Woodruff: You shouldn’t trust trusted publishing

Post Syndicated from jzb original https://lwn.net/Articles/1081690/

William Woodruff, better known online as “yossarian”, has published
a blog post to make the case that users should not place their trust
in trusted
publishing
:

Trusted Publishing is a mechanism for establishing trust between an
external machine identity (like a CI/CD workflow) and one or more
projects on a package index/registry. The “trust” in “Trusted
Publishing” refers to that trust relationship, and not to anything
else.

It is not, and cannot be, a signal for package trust or
quality. You cannot use it to determine whether a package is safe or
“good,” and PyPI consciously stymies attempts to misuse it for that
purpose by not rendering it as a “green checkmark” or anything else of
the sort.

Or as another framing: Trusted Publishing is just a form of
authentication. It doesn’t tell you anything other than that an upload
was authenticated, which all uploads to PyPI are.

LWN covered trusted
publishing in June.

Joy in learning computer science with Experience CS

Post Syndicated from Liz Walsh original https://www.raspberrypi.org/blog/joy-in-learning-computer-science-with-experience-cs/

Last fall I met with Mark Nechanicky and Taryn Israel Nechanicky, two teachers from Albert Lea, Minnesota. Mark and Taryn are bringing computer science into their classroom with Experience CS, our free cross-curricular resource teaching computer science concepts and reinforcing students’ content knowledge in areas including math, science, language arts, and more.

We talked about some of the challenges they faced, and how they’ve worked around them, including constraints on their time and the requirements around teaching their core content areas. But most of our conversation was on the impact the Experience CS resources had on their students. Mark and Taryn shared how teaching cross-curricular computing helped their students to find joy in their learning, express creativity in their projects, and build a sense of leadership within the classroom.

A young person and a teacher looking at a laptop in a classroom setting.

In a little under a week Mark, Taryn, and I will be presenting a breakout session titled Foster Student Engagement, Confidence, and Collaboration through Integrated CS in New Orleans, Louisiana at the Computer Science Teachers Association (CSTA) annual conference. You can read more about our session at the end of this blog post. For now, here’s a preview.

Joy in learning through student agency

When it was time to code, Taryn’s students cheered. She said, “I believe this is because the curriculum makes coding feel like play, which is the basis of how Scratch is designed. Students have choices, agency, chances to make mistakes, and problem-solve individually and together.”

Taryn shared an example of student agency she saw when teaching the first lesson in Weather watchers, a unit designed for students in third grade (ages 8–9) that integrates math and science concepts with programming. During that lesson a student was able to bring her beloved dog, Chewy, into her program as a sprite, and create something meaningful to her.

Fostering creativity among students

While we were designing the units of Experience CS, we focused on ensuring that our resources provided students and teachers with properly scaffolded learning experiences. We did this to support all students in their computing journey, and to provide them with the opportunity to be creative and express themselves in their programs.

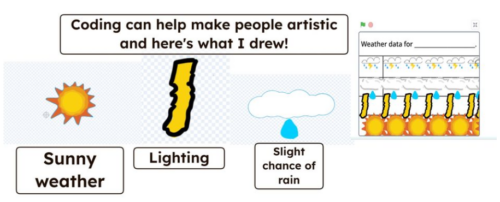
In the Weather watchers unit, students collect weather data and create picture graphs using sprites that represent different weather conditions. Mark’s class let us know the starter project for the unit was missing something — keep an eye out for a tornado sprite in the future! With a little creativity and problem solving, they were able to design just the sprite they needed.

Mark added, “students aren’t just following step-by-step directions to create identical projects. As they work through the lessons, they have the flexibility to add their own sprites, design additional interactions, customize characters, and extend projects in ways that reflect their interests.”

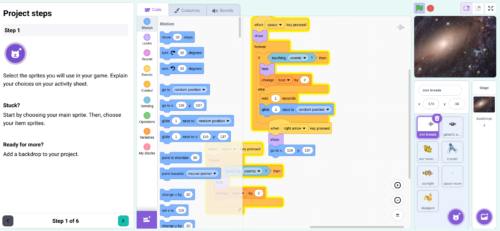
A screenshot from a Scratch programming project.
A student explains how they created their own sprites for a project in Weather watchers.

Fostering leadership in the computer science classroom

The largest part of our discussion was how teaching cross-curricular computer science created environments for all students to become leaders. “One thing I’ve noticed is that coding creates leadership opportunities for students who don’t always get the chance to be seen as the expert. Because it is a new experience for almost everyone, it changes the dynamic in the classroom. Students with Individualized Education Plans (IEPs), English Language Learners, introverted students, and students who may struggle in other academic areas are often the ones discovering new ideas, solving problems, and showing classmates how to do something cool.”

Mark also shared an experience he had while teaching Digit dash, a game design unit that reinforces multiplication fluency, designed for students in fourth grade (ages 9–10). That unit was the first time his students had explored how variables can be used to store a score in a game. The first student to figure out how to use variables in their program was introverted, but became the class “expert” on variables and modeled it for his fellow students.

A screenshot from a Scratch programming project.
Sample student final program from Digit Dash in Code Classroom.

Find us at CSTA

If you’re heading to New Orleans, we hope to see you at our CSTA breakout session, Foster Student Engagement, Confidence, and Collaboration through Integrated CS. During our session, you will be able to hear directly from Mark and Taryn on the impact that teaching Experience CS has had on their students in the last school year. We will include examples from the Experience CS units Weather watchers, Logic and lore, Picture this!, and Digit dash.

Our CSTA session will take place on July 17th, from 3:00 PM to 4:00 PM CT, in Borgne (Floor 3).

And we’d love to hear from you. Have you used our Experience CS resources in your classroom? How did it go?

The post Joy in learning computer science with Experience CS appeared first on Raspberry Pi Foundation.

[$] Faster RCUs and lockless memory allocation

Post Syndicated from daroc original https://lwn.net/Articles/1081009/

Puranjay Mohan shared some of the

work
he’s been doing recently on improving the
performance of read-copy-update (RCU) at the 2026

Linux
Storage, Filesystem, Memory-Management, and BPF Summit
; his talk would have
been nice context to have earlier in the day when Harry Yoo and Alexei
Starovoitov led a session about the

new kmalloc_nolock() function
that
allows for lockless allocation from any kernel context, and which interacts with
the RCU subsystem to allow that. This article therefore covers the two sessions
together and in the reverse order, to provide that missing context.

Security updates for Tuesday

Post Syndicated from jzb original https://lwn.net/Articles/1081644/

Security updates have been issued by AlmaLinux (nodejs22 and nodejs24), Fedora (clamav, hplip, kernel, kernel-headers, librabbitmq, mingw-expat, mir, perl-Imager, podman-tui, prometheus-podman-exporter, python-rpds-py, rust-ashpd, rust-busd, rust-gtk4-macros, rust-inferno, rust-quick-xml, rust-reqsign-aws-v4, rust-wayland-scanner, and sandogasa), Oracle (container-tools:rhel8, kernel, mariadb:10.11, mariadb:11.8, nginx, perl:5.32, php, php:7.4, rrdtool, ruby:2.5, ruby:3.3, ruby:4.0, and uek-kernel), Red Hat (kernel, opentelemetry-collector, and python-urllib3), Slackware (c-ares and openssh), SUSE (bind, chromedriver, cryptsetup, s390-tools, dnsmasq, jackson-annotations, jackson-core, jackson-databind, lcms2, pacemaker, perl-Cpanel-JSON-XS, perl-Crypt-SaltedHash, postfix, and python-mistune), and Ubuntu (gnutls28, gzip, openssh, php7.0, python-parsl, python3.10, python3.12, python3.14, request-tracker5, socat, sogo, and tar).

IBM Expands z17 and LinuxONE 5 Mainframe Lineups With Single Frame and Rackmount Servers

Post Syndicated from Ryan Smith original https://www.servethehome.com/ibm-expands-z17-and-linuxone-5-mainframe-lineups-with-single-frame-and-rackmount-servers/

IBM is expanding its mainframe lineups with new single-frame and rackmount z17 and LinuxONE 5 offerings for smaller customers. As well, the company is releasing an 18U LinuxONE box for new customers called the LinuxONE Express

The post IBM Expands z17 and LinuxONE 5 Mainframe Lineups With Single Frame and Rackmount Servers appeared first on ServeTheHome.

Cloudflare proudly joins the UK government’s Cyber Resilience Pledge

Post Syndicated from Katie Visser original https://blog.cloudflare.com/cloudflare-joins-uk-cyber-resilience-pledge/

Today, the UK government launched the Cyber Resilience Pledge: a voluntary framework inviting organizations to commit to foundational cybersecurity governance, board-level accountability, and comprehensive cybersecurity coverage across supply chains. Cloudflare is proud to join the pledge’s founding cohort of signatories and continue our long-standing work with the Department of Science, Innovation and Technology (DSIT), National Cyber Security Centre, and others to shape a more secure, future-ready digital economy for the UK.

The pledge’s core pillars — democratizing security, leadership accountability, and radical transparency — have been at the heart of Cloudflare since day one. Instead of approaching this framework as a new set of commitments to meet, we see it as a welcome validation from the UK government of the security philosophy and principles Cloudflare has championed for over a decade. We are glad to see the rest of the industry moving in this direction.

This pledge is an important step, and it comes at a time of significant cyber risk. In the first quarter of 2026, Cloudflare’s global network blocked an average of 234 billion cyber threats every day. Recently, we mitigated a hyper-volumetric DDoS attack that peaked at 31.4 Tbps. At the end of 2025, Cloudflare data showed that the UK had risen to be the sixth-most targeted location across the globe for DDoS attacks, with threat actors increasingly targeting application-layer services in financial services, aviation, and regional government infrastructure. This trend is consistent with broader data from the UK Cyber Security Breaches Survey, which revealed that 43% of surveyed British businesses and 28% of charities reported suffering from a cyber incident this past year.

At the same time, frontier AI models are rapidly changing the security landscape, lowering the barrier to entry for attackers, and enabling more automated vulnerability scanning and more convincing phishing campaigns. Cloudflare has long been preparing for this shift. The defensive architecture we recently published for frontier cyber models reflects the same principle: security has to evolve as quickly as the threats companies face. Every layer of that harness architecture, from ML-based attack scoring to Zero Trust access controls, is available to Cloudflare customers today.

Against that backdrop, the pledge does something essential: it recognizes that collective defense is critical. It asks organizations to make cyber resilience a leadership-level priority, to implement appropriate controls to boost threat awareness, and to help ensure supply chains meet a meaningful security baseline. Most breaches still exploit well-understood gaps, like unpatched systems, weak access controls, or poor vendor oversight. Encouraging more organizations to close those gaps through enhanced governance, monitoring, and implementation is a necessary starting point. 

Cloudflare is fully aligned with the UK government’s mission to elevate cybersecurity governance within companies and organizations of all sizes. Every organization that raises its baseline makes the Internet safer for everyone else. Our mission at Cloudflare is to help build a better Internet, and we have always believed that cybersecurity and resilience work best when they are universal. A more resilient Internet is a better Internet. 

Why resilience matters

Cyber resilience is increasingly recognized as a core business requirement. Customers expect services to be available at all times, responsive, and trustworthy. And that’s true even when the environment gets more challenging to operate in, whether from increased attacks, outages, abuse, or complexity. 

Resilience ultimately is not just about recovering after something goes wrong. It is about designing security systems and operating models that can proactively track threat signals, seamlessly absorb disruptions, and adapt to be better. In this way, security and resilience are inseparable. Security controls are what make resilience real. 

How Cloudflare helps strengthen resilience through security

Thanks to the scale of our network, we can help organizations build resilience by shifting protection closer to the edge, before threats reach core systems. We think about cyber resilience through a few core architectural principles:

Security as a default, not a product tier

Cloudflare believes baseline security protections should be available to all and has been living that principle since our founding. We were the first to offer SSL certificates, required for traffic encryption, to all users. We protect vulnerable voices through our Impact programs like Project Galileo and the Athenian Project. We continuously push the boundaries of Internet cryptography, including the deployment of post-quantum cryptography across our network. Our free plan includes unmetered DDoS protection regardless of the size, duration, or volume of attacks, and also provides access to a global content delivery network (CDN) and DNSSEC. These capabilities have historically required expensive hardware and specialist security teams. But the pledge’s aim of elevating organizational resilience and raising the cyber resilience floor across the UK economy only works if small businesses, local authorities, public services, and startups can afford to participate. Our model directly supports that goal.

The network is the sensor

Because Cloudflare directly peers with more than 13,000 networks globally, we see attack patterns as they emerge. Threat intelligence collected in one part of the network can be turned into protection everywhere else in a matter of seconds. A threat detected while mitigating an attack on a customer in Singapore can become a rule that helps protect a customer in Sheffield moments later. That same visibility also helps improve how we detect, score, and respond to attacks across Cloudflare’s network and security services. Visibility at scale leads to resilience at scale for Cloudflare’s customers and network.

Cloudflare is customer zero

Our customers benefit from the exact same industry-leading security products and infrastructure that safeguard our own systems. Cloudflare employees use Cloudflare Access and Gateway to reach internal applications, and every request to an internal system requires hard key-based multi-factor authentication, posture checks, and cryptographically verified identity tokens. We test every security layer on ourselves first, and use our own internal learnings to build better security solutions for ourselves and our network. By integrating security into every level of the business, Cloudflare demonstrates a ground-up commitment that sits at the very heart of the pledge.

Transparency and response

Finally, resilience requires honesty and transparency when things go wrong and a commitment to strengthen systems for the future. When security incidents or zero-day vulnerabilities emerge, we publish deep-dive technical postmortems on the Cloudflare Blog. We share indicators of compromise and architectural retrospectives, so the broader security community can learn from our telemetry. But transparency is only the first step. We treat every incident as a mandate to make our network more resilient. After a significant outage last fall, our Code Orange effort mobilized engineering teams to rebuild for resilience. They designed systems to “fail small,” and built new tooling to enforce safer configuration changes and automate best practices, so the same failure can’t happen twice.

How Cloudflare implements the Cyber Resilience Pledge commitments

As noted above, today’s voluntary pledge asks companies and organizations to commit to certain standards in board responsibility and governance, supply chain security, and the technical requirements under the UK’s Cyber Essentials certification scheme. As a global cybersecurity and network resilience provider, we operate an advanced internal cybersecurity governance model. 

Board responsibility and governance

With cybersecurity and resilience at the core of Cloudflare’s global business, we are proud to be a leader in developing and advocating for practices that strengthen cybersecurity at the board level.

Our Board of Directors treats cyber risk oversight as a core responsibility. Cloudflare’s Board receives cybersecurity briefings from our Chief Security Officer on at least a quarterly basis, including direct threat briefings. In addition, the Audit Committee of the Board receives quarterly briefings on enterprise risk management that include a specific focus on cyber risks and the company’s process for regularly reviewing and mitigating cyber threats and risks.

We are grateful that DSIT’s toolkit and resources are available to benchmark, reinforce, and support boards’ ongoing governance efforts across the entire UK economy.

Supply chain security and Cyber Essentials (CE)

Cloudflare adheres to rigorous international security compliance certifications. We require our supply chain to meet comprehensive international standards that incorporate and build upon the core requirements of Cyber Essentials. Cloudflare manages vendor risk globally, prioritizing comprehensive international security frameworks that encompass and exceed the fundamental technical controls of the Cyber Essentials program.

More specifically, Cloudflare requires critical suppliers to adhere to rigorous, internationally recognized security compliance certifications and reports — primarily ISO 27001 and SOC 2 Type II. These frameworks explicitly require the implementation of firewalls, secure configurations, user access controls, malware protection, and patch management (the five core pillars of Cyber Essentials).

Cloudflare will continue to use a risk-based methodology to evaluate suppliers. We commend DSIT for expanding access to the Cyber Essentials Supplier Check Tool, which Cloudflare can adopt for localized supply chain validation within the UK. And for global suppliers where UK Cyber Essentials is not a native or practical certification, Cloudflare will accept equivalent international certifications (like ISO 27001) as sufficient verification of a robust security posture. These practices help ensure that Cloudflare’s critical supply chain undergoes stringent security vetting, meeting the risk-reduction outcomes intended by Cyber Essentials.

Onward

Cyber resilience is not a one-time pledge — it is a continuous practice of building systems that fail safely, recover quickly, and learn to be better. For organizations across the UK, it means making cybersecurity a business-critical priority, with leadership buy-in, teams that understand the threats they face, and supply chains managed for risk. The pledge sets a baseline that every organization should strive to meet.

Cloudflare built its platform on the belief that security and resilience should be universal and available to both the smallest developer and the largest enterprise. We are proud to stand with DSIT and the other signatories of this pledge, and look forward to continued partnership and innovation to elevate cyber resilience across the UK and around the globe.

Рене Карабаш: Да обичаш означава да…

Post Syndicated from Роси Михова original https://www.toest.bg/rene-karabash-da-obichash-oznachava-da/

Въпросите задават Пабло Неруда и Роси Михова

Рене Карабаш: Да обичаш означава да...

Пабло Неруда умира на 23 септември 1973 г. в чилийската столица Сантяго – дванайсет дни след военния преврат на Аугусто Пиночет. Само ден по-рано поетът, който е виден комунист и приятел на сваления президент Салвадор Алиенде, планира да замине в изгнание в Мексико. Това обаче така и не става. След внезапната смърт на Неруда на бюрото му са открити осем ръкописа. Един от тях е озаглавен „Книга на въпросите“.

„Книга на въпросите“ (Libro de las Preguntas) е нещо като лексикон в стихове. Той включва 316 кратки поетични въпроса, оформени като 74 отделни стихотворения. Неруда вярва, че светът е пълен с „невидими отговори“ и работата на човека е да се научи да задава правилните въпроси. А неговите са едновременно фантасмагорични, съзерцателни, предизвикателни, понякога дори и пиперливи – нещо като горещи, току-що извадени от фурната емпанади с плънка от сюрреализъм, детско удивление пред света и мрачна метафизика.

Оттук тръгва и нашият разговор с моята събеседничка, която аз срещам за първи път, но в ума си вече съм решила, че е сродна на Неруда душа. Това е писателката, поетеса и сценаристка Рене Карабаш*.

Предлагам за загрявка да започнем с една поредица от блицвъпроси. Защо облаците са толкова тъжни, когато спрат да плачат? 

Защото няма кой да полива градината им.

На кого се усмихва оризът, когато показва белите си зъби? 

На печеното пиле, разбира се.

Ако всички реки са сладки, откъде морето взема солта си? 

От сълзите, изплакани от близките на всички удавници.
А също от сълзите на рибите.

Какво мислят рубините, когато видят сок от нар? 

Че са на брега на Червено море.

На какво се смее динята, докато я разсичаме до смърт? 

На ножа. И на този, който го държи. Динята знае: и твоето време ще дойде.

Кое е това, което дървото чува от земята и го казва на небето? 

Нещо, което мисля, че трябва да остане в тайна.

Какво прошепва пепелта на огъня, който гори наблизо? 

Чакам те.

Защо дърветата крият великолепието на своите корени? 

Защото всеки трябва да крие и пази това, което му е най-ценно.

А може би защото никой не обича да го гледат, когато се храни… Дали розата е гола, или това е нейната рокля?

Розата е облечена със своята голота. И с парфюма си. Тя държи на него, защото иначе пчелите няма да ѝ обръщат внимание. Орхидеята обаче е друго нещо. Нейната красота е толкова поразителна, че тя няма нужда от аромат, за да привлича. Има и такива хора.

Къде отиват птиците, когато умират? Има ли гробище за крила?

Когато удари часът, птиците се връщат, за да умрат близо до гнездото си.

А в „Остайница“ пишете, че гробището за крила е домът. Защото точно там някой ги прерязва.

За да разбереш точно колко ти е важно да летиш.

Защо тялото ми продължава да ме носи, когато душата ми е изпаднала някъде?

Душата и тялото са близнаци. И когато единият няма сила да продължи, другият го носи на гръб.

Защо димът винаги се опитва да влезе в небето? 

Защото прилича на нас, хората. Накрая ние също тръгваме по вертикалата натам, нали? Поне това е оптимистичната версия.

А може би споделя нашето атавистично желание да оставим диря?

Да препикаем този свят? Да, чудя се откъде идва това наше желание. Дали маркираме територии? Или се прицелваме в безсмъртието? Аз все пак вярвам, че най-непреходното, което остава след нас, е любовта, която сме дали на другите. И си мисля за моята баба, която ми е дала най-чистата обич и с която дори днес продължавам да си говоря по разни начини. Един ден ще разкажа за нея на моите деца и тя ще е още жива – дори когато мен вече няма да ме има.

Къде се губи времето, което сме пропуснали? 

Вероятно в стаята, където се трупат всички пропуснати неща и моменти. Като онази магическа стая в книгите за Хари Потър, в която можеш да намериш всичко, което търсиш, когато имаш отчаяна нужда от него. Там оставяме пропуснатото време, за да можем да си го потърсим отново при първа възможност.

Но аз също така вярвам, че нещата, с които смятаме, че сме се разминали в този живот, всъщност се случват в някаква паралелна реалност. Не само хубавите и добрите неща, но и нашите грешки, болки или унаследени травми, които продължаваме да рециклираме.

Оттук следва, че всъщност ние можем да бъдем това, което пожелаем, и да имаме това, което искаме. Но то е въпрос на вибрация. Ако човек се настрои на тази честота, че тези неща вече някъде ги има, че те вече са се случили в някакво друго измерение, то те наистина се появяват и в живота, който живеем тук и сега. Всъщност аз така разбирам пътуването в пространството и времето.

Това се вписва в моето далеч по-прагматично убеждение, че човек невинаги има живота, който би искал да има, но това не означава, че не може да бъде човекът, който би искал да бъде. Във Вашата интерпретация това наше паралелно аз съществува някъде и е въпрос на усилие и мотивация да затрептим на една честота с него.

Карл Густав Юнг има тази концепция за противоположностите, които живеят в нас. Едва когато те се срещнат и слеят, се случва онова, което можем да определим като алхимичен брак, а той конкретно нарича „индивидуация“. В живота аз си го обяснявам далеч по-просто. Например когато съм парализирана от страх, вярвам, че противоположното е също в мен – че смелостта е в мен. Нужно е само да стигна до нея, да я проявя с надигащия се в мен ужас и така да стана цяла. Именно тази моя цялост ми дава усещане за сила. Защото страхът вече не изпълва всичко в мен. Защото в неговата стая живее и куражът ми.

Защо ни хапят бълхите и литературните критици?

Защото си нямат друга работа.

Аз обаче имам друг отговор във Вашия случай. Според мен Ви хапят, защото Ви жалят и не искат да Ви унищожат с мълчанието си. Човек, особено ако е творец, най-лесно се „убива“ с безразличие. Но същото важи и за бесовете, ако вярваме на едно Ваше стихотворение:

Още колко стиха трябва да напиша, за да укротя бесовете си?
Спри да пишеш…
бесовете умират сами…
от бялото на листа.

Така е. Но ще споделя тъжната истина, че професионалната литературна критика навсякъде вече е не просто застрашен, а изчезващ вид. Социалните мрежи, инфлуенсърите, хората, които коментират само по заглавие, без да са чели текста, замениха задълбочения литературен анализ. Мисля, че ако литературната критика иска да продължи да живее, тя трябва да се адаптира към новата дигитална реалност, към новия свят, който не ни пита дали искаме, или не да останем аналогови. За жалост.

Неруда има и такъв брутален въпрос: на какъв принудителен труд е осъден Хитлер в ада?

Може би в някакъв следващ живот да има дете, което на игра да си смени дрехите с някое еврейско момченце в нацистка Германия. Вие довършете историята.

Тук ще се изкуша да цитирам отговора на самия Неруда в превод на Никола Инджов:

„На какъв принудителен труд е
оставен Хитлер в ада?
Трупове и стени ли вапсва,
газ пагубен ли опитва?
Дават ли му да яде пепел
от деца, изгорени живи?
Или го насилват да пие
човешка кръв от фуния?
Или му набиват в ченето
изтръгнати златни зъби?

Или му правят постеля
от концлагерна тел бодлива?
Или кожата му татуират
за абажури на лампи в пъкъла?
Или му късат месата
на огъня черните псета?
Или денонощно е длъжен
да стои между своите жертви?
Да умира, без да умира,
вечно под газа отровен?

Да, брутално е наистина. Но да не забравяме, че Хитлер е личност, която ни се е случила наистина. Той не е злодей от хорър фентъзи. Проблемът е, че днес също има хитлеровци, престорени на Спасители. И човек трябва все повече да напряга критическата си мисъл и да подсилва емпатията си, за да може да ги разпознава.

Вярно ли е, че в мравуняка мечтите са задължение? 

Да, вярно е. Защото който не мечтае в мравуняка, бива изхвърлен от него. За да просперира едно общество, всеобщият труд не е достатъчен. Нужна е и мечта. Мечтата на мравката е да занесе едно листо оттук дотам. Нашите мечти не са по-различни. Те на практика се свеждат до същото – дават ни посока и цел, а с тях – и илюзията за смисъл. Или самия смисъл?

Тогава трябва ли мечтите да са изпълними?

Някои трябва да си останат мечти. Особено ако изпуснеш момента. Защото понякога мечтаем толкова дълго и упорито, че не забелязваме как се променяме. И когато мечтата ни най-после се сбъдне, ние вече сме други и тя е била мечта на някой друг човек в нас. Освен това често мечтаенето е по-хубаво от сбъдването.

Това го има и в книгата ми „Писма на Омар до бъдещата му съпруга“. В едно от писмата, които пише до своята любима, той обяснява колко му харесва това, че още не я познава. И че още може да мечтае за нея, да я идеализира, да си я представя. Защото когато се срещнат, всичко това ще свърши.

Тогава не е ли по-добре „никога“, отколкото „късно“, пита Неруда.

За някои неща е по-добре никога, други е добре да се случат, макар и късно. А има и такива, които задължително трябва да се случат късно.

Аз обаче имам татуировка на гръбнака, която гласи: „Защити ме от това, което искам“. Защото невинаги това, което искаме и чакаме, е най-доброто за нас.

И как тогава човек прави разлика между това, което не е добро и не е нужно да чака, и това, което си заслужава цялото търпение на света?

Мисля, че един от компасите е интуицията – когато усещаш, че това е твоят път и трябва да вървиш упорито по него, колкото дълъг и труден да е той. Другото е любовта към теб самия. Ако се обичаш, ако си достатъчно грижлив към себе си и имаш инстинкт за самосъхранение, тогава не би скочил в пропастта. А твоята пропаст може да бъде всичко – човек, който се държи зле с теб, или работа, от която ще прегориш, или място, което ще изцеди радостта от живота ти. С други думи, когато обичаш себе си, ще се опазиш и ще направиш правилния избор между „никога“ и „по-късно“.

При това положение кой е по-тъжен – този, който чака напразно, или този, който никога не е чакал никого? 

Този, който не познава лудостта на очакването. Клишето, че е по-добре някой да разбие сърцето ти, отколкото никой никога да не го докосне, е вярно. Страданието е за предпочитане пред апатията. Едното е животът, другото – не. (И тук не говоря от гледната точка на творец мазохист. Ако прочетете „Жажда“ на Амели Нотомб, ще ме разберете.)

Животът е като линията на сърцето – трябва винаги да има тези скокове нагоре и надолу. Ако в един момент тя стане равна, значи сме мъртви.

А докато сме живи, кое е по-трудно – да сеем или да жънем, да пускаме семена или да прибираме реколтата?

Да жънеш, да прибираш плодовете е по-тежко за мен. Защото няма по-велико нещо от това да засаждаш. И не непременно метафорично, а съвсем буквално. Това е по-леката работа на полето. Прибирането на реколтата, обработката ѝ, почистването на земята, така че да е готова за следващия сезон, е в пъти по-тежък труд.

Нека поспорим малко. Да сееш изобщо не е толкова лесна работа. Тя изисква да се изправиш пред несигурността на бъдещето и пред собствената си уязвимост. Нужно е и безразсъдство, за да започнеш от нищото и да се хвърлиш напред с надеждата, че плодът на твоя труд няма да бъде покосен от градушка, от човешки крак или човешки думи. Жътвата понякога е занаят, понякога – сблъсък с реалността. Но сеитбата е почти религиозна вяра. Тя е оптимизъм на ръба на разумното.

Това съвсем точно отговаря на една реплика, която чух днес – Have some fucking confidence in what you’re doing. И веднага я свързвам с работата си върху следващия ми роман – моята следваща сеитба. Защото много неща за тази книга още не са ми ясни, но вярвам, че в процеса на работа те ще ми се изяснят. Така че човек трябва да се довери на процеса, той да го води… и отговорите ще покълнат и изникнат сами.

А този процес, това, което се случва и в което живеем, то какво е – непрекъснат разпад или битка?

Има нещо, което често ми се налага да казвам сама на себе си: Now, you do not need to survive. Сега не се налага да оцеляваш. Може би защото е трябвало много да оцеляваме в детството си, ние имаме една травматична нагласа. Мозъкът ни постоянно е настроен на тази вълна, че трябва да се справим, трябва да се борим, трябва да оцелеем. Понякога обаче това не е нужно. Понякога можем просто да сме тук и сега и да живеем. И да скачаме във всяка битка.

От друга страна, разпадът е чудесно нещо. Той е краят, който поставя ново начало. Шива е върховният бог на разрушението, но и част от съзиданието на битието. Той танцува своя танц върху земята и когато тя се разпада под нозете му, остава най-малкото зрънце на любовта. И от тази молекула всичко тръгва и се разлиства наново. Така че разпадът е другото лице на сътворението.

Пък и какво значи разпад? То всичко е енергия – събира се, разделя се, размества се, намества се.

Добре, като за финал: дали се научаваме да бъдем състрадателни, или само слагаме маската на състрадание? 

За мен всеки човек е огледало, в което се оглеждаме ние самите. Ако нямаш емпатия към другия, ти нямаш емпатия и към себе си. Ако не обичаш ближния, не обичаш и себе си. Ако си лицемерен с другия, си лицемерен и със себе си. Не можеш да избягаш от това. Понякога си състрадателен към себе си, но само привидно. И родителят вътре в теб по никакъв начин не помага на детето в теб, което в този момент плаче безутешно. А това е единствената му работа.

Но дали за страдащия човек има такова значение дали му съчувстваме искрено, или не? Според мен дори маската на състрадание помага. Може би защото изцяло вярвам на казаното от Кърт Вонегът: „Внимавай на какво се преструваш, защото ти си това, на което се преструваш.“ Искаме или не, в един момент ние се срастваме с маските, които носим.

Съгласна съм. Но тук искам да направя едно уточнение. Първо, човекът, който може най-добре да ти помогне, си ти самият – никой друг. В теб е силата да се издърпаш за косата и да се извадиш от блатото.

Другото е, че има „езици на любовта“. И всеки от нас говори на езика на своята любов. Всеки обича посвоему. И тук се появяват трудностите във връзката с другия.

Например някои хора имат нужда, когато са зле, просто да седна до тях, да ги прегърна и да помълчим заедно. За мен обаче това не е достатъчно. Аз бързам да вляза в ролята на майка (все пак съм зодия Рак) и да предложа решение, да посоча изход, да запаля светлина в тунела им. Те обаче възприемат това не като подкрепа, а като омаловажаване на проблема и страданието им. Думите ми не ги успокояват. Напротив – ожесточават ги. Така понякога всичко, което се очаква от мен, не е решение или план за действие, а защитено пространство, в което една друга душа да се отпусне и да се разпадне.

Искам да кажа, че да обичаш истински означава да се научиш да говориш на езика на любовта на другия. И аз продължавам да се уча на този чужд за мен език.

Дължим го на другите. Дължим го и на себе си.


* Рене Карабаш (Ирена Иванова) е поетеса, писателка, сценаристка и драматург. Името ѝ придобива световна известност покрай романа „Остайница“, който е преведен на 25 езика и печели множество литературни отличия у нас и в чужбина. През 2026 г. е включен и в краткия списък за Международната награда „Букър“. Рене е главна сценаристка на сериала на БНТ „Те, вълните“, а за главната си роля във филма „Безбог“ получава редица филмови награди за най-добра актриса.

Рене е основателка на Академията за писатели „Заешка дупка“, в която преподават изявени поети, писатели и сценаристи. В момента тече прием за есенното издание на Академията с писателски курсове, като „Тайните на трилъра“ с ментори Александър Чобанов и Емил Минчев и гост-лектор криминалния психолог Тодор Тодоров, както и няколко нови терапевтични курса по библиотерапия, писане за вътрешна свобода и терапевтично кинцуги. Повече информация може да получите на сайта на „Заешка дупка“ или на ел. поща: [email protected]

Google Is Suing Chinese Scammers Who Are Using Gemini

Post Syndicated from Bruce Schneier original https://www.schneier.com/blog/archives/2026/07/google-is-suing-chinese-scammers-who-are-using-gemini.html

Not sure this will have any effect, but I support the effort:

According to Google’s legal filing, Outsider Enterprise operates through Telegram. The group offers phishing-as-a-service to individuals who may not be technically savvy enough to set up fraudulent websites and text campaigns on their own. In its Telegram channels, Outsider Enterprise reportedly provided instructions on how to use Google’s Gemini AI to create websites that imitate those of Google, YouTube, and government agencies such as New York’s E-ZPass. The group offered nearly 300 scam templates.

[…]
Google worked with AT&T, Verizon, and T-Mobile to block many of these malicious text messages, and Google notes that its on-device scam detection in Google Messages probably helped reduce the number of successful phishing attempts, too. This AI-powered feature apparently stops 10 billion scam texts every month, so it’s fair to expect it caught at least some Outsider Enterprise activity.

Another article.

На трапезата на европейското разширяване – домакини, гости и нежелани посетители

Post Syndicated from Анахит Хачикян original https://www.toest.bg/na-trapezata-na-evropeyskoto-razshiryavane-domakini-gosti-i-nezhelani-posetiteli/

На трапезата на европейското разширяване – домакини, гости и нежелани посетители

Двайсет и седем високопоставени лица са седнали на една голяма кръгла маса и вечерят. Всеки има различни ястия пред себе си и е платил различна цена за куверта, но всички имат право на мнение за основното ястие, както и дали да бъдат поканени други участници. Един е напуснал през 2020 г. по невнимание и сега горчиво съжалява и обмисля да се върне. Още десетина чакат да влязат, някои вече стоят непосредствено пред вратата на трапезарията. Други са в самото начало на дългия коридор, а един от 1987 г. звъни на входната врата, но за пореден път е оставен „замръзнал“ навън заради непристойно поведение. Двама пък са желани гости, но техните собствени трапези са по-богати от тази, на която са поканени. Един се двоуми от 2009 г. и през август пак ще решава иска ли да вечеря с останалите, или не. Мнозина от самите вечерящи периодично се оплакват и негодуват, но знаят, че общата трапеза ще ги засити повече, отколкото ако решат да се хранят сами.

Приблизително така може да се изобрази разширяването на Европейския съюз, обявено за един от приоритетите на новия мандат на Европейската комисия. Войната в Украйна превърна обещанието за членство в ЕС в съвсем обозрима и конкретна перспектива не само за нападнатата държава, но и за страните от Западните Балкани, които отдавна чакаха в коридора, и сега изведнъж стана неудобно да се правим, че не ги забелязваме. А принципът „Съединението прави силата“ изглежда все по-утешителен в съвременния непредвидим свят.

Западните Балкани на много скорости

Черна гора, най-напреднала за момента в преговорния процес, води усилена имиджова кампания под лозунга „28 до 28“ – идентифицирайки се като „епицентър на еврооптимизма“ и надявайки се да стане 28-мата страна членка на ЕС до 2028 г. Гърция, която по време на председателството си на ЕС през 2003 г. игра ключова роля в подготвянето на предишното голямо присъединяване на десет страни през 2004 г., вече заяви готовност да направи необходимото за Черна гора в края на следващата година, когато пак ще е начело на ЕС. Европейският парламент също потвърди в годишния си доклад, приет на 17 юни на пленарната сесия в Страсбург, че Подгорица продължава да бъде най-напредналата от всички кандидат-членки, следователно вероятно ще бъде първата, която ще се присъедини.

По време на същата пленарна сесия Европейският парламент констатира, че Албания изостава заради корупция и вътрешнополитически проблеми, Босна и Херцеговина – заради недостатъчни реформи. А Северна Македония беше призована да направи необходимите конституционни промени, за да реши проблемните въпроси, включително тези, които са свързани с отношенията ѝ с България.

Косово, кандидатствала за членство през 2022 г., все още няма статус на страна кандидатка и не води преговори не само защото не е достатъчно подготвена, както се казва в последния доклад. По-сериозната причина е, че независимостта ѝ не е призната от 5 страни членки на ЕС (Испания, Словакия, Румъния, Гърция и Кипър), което блокира Съвета да придвижи процеса напред.

Сърбия, за която докладът ще бъде гласуван отделно през юли, се очаква да бъде силно разкритикувана заради флиртовете си с Русия и Китай, подобно на критиките към Грузия – също страна кандидатка от края на 2023 г. Пътят към членството на Грузия е замразен заради отявлените антидемократични закони, приети след изборите през 2024 г., включително за чуждестранните агенти, любим и на българското „Възраждане“. Турция също е със замразена кандидатура още от 2018 г. по сходни причини, свързани с върховенството на закона и демокрацията – критики, които се повтарят ежегодно в докладите на Европейския парламент и които като че ли се приемат с все по-голямо пренебрежение на Босфора.

Украйна и Молдова по бързата процедура, но колко бързо?

Докато положението със Западните Балкани и Турция е относително ясно, защото тези страни отдавна са в чакалнята на ЕС, Украйна и Молдова кандидатстваха през 2022 г. и присъединяването им все по-често се споменава като неотложно. Особено след като Виктор Орбан, основният отявлен опонент на украинското членството, слезе от унгарската политическа сцена. Сред най-големите привърженици на идеята са скандинавските и балтийските държави, които в същото време се чувстват най-застрашени от Русия. За да ускорят преговорите между Украйна и ЕС, те дори сформираха специална група от съветници с опит в европейските дела и дипломацията – привилегия, с която балканските страни не разполагаха.

Въпреки привидния ентусиазъм обаче подходът на ЕС е предпазлив не само защото преговорите с Украйна и Молдова все още са в самото начало. Влизането на Черна гора в ЕС ще означава присъединяване на малко над 600 000 души към населението на ЕС, а населението на Украйна е около 40 милиона… Това означава, че Украйна ще се нареди на пето място в Съюза по брой на населението и на първо по територия. Тя ще има приблизително същия брой евродепутати като Испания и Полша – между 53 и 60, и ще разполага със същата тежест като тях при гласувания в Съвета на ЕС. От друга страна, ще се нуждае от много средства, за да се възстанови и развие икономически. Но и ще може да подпомогне ЕС в амбициите му за самостоятелна отбрана, тъй като напредна значително в тази област в сравнение с всички други страни от ЕС.

Освен че новите гости трябва да спазят определени изисквания, за да седнат на общата трапеза, и домакините трябва да са готови да ги посрещнат.

Така нареченият капацитет на усвояване на ЕС (absorption capacity) се отнася до политическото, финансовото и институционалното приспособяване на Съюза към по-голям брой страни членки. Това включва както големи и сериозни въпроси, като бюджета и оперативните програми, така и логистични детайли, отнасящи се до необходимостта от нови офиси и сгради, които да приютят бъдещите евродепутати, комисари, дипломати и служители.

За да забави ритъма, без да разочарова Украйна, Германия вече предложи като междинна стъпка асоциирано членство на Украйна, което да даде достъп до определени политики, но без право на глас. Идеята бе отхвърлена от украинския президент Володимир Зеленски като „несправедлива“. Новият унгарски лидер Петер Мадяр подкрепи отварянето на първите преговорни глави между Киев и Брюксел, но настоя да не се избързва. Той обеща референдум в Унгария след 10–15 години, ако всички глави са затворени от Украйна за това време.

Молдова, от друга страна, доскоро беше неформално обвързана с Украйна, тъй като Европейската комисия разглеждаше в един пакет присъединителния процес с двете страни, но „със започването на преговорите всяка страна е отговорна за себе си“, както каза Урсула фон дер Лайен. Присъединяването и на двете държави ще затвърди евроатлантическата им ориентация и ще ги спаси от руското влияние, но предстои да разберем дали това може да стане еднакво бързо и за мирна Молдова, и за Украйна, в която войната продължава. Ако се стигне до блокаж, Кишинев разполага с резервен вариант: да се присъедини към Румъния и така автоматично да влезе в ЕС. Според молдовския вицепремиер, ако присъединяването не приключи до 2028 г., може да се пристъпи към това алтернативно решение.

На север от Брюксел: стъпка напред, две назад

Бившите източни и балкански социалистически страни напират да влязат в ЕС не само по икономически и политически причини, а и за да затвърдят принадлежността си към европейските ценности и да запълнят пукнатините, оставени от пропастта на Студената война. Различна е обаче мотивацията на други европейски държави, които периодично се колебаят да се присъединят към ЕС или да се върнат, след като доброволно са го напуснали.

Два референдума на норвежците (1972 и 1994 г.) и един на швейцарците (1992 г.) оставиха двете държави извън Съюза, макар че и двете имат достъп до общия пазар на ЕС, част са от Шенген и се възползват от много общи програми на основата на двустранни споразумения. Същото разширено партньорство ЕС е изградил и с Лихтенщайн и Исландия. Рейкявик обаче подаде кандидатура за членство през 2009 г., оттегли я малко по-късно, но отново се активизира след като Русия нападна Украйна. И ще организира референдум за членство през август 2026 г.

Несъмнено най-големият прецедент в историята на отношенията между ЕС и европейските държави беше създаден от Великобритания, която напусна през 2020 г., след проведен референдум. Резултатите от него учудиха дори тези, които инициираха провеждането му. В новия документален филм на BBC, посветен на десетгодишнината от злополучния референдум: „Брекзит: много британска гражданска война“, са включени главни действащи лица от тогавашната политическа сцена. Сред тях са консервативният премиер Дейвид Камерън, организирал референдума, и Борис Джонсън, също консерватор и защитник на Брекзит. Те споделят изненадата си от крайния резултат и неподготвеността си за него: докато предварителните социологически проучвания сочат, че повече от половината англичани искат да останат в ЕС, гласуващите решават точно обратното.

Десетгодишнината от референдума беше повод за много равносметки и анализи,

в които се анализират загубите на Острова от оттеглянето му от европейската трапеза и се разобличават лъжите зад кампанията преди референдума. Отчитат се намалени търговски и икономически показатели, Лондон е загубил привлекателността си на световна финансова столица, а проблемите с нелегалната имиграция още по-трудно могат да се решат сега, когато Великобритания трябва да се справя сама. През последните месеци лейбъристкото правителство на Киър Стармър зачести изявленията си в полза на нови преговори с ЕС и евентуален ход назад: Breturn. Обществената подкрепа за завръщането прогресивно расте през последните десет години, а от страна на Брюксел и на европейските граждани винаги е имало интерес и готовност англичаните пак да седнат на общата трапеза.

Но планираната среща между ЕС и Великобритания на 22 юли в Брюксел, на която трябваше да бъде обсъдено новото засилено сътрудничество в редица области, беше отложена, след като Стармър подаде оставка, а вероятният следващ британски премиер Анди Бърнам заяви още преди да бъде назначен, че връщането в ЕС няма да е приоритет. Засега въпросът остава открит, но не е изключено една или няколко други държави да влязат в ЕС, преди британците да решат какво искат да правят.

България: какво мислим ние за разширяването?

Дори след като приключи преговорния процес по всички глави, дадена държава не може да се присъедини, преди всички държави членки да са одобрили и ратифицирали това присъединяване. Проучване на Евробарометър от септември 2025 г. сочи, че 56% от европейците подкрепят бъдещи разширявания, като Украйна се радва на най-голяма подкрепа сред страните кандидатки (най-висока в Швеция – 91% и Финландия – 81%), а Турция е най-непопулярна (най-ниска сред кипърците – 13% и австрийците – 19%). Българските резултати обаче са различни: 63% от анкетираните подкрепят Сърбия, после идват Босна и Херцеговина, Черна гора, Молдова, Грузия и Турция, Албания и Косово с подкрепа между 50 и 40%. На последно място сред българските анкетирани се нареждат Украйна (31%) и Северна Македония (32%). Само в Унгария и Чехия подкрепата за Украйна е толкова ниска, колкото и у нас.

Подкрепа в България за присъединяването на страните кандидатки към ЕС

Сърбия
63%

Босна и Херцеговина
53%

Черна гора
52%

Република Молдова
51%

Грузия
47%

Турция
46%

Албания
43%

Косово
40%

Северна Македония
32%

Украйна
31%

Източник: Проучване на Евробарометър, септември 2025 г. (делът на отговорите „Общо подкрепям“)

Логично е да се запитаме защо в България сме по-склонни да приемем в ЕС една голяма държава като Турция, която коренно се различава от останалите в географско, политическо, културно и религиозно отношение и за момента е много далеч от демократичните стандарти, отколкото да подкрепим други две държави, с които споделяме общо славянско наследство? Докато липсата на подкрепа за Северна Македония е пряко свързана с проблемите в двустранните отношения между София и Скопие, зад отрицателното отношение към Украйна ясно прозират българските симпатии към Русия. Тук фразата „Врагът на моя враг е мой приятел“ е преобърната на „Врагът на моя приятел е мой враг“. Ето защо не искаме да седим на една трапеза с този враг, да не би това да постави в риск много „по-важните“ ни приятелства.


Изразеното мнение е лично и не представлява позицията на Европейския парламент.

Uncover new performance insights using Amazon detailed performance statistics on Windows

Post Syndicated from Xinze Zhang original https://aws.amazon.com/blogs/compute/uncover-new-performance-insights-using-amazon-detailed-performance-statistics-on-windows/

The primary storage solutions for EC2 Windows instances, Amazon EC2 Instance Store and Amazon Elastic Block Store (Amazon EBS) , now provide detailed performance statistics for real-time monitoring. Real-time monitoring enables you to gain visibility into key performance metrics, such as latency, throughput, and IOPS, allowing you to detect and address potential bottlenecks or issues proactively.

In this post, we explore how to use detailed performance statistics for both Amazon EBS and Instance Storage on Windows environments. These new metrics provide sub-minute granularity, offering real-time visibility into storage volume performance across both storage types. You can access these statistics directly from your Amazon EBS NVMe/Amazon Instance Storage NVMe device attached to the Amazon Elastic Compute Cloud (Amazon EC2) instance and use them to monitor I/O performance at the storage level. We also provide examples of how to use these statistics to quickly assess EBS volume/Storage health and identify performance bottlenecks, which improve both the reliability and performance of your applications. When creating or attaching EBS volumes, enable encryption at rest using AWS Key Management Service (AWS KMS) to protect your data. For more information, see Amazon EBS encryption in the Amazon EC2 User Guide.

Solution overview

Using the new Amazon EC2 Instance Store/Amazon Elastic Block Store (Amazon EBS) detailed performance statistics at the instance-level, this sample solution enhances observability and troubleshooting capabilities for latency-sensitive applications running on EC2 Nitro instances. We use the new nvme_amzn.exe tool to collect high-frequency statistics on I/O operations, latency, and queue length, enabling proactive troubleshooting.

As examples of how to use these granular metrics, this solution demonstrates how to validate the responsiveness of local storage and EBS volume, so that you can quickly identify any I/O interruptions. This solution helps you identify storage performance bottlenecks, which can be used to optimize the local storage and EC2 instance configurations for your workloads.

Prerequisites

This solution involves setting up an EC2 Nitro instance and an attached local storage to access detailed performance statistics for the local storage. This is a setup you likely already have if using Amazon EC2. To deploy the required components, you must complete the following steps:

  1. Launch an EC2 Nitro instance (or use an existing Nitro instance), and connect to it via Remote Desktop Protocol (RDP).
  2. Verify that your EC2 Windows instance includes AWS NVMe driver version 1.7.0 or later installed by following identify your driver type
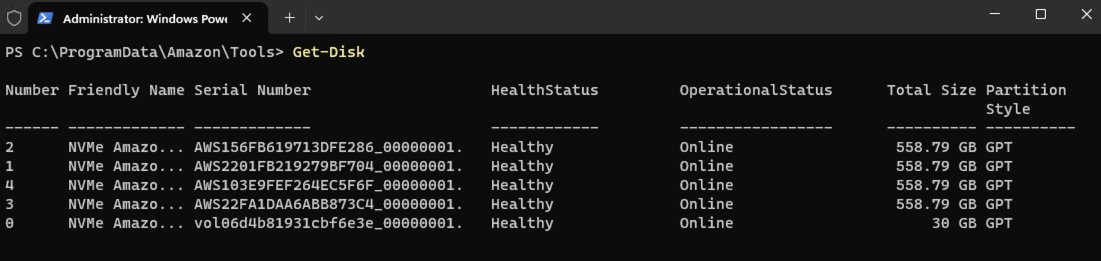
  3. Identify the NVMe device associated with the local storage/EBS volume for which you want to query the stats. You can run the Get-Disk command in PowerShell to output all NVMe devices on the instance. For more information, see Map NVMe disks on Amazon EC2 Windows instance to volumes.

For this demonstration, we’ll monitor two storage volumes:

  • EBS volume (Disk 0): Serial Number vol01234567890abcdef_00000001.
  • Local storage (Disk 1): Serial Number AWSEXAMPLE1234567890_00000001.
  1. Ensure that nvme_amzn.exe is present in C:\ProgramData\Amazon\Tools by default.
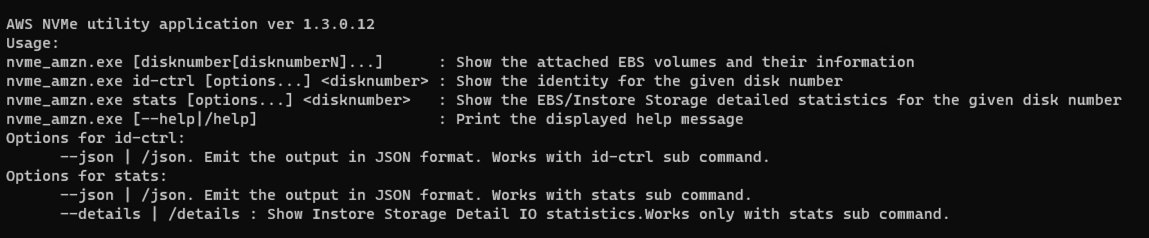
  2. Use the nvme_amzn.exe tool, with administrator privileges, and pass the disk number as a parameter with different command. The returned output looks like the following.

Administrator: Windows PowerShell:

.\nvme_amzn.exe --help or nvme_amzn.exe /help

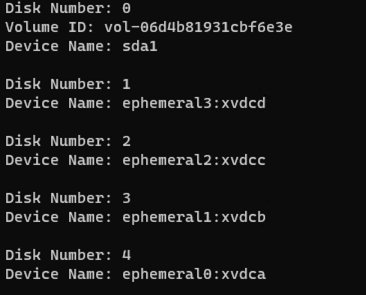
Users can see the EBS volumes devices mapping by default without passing the disk number as a parameter

.\nvme_amzn.exe

Users can view the specific device mapping by passing disk numbers or a single disk number as a parameter.

.\nvme_amzn.exe 0 1 2 3 4

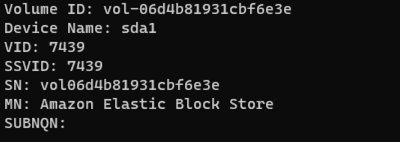
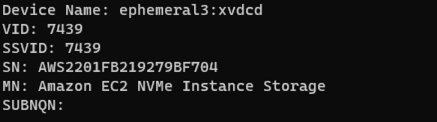
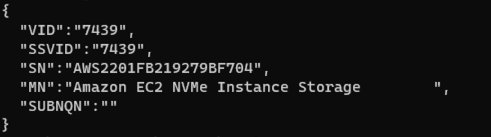
Users can see the nvme controller details by using id-ctrl and pass the disk number as a parameter (JSON output can be retrieved by providing the --json or /json parameter to the tool)

# EBS volume
.\nvme_amzn.exe id-ctrl 0

# EC2 local storage
.\nvme_amzn.exe id-ctrl 1

.\nvme_amzn.exe id-ctrl 0 --json

Users can see the performance statistics for EBS/EC2 local storage volume by using stats and pass the disk number as a parameter (provide the --json or /json parameter to retrieve JSON output).

# EBS volume
.\nvme_amzn.exe stats 0
# Json format
.\nvme_amzn.exe stats 0 --json

# EC2 Local storage volume
.\nvme_amzn.exe stats 1
# Json format
.\nvme_amzn.exe stats 1 --json

In addition, for EC2 local storage volume, by providing the --details/-d option, you can see the histogram of 5 different IO bands: (0, 512 Byte], (512B, 4KiB], (4KiB, 8KiB], (8KiB, 32KiB], (32 KiB, MAX].

.\nvme_amzn.exe stats 0 --details

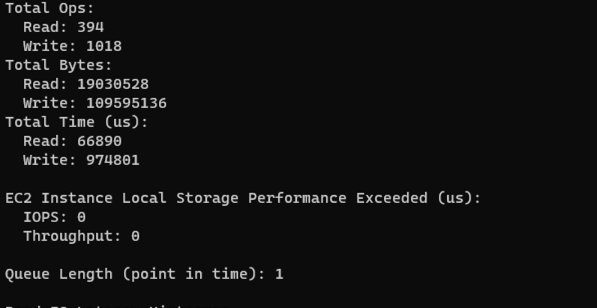
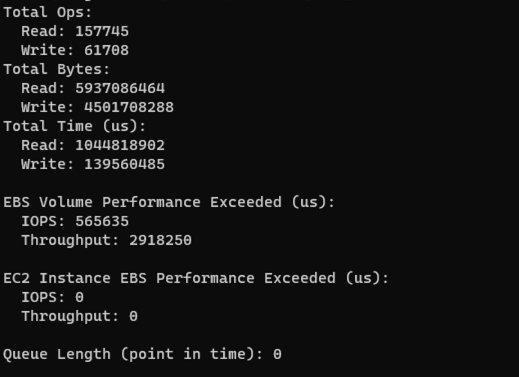
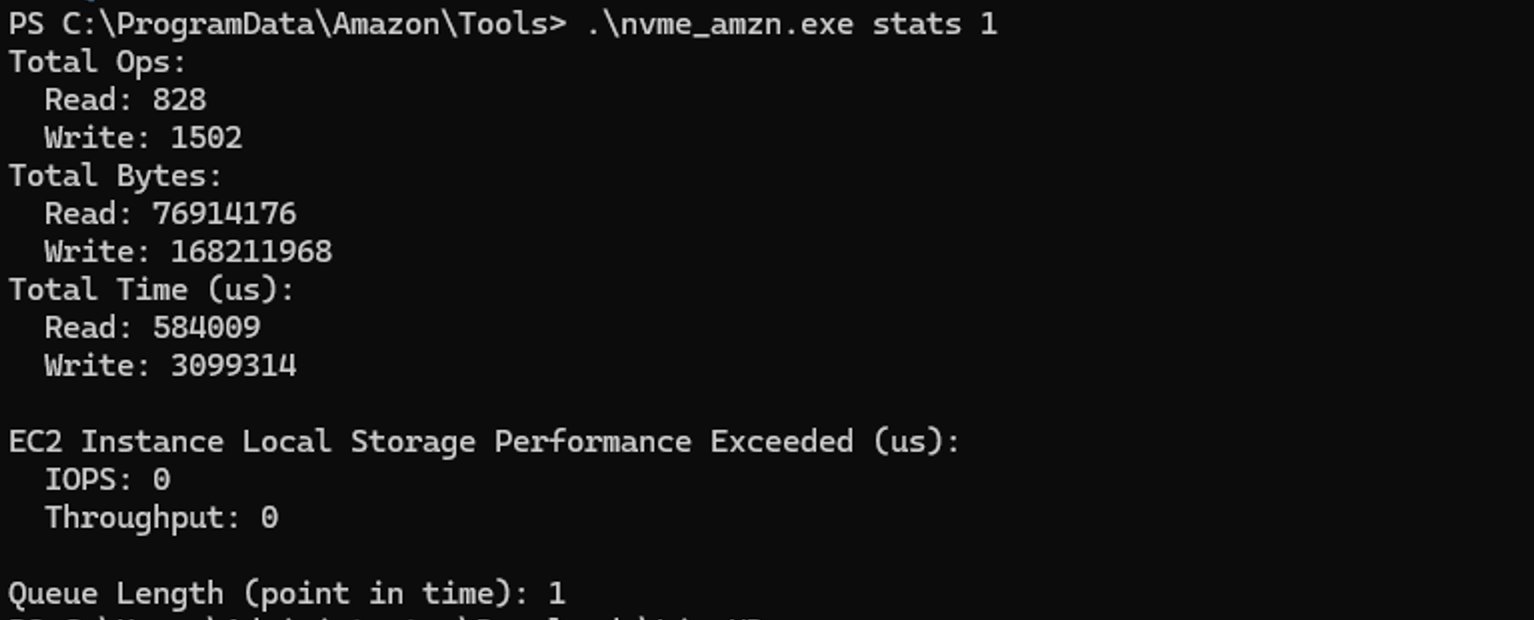
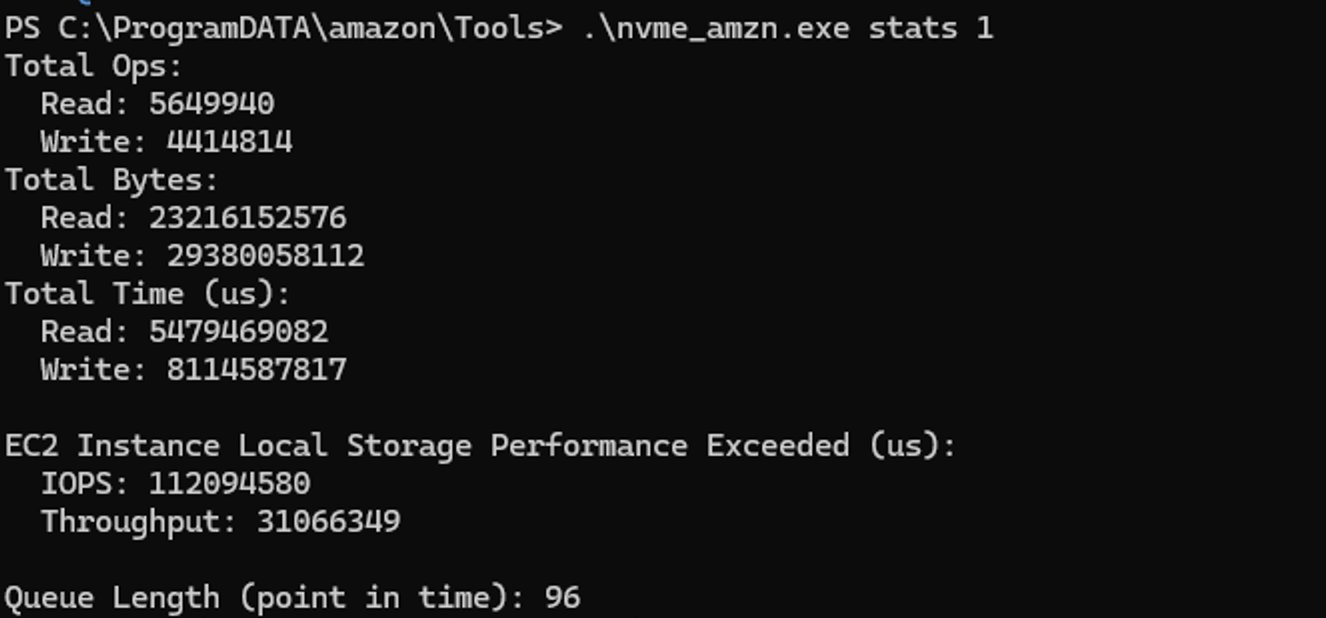
The following example shows NVMe log output with cumulative statistics. The statistics indicate read/write operations, bytes transferred, and time spent processing operations (in microseconds). They also show the number of microseconds in which the application attempted to exceed the Amazon EBS or Amazon EC2 Instance Local Storage IOPS/throughput limits

EBS volume:

EC2 local storage volume:

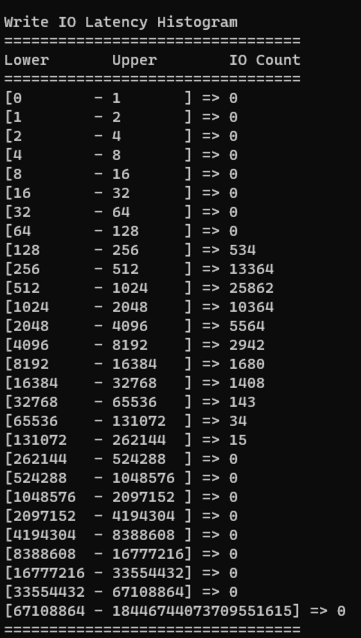
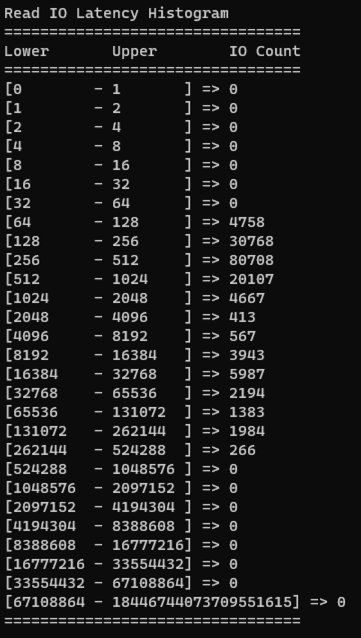
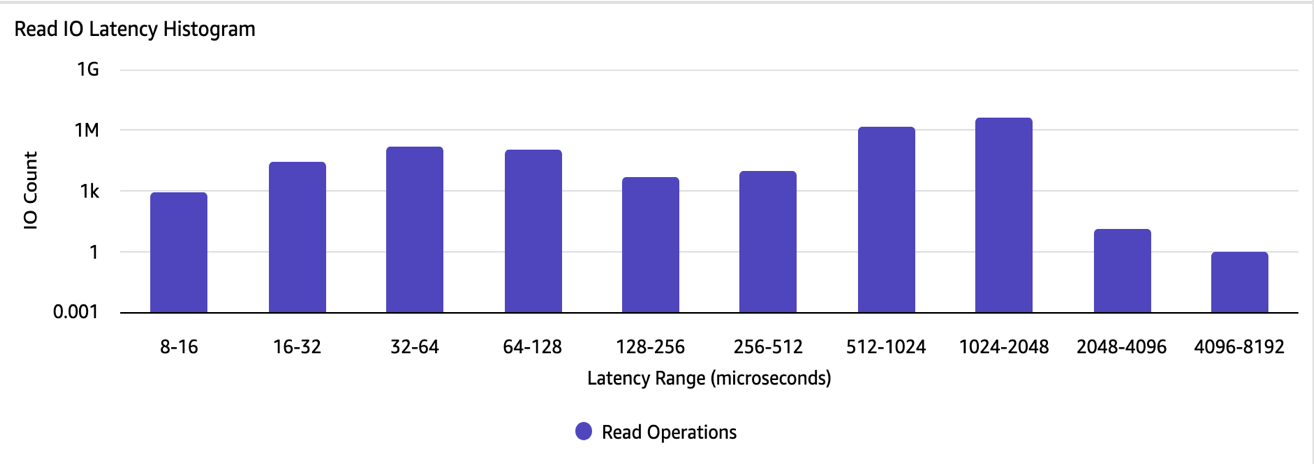
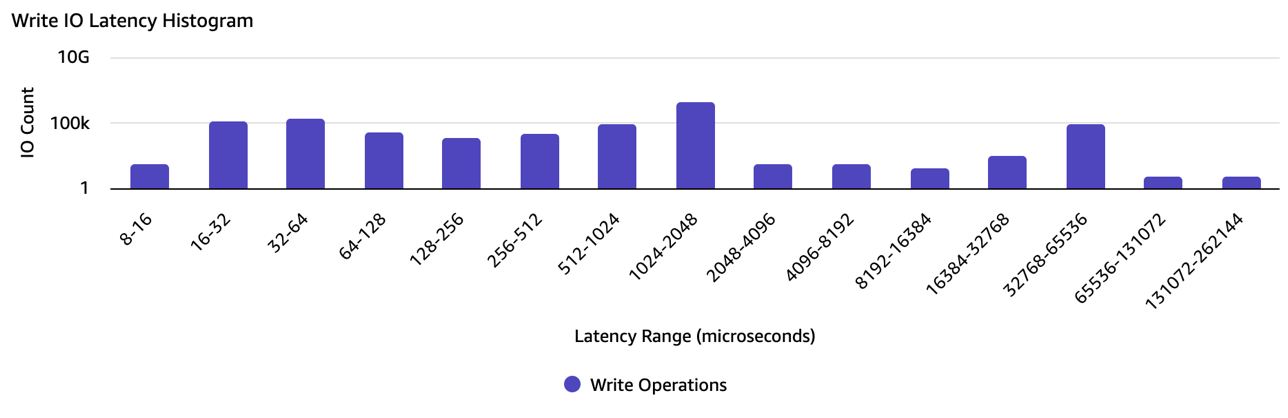
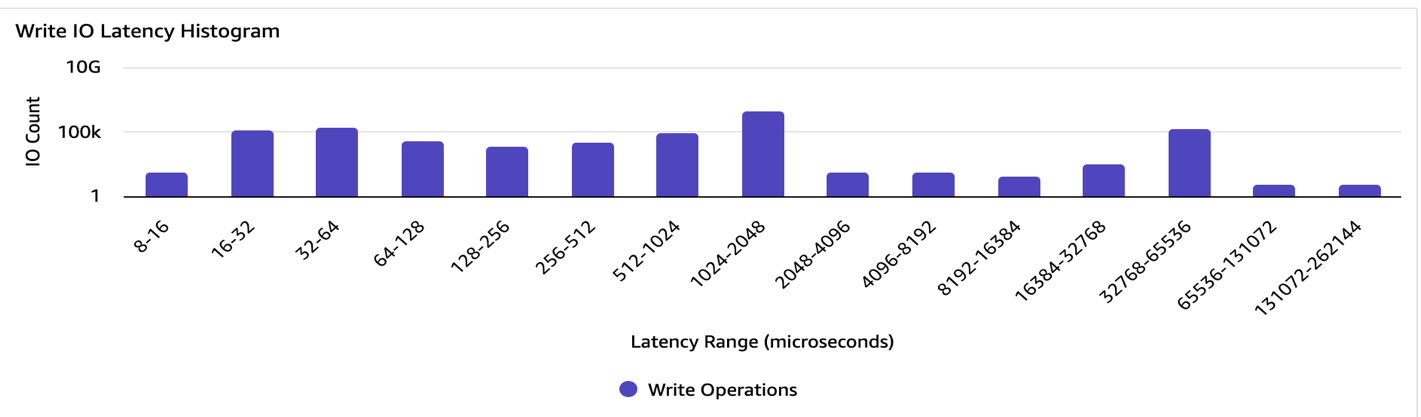
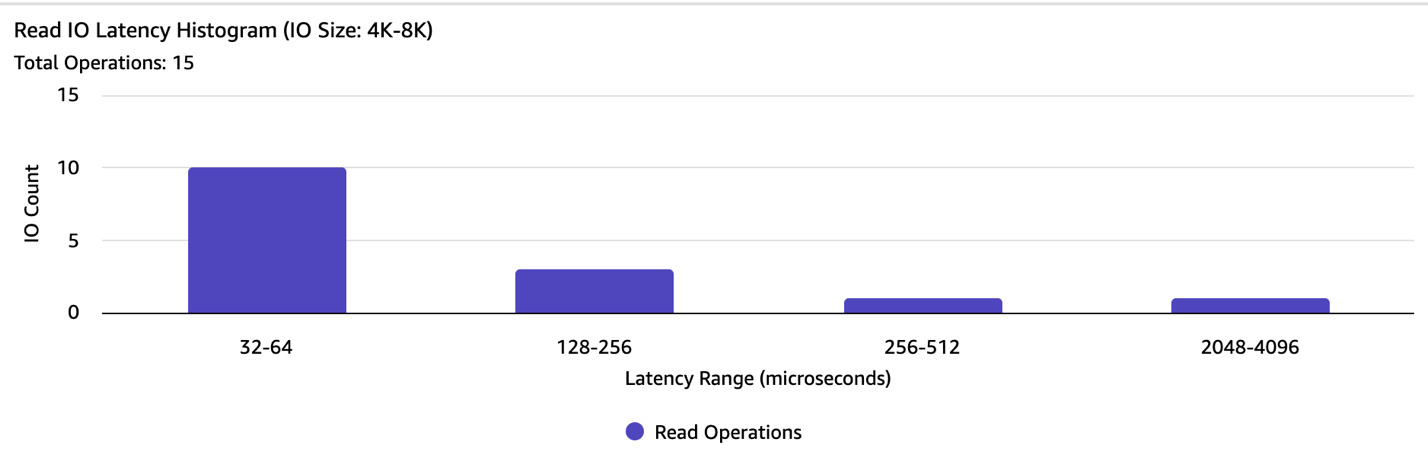
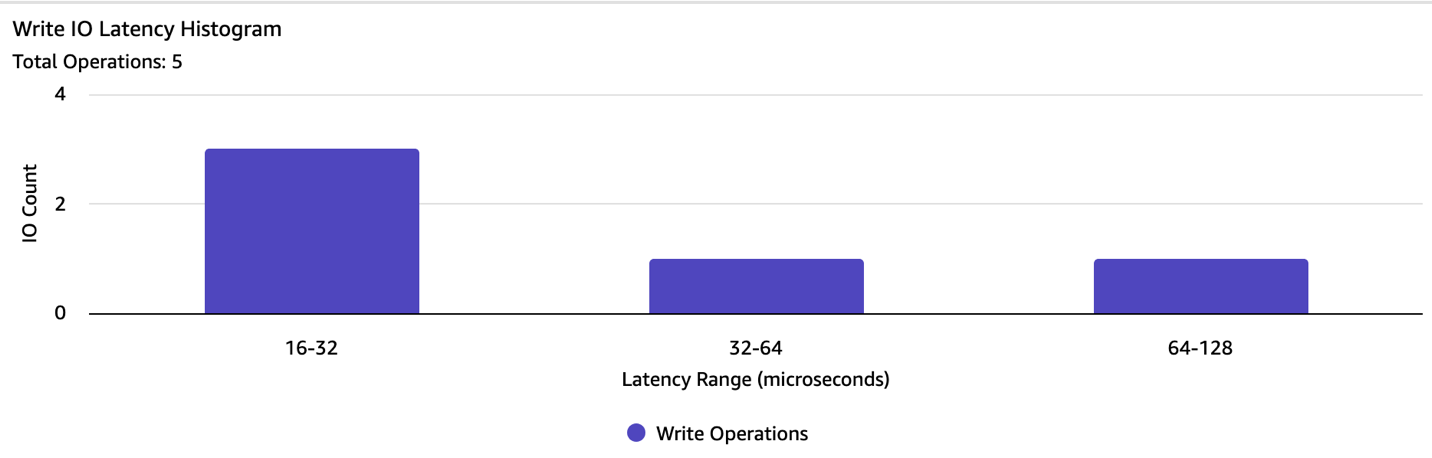
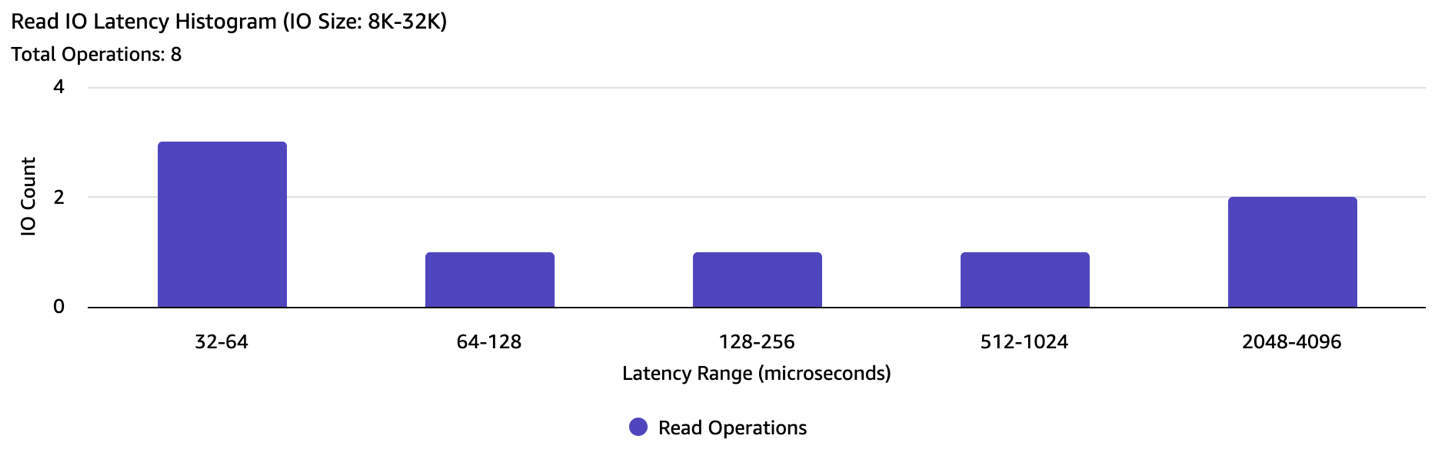
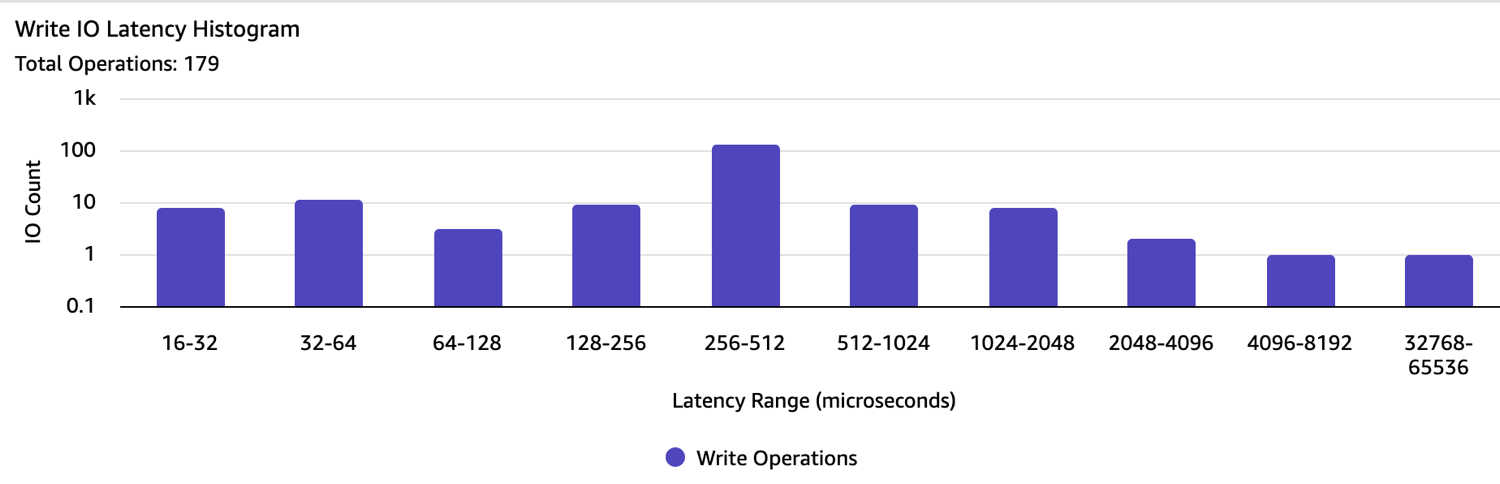
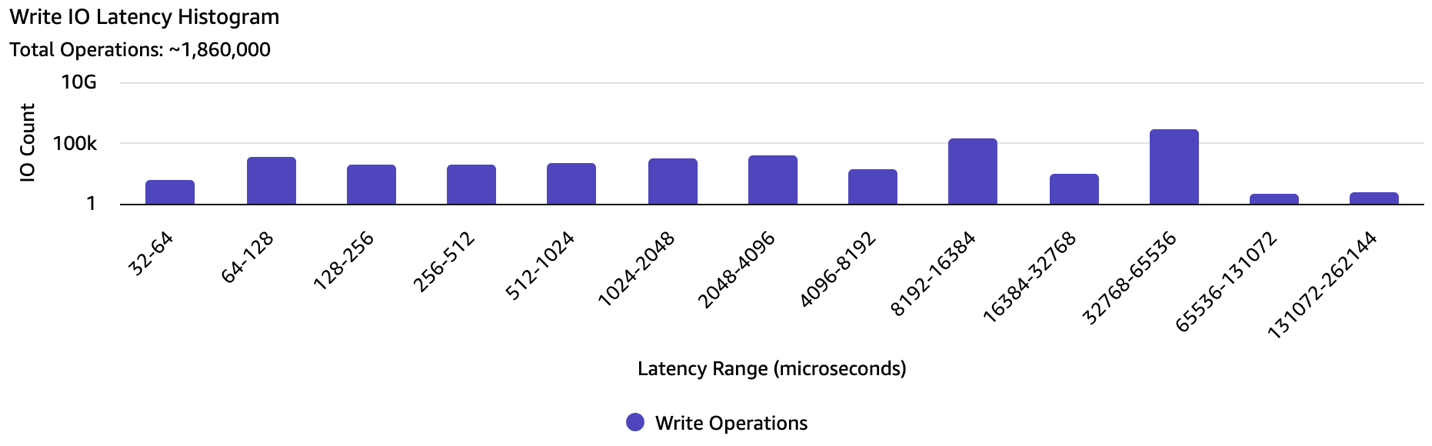
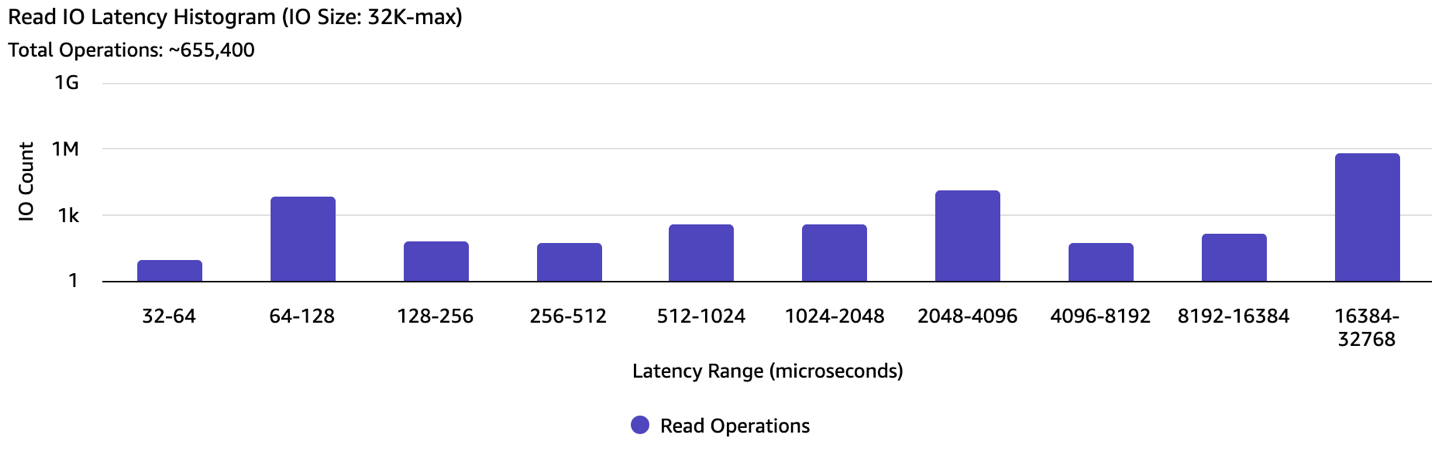
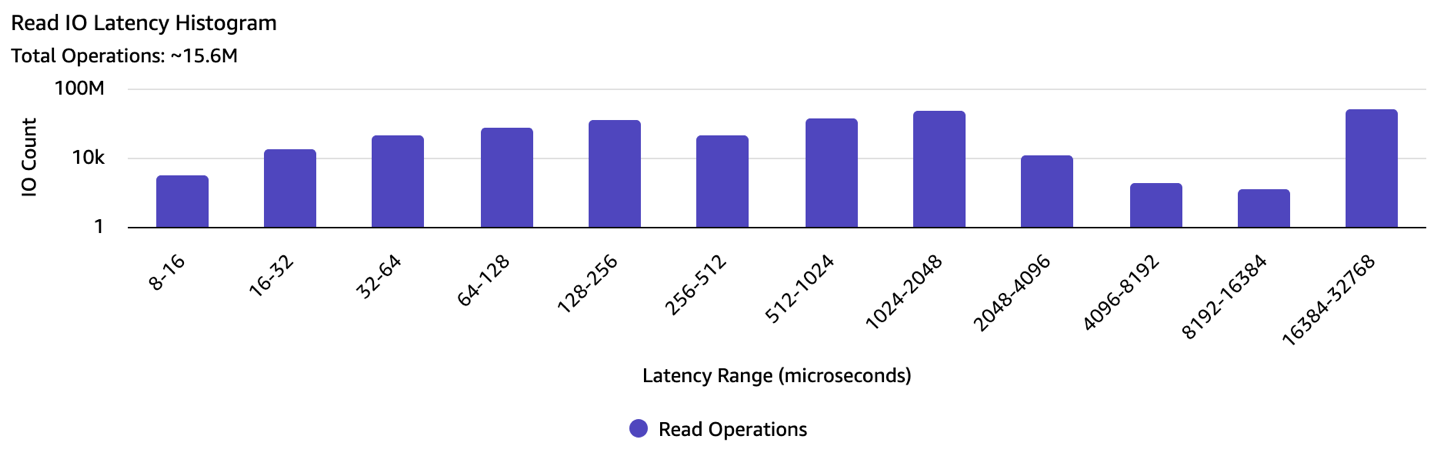
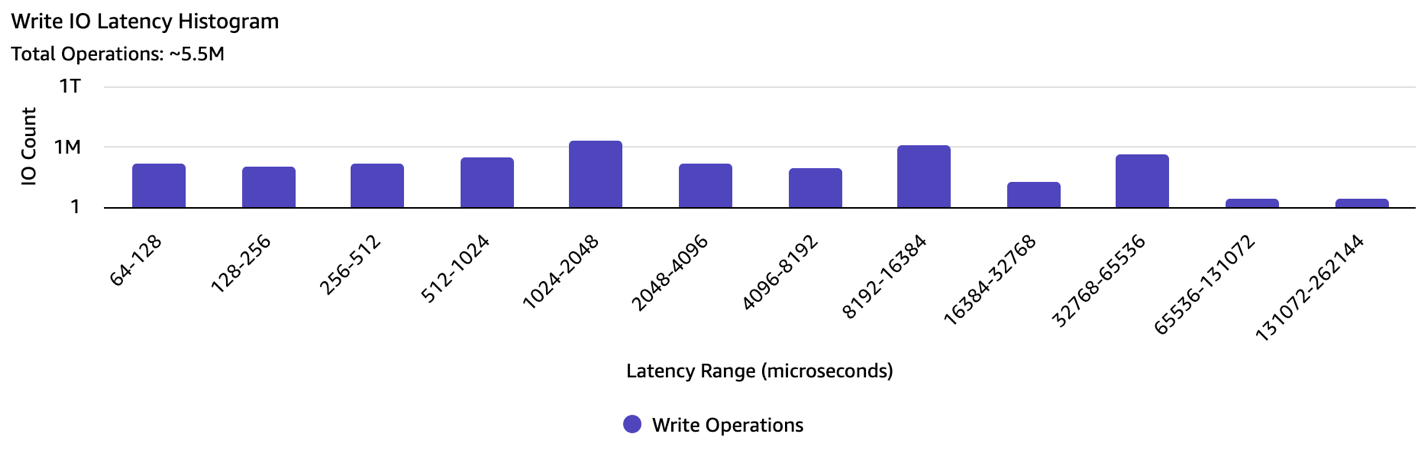
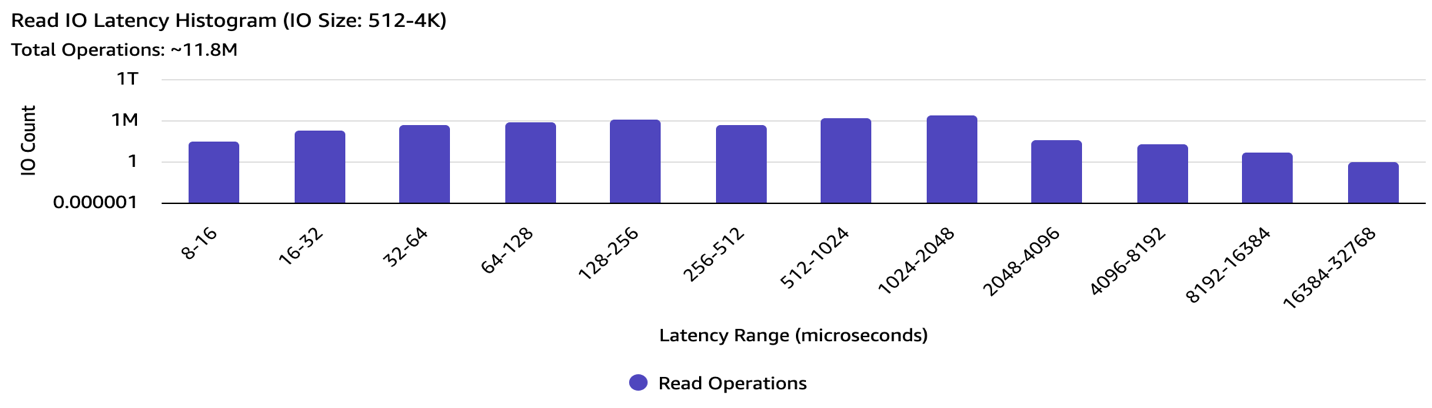
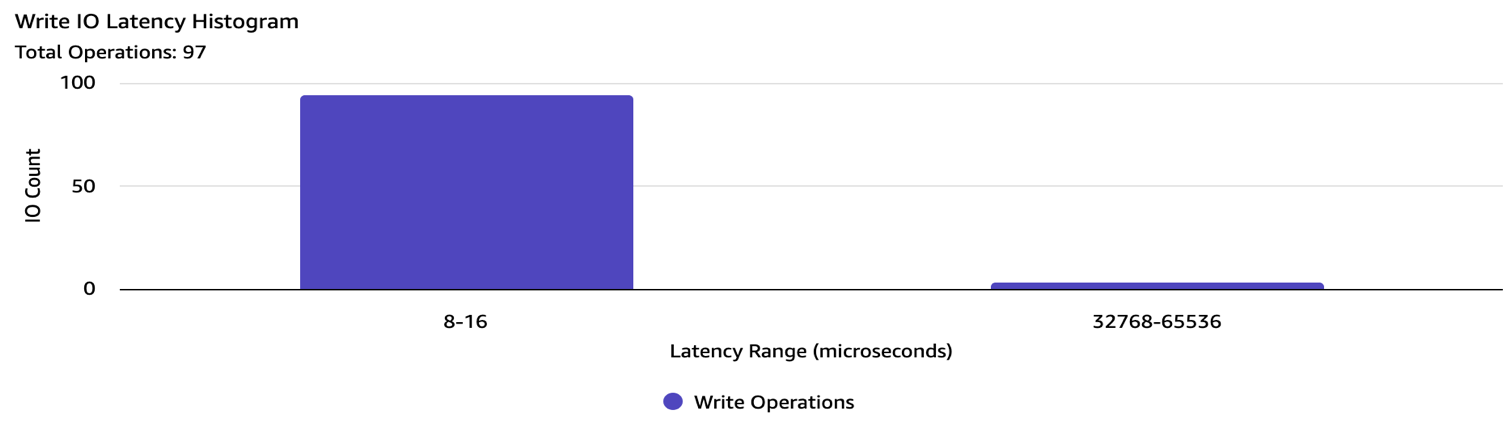
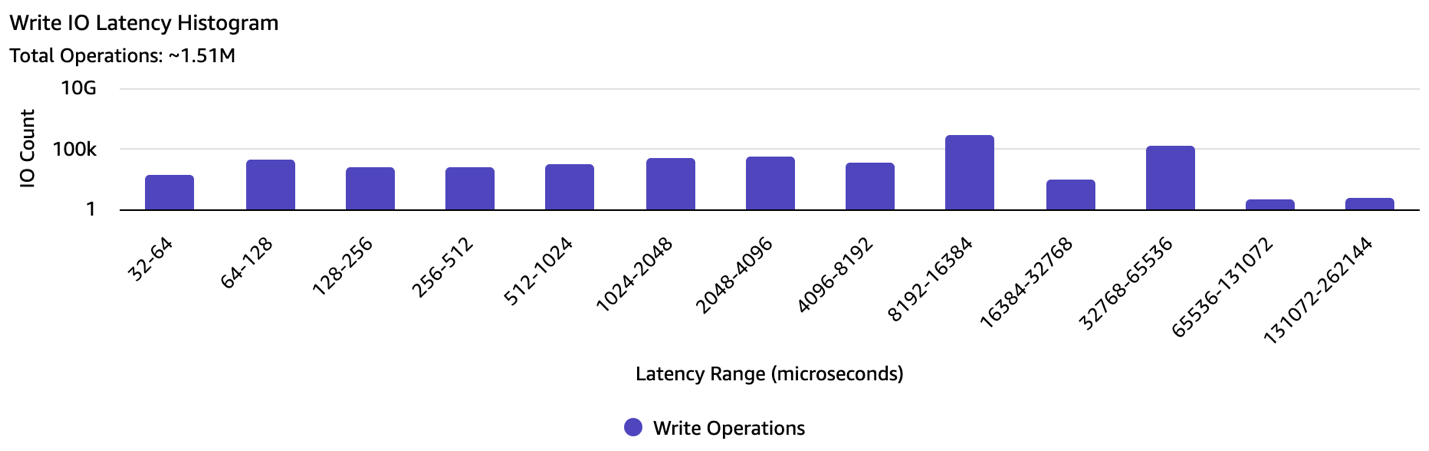
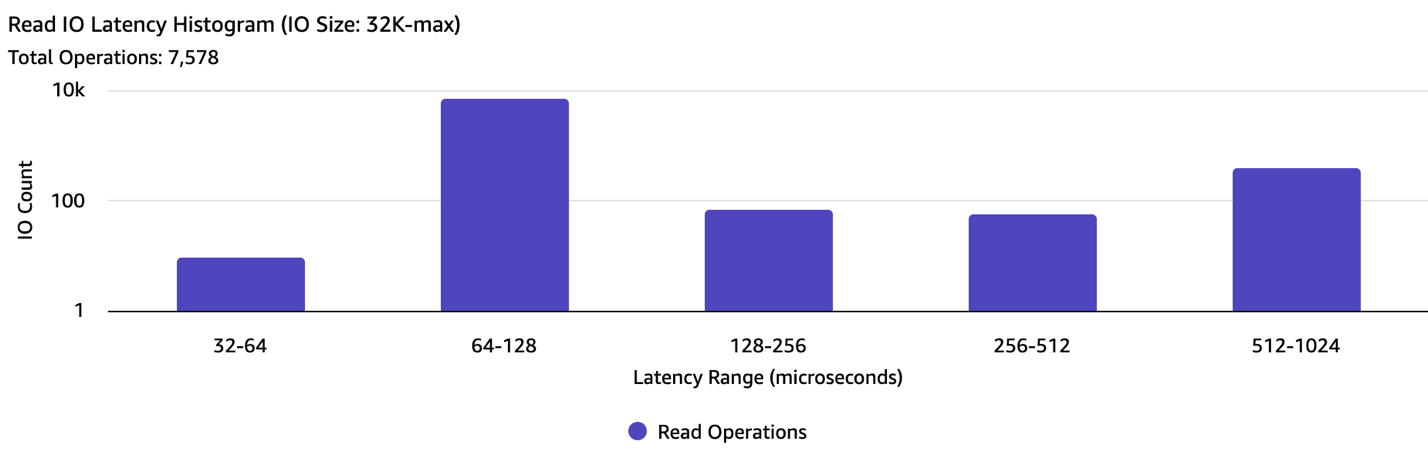
Also included in the following figures are read and write I/O latency histograms, with each row representing the total number of I/O operations completed so far within a specific bin of time (in microseconds).

These statistics are presented as cumulative counters up to the time at which the command is executed. The command can be run at the desired interval, for example, every 15 seconds, with each subsequent output reflecting the updated cumulative totals for the metrics. Calculating the difference in the statistics across the last two outputs allows you to derive insight into the instance storage profile over the given 15 second period.

Deriving insights from the Amazon Instance Storage/EBS volume detailed performance statistics

You have set up monitoring using these detailed performance statistics, now we can demonstrate the different ways you can use these statistics.

As mentioned in the preceding section, you can use the detailed statistics to view I/O latency histograms to observe the spread of I/O latency within the period. You can use the read/write operations and time spent statistics to calculate the average latency. Using the detailed statistics allows you to view the average latency at a sub-minute granularity.

Here are four examples for you to use the statistics to shed light on key performance metrics.

Scenario 1: Identifying unresponsive state of an EBS volume

In this scenario, we discuss how to use Amazon EBS detailed performance statistics to observe when an EBS volume isn’t responding to I/O operations. If you observe multiple intervals where your volume is unresponsive, then you can take actions, such as replacing the affected volume or stopping and restarting the instance to which the volume is attached. In most cases, when your volume becomes unresponsive, Amazon EBS automatically diagnoses and recovers your volume within a few minutes.

To identify if your volume is unresponsive, you can use the following steps to determine whether I/O disrupted on your volume:

  1. Identify the EBS volume’s NVMe device to troubleshoot
  2. Collect stats for the device at the desired intervals
  3. Compare the stats to check if the EBS volume is unresponsive

Step 1: Identify the EBS volume’s NVMe device to troubleshoot

1. Identify the NVMe device associated with the EBS volume on the instance by using the nvme_amzn.exe tool.

.\nvme_amzn.exe

Step 2: Collect stats for the device at the desired intervals

1. Collect the Amazon EBS detailed performance statistics directly from the device by using the nvme_amzn.exe tool:

# EBS volume disk0
.\nvme_amzn.exe stats 0

Step 3: Compare the stats to check if the EBS volume is unresponsive

1. From the output, consider the following three fields for this scenario: Total Read Ops, Total Write Ops, and Queue Length.

2. Issue the same ebsnvme command after a desired interval (for example: after 15 seconds), so that you can compare how Total Read/Write I/Os have progressed at the Amazon EBS level.

3. From the detailed performance statistics collected approximately 15 seconds apart, we make the following key observations

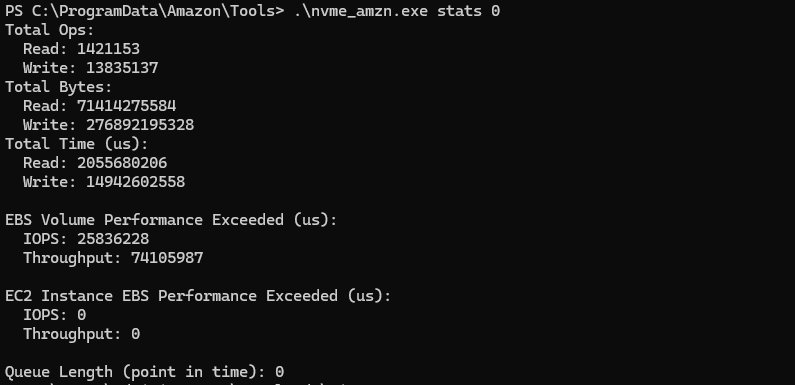
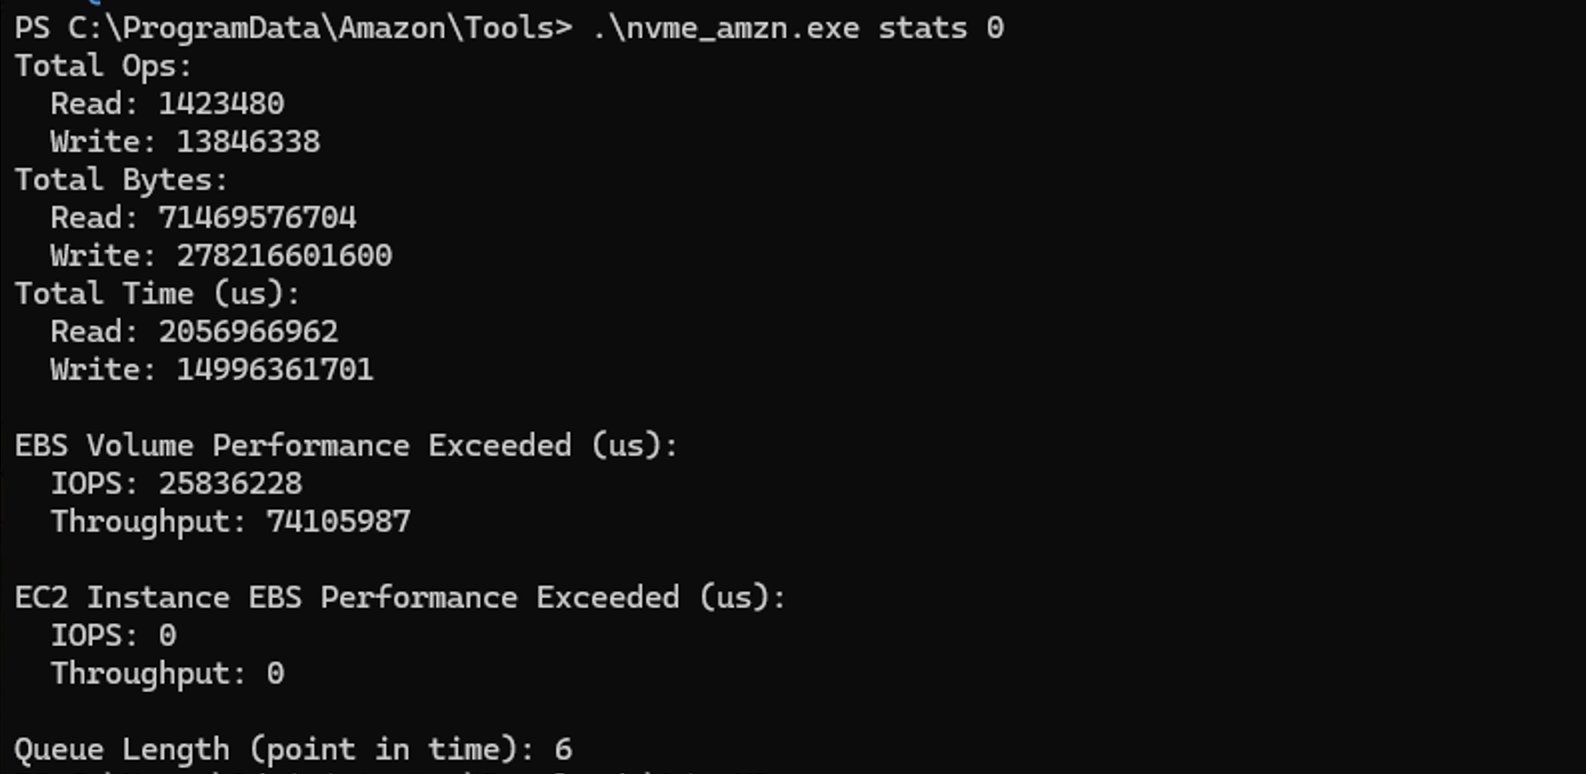
  • Total Read Ops increased from 1421153 to 1423480, indicating 2327 Read operations completed in the 15 second span.
  • Total Write Ops increased from 13835137 to 13846338, indicating 11201 Read operations completed in the 15 second span.
  • Queue Length stayed between 0 and 6, indicating that the application was issuing I/Os to the EBS volume. If you see a gradual increase in the Queue Length, then it would reflect a buildup in queued I/Os.

This shows that the EBS volume is still driving I/Os that it is receiving, which rules out the EBS volume as the source of observed degradation in application performance. If we had seen an increase in the Queue Length along with 0 Read/Write Ops processed during the period, then it would reflect an unresponsive EBS volume.

If you would like to validate your mechanisms of identifying unresponsive EBS volumes, refer to the Conducting chaos engineering experiments on Amazon EBS using AWS Fault Injection Service blog post, which walks through how to set up an AWS Fault Injection Service Pause I/O experiment.

Scenario 2: Identifying bottlenecks in storage performance on EBS

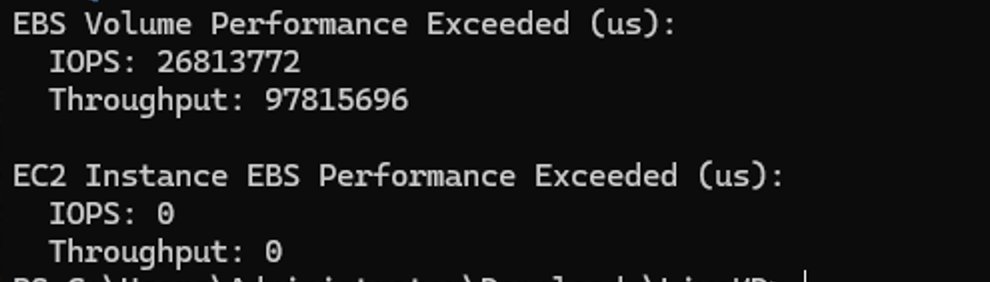
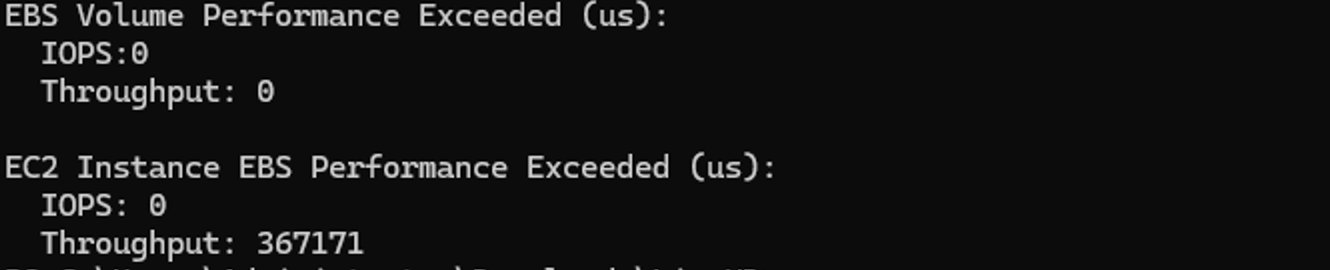
Amazon EBS detailed performance statistics can also be used to configure the appropriate performance characteristics for your EBS volume and EC2 instance based on the performance needs of your application. The EBS Volume Performance Exceeded and EC2 Instance EBS Performance Exceeded statistics indicate the duration for which your workload consistently attempted to drive IOPS or throughput that is greater than your volume or your instance’s provisioned performance in a given period. Exceeding either the volume’s or instance’s provisioned performance can result in elevated latency on your workload. For this scenario, consider the same application as the one used in scenario 1.

Complete the following steps to check if EBS volume performance is correctly provisioned:

1. Select the EBS volume’s NVMe device to check
2. Collect stats for the device at the desired intervals
3. Compare the stats to check if the EBS volume is exceeding provisioned performance

Step 1. Select the EBS volume’s NVMe device to check

1. This step is the same as Step 1 discussed previously in scenario 1.

Step 2. Collect stats for the device at the desired intervals

1. Similar to Step 2 discussed in scenario 1, access the detailed performance statistics across two points in time.

2. Consider the EBS Volume Performance Exceeded and EC2 Instance EBS Performance Exceeded statistics from the EBS NVMe device.

$DiskNumber = 0
$Interval = 15

while ($true) {
    Write-Host "=== $(Get-Date -Format 'yyyy-MM-dd HH:mm:ss') ===" -ForegroundColor Cyan; & "C:\ProgramData\Amazon\Tools\nvme_amzn.exe" stats $DiskNumber
    Write-Host ""
    Start-Sleep -Seconds $Interval
}

Step 3: Compare the stats to check if the EBS volume is exceeding provisioned performance

1. In the following example output, you can see the EBS Volume Performance Exceeded statistic increasing by 26813772 microseconds. This shows the workload running on EBS volume vol-EXAMPLEabcd1234 has attempted to drive more IOPS than provisioned on the underlying EBS volume, which can impact the volume’s I/O latency. We recommend that you increase the performance of your volume to make sure that you have sufficient provisioned performance for your application’s needs.

2. In the following example output, driving a different workload on the instance allows us to see that the volume has exceeded the provisioned IOPS performance at the attached EC2 instance level. In this case, up-sizing to a larger instance size can improve the performance of your application.

3. A synthetic load generator for Oracle called Silly Little Oracle Benchmark (SLOB) could also be used to simulate workloads on Oracle databases, while monitoring the Amazon EBS statistics to see which volume or instance is becoming the bottleneck.

It’s important to have the right instance and volume configurations to avoid performance bottlenecks to your application. Refer to the EBS volume types documentation for more information on the different EBS volume types, and the Amazon EBS-optimized documentation to understand how to select the optimal combination of EC2 instance and EBS volume suited for your application. These statistics are available at up to a one-second granularity, which allows you to effectively perform these checks in real-time and initiate volume modifications to optimize volume characteristics as needed.

Scenario 3: Identifying bottlenecks in storage performance on instance storage volume

Amazon Instance Storage detailed performance statistics can be used to configure the appropriate performance characteristics for your application. The “EC2 Instance local storage Performance Exceeded” statistics indicate the duration for which your workload consistently attempted to drive IOPS or throughput that is greater than your rate limit in a given period. Exceeding the throttle value can result in elevated latency on your workload.

For example, i3en.xlarge can support up to 85,000 read IOPS, 65,000 write IOPS, 634,765 KiB/S for read and 317,382 KiB/S for write. By using the detailed IO metrics, you can more efficiently determine if the instance meets your requirements.

Complete the following steps to check if the device meets your application needs:

  1. Select the instance storage device to check.
  2. Collect stats for the device at the desired intervals
  3. Compare the stats to check if the instance storage is exceeding the throttled value

Step 1. Select the Instance Storage NVMe device to check

Use the nvme_amzn tool and identify the NVMe device associated with the instance storage.

Step 2: Collect stats for the device at the desired intervals

$DiskNumber = 0
$Interval = 15

while ($true) {
    Write-Host "=== $(Get-Date -Format 'yyyy-MM-dd HH:mm:ss') ===" -ForegroundColor Cyan; & "C:\ProgramData\Amazon\Tools\nvme_amzn.exe" stats $DiskNumber
    Write-Host ""
    Start-Sleep -Seconds $Interval
}

Step 3: Compare the stats to check if the instance storage is exceeding throttle value

Take the following scenario as an example. At the very beginning, after the instance launch, both the IOPS and Throughput under “EC2 Instance local storage Performance Exceeded (us)” are 0s.

You start your applications and find that the application write does not meet your expectation. You can check the IO metrics afterwards. You see a lot of IO falls into the 1 ms to 2 ms range, which is unexpected.

By further checking the “EC2 Instance local storage Performance Exceeded (us)”. You found that the IO reached the allowed upper limit for up to 8 seconds, which indicates the i3en.xlarge would not meet your expectations. Select a larger instance size to address this.

It’s important to have the right instance size to avoid performance bottlenecks to your application. Refer to the ec2-instance-type-specifications documentation for more information on the different instance storage size to understand how to select the optimal instance size suited for your application. This tool helps you to effectively perform these checks in real-time.

Scenario 4: Identifying which block size caused the long latency on instance storage volume

You may have a mixed workload:

  • Data (either read or write) pattern with different block sizes like 4K and 128K.
  • Mixed read and write data pattern.

By using the --detail/-d switch from the NVMe CLI, you can identify the issue quickly and readjust the workload.

Example 1: High write latency from a workload

By further looking at the histogram of the block size range larger than 32 KiB, you can see that the larger IO caused high application latency, while other block sizes (like 8K) show no latency abnormality.

Example 2: Mixed read and write traffic

Some users will have a mix of read and write traffic. For example, some applications will do light read traffic (for example to read out some metadata) and heavy write. This may inadvertently impact the read latency. For example, an application is doing a read operation with a single IO of small block size. However, the user experiences high read latency. Examining the histogram breakdown, you could reasonably believe the heavy larger IO write may interfere with the read.

The detailed IO histogram for IO size larger than 512B but less than or equal to 4KB

The detailed IO histogram for IO size larger than 32 KiB

The user should consider smoothing out the write pattern to alleviate the read latency.

Cleaning up

If you created an EC2 instance and EBS volume for this exercise, then terminate and delete the appropriate instance and volumes to avoid future costs.

Conclusion

In this post, we presented a solution for accessing high-resolution performance statistics for Amazon EBS volumes and EC2 Instance Store at the instance level. These detailed metrics provide a real-time view into your underlying storage performance at sub-minute granularity, helping you to quickly root cause disruptions to your applications.

This approach also helps you identify performance bottlenecks caused by workloads exceeding your provisioned IOPS or throughput limits on Amazon EC2, EBS volumes, or EC2 Instance Store. Combined with Amazon CloudWatch metrics, which provide volume-level insights at one-minute granularity, these tools help give you the visibility you need to confidently diagnose and resolve storage-related performance issues.

Enforce least-privilege authorization in multi-agent AI chains using Cedar

Post Syndicated from Dhananjay Karanjkar original https://aws.amazon.com/blogs/security/enforce-least-privilege-authorization-in-multi-agent-ai-chains-using-cedar/

If you’re building multi-agent AI systems, you need to prevent authorization scope from silently expanding as agents delegate tasks through multi-hop chains. Without proper controls, an agent can potentially act beyond what the originating user authorized, even when role-based access control (RBAC) policies are in place. The OWASP Top 10 for Agentic Applications classifies this risk as ASI03: Identity & Privilege Abuse.

This post shows you how to address the potential risk using a three-layer policy model built with Cedar, an open source authorization policy language, deployed on Amazon Web Services (AWS). The reference implementation uses OAuth 2.0 for authentication and Cedar for authorization. A trusted identity provider authenticates the originating user, then Cedar policies enforce authorization across three layers using verified token claims.

Reference implementation overview

To enforce authorization at each hop in a multi-agent delegation chain, the reference implementation uses two AWS Lambda functions in sequence. A Model Context Protocol (MCP) adapter Lambda function normalizes inbound requests and cryptographically signs the originating user context. This prevents downstream tampering. A Cedar evaluator Lambda function evaluates three independent policy layers sequentially, halting on the first deny.

Table 1: Three-layer Cedar policy evaluation model

Layer What it checks Principal to resource
L1 – Agent-to-tool Whether the invoking agent has a sufficient trust score (1–5), belongs to the correct namespace (for example, payments), and is in the production lifecycle stage Agent to tool
L2 – Agent-to-agent delegation Whether the delegation hop count is within the hard limit of five, and whether requested tasks are a subset of the target agent’s registered capabilities Agent to agent
L3 – Originating user authorization Whether the human who initiated the chain has the required role (for example, admin), has completed MFA, and is within the allowed delegation depth Agent to tool (user in context)

Architecture

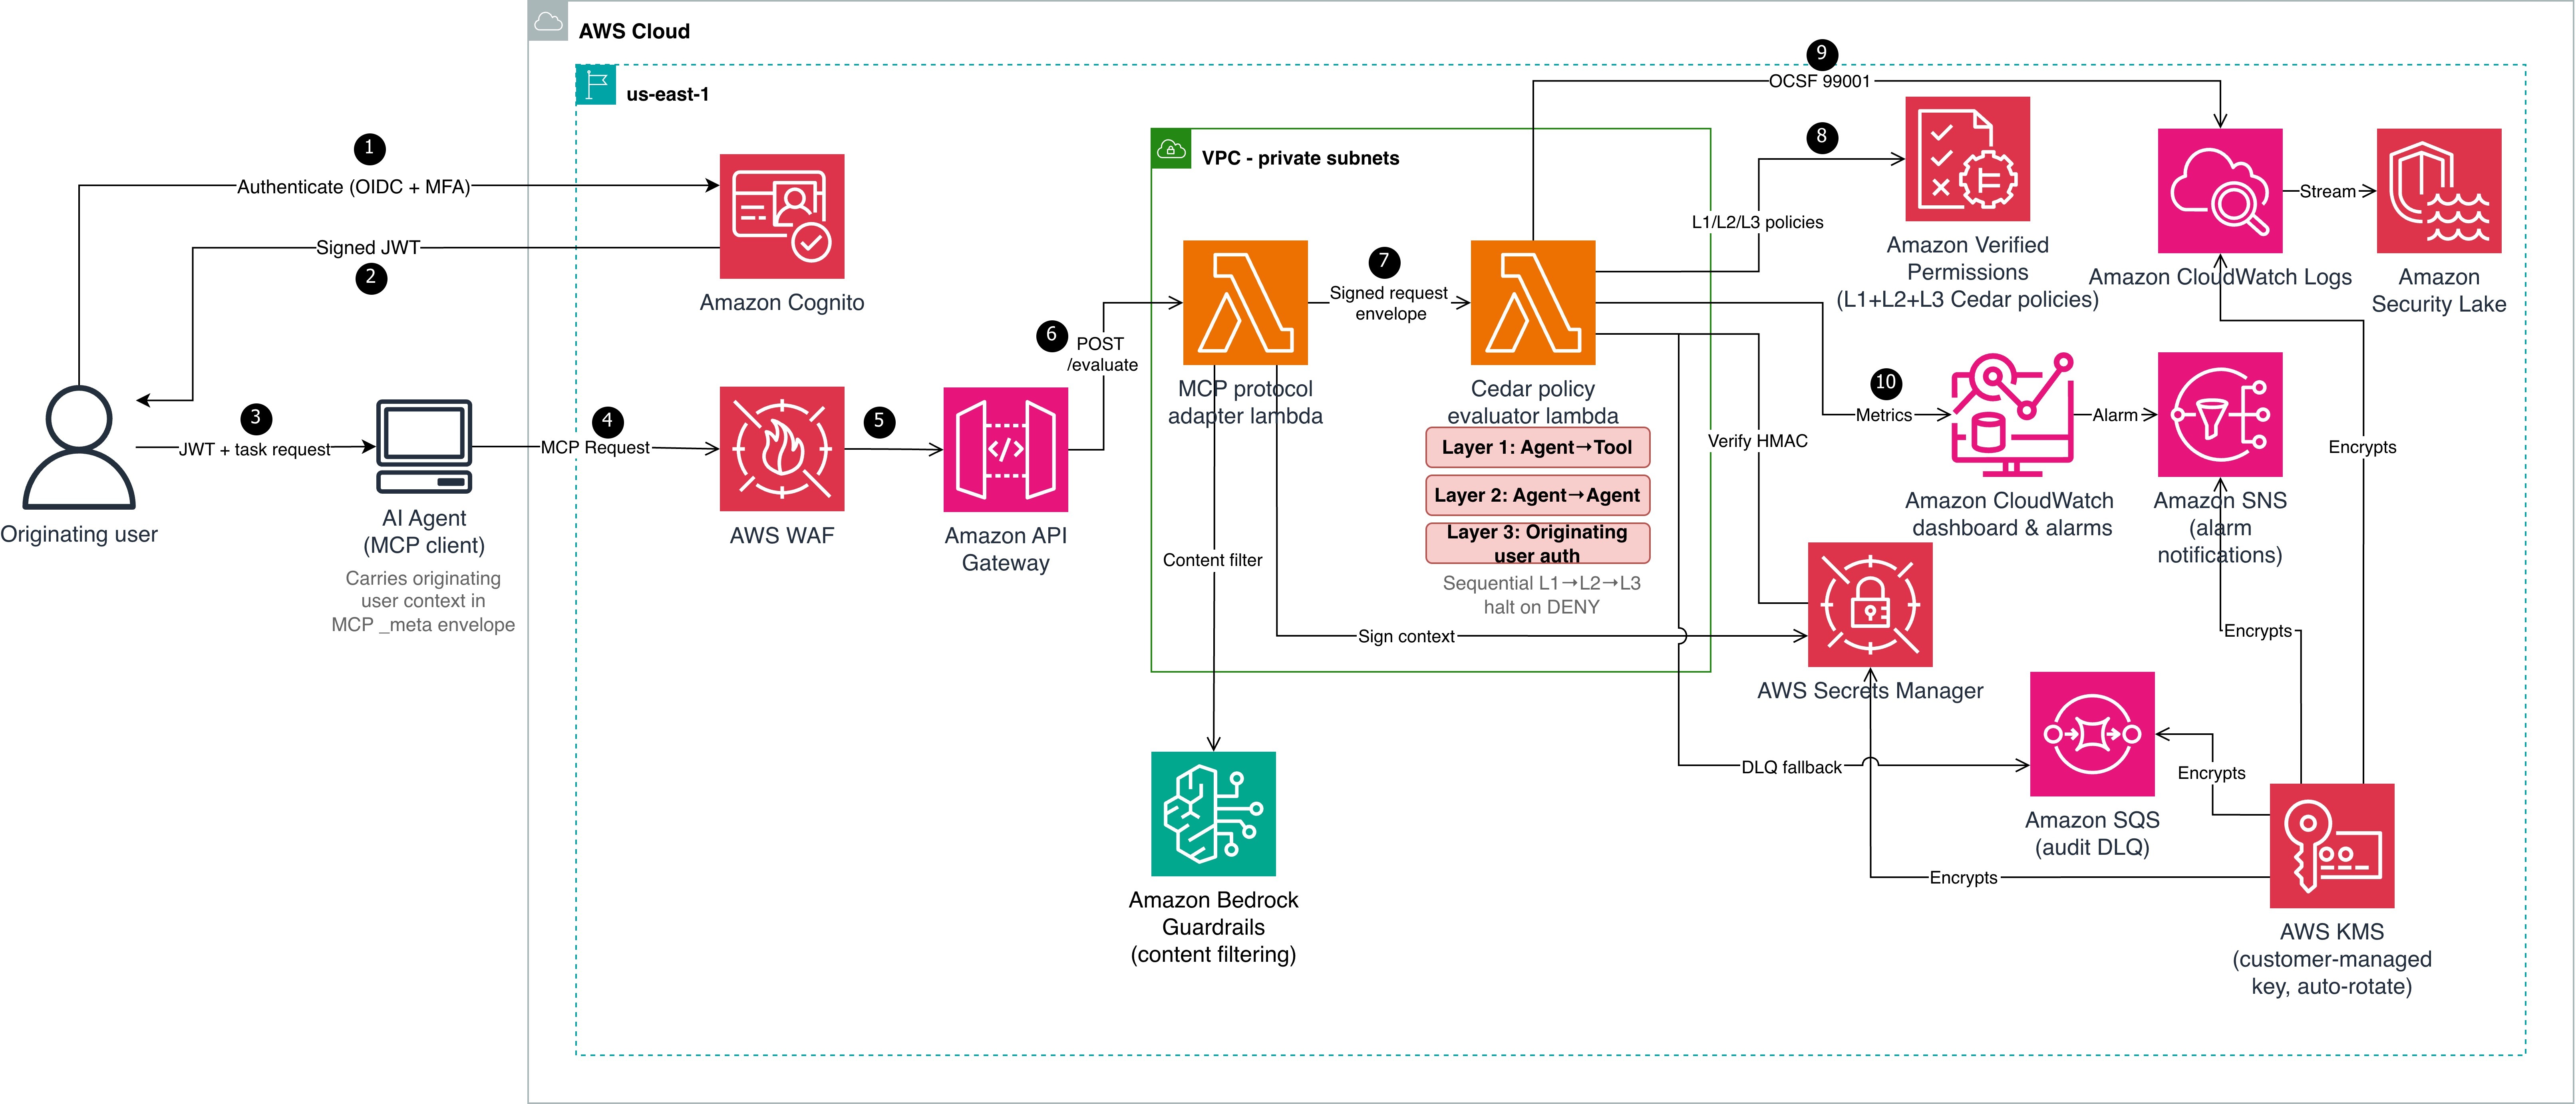
Cedar evaluates authorization but doesn’t establish identity. Before Cedar can evaluate context.originating_user.role or context.originating_user.mfa_verified, a trusted authentication layer must establish the user’s identity and produce verifiable claims. Steps 1–3 handle authentication; steps 4–10 handle authorization. The architecture shown in Figure 1 is described in the following lists:

Authentication (steps 1–3)

  1. The originating user authenticates with an OIDC-compliant identity provider (in this reference implementation, Amazon Cognito with TOTP multi-factor authentication (MFA)). The identity provider (IdP) issues a signed JSON Web Token (JWT) containing claims such as sub, role, amr (authentication methods), and session_id.
  2. Amazon Cognito returns the signed JWT to the user.
  3. The user passes the JWT and task request to the AI agent (MCP client). The agent carries the originating user context in the MCP _meta envelope.

Authorization pipeline (steps 4–10)

  1. The AI agent sends a Model Context Protocol (MCP) request to AWS WAF, which filters using CommonRuleSet, SQLiRuleSet, rate limiting, and body size constraints.
  2. Amazon API Gateway (with Amazon Cognito authorizer) verifies the JWT signature against the user pool’s public keys and rejects invalid or expired tokens. Valid requests are forwarded to the MCP protocol adapter Lambda function, which applies Amazon Bedrock Guardrails content filtering.
  3. The adapter extracts verified claims from the token and maps them to Cedar context attributes:
    1. JWT role claim : context.originating_user.role
    2. JWT amr includes MFA method: context.originating_user.mfa_verified = true
    3. JWT sub: context.originating_user.user_id
    4. JWT sid: context.originating_user.session_id
    5. JWT amr claim: context.originating_user.authentication_method

    The adapter then computes an HMAC-SHA256 signature over the user context (user_id, role, mfa_verified, authentication_method, and session_id in canonical order) using a key from AWS Secrets Manager.

  4. The adapter constructs a signed request envelope and invokes the Cedar evaluator Lambda function.
  5. The evaluator verifies the HMAC-SHA256 signature, retrieves L2 and L3 Cedar policies from Amazon Verified Permissions, and evaluates all three layers (L1, L2, and L3), halting on the first deny.
  6. The evaluator emits an Open Cybersecurity Schema Framework (OCSF) 99001 audit event to Amazon CloudWatch Logs. Failed emissions fall back to an Amazon Simple Queue Service (Amazon SQS) dead-letter queue (DLQ).
  7. Amazon CloudWatch dashboards and alarms monitor evaluation latency, deny rates, and DLQ depth. Alarm notifications route through Amazon Simple Notification Service (Amazon SNS).

Context integrity through delegation hops

Two mechanisms work together to protect identity across hops:

  • Hash-based Message Authentication Code (HMAC-SHA256) ensures integrity and authenticity. Every downstream evaluator verifies this signature before trusting the context.
  • OAuth 2.0 Token Exchange (RFC 8693) sets delegation scope using the on-behalf-of (OBO) pattern. When the orchestrator delegates to a downstream agent (data-bot), it exchanges the original token for a scoped OBO token that records who’s acting on behalf of whom and with what authority. The Cedar policies (detailed in Step 2: Three-layer policies) then check whether that scoped delegation is permitted and verify the originating user claims carried in the OBO token. Token exchange limits each downstream agent to only the delegated task’s scope instead of passing through the full original token. For enterprise deployments, use token exchange alongside HMAC. OAuth tracks who is acting on behalf of whom and with what scope. HMAC verifies that the context hasn’t been tampered with and came from a trusted source.

Prerequisites

The following prerequisites are needed to deploy the reference implementation. Before you begin, clone the repository:

git clone https://github.com/aws-samples/sample-cedar-agentic-ai-authorization.git
cd sample-cedar-agentic-ai-authorization

Verify that you have the following:

Walkthrough

In this walkthrough, you define the Cedar entity schema and policies, deploy the infrastructure with AWS CDK, and integrate your identity provider.

To define the Cedar entity schema

In this step, you define a schema with two entity types (Agent and Tool) and two actions (invoke_tool and delegate_task) in the AgentAuthz namespace. Notice that there is no User entity. Instead, you carry the originating user’s identity in the evaluation context record, which is a structured data object passed alongside each authorization request.

{
  "AgentAuthz": {
    "entityTypes": {
      "Agent": {
        "shape": {
          "type": "Record",
          "attributes": {
            "trust_level": { "type": "Long", "required": true },
            "namespace": { "type": "String", "required": true },
            "registered_capabilities": {
              "type": "Set", "element": { "type": "String" }, "required": true
            },
            "lifecycle_stage": { "type": "String", "required": true }
          }
        }
      },
      "Tool": {
        "shape": {
          "type": "Record",
          "attributes": {
            "namespace": { "type": "String", "required": true },
            "risk_level": { "type": "String", "required": true }
          }
        }
      }
    },
    "actions": {
      "invoke_tool": {
        "appliesTo": { "principalTypes": ["Agent"], "resourceTypes": ["Tool"] }
      },
      "delegate_task": {
        "appliesTo": { "principalTypes": ["Agent"], "resourceTypes": ["Agent"] }
      }
    }
  }
}

This schema is deployed to an Amazon Verified Permissions policy store by the VerifiedPermissionsStack CDK stack. In the reference implementation, the schema file is located at cedar-entity-schema.json.

Agent topology and attributes

The following tables show the agents and tools registered in this reference implementation, along with the attributes the Cedar evaluator function retrieves from the entity store. The test scenarios that follow trace requests through this topology.

Table 2: Agent attributes

Entity Type trust_level namespace lifecycle_stage registered_capabilities
orchestrator Agent 5 orchestration production

delegate_task

route_request

finance-agent Agent 3 payments production

process_payment

refund

data-bot Agent 4 data production

query_records

delete_records

Table 3: Tool attributes

Tool namespace risk_level
process_payment payments medium
delete_records data high
query_records data low

The orchestrator can delegate to both data-bot and finance-agent. Each agent can only invoke tools within its registered capabilities. The test scenarios below trace requests through these delegation paths.

To create three-layer Cedar policies

The following policies are deployed to the same Verified Permissions policy store. In the reference implementation, policy files are located under cedar/policies/ organized by layer: layer1-agent-to-tool/, layer2-agent-to-agent/, and layer3-originating-user-auth/.

Layer 1 (agent-to-tool): This policy permits the finance-agent to invoke the process_payment tool only when three conditions are met: the agent’s trust score is at least 3, it belongs to the payments namespace, and it’s deployed in the production lifecycle stage. If any condition fails, the request is denied. The agent’s trust_level, namespace, and lifecycle_stage aren’t self-reported in a production deployment. Instead, the evaluator retrieves these attributes from the Verified Permissions entity store using the agent_id as a lookup key.

Important: The reference implementation accepts these values from the request payload for simplicity. Production deployments must validate agent attributes against an authoritative source to prevent a compromised agent from escalating its own trust.

The trust_level attribute uses a 1–5 integer scale that represents an agent’s verified maturity: 1 for newly registered and untested agents, 3 for agents that have passed integration testing and security review, and 5 for agents with a proven production track record. Organizations assign trust levels through their agent promotion pipeline, not through self-declaration. The lifecycle_stage attribute (development, staging, production) prevents pre-production agents from invoking production tools, even if they have the correct namespace and trust score.

// L1-001: Finance agent can invoke payment tools
permit(
  principal == AgentAuthz::Agent::"finance-agent",
  action == AgentAuthz::Action::"invoke_tool",
  resource == AgentAuthz::Tool::"process_payment"
) when {
  principal.trust_level >= 3 &&
  principal.namespace == "payments" &&
  principal.lifecycle_stage == "production"
};

Layer 2 (agent-to-agent delegation) enforces depth limits and capability constraints. The orchestrator agent delegates tasks to data-bot only when the delegation chain is three hops or fewer and the requested capabilities are a subset of data-bot’s registered capabilities. A separate forbid policy (L2-004) enforces a hard system-wide limit of five hops regardless of which agents are involved.

// L2-002: Orchestrator can delegate to data agent
permit(
  principal == AgentAuthz::Agent::"orchestrator",
  action == AgentAuthz::Action::"delegate_task",
  resource == AgentAuthz::Agent::"data-bot"
) when {
  context.delegation_depth <= 3 &&
  context.target_capabilities.containsAll(context.requested_capabilities)
};

Layer 3 (originating user authorization) keeps the agent as the principal, but the policy evaluates context.originating_user to validate the human who initiated the request. data-bot invokes the delete_records tool only when the originating user has the admin role, has verified MFA, and the delegation chain is at most two hops deep. Without this layer, an agent with the right capabilities could invoke destructive tools regardless of who initiated the request.

// L3-001: High-risk tool (delete_records) requires admin + MFA
permit(
  principal == AgentAuthz::Agent::"data-bot",
  action == AgentAuthz::Action::"invoke_tool",
  resource == AgentAuthz::Tool::"delete_records"
) when {
  context.originating_user.role == "admin" &&
  context.originating_user.mfa_verified == true &&
  context.delegation_depth <= 2
};

Key design point: The principal remains the agent, not a user entity. The user’s role and MFA status are checked through context attributes, keeping the schema to two entity types and two actions.

Integrate your IdP

The reference implementation uses Amazon Cognito with TOTP MFA, but most OIDC-compliant providers (Okta, Microsoft Entra ID, Auth0, or AWS IAM Identity Center) work with this pattern. The authentication-to-signing flow is described in the preceding Authentication before authorization section. To use a different IdP, replace the Cognito authorizer on API Gateway with a Lambda or JWT authorizer for your IdP’s issuer URL. Cedar policies remain unchanged.

Deploy the infrastructure with AWS CDK

The reference implementation deploys five CloudFormation stacks: KmsStack, VerifiedPermissionsStack, LambdaStack, SecurityLakeStack, and MonitoringStack. The following commands deploy the stacks in dependency order:

cdk deploy KmsStack -c account_id=YOUR_ACCOUNT_ID -c guardrail_id=YOUR_GUARDRAIL_ID
cdk deploy VerifiedPermissionsStack -c account_id=YOUR_ACCOUNT_ID -c guardrail_id=YOUR_GUARDRAIL_ID
cdk deploy LambdaStack -c account_id=YOUR_ACCOUNT_ID -c guardrail_id=YOUR_GUARDRAIL_ID
cdk deploy SecurityLakeStack -c account_id=YOUR_ACCOUNT_ID -c guardrail_id=YOUR_GUARDRAIL_ID
cdk deploy MonitoringStack -c account_id=YOUR_ACCOUNT_ID -c guardrail_id=YOUR_GUARDRAIL_ID

Test the solution

Three end-to-end scenarios validate the evaluation model across different user roles, MFA states, and delegation depths. To run the tests:

  1. Set the API endpoint from the deployment output:
export API_ENDPOINT=$(aws cloudformation describe-stacks --stack-name LambdaStack \
  --query "Stacks[0].Outputs[?OutputKey=='ApiEndpoint'].OutputValue" --output text)

  1. Run the end-to-end tests:
.venv/bin/python -m pytest tests/e2e/ -v -s

The end-to-end tests cover the three scenarios described in the following sections. Each test sends a request through the deployed API and validates the per-layer authorization decisions.

Scenario A: Layer 3 enforcement

A support-role user (no MFA) requests record deletion through orchestrator and data-bot.

Layer Decision Reason
L1: Agent-to-tool PERMIT data-bot has trust level 4, namespace data, and lifecycle production
L2: Agent-to-agent PERMIT orchestrator is authorized to delegate to data-bot, depth within limits
L3: Originating user DENY User role is support, not admin; MFA not verified
Overall DENY Denying layer: L3

Without Layer 3, this request would have been permitted based on agent capabilities alone, demonstrating why originating user authorization is essential.

Scenario B: Authorized admin request

An admin user with MFA requests the same operation through the same chain.

Layer Decision Reason
L1 PERMIT Agent attributes match
L2 PERMIT Delegation path authorized
L3 PERMIT Role is admin, MFA verified, depth is less than or equal to 2
Overall PERMIT All three layers permit

Scenario C: Delegation depth limit

An admin with MFA requests the same operation, but the delegation chain has six hops. This scenario tests the Layer 2 depth constraint independently of user authorization.

Layer Decision Reason
L1 PERMIT Agent attributes match
L2 DENY Depth of six exceeds the hard limit of five
Overall DENY Denying layer: L2 (L3 not evaluated – halt)

Even an authorized admin can’t bypass the delegation depth constraint.

Alignment with the security principles for agentic AI

The AWS Office of the CISO published Four security principles for agentic AI systems. The following table shows how this solution maps to each principle.

Principle How the solution implements it
Secure development lifecycle across components Property-based testing (Hypothesis) for adversarial input fuzzing, Cedar policy formal verification with strict schema validation, end-to-end scenarios testing policy bypass and privilege escalation paths, and infrastructure-as-code (IaC) with AWS CDK.
Traditional security controls remain applicable AWS WAF, Amazon VPC isolation, AWS Key Management Service (AWS KMS) encryption, Amazon Cognito MFA, and Secrets Manager;
NIST SP 800-53 control mapping.
Deterministic external controls (security box) Three-layer Cedar evaluation runs outside the agent’s reasoning loop in a separate Lambda function.
HMAC-signed context prevents tampering.
Verified Permissions (the managed Cedar evaluation service) enforces L2 and L3 at the infrastructure level.
Greater autonomy earned through evaluation trust_level and lifecycle_stage policy attributes calibrate agent capabilities; OCSF 99001 audit events and Amazon CloudWatch dashboards provide the evidence base for expanding autonomy.

Monitoring and audit compliance

Each evaluation produces an OCSF 99001 audit event with request ID, user identity, delegation chain, per-layer decisions, and latency.

The following table maps this implementation to NIST SP 800-53 Rev. 5 controls. Customers are responsible for evaluating whether it meets their compliance requirements.

NIST control Control name How the reference implementation addresses it
AC-4 Information Flow Enforcement User context flows immutably through HMAC-signed envelopes
AC-6 Least Privilege Three-layer evaluation requires both agent capability and user role
AC-6(1) Authorize Access to Security Functions MFA required for high-risk tools in Layer 3
AC-6(5) Privileged Accounts Destructive operations restricted to admin with MFA verified
AU-2 Event Logging Each evaluation is logged as OCSF 99001
AU-3 Content of Audit Records Events include identity, chain, action, resource, decisions, and latency
SI-10 Information Input Validation HMAC verified before evaluation; Amazon Bedrock Guardrails on inbound
IA-2(1) Multi-factor Authentication Layer 3 enforces MFA for high-risk operations
SC-12 Cryptographic Key Management Signing key in Secrets Manager with rotation
SC-28 Protection of Information at Rest Policies in Verified Permissions with STRICT validation

Scaling to multi-account environments

Deploy the Cedar policy store in a central security account and use cross-account IAM roles for workload accounts to call verifiedpermissions:IsAuthorized. Use AWS Organizations service control policies (SCPs) to prevent workload accounts from creating their own policy stores. For standardizing user identity attributes across the organization, consider IAM Identity Center or a centralized OIDC provider that issues consistent claims to your workload accounts. This helps ensure that the context.originating_user attributes are uniform across accounts and agents.

For production deployments, consider extending this pattern with human-in-the-loop escalation for borderline denials, multi-tenant Cedar policy isolation, and Amazon Simple Storage Service (Amazon S3)-backed dynamic policy hot-reload for emergency tool shutdowns.

Clean up

To avoid ongoing charges, delete the deployed resources:

cdk destroy MonitoringStack SecurityLakeStack
cdk destroy LambdaStack
cdk destroy VerifiedPermissionsStack
cdk destroy KmsStack
aws logs delete-log-group --log-group-name /cedar-evaluator/audit  # if RETAIN policy

Conclusion

Multi-agent AI systems need authorization boundaries at every delegation hop. The three-layer Cedar policy model with OAuth 2.0 authentication provides that protection while maintaining least-privilege access. Combining a trusted IdP (AuthN) with Cedar policy evaluation (AuthZ) creates an authorization boundary around each tool invocation, verifying agent capability (L1), delegation path (L2), and originating user authority (L3). The pattern works with an OIDC-compliant IdP and a compute platform that can call Amazon Verified Permissions. Clone the reference implementation and adapt the Cedar policies to your organization’s requirements. For more information, see the Cedar policy language documentation and the Amazon Verified Permissions User Guide.

References

If you have feedback about this post, submit comments in the Comments section below.


Dhananjay Karanjkar

Dhananjay Karanjkar

Dhananjay is a Senior Lead Consultant at AWS Professional Services, specializing in agentic AI systems, multi-agent orchestration, and generative AI security. He holds two US patents and serves as a Responsible AI Champion, with a background spanning financial services, enterprise consulting, and enterprise-scale AI delivery. When not architecting AI solutions, he trains for triathlons, paints oil portraits, and is an avid reader.

How BigBasket uses the Iceberg based lakehouse architecture on AWS to power lightning-fast grocery delivery across India

Post Syndicated from Annie Mattoo original https://aws.amazon.com/blogs/big-data/how-bigbasket-uses-the-iceberg-based-lakehouse-architecture-on-aws-to-power-lightning-fast-grocery-delivery-across-india/

Delivering fresh groceries to millions of customers across India in a few minutes demands a radically modern data architecture and resilient processes to help the business make faster decisions. This is what BigBasket was able to achieve by building a lakehouse architecture on AWS.

In this post, we demonstrate how BigBasket implemented the lakehouse architecture on AWS, including their architecture decisions, implementation approach, and the measurable business results you can expect from a similar modernization. Whether you’re facing scalability challenges or planning your own lakehouse implementation, this blueprint provides actionable insights you can adapt for your organization.

About BigBasket

BigBasket (Innovative Retail Concepts Private Limited) is India’s largest online supermarket, serving millions of customers across over 60 cities. Founded in 2011, the company offers groceries, fresh produce, household items, and personal care products through its mobile app and website, operating subscription services (BBDaily) and quick commerce (bbnow). For BigBasket, the ability to deliver groceries on time isn’t only a competitive advantage. It’s the foundation of customer trust, where every minute counts.

However, rapid business growth brought significant operational challenges:

  • Inability to consistently meet on-time delivery adherence because of high order volumes, extended travel times, and more, directly impacting key metrics like on-time rate (OTR)-10 mins and OTR-15 mins.
  • Struggling to meet on-time delivery targets because of picking inefficiency, high order volumes, and extended travel times, directly impacting key metrics like OTR-10 mins and OTR-15 mins.
  • Delays in stock availability impacting vendor fill-rates, inter-distribution center orders, and warehouse operations.
  • Inaccurate stock forecasting for top-selling stock keeping units (SKUs), assortment variety, event SKUs, store capacity, and buying cycles.
  • Lower dark store productivity across picking, stacking, order processing, and goods receipt notes (GRN).

Behind these business challenges lay a fundamental technology problem: the existing data infrastructure couldn’t keep pace. The company experienced rapid store growth, expanding 4x in a short timeframe, which exposed several limitations within their existing data architecture that needed attention.

Understanding the technical bottlenecks

BigBasket’s initial architecture relied heavily on a single data warehouse built on Amazon Redshift to meet all reporting and dashboarding needs. While this traditional approach had served them well initially, several important limitations emerged:

  • Stale data: Extract, transform, load (ETL) pipelines delivered only day-old (D-1) data, making near real-time analysis impossible for dashboard requirements.
  • Extended recovery times: Pipeline failure recovery processes took several hours, causing significant delays in data availability for business users.
  • Schema rigidity: Schema changes in source databases frequently triggered pipeline failures because of a lack of schema evolution support.
  • Scalability constraints: The infrastructure struggled to handle the sudden load increase from 13,000 to over 35,000 transactions for reports and dashboards with more than 1,000 dataset refreshes.
  • Cost implications: Increasing data volumes demanded additional compute resources, driving up costs.

Diagram of the scalability and cost limitations of BigBasket’s legacy Amazon Redshift data warehouse

It became clear that the existing data infrastructure wasn’t able to meet the evolving business requirements and a redesign of their data architecture is needed.

Why lakehouse architecture?

A modern data lakehouse architecture addresses these issues with near real-time data processing, flexible schema evolution, and scalable analytics, capabilities necessary for fast-moving commerce operations. The lakehouse approach combines the flexibility and cost-effectiveness of data lakes with the performance and governance features of data warehouses, combining the strengths of both. The design of a data lakehouse provides interoperability across storage systems for combined analytics activities.

Solution overview

BigBasket partnered with AWS to implement a comprehensive lakehouse architecture using a combination of AWS native services and open-source technologies.

The following diagram shows an elaborated view of Bigbasket’s modernized architecture on AWS.

Detailed lakehouse data flow across bronze, silver, and gold medallion layers on AWS

Data ingestion: Enabling continuous replication

AWS Database Migration Service (AWS DMS) ingests data from online transaction processing (OLTP) databases running on Amazon Relational Database Service (Amazon RDS) into the lakehouse on AWS.

This method continuously replicates data with minimal latency, so your analytics reflect near real-time business operations.

Storage and governance: Building a solid foundation

The lakehouse is built on Amazon Simple Storage Service (Amazon S3) and Amazon Redshift, which serve as the centralized data lake and warehouse following a medallion architecture.

The architecture persists all analytical data using Apache Iceberg as the open table format. Iceberg provides a robust foundation for large-scale analytics with the following capabilities:

  • ACID transactions: Guarantees data consistency and correctness across concurrent read and write operations.
  • Time travel: Supports querying historical table versions for auditing, troubleshooting, and recovery.
  • Schema evolution: Allows schema changes without disrupting existing queries or downstream pipelines.

The medallion architecture structures data across three logical layers within the lakehouse:

  • Bronze layer: Implements change data capture (CDC)-based source replication using AWS DMS. Raw change events flow into Amazon S3 as Apache Parquet files in their original format from source systems, preserving the complete change history. The data pipeline processes and deduplicates these events using Apache Spark on Amazon EMR to create and maintain Apache Iceberg tables that act as replicated source tables.
  • Silver layer: Represents the conformed data model, where data is cleansed, standardized, and validated with enforced quality checks. This layer contains core dimension and fact tables, modeled for analytical consistency and reuse across domains. Data is stored as Apache Iceberg tables on Amazon S3, making it reliable and performant for downstream analytics and transformations.
  • Gold layer: Provides business-ready data marts and wide tables optimized for reporting, dashboarding, and domain-specific use cases. These datasets are curated to align with business metrics and key performance indicators (KPIs) and are served from Amazon Redshift, using Iceberg-backed tables to deliver fast, scalable analytics for business intelligence (BI) tools and end users.

This layered approach maintains a clear separation of concerns across raw ingestion, analytical modeling, and business consumption, while supporting scalability and flexibility across the organization. AWS Lake Formation enforces fine-grained data access controls, and the AWS Glue Data Catalog centrally manages metadata across Amazon S3 and Amazon Redshift, ensuring consistent data discovery and governance across the analytics ecosystem.

Data processing: Flexibility and performance

For data processing and transformations, BigBasket uses Amazon EMR with Apache Spark and dbt, orchestrated by Apache Airflow running on Amazon Elastic Kubernetes Service (Amazon EKS) as the core compute layer of the lakehouse. Apache Spark on Amazon EMR handles large-scale distributed processing, including CDC deduplication, incremental transformations, and complex data reshaping. Apache Iceberg serves as the open table format, which provides several critical capabilities.

dbt is used to define and execute transformation logic using SQL, managing the build of data models such as staging, intermediate, and final tables on top of the raw data. dbt uses the dbt-Trino adapter to run these transformations using the Trino engine, materializing the results as Apache Iceberg tables in Amazon S3. This approach provides a simple, modular, and governed way to manage transformations while taking advantage of Iceberg’s transactional guarantees.

These features are necessary for production lakehouse implementations and help you avoid vendor lock-in while maintaining enterprise reliability.

Online analytical processing (OLAP) and analytics: Hybrid approach for cost optimization

The analytics layer uses a hybrid approach that you can adapt based on your query patterns:

  • Amazon Redshift: For querying of active, frequently accessed data from the Gold layer.
  • Amazon Athena: For ad-hoc queries on historical data.
  • Apache Trino: For federated queries across multiple data sources while powering dbt-driven transformations directly on Apache Iceberg tables.

This hybrid strategy optimizes costs by keeping frequently accessed data in Amazon Redshift while querying historical data directly from Iceberg tables in Amazon S3. Amazon Redshift data sharing supports a multi-warehouse architecture for cross-team collaboration, allowing different teams to access shared datasets without data duplication.

Orchestration: Managing complex workflows

Apache Airflow running on Amazon EKS orchestrates and schedules data pipelines across the entire environment, providing visibility and control over complex workflows. This gives you a unified view for monitoring and managing your data operations.

Machine learning integration

Amazon SageMaker AI powers machine learning workloads for predictive analytics and model training directly on lakehouse data, from demand forecasting to delivery optimization. This tight integration means your data scientists can work with the same governed data that powers your analytics.

Visualization: Making insights accessible

Amazon Quick Sight provides data visualization and business intelligence reporting capabilities, making insights accessible to business users across the organization without requiring technical expertise.

Special focus: Clickstream data processing

BigBasket implemented a sophisticated dual-path architecture for processing clickstream data from mobile apps and web interactions:

  • Real-time path: Data flows through Scala stream collectors on Amazon Elastic Compute Cloud (Amazon EC2) (behind Elastic Load Balancing) to Amazon Kinesis Data Streams and Amazon OpenSearch Service for immediate insights into customer behavior. This path is necessary when you need to react to user actions within seconds, for example detecting fraud or personalizing experiences in real time.
  • Batch path: The batch path validates data, stores it in Amazon S3, processes it through Amazon EMR, and loads it into Amazon Redshift for comprehensive historical analysis. This path handles data quality checks, enrichment, and aggregation for long-term analytics.

The trade-off between these approaches is latency versus completeness. Real-time processing gives you speed but may sacrifice some data quality checks, while batch processing provides accuracy but introduces delay. This dual approach achieves both immediate operational insights and deep analytical capabilities, letting you optimize for different use cases.

The following diagram shows how the clickstream data is handled and effectively processed today.

BigBasket’s dual-path clickstream processing architecture with real-time and batch paths on AWS

The results: measurable business impact

The data platform transformation achieved significant results across multiple dimensions:

Technical improvements

  • Near real-time data: Achieved near real-time data availability for dashboards within 3–5 minutes, replacing previously day-old data.
  • Rapid failure recovery: Pipeline failure re-runs now complete in minutes instead of hours.
  • Comprehensive governance: Full control over data governance with robust observability, lineage, data accuracy, and consistency.
  • Enhanced scalability: Successfully handling over 35,000 reports and dashboards with over 1,000 dataset refreshes.

Business outcomes

  • On-time delivery: Improved monitoring with real-time insights on low-performing stores.
  • Stock availability: Reduced operational issues with visibility into key bottlenecks.
  • Stock forecasting: Improved accuracy and availability of top-selling SKUs.
  • Dark store productivity: Enhanced productivity of warehouse executives across all operations.

Key takeaways: lessons for modern data platforms

BigBasket’s journey offers valuable insights for organizations facing similar challenges:

  1. Quick commerce needs quick observability. In the fast-paced world of quick commerce, faster decision-making directly improves business metrics. Real-time data isn’t a luxury. It’s a necessity.
  2. Embrace ELT for real-time needs. Shifting from traditional ETL to an extract, load, transform (ELT) pattern within a lakehouse architecture is important to unlock near real-time analytics capabilities.
  3. A lakehouse delivers speed and governance. Modern lakehouse architectures don’t force trade-offs. You can achieve both fast data availability and comprehensive control, lineage, and accuracy.
  4. Focus on operational resilience. Designing for rapid failure recovery (re-runs in minutes, not hours) is necessary for maintaining data availability and business trust, especially in customer-facing operations.
  5. Incremental migration. You don’t need to rebuild everything. Evolve your current Amazon S3 data lake or reuse your existing investments in Amazon Redshift to build the data lakehouse capabilities.

The road ahead

BigBasket continues to innovate, now moving to adopt Amazon SageMaker Unified Studio to access all lakehouse components in a simplified manner across the enterprise. This next evolution will further streamline data access and accelerate insights across teams.

The company’s transformation demonstrates that with the right architecture and AWS services, organizations can turn data infrastructure challenges into competitive advantages, delivering not only better analytics but better customer experiences.

As you plan your own lakehouse implementation, use these patterns and lessons learned to accelerate your journey and avoid common pitfalls.


About the authors

Naga Sandeep Grandhi

Naga Sandeep Grandhi

Sandeep is an engineering leader at BigBasket, driving data platform and cloud architecture initiatives, including the next-gen data lake built for scale, reliability, and real-time insights.

Vikram Kumar

Vikram Kumar

Vikram is a Principal Engineer at BigBasket, where he leads the data engineering team. He specializes in designing and scaling modern data platforms on AWS, enabling BigBasket to process large-scale data efficiently and power data-driven decision-making across the organization.

Annie Mattoo

Annie Mattoo

Annie is a Sr. Analytics Specialist at AWS, bringing over 15+ years of expertise in helping customers with their DATA & AI journeys. She has successfully led customer teams to seamlessly adopt AWS Data & AI services and has worked with Fortune 500 customers across the globe in her previous roles.

Vineet Thapliyal

Vineet Thapliyal

Vineet is an Enterprise Account Manager at Amazon Web Services (AWS) in Bengaluru, India, where he manages strategic cloud and generative AI engagements across some of India’s largest conglomerates spanning energy, retail, and technology. He is passionate about helping enterprises unlock business value through AI/ML, cloud modernization, and industry-specific innovation — from renewable energy analytics to retail transformation at scale.

Anirudh Chawla

Anirudh Chawla

Anirudh is an Analytics Solution Architect at AWS. He helps organization empowers businesses to harness their data effectively through AWS’s analytics platform. His interest lies in building highly available distributed systems.

OpenSSH 10.4 released

Post Syndicated from jzb original https://lwn.net/Articles/1081536/

OpenSSH 10.4 has been released. In addition to a number of security
and bug fixes, there are a few notable changes; this release adds
experimental support for a composite post-quantum signature scheme
combining ML-DSA 44 and Ed25519 as described in this
IETF draft
. With 10.4, if OpenSSH is compiled with sandbox support
it will fail on Linux systems that have not enabled SECCOMP
or NO_NEW_PRIVS; prior to this release, sshd would log an error
but continue operation. See the release notes for
a full list of changes.

AWS Weekly Roundup: Claude Sonnet 5 on AWS, Amazon WorkSpaces for AI agents, AWS service availability updates, and more (July 6, 2026)

Post Syndicated from Daniel Abib original https://aws.amazon.com/blogs/aws/aws-weekly-roundup-claude-sonnet-5-on-aws-amazon-workspaces-for-ai-agents-aws-service-availability-updates-and-more-july-6-2026/

A couple of editions ago I wrote about what I find so energizing about working with startups. Last week I got a fresh dose of it: I spent a few days with the AWS Startups team, listening to stories of founders talking about the problems they’re actually solving. One story that stayed with me came from Marco Negreiros, founder of EyeCare Health, a Brazilian healthtech expanding access to eye care. He shared a striking fact: more than 70% of Brazilian municipalities don’t have a single ophthalmologist. His answer was to put a vision test on the one device almost everyone already carries, the smartphone, so a basic eye screening no longer depends on living near a clinic. Watching a founder turn a gap that big into something that concrete is exactly why I love this space.

AWS Startups team get-together with founders in Brazil

This week, I’ll take a closer look at some key launches, and then cover the quarterly AWS Service Availability updates.

Last week’s launches
Here are some of the launches covered from this past week in the AWS News Blog:

Here are some launches and updates that caught my attention:

For a full list of AWS announcements, be sure to keep an eye on the What’s New with AWS page.

AWS Service Availability Updates
When the availability of an AWS service or feature changes, we provide customers guidance in AWS Product Lifecycle Changes on available alternatives and support for migration so that disruptions to your operations are minimized. The following lifecycle changes were updated on June 30, 2026.

Services moving to Maintenance (no longer accessible to new customers starting July 30, 2026):

Services entering Sunset:

Services reaching End of Support (as of June 30, 2026):

  • Amazon Chime SDK – Carrier Voice Focus
  • Amazon SageMaker AI – Ground Truth Plus

We understand that changes in availability can impact your operations. For specific guidance, consult the relevant service documentation or contact AWS Support.

Upcoming AWS events
Check your calendar and sign up for upcoming AWS events:

  • AWS Summits – AWS Summits are free events that bring the cloud and AI community together to connect, learn, and explore the latest technologies. Browse the full calendar to find a Summit near you in the second half of 2026.
  • AWS Community Days – Community-led conferences where content is planned, sourced, and delivered by community leaders. If you’re in Latin America, don’t miss AWS Community Day Belo Horizonte on August 22. Registration is open at awscommunityday.com.br.

Join the AWS Builder Center to connect with builders, share solutions, and access content that supports your development. Browse here for upcoming AWS-led in-person and virtual events and developer-focused events.

That’s all for this week. Check back next Monday for another Weekly Roundup!

– Daniel Abib

This post is part of our Weekly Roundup series. Check back each week for a quick roundup of interesting news and announcements from AWS!

[$] The kernel’s iomap layer

Post Syndicated from corbet original https://lwn.net/Articles/1079415/

Conversations about the kernel’s filesystem implementations often involve a
layer called “iomap”, but relatively few people can reliably say what iomap
actually is. That is just the kind of gap that LWN exists to fill. In
short, iomap handles the mapping between data in the filesystem space
(identified by a file of interest, and an offset within that file) and in
the storage space (which may be a memory location, or a set of blocks on a
storage device). Using that mapping, iomap handles a long list of common,
filesystem-related tasks, allowing a lot of boilerplate code to be removed
from individual filesystem implementations.

A Day With Your Vector Command Red Team Pod

Post Syndicated from Trevor Christiansen original https://www.rapid7.com/blog/post/so-ditl-day-with-your-vector-command-red-team-pod

Anyone trying to understand continuous red teaming usually gets the same high-level explanation: it is ongoing, attacker-informed, and designed to uncover risk between formal assessments. Useful as that description is, it still leaves most people with the same question, which is what the service actually looks like when a team is working against a real environment day after day.

A Vector Command pod answers that question more clearly than a list of features ever could. Five dedicated operators work against a customer environment continuously, each bringing a different specialty, while the pod as a whole simulates the range, coordination, and persistence of a real adversary. Over time, that gives the customer far more than a periodic snapshot. It gives them a team that keeps learning the environment, keeps pressure on the attack surface, and keeps surfacing the kinds of changes that can turn into incidents if no one catches them quickly.

Because the environment keeps changing, the value of the model shows up in motion rather than in theory. New services appear, controls drift, patching gaps open, and fresh advisories create short windows of risk. Working continuously allows the pod to validate whether those changes matter while they are still actionable, which is what makes the service useful to teams that want more than another point-in-time assessment.

How the Red-Teaming pod works across a normal day

Every day begins with a 30-minute standup, where operators compare notes on what is in motion, what has already been found, and where handoff is needed. That routine may sound simple, but it is what turns five specialists into a coordinated attack team instead of a set of separate testing tracks.

While one operator follows a foothold on a build server, another may be preparing a social engineering campaign tied to a real business event. At the same time, someone else is watching the external footprint for fresh exposures, an emerging threat specialist is validating a new advisory against active customer technology, and the customer interface lead is already helping a security team understand what yesterday’s compromise means in practical terms. The customer is not seeing isolated tasks. They are seeing multiple attack paths, exposure checks, and validation efforts develop at once, with the work feeding into a single picture of risk.

Because the pod works across multiple attack paths at once, the value comes through in more than the sheer volume of activity. Familiarity builds over time, and that accumulated knowledge changes the quality of the work by grounding the findings in how the customer’s environment actually behaves.

What customers are actually getting tested

One of the clearest examples in the draft comes from the lead operator, who receives a callback from a beacon on a customer’s build server and begins exploring what that foothold could reach. Because the build server holds CI/CD credentials, the question is no longer whether the server can be compromised. The more important question is whether that compromise could extend into the deployment pipeline and what persistence would look like from there. For the customer, that kind of work shows how a technical foothold could become a business problem, which is much more useful than a simple proof that access was achieved.

The social engineering work gives a different kind of visibility. Domains are warmed, pretexts are built around real events, target lists are researched carefully, and emails are tested against spam controls before launch. That means the customer is not just testing whether an employee clicks a link. They are testing the full defensive chain, including email filtering, web controls, endpoint visibility, and SOC response.

Continuous external testing tends to make the value especially obvious. In the draft, the network and vulnerability operator identifies two RDP endpoints that are brand new to a customer’s environment and gets them in front of the customer the same day they appear. He also finds a Confluence instance several versions behind and confirms unauthenticated remote code execution. Those are the kinds of issues that often emerge between scheduled assessments and create risk precisely because no one expected them to be there.

When a fresh advisory lands against an exposed technology, the value of the service becomes even clearer. Broad awareness of an industry issue only goes so far. What changes the customer’s decision is knowing whether the exposure is exploitable in their own environment and what an attacker could reach from there.

Where the customer benefit becomes tangible

A service like this becomes much easier to understand when the output is viewed through the customer’s side of the experience. Early visibility into configuration drift, newly exposed services, lagging systems, and fresh exploit windows helps teams focus on changes that are real rather than theoretical. Validation tied to the customer’s own environment gives them a stronger basis for deciding what needs immediate attention. Attack-path testing shows how one weakness could become a wider compromise. Practical remediation guidance helps leadership and technical teams respond while the timing still matters.

Because the customer interface lead is also an operator, the translation from technical finding to leadership action is grounded in hands-on work rather than abstract summary. When a foothold, exposed service, or confirmed compromise needs to be explained, the conversation can move quickly from what happened to what the customer should prioritize next.

Over time, customers get more than a stream of findings because the pod is building familiarity with the environment as it works. That continuity gives the team a stronger basis for identifying which exposures deserve urgent attention, which attack paths are credible, and which changes are likely to matter most if an adversary finds them first.

Why this model gives customers more than a snapshot

Point-in-time testing still has value, but it will always be limited by the fact that the environment keeps moving after the engagement ends. A continuous pod keeps pace with that reality more effectively because it maintains pressure on the environment as it changes, rather than returning periodically to rediscover what is there.

Customers who want a clearer view of what continuous red teaming looks like in practice are really looking for evidence that the model changes the quality of what they get back. A dedicated pod does that by combining sustained offensive pressure, environment familiarity, rapid validation, and practical remediation guidance in a way that helps teams act on real risk while the timing still matters.

For organizations exploring how to test more continuously against the way attackers actually operate, Rapid7’s Continuous Red Team Service offers a closer look at how Vector Command helps uncover attack paths, validate exposures, and strengthen resilience over time.

The collective thoughts of the interwebz