Tag Archives: Amazon OpenSearch Service

Amazon OpenSearch Service 101: How many shards do I need

Post Syndicated from Tom Burns original https://aws.amazon.com/blogs/big-data/amazon-opensearch-service-101-how-many-shards-do-i-need/

Customers new to Amazon OpenSearch Service often ask how many shards their indexes need. An index is a collection of shards, and an index’s shard count can affect both indexing and search request efficiency. OpenSearch Service can take in large amounts of data, split it into smaller units called shards, and distribute those shards across a dynamically changing set of instances.

In this post, we provide some practical guidance for determining the ideal shard count for your use case.

Shards overview

A search engine has two jobs: create an index from a set of documents, and search that index to compute the best-matching documents. If your index is small enough, a single partition on a single machine can store that index. For larger document sets, in cases where a single machine isn’t large enough to hold the index, or in cases where a single machine can’t compute your search results effectively, the index can be split into partitions. These partitions are called shards in OpenSearch Service. Each document is routed to a shard that is calculated, by default, by using a hash of that document’s ID.

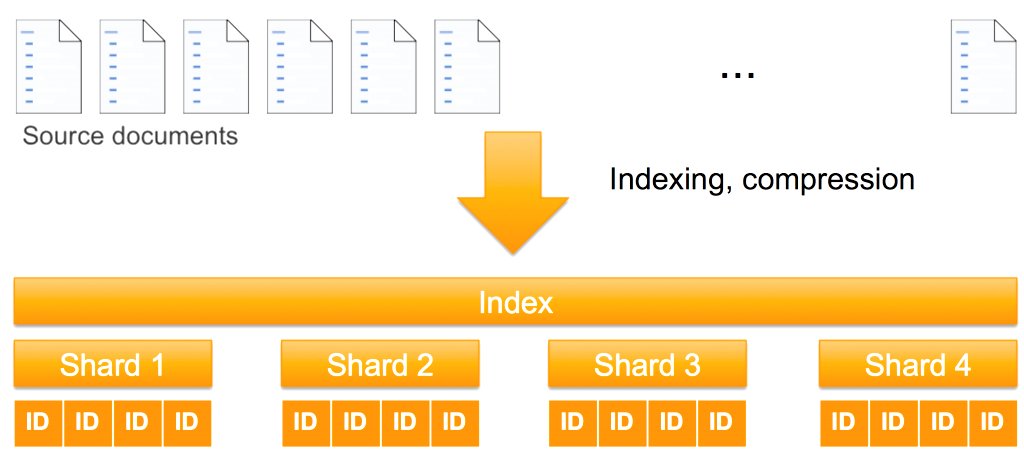
A shard is both a unit of storage and a unit of computation. OpenSearch Service distributes shards across nodes in your cluster to parallelize index storage and processing. If you add more nodes to an OpenSearch Service domain, it automatically rebalances the shards by moving them between the nodes. The following figure illustrates this process.

Diagram showing how source documents are indexed and partitioned into shards.

As storage, primary shards are distinct from one another. The document set in one shard doesn’t overlap the document set in other shards. This approach makes shards independent for storage.

As computational units, shards are also distinct from one another. Each shard is an instance of an Apache Lucene index that computes results on the documents it holds. Because all the shards comprise the index, they must function together to process each query and update request for that index. To process a query, OpenSearch Service routes the query to a data node for a primary or replica shard. Each node computes its response locally and the shard responses get aggregated for a final response. To process a write request (a document ingestion or an update to an existing document), OpenSearch Service routes the request to the appropriate shards—primary then replica. Because most writes are bulk requests, all shards of an index are typically used.

The two different types of shards

There are two kinds of shards in OpenSearch Service—primary and replica shards. In an OpenSearch index configuration, the primary shard count serves to partition data and the replica count is the number of full copies of the primary shards. For example, if you configure your index with 5 primary shards and 1 replica, you will have a total of 10 shards: 5 primary shards and 5 replica shards.

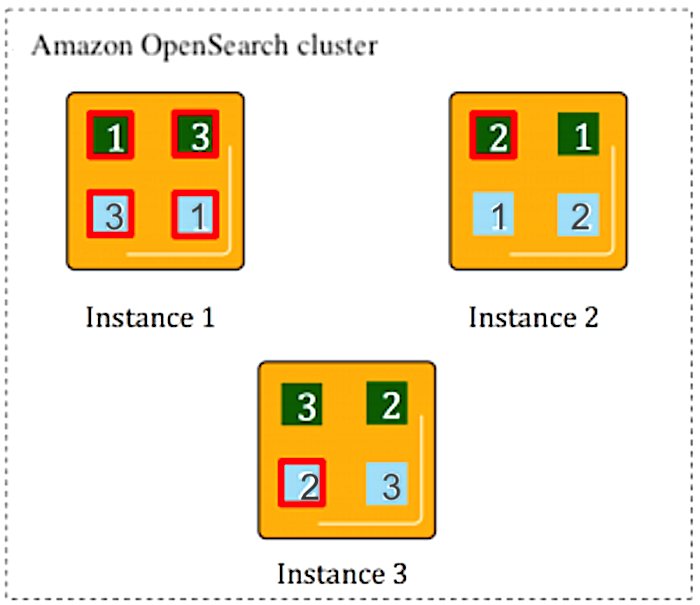
The primary shard receives writes first. The primary shard passes documents to the replica shards for indexing by default. OpenSearch Service’s O-series instances use segment replication. By default, OpenSearch Service waits for acknowledgment from replica shards before confirming a successful write operation to the client. Primary and replica shards provide redundant data storage, enhancing cluster resilience against node failures. In the following example, the OpenSearch Service domain has three data nodes. There are two indexes, green (darker) and blue (lighter), each of which has three shards. The primary for each shard is outlined in red. Each shard also has a single replica, shown with no outline.

Diagram showing how shards and replica shards are distributed between 3 Opensearch instances.

OpenSearch Service maps shards to nodes based on a number of rules. The most basic rule is that primary and replica shards are never put onto the same node. If a data node fails, OpenSearch Service automatically creates another data node and re-replicates shards from surviving nodes and redistributes them across the cluster. If primary shards fail, replica shards are promoted to primary to prevent data loss and provide continuous indexing and search operations.

So how many shards? Focus on storage first

There are three types of workloads that OpenSearch users typically maintain: search for applications, log analytics, and as a vector database. Search workloads are read-heavy and latency sensitive. They are typically tied to an application to enhance search capability and performance. A common pattern is to index the data in relational databases to give users more filtering capabilities and provide efficient full text search.

Log workloads are write-heavy and receive data continuously from applications and network devices. Typically, that data is put into a changing set of indexes, based on an indexing time period like daily or monthly depending on the use case. Instead of indexing based on time period, you can use rollover policies based on index size or document count to make sure shard sizing best practices are followed.

Vector database workloads use the OpenSearch Service k-Nearest Neighbor (k-NN) plugin to index vectors from an embedding pipeline. This enables semantic search, which measures relevance using the meaning of words rather than exactly matching the words. The embedding model from the pipeline maps multimodal data into a vector with potentially thousands of dimensions. OpenSearch Service searches across vectors to provide search results.

To determine the optimal number of shards for your workload, start with your index storage requirements. Although storage requirements can vary widely, a general guideline is to use 1:1.25 using the source data size to estimate usage. Also, compression algorithms default to performance, but can also be adjusted to reduce size. When it comes to shard sizes, consider the following based on the workload:

  • Search – Divide your total storage requirement by 30 GB.
    • If search latency is high, use a smaller shard size (as low as 10GB), increasing the shard count and parallelism for query processing.
    • Increasing the shard count reduces the amount of work at each shard (they have fewer documents to process), but also increases the amount of networking for distributing the query and gathering the response. To balance these competing concerns, examine your average hit count. If your hit count is high, use smaller shards. If your hit count is low, use larger shards.
  • Logs – Divide the storage requirement for your desired time period by 50 GB.
    • If using an ISM policy with rollover, consider setting the min_size parameter to 50 GB.
    • Increasing the shard count for logs workloads similarly improves parallelism. However, most queries for logs workloads have a small hit count, so query processing is light. Logs workloads work well with larger shard sizes, but shard smaller if your query workload is heavier.
  • Vector – Divide your total storage requirement by 50 GB.
    • Reducing shard size (as low as 10GB) can improve search latency when your vector queries are hybrid with a heavy lexical component. Conversely, increasing shard size (as high as 75GB) can improve latency when your queries are pure vector queries.
    • OpenSearch provides other optimization methods for vector databases, including vector quantization and disk-based search.
    • K-NN queries behave like highly filtered search queries, with low hit counts. Therefore, larger shards tend to work well. Be prepared to shard smaller when your queries are heavier.

Don’t be afraid of using a single shard

If your index contains less than the advised shard size (30 GB for search and 50 GB otherwise), we recommend that you use a single primary shard. Although it’s tempting to add more shards thinking it will improve performance, this approach can actually be counterproductive for smaller datasets because of the added networking. Each shard you add to an index distributes the processing of requests for that index across an additional node. Performance can decrease because there is overhead for distributed operations to split and combine results across nodes when a single node can do it sufficiently.

Set the shard count

When you create an OpenSearch index, you set the primary and replica counts for that index. Because you can’t dynamically change the primary shard count of an existing index, you have to make this important configuration decision before indexing your first document.

You set the shard count using the OpenSearch create index API. For example (provide your OpenSearch Service domain endpoint URL and index name):

curl -XPUT https://<opensearch-domain-endpoint>/<index-name> -H 'Content-Type: application/json' -d \
 '{
    "settings": {
        "index" : {
            "number_of_shards": 3,
            "number_of_replicas": 1
        }
    }
 }'

If you have a single index workload, you only have to do this one time, when you create your index for the first time. If you have a rolling index workload, you create a new index regularly. Use the index template API to automate applying settings to all new indexes whose name matches the template. The following example sets the shard count for any index whose name has the prefix logs (provide your OpenSearch service endpoint domain URL and index template name):

curl -XPUT https://<opensearch-domain-endpoint>/_index_template/<template-name> -H 'Content-Type: application/json' -d \
 '{
   "index_patterns": ["logs*"],
   "template": {
        "settings": {
            "index" : {
                "number_of_shards": 3,
                "number_of_replicas": 1
            }
       }
  }
}'

Conclusion

This post outlined basic shard sizing best practices, but additional factors might influence the ideal index configuration you choose to implement in your OpenSearch Service domain.

For more information about sharding, refer to Optimize OpenSearch index shard sizes or Shard strategy. Both resources can help you better fine-tune your OpenSearch Service domain to optimize its available compute resources.


About the authors

Photo of Tom Burns Tom Burns is a Senior Cloud Support Engineer at AWS and is based in the NYC area. He is a subject matter expert in Amazon OpenSearch Service and engages with customers for critical event troubleshooting and improving the supportability of the service. Outside of work, he enjoys playing with his cats, playing board games with friends, and playing competitive games online.

Photo of Ron MillerRon Miller is a Solutions Architect based out of NYC, supporting transportation and logistics customers. Ron works closely with AWS’s Data & Analytics specialist organization to promote and support OpenSearch. On the weekend, Ron is a shade tree mechanic and trains to complete triathlons.

Workload management in OpenSearch-based multi-tenant centralized logging platforms

Post Syndicated from Ezat Karimi original https://aws.amazon.com/blogs/big-data/workload-management-in-opensearch-based-multi-tenant-centralized-logging-platforms/

Modern architectures use many different technologies to achieve their goals. Service-oriented architectures, cloud services, distributed tracing, and more create streams of telemetry and other signal data. Each of these data streams becomes a tenant in your logging backend. If your company runs more than one application, the IT team will frequently centralize the storage and processing of log data, making each application a tenant in the overall observability system.

When you use Amazon OpenSearch Service to store and analyze log data, whether as a developer or an IT admin, you must balance these tenants to make sure you deliver the resources to each tenant so they can ingest, store, and query their data. In this post, we present a multi-layered workload management framework with a rules-based proxy and OpenSearch workload management that can effectively address these challenges.

Example use case

In this post, we discuss GlobalLog, a fictional company supporting healthcare, finance, retail, security, and internal tenants, that built a centralized logging system with OpenSearch Service. Each tenant has unique logging patterns based on their business requirements. Financial tenants generate complex, high-volume queries, healthcare tenants focus on compliance with moderate volume logs and queries, and retail tenants experience seasonal spikes with heavy dashboard usage. Internal operation has steady, low-volume logs and infrequent, simple queries. Security monitoring has a constant, high-volume presence throughout the system.

As the GlobalLog’s tenants scaled, operational challenges emerged: high-priority tenant performance suffered during peak hours, resource-intensive queries caused node crashes, and unpredictable traffic created instability. Limited visibility into tenant resource usage complicated troubleshooting and cross-domain security investigations. The platform required robust handling of varied workload patterns and peak usage times, strong performance isolation to prevent tenant interference, and scalability to manage 30% annual data growth.

Solution overview

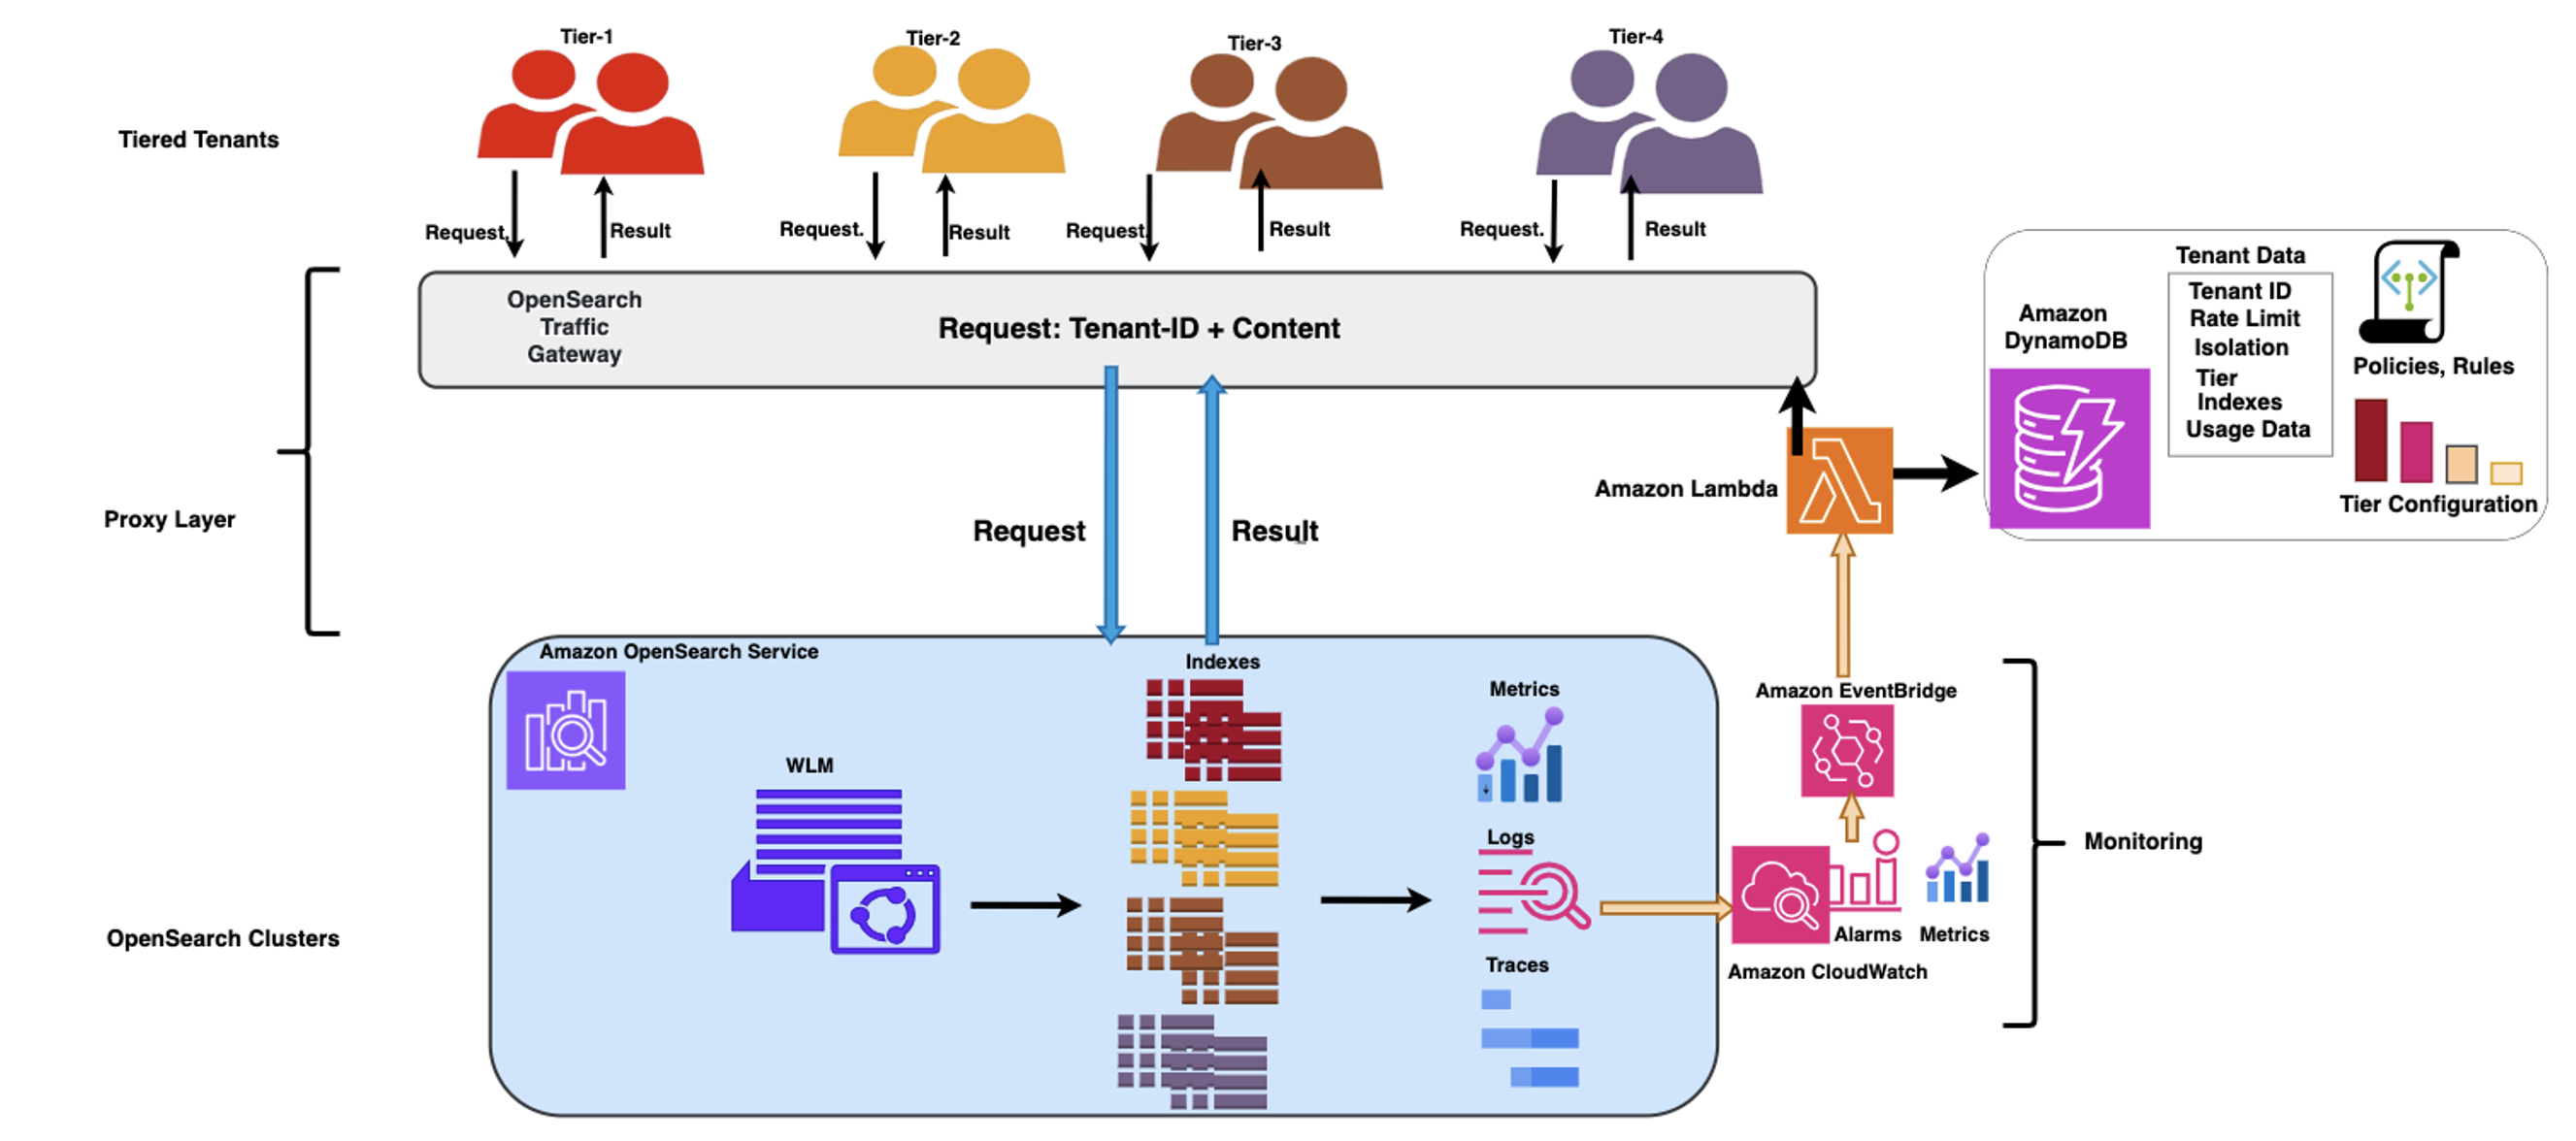
GlobalLog implemented a comprehensive workload management strategy to handle the diverse demands of its tenants. The solution manages the tenancy with a tiered tenant placement, a rule-based proxy layer that shapes incoming traffic based on the tenant profile and the status of the OpenSearch cluster, and an OpenSearch workload management plugin that provides granular resource governance, allocating resources such as CPU and memory proportionally to each tenant’s tier. The monitoring component provides the intelligence that the solution needs to do its assessment and make reactive and proactive scaling and performance-related decisions by adjusting the traffic governance rules and policies in a timely manner.

The following diagram illustrates the architecture.

GlobalLog multi tier workload management

GlobalLog multi tier workload management

Tenant tiering and placement

GlobalLog categorized tenants into four tiers based on their logging requirements (volume, retention, query frequency) and allocated resources accordingly. The tiering system, enforced through the integrated proxy layer and OpenSearch workload management, prevents resource over-allocation while making sure service levels match business priorities. The specification for each tier is detailed in the following table.

 
Tier SLA Resources Limits Behavior

Tier 1 (Enterprise Critical)

High-volume complex queries (over 100 concurrent)

24/7 SLA with 99.99% availability

50% CPU

50%  Memory

100 concurrent requests

20 MB request size

180-second timeout

Priority query routing and dedicated search threads

Tier 2 (Business Critical)

Moderate volume

compliance-oriented queries

Business hours SLA with 99.9% availability

30% CPU

25% memory

50 concurrent requests

10 MB request size

120-second timeout

Compliance-optimized search pipelines

Tier 3 (Business Standard)

Variable volume

dashboard-heavy usage

Standard business hours support no SLA

10% CPU

20% Memory

25 concurrent requests

5 MB request size

60-second timeout

Burst capacity for seasonal peaks

Tier 4 (Basic)

Internal IT operations

development environments

Best-effort support

no SLA

10% CPU

5%Memory

10 concurrent requests,

2 MB request size

30-second timeout

Automated query optimization for efficiency

Operations, seasonal businesses

GlobalLog’s integrated architecture streamlines its cost allocation and resource distribution model. Financial industry tenants pay premium rates for their guaranteed high-performance resources, effectively subsidizing the infrastructure that supports more variable workloads. These tenants are categorized into Tier 1. Healthcare tenants benefit from isolation that enforces compliance without bearing the full cost of dedicated infrastructure. These tenants are categorized into Tier 2. Retail tenants are categorized into Tier 3 because they appreciate the elastic capacity during peak seasons without maintaining excess capacity year-round. Tier 4 includes the administrative tenants with access to enterprise-grade logging at affordable rates through efficient resource sharing.

This balanced ecosystem helps GlobalLog maintain profitability while delivering appropriate service levels to every tenant regardless of their industry-specific workload characteristics.

In the next sections, we discuss GlobalLog’s workload management system.

Proxy layer

GlobalLog’s continuous feedback loop architecture creates a dynamic ecosystem that optimizes resource allocation across diverse tenant workloads in OpenSearch Service. Rather than depending on static configurations, the architecture monitors performance metrics and tenant usage patterns to drive scaling and remediation decisions. This makes sure the system evolves as workloads change over time.

The proxy layer core component is the OpenSearch Traffic Gateway, which functions as an intermediary between clients and OpenSearch clusters. It features the following key capabilities:

  • Rule-based traffic shaping through pattern matching for request paths and parameters
  • Metrics for resource cost allocation
  • Traffic replay

GlobalLog expanded the capabilities of their OpenSearch Traffic Gateway through a comprehensive set of enhancements focused on centralization, dynamism, and adaptability. At the core of this evolution, they used Amazon DynamoDB as the centralized repository for critical gateway data. This central database houses the complete ecosystem of rules, policies, and tenant profiles, alongside crucial operational data including metrics, usage patterns, SLA requirements, tier configurations, and real-time cluster status information.

Beyond this centralization effort, GlobalLog transformed the gateway with a dynamic mechanism capable of real-time adjustments and responsive decision-making. This architectural shift allows the gateway to react intelligently to changing conditions rather than following predetermined pathways.

Additionally, GlobalLog implemented an adaptive rule system with sophisticated contextual awareness. The system now activates specific rules based on current cluster states and tenant usage patterns, enabling precise resource allocation and protection mechanisms that respond to actual conditions rather than hypothetical scenarios. The system implements time-based rule scheduling, providing flexibility by allowing different limits and policies to automatically engage during specific periods such as maintenance windows. This provides optimal performance while accommodating necessary system operations.

The solution implements a continuous feedback loop between the monitoring system, the OpenSearch cluster, and the proxy layer, where the flow of performance metrics and tenant usage patterns drive automated, rule-based scaling and optimization decisions, helping the system evolve as workloads change over time. In this architecture, Amazon EventBridge triggers an AWS Lambda function when predefined criteria are met (for example, an anomaly is detected in OpenSearch Service), resulting in the Lambda function taking steps to remediate the issues by adjusting the traffic shaping rules and uploading them to the OpenSearch Traffic Gateway. To stabilize the feedback loop, GlobalLog took the following steps:

  • Added dampening mechanisms to prevent rapid rule changes
  • Implemented gradual adjustment patterns instead of binary switches
  • Created circuit breakers for automatic fallback to baseline rules

OpenSearch workload management layer

GlobalLog implemented tenant-level admission control and reactive query management through OpenSearch workload management. The system uses workload management to define resource limits, based on tenant criticality, providing efficient resource allocation and preventing bottlenecks.

A key component of OpenSearch’s workload management is its workload groups. A workload group refers to a logical grouping of queries, typically used for managing resources and prioritizing workloads. GlobalLog uses workload groups to manage resource allocation based on the previously defined tenant tiers. Enterprise-critical workloads receive substantial CPU and memory guarantees, providing consistent performance for financial operations. Business Critical tenants operate with moderate resource guarantees, and Standard and Basic tiers function with more constrained resources, reflecting their lower priority status. The following example shows the workload group setup for Enterprise Critical and Business Critical tiers:

PUT _wlm/workload_group
{
  “name”: “Enterprise Critical”,
  “resiliency_mode”: “enforced”,
  “resource_limits”: {
    “cpu”: 0.5,
    “memory”: 0.5
  }

PUT _wlm/workload_group
{
  “name”: “Business Critical”,
  “resiliency_mode”: “enforced”,
  “resource_limits”: {
    “cpu”: 0.3,
    “memory”: 0.25
  }

OpenSearch responds with the set resource limits and the ID for the workload group for Enterprise Critical tier tenants:

{
"_id":"preXpc67RbKKeCyka72_Gw",
  "name":"analytics",
 "resiliency_mode":"enforced",
 "resource_limits":{
"cpu":0.5,
 "memory":0.5
  },
 "updated_at":1726270204642
}

To use a workload group, use the following code:

GET finindex/_search
Host: localhost:9200
Content-Type: application/json
workloadGroupId: preXpc67RbKKeCyka72_Gw
{
 "query": {
      "match": {
             "field_name": "value"
     }
}
}

Real-world use cases

In this section, we discuss two scenarios where GlobalLog’s workload management system helped the company overcome various challenges.

Scenario 1: Security incident response

During a critical security incident, GlobalLog faced a complex challenge of managing simultaneous log access requests from multiple business units, each with different priority levels. At the highest tier were security and financial operations (Tier 1), followed by healthcare operations (Tier 2), retail operations (Tier 3), and internal operations (Tier 4).

At the proxy layer, GlobalLog gave precedence to security and financial tenant queries while implementing specific limitations for other units. Healthcare operations were capped at 15 concurrent queries, retail operations were restricted to 5 queries per minute, and internal operations had their date ranges narrowed.

OpenSearch workload management and the proxy layer played a crucial role by maintaining the security team’s query priority while managing resource pressure, including the cancellation of complex retail queries during high CPU usage.

Scenario 2: End-of-month reporting

During month-end reporting periods, GlobalLog successfully handled intensive analytical workloads from multiple tenants. The implementation of time-based rules proved particularly effective, with prioritizing Tier 4 tenants for batch reporting during regular end-of-month off-peak business hours. The following code shows an example of GlobalLog rules in this context. The first rule allows Tier 4 tenants to run reports during off-peak business hours, and the second rule denies Tier 4 tenants’ requests during business hours:

monthlyReportAllowRule",
"ruleConfig": {
"tenantTier": "tier4$",
"timeWindow": {
     		"dayOfMonth": "25-30",
      		"hours": "18:00-8:00"
    	      }
               }
monthlyReportDenyRule",
"ruleConfig": {
"tenantTier": "^tier4$",
"timeWindow": {
     	       "dayOfMonth": "25-30",
      	       "hours": "9:00-18:00"
    	      }
               }

The system dynamically adjusted resource allocation for Tier 4 tenants for the off-peak hours (6:00 PM – 8:00 AM) using the OpenSearch workload management API.

This comprehensive approach proved highly successful in managing peak reporting periods, facilitating both system stability and optimal performance across all tenant tiers.

Conclusion

The integration of proxy-layer traffic shaping with the OpenSearch workload management plugin in a continuous feedback loop architecture achieved resiliency, stable performance, and fair resource allocation while supporting diverse business priorities. The implementation discussed in this post demonstrates that large-scale, multi-tenant logging environments can effectively serve diverse business needs on shared infrastructure while maintaining performance and cost-efficiency.

Try out these workload management techniques for your own use case and share your feedback and questions in the comments.


About the Authors

Ezat Karimi is a Senior Solutions Architect at AWS, based in Austin, TX. Ezat specializes in designing and delivering modernization solutions and strategies for database applications. Working closely with multiple AWS teams, Ezat helps customers migrate their database workloads to the AWS Cloud.

Jon Handler is a Senior Principal Solutions Architect at AWS based in Palo Alto, CA. Jon works closely with OpenSearch and Amazon OpenSearch Service, providing help and guidance to a broad range of customers who have vector, search, and log analytics workloads that they want to move to the AWS Cloud. Prior to joining AWS, Jon’s career as a software developer included 4 years of coding a large-scale, ecommerce search engine. Jon holds a Bachelor’s of the Arts from the University of Pennsylvania, and a Master’s of Science and a PhD in Computer Science and Artificial Intelligence from Northwestern University.
Optimizing vector search using Amazon S3 Vectors and Amazon OpenSearch Service

Post Syndicated from Sohaib Katariwala original https://aws.amazon.com/blogs/big-data/optimizing-vector-search-using-amazon-s3-vectors-and-amazon-opensearch-service/

NOTE: As of July 15, the Amazon S3 Vectors Integration with Amazon OpenSearch Service is in preview release and is subject to change.

The way we store and search through data is evolving rapidly with the advancement of vector embeddings and similarity search capabilities. Vector search has become essential for modern applications such as generative AI and agentic AI, but managing vector data at scale presents significant challenges. Organizations often struggle with the trade-offs between latency, cost, and accuracy when storing and searching through millions or billions of vector embeddings. Traditional solutions either require substantial infrastructure management or come with prohibitive costs as data volumes grow.

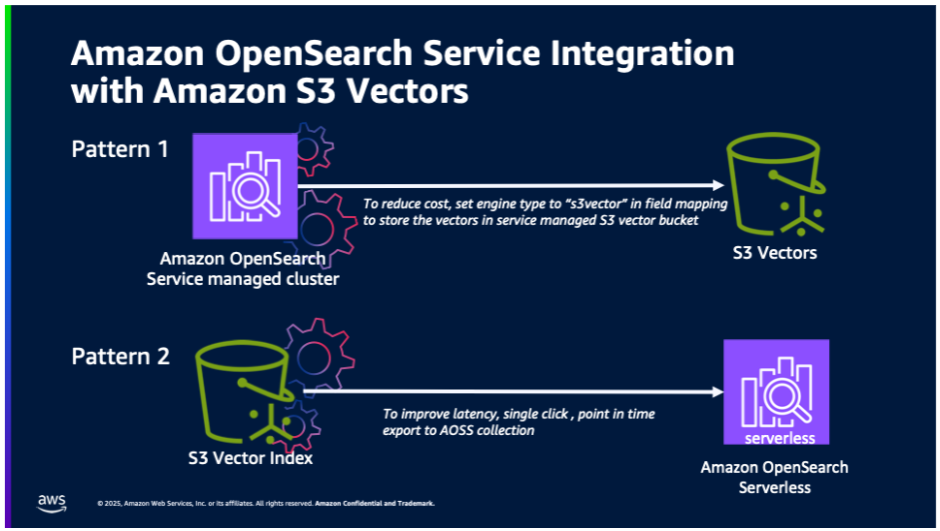
We now have a public preview of two integrations between Amazon Simple Storage Service (Amazon S3) Vectors and Amazon OpenSearch Service that give you more flexibility in how you store and search vector embeddings:

  1. Cost-optimized vector storage: OpenSearch Service managed clusters using service-managed S3 Vectors for cost-optimized vector storage. This integration will support OpenSearch workloads that are willing to trade off higher latency for ultra-low cost and still want to use advanced OpenSearch capabilities (such as hybrid search, advanced filtering, geo filtering, and so on).
  2. One-click export from S3 Vectors: One-click export from an S3 vector index to OpenSearch Serverless collections for high-performance vector search. Customers who build natively on S3 Vectors will benefit from being able to use OpenSearch for faster query performance.

By using these integrations, you can optimize cost, latency, and accuracy by intelligently distributing your vector workloads by keeping infrequent queried vectors in S3 Vectors and using OpenSearch for your most time-sensitive operations that require advanced search capabilities such as hybrid search and aggregations. Further, OpenSearch performance tuning capabilities (that is, quantization, k-nearest neighbor (knn) algorithms, and method-specific parameters) help to improve the performance with little compromise of cost or accuracy.

In this post, we walk through this seamless integration, providing you with flexible options for vector search implementation. You’ll learn how to use the new S3 Vectors engine type in OpenSearch Service managed clusters for cost-optimized vector storage and how to use one-click export from S3 Vectors to OpenSearch Serverless collections for high-performance scenarios requiring sustained queries with latency as low as 10ms. By the end of this post, you’ll understand how to choose and implement the right integration pattern based on your specific requirements for performance, cost, and scale.

Service overview

Amazon S3 Vectors is the first cloud object store with native support to store and query vectors with sub-second search capabilities, requiring no infrastructure management. It combines the simplicity, durability, availability, and cost-effectiveness of Amazon S3 with native vector search functionality, so you can store and query vector embeddings directly in S3. Amazon OpenSearch Service provides two complementary deployment options for vector workloads: Managed Clusters and Serverless Collections. Both harness Amazon OpenSearch’s powerful vector search and retrieval capabilities, though each excels in different scenarios. For OpenSearch users, the integration between S3 Vectors and Amazon OpenSearch Service offers unprecedented flexibility in optimizing your vector search architecture. Whether you need ultra-fast query performance for real-time applications or cost-effective storage for large-scale vector datasets, this integration lets you choose the approach that best fits your specific use case.

Understanding Vector Storage Options

OpenSearch Service provides multiple options for storing and searching vector embeddings, each optimized for different use cases. The Lucene engine, which is OpenSearch’s native search library, implements the Hierarchical Navigable Small World (HNSW) method, offering efficient filtering capabilities and strong integration with OpenSearch’s core functionality. For workloads requiring additional optimization options, the Faiss engine (Facebook AI Similarity Search) provides implementations of both HNSW and IVF (Inverted File Index) methods, along with vector compression capabilities. HNSW creates a hierarchical graph structure of connections between vectors, enabling efficient navigation during search, while IVF organizes vectors into clusters and searches only relevant subsets during query time. With the introduction of the S3 engine type, you now have a cost-effective option that uses Amazon S3’s durability and scalability while maintaining sub-second query performance. With this variety of options, you can choose the most suitable approach based on your specific requirements for performance, cost, and accuracy. For instance, if your application requires sub-50 ms query responses with efficient filtering, Faiss’s HNSW implementation is the best choice. Alternatively, if you need to optimize storage costs while maintaining reasonable performance, the new S3 engine type would be more appropriate.

Solution overview

In this post, we explore two primary integration patterns:

OpenSearch Service managed clusters using service-managed S3 Vectors for cost-optimized vector storage.

For customers already using OpenSearch Service domains who want to optimize costs while maintaining sub-second query performance, the new Amazon S3 engine type offers a compelling solution. OpenSearch Service automatically manages vector storage in Amazon S3, data retrieval, and cache optimization, eliminating operational overhead.

One-click export from an S3 vector index to OpenSearch Serverless collections for high-performance vector search.

For use cases requiring faster query performance, you can migrate your vector data from an S3 vector index to an OpenSearch Serverless collection. This approach is ideal for applications that require real-time response times and gives you the benefits that come with Amazon OpenSearch Serverless, including advanced query capabilities and filters, automatic scaling and high availability, and no administration. The export process automatically handles schema mapping, vector data transfer, index optimization, and connection configuration.

The following illustration shows the two integration patterns between Amazon OpenSearch Service and S3 Vectors.

Prerequisites

Before you begin, make sure you have:

  • An AWS account
  • Access to Amazon S3 and Amazon OpenSearch Service
  • An OpenSearch Service domain (for the first integration pattern)
  • Vector data stored in S3 Vectors (for the second integration pattern)

Integration pattern 1: OpenSearch Service managed cluster using S3 Vectors

To implement this pattern:

  1. Create an OpenSearch Service Domain using OR1 instances on OpenSearch version 2.19.
    1. While creating the OpenSearch Service domain, choose the Enable S3 Vectors as an engine option in the Advanced features section.
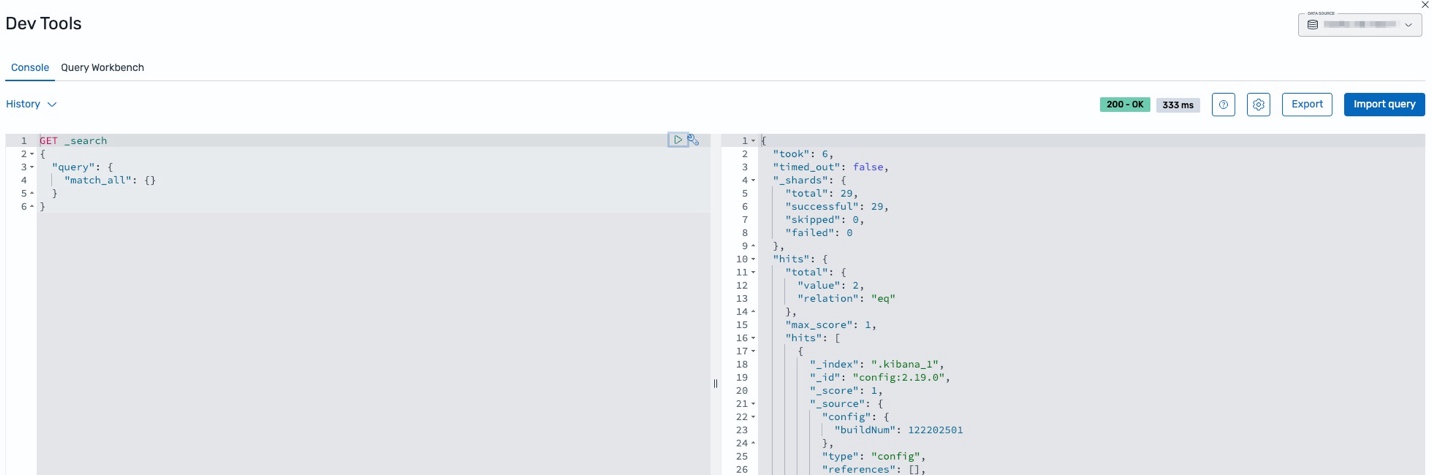
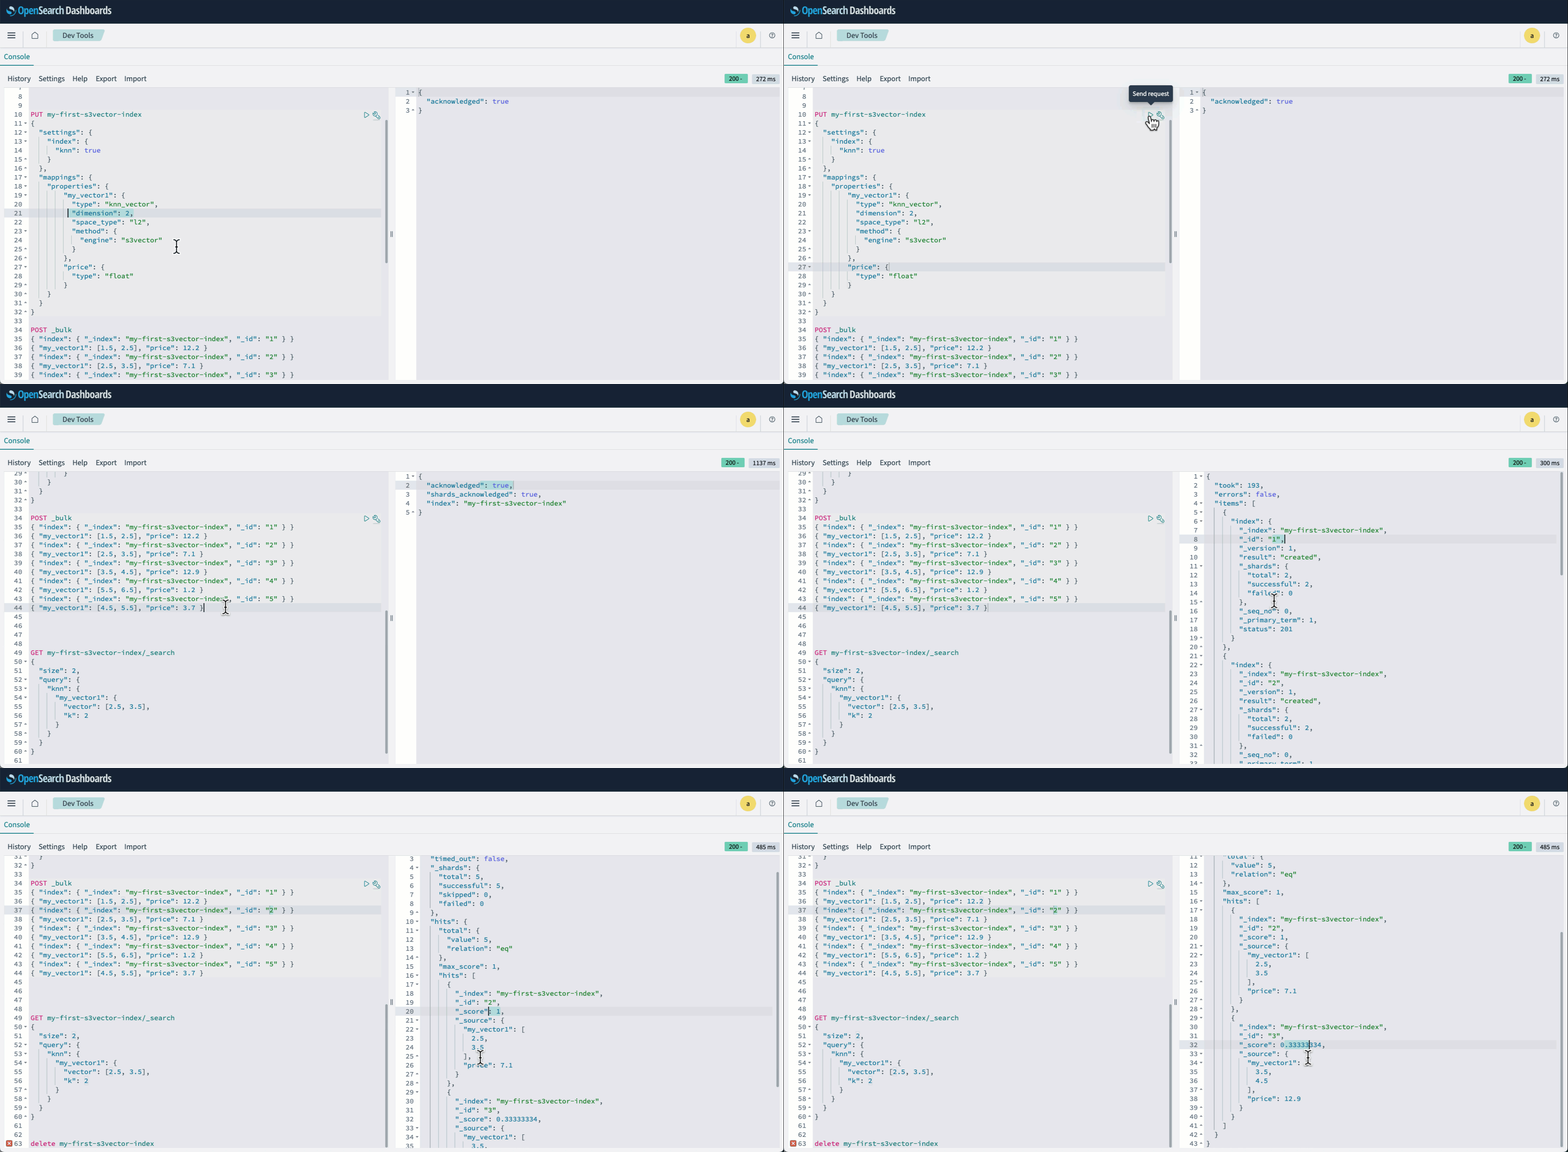
  2. Sign in to OpenSearch Dashboards and open Dev tools. Then create your knn index and specify s3vector as the engine.
PUT my-first-s3vector-index
{
  "settings": {
    "index": {
      "knn": true
    }
  },
  "mappings": {
    "properties": {
        "my_vector1": {
          "type": "knn_vector",
          "dimension": 2,
          "space_type": "l2",
          "method": {
            "engine": "s3vector"
          }
        },
        "price": {
          "type": "float"
        }
    }
  }
} 
  1. Index your vectors using the Bulk API:
POST _bulk
{ "index": { "_index": "my-first-s3vector-index", "_id": "1" } }
{ "my_vector1": [2.5, 3.5], "price": 7.1 }
{ "index": { "_index": "my-first-s3vector-index", "_id": "3" } }
{ "my_vector1": [3.5, 4.5], "price": 12.9 }
{ "index": { "_index": "my-first-s3vector-index", "_id": "4" } }
{ "my_vector1": [5.5, 6.5], "price": 1.2 }
{ "index": { "_index": "my-first-s3vector-index", "_id": "5" } }
{ "my_vector1": [4.5, 5.5], "price": 3.7 }
{ "index": { "_index": "my-first-s3vector-index", "_id": "6" } }
{ "my_vector1": [1.5, 2.5], "price": 12.2 }
  1. Run a knn query as usual:
GET my-first-s3vector-index/_search
{
  "size": 2,
  "query": {
    "knn": {
      "my_vector1": {
        "vector": [2.5, 3.5],
        "k": 2
      }
    }
  }
}

The following animation demonstrates steps 2-4 above.

Integration pattern 2: Export S3 vector indexes to OpenSearch Serverless

To implement this pattern:

  1. Navigate to the AWS Management Console for Amazon S3 and select your S3 vector bucket.

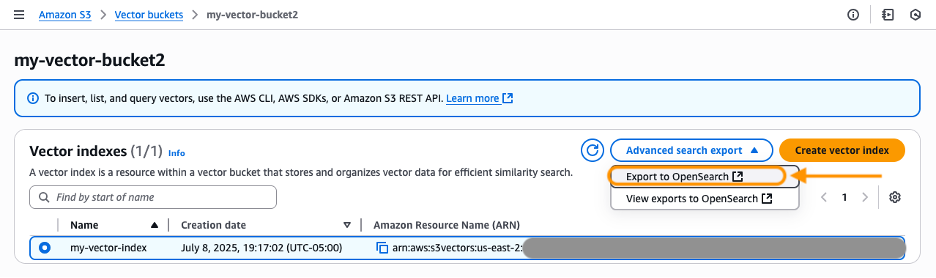
  1. Select a vector index that you want to export. Under Advanced search export, select Export to OpenSearch.

Alternatively, you can:

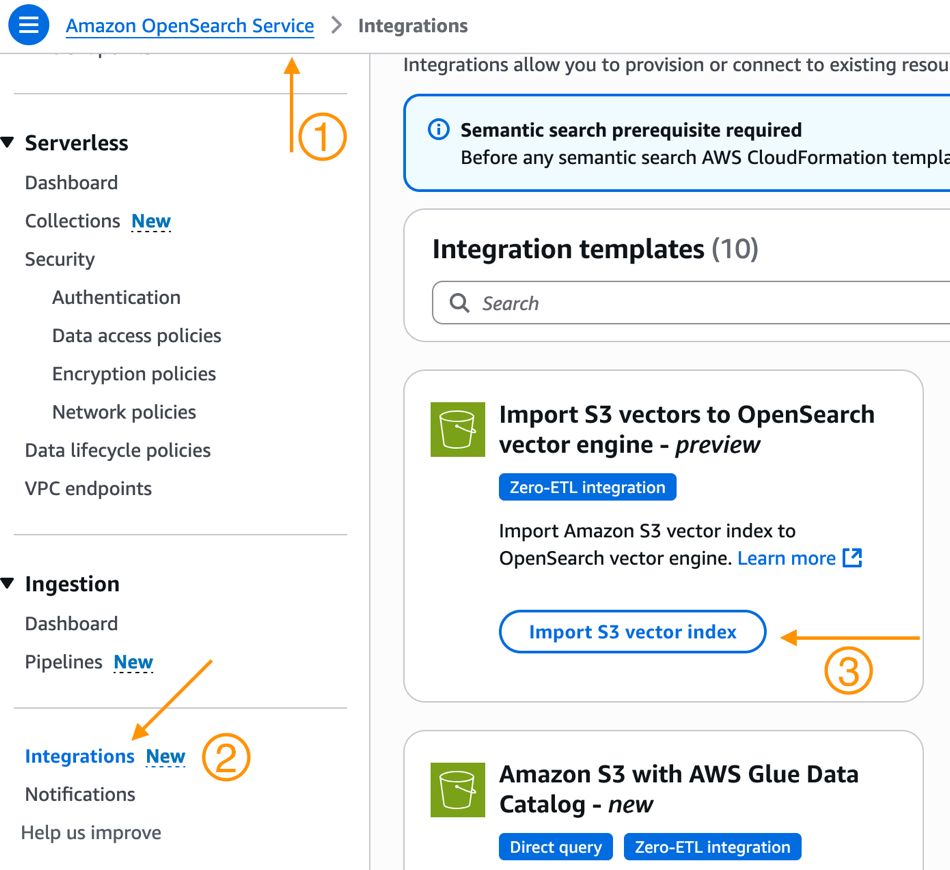
  1. Navigate to the OpenSearch Service console.
  2. Select Integrations from the navigation pane.
  3. Here you will see a new Integration Template to Import S3 vectors to OpenSearch vector engine – preview. Select Import S3 vector index.

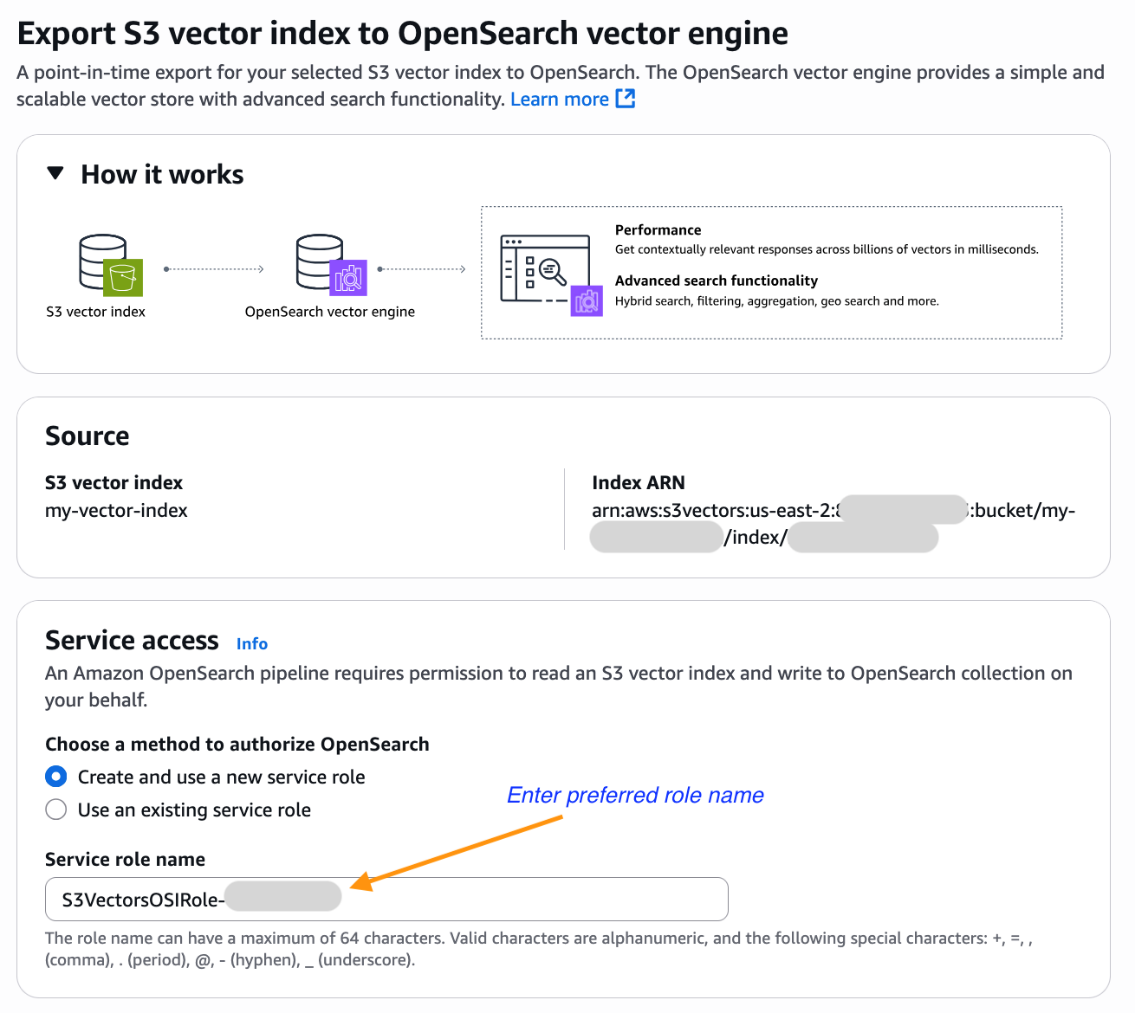
  1. You will now be brought to the Amazon OpenSearch Service integration console with the Export S3 vector index to OpenSearch vector engine template pre-selected and pre-populated with your S3 vector index Amazon Resource Name (ARN). Select an existing role that has the necessary permissions or create a new service role.

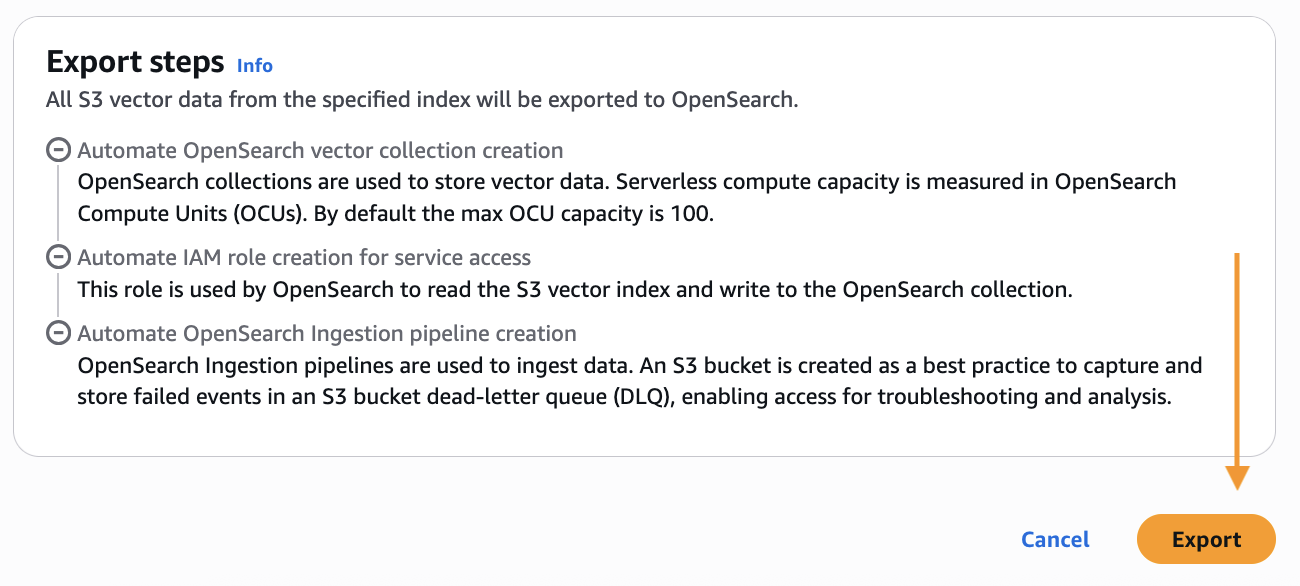
  1. Scroll down and choose Export to start the steps to create a new OpenSearch Serverless collection and copy data from your S3 vector index into an OpenSearch knn index.

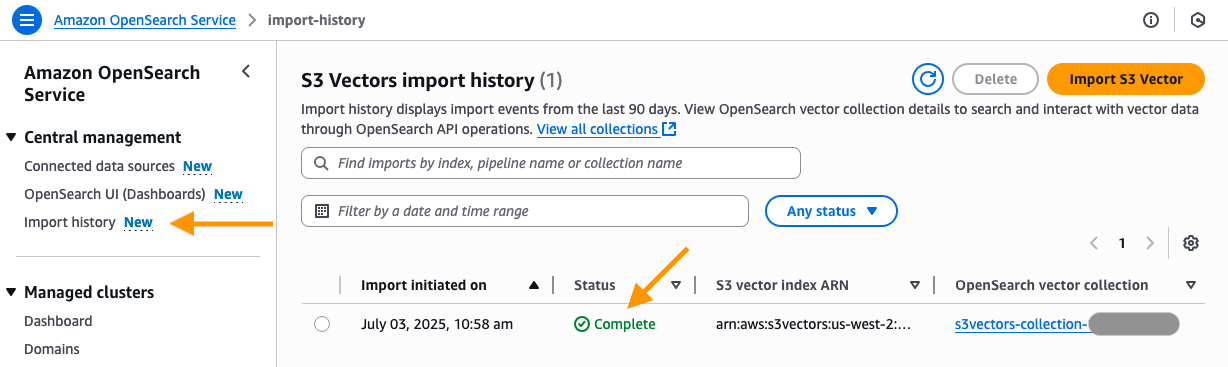
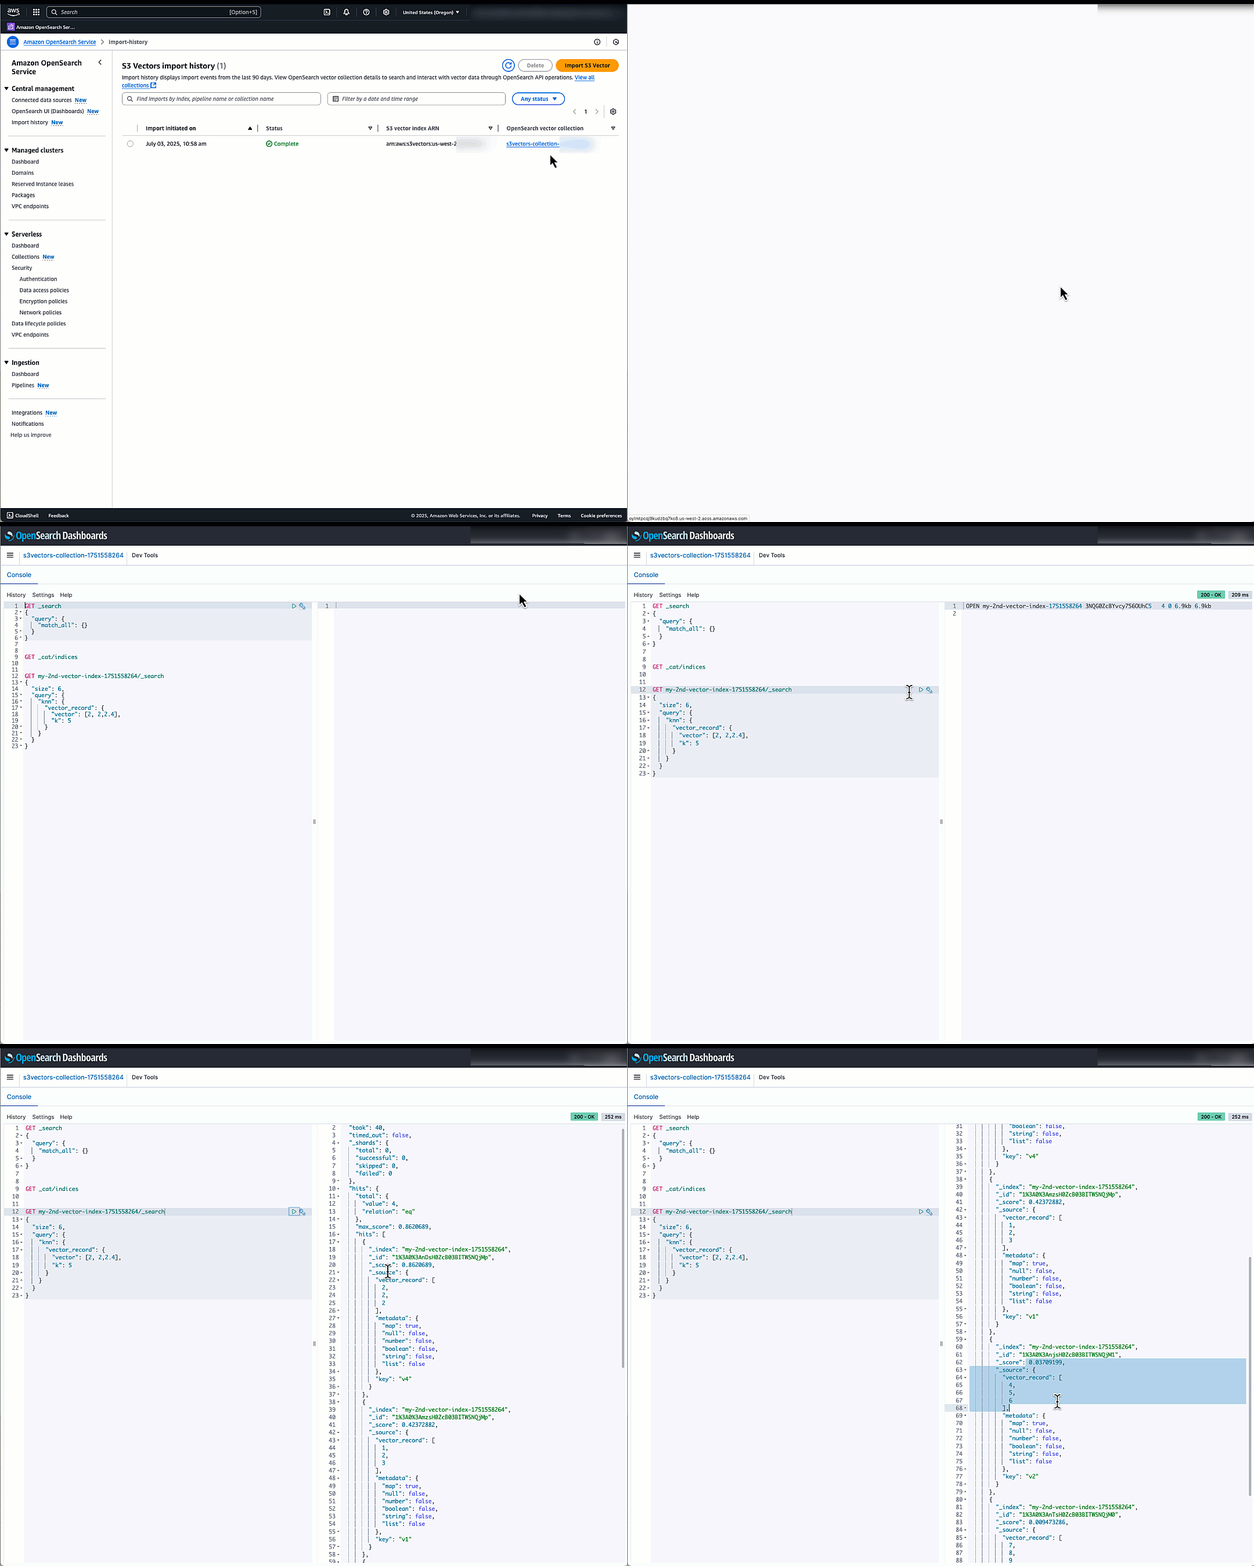
  1. You will now be taken to the Import history page in the OpenSearch Service console. Here you will see the new job that was created to migrate your S3 vector index into the OpenSearch serverless knn index. After the status changes from In Progress to Complete, you can connect to the new OpenSearch serverless collection and query your new OpenSearch knn index.

The following animation demonstrates how to connect to the new OpenSearch serverless collection and query your new OpenSearch knn index using Dev tools.

Cleanup

To avoid ongoing charges:

  1. For Pattern 1:
  1. For Pattern 2:
    • Delete the import task from the Import history section of the OpenSearch Service console. Deleting this task will remove both the OpenSearch vector collection and the OpenSearch Ingestion pipeline that was automatically created by the import task.

Conclusion

The innovative integration between Amazon S3 Vectors and Amazon OpenSearch Service marks a transformative milestone in vector search technology, offering unprecedented flexibility and cost-effectiveness for enterprises. This powerful combination delivers the best of both worlds: The renowned durability and cost efficiency of Amazon S3 merged seamlessly with the advanced AI search capabilities of OpenSearch. Organizations can now confidently scale their vector search solutions to billions of vectors while maintaining control over their latency, cost, and accuracy. Whether your priority is ultra-fast query performance with latency as low as 10ms through OpenSearch Service, or cost-optimized storage with impressive sub-second performance using S3 Vectors or implementing advanced search capabilities in OpenSearch, this integration provides the perfect solution for your specific needs. We encourage you to get started today by trying S3 Vectors engine in your OpenSearch managed clusters and testing the one-click export from S3 vector indexes to OpenSearch Serverless.

For more information, visit:


About the Authors

Sohaib Katariwala is a Senior Specialist Solutions Architect at AWS focused on Amazon OpenSearch Service based out of Chicago, IL. His interests are in all things data and analytics. More specifically he loves to help customers use AI in their data strategy to solve modern day challenges.

Mark Twomey is a Senior Solutions Architect at AWS focused on storage and data management. He enjoys working with customers to put their data in the right place, at the right time, for the right cost. Living in Ireland, Mark enjoys walking in the countryside, watching movies, and reading books.

Sorabh Hamirwasia is a senior software engineer at AWS working on the OpenSearch Project. His primary interest include building cost optimized and performant distributed systems.

Pallavi Priyadarshini is a Senior Engineering Manager at Amazon OpenSearch Service leading the development of high-performing and scalable technologies for search, security, releases, and dashboards.

Bobby Mohammed is a Principal Product Manager at AWS leading the Search, GenAI, and Agentic AI product initiatives. Previously, he worked on products across the full lifecycle of machine learning, including data, analytics, and ML features on SageMaker platform, deep learning training and inference products at Intel.
Integrating Amazon OpenSearch Ingestion with Amazon RDS and Amazon Aurora

Post Syndicated from Michael Torio original https://aws.amazon.com/blogs/big-data/integrating-amazon-opensearch-ingestion-with-amazon-rds-and-amazon-aurora/

Unlocking powerful search capabilities for millions of items should be fast, accurate, and effortless while maintaining high relevance. Relational databases are a popular storage method for structured data, and organizations use them extensively to store their core business information. Although relational databases excel at storing and retrieving structured data, they often struggle with searching through large blocks of unstructured text and, for performance reasons, typically don’t index all columns.

In contrast, search engines such as OpenSearch index all fields, enabling rich search capabilities, including semantic search, and powerful aggregations for summarizing and analyzing numeric data. Traditionally, organizations have managed complex, inefficient, and expensive data synchronization processes, including extract, transform, and load (ETL) pipelines, to keep their search indices up to date with their databases. Those looking to enhance their applications with advanced search features need a simpler solution that can maintain search index synchronization with their databases without the overhead of managing custom data sync processes.

We are happy to announce the general availability of the integration of Amazon OpenSearch Service with Amazon Relational Database Service (Amazon RDS) and Amazon Aurora. This new integration eliminates complex data pipelines and enables near real-time data synchronization between Amazon Aurora (including Amazon Aurora MySQL-Compatible Edition and Amazon Aurora PostgreSQL-Compatible Edition) and Amazon RDS databases (including Amazon RDS for MySQL and Amazon RDS for PostgreSQL), and Amazon OpenSearch Service, unlocking advanced search capabilities such as hybrid search, ranked results, and faceted search on transactional databases. You can now deliver low-latency, high-throughput search results, live inventory updates, and personalized recommendations while focusing on creating exceptional customer experiences instead of managing data synchronization. This integration reduces the operational burden of maintaining complex ETL pipelines, reducing costs while providing instant data availability for search operations.

Amazon OpenSearch Ingestion provides near real-time data synchronization between Amazon Aurora or Amazon RDS and OpenSearch Service. Select your Aurora or RDS database, and OpenSearch Ingestion handles the rest, supporting both Aurora MySQL or RDS for MySQL (8.0 and above) and Aurora PostgreSQL or RDS for PostgreSQL (16 and above).

Solution overview

Here’s how these services work together:

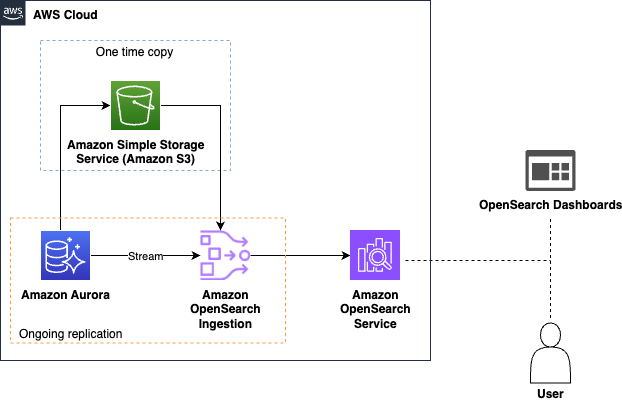
  • Data ingestion – OpenSearch Ingestion first loads your database snapshot from Amazon Simple Storage Service (Amazon S3), where Aurora or Amazon RDS has exported the initial data. It then uses Aurora or Amazon RDS change data capture (CDC) streams to replicate further changes in near real time and indexes them into OpenSearch Service. This automated process keeps your data is consistently up to date in OpenSearch, making it readily available for search and analysis without manual intervention.
  • Real-time querying – OpenSearch Service offers powerful query capabilities that enable you to perform complex searches and aggregations on your data. Whether you need to analyze trends, detect anomalies, or perform search queries to return relevant results for your application, OpenSearch Service provides the tools you need.

The following diagram illustrates the solution architecture for Amazon Aurora as a source:

A diagram of a processAI-generated content may be incorrect.

Getting Started

Configuring Your Database Source

Before setting up synchronization, you need to configure your source database’s logging settings. For Aurora MySQL, configure your cluster parameter group with enhanced binary log settings. For Amazon RDS, enable basic binary logging or logical replication through your instance parameter group settings. These logging configurations enable OpenSearch Ingestion to capture and replicate data changes from your database.

The sample HR database with Aurora MySQL is a good example to show how this integration works.

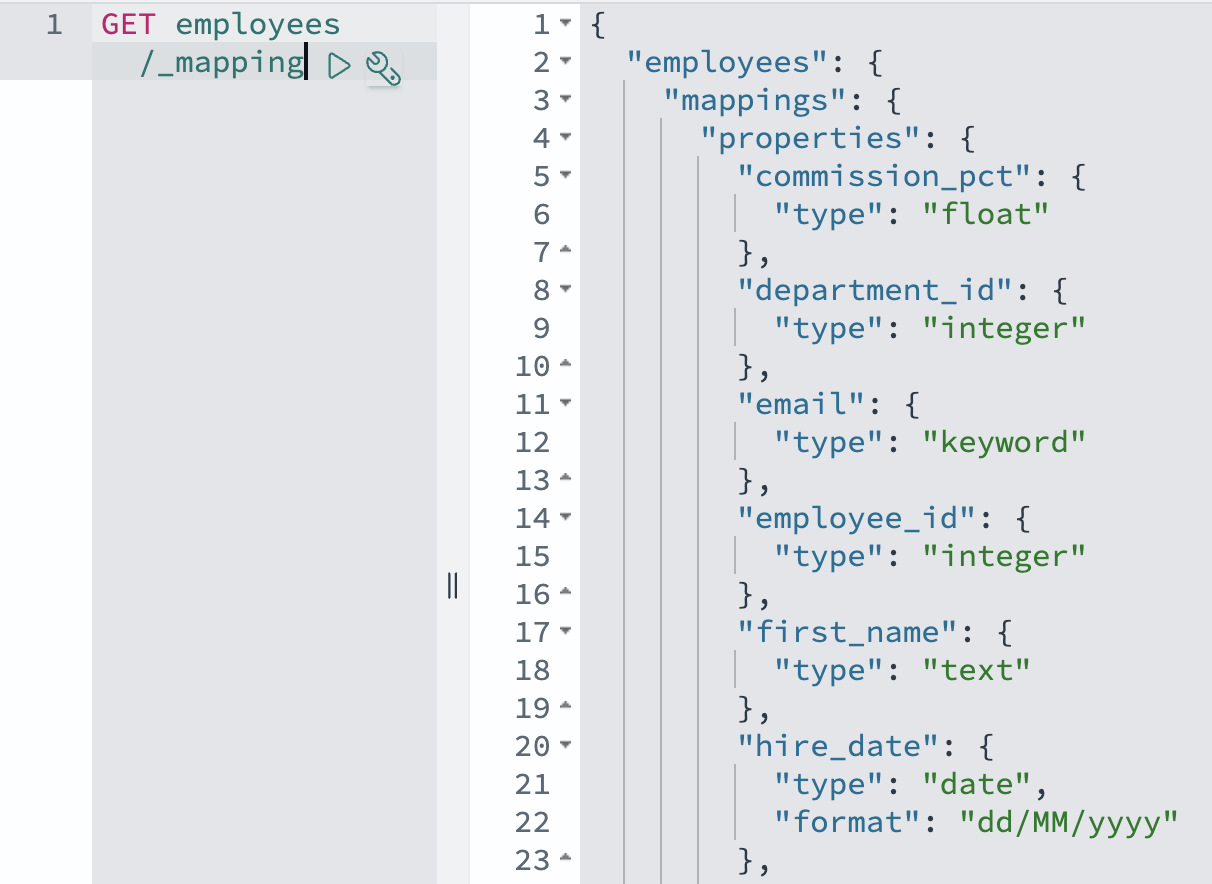
Before creating the view, we now explain how OpenSearch will represent this data. OpenSearch mappings define how documents and their fields are stored and indexed, similar to how a database schema defines tables and columns. The OpenSearch Ingestion pipeline uses dynamic mappings by default, automatically converting Aurora or Amazon RDS data types to appropriate OpenSearch field types. For example, database DATE fields become OpenSearch date types, and numeric fields are mapped to corresponding OpenSearch numeric types. Although you can customize these mappings using index templates, the default mappings typically handle common data types correctly, including dates, numbers, and text fields.

GET employees/_mapping

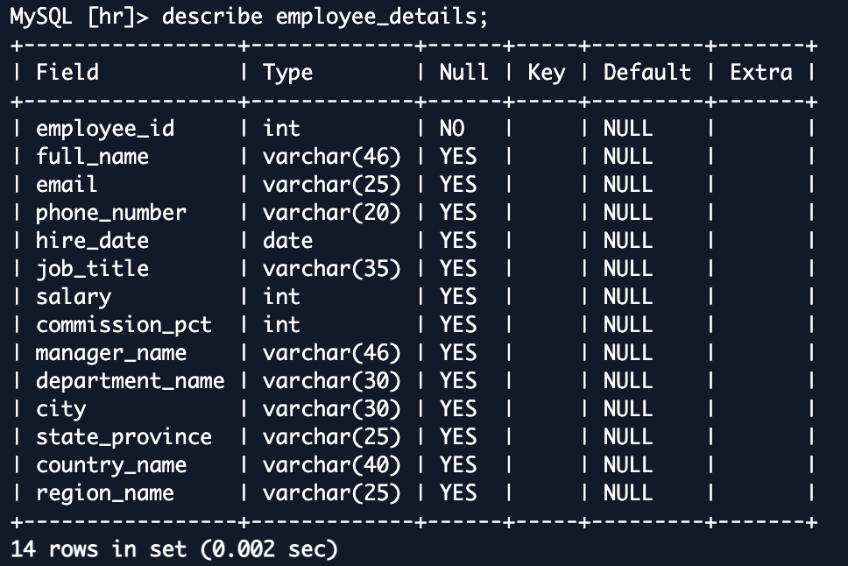
To demonstrate the integration’s ability to handle complex data relationships, we now examine how OpenSearch Ingestion handles joined data. We create a view in the sample HR database that combines information from multiple related tables into a single, searchable document in OpenSearch. This approach shows how you can transform normalized database structures into denormalized documents that are optimized for search operations.

This employee_details view combines data from multiple tables, creating a rich, denormalized representation of employee information. When replicated to OpenSearch, this view becomes a single, comprehensive document for each employee. This structure is ideal for search operations, allowing for fast and complex queries across what were originally separate tables. For example, you could easily search for employees in a specific department and country or analyze salary distributions across regions—queries that would be more complex and potentially slower in the original normalized database structure.

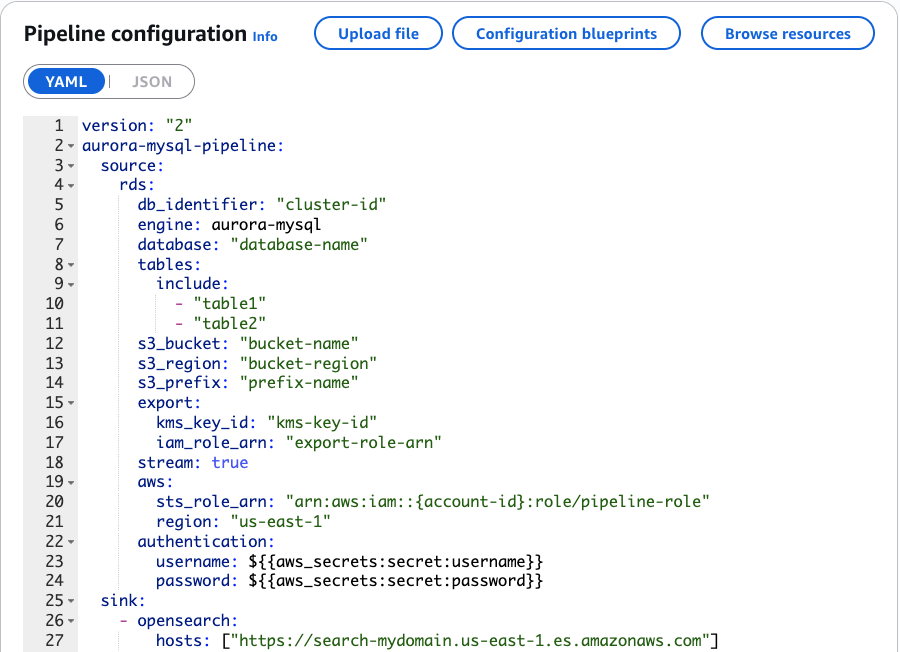
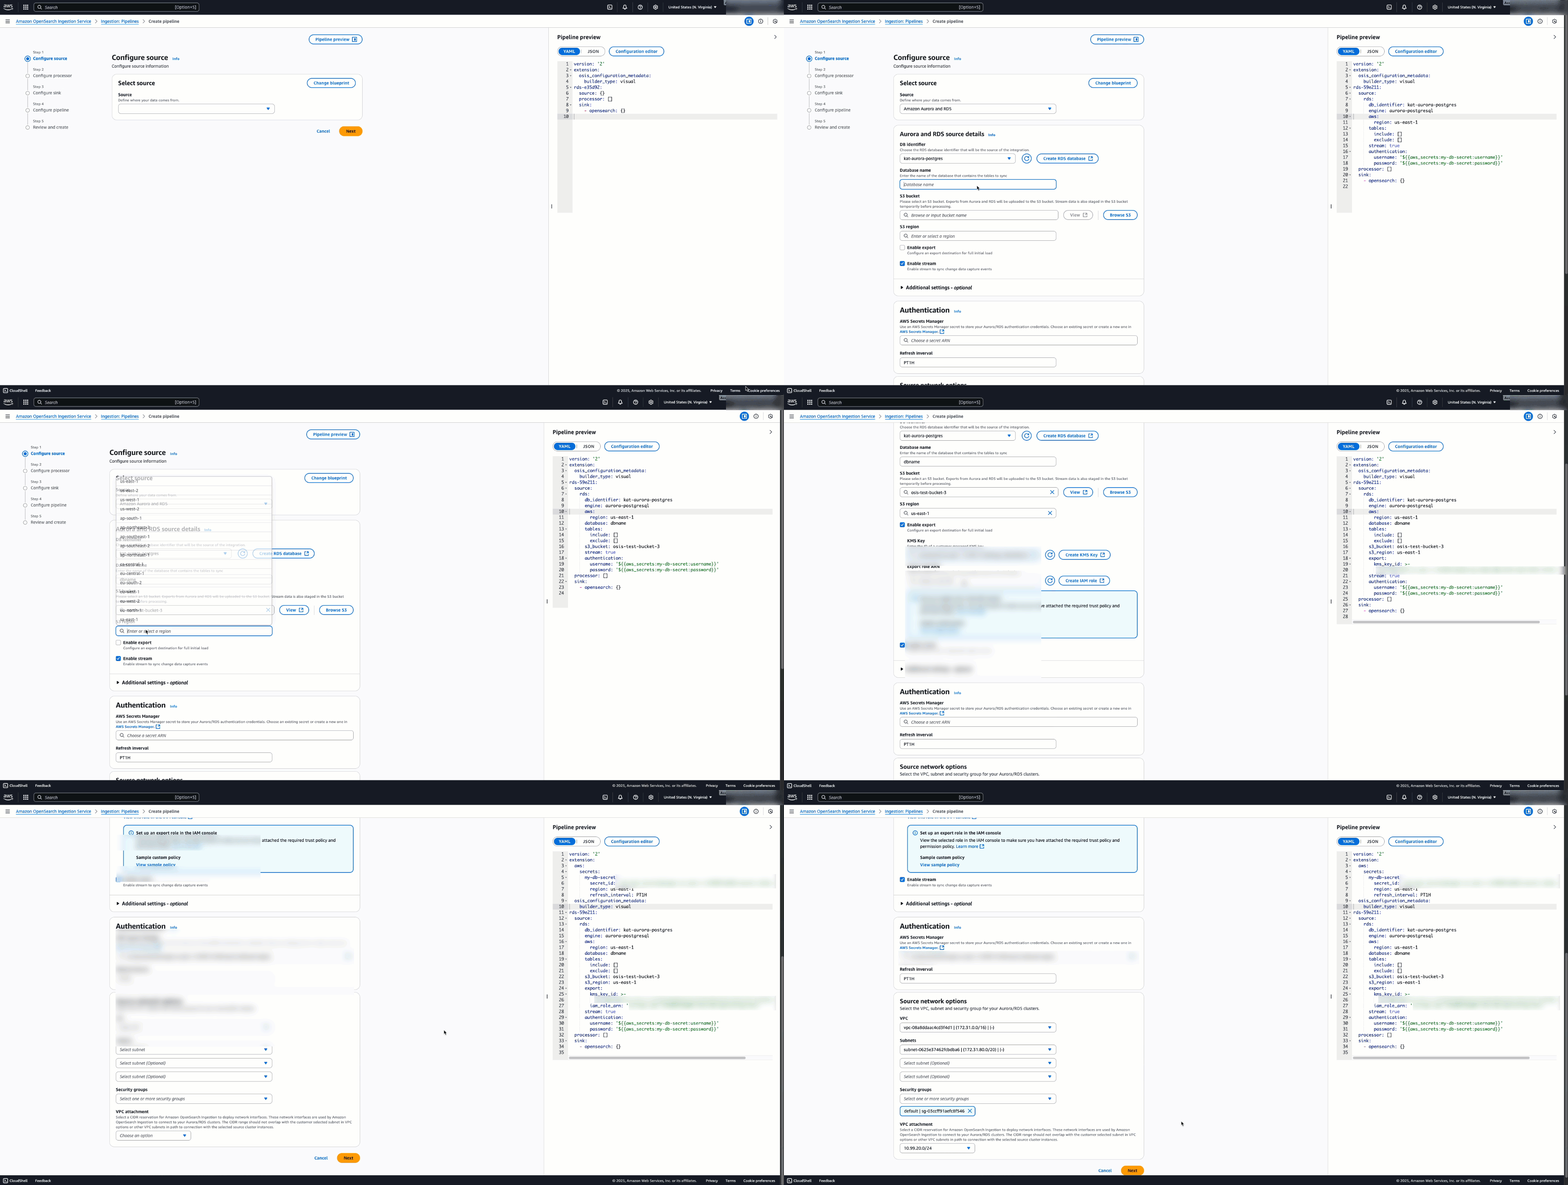
In the pipeline configuration shown in the following screenshot, you can check how OpenSearch Ingestion connects to the HR database. The configuration identifies the source database and the specific tables we want to replicate. While we created a view to understand the data relationships, the pipeline tracks changes from the underlying base tables (employees, departments, locations, and regions). OpenSearch Ingestion automatically maintains these relationships, which means that changes to these tables are properly reflected in your OpenSearch index, keeping your search data consistent with your source database.

In the gif shown below, you can see a demo of setting up this integration using the visual editor of OpenSearch Ingestion.

You can also specify index mapping templates to map your Aurora or Amazon RDS fields to the correct fields in your OpenSearch Service indexes.

For a comprehensive overview of configuration settings for the pipeline, refer to the OpenSearch Data Prepper documentation. You must set up AWS Identity and Access Management (IAM) roles for the pipeline. For instructions, refer to Configure the pipeline role.

After you configure the integration in OpenSearch Ingestion, the pipeline automatically creates indexes that you can view in OpenSearch Dashboards. OpenSearch Ingestion first triggers an automatic export of your Aurora or Amazon RDS database to Amazon S3, then loads this snapshot data from S3 into your OpenSearch cluster to create the initial indices. After this initial load, OpenSearch Ingestion continually captures changes using binary logs (binlog) for MySQL-based databases or write-ahead logs (WAL) for PostgreSQL-based databases. This way, your OpenSearch indices stay synchronized with your source database in near real time. You can view your indices in OpenSearch Dashboards by invoking:

GET _cat/indices

Example response:

Demonstrating near real time data synchronization

Consider the first five entries in the employee table:

When you make changes to your database, OpenSearch Ingestion updates Amazon OpenSearch Service with the change data. For example, the following code updates an employee’s salary:

UPDATE hr.employees SET SALARY = 26000 WHERE EMPLOYEE_ID = 100;

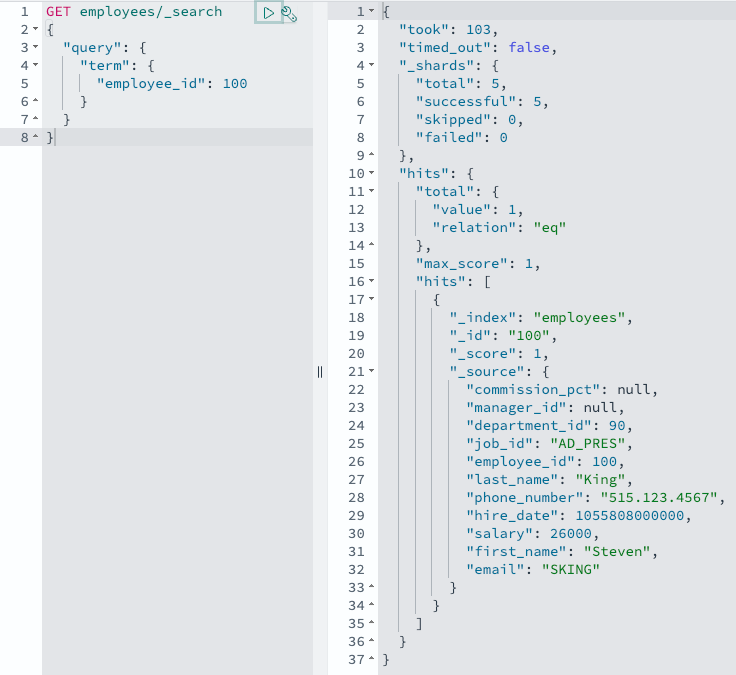
Amazon Aurora sends out a change notice, your OpenSearch Ingestion pipeline picks it up, and OpenSearch Ingestion sends the changed record to OpenSearch in near real time. You can verify this with an OpenSearch query:

GET employees/_search

Important details about this feature:

  • Monitoring Track pipeline performance and data synchronization through CloudWatch metrics and the OpenSearch Ingestion dashboard
  • Limitations – Requires same-Region and same-account deployment, primary keys for optimal synchronization, and currently has no data definition language (DDL) statement support

Conclusion

Amazon Aurora or Amazon RDS integration with Amazon OpenSearch Service is now generally available in all AWS Regions where OpenSearch Ingestion is available.

To learn more, refer to the AWS documentation for Aurora or Amazon RDS integration with Amazon OpenSearch Service:


About the authors

Michael Torio is an Associate Specialist Solutions Architect at AWS focused on Amazon OpenSearch Service based out of Mountain View, CA. Michael enjoys helping customers leverage cloud technologies to solve their business challenges.

Sohaib Katariwala is a Senior Specialist Solutions Architect at AWS focused on Amazon OpenSearch Service based out of Chicago, IL. His interests are in all things data and analytics. More specifically he loves to help customers use AI in their data strategy to solve modern day challenges.

Arjun Nambiar is a Product Manager with Amazon OpenSearch Service. He focuses on ingestion technologies that enable ingesting data from a wide variety of sources into Amazon OpenSearch Service at scale. Arjun is interested in large-scale distributed systems and cloud-centered technologies, and is based out of Seattle, Washington.

Introducing Amazon S3 Vectors: First cloud storage with native vector support at scale (preview)

Post Syndicated from Channy Yun (윤석찬) original https://aws.amazon.com/blogs/aws/introducing-amazon-s3-vectors-first-cloud-storage-with-native-vector-support-at-scale/

Today, we’re announcing the preview of Amazon S3 Vectors, a purpose-built durable vector storage solution that can reduce the total cost of uploading, storing, and querying vectors by up to 90 percent. Amazon S3 Vectors is the first cloud object store with native support to store large vector datasets and provide subsecond query performance that makes it affordable for businesses to store AI-ready data at massive scale.

Vector search is an emerging technique used in generative AI applications to find similar data points to given data by comparing their vector representations using distance or similarity metrics. Vectors are numerical representation of unstructured data created from embedding models. You generate vectors using embedding models for fields inside your document and store vectors into S3 Vectors to search semantically.

S3 Vectors introduces vector buckets, a new bucket type with a dedicated set of APIs to store, access, and query vector data without provisioning any infrastructure. When you create an S3 vector bucket, you organize your vector data within vector indexes, making it simple for running similarity search queries against your dataset. Each vector bucket can have up to 10,000 vector indexes, and each vector index can hold tens of millions of vectors.

After creating a vector index, when adding vector data to the index, you can also attach metadata as key-value pairs to each vector to filter future queries based on a set of conditions, for example, dates, categories, or user preferences. As you write, update, and delete vectors over time, S3 Vectors automatically optimizes the vector data to achieve the best possible price-performance for vector storage, even as the datasets scale and evolve.

S3 Vectors is also natively integrated with Amazon Bedrock Knowledge Bases, including within Amazon SageMaker Unified Studio, for building cost-effective Retrieval-Augmented Generation (RAG) applications. Through its integration with Amazon OpenSearch Service, you can lower storage costs by keeping infrequent queried vectors in S3 Vectors and then quickly move them to OpenSearch as demands increase or to support real-time, low-latency search operations.

With S3 Vectors, you can now economically store the vector embeddings that represent massive amounts of unstructured data such as images, videos, documents, and audio files, enabling scalable generative AI applications including semantic and similarity search, RAG, and build agent memory. You can also build applications to support a wide range of industry use cases including personalized recommendations, automated content analysis, and intelligent document processing without the complexity and cost of managing vector databases.

S3 Vectors in action
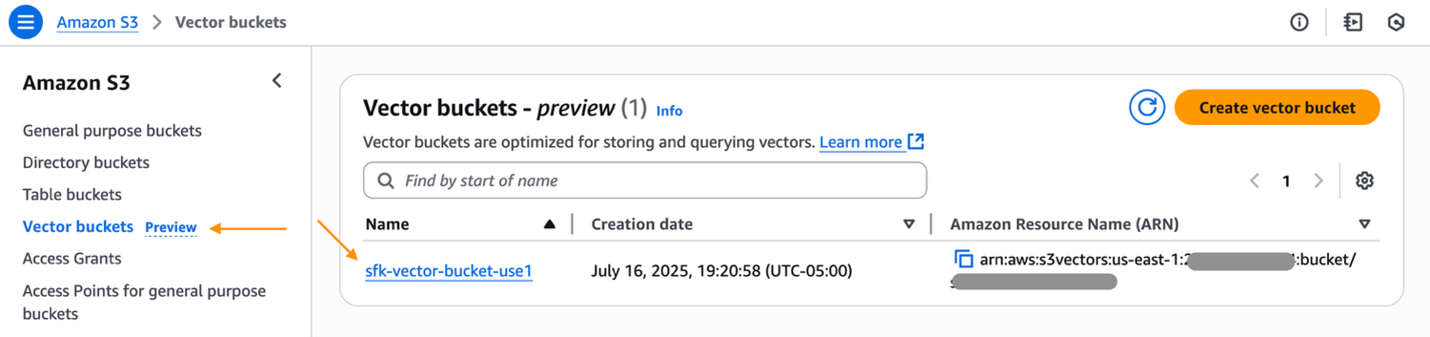
To create a vector bucket, choose Vector buckets in the left navigation pane in the Amazon S3 console and then choose Create vector bucket.

Enter a vector bucket name and choose the encryption type. If you don’t specify an encryption type, Amazon S3 applies server-side encryption with Amazon S3 managed keys (SSE-S3) as the base level of encryption for new vectors. You can also choose server-side encryption with AWS Key Management Service (AWS KMS) keys (SSE-KMS). To learn more about managing your vector bucket, visit S3 Vector buckets in the Amazon S3 User Guide.

Now, you can create a vector index to store and query your vector data within your created vector bucket.

Enter a vector index name and the dimensionality of the vectors to be inserted in the index. All vectors added to this index must have exactly the same number of values.

For Distance metric, you can choose either Cosine or Euclidean. When creating vector embeddings, select your embedding model’s recommended distance metric for more accurate results.

Choose Create vector index and then you can insert, list, and query vectors.

To insert your vector embeddings to a vector index, you can use the AWS Command Line Interface (AWS CLI), AWS SDKs, or Amazon S3 REST API. To generate vector embeddings for your unstructured data, you can use embedding models offered by Amazon Bedrock.

If you’re using the latest AWS Python SDKs, you can generate vector embeddings for your text using Amazon Bedrock using following code example:

# Generate and print an embedding with Amazon Titan Text Embeddings V2.
import boto3 
import json 

# Create a Bedrock Runtime client in the AWS Region of your choice. 
bedrock= boto3.client("bedrock-runtime", region_name="us-west-2") 

The text strings to convert to embeddings.
texts = [
"Star Wars: A farm boy joins rebels to fight an evil empire in space", 
"Jurassic Park: Scientists create dinosaurs in a theme park that goes wrong",
"Finding Nemo: A father fish searches the ocean to find his lost son"]

embeddings=[]
#Generate vector embeddings for the input texts
for text in texts:
        body = json.dumps({
            "inputText": text
        })    
        # Call Bedrock's embedding API
        response = bedrock.invoke_model(
        modelId='amazon.titan-embed-text-v2:0',  # Titan embedding model 
        body=body)   
        # Parse response
        response_body = json.loads(response['body'].read())
        embedding = response_body['embedding']
        embeddings.append(embedding)

Now, you can insert vector embeddings into the vector index and query vectors in your vector index using the query embedding:

# Create S3Vectors client
s3vectors_client = boto3.client('s3vectors', region_name='us-west-2')

# Insert vector embedding
s3vectors.put_vectors( vectorBucketName="channy-vector-bucket",
  indexName="channy-vector-index", 
  vectors=[
{"key": "v1", "data": {"float32": embeddings[0]}, "metadata": {"id": "key1", "source_text": texts[0], "genre":"scifi"}},
{"key": "v2", "data": {"float32": embeddings[1]}, "metadata": {"id": "key2", "source_text": texts[1], "genre":"scifi"}},
{"key": "v3", "data": {"float32": embeddings[2]}, "metadata": {"id": "key3", "source_text":  texts[2], "genre":"family"}}
],
)

#Create an embedding for your query input text
# The text to convert to an embedding.
input_text = "List the movies about adventures in space"

# Create the JSON request for the model.
request = json.dumps({"inputText": input_text})

# Invoke the model with the request and the model ID, e.g., Titan Text Embeddings V2. 
response = bedrock.invoke_model(modelId="amazon.titan-embed-text-v2:0", body=request)

# Decode the model's native response body.
model_response = json.loads(response["body"].read())

# Extract and print the generated embedding and the input text token count.
embedding = model_response["embedding"]

# Performa a similarity query. You can also optionally use a filter in your query
query = s3vectors.query_vectors( vectorBucketName="channy-vector-bucket",
  indexName="channy-vector-index",
  queryVector={"float32":embedding},
  topK=3, 
  filter={"genre":"scifi"},
  returnDistance=True,
  returnMetadata=True
  )
results = query["vectors"]
print(results)

To learn more about inserting vectors into a vector index, or listing, querying, and deleting vectors, visit S3 vector buckets and S3 vector indexes in the Amazon S3 User Guide. Additionally, with the S3 Vectors embed command line interface (CLI), you can create vector embeddings for your data using Amazon Bedrock and store and query them in an S3 vector index using single commands. For more information, see the S3 Vectors Embed CLI GitHub repository.

Integrate S3 Vectors with other AWS services
S3 Vectors integrates with other AWS services such as Amazon Bedrock, Amazon SageMaker, and Amazon OpenSearch Service to enhance your vector processing capabilities and provide comprehensive solutions for AI workloads.

Create Amazon Bedrock Knowledge Bases with S3 Vectors
You can use S3 Vectors in Amazon Bedrock Knowledge Bases to simplify and reduce the cost of vector storage for RAG applications. When creating a knowledge base in the Amazon Bedrock console, you can choose the S3 vector bucket as your vector store option.

In Step 3, you can choose the Vector store creation method either to create an S3 vector bucket and vector index or choose the existing S3 vector bucket and vector index that you’ve previously created.

For detailed step-by-step instructions, visit Create a knowledge base by connecting to a data source in Amazon Bedrock Knowledge Bases in the Amazon Bedrock User Guide.

Using Amazon SageMaker Unified Studio
You can create and manage knowledge bases with S3 Vectors in Amazon SageMaker Unified Studio when you build your generative AI applications through Amazon Bedrock. SageMaker Unified Studio is available in the next generation of Amazon SageMaker and provides a unified development environment for data and AI, including building and texting generative AI applications that use Amazon Bedrock knowledge bases.

You can choose your knowledge bases using the S3 Vectors created through Amazon Bedrock when you build generative AI applications. To learn more, visit Add a data source to your Amazon Bedrock app in the Amazon SageMaker Unified Studio User Guide.

Export S3 vector data to Amazon OpenSearch Service
You can balance cost and performance by adopting a tiered strategy that stores long-term vector data cost-effectively in Amazon S3 while exporting high priority vectors to OpenSearch for real-time query performance.

This flexibility means your organizations can access OpenSearch’s high performance (high QPS, low latency) for critical, real-time applications, such as product recommendations or fraud detection, while keeping less time-sensitive data in S3 Vectors.

To export your vector index, choose Advanced search export, then choose Export to OpenSearch in the Amazon S3 console.

Then, you will be brought to the Amazon OpenSearch Service Integration console with a template for S3 vector index export to OpenSearch vector engine. Choose Export with pre-selected S3 vector source and a service access role.

It will start the steps to create a new OpenSearch Serverless collection and migrate data from your S3 vector index into an OpenSearch knn index.

Choose the Import history in the left navigation pane. You can see the new import job that was created to make a copy of vector data from your S3 vector index into the OpenSearch Serverless collection.

Once the status changes to Complete, you can connect to the new OpenSearch serverless collection and query your new OpenSearch knn index.

To learn more, visit Creating and managing Amazon OpenSearch Serverless collections in the Amazon OpenSearch Service Developer Guide.

Now available
Amazon S3 Vectors, and its integrations with Amazon Bedrock, Amazon OpenSearch Service, and Amazon SageMaker are now in preview in the US East (N. Virginia), US East (Ohio), US West (Oregon), Europe (Frankfurt), and Asia Pacific (Sydney) Regions.

Give S3 Vectors a try in the Amazon S3 console today and send feedback to AWS re:Post for Amazon S3 or through your usual AWS Support contacts.

Channy

Build conversational AI search with Amazon OpenSearch Service

Post Syndicated from Bharav Patel original https://aws.amazon.com/blogs/big-data/build-conversational-ai-search-with-amazon-opensearch-service/

Retrieval Augmented Generation (RAG) is a well-known approach to creating generative AI applications. RAG combines large language models (LLMs) with external world knowledge retrieval and is increasingly popular for adding accuracy and personalization to AI. It retrieves relevant information from external sources, augments the input with this data, and generates responses based on both. This approach reduces hallucinations, improves fact accuracy, and allows for up-to-date, efficient, and explainable AI systems. RAG’s ability to break through classical language model limitations has made it applicable to broad AI use cases.

Amazon OpenSearch Service is a versatile search and analytics tool. It is capable of performing security analytics, searching data, analyzing logs, and many other tasks. It can also work with vector data with a k-nearest neighbors (k-NN) plugin, which makes it helpful for more complex search strategies. Because of this feature, OpenSearch Service can serve as a knowledge base for generative AI applications that integrate language generation with search results.

By preserving context over several exchanges, honing responses, and providing a more seamless user experience, conversational search enhances RAG. It helps with complex information needs, resolves ambiguities, and manages multi-turn reasoning. Conversational search provides a more natural and personalized interaction, yielding more accurate and pertinent results, even though standard RAG performs well for single queries.

In this post, we explore conversational search, its architecture, and various ways to implement it.

Solution overview

Let’s walk through the solution to build conversational search. The following diagram illustrates the solution architecture.

The new OpenSearch feature known as agents and tools is used to create conversational search. To develop sophisticated AI applications, agents coordinate a variety of machine learning (ML) tasks. Every agent has a number of tools; each intended for a particular function. To use agents and tools, you need OpenSearch version 2.13 or later.

Prerequisites

To implement this solution, you need an AWS account. If you don’t have one, you can create an account. You also need an OpenSearch Service domain with OpenSearch version 2.13 or later. You can use an existing domain or create a new domain.

To use the Amazon Titan Text Embedding and Anthropic Claude V1 models in Amazon Bedrock, you need to enable access to these foundation models (FMs). For instructions, refer to Add or remove access to Amazon Bedrock foundation models.

Configure IAM permissions

Complete the following steps to set up an AWS Identity and Access Management (IAM) role and user with appropriate permissions:

  1. Create an IAM role with the following policy that will allow the OpenSearch Service domain to invoke the Amazon Bedrock API:
    {
        "Version": "2012-10-17",
        "Statement": [
            {
                "Sid": "Statement1",
                "Effect": "Allow",
                "Action": [
                    "bedrock:InvokeAgent",
                    "bedrock:InvokeModel"
                ],
                "Resource": [
                    "arn:aws:bedrock:${Region}::foundation-model/amazon.titan-embed-text-v1",
                    "arn:aws:bedrock: ${Region}::foundation-model/anthropic.claude-instant-v1"
                ]
            }
        ]
    }
    

Depending on the AWS Region and model you use, specify those in the Resource section.

  1. Add opensearchservice.amazonaws.com as a trusted entity.
  2. Make a note of the IAM role Amazon Resource name (ARN).
  3. Assign the preceding policy to the IAM user that will create a connector.
  4. Create a passRole policy and assign it to IAM user that will create the connector using Python:
    {
        "Version": "2012-10-17",
        "Statement": [
            {
                "Effect": "Allow",
                "Action": "iam:PassRole",
                "Resource": "arn:aws:iam::${AccountId}:role/OpenSearchBedrock"
            }
        ]
    }
  5. Map the IAM role you created to the OpenSearch Service domain role using the following steps:
    • Log in to the OpenSearch Dashboard and open the Security page from the navigation menu.
    • Choose Roles and select ml_all_access.
    • Choose Mapped Users and Manage Mapping.
    • Under Users, add the ARN of the IAM user you created.

Establish a connection to the Amazon Bedrock model using the MLCommons plugin

In order to identify patterns and relationships, an embedding model transforms input data—such as words or images—into numerical vectors in a continuous space. Similar objects are grouped together to make it easier for AI systems to comprehend and respond to intricate user enquiries.

Semantic search concentrates on the purpose and meaning of a query. OpenSearch stores data in a vector index for retrieval and transforms it into dense vectors (lists of numbers) using text embedding models. We are using amazon.titan-embed-text-v1 hosted on Amazon Bedrock, but you will need to evaluate and choose the right model for your use case. The amazon.titan-embed-text-v1 model maps sentences and paragraphs to a 1,536-dimensional dense vector space and is optimized for the task of semantic search.

Complete the following steps to establish a connection to the Amazon Bedrock model using the MLCommons plugin:

  1. Establish a connection by using the Python client with the connection blueprint.
  2. Modify the values of the host and region parameters in the provided code block. For this example, we’re running the program in Visual Studio Code with Python version 3.9.6, but newer versions should also work.
  3. For the role ARN, use the ARN you created earlier, and run the following script using the credentials of the IAM user you created:
    import boto3
    import requests 
    from requests_aws4auth import AWS4Auth
    
    host = 'https://search-test.us-east-1.es.amazonaws.com/'
    region = 'us-east-1'
    service = 'es'
    credentials = boto3.Session().get_credentials()
    awsauth = AWS4Auth(credentials.access_key, credentials.secret_key, region, service, session_token=credentials.token)
    
    path = '_plugins/_ml/connectors/_create'
    url = host + path
    
    payload = {
      "name": "Amazon Bedrock Connector: embedding",
      "description": "The connector to bedrock Titan embedding model",
      "version": 1,
      "protocol": "aws_sigv4",
      "parameters": {
        "region": "us-east-1",
        "service_name": "bedrock",
        "model": "amazon.titan-embed-text-v1"
      },
      "credential": {
        "roleArn": "arn:aws:iam::<accountID>:role/opensearch_bedrock_external"
      },
      "actions": [
        {
          "action_type": "predict",
          "method": "POST",
          "url": "https://bedrock-runtime.${parameters.region}.amazonaws.com/model/${parameters.model}/invoke",
          "headers": {
            "content-type": "application/json",
            "x-amz-content-sha256": "required"
          },
          "request_body": "{ \"inputText\": \"${parameters.inputText}\" }",
          "pre_process_function": "connector.pre_process.bedrock.embedding",
          "post_process_function": "connector.post_process.bedrock.embedding"
        }
      ]
    }
    
    headers = {"Content-Type": "application/json"}
    
    r = requests.post(url, auth=awsauth, json=payload, headers=headers, timeout=15)
    print(r.status_code)
    print(r.text)
    
  4. Run the Python program. This will return connector_id.
    python3 connect_bedrocktitanembedding.py
    200
    {"connector_id":"nbBe65EByVCe3QrFhrQ2"}
  5. Create a model group against which this model will be registered in the OpenSearch Service domain:
    POST /_plugins/_ml/model_groups/_register
    {
      "name": "embedding_model_group",
      "description": "A model group for bedrock embedding models"
    }

    You get the following output:

    {
      "model_group_id": "1rBv65EByVCe3QrFXL6O",
      "status": "CREATED"
    }
  6. Register a model using connector_id and model_group_id:
    POST /_plugins/_ml/models/_register
    {
        "name": "titan_text_embedding_bedrock",
        "function_name": "remote",
        "model_group_id": "1rBv65EByVCe3QrFXL6O",
        "description": "test model",
        "connector_id": "nbBe65EByVCe3QrFhrQ2",
       "interface": {}
    }

You get the following output:

{
  "task_id": "2LB265EByVCe3QrFAb6R",
  "status": "CREATED",
  "model_id": "2bB265EByVCe3QrFAb60"
}
  1. Deploy a model using the model ID:
POST /_plugins/_ml/models/2bB265EByVCe3QrFAb60/_deploy

You get the following output:

{
  "task_id": "bLB665EByVCe3QrF-slA",
  "task_type": "DEPLOY_MODEL",
  "status": "COMPLETED"
}

Now the model is deployed, and you will see that in OpenSearch Dashboards on the OpenSearch Plugins page.

Create an ingestion pipeline for data indexing

Use the following code to create an ingestion pipeline for data indexing. The pipeline will establish a connection to the embedding model, retrieve the embedding, and then store it in the index.

PUT /_ingest/pipeline/cricket_data_pipeline {
    "description": "batting score summary embedding pipeline",
    "processors": [
        {
            "text_embedding": {
                "model_id": "GQOsUJEByVCe3QrFfUNq",
                "field_map": {
                    "cricket_score": "cricket_score_embedding"
                }
            }
        }
    ]
}

Create an index for storing data

Create an index for storing data (for this example, the cricket achievements of batsmen). This index stores raw text and embeddings of the summary text with 1,536 dimensions and uses the ingest pipeline we created in the previous step.

PUT cricket_data {
    "mappings": {
        "properties": {
            "cricket_score": {
                "type": "text"
            },
            "cricket_score_embedding": {
                "type": "knn_vector",
                "dimension": 1536,
                "space_type": "l2",
                "method": {
                    "name": "hnsw",
                    "engine": "faiss"
                }
            }
        }
    },
    "settings": {
        "index": {
            "knn": "true"
        }
    }
}

Ingest sample data

Use the following code to ingest the sample data for four batsmen:

POST _bulk?pipeline=cricket_data_pipeline
{"index": {"_index": "cricket_data"}}
{"cricket_score": "Sachin Tendulkar, often hailed as the 'God of Cricket,' amassed an extraordinary batting record throughout his 24-year international career. In Test cricket, he played 200 matches, scoring a staggering 15,921 runs at an average of 53.78, including 51 centuries and 68 half-centuries, with a highest score of 248 not out. His One Day International (ODI) career was equally impressive, spanning 463 matches where he scored 18,426 runs at an average of 44.83, notching up 49 centuries and 96 half-centuries, with a top score of 200 not out – the first double century in ODI history. Although he played just one T20 International, scoring 10 runs, his overall batting statistics across formats solidified his status as one of cricket's all-time greats, setting numerous records that stand to this day."}
{"index": {"_index": "cricket_data"}}
{"cricket_score": "Virat Kohli, widely regarded as one of the finest batsmen of his generation, has amassed impressive statistics across all formats of international cricket. As of April 2024, in Test cricket, he has scored over 8,000 runs with an average exceeding 50, including numerous centuries. His One Day International (ODI) record is particularly stellar, with more than 12,000 runs at an average well above 50, featuring over 40 centuries. In T20 Internationals, Kohli has maintained a high average and scored over 3,000 runs. Known for his exceptional ability to chase down targets in limited-overs cricket, Kohli has consistently ranked among the top batsmen in ICC rankings and has broken several batting records throughout his career, cementing his status as a modern cricket legend."}
{"index": {"_index": "cricket_data"}}
{"cricket_score": "Adam Gilchrist, the legendary Australian wicketkeeper-batsman, had an exceptional batting record across formats during his international career from 1996 to 2008. In Test cricket, Gilchrist scored 5,570 runs in 96 matches at an impressive average of 47.60, including 17 centuries and 26 half-centuries, with a highest score of 204 not out. His One Day International (ODI) record was equally remarkable, amassing 9,619 runs in 287 matches at an average of 35.89, with 16 centuries and 55 half-centuries, and a top score of 172. Gilchrist's aggressive batting style and ability to change the course of a game quickly made him one of the most feared batsmen of his era. Although his T20 International career was brief, his overall batting statistics, combined with his wicketkeeping skills, established him as one of cricket's greatest wicketkeeper-batsmen."}
{"index": {"_index": "cricket_data"}}
{"cricket_score": "Brian Lara, the legendary West Indian batsman, had an extraordinary batting record in international cricket during his career from 1990 to 2007. In Test cricket, Lara amassed 11,953 runs in 131 matches at an impressive average of 52.88, including 34 centuries and 48 half-centuries. He holds the record for the highest individual score in a Test innings with 400 not out, as well as the highest first-class score of 501 not out. In One Day Internationals (ODIs), Lara scored 10,405 runs in 299 matches at an average of 40.48, with 19 centuries and 63 half-centuries. His highest ODI score was 169. Known for his elegant batting style and ability to play long innings, Lara's exceptional performances, particularly in Test cricket, cemented his status as one of the greatest batsmen in the history of the game."}

Deploy the LLM for response generation

Use the following code to deploy the LLM for response generation. Modify the values of host, region, and roleArn in the provided code block.

  1. Create a connector by running the following Python program. Run the script using the credentials of the IAM user created earlier.
    import boto3
    import requests 
    from requests_aws4auth import AWS4Auth
    
    host = 'https://search-test.us-east-1.es.amazonaws.com/'
    region = 'us-east-1'
    service = 'es'
    credentials = boto3.Session().get_credentials()
    awsauth = AWS4Auth(credentials.access_key, credentials.secret_key, region, service, session_token=credentials.token)
    
    path = '_plugins/_ml/connectors/_create'
    url = host + path
    
    payload = {
      "name": "BedRock Claude instant-v1 Connector ",
      "description": "The connector to BedRock service for claude model",
      "version": 1,
      "protocol": "aws_sigv4",
      "parameters": {
        "region": "us-east-1",
        "service_name": "bedrock",
        "anthropic_version": "bedrock-2023-05-31",
        "max_tokens_to_sample": 8000,
        "temperature": 0.0001,
        "response_filter": "$.completion"
      },
       "credential": {
            "roleArn": "arn:aws:iam::accountId:role/opensearch_bedrock_external"
        },
      "actions": [
        {
          "action_type": "predict",
          "method": "POST",
          "url": "https://bedrock-runtime.${parameters.region}.amazonaws.com/model/anthropic.claude-instant-v1/invoke",
          "headers": {
            "content-type": "application/json",
            "x-amz-content-sha256": "required"
          },
          "request_body": "{\"prompt\":\"${parameters.prompt}\", \"max_tokens_to_sample\":${parameters.max_tokens_to_sample}, \"temperature\":${parameters.temperature},  \"anthropic_version\":\"${parameters.anthropic_version}\" }"
        }
      ]
     }
        
    
    headers = {"Content-Type": "application/json"}
    
    r = requests.post(url, auth=awsauth, json=payload, headers=headers, timeout=15)
    print(r.status_code)
    print(r.text)

If it ran successfully, it would return connector_id and a 200-response code:

200
{"connector_id":"LhLSZ5MBLD0avmh1El6Q"}
  1. Create a model group for this model:
    POST /_plugins/_ml/model_groups/_register
    {
        "name": "claude_model_group",
        "description": "This is an example description"
    }

This will return model_group_id; make a note of it:

{
  "model_group_id": "LxLTZ5MBLD0avmh1wV4L",
  "status": "CREATED"
}
  1. Register a model using connection_id and model_group_id:
    POST /_plugins/_ml/models/_register
    {
        "name": "anthropic.claude-v1",
        "function_name": "remote",
        "model_group_id": "LxLTZ5MBLD0avmh1wV4L",
        "description": "LLM model",
        "connector_id": "LhLSZ5MBLD0avmh1El6Q",
        "interface": {}
    }
    

It will return model_id and task_id:

{
  "task_id": "YvbVZ5MBtVAPFbeA7ou7",
  "status": "CREATED",
  "model_id": "Y_bVZ5MBtVAPFbeA7ovb"
}
  1. Finally, deploy the model using an API:
POST /_plugins/_ml/models/Y_bVZ5MBtVAPFbeA7ovb/_deploy

The status will show as COMPLETED. That means the model is successfully deployed.

{
  "task_id": "efbvZ5MBtVAPFbeA7otB",
  "task_type": "DEPLOY_MODEL",
  "status": "COMPLETED"
}

Create an agent in OpenSearch Service

An agent orchestrates and runs ML models and tools. A tool performs a set of specific tasks. For this post, we use the following tools:

  • VectorDBTool – The agent use this tool to retrieve OpenSearch documents relevant to the user question
  • MLModelTool – This tool generates user responses based on prompts and OpenSearch documents

Use the embedding model_id in VectorDBTool and LLM model_id in MLModelTool:

POST /_plugins/_ml/agents/_register {
    "name": "cricket score data analysis agent",
    "type": "conversational_flow",
    "description": "This is a demo agent for cricket data analysis",
    "app_type": "rag",
    "memory": {
        "type": "conversation_index"
    },
    "tools": [
        {
            "type": "VectorDBTool",
            "name": "cricket_knowledge_base",
            "parameters": {
                "model_id": "2bB265EByVCe3QrFAb60",
                "index": "cricket_data",
                "embedding_field": "cricket_score_embedding",
                "source_field": [
                    "cricket_score"
                ],
                "input": "${parameters.question}"
            }
        },
        {
            "type": "MLModelTool",
            "name": "bedrock_claude_model",
            "description": "A general tool to answer any question",
            "parameters": {
                "model_id": "gbcfIpEByVCe3QrFClUp",
                "prompt": "\n\nHuman:You are a professional data analysist. You will always answer question based on the given context first. If the answer is not directly shown in the context, you will analyze the data and find the answer. If you don't know the answer, just say don't know. \n\nContext:\n${parameters.cricket_knowledge_base.output:-}\n\n${parameters.chat_history:-}\n\nHuman:${parameters.question}\n\nAssistant:"
            }
        }
    ]
}

This returns an agent ID; take note of the agent ID, which will be used in subsequent APIs.

Query the index

We have batting scores of four batsmen in the index. For the first query, let’s specify the player name:

POST /_plugins/_ml/agents/<agent ID>/_execute {
    "parameters": {
        "question": "What is batting score of Sachin Tendulkar ?"
    }
}

Based on context and available information, it returns the batting score of Sachin Tendulkar. Note the memory_id from the response; you will need it for subsequent questions in the next steps.

We can ask a follow-up question. This time, we don’t specify the player name and expect it to answer based on the earlier question:

POST /_plugins/_ml/agents/<agent ID>/_execute {
    "parameters": {
        "question": " How many T20 international match did he play?",
        "next_action": "then compare with Virat Kohlis score",
        "memory_id": "so-vAJMByVCe3QrFYO7j",
        "message_history_limit": 5,
        "prompt": "\n\nHuman:You are a professional data analysist. You will always answer question based on the given context first. If the answer is not directly shown in the context, you will analyze the data and find the answer. If you don't know the answer, just say don't know. \n\nContext:\n${parameters.population_knowledge_base.output:-}\n\n${parameters.chat_history:-}\n\nHuman:always learn useful information from chat history\nHuman:${parameters.question}, ${parameters.next_action}\n\nAssistant:"
    }
}

In the preceding API, we use the following parameters:

  • Question and Next_action – We also pass the next action to compare Sachin’s score with Virat’s score.
  • Memory_id – This is memory assigned to this conversation. Use the same memory_id for subsequent questions.
  • Prompt – This is the prompt you give to the LLM. It includes the user’s question and the next action. The LLM should answer only using the data indexed in OpenSearch and must not invent any information. This way, you prevent hallucination.

Refer to ML Model tool for more details about setting up these parameters and the GitHub repo for blueprints for remote inferences.

The tool stores the conversation history of the questions and answers in the OpenSearch index, which is used to refine answers by asking follow-up questions.

In real-world scenarios, you can map memory_id against the user’s profile to preserve the context and isolate the user’s conversation history.

We have demonstrated how to create a conversational search application using the built-in features of OpenSearch Service.

Clean up

To avoid incurring future charges, delete the resources created while building this solution:

  1. Delete the OpenSearch Service domain.
  2. Delete the connector.
  3. Delete the index.

Conclusion

In this post, we demonstrated how to use OpenSearch agents and tools to create a RAG pipeline with conversational search. By integrating with ML models, vectorizing questions, and interacting with LLMs to improve prompts, this configuration oversees the entire process. This method allows you to quickly develop AI assistants that are ready for production without having to start from scratch.

If you’re building a RAG pipeline with conversational history to let users ask follow-up questions for more refined answers, give it a try and share your feedback or questions in the comments!


About the author

Bharav Patel is a Specialist Solution Architect, Analytics at Amazon Web Services. He primarily works on Amazon OpenSearch Service and helps customers with key concepts and design principles of running OpenSearch workloads on the cloud. Bharav likes to explore new places and try out different cuisines.

Enhance stability with dedicated cluster manager nodes using Amazon OpenSearch Service

Post Syndicated from Chinmayi Narasimhadevara original https://aws.amazon.com/blogs/big-data/enhance-stability-with-dedicated-cluster-manager-nodes-using-amazon-opensearch-service/

Amazon OpenSearch Service is a managed service that you can use to secure, deploy, and operate OpenSearch clusters at scale in the AWS Cloud. With OpenSearch Service, you can configure clusters with different types of node options such as data nodes, dedicated cluster manager nodes, dedicated coordinator nodes, and UltraWarm nodes. When configuring your OpenSearch Service domain, you can exercise different node options to manage your cluster’s overall stability, performance, and resiliency.

In this post, we show how to enhance the stability of your OpenSearch Service domain with dedicated cluster manager nodes and how using these in deployment enhances your cluster’s stability and reliability.

The benefit of dedicated cluster manager nodes

A dedicated cluster manager node handles the behind-the-scenes work of running an OpenSearch Service cluster, but it doesn’t store actual data or process search requests. In the absence of dedicated cluster manager nodes, OpenSearch Service will use data nodes for cluster management; combining these responsibilities on the data nodes can impact performance and stability because data operations (like indexing and searching) compete with critical cluster management tasks for computing resources. The dedicated cluster manager node is responsible for several key tasks: monitoring and keeping track of all the data nodes in the cluster, knowing how many indexes and shards there are and where they’re located, and routing data to the correct places. They also update and share the cluster state whenever something changes, like creating an index or adding and removing nodes. The problem, however, is that when traffic gets heavy, the cluster manager node can get overloaded and become unresponsive. If this happens, your cluster will not respond to write requests until it elects a new cluster manager, at which point the cycle might repeat itself. You can alleviate this issue by deploying dedicated cluster manager instances, whereby this separation of duties between the manager node and the data nodes results in a much more stable cluster.

Calculating the number of dedicated cluster manager nodes

In OpenSearch Service, a single node is elected as the cluster manager from all eligible nodes through a quorum-based voting process, confirming consensus before taking on the responsibility of coordinating cluster-wide operations and maintaining the cluster’s state. Quorum is the minimum number of nodes that need to agree before the cluster makes important decisions. It helps keep your data consistent and your cluster running smoothly. When you use dedicated cluster manager nodes, only those nodes are eligible for election and OpenSearch Service sets the quorum to half of the nodes, rounded down to the nearest whole number, plus one. One dedicated cluster manager node is explicitly prohibited by OpenSearch Service because you have no backup in the event of a failure. Using three dedicated cluster manager nodes makes sure that even if one node fails, the remaining two can still reach a quorum and maintain cluster operations. We recommend three dedicated cluster manager nodes for production use cases. Multi-AZ with standby is an OpenSearch Service feature designed to deliver four 9s of availability using a third AWS Availability Zone as a standby. When you use Multi-AZ with standby, the service requires three dedicated cluster manager nodes. If you deploy with Multi-AZ without standby or Single-AZ, we still recommend three dedicated cluster manager nodes. It provides two backup nodes in the event of one cluster manager node failure and the necessary quorum (two) to elect a new manager. You can choose three or five dedicated cluster manager nodes.

Having five dedicated cluster manager nodes works as well as three, and you can lose two nodes while maintaining a quorum. But because only one dedicated cluster manager node is active at any given time, this configuration means you pay for four idle nodes.

Cluster manager node configurations for different domain creation methods

This section explains the resources each domain creation method and template deploy when you set up an OpenSearch Service domain.

With the Easy create option, you can quickly create a domain using ‘multi-AZ with standby’ for high availability three-cluster manager nodes distributed across three Availability Zones. The following table summarizes the configuration.

Domain Creation Method Output
Easy Create

Dedicated cluster manager node: Yes

Number of cluster manager nodes: 3

Availability Zones: 3

Standby: Yes

The Standard create option provides templates for ‘Production’ and ‘Dev/test’workloads. Both templates come with a Domain with standby and a Domain without standby deployment choice. The following table summarizes these configuration options.

Domain Creation Method Template Deployment Option Output
Standard Create Production Domain with standby

Requires dedicated cluster manager node

Number of cluster manager nodes: 3

Availability Zones: 3

Standby: Yes

Instance type choice: Yes

Standard create Production Domain without standby

Requires dedicated cluster manager node

Number of cluster manager nodes: 3, 5

Availability Zones: 3

Standby: No

Instance type choice: Yes

Standard Create Dev/test Domain with standby

Requires dedicated cluster manager node

Number of cluster manager nodes: 3

Availability Zones: 3

Standby: Yes

Instance type choice: Yes

Standard create Dev/test Domain without standby Does not require dedicated cluster manager node

Choosing a dedicated cluster manager instance type

Dedicated cluster manager instances typically handle critical cluster operations like shard distribution and index management and track cluster state changes. It’s recommended to select a comparatively smaller instance type. Refer to Choosing instance types for dedicated master nodes for more information on instance types for dedicated cluster manager nodes.

You should expect to occasionally adjust cluster manager instance size and type as your workload evolves over time. As with all scale questions, you need to monitor performance and make sure you have enough CPU and Java virtual machine (JVM) heap for your dedicated cluster managers. We recommend using Amazon CloudWatch alarms to monitor the following CloudWatch metrics, and adjust according to the alarm state:

  • ManagerCPUUtilization – Maximum is greater than or equal to 50% for 15 minutes, three consecutive times
  • ManagerJVMMemoryPressure – Maximum is greater than or equal to 95% for 1 minute, three consecutive times

Conclusion

Dedicated cluster manager nodes provide added stability and protection against split-brain situations, can be of a different instance type than data nodes, and are an obvious benefit when OpenSearch Service is backing mission-critical applications for production workloads. They are typically not required for development workloads like proof of concept because the cost of running a dedicated cluster manager node exceeds the tangible benefits of keeping the cluster up and running. To learn more about OpenSearch best practices, see link.


About the authors

Imtiaz (Taz) Sayed is the WW Tech Leader for Analytics at AWS. He enjoys engaging with the community on all things data and analytics. He can be reached through LinkedIn.

Chinmayi Narasimhadevara is a Senior Solutions Architect focused on Data Analytics and AI at AWS. She helps customers build advanced, highly scalable, and performant solutions.

Kaltura reduces observability operational costs by 60% with Amazon OpenSearch Service

Post Syndicated from Ido Ziv original https://aws.amazon.com/blogs/big-data/kaltura-reduces-observability-operational-costs-by-60-with-amazon-opensearch-service/

This post is co-written with Ido Ziv from Kaltura.

As organizations grow, managing observability across multiple teams and applications becomes increasingly complex. Logs, metrics, and traces generate vast amounts of data, making it challenging to maintain performance, reliability, and cost-efficiency.

At Kaltura, an AI-infused video-first company serving millions of users across hundreds of applications, observability is mission-critical. Understanding system behavior at scale isn’t just about troubleshooting—it’s about providing seamless experiences for customers and employees alike. But achieving effective observability at this scale comes with challenges: managing spans; correlating logs, traces, and events across distributed systems; and maintaining visibility without overwhelming teams with noise. Balancing granularity, cost, and actionable insights requires constant tuning and thoughtful architecture.

In this post, we share how Kaltura transformed its observability strategy and technological stack by migrating from a software as a service (SaaS) logging solution to Amazon OpenSearch Service—achieving higher log retention, a 60% reduction in cost, and a centralized platform that empowers multiple teams with real-time insights.

Observability challenges at scale

Kaltura ingests over 8TB of logs and traces daily, processing more than 20 billion events across 6 production AWS Regions and over 200 applications—with log spikes reaching up to 6 GB per second. This immense data volume, combined with a highly distributed architecture, created significant challenges in observability. Historically, Kaltura relied on a SaaS-based observability solution that met initial requirements but became increasingly difficult to scale. As the platform evolved, teams generated disparate log formats, applied retention policies that no longer reflected data value, and operated more than 10 organically grown observability sources. The lack of standardization and visibility required extensive manual effort to correlate data, maintain pipelines, and troubleshoot issues – leading to rising operational complexity and fixed costs that didn’t scale efficiently with usage.

Kaltura’s DevOps team recognized the need to reassess their observability solution and began exploring a variety of options, from self-managed platforms to fully managed SaaS offerings. After a comprehensive evaluation, they made the strategic decision to migrate to OpenSearch Service, using its advanced features such as Amazon OpenSearch Ingestion, the Observability plugin, UltraWarm storage, and Index State Management.

Solution overview

Kaltura created a new AWS account that would be a dedicated observability account, where OpenSearch Service was deployed. Logs and traces were collected from different accounts and producers such as microservices on Amazon Elastic Kubernetes Service (Amazon EKS) and services running on Amazon Elastic Compute Cloud (Amazon EC2).

By using AWS services such as AWS Identity and Access Management (IAM), AWS Key Management Service (AWS KMS), and Amazon CloudWatch, Kaltura was able to meet the standards to create a production-grade system while keeping security and reliability in mind. The following figure shows a high-level design of the environment setup.

Ingestion

As seen in the following diagram, logs are shipped using log shippers, also known as collectors. In Kaltura’s case, they used Fluent Bit. A log shipper is a tool designed to collect, process, and transport log data from various sources to a centralized location, such as log analytics platforms, management systems, or an aggregator system. Fluent Bit was used in all sources and also provided light processing abilities. Fluent Bit was deployed as a daemonset in Kubernetes. The application development teams didn’t change their code, because the Fluent Bit pods were reading the stdout of the application pods.

The following code is an example of FluentBit configurations for Amazon EKS:

[INPUT]
   Name                tail
   Path                /var/log/containers/*.log
   Tag                 kube.*
   Skip_Long_Lines     On
   multiline.parser    docker, cri
[FILTER]
   alias               k8s
   # kubernetes filter to parse all logs
   Name                kubernetes
   Match               kube.*
   Kube_Tag_Prefix     kube.var.log.containers.
   Annotations         On
   Labels              Off
   Merge_Log           On
   Keep_Log            Off
   Kube_URL            https://kubernetes.default.svc.cluster.local:443 
[FILTER]
   alias               apps
   Name                rewrite_tag
   Match               kube.*
   Rule                $kubernetes['annotations']['kaltura.com/observability'] ^apps$ 
[OUTPUT]
   Name                http
   Match               apps.*
   Alias               apps
   Host                xxxxx.us-east-1.osis.amazonaws.com
   Port                443
   URI                 /log/apps
   Format              json
   aws_auth            true
   aws_region          us-east-1
   aws_service         osis
   aws_role_arn        arn:aws:iam::xxxxx:role/osis-ingestion-role
   Log_Level           trace
   tls On

Spans and traces were collected directly from the application layer using a seamless integration approach. To facilitate this, Kaltura deployed an OpenTelemetry Collector (OTEL) using the OpenTelemetry Operator for Kubernetes. Additionally, the team developed a custom OTEL code library, which was incorporated into the application code to efficiently capture and log traces and spans, providing comprehensive observability across their system.

Data from Fluent Bit and OpenTelemetry Collector was sent to OpenSearch Ingestion, a fully managed, serverless data collector that delivers real-time log, metric, and trace data to OpenSearch Service domains and Amazon OpenSearch Serverless collections. Each producer sent data to a specific pipeline, one for logs and one for traces, where data was transformed, aggregated, enriched, and normalized before being sent to OpenSearch Service. The trace pipeline used the otel_trace and service_map processors, while using the OpenSearch Ingestion OpenTelemetry trace analytics blueprint.

The following code is an example of the OpenSearch Ingestion pipeline for logs:

version: "2"
entry-pipeline:
 source:
   http:
     path: "/log/apps"

 processor:
   - add_entries:
       entries:
       - key: "log_type"
         value: "default"
       - key: "log_type"
         value: "api"
         add_when: 'contains(/filename, "api.log")'
         overwrite_if_key_exists: true
       - key: "log_type"
         value: "stats"
         add_when: 'contains(/filename, "stats.log")'
         overwrite_if_key_exists: true
       - key: "log_type"
         value: "event"
         add_when: 'contains(/filename, "event.log")'
         overwrite_if_key_exists: true
       - key: "log_type"
         value: "login"
         add_when: 'contains(/filename, "login.log")'
         overwrite_if_key_exists: true

   - grok:
       grok_when: '/log_type == "api"'
       match:
         log: ['^\[%%{DATA:timestamp}] \[%%{DATA:logIp}\] \[%%{DATA:host}\] \[%%{WORD:id}\] %%{WORD:priorityName}\(%%{NUMBER:priority}\): \[memory: %%{DATA:memory} MB, real: %%{DATA:real}MB\] %%{GREEDYDATA:message}']

   - date:
       match:
         - key: timestamp
           patterns: ["dd-MMM-yyyy HH:mm:ss", "dd/MMM/yyyy:HH:mm:ss Z", "EEE MMM dd HH:mm:ss.SSSSSS yyyy"]

       destination: "@timestamp"
       output_format: "yyyy-MM-dd'T'HH:mm:ss"

   - rename_keys:
       entries:
       - from_key: "timestamp"
         to_key: "@timestamp"
         overwrite_if_to_key_exists: false
       - from_key: "date"
         to_key: "@timestamp"
         overwrite_if_to_key_exists: false

   - drop_events:
       drop_when: 'contains(/filename, "simplesamlphp.log")'


 sink:
   - opensearch:
       hosts: ["${opensearch_host}"]
       index: '$${/env}-api-$${/log_type}-app-logs'
       index_type: custom
       action: create
       bulk_size: 20
       aws:
         sts_role_arn: ${sts_role_arn}
         region:  ${region}
       dlq:
         s3:
           bucket: "${bucket}"
           key_path_prefix: 'my-app-dlq-files'
           region: "${region}"
           sts_role_arn: "${sts_role_arn}"

The preceding example shows the use of processors such as grok, date, add_entries, rename_keys, and drop_events:

  • add_entries:
    • Adds a new field log_type based on filename
    • Default: “default”
    • If the filename contains specific substrings (such as api.log or stats.log), it assigns a more specific type
  • grok:
    • Applies Grok parsing to logs of type “api”
    • Extracts fields like timestamp, logIp, host, priorityName, priority, memory, real, and message using a custom pattern
  • date:
    • Parses timestamp strings into a standard datetime format
    • Stores it in a field called @timestamp based on ISO8601 format
    • Handles multiple timestamp patterns
  • rename_keys:
    • timestamp or date are renamed into @timestamp
    • Does not overwrite if @timestamp already exists
  • drop_events:
    • Drops logs where filename contains simplesamlphp.log
    • This is a filtering rule to ignore noisy or irrelevant logs

The following is an example of the input of a log line:

   "log": "[25-Mar-2025 18:23:18] [127.0.0.1] [the-most-awesome-server-in-kaltura] [67e2f496cc321] INFO(6): [memory: 4.51 MB, real: 6MB] [request: 1] [time: 0.0263s / total: 0.0263s]",

After processing, we get the following code:

    "log_type": "api",
    "priorityName": "INFO",
    "memory": "4.51",
    "host": "the-most-awesome-server-in-kaltura",
    "real": "6",
    "priority": "6",
    "message": "[request: 1] [time: 0.0263s / total: 0.0263s]",
    "logIp": "127.0.0.1",
    "id": "67e2f496cc321",
    "@timestamp": "2025-03-25T18:23:18"

Kaltura followed some OpenSearch Ingestion best practices, such as:

  • Including a dead-letter queue (DLQ) in pipeline configuration. This can significantly help troubleshoot pipeline issues.
  • Starting and stopping pipelines to optimize cost-efficiency, when possible.
  • During the proof of concept stage:
    • Installing Data Prepper locally for faster development iterations.
    • Disabling persistent buffering to expedite blue-green deployments.

Achieving operational excellence with efficient log and trace management

Logs and traces play a vital role in identifying operational issues, but they come with unique challenges. First, they represent time series data, which inherently evolves over time. Second, their value typically diminishes as time passes, making efficient management crucial. Third, they are append-only in nature. With OpenSearch, Kaltura faced distinct trade-offs between cost, data retention, and latency. The goal was to make sure valuable data remained accessible to engineering teams with minimal latency, but the solution also needed to be cost-effective. Balancing these factors required thoughtful planning and optimization.

Data was ingested to OpenSearch data streams, which simplifies the process of ingesting append-only time series data. Several Index State Management (ISM) policies were applied to different data streams, which were dependent on log retention requirements. ISM policies handled moving indexes from hot storage to UltraWarm, and eventually deleting the indexes. This allowed a customizable and cost-effective solution, with low latency for querying new data and reasonable latency for querying historical data.

The following example ISM policy makes sure indexes are managed efficiently, rolled over, and moved to different storage tiers based on their age and size, and eventually deleted after 60 days. If an action fails, it is retried with an exponential backoff strategy. In case of failures, notifications are sent to relevant teams to keep them informed.

{
    "id": "retention",
    "policy": {
        "description": "production ISM",
        },
        "default_state": "hot",
        "states": [
            {
                "name": "hot",
                "actions": [
                    {
                        "retry": {
                            "count": 5,
                            "backoff": "exponential",
                            "delay": "1h"
                        },
                        "rollover": {
                            "min_primary_shard_size": "30gb",
                            "copy_alias": false
                        }
                    }
                ],
                "transitions": [
                    {
                        "state_name": "warm",
                        "conditions": {
                            "min_index_age": "2d"
                        }
                    }
                ]
            },
            {
                "name": "warm",
                "actions": [
                    {
                        "retry": {
                            "count": 5,
                            "backoff": "exponential",
                            "delay": "1h"
                        },
                        "warm_migration": {}
                    }
                ],
                "transitions": [
                    {
                        "state_name": "cold",
                        "conditions": {
                            "min_index_age": "14d"
                        }
                    }
                ]
            },
            {
                "name": "cold",
                "actions": [
                    {
                        "retry": {
                            "count": 5,
                            "backoff": "exponential",
                            "delay": "1h"
                        },
                        "cold_migration": {
                            "start_time": null,
                            "end_time": null,
                            "timestamp_field": "@timestamp",
                            "ignore": "none"
                        }
                    }
                ],
                "transitions": [
                    {
                        "state_name": "delete",
                        "conditions": {
                            "min_index_age": "60d"
                        }
                    }
                ]
            },
            {
                "name": "delete",
                "actions": [
                    {
                        "retry": {
                            "count": 3,
                            "backoff": "exponential",
                            "delay": "1m"
                        },
                        "cold_delete": {}
                    }
                ],
                "transitions": []
            }
        ],
        "ism_template": [
            {
                "index_patterns": [
                    "*-logs"
                ],
                "priority": 50,
            }
        ]
    }
}

To create a data stream in OpenSearch, a definition of index template is required, which configures how the data stream and its backing indexes will behave. In the following example, the index template specifies key index settings such as the number of shards, replication, and refresh interval—controlling how data is distributed, replicated, and refreshed across the cluster. It also defines the mappings, which describe the structure of the data—what fields exist, their types, and how they should be indexed. These mappings make sure the data stream knows how to interpret and store incoming log data efficiently. Finally, the template enables the @timestamp field as the time-based field required for a data stream.

{
  "index_patterns": [
    "*my-app-logs"
  ],
  "template": {
    "settings": {
      "index.number_of_shards": "32",
      "index.number_of_replicas": "0",
      "index.refresh_interval": "60s"
    },
    "mappings": {
      "properties": {
        "priorityName": {
          "type": "keyword"
        },
        "log_type": {
          "type": "keyword"
        },
        "@timestamp": {
          "type": "date"
        },
        "memory": {
          "type": "float"
        },
        "host": {
          "type": "keyword"
        },
        "pid": {
          "type": "keyword"
        },
        "real": {
          "type": "float"
        },
        "env": {
          "type": "keyword"
        },
        "message": {
          "type": "text"
        },
        "priority": {
          "type": "integer"
        },
        "logIp": {
          "type": "ip"
        }
      }
    }
  },
  "composed_of": [],
  "priority": "100",
  "_meta": {
    "flow": "simple"
  },
  "data_stream": {
    "timestamp_field": {
      "name": "@timestamp"
    }
  },
  "name": "my-app-logs"
}

Implementing role-based access control and user access

The new observability platform is accessed by many types of users; internal users log in to OpenSearch Dashboards using SAML-based federation with Okta. The following diagram illustrates the user flow.

Each user accesses the dashboards to view observability items relevant to their role. Fine-grained access control (FGAC) is enforced in OpenSearch using built-in IAM role and SAML group mappings to implement role-based access control (RBAC).When users log in to the OpenSearch domain, they are automatically routed to the appropriate tenant based on their assigned role. This setup makes sure developers can create dashboards tailored to debugging within development environments, and support teams can build dashboards focused on identifying and troubleshooting production issues. The SAML integration alleviates the need to manage internal OpenSearch users entirely.

For each role in Kaltura, a corresponding OpenSearch role was created with only the necessary permissions. For instance, support engineers are granted access to the monitoring plugin to create alerts based on logs, whereas QA engineers, who don’t require this functionality, are not granted that access.

The following screenshot shows the role of the DevOps engineers defined with cluster permissions.

These users are routed to their own dedicated DevOps tenant, to which they only have write access. This makes it possible for different users from different roles in Kaltura to create the dashboard items that focus on their priorities and needs. OpenSearch supports backend role mapping; Kaltura mapped the Okta group to the role so when a user logs in from Okta, they automatically get assigned based on their role.

This also works with IAM roles to facilitate automations in the cluster using external services, such as OpenSearch Ingestion pipelines, as can be seen in the following screenshot.

Using observability features and service mapping for enhanced trace and log correlation

After a user is logged in, they can use the Observability plugins, view surrounding events in logs, correlate logs and traces, and use the Trace Analytics plugin. Users can inspect traces and spans, and group traces with latency information using built-in dashboards. Users can also drill down to a specific trace or span and correlate it back to log events. The service_map processor used in OpenSearch Ingestion sends OpenTelemetry data to create a distributed service map for visualization in OpenSearch Dashboards.

Using the combined signals of traces and spans, OpenSearch discovers the application connectivity and maps them to a service map.

After OpenSearch ingests the traces and spans from Otel, they are aggregated to groups according to paths and trends. Durations are also calculated and presented to the user over time.

With a trace ID, it’s possible to filter out all the relevant spans by the service and see how long each took, identifying issues with external services such as MongoDB and Redis.

From the spans, users can discover the relevant logs.

Post-migration enhancements

After the migration, a strong developer community emerged within Kaltura that embraced the new observability solution. As adoption grew, so did requests for new features and enhancements aimed at improving the overall developer experience.

One key improvement was extending log retention. Kaltura achieved this by re-ingesting historical logs from Amazon Simple Storage Service (Amazon S3) using a dedicated OpenSearch Ingestion pipeline with Amazon S3 read permissions. With this enhancement, teams can access and analyze logs from up to a year ago using the same familiar dashboards and filters.

In addition to monitoring EKS clusters and EC2 instances, Kaltura expanded its observability stack by integrating more AWS services. Amazon API Gateway and AWS Lambda were introduced to support log ingestion from external vendors, allowing for seamless correlation with existing data and broader visibility across systems.

Finally, to empower teams and promote autonomy, data stream templates and ISM policies are managed directly by developers within their own repositories. By using infrastructure as code tools like Terraform, developers can define index mappings, alerts, and dashboards as code—versioned in Git and deployed consistently across environments.

Conclusion

Kaltura successfully implemented a smart log retention strategy, extending real time retention from 5 days for all log types to 30 days for critical logs, while maintaining cost-efficiency through the use of UltraWarm nodes. This approach led to a 60% reduction in costs compared to their previous solution. Additionally, Kaltura consolidated their observability platform, streamlining operations by merging 10 separate systems into a unified, all-in-one solution. This consolidation not only improved operational efficiency but also sparked increased engagement from developer teams, driving feature requests, fostering internal design collaborations, and attracting early adopters for new enhancements. If Kaltura’s journey has inspired you and you’re thinking about implementing a similar solution in your organization, consider these steps:


About the authors

Ido Ziv is a DevOps team leader in Kaltura with over 6 years of experience. His hobbies include sailing and Kubernetes (but not at the same time).

Roi Gamliel is a Senior Solutions Architect helping startups build on AWS. He is passionate about the OpenSearch Project, helping customers fine-tune their workloads and maximize results.

Yonatan Dolan is a Principal Analytics Specialist at Amazon Web Services. He is located in Israel and helps customers harness AWS analytical services to use data, gain insights, and derive value.

Amazon OpenSearch Service 101: Create your first search application with OpenSearch

Post Syndicated from Sriharsha Subramanya Begolli original https://aws.amazon.com/blogs/big-data/amazon-opensearch-service-101-create-your-first-search-application-with-opensearch/

Organizations today face the challenge of managing and deriving insights from an ever-expanding universe of data in real time. Industrial Internet of Things (IoT) sensors stream millions of temperature, pressure, and performance metrics from field equipment every second. Ecommerce platforms need to surface relevant products from vast catalogs instantly. Security teams must analyze system logs in real time to detect threats. As data volumes grow, organizations increasingly struggle with fragmented monitoring tools that create critical visibility gaps and slow incident response times. The cost of commercial observability solutions becomes prohibitive, forcing teams to manage multiple separate tools and increasing both operational overhead and troubleshooting complexity. Across these diverse scenarios, the ability to efficiently search, analyze, and visualize data in real time has become crucial for business success.

Amazon OpenSearch Service addresses these challenges by providing a fully managed search and analytics service. This managed service configures, manages, and scales OpenSearch clusters so you can focus on your search workloads and end customers. Amazon OpenSearch Serverless further makes it straightforward to run search and log analytics workloads by automatically scaling compute and storage resources up and down to match your application’s demands—with no infrastructure to manage. Whether you’re processing continuous streams of IoT telemetry, enabling product discovery, or performing security analytics, OpenSearch Service scales to meet your needs.

In this post, we walk you through a search application building process using Amazon OpenSearch Service. Whether you’re a developer new to search or looking to understand OpenSearch fundamentals, this hands-on post shows you how to build a search application from scratch—starting with the initial setup; diving into core components such as indexing, querying, result presentation; and culminating in the execution of your first search query.

Components of OpenSearch Service

Before building your first search application, it’s important to understand some key architectural components in OpenSearch. The fundamental unit of information in OpenSearch is a document stored in JSON format. These documents are organized into indices—collections of related documents that function similar to database tables. When you search for information, OpenSearch queries these indices to find matching documents.

OpenSearch operates on a distributed architecture where multiple servers, called nodes, work together in a cluster or domain. Each cluster can utilize dedicated master nodes that focus solely on cluster management tasks, such as maintaining cluster state, managing indices, and orchestrating shard allocation. These specialized nodes enhance cluster stability by offloading cluster management duties from data nodes. Data nodes, on the other hand, handle the storage, indexing, and querying of data—essentially performing the heavy lifting of data operations. Together, they provide scalability, availability, and efficient data processing in the cluster. Configure dedicated coordinator nodes that specialize in routing and distributing search and indexing requests across the cluster. These nodes reduce the load on data nodes, which allows them to focus on data storage, indexing, and search operations.

Coordinator nodes in OpenSearch are most beneficial in the following scenarios:

  1. Large cluster deployments – When managing substantial data volumes across many nodes.
  2. Query-intensive workloads – For environments handling frequent search queries or aggregations, especially those with complex date histograms or multiple aggregations, benefit from faster query processing.
  3. Heavy dashboard utilizationOpenSearch Dashboards can be resource-intensive. Offloading this responsibility to dedicated coordinator nodes reduces the strain on data nodes.

To manage large datasets efficiently, OpenSearch splits indices into smaller pieces called shards. Each shard is distributed across the cluster, with a recommended size of 10–50 GB for optimal performance. For reliability and high availability, OpenSearch maintains replica copies of these shards on different nodes, which means that your data remains accessible even if some nodes fail.

Search operations in OpenSearch are powered by inverted indices, a data structure that maps terms to the documents containing them. The BM25 ranking algorithm helps make sure that search results are relevant to users’ queries. Although searches happen in near real time, with configurable refresh intervals, individual document retrievals are immediate.

This architecture provides the foundation for handling high-volume IoT data streams, complex full-text search operations, and real-time analytics, all while maintaining fault tolerance. Understanding these components will help you make informed decisions as you build your search application.OpenSearch Dashboards is a visualization and analytics tool for exploring, analyzing, and visualizing data in real time. It provides an intuitive interface for querying, monitoring, and reporting on OpenSearch data using visualizations such as charts, graphs, and maps. Key features include interactive dashboards, alerting, anomaly detection, security monitoring, and trace analytics.

Sample Amazon OpenSearch Service tutorial application overview

The following architecture diagram demonstrates how to build and deploy a scalable, fully managed search application on Amazon Web Services (AWS). The architecture uses Amazon OpenSearch Service for indexing and searching data. The UI application is deployed on AWS App Runner and interacts with Amazon OpenSearch Service through secure serverless Amazon API Gateway and AWS Lambda.

Scope of Solution

Here is the end-to-end workflow for our application detailing how user requests are handled from initial access through to data retrieval or indexing:

  1. Users access the application through AWS App Runner, which hosts the frontend interface.
  2. Amazon Cognito handles user authentication and authorization for secure access to the application.
  3. When users interact with the application, their requests are sent to API Gateway. API Gateway communicates with Amazon Cognito to verify user authentication status. It serves as the primary entry point for all API operations and routes the requests appropriately. It forwards requests to Lambda functions within the virtual private cloud (VPC).
  4. Lambda functions process the requests, performing either:
  5. Data indexing operations into OpenSearch Service
  6. Search queries against the OpenSearch Service cluster
  7. The OpenSearch Service cluster resides within a private subnet in a VPC for enhanced security.

Prerequisites

Before you deploy the solution, review the prerequisites.

Install the sample app

The entire infrastructure is deployed using AWS Cloud Development Kit (AWS CDK), with cluster configurations customizable through the cdk.json file on GitHub. This deployment approach provides consistent and repeatable infrastructure creation while maintaining security best practices. The steps to deploy this infrastructure are available in this README file. After deployment, you’ll access a comprehensive search application built with Cloudscape React components that includes:

  1. Interactive search functionality – Test various OpenSearch query methods including prefix match keyword searches, phrase matching, fuzzy searches, and field-specific queries against the sample product dataset
  2. Document management tools – Bulk index the product catalog with a single click or delete and recreate the index as needed for testing purposes
  3. Educational resources – Access embedded guides explaining OpenSearch concepts, query syntax, and best practices

Index the documents

After you’ve deployed this search application, the first step is to index some documents into OpenSearch Service. Sign in to the search application UI and follow these steps:

  1. To trigger a bulk index process, under Index Documents in the navigation pane, choose Bulk Index Product Catalog.
  2. Choose Index Product catalog, as shown in the following screenshot.

The Lambda function indexes a comprehensive ecommerce product catalog into your newly created OpenSearch Service cluster. This sample dataset includes detailed fashion and lifestyle products spanning multiple categories. Each product record contains rich metadata, including title, detailed description, category, color, and price.

Bulk Index Process

Keyword searches

OpenSearch Service offers multiple search features. For an exhaustive list, refer to Search features. We focus on a few keyword search types to help you get started with OpenSearch.

With the product catalog in OpenSearch, you can perform prefix searches through the search application’s intuitive interface. To better understand the search functionality, expand the Guide section at the top of the interface. This interactive guide explains how various kinds of searches work, complete with a practical example in context of the product catalog dataset. The guide includes best practices and a link to the detailed documentation to help you make the most of OpenSearch’s powerful query capabilities.

You can do a prefix search on any of the three key search fields: Title, Description, or Color.

A typical prefix match query looks like this:

{
  "query": {
    "match_phrase_prefix": {
      "attribute_name": {
        "query": "attribute_value",
        "max_expansions": 10,
        "slop": 1
      }
    }
  }
}

You can use this query pattern to find documents where specific fields begin with your search term, offering an intuitive “starts with” search experience.

The following image illustrates a practical example of the Prefix Match search. Entering “Ru” in the title field matches products with titles such as “Running”, “Runners” and “Ruby.” Prefix Match search is particularly useful when users only remember the beginning of a product name or are searching across multiple variations or simply exploring product categories.

Prefix Match example

Multi Match search enables searching across multiple fields simultaneously. For example, you can search for “Coral” across product title, description, and color fields simultaneously. The search query can be customized using field boosting in which matches in certain fields carry more weight than others.

A typical multi match query looks like this:

{
  "query": {
    "multi_match": {
      "query": "Coral",
      "fields": [
        "title^3",
        "description",
        "color"
      ],
      "type": "best_fields"
    }
  }
}

You can explore Wildcard Match, Range Filter, and other search features through the search application. For developers and administrators managing this search infrastructure, OpenSearch Dashboards is a native, developer-friendly interface for indexing, searching, and managing your data. It serves as a comprehensive control center where you can interact directly with your indices, test queries, and monitor performance in real time. The following screenshot shows OpenSearch Dashboards which provides an interactive UI to explore, analyze and visualize search and log data.

OpenSearch Dashboards

While our example demonstrates lexical search functionality on a sample product catalog, OpenSearch Service is equally powerful for observability usecases. When handling time-series data from logs, metrics, or traces, OpenSearch excels at real-time analytics and visualization. For instance, DevOps teams can index application logs and system telemetry data, then use date histograms and statistical aggregations to identify performance bottlenecks or security anomalies as they occur. This real-time search allows IT teams to detect and respond to incidents with minimal delay. Using OpenSearch Dashboards, teams can create live operational dashboards that update automatically as new data streams in. For IoT applications monitoring thousands of sensors, this means temperature anomalies or equipment failures can trigger immediate alerts through OpenSearch’s alerting capabilities. These observability workloads benefit from the same distributed architecture that powers our product search example, with the added advantage of time-series optimized indices and retention policies for managing high-volume streaming data efficiently.

Beyond search management, you can configure alerts for specific conditions, set up notification channels for operational events, and enable data discovery features. If you want to experiment with the same search queries we implemented in our application, you can launch OpenSearch Dashboards and use relevant index and search APIs from the Dev Tools section, which is an ideal environment for developing and testing before implementing in your production application. Because our OpenSearch Service cluster resides within a private subnet, you need to create a Secure Shell (SSH) tunnel to access the dashboard. For more information and steps to do this, refer to How do I use an SSH tunnel to access OpenSearch Dashboards with Amazon Cognito authentication from outside a VPC? in the Knowledge Center. So far, we’ve explored OpenSearch’s query domain-specific language (DSL). However, for those coming in from a traditional database background, OpenSearch also offers SQL and Piped Processing Language (PPL) functionality, making the transition smoother. You can explore more on this at SQL and PPL in the OpenSearch documentation.

In this post, we introduced you to different types of keyword searches. You can also store documents as vector embeddings in OpenSearch and use it for semantic search, hybrid search, multimodal search, or to implement Retrieval Augmented Generation (RAG) pattern.

Conclusion

You can now build sample search applications by following the steps outlined in this post and the implementation details available at sample-for-amazon-opensearch-service-tutorials-101 on GitHub. By using the distributed architecture of Amazon OpenSearch Service, an AWS managed service, you get fast, scalable search capabilities that grow with your business, built-in security and compliance controls, and automated cluster management—all with pay-only-for-what-you-use pricing flexibility.

Ready to learn more? Check out the Amazon OpenSearch Service Developer Guide. For more insights, best practices and architectures, and industry trends, refer to Amazon OpenSearch Service blog posts and hands-on workshops at AWS Workshops. Please also visit the OpenSearch Service Migration Hub if you are ready to migrate legacy or self-managed workloads to OpenSearch Service.

We hope this detailed guide and accompanying code will help you get started. Try it out, let us know your thoughts in the comments section, and feel free to reach out to us for questions!


About the authors

SriharshaSriharsha Subramanya Begolli works as a Senior Solutions Architect with Amazon Web Services (AWS), based in Bengaluru, India. His primary focus is assisting large enterprise customers in modernizing their applications and developing cloud-based systems to meet their business objectives. His expertise lies in the domains of data and analytics.

Fraser SequeiraFraser Sequeira is a Startups Solutions Architect with Amazon Web Services (AWS) based in Melbourne, Australia. In his role at AWS, Fraser works closely with startups to design and build cloud-native solutions on AWS, with a focus on analytics and streaming workloads. With over 10 years of experience in cloud computing, Fraser has deep expertise in big data, real-time analytics, and building event-driven architecture on AWS. He enjoys staying on top of the latest technology innovations from AWS and sharing his learnings with customers. He spends his free time tinkering with new open source technologies.

Implement secure hybrid and multicloud log ingestion with Amazon OpenSearch Ingestion

Post Syndicated from Xiaoxue Xu original https://aws.amazon.com/blogs/big-data/implement-secure-hybrid-and-multicloud-log-ingestion-with-amazon-opensearch-ingestion/

Running applications across hybrid or multicloud environments creates a common challenge: fragmented logs scattered across different platforms. This fragmentation complicates monitoring, slows troubleshooting, and reduces operational visibility. To address this, many organizations seek to implement secure log ingestion from all environments into a centralized platform.

Amazon OpenSearch Service provides a unified solution for real-time search, analytics, and log management across your entire infrastructure. Amazon OpenSearch Ingestion, a fully managed data collector, simplifies data processing with built-in capabilities to filter, transform, and enrich your logs before analysis.

However, securely sending logs from non-AWS environments presents a challenge. Every request to OpenSearch Ingestion requires AWS Signature Version 4 (AWS SigV4) authentication, traditionally requiring long-term credentials that introduce security risks. AWS Identity and Access Management Roles Anywhere solves this problem by providing temporary credentials for workloads running outside AWS.

In this post, we demonstrate how to configure Fluent Bit, a fast and flexible log processor and router supported by various operating systems, to securely send logs from any environment to OpenSearch Ingestion using IAM Roles Anywhere. This approach alleviates the need for long-term credentials while providing a comprehensive view of your application logs across all environments—improving security, simplifying operations, and enhancing your ability to quickly resolve issues.

Solutions overview

The solution in this post uses Fluent Bit to collect logs, retrieve temporary credentials from IAM Roles Anywhere, and sign HTTP log ingestion requests with AWS SigV4 before sending them to the OpenSearch Ingestion pipeline. The following diagram shows the architecture.

Architecture for log ingestion with AWS IAM Roles Anywhere

This solution provisions the following key components:

  • Certificate authority – For this post, we use AWS Private Certificate Authority (AWS Private CA) as the certificate authority (CA) source. Alternatively, you can integrate with an external CA; for more details, see IAM Roles Anywhere with an external certificate authority. Certificates issued from public CAs can’t be used as trust anchors for IAM Roles Anywhere.
  • X.509 Certificate – We use a sample private certificate stored in AWS Certificate Manager (ACM) and issued by AWS Private CA.
  • IAM Roles Anywhere configuration – This includes the following:
    • Trust anchor – Establishes trust between IAM Roles Anywhere and the specified CA.
    • IAM role – Grants permissions for log ingestion and trusts the IAM Roles Anywhere service principal. At minimum, this role must be granted permission for the osis:Ingest action.
    • Profile – Defines which roles IAM Roles Anywhere can assume and the maximum permissions granted with the temporary credentials.
  • OpenSearch Service domain – For this post, we use an OpenSearch Service domain, which is an AWS provisioned equivalent of an open source OpenSearch cluster. We create the domain within a virtual private cloud (VPC); see VPC versus public domains for more information. Alternatively, you can use an Amazon OpenSearch Serverless collection, which is an OpenSearch cluster that scales compute capacity based on your application’s needs.
  • OpenSearch Ingestion – This is configured to receive logs over HTTP as the pipeline source and forward them to the OpenSearch Service domain as the pipeline sink.

Connectivity between AWS and your hybrid or multicloud environments

You can access your OpenSearch Ingestion pipelines using an interface VPC endpoint with push-based HTTP source, which provides private IP address connectivity. For production environments, we recommend using these private connections through interface endpoints for enhanced security.

Setting up this connectivity requires additional configuration, such as creating an AWS Site-to-Site VPN connection with your hybrid and multicloud network. Although this post focuses on the log ingestion solution, you can find detailed guidance on network connectivity in the following resources:

How Fluent Bit retrieves temporary credentials using IAM Roles Anywhere

Using the HTTP output plugin, Fluent Bit can send logs to the OpenSearch Ingestion pipeline. The following diagram is a simplified view of how Fluent Bit retrieves AWS credentials.

How Fluent Bit retrieve AWS credentials

On Linux systems, Fluent Bit can use an AWS Command Line Interface (AWS CLI) profile that uses the credential_process parameter to trigger an external process. This external process is invoked to generate or retrieve credentials not directly supported by the AWS CLI.

The following are two common mechanisms for the external process:

Although both options are viable, this post focuses on IAM Roles Anywhere. In this setup, the AWS IAM Roles Anywhere Credential Helper is executed to handle the signing process for the CreateSession API. This returns credentials in a JSON format that Fluent Bit can consume.

As of this writing, the Fluent Bit aws_profile configuration is supported only on Linux. It is untested on other Unix-based systems (such as macOS) and is not implemented for Windows.

Prerequisites

Before you begin this walkthrough, make sure you have the following:

Deploy AWS resources with AWS CloudFormation

Follow these steps to deploy AWS resources required for this solution:

  1. Choose Launch Stack:


  2. Enter a unique name for Stack name. The default value is osis-with-iamra.
  3. Configure the stack parameters. Default values are provided in the following table.
Parameter Default value Description
CACommonName example.com Common Name for the CA
CACountry US Organization for the CA
CAOrganization Example Org Country for the CA
CAValidityInDays 1826 Validity period in days for the CA certificate
VPCCIDR 10.0.0.0/16 IPv4 CIDR range for the VPC used for OpenSearch Service domain
PublicSubnetCIDR 10.0.0.0/24 IPv4 CIDR range for public subnet
PrivateSubnet1CIDR 10.0.1.0/24 IPv4 CIDR range for private subnet
PrivateSubnet2CIDR 10.0.2.0/24 IPv4 CIDR range for private subnet
DomainName test-domain Name of the OpenSearch Service domain
PipelineName test-pipeline Name of the OpenSearch Ingestion pipeline
PipelineIngestionPath /test-ingestion-path Ingestion path for the OpenSearch Ingestion pipeline
  1. Select the acknowledgement check box and choose Create Stack.
    Stack deployment takes about 30 minutes to complete.
  2. When stack creation is complete, navigate to the Outputs tab on the AWS CloudFormation console and note down the values for the resources created.
    The following table summarizes the output values.
Output Description Example value
ACMCertificateArn Amazon Resource Name (ARN) of the ACM certificate. You will use this for exporting certificate and private key files using the AWS CLI in a later step. arn:aws:acm:aa-example-1:111122223333:certificate/a1b2c3d4-5678-90ab-cdef-EXAMPLE11111
CertificateAuthorityArn ARN of the Private CA. arn:aws:acm-pca:aa-example-1:111122223333:certificate-authority/a1b2c3d4-5678-90ab-cdef-EXAMPLE22222
TrustAnchorArn ARN of the IAM Roles Anywhere profile. You will use this value for configuring credential_process for IAM Roles Anywhere in a later step. arn:aws:rolesanywhere:aa-example-1:111122223333:trust-anchor/a1b2c3d4-5678-90ab-cdef-EXAMPLE33333
IngestionRoleArn ARN of the OpenSearch Ingestion role. You will use this value for configuring credential_process for IAM Roles Anywhere in a later step. arn:aws:iam::111122223333:role/role-name-with-path
ProfileArn ARN of the IAM Roles Anywhere profile. You will use this value for configuring credential_process for IAM Roles Anywhere in a later step. arn:aws:rolesanywhere:aa-example-1:111122223333:profile/a1b2c3d4-5678-90ab-cdef-EXAMPLE44444
OpenSearchDomainEndpoint Endpoint of the VPC OpenSearch domain. You will use this public endpoint for querying your index after ingestion. vpc-my-domain-123456789012.aa-example-1.es.amazonaws.com
PipelineEndpoint Endpoint of the OpenSearch Ingestion pipeline. You will use this public endpoint in the Fluent Bit configuration. my-pipeline-123456789012.aa-example-1.osis.amazonaws.com
PipelineIngestionPath Ingestion path for the OpenSearch Ingestion pipeline. /test-ingestion-path

Export a sample private certificate using CloudShell

Follow these steps to export the sample private certificate created by the CloudFormation stack:

  1. Open CloudShell. For more details, see Navigating the AWS CloudShell interface.
  2. Export the certificate ARN from the CloudFormation outputs. If you changed the stack name in the previous step, use that value for <stack-name>, otherwise use the default value osis-with-iamra.
export CERT_ARN=$(aws cloudformation describe-stacks \
    --stack-name <stack-name> \
    --query 'Stacks[0].Outputs[?OutputKey==`ACMCertificateArn`].OutputValue' \
    --output text)
  1. Extract the certificate and private key files:
# Generate and save the passphrase
export PASSPHRASE=$(openssl rand -base64 32)

# Export certificate using environment variables
aws acm export-certificate \
    --certificate-arn $CERT_ARN \
    --passphrase $(echo -n "$PASSPHRASE" | base64) \
    > cert_export.json

# Extract components to separate files
jq -r '.Certificate' cert_export.json > certificate.pem
jq -r '.PrivateKey' cert_export.json > encrypted_private_key.pem

# Decrypt the private key
openssl rsa -in encrypted_private_key.pem -out private_key.pem -passin pass:"$PASSPHRASE"

# Clear environment variables
unset PASSPHRASE CERT_ARN
  1. Download the extracted certificate and private key files from CloudShell:
    1. /home/cloudshell-user/certificate.pem
    2. /home/cloudshell-user/private_key.pem

Configure an AWS CLI profile

Follow these steps to configure an AWS CLI profile for your log ingestion environment:

  1. Store the downloaded certificate and private key to your environment. For an automated approach to generate and rotate certificates, see Set up AWS Private Certificate Authority to issue certificates for use with IAM Roles Anywhere.
  2. Create a new profile named osis-pipeline-credentials that invokes the credential process. Replace the placeholders with your specific values. Find the values for trusted-anchor-arn, profile-arn, and ingestion-role-arn in your CloudFormation stack outputs.
aws configure set profile.osis-pipeline-credentials.credential_process "</path/to/aws_signing_helper> credential-process \
      --certificate </path/to/certificate.pem> \
      --private-key </path/to/private_key.pem> \
      --trust-anchor-arn <trusted-anchor-arn> \
      --profile-arn <profile-arn> \
      --role-arn <ingestion-role-arn>"
  1. Verify your configuration. Open the ~/.aws/config file and confirm it contains a profile named osis-pipeline-credentials similar to the following:
[profile osis-pipeline-credentials]
credential_process = </path/to/aws_signing_helper> credential-process       --certificate </path/to/certificate.pem>       --private-key </path/to/private_key.pem>       --trust-anchor-arn <trusted-anchor-arn>       --profile-arn <profile-arn>       --role-arn <ingestion-role-arn>

Configure Fluent Bit

Run the following command to create a Fluent Bit configuration. Replace the placeholders with your specific values. Find the osis-pipeline-endpoint and pipeline-ingestion-path values in your CloudFormation stack outputs.

cat << 'EOF' > ~/fluent-bit.conf
[INPUT]
  name                  tail
  path                  /var/log/syslog
  read_from_head        true
  refresh_interval      5
[OUTPUT]
  name 			http
  match	   		*
  aws_service 		osis
  host 			<osis-pipeline-endpoint>
  port 			443
  uri 			<pipeline-ingestion-path> 
  format 		json
  aws_auth	 	true
  aws_region 		<aa-example-1>   
  aws_profile 		osis-pipeline-credentials
  tls 			On
EOF

This example configuration includes the following:

  • Uses the tail input plugin to monitor the /var/log/syslog file
  • Uses the http output plugin to flush log records to the OpenSearch Ingestion pipeline endpoint
  • Uses the osis-pipeline-credentials profile to obtain temporary AWS credentials for SigV4 authentication (aws_auth set to true)

Test the solution

Follow these steps to test the setup:

  1. Start the Fluent Bit client with the configuration file fluent-bit.conf that you created in the previous step. Replace the placeholder with the value applicable to your environment. For Ubuntu 24.04, the default path of the Fluent Bit client is /opt/fluent-bit/bin/fluent-bit. Adjust the path if using other distributions.

sudo AWS_CONFIG_FILE=~/.aws/config <path-to-fluent-bit> -c ~/fluent-bit.conf

  1. Because the solution in this post launched the OpenSearch Service domain within a VPC, you will need an environment that has connectivity to the VPC. For this post, we create a CloudShell VPC environment to run the commands in the next step. Find the VPC, subnet, and security group to use from your CloudFormation stack outputs.
  2. The solution that you deployed through AWS CloudFormation dynamically creates indexes based on ingestion timestamps, format logs-%{yyyy.MM.dd}. You can specify your preferred naming using OpenSearch Ingestion index management. You can query your OpenSearch index using your preferred tool to see the ingested logs from Fluent Bit. We use awscurl in a CloudShell environment as shown in the following example. Replace the placeholders with your specific values. Find the opensearch-domain-endpoint value in your CloudFormation stack outputs.
pip install awscurl

export OPENSEARCH_DOMAIN_ENDPOINT=https://<opensearch-domain-endpoint>

# List indices matching logs-%{yyyy.MM.dd} format and get most recent one to query
export INDEX=$(awscurl --service es "$OPENSEARCH_DOMAIN_ENDPOINT/_cat/indices?v" | grep -E "logs-[0-9]{4}\.[0-9]{2}\.[0-9]{2}" | sort -r | head -1 | awk '{print $3}')

awscurl --service es $OPENSEARCH_DOMAIN_ENDPOINT/$INDEX/_search \
        -X GET -H "Content-Type: application/json" \
        -d '{
            "size": 10,
            "sort": [
              {"@timestamp": {"order": "desc"}}
            ],
            "query": { "match_all": {} }
          }' | jq '.hits.hits[]._source'

The following is an example of the expected output:

{
  "date": 1732039662.399506,
  "log": "2024-11-19T18:07:42.399375+00:00 test-server fluent-bit[9986]: 200 OK",
  "@timestamp": "2024-11-19T18:07:42.812Z"
}
{
  "date": 1732039662.399501,
  "log": "2024-11-19T18:07:42.399224+00:00 test-server fluent-bit[9986]: [2024/11/19 18:07:42] [ info] [output:http:http.0] test-pipeline-123456789012.us-east-2.osis.amazonaws.com:443, HTTP status=200",
  "@timestamp": "2024-11-19T18:07:42.812Z"
}
...

Clean up

To avoid future charges, remove the deployed resources:

  1. Delete the CloudFormation stack.
  2. Remove generated files from CloudShell:

rm cert_export.json encrypted_private_key.pem certificate.pem private_key.pem

Conclusion

In this post, we demonstrated how to obtain temporary credentials from IAM Roles Anywhere and securely ingest logs from hybrid or multicloud environments into OpenSearch Service using OpenSearch Ingestion. This approach minimizes the risk of credential exposure while enabling centralized log collection from distributed workloads. This solution is particularly valuable for organizations managing complex infrastructures across multiple environments and looking to consolidate observability data in OpenSearch Service. For additional details, refer to the following resources:

If you have questions or feedback about this post, please leave them in the comments section.


About the Authors

Xiaoxue Xu is a Solutions Architect for AWS based in Toronto. She primarily works with financial services customers to help secure their workload and design scalable solutions on the AWS Cloud.

Simran Singh is a Senior Solutions Architect at AWS. In this role, he assists our large enterprise customers in meeting their key business objectives using AWS. His areas of expertise include artificial intelligence and machine learning, security, and improving the experience of developers building on AWS.

Enhance security and performance with TLS 1.3 and Perfect Forward Secrecy on Amazon OpenSearch Service

Post Syndicated from Shubham Kumar original https://aws.amazon.com/blogs/big-data/enhance-security-and-performance-with-tls-1-3-and-perfect-forward-secrecy-on-amazon-opensearch-service/

Amazon OpenSearch Service recently introduced a new Transport Layer Security (TLS) policy Policy-Min-TLS-1-2-PFS-2023-10, which supports the latest TLS 1.3 protocol and TLS 1.2 with Perfect Forward Secrecy (PFS) cipher suites. This new policy improves security and enhances OpenSearch performance.

OpenSearch Service previously offered predefined TLS policies for domain endpoint security, making it possible to encrypt your traffic end-to-end by enforcing HTTPS. However, these policies were limited to older versions of TLS, such as TLS 1.0 and TLS 1.2, without any PFS offerings.

In this post, we discuss the benefits of this new policy and how to enable it using the AWS Command Line Interface (AWS CLI).

Solution overview

The new TLS security policy provides an upgraded security posture for OpenSearch Service domains by implementing TLS 1.3 and PFS. This makes it possible to enhance the confidentiality and integrity of traffic between clients and your OpenSearch Service domains, providing a more secure and efficient communication channel for your sensitive data. TLS 1.3 is the latest version of the Transport Layer Security protocol, designed to prevent certain attacks targeting legacy TLS ciphers and provide improvements like 0-RTT resumption for faster connection times. TLS 1.3 can establish secure connections faster than TLS 1.2, resulting in reduced latency for your applications. PFS is an important security enhancement that makes sure past communications remain secure, even if the server’s long-term secret key is compromised in the future. By using a unique, randomly generated session key for each connection, PFS adds an extra layer of protection against potential eavesdropping or decryption of encrypted data. Compared to the older TLS 1.2 policy Policy-Min-TLS-1-2-2019-07, TLS 1.2 with PFS offers stronger security by protecting against potential key compromises, while still maintaining compatibility with older clients that don’t support TLS 1.3.

Prerequisites

To start using this new policy, you need the following prerequisites:

Enable the new TLS policy on OpenSearch Service

To create new domains with the new TLS policy enabled, add --domain-endpoint-options '{"TLSSecurityPolicy": "Policy-Min-TLS-1-2-PFS-2023-10"}' to the create-domain AWS CLI command:

aws opensearch create-domain \
--domain-name my-domain \
--domain-endpoint-options '{"TLSSecurityPolicy": "Policy-Min-TLS-1-2-PFS-2023-10"}' <other config options>

For existing domains, you can update the domain configuration to use the new TLS policy by running the update-domain-config AWS CLI command:

aws opensearch update-domain-config \
--domain-name my-domain \
--domain-endpoint-options '{"TLSSecurityPolicy": "Policy-Min-TLS-1-2-PFS-2023-10"}'

Client-side considerations

Most modern clients and libraries should support TLS 1.3 and TLS 1.2 with PFS out of the box. However, if you encounter issues or compatibility concerns, you might need to update your client libraries or configurations to enable support for the new TLS policy.

Conclusion

The new Policy-Min-TLS-1-2-PFS-2023-10 security policy for OpenSearch Service offers significant improvements in security and performance. By supporting TLS 1.3 and TLS 1.2 with PFS, this policy helps protect your data in transit and provides faster connection times. We recommend that you start using this new TLS security policy for improved security posture and performance when connecting to your OpenSearch Service domains. To get started, follow the steps outlined in this post to enable the new policy on your existing or new domains.

For more information on the available TLS options and how to configure them, refer to Infrastructure security in Amazon OpenSearch Service.

At Amazon, security is our top priority, and we are continuously working to enhance the security and performance of our services. Stay tuned for more exciting updates!


About the authors

Shubham Kumar is a Software Development Engineer at Amazon OpenSearch Service, specializing in the security domain. He is passionate about developing robust security features to enhance the protection of customer data and infrastructure.

Sachet Alva is a Software Development Manager at Amazon OpenSearch Service, overseeing the infrastructure security and custom package initiatives. His team’s innovations contribute to the enhanced security and flexibility of Amazon OpenSearch Service deployments.

Naveen Negi is a Senior Tech Product Manager for Amazon OpenSearch Service. He works closely with engineering teams and customers to shape the future of OpenSearch Service, making sure it meets evolving security and performance needs.

Designing centralized and distributed network connectivity patterns for Amazon OpenSearch Serverless

Post Syndicated from Ankush Goyal original https://aws.amazon.com/blogs/big-data/designing-centralized-and-distributed-network-connectivity-patterns-for-amazon-opensearch-serverless/

Amazon OpenSearch Serverless is a fully managed search and analytics service that automatically provisions and scales infrastructure to help you run search and analytics workloads without cluster management. With OpenSearch Serverless, you can quickly build search and analytics capabilities into your applications.

As organizations scale their use of OpenSearch Serverless, understanding network architecture and DNS management becomes increasingly important. Building upon the connectivity patterns discussed in our previous post Network connectivity patterns for Amazon OpenSearch Serverless, this post covers advanced deployment scenarios focused on centralized and distributed access patterns—specifically, how enterprises can simplify network connectivity across multiple AWS accounts and extend access to on-premises environments for their OpenSearch Serverless deployments.

We outline two key deployment patterns:

  • Pattern 1 – A centralized endpoint model where interface virtual private cloud (VPC) endpoints for OpenSearch Serverless are deployed in a shared services VPC, allowing spoke VPCs from other AWS accounts and on premises to access OpenSearch Serverless collections through these consolidated endpoints.
  • Pattern 2 – A distributed endpoint model where interface VPC endpoints are created in individual spoke VPCs, with multiple consumers (central account, on-premises networks, and other spoke accounts) accessing these endpoints through centralized DNS management. This approach provides direct connectivity within each spoke VPC while maintaining centralized DNS control and management across the organization.

Before diving into advanced deployment patterns, let’s review the DNS behavior of OpenSearch Serverless when accessed through an interface VPC endpoint (AWS PrivateLink). Understanding this foundational aspect can help clarify the connectivity patterns we explore in this post.

OpenSearch Serverless interface VPC endpoint DNS resolution

When creating an OpenSearch Serverless interface VPC endpoint, the service automatically provisions three private hosted zones: one visible private hosted zone us-east-1.aoss.amazonaws.com that handles domain resolution for the OpenSearch Serverless collection and dashboard, another visible private hosted zone us-east-1.opensearch.amazonaws.com that manages resolution for the OpenSearch UI (OpenSearch Dashboards), and one hidden internal private hosted zone that manages the final DNS resolution to private IP addresses.

Our objective in this post is to explore how the two private hosted zones for OpenSearch Serverless work together: the visible private hosted zone us-east-1.aoss.amazonaws.com for collections and dashboards, and the hidden private hosted zone for final DNS resolution to private IP addresses. We examine how these private hosted zones enable scalable DNS resolution in both centralized and distributed architectures. The following workflow diagram shows the DNS resolution flow for the us-east-1 AWS Region. The same pattern applies to other Regions, with the Region identifiers in the DNS records changing accordingly.

DNS Workflow Diagram AOSS

The workflow consists of the following steps:

  1. A user requests access to a collection URL (for example, abc.us-east-1.aoss.amazonaws.com).
  2. The DNS request is sent to the Amazon Route 53 Resolver, which checks the visible private hosted zone us-east-1.aoss.amazonaws.com and finds a CNAME record pointing to the endpoint-specific domain.
  3. The Route 53 Resolver uses the hidden internal private hosted zone to resolve this endpoint-specific domain to the VPC endpoint’s private IP address.
  4. Traffic is allowed only if it originates from the interface VPC endpoint approved by OpenSearch Serverless network policies.

Although this DNS Resolution Process provides flexible and secure private access, it becomes complex when you need connectivity from multiple VPCs, different AWS accounts, or on-premises networks. The following patterns address these challenges and outline strategies to simplify network access and DNS management for OpenSearch Serverless in such environments.

Pattern 1: Centralized interface VPC endpoint for OpenSearch Serverless

This pattern uses a centralized approach where a shared services AWS account with a shared services VPC hosts the OpenSearch Serverless interface VPC endpoint and OpenSearch Serverless collection. From there, other AWS accounts with Amazon VPCs (spoke VPCs) need to be able to access OpenSearch Serverless collections through this central endpoint. Organizations commonly implement this setup in hub-and-spoke network designs that connect their VPCs using either AWS Transit Gateway or AWS Cloud WAN. The following diagram illustrates this architecture.

AOSS Centralized Account

Challenge

When accessing from on-premises networks, both network access and DNS resolution for the OpenSearch Serverless interface VPC endpoint work successfully. However, although the endpoint is network-accessible from spoke VPCs (for example, through Transit Gateway or AWS Cloud WAN), DNS resolution from these VPCs fail.

This happens because OpenSearch Serverless creates and uses a private hosted zone us-east-1.aoss.amazonaws.com that is only associated with the VPC containing the endpoint, in this case, the Shared Services VPC. Simply sharing this private hosted zone with the spoke VPCs doesn’t solve the problem, because the wildcard CNAME record references a DNS name privatelink.c0X.sgw.iad.prod.aoss.searchservices.aws.dev. This DNS name can’t be resolved from other VPCs without additional configuration, because it belongs to a private hosted zone privatelink.c0X.sgw.iad.prod.aoss.searchservices.aws.dev that is only associated with the shared services VPC. This private hosted zone isn’t visible in your account and is controlled by AWS.

Solution: Use Amazon Route 53 Profiles for cross-VPC DNS resolution

To enable centralized DNS resolution, you can use Amazon Route 53 Profiles. With Route 53 Profiles, you can manage and apply DNS-related Amazon Route 53 configurations across multiple VPCs and AWS accounts. The following diagram illustrates the solution architecture.

AOSS Centralized Account Route53 Profile

The solution consists of the following steps:

  1. Create an OpenSearch Serverless interface VPC endpoint in the shared services VPC. This automatically creates and associates the following:
      1. Two default private hosted zones.
      2. One hidden private hosted zone with this VPC.
  2. Create a Route 53 Profile in the shared services account.
  3. Associate the interface VPC endpoint for OpenSearch Serverless with the Route 53 Profile.
    1. The Route 53 Profile automatically associates the hidden private hosted zone with the profile.
  4. Associate the private hosted zone us-east-1.aoss.amazonaws.com that was automatically created by OpenSearch Serverless with the Route 53 Profile.
  5. Share the Route 53 Profile with your other AWS accounts in your organization using AWS Resource Access Manager (AWS RAM).
  6. Associate the spoke VPCs (located in different accounts) with the Route 53 Profile.

If you have an existing Route 53 Profile in your shared services account that is already associated to spoke VPCs, you can simply associate the OpenSearch Serverless interface VPC endpoint and the private hosted zone us-east-1.aoss.amazonaws.com to this profile.

After completing these steps, the DNS resolution for the OpenSearch Serverless collection and dashboard endpoints works seamlessly from spoke VPCs associated with the Route 53 Profile. Clients in spoke VPCs can resolve and access OpenSearch Serverless collections and dashboards through the centralized VPC endpoint.

Pattern 2: Distributed interface VPC endpoint for OpenSearch Serverless

Each spoke VPC, residing in its respective AWS account, hosts its own OpenSearch Serverless collection and interface VPC endpoint. We now want to achieve the following:

  • Centralize DNS management in a shared services VPC to provide consistent resolution for OpenSearch Serverless collections deployed across multiple spoke accounts
  • Provide on-premises resources with DNS resolution capability for all OpenSearch Serverless collections across the organization through a Route 53 Resolver inbound endpoint in the shared services VPC

The following diagram illustrates this architecture.

AOSS Distributed

Challenge

Managing DNS resolution for OpenSearch Serverless collections and dashboards becomes complex in this distributed model because each interface VPC endpoint creates its own set of private hosted zones that are only associated with their respective VPCs. This creates a fragmented DNS landscape where the shared services VPC and on-premises networks need a consolidated way to resolve domains of OpenSearch Serverless collections and dashboards across multiple spoke accounts.

Solution: Use a self-managed private hosted zone in the shared services VPC for on-prem DNS resolution

To enable centralized DNS resolution for distributed endpoints, create a self-managed private hosted zone in the shared services account and associate it with the shared services VPC. Within this private hosted zone, you can create CNAME records that map each OpenSearch Serverless collection endpoint to its respective interface VPC endpoint DNS names in the spoke accounts. The following diagram illustrates this architecture.

AOSS Distributed Centralized DNS On Prem and VPC

Implementation consists of the following steps:

  1. Create a self-managed private hosted zone in the shared services account with the domain name us-east-1.aoss.amazonaws.com and associate it with the shared services VPC. For each OpenSearch Serverless collection, create a CNAME record that points to the Regional DNS name of its corresponding interface VPC endpoint.

This configuration enables both on-premises resources and resources in the shared services VPC to resolve OpenSearch Serverless endpoints that are in the spoke accounts.

After you complete these steps, each OpenSearch Serverless interface VPC endpoint remains within its original AWS account, maintaining security boundaries and account-level autonomy. On-premises systems can access OpenSearch Serverless collections and dashboards using original collection DNS names (for example, {collection-name}.us-east-1.aoss.amazonaws.com) through DNS resolution provided by the private hosted zone in the shared services VPC.

Conclusion

As organizations scale their adoption of OpenSearch Serverless, establishing secure and centralized network access becomes increasingly important. In this post, we explored two architectural patterns specifically around DNS management:

  • Centralized endpoint model – This pattern is ideal when a shared services account manages the OpenSearch Serverless interface VPC endpoints, allowing multiple spoke accounts to access OpenSearch Serverless collections and dashboards through a centralized set of network resources.
  • Distributed endpoint model with centralized DNS – This pattern is suitable for organizations that require account-level autonomy, where each AWS account manages its own OpenSearch Serverless interface VPC endpoints, while DNS resolution is centralized through a shared self-managed private hosted zone in a shared services account.

By understanding the DNS architecture of OpenSearch Serverless and using services like Route 53 Profiles and AWS RAM, organizations can build secure and robust access patterns that align with their organizational structure and needs.


About the Authors

Ankush GoyalAnkush Goyal is a Enterprise Support Lead in AWS Enterprise Support who helps customers streamline their cloud operations on AWS. He is a results-driven IT professional with over 20 years of experience.

Anvesh KogantiAnvesh Koganti is a Solutions Architect at AWS specializing in Networking. He focuses on helping customers build networking architectures for highly scalable and resilient AWS environments. Outside of work, Anvesh is passionate about consumer technology and enjoys listening to podcasts on tech and business. When disconnecting from the digital world, Anvesh spends time outdoors hiking and biking.

Salman AhmedSalman Ahmed is a Senior Technical Account Manager in AWS Enterprise Support. He specializes in guiding customers through the design, implementation, and support of AWS solutions. Combining his networking expertise with a drive to explore new technologies, he helps organizations successfully navigate their cloud journey. Outside of work, he enjoys photography, traveling, and watching his favorite sports teams.

PackScan: Building real-time sort center analytics with AWS Services

Post Syndicated from Sairam Vangapally original https://aws.amazon.com/blogs/big-data/packscan-building-real-time-sort-center-analytics-with-aws-services/

Amazon manages a complex logistics network with multiple touch points, from fulfillment centers to sort centers to final customer delivery. Among these, sort centers play a crucial role in the middle mile, providing faster and more efficient package movement. Within Amazon’s Middle Mile operations, high-volume sort centers process millions of packages daily, making immediate access to operational data essential for optimizing efficiency and decision-making. Real-time visibility into key metrics—such as package movements, container statuses, and associate productivity—is critical for smooth logistics operations. To address the need for real-time operational planning, the Amazon Middle Mile team developed PackScan, a cloud-based platform designed to provide instant insights across the network. By significantly reducing data latency, PackScan enables proactive decision-making, so teams can monitor inbound package flows, optimize outbound shipments based on live data, track associate productivity, identify bottlenecks, and enhance overall operational efficiency—all in real time.

In this post, we explore how PackScan uses Amazon cloud-based services to drive real-time visibility, improve logistics efficiency, and support the seamless movement of packages across Amazon’s Middle Mile network.

Prerequisites

This post assumes a foundational understanding of the following services and concepts:

Although hands-on experience is not required, a conceptual understanding of these services will help in understanding the architecture, design patterns, and components discussed throughout the article.

Business challenges

Amazon’s sort centers handle over 15 million packages daily across more than 120 facilities in North America. Given this scale, even minor delays in operational insights can lead to inefficiencies, increased costs, and escalations. Traditionally, data latencies of up to an hour have restricted the ability to make proactive decisions, directly affecting productivity, resource allocation, and responsiveness—especially during peak periods like holiday seasons and big deal days.

Without immediate visibility into package movements, container statuses, and associate performance, operational teams face challenges in identifying and resolving bottlenecks in real time. The lack of timely insights can disrupt the flow of packages, leading to shipment delays, reduced throughput, and suboptimal facility performance. Addressing these inefficiencies required a solution capable of delivering real-time, high-fidelity data to support rapid decision-making.

To bridge this gap, Amazon’s Middle Mile organization needed a scalable platform that could enhance visibility, minimize latency, and provide up-to-the-minute insights into logistics operations. PackScan was designed to meet these demands, giving teams access to the real-time data necessary to optimize workflows, mitigate bottlenecks, and improve overall efficiency.

Data flow

In 2024, PackScan was deployed across 80 sort centers in the USA, enabling real-time package analytics. The solution powers Grafana dashboards, which refresh every 10 seconds by fetching live package data from OpenSearch Service. With this near real-time visibility, operations teams can monitor package movement and sorting efficiency across sort centers. The following diagram outlines how package scan data is ingested, processed, and made actionable.

Each sort center is equipped with hardware at inbound stations where packages arrive from trailers. Integrated barcode scanners automatically scan each package as it enters the sorting process. Every scan generates an SNS event, capturing key attributes such as the package ID, dimensions, the associate who performed the scan, and the timestamp and location of the scan.

After they’re generated, these SNS events are ingested into Data Firehose through a Lambda function, where the data undergoes real-time enrichment. During this process, additional attributes are appended, including the business logic rules. The enriched data is then streamed into OpenSearch Service, where events are indexed to enable fast and efficient querying. With the indexed package scan events available in OpenSearch Service, real-time analytics and monitoring become possible. The Grafana dashboards query this data every 10 seconds, providing operational insights into package inflow metrics and associate performance.

Solution overview

PackScan was implemented using a structured and scalable approach, using AWS cloud-based services to enable high-frequency data ingestion, real-time processing, and actionable insights. The architecture is designed to minimize latency while providing reliability, scalability, and operational efficiency. The solution is built around a serverless, event-driven architecture that dynamically scales based on data ingestion volumes. The architecture—illustrated in the following figure—enabled us to build a real-time data solution, utilizing the advantages of various AWS services to provide low-latency analytics, high scalability, and real-time operational insights across Amazon’s sort centers.

The following are the key components and features of the solution:

  • Real-time data processing – Lambda functions serve as the processing backbone of the system, handling 500,000 scan events per second. Each incoming event is processed by applying data transformations, enrichment, and validation before passing it downstream.
  • High-frequency data ingestion and streaming – Data Firehose is the primary ingestion pipeline, handling millions of scan events daily from thousands of barcode scanners across multiple sort centers. The Firehose streams handle incoming data of 12,000 PUT requests per second, maintaining smooth ingestion and low-latency streaming. Data retention policies are set to buffer and forward enriched events every 60 seconds or upon reaching 5 MB batch size, optimizing storage and processing efficiency.
  • Optimized querying and operational insights – OpenSearch Service is used to index and store the processed scan events, providing real-time querying and anomaly detection. The OpenSearch cluster consists of 12 data nodes (r5.4xlarge.search) and 3 primary nodes (r5.large.search), processing up to 10 GB of data per day with a rolling index strategy, where indexes are rotated every 24 hours to maintain query performance. The system supports concurrent queries per second, enabling logistics teams to perform rapid lookups and gain instant visibility into package movements.
  • Live visualization and dashboarding – Grafana, hosted on an m5.12xlarge EC2 instance, provides real-time visualization of key logistics metrics. The dashboards refresh every 10 seconds, querying OpenSearch and displaying up-to-the-minute package analytics. The setup includes multiple preconfigured dashboards, monitoring package flow at different inbound stations, and workforce efficiency. These dashboards support concurrent users, enabling supervisors and associates to track and optimize operations proactively. The following screenshot shows one of the real-time dashboards, with details of package flow by different routes within sort centers.

The entire PackScan architecture is designed for automatic scaling, adjusting dynamically based on data ingestion volume to maintain efficiency during peak and off-peak operations. This approach provides cost-effective resource utilization while maintaining high availability and performance.

Business outcomes

The implementation of PackScan has led to measurable improvements in operational efficiency, workforce productivity, and real-time decision-making across Amazon’s sort centers. By reducing data latency and enabling real-time insights, PackScan has transformed logistics operations in meaningful ways:

  • Widespread deployment – PackScan was deployed across 80 sort centers, supporting approximately 1,000 display monitors that provide real-time operational insights.
  • Significant reduction in data latency – Data latency dropped from approximately 1 hour to less than 1 minute, allowing for real-time operational responsiveness and minimizing workflow disruptions.
  • Proactive operational management – With dynamic workload balancing and instant bottleneck identification, supervisors can now address issues as they arise, leading to smoother operations and fewer escalations.
  • Boost in workforce productivity – The real-time performance feedback has enhanced associate engagement, resulting in a 25% increase in throughput per hour and 12% reduction in labor hours.

Overall, PackScan has redefined real-time logistics visibility within Amazon’s Middle Mile operations, empowering operational teams with actionable insights, enhanced workforce efficiency, and a data-driven approach to package movement and sort center performance.

Lessons learned and best practices

The deployment and scaling of PackScan provided valuable insights into optimizing real-time logistics visibility. Several key lessons and best practices emerged from this implementation:

  • Cloud architecture drives efficiency – Adopting Amazon technologies provides seamless scalability, reduced operational overhead, and lower infrastructure costs, while maintaining high reliability. The following table shows an approximate breakdown of monthly service costs observed in production. This is an estimation based on current pricing; we recommend checking the respective AWS service pricing pages to generate the most up-to-date quote. This architecture demonstrates that with combination of provisioned and serverless design, production-ready solutions can be built and scaled at a fraction of the cost of traditional infrastructure.
AWS Service Description Estimated Monthly Cost
Amazon EC2 Three EC2 instances of type m5.12xlarge hosting Grafana $1,700
AWS Lambda Streams SNS events to Data Firehose $4,000
Amazon Data Firehose Real-time data delivery with 12,000 records streaming to OpenSearch Service $1,500
Amazon OpenSearch Service Indexing and querying package scan events $28,000
  • Real-time visibility is a game changer – Immediate access to operational data enhances agility, enabling teams to make timely, data-driven decisions that prevent bottlenecks and improve throughput.
  • Continuous monitoring enhances decision-making – Operational dashboards should evolve with business needs. Regular monitoring and updates provide accuracy, usability, and relevance in driving informed decision-making.

By applying these best practices, PackScan has set a foundation for scalable, real-time logistics management, making sure that Amazon’s Middle Mile operations remain proactive, efficient, and highly responsive to changing business demands.

Conclusion

PackScan has successfully transformed real-time operational visibility within Amazon’s sort centers, addressing critical challenges in data latency, workforce productivity, and logistics efficiency. By using AWS services, particularly Data Firehose for real-time data delivery and OpenSearch Service for analytics, PackScan has enabled proactive decision-making, streamlined operations, and enhanced throughput in high-volume sort environments. Looking ahead, future enhancements will focus on further elevating operational intelligence and scalability, including:

  • Integrating predictive analytics to anticipate workflow bottlenecks and optimize resource allocation
  • Scaling the solution across additional operational scenarios, providing greater resilience and adaptability to dynamic logistics environments

With these advancements, PackScan will continue to drive operational excellence, cost-efficiency, and real-time decision-making capabilities, reinforcing Amazon’s commitment to innovation in logistics and supply chain management.

For those interested in implementing similar solutions, we recommend exploring AWS Serverless Architecture Patterns and the AWS Architecture Blog for additional insights and best practices in building scalable, real-time analytics solutions.


About the authors

Sairam Vangapally is a Data Engineer at Amazon with extensive experience architecting real-time, large-scale data platforms that power critical logistics operations across North America. He has led the design and deployment of end-to-end data pipelines, enabling high-throughput ingestion, transformation, and analytics at scale. He is passionate about building resilient data infrastructure and driving cross-functional collaboration to deliver solutions that accelerate operational insights and business impact.

Nitin Goyal serves as a Data Engineering Manager in Amazon’s Sort Center organization, where he leads initiatives to optimize operational efficiency across North American facilities. With over nine years of tenure at Amazon spanning multiple teams, he specializes in architecting high-performance data systems, with particular emphasis on real-time streaming pipelines, artificial intelligence, and low-latency solutions. His expertise drives the development of sophisticated operational workflows that enhance sort center productivity and effectiveness.

OpenSearch UI: Six months in review

Post Syndicated from Muthu Pitchaimani original https://aws.amazon.com/blogs/big-data/opensearch-ui-six-months-in-review/

OpenSearch UI has been adopted by thousands of customers for various use cases since its launch in November 2024. Exciting customer stories and feedback have helped shape our feature improvements. As we complete 6 months since its general availability, we are sharing major enhancements that have improved OpenSearch UI’s capability, especially in observability and security analytics, in this post.

OpenSearch UI is a serverless, fully managed dashboard to provide a scalable, zero-downtime, web-based interface for data analytics and visualizations. With OpenSearch UI, you can have a unified interface to gain actionable insights across multiple data sources, including Amazon OpenSearch Service domains, Amazon OpenSearch Serverless collections, and AWS services such as Amazon CloudWatch and Amazon Security Lake.

Use natural language for your AI-powered analytics with Amazon Q Developer

OpenSearch UI has transformed complex data analysis to be as simple as asking questions in natural language with its integration with Amazon Q Developer in OpenSearch. You can access the conversational chat pane by choosing the Amazon Q Developer icon in the top right corner of the UI. Amazon Q Developer will answer generic questions such as how to use the features in OpenSearch UI and how to use OpenSearch UI with additional data sources.

You can use the search bar on the Discover page to use the generative AI capabilities with your OpenSearch data. You can enter your question about your data in natural language. The query assistant feature will translate your question to Piped Processing Language (PPL), run the query, and show the results. There will also be an Amazon Q Summary section generated from the query results to answer your question. The query assistant feature now also works with data connections from Amazon Simple Storage Service (Amazon S3).

Additionally, you can use the generative AI feature for anomaly detection and visualizations for your data, so it’s straightforward to identify potential issues earlier and faster, reducing the mean time to resolution.

When an alert is triggered, you can choose the Amazon Q icon to generate a summary of the alert, so you can catch up on the context of this alert. The View insights button will provide further analysis of the alerts in combination with OpenSearch knowledge through a process called Retrieval Augmented Generation (RAG). If you want to further investigate the alert, you can choose View in Discover to proceed to log analytics.

Amazon Q Developer in OpenSearch Service will help you reduce troubleshooting time, resolve more issues without escalation, and extract actionable insights from your operational data using natural language instead of specialized queries. Refer to Amazon Q Developer in Amazon OpenSearch Service to get started with the AI assisted analytics experience.

Enhance enterprise security

We have improved OpenSearch UI’s security capability to meet the demanding needs of large enterprises. Through these enhancements, we’re making it seamless to manage secure access at scale so you can have precise control over who can access your analytics workspaces and data that resides in them.

Use SAML workflows through IAM federation

OpenSearch UI now supports Security Assertion Markup Language (SAML) through AWS Identity and Access Management (IAM) federation so that you can create a single sign-on (SSO) experience for your end-users that initiates authentication workflows from your external identity providers (IdPs), typically called IdP-initiated SSO. You might find this process familiar if your organization is using external IdPs (such as Okta) to manage user permissions and track user activities in accessing AWS services. You can now define a default relay state URL to share with your end-users with this support. Your end-users can use this URL to land directly in OpenSearch UI after authenticating with their IdP. You can also achieve fine-grained access control by defining different permissions for each IAM role assumed by different end-users. To get started, refer to Enabling SAML federation with AWS Identity and Access Management.

Secure access with AWS PrivateLink

OpenSearch UI now supports AWS PrivateLink. You can now access OpenSearch UI privately from within your virtual private cloud (VPC). To learn more, see Managing access to the OpenSearch UI from a VPC endpoint.

Enhancing workspace privacy

There are also new workspace-level privacy settings, so you can quickly configure your workspace with the right permissions with collaborators. For more details, refer to Using Amazon OpenSearch Service workspaces.

Expanded data access capabilities

OpenSearch UI now also offers following additional data access capabilities.

Support for cross-cluster search

Cross-cluster search is an OpenSearch feature with which you can query multiple connected OpenSearch Service domains across accounts and across AWS Regions. We added the capability to support these connected domains as data sources in OpenSearch UI. With this support, you can view remote connected clusters with an index pattern under the data source for the source cluster. To learn more, see Cross-Region and cross-account data access with cross-cluster search.

Regional expansion

To further expand the data access capabilities of OpenSearch UI, we expanded its availability to two more regions: Asia Pacific (Hong Kong) and Europe (Stockholm).

Conclusion

The past 6 months after general availability of OpenSearch UI have seen significant progress in making OpenSearch UI more user-friendly, more available, and more secure. From natural language-based exploration to enterprise security, these feature enhancements reflect our commitment to simplify and improve your data analytics experience. To learn more, refer to Using OpenSearch UI in Amazon OpenSearch Service and get updates through Amazon OpenSearch Service user interface release history.


About the Authors

Muthu Pitchaimani is a Search Specialist with Amazon OpenSearch Service. He builds large-scale search applications and solutions. Muthu is interested in the topics of networking and security, and is based out of Austin, Texas.

Hang (Arthur) Zuo is a Senior Product Manager with Amazon OpenSearch Service. Arthur leads generative AI, workspaces, and infrastructural features in OpenSearch UI. Arthur is passionate about cloud technologies and building data products that help users and businesses gain actionable insights and achieve operational excellence.

Zero-copy, Coordination-free approach to OpenSearch Snapshots

Post Syndicated from Sachin Kale original https://aws.amazon.com/blogs/big-data/zero-copy-coordination-free-approach-to-opensearch-snapshots/

Amazon OpenSearch Service provides automated hourly snapshots as a critical backup and recovery mechanism for customer data. These snapshots serve as point-in-time backups that you can use to restore your OpenSearch domains to a previous state, helping to ensure data durability and business continuity. While this functionality is essential, it’s equally important that the snapshot process operates seamlessly without impacting the domain’s core operations. The snapshot workflow must be efficient enough to maintain optimal performance of search and indexing operations, preserve the domain’s ability to scale with growing workloads, and support overall cluster stability.

In this blog post, we tell you how we enhanced the snapshot efficiency in Amazon OpenSearch Service while carefully maintaining these critical operational aspects. These snapshot optimizations are enabled for all OpenSearch optimized instance family (OR1, OR2, OM2) domains from version 2.17 onwards.

Background

In the traditional snapshot mechanism of OpenSearch, the process involves uploading incremental segment files from each shard to Amazon Simple Storage Service (Amazon S3). The workflow begins when the cluster manager node initiates the snapshot creation and coordinates with the nodes holding primary shards to capture their respective snapshots. Throughout this process, data nodes continuously communicate with the cluster manager node to report their snapshot progress. To provide resilience against leader failures, the cluster state maintains detailed tracking of all in-progress snapshots. This state is shared with all data nodes. However, this approach introduces significant communication overhead, especially in large-scale deployments.

Consider a cluster with M nodes and N primary shards. Each snapshot operation requires at least N cluster state updates, with M*N transport calls flowing to and from the cluster manager node to the data nodes (comprising one cluster state update for each primary shard and M transport calls for each update), as shown in the following diagram. In large domains with hundreds of nodes and thousands of shards, this intensive communication pattern can potentially overwhelm the cluster manager node, impacting its ability to handle other critical cluster management tasks.

Traditional Snapshot

The OpenSearch optimized instance family introduced a significant advancement in data durability and snapshot efficiency. Built to deliver high throughput with 11 nines of durability, OpenSearch optimized instances maintain a copy of all indexed data in Amazon S3. This architectural design eliminated the need to re-upload data during snapshot creation. Instead, the system references the existing data checkpoint in the snapshot metadata. Data checkpoints track the state of data on shards at a given point in time to help ensure consistency and durability. We also prevent cleaning up data from Amazon S3 that is referenced in the snapshot metadata. This approach made snapshots substantially more lightweight and faster compared to the conventional method.

The improved snapshot flow with OpenSearch optimized instances, also called a shallow snapshot v1, manages checkpoint referencing by creating explicit lock files for each checkpoint of a given shard. This flow is illustrated in the following diagram where in the fourth step, instead of uploading segments data, we upload a checkpoint lock file.

Shallow Snapshot V1

While this approach successfully addressed the data redundancy issue by replacing segment data uploads with checkpoint lock file creation, it introduced its own set of challenges. The communication overhead between nodes remained unchanged during snapshot creation and deletion operations. Additionally, the system creates lock files for every shard in each snapshot, regardless of whether the shard receives active traffic or not. This design choice generated an excessive number of remote store calls in order to create a lock file per shard during snapshot operations which is particularly problematic for larger OpenSearch domains.

Revised shallow snapshot (v2)

At its core, shallow snapshot v2 reimagines how we handle data backup in OpenSearch. Shallow snapshot v2 takes a more intelligent approach by implementing a timestamp-based referencing system that reduces data duplication while eliminating the communication overhead. In shallow snapshot v2, as shown in the following diagram, instead of putting an explicit lock on the remote store checkpoint file of a shard, it puts an implicit lock based on the timestamp of the snapshot and of the checkpoint file. We track these snapshot timestamps in pinned timestamp files and upload them to the remote store. With this implicit lock, the checkpoints that match with timestamps in pinned timestamp files aren’t cleaned up from Amazon S3. With this architectural change, data nodes don’t need to send shard updates to the cluster manager, avoiding the subsequent cluster state updates. The snapshot restoration process works by reading a pinned timestamp file corresponding to your snapshot, which helps the data node locate and download the correct version of data from Amazon S3.

Key benefits

Let’s explore the major advantages of using shallow snapshot v2.

Performance improvements

The performance benefits of shallow snapshot v2 are substantial and multifaceted. By minimizing the amount of data that needs to be uploaded to the remote store and the number of cluster state updates that need to be communicated between nodes during snapshot creation, the system significantly reduces I/O and network operations. This reduction translates to faster snapshot creation times and lower system resource utilization during backup operations.

The evaluations shown in the following table were performed to assess the influence on snapshot operations when the domain experiences significant load.

Domain config Snapshot creation time
Number of nodes Number of shards Traditional Shallow snapshot v1 Shallow snapshot v2
10 100 15–20 minutes 1–2 minutes <1 second
10 10,000 30–40 minutes 5–10 minutes <5 seconds
100 100,000 >1 hour >1 hour <10 seconds

Scalability

With fixed number of inter-node communication calls during snapshot creation, the snapshot creation time is single digit seconds even as the node, index, and shard count grows. When tested on 1,000 nodes in an Amazon OpenSearch Service domain, shallow snapshot v2 creation time was observed between 10–20 seconds. For organizations managing large Amazon OpenSearch Service domains, shallow snapshot v2 offers particular advantages. The reduced storage cost from shallow snapshot and faster snapshot creation times from shallow snapshot v2 make it possible to maintain more frequent backups without overwhelming storage resources or impacting system performance.

Architectural simplification

The architectural improvements in Shallow Snapshot V2 go beyond performance optimization. The new implementation features a more streamlined and maintainable codebase, reducing the effort needed to debug issues and implement future enhancements. The simplified architecture reduces the complexity of the snapshot and restore process, leading to more reliable operations and fewer potential points of failure for use cases that require frequent backups, such as compliance-driven scenarios or development environments. This means that you can establish a lower recovery point objective for disaster recovery. Shallow snapshot v2’s efficient handling of incremental changes makes it possible to maintain more granular backup schedules without performance penalties.

Storage efficiency

The cornerstone of shallow snapshot v2 is its innovative approach to storage management. Instead of creating multiple copies of unchanged data, the system maintains smart references to existing data blocks. This implicit timestamp-based reference-counting mechanism avoids creating explicit locks per shard. In environments where storage resources are at a premium, the storage efficiency of shallow snapshot v2 can lead to significant cost savings. The reference-based approach helps ensure optimal use of available storage space while maintaining comprehensive backup coverage.

Looking ahead

The introduction of Shallow Snapshot V2 marks the beginning of our journey toward more efficient data backup solutions. Building upon the framework created by shallow snapshot v2, we can implement additional features such as point in time recovery (PITR), better cluster state integration, and various performance optimizations.

Conclusion

Shallow Snapshot V2 represents a significant advancement in OpenSearch’s backup capabilities. By combining storage efficiency, improved performance, and architectural simplification, it provides a robust solution for modern data backup challenges. If you’re using an instance type from the optimized instance family, shallow snapshot v2 is already enabled for you. Whether you’re using a large-scale domain or working within storage constraints, shallow snapshot v2 offers tangible benefits for your Amazon OpenSearch Service domains.


About the Authors

Sachin Kale is a senior software development engineer at AWS working on OpenSearch.

Bukhtawar Khan is a Principal Engineer working on Amazon OpenSearch Service. He is interested in building distributed and autonomous systems. He is a maintainer and an active contributor to OpenSearch.

Gaurav Bafna is a Senior Software Engineer working on OpenSearch at Amazon Web Services. He is fascinated about solving problems in distributed systems. He is a maintainer and an active contributor to OpenSearch.

Introducing Amazon Q Developer in Amazon OpenSearch Service

Post Syndicated from Muthu Pitchaimani original https://aws.amazon.com/blogs/big-data/introducing-amazon-q-developer-in-amazon-opensearch-service/

Customers use Amazon OpenSearch Service to store their operational and telemetry signal data. They use this data to monitor the health of their applications and infrastructure, so that when a production issue happens, they can identify the cause quickly. The sheer volume and variety in data often makes this process complex and time-consuming, leading to high mean time to repair (MTTR).

To expedite this process and transform how developers interact with their operational data, today we introduced Amazon Q Developer support in OpenSearch Service. With this AI-assisted analysis, both new and experienced users can navigate complex operational data without training, analyze issues, and gain insights in a fraction of the time. Amazon Q Developer in OpenSearch Service reduces MTTR by integrating generative AI capabilities directly into OpenSearch workflows so you can improve your operational capabilities without scaling your specialist teams. You can now investigate issues, analyze patterns, and create visualizations using in-context assistance and natural language interactions.

In this post, we share how to get started using Amazon Q Developer in OpenSearch Service and explore some of its key capabilities.

Solution overview

Setting up observability signal data for analysis involves many steps, including instrumenting application code, creating complex queries, creating visualizations and dashboards, configuring appropriate alerts, and often machine learning-based anomaly detectors. This requires significant upfront investment in time, resources, and expertise. Amazon Q Developer in OpenSearch Service introduces natural language exploration and generative AI-based tooling throughout OpenSearch, simplifying both initial setup and ongoing operations. Customers already use natural language based query generation to aid constructing OpenSearch queries; Amazon Q in OpenSearch Service brings in the following additional capabilities:

  • Natural language-based visualizations
  • Result summarization for queries generated with natural language queries
  • Anomaly detector suggestions
  • Alert summarization and insights
  • Best practices guidance

Let’s explore each of these capabilities in detail to understand how they help transform traditional observability workflows and streamline the process of data analysis in the centralized OpenSearch UI.

Natural language-based visualization

Natural language-based visualizations with Amazon Q for OpenSearch Service fundamentally transform how users create and interact with data visualizations. You don’t need to know specialized query languages currently used in OpenSearch Service dashboards to create complex visualizations. For example, you can input requests like “show me a chart of error rates over the last 24 hours broken down by region” or “create a chart showing the distribution of HTTP response codes,” and Amazon Q will automatically generate the appropriate visualization.

To get started with this feature, choose Visualizations in the navigation pane and choose Create New Visualization. The OpenSearch UI has many built-in visualization types. To use the new natural language-based visualization, choose Natural language previewer.

This will bring will bring a new visualization page with a text field where you can enter a query in natural language.

Choose an index pattern on the dropdown menu (openSearch_dashabords_sample_data_logs in this case). Amazon Q interprets your intent, identifies relevant fields, automatically selects the most appropriate visualization type, and applies proper formatting and styling. Amazon Q can also understand multiple dimensions in the data, various aggregation methods, and different time ranges.

Now you’re ready to build your visualization in natural language. For example, for the query “Show me number of distinct IP addresses per day in logs,” we see the following visualization.

Amazon Q generates the visualization as per the instruction. The UI also gives the option to update any component of data, transformations, marks and encoding for the visualization. This window also shows the generated query for the data in PPL. For this example Amazon Q generated this query

source=opensearch_dashboards_sample_data_logs*| stats DISTINCT_COUNT(`ip`) as unique_ips by span(`timestamp`, 1d)

Using this interactive UI, you can customize different aspects of the visualization if needed. For example, if you prefer to use a bar type instead of what Amazon Q generated, you can change the mark type to bar and choose Update, or choose Edit visual and specify new set of instructions for this visualization (for example, “change to bar chart”).

After you have adjusted the visualization to your satisfaction, you can save it to retrieve later. What makes this feature particularly powerful is its ability to understand context and suggest refinements by updating your prompts—if the initial visualization doesn’t quite meet your needs, you can describe the desired changes using the Edit visual option.

Result summarization

Amazon Q acts as an interpretation layer that processes query results into a condensed, structured summary. It can also identify patterns and other significant trends in the data by observing both the qualitative and quantitative characteristics of the results. The system’s effectiveness largely depends on the quality of the underlying data, the specificity of the initial query, and the characteristics of query generation, among other things. Amazon Q also samples the result set for generating this result summarization. These summaries are a good starting point for analysis. For example, for the same query we used last time (“Show me number of distinct IP addresses per day in logs”), Amazon Q will analyze the result set in the Amazon Q Summary section.

Anomaly detector suggestions

As it responds to your query, Amazon Q can make suggestions for creating an anomaly detector based upon your data source selected. It does that by recommending relevant fields of your operational data patterns with a one-click confirmation to create the detector.

Features are aggregation of fields or scripts that determines what constitutes an anomaly. Identifying features and creating a detector to use those features typically requires deep technical understanding of spikes, dips, thresholds and inter-relationship between multiple features. Amazon Q helps reduce this traditional complexity when creating a detector by automatically identifying these features as shown below. You can also make changes to the suggested detector to fine-tune to your needs.

Alerts summarization and insights

Choosing the Amazon Q icon next to alerts generates a concise summary that includes alert definitions, the specific conditions that led to its activation, and an overview of the current state of the monitored system or service.

The insights component provides a higher-level insight into the alerts by highlighting the significance of these alerts, typical conditions that results in these alerts, along with recommendations to help mitigate the conditions of these alerts. To get an insight for an alert, you need to provide additional information about your environment with a knowledge base. For instructions on generating insights, see View alert summaries and insights.

By choosing View in Discover, you can dive deeper into the data behind the alert with a single click, facilitating a seamless transition from alert notification to detailed investigation in Discover. The insights and summarization feature helps accelerate your investigations; care must be taken to identify the root cause of the problem because it will likely require human intervention.

Best practices guidance

Amazon Q Developer in OpenSearch Service not only simplifies operations, but also serves as an intelligent assistant for implementing OpenSearch Service best practices. Amazon Q for OpenSearch Service has been trained on the developer and product documentation, so that it can suggest best practices for operating OpenSearch Service domains, Amazon OpenSearch Serverless collections, and configurations based on your needs for capacity and compliance. To get started, choose the Amazon Q icon on the top right. The assistant maintains the history of the conversations. For the guidance it provides, the assistant cites its sources, providing a helpful link to the documentation. It also provides suggestions to continue the conversation. You can ask questions regarding data access policies, index state managements, sizing leader nodes, or other best practices or operational questions about OpenSearch.

Cost considerations

OpenSearch UI is available for use without other associated costs. Amazon Q Developer for OpenSearch Service is available within OpenSearch UI in the following AWS Regions: US East (N. Virginia), US West (Oregon), Asia Pacific (Mumbai), Asia Pacific (Sydney), Asia Pacific (Tokyo), Canada (Central), Europe (Frankfurt), Europe (London), Europe (Paris), and South America (São Paulo). Because it’s included at the Free Tier, there is no associated cost.

Conclusion

Amazon Q Developer support in OpenSearch Service brings in AI-powered capabilities to help alleviate the traditional barriers that teams face when setting up, monitoring, and troubleshooting their applications. This allows teams of all experience levels to harness the full power of OpenSearch.

We’re excited to see how you will use these new capabilities to transform your observability workflows and drive better operational outcomes. To get started with Amazon Q Developer in OpenSearch Service, refer to Amazon Q Developer is now generally available in Amazon OpenSearch Service


About the Authors

Muthu Pitchaimani is a Search Specialist with Amazon OpenSearch Service. He builds large-scale search applications and solutions. Muthu is interested in the topics of networking and security, and is based out of Austin, Texas.

Dagney Braun is a Senior Manager of Product on the Amazon Web Services OpenSearch team. She is passionate about improving the ease of use of OpenSearch and expanding the tools available to better support all customer use cases.

Save big on OpenSearch: Unleashing Intel AVX-512 for binary vector performance

Post Syndicated from Akash Shankaran, Mulugeta Mammo, Noah Staveley, Assane Diop original https://aws.amazon.com/blogs/big-data/save-big-on-opensearch-unleashing-intel-avx-512-for-binary-vector-performance/

With OpenSearch version 2.19, Amazon OpenSearch Service now supports hardware-accelerated enhanced latency and throughput for binary vectors. When you choose the latest-generation, Intel Xeon instances for your data nodes, OpenSearch uses AVX-512 acceleration to bring up to 48% throughput improvement vs. previous-generation R5 instances, and 10% throughput improvement compared with OpenSearch 2.17 and below. There’s no need to change your settings. You will simply see improvements when you upgrade to OpenSearch 2.19 and use c7i, m7i, and R7i instances.

In this post, we discuss the improvements these advanced processors provide to your OpenSearch workloads, and how it can help you lower your total cost of ownership (TCO).

Difference between full precision and binary vectors

When you use OpenSearch Service for semantic search, you create vector embeddings that you store in OpenSearch. OpenSearch’s k-nearest neighbors (k-NN) plugin provides engines—Facebook AI Similarity Search (FAISS), Non-Metric Space Library (NMSLib), and Apache Lucene—and algorithms—Hierarchical Navigable Small World (HNSW) and Inverted File (IVF)—that store embeddings and compute nearest neighbor matches.

Vector embeddings are high-dimension arrays of 32-bit floating-point numbers (FP32). Large language models (LLMs), foundation models (FMs), and other machine learning (ML) models generate vector embeddings from their inputs. A typical, 384-dimension embedding takes 384 * 4 = 1,536 B. As the number of vectors in the solution grows into the millions (or billions), it is costly to store and work with that much data.

OpenSearch Service supports binary vectors. These vectors use 1 bit to store each dimension. A 384-dimension, binary embedding takes 384 / 8 b = 48 B to store. Of course, in reducing the number of bits, you also lose information. Binary vectors don’t provide recall that is as accurate as full-precision vectors. In trade, binary vectors are substantially less costly and provide substantially better latency.

Hardware acceleration: AVX-512 and popcount instructions

Binary vectors rely on Hamming distance to measure similarity. The Hamming distance between 2-bit strings is the number of positions where corresponding bits differ. The Hamming distance between two binary vectors is the sum of the Hamming distances for the bytes in those vectors. Hamming distance relies on a technique called popcount (population count), which is briefly described in the next section.

For example, for finding the Hamming distance between 5 and 3:

  • 5 = 101
  • 3 = 011
  • Differences at two positions (bitwise XOR): 101 ⊕ 011 = 110 (2 ones)

Therefore, Hamming distance (5, 3) = 2.

Popcount is an operation that counts the number of 1 bits in a binary input. The Hamming distance between two binary inputs is directly equivalent to calculating the popcount of their bitwise XOR result. The AVX-512 accelerator has a native popcount operation, which makes popcount and Hamming distance calculations fast.

OpenSearch 2.19 integrates advanced Intel AVX-512 instructions in the FAISS engine. When you use binary vectors with OpenSearch 2.19 engine in OpenSearch Service, OpenSearch can maximize performance on the latest Intel Xeon processors. The OpenSearch k-NN plugin with FAISS uses a specialized build mode, avx512_spr, that enhances the Hamming distance computation with the __mm512_popcnt_epi64 vector instruction. __mm512_popcnt_epi64 counts the number of logical 1 bits in eight 64-bit integers at once. This reduces the instruction pathlength—the number of instructions the CPU executes— by eight times. The benchmarks in the next sections demonstrate the improvements seen on OpenSearch binary vectors due to this optimization.

There is no special configuration required to take advantage of the optimization, because it’s enabled by default. The requirements to using the optimization are:

  • OpenSearch version 2.19 and above
  • Intel 4th Generation Xeon or newer instances—C7i, M7i, or R7i— for data nodes

Where do binary vector workloads spend the bulk of time?

To put our system through its paces, we created a test dataset of 10 million binary vectors. We chose the Hamming space for measuring distances between vectors because it’s particularly well-suited for binary data. This substantial dataset helped us generate enough stress on the system to pinpoint exactly where performance bottlenecks might occur. If you’re interested in the details, you can find the complete cluster configuration and index settings for this analysis in Appendix 2 at the end of this post.

The following profile analysis of binary vector-based workloads using a flame graph shows that the bulk of time is spent in the FAISS library computing Hamming distances. We observe up to 66% time spent on BinaryIndices in the FAISS library.

Benchmarks and Results

In the next sections, we look at the results of optimizing this logic and the benefits to OpenSearch workloads along two aspects:

  1. Price-performance; with reduced CPU consumption, you might be able to reduce the instances in your domain
  2. Performance gains due to the Intel popcount instruction

Price-performance and TCO gains for OpenSearch users

If you want to take advantage of the performance gains, we recommend the R7i instances, with a high memory:core ratio, for your data nodes. The following table shows the results of benchmarking with a 10-million-vector and 100-million-vector dataset and the resulting improvements on an R7i instance compared to an R5 instance. R5 instances support avx512 instructions, but not the advanced instructions present in avx512_spr. That is only available with R7i and newer Intel instances.

On average, we observed 20% gains on indexing throughput and up to 48% gains on search throughput comparing R5 and R7i instances. R7i instances are about 13% more costly than R5 instances. The price-performance favors the R7is. The 100-million-vector dataset showed slightly better results with search throughput improving more than 40%. In Appendix 1, we document the test configuration, and we present the tabular results in Appendix 3.

The following figures visualize the results with the 10-million-vector dataset.

The following figures visualize the results with the 100-million-vector dataset.

Performance gains due to popcount instruction in AVX-512

This section is for advanced users interested in knowing the extent of improvements the new avx512_spr provides and more details on where the performance gains are coming from. The OpenSearch configuration used in this experiment is documented in Appendix 2.

We ran an OpenSearch benchmark on R7i instances with and without the Hamming distance optimization. You can disable avx512_spr by setting knn.faiss.avx512_spr.disabled in your opensearch.yaml file, as described in SIMD optimization. The data shows that the feature provides a 10% throughput improvement on indexing and search and a 10% reduction in latency if the client load is constant.

The gain is due to the use of __mm512_popcnt_epi64 hardware instruction present on Intel processors, which results in a pathlength reduction for the workloads. The hotspot identified in the earlier section is optimized with code using the hardware instruction. This results in fewer CPU cycles spent to run the same workload and translates to a 10% speed-up for binary vector indexing and latency reduction for search workloads on OpenSearch.

The following figures visualize the benchmarking results.


Conclusion

Improving storage, memory, and compute is key to optimizing vector search. Binary vectors already offer storage and memory benefits over FP32/FP16. This post detailed how our improvements to Hamming distance calculations significantly improve compute performance by up to 48% when comparing R5 and R7i instances on AWS. Whereas binary vectors fall short on matching recall for FP32 counterparts, techniques such as oversampling and rescoring help with improving recall rates. If you’re handling massive datasets, compute costs become a major expense. By migrating to Intel’s R7i and newer offerings on AWS, we’ve demonstrated substantial reductions in infrastructure costs, making these processors a highly efficient solution for users.

Hamming distance with newer AVX-512 instructions support is available on OpenSearch starting with 2.19 and later. We encourage you to give it a try on the latest Intel instances in your preferred cloud environment.

The new instructions also provide additional opportunities to use hardware acceleration in other areas of vector search, such as quantization techniques of FP16 and BF16. We are also interested in exploring the use of other hardware accelerators to vector search, such as AMX and AVX-10.


About the Authors

Akash Shankaran is a Software Architect and Tech Lead in the Xeon software team at Intel. He works on pathfinding opportunities and enabling optimizations on OpenSearch.

Mulugeta Mammo is a Senior Software Engineer and currently leads the OpenSearch Optimization team at Intel.

Noah Staveley is a Cloud Development Engineer currently working in the OpenSearch Optimization team at Intel.

Assane Diop is a Cloud Development Engineer, and currently works in the OpenSearch Optimization team at Intel.

Naveen Tatikonda is a software engineer at AWS, working on the OpenSearch Project and Amazon OpenSearch Service. His interests include distributed systems and vector search.

Vamshi Vijay Nakkirtha is a software engineering manager working on the OpenSearch Project and Amazon OpenSearch Service. His primary interests include distributed systems.

Dylan Tong is a Senior Product Manager at Amazon Web Services. He leads the product initiatives for AI and machine learning (ML) on OpenSearch including OpenSearch’s vector database capabilities. Dylan has decades of experience working directly with customers and creating products and solutions in the database, analytics and AI/ML domain. Dylan holds a BSc and MEng degree in Computer Science from Cornell University.


Notices and disclaimers

Intel and the OpenSearch team collaborated on adding the Hamming distance feature. Intel contributed by designing and implementing the feature, and Amazon contributed by updating the toolchain, including compilers, release management, and documentation. Both teams collected data points showcased in the post.

Performance varies by use, configuration, and other factors. Learn more on the Performance Index website.

Your costs and results may vary.

Intel technologies might require enabled hardware, software, or service activation.


Appendix 1

The following table summarizes the test configuration for results in Appendix 3.

avx512 avx512_spr
vector dimension 768
ef_construction 100
ef_search 100
primary shards 8
replica 1
data nodes 2
data node instance type R5.4xl R7i.4xl
vCPU 16
Cluster manager nodes 3
Cluster manager node instance type c5.xl
data type binary
space type Hamming

 Appendix 2

The following table summarizes the OpenSearch configuration used for this benchmarking.

avx512 avx512_spr
OpenSearch version 2.19
engine faiss
dataset random-768-10M
vector dimension 768
ef_construction 256
ef_search 256
primary shards 4
replica 1
data nodes 2
cluster manager nodes 1
data node instance type R7i.2xl
client instance m6id.16xlarge
data type binary
space type Hamming
Indexing clients 20
query clients 20
force merge segments 1

Appendix 3

This appendix contains the results of the 10-million-vector and 100-million-vector dataset runs.

The following table summarizes the query results in queries per second (QPS).

Query Throughput Without Forcemerge Query Throughput with Forcemerge to 1 Segment
Dataset Dimension avx512 / avx512_spr Query Clients Mean Throughput Median Throughput Mean Throughput Median Throughput
random-768-10M 768 avx512 10 397.00 398.00 1321.00 1319.00
random-768-10M 768 avx512_spr 10 516.00 525.00 1542.00 1544.00
%gain 29.97 31.91 16.73 17.06
random-768-10M 768 avx512 20 424.00 426.00 1849.00 1853.00
random-768-10M 768 avx512_spr 20 597.00 600.00 2127.00 2127.00
%gain 40.81 40.85 15.04 14.79
random-768-100M 768 avx512 10 219 220 668 668
random-768-100M 768 avx512_spr 10 324 324 879 887
%gain 47.95 47.27  31.59 32.78
random-768-100M 768 avx512 20 234 235 756 757
random-768-100M 768 avx512_spr 20 338 339 1054 1062
%gain 44.44 44.26 39.42 40.29

The following table summarizes the indexing results.

Indexing Throughput (documents/second)
Dataset Dimension avx512 / avx512_spr Indexing Clients Mean Throughput Median Throughput Forcemerge (minutes)
random-768-10M 768 avx512 20 58729 57135 61
random-768-10M 768 avx512_spr 20 63595 65240 57
%gain 8.29 14.19 7.02
random-768-100M 768 avx512 16 28006 25381 682
random-768-100M 768 avx512_spr 16 33477 30581 634
%gain 19.54 20.49 7.04

AWS Weekly Roundup: Amazon Nova Premier, Amazon Q Developer, Amazon Q CLI, Amazon CloudFront, AWS Outposts, and more (May 5, 2025)

Post Syndicated from Donnie Prakoso original https://aws.amazon.com/blogs/aws/aws-weekly-roundup-amazon-nova-premier-amazon-q-developer-amazon-q-cli-amazon-cloudfront-aws-outposts-and-more-may-5-2025/

Last week I went to Thailand to attend the AWS Summit Bangkok. It was an energizing and exciting event. We hosted the Developer Lounge, where developers can meet, discuss ideas, enjoy lightning talks, win SWAGs at AWS Builder ID Prize Wheel, take a challenge at Amazon Q Developer Coding Challenge, or learn Generative AI at Learn Amazon Bedrock booth.

Here’s a quick look:

Thank you to AWS Heroes, AWS Community Builders, AWS User Group leaders and developers for your collaboration.

Coming up next in ASEAN is AWS Summit Singapore—make sure you don’t miss it by registering now.

Last Week’s Launches
Here are some launches last week that caught my attention:

  • Amazon Nova Premier Now Generally Available — Amazon Nova Premier, our most capable model for complex tasks and teacher for model distillation, is now generally available in Amazon Bedrock. It excels at complex tasks requiring deep context understanding and multistep planning, while processing text, images, and videos with a 1M token context length. With Nova Premier and Amazon Bedrock Model Distillation, you can create highly capable, cost-effective, and low-latency versions of Nova Pro, Lite, and Micro, for your specific needs.

  • Amazon Q Developer elevates the IDE experience with new agentic coding experience — This new interactive, agentic coding experience for Visual Studio Code allows Q Developer to intelligently take actions on behalf of the developer. Amazon Q Developer introduces an interactive coding experience in Visual Studio Code, offering real-time collaboration for coding, documentation, and testing. It provides transparent reasoning, and supports automated or step-by-step changes in multiple languages.

  • New Foundation Models in Amazon Bedrock — Amazon Bedrock expands its model offerings with two significant additions:
    • Writer’s Palmyra X5 and X4 models feature extensive context windows (1M and 128K tokens respectively) and excel in complex reasoning for enterprise applications. They support multistep tool-calling and adaptive thinking with high reliability standards.
    • Meta’s Llama 4 Scout 17B and Maverick 17B models offer natively multimodal capabilities using mixture-of-experts architecture for enhanced reasoning and image understanding. They support multiple languages and extended context processing, with simplified integration through the Bedrock Converse API.
  • Second-Generation AWS Outposts Racks Released AWS announces the general availability of second-generation Outposts racks with significant enhancements including the latest x86 EC2 instances, simplified networking, and accelerated networking options. These improvements deliver doubled vCPU, memory, and network bandwidth, 40% better performance, and support for ultra-low latency workloads, making them ideal for demanding on-premises deployments.

  • Amazon CloudFront SaaS Manager Launches — Amazon CloudFront SaaS Manager helps SaaS providers and web hosting platforms efficiently manage content delivery across multiple customer domains. The service dramatically reduces operational complexity while providing high-performance content delivery and enterprise-grade security for every customer domain.

  • Amazon Aurora Now Supports PostgreSQL 17 — Amazon Aurora now supports PostgreSQL 17.4, offering community improvements and Aurora-specific enhancements like optimized memory management and faster failovers. The release includes new features for Babelfish, security fixes, and updated extensions, available in all AWS Regions.
  • CloudWatch Introduces Tiered Pricing for Lambda Logs — Amazon CloudWatch launches tiered pricing for AWS Lambda logs and new delivery destinations. Pricing in US East starts at $0.50/GB for CloudWatch and $0.25/GB for S3 and Firehose, both tiering down to $0.05/GB. This update enhances flexibility in log management across all supporting Regions.
  • RDS for MySQL Updates Minor VersionsAmazon RDS for MySQL now supports minor versions 8.0.42 and 8.4.5, delivering security fixes, bug fixes, and performance improvements. Users can upgrade automatically during maintenance windows or use Blue/Green deployments for safer updates.
  • Amazon Bedrock Model Distillation Generally AvailableAmazon Bedrock Model Distillation is now generally available, supporting new models like Amazon Nova and Claude 3.5. It enables smaller models to accurately predict function calling for Agents, delivering up to 500% faster responses and 75% lower costs with minimal accuracy loss for RAG use cases. The service includes automated workflows for data synthesis and student model training.
  • AI Search Flow Builder for Amazon OpenSearch Service Amazon OpenSearch Service now offers an AI search flow builder for OpenSearch 2.19+ domains. This low-code designer enables creation of sophisticated AI-enhanced search flows using AWS and third-party services, supporting use cases like RAG, query rewriting, and semantic encoding.

From Community.AWS
Here’s my personal favorites posts from community.aws:

Upcoming AWS events
Check your calendars and sign up for these upcoming AWS events:

  • AWS Summit — Join free online and in-person events that bring the cloud computing community together to connect, collaborate, and learn about AWS. Register in your nearest city: Poland (6 May), Bengaluru (May 7 – 8), Hong Kong (May 8), Seoul (May 14-15), Singapore (May 29), and Sydney (June 4–5).
  • AWS re:Inforce – Mark your calendars for AWS re:Inforce (June 16–18) in Philadelphia, PA. AWS re:Inforce is a learning conference focused on AWS security solutions, cloud security, compliance, and identity. You can subscribe for event updates now!
  • AWS Partners Events – You’ll find a variety of AWS Partner events that will inspire and educate you, whether you are just getting started on your cloud journey or you are looking to solve new business challenges.
  • AWS Community Days – Join community-led conferences that feature technical discussions, workshops, and hands-on labs led by expert AWS users and industry leaders from around the world: Yerevan, Armenia (May 24), Zurich, Switzerland (May 25), and Bengaluru, India (May 25).

You can browse all upcoming in-person and virtual events.

That’s all for this week. Check back next Monday for another Weekly Roundup!


How is the News Blog doing? Take this 1 minute survey!

(This survey is hosted by an external company. AWS handles your information as described in the AWS Privacy Notice. AWS will own the data gathered via this survey and will not share the information collected with survey respondents.)

Amazon OpenSearch Service launches flow builder to empower rapid AI search innovation

Post Syndicated from Dylan Tong original https://aws.amazon.com/blogs/big-data/amazon-opensearch-service-launches-flow-builder-to-empower-rapid-ai-search-innovation/

You can now access the AI search flow builder on OpenSearch 2.19+ domains with Amazon OpenSearch Service and begin innovating AI search applications faster. Through a visual designer, you can configure custom AI search flows—a series of AI-driven data enrichments performed during ingestion and search. You can build and run these AI search flows on OpenSearch to power AI search applications on OpenSearch without you having to build and maintain custom middleware.

Applications are increasingly using AI and search to reinvent and improve user interactions, content discovery, and automation to uplift business outcomes. These innovations run AI search flows to uncover relevant information through semantic, cross-language, and content understanding; adapt information ranking to individual behaviors; and enable guided conversations to pinpoint answers. Nonetheless, search engines are limited in native AI-enhanced search support, so builders develop middleware to complement search engines to fill in functional gaps. This middleware consists of custom code that runs data flows to stitch data transformations, search queries, and AI enrichments in varying combinations tailored to use cases, datasets, and requirements.

With the new AI search flow builder for OpenSearch, you have a collaborative environment to design and run AI search flows on OpenSearch. You can find the visual designer within OpenSearch Dashboards under AI Search Flows, and get started quickly by launching preconfigured flow templates for popular use cases like semantic, multimodal or hybrid search, and retrieval augmented generation (RAG). Through configurations, you can create customize flows to enrich search and index processes through AI providers like Amazon Bedrock, Amazon SageMaker, Amazon Comprehend, OpenAI, DeepSeek, and Cohere. Flows can be programmatically exported, deployed, and scaled on any OpenSearch 2.19+ cluster through OpenSearch’s existing ingest, index, workflow and search APIs.

In the remainder of the post, we’ll walk through a couple of scenarios to demonstrate the flow builder. First, we’ll enable semantic search on your old keyword-based OpenSearch application without client-side code changes. Next, we’ll create a multi-modal RAG flow, to showcase how you can redefine image discovery within your applications.

AI search flow builder key concepts

Before we get started, let’s cover some key concepts. You can use the flow builder through APIs or a visual designer. The visual designer is recommended for helping you manage workflow projects. Each project contains at least one ingest or search flow. Flows are a pipeline of processor resources. Each processor applies a type of data transform such as encoding text into vector embeddings, or summarizing search results with a chatbot AI service.

Ingest flows are created to enrich data as it’s added to an index. They consist of:

  1. A data sample of the documents you want to index.
  2. A pipeline of processors that apply transforms on ingested documents.
  3. An index constructed from the processed documents.

Search flows are created to dynamically enrich search request and results. They consist of:

  1. A query interface based on the search API, defining how the flow is queried and ran.
  2. A pipeline of processors that transform the request context or search results.

Generally, the path from prototype to production starts with deploying your AI connectors, designing flows from a data sample, then exporting your flows from a development cluster to a preproduction environment for testing at-scale.

Scenario 1: Enable semantic search on an OpenSearch application without client-side code changes

In this scenario, we have a product catalog that was built on OpenSearch a decade ago. We aim to improve its search quality, and in turn, uplift purchases. The catalog has search quality issues, for instance, a search for “NBA,” doesn’t surface basketball merchandise. The application is also untouched for a decade, so we aim to avoid changes to client-side code to reduce risk and implementation effort.

A solution requires the following:

  • An ingest flow to generate text embeddings (vectors) from text in an existing index.
  • A search flow that encodes search terms into text embeddings, and dynamically rewrites keyword-type match queries into a k-NN (vector) query to run a semantic search on the encoded terms. The rewrite allows your application to transparently run semantic-type queries through keyword-type queries.

We will also evaluate a second-stage reranking flow, which uses a cross-encoder to rerank results as it can potentially boost search quality.

We’ll accomplish our task through the flow builder. We begin by navigating to AI Search Flows in the OpenSearch Dashboard, and selecting Semantic Search from the template catalog.

image of the flow template catalog.

This template requires us to select a text embedding model. We’ll use Amazon Bedrock Titan Text, which was deployed as a prerequisite. Once the template is configured, we enter the designer’s main interface. From the preview, we can see that the template consists of a preset ingestion and search flow.

image of the visual flow designer.

The ingest flow requires us to provide a data sample. Our product catalog is currently served by an index containing the Amazon product dataset, so we import a data sample from this index.

importing a data sample from an existing index.

The ingest flow includes a ML Inference Ingest Processor, which generates machine learning (ML) model outputs such as embeddings (vectors) as your data is ingested into OpenSearch. As previously configured, the processor is set to use Amazon Titan Text to generate text embeddings. We map the data field that holds our product descriptions to the model’s inputText field to enable embedding generation.

Configuring the ML Inference Ingest Processor to generate text embeddings.

We can now run our ingest flow, which builds a new index containing our data sample embeddings. We can inspect the index’s contents to confirm that the embeddings were successfully generated.

Inspect your new index and embeddings from the flow designer.

Once we have an index, we can configure our search flow. We’ll start with updating the query interface, which is preset to a basic match query. The placeholder my_text has to be replaced with the product descriptions. With this update, our search flow can now respond to queries from our legacy application.

Update the search flow’s query interface

The search flow includes an ML Inference Search Processor. As previously configured, it’s set to use Amazon Titan Text. Since it’s added under Transform query, it’s applied to query requests. In this case, it will transform search terms into text embeddings (a query vector). The designer lists the variables from the query interface, allowing us to map the search terms (query.match.text.query), to the model’s inputText field. Text embeddings will now be generated from the search terms whenever our index is queried.

Configure a ML Inference Search Processor to generate query vectors.

Next, we update the query rewrite configurations, which is preset to rewrite the match query into a k-NN query. We replace the placeholder my_embedding with the query field assigned to your embeddings. Note that we could rewrite this to another query type, including a hybrid query, which may improve search quality.

Configure a query rewrite.

Let’s compare our semantic and keyword solutions from the search comparison tool. Both solutions are able to find basketball merchandise when we search for “basketball.”

Keyword versus semantic search results on the term “basketball”.

But what happens if we search for “NBA?” Only our semantic search flow returns results because it detects the semantic similarities between “NBA” and “basketball.”

Keyword versus semantic search results on the term “NBA”.

We’ve managed improvements, but we might be able to do better. Let’s see if reranking our search results with a cross-encoder helps. We’ll add a ML Inference Search Processor under Transform response, so that the processor applies to search results, and select Cohere Rerank. From the designer, we see that Cohere Rerank requires a list of documents and the query context as input. Data transformations are needed to package the search results into a format that can be processed by Cohere Rerank. So, we apply JSONPath expressions to extract the query context, flatten data structures, and pack the product descriptions from our documents into a list.

configure a ML Inference Search Processor with a reranker and apply JSONPath expressions.

Let’s return to the search comparison tool to compare our flow variations. We don’t observe any meaningful difference in our previous search for “basketball” and “NBA.” However, improvements are observed when we search, “hot weather.” On the right, we see that the second and fifth search hit moved 32 and 62 spots up, and returned “sandals” that are well suited for “hot weather.”

Reranked search results for “hot weather” demonstrate search quality gains.

We’re ready to proceed to production, so we export our flows from our development cluster into our preproduction environment, use the workflow APIs to integrate our flows into automations, and scale our test processes through the bulk, ingest and search APIs.

Scenario 2: Use generative AI to redefine and elevate image search

In this scenario, we have photos of millions of fashion designs. We’re looking for a low-maintenance image search solution. We will use generative multimodal AI to modernize image search, eliminating the need for labor to maintain image tags and other metadata.

Our solution requires the following:

  • An ingest flow which uses a multimodal model like Amazon Titan Multimodal Embeddings G1 to generate image embeddings.
  • A search flow which generates text embeddings with a multimodal model, runs a k-NN query for text to image matching, and sends matching images to a generative model like Anthropic’s Claude Sonnet 3.7 that can operate on text and images.

We’ll start from the RAG with Vector Retrieval template. With this template, we can quickly configure a basic RAG flow. The template requires an embedding and large language model (LLM) that can process text and image content. We use Amazon Bedrock Titan Multimodal G1 and Anthropic’s Claude Sonnet 3.7, respectively.

From the designer’s preview panel, we can see similarities between this template and the semantic search template. Again, we seed the ingest flow with a data sample. Like the previous example, we use the Amazon product dataset except we replace the production descriptions with base64 encoded images because our models require base64 images, and this solution doesn’t require text. We map the base64 image data to the corresponding Amazon Titan G1 inputs to generate embeddings. We then run our ingest flow and confirm that our index contains base64 images and corresponding embeddings.

Ingest flow creates a new index containing base64 images and corresponding embeddings.

The initial steps for configuring this search flow are similar to the previous scenario: we update the query interface, map the query text fields to the model inputs for the ML Inference Search Processor, and revise the query rewrite settings. The main difference with this flow is the additional response processor set to use Anthropic’s Claude Sonnet 3.7 to process images.

We need to configure an LLM prompt that includes the query context and instructions for the LLM to play the role of a fashion advisor, and provide commentary about the image payload.

configure a LLM prompt to generate commentary for product images.

Next, we map the prompt and the base64 image data field to the model’s inputs accordingly.

Configure the ML Inference Search Processor to process search results with Anthropic Claude Sonnet 3.7.

Let’s test our multimodal RAG flow by searching for “sunset colored dresses.” We observe the following results.

This beautiful dress perfectly captures the essence of a sunset with its gorgeous ombre color gradient. Starting with a soft peachy pink at the top, it transitions into a vibrant orange in the middle, and finishes with a bright yellow at the hem – just like the colors of the sky as the sun dips below the horizon. The dress features a simple, casual silhouette with short cap sleeves and appears to have a comfortable, relaxed fit that would flatter many body types. The tie-dye effect gives it a bohemian, carefree vibe that’s perfect for summer outings, beach vacations, or casual evening events. I recommend this sunset-colored dress because it’s eye-catching, versatile, and embodies that magical sunset glow that can brighten any occasion. The colors would complement warm skin tones particularly well, and you could easily dress it up with gold accessories or keep it casual with simple sandals.
This vibrant tie-dye dress perfectly captures the essence of a sunset with its beautiful gradient of colors. The dress features bands of golden yellow, fiery orange, and rich pink that blend together seamlessly, reminiscent of the sky at dusk. The strapless design showcases the shoulders elegantly, while the gathered waist creates a flattering silhouette that flows into a comfortable, knee-length skirt. This dress would be an excellent choice for summer events, beach vacations, or casual outings. The sunset color palette is not only on-trend but also versatile enough to pair with neutral accessories. I recommend this piece for its eye-catching colors, comfortable fit, and the way it embodies the warm, relaxed feeling of watching a beautiful sunset.

Without any image metadata, OpenSearch finds images of sunset-colored dresses, and responds with accurate and colorful commentary.

Conclusion

The AI search flow builder is available in all AWS Regions that support OpenSearch 2.19+ on OpenSearch Service. To learn more, refer to Building AI search workflows in OpenSearch Dashboards, and the available tutorials on GitHub, which demonstrate how to integrate various AI models from Amazon Bedrock, SageMaker, and other AWS and third-party AI services.


About the authors

Dylan Tong is a Senior Product Manager at Amazon Web Services. He leads the product initiatives for AI and machine learning (ML) on OpenSearch including OpenSearch’s vector database capabilities. Dylan has decades of experience working directly with customers and creating products and solutions in the database, analytics and AI/ML domain. Dylan holds a BSc and MEng degree in Computer Science from Cornell University.

Tyler Ohlsen is a software engineer at Amazon Web Services focusing mostly on the OpenSearch Anomaly Detection and Flow Framework plugins.

Mingshi Liu is a Machine Learning Engineer at OpenSearch, primarily contributing to OpenSearch, ML Commons and Search Processors repo. Her work focuses on developing and integrating machine learning features for search technologies and other open-source projects.

Ka Ming Leung (Ming) is a Senior UX designer at OpenSearch, focusing on ML-powered search developer experiences as well as designing observability and cluster management features.

Accelerate data pipeline creation with the new visual interface in Amazon OpenSearch Ingestion

Post Syndicated from Samuel Selvan original https://aws.amazon.com/blogs/big-data/accelerate-data-pipeline-creation-with-the-new-visual-interface-in-amazon-opensearch-ingestion/

Amazon OpenSearch Ingestion is a fully managed serverless pipeline that allows you to ingest, filter, transform, enrich, and route data to an Amazon OpenSearch Service domain or Amazon OpenSearch Serverless collection. OpenSearch Ingestion is capable of ingesting data from a wide variety of sources and has a rich ecosystem of built-in processors to take care of your most complex data transformation needs.

Today, we’re launching a new visual interface for OpenSearch Ingestion that makes it simple to create and manage your data pipelines from the AWS Management Console. With this new feature, you can build pipelines in minutes without writing complex configurations manually.

The new visual interface brings three key improvements to help streamline your workflow:

  • A guided visual workflow that walks you through pipeline creation
  • Automatic permission setup that eliminates manual AWS Identity and Access Management (IAM) policy management
  • Real-time validation checks that help catch issues early

These enhancements make it straightforward to ingest, transform, enrich, and route your data, whether you’re setting up your first pipeline or architecting sophisticated data workflows with multiple transformations and sinks.

In this post, we walk through how these new features work and how you can use them to accelerate your data ingestion projects.

Automatic discovery

Before the visual interface, creating an OpenSearch Ingestion pipeline started with selecting a blueprint that provided a template with placeholders for sources and sinks. You would then need to manually modify this template to match your specific requirements.

The new visual interface improves this process by automatically discovering your sources and sinks as you build. Instead of modifying template code, you can simply select from available resources on the dropdown menus and watch your pipeline configuration build in real time.

This automatic discovery feature eliminates the need to switch between different service consoles to find your source and sink details. Previously, you had to navigate to services like Amazon Simple Storage Service (Amazon S3) or Amazon DynamoDB to copy resource details and Amazon Resource Name (ARN) values, then switch back to enter them into your template. This keeps you focused on your pipeline design, streamlining the entire creation process.

Automated IAM role management

With automatic permission creation, you no longer need to manually create IAM policies for your pipelines and the components involved. With the new UI, you can now create a unified IAM role automatically, granting the necessary permissions for all the components in your pipeline. This significantly reduces the complexity of security management and minimizes the risk of permission-related errors. You can also still use your existing roles if you have them defined already.

Real-time validation

The new interface introduces real-time validation capabilities that go far beyond basic syntax checking. Whereas previous versions only validated keyword syntax, the new interface executes your processor chain in real time, catching both configuration and runtime errors as you build. As you construct your pipeline, the interface continuously validates your entire configuration, helping you identify and resolve potential issues like processor misconfigurations, data type mismatches, or transformation errors before deployment. This proactive, execution-based validation approach helps make sure your pipelines work as intended from the start, alleviating the need to wait until runtime to discover processing chain issues.

Now that we’ve covered the key features, let’s walk through the process of creating a pipeline using the new interface.

Create a pipeline in OpenSearch Ingestion

Getting started with the visual interface is straightforward — you can choose a blueprint as your pipeline foundation or start with a clean slate from a blank template. The interface then guides you through each step, using intelligent resource discovery and automatic population features to simplify the entire creation process. For this post, we use the “Zero-ETL with DynamoDB” blueprint.

The visual interface streamlines source configuration by presenting your DynamoDB tables on an easy-to-navigate dropdown menu. After you select a table, the interface handles all the technical details, including automatically retrieving and configuring the ARN. This same functionality extends to Amazon S3 export configuration, where you can choose Browse S3 to select your bucket and folders directly within the pipeline creation workflow.

After your source is configured, you can enhance your pipeline with processors to transform your data. The processor configuration panel starts with a search field where you can find and select the processor you need. You can choose Add to include processors also then arrange them in the desired order. This flexibility allows you to build complex data transformation workflows by combining different processors in the sequence you need.

If there are any issues, such as missing required fields, the interface displays clear error messages, allowing you to address problems before moving forward. This validation at each step makes sure your pipeline is properly configured before deployment.

The following screen capture shows an example of the visual interface.

The interface’s real-time validation capabilities extend to processor configuration, helping you identify and resolve potential issues before they impact your pipeline. Each processor’s configuration is validated as you build your pipeline, with clear error messages guiding you toward proper setup. This proactive validation approach makes sure your data transformation logic is sound before moving to the next stage of pipeline creation.

The sink configuration panel offers flexibility in choosing your OpenSearch destination. You can select between a managed cluster or serverless option, depending on your specific needs. For added convenience, we’ve integrated the ability to create a new OpenSearch domain directly from this interface, streamlining the end-to-end pipeline setup process.

The sink configuration provides options for both dynamic and custom mapping. Dynamic mapping automatically handles data type detection and mapping creation, whereas custom mapping gives you precise control over your data structure. To maintain data reliability, you can enable a dead-letter queue (DLQ)—a holding area for messages that couldn’t be processed successfully—to capture and manage any failed events.

As you make choices in the visual interface, the corresponding YAML/JSON configuration updates in real time. This immediate feedback helps you understand how your selections translate into technical configurations, from index naming to mapping options and advanced settings like flush timeout and document versioning.

Security configuration is now seamless with automated IAM role management. The interface intelligently handles the creation and management of permissions across all pipeline components. You can either create a new service role or use an existing one, and the interface automatically generates a unified IAM role that provides the precise permissions needed across pipeline components—from your source to Amazon S3 components needed for the DLQ and OpenSearch/Amazon S3 sinks. This automation not only saves time but also reduces the risk of permission-related errors that could occur when managing access controls across multiple resources. The following screen capture shows an example.

By consolidating resource selection into a single interface, we’ve eliminated the need to navigate between multiple AWS services. This saves time and reduces the potential for errors that could occur when manually copying resource identifiers. Once a pipeline is created using the visual interface, you can also edit a pipeline using the same visual interface to quickly alter pipeline configuration.

Conclusion

The new visual interface for OpenSearch Ingestion introduces guided visual workflows that simplify pipeline creation, automatic discovery of resources, automated IAM role management, real-time validation, and dynamic configuration previews. These enhancements collectively streamline the pipeline creation process, reduce the potential for errors, and provide a more intuitive experience for users of all skill levels.

Ready to get started? Visit the OpenSearch Service console today and begin building your first visual pipeline. With this new interface, you can transform your data ingestion workflows and unlock new insights from your data more quickly and efficiently than ever before.


About the authors

Sam Selvan is a Principal Specialist Solution Architect with Amazon OpenSearch Service.

Jagadish Kumar (Jag) is a Senior Specialist Solutions Architect at AWS focused on Amazon OpenSearch Service. He is deeply passionate about Data Architecture and helps customers build analytics solutions at scale on AWS.