Tag Archives: AWS Glue

Secure generative SQL with Amazon Q

Post Syndicated from Gregory Knowles original https://aws.amazon.com/blogs/big-data/secure-generative-sql-with-amazon-q/

Amazon Q generative SQL brings generative AI capabilities to help speed up deriving insights from your Amazon Redshift data warehouses and AWS Glue Data Catalog, generating SQL for Amazon Redshift or Amazon Athena. With Amazon Q, you get SQL commands generated with your context. This means you can focus on deriving insights faster, rather than having to first learn potentially complex schemas. Without generative SQL, your data analysts might have to frequently switch between different types of SQL, which can further slow analysis down. Amazon Q generative SQL can help by generating SQL statements from natural language and speeding up development. This can help onboard analysts faster and improve analyst productivity. The generative SQL experience is available through Amazon SageMaker Unified Studio and Amazon Redshift Query Editor v2.

To scale the use of generative SQL in production scenarios, you need to consider how relevant and accurate SQL is generated. In doing so, it’s important to understand what data is used and how your information is protected. Amazon Q generative SQL is designed to keep your data secure and private. Your queries, data, and database schemas are not used to train generative AI foundation models (FMs). For more information, see Considerations when interacting with Amazon Q generative SQL.

In the post Write queries faster with Amazon Q generative SQL for Amazon Redshift, we provided general advice around getting started with generative SQL. In this post, we discuss the design and security controls in place when using generative SQL and its use in both SageMaker Unified Studio and Amazon Redshift Query Editor v2.

Solution overview

Generating relevant SQL requires context from your data warehouse or data catalog schemas. Your analysts can ask free text or natural language questions in the Amazon Q chat window and have SQL statements returned that reference your tables and columns. It’s important that the generated SQL is consistent with your schema so that it can find the most relevant fields to answer questions and generate queries that accurately reference data. In SageMaker Unified Studio or Amazon Redshift Query Editor v2, when the Amazon Q chat window is open, database metadata that is viewable under the connection context is made available to Amazon Q for SQL generation. This means that only the schema information that the connecting user can access is used. Tables or database objects the user doesn’t have access to are excluded.

When a user submits questions in the Amazon Q chat window, a search algorithm is used to find the most relevant context from the available database schema metadata information. This context is combined with the user’s question and used as a prompt to a large language model (LLM) to generate a SQL statement. The supporting information is cached so that your data source doesn’t need to be queried every time a user initiates SQL generation. Instead, data source metadata will be periodically refreshed if it remains in use, or you can trigger a manual refresh. If the data is not being used, Amazon Q will automatically delete it. Where applicable, the information used to support SQL generation is encrypted with an AWS Key Management Service (AWS KMS) customer managed KMS key where one has been specified in the SageMaker Unified Studio or Amazon Redshift Query Editor v2 settings. Otherwise, an AWS managed key is used. Your information is encrypted in transit and at rest.

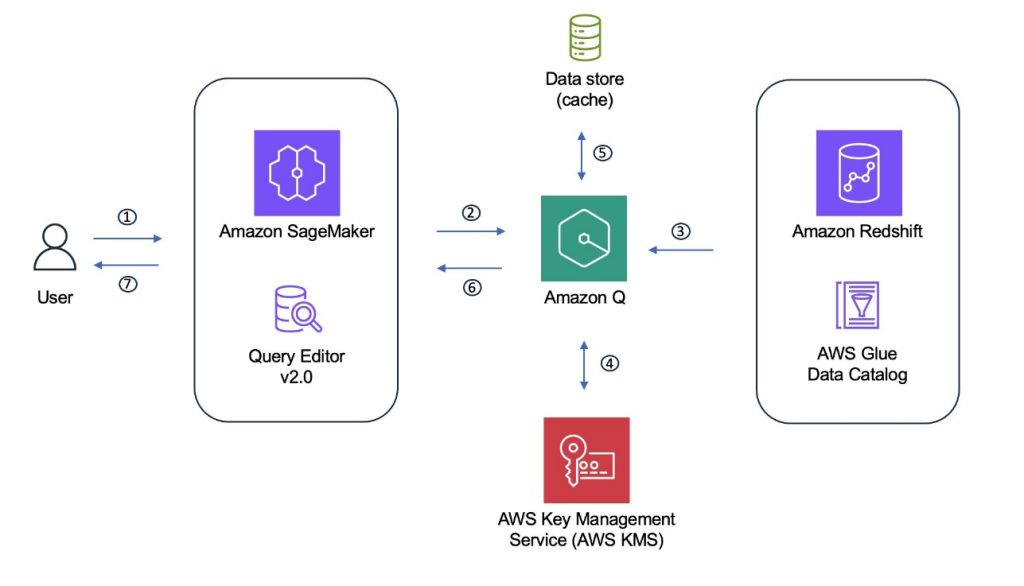
The following diagram shows the process flow for SQL generation when using SageMaker Unified Studio or the Amazon Redshift Query Editor and using Amazon Redshift or Data Catalog source data.

Process diagram for SQL generation

The Amazon Q generative SQL process can be summarized as the following steps:

  1. A user interacts with the Amazon Q chat pane through SageMaker Unified Studio or the Amazon Redshift Query Editor.
  2. The SQL chat frontend sends the prompt along with the connection configuration to Amazon Q.
  3. Amazon Q uses the connection context to retrieve information that will support SQL generation if this data is not already available.
  4. Amazon Q encrypts the retrieved information under the appropriate AWS managed or customer managed KMS key. The information is subsequently decrypted on retrieval.
  5. The information is stored along with custom context information, if this has been provided.
  6. Relevant context from the combined information is selected and added to the user’s questions and sent to an LLM to generate a SQL statement, which is returned to the user.
  7. The user can decide whether to run the statement and can provide feedback on usefulness and accuracy.

Additional context to enhance SQL generation

You can provide further context to supplement the database schema information, which can help improve the accuracy and relevancy of the generated SQL.

One option is to provide custom context. Custom context gives the option to specify instructions and extra information, such as descriptions of tables and columns. These descriptions can then be used to help the selection of relevant tables and attributes when generating SQL statements. This is particularly relevant when your schema uses more obscure naming that might not directly relate to business terms or uses non-standard abbreviations. For example, consider a table called sls_r1_2024. With custom context, you can add a table description specifying that, for example, the table includes sales information across stores in the US region for the calendar year 2024. This information can help the LLM generate SQL referencing the correct tables. The same approach can be applied to columns within the table. Your custom context is encrypted using a customer managed KMS key if one has been specified (during Amazon Redshift Query Editor account creation or SageMaker Unified Studio project creation) or an AWS managed key otherwise.

You can also introduce constraints using custom context. For example, you can explicitly include or exclude specific schemas, tables, or columns from SQL query generation. Similarly, specific topics can also be disallowed, such as not generating SQL statements to support financial reporting. For more details about the information that can be supplied, refer to Custom context.

Another option is to grant SQL query history access to the user establishing the connection. This information is then also made available to enhance SQL generation and to provide the LLM with examples of relevant queries. Be aware that granting wider SQL query history access to the connecting user, and therefore also the generative SQL workflow, allows viewing of queries over tables or objects the user might not have access to. Furthermore, string literals might be present in historic statements that might contain sensitive information. To help mitigate this risk, you could instead use the CuratedQueries section of custom context to provide predefined question and answer examples, without exposing all user queries.

Generated statement response

Before a SQL statement is returned to the user, Amazon Q tries to detect syntax issues. This step helps improve the likelihood that only valid SQL syntax is returned. Amazon Q will use the available information for the user to return statements that align with user permissions, to reduce scenarios where users can’t run generated statements. For example, if you have given access to SQL query history information, then the SQL generation step might produce a query statement referencing a table that the user asking the question doesn’t have access to. Amazon Q minimizes the occurrence of this scenario by assessing if the generated SQL aligns with user permissions and updating the statement if not. User permissions are not bypassed through the use of Amazon Q generative SQL. If a statement was returned referencing a table the user doesn’t have access to, the authorization applied to the user will enforce access control when the statement is executed.

Statements generated by Amazon Q that could potentially change your database, such as DML or DDL statements, are returned with a warning. The warning highlights to the user that running the statement could potentially modify the database. Again, these statements are only executable if the user has the required permissions.

Prerequisites

Amazon Q generative SQL works with your Redshift data warehouses and Data Catalog tables. To get started, you should have data available in either or both of these environments. To use Amazon Q generative SQL with your AWS Glue tables, you need a SageMaker Unified Studio domain. Within your domain, you can use the Amazon Q chat integration to ask questions of your data and have SQL generated. This also works for Amazon Redshift data sources available in the domain. You can use Amazon Q generative SQL without a SageMaker Unified Studio domain using the Amazon Redshift Query Editor. Access to the editor enables Amazon Q chat integration against your Amazon Redshift data sources.

Enable Amazon Q generative SQL

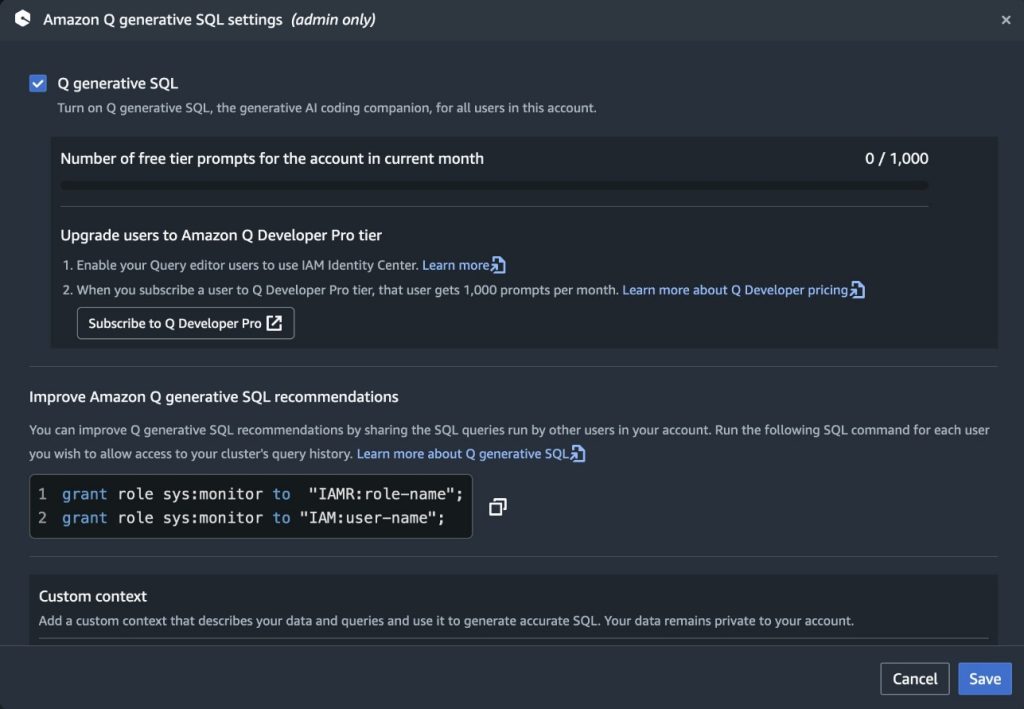
You can control access to generative SQL at the account-Region level in the Amazon Redshift Query Editor or at the SageMaker Unified Studio domain level. To enable this feature, an account admin must explicitly turn on Amazon Q generative SQL. By default, the feature is not accessible to your users. Administrators that have permission for the sqlworkbench:UpdateAccountQSqlSettings AWS Identity and Access Management (IAM) action can turn the Amazon Q generation SQL feature on or off through the admin window, as illustrated in the following sections. When turned off, this will restrict users from opening the Amazon Q chat pane and help prevent interaction with generative SQL.

Enable Amazon Q in your SageMaker domain

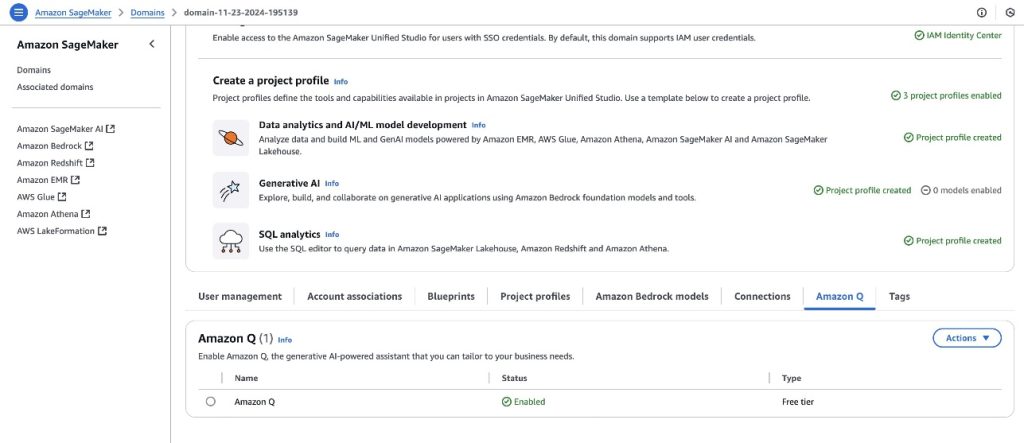
To enable Amazon Q in your SageMaker domain, you can navigate to the Amazon Q tab on the domain settings page and choose to enable the service. For more information, see Amazon Q in Amazon SageMaker Unified Studio.

Enable Amazon Q in SageMaker Unified Studio domain

Enable Amazon Q in Amazon Redshift

To enable Amazon Q generative SQL from the Amazon Redshift Query Editor, access the Amazon Q generative SQL settings. This requires the administrator to have the sqlworkbench:UpdateAccountQSqlSettings permission in their IAM policy. For more information, see Updating generative SQL settings as an administrator.

Enabling Amazon Q generative SQL from Redshift query editor

With generative SQL enabled at the account-Region level, you can restrict access to specific users with IAM controls. IAM administrators can build IAM policies that allow or deny access to the action sqlworkbench:GetQSqlRecommendations. For more information, refer to Actions, resources, and condition keys for AWS SQL Workbench. Policies can then be associated with IAM users or roles to control access to SQL generation at a more granular level. An appropriately scoped service control policy (SCP) can be used to limit access to SQL generation to specific accounts within your organization if required.

The following is an example policy denying access to use SQL generation:

{
"Version": "2012-10-17",
    "Statement": [
        {
"Sid": "DenyAccessToAmazonQGenerativeSql",
            "Effect": "Deny",
            "Action": [
                "sqlworkbench:GetQSqlRecommendations"
            ],
            "Resource": "*",
        }
    ]
}

Cross-Region inference

Amazon Q Developer uses cross-Region inference to distribute traffic across different AWS Regions, which provides increased throughput and resilience during high demand periods, improved performance, and access to the latest Amazon Q Developer capabilities.

When a request is made from an Amazon Q Developer profile, it is kept within the Regions in the same geography as the original data. Although this doesn’t change where the data is stored, the requests and output results might move across Regions during the inference process. Data is encrypted when transmitted across Amazon’s network. For more information on cross-Region inference, see Cross-region processing in Amazon Q Developer.

Monitoring

To monitor which IAM users or roles are interacting with generative SQL, you can use AWS CloudTrail. CloudTrail monitors API calls and logs which identities have performed particular actions. When a user first asks a question, a CloudTrail event is emitted called IngestQSqlMetadata. This is a result of Amazon Q starting the metadata ingest process. Ingestion is an asynchronous operation, so there might be a series of GetQSqlMetadataStatus events. This is due to the workflow checking the ingestion process status.

After the workflow has completed successfully, each question sees a GetQSqlRecommendation event. This is the result of users submitting questions and triggering generation of SQL statements. The following is an example CloudTrail event for GetQSqlRecommendation. In this example, Amazon Q emits detailed CloudTrail events highlighting the warehouse being queried, IAM principal calling Amazon Q, and the entire response structure from Amazon Q in responseElements:

{
    "eventVersion": "1.09",
    "userIdentity": {
        "type": "AssumedRole",
        "principalId": "AROA123456789EXAMPLE:demouser",
        "arn": "arn:aws:sts::111122223333:assumed-role/DemoUser",
        "accountId": "111122223333",
        "accessKeyId": "ASIAIOSFODNN7EXAMPLE",
        "sessionContext": {
            "sessionIssuer": {
                "type": "Role",
                "principalId": "AROA123456789EXAMPLE",
                "arn": "arn:aws:iam::111122223333:role/DemoUser",
                "accountId": "111122223333",
                "userName": "DemoUser"
            },
            "attributes": {
                "creationDate": "2025-01-17T05:31:01Z",
                "mfaAuthenticated": "false"
            }
        }
    },
    "eventTime": "2025-01-17T05:34:51Z",
    "eventSource": "sqlworkbench.amazonaws.com",
    "eventName": "GetQSqlRecommendation",
    "awsRegion": "us-east-1",
    "sourceIPAddress": "122.171.17.139",
    "userAgent": "Mozilla/5.0 (Macintosh; Intel Mac OS X 10.15; rv:133.0) Gecko/20100101 Firefox/133.0",
    "requestParameters": {
        "dbConfig": {
            "database": "sample_data_dev"
        },
        "databaseConfiguration": {
            "redshiftConfig": {
                "clusterIdentifier": "redshift-cluster-1",
                "database": "sample_data_dev"
            }
        },
        "prompt": "HIDDEN_DUE_TO_SECURITY_REASONS",
        "clientToken": "HIDDEN_DUE_TO_SECURITY_REASONS",
        "logConfig": {},
        "sqlworkbenchConnectionArn": "arn:aws:sqlworkbench:us-east-1:111122223333:connection/47ahg61-ce0b-4646-831b-a140ea4055ae"
    },
    "responseElements": {
        "data": {
            "extractionErrors": false,
            "guardRails": {
                "isDml": false
            },
            "sqlStatement": "HIDDEN_DUE_TO_SECURITY_REASONS",
            "syntaxErrors": "HIDDEN_DUE_TO_SECURITY_REASONS"
        },
        "logSessionId": "623318ad-dbcc-4f69-ae08-f85d1b63a70f",
        "questionId": "623318ad-dbcc-4f69-ae08-f85d1b63a70f",
        "originalQuestionId": "623318ad-dbcc-4f69-ae08-ae08asd1a"
    },
    "requestID": "623318ad-dbcc-4f69-ae08-f85d1b63a70f",
    "eventID": "ac2c1932-49b1-41b3-a1af-20fa4461cf7d",
    "readOnly": false,
    "eventType": "AwsApiCall",
    "managementEvent": true,
    "recipientAccountId": "111122223333",
    "eventCategory": "Management",
    "tlsDetails": {
        "tlsVersion": "TLSv1.3",
        "cipherSuite": "TLS_AES_128_GCM_SHA256",
        "clientProvidedHostHeader": "qsql.sqlworkbench.us-east-1.amazonaws.com"
    },
    "sessionCredentialFromConsole": "true"
}

Conclusion

In this post, we discussed the Amazon Q generative SQL workflow. We highlighted the process around using your schema context alongside metadata such as historic SQL queries and custom context. Using this metadata allows the generation of relevant SQL that helps accelerate your analyst’s productivity. Although it’s important to assist analysts, it’s also imperative to make sure data remains secure and protected. To support this, generative SQL uses only the data the connected user has access to. This helps prevent exposure to information beyond their authorization.When you’re looking to increase the relevance of generated SQL through sharing additional query history, it’s important to consider the trade-off of exposing additional information to the user. Deciding your approach here should take into account the domain context of the data and the possible exposure of metadata the user doesn’t have access to, or potentially sensitive information that might appear in query strings. Keeping these considerations in mind can help you achieve the appropriate security posture for your workloads.

To get started with Amazon Q generative SQL, see Write queries faster with Amazon Q generative SQL for Amazon Redshift and Interacting with Amazon Q generative SQL.


About the authors

Gregory Knowles is a data and AI specialist solution architect at AWS, focusing on the UK public sector. With extensive experience in cloud-based architectures, Greg guides public sector customers in implementing modern data solutions. His expertise spans governance, analytics, and AI/ML. Greg’s passion lies in accelerating transformation and innovation to improve productivity and outcomes. He has successfully led projects that moved data systems into the cloud, adopted new data architectures, and implemented AI at scale in production.

Abhinav Tripathy is a Software Engineer and Security Guardian at AWS, where he develops Amazon Q generative SQL by combining machine learning, databases, and web systems. Abhinav is passionate about building scalable web systems from scratch that solve real customer challenges. Outside of work, he enjoys traveling, watching soccer, and playing badminton.

Erol Murtezaoglu is a Technical Product Manager at AWS, is an inquisitive and enthusiastic thinker with a drive for self-improvement and learning. He has a strong and proven technical background in software development and architecture, balanced with a drive to deliver commercially successful products. Erol highly values the process of understanding customer needs and problems, in order to deliver solutions that exceed expectations.

Scale your AWS Glue for Apache Spark jobs with R type, G.12X, and G.16X workers

Post Syndicated from Noritaka Sekiyama original https://aws.amazon.com/blogs/big-data/scale-your-aws-glue-for-apache-spark-jobs-with-r-type-g-12x-and-g-16x-workers/

With AWS Glue, organizations can discover, prepare, and combine data for analytics, machine learning (ML), AI, and application development. At its core, AWS Glue for Apache Spark jobs operate by specifying your code and the number of Data Processing Units (DPUs) needed, with each DPU providing computing resources to power your data integration tasks. However, although the existing workers effectively serve most data integration needs, today’s data landscapes are becoming increasingly complex at larger scale. Organizations are dealing with larger data volumes, more diverse data sources, and increasingly sophisticated transformation requirements.

Although horizontal scaling (adding more workers) effectively addresses many data processing challenges, certain workloads benefit significantly from vertical scaling (increasing the capacity of individual workers). These scenarios include processing large, complex query plans, handling memory-intensive operations, or managing workloads that require substantial per-worker resources for operations such as large join operations, complex aggregations, and data skew scenarios. The ability to scale both horizontally and vertically provides the flexibility needed to optimize performance across diverse data processing requirements.

Responding to these growing demands, today we are pleased to announce the general availability of AWS Glue R type, G.12X, and G.16X workers, the new AWS Glue worker types for the most demanding data integration workloads. G.12X and G.16X workers offer increased compute, memory, and storage, making it possible for you to vertically scale and run even more intensive data integration jobs. R type workers offer increased memory to meet even more memory-intensive requirements. Larger worker types not only benefit the Spark executors, but also in cases where the Spark driver needs larger capacity—for instance, because the job query plan is large. To learn more about Spark driver and executors, see Key topics in Apache Spark.

This post demonstrates how AWS Glue R type, G.12X, and G.16X workers help you scale up your AWS Glue for Apache Spark jobs.

R type workers

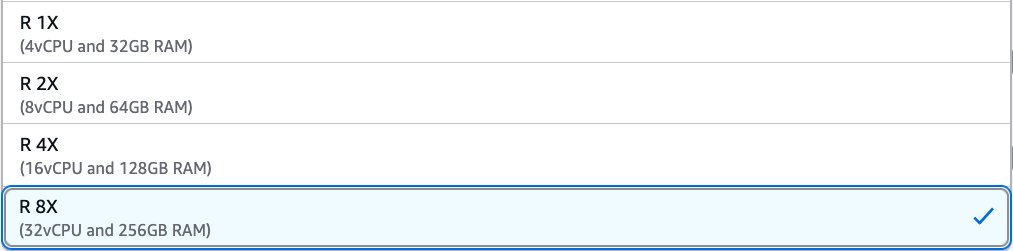
AWS Glue R type workers are designed for memory-intensive workloads where you need more memory per worker than G worker types. G worker types run with a 1:4 vCPU to memory (GB) ratio, whereas R worker types run with a 1:8 vCPU to memory (GB) ratio. R.1X workers provide 1 DPU, with 4 vCPU, 32 GB memory, and 94 GB of disk per node. R.2X workers provide 2 DPU, with 8 vCPU, 64 GB memory, and 128 GB of disk per node. R.4X workers provide 4 DPU, with 16 vCPU, 128 GB memory, and 256 GB of disk per node. R.8X workers provide 8 DPU, with 32 vCPU, 256 GB memory, and 512 GB of disk per node. As with G worker types, you can choose R type workers with a single parameter change in the API, AWS Command Line Interface (AWS CLI), or AWS Glue Studio. Regardless of the worker used, the AWS Glue jobs have the same capabilities, including automatic scaling and interactive job authoring using notebooks. R type workers are available with AWS Glue 4.0 and 5.0.

The following table shows compute, memory, disk, and Spark configurations for each R worker type.

AWS Glue Worker Type DPU per Node vCPU Memory (GB) Disk (GB) Approximate Free Disk Space (GB) Number of Spark Executors per Node Number of Cores per Spark Executor
R.1X 1 4 32 94 44 1 4
R.2X 2 8 64 128 78 1 8
R.4X 4 16 128 256 230 1 16
R.8X 8 32 256 512 485 1 32

To use R type workers on an AWS Glue job, change the setting of the worker type parameter. In AWS Glue Studio, you can choose R 1X, R 2X, R 4X, or R 8X under Worker type.

In the AWS API or AWS SDK, you can specify R worker types in the WorkerType parameter. In the AWS CLI, you can use the --worker-type parameter in a create-job command.

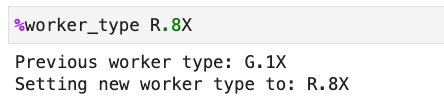
To use R worker types on an AWS Glue Studio notebook or interactive sessions, set R.1X, R.2X, R.4X, or R.8X in the %worker_type magic:

R type workers are priced at $0.52 per DPU-hour for each job, billed per second with a 1-minute minimum.

G.12X and G.16X workers

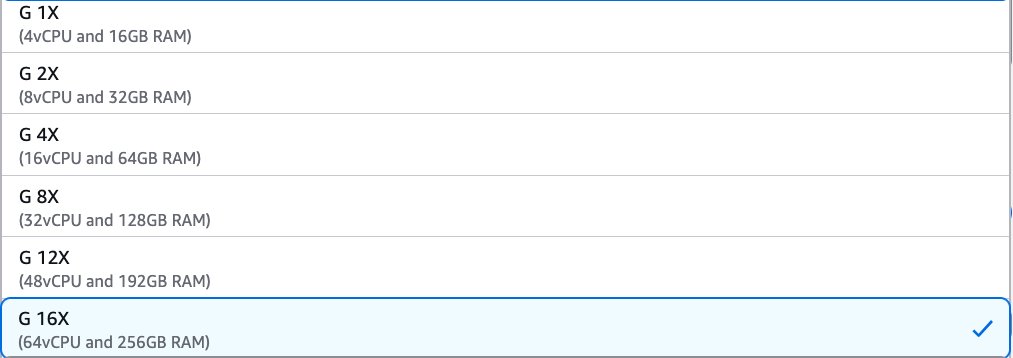
AWS Glue G.12X and G.16X workers give you more compute, memory, and storage to run your most demanding jobs. G.12X workers provide 12 DPU, with 48 vCPU, 192 GB memory, and 768 GB of disk per worker node. G.16X workers provide 16 DPU, with 64 vCPU, 256 GB memory, and 1024 GB of disk per node. G.16x is double the resources of the existing largest worker type G.8X. You can enable G.12X and G.16X workers with a single parameter change in the API, AWS CLI, or AWS Glue Studio. Regardless of the worker used, the AWS Glue jobs have the same capabilities, including automatic scaling and interactive job authoring using notebooks. G.12X and G.16X workers are available with AWS Glue 4.0 and 5.0.The following table shows compute, memory, disk, and Spark configurations for each G worker type.

AWS Glue Worker Type DPU per Node vCPU Memory (GB) Disk (GB) Approximate Free Disk Space (GB) Number of Spark Executors per Node Number of Cores per Spark Executor
G.025X 0.25 2 4 84 34 1 2
G.1X 1 4 16 94 44 1 4
G.2X 2 8 32 138 78 1 8
G.4X 4 16 64 256 230 1 16
G.8X 8 32 128 512 485 1 32
G.12X (new) 12 48 192 768 741 1 48
G.16X (new) 16 64 256 1024 996 1 64

To use G.12X and G.16X workers on an AWS Glue job, change the setting of the worker type parameter to G.12X or G.16X. In AWS Glue Studio, you can choose G 12X or G 16X under Worker type.

In the AWS API or AWS SDK, you can specify G.12X or G.16X in the WorkerType parameter. In the AWS CLI, you can use the --worker-type parameter in a create-job command.

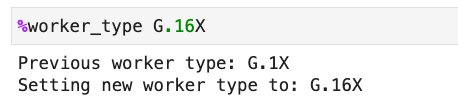
To use G.12X and G.16X on an AWS Glue Studio notebook or interactive sessions, set G.12X or G.16X in the %worker_type magic:

G type workers are priced at $0.44 per DPU-hour for each job, billed per second with a 1-minute minimum. This is the same pricing as the existing worker types.

Choose the right worker type for your workload

To optimize job resource utilization, run your expected application workload to identify the ideal worker type that aligns with your application’s requirements. Start with general worker types like G.1X or G.2X, and monitor your job run from AWS Glue job metrics, observability metrics, and Spark UI. For more details about how to monitor the resource metrics for AWS Glue jobs, see Best practices for performance tuning AWS Glue for Apache Spark jobs.

When your data processing workload is well distributed across workers, G.1X or G.2X work very well. However, some workloads might require more resources per worker. You can use the new G.12X, G.16X, and R type workers to address them. In this section, we discuss typical use cases where vertical scaling is effective.

Large join operations

Some joins might involve large tables where one or both sides need to be broadcast. Multi-way joins require multiple large datasets to be held in memory. With skewed joins, certain partition keys have disproportionately large data volumes. Horizontal scaling doesn’t help when the entire dataset needs to be in memory on each node for broadcast joins.

High-cardinality group by operations

This use case includes aggregations on columns with many unique values, operations requiring maintenance of large hash tables for grouping, and distinct counts on columns with high uniqueness. High-cardinality operations often result in large hash tables that need to be maintained in memory on each node. Adding more nodes doesn’t reduce the size of these per-node data structures.

Window functions and complex aggregations

Some operations might require a large window frame, or involve computing percentiles, medians, or other rank-based analytics across large datasets, in addition to complex grouping sets or CUBE operations on high-cardinality columns. These operations often require keeping large portions of data in memory per partition. Adding more nodes doesn’t reduce the memory requirement for each individual window or grouping operation.

Complex query plans

Complex query plans can have many stages and deep dependency chains, operations requiring large shuffle buffers, or multiple transformations that need to maintain large intermediate results. These query plans often involve large amounts of intermediate data that need to be held in memory. More nodes don’t necessarily simplify the plan or reduce per-node memory requirements.

Machine learning and complex analytics

With ML and analytics use cases, model training might involve large feature sets, wide transformations requiring substantial intermediate data, or complex statistical computations requiring entire datasets in memory. Many ML algorithms and complex analytics require the entire dataset or large portions of it to be processed together, which can’t be effectively distributed across more nodes.

Data skew scenarios

In some data skew scenarios, you might have to process heavily skewed data where certain partitions are significantly larger, or perform operations on datasets with high-cardinality keys, leading to uneven partition sizes. Horizontal scaling can’t address the fundamental issue of data skew, where some partitions remain much larger than others regardless of the number of nodes.

State-heavy stream processing

State-heavy stream processing can include stateful operations with large state requirements, windowed operations over streaming data with large window sizes, or processing micro-batches with complex state management. Stateful stream processing often requires maintaining large amounts of state per key or window, which can’t be easily distributed across more nodes without compromising the integrity of the state.

In-memory caching

These scenarios might include large datasets that must be be cached for repeated access, iterative algorithms requiring multiple passes over the same data, or caching large datasets for fast access, which often requires keeping substantial portions of data in each node’s memory. Horizontal scaling might not help if the entire dataset needs to be cached on each node for optimal performance.

Data skew example scenarios

Several common patterns can typically cause data skew, such as sorting or groupBy transformations on columns with non-uniformed value distributions, and join operations where certain keys appear more frequently than other keys.

In the following example, we compare the behavior with two different worker types, G.2X and R.2X in the same sample workload to process skewed data.

With G.2X workers

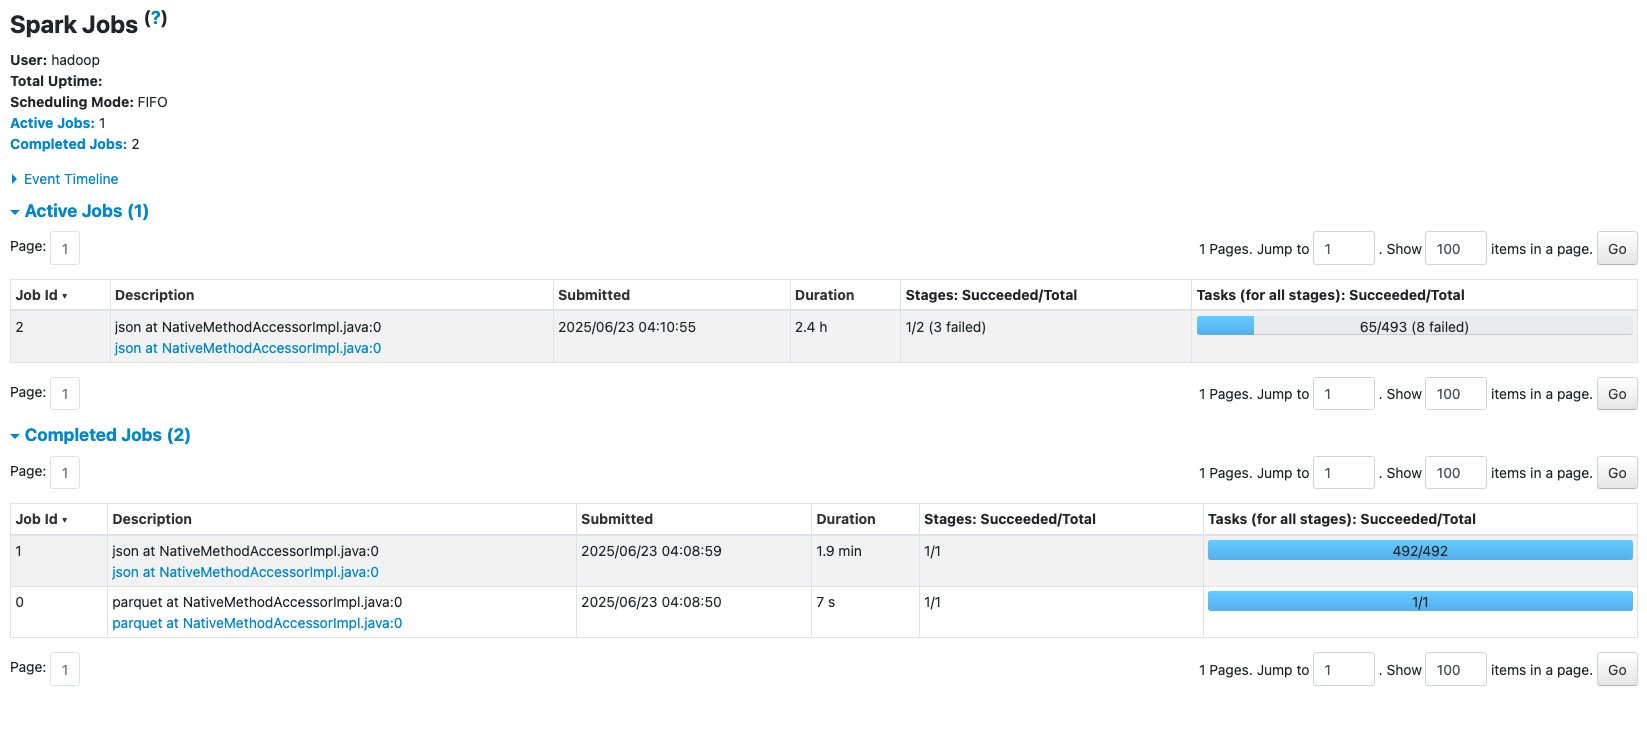
With the G.2X worker type, an AWS Glue job with 10 workers failed due to a No space on left device error while writing records into Amazon Simple Storage Service (Amazon S3). This was mainly caused by large shuffling on a specific column. The following Spark UI view shows the job details.

The Jobs tab shows two completed jobs and one active job where 8 tasks failed out of 493 tasks. Let’s drill down to the details.

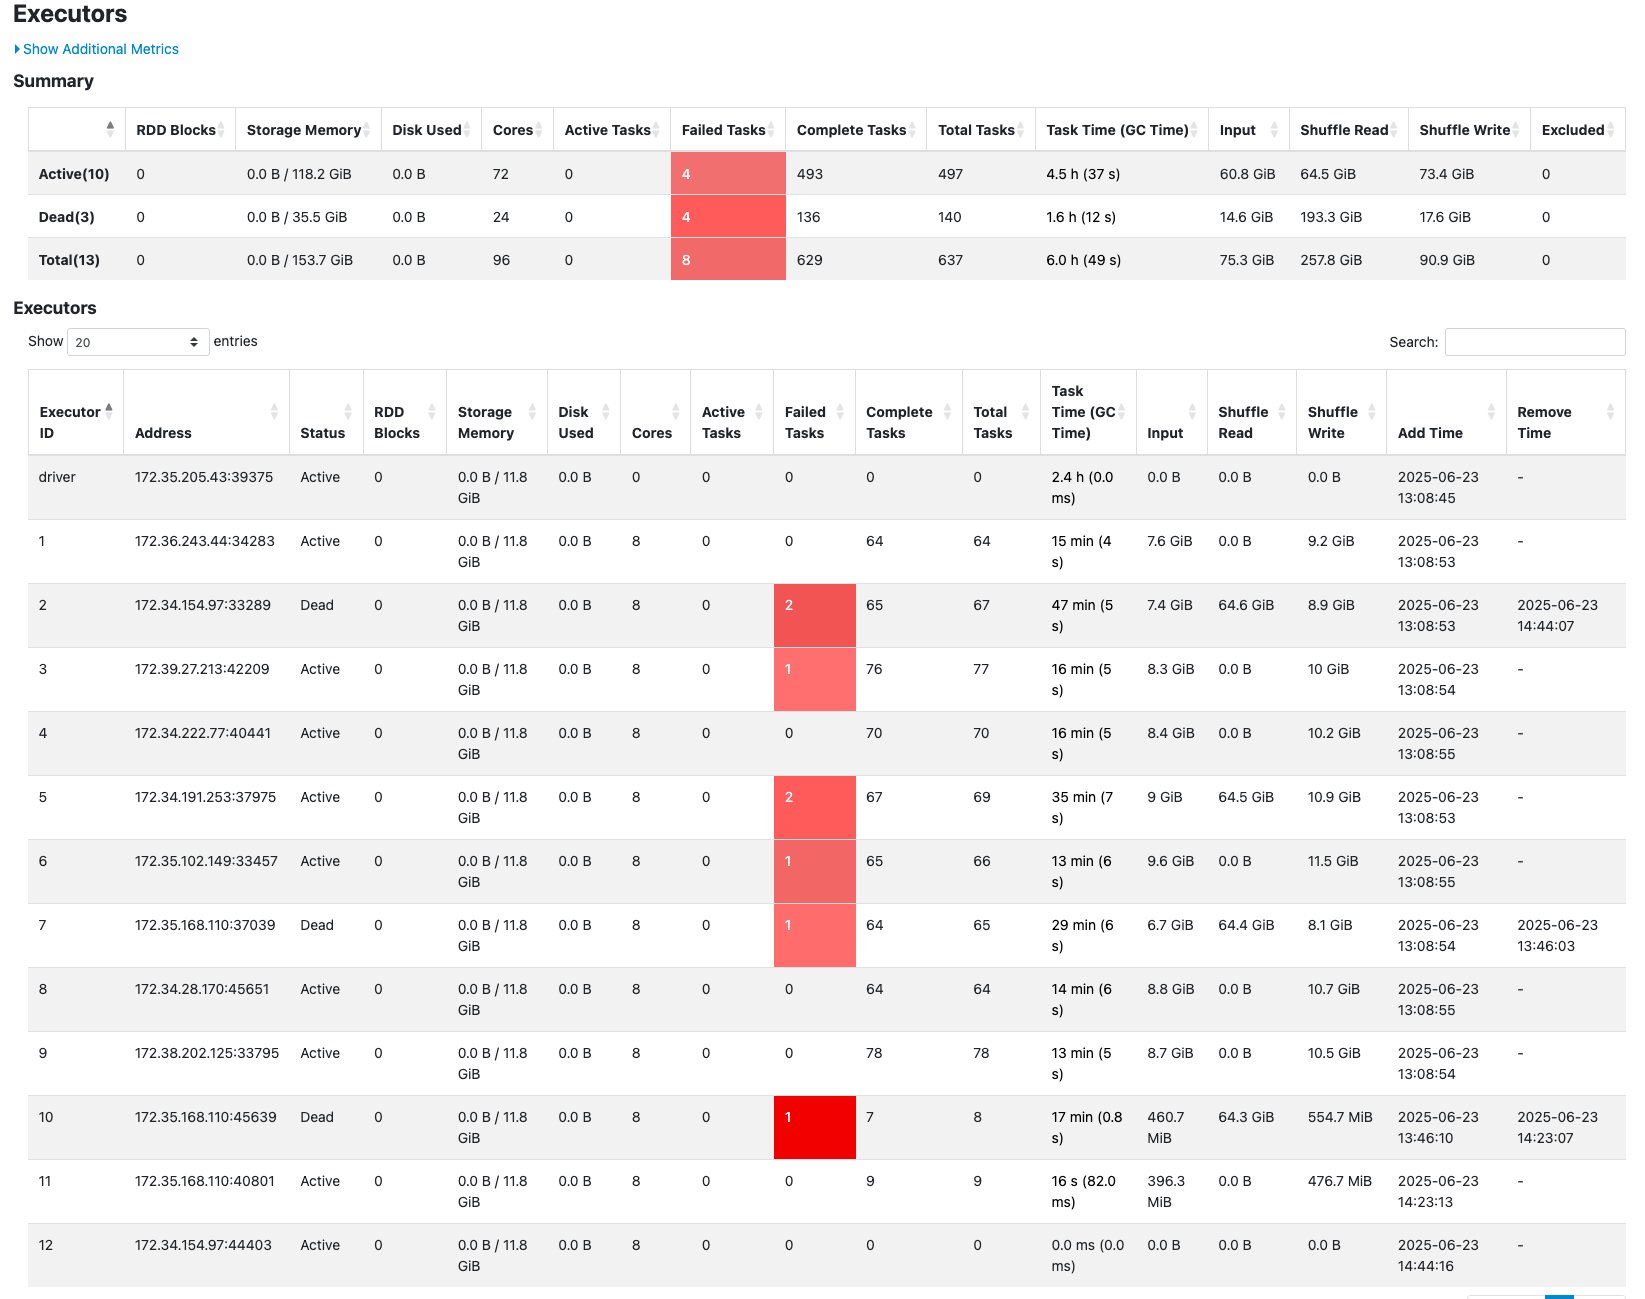
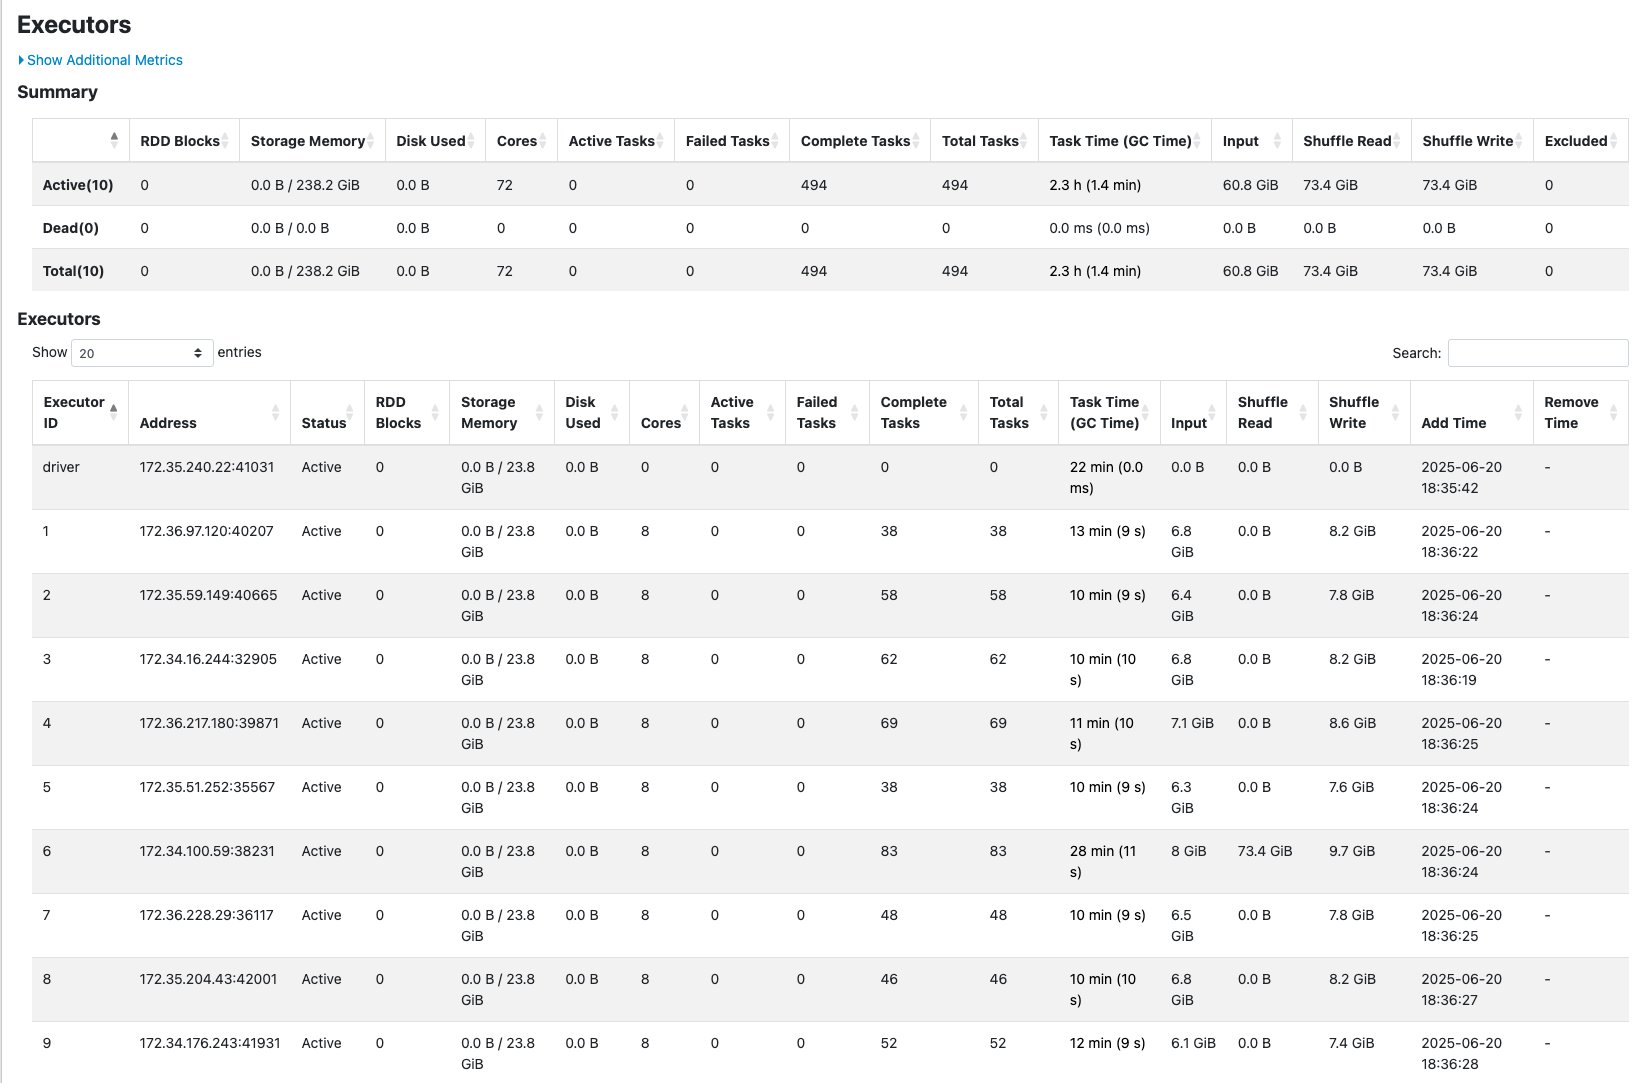
The Executors tab shows an uneven distribution of data processing across the Spark executors, which indicates data skew in this failed job. Executors with IDs 2, 7, and 10 have failed tasks and read approximately 64.5 GiB of shuffle data as shown in the Shuffle Read column. In contrast, the other executors show 0.0 B of shuffle data in the Shuffle Read column.

The G.2X worker type can handle most Spark workloads such as data transformations and join operations. However, in this example, there was significant data skew, which caused certain executors to fail due to exceeding the allocated memory.

With R.2X workers

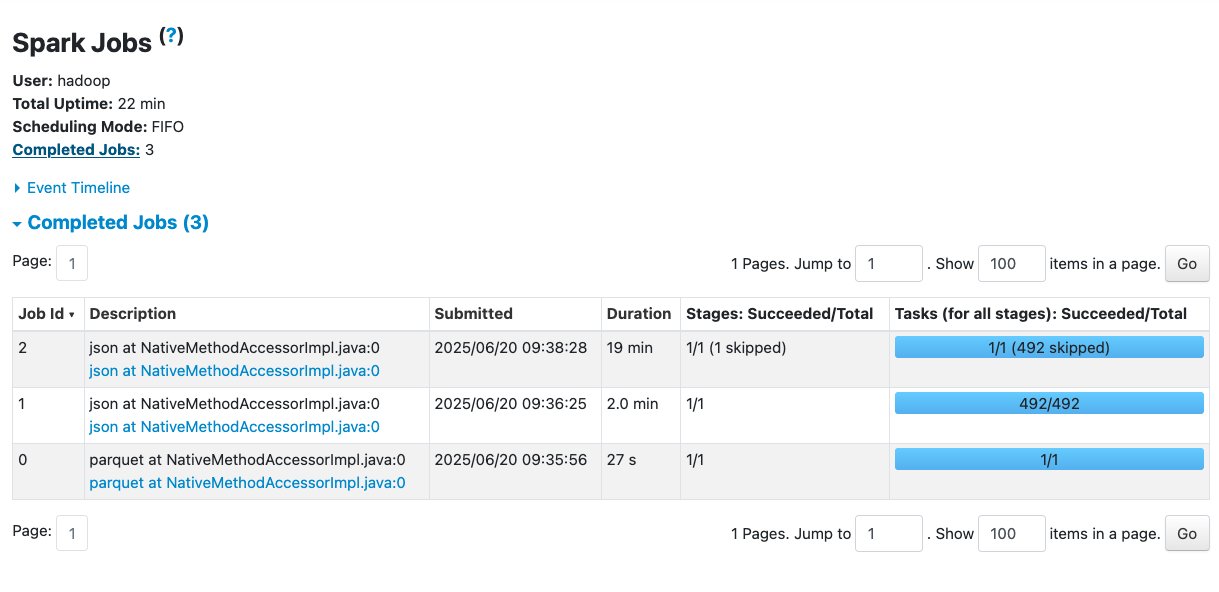
With the R.2X worker type, an AWS Glue job with 10 workers successfully ran without any failures. The number of workers is the same as the previous example—the only difference is the worker type. R workers have two times more memory compared to G workers. The following Spark UI view shows more details.

The Jobs tab shows three completed jobs. No failures are shown on this page.

The Executors tab shows no failed tasks per executor even though there’s an uneven distribution of shuffle reads across executors.

The results showed that R.2X workers successfully completed the workload that failed on G.2X workers using the same number of executors but with the additional memory capacity to handle the skewed data distribution.

Conclusion

In this post, we demonstrated how AWS Glue R type, G.12X, and G.16X workers can help you vertically scale your AWS Glue for Apache Spark jobs. You can start using the new R type, G.12X, and G.16X workers to scale your workload today. For more information on these new worker types and AWS Regions where the new workers are available, visit the AWS Glue documentation.

To learn more, see Getting Started with AWS Glue.


About the Authors

Noritaka Sekiyama is a Principal Big Data Architect with AWS Analytics services. He’s responsible for building software artifacts to help customers. In his spare time, he enjoys cycling on his road bike.

Tomohiro Tanaka is a Senior Cloud Support Engineer at Amazon Web Services. He’s passionate about helping customers use Apache Iceberg for their data lakes on AWS. In his free time, he enjoys a coffee break with his colleagues and making coffee at home.

Peter Tsai is a Software Development Engineer at AWS, where he enjoys solving challenges in the design and performance of the AWS Glue runtime. In his leisure time, he enjoys hiking and cycling.

Matt Su is a Senior Product Manager on the AWS Glue team. He enjoys helping customers uncover insights and make better decisions using their data with AWS Analytics services. In his spare time, he enjoys skiing and gardening.

Sean McGeehan is a Software Development Engineer at AWS, where he builds features for the AWS Glue fulfillment system. In his leisure time, he explores his home of Philadelphia and work city of New York.

Introducing Jobs in Amazon SageMaker

Post Syndicated from Chiho Sugimoto original https://aws.amazon.com/blogs/big-data/introducing-jobs-in-amazon-sagemaker/

Processing large volumes of data efficiently is critical for businesses, and so data engineers, data scientists, and business analysts need reliable and scalable ways to run data processing workloads. The next generation of Amazon SageMaker is the center for all your data, analytics, and AI. Amazon SageMaker Unified Studio is a single data and AI development environment where you can find and access all of the data in your organization and act on it using the best tools across any use case.

We’re excited to announce a new data processing job experience for Amazon SageMaker. Jobs are a common concept widely used in existing AWS services such as Amazon EMR and AWS Glue. With this launch, you can now build jobs in SageMaker to process large volumes of data. Jobs can be built using your preferred tool. For example, you can create jobs from extract, transform, and load (ETL) scripts coded in the Unified Studio code editor, code interactively in a Unified Studio Notebooks, or create jobs visually using the Unified Studio Visual ETL editor. After being created, data processing jobs can be set to run on demand, scheduled using the built in scheduler, or orchestrated with SageMaker workflows. You can monitor the status of your data processing jobs and view run history showing status, logs, and performance metrics. When jobs encounter failures, you can use generative AI troubleshooting to automatically analyze errors and receive detailed recommendations to resolve issues quickly. Together, you can use these capabilities to author, manage, operate, and monitor data processing workloads across your organization. The new experience provides an experience that’s consistent with other AWS analytics services such as AWS Glue.

This post demonstrates how the new jobs experience works in SageMaker Unified Studio.

Prerequisites

To get started, you must have the following prerequisites in place:

  • An AWS account
  • A SageMaker Unified Studio domain
  • A SageMaker Unified Studio project with an Data analytics and AI-ML model development project profile

Example use case

A global apparel ecommerce retailer processes thousands of customer reviews daily across multiple marketplaces. They need to transform their raw review data into actionable insights to improve their product offerings and customer experience. Using SageMaker Unified Studio visual ETL editor, we’ll demonstrate how to transform raw review data into structured analytical datasets that enable market-specific performance analysis and product quality monitoring.

Create and run a visual job

In this section, you’ll create a Visual ETL Job that processes the review data from a Parquet file in Amazon Simple Storage Service Amazon S3. The job transforms the data using SQL queries and saves the results back to S3 buckets. Complete the following steps to create a Visual ETL Job:

  1. On the SageMaker Unified Studio console, on the top menu, choose Build.
  2. Under DATA ANALYSIS & INTEGRATION, choose Data processing jobs.
  3. Choose Create Visual ETL Job.

You’ll be directed to the Visual ETL editor, where you can create ETL jobs. You can use this editor to design data transformation pipelines by connecting source nodes, transformation nodes, and target nodes.

  1. On the top left, choose the plus (+) icon in the circle. Under Data sources, select Amazon S3.
  2. Select the Amazon S3 source node and enter the following values:
    1. S3 URI: s3://aws-bigdata-blog/generated_synthetic_reviews/data/product_category=Apparel/
    2. Format: Parquet
  3. Select Update node.
  4. Choose the plus (+) icon in the circle to the right of the Amazon S3 source node. Under Transforms, select SQL query.
  5. Enter the following query statement and select Update node.
SELECT
    marketplace,
    star_rating,
    DATE_FORMAT(review_date, 'yyyy-MM-dd') as review_date,
    COUNT(*) as review_count,
    AVG(CAST(helpful_votes as DOUBLE) / NULLIF(total_votes, 0)) as helpfulness_ratio,
    COUNT(CASE WHEN insight = 'Y' THEN 1 END) as insight_count
FROM {myDataSource}
GROUP BY
    marketplace,
    star_rating,
    DATE_FORMAT(review_date, 'yyyy-MM-dd')
  1. Choose the plus (+) icon to the right of the SQL Query node. Under Data target, select Amazon S3.
  2. Select the Amazon S3 target node and enter the following values:
    1. S3 URI: Choose the Amazon S3 location from the project overview page and add the suffix “/output/rating_analysis/”. For example, s3://<bucket-name>/<domainId>/<projectId>/output/rating_analysis/
    2. Format: Parquet
    3. Compression: Snappy
    4. Partition keys: review_date
    5. Mode: Append
  3. Select Update node.

Next, add another SQL query node connected to the same Amazon S3 data source. This node performs a SQL query transformations and outputs the results to a separate S3 location.

  1. On the top left, choose the plus (+) icon in the circle. Under Transforms, select SQL query, and connect the Amazon S3 source node.
  2. Enter the following query statement and select Update node.
SELECT 
    marketplace,
    product_id,
    product_title,
    COUNT(*) as review_count,
    AVG(star_rating) as avg_rating,
    SUM(helpful_votes) as total_helpful_votes,
    COUNT(DISTINCT customer_id) as unique_reviewers,
    COUNT(CASE WHEN insight = 'Y' THEN 1 END) as insight_count
FROM {myDataSource}
GROUP BY 
    marketplace,
    product_id,
    product_title
  1. Choose the plus (+) icon to the right of the SQL Query node. Under Data target, select Amazon S3.
  2. Select the Amazon S3 target node and enter the following values:
    1. S3 URI: Choose the Amazon S3 location from the project overview page and add suffix “/output/product_analysis/”. For example, s3://<bucket-name>/<domainId>/<projectId>/output/product_analysis/
    2. Format: Parquet
    3. Compression: Snappy
    4. Partition keys: marketplace
    5. Mode: Append
  3. Select Update node.

At this point, your end-to-end visual job should look like the following image. The next step is to save this job to the project and run the job.

  1. On the top right, choose Save to project to save the draft job. You can optionally change the name and add a description.
  2. Choose Save.
  3. On the top right, choose Run.

This will start running your Visual ETL job. You can monitor the list of job runs by selecting View runs in the top middle of the screen.

Create and run a code based job

In addition to creating jobs through the Visual ETL Editor, you can create jobs using a code-based approach by specifying Python script or Notebook files. When you specify a Notebook file, it automatically converts to a Python script to create the job. Here, you’ll create a notebook in JupyterLab within SageMaker Unified Studio, save it to the project repository, and then create a code-based job from that notebook. First, create a Notebook.

  1. On the SageMaker Unified Studio console, on the top menu, choose Build.
  2. Under IDE & APPLICATIONS, select JupyterLab.
  3. Select Python 3 under Notebook.

  1. For the first cell, select Local Python, python, enter following code:
%%configure -n project.spark.compatibility
{
    "number_of_workers": 10,
    "session_type": "etl",
    "glue_version": "5.0",
    "worker_type": "G.1X",
    "idle_timeout": 10,
    "timeout": 1200
}
  1. For the second cell, select PySpark, project.spark.compatibility, enter following code. This performs the same processing as the Visual ETL job you created above. Replace the S3 bucket and folder names for output_path.
import sys
from pyspark.context import SparkContext
from pyspark.sql import SparkSession

sc = SparkContext.getOrCreate()
spark = SparkSession.builder.getOrCreate()

# Create Spark session
sc = SparkContext.getOrCreate()
spark = SparkSession.builder.getOrCreate()

# Configure paths
input_path = "s3://aws-bigdata-blog/generated_synthetic_reviews/data/product_category=Apparel/"
output_path = "s3://<bucket-name>/<domainId>/<projectId>/code-job-output/results"


# Read data from S3
df = spark.read.format("parquet").load(input_path)
df.createOrReplaceTempView("reviews")

# Transform 1: Rating Analysis
rating_analysis = spark.sql("""
    SELECT 
        marketplace,
        star_rating,
        DATE_FORMAT(review_date, 'yyyy-MM-dd') as review_date,
        COUNT(*) as review_count,
        AVG(CAST(helpful_votes as DOUBLE) / NULLIF(total_votes, 0)) as helpfulness_ratio,
        COUNT(CASE WHEN insight = 'Y' THEN 1 END) as insight_count
    FROM reviews
    GROUP BY 
        marketplace,
        star_rating,
        DATE_FORMAT(review_date, 'yyyy-MM-dd')
""")

# Transform 2: Product Analysis
product_analysis = spark.sql("""
    SELECT 
        marketplace,
        product_id,
        product_title,
        COUNT(*) as review_count,
        AVG(star_rating) as avg_rating,
        SUM(helpful_votes) as total_helpful_votes,
        COUNT(DISTINCT customer_id) as unique_reviewers,
        COUNT(CASE WHEN insight = 'Y' THEN 1 END) as insight_count
    FROM reviews
    GROUP BY 
        marketplace,
        product_id,
        product_title
    HAVING 
        COUNT(*) >= 5
""")

# Write results to S3
rating_analysis.write.format("parquet") \
    .option("compression", "snappy") \
    .partitionBy("review_date") \
    .mode("append") \
    .save(f"{output_path}/rating_analysis")

product_analysis.write.format("parquet") \
    .option("compression", "snappy") \
    .partitionBy("marketplace") \
    .mode("append") \
    .save(f"{output_path}/product_analysis")
  1. Choose the File icon to save the notebook file. Enter the name of your notebook.

Save the notebook to the project’s repository.

  1. Choose the Git icon in the left navigation. This opens a panel where you can view the commit history and perform Git operations.
  2. Choose the plus (+) icon next to the files you want to commit.
  3. Enter a brief summary of the commit in the Summary text entry field. Optionally, enter a longer description of the commit in the Description text entry field.
  4. Choose Commit.
  5. Choose the Push committed changes icon to do a git push.

Create the Code-based Job from the Notebook file in the project repository.

  1. On the SageMaker Unified Studio console, on the top menu, choose Build.
  2. Under DATA ANALYSIS & INTEGRATION, choose Data processing jobs.
  3. Choose Create job from files.
  4. Choose Choose project files and choose Browse files.
  5. Select the Notebook file you created and choose Select.

Here, the Python script automatically converted from your notebook file will be displayed. Review the content.

  1.  Choose Next.
  2. For Job name, enter the name of your job.
  3. Choose Submit to create your job.
  4. Choose the job you created.
  5. Choose Run job.

Convert existing Visual ETL flows to jobs

You can convert an existing visual ETL flow to a job by saving your existing Visual ETL flow to the project repository. Use the following steps to create a job from your existing visual ETL flow:

  1. On the SageMaker Unified Studio console, on the top menu, choose Build.
  2. Under DATA ANALYSIS & INTEGRATION, select Visual ETL editor.
  3. Select the existing Visual ETL flow.
  4. On the top right, choose Save to project to save the draft flow. You can optionally change the name and add a description.
  5. Choose Save.

View jobs

You can view the list of jobs in your project on the Data processing jobs page. Jobs can be filtered by mode (Visual ETL or Code).

Monitor job runs

On each job’s detail page, you can view a list of job runs in the Job runs tab. You can filter activities by job run ID, status, start time, and end time. The Job runs list shows basic attributes such as duration, resources consumed, and instance type, along with log group names and various job parameters. You can list, compare, and explore job runs history based on various attributes.

On the individual job run details page, you can view job properties and output logs from the run. When a job fails because of an error, you can see the error message at the top of the page and examine detailed error information in the output logs.

Intelligent troubleshooting with generative AI: When jobs fail, you can take advantage of generative AI troubleshooting to resolve issues quickly. SageMaker Unified Studio’s AI-powered troubleshooting automatically analyzes job metadata, Spark event logs, error stack traces, and runtime metrics to identify root causes and provide actionable solutions. It handles both simple scenarios like missing S3 buckets, and complex performance issues such as out-of-memory exceptions. The analysis explains not just what failed, but why it failed and how to fix it, reducing troubleshooting time from hours or days to minutes.

To start the analysis, choosing Troubleshoot with AI at the top right. The troubleshooting analysis provides Root Cause Analysis identifying the specific issue, Analysis Insights explaining the error context and failure patterns, and Recommendations with step-by-step remediation actions. This expert-level analysis makes complex Spark debugging accessible to all team members, regardless of their Spark expertise.

Clean up

To avoid incurring future charges, delete the resources you created during this walkthrough:

  1. Delete Visual ETL flows in Visual ETL editor.
  2. Delete Data processing jobs, including Visual ETL and Code-based jobs.
  3. Delete Output files in the S3 bucket.

Conclusion

In this post, we explored the new job experience in Amazon SageMaker Unified Studio, which brings a familiar and consistent experience for data processing and data integration tasks. This new capability streamlines your workflows by providing enhanced visibility, cost management, and seamless migration paths from AWS Glue.With the ability to create both visual and code-based jobs, monitor job runs, and set up scheduling, the new jobs experience helps you build and manage data processing and data integration tasks efficiently. Whether you’re a data engineer working on ETL processes or a data scientist preparing datasets for machine learning, the job experience in SageMaker Unified Studio provides the tools you need in a unified environment.Start exploring the new job experience today to simplify your data processing workflows and make the most of your data in Amazon SageMaker Unified Studio.


About the authors

Chiho Sugimoto is a Cloud Support Engineer on the AWS Big Data Support team. She is passionate about helping customers build data lakes using ETL workloads. She loves planetary science and enjoys studying the asteroid Ryugu on weekends.

Noritaka Sekiyama is a Principal Big Data Architect at the AWS Analytics product team. He’s responsible for designing new features in AWS products, building software artifacts, and providing architecture guidance to customers. In his spare time, he enjoys cycling on his road bike.

Matt Su is a Senior Product Manager on the AWS Glue team. He enjoys helping customers uncover insights and make better decisions using their data with AWS Analytics services. In his spare time, he enjoys skiing and gardening.

Revenue NSW modernises analytics with AWS, enabling unified and scalable data management, processing, and access

Post Syndicated from Saeed Barghi original https://aws.amazon.com/blogs/big-data/revenue-nsw-modernises-analytics-with-aws-enabling-unified-and-scalable-data-management-processing-and-access/

Revenue NSW, in Australia, is New South Wales (NSW) state’s principal revenue management agency and aspires to be the world’s most innovative and customer-centric revenue agency. Revenue NSW exists to administer grants, resolve fines, and collect revenue to fund essential state services for the over 8 million people of NSW in a fair, efficient, and timely manner.

Analytics at Revenue NSW plays a key role in enabling the organization’s goals and purpose by delivering reliable, secure, and authoritative insights. These insights are key to:

  • Understanding customer attributes to enable empathetic and informed actions
  • Supporting policy development
  • Assisting in the sequencing of millions of decisions
  • Maintaining compliance and education
  • Fostering transparency by providing open data and insights directly to the public

The challenge

Revenue NSW Analytics consumes data from a multitude of operational databases and real-time interfaces and through internally generated reports and files received from external data partners such as other government departments and agencies. The varying technologies, formats, and complexities of these data sources created friction and inefficiencies in data transformation, consolidation, and analysis in an environment that is often time-critical. In addition, these analytics systems were previously hosted on dedicated hardware on-premises that was nearing end-of-life and wasn’t easy to scale efficiently. To address these challenges, Revenue NSW Analytics used their partnership with AWS to build a strategic, unified, scalable, frictionless and modern data environment to help them standardize data transformation and consolidation pipelines from the hundreds of data sources. Additionally, the modern data environment must provide a single source of truth and enable secure and seamless access to the data through a unified SQL interface regardless of the data’s original format or technology.

After understanding other offerings, Revenue NSW Analytics decided on a proof of concept (PoC) using Amazon Web Services (AWS) cloud-based services, including Amazon Redshift. The key goals of the PoC were to assess the completeness of the solution, its performance, and the potential change in total cost of ownership compared to their on-premises setup.

Amazon Redshift, with its integration options, columnar storage, and massively parallel processing (MPP) architecture, offered the desired end-state solution. Tests demonstrated a typical speed increase between 5- and 50-fold in query execution, with many results 100 times faster than the existing on-premises solution. Amazon Redshift also performed significantly better compared with other cloud-based solutions, offering up to 6 times better performance. The success of the initial PoC led Revenue NSW Analytics to further collaborate with AWS, working towards developing a prototype that incorporated Amazon Redshift alongside various data ingestion patterns.

The solution

To simplify data ingestion from the operational databases—which run on different database engines including Oracle, PostgreSQL, and Microsoft SQL—Revenue NSW Analytics used AWS Database Migration Service (AWS DMS) to perform a bulk initial load, followed by capturing ongoing changes from these databases into Amazon Redshift in near real time.

For data from Salesforce’s real-time API, Revenue NSW Analytics used Amazon AppFlow to automate the continuous pulling and ingesting of data into Amazon Redshift.

The hundreds of structured and semi-structured data files were handled using AWS Glue. These files are regularly uploaded to Amazon Simple Storage Service (Amazon S3), triggering the relevant AWS Glue extract, transform, and load (ETL) jobs in an event-based architecture to transfer the data into Amazon Redshift.

To facilitate repeatability and enable iteration, Revenue NSW Analytics used infrastructure-as-code (IaC) and continuous integration and delivery (CI/CD) pipelines to deploy the different components of the solution.

The following is a high-level architecture demonstrating how these different components and services fit together.

Along with standardization and unified access, the success criteria of the new data environment included the ease of transition, consolidation of processes to the new standardised pipelines, scalability, language uniformity, and availability. The combination of supporting standard SQL, AWS DMS, and Amazon AppFlow low-code capabilities, and supporting Python in AWS Glue, a popular programming language, played a crucial role in facilitating the successful transition and adoption of the cloud-based data environment.

Other success factors of this environment include the ability to work within current budgets, and the extendibility and modularity of the solution. As shown in the preceding high-level architecture, the solution runs on multiple building blocks that are decoupled, modular, and either serverless—like AWS Glue—or managed services that support seamless scalable configurations that don’t require rebuilds. This allowed Revenue NSW Analytics to start small with each use case, expand and grow as required, and pay only for what they need.

Moreover, with the new cloud-based data environment, Revenue NSW Analytics can access to up-to-date data in near real time, which is essential to fulfilling critical use cases such as information requests and assisting with compliance case identification. The automated data ingestion pipelines removed much of the boilerplate and heavy lifting, allowing Revenue NSW teams to work more efficiently and focus on the differentiators of their business, and in some cases, shorten workflow times from months to weeks or days.

Another significant factor contributing to the project’s success is the people at the heart of Revenue NSW Analytics. The teams allocated to own and deliver this platform are cross-functional, with adjoining responsibilities and skills, and were prepared through multiple in-person and online training sessions. The teams were empowered to trial individual services to deliver new use cases and iterate on the solution to learn from successes and innovate progressively. This approach, together with support Revenue NSW received from AWS specialist solution architects, helped to minimize the risk of knowledge gaps that often arise when separate teams are responsible for building and operating a system.

The hard work of the Analytics team, the investment of Revenue NSW Analytics leadership in its people, and the continuous support from AWS can truly be seen throughout the delivery of the data environment, resulting in the achievement of the intended outcomes.

Conclusion and call to action

Since going live with their cloud-based data environment on AWS, Revenue NSW has onboarded dozens of analysts who can get more done in less time. This is a result of establishing a single source of truth from different data sources in Amazon Redshift, so that analysts and data consumers don’t need to shop around to find the data that they need to complete their tasks. This new data environment also provides Revenue NSW with the ability to create improved conditions for:

  • Increasing agility by exposing reusable, trusted data services for people and AI
  • Empowering operational systems with services best provided by analytical approaches
  • Decommissioning heritage, costly infrastructure and data practices.

Successful delivery of the cloud-based data environment on AWS has led to further collaboration between AWS and Revenue NSW. This includes exploring the adoption of AI and machine learning (AI/ML) and generative AI to further improve the delivery of services for the people of NSW.

To learn more about customer success stories like this or how to get started with building a data environment on AWS, contact your AWS account team. You can read about similar customers by browsing Customer Success Stories on our website.


About the authors

Saeed BarghiSaeed Barghi is a Sr. Specialist Solutions Architect at Amazon Web Services (AWS) specializing in architecting enterprise data platforms and AI solutions. Based in Melbourne, Australia, Saeed works with public sector customers in Australia and New Zealand and helps his customers build fit-for-purpose and future-proof data platforms and AI solutions.

Miroslaw (Mick) Mioduszewski is the Director of Analytics at Revenue NSW Department of Customer service in NSW. He held multiple C-level roles in private and public companies as well as government, e.g. COO and CIO, as well as serving as company director. Mick holds computer science and business degrees, is a fellow of the Australian Institute of Company Directors and an industry fellow at the University of technology, Sydney.

Moha Alsouli is a Public Sector Solutions Architect at Amazon Web Services (AWS) in Sydney. He is dedicated to supporting state and local government customers deliver citizen services, through solution design, reviews, optimisation, and architecture guidance. Moha is also specialising in generative artificial intelligence (AI) on AWS.

Geospatial data lakes with Amazon Redshift

Post Syndicated from Jeremy Spell original https://aws.amazon.com/blogs/big-data/geospatial-data-lakes-with-amazon-redshift/

Data lake architectures help organizations offload data from premium storage systems without losing the ability to query and analyze the data. This architecture can be useful for geospatial data, where builders might have terabytes of infrequently accessed data in their databases that they want to cost-effectively maintain. However, this requires for their data lake query engine to support geographic information systems (GIS) data types and functions.

Amazon Redshift supports querying spatial data, including the GEOMETRY and GEOGRAPHY data types and functions that are used in querying GIS systems. Additionally, Amazon Redshift lets you query geospatial data both in your data lakes on Amazon S3 and your Redshift data warehouse, giving you the choice of how you can access your data. Additionally, AWS Lake Formation and support for AWS Identity and Access Management (IAM) in Esri’s ArcGIS Pro gives you a way to securely bridge data between your geospatial data lakes and map visualization tools. You can set up, manage, and secure geospatial data lakes in the cloud with a few clicks.

In this post, we walk through how to set up a geospatial data lake using Lake Formation and query the data with ArcGIS Pro using Amazon Redshift Serverless.

Solution overview

In our example, a county public health department has used Lake Formation to secure their data lake that contains public health information (PHI) data. Epidemiologists within the county want to create a map for the clinics providing vaccination for their communities. The county’s GIS analysts need access to the data lake to create the required maps without being able to access the PHI data.

This solution uses Lake Formation tags to allow column-level access in the database to the public information that includes the clinic names, addresses, zip codes, and longitude/latitude coordinates without allowing access to the PHI data within the same tables. We use Redshift Serverless and Amazon Redshift Spectrum to access this data from ArcGIS Pro, a GIS mapping software from Esri, an AWS Partner.

The following diagram shows the architecture for this solution.

End-to-end architecture showing ArcGIS Pro data integration with AWS analytics services through Redshift connector

The following is a sample schema for this post.

Description Column Name Geoproperty Tag
Patient ID patient_id No
Clinic ID clinic_id Yes
Address of Clinic clinic_address Yes
Clinic Zip Code clinic_zip Yes
Clinic City clinic_city Yes
First Name Patient first_name No
Last Name Patient last_name No
Patient Address patient_address No
Patient Zip Code patient_zip No
Vaccination Type vaccination_type No
Latitude of Clinic clinic_lat Yes
Longitude of Clinic clinic_long Yes

In the following sections, we walk through the steps to set up the solution:

  1. Deploy the solution infrastructure using AWS CloudFormation.
  2. Upload a CSV with sample data to an Amazon Simple Storage Service (Amazon S3) bucket and run an AWS Glue crawler to crawl the data.
  3. Set up Lake Formation permissions.
  4. Configure the Amazon Redshift Query Editor v2.
  5. Set up the schemas in Amazon Redshift.
  6. Create a view in Amazon Redshift.
  7. Create a local database user in ArcGIS Pro.
  8. Connect ArcGIS Pro to the Redshift database.

Prerequisites

You should have the following prerequisites:

Set up the infrastructure with AWS CloudFormation

To create the environment for the demo, complete the following steps:

  1. Log in to the AWS Management Console as an AWS account administrator and a Lake Formation data lake administrator—this account needs to be both an account admin and a data lake admin for the template to complete.
  2. Open the AWS CloudFormation console
  3. Choose Launch Stack.

The CloudFormation template creates the following components:

  • S3 bucket – samp-clinic-db-{ACCOUNT_ID}
  • AWS Glue database – samp-clinical-glue-db
  • AWS Glue crawler – samp-glue-crawler
  • Redshift Serverless workgroup – samp-clinical-rs-wg
  • Redshift Serverless namespace – samp-clinical-rs-ns
  • IAM role for Amazon Redshift – demo-RedshiftIAMRole-{UNIQUE_ID}
  • IAM role for AWS Glue – samp-clinical-glue-role
  • Lake Formation tag – geoproperty

Upload a CSV to the S3 bucket and run the AWS Glue crawler

The next step is to create a data lake in our demo environment and then use an AWS Glue crawler to populate the AWS Glue database and update the schema and metadata in the AWS Glue Data Catalog.

The CloudFormation stack created the S3 bucket we will use as well as the AWS Glue database and crawler. We have provided a fictious test dataset that will represent the patient and clinical information. Download the file and complete the following steps:

  1. On the AWS CloudFormation console, open the stack you just launched.
  2. On the Resources tab, choose the link to the S3 bucket.
  3. Choose Upload and add the CSV file (data-with-geocode.csv), then choose Upload.
  4. On the AWS Glue console, choose Crawlers in the navigation pane.
  5. Select the crawler you created with the CloudFormation stack and choose Run.

The crawler run should only take a minute to complete, and will populate a table named clinic-sample-s3_ACCOUNT_ID with a fictious dataset.

  1. Choose Tables in the navigation pane and open the table the crawler populated.

You will see that the dataset contains fields that contain PHI and personally identifiable information (PII).

AWS Glue table 'clinic-sample_s3' schema definition with patient and clinic fields, input/output formats, and database properties

We now have a database set up and the Data Catalog populated with the schema and metadata we will use for the rest of the demo.

Set up Lake Formation permissions

In this next set of steps, we demonstrate how to secure PHI data to maintain compliance and empower GIS analysts to work effectively. To secure the data lake, we use AWS Lake Formation. In order to properly set up Lake Formation permissions, we need to gather details on how access to the data lake is established.

The Data Catalog provides metadata and schema information that enables services to access data within the data lake. To access the data lake from ArcGIS Pro, we use the ArcGIS Pro Redshift connector, which allows a connection from ArcGIS Pro to Amazon Redshift. Amazon Redshift can access the Data Catalog and provide connectivity to the data lake. The CloudFormation template created a Redshift Serverless instance and namespace and an IAM role that we will use to configure this connection. We still need to set up Lake Formation permissions so that GIS analysts can only access publicly available fields and not those containing PHI or PII. We will assign a Lake Formation tag on the columns containing the publicly available information and assign permissions to the GIS analysts to allow access to columns with this tag.

By default, the Lake Formation configuration allows Super access to IAMAllowedPrinciples; this is to maintain backward compatibility as detailed in Changing the default settings for your data lake. To demonstrate a more secure configuration, we will remove this default configuration.

  1. On the Lake Formation console, choose Administration in the navigation pane.
  2. In the Data Catalog settings section, make sure Use only IAM access control for new databases and Use only IAM access control for new tables in new databases are unchecked.

AWS Data Catalog settings interface showing unchecked IAM-only access control options for new databases and tables

  1. In the navigation pane, under Permissions, choose Data permissions.
  2. Select IAMAllowedPrincipals and choose Revoke.
  3. Choose Tables in the navigation pane.
  4. Open the table clinic-sample-s3_ACCOUNT_ID and choose Edit schema.
  5. Select the fields beginning with clinic_ and choose Edit LF-Tags.
  6. The CloudFormation stack created a Lake Formation tag named geoproperty. Assign geoproperty as the key and true for the value on all the clinic_ fields, then choose Save.

Next, we need to grant the Amazon Redshift IAM role permission to access fields tagged with geoproperty = true.

  1. Choose Data lake permissions, then choose Grant.
  2. For the IAM role, choose demo-RedshiftIAMRole-UNIQUE_ID.
  3. Select geoproperty for the key and true for the value.
  4. Under Database permissions, select Describe, and under Table permissions, select Select and Describe.

Configure the Amazon Redshift Query Editor v2

Next, we need to perform the initial configuration of Amazon Redshift required for database operations. We use an AWS Secrets Manager secret created by the template to make sure password access is managed securely in accordance with AWS best practices.

  1. On the Amazon Redshift console, choose Query editor v2.
  2. When you first start Amazon Redshift, a one-time configuration for the account appears. For this post, leave the options default and choose Configure account.

For more information about these options, refer to Configuring your AWS account.

Redshift query editor configuration interface with AWS KMS encryption settings and optional S3 bucket path input

The query editor will require credentials to connect to the serverless instance; these have been created by the template and stored in Secrets Manager.

  1. Select Other ways to connect, then select AWS Secrets Manager.
  2. For Secret, select (Redshift-admin-credentials).
  3. Choose Save.

Redshift connection interface displaying IAM Identity Center and AWS Secrets Manager authentication methods with credential selector

Set up schemas in Amazon Redshift

An external schema in Amazon Redshift is a feature used to reference schemas that exist in external data sources. For information on creating external schemas, see External schemas in Amazon Redshift Spectrum. We use an external schema to provide access to the data lake in Amazon Redshift. From ArcGIS Pro, we will connect to Amazon Redshift to access the geospatial data.

The IAM role used in the creation of the external schema needs to be associated with the Redshift namespace. This has already been set up by the CloudFormation template, but it’s a good practice to verify that the role is set up correctly before proceeding.

  1. On the Redshift Serverless console, choose Namespace configuration in the navigation pane.
  2. Choose the namespace (sample-rs-namespace).

Amazon Redshift Serverless console displaying namespace configuration with status, workgroup and creation details

On the Security and encryption tab, you should see the IAM role created by CloudFormation. If this role or the namespace isn’t present, verify the stack in AWS CloudFormation before proceeding.

  1. Copy the ARN of the role for use in a later step.

Redshift security configuration panel showing single synchronized IAM role with complete ARN and management options

  1. Choose Query data to return to the query editor.

Amazon Redshift Serverless interface displaying sample-rs-namespace configuration with management and query data controls

  1. In the query editor, enter the following SQL command; be sure to replace the example role ARN with your own. This SQL command will create an external schema that uses the same Redshift role associated with our namespace to attach to the AWS Glue database.
CREATE EXTERNAL SCHEMA samp_clinic_sch_ext FROM DATA CATALOG
database 'sample-glue-database'
IAM_ROLE 'arn:aws:iam::{ACCOUNT_ID}:role/demo-RedshiftIAMRole-{UNIQUE_ID}';
  1. In the query editor, perform a select query on sample-glue-database:
SELECT * FROM "dev"."samp_clinic_sch_ext"."clinic-sample_s3_{ACCOUNT_ID}";

Because the associated role has been granted access to columns tagged with geoproperty = true, only those fields will be returned, as shown in the following screenshot (the data in this example is fictionalized).

Query result displaying 20 medical clinics with details like name, address, and coordinates

  1. Use the following command to create a local schema in Amazon Redshift. The external schema can’t be updated; we will use this local schema to add a geometry field with a Redshift function.
CREATE SCHEMA samp_clinic_sch_local

Create a view in Amazon Redshift

For the data to be viewable from ArcGIS Pro, we will need to create a view. Now that the schemas have been established, we can create the view that can be accessed from ArcGIS Pro.

Amazon Redshift provides many geospatial functions that can be used to create views with fields used by ArcGIS Pro to add points onto a map. We will use one of these functions because the dataset contains latitude and longitude.

Use the following SQL code in the Amazon Redshift Query Editor to create a new view named clinic_location_view. Replace {ACCOUNT_ID} with your own account ID.

CREATE
OR REPLACE VIEW "samp_clinic_sch_local"."clinic_location_view" AS
SELECT
    clinic_id as id,
    clinic_lat as lat,
    clinic_long as long,
    ST_MAKEPOINT(long, lat) as geom
FROM
    “dev”."samp_clinic_sch_ext"."clinic-sample_s3_{ACCOUNT_ID}"
WITH NO SCHEMA BINDING;

The new view that is created under your local schema will have a column named geom containing map-based points that can be used by ArcGIS Pro to add points during map creation. The points in this example are for the clinics providing vaccines. In a real-world scenario, as new clinics are built and their data is added to the data lake, their locations would be added to the map created using this data.

Create a local database user for ArcGIS Pro

For this demo, we use a database user and group to provide access for ArcGIS Pro clients. Enter the following SQL code into the Amazon Redshift Query Editor to create a database user and group:

CREATE USER dbuser with PASSWORD ‘SET_PASSWORD_HERE’;
CREATE GROUP esri_developer_group;
ALTER GROUP esri_developer_group ADD USER dbuser;

After the commands are complete, use the following code to grant permissions to the group:

GRANT USAGE ON SCHEMA samp_clinic_sch_local TO GROUP esri_developer_group;
ALTER DEFAULT PRIVILEGES IN SCHEMA samp_clinic_sch_local GRANT SELECT ON TABLES TO GROUP esri_developer_group;
GRANT SELECT ON ALL TABLES IN SCHEMA samp_clinic_sch_local TO GROUP esri_developer_group;

Connect ArcGIS Pro to the Redshift database

In order to add the database connection to ArcGIS Pro, you need the endpoint for the Redshift Serverless workgroup. You can access the endpoint information on the sample-rs-wg workgroup details page on the Redshift Serverless console. The Redshift namespaces and workgroups are listed by default, as shown in the following screenshot.
Amazon Redshift Serverless namespace and workgroup status dashboard with performance metrics

You can copy the endpoint in the General information section. This endpoint will need to modified; the :5439/dev will need to be removed when configuring the connector in ArcGIS Pro.

Amazon Redshift Serverless workgroup details showing configuration and connection information

  1. Open ArcGIS Pro with the project file you want to add the Redshift connection to.
Make sure the Amazon Redshift ODBC connector has already been installed; this is required in order to make the connection.
  1. On the menu, choose Insert and then Connections, Database, and New Database Connection.
  2. For Database Platform, choose Amazon Redshift.
  3. For Server, insert the endpoint you copied (remove everything following .com from the endpoint).
  4. For Database, choose your database.

Amazon Redshift Serverless connection settings with server, authentication, and database fields

If your ArcGIS Pro client doesn’t have access to the endpoint, you will receive an error during this step. A network path must exist between the ArcGIS Pro client and the Redshift Serverless endpoint. You can set up the network path with Direct Connect, AWS Site-to-Site VPN, or AWS Client VPN. Although it’s not recommended for security reasons, you can also configure Amazon Redshift with a publicly available endpoint. Be sure you consult your security and network teams for best practices and policy guidance before allowing public access to your Redshift Serverless instance.

If a network path exists and you’re having issues connecting, verify the security group rules allow communication inbound from your ArcGIS Pro subnet over the port your Redshift Serverless instance is running on. The default port is 5439, but you can configure a range of ports depending on your environment; see Connecting to Amazon Redshift Serverless for more information.

If connectivity is successful, ArcGIS Pro will add the Amazon Redshift connection under Connection File Name.

  1. Choose OK.
  2. Choose the connection to display the view that was created to include geometry (clinic_location_view).
  3. Choose (right-click) the view and choose Add To Current Map.

ArcGIS Pro will add the points from the view onto the map. The final map displayed has the symbology edited to use red crosses to represent the clinics instead of dots.

Professional GIS interface showing Houston metropolitan vaccination clinics with topographic base map, toolbars, and database connectivity

Clean up

After you have finished the demo, complete the following steps to clean up your resources:

  1. On the Amazon S3 console, open the bucket created by the CloudFormation stack and delete the data-with-geocode.csv file.
  2. On the AWS CloudFormation console, delete the demo stack to remove the resources it created.

Conclusion

In this post, we reviewed how to set up Redshift Serverless to use geospatial data contained within a data lake to enhance maps in ArcGIS Pro. This technique helps builders and GIS analysts use available datasets in data lakes and transform it in Amazon Redshift to further enrich the data before presenting it on a map. We also showed how to secure a data lake using Lake Formation, crawl a geospatial dataset with AWS Glue, and visualize the data in ArcGIS Pro.

For additional best practices for storing geospatial data in Amazon S3 and querying it with Amazon Redshift, see How to partition your geospatial data lake for analysis with Amazon Redshift. We invite you to leave feedback in the comments section.


About the authors

Jeremy Spell is a Cloud Infrastructure Architect working with Amazon Web Services (AWS) Professional Services. He enjoys architecting and building solutions for customers. In his free time Jeremy makes Texas style BBQ, and spends time with his family and church community.

Jeff Demuth is a solutions architect who joined Amazon Web Services (AWS) in 2016. He focuses on the geospatial community and is passionate about geographic information systems (GIS) and technology. Outside of work, Jeff enjoys traveling, building Internet of Things (IoT) applications, and tinkering with the latest gadgets.

How Stifel built a modern data platform using AWS Glue and an event-driven domain architecture

Post Syndicated from Amit Maindola original https://aws.amazon.com/blogs/big-data/how-stifel-built-a-modern-data-platform-using-aws-glue-and-an-event-driven-domain-architecture/

Stifel Financial Corp. is an American multinational independent investment bank and financial services company, founded in 1890 and headquartered in downtown St. Louis, Missouri. Stifel offers securities-related financial services in the United States and Europe through several wholly owned subsidiaries. Stifel provides both equity and fixed income research and is the largest provider of US equity research.

In this post, we show you how Stifel implemented a modern data platform using AWS services and open data standards, building an event-driven architecture for domain data products while centralizing the metadata to facilitate discovery and sharing of data products.

Stifel’s modern data platform use case

Stifel envisioned a data platform that delivers accurate, timely, and properly governed data, providing consistency throughout the organization whenever users access the information. This approach showed limitations as the data complexity increased, data volumes grew, and demand for quick, business-driven insights rose. These challenges are encountered by financial institutions worldwide, leading to a reassessment of traditional data management practices. Under the federated governance model, Stifel developed a modern data strategy based on the following objectives:

  • Managing ingestion and metadata
  • Creating source-aligned data products complying with Stifel business streams
  • Integrating source-aligned data products from other domains (Stifel business units)
  • Producing consumer-aligned data products for specific business purposes
  • Publishing data products to a centralized data catalog

Some of the Stifel challenges highlighted in the preceding list required building a data platform that can:

  • Boost agility by democratizing data, thus reducing time to market and enhancing the customer experience
  • Improve data quality and trust in the data
  • Standardize tools and eliminate the shadow information technology (IT) culture to increase scalability, reduce risk, and minimize operational inefficiencies

Following the federated governance model, Stifel has organized its domain structure to provide autonomy to various functional teams while preserving the core values of data mesh. The following diagram depicts a high-level architecture of the data mesh implementation at Stifel.

Each data domain has the flexibility to create data products that can be published to the centralized catalog, while maintaining the autonomy for teams to develop data products that are exclusively accessible to teams within the domain. These products aren’t available to others until they are deemed ready for broader enterprise use. Domains have the freedom to decide which data they want to share. They can either:

  • Make their data products visible to everyone through the central catalog
  • Keep their data products visible only within their own domain

By implementing an event-driven domain architecture, organizations can achieve significant business advantages while positioning themselves for future growth and innovation. Stifel data products refreshes were dependent on data assets with variable cadence. Event-driven architecture enables real-time or near real-time updates by allowing data products to automatically respond to changes in underlying data assets as they occur, rather than relying on fixed batch schedules that might miss critical updates or waste resources on unnecessary refreshes. The key is to carefully plan the implementation and make sure of alignment with business objectives while considering both technical and organizational factors. This architecture style particularly suits organizations that:

  • Need real-time processing capabilities
  • Have complex domain interactions
  • Require high scalability
  • Want to improve business agility
  • Need better system integration
  • Are pursuing digital transformation

The following are some of the key AWS Services that helped Stifel to build their modern data platform.

  • AWS Glue is a serverless data integration service that’s used for data processing to build data assets and data products in the domains. Data is also cataloged in AWS Glue Catalog, making it straightforward to discover and query with supported engines.
  • Amazon EventBridge provides a scalable and flexible serverless event bus that facilitates seamless communication between different domains and services. By using EventBridge, Stifel was able to implement a publish-subscribe model where domain events can be emitted, filtered, and routed to appropriate consumers based on configurable rules. EventBridge supports custom event buses for domain-specific events, enabling clear separation of concerns and improved manageability.
  • AWS Lake Formation helped in providing centralized security, governance, and catalog capabilities while preserving domain autonomy in data product creation and management. With Lake Formation, data domains were able to maintain their independent data products within a federated structure while enforcing consistent access controls, data quality standards, and metadata management across the organization.
  • Apache Hudi on Amazon Simple Storage Service (Amazon S3) offers an optimized way to store data assets and products and promotes interoperability across other services.

Stifel’s solution architecture

The following diagram illustrates the data mesh architecture that Stifel uses to build a domain-driven architecture. In this system, various domains create data products and share them with other domains through a central governance account that uses Lake Formation.

Let’s look at some of the key design components that are being used to enable and implement data mesh and event driven design

Data ingestion framework

The data ingestion framework consists of several processor modules that are built using several AWS services and metadata driven architecture. The following diagram shows the architecture of the raw data ingestion framework.

The framework gets raw data files from both internal Stifel systems and third-party data sources. These files are processed and stored in a raw data ingestion account on Amazon S3 in open table format Apache Hudi. This stored data is then shared with different parts of the organization, called data domains. Each domain can use this shared data to create their own data products.

As a file (in CSV, XML, JSON and custom formats) lands into the landing bucket, an Amazon S3 event notification is created and placed in an Amazon Simple Queue Service (Amazon SQS)queue. The Amazon SQS queue triggers an AWS Lambda function and saves the metadata (such as the name of the file, date and time the file was received, and the file size) to a file audit data store (Amazon Aurora PostgreSQL-Compatible Edition).

An EventBridge time scheduler invokes an AWS Step Functions workflow at pre-determined intervals. The Step Functions workflow orchestrates the batch ingestion from raw to staging layer.

  1. The Step Functions workflow orchestrates a set of Lambda functions to get the list of unprocessed raw files from the audit data store and create batches of raw files to process them in parallel. The Step Functions workflow then triggers parallel AWS Glue jobs that process each batch of raw files.
  2. Each raw file is validated for any data quality checks and the data is saved to staging tables in Hudi format. Any errors encountered are logged into an audit table and a notification is generated for support team. For all successfully processed raw files, the file status is updated to PROCESSED and logged into an audit table.
  3. After the Hudi table is updated, a data refresh event is sent to EventBridge and then passed to the Central Mesh Account. The Central Mesh Account forwards these events to the data domains to notify them that the raw tables are refreshed, allowing the data domains to use this data for creating their own data products.

Event driven data product refresh

The Stifel data lake is based on a data mesh architecture where several data producers share data across data domains. A mechanism is needed to alert consumers who depend on other data producers’ data products when those source data products are refreshed, so that the consumers can update their own data products accordingly. The following diagram describes the technical architecture of event-based data processing. The central governance account acts as the central event bus, which receives all data refresh events from all data producers. The central event bus forwards the events to consumer accounts. The consumer accounts filter the events consumers are interested in from data producers for their data processing needs.

Orchestration design

Stifel designed and implemented an event-based data pipeline orchestration system that triggers data pipelines when specific events occur. This system processes data immediately after receiving all required dependency events, enabling efficient workflow management.

The following diagram describes the logical architecture of the domain data pipeline orchestration framework.

The orchestration framework includes the components described in the following list. The data dependencies and data pipeline state management metadata are hosted in an Aurora PostgreSQL database.

  1. Data refresh processor: Receives data refresh events from central mesh and local data domain and evaluates if the domain data products data dependencies are met
  2. Data product dependency processor: Retrieves metadata for the product, kicks off a corresponding data domain AWS Glue job, and updates metadata with the job information
  3. Data pipeline state change processor: Monitors the domain data jobs and takes actions based on the job’s final status (SUCCEED or FAILED) and then creates incident tickets for failed jobs

Conclusion

Stifel has improved its data management and reduced data silos by adopting a data product approach. This strategy has positioned Stifel to become a data-driven, customer-centric organization. The company combines federated platform practices with AWS and open standards. As a result, Stifel is achieving its decentralization objectives through a scalable data platform. This platform empowers domain teams to make informed decisions, drive innovation, and maintain a competitive edge. Here are the some of the advantages Stifel got from an event-driven domain architecture (EDDA):

  • Business agility: Rapid market response, new business capability integration, scalable domains, quicker feature deployment, and flexible process modification
  • Customer experience: Real-time processing, responsive interactions, personalized services, consistent omnichannel presence, and enhanced service availability
  • Operational efficiency: Reduced system coupling, optimal resource use, scalable systems, lower maintenance overhead, and efficient data processing
  • Cost benefits: Lower development costs, reduced infrastructure expenses, decreased maintenance costs, efficient resource usage, and a better ROI on technology investments

In this post, we demonstrated how Stifel is building a modern data platform by recognizing the critical importance of data in today’s financial landscape. This strategic approach not only enhances operational efficiency but also positions Stifel at the forefront of technological innovation in the financial services industry. To learn more and get started, see the following resources:


About the authors

Amit Maindola is a Senior Data Architect focused on data engineering, analytics, and AI/ML at Amazon Web Services. He helps customers in their digital transformation journey and enables them to build highly scalable, robust, and secure cloud-based analytical solutions on AWS to gain timely insights and make critical business decisions.

Srinivas Kandi is a Senior Architect at Stifel focusing on delivering the next generation of cloud data platform on AWS. Prior to joining Stifel, Srini was a delivery specialist in cloud data analytics at AWS helping several customers in their transformational journey into AWS cloud. In his free time, Srini likes to explore cooking, travel and learn new trends and innovations in AI and cloud computing.

Hossein Johari is a seasoned data and analytics leader with over 25 years of experience architecting enterprise-scale platforms. As Lead and Senior Architect at Stifel Financial Corp. in St. Louis, Missouri, he spearheads initiatives in Data Platforms and Strategic Solutions, driving the design and implementation of innovative frameworks that support enterprise-wide analytics, strategic decision-making, and digital transformation. Known for aligning technical vision with business objectives, he works closely with cross-functional teams to deliver scalable, forward-looking solutions that advance organizational agility and performance.

Ahmad Rawashdeh is a Senior Architect at Stifel Financial. He supports Stifel and its clients in designing, implementing, and building scalable and reliable data architectures on Amazon Web Services (AWS), with a strong focus on data lake strategies, database services, and efficient data ingestion and transformation pipelines.

Lei Meng is a data architect at Stifel. His focus is working in designing and implementing scalable and secure data solutions on the AWS and helping Stifel’s cloud migration from on-premises systems.

Enforce table level access control on data lake tables using AWS Glue 5.0 with AWS Lake Formation

Post Syndicated from Layth Yassin original https://aws.amazon.com/blogs/big-data/enforce-table-level-access-control-on-data-lake-tables-using-aws-glue-5-0-with-aws-lake-formation/

AWS Glue 5.0 now supports Full-Table Access (FTA) control in Apache Spark based on your policies defined in AWS Lake Formation. This new feature enables read and write operations from your AWS Glue 5.0 Spark jobs on Lake Formation registered tables when the job role has full table access. This level of control is ideal for use cases that need to comply with security regulations at the table level. In addition, you can now use Spark capabilities including Resilient Distributed Datasets (RDDs), custom libraries, and user-defined functions (UDFs) with Lake Formation tables. This capability enables Data Manipulation Language (DML) operations including CREATE, ALTER, DELETE, UPDATE, and MERGE INTO statements on Apache Hive and Iceberg tables from within the same Apache Spark application. Data teams can run complex, interactive Spark applications through Amazon SageMaker Unified Studio in compatibility mode while maintaining the table-level security boundaries provided by Lake Formation. This simplifies security and governance of your data lakes.

In this post, we show you how to enforce FTA control on AWS Glue 5.0 through Lake Formation permissions.

How access control works on AWS Glue

AWS Glue 5.0 supports two features that achieve access control through Lake Formation:

  • Full-Table Access (FTA) control
  • Fine-grained access control (FGAC)

At a high level, FTA supports access control at the table level whereas FGAC can support access control at the table, row, column, and cell levels. To support more granular access control, FGAC uses a tight security model based on user/system space isolation. By maintaining this extra level of security, only a subset of Spark core classes are allowlisted. Additionally, there is extra setup for enabling FGAC, such as passing the --enable-lakeformation-fine-grained-access parameter to the job. For more information about FGAC, see Enforce fine-grained access control on data lake tables using AWS Glue 5.0 integrated with AWS Lake Formation.

While this level of granular control is essential for organizations that need to comply with data governance, security regulations, or deal with sensitive data, it’s excessive for organizations that only need table level access control. To provide customers with a way to enforce table level access without the performance, cost, and setup overhead introduced by the tighter security model in FGAC, AWS Glue introduced FTA. Let’s dive into FTA, the main topic of this post.

How Full-Table Access (FTA) works in AWS Glue

Until AWS Glue 4.0, Lake Formation-based data access worked through GlueContext class, the utility class provided by AWS Glue. With the launch of AWS Glue 5.0, Lake Formation-based data access is available through native Spark SQL and Spark DataFrames.

With this launch, when you have full table access to your tables through Lake Formation permissions, you don’t need to enable fine-grained access mode for your AWS Glue jobs or sessions. This eliminates the need to spin up a system driver and system executors, because they’re designed to allow fine-grained access, resulting in lower performance overhead and lower cost. In addition, although Lake Formation fine-grained access mode supports read operations, FTA supports not only read operations, but also write operations through CREATE, ALTER, DELETE, UPDATE, and MERGE INTO commands.

To use FTA mode, you must allow third-party query engines to access data without the AWS Identity and Access Management (IAM) session tag validation in Lake Formation. To do this, follow the steps in Application integration for full table access.

Migrate an AWS Glue 4.0 GlueContext FTA job to AWS Glue 5.0 native Spark FTA

The high-level steps to enable the Spark native FTA feature are documented in Using AWS Glue with AWS Lake Formation for Full Table Access. However, in this section, we will go through an end-to-end example of how to migrate an AWS Glue 4.0 job that uses FTA through GlueContext to read an Iceberg table to an AWS Glue 5.0 job that uses Spark native FTA.

Prerequisites

Before you get started, make sure that you have the following prerequisites:

For this post, we use the us-east-1 AWS Region, but you can integrate it in your preferred Region if the AWS services included in the architecture are available in that Region.

You will walk through setting up test data and an example AWS Glue 4.0 job using GlueContext, but if you already have these and are only interested in how to migrate, proceed to Migrate an AWS Glue 4.0 GlueContext FTA job to AWS Glue 5.0 native Spark FTA. With the prerequisites in place, you’re ready start the implementation steps.

Create an S3 bucket and upload a sample data file

To create an S3 bucket for the raw input datasets and Iceberg table, complete the following steps:

  1. On the AWS Management Console for Amazon S3, choose Buckets in the navigation pane.
  2. Choose Create bucket.
  3. Enter the bucket name (for example, glue5-fta-demo-${AWS_ACCOUNT_ID}-${AWS_REGION_CODE}), and leave the remaining fields as default.
  4. Choose Create bucket.
  5. On the bucket details page, choose Create folder.
  6. Create two subfolders: raw-csv-input and iceberg-datalake.

  1. Upload the LOAD00000001.csv file into the raw-csv-input folder of the bucket.

Create an AWS Glue database and AWS Glue tables

To create input and output sample tables in the Data Catalog, complete the following steps:

  1. On the Athena console, navigate to the query editor.
  2. Run the following queries in sequence (provide your S3 bucket name):
-- Create database for the demo
CREATE DATABASE glue5_fta_demo;

-- Create external table in input CSV files. Replace the S3 path with your bucket name
CREATE EXTERNAL TABLE glue5_fta_demo.raw_csv_input(
 op string, 
 product_id bigint, 
 category string, 
 product_name string, 
 quantity_available bigint, 
 last_update_time string)
ROW FORMAT DELIMITED FIELDS TERMINATED BY ',' 
STORED AS INPUTFORMAT 'org.apache.hadoop.mapred.TextInputFormat' 
OUTPUTFORMAT 'org.apache.hadoop.hive.ql.io.HiveIgnoreKeyTextOutputFormat'
LOCATION 's3:///raw-csv-input/'
TBLPROPERTIES (
  'areColumnsQuoted'='false', 
  'classification'='csv', 
  'columnsOrdered'='true', 
  'compressionType'='none', 
  'delimiter'=',', 
  'typeOfData'='file');
 
-- Create output Iceberg table with partitioning. Replace the S3 bucket name with your bucket name
CREATE TABLE glue5_fta_demo.iceberg_datalake WITH (
  table_type='ICEBERG',
  format='parquet',
  write_compression = 'SNAPPY',
  is_external = false,
  partitioning=ARRAY['category', 'bucket(product_id, 16)'],
  location='s3:///iceberg-datalake/'
) AS SELECT * FROM glue5_fta_demo.raw_csv_input;
  1. Run the following query to validate the raw CSV input data:

SELECT * FROM glue5_fta_demo.raw_csv_input;The following screenshot shows the query result:

  1. Run the following query to validate the Iceberg table data:

SELECT * FROM glue5_fta_demo.iceberg_datalake;The following screenshot shows the query result:

This step used DDL to create table definitions. Alternatively, you can use a Data Catalog API, the AWS Glue console, the Lake Formation console, or an AWS Glue crawler.

The next step is to configure Lake Formation permissions on the iceberg_datalake table.

Configure Lake Formation permissions

To validate the capability, you need to define FTA permissions for the iceberg_datalake Data Catalog table you created. To start, enable read access to iceberg_datalake.

To configure Lake Formation permissions for the iceberg_datalake table, complete the following steps:

  1. On the Lake Formation console, choose Data lake locations under Administration in the navigation pane.
  2. Choose Register location.
  3. For Amazon S3 path, enter the path of your S3 bucket to register the location.
  4. For IAM role, choose your Lake Formation data access IAM role, which is not a service linked role.
  5. For Permission mode, select Lake Formation.

  1. Choose Register location.

Grant permissions on the Iceberg table

The next step is to grant table permissions on the iceberg_datalake table to the AWS Glue job role.

  1. On the Lake Formation console, choose Data permissions under Permissions in the navigation pane.
  2. Choose Grant.
  3. For Principals, choose IAM users and roles.
  4. For IAM users and roles, choose your IAM role that is going to be used on an AWS Glue job.
  5. For LF-Tags or catalog resources, choose Named Data Catalog resources.
  6. For Catalogs, choose your account ID (the default catalog).
  7. For Databases, choose glue5_fta_demo.
  8. For Tables, choose iceberg_datalake.
  9. For Table permissions, choose Select and Describe.
  10. For Data permissions, choose All data access.

Next, create the AWS Glue PySpark job to process the input data.

Query the Iceberg table through an AWS Glue 4.0 job using GlueContext and DataFrames

Next, create a sample AWS Glue 4.0 job to load data from the iceberg_datalake table. You will use this sample job as a source of migration. Complete the following steps:

  1. On the AWS Glue console, choose ETL jobs in the navigation pane.
  2. For Create job, choose Script Editor.
  3. For Engine, choose Spark.
  4. For Options, choose Start fresh.
  5. Choose Create script.
  6. For Script, replace the following parameters:
    1. Replace aws_region with your Region.
    2. Replace aws_account_id with your AWS account ID.
    3. Replace warehouse_path with your Amazon S3 warehouse path for the Iceberg table.

For more information about how to use Iceberg in AWS Glue 4.0 jobs, see Using the Iceberg framework in AWS Glue.

from awsglue.context import GlueContext
from pyspark.sql import SparkSession

catalog_name = "glue_catalog"
aws_region = "us-east-1"
aws_account_id = "123456789012"
warehouse_path = "s3:///warehouse/"

# Initialize Spark and Glue contexts
spark = SparkSession.builder \
    .config(f"spark.sql.catalog.{catalog_name}", "org.apache.iceberg.spark.SparkCatalog") \
    .config(f"spark.sql.catalog.{catalog_name}.warehouse", f"{warehouse_path}") \
    .config(f"spark.sql.catalog.{catalog_name}.catalog-impl", "org.apache.iceberg.aws.glue.GlueCatalog") \
    .config(f"spark.sql.catalog.{catalog_name}.io-impl", "org.apache.iceberg.aws.s3.S3FileIO") \
    .config(f"spark.sql.catalog.{catalog_name}.glue.lakeformation-enabled","true") \
    .config(f"spark.sql.catalog.{catalog_name}.client.region",f"{aws_region}") \
    .config(f"spark.sql.catalog.{catalog_name}.glue.id",f"{aws_account_id}") \
    .getOrCreate()
glueContext = GlueContext(spark.sparkContext)

database_name = "glue5_fta_demo"
table_name = "iceberg_datalake"

# Read the Iceberg table
df = glueContext.create_data_frame.from_catalog(
    database=database_name,
    table_name=table_name,
)
df.show()
  1. On the Job details tab, for Name, enter glue-fta-demo-iceberg.
  2. For IAM Role, assign an IAM role that has the required permissions to run an AWS Glue job and read and write to the S3 bucket.
  3. For Glue version, choose Glue 4.0 – Supports spark 3.3, Scala 2, Python 3.
  4. For Job parameters, add the following parameters:
    1. Key: --conf
    2. Value: spark.sql.extensions=org.apache.iceberg.spark.extensions.IcebergSparkSessionExtensions
    3. Key: --datalake-formats
    4. Value: iceberg
  5. Choose Save and then Run.
  6. When the job is complete, on the Run details tab, choose Output logs.

You’re redirected to the Amazon CloudWatch console to validate the output.

The output table is shown in the following screenshot. You see the same output that you saw in Athena when you verified that the Iceberg table was populated. This is because the AWS Glue job execution role has full table access from the Lake Formation permissions that you granted:

If you were to run this same AWS Glue job with another IAM role that wasn’t granted access to the table in Lake Formation, you would see an error Insufficient Lake Formation permission(s) on iceberg_datalake. Use the following steps to replicate this behavior:

  1. Create a new IAM role that’s identical to the AWS Glue job execution role you already used, but don’t grant permissions to this clone in Lake Formation.
  2. Change the role in the AWS Glue console for glue-fta-demo-iceberg to the new cloned role.
  3. Rerun the job. You should see the error.
  4. For the purposes of this post, change the role back to the original job execution role that’s registered in Lake Formation so you can use it in the next steps.

You now have an FTA setup in AWS Glue 4.0 that uses GlueContext DataFrames for an Iceberg table. You saw how roles that are granted permission in Lake Formation can read, and how roles that aren’t granted permission in Lake Formation cannot read. In the next section, we show you how to migrate from AWS Glue 4.0 GlueContext FTA to AWS Glue 5.0 native Spark FTA.

Migrate an AWS Glue 4.0 GlueContext FTA job to AWS Glue 5.0 native Spark FTA

The Lake Formation permission granting experience is identical regardless of the AWS Glue version and Spark data structures used. Therefore, assuming you have a working Lake Formation setup for your AWS Glue 4.0 job, you don’t need to modify those permissions during migration. Here are the migration steps using the AWS Glue 4.0 example from the previous sections:

  1. Allow third-party query engines to access data without the IAM session tag validation in Lake Formation. Follow the step-by-step guide in Application integration for full table access.
  2. You shouldn’t need to change the job runtime role if you have AWS Glue 4.0 FTA working (see the example permissions in the prerequisites). The main IAM permission to verify is that the AWS Glue job execution role has lakeformation:GetDataAccess.
  3. Modify the Spark session configurations in the script. Verify that the following Spark configurations are present:
--conf spark.sql.catalog.spark_catalog=org.apache.iceberg.spark.SparkSessionCatalog
--conf spark.sql.catalog.spark_catalog.warehouse=s3:///warehouse/
--conf spark.sql.catalog.spark_catalog.client.region=REGION
--conf spark.sql.catalog.spark_catalog.glue.account-id=ACCOUNT_ID
--conf spark.sql.catalog.spark_catalog.glue.lakeformation-enabled=true
--conf spark.sql.catalog.dropDirectoryBeforeTable.enabled=true

For more info about the above three steps, see Using AWS Glue with AWS Lake Formation for Full Table Access.

  1. Update the script so that GlueContext DataFrames are changed to native Spark DataFrames. For example, the updated script for the previous AWS Glue 4.0 job would now look like:
from pyspark.sql import SparkSession

catalog_name = "spark_catalog"
aws_region = "us-east-1"
aws_account_id = ""
warehouse_path = "s3:///warehouse/"

spark = SparkSession.builder \
    .config("spark.sql.extensions","org.apache.iceberg.spark.extensions.IcebergSparkSessionExtensions") \
    .config("spark.sql.defaultCatalog", f"{catalog_name}") \
    .config(f"spark.sql.catalog.{catalog_name}", "org.apache.iceberg.spark.SparkSessionCatalog") \
    .config(f"spark.sql.catalog.{catalog_name}.warehouse", f"{warehouse_path}") \
    .config(f"spark.sql.catalog.{catalog_name}.client.region", f"{aws_region}") \
    .config(f"spark.sql.catalog.{catalog_name}.glue.account-id", f"{aws_account_id}") \
    .config(f"spark.sql.catalog.{catalog_name}.glue.lakeformation-enabled", "true") \
    .config(f"spark.sql.catalog.dropDirectoryBeforeTable.enabled", "true") \
    .config(f"spark.sql.catalog.{catalog_name}.catalog-impl", "org.apache.iceberg.aws.glue.GlueCatalog") \
    .config(f"spark.sql.catalog.{catalog_name}.io-impl", "org.apache.iceberg.aws.s3.S3FileIO") \
    .getOrCreate()

database_name = "glue5_fta_demo"
table_name = "iceberg_datalake"

df = spark.sql(f"select * from {database_name}.{table_name}")
df.show()
  • You can remove the --conf job argument that was added in the AWS Glue 4.0 job because it’s set in the script itself now.
  1. For Glue version, choose Glue 5.0 – Supports spark 3.5, Scala 2, Python 3.

To verify that roles that don’t have Lake Formation permissions granted for them aren’t able to access the Iceberg table, you can repeat the same exercise you did in AWS Glue 4.0 and reuse the clone job execution role to rerun the job. You should see the error message: AnalysisException: Insufficient Lake Formation permission(s) on glue5_fta_demo

You’ve completed the migration and now have an FTA setup in AWS Glue 5.0 that uses native Spark and reads from an Iceberg table. You saw that roles that are granted permission in Lake Formation can read and that roles that aren’t granted permission in Lake Formation cannot read.

Clean up

Complete the following steps to clean up your resources:

  1. Delete the AWS Glue job glue-fta-demo-iceberg.
  2. Delete the Lake Formation permissions.
  3. Delete the bucket that you created for the input datasets, which might have a name similar to glue5-fta-demo-${AWS_ACCOUNT_ID}-${AWS_REGION_CODE}.

Conclusion

This post explained how you can enable Spark native FTA in AWS Glue 5.0 jobs that will enforce access control defined using Lake Formation grant commands. For previous AWS Glue versions, you needed to integrate AWS Glue DataFrames to enforce FTA in AWS Glue jobs or migrate to AWS Glue 5.0 FGAC, which has relatively limited functionality. With this release, if you don’t need fine-grained control, you can enforce FTA through Spark DataFrame or Spark SQL for more flexibility and performance. This capability is currently supported for Iceberg and Hive tables.

This feature can save you effort and encourage portability while migrating Spark scripts to different serverless environments such as AWS Glue and Amazon EMR.


About the authors

Layth Yassin is a Software Development Engineer on the AWS Glue team. He’s passionate about tackling challenging problems at a large scale, and building products that push the limits of the field. Outside of work, he enjoys playing/watching basketball, and spending time with friends and family.

Noritaka Sekiyama is a Principal Big Data Architect on the AWS Glue team. He is also the author of the book Serverless ETL and Analytics with AWS Glue. He is responsible for building software artifacts to help customers. In his spare time, he enjoys cycling with his road bike.

Kartik Panjabi is a Software Development Manager on the AWS Glue team. His team builds generative AI features for the Data Integration and distributed system for data integration.

Matt Su is a Senior Product Manager on the AWS Glue team. He enjoys helping customers uncover insights and make better decisions using their data with AWS Analytics services. In his spare time, he enjoys skiing and gardening.

Introducing AWS Glue Data Catalog usage metrics for API usage

Post Syndicated from David Zhang original https://aws.amazon.com/blogs/big-data/introducing-aws-glue-data-catalog-usage-metrics-for-api-usage/

We’re excited to announce AWS Glue Data Catalog usage metrics. The usage metrics is a new feature that provides native integration with Amazon CloudWatch. This feature provides you with immediate visibility into your AWS Glue Data Catalog API usage patterns and trends.

AWS Glue Data Catalog is a centralized repository that stores metadata about your organization’s datasets. With its unified interface that acts as an index, you can store and query information about your data sources, including their location, formats, schemas, and runtime metrics.

As you scale your lakehouse architecture on Amazon Web Services (AWS) and maintain reliable data operations, observability and monitoring becomes critical to understanding and optimizing Data Catalog API usages.

With Data Catalog usage metrics in CloudWatch, you can achieve the following:

  • Monitor API call patterns at 1-minute intervals
  • Proactively request service quota increase for API rate limits
  • Enable the CloudWatch pre-built anomaly detection feature to identify abnormalities in your API usage
  • Understand lakehouse usage across more than 50 APIs

In this post, we demonstrate how to access these metrics, provide a step-by-step walkthrough, and set up meaningful alarms.

Access Data Catalog usage metrics in Amazon CloudWatch console

To access Data Catalog usage metrics, complete the following steps:

  1. Open Amazon CloudWatch console
  2. Under Metrics, choose All metrics
  3. In the search bar, enter Glue and choose Enter
  4. Choose Usage > By AWS Resource, as shown in the following screenshot

  1. The Metrics section opens and displays different catalog usage metrics that you can select from to create dashboards and alarms, as shown in the following screenshot

Monitor CallCount metrics

Each Amazon CloudWatch metric for Data Catalog is of a type API and set as CallCount. This means that for each API call on that specific resource (for example, GetConnection API) will be logged as one count. These metrics can seamlessly integrate into your existing CloudWatch dashboards, or you can use them to create new ones. For proactive monitoring, you can configure custom alarms that trigger automatically when this API usage exceeds your defined thresholds, helping you comply with service limits.

Under the Graphed metrics tab, you can provide additional customizations to match your monitoring needs. In the Details column, you can create alarms and enable anomaly detection to identify unusual patterns.

To help with effective API monitoring, CallCount metrics specifically focus on successful API calls. This way, you have more precise monitoring and can troubleshoot different types of API behaviors. The following screenshot shows the AWS Glue usage metrics view for GetTables API.

In the Statistics column, you can view your API usage beyond the default Sum, Min, and Max metrics. You can now select a wide variety of statistical methods to analyze your usage patterns, as shown in the following screenshot.
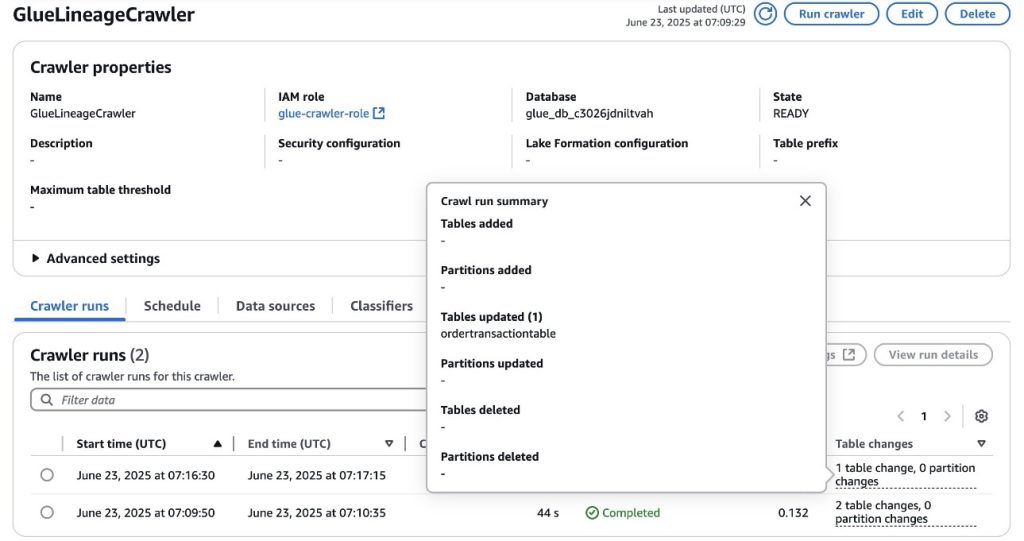
Metrics and dimensions for Data Catalog usage metrics

Data Catalog usage metrics use the AWS/Usage namespace and provide CallCount metrics. These metrics are published with the dimensions Service, Resource, Type and Class.

The CallCount metric doesn’t have a specified unit. The most useful statistic for the metric is SUM, which represents the total operation count for the 1-minute period. An important note is that the metric value is emitted at 1-minute intervals. Reducing the period further (for example, to 1 second) won’t change the emittance interval.

Metrics

Metric Description
CallCount The number of specified operations performed in your account.

Dimensions

Dimension key Dimension value Description
Service AWS Glue The name of the AWS service containing the resource. For Data Catalog usage metrics, the value for this dimension is AWS Glue.
Type API The type of resource being tracked. Currently, when the Service dimension is AWS Glue, the only valid value for Type is API.
Resource <API name>

The name of the API operation. Valid values include the following:

GetCatalogs, GetCatalog, GetDatabases, GetDatabase, GetTables, GetTable, GetTableVersion, GetTableVersions, SearchTables, GetPartitionIndexes, GetColumnStatisticsForTable, GetPartition, GetPartitions, BatchGetPartition, GetColumnStatisticsForPartition, GetConnection, GetConnections, GetUserDefinedFunction, GetUserDefinedFunctions, GetCatalogImportStatus, GetTableOptimizer, BatchGetTableOptimizer, ListTableOptimizerRuns, CreateCatalog, CreateDatabase, CreateTable, CreatePartitionIndex, CreatePartition, BatchCreatePartition, CreateConnection, CreateUserDefinedFunction, CreateTableOptimizer, UpdateCatalog, UpdateDatabase, UpdateTable, UpdateColumnStatisticsForTable, UpdatePartition, BatchUpdatePartition, UpdateColumnStatisticsForPartition, UpdateConnection, UpdateUserDefinedFunction, UpdateTableOptimizer, DeleteCatalog, DeleteDatabase, DeleteTable, BatchDeleteTable, DeleteTableVersion, DeletePartitionIndex, DeleteColumnStatisticsForTable, DeletePartition, BatchDeletePartition, DeleteColumnStatisticsForPartition, DeleteConnection, BatchDeleteConnection, DeleteUserDefinedFunction, DeleteTableOptimizer, TestConnection, ImportCatalogToGlue

Class None The class of resource being tracked. Data Catalog usage metrics use this dimension with a value of None.

Set up CloudWatch alarms for Data Catalog usage metrics

Data Catalog has defined rules to manage atypical usage patterns that limit the customer call rate at the granularity of requests per second. You can generate CloudWatch alarms using the CallCount metric so that limit increases can be done proactively. To configure a CloudWatch alarm with this threshold, complete the following steps:

  1. On the CloudWatch metrics console, select one of the available metrics, as shown in the following screenshot. In this example, we select the resource GetTables. You can select multiple metrics to fit your use case.
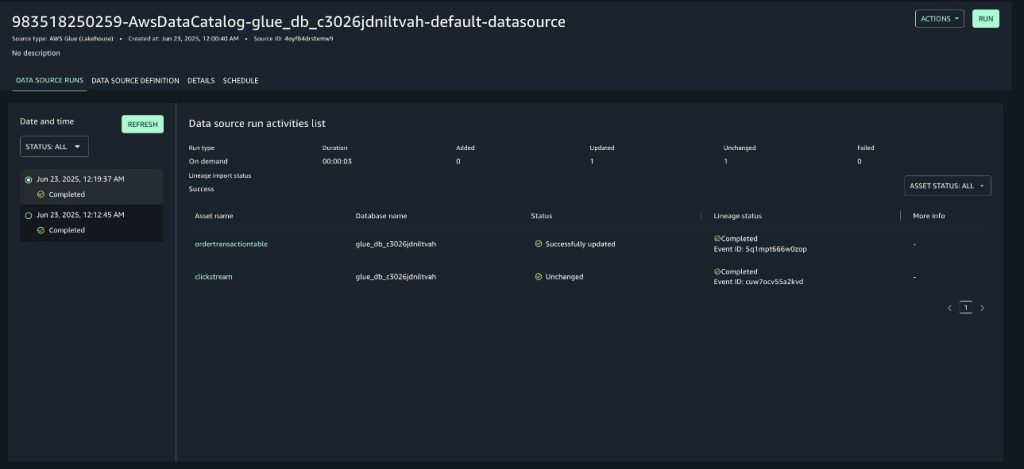
  1. Choose Graphed metrics.
  2. Choose Sum as the primary statistic.
  3. Set period to 1 minute.

  1. Choose Details and Create Alarm.

  1. For Threshold type, choose Anomaly Detection. You can also select Static based on your requirements and after you’ve determined a specific threshold value.
  2. Set the Anomaly detection threshold to 2 (default). The threshold value is used to determine the normal range of values for the metric. A higher value produces a thicker band of normal values. For more information on how CloudWatch anomaly detection works, refer to How CloudWatch anomaly detection works.
  3. Choose Next.
  4. For Send a notification to the following SNS topic, choose Create new topic.
  5. For Create a new topic, enter your Amazon Simple Notification Service (Amazon SNS) topic name.
  6. For Email endpoints that will receive the notification, enter your email address. In this example, we’re going to create a new SNS topic. However, you can use your existing SNS topics or use other options such as AWS Lambda or auto scaling action.
  7. Choose Create topic.

  1. Scroll down and choose Next.
  2. Enter an alarm name and a description and choose Next.
  3. Review all the details you’ve entered and choose Create alarm, as shown in the following screenshot.
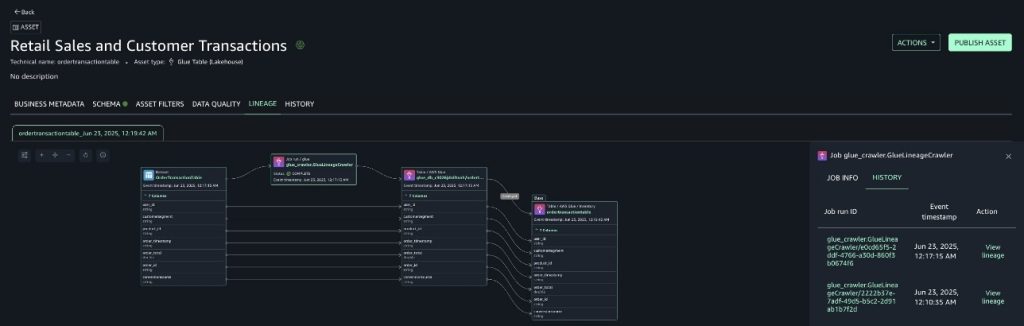
By following these steps, you’ve successfully configured a CloudWatch alarm using anomaly detection that monitors your Data Catalog usage with the threshold that you set. The alarm will trigger when the CallCount metric exceeds the calculated threshold, sending notifications to your specified SNS topic and email endpoints.

This proactive monitoring approach prevents API rate limit issues and provides a smooth operation of your Data Catalog usage. For more information on using CloudWatch alarms, refer to Using Amazon CloudWatch alarms.

Conclusion

AWS Glue Data Catalog usage metrics is an effective enhancement to your data infrastructure monitoring capabilities. It addresses the growing need for detailed observability through Amazon CloudWatch in modern data architectures built on top of Data Catalog. You now have access to more granular statistics, moving beyond simple maximum and average request metrics to comprehensive performance indicators including p99 percentiles. These metrics are emitted in 1-minute intervals, providing visibility into your data catalog operations. Organizations can now proactively identify bottlenecks before they affect operations and efficiently conduct capacity planning through detailed usage patterns.

From building monitoring dashboards to setting up alerts, the native support with CloudWatch anomaly detection and flexible alarm configurations makes it straightforward to proactively monitor your lakehouse deployment and prevent abnormalities in your lakehouse usage. For more information, refer to Monitoring Data Catalog usage metrics in Amazon CloudWatch in the AWS Glue documentation. We recommend testing and using these metrics as part of your modern monitoring and observability strategy. We encourage you to share your feedback with us.


About the authors

David Zhang is an Analytics Solutions Architect specializing in designing and implementing large-scale data infrastructure, ETL processes, and extensive data management systems. He helps customers modernize data platforms on Amazon Web Services (AWS). David is also an active speaker at AWS events and contributor to technical content and open source initiatives. He enjoys playing volleyball, tennis, and basketball during his free time.

Noritaka Sekiyama is a Principal Big Data Architect with Amazon Web Services (AWS) Analytics services. He’s responsible for building software artifacts to help customers. In his spare time, he enjoys cycling on his road bike.

Sandeep Adwankar is a Senior Product Manager at AWS. Based in the California Bay Area, he works with customers around the globe to translate business and technical requirements into products that enable customers to improve how they manage, secure, and access data.

Abhay Joshi is a Software Development Engineer at AWS Glue and AWS Lake Formation. He is passionate about building fault tolerant and reliable distributed systems at scale.

New: Improve Apache Iceberg query performance in Amazon S3 with sort and z-order compaction

Post Syndicated from Sébastien Stormacq original https://aws.amazon.com/blogs/aws/new-improve-apache-iceberg-query-performance-in-amazon-s3-with-sort-and-z-order-compaction/

You can now use sort and z-order compaction to improve Apache Iceberg query performance in Amazon S3 Tables and general purpose S3 buckets.

You typically use Iceberg to manage large-scale analytical datasets in Amazon Simple Storage Service (Amazon S3) with AWS Glue Data Catalog or with S3 Tables. Iceberg tables support use cases such as concurrent streaming and batch ingestion, schema evolution, and time travel. When working with high-ingest or frequently updated datasets, data lakes can accumulate many small files that impact the cost and performance of your queries. You’ve shared that optimizing Iceberg data layout is operationally complex and often requires developing and maintaining custom pipelines. Although the default binpack strategy with managed compaction provides notable performance improvements, introducing sort and z-order compaction options for both S3 and S3 Tables delivers even greater gains for queries filtering across one or more dimensions.

Two new compaction strategies: Sort and z-order
To help organize your data more efficiently, Amazon S3 now supports two new compaction strategies: sort and z-order, in addition to the default binpack compaction. These advanced strategies are available for both fully managed S3 Tables and Iceberg tables in general purpose S3 buckets through AWS Glue Data Catalog optimizations.

Sort compaction organizes files based on a user-defined column order. When your tables have a defined sort order, S3 Tables compaction will now use it to cluster similar values together during the compaction process. This improves the efficiency of query execution by reducing the number of files scanned. For example, if your table is organized by sort compaction along state and zip_code, queries that filter on those columns will scan fewer files, improving latency and reducing query engine cost.

Z-order compaction goes a step further by enabling efficient file pruning across multiple dimensions. It interleaves the binary representation of values from multiple columns into a single scalar that can be sorted, making this strategy particularly useful for spatial or multidimensional queries. For example, if your workloads include queries that simultaneously filter by pickup_location, dropoff_location, and fare_amount, z-order compaction can reduce the total number of files scanned compared to traditional sort-based layouts.

S3 Tables use your Iceberg table metadata to determine the current sort order. If a table has a defined sort order, no additional configuration is needed to activate sort compaction—it’s automatically applied during ongoing maintenance. To use z-order, you need to update the table maintenance configuration using the S3 Tables API and set the strategy to z-order. For Iceberg tables in general purpose S3 buckets, you can configure AWS Glue Data Catalog to use sort or z-order compaction during optimization by updating the compaction settings.

Only new data written after enabling sort or z-order will be affected. Existing compacted files will remain unchanged unless you explicitly rewrite them by increasing the target file size in table maintenance settings or rewriting data using standard Iceberg tools. This behavior is designed to give you control over when and how much data is reorganized, balancing cost and performance.

Let’s see it in action
I’ll walk you through a simplified example using Apache Spark and the AWS Command Line Interface (AWS CLI). I have a Spark cluster installed and an S3 table bucket. I have a table named testtable in a testnamespace. I temporarily disabled compaction, the time for me to add data into the table.

After adding data, I check the file structure of the table.

spark.sql("""
  SELECT 
    substring_index(file_path, '/', -1) as file_name,
    record_count,
    file_size_in_bytes,
    CAST(UNHEX(hex(lower_bounds[2])) AS STRING) as lower_bound_name,
    CAST(UNHEX(hex(upper_bounds[2])) AS STRING) as upper_bound_name
  FROM ice_catalog.testnamespace.testtable.files
  ORDER BY file_name
""").show(20, false)
+--------------------------------------------------------------+------------+------------------+----------------+----------------+
|file_name                                                     |record_count|file_size_in_bytes|lower_bound_name|upper_bound_name|
+--------------------------------------------------------------+------------+------------------+----------------+----------------+
|00000-0-66a9c843-5a5c-407f-8da4-4da91c7f6ae2-0-00001.parquet  |1           |837               |Quinn           |Quinn           |
|00000-1-b7fa2021-7f75-4aaf-9a24-9bdbb5dc08c9-0-00001.parquet  |1           |824               |Tom             |Tom             |
|00000-10-00a96923-a8f4-41ba-a683-576490518561-0-00001.parquet |1           |838               |Ilene           |Ilene           |
|00000-104-2db9509d-245c-44d6-9055-8e97d4e44b01-0-00001.parquet|1000000     |4031668           |Anjali          |Tom             |
|00000-11-27f76097-28b2-42bc-b746-4359df83d8a1-0-00001.parquet |1           |838               |Henry           |Henry           |
|00000-114-6ff661ca-ba93-4238-8eab-7c5259c9ca08-0-00001.parquet|1000000     |4031788           |Anjali          |Tom             |
|00000-12-fd6798c0-9b5b-424f-af70-11775bf2a452-0-00001.parquet |1           |852               |Georgie         |Georgie         |
|00000-124-76090ac6-ae6b-4f4e-9284-b8a09f849360-0-00001.parquet|1000000     |4031740           |Anjali          |Tom             |
|00000-13-cb0dd5d0-4e28-47f5-9cc3-b8d2a71f5292-0-00001.parquet |1           |845               |Olivia          |Olivia          |
|00000-134-bf6ea649-7a0b-4833-8448-60faa5ebfdcd-0-00001.parquet|1000000     |4031718           |Anjali          |Tom             |
|00000-14-c7a02039-fc93-42e3-87b4-2dd5676d5b09-0-00001.parquet |1           |838               |Sarah           |Sarah           |
|00000-144-9b6d00c0-d4cf-4835-8286-ebfe2401e47a-0-00001.parquet|1000000     |4031663           |Anjali          |Tom             |
|00000-15-8138298d-923b-44f7-9bd6-90d9c0e9e4ed-0-00001.parquet |1           |831               |Brad            |Brad            |
|00000-155-9dea2d4f-fc98-418d-a504-6226eb0a5135-0-00001.parquet|1000000     |4031676           |Anjali          |Tom             |
|00000-16-ed37cf2d-4306-4036-98de-727c1fe4e0f9-0-00001.parquet |1           |830               |Brad            |Brad            |
|00000-166-b67929dc-f9c1-4579-b955-0d6ef6c604b2-0-00001.parquet|1000000     |4031729           |Anjali          |Tom             |
|00000-17-1011820e-ee25-4f7a-bd73-2843fb1c3150-0-00001.parquet |1           |830               |Noah            |Noah            |
|00000-177-14a9db71-56bb-4325-93b6-737136f5118d-0-00001.parquet|1000000     |4031778           |Anjali          |Tom             |
|00000-18-89cbb849-876a-441a-9ab0-8535b05cd222-0-00001.parquet |1           |838               |David           |David           |
|00000-188-6dc3dcca-ddc0-405e-aa0f-7de8637f993b-0-00001.parquet|1000000     |4031727           |Anjali          |Tom             |
+--------------------------------------------------------------+------------+------------------+----------------+----------------+
only showing top 20 rows

I observe the table is made of multiple small files and that the upper and lower bounds for the new files have overlap–the data is certainly unsorted.

I set the table sort order.

spark.sql("ALTER TABLE ice_catalog.testnamespace.testtable WRITE ORDERED BY name ASC")

I enable table compaction (it’s enabled by default; I disabled it at the start of this demo)

aws s3tables put-table-maintenance-configuration --table-bucket-arn ${S3TABLE_BUCKET_ARN} --namespace testnamespace --name testtable --type icebergCompaction --value "status=enabled,settings={icebergCompaction={strategy=sort}}"

Then, I wait for the next compaction job to trigger. These run throughout the day, when there are enough small files. I can check the compaction status with the following command.

aws s3tables get-table-maintenance-job-status --table-bucket-arn ${S3TABLE_BUCKET_ARN} --namespace testnamespace --name testtable

When the compaction is done, I inspect the files that make up my table one more time. I see that the data was compacted to two files, and the upper and lower bounds show that the data was sorted across these two files.

spark.sql("""
  SELECT 
    substring_index(file_path, '/', -1) as file_name,
    record_count,
    file_size_in_bytes,
    CAST(UNHEX(hex(lower_bounds[2])) AS STRING) as lower_bound_name,
    CAST(UNHEX(hex(upper_bounds[2])) AS STRING) as upper_bound_name
  FROM ice_catalog.testnamespace.testtable.files
  ORDER BY file_name
""").show(20, false)
+------------------------------------------------------------+------------+------------------+----------------+----------------+
|file_name                                                   |record_count|file_size_in_bytes|lower_bound_name|upper_bound_name|
+------------------------------------------------------------+------------+------------------+----------------+----------------+
|00000-4-51c7a4a8-194b-45c5-a815-a8c0e16e2115-0-00001.parquet|13195713    |50034921          |Anjali          |Kelly           |
|00001-5-51c7a4a8-194b-45c5-a815-a8c0e16e2115-0-00001.parquet|10804307    |40964156          |Liza            |Tom             |
+------------------------------------------------------------+------------+------------------+----------------+----------------+

There are fewer files, they have larger sizes, and there is a better clustering across the specified sort column.

To use z-order, I follow the same steps, but I set strategy=z-order in the maintenance configuration.

Regional availability
Sort and z-order compaction are now available in all AWS Regions where Amazon S3 Tables are supported and for general purpose S3 buckets where optimization with AWS Glue Data Catalog is available. There is no additional charge for S3 Tables beyond existing usage and maintenance fees. For Data Catalog optimizations, compute charges apply during compaction.

With these changes, queries that filter on the sort or z-order columns benefit from faster scan times and reduced engine costs. In my experience, depending on my data layout and query patterns, I observed performance improvements of threefold or more when switching from binpack to sort or z-order. Tell us how much your gains are on your actual data.

To learn more, visit the Amazon S3 Tables product page or review the S3 Tables maintenance documentation. You can also start testing the new strategies on your own tables today using the S3 Tables API or AWS Glue optimizations.

— seb

Introducing AWS Lambda native support for Avro and Protobuf formatted Apache Kafka events

Post Syndicated from Julian Wood original https://aws.amazon.com/blogs/compute/introducing-aws-lambda-native-support-for-avro-and-protobuf-formatted-apache-kafka-events/

AWS Lambda now provides native support for Apache Avro and Protocol Buffers (Protobuf) formatted events with Apache Kafka event source mapping (ESM) when using Provisioned Mode. The support allows you to validate your schema with popular schema registries. This allows you to use and filter the more efficient binary event formats and share data using schema in a centralized and consistent way. This blog post shows how you can use Lambda to process Avro and Protobuf formatted events from Kafka topics using schema registry integration.

This new capability works with both Amazon Managed Streaming for Apache Kafka (Amazon MSK), Confluent Cloud and self-managed Kafka clusters. To get started, update your existing Kafka ESM to Provisioned Mode and add schema registry configuration, or create a new ESM in Provisioned Mode with schema registry integration enabled.

Avro and Protobuf

Many organizations use Avro and Protobuf formats with Apache Kafka because these binary serialization formats offer advantages over JSON. They provide 50-80% smaller message sizes, faster serialization and deserialization performance, robust schema evolution capabilities, and strong typing across multiple programming languages.Working with these formats in Lambda functions previously necessitated custom code. Developers needed to implement schema registry clients, handle authentication and caching, write format-specific deserialization logic, and manage schema evolution scenarios.

What’s new

Lambda’s Kafka Event Source Mapping (ESM) now provides built-in integration with AWS Glue Schema Registry, Confluent Cloud Schema Registry, and self-managed Confluent Schema Registry. When you configure schema registry settings for your Kafka ESM, the service automatically validates incoming JSON Schema, Avro, and Protobuf records against their registered schema. This moves complex schema registry integration logic from your application layer to the managed Lambda service.

You can build your function with Kafka’s open-source ConsumerRecords interface using Powertools for AWS Lambda to get your Avro or Protobuf generated business objects directly. Optionally you can specify to get your records in the JSON format, where your function receives clean, validated JSON data regardless of the original serialization format, removing the need for custom deserialization code in your Lambda functions. This also allows you to create Kafka consumers across multiple programming languages.

Powertools for AWS Lambda is a developer toolkit that provides specific support for Java, .NET, Python, and TypeScript, maintaining consistency with existing Kafka development patterns. You can directly access business objects without custom deserialization code.

You can also setup filtering rules to discard irrelevant, JSON, Avro or Protobuf formatted events before function invocations, which can improve processing performance and reduce costs.

How schema validation works

When you configure schema registry integration for your Kafka ESM, you specify the registry endpoint, authentication details, and which event fields (key, value, or both) to validate. The ESM polls your Kafka topics for records as usual but now performs additional processing before invoking your Lambda function.For each incoming event, the ESM extracts the schema ID embedded in the serialized data. It fetches the corresponding schema from your configured registry. This process happens transparently, with schema definitions cached for up to 24 hours to optimize performance. The ESM identifies the format of your events using schema metadata and validates the event structure. It keeps either the original binary data or deserializes it to JSON format based on your customer configuration and sends it to your function for processing.


Figure 1: Kafka processing flow diagram.

The ESM handles schema evolution automatically. When producers begin using new schema versions, the service detects the updated schema IDs and fetches the latest definitions from your registry. This makes sure that your functions always receive properly deserialized data without requiring code changes.

Event record format

As a part of the ESM schema registry configuration, you need to specify Event Record Format, which Lambda uses to deliver validated records to your function. The schema registry configuration supports SOURCE and JSON.

SOURCE preserves the original binary format of the data as a base64-encoded string with producer-appended schema-id removed. This allows direct conversion to Avro or Protobuf objects so that you can use Kafka’s ConsumerRecords interface for a Kafka-like experience. Use this format when working with strongly typed languages or when you need to maintain the full capabilities of Avro or Protobuf schemas. Then, you can use any Avro or Protobuf deserializer to convert raw bytes to your business object. Powertools provides native support for this deserialization.

With JSON, the ESM deserializes the data ready for direct use in languages with native JSON support. Use this when you don’t need to preserve the original binary format or work with generated classes. You can also use Powertools to convert the base64 to your business object. See the documentation for payload formats and deserialization behavior.

If you configure filtering rules, then they operate on the JSON-formatted events after deserialization. This upstream filtering prevents unnecessary Lambda invocations for events that don’t match your processing criteria, directly reducing your compute costs.

Configuration and setup

To use this feature, you must enable Provisioned Mode for your Kafka ESM, which provides the dedicated compute resources needed for schema registry integration.

You can configure the integration through the AWS Management Console, AWS Command Line Interface (AWS CLI), AWS Language SDKs, or infrastructure as code (IaC) tools such as the AWS Serverless Application Model (AWS SAM) or AWS Cloud Development Kit (AWS CDK).

Your schema registry configuration includes the registry endpoint URL, authentication method (AWS Identity and Access Management (IAM) for AWS Glue Schema Registry, or Basic Auth, SASL/SCRAM, or mTLS for Confluent registries), and validation settings. You specify which event attributes to validate and optionally define filtering rules using standard Lambda event filtering syntax.

For error handling, configure Lambda failure destinations where events that fail schema validation or deserialization are sent. This makes sure that problematic events don’t disappear silently but are routed to other services such as Amazon Simple Queue Service (Amazon SQS), Amazon Simple Notification Service (Amazon SNS), and Amazon S3 for debugging and analysis.

Seeing the new features in action

There are a number of Serverless Patterns that you can use to process Kafka streams using Lambda. This example uses the Java pattern.

Deploy a sample Amazon MSK cluster

To set up an Amazon MSK cluster, follow the instructions in the GitHub repo and create a new AWS CloudFormation stack using the MSKAndKafkaClientEC2.yaml template file. The stack creates the Amazon MSK cluster, along with a client Amazon EC2 instance, to manage the Kafka cluster. There are costs involved when running this infrastructure.

  1. Connect to the EC2 instance using EC2 Instance Connect.
  2. Check that the Kafka topic is created by checking the contents of the kafka_topic_creator_output.txt file.
    cat kafka_topic_creator_output.txt

  3. The file should contain the text: “Created topic MskIamJavaLambdaTopic.”

Deploy the Glue schema registry and consumer Lambda function

The EC2 instance contains the software needed to deploy the schema registry and Lambda function.

  1. Change directory to the pattern directory.
    cd serverless-patterns/msk-lambda-iam-java-sam
  2. Build the application using AWS SAM.
    sam build
  3. To deploy your application for the first time, run the following in the EC2 instance shell:
    sam deploy --capabilities CAPABILITY_IAM --no-confirm-changeset \
    	--no-disable-rollback --region $AWS_REGION --stack-name msk-lambda-schema-avro-java-sam --guided

  4. You can accept all the defaults by hitting Enter. You can browse to the AWS Glue schema registry console and view the ContactSchema definition:
    {
      "type": "record",
      "name": "Contact",
      "fields": [
        {"name": "firstname", "type": "string"},
        {"name": "lastname", "type": "string"},
        {"name": "company", "type": "string"},
        {"name": "street", "type": "string"},
        {"name": "city", "type": "string"},
        {"name": "county", "type": "string"},
        {"name": "state", "type": "string"},
        {"name": "zip", "type": "string"},
        {"name": "homePhone", "type": "string"},
        {"name": "cellPhone", "type": "string"},
        {"name": "email", "type": "string"},
        {"name": "website", "type": "string"}
      ]
    }
    

    The consumer Lambda function ESM is configured for Provisioned Mode.

  5. View the ESM configuration from the Lambda console for the Lambda function name prefixed with msk-lambda-schema-avro-ja-LambdaMSKConsumer.
  6. Choose the MSK Lambda trigger which opens the Triggers pane under Configuration.
    Figure 2: View Lambda ESM schema configuration
  7. The configuration specifies using the Event record format SOURCE so your function can use Kafka’s native open-source ConsumerRecords interface. Powertools then deserializes the payload.
  8. The schema validation attribute is VALUE.
  9. The ESM filter configuration only processes the records that match zip codes of 2000.
  10. In your function code, specify the open-source Kafka ConsumersRecords interface by including Powertools for Lambda as a dependency. ConsumerRecords provides metadata about Kafka records and allows you to get direct access to your Avro/Protobuf generated business objects without requiring any additional deserialization code.
package com.amazonaws.services.lambda.samples.events.msk;

import com.amazonaws.services.lambda.runtime.Context;
import com.amazonaws.services.lambda.runtime.RequestHandler;
import org.apache.kafka.clients.consumer.ConsumerRecord;
import org.apache.kafka.clients.consumer.ConsumerRecords;
import org.slf4j.Logger;
import org.slf4j.LoggerFactory;
import software.amazon.lambda.powertools.kafka.Deserialization;
import software.amazon.lambda.powertools.kafka.DeserializationType;
import software.amazon.lambda.powertools.logging.Logging;

public class AvroKafkaHandler implements RequestHandler<ConsumerRecords<String, Contact>, String> {
    private static final Logger LOGGER = LoggerFactory.getLogger(AvroKafkaHandler.class);

    @Override
    @Logging(logEvent = true)
    @Deserialization(type = DeserializationType.KAFKA_AVRO)
    public String handleRequest(ConsumerRecords<String, Contact> records, Context context) {
        LOGGER.info("=== AvroKafkaHandler called ===");
        LOGGER.info("Event object: {}", records);
        LOGGER.info("Number of records: {}", records.count());
        
        for (ConsumerRecord<String, Contact> record : records) {
            LOGGER.info("Processing record - Topic: {}, Partition: {}, Offset: {}", 
                       record.topic(), record.partition(), record.offset());
            LOGGER.info("Record key: {}", record.key());
            LOGGER.info("Record value: {}", record.value());
            
            if (record.value() != null) {
                Contact contact = record.value();
                LOGGER.info("Contact details - firstName: {}, zip: {}", 
                           contact.getFirstname(), contact.getZip());
            }
        }
        
        LOGGER.info("=== AvroKafkaHandler completed ===");
        return "OK";
    }
}
Produce and consumer records

To send messages to Kafka, there is a LambdaMSKProducerJava function.

  1. Invoke the function from the Lambda console or CLI within the EC2 instance.
    sam remote invoke LambdaMSKProducerJavaFunction --region $AWS_REGION \
    	--stack-name msk-lambda-schema-avro-java-sam

  2. You can view the Producer logs to see the 10 records produced.The consumer Lambda function processes the records.
  3. View the consumer Lambda function logs using the Amazon CloudWatch logs console or CLI within the EC2 instance.
    sam logs --name LambdaMSKConsumerJavaFunction \
    	--stack-name msk-lambda-schema-avro-java-sam --region $AWS_REGION

The Lambda function processes and logs only the records that match the filter FILTER. The Avro binary data is deserialized using Powertools for AWS Lambda. You should see the function logs showing each record processed with the decoded keys and values.


Figure 3: Lambda consumer logs showing Avro processing

Cleaning up

You can clean up the example Lambda function by running the sam delete command.

sam delete

If you created the Amazon MSK cluster and EC2 client instance, then navigate to the CloudFormation console, choose the stack, and choose Delete.

Performance and cost considerations

Schema validation and deserialization can add processing time before your function invocation. However, this overhead is typically minimal when compared to the benefits. ESM caching minimizes schema registry API calls. Using filtering allows you to reduce costs, depending on how effectively your filtering rules eliminate irrelevant events. This feature simplifies the operational overhead of managing schema registry integration code so teams can focus on business logic rather than infrastructure concerns.

Error handling and monitoring

If schema registries become temporarily unavailable, then cached schemas allow event processing to continue until the registry is available again. Authentication failures generate error messages with automatic retry logic. Schema evolution happens seamlessly as Lambda automatically detects and fetches new versions.

If events fail validation or deserialization, they are routed to your configured failure destinations. For Amazon SQS and Amazon SNS destinations, the service sends metadata about the failure. For Amazon S3 destinations, both metadata and the original serialized payload are included for detailed analysis.

You can use standard Lambda monitoring, with more CloudWatch metrics providing visibility into schema validation success rates, registry API usage, and filtering effectiveness.

Conclusion

AWS Lambda now supports Avro and Protobuf formats for Kafka event processing in Provisioned Mode for Kafka ESM. This enables schema validation, event filtering, and integration with both Amazon MSK, Confluent, and self-managed Kafka clusters. Whether you’re building new Kafka applications or migrating existing consumers to Lambda, this native schema registry integration streamlines processing pipelines.

For more information about the Lambda Kafka integration capabilities, go to the learning guide, Lambda ESM documentation. To learn about Lambda pricing, such as Provisioned Mode costs, visit the Lambda pricing page.

For more serverless learning resources, visit Serverless Land.

RocksDB 101: Optimizing stateful streaming in Apache Spark with Amazon EMR and AWS Glue

Post Syndicated from Melody Yang original https://aws.amazon.com/blogs/big-data/rocksdb-101-optimizing-stateful-streaming-in-apache-spark-with-amazon-emr-and-aws-glue/

Real-time streaming data processing is a strategic imperative that directly impacts business competitiveness. Organizations face mounting pressure to process massive data streams instantaneously—from detecting fraudulent transactions and delivering personalized customer experiences to optimizing complex supply chains and responding to market dynamics milliseconds ahead of competitors.

Apache Spark Structured Streaming addresses these critical business challenges through its stateful processing capabilities, enabling applications to maintain and update intermediate results across multiple data streams or time windows. RocksDB was introduced in Apache Spark 3.2, offering a more efficient alternative to the default HDFS-based in-memory store. RocksDB excels in stateful streaming in scenarios that require handling large quantities of state data. It delivers optimal performance benefits, particularly in reducing Java virtual machine (JVM) memory pressure and garbage collection (GC) overhead.

This post explores RocksDB’s key features and demonstrates its implementation using Spark on Amazon EMR and AWS Glue, providing you with the knowledge you need to scale your real-time data processing capabilities.

RocksDB state store overview

Spark Structured Streaming processes fall into two categories:

  • Stateful: Requires tracking intermediate results across micro-batches (for example, when running aggregations and de-duplication).
  • Stateless: Processes each batch independently.

A state store is required by stateful applications that track intermediate query results. This is essential for computations that depend on continuous events and change results based on each batch of input, or on aggregate data over time, including late arriving data. By default, Spark offers a state store that keeps states in JVM memory, which is performant and sufficient for most general streaming cases. However, if you have a large number of stateful operations in a streaming application—such as, streaming aggregation, streaming dropDuplicates, stream-stream joins, and so on—the default in-memory state store might face out-of-memory (OOM) issues because of a large JVM memory footprint or frequent GC pauses, resulting in degraded performance.

Advantages of RocksDB over in-memory state store

RocksDB addresses the challenges of an in-memory state store through off-heap memory management and efficient checkpointing.

  • Off-heap memory management: RocksDB stores state data in OS-managed off-heap memory, reducing GC pressure. While off-heap memory still consumes machine memory, it doesn’t occupy space in the JVM. Instead, its core memory structures, such as block cache or memTables, allocate directly from the operating system, bypassing the JVM heap. This approach makes RocksDB an optimal choice for memory-intensive applications.
  • Efficient checkpointing: RocksDB automatically saves state changes to checkpoint locations, such as Amazon Simple Storage Service (Amazon S3) paths or local directories, helping to ensure full fault tolerance. When interacting with S3, RocksDB is designed to improve checkpointing efficiency; it does this through incremental updates and compaction to reduce the amount of data transferred to S3 during checkpoints, and by persisting fewer large state files compared to the many small files of the default state store, reducing S3 API calls and latency.

Implementation considerations

RocksDB operates as a native C++ library embedded within the Spark executor, using off-heap memory. While it doesn’t fall under JVM GC control, it still affects overall executor memory usage from the YARN or OS perspective. RocksDB’s off-heap memory usage might exceed YARN container limits without triggering container termination, potentially leading to OOM issues. You should consider the following approaches to manage Spark’s memory:

Adjust the Spark executor memory size

Increase spark.executor.memoryOverheadorspark.executor.memoryOverheadFactor to leave more room for off-heap usage. The following example sets half (4 GB) of spark.executor.memory (8 GB) as the memory overhead size.

# Total executor memory = 8GB (heap) + 4GB (overhead) = 12GB
spark-submit \
. . . . . . . .
--conf spark.executor.memory=8g \         # JVM Heap
--conf spark.executor.memoryOverhead=4g \ # Off-heap allocation (RocksDB + other native)
. . . . . . . .

For Amazon EMR on Amazon Elastic Compute Cloud (Amazon EC2), enabling YARN memory control with the following strict container memory enforcement through polling method preempts containers to avoid node-wide OOM failures:

yarn.nodemanager.resource.memory.enforced = false
yarn.nodemanager.elastic-memory-control.enabled = false
yarn.nodemanager.pmem-check-enabled = true 
or 
yarn.nodemanager.vmem-check-enabled = true

Off-heap memory control

Use RocksDB-specific settings to configure memory usage. More details can be found in the Best practices and considerations section.

Get started with RocksDB on Amazon EMR and AWS Glue

To turn on the state store RocksDB in Spark, configure your application with the following setting:

spark.sql.streaming.stateStore.providerClass=org.apache.spark.sql.execution.streaming.state.RocksDBStateStoreProvider

In the following sections, we explore creating a sample Spark Structured Streaming job with RocksDB enabled running on Amazon EMR and AWS Glue respectively.

RocksDB on Amazon EMR

Amazon EMR versions 6.6.0 and later support RocksDB, including Amazon EMR on EC2, Amazon EMR serverless and Amazon EMR on Amazon Elastic Kubernetes Service (Amazon EKS). In this case, we use Amazon EMR on EC2 as an example.

Use the following steps to run a sample streaming job with RocksDB enabled.

  1. Upload the following sample script to s3://<YOUR_S3_BUCKET>/script/sample_script.py
from pyspark.sql import SparkSession
from pyspark.sql.functions import explode, split, col, expr
import random

# List of words
words = ["apple", "banana", "orange", "grape", "melon", 
         "peach", "berry", "mango", "kiwi", "lemon"]

# Create random strings from words
def generate_random_string():
    return " ".join(random.choices(words, k=5)) 
    
    
# Create Spark Session
spark = SparkSession \
    .builder \
    .appName("StreamingWordCount") \
    .config("spark.sql.streaming.stateStore.providerClass","org.apache.spark.sql.execution.streaming.state.RocksDBStateStoreProvider") \
    .getOrCreate()


# Register UDF
spark.udf.register("random_string", generate_random_string)

# Create streaming data
raw_stream = spark.readStream \
    .format("rate") \
    .option("rowsPerSecond", 1) \
    .load() \
    .withColumn("words", expr("random_string()"))

# Execute word counts
wordCounts = raw_stream.select(explode(split(raw_stream.words, " ")).alias("word")).groupby("word").count()

# Output the results
query = wordCounts \
    .writeStream \
    .outputMode("complete") \
    .format("console") \
    .start()

query.awaitTermination()
  1. On the AWS Management Console for Amazon EMR, choose Create Cluster
  2. For Name and applications – required, select the latest Amazon EMR release.
  3. For Steps, choose Add. For Type, select Spark application.
  4. For Name, enter GettingStartedWithRocksDB and s3://<YOUR_S3_BUCKET>/script/sample_script.py as the Application location.
  5. Choose Save step.
  6. For other settings, choose the appropriate settings based on your use case.
  7. Choose Create cluster to start the streaming application via Amazon EMR step.

RocksDB on AWS Glue

AWS Glue 4.0 and later versions support RocksDB. Use the following steps to run the sample job with RocksDB enabled on AWS Glue.

  1. On the AWS Glue console, in the navigation pane, choose ETL jobs.
  2. Choose Script editor and Create script.
  3. For the job name, enter GettingStartedWithRocksDB.
  4. Copy the script from the previous example and paste it on the Script tab.
  5. On Job details tab, for Type, select Spark Streaming.
  6. Choose Save, and then choose Run to start the streaming job on AWS Glue.

Walkthrough details

Let’s dive deep into the script to understand how to run a simple stateful Spark application with RocksDB using the following example pySpark code.

  1. First, set up RocksDB as your state store by configuring the provider class:
spark = SparkSession \
    .builder \
    .appName("StreamingWordCount") \
    .config("spark.sql.streaming.stateStore.providerClass","org.apache.spark.sql.execution.streaming.state.RocksDBStateStoreProvider") \
    .getOrCreate()
  1. To simulate streaming data, create a data stream using the rate source type. It generates one record per second, containing five random fruit names from a pre-defined list.
# List of words
words = ["apple", "banana", "orange", "grape", "melon", 
         "peach", "berry", "mango", "kiwi", "lemon"]

# Create random strings from words
def generate_random_string():
    return " ".join(random.choices(words, k=5))
# Register UDF
spark.udf.register("random_string", generate_random_string)

# Create streaming data
raw_stream = spark.readStream \
    .format("rate") \
    .option("rowsPerSecond", 1) \
    .load() \
    .withColumn("words", expr("random_string()"))
  1. Create a word counting operation on the incoming stream. This is a stateful operation because it maintains running counts between processing intervals, that is, previous counts must be stored to calculate the next new totals.
# Split raw_stream into words and counts them
wordCounts = raw_stream.select(explode(split(raw_stream.words, " ")).alias("word")).groupby("word").count()
  1. Finally, output the word count totals to the console:
# Output the results
query = wordCounts \
    .writeStream \
    .outputMode("complete") \
    .format("console") \
    .start()

Input data

In the same sample code, test data (raw_stream) is generated at a rate of one-row-per-second, as shown in the following example:

+-----------------------+-----+--------------------------------+
|timestamp              |value|words                           |
+-----------------------+-----+--------------------------------+
|2025-04-18 07:05:57.204|125  |berry peach orange banana banana|
+-----------------------+-----+--------------------------------+

Output result

The streaming job produces the following results in the output logs. It demonstrates how Spark Structured Streaming maintains and updates the state across multiple micro-batches:

  • Batch 0: Starts with an empty state
  • Batch 1: Processes multiple input records, resulting in initial counts for every one of the 10 fruits (for example, banana appears 8 times)
  • Batch 2: Running totals based on new occurrences from the next set of records are added to the counts (for example,  banana increases from 8 to 15, indicating 7 new occurrences).

-------------------------------------------
Batch: 0
-------------------------------------------
+----+-----+
|word|count|
+----+-----+
+----+-----+

-------------------------------------------
Batch: 1
-------------------------------------------
+------+-----+
|  word|count|
+------+-----+
|banana|    8|
|orange|    4|
| apple|    3|
| berry|    5|
| lemon|    7|
|  kiwi|    6|
| melon|    8|
| peach|    8|
| mango|    7|
| grape|    9|
+------+-----+

-------------------------------------------
Batch: 2
-------------------------------------------
+------+-----+
|  word|count|
+------+-----+
|banana|   15|
|orange|    8|
| apple|    7|
| berry|   11|
| lemon|   12|
|  kiwi|   11|
| melon|   16|
| peach|   15|
| mango|   12|
| grape|   13|
+------+-----+

State store logs

RocksDB generates detailed logs during the job run, like the following:

INFO    2025-04-18T07:52:28,378 83933   org.apache.spark.sql.execution.streaming.MicroBatchExecution    [stream execution thread for [id = xxxxxxxx-xxxx-xxxx-xxxx-xxxxxxxxxxxx, runId = xxxxxxxx-xxxx-xxxx-xxxx-xxxxxxxxxxxx]] 60  Streaming query made progress: {
  "id": "xxxxxxxx-xxxx-xxxx-xxxx-xxxxxxxxxxxx",
  "runId": "xxxxxxxx-xxxx-xxxx-xxxx-xxxxxxxxxxxx",
  "name": null,
  "timestamp": "2025-04-18T07:52:27.642Z",
  "batchId": 39,
  "numInputRows": 1,
  "inputRowsPerSecond": 100.0,
  "processedRowsPerSecond": 1.3623978201634879,
  "durationMs": {
    "addBatch": 648,
    "commitOffsets": 39,
    "getBatch": 0,
    "latestOffset": 0,
    "queryPlanning": 10,
    "triggerExecution": 734,
    "walCommit": 35
  },
  "stateOperators": [
    {
      "operatorName": "stateStoreSave",
      "numRowsTotal": 10,
      "numRowsUpdated": 4,
      "allUpdatesTimeMs": 18,
      "numRowsRemoved": 0,
      "allRemovalsTimeMs": 0,
      "commitTimeMs": 3629,
      "memoryUsedBytes": 174179,
      "numRowsDroppedByWatermark": 0,
      "numShufflePartitions": 36,
      "numStateStoreInstances": 36,
      "customMetrics": {
        "rocksdbBytesCopied": 5009,
        "rocksdbCommitCheckpointLatency": 533,
        "rocksdbCommitCompactLatency": 0,
        "rocksdbCommitFileSyncLatencyMs": 2991,
        "rocksdbCommitFlushLatency": 44,
        "rocksdbCommitPauseLatency": 0,
        "rocksdbCommitWriteBatchLatency": 0,
        "rocksdbFilesCopied": 4,
        "rocksdbFilesReused": 24,
        "rocksdbGetCount": 8,
        "rocksdbGetLatency": 0,
        "rocksdbPinnedBlocksMemoryUsage": 3168,
        "rocksdbPutCount": 4,
        "rocksdbPutLatency": 0,
        "rocksdbReadBlockCacheHitCount": 8,
        "rocksdbReadBlockCacheMissCount": 0,
        "rocksdbSstFileSize": 35035,
        "rocksdbTotalBytesRead": 136,
        "rocksdbTotalBytesReadByCompaction": 0,
        "rocksdbTotalBytesReadThroughIterator": 0,
        "rocksdbTotalBytesWritten": 228,
        "rocksdbTotalBytesWrittenByCompaction": 0,
        "rocksdbTotalBytesWrittenByFlush": 5653,
        "rocksdbTotalCompactionLatencyMs": 0,
        "rocksdbWriterStallLatencyMs": 0,
        "rocksdbZipFileBytesUncompressed": 266452
      }
    }
  ],
  "sources": [
    {
      "description": "RateStreamV2[rowsPerSecond=1, rampUpTimeSeconds=0, numPartitions=default",
      "startOffset": 63,
      "endOffset": 64,
      "latestOffset": 64,
      "numInputRows": 1,
      "inputRowsPerSecond": 100.0,
      "processedRowsPerSecond": 1.3623978201634879
    }
  ],
  "sink": {
    "description": "org.apache.spark.sql.execution.streaming.ConsoleTable$@2cf39784",
    "numOutputRows": 10
  }
}

In Amazon EMR on EC2, these logs are available on the node where the YARN ApplicationMaster container is running. They can be found at/var/log/hadoop-yarn/containers/<Application ID>/<container_id>/stderr.

As for AWS Glue, you can find the RocksDB metrics in Amazon CloudWatch, under the log group /aws-glue/jobs/error.

RocksDB metrics

The metrics from the preceding logs provide insights on RocksDB status. The followings are some example metrics you might find useful when investigating streaming job issues:

  • rocksdbCommitCheckpointLatency: Time spent writing checkpoints to local storage
  • rocksdbCommitCompactLatency: Duration of checkpoint compaction operations during checkpoint commits
  • rocksdbSstFileSize: Current size of SST files in RocksDB.

Deep dive into RocksDB key concepts

To better understand the state metrics shown in the logs, we deep dive into RocksDB’s key concepts: MemTable, sorted string table (SST) file, and checkpoints. Additionally, we provide some tips for best practices and fine-tuning.

High level architecture

RocksDB is a local, non-distributed persistent key-value store embedded in Spark executors. It enables scalable state management for streaming workloads, backed by Spark’s checkpointing for fault tolerance. As shown in the preceding figure, RocksDB stores data in memory and also on disk. RocksDB’s ability to spill data over to disk is what allows Spark Structured Streaming to handle state data that exceeds the available memory.

Memory:

  • Write buffers (MemTables): Designated memory to buffer writes before flushing onto disk
  • Block cache (read buffer): Reduces query time by caching results from disk

Disk:

  • SST files: Sorted String Table saved as SST file format for fast access

MemTable: Stored off-heap

MemTable, shown in the preceding figure, is an in-memory store where data is first written off-heap, before being flushed to disk as an SST file. RocksDB caches the latest two batches of data (hot data) in MemTable to reduce streaming process latency. By default, RocksDB only has two MemTables—one is active and the other is read-only. If you have sufficient memory, the configuration spark.sql.streaming.stateStore.rocksdb.maxWriteBufferNumber can be increased to have more than two MemTables. Among these MemTables, there is always one active table, and the rest are read-only MemTables used as write buffers.

SST files: Stored on Spark executor’s local disk

SST files are block-based tables stored on the Spark executor’s local disk. When the in-memory state data can no longer fit into a MemTable (defined by a Spark configuration writeBufferSizeMB), the active table is marked as immutable, saving it as the SST file format, which switches it to a read-only MemTable while asynchronously flushing it to local disks. While flushing, the immutable MemTable can still be read, so that the most recent state data is available with minimal read latency.

Reading from RocksDB follows the sequence demonstrated by the preceding diagram:

  1. Read from the active MemTable.
  2. If not found, iterate through read-only MemTables in the order of newest to oldest.
  3. If not found, read from BlockCache (read buffer).
  4. If misses, load index (one index per SST) from disk into BlockCache. Look up key from index and if hits, load data block onto BlockCache and return result.

SST files are stored on executors’ local directories under the path of spark.local.dir (default: /tmp) or yarn.nodemanager.local-dirs:

  • Amazon EMR on EC2 – ${yarn.nodemanager.local-dirs}/usercache/hadoop/appcache/<yarn_app_id>/<spark_app_id>/
  • Amazon EMR Serverless, Amazon EMR on EKS, AWS Glue – ${spark.local.dir}/<spark_app_id>/

Additionally, by using application logs, you can track the MemTable flush and SST file upload status under the file path:

  • Amazon EMR on EC2 – /var/log/hadoop-yarn/containers/<application_id>/<container_id>/stderr
  • Amazon EMR on EKS –/var/log/spark/user/<spark_app_name>-<spark_executor_ID>/stderr

The following is an example command to check the SST file status in an executor log from Amazon EMR on EKS:

cat /var/log/spark/user/<spark_app_name>-<spark_executor_ID>/stderr/current | grep old

or

kubectl logs <spark_executor_pod_name> --namespace emr -c spark-kubernetes-executor | grep old

The following screenshot is an example of the output of either command.

You can use the following examples to check if the MemTable records were deleted and flushed out to SST:

cat /var/log/spark/user/<spark_app_name>-<spark_executor_ID>/stderr/current | grep deletes

or

kubectl logs <spark_executor_pod_name> --namespace emr -c spark-kubernetes-executor | grep deletes

The following screenshot is an example of the output of either command.

Checkpoints: Stored on the executor’s local disk or in an S3 bucket

To handle fault tolerance and fail over from the last committed point, RocksDB supports checkpoints. The checkpoint files are usually stored on the executor’s disk or in an S3 bucket, including snapshot and delta or changelog data files.

Starting with Amazon EMR 7.0 and AWS Glue5.0, RocksDB state store provides a new feature called changelog checkpointing to enhance checkpoint performance. when the changelog is enabled (disabled by default) using the setting spark.sql.streaming.stateStore.rocksdb.changelogCheckpointing.enabled, RocksDB writes smaller change logs to the storage location (the local disk by default) instead of frequently persisting large snapshot data. Note that snapshots are still created but less frequently, as shown in the following screenshot.

Here’s an example of a checkpoint location path when overridden to an S3 bucket: s3://<S3BUCKET>/<checkpointDir>/state/0/spark_parition_ID/state_version_ID.zip

Best practices and considerations

This section outlines key strategies for fine-tuning RocksDB performance and avoiding common pitfalls.

1. Memory management for RocksDB

To prevent OOM errors on Spark executors, you can configure RocksDB’s memory usage at either the node level or instance level:

  • Node level (recommended): Enforce a global off-heap memory limit per executor. In this context, each executor is treated as a RocksDB node. If an executor processes N partitions of a stateful operator, it will have N number of RocksDB instances on a single executor.
  • Instance-level: Fine-tune individual RocksDB instances.

Node-level memory control per executor

Starting with Amazon EMR 7.0 and AWS Glue 5.0 (Spark 3.5), a critical Spark configuration, boundedMemoryUsage, was introduced (through SPARK-43311) to enforce a global memory cap at a single executor level that is shared by multiple RocksDB instances. This prevents RocksDB from consuming unbounded off-heap memory, which could lead to OOM errors or executor termination by resource managers such as YARN or Kubernetes.

The following example shows the node-level configuration:

 # Bound total memory usage per executor 
 "spark.sql.streaming.stateStore.rocksdb.boundedMemoryUsage": "true"
 # Set a static total memory size per executor
 "spark.sql.streaming.stateStore.rocksdb.maxMemoryUsageMB": "500"
 # For read-heavy workloads, split memory allocation between write buffers (30%) and block cache (70%) 
 "spark.sql.streaming.stateStore.rocksdb.writeBufferCacheRatio": "0.3"

A single RocksDB instance level control

For granular memory management, you can configure individual RocksDB instances using the following settings:

# Control MemTable (write buffer) size and count
"spark.sql.streaming.stateStore.rocksdb.writeBufferSizeMB": "64"
"spark.sql.streaming.stateStore.rocksdb.maxWriteBufferNumber": "4"
  • writeBufferSizeMB (default: 64, suggested: 64 – 128): Controls the maximum size of a single MemTable in RocksDB, affecting memory usage and write throughput. This setting is available in Spark3.5 – [SPARK-42819] and later. It determines the size of the memory buffer before state data is flushed to disk. Larger buffer sizes can improve write performance by reducing SST flush frequency but will increase the executor’s memory usage. Adjusting this parameter is crucial for optimizing memory usage and write throughput.
  • maxWriteBufferNumber (default: 2, suggested: 3 – 4): Sets the total number of active and immutable MemTables.

For read-heavy workloads, prioritize the following block cache tuning over write buffers to reduce disk I/O. You can configure SST block size and caching as follows:

"spark.sql.streaming.stateStore.rocksdb.blockSizeKB": "64"
"spark.sql.streaming.stateStore.rocksdb.blockCacheSizeMB": "128"
  •  blockSizeKB (default: 4, suggested: 64–128): When an active MemTable is full, it becomes a read-only memTable. From there, new writes continue to accumulate in a new table. The read-only MemTable is flushed into SST files on the disk. The data in SST files is approximately chunked into fixed-sized blocks (default is 4 KB). Each block, in turn, keeps multiple data entries. When writing data to SST files, you can compress or encode data efficiently within a block, which often results in a smaller data size compared with its raw format.

For workloads with a small state size (such as less than 10 GB), the default block size is usually sufficient. For a large state (such as more than 50 GB), increasing the block size can improve compression efficiency and sequential read performance but increase CPU overhead.

  • blockCacheSizeMB (default: 8, suggested: 64–512, large state: more than 1024): When retrieving data from SST files, RocksDB provides a cache layer (block cache) to improve the read performance. It first locates the data block where the target record might reside, then caches the block to memory, and finally searches that record within the cached block. To avoid frequent reads of the same block, the block cache can be used to keep the loaded blocks in memory.

2. Clean up state data at checkpoint

To help ensure that your state file sizes and storage costs remain under control when checkpoint performance becomes a concern, use the following Spark configurations to adjust cleanup frequency, retention limits, and checkpoint file types:

# clean up RocksDB state every 30 seconds
"spark.sql.streaming.stateStore.maintenanceInterval":"30s"
# retain only the last 50 state versions  
"spark.sql.streaming.minBatchesToRetain":"50"
# use changelog instead of snapshots
"spark.sql.streaming.stateStore.rocksdb.changelogCheckpointing.enabled":"true"
  • maintenanceInterval (default: 60 seconds): Retaining a state for a long period of time can help reduce maintenance cost and background IO. However, longer intervals increase file listing time, because state stores often scan every retained file.
  • minBatchesToRetain (default: 100, suggested: 10–50): Limits the number of state versions retained at checkpoint locations. Reducing this number results in fewer files being persisted and reduces storage usage.
  • changelogCheckpointing (default: false, suggested: true): Traditionally, RocksDB snapshots and uploads incremental SST files to checkpoint. To avoid this cost, changelog checkpointing was introduced in Amazon EMR7.0+ and AWS Glue 5.0, which write only state changes since the last checkpoint.

To track an SST file’s retention status, you can search RocksDBFileManager entries in the executor logs. Consider the following logs in Amazon EMR on EKS as an example. The output (shown in the screenshot) shows that four SST files under version 102 were uploaded to an S3 checkpoint location, and that an old changelog state file with version 97 was cleaned up.

cat /var/log/spark/user/<spark_app_name>-<spark_executor_ID>/stderr/ current | grep RocksDBFileManager

or

kubectl logs <spark_executor_pod_name> -n emr -c spark-kubernetes-executor | grep RocksDBFileManager

3. Optimize local disk usage

RocksDB consumes local disk space when generating SST files at each Spark executor. While disk usage doesn’t scale linearly, RocksDB can accumulate storage over time based on state data size. When running streaming jobs, if local available disk space gets insufficient, No space left on device errors can occur.

To optimize disk usage by RocksDB, adjust the following Spark configurations:

# compact state files during commit (default:false)
"spark.sql.streaming.stateStore.rocksdb.compactOnCommit": "true"
# number of delta SST files before becomes a consolidated snapshot file(default:10)
"spark.sql.streaming.stateStore.minDeltasForSnapshot": "5" 

Infrastructure adjustments can further mitigate the disk issue:

For Amazon EMR:

For AWS Glue:

  • Use AWS Glue G.2X or larger worker types to avoid the limited disk capacity of G.1X workers.
  • Schedule regular maintenance windows at optimal timing to free up disk space based on workload needs.

Conclusion

In this post, we explored RocksDB as the new state store implementation in Apache Spark Structured Streaming, available on Amazon EMR and AWS Glue. RocksDB offers advantages over the default HDFS-backed in-memory state store, particularly for applications dealing with large-scale stateful operations. RocksDB helps prevent JVM memory pressure and garbage collection issues common with the default state store.

The implementation is straightforward, requiring minimal configuration changes, though you should pay careful attention to memory and disk space management for optimal performance. While RocksDB is not guaranteed to reduce job latency, it provides a robust solution for handling large-scale stateful operations in Spark Structured Streaming applications.

We encourage you to evaluate RocksDB for your use cases, particularly if you’re experiencing memory pressure issues with the default state store or need to handle large amounts of state data in your streaming applications.


About the authors

Melody Yang is a Senior Big Data Solution Architect for Amazon EMR at AWS. She is an experienced analytics leader working with AWS customers to provide best practice guidance and technical advice in order to assist their success in data transformation. Her areas of interests are open-source frameworks and automation, data engineering and DataOps.

Dai Ozaki is a Cloud Support Engineer on the AWS Big Data Support team. He is passionate about helping customers build data lakes using ETL workloads. In his spare time, he enjoys playing table tennis.

Noritaka Sekiyama is a Principal Big Data Architect with Amazon Web Services (AWS) Analytics services. He’s responsible for building software artifacts to help customers. In his spare time, he enjoys cycling on his road bike.

Amir Shenavandeh is a Sr Analytics Specialist Solutions Architect and Amazon EMR subject matter expert at Amazon Web Services. He helps customers with architectural guidance and optimisation. He leverages his experience to help people bring their ideas to life, focusing on distributed processing and big data architectures.

Xi Yang is a Senior Hadoop System Engineer and Amazon EMR subject matter expert at Amazon Web Services. He is passionate about helping customers resolve challenging issues in the Big Data area.

Simplify real-time analytics with zero-ETL from Amazon DynamoDB to Amazon SageMaker Lakehouse

Post Syndicated from Narayani Ambashta original https://aws.amazon.com/blogs/big-data/simplify-real-time-analytics-with-zero-etl-from-amazon-dynamodb-to-amazon-sagemaker-lakehouse/

At AWS re:Invent 2024, we introduced a no code zero-ETL integration between Amazon DynamoDB and Amazon SageMaker Lakehouse, simplifying how organizations handle data analytics and AI workflows. This integration alleviates the traditional challenges of building and maintaining complex extract, transform, and load (ETL) pipelines for transforming NoSQL data into analytics-ready formats, which previously required significant time and resources while introducing potential system vulnerabilities. Organizations can now seamlessly combine the strength of DynamoDB in handling rapid, concurrent transactions with immediate analytical processing through the zero-ETL integration. For example, an ecommerce platform storing user session data and cart information in DynamoDB can now analyze this data in near real time without building custom pipelines. Gaming companies using DynamoDB for player data can instantly analyze user behavior as events occur, enabling real-time insights into game balance and player engagement patterns.

The zero-ETL capability uses built-in change data capture (CDC) to automatically synchronize data updates and schema changes between DynamoDB and SageMaker Lakehouse tables. By using Apache Iceberg format, the integration provides reliable performance with ACID transaction support and efficient large-scale data handling. Data scientists can train ML models on fresh data and data analysts can generate reports using current information, with typical synchronization latency in minutes rather than hours.

In this post, we share how to set up this zero-ETL integration from DynamoDB to your SageMaker Lakehouse environment.

Solution overview

We use a SageMaker Lakehouse catalog, AWS Lake Formation, Amazon Athena, AWS Glue, and Amazon SageMaker Unified Studio for this integration. The following is the reference data flow diagram for the zero-ETL integration.

ref architecture

The workflow consists of the following components:

  1. The recently launched zero-ETL integration capability within the AWS Glue console enables direct integration between DynamoDB and SageMaker Lakehouse, storing data in Iceberg format. This streamlined approach opens up new possibilities for data teams by creating a large-scale open and secure data ecosystem without traditional ETL processing overhead.
  2. When building a SageMaker Lakehouse architecture, you can use an Amazon Simple Storage Service (Amazon S3) based managed catalog as your zero-ETL target, providing seamless data integration without transformation overhead. This approach creates a robust foundation for your SageMaker Lakehouse implementation while maintaining the cost-effectiveness and scalability inherent to Amazon S3 storage, enabling efficient analytics and machine learning workflows.
  3. Organizations can use a Redshift Managed Storage (RMS) based managed catalog when they need high-performance SQL analytics and multi-table transactions. This approach uses RMS for storage while maintaining data in the Iceberg format, providing an optimal balance of performance and flexibility.
  4. After you establish your Lakehouse infrastructure, you can access it through diverse analytics engines, including AWS services like Athena, Amazon Redshift, AWS Glue, and Amazon EMR as independent services. For a more streamlined experience, SageMaker Unified Studio offers centralized analytics management, where you can query your data from a single unified interface.

Prerequisites

In this section, we walk through the steps to set up your solution resources and confirm your permission settings.

Create a SageMaker Unified Studio domain, project, and IAM role

Before you begin, you need an AWS Identity and Access Management (IAM) role for enabling the zero-ETL integration. In this post, we use SageMaker Unified Studio, which offers a unified data platform experience. It automatically manages required Lake Formation permissions on data and catalogs for you.

You have to first create a SageMaker Unified Studio domain, an administrative entity that controls user access, permissions, and resources for teams working within the SageMaker Unified Studio environment. Note down the SageMaker Unified Studio URL after you create the domain. You will be using this URL later to log in to the SageMaker Unified Studio portal and query our data across multiple engines.

Then, you create a SageMaker Unified Studio project, an integrated development environment (IDE) that provides a unified experience for data processing, analytics, and AI development. As part of project creation, an IAM role is automatically generated. This role will be used when you access SageMaker Unified Studio later. For more details on how to create a SageMaker Unified Studio project and domain, refer to An integrated experience for all your data and AI with Amazon SageMaker Unified Studio.

Prepare a sample dataset within DynamoDB

To implement this solution, you need a DynamoDB table that can either be used from your existing resources, or created using the sample data file that you can import from an S3 bucket. For this post, we guide you through importing sample data from an S3 bucket into a new DynamoDB table, providing a practical foundation for the concepts discussed.

To create a sample table in DynamoDB, complete the following steps:

  1. Download the fictitious ecommerce_customer_behavior.csv dataset. This dataset captures customer behavior and interactions on an ecommerce platform.
  2. On the Amazon S3 console, open the S3 bucket used by the SageMaker Unified Studio project.
  3. Upload the CSV file you downloaded.

BDB-4928-image-2.png

  1. Select the uploaded file to view its details page.

  1. Copy the value for S3 URI and make a note of it; you will use this path for the subsequent DynamoDB table creation step.

Create a Dynamo DB table

Complete the following steps to create a DynamoDB table from a file from Amazon S3, using the import from Amazon S3 functionality. Then you can enable the settings on the DynamoDB table required to enable zero-ETL integration.

  1. On the DynamoDB console, select Imports from S3 in the navigation pane.
  2. Select Import from S3.

  1. Enter the S3 URI from previous step for Source S3 URL, select CSV for Import file format, and select Next.

  1. Provide the table name as ecommerce_customer_behavior, the partition key as customer_id, and the sort key as product_id, then select Next.

  1. Use the default table settings, then select Next to review the details.

  1. Review the settings and select Import.

It will take a few minutes for the import status to change from Importing to Completed.

When the import is complete, you should be able to see the table created on the Tables page.

  1. Select the ecommerce_customer_behavior table and select Edit PTIR.

  1. Select Turn on point in time recovery and select Save changes.

This is required for setting up zero-ETL using DynamoDB as source.
On the Backups tab, you should see the status for PITR as On.

  1. Additionally, you need to use a table policy to enable access for zero-ETL integration. On the Permissions tab, and copy the following code under Resource-based policy for table:
{
    "Version": "2012-10-17",
    "Statement": [
        {
            "Sid": "TablePolicy01",
            "Effect": "Allow",
            "Principal": {
                "Service": "glue.amazonaws.com"
            },
            "Action": [
                "dynamodb:ExportTableToPointInTime",
                "dynamodb:DescribeExport",
                "dynamodb:DescribeTable"
            ],
            "Resource": "*"
        }
    ]
}

This policy uses all the resources, which shouldn’t be used in production workload. To deploy this setup in production, restrict it to only specific zero-ETL integration resources by adding a condition to the resource-based policy.

Now that you have used the Amazon S3 import method to load a CSV file to create a DynamoDB table, you can enable zero-ETL integration on the table.

Validate permission settings

To validate if the catalog permission setting is appropriate, complete the following steps:

  1. On the AWS Glue console, select Databases in the navigation pane.

  1. Check for the database salesmarketing_XXX.

  1. Select Catalog settings in the navigation pane, and save the permissions.

The following code is an example of permissions for catalog settings:

{
    "Version": "2012-10-17",
    "Statement": [
        {
            "Effect": "Allow",
            "Principal": {
                "AWS": "arn:aws:iam::<Account-id>:root"
            },
            "Action": "glue:CreateInboundIntegration",
            "Resource": "arn:aws:glue:<region>:<Account-id>:database/salesmarketing_XXX"
        },
        {
            "Effect": "Allow",
            "Principal": {
                "Service": "glue.amazonaws.com"
            },
            "Action": "glue:AuthorizeInboundIntegration",
            "Resource": "arn:aws:glue:<region>:<Account-id>:database/salesmarketing_XXX"
        }
    ]
}

Now you’re ready to create your zero-ETL integration.

Create a zero-ETL integration

Complete the following steps to create a zero-ETL integration:

  1. On the AWS Glue console, select Zero-ETL integrations in the navigation pane.

  1. Select “Create zero-ETL integration” to create a new configuration.

  1. Select Amazon DynamoDB as the source type.

  1. Under Source details, select ecommerce_customer_behavior for DynamoDB table.


  1. Under Target details, provide the following information:
    1. For AWS account, select Use the current account.
    2. For Data warehouse or catalog, enter the account ID of your default catalog.
    3. For Target database, enter salesmarketing_XXX.
    4. For Target IAM role, enter datazone_usr_role_XXX.

  1. Under Output settings, select Unnest all fields and Use primary keys from DynamoDB tables, leave Configure target table name as the default value (ecommerce_customer_behavior), then select Next.

  1. Enter zetl-ecommerce-customer-behavior for Name under Integration details, then select Next.

  1. Select Create and launch integration to launch the integration.

The status should be Creating after the integration is successfully initiated.
The status will change to Active in approximately a minute.

Verify that the SageMaker Lakehouse table exists. This process might take up to 15 minutes to complete, because the default refresh interval from DynamoDB is set to 15 minutes.

Validate the SageMaker Lakehouse table

You can now query your SageMaker Lakehouse table, created through zero-ETL integration, using various query engines. Complete the following steps to verify you can you see the table in SageMaker Unified Studio:

  1. Log in to the SageMaker Unified Studio portal using the single sign-on (SSO) option.

  1. Select your project to view its details page.

  1. Select Data in the navigation pane.

  1. Verify that you can see the Iceberg table in the SageMaker Lakehouse catalog.

Query with Athena

In this section, we show how to use Athena to query the SageMaker Lakehouse table from SageMaker Unified Studio. On the project page, locate the ecommerce_customer_behavior table in the catalog, and on the options menu (three dots), select Query with Athena.

This creates a SELECT query against the SageMaker Lakehouse table in a new window, and you should see the query results as shown in the following screenshot.

Query with Amazon Redshift

You can also query the SageMaker Lakehouse table from SageMaker Unified Studio using Amazon Redshift. Complete the following steps:

  1. Select the connection on the top right.
  2. Select Redshift (Lakehouse) from the list of connections.
  3. Select the awsdatacatalog database.
  4. Select the salesmarketing schema.
  5. Select Choose button.

The results will be shown in the Amazon Redshift Query Editor.

Query with Amazon EMR Serverless

You can query the Lakehouse table using Amazon EMR Serverless, which uses Apache Spark’s processing capabilities. Complete the following steps:

  1. On the project page, select Compute in the navigation pane.
  2. Select Add compute on the Data processing tab to create an EMR Serverless compute associated to the project.

  1. You can create new compute resources or connect to existing resources. For this example, select Create new compute resources.

  1. Select EMR Serverless.

  1. Enter a compute name (for example, Sales-Marketing), select the most recent release of EMR Serverless, and select Add compute.

It will take some time to create the compute.

You should see the status as Started for the compute. Now it’s ready to be used as your compute option for querying through a Jupyter notebook.

  1. Select the Build menu and select JupyterLab.

It will take some time to set up the workspace for running JupyterLab.

After the Jupyter Lab space is set up, you should see a page similar to the following screenshot.

  1. Select the new folder icon to create a new folder.

  1. Name the folder lakehouse_zetl_lab.

  1. Navigate to the folder you just created and create a notebook under this folder.
  1. Select the notebook Python3 (ipykernel) on the Launcher tab, and rename the notebook to query_lakehouse_table.

You can observe that the notebook is showing local Python as default language and compute. The two drop down menus show the connection type and compute for the selected connection type, just above the first cell within the Jupyter notebook.

  1. Select PySpark as the connection, and select the EMR Serverless application as compute.

  1. Enter the following sample code to query the table using Spark SQL:
import sys
from pyspark.sql import SparkSession
from pyspark.sql.functions import *

# Set the current database
spark.catalog.setCurrentDatabase("salesmarketing_XXX")

# Execute SQL query and store results in DataFrame
df = spark.sql("select * from ecommerce_customer_behavior limit 10")

# Display the results
df.show()

You can see the Spark DataFrame results.

Clean up

To avoid incurring future charges, delete the SageMaker domain, DynamoDB table, AWS Glue resources, and other objects created from this post.

Conclusion

This post demonstrated how you can establish a zero-ETL connection from DynamoDB to SageMaker Lakehouse, making your data available in Iceberg format without building custom data pipelines. We showed how you can analyze this DynamoDB data through various compute engines within SageMaker Unified Studio. This streamlined approach alleviates traditional data movement complexities, and enables more efficient data analysis workflows directly from your DynamoDB tables.

Try out this solution for your own use case, and share your feedback in the comments.


About the authors

Narayani Ambashta is an Analytics Specialist Solutions Architect at AWS, focusing on the automotive and manufacturing sector, where she guides strategic customers in developing modern data and AI strategies. With over 15 years of cross-industry experience, she specializes in big data architecture, real-time analytics, and AI/ML technologies, helping organizations implement modern data architectures. Her expertise spans across lakehouse, generative AI, and IoT platforms, enabling customers to drive digital transformation initiatives. When not architecting modern solutions, she enjoys staying active through sports and yoga.
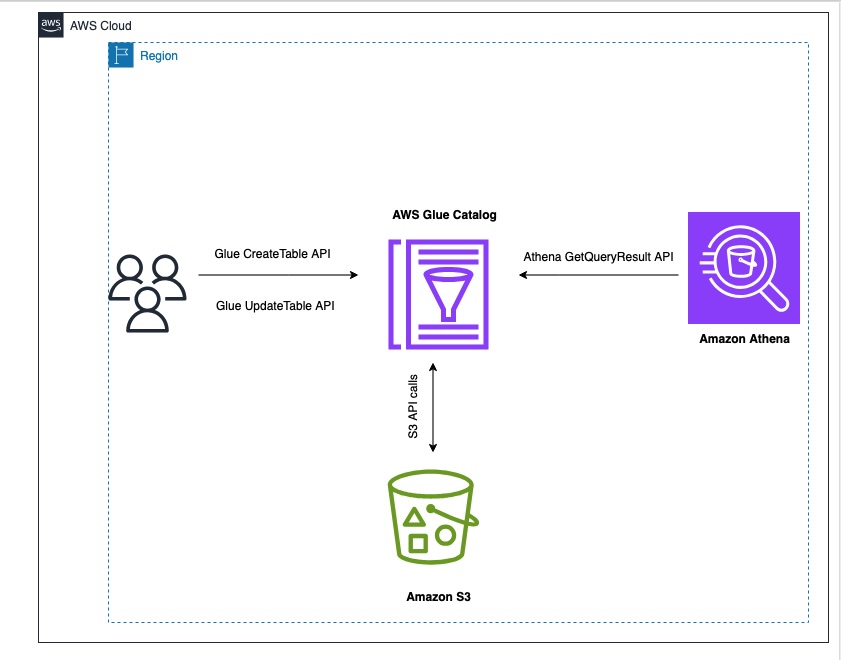
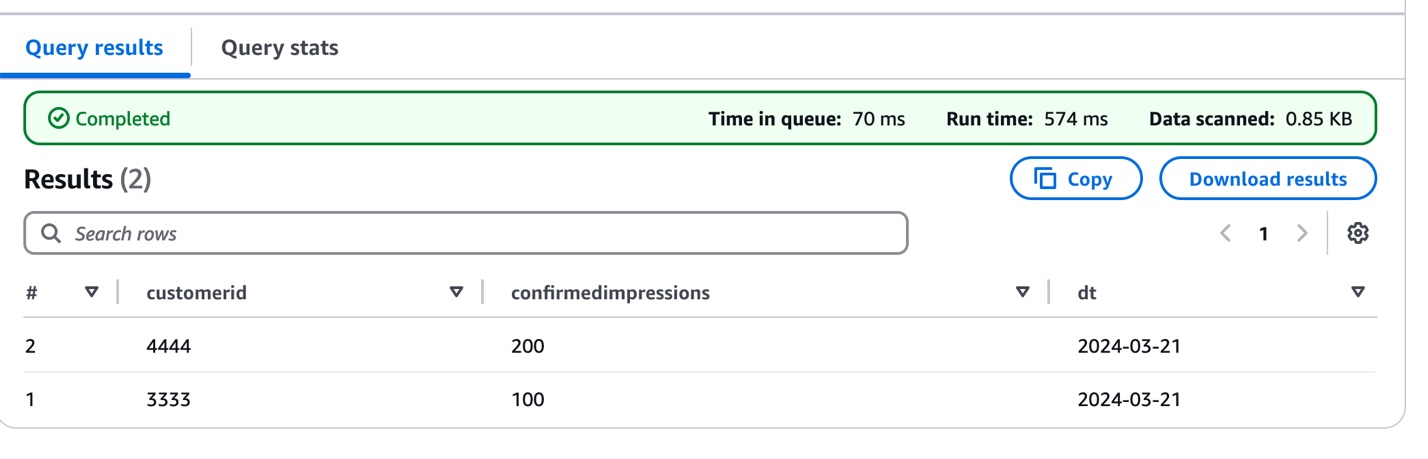
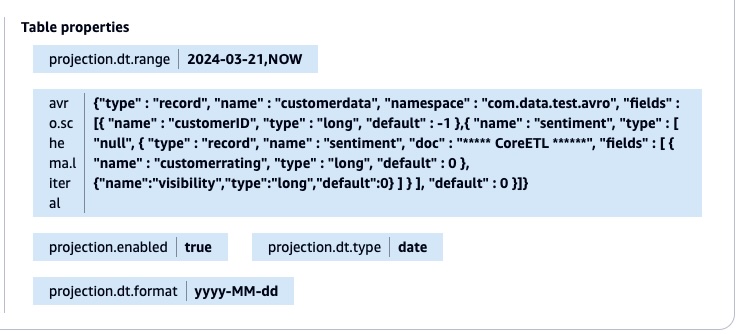
Raj Ramasubbu is a Senior Analytics Specialist Solutions Architect focused on big data and analytics and AI/ML with AWS. He helps customers architect and build highly scalable, performant, and secure cloud-based solutions on AWS. Raj provided technical expertise and leadership in building data engineering, big data analytics, business intelligence, and data science solutions for over 18 years prior to joining AWS. He helped customers in various industry verticals like healthcare, medical devices, life sciences, retail, asset management, car insurance, residential REIT, agriculture, title insurance, supply chain, document management, and real estate.

Yadgiri Pottabhathini is a Senior Analytics Specialist Solutions Architect in the media and entertainment sector. He specializes in assisting enterprise customers with their data and analytics cloud transformation initiatives, while providing guidance on accelerating their Generative AI adoption through the development of data foundations and modern data strategies that leverage open-source frameworks and technologies.

Junpei Ozono is a Sr. Go-to-market (GTM) Data & AI solutions architect at AWS in Japan. He drives technical market creation for data and AI solutions while collaborating with global teams to develop scalable GTM motions. He guides organizations in designing and implementing innovative data-driven architectures powered by AWS services, helping customers accelerate their cloud transformation journey through modern data and AI solutions. His expertise spans across modern data architectures including Data Mesh, Data Lakehouse, and Generative AI, enabling customers to build scalable and innovative solutions on AWS.

Using AWS Glue Data Catalog views with Apache Spark in EMR Serverless and Glue 5.0

Post Syndicated from Aarthi Srinivasan original https://aws.amazon.com/blogs/big-data/using-aws-glue-data-catalog-views-with-apache-spark-in-emr-serverless-and-glue-5-0/

The AWS Glue Data Catalog has expanded its Data Catalog views feature, and now supports Apache Spark environments in addition to Amazon Athena and Amazon Redshift. This enhancement, launched in March 2025, now makes it possible to create, share, and query multi-engine SQL views across Amazon EMR Serverless, Amazon EMR on Amazon EKS, and AWS Glue 5.0 Spark, as well as Athena and Amazon Redshift Spectrum. The multi-dialect views empower data teams to create SQL views one time and query them through supported engines—whether it’s Athena for ad-hoc analytics, Amazon Redshift for data warehousing, or Spark for large-scale data processing. This cross-engine compatibility means data engineers can focus on building data products rather than managing multiple view definitions or complex permission schemes. Using AWS Lake Formation permissions, organizations can share these views within the same AWS account, across different AWS accounts, and with AWS IAM Identity Center users and groups, without granting direct access to the underlying tables. Features of Lake Formation such as fine-grained access control (FGAC) using Lake Formation-tag based access control (LF-TBAC) can be applied to Data Catalog views, enabling scalable sharing and access control across organizations.

In an earlier blog post, we demonstrated the creation of Data Catalog views using Athena, adding a SQL dialect for Amazon Redshift, and querying the view using Athena and Amazon Redshift. In this post, we guide you through the process of creating a Data Catalog view using EMR Serverless, adding the SQL dialect to the view for Athena, sharing it with another account using LF-Tags, and then querying the view in the recipient account using a separate EMR Serverless workspace and AWS Glue 5.0 Spark job and Athena. This demonstration showcases the versatility and cross-account capabilities of Data Catalog views and access through various AWS analytics services.

Benefits of Data Catalog views

The following are key benefits of Data Catalog views for business solutions:

  • Targeted data sharing and access control – Data Catalog views, combined with the sharing capabilities of Lake Formation, enable organizations to provide specific data subsets to different teams or departments without duplicating data. For example, a retail company can create views that show sales data to regional managers while restricting access to sensitive customer information. By applying LF-TBAC to these views, companies can efficiently manage data access across large, complex organizational structures, maintaining compliance with data governance policies while promoting data-driven decision-making.
  • Multi-service analytics integration – The ability to create a view in one analytics service and query it across Athena, Amazon Redshift, EMR Serverless, and AWS Glue 5.0 Spark breaks down data silos and promotes a unified analytics approach. This feature allows businesses to use the strengths of different services for various analytics needs. For instance, a financial institution could create a view of transaction data and use Athena for ad-hoc queries, Amazon Redshift for complex aggregations, and EMR Serverless for large-scale data processing—all without moving or duplicating the data. This flexibility accelerates insights and improves resource utilization across the analytics stack.
  • Centralized auditing and compliance – With views stored in the central Data Catalog, businesses can maintain a comprehensive audit trail of data access across connected accounts using AWS CloudTrail logs. This centralization is crucial for industries with strict regulatory requirements, such as healthcare or finance. Compliance officers can seamlessly monitor and report on data access patterns, detect unusual activities, and demonstrate adherence to data protection regulations like GDPR or HIPAA. This centralized approach simplifies compliance processes and reduces the risk of regulatory violations.

These capabilities of Data Catalog views provide powerful solutions for businesses to enhance data governance, improve analytics efficiency, and maintain robust compliance measures across their data ecosystem.

Solution overview

An example company has multiple datasets containing details of their customers’ purchase details mixed with personally identifiable information (PII) data. They categorize their datasets based on sensitivity of the information. The data steward wants to share a subset of their preferred customers data for further analysis downstream by their data engineering team.

To demonstrate this use case, we use sample Apache Iceberg tables customer and customer_address. We create a Data Catalog view from these two tables to filter by preferred customers. We then use LF-Tags to share restricted columns of this view to the downstream engineering team. The solution is represented in the following diagram.

arch diagram

Prerequisites

To implement this solution, you need two AWS accounts with an AWS Identity and Access Management (IAM) admin role. We use the role to run the provided AWS CloudFormation templates and also use the same IAM roles added as Lake Formation administrator.

Set up infrastructure in the producer account

We provide a CloudFormation template that deploys the following resources and completes the data lake setup:

  • Two Amazon Simple Storage Service (Amazon S3) buckets: one for scripts, logs, and query results, and one for the data lake storage.
  • Lake Formation administrator and catalog settings. The IAM admin role that you provide is registered as Lake Formation administrator. Cross-account sharing version is set to 4. Default permissions for newly created databases and tables is set to use Lake Formation permissions only.
    data catalog settings
  • An IAM role with read, write, and delete permissions on the data lake bucket objects. The data lake bucket is registered with Lake Formation using this IAM role.
    data lake locations
  • An AWS Glue database for the data lake.
  • Lake Formation tags. These tags are attached to the database.
    lf-tags
  • CSV and Iceberg format tables in the AWS Glue database. The CSV tables are pointing to s3://redshift-downloads/TPC-DS/2.13/10GB/ and the Iceberg tables are stored in the user account’s data lake bucket.
  • An Athena workgroup.
  • An IAM role and an AWS Lambda function to run Athena queries. Athena queries are run in the Athena workgroup to insert data from CSV tables to Iceberg tables. Relevant Lake Formation permissions are granted to the Lambda role.
    lf-tables
  • An EMR Studio and related virtual private cloud (VPC), subnet, routing table, security groups, and EMR Studio service IAM role.
  • An IAM role with policies for the EMR Studio runtime. Relevant Lake Formation permissions are granted to this role on the Iceberg tables. This role will be used as the definer role to create the Data Catalog view. A definer role is the IAM role with necessary permissions to access the referenced tables, and runs the SQL statement that defines the view.

Complete the following steps in your producer AWS account:

  1. Sign in to the AWS Management Console as an IAM administrator role.
  2. Launch the CloudFormation stack.

Allow approximately 5 minutes for the CloudFormation stack to complete creation. After the CloudFormation has completed launching, proceed with the following instructions.

  1. If you’re using the producer account in Lake Formation for the first time, on the Lake Formation console, create a database named default and grant describe permission on the default database to runtime role GlueViewBlog-EMRStudio-RuntimeRole.
    data permissions

Create an EMR Serverless application

Complete the following steps to create an EMR Serverless application in your EMR Studio:

  1. On the Amazon EMR console, under EMR Studio in the navigation pane, choose Studios.
  2. Choose GlueViewBlog-emrstudio and choose the URL link of the Studio to open it.
    glueviewblog-emrstudio
  3. On the EMR Studio dashboard, choose Create application.
    emr-studio-dashboard

You will be directed to the Create application page on EMR Studio. Let’s create a Lake Formation enabled EMR Serverless application.

  1. Under Application settings, provide the following information:
    1. For Name, enter a name (for example, emr-glueview-application).
    2. For Type, choose Spark.
    3. For Release version, choose emr-7.8.0.
    4. For Architecture, choose x86_64.
  2. Under Application setup options, select Use custom settings.
  3. Under Interactive endpoint, select Enable endpoint for EMR studio.
  4. Under Additional configurations, for Metastore configuration, select Use AWS Glue Data Catalog as metastore, then select Use Lake Formation for fine-grained access control.
  5. Under Network connections, choose emrs-vpc for VPC, enter any two private subnets, and enter emr-serverless-sg for Security groups.
  6. Choose Create and start the application.

Create an EMR Workspace

Complete the following steps to create an EMR Workspace:

  1. On the EMR Studio console, choose Workspaces in the navigation pane and choose Create Workspace.
  2. Enter a Workspace name (for example, emrs-glueviewblog-workspace).
  3. Leave all other settings as default and choose Create Workspace.
  4. Choose Launch Workspace. Your browser might request to allow pop-up permissions for the first time launching the Workspace.
  5. After the Workspace is launched, in the navigation pane, choose Compute.
  6. For Compute type, select EMR Serverless application and enter emr-glueview-application for the application and GlueViewBlog-EMRStudio-RuntimeRole for Interactive runtime role.
  7. Make sure the kernel attached to the Workspace is PySpark.

Create a Data Catalog view and verify

Complete the following steps:

  1. Download the notebook glueviewblog_producer.ipynb. The code creates a Data Catalog view customer_nonpii_view from the two Iceberg tables, customer_iceberg and customer_address_iceberg, in the database glueviewblog_<account-id>_db.
  2. On your EMR Workspace emrs-glueviewblog-workspace, go to the File browser section and choose Upload files.
  3. Upload glueviewblog_producer.ipynb.
  4. Update the data lake bucket name, AWS account ID, and AWS Region to match your resources.
  5. Update the database_name, table1_name, and table2_name to match your resources.
  6. Save the notebook.
  7. Choose the double arrow icon to restart the kernel and rerun the notebook.

The Data Catalog view customer_nonpii_view is created and verified.

  1. In the navigation pane on the Lake Formation console, under Data Catalog, choose Views.
  2. Choose the new view customer_nonpii_view.
  3. On the SQL definitions tab, verify EMR with Apache Spark shows up for Engine name.
  4. Choose the tab LF-Tags. The view should show the LF-Tag sensitivity=pii-confidential inherited from the database.
  5. Choose Edit LF-Tags.
  6. On the Values dropdown menu, choose confidential to overwrite the Data Catalog view’s key value of sensitivity from pii-confidential.
  7. Choose Save.

With this, we have created a non-PII view to share with the data engineering team from the datasets that has PII information of customers.

Add Athena SQL dialect to the view

With the view customer_nonpii_view having been created by the EMR runtime role GlueViewBlog-EMRStudio-RuntimeRole, the Admin will have only describe permissions on it as a database creator and Lake Formation administrator. In this step, the Admin will grant itself alter permissions on the view, in order to add the Athena SQL dialect to the view.

  1. On the Lake Formation console, in the navigation pane, choose Data permissions.
  2. Choose Grant and provide the following information:
    1. For Principals, enter Admin.
    2. For LF-Tags or catalog resources, select Resources matched by LF-Tags.
    3. For Key, choose sensitivity.
    4. For Values, choose confidential and pii-confidential.
    5. Under Database permissions, select Super for Database permissions and Grantable permissions.
    6. Under Table permissions, select Super for Table permissions and Grantable permissions.
    7. Choose Grant.
  3. Verify the LF-Tags based permissions the Admin.
  4. Open the Athena query editor, choose the Workgroup GlueViewBlogWorkgroup and choose the AWS Glue database glueviewblog_<accountID>_db.
  5. Run the following query. Replace <accountID> with your account ID.
    ALTER VIEW glueviewblog_<accountID>_db.customer_nonpii_view ADD DIALECT
    AS
    select c_customer_id, c_customer_sk, c_last_review_date, ca_country, ca_location_type
    from glueviewblog__<accountID>_db.customer_iceberg, glueviewblog__<accountID>_db.customer_address_iceberg
    where c_current_addr_sk = ca_address_sk and c_preferred_cust_flag='Y';

  6. Verify the Athena dialect by running a preview on the view.
  7. On the Lake Formation console, verify the SQL dialects on the view customer_nonpii_view.

Share the view to the consumer account

Complete the following steps to share the Data Catalog view to the consumer account:

  1. On the Lake Formation console, in the navigation pane, choose Data permissions.
  2. Choose Grant and provide the following information:
    1. For Principals, select External accounts and enter the consumer account ID.
    2. For LF-Tags or catalog resources, select Resources matched by LF-Tags.
    3. For Key, choose sensitivity.
    4. For Values, choose confidential.
    5. Under Database permissions, select Describe for Database permissions and Grantable permissions.
    6. Under Table permissions, select Describe and Select for Table permissions and Grantable permissions.
    7. Choose Grant.
  3. Verify granted permissions on the Data permissions page.

With this, the producer account data steward has created a Data Catalog view of a subset of data from two tables in their Data Catalog, using the EMR runtime role as the definer role. They have shared it to their analytics account using LF-Tags to run further processing of the data downstream.

Set up infrastructure in the consumer account

We provide a CloudFormation template to deploy the following resources and set up the data lake as follows:

  • An S3 bucket for Amazon EMR and AWS Glue logs
  • Lake Formation administrator and catalog settings similar to the producer account setup
  • An AWS Glue database for the data lake
  • An EMR Studio and related VPC, subnet, routing table, security groups, and EMR Studio service IAM role
  • An IAM role with policies for the EMR Studio runtime

Complete the following steps in your consumer AWS account:

  1. Sign in to the console as an IAM administrator role.
  2. Launch the CloudFormation stack.

Allow approximately 5 minutes for the CloudFormation stack to complete creation. After the CloudFormation has completed launching, proceed with the following instructions.

  1. If you’re using the consumer account Lake Formation for the first time, on the Lake Formation console, create a database named default and grant describe permission on the default database to runtime role GlueViewBlog-EMRStudio-Consumer-RuntimeRole.

Accept AWS RAM shares in the consumer account

You can now log in to the AWS consumer account and accept the AWS RAM invitation:

  1. Open the AWS RAM console with the IAM role that has AWS RAM access.
  2. In the navigation pane, choose Resource shares under Shared with me.

You should see two pending resource shares from the producer account.

  1. Accept both invitations.

Create a resource link for the shared view

To access the view that was shared by the producer AWS account, you need to create a resource link in the consumer AWS account. A resource link is a Data Catalog object that is a link to a local or shared database, table, or view. After you create a resource link to a view, you can use the resource link name wherever you would use the view name. Furthermore, you can grant permission on the resource link to the job runtime role GlueViewBlog-EMRStudio-Consumer-RuntimeRole to access the view through EMR Serverless Spark.

To create a resource link, complete the following steps:

  1. Open the Lake Formation console as the Lake Formation data lake administrator in the consumer account.
  2. In the navigation pane, choose Tables.
  3. Choose Create and Resource link.
  4. For Resource link name, enter the name of the resource link (for example, customer_nonpii_view_rl).
  5. For Database, choose the glueviewblog_customer_<accountID>_db database.
  6. For Shared table region, choose the Region of the shared table.
  7. For Shared table, choose customer_nonpii_view.
  8. Choose Create.

Grant permissions on the database to the EMR job runtime role

Complete the following steps to grant permissions on the database glueviewblog_customer_<accountID>_db to the EMR job runtime role:

  1. On the Lake Formation console, in the navigation pane, choose Databases.
  2. Select the database glueviewblog_customer_<accountID>_db and on the Actions menu, choose Grant.
  3. In the Principles section, select IAM users and roles, and choose GlueViewBlog-EMRStudio-Consumer-RuntimeRole.
  4. In the Database permissions section, select Describe.
  5. Choose Grant.

Grant permissions on the resource link to the EMR job runtime role

Complete the following steps to grant permissions on the resource link customer_nonpii_view_rl to the EMR job runtime role:

  1. On the Lake Formation console, in the navigation pane, choose Tables.
  2. Select the resource link customer_nonpii_view_rl and on the Actions menu, choose Grant.
  3. In the Principles section, select IAM users and roles, and choose GlueViewBlog-EMRStudio-Consumer-RuntimeRole.
  4. In the Resource link permissions section, select Describe for Resource link permissions.
  5. Choose Grant.

This allows the EMR Serverless job runtime roles to describe the resource link. We don’t make any selections for grantable permissions because runtime roles shouldn’t be able to grant permissions to other principles.

Grant permissions on the target for the resource link to the EMR job runtime role

Complete the following steps to grant permissions on the target for the resource link customer_nonpii_view_rl to the EMR job runtime role:

  1. On the Lake Formation console, in the navigation pane, choose Tables.
  2. Select the resource link customer_nonpii_view_rl and on the Actions menu, choose Grant on target.
  3. In the Principles section, select IAM users and roles, and choose GlueViewBlog-EMRStudio-Consumer-RuntimeRole.
  4. In the View permissions section, select Select and Describe.
  5. Choose Grant.

Set up an EMR Serverless application and Workspace in the consumer account

Repeat the steps to create an EMR Serverless application in the consumer account.

Repeat the steps to create a Workspace in the consumer account. For Compute type, select EMR Serverless application and enter emr-glueview-application for the application and GlueViewBlog-EMRStudio-Consumer-RuntimeRole as the runtime role.

Verify access using interactive notebooks from EMR Studio

Complete the following steps to verify access in EMR Studio:

  1. Download the notebook glueviewblog_emr_consumer.ipynb. The code runs a select statement on the view shared from the producer.
  2. In your EMR Workspace emrs-glueviewblog-workspace, navigate to the File browser section and choose Upload files.
  3. Upload glueviewblog_emr_consumer.ipynb.
  4. Update the data lake bucket name, AWS account ID, and Region to match your resources.
  5. Update the database to match your resources.
  6. Save the notebook.
  7. Choose the double arrow icon to restart the kernel with PySpark kernel and rerun the notebook.

Verify access using interactive notebooks from AWS Glue Studio

Complete the following steps to verify access using AWS Glue Studio:

  1. Download the notebook glueviewblog_glue_consumer.ipynb
  2. Open the AWS Glue Studio console.
  3. Choose Notebook and then choose Upload notebook.
  4. Upload the notebook glueviewblog_glue_consumer.ipynb.
  5. For IAM role, choose GlueViewBlog-EMRStudio-Consumer-RuntimeRole.
  6. Choose Create notebook.
  7. Update the data lake bucket name, AWS account ID, and Region to match your resources.
  8. Update the database to match your resources.
  9. Save the notebook.
  10. Run all the cells to verify fine-grained access.

Verify access using the Athena query editor

Because the view from the producer account was shared to the consumer account, the Lake Formation administrator will have access to the view in the producer account. Also, because the lake admin role created the resource link pointing to the view, it will also have access to the resource link. Go to the Athena query editor and run a simple select query on the resource link.

The analytics team in the consumer account was able to access a subset of the data from a business data producer team, using their analytics tools of choice.

Clean up

To avoid incurring ongoing costs, clean up your resources:

  1. In your consumer account, delete AWS Glue notebook, stop and delete the EMR application, and then delete EMR Workspace.
  2. In your consumer account, delete the CloudFormation stack. This should remove the resources launched by the stack.
  3. In your producer account, log in to the Lake Formation console and revoke the LF-Tags based permissions you had granted to the consumer account.
  4. In your producer account, stop and delete the EMR application and then delete the EMR Workspace.
  5. In your producer account, delete the CloudFormation stack. This should delete the resources launched by the stack.
  6. Review and clean up any additional AWS Glue and Lake Formation resources and permissions.

Conclusion

In this post, we demonstrated a powerful, enterprise-grade solution for cross-account data sharing and analysis using AWS services. We walked you through how to do the following key steps:

  • Create a Data Catalog view using Spark in EMR Serverless within one AWS account
  • Securely share this view with another account using LF-TBAC
  • Access the shared view in the recipient account using Spark in both EMR Serverless and AWS Glue ETL
  • Implement this solution with Iceberg tables (it’s also compatible other open table formats like Apache Hudi and Delta Lake)

The solution approach with multi-dialect data catalog views provided in this post is particularly valuable for enterprises looking to modernize their data infrastructure while optimizing costs, improve cross-functional collaboration while enhancing data governance, and accelerate business insights while maintaining control over sensitive information.

Refer to the following information about Data Catalog views with individual analytics services, and try out the solution. Let us know your feedback and questions in the comments section.


About the Authors

Aarthi Srinivasan is a Senior Big Data Architect with Amazon SageMaker Lakehouse. As part of the SageMaker Lakehouse team, she works with AWS customers and partners to architect lake house solutions, enhance product features, and establish best practices for data governance.

Praveen Kumar is an Analytics Solutions Architect at AWS with expertise in designing, building, and implementing modern data and analytics platforms using cloud-based services. His areas of interest are serverless technology, data governance, and data-driven AI applications.

Dhananjay Badaya is a Software Developer at AWS, specializing in distributed data processing engines including Apache Spark and Apache Hadoop. As a member of the Amazon EMR team, he focuses on designing and implementing enterprise governance features for EMR Spark.

Access Amazon Redshift Managed Storage tables through Apache Spark on AWS Glue and Amazon EMR using Amazon SageMaker Lakehouse

Post Syndicated from Noritaka Sekiyama original https://aws.amazon.com/blogs/big-data/access-amazon-redshift-managed-storage-tables-through-apache-spark-on-aws-glue-and-amazon-emr-using-amazon-sagemaker-lakehouse/

Data environments in data-driven organizations are changing to meet the growing demands for analytics, including business intelligence (BI) dashboarding, one-time querying, data science, machine learning (ML), and generative AI. These organizations have a huge demand for lakehouse solutions that combine the best of data warehouses and data lakes to simplify data management with easy access to all data from their preferred engines.

Amazon SageMaker Lakehouse unifies all your data across Amazon Simple Storage Service (Amazon S3) data lakes and Amazon Redshift data warehouses, helping you build powerful analytics and artificial intelligence and machine learning (AI/ML) applications on a single copy of data. SageMaker Lakehouse gives you the flexibility to access and query your data  in place with all Apache Iceberg compatible tools and engines. It secures your data in the lakehouse by defining fine-grained permissions, which are consistently applied across all analytics and ML tools and engines. You can bring data from operational databases and applications into your lakehouse in near real time through zero-ETL integrations. It accesses and queries data in-place with federated query capabilities across third-party data sources through Amazon Athena.

With SageMaker Lakehouse, you can access tables stored in Amazon Redshift managed storage (RMS) through Iceberg APIs, using the Iceberg REST catalog backed by AWS Glue Data Catalog. This expands your data integration workload across data lakes and data warehouses, enabling seamless access to diverse data sources.

Amazon SageMaker Unified Studio, Amazon EMR 7.5.0 and higher, and AWS Glue 5.0 natively support SageMaker Lakehouse. This post describes how to integrate data on RMS tables through Apache Spark using SageMaker Unified Studio, Amazon EMR 7.5.0 and higher, and AWS Glue 5.0.

How to access RMS tables through Apache Spark on AWS Glue and Amazon EMR

With SageMaker Lakehouse, RMS tables are accessible through the Apache Iceberg REST catalog. Open source engines such as Apache Spark are compatible with Apache Iceberg, and they can interact with RMS tables by configuring this Iceberg REST catalog. You can learn more in Connecting to the Data Catalog using AWS Glue Iceberg REST extension endpoint.

Note that the Iceberg REST extensions endpoint is used when you access RMS tables. This endpoint is accessible through the Apache Iceberg AWS Glue Data Catalog extensions, which comes preinstalled on AWS Glue 5.0 and Amazon EMR 7.5.0 or higher. The extension library enables access to RMS tables using the Amazon Redshift connector for Apache Spark.

To access RMS backed catalog databases from Spark, each RMS database requires its own Spark session catalog configuration. Here are the required Spark configurations:

Spark config key Value
spark.sql.catalog.{catalog_name} org.apache.iceberg.spark.SparkCatalog
spark.sql.catalog.{catalog_name}.type glue
spark.sql.catalog.{catalog_name}.glue.id {account_id}:{rms_catalog_name}/{database_name}
spark.sql.catalog.{catalog_name}.client.region {aws_region}
spark.sql.extensions org.apache.iceberg.spark.extensions.IcebergSparkSessionExtensions

Configuration parameters:

  • {catalog_name}: Your chosen name for referencing the RMS catalog database in your application code
  • {rms_catalog_name}: The RMS catalog name as shown in the AWS Lake Formation catalogs section
  • {database_name}: The RMS database name
  • {aws_region}: The AWS Region where the RMS catalog is located

For a deeper understanding of how the Amazon Redshift hierarchy (databases, schemas, and tables) is mapped to the AWS Glue multilevel catalogs, you can refer to the Bringing Amazon Redshift data into the AWS Glue Data Catalog documentation.

In the following section, we demonstrate how to access RMS tables through Apache Spark using SageMaker Unified Studio JupyterLab notebooks with the AWS Glue 5.0 runtime and Amazon EMR Serverless.

Although we can bring existing Amazon Redshift tables into the AWS Glue Data catalog by creating a Lakehouse Redshift catalog from an existing Redshift namespace and provide access to a SageMaker Unified Studio project, in the following example, you’ll create a managed Amazon Redshift Lakehouse catalog directly from SageMaker Unified Studio and work with that.

Prerequisites

To follow these instructions, you must have the following prerequisites:

Create a SageMaker Unified Studio project

Complete the following steps to create a SageMaker Unified Studio project:

  1. Sign in to SageMaker Unified Studio.
  2. Choose Select a project on the top menu and choose Create project.
  3. For Project name, enter demo.
  4. For Project profile, choose All capabilities.
  5. Choose Continue.

  1. Leave the default values and choose Continue.
  2. Review the configurations and choose Create project.

You need to wait for the project to be created. Project creation can take about 5 minutes. When the project status changes to Active, select the project name to access the project’s home page.

  1. Make note of the Project role ARN because you’ll need it for next steps.

You’ve successfully created the project and noted the project role ARN. The next step is to configure a Lakehouse catalog for your RMS.

Configure a Lakehouse catalog for your RMS

Complete the following steps to configure a Lakehouse catalog for your RMS:

  1. In the navigation pane, choose Data.
  2. Choose the + (plus) sign.
  3. Select Create Lakehouse catalog to create a new catalog and choose Next.

  1. For Lakehouse catalog name, enter rms-catalog-demo.
  2. Choose Add catalog.

  1. Wait for the catalog to be created.

  1. In SageMaker Unified Studio, choose Data in the left navigation pane, then select the three vertical dots next to Redshift (Lakehouse) and choose Refresh to make sure the Amazon Redshift compute is active.

Create a new table in the RMS Lakehouse catalog:

  1. In SageMaker Unified Studio, on the top menu, under Build, choose Query Editor.
  2. On the top right, choose Select data source.
  3. For CONNECTIONS, choose Redshift (Lakehouse).
  4. For DATABASES, choose dev@rms-catalog-demo.
  5. For SCHEMAS, choose public.
  6. Choose Choose.

  1. In the query cell, enter and execute the following query to create a new schema:
create schema "dev@rms-catalog-demo".salesdb

  1. In a new cell, enter and execute the following query to create a new table:
create table salesdb.store_sales (ss_sold_timestamp timestamp, ss_item text, ss_sales_price float);

  1. In a new cell, enter and execute the following query to populate the table with sample data:
insert into salesdb.store_sales values ('2024-12-01T09:00:00Z', 'Product 1', 100.0),
('2024-12-01T11:00:00Z', 'Product 2', 500.0),
('2024-12-01T15:00:00Z', 'Product 3', 20.0),
('2024-12-01T17:00:00Z', 'Product 4', 1000.0),
('2024-12-01T18:00:00Z', 'Product 5', 30.0),
('2024-12-02T10:00:00Z', 'Product 6', 5000.0),
('2024-12-02T16:00:00Z', 'Product 7', 5.0);

  1. In a new cell, enter and run the following query to verify the table contents:
select * from salesdb.store_sales;

(Optional) Create an Amazon EMR Serverless application

IMPORTANT: This section is only required if you plan to test also using Amazon EMR Serverless. If you intend to use AWS Glue exclusively, you can skip this section entirely.

  1. Navigate to the project page. In the left navigation pane, select Compute, then select the Data processing Choose Add compute.

  1. Choose Create new compute resources, then choose Next.

  1. Select EMR Serverless.

  1. Specify emr_serverless_application as Compute name, select Compatibility as Permission mode, and choose Add compute.

  1. Monitor the deployment progress. Wait for the Amazon EMR Serverless application to complete its deployment. This process can take a minute.

Access Amazon Redshift Managed Storage tables through Apache Spark

In this section, we demonstrate how to query tables stored in RMS using a SageMaker Unified Studio notebook.

  1. In the navigation pane, choose Data
  2. Under Lakehouse, select the down arrow next to rms-catalog-demo
  3. Under dev, select the down arrow next salesdb, choose store_sales, and choose the three dots

SageMaker Lakehouse offers multiple analysis options: Query with Athena, Query with Redshift, and Open in Jupyter Lab notebook.

  1. Choose Open in Jupyter Lab notebook
  2. On the Launcher tab, choose Python 3 (ipykernel)

In SageMaker Unified Studio JupyterLab, you can specify different compute types for each notebook cell. Although this example demonstrates using AWS Glue compute (project.spark.compatibility), the same code can be executed using Amazon EMR Serverless by selecting the appropriate compute in the cell settings. The following table shows the connection type and compute values to specify when running PySpark code or Spark SQL code with different engines:

Compute option Pyspark code Spark SQL
Connection type Compute Connection type Compute
AWS Glue Pyspark project.spark.compatibility SQL project.spark.compatibility
Amazon EMR Serverless Pyspark emr-s.emr_serverless_application SQL emr-s.emr_serverless_application
  1. In the notebook cell’s top left corner, set Connection Type to PySpark and select spark.compatibility (AWS Glue 5.0) as Compute
  2. Execute the following code to initialize the SparkSession and configure rmscatalog as the session catalog for accessing the dev database under the rms-catalog-demo RMS catalog:
from pyspark.sql import SparkSession

catalog_name = "rmscatalog"
#Change <your_account_id> with your AWS account ID
rms_catalog_id = "<your_account_id>:rms-catalog-demo/dev"

#Change with your AWS region
aws_region="us-east-2"

spark = SparkSession.builder.appName('rms_demo') \
    .config(f'spark.sql.catalog.{catalog_name}', 'org.apache.iceberg.spark.SparkCatalog') \
    .config(f'spark.sql.catalog.{catalog_name}.type', 'glue') \
    .config(f'spark.sql.catalog.{catalog_name}.glue.id', rms_catalog_id) \
    .config(f'spark.sql.catalog.{catalog_name}.client.region', aws_region) \
    .config('spark.sql.extensions','org.apache.iceberg.spark.extensions.IcebergSparkSessionExtensions') \
    .getOrCreate()

  1. Create a new cell and switch the connection type from PySpark to SQL to execute Spark SQL commands directly
  2. Enter the following SQL statement to view all tables under salesdb (RMS schema) within rmscatalog:
SHOW TABLES IN rmscatalog.salesdb

  1. In a new SQL cell, enter the following DESCRIBE EXTENDED statement to view detailed information about the store_sales table in the salesdb schema:
DESCRIBE EXTENDED rmscatalog.salesdb.store_sales

In the output, you’ll observe that the Provider is set to iceberg. This indicates that the table is recognized as an Iceberg table, despite being stored in Amazon Redshift managed storage.

  1. In a new SQL cell, enter the following SELECT statement to view the content of the table
SELECT * FROM rmscatalog.salesdb.store_sales

Throughout this example, we demonstrated how to create a table in Amazon Redshift Serverless and seamlessly query it as an Iceberg table using Apache Spark within a SageMaker Unified Studio notebook.

Clean up

To avoid incurring future charges, clean up all created resources:

  1. Delete the created SageMaker Unified Studio project. This step will automatically delete Amazon EMR compute (for example, the Amazon EMR Serverless application) that was provisioned from the project:
    1. Inside SageMaker Studio, navigate to the demo project’s Project overview section.
    2. Choose Actions, then select Delete project.
    3. Type confirm and choose Delete project.
  1. Delete the created Lakehouse catalog:
    1. Navigate to the AWS Lake Formation page in the Catalogs section.
    2. Select the rms-catalog-demo catalog, choose Actions, then select Delete.
    3. In the confirmation window type rms-catalog-demo and then choose Drop.

Conclusion

In this post, we demonstrated how to use Apache Spark to interact with Amazon Redshift Managed Storage tables through Amazon SageMaker Lakehouse using the Iceberg REST catalog. This integration provides a unified view of your data across Amazon S3 data lakes and Amazon Redshift data warehouses, so you can build powerful analytics and AI/ML applications while maintaining a single copy of your data.

For additional workloads and implementations, visit Simplify data access for your enterprise using Amazon SageMaker Lakehouse.


About the Authors

Noritaka Sekiyama is a Principal Big Data Architect with Amazon Web Services (AWS) Analytics services. He’s responsible for building software artifacts to help customers. In his spare time, he enjoys cycling on his road bike.

Stefano Sandonà is a Senior Big Data Specialist Solution Architect at Amazon Web Services (AWS). Passionate about data, distributed systems, and security, he helps customers worldwide architect high-performance, efficient, and secure data solutions.

Derek Liu is a Senior Solutions Architect based out of Vancouver, BC. He enjoys helping customers solve big data challenges through Amazon Web Services (AWS) analytic services.

Raj Ramasubbu is a Senior Analytics Specialist Solutions Architect focused on big data and analytics and AI/ML with Amazon Web Services (AWS). He helps customers architect and build highly scalable, performant, and secure cloud-based solutions on AWS. Raj provided technical expertise and leadership in building data engineering, big data analytics, business intelligence, and data science solutions for over 18 years prior to joining AWS. He helped customers in various industry verticals like healthcare, medical devices, life science, retail, asset management, car insurance, residential REIT, agriculture, title insurance, supply chain, document management, and real estate.

Angel Conde Manjon is a Sr. EMEA Data & AI PSA, based in Madrid. He has previously worked on research related to data analytics and AI in diverse European research projects. In his current role, Angel helps partners develop businesses centered on data and AI.


Appendix: Sample script for Lake Formation FGAC enabled Spark cluster

If you want to access RMS tables from Lake Formation FGAC enabled Spark cluster on AWS Glue or Amazon EMR, refer to the following code example:

from pyspark.sql import SparkSession

catalog_name = "rmscatalog"
rms_catalog_name = "123456789012:rms-catalog-demo/dev"
account_id = "123456789012"
region = "us-east-2"

spark = SparkSession.builder.appName('rms_demo') \
.config('spark.sql.defaultCatalog', catalog_name) \
.config(f'spark.sql.catalog.{catalog_name}', 'org.apache.iceberg.spark.SparkCatalog') \
.config(f'spark.sql.catalog.{catalog_name}.type', 'glue') \
.config(f'spark.sql.catalog.{catalog_name}.glue.id', rms_catalog_name) \
.config(f'spark.sql.catalog.{catalog_name}.client.region', region) \
.config(f'spark.sql.catalog.{catalog_name}.glue.account-id', account_id) \
.config(f'spark.sql.catalog.{catalog_name}.glue.catalog-arn',f'arn:aws:glue:{region}:{rms_catalog_name}') \
.config('spark.sql.extensions','org.apache.iceberg.spark.extensions.IcebergSparkSessionExtensions') \
.getOrCreate()

Configure cross-account access of Amazon SageMaker Lakehouse multi-catalog tables using AWS Glue 5.0 Spark

Post Syndicated from Aarthi Srinivasan original https://aws.amazon.com/blogs/big-data/configure-cross-account-access-of-amazon-sagemaker-lakehouse-multi-catalog-tables-using-aws-glue-5-0-spark/

Many organizations build and operate enterprise-wide data mesh architectures using the AWS Glue Data Catalog and AWS Lake Formation for their Amazon Simple Storage Service (Amazon S3) based data lakes. Now, with Amazon SageMaker Lakehouse, these organizations can unify their data analytics and AI/ML workflows while maintaining secure cross-account access without data replication. By centralizing access to a single copy of data and using the secure fine-grained permissions of Lake Formation, enterprises can accelerate their analytics initiatives while reducing operational complexity across business units.

SageMaker Lakehouse organizes data using logical containers called catalogs, enabling teams to seamlessly query and analyze data across their entire ecosystem—from S3 data lakes to Amazon Redshift warehouses—using familiar Apache Iceberg compatible tools. Organizations can either mount their existing data warehouse to the lakehouse or create new catalogs using Amazon Redshift managed storage. Built-in zero-ETL connectors reduce data silos by integrating various data sources, enabling unified analytics across teams. This seamless integration particularly benefits existing AWS customers who already use the Data Catalog and Lake Formation, because they can immediately take advantage of SageMaker Lakehouse capabilities.

AWS Glue is a serverless service that makes data integration simpler, faster, and cheaper. We launched AWS Glue 5.0 with upgraded Apache Spark 3.5.4 and Python 3.11. AWS Glue 5.0 adds support for SageMaker Lakehouse to unify your data across S3 data lakes and Redshift data warehouses.

In our previous blog post, we demonstrated the process of creating tables in both the Amazon Redshift managed catalog and Amazon Redshift federated catalog within a single AWS account. In this post, we show you how to share a Redshift table and Amazon S3 based Iceberg table from the account that owns the data to another account that consumes the data. In the recipient account, we run a join query on the shared data lake and data warehouse tables using Spark in AWS Glue 5.0. We walk you through the complete cross-account setup and provide the Spark configuration in a Python notebook.

Solution overview

To demonstrate the functionality of SageMaker Lakehouse multi-catalog tables using AWS Glue 5.0 Spark, let’s assume the retail company Example Retail Corp launches a campaign to understand their market and drive growth by country of operation. Their infrastructure consists of a Redshift data warehouse for structured data and an S3 data lake for structured and semi-structured data. The marketing team realizes that customer data is spread across those two systems and wants to use the support of their data engineering and analysts to analyze and provide insights. As a company, they prefer unified governance for managing data access while enabling a secure sharing mechanism for business and engineering teams.

Let’s see how they can achieve the goal using SageMaker Lakehouse. The solution is represented in the following diagram.

001-BDB 5089

The setup could be extended to enterprise data meshes where a data producer account will own the Redshift clusters, catalog the tables in a central governance account, and share with any number of consumer accounts from the central account. Multiple consumer accounts could analyze the shared Redshift tables using the SageMaker Lakehouse integrated analytics engines.

The solution also works for cross-Region table access. You would create a resource link for the catalog tables in an AWS Region where you want to run your analyses and create dashboards. For cross-Region resource link setup, refer to Setting up cross-Region table access.

Prerequisites

To implement this solution, you need the following prerequisites:

  • Two AWS accounts with Lake Formation cross-account sharing version 4 and Lake Formation administrator configured. Refer to the Lake Formation data administrator permissions and initial setup of Lake Formation.
  • Permissions from Prerequisites for managing Amazon Redshift namespaces in the AWS Glue Data Catalog granted to the Lake Formation administrator role on both accounts.
  • An S3 bucket in the producer account to host the sample Iceberg table data.
  • An AWS Identity and Access Management (IAM) role, LakeFormationS3Registration_custom, in the producer account to register your Iceberg table’s Amazon S3 location with Lake Formation. For details, refer to Registering an Amazon S3 location and Requirements for roles used to register locations.
  • An Amazon Redshift Serverless namespace in the producer account. Follow the instructions in Creating a data warehouse with Amazon Redshift Serverless to launch a serverless namespace with default settings.
  • Two sample datasets, orders and returns, in CSV format. This is Example Retail Corp’s data on their customer purchase and return trends. Their marketing team has collected these data in a Redshift table and Amazon S3 from various systems. The instructions to create these tables are provided in the appendix at the end of this post. After completing the steps in the appendix, you should have customerdb.returnstbl_iceberg in your default catalog and ordersdb.orderstbl in your Redshift Serverless application default namespace.
  • An IAM role, Glue-execution-role, in the consumer account, with the following policies:
    1. AWS managed policies AWSGlueServiceRole and AmazonRedshiftDataFullAccess.
    2. Create a new in-line policy with the following permissions and attach it:
      {
          "Version": "2012-10-17",
          "Statement": [
              {
                  "Sid": "LFandRSserverlessAccess",
                  "Effect": "Allow",
                  "Action": [
                      "lakeformation:GetDataAccess",
                      "redshift-serverless:GetCredentials"
                  ],
                  "Resource": "*"
              },
              {
                  "Effect": "Allow",
                  "Action": "iam:PassRole",
                  "Resource": "*",
                  "Condition": {
                      "StringEquals": {
                          "iam:PassedToService": "glue.amazonaws.com"
                      }
                  }
              }
          ]
      }

    3. Add the following trust policy to Glue-execution-role, allowing AWS Glue to assume this role:
      {
          "Version": "2012-10-17",
          "Statement": [
              {
                  "Effect": "Allow",
                  "Principal": {
                      "Service": [
                          "glue.amazonaws.com"
                      ]
                  },
                  "Action": "sts:AssumeRole"
              }
          ]
      }

    Steps for producer account setup

    For the producer account setup, you can either use your IAM administrator role added as Lake Formation administrator or use a Lake Formation administrator role with permissions added as discussed in the prerequisites. For illustration purposes, we use the IAM admin role Admin added as Lake Formation administrator.

    002-BDB 5089

    Configure your catalog

    Complete the following steps to set up your catalog:

    1. Log in to AWS Management Console as Admin.
    2. On the Amazon Redshift console, follow the instructions in Registering Amazon Redshift clusters and namespaces to the AWS Glue Data Catalog.
    3. After the registration is initiated, you will see the invite from Amazon Redshift on the Lake Formation console.
    4. Select the pending catalog invitation and choose Approve and create catalog.

    003-BDB 5089

    1. On the Set catalog details page, configure your catalog:
      1. For Name, enter a name (for this post, redshiftserverless1-uswest2).
      2. Select Access this catalog from Apache Iceberg compatible engines.
      3. Choose the IAM role you created for the data transfer.
      4. Choose Next.

      004-BDB 5089

    2. On the Grant permissions – optional page, choose Add permissions.
      1. Grant the Admin user Super user permissions for Catalog permissions and Grantable permissions.
      2. Choose Add.

      005-BDB 5089

    3. Verify the granted permission on the next page and choose Next.
      006-BDB 5089
    4. Review the details on the Review and create page and choose Create catalog.
      007-BDB 5089

    Wait a few seconds for the catalog to show up.

    1. Choose Catalogs in the navigation pane and verify that the redshiftserverless1-uswest2 catalog is created.
      008-BDB 5089
    2. Explore the catalog detail page to verify the ordersdb.public database.
      009-BDB 5089
    3. On the database View dropdown menu, view the table and verify that the orderstbl table shows up.
      010-BDB 5089

    As the Admin role, you can also query the orderstbl in Amazon Athena and confirm the data is available.

    011-BDB 5089

    Grant permissions on the tables from the producer account to the consumer account

    In this step, we share the Amazon Redshift federated catalog database redshiftserverless1-uswest2:ordersdb.public and table orderstbl as well as the Amazon S3 based Iceberg table returnstbl_iceberg and its database customerdb from the default catalog to the consumer account. We can’t share the entire catalog to external accounts as a catalog-level permission; we just share the database and table.

    1. On the Lake Formation console, choose Data permissions in the navigation pane.
    2. Choose Grant.
      012-BDB 5089
    3. Under Principals, select External accounts.
    4. Provide the consumer account ID.
    5. Under LF-Tags or catalog resources, select Named Data Catalog resources.
    6. For Catalogs, choose the account ID that represents the default catalog.
    7. For Databases, choose customerdb.
      013-BDB 5089
    8. Under Database permissions, select Describe under Database permissions and Grantable permissions.
    9. Choose Grant.
      014-BDB 5089
    10. Repeat these steps and grant table-level Select and Describe permissions on returnstbl_iceberg.
    11. Repeat these steps again to grant database- and table-level permissions for the ordertbl table of the federated catalog database redshiftserverless1-uswest2/ordersdb.

    The following screenshots show the configuration for database-level permissions.

    015-BDB 5089

    016-BDB 5089

    The following screenshots show the configuration for table-level permissions.

    017-BDB 5089

    018-BDB 5089

    1. Choose Data permissions in the navigation pane and verify that the consumer account has been granted database- and table-level permissions for both orderstbl from the federated catalog and returnstbl_iceberg from the default catalog.
      019-BDB 5089

    Register the Amazon S3 location of the returnstbl_iceberg with Lake Formation.

    In this step, we register the Amazon S3 based Iceberg table returnstbl_iceberg data location with Lake Formation to be managed by Lake Formation permissions. Complete the following steps:

    1. On the Lake Formation console, choose Data lake locations in the navigation pane.
    2. Choose Register location.
      020-BDB 5089
    3. For Amazon S3 path, enter the path for your S3 bucket that you provided while creating the Iceberg table returnstbl_iceberg.
    4. For IAM role, provide the user-defined role LakeFormationS3Registration_custom that you created as a prerequisite.
    5. For Permission mode, select Lake Formation.
    6. Choose Register location.
      021-BDB 5089
    7. Choose Data lake locations in the navigation pane to verify the Amazon S3 registration.
      022-BDB 5089

    With this step, the producer account setup is complete.

    Steps for consumer account setup

    For the consumer account setup, we use the IAM admin role Admin, added as a Lake Formation administrator.

    The steps in the consumer account are quite involved. In the consumer account, a Lake Formation administrator will accept the AWS Resource Access Manager (AWS RAM) shares and create the required resource links that point to the shared catalog, database, and tables. The Lake Formation admin verifies that the shared resources are accessible by running test queries in Athena. The admin further grants permissions to the role Glue-execution-role on the resource links, database, and tables. The admin then runs a join query in AWS Glue 5.0 Spark using Glue-execution-role.

    Accept and verify the shared resources

    Lake Formation uses AWS RAM shares to enable cross-account sharing with Data Catalog resource policies in the AWS RAM policies. To view and verify the shared resources from producer account, complete the following steps:

    1. Log in to the consumer AWS console and set the AWS Region to match the producer’s shared resource Region. For this post, we use us-west-2.
    2. Open the Lake Formation console. You will see a message indicating there is a pending invite and asking you accept it on the AWS RAM console.
      023-BDB 5089
    3. Follow the instructions in Accepting a resource share invitation from AWS RAM to review and accept the pending invites.
    4. When the invite status changes to Accepted, choose Shared resources under Shared with me in the navigation pane.
    5. Verify that the Redshift Serverless federated catalog redshiftserverless1-uswest2, the default catalog database customerdb, the table returnstbl_iceberg, and the producer account ID under Owner ID column display correctly.
      024-BDB 5089
    6. On the Lake Formation console, under Data Catalog in the navigation pane, choose Databases.
    7. Search by the producer account ID.
      You should see the customerdb and public databases. You can further select each database and choose View tables on the Actions dropdown menu and verify the table names

    025-BDB 5089

    You will not see an AWS RAM share invite for the catalog level on the Lake Formation console, because catalog-level sharing isn’t possible. You can review the shared federated catalog and Amazon Redshift managed catalog names on the AWS RAM console, or using the AWS Command Line Interface (AWS CLI) or SDK.

    Create a catalog link container and resource links

    A catalog link container is a Data Catalog object that references a local or cross-account federated database-level catalog from other AWS accounts. For more details, refer to Accessing a shared federated catalog. Catalog link containers are essentially Lake Formation resource links at the catalog level that reference or point to a Redshift cluster federated catalog or Amazon Redshift managed catalog object from other accounts.

    In the following steps, we create a catalog link container that points to the producer shared federated catalog redshiftserverless1-uswest2. Inside the catalog link container, we create a database. Inside the database, we create a resource link for the table that points to the shared federated catalog table <<producer account id>>:redshiftserverless1-uswest2/ordersdb.public.orderstbl.

    1. On the Lake Formation console, under Data Catalog in the navigation pane, choose Catalogs.
    2. Choose Create catalog.

    026-BDB 5089

    1. Provide the following details for the catalog:
      1. For Name, enter a name for the catalog (for this post, rl_link_container_ordersdb).
      2. For Type, choose Catalog Link container.
      3. For Source, choose Redshift.
      4. For Target Redshift Catalog, enter the Amazon Resource Name (ARN) of the producer federated catalog (arn:aws:glue:us-west-2:<<producer account id>>:catalog/redshiftserverless1-uswest2/ordersdb).
      5. Under Access from engines, select Access this catalog from Apache Iceberg compatible engines.
      6. For IAM role, provide the Redshift-S3 data transfer role that you had created in the prerequisites.
      7. Choose Next.

    027-BDB 5089

    1. On the Grant permissions – optional page, choose Add permissions.
      1. Grant the Admin user Super user permissions for Catalog permissions and Grantable permissions.
      2. Choose Add and then choose Next.

    028-BDB 5089

    1. Review the details on the Review and create page and choose Create catalog.

    Wait a few seconds for the catalog to show up.

    029-BDB 5089

    1. In the navigation pane, choose Catalogs.
    2. Verify that rl_link_container_ordersdb is created.

    030-BDB 5089

    Create a database under rl_link_container_ordersdb

    Complete the following steps:

    1. On the Lake Formation console, under Data Catalog in the navigation pane, choose Databases.
    2. On the Choose catalog dropdown menu, choose rl_link_container_ordersdb.
    3. Choose Create database.

    Alternatively, you can choose the Create dropdown menu and then choose Database.

    1. Provide details for the database:
      1. For Name, enter a name (for this post, public_db).
      2. For Catalog, choose rl_link_container_ordersdb.
      3. Leave Location – optional as blank.
      4. Under Default permissions for newly created tables, deselect Use only IAM access control for new tables in this database.
      5. Choose Create database.

    031-BDB 5089

    1. Choose Catalogs in the navigation pane to verify that public_db is created under rl_link_container_ordersdb.

    032-BDB 5089

    Create a table resource link for the shared federated catalog table

    A resource link to a shared federated catalog table can reside only inside the database of a catalog link container. A resource link for such tables will not work if created inside the default catalog. For more details on resource links, refer to Creating a resource link to a shared Data Catalog table.

    Complete the following steps to create a table resource link:

    1. On the Lake Formation console, under Data Catalog in the navigation pane, choose Tables.
    2. On the Create dropdown menu, choose Resource link.

    033-BDB 5089

    1. Provide details for the table resource link:
      1. For Resource link name, enter a name (for this post, rl_orderstbl).
      2. For Destination catalog, choose rl_link_container_ordersdb.
      3. For Database, choose public_db.
      4. For Shared table’s region, choose US West (Oregon).
      5. For Shared table, choose orderstbl.
      6. After the Shared table is selected, Shared table’s database and Shared table’s catalog ID should get automatically populated.
      7. Choose Create.

    034-BDB 5089

    1. In the navigation pane, choose Databases to verify that rl_orderstbl is created under public_db, inside rl_link_container_ordersdb.

    035-BDB 5089

    036-BDB 5089

    Create a database resource link for the shared default catalog database.

    Now we create a database resource link in the default catalog to query the Amazon S3 based Iceberg table shared from the producer. For details on database resource links, refer Creating a resource link to a shared Data Catalog database.

    Though we are able to see the shared database in the default catalog of the consumer, a resource link is required to query from analytics engines, such as Athena, Amazon EMR, and AWS Glue. When using AWS Glue with Lake Formation tables, the resource link needs to be named identically to the source account’s resource. For additional details on using AWS Glue with Lake Formation, refer to Considerations and limitations.

    Complete the following steps to create a database resource link:

    1. On the Lake Formation console, under Data Catalog in the navigation pane, choose Databases.
    2. On the Choose catalog dropdown menu, choose the account ID to choose the default catalog.
    3. Search for customerdb.

    You should see the shared database name customerdb with the Owner account ID as that of your producer account ID.

    1. Select customerdb, and on the Create dropdown menu, choose Resource link.
    2. Provide details for the resource link:
      1. For Resource link name, enter a name (for this post, customerdb).
      2. The rest of the fields should be already populated.
      3. Choose Create.
    3. In the navigation pane, choose Databases and verify that customerdb is created under the default catalog. Resource link names will show in italicized font.

    037-BDB 5089

    Verify access as Admin using Athena

    Now you can verify your access using Athena. Complete the following steps:

    1. Open the Athena console.
    2. Make sure an S3 bucket is provided to store the Athena query results. For details, refer to Specify a query result location using the Athena console.
    3. In the navigation pane, verify both the default catalog and federated catalog tables by previewing them.
    4. You can also run a join query as follows. Pay attention to the three-point notation for referring to the tables from two different catalogs:
    SELECT
    returns_tb.market as Market,
    sum(orders_tb.quantity) as Total_Quantity
    FROM rl_link_container_ordersdb.public_db.rl_orderstbl as orders_tb
    JOIN awsdatacatalog.customerdb.returnstbl_iceberg as returns_tb
    ON orders_tb.order_id = returns_tb.order_id
    GROUP BY returns_tb.market;

    038-BDB 5089

    This verifies the new capability of SageMaker Lakehouse, which enables accessing Redshift cluster tables and Amazon S3 based Iceberg tables in the same query, across AWS accounts, through the Data Catalog, using Lake Formation permissions.

    Grant permissions to Glue-execution-role

    Now we will share the resources from the producer account with additional IAM principals in the consumer account. Usually, the data lake admin grants permissions to data analysts, data scientists, and data engineers in the consumer account to do their job functions, such as processing and analyzing the data.

    We set up Lake Formation permissions on the catalog link container, databases, tables, and resource links to the AWS Glue job execution role Glue-execution-role that we created in the prerequisites.

    Resource links allow only Describe and Drop permissions. You need to use the Grant on target configuration to provide database Describe and table Select permissions.

    Complete the following steps:

    1. On the Lake Formation console, choose Data permissions in the navigation pane.
    2. Choose Grant.
    3. Under Principals, select IAM users and roles.
    4. For IAM users and roles, enter Glue-execution-role.
    5. Under LF-Tags or catalog resources, select Named Data Catalog resources.
    6. For Catalogs, choose rl_link_container_ordersdb and the consumer account ID, which indicates the default catalog.
    7. Under Catalog permissions, select Describe for Catalog permissions.
    8. Choose Grant.

    039-BDB 5089

    040-BDB 5089

    1. Repeat these steps for the catalog rl_link_container_ordersdb:
      1. On the Databases dropdown menu, choose public_db.
      2. Under Database permissions, select Describe.
      3. Choose Grant.
    2. Repeat these steps again, but after choosing rl_link_container_ordersdb and public_db, on the Tables dropdown menu, choose rl_orderstbl.
      1. Under Resource link permissions, select Describe.
      2. Choose Grant.
    3. Repeat these steps to grant additional permissions to Glue-execution-role.
      1. For this iteration, grant Describe permissions on the default catalog databases public and customerdb.
      2. Grant Describe permission on the resource link customerdb.
      3. Grant Select permission on the tables returnstbl_iceberg and orderstbl.

    The following screenshots show the configuration for database public and customerdb permissions.

    041-BDB 5089

    042-BDB 5089

    The following screenshots show the configuration for resource link customerdb permissions.

    043-BDB 5089

    044-BDB 5089

    The following screenshots show the configuration for table returnstbl_iceberg permissions.

    045-BDB 5089

    046-BDB 5089

    The following screenshots show the configuration for table orderstbl permissions.

    047-BDB 5089

    048-BDB 5089

    1. In the navigation pane, choose Data permissions and verify permissions on Glue-execution-role.

    049-BDB 5089

    Run a PySpark job in AWS Glue 5.0

    Download the PySpark script LakeHouseGlueSparkJob.py. This AWS Glue PySpark script runs Spark SQL by joining the producer shared federated orderstbl table and Amazon S3 based returns table in the consumer account to analyze the data and identify the total orders placed per market.

    Replace <<consumer_account_id>> in the script with your consumer account ID. Complete the following steps to create and run an AWS Glue job:

    1. On the AWS Glue console, in the navigation pane, choose ETL jobs.
    2. Choose Create job, then choose Script editor.

    050-BDB 5089

    1. For Engine, choose Spark.
    2. For Options, choose Start fresh.
    3. Choose Upload script.
    4. Browse to the location where you downloaded and edited the script, select the script, and choose Open.
    5. On the Job details tab, provide the following information:
      1. For Name, enter a name (for this post, LakeHouseGlueSparkJob).
      2. Under Basic properties, for IAM role, choose Glue-execution-role.
      3. For Glue version, select Glue 5.0.
      4. Under Advanced properties, for Job parameters, choose Add new parameter.
      5. Add the parameters --datalake-formats = iceberg and --enable-lakeformation-fine-grained-access = true.
    6. Save the job.
    7. Choose Run to execute the AWS Glue job, and wait for the job to complete.
    8. Review the job run details from the Output logs

    051-BDB 5089

    052-BDB 5089

    Clean up

    To avoid incurring costs on your AWS accounts, clean up the resources you created:

    1. Delete the Lake Formation permissions, catalog link container, database, and tables in the consumer account.
    2. Delete the AWS Glue job in the consumer account.
    3. Delete the federated catalog, database, and table resources in the producer account.
    4. Delete the Redshift Serverless namespace in the producer account.
    5. Delete the S3 buckets you created as part of data transfer in both accounts and the Athena query results bucket in the consumer account.
    6. Clean up the IAM roles you created for the SageMaker Lakehouse setup as part of the prerequisites.

    Conclusion

    In this post, we illustrated how to bring your existing Redshift tables to SageMaker Lakehouse and share them securely with external AWS accounts. We also showed how to query the shared data warehouse and data lakehouse tables in the same Spark session, from a recipient account, using Spark in AWS Glue 5.0.

    We hope you find this useful to integrate your Redshift tables with an existing data mesh and access the tables using AWS Glue Spark. Test this solution in your accounts and share feedback in the comments section. Stay tuned for more updates and feel free to explore the features of SageMaker Lakehouse and AWS Glue versions.

    Appendix: Table creation

    Complete the following steps to create a returns table in the Amazon S3 based default catalog and an orders table in Amazon Redshift:

    1. Download the CSV format datasets orders and returns.
    2. Upload them to your S3 bucket under the corresponding table prefix path.
    3. Use the following SQL statements in Athena. First-time users of Athena should refer to Specify a query result location.
    CREATE DATABASE customerdb;
    CREATE EXTERNAL TABLE customerdb.returnstbl_csv(
      `returned` string, 
      `order_id` string, 
      `market` string)
    ROW FORMAT DELIMITED 
      FIELDS TERMINATED BY '\;' 
    LOCATION
      's3://<your-S3-bucket>/<prefix-for-returns-table-data>/'
    TBLPROPERTIES (
      'skip.header.line.count'='1'
    );
    
    select * from customerdb.returnstbl_csv limit 10; 
    

    053-BDB 5089

    1. Create an Iceberg format table in the default catalog and insert data from the CSV format table:
    CREATE TABLE customerdb.returnstbl_iceberg(
      `returned` string, 
      `order_id` string, 
      `market` string)
    LOCATION 's3://<your-producer-account-bucket>/returnstbl_iceberg/' 
    TBLPROPERTIES (
      'table_type'='ICEBERG'
    );
    
    INSERT INTO customerdb.returnstbl_iceberg
    SELECT *
    FROM returnstbl_csv;  
    
    SELECT * FROM customerdb.returnstbl_iceberg LIMIT 10; 
    

    054-BDB 5089

    1. To create the orders table in the Redshift Serverless namespace, open the Query Editor v2 on the Amazon Redshift console.
    2. Connect to the default namespace using your database admin user credentials.
    3. Run the following commands in the SQL editor to create the database ordersdb and table orderstbl in it. Copy the data from your S3 location of the orders data to the orderstbl:
    create database ordersdb;
    use ordersdb;
    
    create table orderstbl(
      row_id int, 
      order_id VARCHAR, 
      order_date VARCHAR, 
      ship_date VARCHAR, 
      ship_mode VARCHAR, 
      customer_id VARCHAR, 
      customer_name VARCHAR, 
      segment VARCHAR, 
      city VARCHAR, 
      state VARCHAR, 
      country VARCHAR, 
      postal_code int, 
      market VARCHAR, 
      region VARCHAR, 
      product_id VARCHAR, 
      category VARCHAR, 
      sub_category VARCHAR, 
      product_name VARCHAR, 
      sales VARCHAR, 
      quantity bigint, 
      discount VARCHAR, 
      profit VARCHAR, 
      shipping_cost VARCHAR, 
      order_priority VARCHAR
      );
    
    copy orderstbl
    from 's3://<your-s3-bucket>/ordersdatacsv/orders.csv' 
    iam_role 'arn:aws:iam::<producer-account-id>:role/service-role/<your-Redshift-Role>'
    CSV 
    DELIMITER ';'
    IGNOREHEADER 1
    ;
    
    select * from ordersdb.orderstbl limit 5;


    About the Authors

    055-BDB 5089Aarthi Srinivasan is a Senior Big Data Architect with Amazon SageMaker Lakehouse. She collaborates with the service team to enhance product features, works with AWS customers and partners to architect lakehouse solutions, and establishes best practices for data governance.

    056-BDB 5089Subhasis Sarkar is a Senior Data Engineer with Amazon. Subhasis thrives on solving complex technological challenges with innovative solutions. He specializes in AWS data architectures, particularly data mesh implementations using AWS CDK components.

Accelerate lightweight analytics using PyIceberg with AWS Lambda and an AWS Glue Iceberg REST endpoint

Post Syndicated from Sotaro Hikita original https://aws.amazon.com/blogs/big-data/accelerate-lightweight-analytics-using-pyiceberg-with-aws-lambda-and-an-aws-glue-iceberg-rest-endpoint/

For modern organizations built on data insights, effective data management is crucial for powering advanced analytics and machine learning (ML) activities. As data use cases become more complex, data engineering teams require sophisticated tooling to handle versioning, increasing data volumes, and schema changes across multiple data sources and applications.

Apache Iceberg has emerged as a popular choice for data lakes, offering ACID (Atomicity, Consistency, Isolation, Durability) transactions, schema evolution, and time travel capabilities. Iceberg tables can be accessed from various distributed data processing frameworks like Apache Spark and Trino, making it a flexible solution for diverse data processing needs. Among the available tools for working with Iceberg, PyIceberg stands out as a Python implementation that enables table access and management without requiring distributed compute resources.

In this post, we demonstrate how PyIceberg, integrated with the AWS Glue Data Catalog and AWS Lambda, provides a lightweight approach to harness Iceberg’s powerful features through intuitive Python interfaces. We show how this integration enables teams to start working with Iceberg tables with minimal setup and infrastructure dependencies.

PyIceberg’s key capabilities and advantages

One of PyIceberg’s primary advantages is its lightweight nature. Without requiring distributed computing frameworks, teams can perform table operations directly from Python applications, making it suitable for small to medium-scale data exploration and analysis with minimal learning curve. In addition, PyIceberg is integrated with Python data analysis libraries like Pandas and Polars, so data users can use their existing skills and workflows.

When using PyIceberg with the Data Catalog and Amazon Simple Storage Service (Amazon S3), data teams can store and manage their tables in a completely serverless environment. This means data teams can focus on analysis and insights rather than infrastructure management.

Furthermore, Iceberg tables managed through PyIceberg are compatible with AWS data analytics services. Although PyIceberg operates on a single node and has performance limitations with large data volumes, the same tables can be efficiently processed at scale using services such as Amazon Athena and AWS Glue. This enables teams to use PyIceberg for rapid development and testing, then transition to production workloads with larger-scale processing engines—while maintaining consistency in their data management approach.

Representative use case

The following are common scenarios where PyIceberg can be particularly useful:

  • Data science experimentation and feature engineering – In data science, experiment reproducibility is crucial for maintaining reliable and efficient analyses and models. However, continuously updating organizational data makes it challenging to manage data snapshots for important business events, model training, and consistent reference. Data scientists can query historical snapshots through time travel capabilities and record important versions using tagging features. With PyIceberg, they can receive these benefits in their Python environment using familiar tools like Pandas. Thanks to Iceberg’s ACID capabilities, they can access consistent data even when tables are being actively updated.
  • Serverless data processing with Lambda – Organizations often need to process data and maintain analytical tables efficiently without managing complex infrastructure. Using PyIceberg with Lambda, teams can build event-driven data processing and scheduled table updates through serverless functions. PyIceberg’s lightweight nature makes it well-suited for serverless environments, enabling simple data processing tasks like data validation, transformation, and ingestion. These tables remain accessible for both updates and analytics through various AWS services, allowing teams to build efficient data pipelines without managing servers or clusters.

Event-driven data ingestion and analysis with PyIceberg

In this section, we explore a practical example of using PyIceberg for data processing and analysis using NYC yellow taxi trip data. To simulate an event-driven data processing scenario, we use Lambda to insert sample data into an Iceberg table, representing how real-time taxi trip records might be processed. This example will demonstrate how PyIceberg can streamline workflows by combining efficient data ingestion with flexible analysis capabilities.

Imagine your team faces several requirements:

  • The data processing solution needs to be cost-effective and maintainable, avoiding the complexity of managing distributed computing clusters for this moderately-sized dataset.
  • Analysts need the ability to perform flexible queries and explorations using familiar Python tools. For example, they might need to compare historical snapshots with current data to analyze trends over time.
  • The solution should have the ability to expand to be more scalable in the future.

To address these requirements, we implement a solution that combines Lambda for data processing with Jupyter notebooks for analysis, both powered by PyIceberg. This approach provides a lightweight yet robust architecture that maintains data consistency while enabling flexible analysis workflows. At the end of the walkthrough, we also query this data using Athena to demonstrate compatibility with multiple Iceberg-supporting tools and show how the architecture can scale.

We walk through the following high-level steps:

  1. Use Lambda to write sample NYC yellow taxi trip data to an Iceberg table on Amazon S3 using PyIceberg with an AWS Glue Iceberg REST endpoint. In a real-world scenario, this Lambda function would be triggered by an event from a queuing component like Amazon Simple Queue Service (Amazon SQS). For more details, see Using Lambda with Amazon SQS.
  2. Analyze table data in a Jupyter notebook using PyIceberg through the AWS Glue Iceberg REST endpoint.
  3. Query the data using Athena to demonstrate Iceberg’s flexibility.

The following diagram illustrates the architecture.

Overall Architecture

When implementing this architecture, it’s important to note that Lambda functions can have multiple concurrent invocations when triggered by events. This concurrent invocation might lead to transaction conflicts when writing to Iceberg tables. To handle this, you should implement an appropriate retry mechanism and carefully manage concurrency levels. If you’re using Amazon SQS as an event source, you can control concurrent invocations through the SQS event source’s maximum concurrency setting.

Prerequisites

The following prerequisites are necessary for this use case:

Set up resources with AWS CloudFormation

You can use the provided CloudFormation template to set up the following resources:

Complete the following steps to deploy the resources:

  1. Choose Launch stack.

  1. For Parameters, pyiceberg_lambda_blog_database is set by default. You can also change the default value. If you change the database name, remember to replace pyiceberg_lambda_blog_database with your chosen name in all subsequent steps. Then, choose Next.
  2. Choose Next.
  3. Select I acknowledge that AWS CloudFormation might create IAM resources with custom names.
  4. Choose Submit.

Build and run a Lambda function

Let’s build a Lambda function to process incoming records using PyIceberg. This function creates an Iceberg table called nyc_yellow_table in the database pyiceberg_lambda_blog_database in the Data Catalog if it doesn’t exist. It then generates sample NYC taxi trip data to simulate incoming records and inserts it into nyc_yellow_table.

Although we invoke this function manually in this example, in real-world scenarios, this Lambda function would be triggered by actual events, such as messages from Amazon SQS. When implementing real-world use cases, the function code must be modified to receive the event data and process it based on the requirements.

We deploy the function using container images as the deployment package. To create a Lambda function from a container image, build your image on CloudShell and push it to an ECR repository. Complete the following steps:

  1. Sign in to the AWS Management Console and launch CloudShell.
  2. Create a working directory.
mkdir pyiceberg_blog
cd pyiceberg_blog
  1. Download the Lambda script lambda_function.py.
aws s3 cp s3://aws-blogs-artifacts-public/artifacts/BDB-5013/lambda_function.py .

This script performs the following tasks:

  • Creates an Iceberg table with the NYC taxi schema in the Data Catalog
  • Generates a random NYC taxi dataset
  • Inserts this data into the table

Let’s break down the essential parts of this Lambda function:

  • Iceberg catalog configuration – The following code defines an Iceberg catalog that connects to the AWS Glue Iceberg REST endpoint:
# Configure the catalog
catalog_properties = {
   "type": "rest",
   "uri": f"https://glue.{region}.amazonaws.com/iceberg",
   "s3.region": region,
   "rest.sigv4-enabled": "true",
   "rest.signing-name": "glue",
   "rest.signing-region": region
}
catalog = load_catalog(**catalog_properties)
  • Table schema definition – The following code defines the Iceberg table schema for the NYC taxi dataset. The table includes:
    • Schema columns defined in the Schema
    • Partitioning by vendorid and tpep_pickup_datetime using PartitionSpec
    • Day transform applied to tpep_pickup_datetime for daily record management
    • Sort ordering by tpep_pickup_datetime and tpep_dropoff_datetime

When applying the day transform to timestamp columns, Iceberg automatically handles date-based partitioning hierarchically. This means a single day transform enables partition pruning at the year, month, and day levels without requiring explicit transforms for each level. For more details about Iceberg partitioning, see Partitioning.

# Table Definition
schema = Schema(
    NestedField(field_id=1, name="vendorid", field_type=LongType(), required=False),
    NestedField(field_id=2, name="tpep_pickup_datetime", field_type=TimestampType(), required=False),
    NestedField(field_id=3, name="tpep_dropoff_datetime", field_type=TimestampType(), required=False),
    NestedField(field_id=4, name="passenger_count", field_type=LongType(), required=False),
    NestedField(field_id=5, name="trip_distance", field_type=DoubleType(), required=False),
    NestedField(field_id=6, name="ratecodeid", field_type=LongType(), required=False),
    NestedField(field_id=7, name="store_and_fwd_flag", field_type=StringType(), required=False),
    NestedField(field_id=8, name="pulocationid", field_type=LongType(), required=False),
    NestedField(field_id=9, name="dolocationid", field_type=LongType(), required=False),
    NestedField(field_id=10, name="payment_type", field_type=LongType(), required=False),
    NestedField(field_id=11, name="fare_amount", field_type=DoubleType(), required=False),
    NestedField(field_id=12, name="extra", field_type=DoubleType(), required=False),
    NestedField(field_id=13, name="mta_tax", field_type=DoubleType(), required=False),
    NestedField(field_id=14, name="tip_amount", field_type=DoubleType(), required=False),
    NestedField(field_id=15, name="tolls_amount", field_type=DoubleType(), required=False),
    NestedField(field_id=16, name="improvement_surcharge", field_type=DoubleType(), required=False),
    NestedField(field_id=17, name="total_amount", field_type=DoubleType(), required=False),
    NestedField(field_id=18, name="congestion_surcharge", field_type=DoubleType(), required=False),
    NestedField(field_id=19, name="airport_fee", field_type=DoubleType(), required=False),
)

# Define partition spec
partition_spec = PartitionSpec(
    PartitionField(source_id=1, field_id=1001, transform=IdentityTransform(), name="vendorid_idenitty"),
    PartitionField(source_id=2, field_id=1002, transform=DayTransform(), name="tpep_pickup_day"),
)

# Define sort order
sort_order = SortOrder(
    SortField(source_id=2, transform=DayTransform()),
    SortField(source_id=3, transform=DayTransform())
)

database_name = os.environ.get('GLUE_DATABASE_NAME')
table_name = os.environ.get('ICEBERG_TABLE_NAME')
identifier = f"{database_name}.{table_name}"

# Create the table if it doesn't exist
location = f"s3://pyiceberg-lambda-blog-{account_id}-{region}/{database_name}/{table_name}"
if not catalog.table_exists(identifier):
    table = catalog.create_table(
        identifier=identifier,
        schema=schema,
        location=location,
        partition_spec=partition_spec,
        sort_order=sort_order
    )
else:
    table = catalog.load_table(identifier=identifier)
  • Data generation and insertion – The following code generates random data and inserts it into the table. This example demonstrates an append-only pattern, where new records are continuously added to track business events and transactions:
# Generate random data
records = generate_random_data()
# Convert to Arrow Table
df = pa.Table.from_pylist(records)
# Write data using PyIceberg
table.append(df)
  1. Download the Dockerfile. It defines the container image for your function code.
aws s3 cp s3://aws-blogs-artifacts-public/artifacts/BDB-5013/Dockerfile .
  1. Download the requirements.txt. It defines the Python packages required for your function code.
aws s3 cp s3://aws-blogs-artifacts-public/artifacts/BDB-5013/requirements.txt .

At this point, your working directory should contain the following three files:

  • Dockerfile
  • lambda_function.py
  • requirements.txt
  1. Set the environment variables. Replace <account_id> with your AWS account ID:
export AWS_ACCOUNT_ID=<account_id>
  1. Build the Docker image:
docker build --provenance=false -t localhost/pyiceberg-lambda .

# Confirm built image
docker images | grep pyiceberg-lambda
  1. Set a tag to the image:
docker tag localhost/pyiceberg-lambda:latest ${AWS_ACCOUNT_ID}.dkr.ecr.${AWS_REGION}.amazonaws.com/pyiceberg-lambda-repository:latest
  1. Log in to the ECR repository created by AWS CloudFormation:
aws ecr get-login-password --region ${AWS_REGION} | docker login --username AWS --password-stdin ${AWS_ACCOUNT_ID}.dkr.ecr.${AWS_REGION}.amazonaws.com
  1. Push the image to the ECR repository:
docker push ${AWS_ACCOUNT_ID}.dkr.ecr.${AWS_REGION}.amazonaws.com/pyiceberg-lambda-repository:latest
  1. Create a Lambda function using the container image you pushed to Amazon ECR:
aws lambda create-function \
--function-name pyiceberg-lambda-function \
--package-type Image \
--code ImageUri=${AWS_ACCOUNT_ID}.dkr.ecr.${AWS_REGION}.amazonaws.com/pyiceberg-lambda-repository:latest \
--role arn:aws:iam::${AWS_ACCOUNT_ID}:role/pyiceberg-lambda-function-role-${AWS_REGION} \
--environment "Variables={ICEBERG_TABLE_NAME=nyc_yellow_table, GLUE_DATABASE_NAME=pyiceberg_lambda_blog_database}" \
--region ${AWS_REGION} \
--timeout 60 \
--memory-size 1024
  1. Invoke the function at least five times to create multiple snapshots, which we will examine in the following sections. Note that we are invoking the function manually to simulate event-driven data ingestion. In real world scenarios, Lambda functions will be automatically invoked with event-driven fashion.
aws lambda invoke \
--function-name arn:aws:lambda:${AWS_REGION}:${AWS_ACCOUNT_ID}:function:pyiceberg-lambda-function \
--log-type Tail \
outputfile.txt \
--query 'LogResult' | tr -d '"' | base64 -d

At this point, you have deployed and run the Lambda function. The function creates the nyc_yellow_table Iceberg table in the pyiceberg_lambda_blog_database database. It also generates and inserts sample data into this table. We will explore the records in the table in later steps.

For more detailed information about building Lambda functions with containers, see Create a Lambda function using a container image.

Explore the data with Jupyter using PyIceberg

In this section, we demonstrate how to access and analyze the data stored in Iceberg tables registered in the Data Catalog. Using a Jupyter notebook with PyIceberg, we access the taxi trip data created by our Lambda function and examine different snapshots as new records arrive. We also tag specific snapshots to retain important ones, and create new tables for further analysis.

Complete the following steps to open the notebook with Jupyter on the SageMaker AI notebook instance:

  1. On the SageMaker AI console, choose Notebooks in the navigation pane.
  2. Choose Open JupyterLab next to the notebook that you created using the CloudFormation template.

notebook list

  1. Download the notebook and open it in a Jupyter environment on your SageMaker AI notebook.

upload notebook

  1. Open uploaded pyiceberg_notebook.ipynb.
  2. In the kernel selection dialog, leave the default option and choose Select.

select kernel

From this point forward, you will work through the notebook by running cells in order.

Connecting Catalog and Scanning Tables

You can access the Iceberg table using PyIceberg. The following code connects to the AWS Glue Iceberg REST endpoint and loads the nyc_yellow_table table on the pyiceberg_lambda_blog_database database:

import pyarrow as pa
from pyiceberg.catalog import load_catalog
import boto3

# Set AWS region
sts = boto3.client('sts')
region = sts._client_config.region_name

# Configure catalog connection properties
catalog_properties = {
    "type": "rest",
    "uri": f"https://glue.{region}.amazonaws.com/iceberg",
    "s3.region": region,
    "rest.sigv4-enabled": "true",
    "rest.signing-name": "glue",
    "rest.signing-region": region
}

# Specify database and table names
database_name = "pyiceberg_lambda_blog_database"
table_name = "nyc_yellow_table"

# Load catalog and get table
catalog = load_catalog(**catalog_properties)
table = catalog.load_table(f"{database_name}.{table_name}")

You can query full data from the Iceberg table as an Apache Arrow table and convert it to a Pandas DataFrame.

scan table

Working with Snapshots

One of the important features of Iceberg is snapshot-based version control. Snapshots are automatically created whenever data changes occur in the table. You can retrieve data from a specific snapshot, as shown in the following example.

working with snapshots

# Get data from a specific snapshot ID
snapshot_id = snapshots.to_pandas()["snapshot_id"][3]
snapshot_pa_table = table.scan(snapshot_id=snapshot_id).to_arrow()
snapshot_df = snapshot_pa_table.to_pandas()

You can compare the current data with historical data from any point in time based on snapshots. In this case, you are comparing the differences in data distribution between the latest table and a snapshot table:

# Compare the distribution of total_amount in the specified snapshot and the latest data.
import matplotlib.pyplot as plt

plt.figure(figsize=(4, 3))
df['total_amount'].hist(bins=30, density=True, label="latest", alpha=0.5)
snapshot_df['total_amount'].hist(bins=30, density=True, label="snapshot", alpha=0.5)
plt.title('Distribution of total_amount')
plt.xlabel('total_amount')
plt.ylabel('relative Frequency')
plt.legend()
plt.show()

matplotlib graph

Tagging snapshots

You can tag specific snapshots with an arbitrary name and query specific snapshots with that name later. This is useful when managing snapshots of important events.

In this example, you query a snapshot specifying the tag checkpointTag. Here, you are using the polars to create a new DataFrame by adding a new column called trip_duration based on existing columns tpep_dropoff_datetime and tpep_pickup_datetime columns:

# retrive tagged snapshot table as polars data frame
import polars as pl

# Get snapshot id from tag name
df = table.inspect.refs().to_pandas()
filtered_df = df[df["name"] == tag_name]
tag_snapshot_id = filtered_df["snapshot_id"].iloc[0]

# Scan Table based on the snapshot id
tag_pa_table = table.scan(snapshot_id=tag_snapshot_id).to_arrow()
tag_df = pl.from_arrow(tag_pa_table)

# Process the data adding a new column "trip_duration" from check point snapshot.
def preprocess_data(df):
    df = df.select(["vendorid", "tpep_pickup_datetime", "tpep_dropoff_datetime", 
                    "passenger_count", "trip_distance", "fare_amount"])
    df = df.with_columns(
        ((pl.col("tpep_dropoff_datetime") - pl.col("tpep_pickup_datetime"))
         .dt.total_seconds() // 60).alias("trip_duration"))
    return df

processed_df = preprocess_data(tag_df)
display(processed_df)
print(processed_df["trip_duration"].describe())

processed-df

Create a new table from the processed DataFrame with the trip_duration column. This step illustrates how to prepare data for potential future analysis. You can explicitly specify the snapshot of the data that the processed data is referring to by using a tag, even if the underlying table has been changed.

# write processed data to new iceberg table
account_id = sts.get_caller_identity()["Account"] 

new_table_name = "processed_" + table_name
location = f"s3://pyiceberg-lambda-blog-{account_id}-{region}/{database_name}/{new_table_name}"

pa_new_table = processed_df.to_arrow()
schema = pa_new_table.schema
identifier = f"{database_name}.{new_table_name}"

new_table = catalog.create_table(
                identifier=identifier,
                schema=schema,
                location=location
            )
            
# show new table's schema
print(new_table.schema())
# insert processed data to new table
new_table.append(pa_new_table)

Let’s query this new table made from processed data with Athena to demonstrate the Iceberg table’s interoperability.

Query the data from Athena

  1. In the Athena query editor, you can query the table pyiceberg_lambda_blog_database.processed_nyc_yellow_table created from the notebook in the previous section:
SELECT * FROM "pyiceberg_lambda_blog_database"."processed_nyc_yellow_table" limit 10;

query with athena

By completing these steps, you’ve built a serverless data processing solution using PyIceberg with Lambda and an AWS Glue Iceberg REST endpoint. You’ve worked with PyIceberg to manage and analyze data using Python, including snapshot management and table operations. In addition, you ran the query using another engine, Athena, which shows the compatibility of the Iceberg table.

Clean up

To clean up the resources used in this post, complete the following steps:

  1. On the Amazon ECR console, navigate to the repository pyiceberg-lambda-repository and delete all images contained in the repository.
  2. On the CloudShell, delete working directory pyiceberg_blog.
  3. On the Amazon S3 console, navigate to the S3 bucket pyiceberg-lambda-blog-<ACCOUNT_ID>-<REGION>, which you created using the CloudFormation template, and empty the bucket.
  4. After you confirm the repository and the bucket are empty, delete the CloudFormation stack pyiceberg-lambda-blog-stack.
  5. Delete the Lambda function pyiceberg-lambda-function that you created using the Docker image.

Conclusion

In this post, we demonstrated how using PyIceberg with the AWS Glue Data Catalog enables efficient, lightweight data workflows while maintaining robust data management capabilities. We showcased how teams can use Iceberg’s powerful features with minimal setup and infrastructure dependencies. This approach allows organizations to start working with Iceberg tables quickly, without the complexity of setting up and managing distributed computing resources.

This is particularly valuable for organizations looking to adopt Iceberg’s capabilities with a low barrier to entry. The lightweight nature of PyIceberg allows teams to begin working with Iceberg tables immediately, using familiar tools and requiring minimal additional learning. As data needs grow, the same Iceberg tables can be seamlessly accessed by AWS analytics services like Athena and AWS Glue, providing a clear path for future scalability.

To learn more about PyIceberg and AWS analytics services, we encourage you to explore the PyIceberg documentation and What is Apache Iceberg?


About the authors

Sotaro Hikita is a Specialist Solutions Architect focused on analytics with AWS, working with big data technologies and open source software. Outside of work, he always seeks out good food and has recently become passionate about pizza.

Shuhei Fukami is a Specialist Solutions Architect focused on Analytics with AWS. He likes cooking in his spare time and has become obsessed with making pizza these days.

Melting the ice — How Natural Intelligence simplified a data lake migration to Apache Iceberg

Post Syndicated from Yonatan Dolan original https://aws.amazon.com/blogs/big-data/melting-the-ice-how-natural-intelligence-simplified-a-data-lake-migration-to-apache-iceberg/

This post is co-written with Haya Axelrod Stern, Zion Rubin and Michal Urbanowicz from Natural Intelligence.

Many organizations turn to data lakes for the flexibility and scale needed to manage large volumes of structured and unstructured data. However, migrating an existing data lake to a new table format such as Apache Iceberg can bring significant technical and organizational challenges

Natural Intelligence (NI) is a world leader in multi-category marketplaces. NI’s leading brands, Top10.com and BestMoney.com, help millions of people worldwide to make informed decisions every day. Recently, NI embarked on a journey to transition their legacy data lake from Apache Hive to Apache Iceberg.

In this blog post, NI shares their journey, the innovative solutions developed, and the key takeaways that can guide other organizations considering a similar path.

This article details NI’s practical approach to this complex migration, focusing less on Apache Iceberg’s technical specifications, but rather on the real-world challenges and solutions encountered during the transition to Apache Iceberg, a challenge that many organizations are grappling with.

Why Apache Iceberg?

The architecture at NI followed the commonly used medallion architecture, comprised of a bronze-silver-gold layered framework, shown in the figure that follows:

  • Bronze layer: Unprocessed data from various sources, stored in its raw format in Amazon Simple Storage Service (Amazon S3), ingested through Apache Kafka brokers.
  • Silver layer: Contains cleaned and enriched data, processed using Apache Flink.
  • Gold layer: Holds analytics-ready datasets designed for business intelligence (BI) and reporting, produced using Apache Spark pipelines, and consumed by services such as Snowflake, Amazon Athena, Tableau, and Apache Druid. The data is stored in Apache Parquet format with AWS Glue Catalog providing metadata management.

BDB4681-Arch1

While this architecture supported NI analytical needs, it lacked the flexibility required for a truly open and adaptable data platform. The gold layer was coupled only with query engines that supported Hive and AWS Glue Data Catalog. It was possible to use Amazon Athena however Snowflake required maintaining another catalog in order to query those external tables. This issue made it difficult to evaluate or adopt alternative tools and engines without costly data duplication, query rewrite data catalog synchronization. As business scaled, NI needed a data platform that could seamlessly support multiple query engines simultaneously with a single data catalog and avoiding any vendor lock-in.

The power of Apache Iceberg

Apache Iceberg emerged as the perfect solution—a flexible, open table format that aligns with NI’s approach of Data Lake First. Iceberg offers several critical advantages such as ACID transactions, schema evolution, time travel, performance improvements and more. But the key strategic benefits lay in the ability to support multiple query engines simultaneously. It also has the following advantages:

  • Decoupling of storage and compute: The open table format enables you to separate the storage layer from the query engine, allowing an easy swap and support for multiple engines concurrently without data duplication.
  • Vendor independence: As an open table format, Apache Iceberg prevents vendor lock-in, giving you the flexibility to adapt to changing analytics needs.
  • Vendor adoption: Apache Iceberg is widely supported by major platforms and tools, providing seamless integration and long-term ecosystem compatibility.

By transitioning to Iceberg, NI was able to embrace a truly open data platform, providing long-term flexibility, scalability, and interoperability while maintaining a unified source of truth for all analytics and reporting needs.

Challenges faced

Migrating a live production data lake to Iceberg was challenging because of operational complexities and legacy constraints. The data service at NI runs hundreds of Spark and machine learning pipelines, manages thousands of tables, and supports over 400 dashboards—all operating 24/7. Any migration would need to be done without production interruptions; and coordinating such a migration while operations continue seamlessly was daunting.

NI needed to accommodate diverse users with varying requirements and timelines from data engineers to data analysts all the way to data scientists and BI teams.

Adding to the challenge were legacy constraints. Some of the existing tools didn’t fully support Iceberg, so there was a need to maintain Hive-backed tables for compatibility. As NI realized that not all consumers could adopt Iceberg immediately. A plan was required to allow for incremental transitions without downtime or disruption to ongoing operations.

Key pillars for migration

To help ensure a smooth and successful transition, six critical pillars were defined:

  • Support ongoing operations: Maintain uninterrupted compatibility with existing systems and workflows during the migration process.
  • User transparency: Minimize disruption for users by preserving existing table names and access patterns.
  • Gradual consumer migration: Allow consumers to adopt Iceberg at their own pace, avoiding a forced, simultaneous switchover.
  • ETL flexibility: Migrate ETL pipelines to Iceberg without imposing constraints on development or deployment.
  • Cost effectiveness: Minimize storage and compute duplication and overhead during the migration period.
  • Minimize maintenance: Reduce the operational burden of managing dual table formats (Hive and Iceberg) during the transition.

Evaluating traditional migration approaches

Apache Iceberg supports two main approaches for migration: In-place and rewrite-based migration.

In-place migration

How it works: Converts an existing dataset into an Iceberg table without duplicating data by creating Iceberg metadata on top of the existing files while preserving their layout and format.

Advantages:

  • Cost-effective in terms of storage (no data duplication)
  • Simplified implementation
  • Maintains existing table names and locations
  • No data movement and minimal compute requirements, translating into lower cost

Disadvantages:

  • Downtime required: All write operations must be paused during conversion, which was unacceptable in NI cases because data and analytics are considered mission critical and run 24/7
  • No gradual adoption: All consumers must switch to Iceberg simultaneously, increasing the risk of disruption
  • Limited validation: No opportunity to validate data before cutover; rollback requires restoring from backups
  • Technical constraints: Schema evolution during migration can be challenging; data type incompatibilities can halt the entire process

Rewrite-based migration

How it works: Rewrite-based migration in Apache Iceberg involves creating a new Iceberg table by rewriting and reorganizing existing dataset files into Iceberg’s optimized format and structure for improved performance and data management.

Advantages:

  • Zero downtime during migration
  • Supports gradual consumer migration
  • Enables thorough validation
  • Simple rollback mechanism

Disadvantages:

  • Resource overhead: Double storage and compute costs during migration
  • Maintenance complexity: Managing two parallel data pipelines increases operational burden
  • Consistency challenges: Maintaining perfect consistency between the two systems is challenging
  • Performance impact: Increased latency because of dual writes; potential pipeline slowdowns

Why neither option alone was good enough

NI decided that neither option could meet all critical requirements:

  • In-place migration fell short because of unacceptable downtime and lack of support for gradual migration.
  • Rewrite-based migration fell short because of prohibitive cost overhead and complex operational management.

This analysis led NI to develop a hybrid approach that combines the advantages of both methods while mitigating and minimizing limitations.

The hybrid solution

The hybrid migration strategy was designed around five foundational elements, using AWS analytical services for orchestration, processing, and state management.

  1. Hive-to-Iceberg CDC: Automatically synchronize Hive tables with Iceberg using a custom change data capture (CDC) process to support existing consumers. Unlike traditional CDC focusing on row-level changes, the process was done at the partition-level to preserve Hive’s behavior of updating tables by overwriting partitions. This helps ensure that data consistency is maintained between Hive and Iceberg without logic changes at the migration phase, making sure that the same data exists on both tables.
  2. Continuous schema synchronization: Schema evolution during the migration introduced maintenance challenges. Automated schema sync processes compared Hive and Iceberg schemas, reconciling differences while maintaining type compatibility.
  3. Iceberg-to-Hive reverse CDC: To enable the data team to transition extract, transform, and load (ETL) jobs to write directly to Iceberg while maintaining compatibility with existing Hive-based processes not yet migrated, a reverse CDC from Iceberg to Hive was implemented. This allowed ETLs to write to Iceberg while maintaining Hive tables for downstream processes that had not yet migrated and still relied on them during the migration period.
  4. Alias management in Snowflake: Snowflake aliases made sure that Iceberg tables retained their original names, making the transition transparent to users. This approach minimized reconfiguration efforts across dependent teams and workflows.
  5. Table replacement: Swap production tables while retaining original names, completing the migration.

Technical deep dive

The migration to from Hive to Iceberg was constructed of several steps:

1. Hive-to-Iceberg CDC pipeline

Objective: Keep Hive and Iceberg tables synchronized without duplicating effort.

The preceding figure demonstrates how every partition written to the Hive table is automatically and transparently copied to the Iceberg table using a CDC process. This process makes sure that both tables are synchronized, enabling a seamless and incremental migration without disrupting downstream systems. NI chose partition-level synchronization because the legacy Hive ETL jobs already wrote updates by overwriting entire partitions and updating the partition location. Adopting that same approach in the CDC pipeline helped ensure that it remained consistent with how data was originally managed, making the migration smoother and avoiding the need to rework row-level logic.

Implementation:

  • To keep Hive and Iceberg tables synchronized without duplicating effort, a streamlined pipeline was implemented. Whenever partitions in Hive tables are updated, the AWS Glue Catalog emits events such as UpdatePartition. Amazon EventBridge captured these events, filtered them for the relevant databases and tables according to the event bridge rule, and triggered an AWS Lambda This function parsed the event metadata and sent the partition updates to an Apache Kafka topic.
  • A Spark job running on Amazon EMR consumed the messages from Kafka, which contained the updated partition details from the Data Catalog events. Using that event metadata, the Spark job queried the relevant Hive table, and wrote it to Iceberg table in Amazon S3 using the Spark Iceberg overwritePartitions API, as shown in the following example:
{
   "id":"10397e54-c049-fc7b-76c8-59e148c7cbfc",
   "detail-type":"Glue Data Catalog Table State Change",
   "source":"aws.glue",
   "time":"2024-10-27T17:16:21Z",
   "region":"us-east-1",
   "detail":{
      "databaseName":"dlk_visitor_funnel_dwh_production",
      "changedPartitions":[
         "2024-10-27"
      ],
      "typeOfChange":"UpdatePartition",
      "tableName":"fact_events"
   }
}
  • By targeting only modified partitions, the pipeline (shown in the following figure) significantly reduced the need for costly full-table rewrites. Iceberg’s robust metadata layers, including snapshots and manifest files, were seamlessly updated to capture these changes, providing efficient and accurate synchronization between Hive and Iceberg tables.

2. Iceberg-to-Hive reverse CDC pipeline

Objective: Support Hive consumers while allowing ETL pipelines to transition to Iceberg.

BDB4681-arch4

The preceding figure shows the reverse process, where every partition written to the Iceberg table is automatically and transparently copied to the Hive table using a CDC mechanism. This process helps ensure synchronization between the two systems, enabling seamless data updates for legacy systems that still rely on Hive while transitioning to Iceberg.

Implementation:

Synchronizing data from Iceberg tables back to Hive tables presented a different challenge. Unlike Hive tables, Data Catalog doesn’t track partition updates for Iceberg tables because partitions in Iceberg are managed internally and not within the catalog. This meant NI couldn’t rely on Glue Catalog events to detect partition changes.

To address this, NI implemented a solution similar to the previous flow but adapted to Iceberg’s architecture. Apache Spark was used to query Iceberg’s metadata tables—specifically the snapshots and entries tables—to identify the partitions modified since the last synchronization. The query used was:

SELECT e.data_file.partition, MAX(s.committed_at) AS last_modified_time 
FROM $target_table.snapshots JOIN $target_table.entries e ON s.snapshot_id = e.snapshot_id 
WHERE s.committed_at &amp;gt; '$last_sync_time' 
GROUP BY e.data_file.partition;

This query returned only the partitions that had been updated since the last synchronization, enabling it to focus exclusively on the changed data. Using this information, similar to the earlier process, a Spark job retrieved the updated partitions from Iceberg and wrote them back to the corresponding Hive table, providing seamless synchronization between both tables.

3. Continuous schema synchronization

Objective: Automate schema updates to maintain consistency across Hive and Iceberg.

BDB4681-arch5

The preceding figure shows how the automatic schema sync process helps ensure consistency between Hive and Iceberg tables schemas by automatically synchronizing schema changes. In this example adding the Channel column, minimizing manual work and double maintenance during the extended migration period.

 Implementation:

To handle schema changes between Hive and Iceberg, a process was implemented to detect and reconcile differences automatically. When a schema change happens in a Hive table, Data Catalog emits an UpdateTable event. This event triggers a Lambda function (routed through EventBridge), which retrieves the updated schema from Data Catalog for the Hive table and compares it to the Iceberg schema. It’s important to call out that in NI’s setup, schema changes originate from Hive because the Iceberg table is hidden behind aliases across the system. Because Iceberg is primarily used for Snowflake, a one-way sync from Hive to Iceberg is sufficient. As a result, there is no mechanism to detect or handle schema changes made directly in Iceberg, because they aren’t needed in the current workflow.

During the schema reconciliation (shown in the following figure), data types are normalized to help ensure compatibility—for example, converting Hive’s VARCHAR to Iceberg’s STRING. Any new fields or type changes are validated and applied to the Iceberg schema using a Spark job running on Amazon EMR. Amazon DynamoDB stores schema synchronization checkpoints which allow tracking changes over time and maintain consistency between the Hive and Iceberg schemas.

BDB4681-arch6

By automating this schema synchronization, maintenance overhead was significantly reduced and freed developers from manually keeping schemas in sync, making the long migration period significantly more manageable.

The preceding figure depicts an automated workflow to maintain schema consistency between Hive and Iceberg tables. AWS Glue captures table state change events from Hive, which trigger an EventBridge event. The event invokes a Lambda function that fetches metadata from DynamoDB and compares schemas fetched from AWS Glue for both Hive and Iceberg tables. If a mismatch is detected, the schema in Iceberg is updated to help ensure alignment, minimizing manual intervention and supporting smooth operation during the migration.

4. Alias management in Snowflake

Objective: Enable Snowflake consumers to adopt Iceberg without changing query references.

The preceding figure shows how Snowflake aliases enable seamless migration by mapping queries like SELECT platform, COUNT(clickouts) FROM funnel.clickouts to Iceberg tables in the Glue Catalog. Even with suffixes added during the Iceberg migration, existing queries and workflows remain unchanged, minimizing disruption for BI tools and analysts.

Implementation:

To help ensure a seamless experience for BI tools and analysts during the migration, Snowflake aliases were used to map external tables to the Iceberg metadata stored in Data Catalog. By assigning aliases that matched the original Hive table names, existing queries and reports were preserved without interruption. For example, an external table was created in Snowflake and aliased it to the original table name, as shown in the following query:

CREATE OR REPLACE ICEBERG TABLE dlk_visitor_funnel_dwh_production.aggregated_cost 
EXTERNAL_VOLUME = 's3_dlk_visitor_funnel_dwh_production_iceberg_migration' 
CATALOG = 'glue_dlk_visitor_funnel_dwh_production_iceberg_migration' 
CATALOG_TABLE_NAME = 'aggregated_cost'; 
ALTER ICEBERG TABLE dlk_visitor_funnel_dwh_production.aggregated_cost REFRESH;

When migration was completed, a simple change back to the alias was done to point to the new location or schema, making the transition seamless and minimizing any disruption to user workflows.

5. Table replacement

Objective: When all ETLs and related data workflows were successfully transitioned to use Apache Iceberg’s capabilities, and everything was functioning correctly with the synchronization flow, it was time to move on to the final phase of the migration. The primary objective was to maintain the original table names, avoiding the use of any prefixes like those employed in the earlier, intermediate migration steps. This helped ensure that the configuration remained tidy and free from unnecessary naming complications.

The preceding figure shows the table replacement to complete the migration, where Hive on Amazon EMR was used to register Parquet files as Iceberg tables while preserving original table names and avoiding data duplication, helping to ensure a seamless and tidy migration.

Implementation:

One of the challenges was that renaming tables isn’t possible within AWS Glue, which prevents the use of a straightforward renaming approach for the existing synchronization flow tables. In addition, AWS Glue doesn’t support the Migrate procedure, which creates Iceberg metadata on top of the existing data file while preserving the original table name. The strategy to overcome this limitation was to use a Hive metastore on an Amazon EMR cluster. By using Hive on Amazon EMR, NI was able to create the final tables with their original names because it operates in a separate metastore environment, giving the flexibility to define any required schema and table names without interference.

The add_files procedure was used to methodically register all the existing Parquet files, thus constructing all necessary metadata within Hive. This was a crucial step, because it helped ensure that all data files were appropriately cataloged and linked within the metastore.

The preceding figure shows the transition of a production table to Iceberg by using the add_files procedure to register existing Parquet files and create Iceberg metadata. This helped ensure a smooth migration while preserving the original data and avoiding duplication.

This setup allowed the use of existing Parquet files without duplicating data, thus saving resources. Although the sync flow used separate buckets for the final architecture, NI chose to maintain the original buckets and cleaned the intermediate files. This resulted in a different folder structure on Amazon S3. The historical data had subfolders for each partition under the root table directory, while the new Iceberg data organizes subfolders within a data folder. This difference was acceptable to avoid data duplication and preserve the original Amazon S3 buckets.

Technical recap

The AWS Glue Data Catalog served as the primary source of truth for schema and table updates, with Amazon EventBridge capturing Data Catalog events to trigger synchronization workflows. AWS Lambda parsed event metadata and managed schema synchronization, while Apache Kafka buffered events for real-time processing. Apache Spark on Amazon EMR handled data transformations and incremental updates, and Amazon DynamoDB maintained state, including synchronization checkpoints and table mappings. Finally, Snowflake seamlessly consumed Iceberg tables via aliases without disrupting existing workflows.

Migration outcome

The migration was completed with zero downtime; continuous operations were maintained throughout the migration, supporting hundreds of pipelines and dashboards without interruption. The migration was done with a cost optimized mindset with incremental updates and partition-level synchronization that minimized the usage of compute and storage resources. Lastly, NI Established a modern, vendor-neutral platform that enables scaling their evolving analytics and machine learning needs. It enables seamless integration with multiple compute and query engines, supporting flexibility and further innovation.

Conclusion

Natural intelligence migration to Apache Iceberg was a pivotal step in modernizing the company’s data infrastructure. By adopting a hybrid strategy and using the power of event-driven architectures, NI helped ensure a seamless transition that balanced innovation with operational stability. The journey underscored the importance of careful planning, understanding the data ecosystem, and focusing on an organization-first approach.

Above all, business was kept in focus and continuity prioritized the user experience. By doing so, NI unlocked the flexibility and scalability of their data lake while minimizing disruption, allowing teams to use cutting-edge analytics capabilities, positioning the company at the forefront of modern data management and readiness for the future.

If you’re considering an Apache Iceberg migration or facing similar data infrastructure challenges, we encourage you to explore the possibilities. Embrace open formats, use automation, and design with your organization’s unique needs in mind. The journey might be complex, but the rewards in scalability, flexibility, and innovation are well worth the effort. You can use the AWS prescriptive guide to help learn more about how to best use Apache Iceberg for your organization


About the Authors

Yonatan DolanYonatan Dolan is a Principal Analytics Specialist at Amazon Web Services. Yonatan is an Apache Iceberg evangelist.

Haya Stern is a Senior Director of Data at Natural Intelligence. She leads the development of NI’s large-scale data platform, with a focus on enabling analytics, streamlining data workflows, and improving dev efficiency. In the past year, she led the successful migration from the previous data architecture to a modern lake house based on Apache Iceberg and Snowflake.

Zion Rubin is a Data Architect at Natural Intelligence with ten years of experience architecting large‑scale big‑data platforms, now focused on developing intelligent agent systems that turn complex data into real‑time business insight.

Michał Urbanowicz is a Cloud Data Engineer at Natural Intelligence with expertise in migrating data warehouses and implementing robust retention, cleanup, and monitoring processes to ensure scalability and reliability. He also develops automations that streamline and support campaign management operations in cloud-based environments.

Amazon SageMaker Lakehouse now supports attribute-based access control

Post Syndicated from Sandeep Adwankar original https://aws.amazon.com/blogs/big-data/amazon-sagemaker-lakehouse-now-supports-attribute-based-access-control/

Amazon SageMaker Lakehouse now supports attribute-based access control (ABAC) with AWS Lake Formation, using AWS Identity and Access Management (IAM) principals and session tags to simplify data access, grant creation, and maintenance. With ABAC, you can manage business attributes associated with user identities and enable organizations to create dynamic access control policies that adapt to the specific context.

SageMaker Lakehouse is a unified, open, and secure data lakehouse that now supports ABAC to provide unified access to general purpose Amazon S3 buckets, Amazon S3 Tables, Amazon Redshift data warehouses, and data sources such as Amazon DynamoDB or PostgreSQL. You can then query, analyze, and join the data using Redshift, Amazon Athena, Amazon EMR, and AWS Glue. You can secure and centrally manage your data in the lakehouse by defining fine-grained permissions with Lake Formation that are consistently applied across all analytics and machine learning(ML) tools and engines. In addition to its support for role-based and tag-based access control, Lake Formation extends support to attribute-based access to simplify data access management for SageMaker Lakehouse, with the following benefits:

  • Flexibility – ABAC policies are flexible and can be updated to meet changing business needs. Instead of creating new rigid roles, ABAC systems allow access rules to be modified by simply changing user or resource attributes.
  • Efficiency – Managing a smaller number of roles and policies is more straightforward than managing a large number of roles, reducing administrative overhead.
  • Scalability – ABAC systems are more scalable for larger enterprises because they can handle a large number of users and resources without requiring a large number of roles.

Attribute-based access control overview

Previously, within SageMaker Lakehouse, Lake Formation granted access to resources based on the identity of a requesting user. Our customers were requesting the capability to express the full complexity required for access control rules in organizations. ABAC allows for more flexible and nuanced access policies that can better reflect real-world needs. Organizations can now grant permissions on a resource based on user attribute and is context-driven. This allows administrators to grant permissions on a resource with conditions that specify user attribute keys and values. IAM principals with matching IAM or session tag key-value pairs will gain access to the resource.

Instead of creating a separate role for each team member’s access to a specific project, you can set up ABAC policies to grant access based on attributes like membership and user role, reducing the number of roles required. For instance, without ABAC, a company with an account manager role that covers five different geographical territories needs to create five different IAM roles and grant data access for only the specific territory for which the IAM role is meant. With ABAC, they can simply add those territory attributes as keys/values to the principal tag and provide data access grants based on those attributes. If the value of the attribute for a user changes, access to the dataset will automatically be invalidated.

With ABAC, you can use attributes such as department or country and use IAM or sessions tags to determine access to data, making it more straightforward to create and maintain data access grants. Administrators can define fine-grained access permissions with ABAC to limit access to databases, tables, rows, columns, or table cells.

In this post, we demonstrate how to get started with ABAC in SageMaker Lakehouse and use with various analytics services.

Solution overview

To illustrate the solution, we are going to consider a fictional company called Example Retail Corp. Example Retail’s leadership is interested in analyzing sales data in Amazon S3 to determine in-demand products, understand customer behavior, and identify trends, for better decision-making and increased profitability. The sales department sets up a team for sales analysis with the following data access requirements:

  • All data analysts in the Sales department in the US get access to only sales-specific data in only US regions
  • All BI analysts in the Sales department have full access to data in only US regions
  • All scientists in the Sales department get access to only sales-specific data across all regions
  • Anyone outside of Sales department have no access to sales data

For this post, we consider the database salesdb, which contains the store_sales table that has store sales details. The table store_sales has the following schema.

To demonstrate the product sales analysis use case, we will consider the following personas from the Example Retail Corp:

  • Ava is a data administrator in Example Retail Corp who is responsible for supporting team members with specific data permission policies
  • Alice is a data analyst who should be able to access sales specific US store data to perform product sales analysis
  • Bob is a BI analyst who should be able to access all data from US store sales to generate reports
  • Charlie is a data scientist who should be able to access sales specific across all regions to explore and find patterns for trend analysis

Ava decides to use SageMaker Lakehouse to unify data across various data sources while setting up fine-grained access control using ABAC. Alice is excited about this decision as she can now build daily reports using her expertise with Athena. Bob now knows that he can quickly build Amazon QuickSight dashboards with queries that are optimized using Redshift’s cost-based optimizer. Charlie, being an open source Apache Spark contributor, is excited that he can build Spark based processing with Amazon EMR to build ML forecasting models.

Ava defines the user attributes as static IAM tags that could also include attributes stored in the identity provider (IdP) or as session tags dynamically to represent the user metadata. These tags are assigned to IAM users or roles and can be used to define or restrict access to specific resources or data. For more details, refer to Tags for AWS Identity and Access Management resources and Pass session tags in AWS STS.

For this post, Ava assigns users with static IAM tags to represent the user attributes, including their department membership, Region assignment, and current role relationship. The following table summarizes the tags that represent user attributes and user assignment.

User Persona Attributes Access
Alice Data Analyst Department=sales
Region=US
Role=Analyst
Sales specific data in US and no access to customer data
Bob BI Analyst Department=sales
Region=US
Role=BIAnalyst
All data in US
Charlie Data Scientist Department=sales
Region=ALL
Role=Scientist
Sales specific data in All regions and no access to customer data

Ava then defines access control policies in Lake Formation that grant or restrict access to certain resources based on predefined criteria (user attributes defined using IAM tags) being satisfied. This allows for flexible and context-aware security policies where access privileges can be adjusted dynamically by modifying the user attribute assignment without changing the policy rules. The following table summarizes the policies in the Sales department.

Access User Attributes Policy
All analysts (including Alice) in US get access to sales specific data in US regions Department=sales
Region=US
Role=Analyst
Table: store_sales (store_id, transaction_date, product_name, country, sales_price, quantity columns)
Row filter: country='US'
All BI analysts (including Bob) in US get access to all data in US regions Department=sales
Region=US
Role=BIAnalyst
Table: store_sales (all columns)
Row filter: country='US'
All scientists (including Charlie) get access to sales-specific data from all regions Department=sales
Region=ALL
Role=Scientist
Table: store_sales (all rows)
Column filter: store_id, transaction_date, product_name, country, sales_price,quantity

The following diagram illustrates the solution architecture.

Implementing this solution consists of the following high-level steps. For Example Retail, Ava as a data Administrator performs these steps:

  1. Define the user attributes and assign them to the principal.
  2. Grant permission on the resources (database and table) to the principal based on user attributes.
  3. Verify the permissions by querying the data using various analytics services.

Prerequisites

To follow the steps in this post, you must complete the following prerequisites:

  1. AWS account with access to the following AWS services:
    • Amazon S3
    • AWS Lake Formation and AWS Glue Data Catalog
    • Amazon Redshift
    • Amazon Athena
    • Amazon EMR
    • AWS Identity and Access Management (IAM)
  1. Set up an admin user for Ava. For instructions, see Create a user with administrative access.
  2. Setup S3 bucket for uploading script.
  3. Set up a data lake admin. For instructions, see Create a data lake administrator.
  4. Create IAM user named Alice and attach permissions for Athena access. For instructions, refer to Data analyst permissions.
  5. Create IAM user Bob and attach permissions for Redshift access.
  6. Create IAM user Charlie and attach permissions for EMR Serverless access.
  7. Create job runtime role: scientist_role and that will be used by Charlie. For instruction refer to: Job runtime roles for Amazon EMR Serverless
  8. Setup EMR Serverless application with Lake Formation enabled. For instruction refer to: Using EMR Serverless with AWS Lake Formation for fine-grained access control
  9. Have an existing AWS Glue database or table and Amazon Simple Storage Service (Amazon) S3 bucket that holds the table data. For this post, we use salesdb as our database, store_sales as our table, and data is stored in an S3 bucket.

Define attributes for the IAM principals Alice, Bob, Charlie

Ava completes the following steps to define the attributes for the IAM principal:

  1. Log in as an admin user and navigate to the IAM console.
  2. Choose Users under Access management in the navigation pane and search for the user Alice.
  3. Choose the user and choose the Tags tab.
  4. Choose Add new tag and provide the following key pairs:
    • Key: Department and value: sales
    • Key: Region and value: US
    • Key: Role and value: Analyst
  5. Choose Save changes.
  6. Repeat the process for the user Bob and provide the following key pairs:
    • Key: Department and value: sales
    • Key: Region and value: US
    • Key: Role and value: BIAnalyst
  7. Repeat the process for the user Charlie and IAM role scientist_role and provide the following key pairs:
    • Key: Department and value: sales
    • Key: Region and value: ALL
    • Key: Role and value: Scientist

Grant permissions to Alice, Bob, Charlie using ABAC

Ava now grants database and table permissions to users with ABAC.

Grant database permissions

Complete the following steps:

  1. Ava logs in as data lake admin and navigate to the Lake Formation console.
  2. In the navigation pane, under Permissions, choose Data lake permissions.
  3. Choose Grant.
  4. On the Grant permissions page, choose Principals by attribute.
  5. Specify the following attributes:
    • Key: Department  and value: sales
    • Key: Role and value: Analyst,Scientist
  6. Review the resulting policy expression.
  7. For Permission scope, select This account.
  8. Next, choose the catalog resources to grant access:
    • For Catalogs, enter the account ID.
    • For Databases, enter salesdb.
  9. For Database permissions, select Describe.
  10. Choose Grant.

Ava now verifies the database permission by navigating to the Databases tab under the Data Catalog and searching for salesdb. Select salesdb and choose View under Actions.

Grant table permissions to Alice

Complete the following steps to create a data filter to view sales specific columns in store_sales records whose country=US:

  1. On the Lake Formation console, choose Data filters under Data Catalog in the navigation pane.
  2. Choose Create new filter.
  3. Provide the data filter name as us_sales_salesonlydata.
  4. For Target catalog, enter the account ID.
  5. For Target database, choose salesdb.
  6. For Target table, choose store_sales.
  7. For column-level access, choose Include columns: store_id, item_code, transaction_date, product_name, country, sales_price, and quantity.
  8. For Row-level access, choose Filter rows and enter the row filter country='US'.
  9. Choose Create data filter.
  1. On the Grant permissions page, choose Principals by attribute.
  2. Specify the attributes:
    • Key: Department and value: sales
    • Key: Role as value: Analyst
    • Key: Region and value: US
  3. Review the resulting policy expression.
  4. For Permission scope, select This account.
  5. Choose the catalog resources to grant access:
    • Catalogs: Account ID
    • Databases: salesdb
    • Table: store_sales
    • Data filters: us_sales
  6. For Data filter permissions, select Select.
  7. Choose Grant.

Grant table permissions to Bob

Complete the following steps to create a data filter to view only store_sales records whose country=US:

  1. On the Lake Formation console, choose Data filters under Data Catalog in the navigation pane.
  2. Choose Create new filter.
  3. Provide the data filter name as us_sales.
  4. For Target catalog, enter the account ID.
  5. For Target database, choose salesdb.
  6. For Target table, choose store_sales.
  7. Leave Column-level access as Access to all columns.
  8. For Row-level access, enter the row filter country='US'.
  9. Choose Create data filter.

Complete the following steps to grant table permissions to Bob:

  1. On the Grant permissions page, choose Principals by attribute.
  2. Specify the attributes:
    • Key: Department and value: sales
    • Key: Role as value: BIAnalyst
    • Key: Region and value: US
  3. Review the resulting policy expression.
  4. For Permission scope, select This account.
  5. Choose the catalog resources to grant access:
    • Catalogs: Account ID
    • Databases: salesdb
    • Table: store_sales
  6. For Data filter permissions, select Select.
  7. Choose Grant.

Grant table permissions to Charlie

Complete the following steps to grant table permissions to Charlie:

  1. On the Grant permissions page, choose Principals by attribute.
  2. Specify the attributes:
    1. Key: Department and value: sales
    2. Key: Role as value: Scientist
    3. Key: Region and value: ALL
  3. Review the resulting policy expression.
  4. For Permission scope, select This account
  5. Choose the catalog resources to grant access:
    1. Catalogs: Account ID
    2. Databases: salesdb
    3. Table: store_sales
  6. For Table permissions, select Select.
  7. For Data permissions, specify the following columns: store_id, transaction_date, product_name, country, sales_price, and quantity.
  8. Choose Grant.

Alice now verifies the table permission by navigating to the Tables tab under the Data Catalog and searching for store_sales. Select store_sales and choose View under Actions. The following screenshots show the details for both sets of permissions.

Data Analyst uses Athena for building daily sales reports

Alice, the data analyst logs in to the Athena console and run the following query:

select * from "salesdb"."store_sales" limit 5

Alice has the user attributes as Department=sales, Role=Analyst, Region=US, and this attribute combination allows her access to US sales data to specific sales only column, without access to customer data as shown in the following screenshot.

BI Analyst uses Redshift for building sales dashboards

Bob, the BI Analyst, logs in to the Redshift console and run the following query:

select * from "salesdb"."store_sales" limit 10

Bob has the user attributes Department=sales, Role=BIAnalyst, Region=US, and this attribute combination allows him access to all columns including customer data for US sales data.

Data Scientist uses Amazon EMR to process sales data

Finally, Charlie logs in to the EMR console and submit the EMR job with runtime role as scientist_role. Charlie uses  the script sales_analysis.py that is uploaded to s3 bucket created for the script. He chooses the EMR Serverless application created with Lake Formation enabled.

Charlie submits batch job runs by choosing the following values:

  • Name: sales_analysis_Charlie
  • Runtime_role: scientist_role
  • Script location: <s3_script_path>/sales_analysis.py
  • For spark properties, provide key as spark.emr-serverless.lakeformation.enabled and value as true.
  • Additional configurations: Under Metastore configuration select Use AWS Glue Data Catalog as metastore. Charlie keeps rest of the configuration as default.

Once the job run is completed, Charlie can view the output by selecting stdout under Driver log files.

Charlie uses scientist_role as job runtime role with the attributes Department=sales, Role=Scientist, Region=ALL, and this attribute combination allows him access to select columns of all sales data.

Clean up

Complete the following steps to delete the resources you created to avoid unexpected costs:

  1. Delete the IAM users created.
  2. Delete the AWS Glue database and table resources created for the post, if any.
  3. Delete the Athena, Redshift and EMR resources created for the post.

Conclusion

In this post, we showcased how you can use SageMaker Lakehouse attribute-based access control, using IAM principals and session tags to simplify data access, grant creation, and maintenance. With attribute-based access control, you can manage permissions using dynamic business attributes associated with user identities and secure your data in the lakehouse by defining fine-grained permissions in the Lake Formation that are enforced across analytics and ML tools and engines.

For more information, refer to documentation. We encourage you to try out the SageMaker Lakehouse with ABAC and share your feedback with us.


About the authors

Sandeep Adwankar is a Senior Product Manager at AWS. Based in the California Bay Area, he works with customers around the globe to translate business and technical requirements into products that enable customers to improve how they manage, secure, and access data.

Srividya Parthasarathy is a Senior Big Data Architect on the AWS Lake Formation team. She enjoys building data mesh solutions and sharing them with the community.

Accelerate your analytics with Amazon S3 Tables and Amazon SageMaker Lakehouse

Post Syndicated from Sandeep Adwankar original https://aws.amazon.com/blogs/big-data/accelerate-your-analytics-with-amazon-s3-tables-and-amazon-sagemaker-lakehouse/

Amazon SageMaker Lakehouse is a unified, open, and secure data lakehouse that now seamlessly integrates with Amazon S3 Tables, the first cloud object store with built-in Apache Iceberg support. With this integration, SageMaker Lakehouse provides unified access to S3 Tables, general purpose Amazon S3 buckets, Amazon Redshift data warehouses, and data sources such as Amazon DynamoDB or PostgreSQL. You can then query, analyze, and join the data using Redshift, Amazon Athena, Amazon EMR, and AWS Glue. In addition to your familiar AWS services, you can access and query your data in-place with your choice of Iceberg-compatible tools and engines, providing you the flexibility to use SQL or Spark-based tools and collaborate on this data the way you like. You can secure and centrally manage your data in the lakehouse by defining fine-grained permissions with AWS Lake Formation that are consistently applied across all analytics and machine learning(ML) tools and engines.

Organizations are becoming increasingly data driven, and as data becomes a differentiator in business, organizations need faster access to all their data in all locations, using preferred engines to support rapidly expanding analytics and AI/ML use cases. Let’s take an example of a retail company that started by storing their customer sales and churn data in their data warehouse for business intelligence reports. With massive growth in business, they need to manage a variety of data sources as well as exponential growth in data volume. The company builds a data lake using Apache Iceberg to store new data such as customer reviews and social media interactions.

This enables them to cater to their end customers with new personalized marketing campaigns and understand its impact on sales and churn. However, data distributed across data lakes and warehouses limits their ability to move quickly, as it may require them to set up specialized connectors, manage multiple access policies, and often resort to copying data, that can increase cost in both managing the separate datasets as well as redundant data stored. SageMaker Lakehouse addresses these challenges by providing secure and centralized management of data in data lakes, data warehouses, and data sources such as MySQL, and SQL Server by defining fine-grained permissions that are consistently applied across data in all analytics engines.

In this post, we guide you how to use various analytics services using the integration of SageMaker Lakehouse with S3 Tables. We begin by enabling integration of S3 Tables with AWS analytics services. We create S3 Tables and Redshift tables and populate them with data. We then set up SageMaker Unified Studio by creating a company specific domain, new project with users, and fine-grained permissions. This lets us unify data lakes and data warehouses and use them with analytics services such as Athena, Redshift, Glue, and EMR.

Solution overview

To illustrate the solution, we are going to consider a fictional company called Example Retail Corp. Example Retail’s leadership is interested in understanding customer and business insights across thousands of customer touchpoints for millions of their customers that will help them build sales, marketing, and investment plans. Leadership wants to conduct an analysis across all their data to identify at-risk customers, understand impact of personalized marketing campaigns on customer churn, and develop targeted retention and sales strategies.

Alice is a data administrator in Example Retail Corp who has embarked on an initiative to consolidate customer information from multiple touchpoints, including social media, sales, and support requests. She decides to use S3 Tables with Iceberg transactional capability to achieve scalability as updates are streamed across billions of customer interactions, while providing same durability, availability, and performance characteristics that S3 is known for. Alice already has built a large warehouse with Redshift, which contains historical and current data about sales, customers prospects, and churn information.

Alice supports an extended team of developers, engineers, and data scientists who require access to the data environment to develop business insights, dashboards, ML models, and knowledge bases. This team includes:

Bob, a data analyst who needs to access to S3 Tables and warehouse data to automate building customer interactions growth and churn across various customer touchpoints for daily reports sent to leadership.

Charlie, a Business Intelligence analyst who is tasked to build interactive dashboards for funnel of customer prospects and their conversions across multiple touchpoints and make those available to thousands of Sales team members.

Doug, a data engineer responsible for building ML forecasting models for sales growth using the pipeline and/or customer conversion across multiple touchpoints and make those available to finance and planning teams.

Alice decides to use SageMaker Lakehouse to unify data across S3 Tables and Redshift data warehouse. Bob is excited about this decision as he can now build daily reports using his expertise with Athena. Charlie now knows that he can quickly build Amazon QuickSight dashboards with queries that are optimized using Redshift’s cost-based optimizer. Doug, being an open source Apache Spark contributor, is excited that he can build Spark based processing with AWS Glue or Amazon EMR to build ML forecasting models.

The following diagram illustrates the solution architecture.

Implementing this solution consists of the following high-level steps. For Example Retail, Alice as a data Administrator performs these steps:

  1. Create a table bucket. S3 Tables stores Apache Iceberg tables as S3 resources, and customer details are managed in S3 Tables. You can then enable integration with AWS analytics services, which automatically sets up the SageMaker Lakehouse integration so that the tables bucket is shown as a child catalog under the federated s3tablescatalog in the AWS Glue Data Catalog and is registered with AWS Lake Formation for access control. Next, you create a table namespace or database which is a logical construct that you group tables under and create a table using Athena SQL CREATE TABLE statement.
  2. Publish your data warehouse to Glue Data Catalog. Churn data is managed in a Redshift data warehouse, which is published to the Data Catalog as a federated catalog and is available in SageMaker Lakehouse.
  3. Create a SageMaker Unified Studio project. SageMaker Unified Studio integrates with SageMaker Lakehouse and simplifies analytics and AI with a unified experience. Start by creating a domain and adding all users (Bob, Charlie, Doug). Then create a project in the domain, choosing project profile that provisions various resources and the project AWS Identity and Access Management (IAM) role that manages resource access. Alice adds Bob, Charlie, and Doug to the project as members.
  4. Onboard S3 Tables and Redshift tables to SageMaker Unified Studio. To onboard the S3 Tables to the project, in Lake Formation, you grant permission on the resource to the SageMaker Unified Studio project role. This enables the catalog to be discoverable within the lakehouse data explorer for users (Bob, Charlie, and Doug) to start querying tables .SageMaker Lakehouse resources can now be accessed from computes like Athena, Redshift, and Apache Spark based computes like Glue to derive churn analysis insights, with Lake Formation managing the data permissions.

Prerequisites

To follow the steps in this post, you must complete the following prerequisites:

Alice completes the following steps to create the S3 Table bucket for the new data she plans to add/import into an S3 Table.

  1. AWS account with access to the following AWS services:
    • Amazon S3 including S3 Tables
    • Amazon Redshift
    • AWS Identity and Access Management (IAM)
    • Amazon SageMaker Unified Studio
    • AWS Lake Formation and AWS Glue Data Catalog
    • AWS Glue
  2. Create a user with administrative access.
  3. Have access to an IAM role that is a Lake Formation data lake administrator. For instructions, refer to Create a data lake administrator.
  4. Enable AWS IAM Identity Center in the same AWS Region where you want to create your SageMaker Unified Studio domain. Set up your identity provider (IdP) and synchronize identities and groups with AWS IAM Identity Center. For more information, refer to IAM Identity Center Identity source tutorials.
  5. Create a read-only administrator role to discover the Amazon Redshift federated catalogs in the Data Catalog. For instructions, refer to Prerequisites for managing Amazon Redshift namespaces in the AWS Glue Data Catalog.
  6. Create an IAM role named DataTransferRole. For instructions, refer to Prerequisites for managing Amazon Redshift namespaces in the AWS Glue Data Catalog.
  7. Create an Amazon Redshift Serverless namespace called churnwg. For more information, see Get started with Amazon Redshift Serverless data warehouses.

Create a table bucket and enable integration with analytics services

Alice completes the following steps to create the S3 Table bucket for the new data she plans to add/import into an S3 Tables.

Follow the below steps to create a table bucket to enable integration with SageMaker Lakehouse:

  1. Sign in to the S3 console as user created in prerequisite step 2.
  2. Choose Table buckets in the navigation pane and choose Enable integration.
  3. Choose Table buckets in the navigation pane and choose Create table bucket.
  4. For Table bucket name, enter a name such as blog-customer-bucket.
  5. Choose Create table bucket.
  6. Choose Create table with Athena.
  7. Select Create a namespace and provide a namespace (for example, customernamespace).
  8. Choose Create namespace.
  9. Choose Create table with Athena.
  10. On the Athena console, run the following SQL script to create a table:
    CREATE TABLE customer (
      `c_salutation` string, 
      `c_preferred_cust_flag` string, 
      `c_first_sales_date_sk` int, 
      `c_customer_sk` int, 
      `c_login` string, 
      `c_current_cdemo_sk` int, 
      `c_first_name` string, 
      `c_current_hdemo_sk` int, 
      `c_current_addr_sk` int, 
      `c_last_name` string, 
      `c_customer_id` string, 
      `c_last_review_date_sk` int, 
      `c_birth_month` int, 
      `c_birth_country` string, 
      `c_birth_year` int, 
      `c_birth_day` int, 
      `c_first_shipto_date_sk` int, 
      `c_email_address` string)
      TBLPROPERTIES ('table_type' = 'iceberg')
      
    
    INSERT INTO customer VALUES
    ('Dr.','N',2452077,13251813,'Y',1381546,'Joyce',2645,2255449,'Deaton','AAAAAAAAFOEDKMAA',2452543,1,'GREECE',1987,29,2250667,'[email protected]'),
    ('Dr.','N',2450637,12755125,'Y',1581546,'Daniel',9745,4922716,'Dow','AAAAAAAAFLAKCMAA',2432545,1,'INDIA',1952,3,2450667,'[email protected]'),
    ('Dr.','N',2452342,26009249,'Y',1581536,'Marie',8734,1331639,'Lange','AAAAAAAABKONMIBA',2455549,1,'CANADA',1934,5,2472372,'[email protected]'),
    ('Dr.','N',2452342,3270685,'Y',1827661,'Wesley',1548,11108235,'Harris','AAAAAAAANBIOBDAA',2452548,1,'ROME',1986,13,2450667,'[email protected]'),
    ('Dr.','N',2452342,29033279,'Y',1581536,'Alexandar',8262,8059919,'Salyer','AAAAAAAAPDDALLBA',2952543,1,'SWISS',1980,6,2650667,'[email protected]'),
    ('Miss','N',2452342,6520539,'Y',3581536,'Jerry',1874,36370,'Tracy','AAAAAAAALNOHDGAA',2452385,1,'ITALY',1957,8,2450667,'[email protected]')

This is just an example of adding a few rows to the table, but generally for production use cases, customers use engines such as Spark to add data to the table.

S3 Tables customer is now created, populated with data and integrated with SageMaker Lakehouse.

Set up Redshift tables and publish to the Data Catalog

Alice completes the following steps to connect the data in Redshift to be published into the data catalog. We’ll also demonstrate how the Redshift table is created and populated, but in Alice’s case Redshift table already exists with all the historic data on sales revenue.

  1. Sign in to the Redshift endpoint churnwg as an admin user.
  2. Run the following script to create a table under the dev database under the public schema:
    CREATE TABLE customer_churn (
    customer_id BIGINT,
    tenure INT,
    monthly_charges DECIMAL(5,1),
    total_charges DECIMAL(5,1),
    contract_type VARCHAR(100),
    payment_method VARCHAR(100),
    internet_service VARCHAR(100),
    has_phone_service BOOLEAN,
    is_churned BOOLEAN
    );
    
    INSERT INTO customer_churn VALUES
    (10251783, 12, 70.5, 850.0, 'Month-to-Month', 'Credit Card', 'Fiber Optic', true, true),
    (13251813, 36, 55.0, 1980.0, 'One Year', 'Bank Transfer', 'DSL', true, false),
    (12755125, 6, 90.0, 540.0, 'Month-to-Month', 'Mailed Check', 'Fiber Optic', false, true),
    (26009249, 12, 70.5, 850.0, 'One Year', 'Credit Card', 'DSL', true, false),
    (3270685, 36, 55.0, 1980.0, 'One Year', 'Bank Transfer', 'DSL', true, false),
    (29033279, 6, 90.0, 540.0, 'Month-to-Month', 'Mailed Check', 'Fiber Optic', false, true),
    (6520539, 24, 60.0, 1440.0, 'Two Year', 'Electronic Check', 'DSL', true, false);

    This is just an example of adding a few rows to the table, but generally for production use cases, customers use several ways to add data to the table as documented in Loading data in Amazon Redshift.

  3. On the Redshift Serverless console, navigate to the namespace.
  4. On the Action dropdown menu, choose Register with AWS Glue Data Catalog to integrate with SageMaker Lakehouse.
  5. Choose Register.
  6. Sign in to the Lake Formation console as the data lake administrator.
  7. Under Data Catalog in the navigation pane, choose Catalogs and Pending catalog invitations.
  8. Select the pending invitation and choose Approve and create catalog.
  9. Provide a name for the catalog (for example, churn_lakehouse).
  10. Under Access from engines, select Access this catalog from Iceberg-compatible engines and choose DataTransferRole for the IAM role.
  11. Choose Next.
  12. Choose Add permissions.
  13. Under Principals, choose the datalakeadmin role for IAM users and roles, Super user for Catalog permissions, and choose Add.
  14. Choose Create catalog.

Redshift Table customer_churn is now created, populated with data and integrated with SageMaker Lakehouse.

Create a SageMaker Unified Studio domain and project

Alice now sets up SageMaker Unified Studio domain and projects so that she can bring users (Bob, Charlie and Doug) together in the new project.

Complete the following steps to create a SageMaker domain and project using SageMaker Unified Studio:

  1. On the SageMaker Unified Studio console, create a SageMaker Unified Studio domain and project using the All Capabilities profile template. For more details, refer to Setting up Amazon SageMaker Unified Studio. For this post, we create a project named churn_analysis.
  2. Setup AWS Identity center with users Bob, Charlie and Doug, Add them to domain and project.
  3. From SageMaker Unified Studio, navigate to the project overview and on the Project details tab, note the project role Amazon Resource Name (ARN).
  4. Sign in to the IAM console as an admin user.
  5. In the navigation pane, choose Roles.
  6. Search for the project role and add AmazonS3TablesReadOnlyAccess by choosing Add permissions.

SageMaker Unified Studio is now setup with domain, project and users.

Onboard S3 Tables and Redshift tables to the SageMaker Unified Studio project

Alice now configures SageMaker Unified Studio project role for fine-grained access control to determine who on her team gets to access what data sets.

Grant the project role full table access on customer dataset. For that, complete the following steps:

  1. Sign in to the Lake Formation console as the data lake administrator.
  2. In the navigation pane, choose Data lake permissions, then choose Grant.
  3. In the Principals section, for IAM users and roles, choose the project role ARN noted earlier.
  4. In the LF-Tags or catalog resources section, select Named Data Catalog resources:
    • Choose <account_id>:s3tablescatalog/blog-customer-bucket for Catalogs.
    • Choose customernamespace for Databases.
    • Choose customer for Tables.
  5. In the Table permissions section, select Select and Describe for permissions.
  6. Choose Grant.

Now grant the project role access to subset of columns  from customer_churn dataset.

  1. In the navigation pane, choose Data lake permissions, then choose Grant.
  2. In the Principals section, for IAM users and roles, choose the project role ARN noted earlier.
  3. In the LF-Tags or catalog resources section, select Named Data Catalog resources:
    • Choose <account_id>:churn_lakehouse/dev for Catalogs.
    • Choose public for Databases.
    • Choose customer_churn for Tables.
  4. In the Table Permissions section, select Select.
  5. In the Data Permissions section, select Column-based access.
  6. For Choose permission filter, select Include columns and choose customer_id, internet_service, and is_churned.
  7. Choose Grant.

All users in the project churn_analysis in SageMaker Unified Studio are now setup. They have access to all columns in the table and fine-grained access permissions for Redshift table where they have access to only three columns.

Verify data access in SageMaker Unified Studio

Alice can now do a final verification if the data is all available to ensure that each of her team members are set up to access the datasets.

Now you can verify data access for different users in SageMaker Unified Studio.

  1. Sign in to SageMaker Unified Studio as Bob and choose the churn_analysis
  2. Navigate to the Data explorer to view s3tablescatalog and churn_lakehouse under Lakehouse.

Data Analyst uses Athena for analyzing customer churn

Bob, the data analyst can now logs into to the SageMaker Unified Studio, chooses the churn_analysis project and navigates to the Build options and choose Query Editor under Data Analysis & Integration.

Bob chooses the connection as Athena (Lakehouse), the catalog as s3tablescatalog/blog-customer-bucket, and the database as customernamespace. And runs the following SQL to analyze the data for customer churn:

select * from "churn_lakehouse/dev"."public"."customer_churn" a, 
"s3tablescatalog/blog-customer-bucket"."customernamespace"."customer" b
where a.customer_id=b.c_customer_sk limit 10;

Bob can now join the data across S3 Tables and Redshift in Athena and now can proceed to build full SQL analytics capability to automate building customer growth and churn leadership daily reports.

BI Analyst uses Redshift engine for analyzing customer data

Charlie, the BI Analyst can now logs into the SageMaker Unified Studio and chooses the churn_analysis project. He navigates to the Build options and choose Query Editor under Data Analysis & Integration. He chooses the connection as Redshift (Lakehouse), Databases as dev, Schemas as public.

He then runs the follow SQL to perform his specific analysis.

select * from "dev@churn_lakehouse"."public"."customer_churn" a, 
"blog-customer-bucket@s3tablescatalog"."customernamespace"."customer" b
where a.customer_id=b.c_customer_sk limit 10;

Charlie can now further update the SQL query and use it to power QuickSight dashboards that can be shared with Sales team members.

Data engineer uses AWS Glue Spark engine to process customer data

Finally, Doug logs in to SageMaker Unified Studio as Doug and chooses the churn_analysis project to perform his analysis. He navigates to the Build options and choose JupyterLab under IDE & Applications. He downloads the churn_analysis.ipynb notebook and upload it into the explorer. He then runs the cells by selecting compute as project.spark.compatibility.

He runs the following SQL to analyze the data for customer churn:

Doug, now can use Spark SQL and start processing data from both S3 tables and Redshift tables and start  building forecasting models for customer growth and churn

Cleaning up

If you implemented the example and want to remove the resources, complete the following steps:

  1. Clean up S3 Tables resources:
    1. Delete the table.
    2. Delete the namespace in the table bucket.
    3. Delete the table bucket.
  2. Clean up the Redshift data resources:
    1. On the Lake Formation console, choose Catalogs in the navigation pane.
    2. Delete the churn_lakehouse catalog.
  3. Delete SageMaker project, IAM roles, Glue resources, Athena workgroup, S3 buckets created for domain.
  4. Delete SageMaker domain and VPC created for the setup.

Conclusion

In this post, we showed how you can use SageMaker Lakehouse to unify data across S3 Tables and Redshift data warehouses, which can help you build powerful analytics and AI/ML applications on a single copy of data. SageMaker Lakehouse gives you the flexibility to access and query your data in-place with Iceberg-compatible tools and engines. You can secure your data in the lakehouse by defining fine-grained permissions that are enforced across analytics and ML tools and engines.

For more information, refer to Tutorial: Getting started with S3 Tables, S3 Tables integration, and Connecting to the Data Catalog using AWS Glue Iceberg REST endpoint. We encourage you to try out the S3 Tables integration with SageMaker Lakehouse integration and share your feedback with us.


About the authors

Sandeep Adwankar is a Senior Technical Product Manager at AWS. Based in the California Bay Area, he works with customers around the globe to translate business and technical requirements into products that enable customers to improve how they manage, secure, and access data.

Srividya Parthasarathy is a Senior Big Data Architect on the AWS Lake Formation team. She works with the product team and customers to build robust features and solutions for their analytical data platform. She enjoys building data mesh solutions and sharing them with the community.

Aditya Kalyanakrishnan is a Senior Product Manager on the Amazon S3 team at AWS. He enjoys learning from customers about how they use Amazon S3 and helping them scale performance. Adi’s based in Seattle, and in his spare time enjoys hiking and occasionally brewing beer.

Build unified pipelines spanning multiple AWS accounts and Regions with Amazon MWAA

Post Syndicated from Anubhav Gupta original https://aws.amazon.com/blogs/big-data/build-unified-pipelines-spanning-multiple-aws-accounts-and-regions-with-amazon-mwaa/

As organizations scale their Amazon Web Services (AWS) infrastructure, they frequently encounter challenges in orchestrating data and analytics workloads across multiple AWS accounts and AWS Regions. While multi-account strategy is essential for organizational separation and governance, it creates complexity in maintaining secure data pipelines and managing fine-grained permissions particularly when different teams manage resources in separate accounts.

Amazon Managed Workflows for Apache Airflow (Amazon MWAA) is a managed orchestration service for Apache Airflow that you can use to set up and operate data pipelines in the Amazon Cloud at scale. Apache Airflow is an open source tool used to programmatically author, schedule, and monitor sequences of processes and tasks, referred to as workflows. With Amazon MWAA, you can use Apache Airflow to create workflows without having to manage the underlying infrastructure for scalability, availability, and security.

In this blog post, we demonstrate how to use Amazon MWAA for centralized orchestration, while distributing data processing and machine learning tasks across different AWS accounts and Regions for optimal performance and compliance.

Solution overview

Let’s consider an example of a global enterprise with distributed teams spread across different AWS regions. Each team generates and processes valuable data that is often required by other teams for comprehensive insights and streamlined operations. In this post, we consider a scenario where the data processing team sits in one region and the machine learning (ML) team sits in another region and there is a central team that manages the tasks between the two teams.

To address this complex challenge of orchestrating dependent teams across geographic regions, we’ve designed a data pipeline that spans multiple AWS accounts across different AWS Regions and is centrally orchestrated using Amazon MWAA. This design enables seamless data flow between teams, making sure that each team has access to the necessary data from other AWS accounts and Regions while maintaining compliance and operational efficiency.

Here’s a high-level overview of the architecture:

  • Centralized orchestration hub (Account A, us-east-1)
    • Amazon MWAA serves as the central orchestrator, coordinating operations across all regional data pipelines.
  • Regional data pipelines (Account B, two Regions)

This architecture maintains the concept of separate regional operations within Account B, with data processing in AWS Region 1 and ML in AWS Region 2. The central Amazon MWAA instance in Account A orchestrates these operations across AWS Regions, enabling different teams to work with the data they need. It enables scalability, automation, and streamlined data processing and ML workflows across multiple AWS environments.

Architecture Diagram

Prerequisites

 This solution requires two AWS accounts:

  • Account A: Central managed account for the Amazon MWAA environment.
  • Account B: Data processing and ML operations
    • Primary Region: US East (N. Virginia) [us-east-1]: Data processing workloads
    • Secondary Region: US West (Oregon) [us-west-2]: ML workloads

Step 1: Set up Account B (data processing and ML tasks)

Launch Button in us-east-1 and provide Account A as input. This template creates the following three stacks:

  • Stack in us-east-1: Creates the required roles for stackset execution.
  • Second stack in us-east-1: Creates an S3 bucket, S3 folders, and AWS Glue job.
  • Stack in us-west-2: Creates a S3 bucket, S3 folders, Amazon SageMaker Config file, cross-account-role, and AWS Lambda function.

Collect stack outputs: After successful deployment, gather the following output values from the created stacks. These outputs will be used in subsequent steps of the setup process.

  • From the us-east-1 stack:
    • The value of SourceBucketName
  • From the us-west-2 stack:
    • The value of DestinationBucketName
    • The value of CrossAccountRoleArn

 Step 2: Set up Account A (central orchestration)

Launch Button in us-east-1. Provide value of CrossAccountRoleArn from Account B setup as input. This template does the following:

  • Deploys an Amazon MWAA environment
  • Sets up an Amazon MWAA Execution role with a cross-account trust policy.

Step 3: Setting up S3 CRR and bucket policies in Account B

Launch Button in us-east-1 for cross-Region replication of the S3 data-processing bucket in us-east-1 and the ML pipeline bucket in us-west-1. Provide values of SourceBucketName, DestinationBucketName, and AccountAId as input parameters.

This stack should be deployed after completing the Amazon MWAA setup. This sequence is necessary because you need to grant the Amazon MWAA execution role appropriate permissions to access both the source and destination buckets.

Step 4: Implement cross-account, cross-Region orchestration

IAM cross-account role in Account B

The stack in Step 2 created an AWS Identity and Access Management (IAM) role in Account B with a trust relationship that allows the Amazon MWAA execution role from Account A (the central orchestration account) to assume it. Additionally, this role is granted the necessary permissions to access AWS resources in both Regions of Account B.

This setup enables the Amazon MWAA environment in Account A to securely perform actions and access resources across different Regions in Account B, maintaining the principle of least privilege while allowing for flexible, cross-account orchestration.

Airflow connection in Account A

To establish cross-account connections in Amazon MWAA:

Create a connection for us-east-1. Open the Airflow UI and navigate to Admin and then to Connections. Choose the plus (+) icon to add a new connection and enter the following details:

  • Connection ID: Enter aws_crossaccount_role_conn_east1
  • Connection type: Select Amazon Web Services.
  • Extras: Add the cross-account-role and Region name using the following code. Replace <CrossAccountRoleArn> with the cross-account role Amazon Resource Name (ARN) created while setting Account B in Step 1, in Region 2 (us-west-2):
{
"role_arn": "<CrossAccountRoleArn>",
"region_name": "us-east-1"
}

Create a second connection for us-west-2.

  • Connection ID: Enter aws_crossaccount_role_conn_west2
  • Connecton type: Select Amazon Web Services.
  • Extras: Add a CrossAccountRoleArn and Region name using the following code:
{
"role_arn": "<CrossAccountRoleArn>",
"region_name": "us-west-2"
}

By setting up these Airflow connections, Amazon MWAA can securely access resources in both us-east-1 and us-west-2, helping to ensure seamless workflow execution.

Implement cross-account workflows in Account A

Now that your environment is set up with the necessary IAM roles and Airflow connections, you can create data processing and ML workflows that span across accounts and Regions.

DAG 1: Cross-account data processing

Airflow DAG1 Workflow for Data Processing

The directed acyclic graph (DAG) depicted in the preceding figure demonstrates a cross-account data processing workflow using Amazon MWAA and AWS services.

To implement this DAG:

Here’s a description of its key operators:

  • S3KeySensor: This sensor monitors a specified S3 bucket for the presence of a raw data file (raw/ml_train_data.csv). It uses a cross-account AWS connection (aws_crossaccount_role_conn_east1) to access the S3 bucket in a different AWS account. The sensor checks every 60 seconds and times out after 1 hour if the file is not detected.
  • GlueJobOperator: This operator triggers an AWS Glue job (mwaa_glue_raw_to_transform) for data preprocessing. It passes the bucket name as a script argument to the AWS Glue job. Like the S3KeySensor, it uses the cross-account AWS connection to execute the AWS Glue job in the target account.

 DAG 2: Cross-account and cross-Region ML

Airflow DAG2 Workflow for Machine Learning

The DAG in the preceding figure demonstrates a cross-account machine learning workflow using Amazon MWAA and AWS services. It shows Airflow’s flexibility in enabling users to write custom operators for specific use cases, particularly for cross-account operations.

To implement this DAG:

Here’s a description of the custom operators and key components:

  • CrossAccountSageMakerHook: This custom hook extends the SageMakerHook to enable cross-account access. It uses AWS Security Token Service (AWS STS) to assume a role in the target account, enabling seamless interaction with SageMaker across account boundaries.
  • CrossAccountSageMakerTrainingOperator: Building on the CrossAccountSageMakerHook, this operator enables SageMaker training jobs to be executed in a different AWS account. It overrides the default SageMakerTrainingOperator to use the cross-account hook.
  • S3KeySensor: Used to monitor the presence of training data in a specified S3 bucket. These sensors verify that the required data is available before proceeding with the machine learning workflow. It uses a cross-account AWS connection (aws_crossaccount_role_conn_west2) to access the S3 bucket in a different AWS account.
  • SageMakerTrainingOperator: Uses the custom CrossAccountSageMakerTrainingOperator to initiate a SageMaker training job in the target account. The configuration for this job is dynamically loaded from an S3 bucket.
  • LambdaInvokeFunctionOperator: Invokes a Lambda function named dagcleanup after the SageMaker training job completes. This can be used for post-processing or cleanup tasks.

Step 5: Schedule and verify the Airflow DAGs

  1. To schedule the DAGs, copy the Python scripts cross_account_data_processing_dag.py and cross_account_machine_learning_dag.py to the S3 location associated with Amazon MWAA in central Account A. Go to the Airflow environment created in Account A, us-east-1, and locate the S3 bucket link and upload them to the dags folder.
  2. Download data file to the source bucket created in Account B, us-east-1, under raw folder.
  3. Navigate to the Airflow UI.
  4. Locate your DAG in the DAGs tab. The DAG automatically syncs from Amazon S3 to the Airflow UI. Choose the toggle button to enable the DAGs.
  5. Trigger the DAG runs.

DAGs Dashboard

Best practices for cross-account integration

When implementing cross-account, cross-Region workflows with Amazon MWAA, consider the following best practices to help ensure security, efficiency, and maintainability.

  • Secrets management: Use AWS Secrets Manager to securely store and manage sensitive information such as database credentials, API keys, or cross-account role ARNs. Rotate secrets regularly using Secrets Manager automatic rotation. For more information, see Using a secret key in AWS Secrets Manager for an Apache Airflow connection.
  • Networking: Choose the appropriate networking solution (AWS Transit Gateway, VPC Peering, AWS PrivateLink) based on your specific requirements, considering factors such as the number of VPCs, security needs, and scalability requirements. Implement appropriate security groups and network ACLs to control traffic flow between connected networks.
  • IAM role management: Follow the principle of least privilege when creating IAM roles for cross-account access.
  • Error handling and retries: Implement robust error handling in your DAGs to manage cross-account access issues. Use Airflow’s retry mechanisms to handle transient failures in cross-account operations.
  • Managing Python dependencies: Use a requirements.txt file to specify exact versions of required packages. Test your dependencies locally using the Amazon MWAA local runner before deploying to production. For more information, see Amazon MWAA best practices for managing Python dependencies

Clean up

To avoid future charges, remove any resources you created for this solution.

  • Empty the S3 buckets: Manually delete all objects within each bucket, verify they are empty, then delete the buckets themselves.
  • Delete the CloudFormation stacks: Identify and delete the stacks associated with the architecture.
  • Verify resource cleanup: Make sure that Amazon MWAA, AWS Glue, SageMaker, Lambda, and other services are terminated.
  • Remove remaining resources: Delete any manually created IAM roles, policies, or security groups.

Conclusion

By using Airflow connections, custom operators, and features such as Amazon S3 cross-Region replication, you can create a sophisticated workflow that seamlessly operates across multiple AWS accounts and Regions. This approach allows for complex, distributed data processing and machine learning pipelines that can take advantage of resources spread across your entire AWS infrastructure. The combination of cross-account access, cross-Region replication, and custom operators provides a powerful toolkit for building scalable and flexible data workflows. As always, careful planning and adherence to security best practices are crucial when implementing these advanced multi-account, multi-Region architectures.

Ready to tackle your own cross-account orchestration challenges? Test this approach and share your experience in the comments section.


About the authors

Suba Palanisamy is a Senior Technical Account Manager helping customers achieve operational excellence using AWS. Suba is passionate about all things data and analytics. She enjoys traveling with her family and playing board games

Anubhav Gupta is a Solutions Architect at AWS supporting enterprise greenfield customers, focusing on the financial services industry. He has worked with hundreds of customers worldwide building their cloud foundational environments and platforms, architecting new workloads, and creating governance strategy for their cloud environments. In his free time, he enjoys traveling and spending time outdoors

Anusha Pininti is a Solutions Architect guiding enterprise greenfield customers through every stage of their cloud transformation, specializing in data analytics. She supports customers across various industries, helping them achieve their business objectives through cloud-based solutions. In her free time, Anusha loves to travel, spend time with family, and experiment with new dishes

Sriharsh Adari is a Senior Solutions Architect at AWS, where he helps customers work backward from business outcomes to develop innovative solutions on AWS. Over the years, he has helped multiple customers on data platform transformations across industry verticals. His core area of expertise includes technology strategy, data analytics, and data science. In his spare time, he enjoys playing sports, watching TV shows, and playing Tabla

Geetha Penmatsa is a Solutions Architect supporting enterprise greenfield customers through their cloud journey. She helps customers across various industries transform their business with the AWS Cloud. She has a background in data analytics and is specializing in Amazon Connect Cloud contact center to help transform customer experience at scale. Outside work, Geetha loves to travel, ski, hike, and spend time with friends and family