Post Syndicated from Sébastien Stormacq original https://aws.amazon.com/blogs/aws/cloudwatch-evidently/
As a developer, I am excited to announce the availability of Amazon CloudWatch Evidently. This is a new Amazon CloudWatch capability that makes it easy for developers to introduce experiments and feature management in their application code. CloudWatch Evidently may be used for two similar but distinct use-cases: implementing dark launches, also known as feature flags, and A/B testing.
Features flags is a software development technique that lets you enable or disable features without needing to deploy your code. It decouples the feature deployment from the release. Features in your code are deployed in advance of the actual release. They stay hidden behind if-then-else statements. At runtime, your application code queries a remote service. The service decides the percentage of users who are exposed to the new feature. You can also configure the application behavior for some specific customers, your beta testers for example.
When you use feature flags you can deploy new code in advance of your launch. Then, you can progressively introduce a new feature to a fraction of your customers. During the launch, you monitor your technical and business metrics. As long as all goes well, you may increase traffic to expose the new feature to additional users. In the case that something goes wrong, you may modify the server-side routing with just one click or API call to present only the old (and working) experience to your customers. This lets you revert back user experience without requiring rollback deployments.
A/B Testing shares many similarities with feature flags while still serving a different purpose. A/B tests consist of a randomized experiment with multiple variations. A/B testing lets you compare multiple versions of a single feature, typically by testing the response of a subject to variation A against variation B, and determining which of the two is more effective. For example, let’s imagine an e-commerce website (a scenario we know quite well at Amazon). You might want to experiment with different shapes, sizes, or colors for the checkout button, and then measure which variation has the most impact on revenue.
The infrastructure required to conduct A/B testing is similar to the one required by feature flags. You deploy multiple scenarios in your app, and you control how to route part of the customer traffic to one scenario or the other. Then, you perform deep dive statistical analysis to compare the impacts of variations. CloudWatch Evidently assists in interpreting and acting on experimental results without the need for advanced statistical knowledge. You can use the insights provided by Evidently’s statistical engine, such as anytime p-value and confidence intervals for decision-making while an experiment is in progress.
At Amazon, we use feature flags extensively to control our launches, and A/B testing to experiment with new ideas. We’ve acquired years of experience to build developers’ tools and libraries and maintain and operate experimentation services at scale. Now you can benefit from our experience.
CloudWatch Evidently uses the terms “launches” for feature flags and “experiments” for A/B testing, and so do I in the rest of this article.
Let’s see how it works from an application developer point of view.
Launches in Action
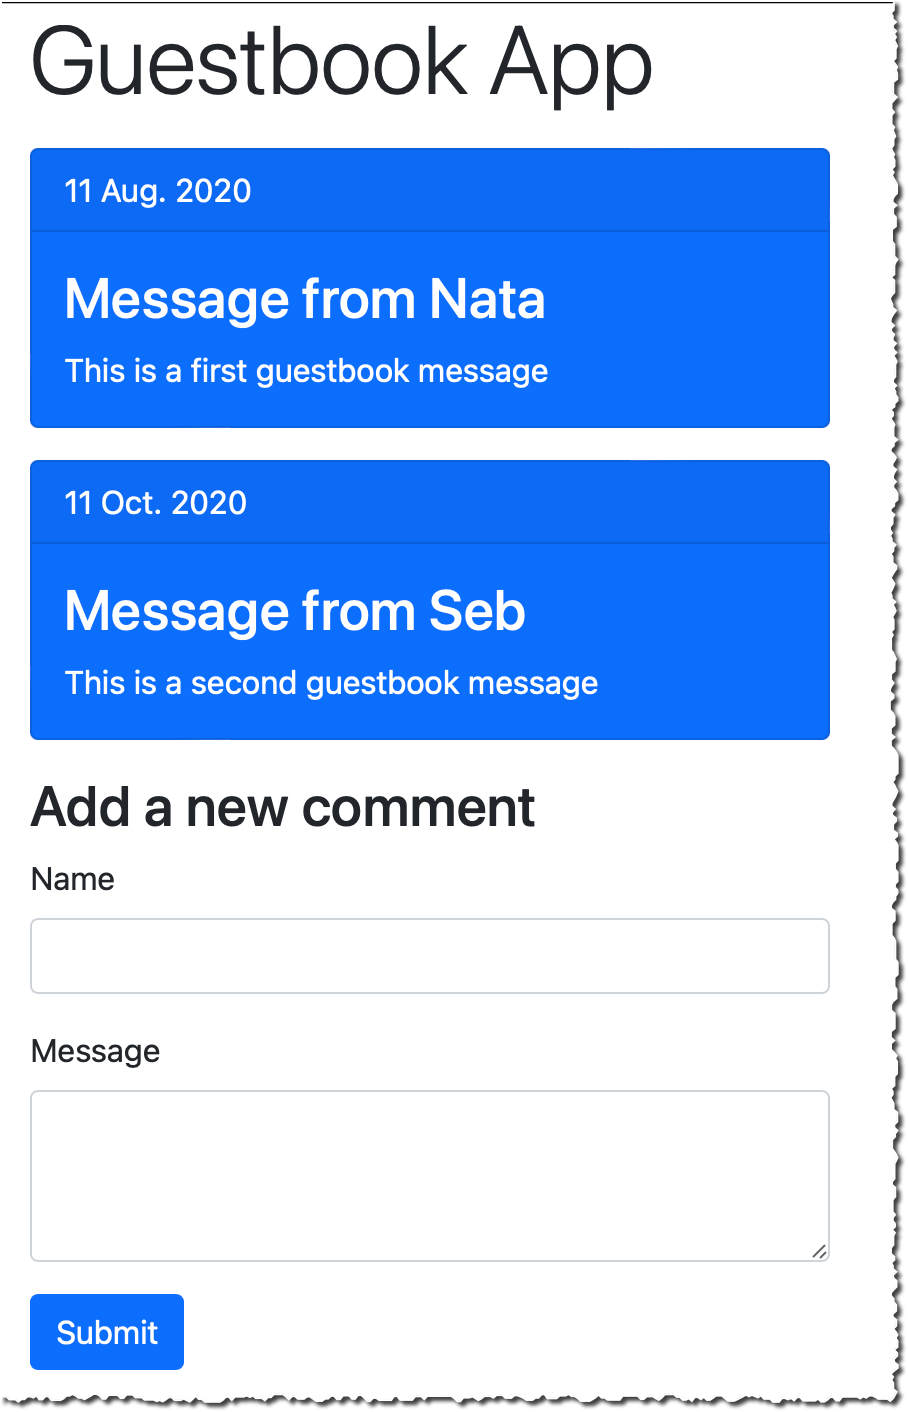
For this demo, I use a simple Guestbook web application. So far, the guest book page is read-only, and comments are entered from our back-end only. I developed a new feature to let customers enter their comments on the guestbook page. I want to launch this new feature progressively over a week and keep the ability to revert the change back if it impacts important technical or business metrics (such as p95 latency, customer engagement, page views, etc.). Users are authenticated, and I will segment users based on their user ID.
Before launch:
 |
After launch:
 |
Create a Project
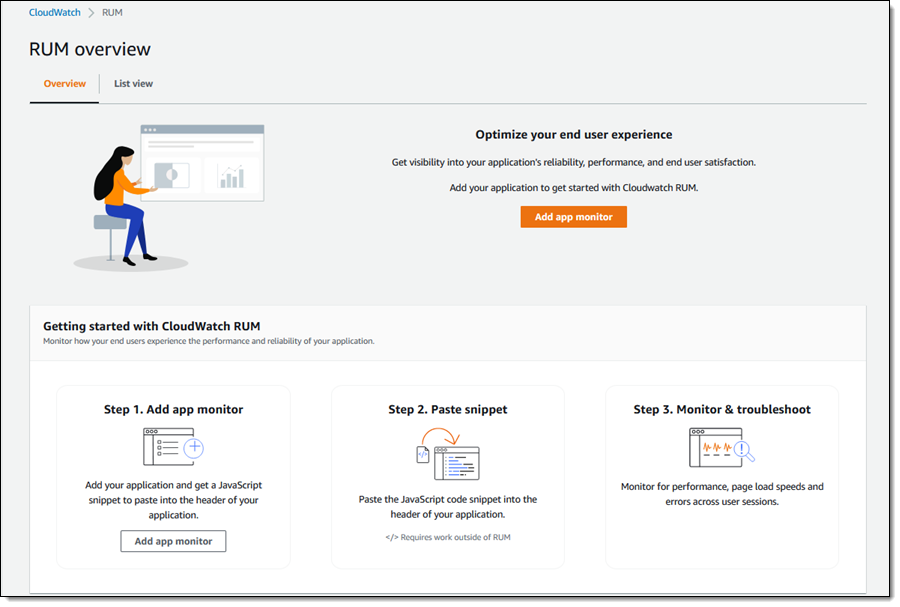
Let’s start by configuring Evidently. I open the AWS Management Console and navigate to CloudWatch Evidently. Then, I select Create a project.

I enter a Project name and Description.
Evidently lets you optionally store events to CloudWatch logs or S3, so that you can move them to systems such as Amazon Redshift to perform analytical operations. For this demo, I choose not to store events. When done, I select Create project.

Add a Feature
Next, I create a feature for this project by selecting Add feature. I enter a Feature name and Feature description. Next, I define my Feature variations. In this example, there are two variations, and I use a Boolean type. true indicates the guestbook is editable and false indicates it is read only. Variations types might be boolean, double, long, or string.
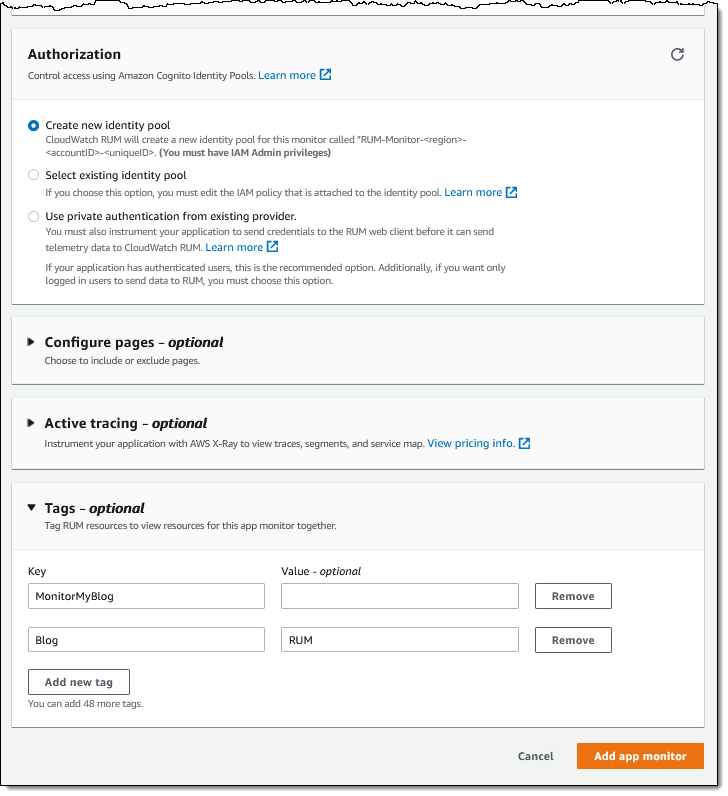
 I may define overrides. Overrides let me pre-define the variation for selected users. I want the user “seb”, my beta tester, to always receive the editable variation.
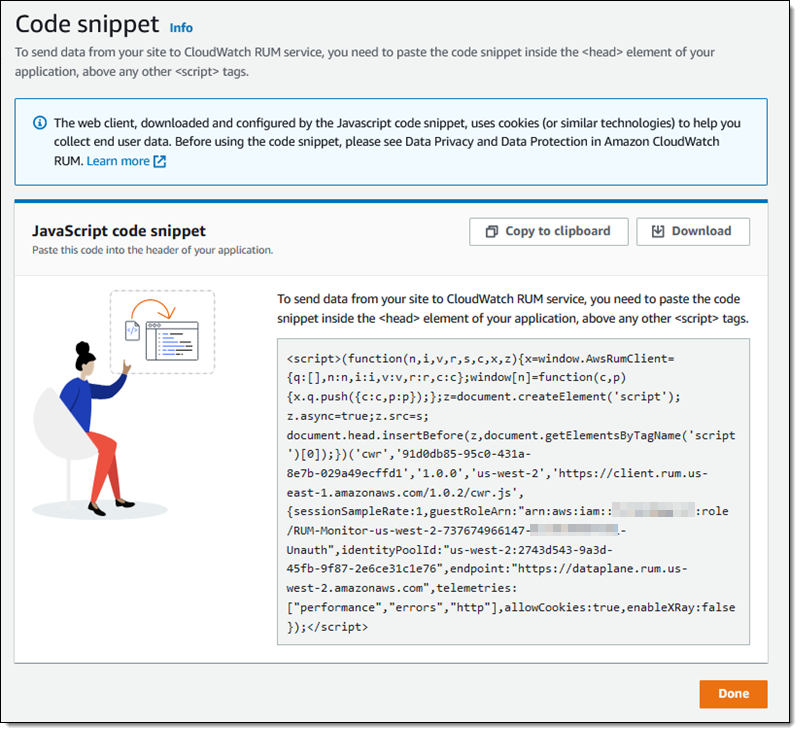
 The console shares the JavaScript and Java code snippets to add into my application.
 Talking about code snippets, let’s look at the changes at the code level.
Instrument my Application Code
I use a simple web application for this demo. I coded this application using JavaScript. I use the AWS SDK for JavaScript and Webpack to package my code. I also use JQuery to manipulate the DOM to hide or show elements. I designed this application to use standard JavaScript and a minimum number of frameworks to make this example inclusive to all. Feel free to use higher level tools and frameworks, such as React or Angular for real-life projects.
I first initialize the Evidently client. Just like other AWS Services, I have to provide an access key and secret access key for authentication. Let’s leave the authentication part out for the moment. I added a note at the end of this article to discuss the options that you have. In this example, I use Amazon Cognito Identity Pools to receive temporary credentials.
// Initialize the Amazon CloudWatch Evidently client
const evidently = new AWS.Evidently({
    endpoint: EVIDENTLY_ENDPOINT,
    region: 'us-east-1',
    credentials: fromCognitoIdentityPool({
        client: new CognitoIdentityClient({ region: 'us-west-2' }),
        identityPoolId: IDENTITY_POOL_ID
    }),
});
Armed with this client, my code may invoke the EvaluateFeature API to make decisions about the variation to display to customers. The entityId is any string-based attribute to segment my customers. It might be a session ID, a customer ID, or even better, a hash of these. The featureName parameter contains the name of the feature to evaluate. In this example, I pass the value EditableGuestBook.
const evaluateFeature = async (entityId, featureName) => {

    // API request structure
    const evaluateFeatureRequest = {
        // entityId for calling evaluate feature API
        entityId: entityId,
        // Name of my feature
        feature: featureName,
        // Name of my project
        project: "AWSNewsBlog",
    };

    // Evaluate feature
    const response = await evidently.evaluateFeature(evaluateFeatureRequest).promise();
    console.log(response);
    return response;
}
The response contains the assignment decision from Evidently, as based on traffic rules defined on the server-side.
{
 details: {
   launch: "EditableGuestBook", group: "V2"},
   reason: "LAUNCH_RULE_MATCH",
   value: {boolValue: false},
   variation: "readonly"
}}
The last part consists of hiding or displaying part of the user interface based on the value received above. Using basic JQuery DOM manipulation, it would be something like the following:
window.aws.evaluateFeature(entityId, 'EditableGuestbook').then((response, error) => {
    if (response.value.boolValue) {
        console.log('Feature Flag is on, showing guest book');
        $('div#guestbook-add').show();
    } else {
        console.log('Feature Flag is off, hiding guest book');
        $('div#guestbook-add').hide();
    }
});
Create a Launch
Now that the feature is defined on the server-side, and the client code is instrumented, I deploy the code and expose it to my customers. At a later stage, I may decide to launch the feature. I navigate back to the console, select my project, and select Create Launch. I choose a Launch name and a Launch description for my launch. Then, I select the feature I want to launch.
 In the Launch Configuration section, I configure how much traffic is sent to each variation. I may also schedule the launch with multiple steps. This lets me plan different steps of routing based on a schedule. For example, on the first day, I may choose to send 10% of the traffic to the new feature, and on the second day 20%, etc. In this example, I decide to split the traffic 50/50.
 Finally, I may define up to three metrics to measure the performance of my variations. Metrics are defined by applying rules to data events.
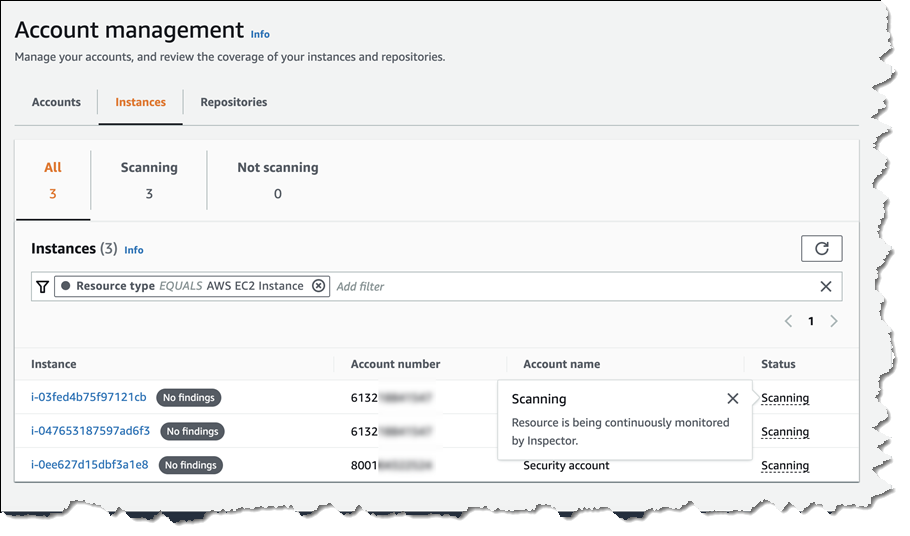
 Again, I have to instrument my code to send these metrics with
 PutProjectEvents API from Evidently. Once my launch is created, the EvaluateFeature API returns different values for different values of entityId (users in this demo).
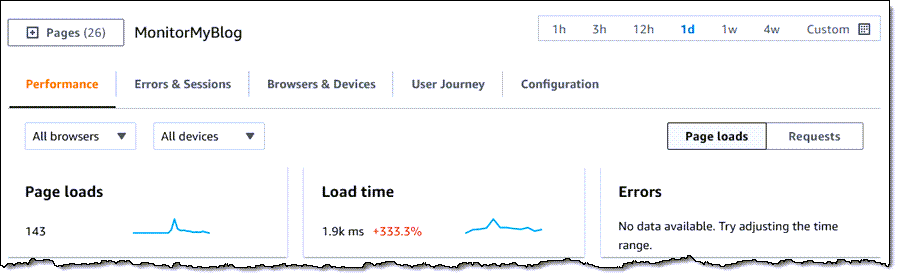
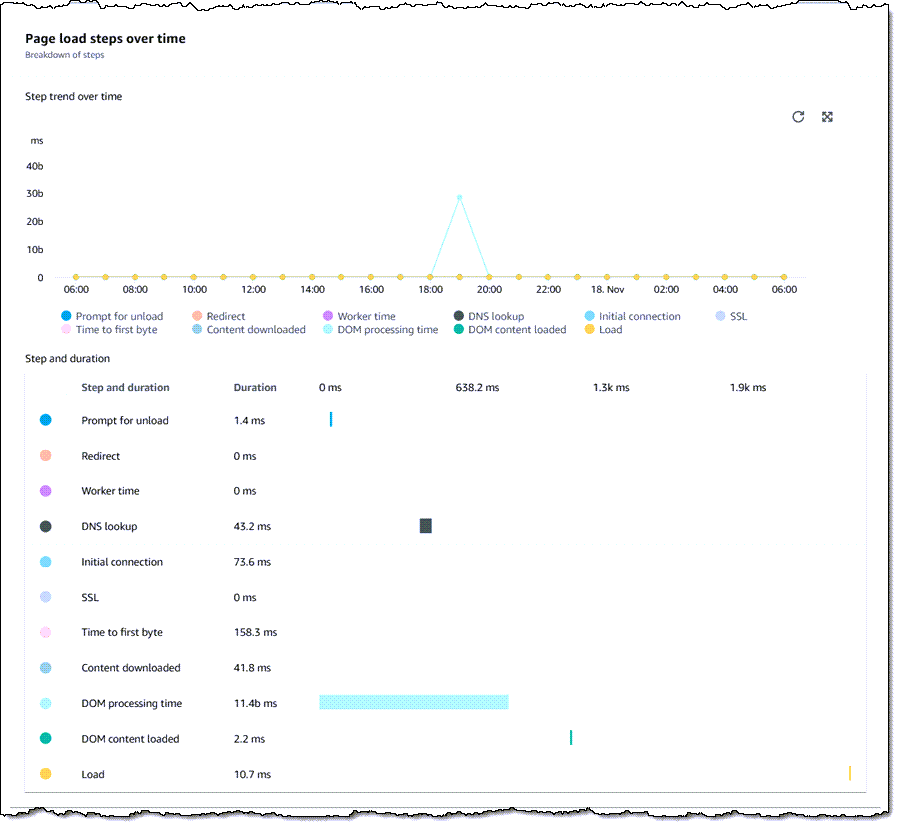
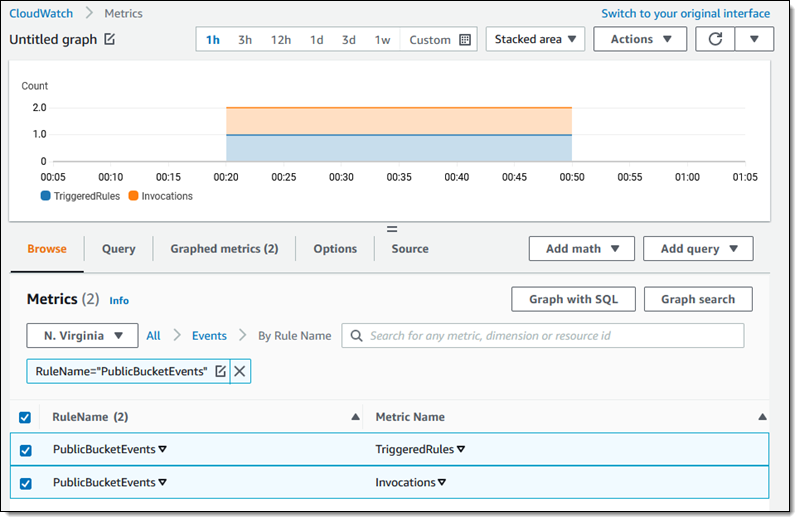
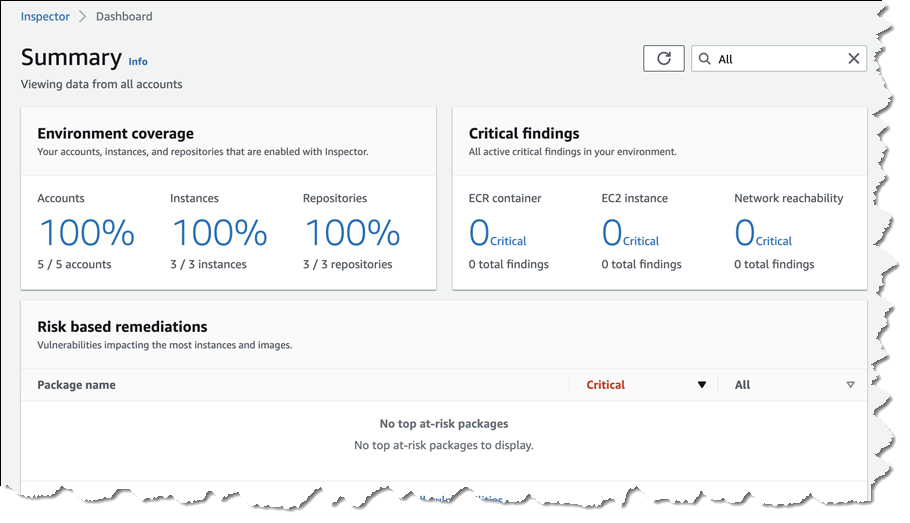
At any moment, I may change the routing configuration. Moreover, I also have access to a monitoring dashboard to observe the distribution of my variations and the metrics for each variation.
 I am confident that your real-life launch graph will get more data than mine did, as I just created it to write this post.
A/B Testing
Doing an A/B test is similar. I create a feature to test, and I create an Experiment. I configure the experiment to route part of the traffic to variation 1, and then the other part to variation 2. When I am ready to launch the experiment, I explicitly select Start experiment.

In this experiment, I am interested in sending custom metrics. For example:
// pageLoadTime custom metric
const timeSpendOnHomePageData = `{
   "details": {
      "timeSpendOnHomePage": ${timeSpendOnHomePageValue}
   },
   "userDetails": { "userId": "${randomizedID}", "sessionId": "${randomizedID}" }
}`;

const putProjectEventsRequest: PutProjectEventsRequest = {
   project: 'AWSNewsBlog',
   events: [
    {
        timestamp: new Date(),
        type: 'aws.evidently.custom',
        data: JSON.parse(timeSpendOnHomePageData)
    },
   ],
};

this.evidently.putProjectEvents(putProjectEventsRequest).promise().then(res =>{})
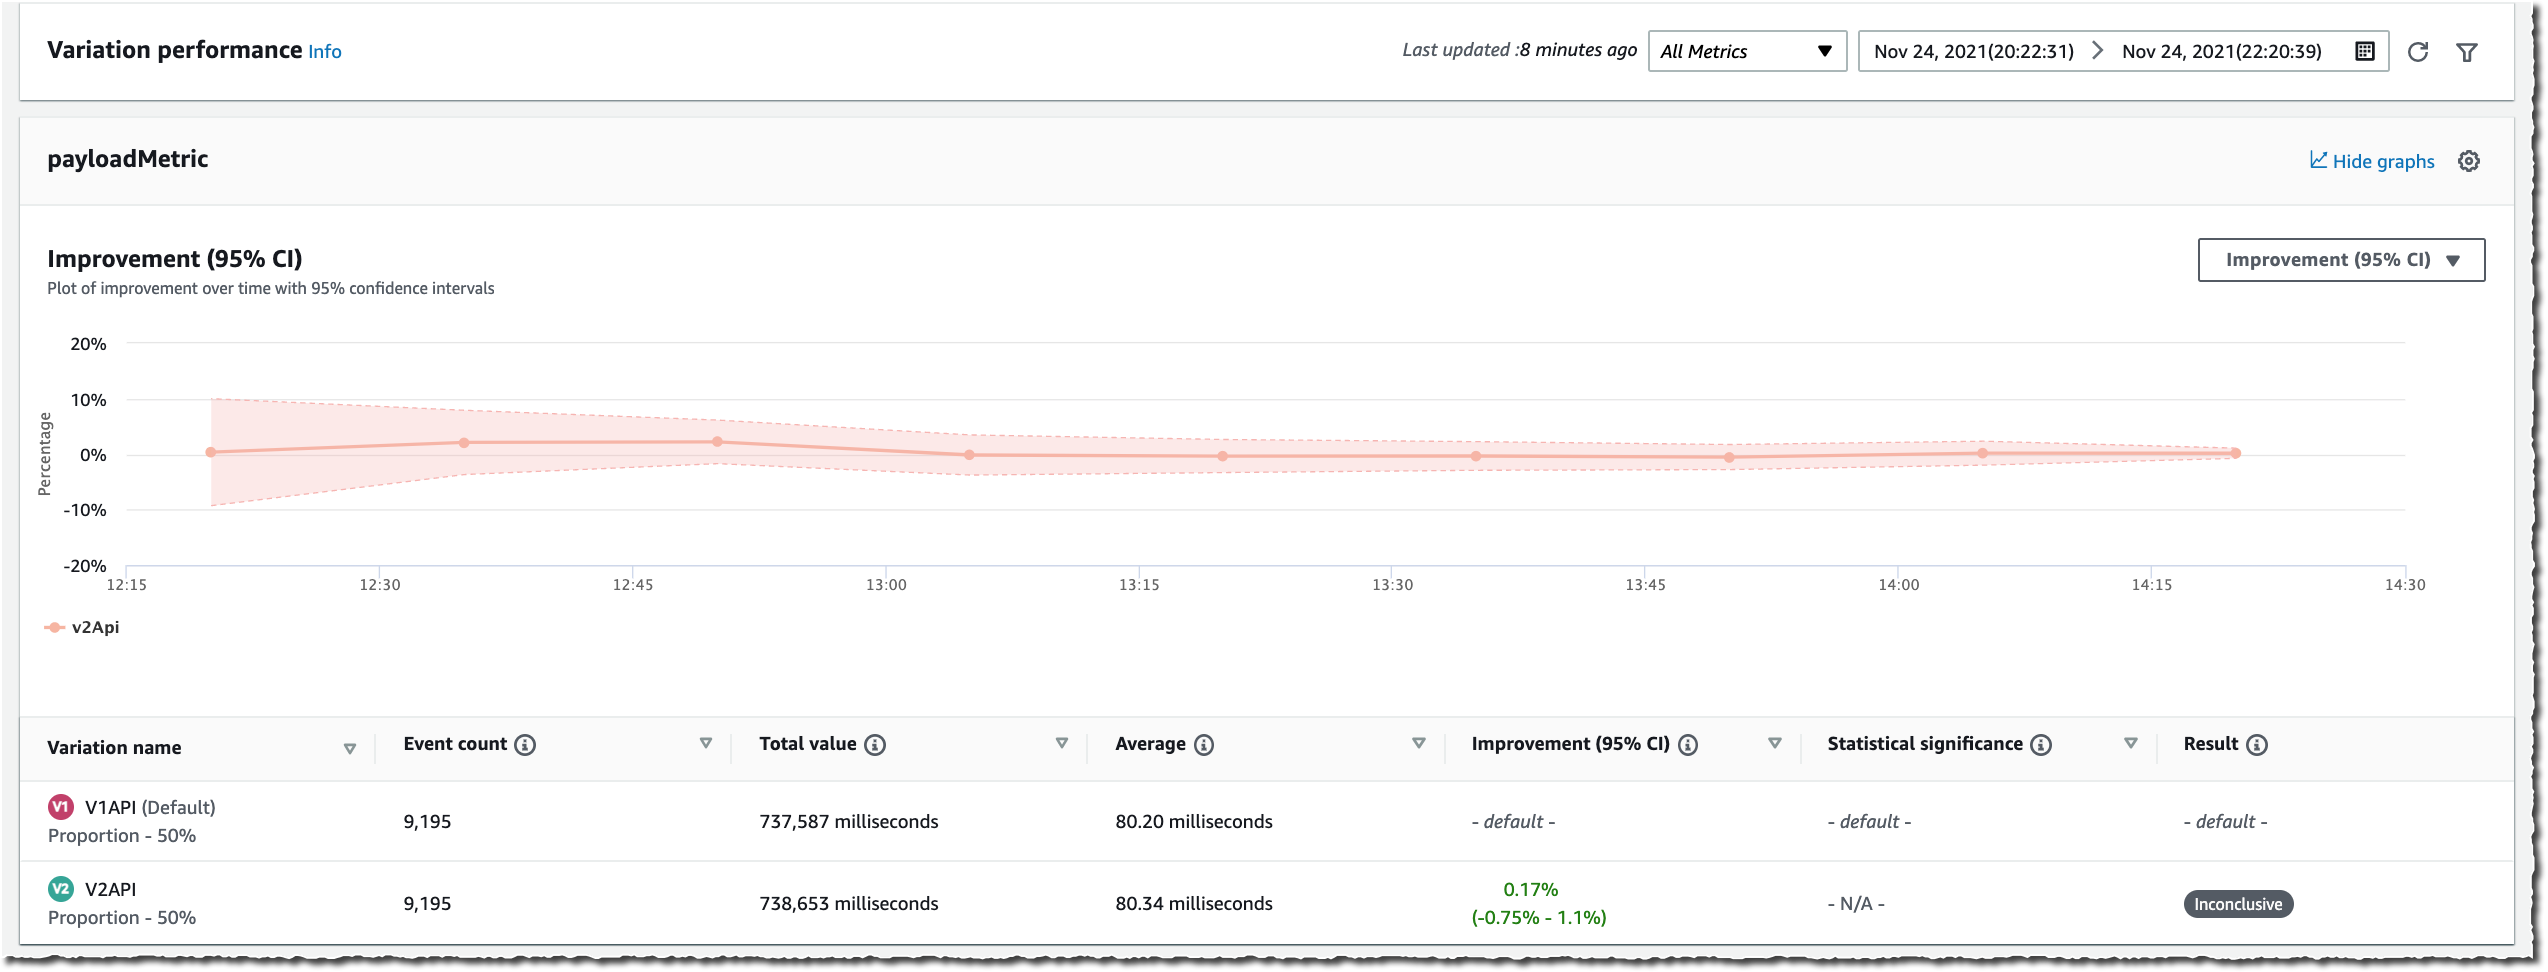
Switching to the Results page, I see raw values and graph data for Event Count, Total Value, Average, Improvement (with 95% confidence interval), and Statistical significance. The statistical significance describes how certain we are that the variation has an effect on the metric as compared to the baseline.
These results are generated throughout the experiment and the confidence intervals and the statistical significance are guaranteed to be valid anytime you want to view them. Additionally, at the end of the experiment, Evidently also generates a Bayesian perspective of the experiment that provides information about how likely it is that a difference between the variations exists.
The following two screenshots show graphs for the average value of two metrics over time, and the improvement for a metric within a 95% confidence interval.


Additional Thoughts
Before we wrap-up, I’d like to share some additional considerations.
First, it is important to understand that I choose to demo Evidently in the context of front-end application development. However, you may use Evidently with any application type: front-end web or mobile, back-end API, or even machine learning (ML). For example, you may use Evidently to deploy two different ML models and conduct experiments just like I showed above.
Second, just like with other AWS Services, Evidently API is available in all of our AWS SDK. This lets you use EvaluateFeature and other APIs from nine programing languages: C++, Go, Java, JavaScript (and Typescript), .Net, NodeJS, PHP, Python, and Ruby. AWS SDK for Rust and Swift are in the making.
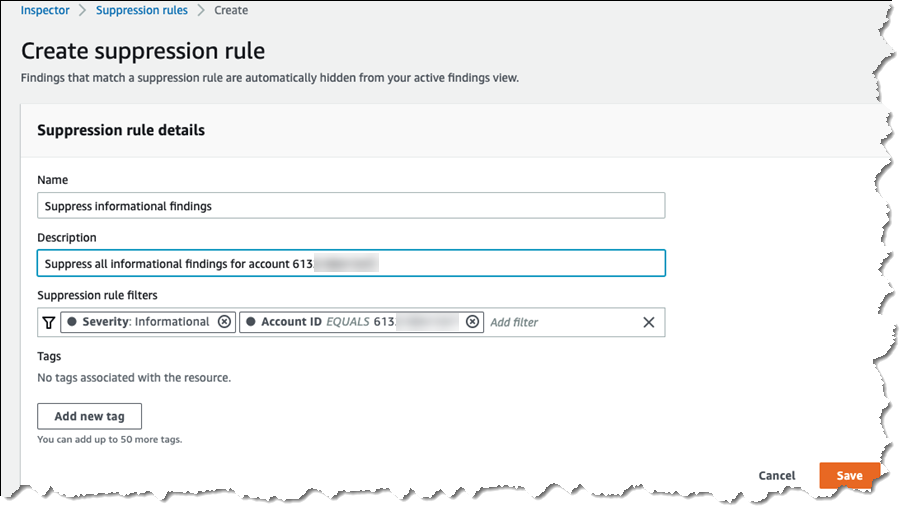
Third, for a front-end application as I demoed here, it is important to consider how to authenticate calls to Evidently API. Hard coding access keys and secret access keys is not an option. For the front-end scenario, I suggest that you use Amazon Cognito Identity Pools to exchange user identity tokens for a temporary access and secret keys. User identity tokens may be obtained from Cognito User Pools, or third-party authentications systems, such as Active Directory, Login with Amazon, Login with Facebook, Login with Google, Signin with Apple, or any system compliant with OpenID Connect or SAML. Cognito Identity Pools also allows for anonymous access. No identity token is required. Cognito Identity Pools vends temporary tokens associated with IAM roles. You must Allow calls to the evidently:EvaluateFeature API in your policies.
Finally, when using feature flags, plan for code cleanup time during your sprints. Once a feature is launched, you might consider removing calls to EvaluateFeature API and the if-then-else logic used to initially hide the feature.
Pricing and Availability
Amazon Cloudwatch Evidently is generally available in nine AWS Regions: US East (N. Virginia), US East (Ohio), US West (Oregon), Asia Pacific (Singapore), Asia Pacific (Sydney), Asia Pacific (Tokyo), Europe (Ireland), Europe (Frankfurt), and Europe (Stockholm). As usual, we will gradually extend to other Regions in the coming months.
Pricing is pay-as-you-go with no minimum or recurring fees. CloudWatch Evidently charges your account based on Evidently events and Evidently analysis units. Evidently analysis units are generated from Evidently events, based on rules you have created in Evidently. For example, a user checkout event may produce two Evidently analysis units: checkout value and the number of items in cart. For more information about pricing, see Amazon CloudWatch Pricing.
Start experimenting with CloudWatch Evidently today!
— seb


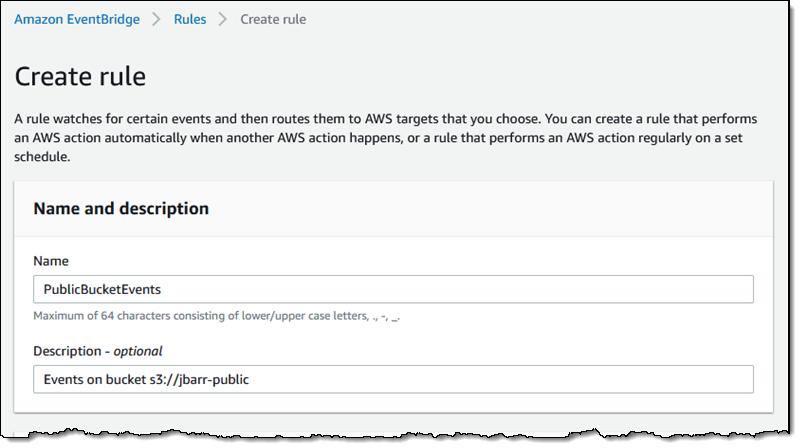 Then I define a pattern that matches the bucket and the events of interest:
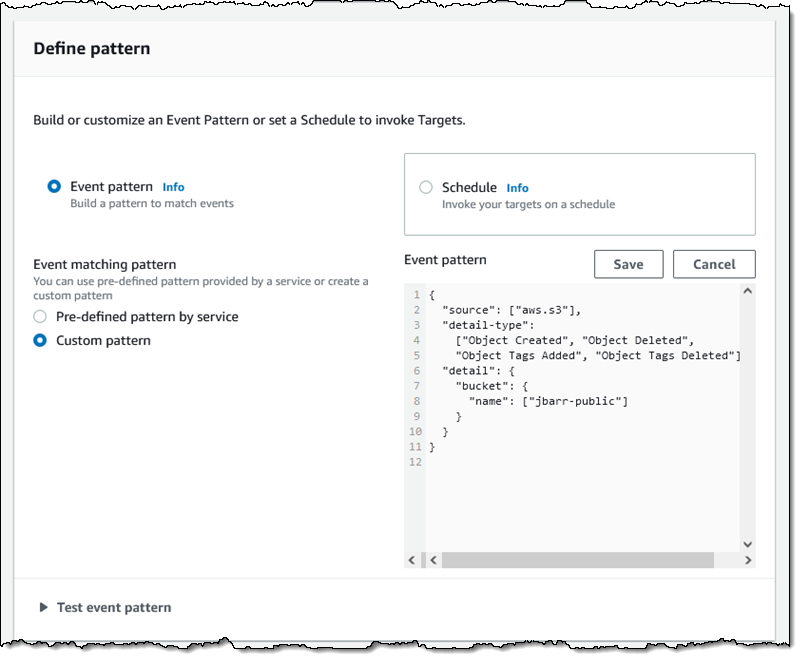 One pattern can match one or more buckets and one or more events; the following events are supported:
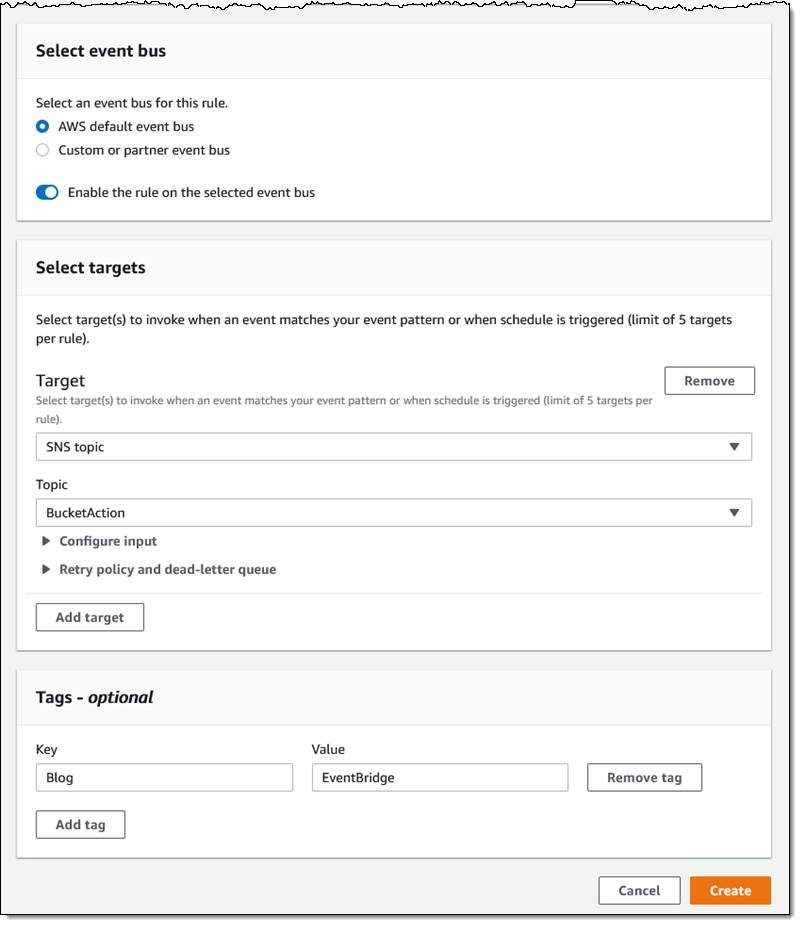


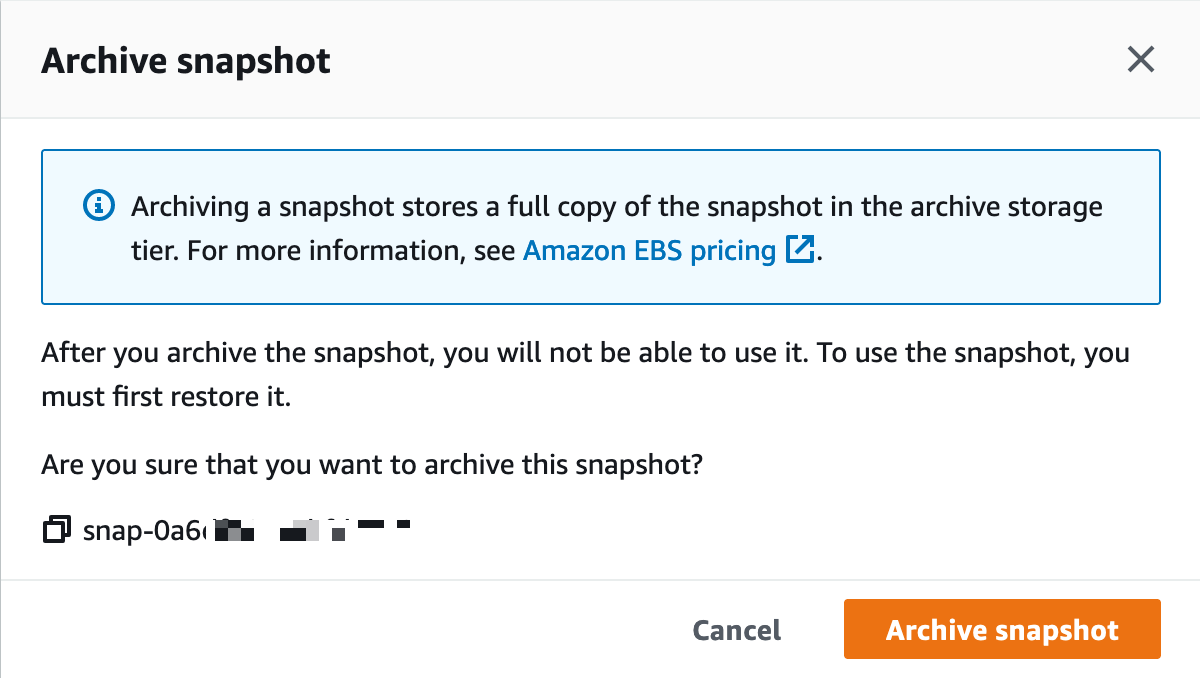
 Archival completed.


 I add a tag (User) to the rule, and click Create retention rule:
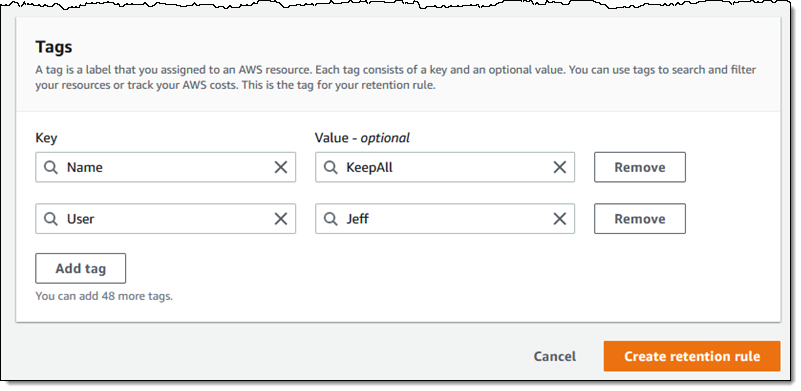


 processors in 2018 such as