Post Syndicated from Channy Yun original https://aws.amazon.com/blogs/aws/amazon-dynamodb-zero-etl-integration-with-amazon-opensearch-service-is-now-generally-available/
Today, we are announcing the general availability of Amazon DynamoDB zero-ETL integration with Amazon OpenSearch Service, which lets you perform a search on your DynamoDB data by automatically replicating and transforming it without custom code or infrastructure. This zero-ETL integration reduces the operational burden and cost involved in writing code for a data pipeline architecture, keeping the data in sync, and updating code with frequent application changes, enabling you to focus on your application.
With this zero-ETL integration, Amazon DynamoDB customers can now use the powerful search features of Amazon OpenSearch Service, such as full-text search, fuzzy search, auto-complete, and vector search for machine learning (ML) capabilities to offer new experiences that boost user engagement and improve satisfaction with their applications.
This zero-ETL integration uses Amazon OpenSearch Ingestion to synchronize the data between Amazon DynamoDB and Amazon OpenSearch Service. You choose the DynamoDB table whose data needs to be synchronized and Amazon OpenSearch Ingestion synchronizes the data to an Amazon OpenSearch managed cluster or serverless collection within seconds of it being available.
You can also specify index mapping templates to ensure that your Amazon DynamoDB fields are mapped to the correct fields in your Amazon OpenSearch Service indexes. Also, you can synchronize data from multiple DynamoDB tables into one Amazon OpenSearch Service managed cluster or serverless collection to offer holistic insights across several applications.
Getting started with this zero-ETL integration
With a few clicks, you can synchronize data from DynamoDB to OpenSearch Service. To create an integration between DynamoDB and OpenSearch Service, choose the Integrations menu in the left pane of the DynamoDB console and the DynamoDB table whose data you want to synchronize.

You must turn on point-in-time recovery (PITR) and the DynamoDB Streams feature. This feature allows you to capture item-level changes in your table and push the changes to a stream. Choose Turn on for PITR and enable DynamoDB Streams in the Exports and streams tab.
After turning on PITR and DynamoDB Stream, choose Create to set up an OpenSearch Ingestion pipeline in your account that replicates the data to an OpenSearch Service managed domain.

In the first step, enter a unique pipeline name and set up pipeline capacity and compute resources to automatically scale your pipeline based on the current ingestion workload.

Now you can configure the pre-defined pipeline configuration in YAML file format. You can browse resources to look up and paste information to build the pipeline configuration. This pipeline is a combination of a source part from DyanmoDB settings and a sink part for OpenSearch Service.
You must set multiple IAM roles (sts_role_arn) with the necessary permissions to read data from the DynamoDB table and write to an OpenSearch domain. This role is then assumed by OpenSearch Ingestion pipelines to ensure that the right security posture is always maintained when moving the data from source to destination. To learn more, see Setting up roles and users in Amazon OpenSearch Ingestion in the AWS documentation.

After entering all required values, you can validate the pipeline configuration to ensure that your configuration is valid. To learn more, see Creating Amazon OpenSearch Ingestion pipelines in the AWS documentation.
Take a few minutes to set up the OpenSearch Ingestion pipeline, and you can see your integration is completed in the DynamoDB table.

Now you can search synchronized items in the OpenSearch Dashboards.
Things to know
Here are a couple of things that you should know about this feature:
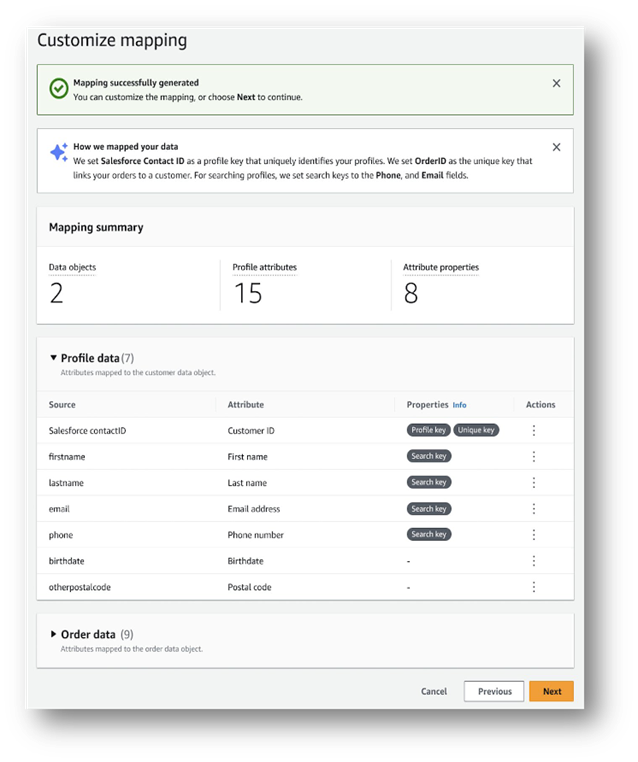
- Custom schema – You can specify your custom data schema along with the index mappings used by OpenSearch Ingestion when writing data from Amazon DynamoDB to OpenSearch Service. This experience is added to the console within Amazon DynamoDB so that you have full control over the format of indices that are created on OpenSearch Service.
- Pricing – There will be no additional cost to use this feature apart from the cost of the existing underlying components. Note that Amazon OpenSearch Ingestion charges OpenSearch Compute Units (OCUs) which will be used to replicate data between Amazon DynamoDB and Amazon OpenSearch Service. Furthermore, this feature uses Amazon DynamoDB streams for the change data capture (CDC) and you will incur the standard costs for Amazon DynamoDB Streams.
- Monitoring – You can monitor the state of the pipelines by checking the status of the integration on the DynamoDB console or using the OpenSearch Ingestion dashboard. Additionally, you can use Amazon CloudWatch to provide real-time metrics and logs, which lets you to set up alerts in case of a breach of user-defined thresholds.
Now available
Amazon DynamoDB zero-ETL integration with Amazon OpenSearch Service is now generally available in all AWS Regions where OpenSearch Ingestion is available today.
— Channy


 I’m happy to be able to tell you about the latest in our series of innovative


 3. Access to cutting-edge capabilities