Post Syndicated from Julian Wood original https://aws.amazon.com/blogs/compute/introducing-amazon-codewhisperer-in-the-aws-lambda-console-in-preview/
This blog post is written by Mark Richman, Senior Solutions Architect.
Today, AWS is launching a new capability to integrate the Amazon CodeWhisperer experience with the AWS Lambda console code editor.
Amazon CodeWhisperer is a machine learning (ML)–powered service that helps improve developer productivity. It generates code recommendations based on their code comments written in natural language and code.
CodeWhisperer is available as part of the AWS toolkit extensions for major IDEs, including JetBrains, Visual Studio Code, and AWS Cloud9, currently supporting Python, Java, and JavaScript. In the Lambda console, CodeWhisperer is available as a native code suggestion feature, which is the focus of this blog post.
CodeWhisperer is currently available in preview with a waitlist. This blog post explains how to request access to and activate CodeWhisperer for the Lambda console. Once activated, CodeWhisperer can make code recommendations on-demand in the Lambda code editor as you develop your function. During the preview period, developers can use CodeWhisperer at no cost.

Amazon CodeWhisperer
Lambda is a serverless compute service that runs your code in response to events and automatically manages the underlying compute resources for you. You can trigger Lambda from over 200 AWS services and software as a service (SaaS) applications and only pay for what you use.
With Lambda, you can build your functions directly in the AWS Management Console and take advantage of CodeWhisperer integration. CodeWhisperer in the Lambda console currently supports functions using the Python and Node.js runtimes.
When writing AWS Lambda functions in the console, CodeWhisperer analyzes the code and comments, determines which cloud services and public libraries are best suited for the specified task, and recommends a code snippet directly in the source code editor. The code recommendations provided by CodeWhisperer are based on ML models trained on a variety of data sources, including Amazon and open source code. Developers can accept the recommendation or simply continue to write their own code.
Requesting CodeWhisperer access
CodeWhisperer integration with Lambda is currently available as a preview only in the N. Virginia (us-east-1) Region. To use CodeWhisperer in the Lambda console, you must first sign up to access the service in preview here or request access directly from within the Lambda console.
In the AWS Lambda console, under the Code tab, in the Code source editor, select the Tools menu, and Request Amazon CodeWhisperer Access.

Request CodeWhisperer access in Lambda console
You may also request access from the Preferences pane.

Request CodeWhisperer access in Lambda console preference pane
Selecting either of these options opens the sign-up form.

CodeWhisperer sign up form
Enter your contact information, including your AWS account ID. This is required to enable the AWS Lambda console integration. You will receive a welcome email from the CodeWhisperer team upon once they approve your request.
Activating Amazon CodeWhisperer in the Lambda console
Once AWS enables your preview access, you must turn on the CodeWhisperer integration in the Lambda console, and configure the required permissions.
From the Tools menu, enable Amazon CodeWhisperer Code Suggestions

Enable CodeWhisperer code suggestions
You can also enable code suggestions from the Preferences pane:
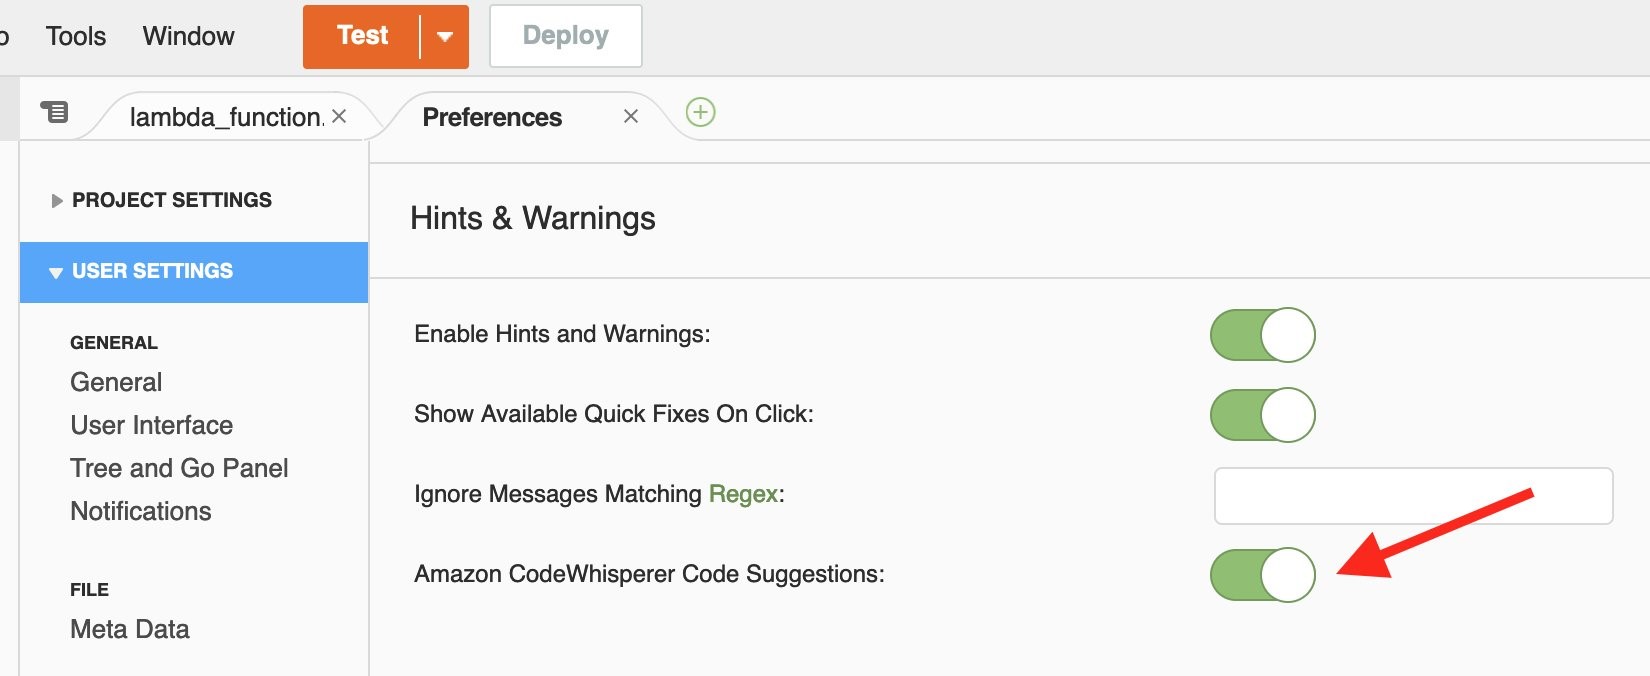
Enable CodeWhisperer code suggestions from Preferences pane
The first time you activate CodeWhisperer, you see a pop-up containing terms and conditions for using the service.

CodeWhisperer Preview Terms
Read the terms and conditions and choose Accept to continue.
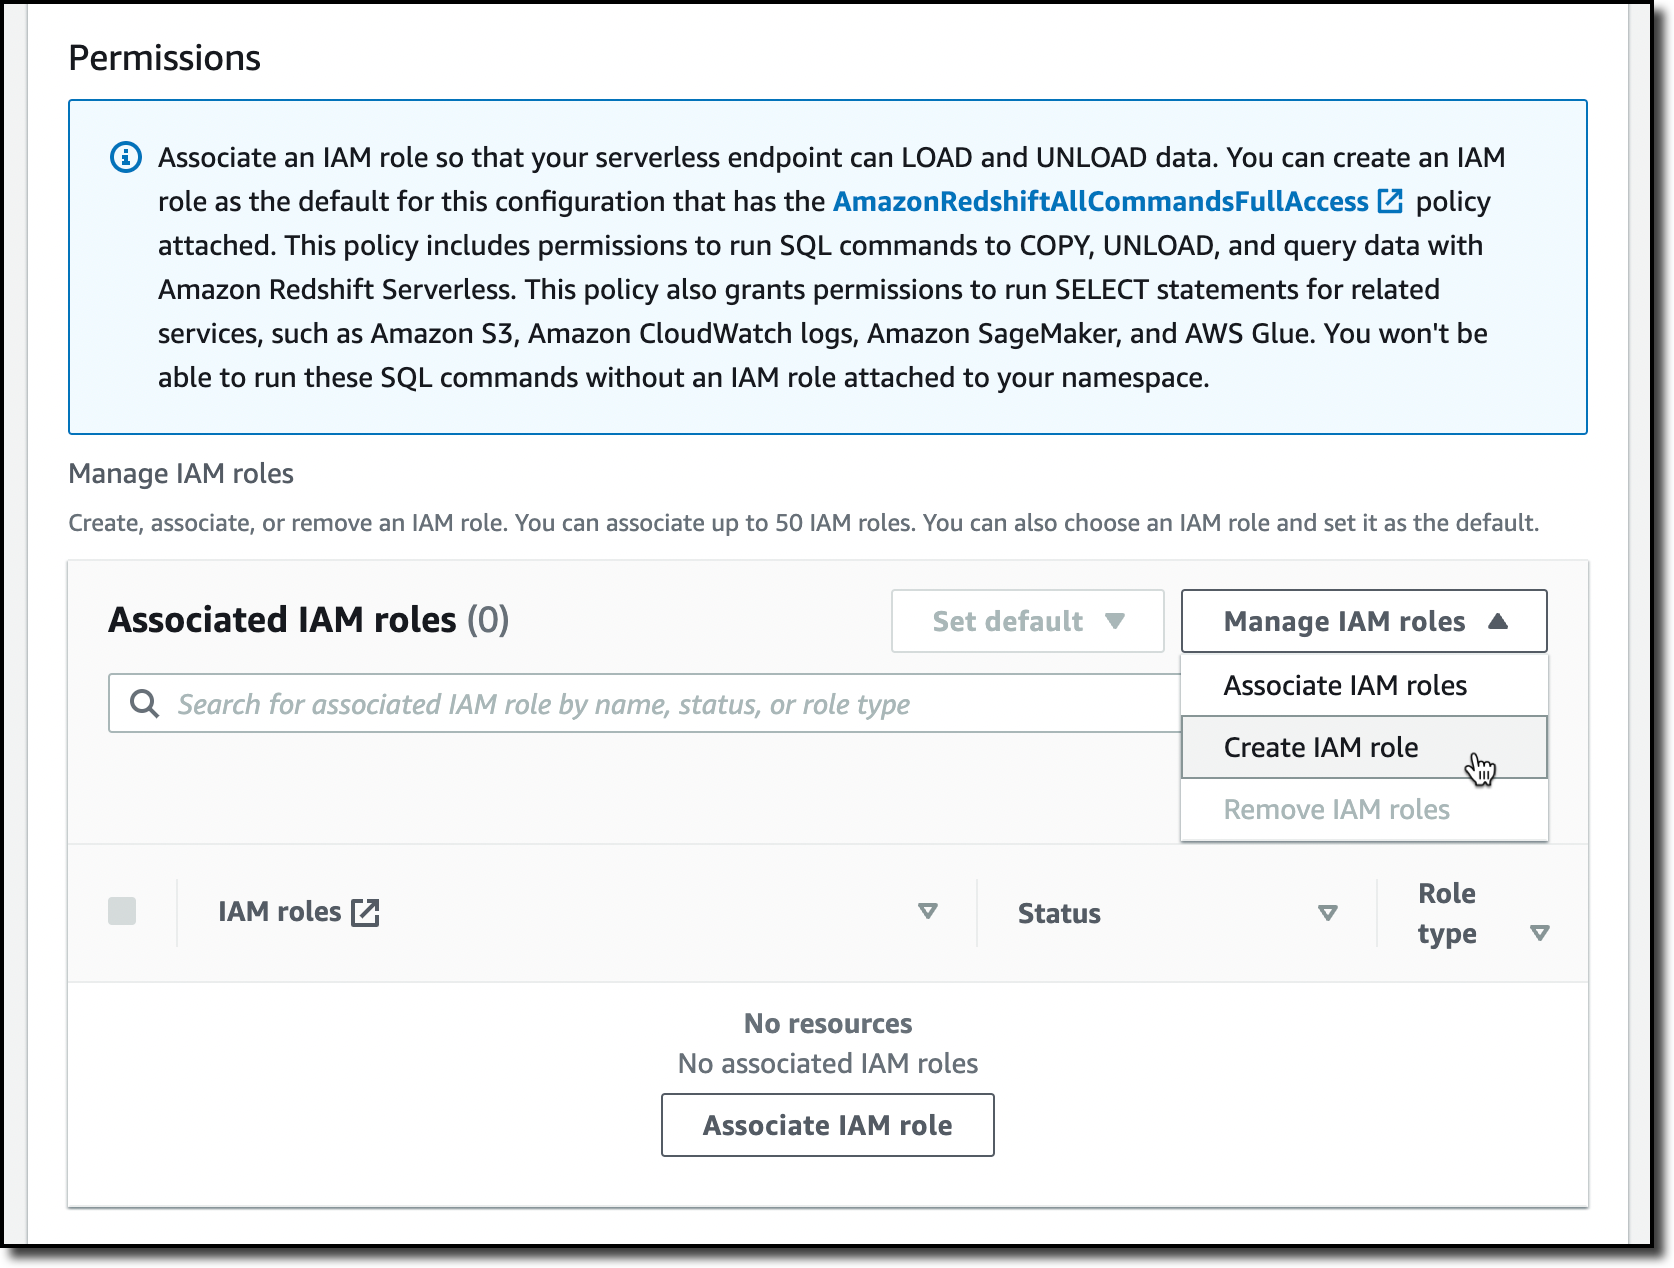
AWS Identity and Access Management (IAM) permissions
For CodeWhisperer to provide recommendations in the Lambda console, you must enable the proper AWS Identity and Access Management (IAM) permissions for either your IAM user or role. In addition to Lambda console editor permissions, you must add the codewhisperer:GenerateRecommendations permission.
Here is a sample IAM policy that grants a user permission to the Lambda console as well as CodeWhisperer:
{
  "Version": "2012-10-17",
  "Statement": [{
      "Sid": "LambdaConsolePermissions",
      "Effect": "Allow",
      "Action": [
        "lambda:AddPermission",
        "lambda:CreateEventSourceMapping",
        "lambda:CreateFunction",
        "lambda:DeleteEventSourceMapping",
        "lambda:GetAccountSettings",
        "lambda:GetEventSourceMapping",
        "lambda:GetFunction",
        "lambda:GetFunctionCodeSigningConfig",
        "lambda:GetFunctionConcurrency",
        "lambda:GetFunctionConfiguration",
        "lambda:InvokeFunction",
        "lambda:ListEventSourceMappings",
        "lambda:ListFunctions",
        "lambda:ListTags",
        "lambda:PutFunctionConcurrency",
        "lambda:UpdateEventSourceMapping",
        "iam:AttachRolePolicy",
        "iam:CreatePolicy",
        "iam:CreateRole",
        "iam:GetRole",
        "iam:GetRolePolicy",
        "iam:ListAttachedRolePolicies",
        "iam:ListRolePolicies",
        "iam:ListRoles",
        "iam:PassRole",
        "iam:SimulatePrincipalPolicy"
      ],
      "Resource": "*"
    },
    {
      "Sid": "CodeWhispererPermissions",
      "Effect": "Allow",
      "Action": ["codewhisperer:GenerateRecommendations"],
      "Resource": "*"
    }
  ]
}
This example is for illustration only. It is best practice to use IAM policies to grant restrictive permissions to IAM principals to meet least privilege standards.
Demo
To activate and work with code suggestions, use the following keyboard shortcuts:
- Manually fetch a code suggestion: Option+C (macOS), Alt+C (Windows)
- Accept a suggestion: Tab
- Reject a suggestion: ESC, Backspace, scroll in any direction, or keep typing and the recommendation automatically disappears.
Currently, the IDE extensions provide automatic suggestions and can show multiple suggestions. The Lambda console integration requires a manual fetch and shows a single suggestion.
Here are some common ways to use CodeWhisperer while authoring Lambda functions.
Single-line code completion
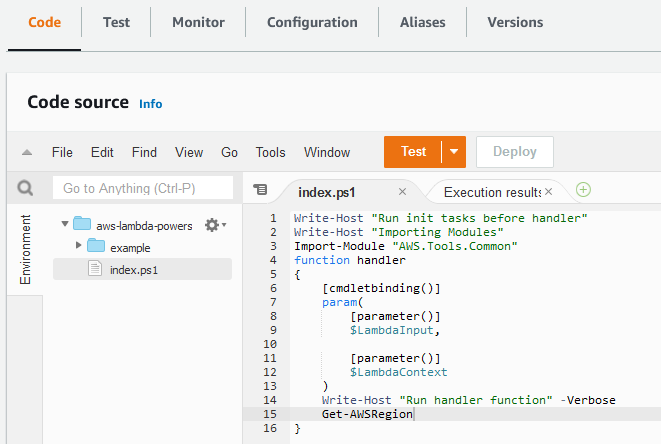
When typing single lines of code, CodeWhisperer suggests how to complete the line.
CodeWhisperer single-line completion
Full function generation
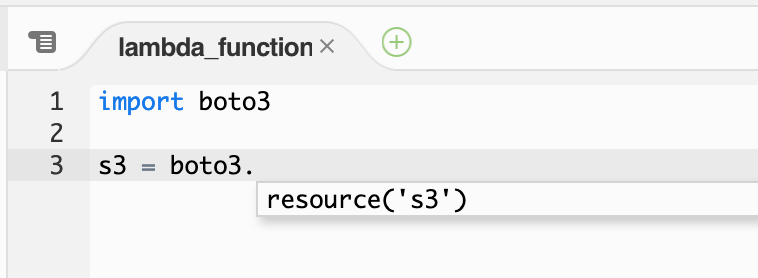
CodeWhisperer can generate an entire function based on your function signature or code comments. In the following example, a developer has written a function signature for reading a file from Amazon S3. CodeWhisperer then suggests a full implementation of the read_from_s3 method.

CodeWhisperer full function generation
CodeWhisperer may include import statements as part of its suggestions, as in the previous example. As a best practice to improve performance, manually move these import statements to outside the function handler.
Generate code from comments
CodeWhisperer can also generate code from comments. The following example shows how CodeWhisperer generates code to use AWS APIs to upload files to Amazon S3. Write a comment describing the intended functionality and, on the following line, activate the CodeWhisperer suggestions. Given the context from the comment, CodeWhisperer first suggests the function signature code in its recommendation.

CodeWhisperer generate function signature code from comments
After you accept the function signature, CodeWhisperer suggests the rest of the function code.
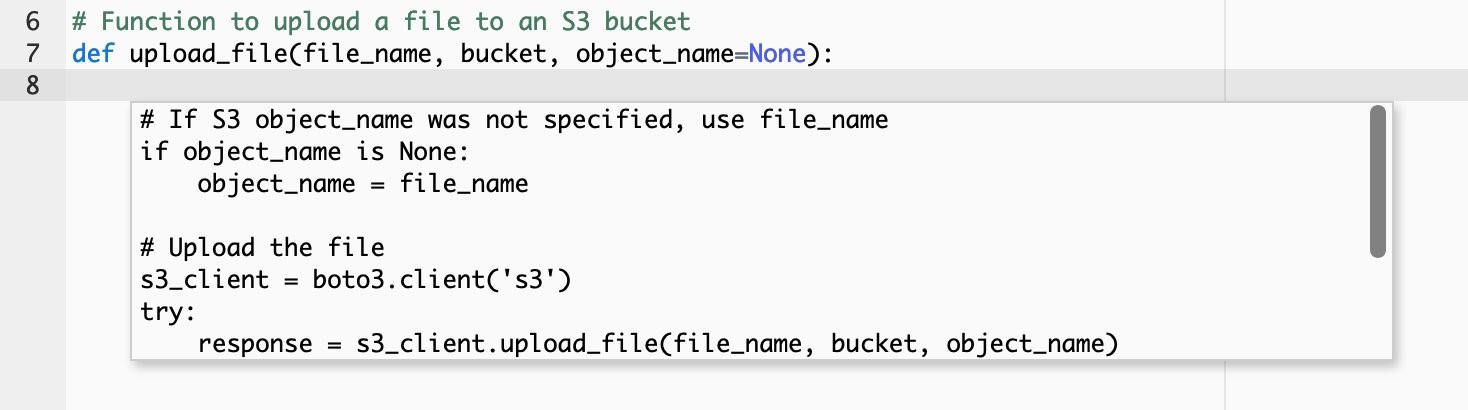
CodeWhisperer generate function code from comments
When you accept the suggestion, CodeWhisperer completes the entire code block.

CodeWhisperer generates code to write to S3.
CodeWhisperer can help write code that accesses many other AWS services. In the following example, a code comment indicates that a function is sending a notification using Amazon Simple Notification Service (SNS). Based on this comment, CodeWhisperer suggests a function signature.
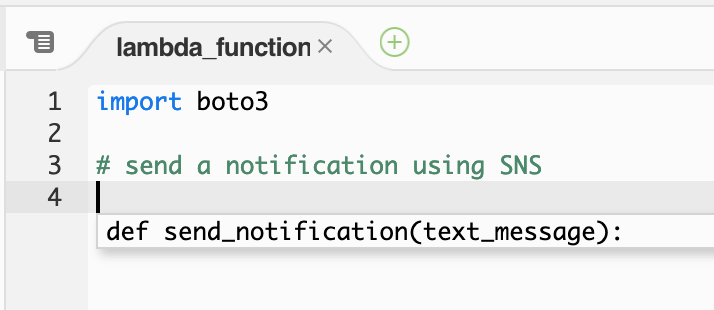
CodeWhisperer function signature for SNS
If you accept the suggested function signature. CodeWhisperer suggest a complete implementation of the send_notification function.

CodeWhisperer function send notification for SNS
The same procedure works with Amazon DynamoDB. When writing a code comment indicating that the function is to get an item from a DynamoDB table, CodeWhisperer suggests a function signature.
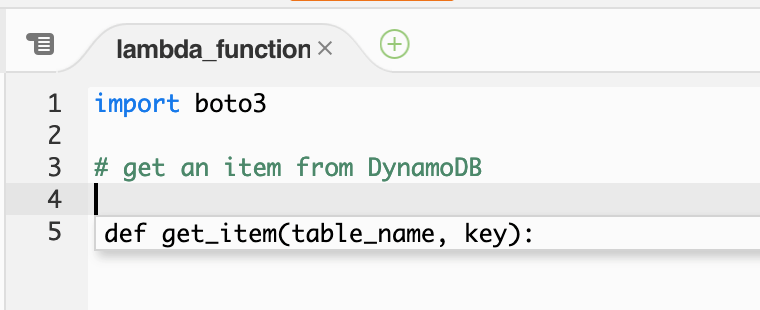
CodeWhisperer DynamoDB function signature
When accepting the suggestion, CodeWhisperer then suggests a full code snippet to complete the implementation.

CodeWhisperer DynamoDB code snippet
Once reviewing the suggestion, a common refactoring step in this example would be manually moving the references to the DynamoDB resource and table outside the get_item function.
CodeWhisperer can also recommend complex algorithm implementations, such as Insertion sort.
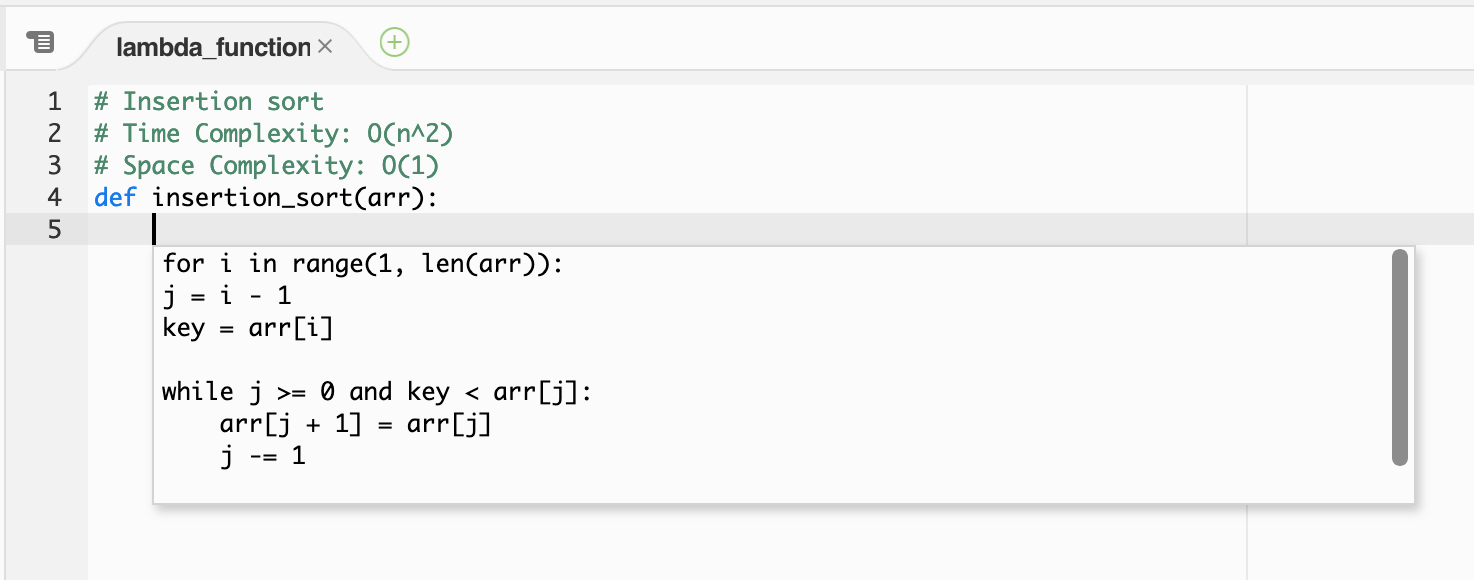
CodeWhisperer insertion sort.
As a best practice, always test the code recommendation for completeness and correctness.
CodeWhisperer not only provides suggested code snippets when integrating with AWS APIs, but can help you implement common programming idioms, including proper error handling.
Conclusion
CodeWhisperer is a general purpose, machine learning-powered code generator that provides you with code recommendations in real time. When activated in the Lambda console, CodeWhisperer generates suggestions based on your existing code and comments, helping to accelerate your application development on AWS.
To get started, visit https://aws.amazon.com/codewhisperer/. Share your feedback with us at [email protected].
For more serverless learning resources, visit Serverless Land.


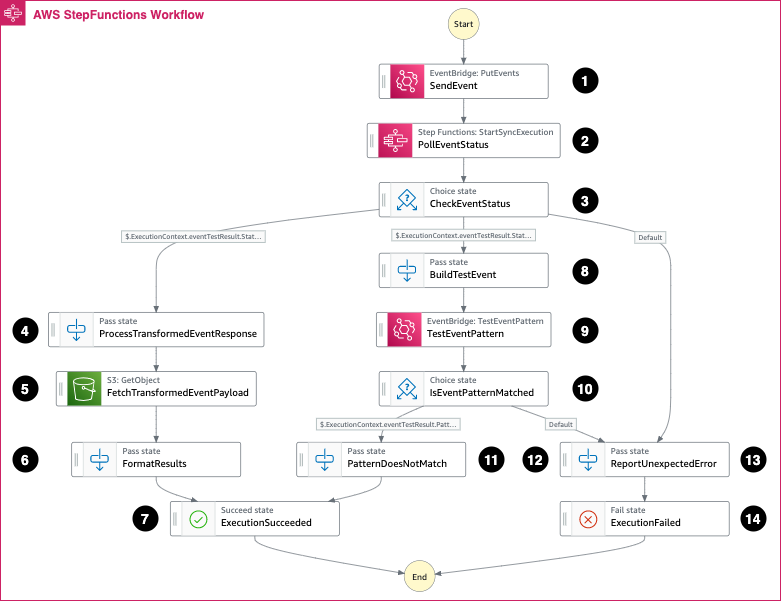
 The workflows collection currently supports deployable workflow templates defined with
  ASL is a JSON-based, structured language for authoring Step Functions workflows. It enables developers to filter and manipulate data at various stages of a workflow state’s execution using