Post Syndicated from The History Guy: History Deserves to Be Remembered original https://www.youtube.com/watch?v=b8_nISei1cY
Jailbreaking LLM-Controlled Robots
Post Syndicated from Bruce Schneier original https://www.schneier.com/blog/archives/2024/12/jailbreaking-llm-controlled-robots.html
Surprising no one, it’s easy to trick an LLM-controlled robot into ignoring its safety instructions.
See what’s possible in Zabbix 7.2!
Post Syndicated from Arturs Lontons original https://blog.zabbix.com/see-whats-possible-in-zabbix-7-2/29373/
Zabbix 7.2 is out now and available for download! The latest Zabbix major release introduces a range of new visualization features and widgets while adding a variety of updated monitoring features to support new use cases and scenarios. Read more to find out about the latest Zabbix features and improvements.
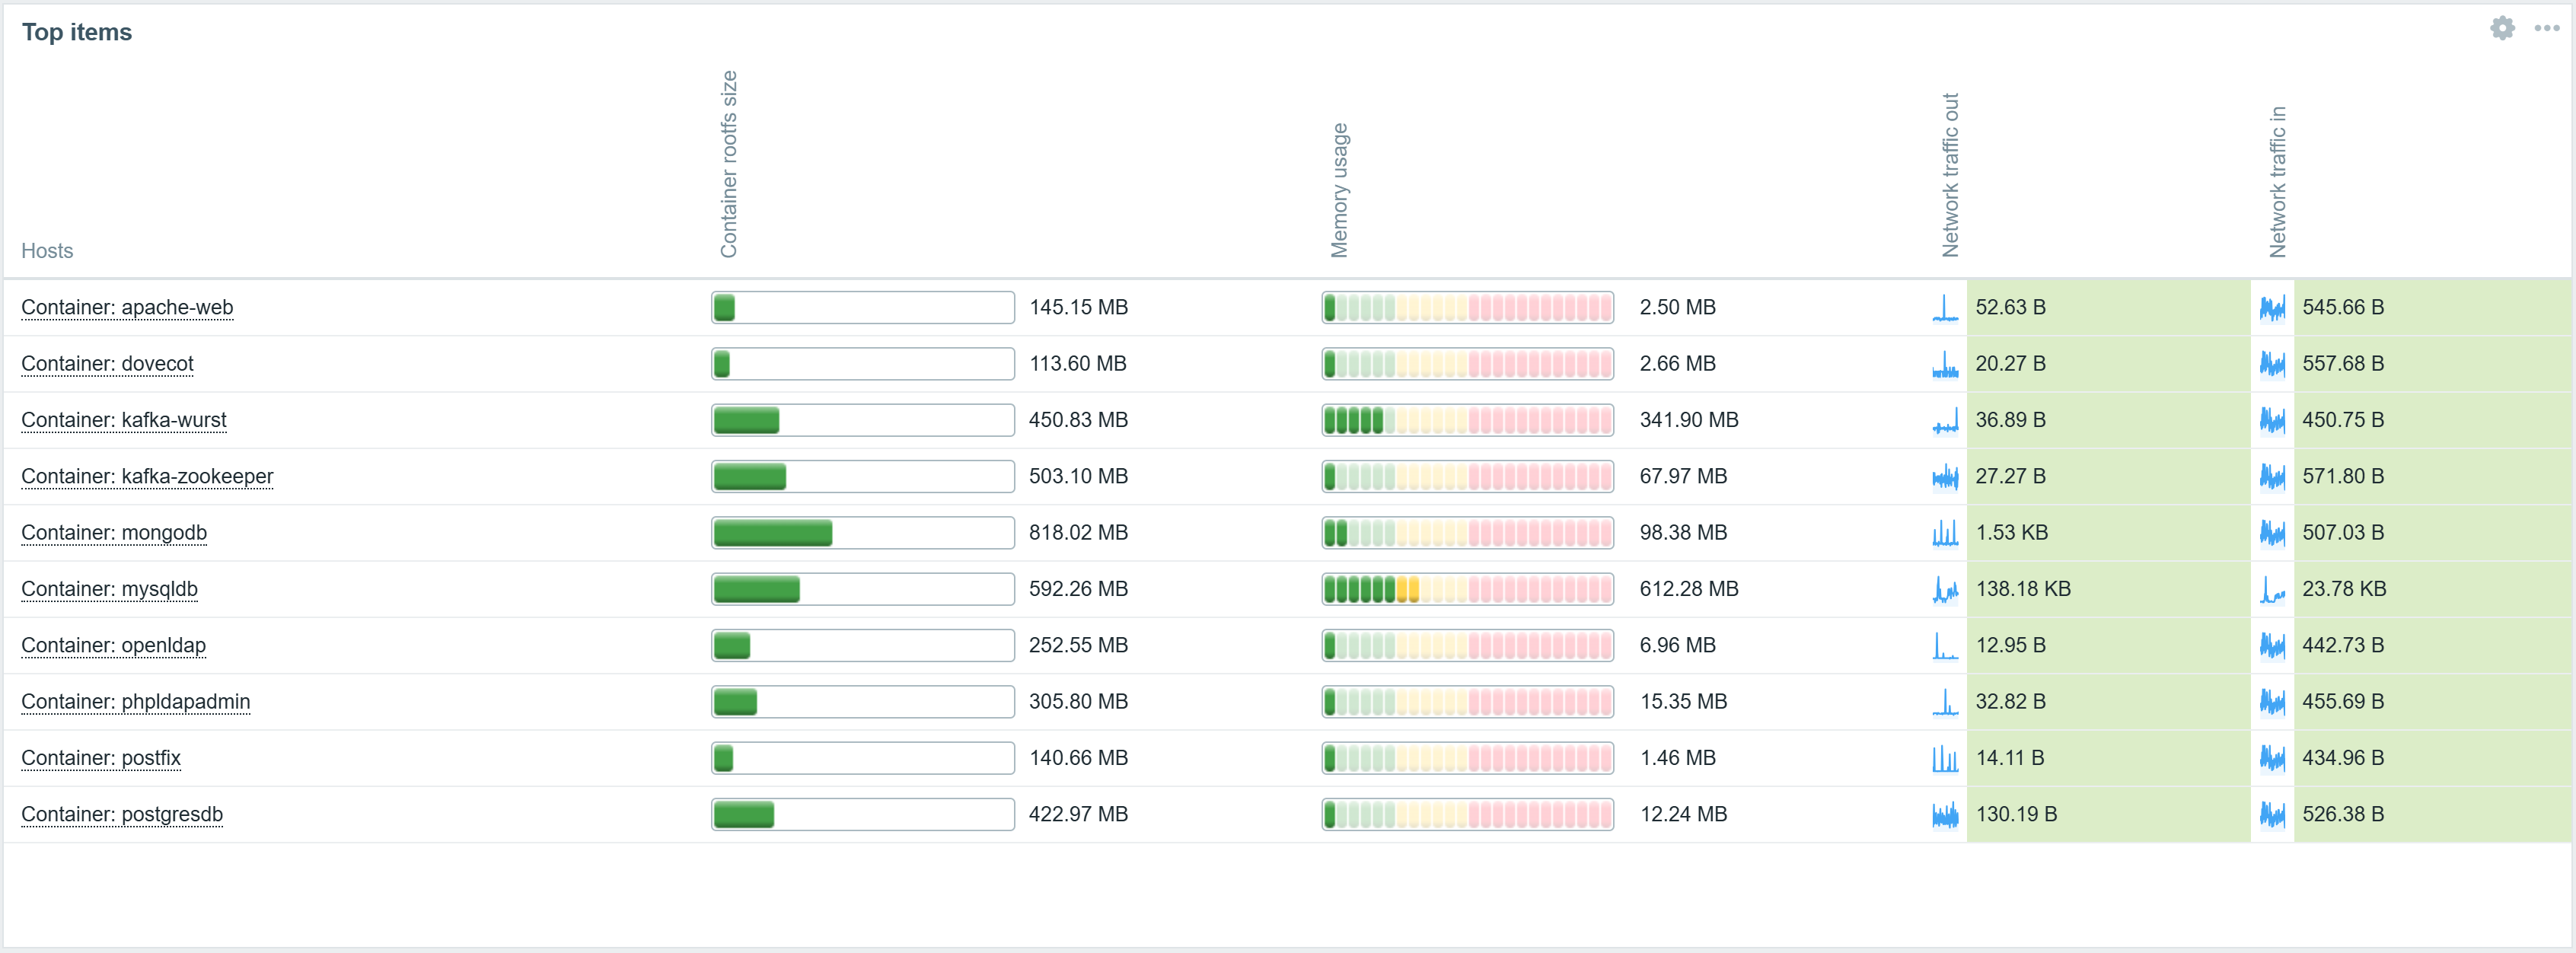
Top items widget
The previously deprecated Data overview widget has been converted to the new Top items widget. The Top items widget enables item selection via item patterns. The selected items are then displayed for hosts based on host and host group filters. This means that users are not limited to explicitly selected items or hosts, which enables dynamically matching items in rapidly changing environments.
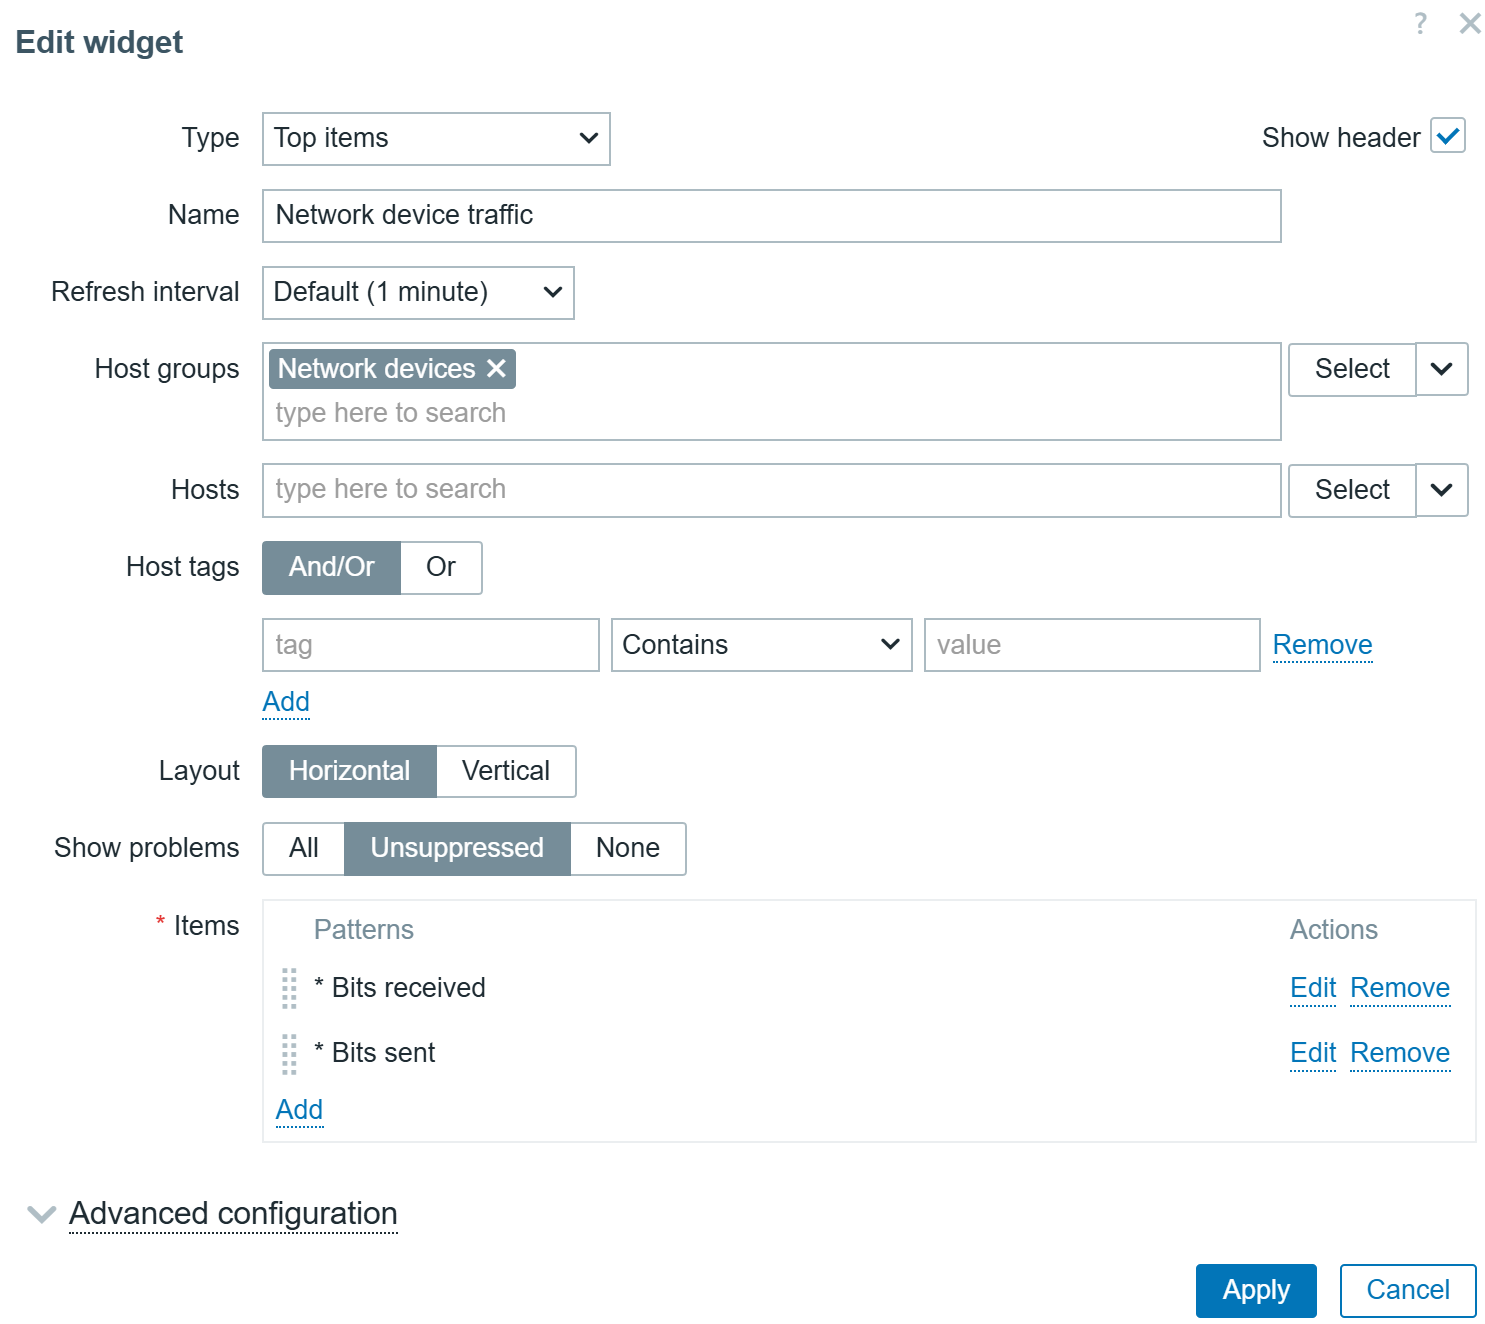
The widget supports Bar, Indicator, Sparkline, and As-is value visualization as well as defining value thresholds, enabling value highlighting for values exceeding the defined threshold.
Host card widget
The Host card widget adds the ability to display host information on Zabbix dashboards. The widget configuration supports selecting and ordering fields containing a variety of information about the host.
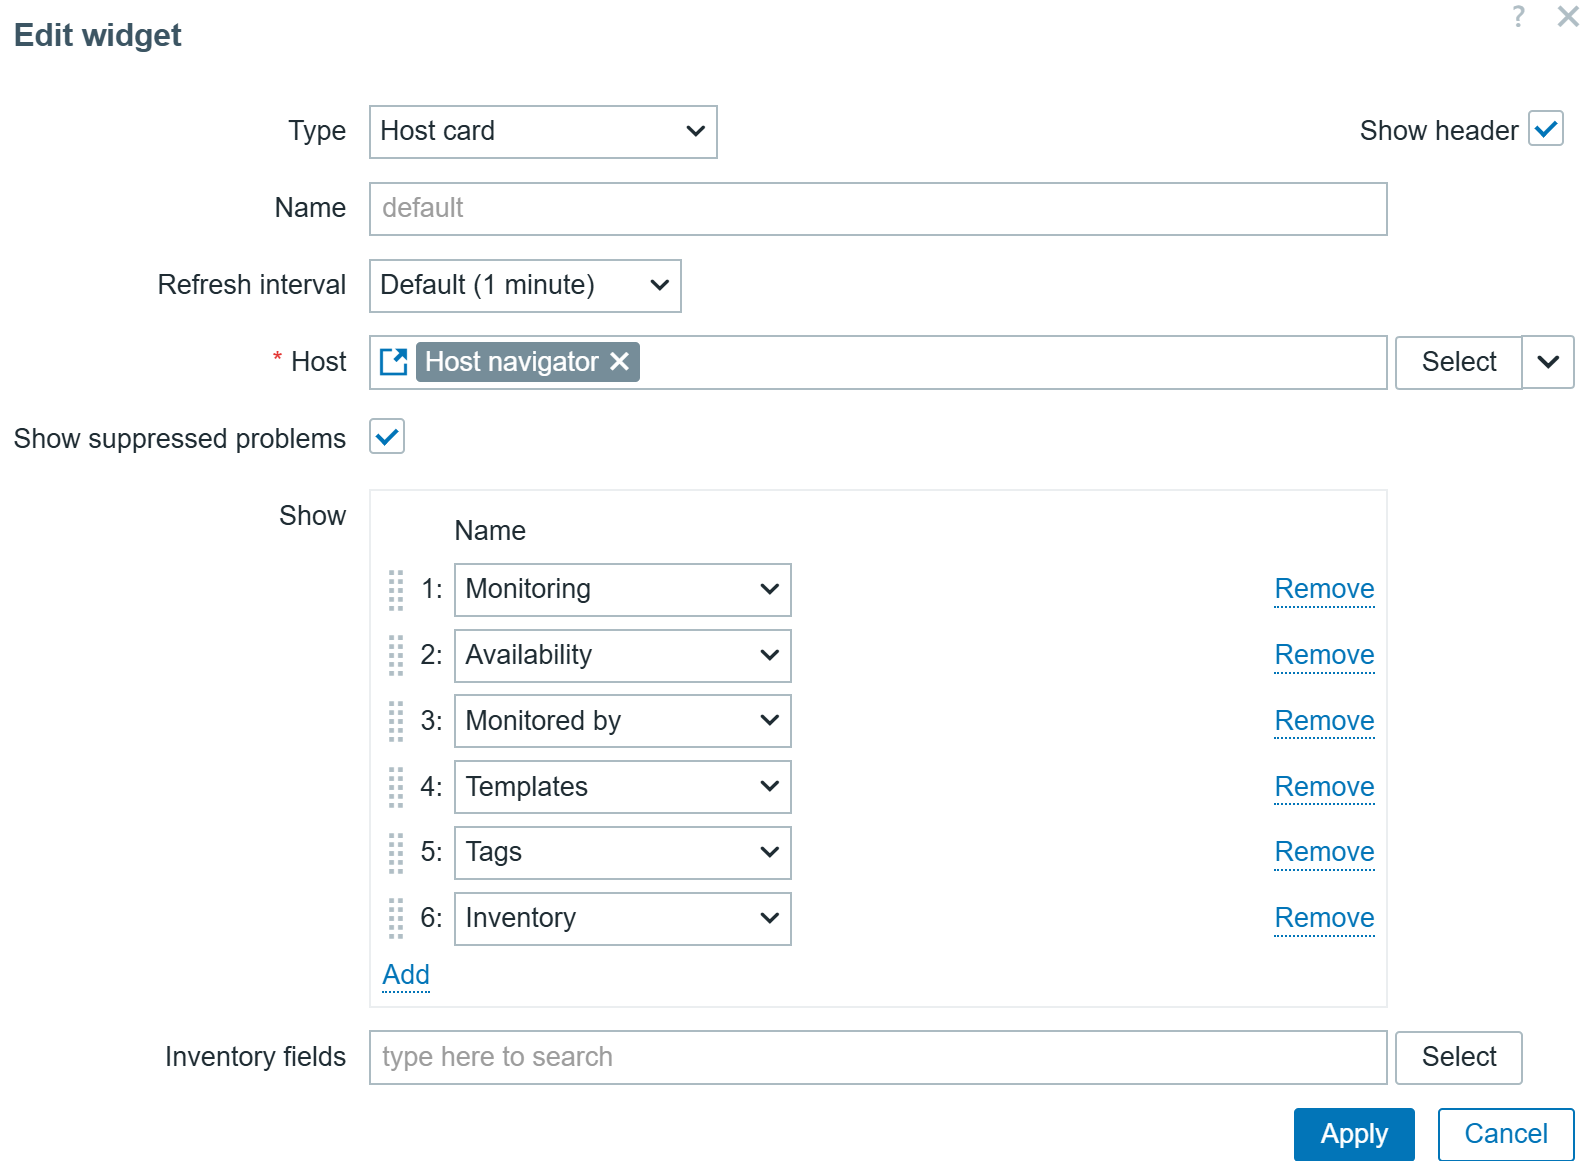
The widget also supports a multi-column layout. Host information can be displayed in 1-3 columns, depending on how the widget is placed on the dashboard.
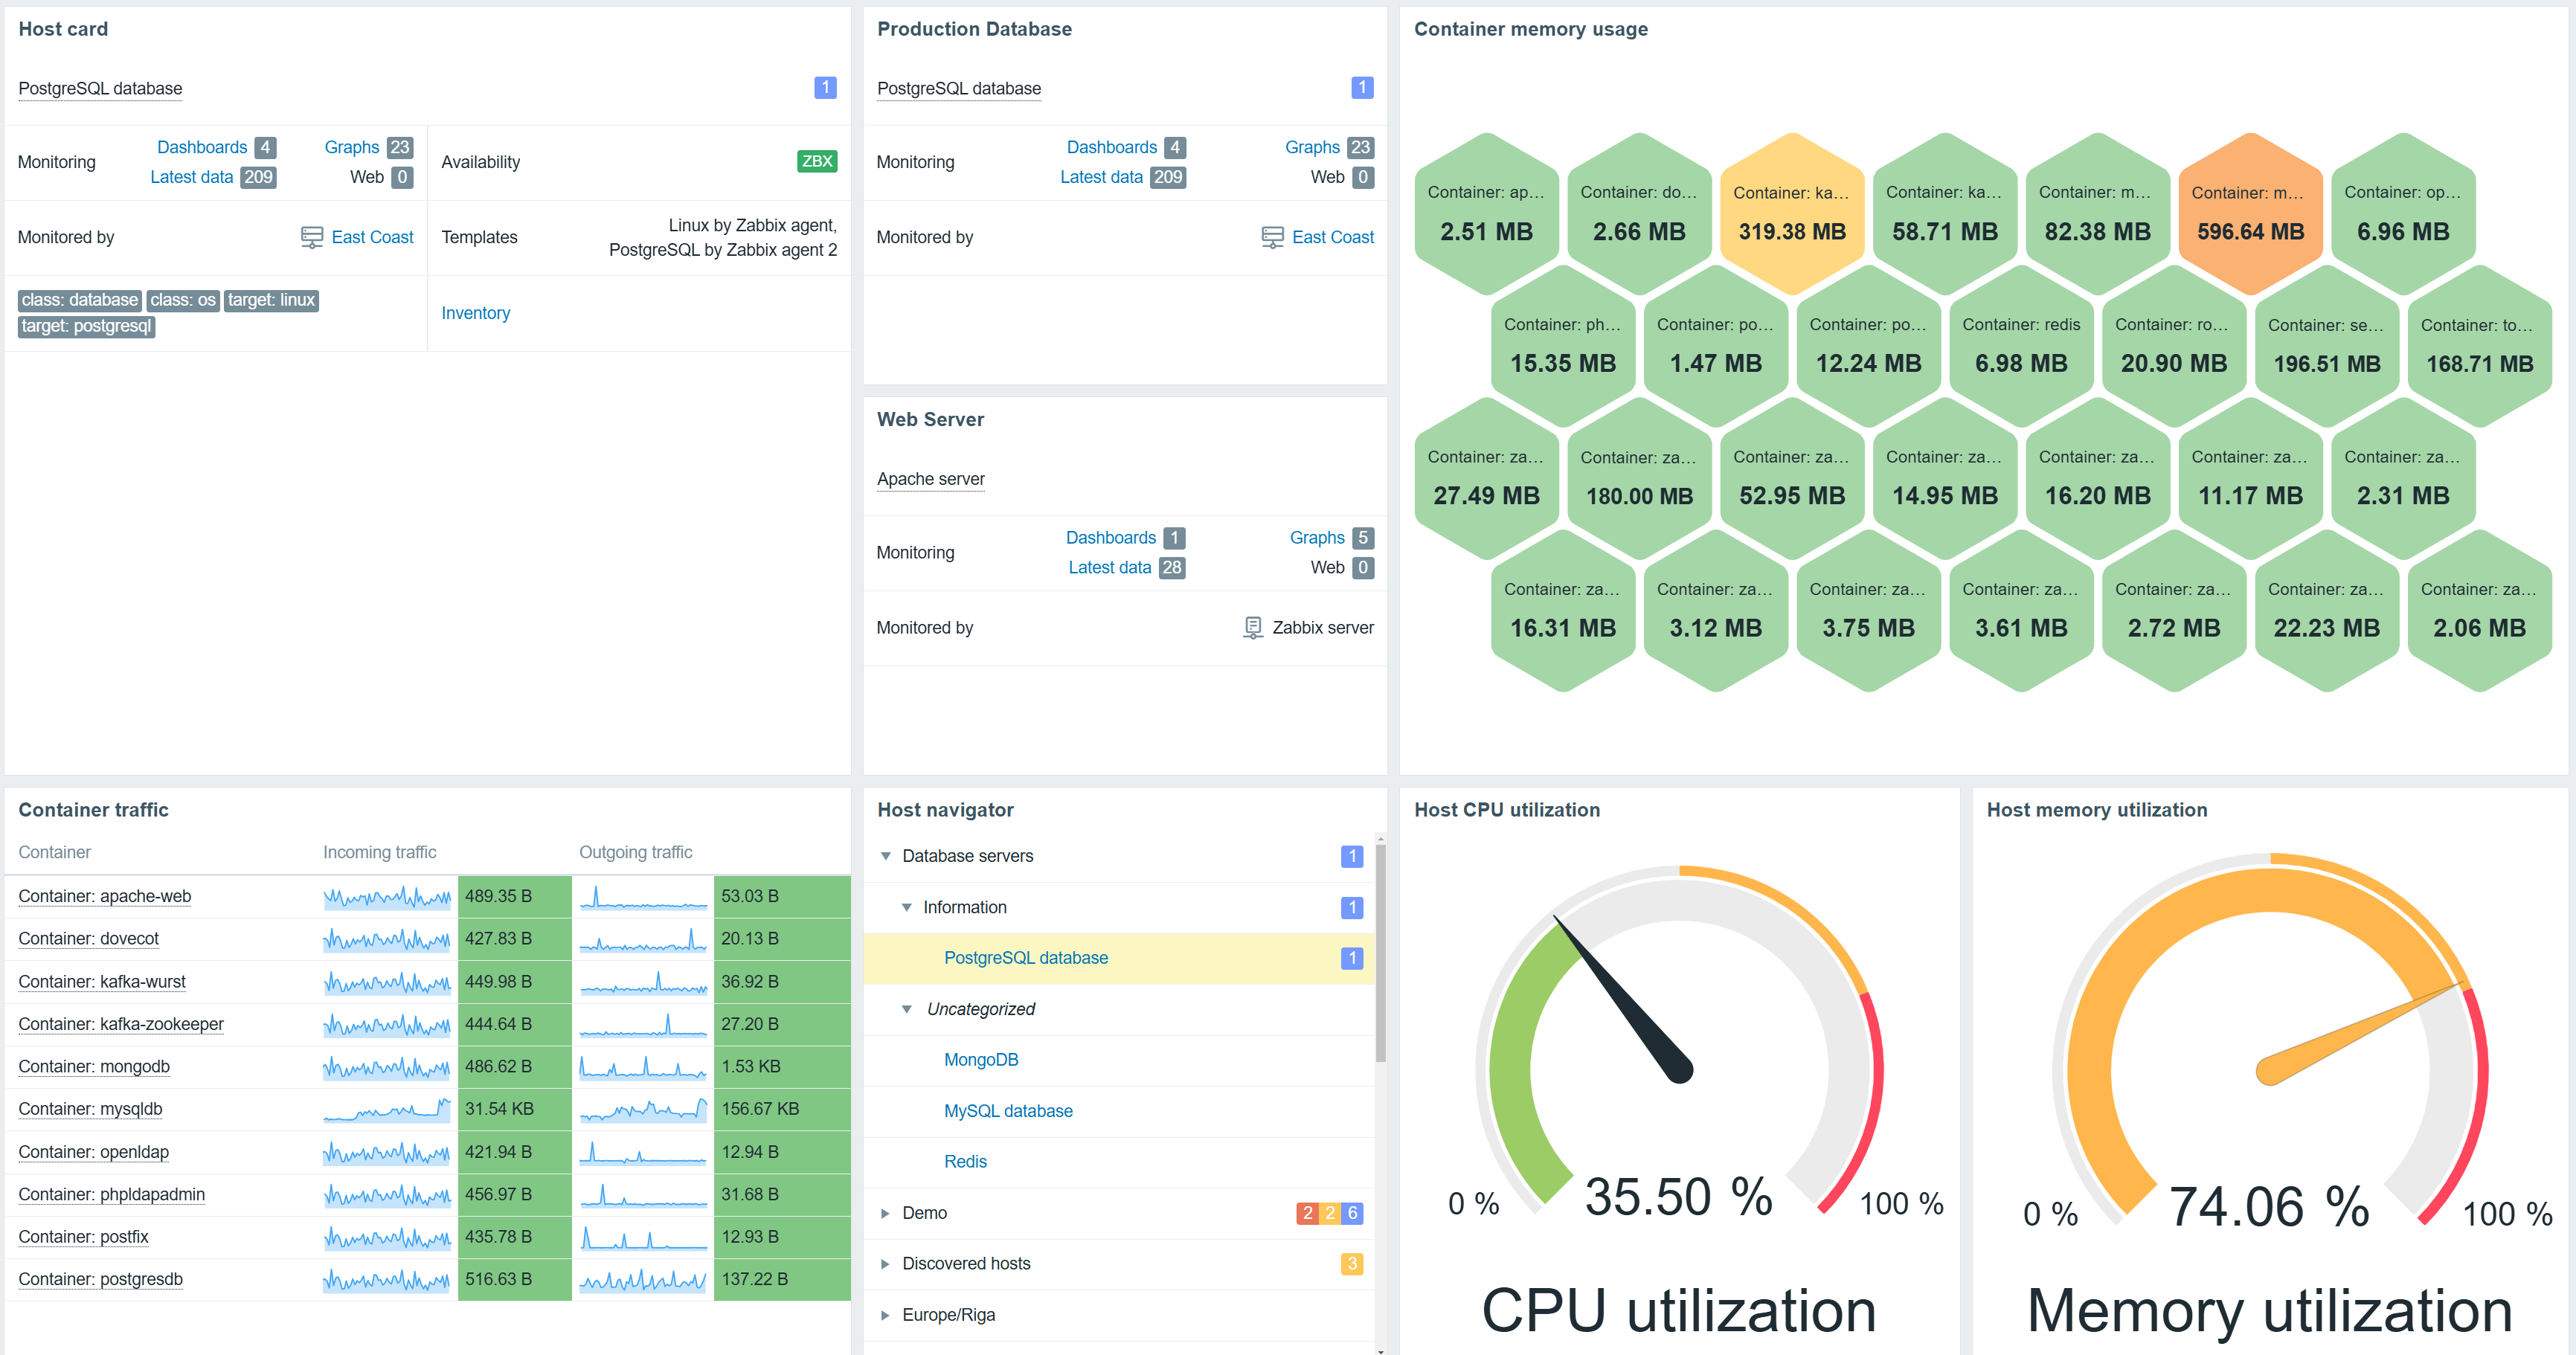
Sparkline chart
Sparkline charts have been introduced in Zabbix 7.2 as an additional visualization option for existing widgets. The goal of a sparkline chart is to provide additional over-time context when viewing collected values in widgets, such as the Item value widget. Sparkline charts are supported in Top items, Top hosts, and Item value widgets.
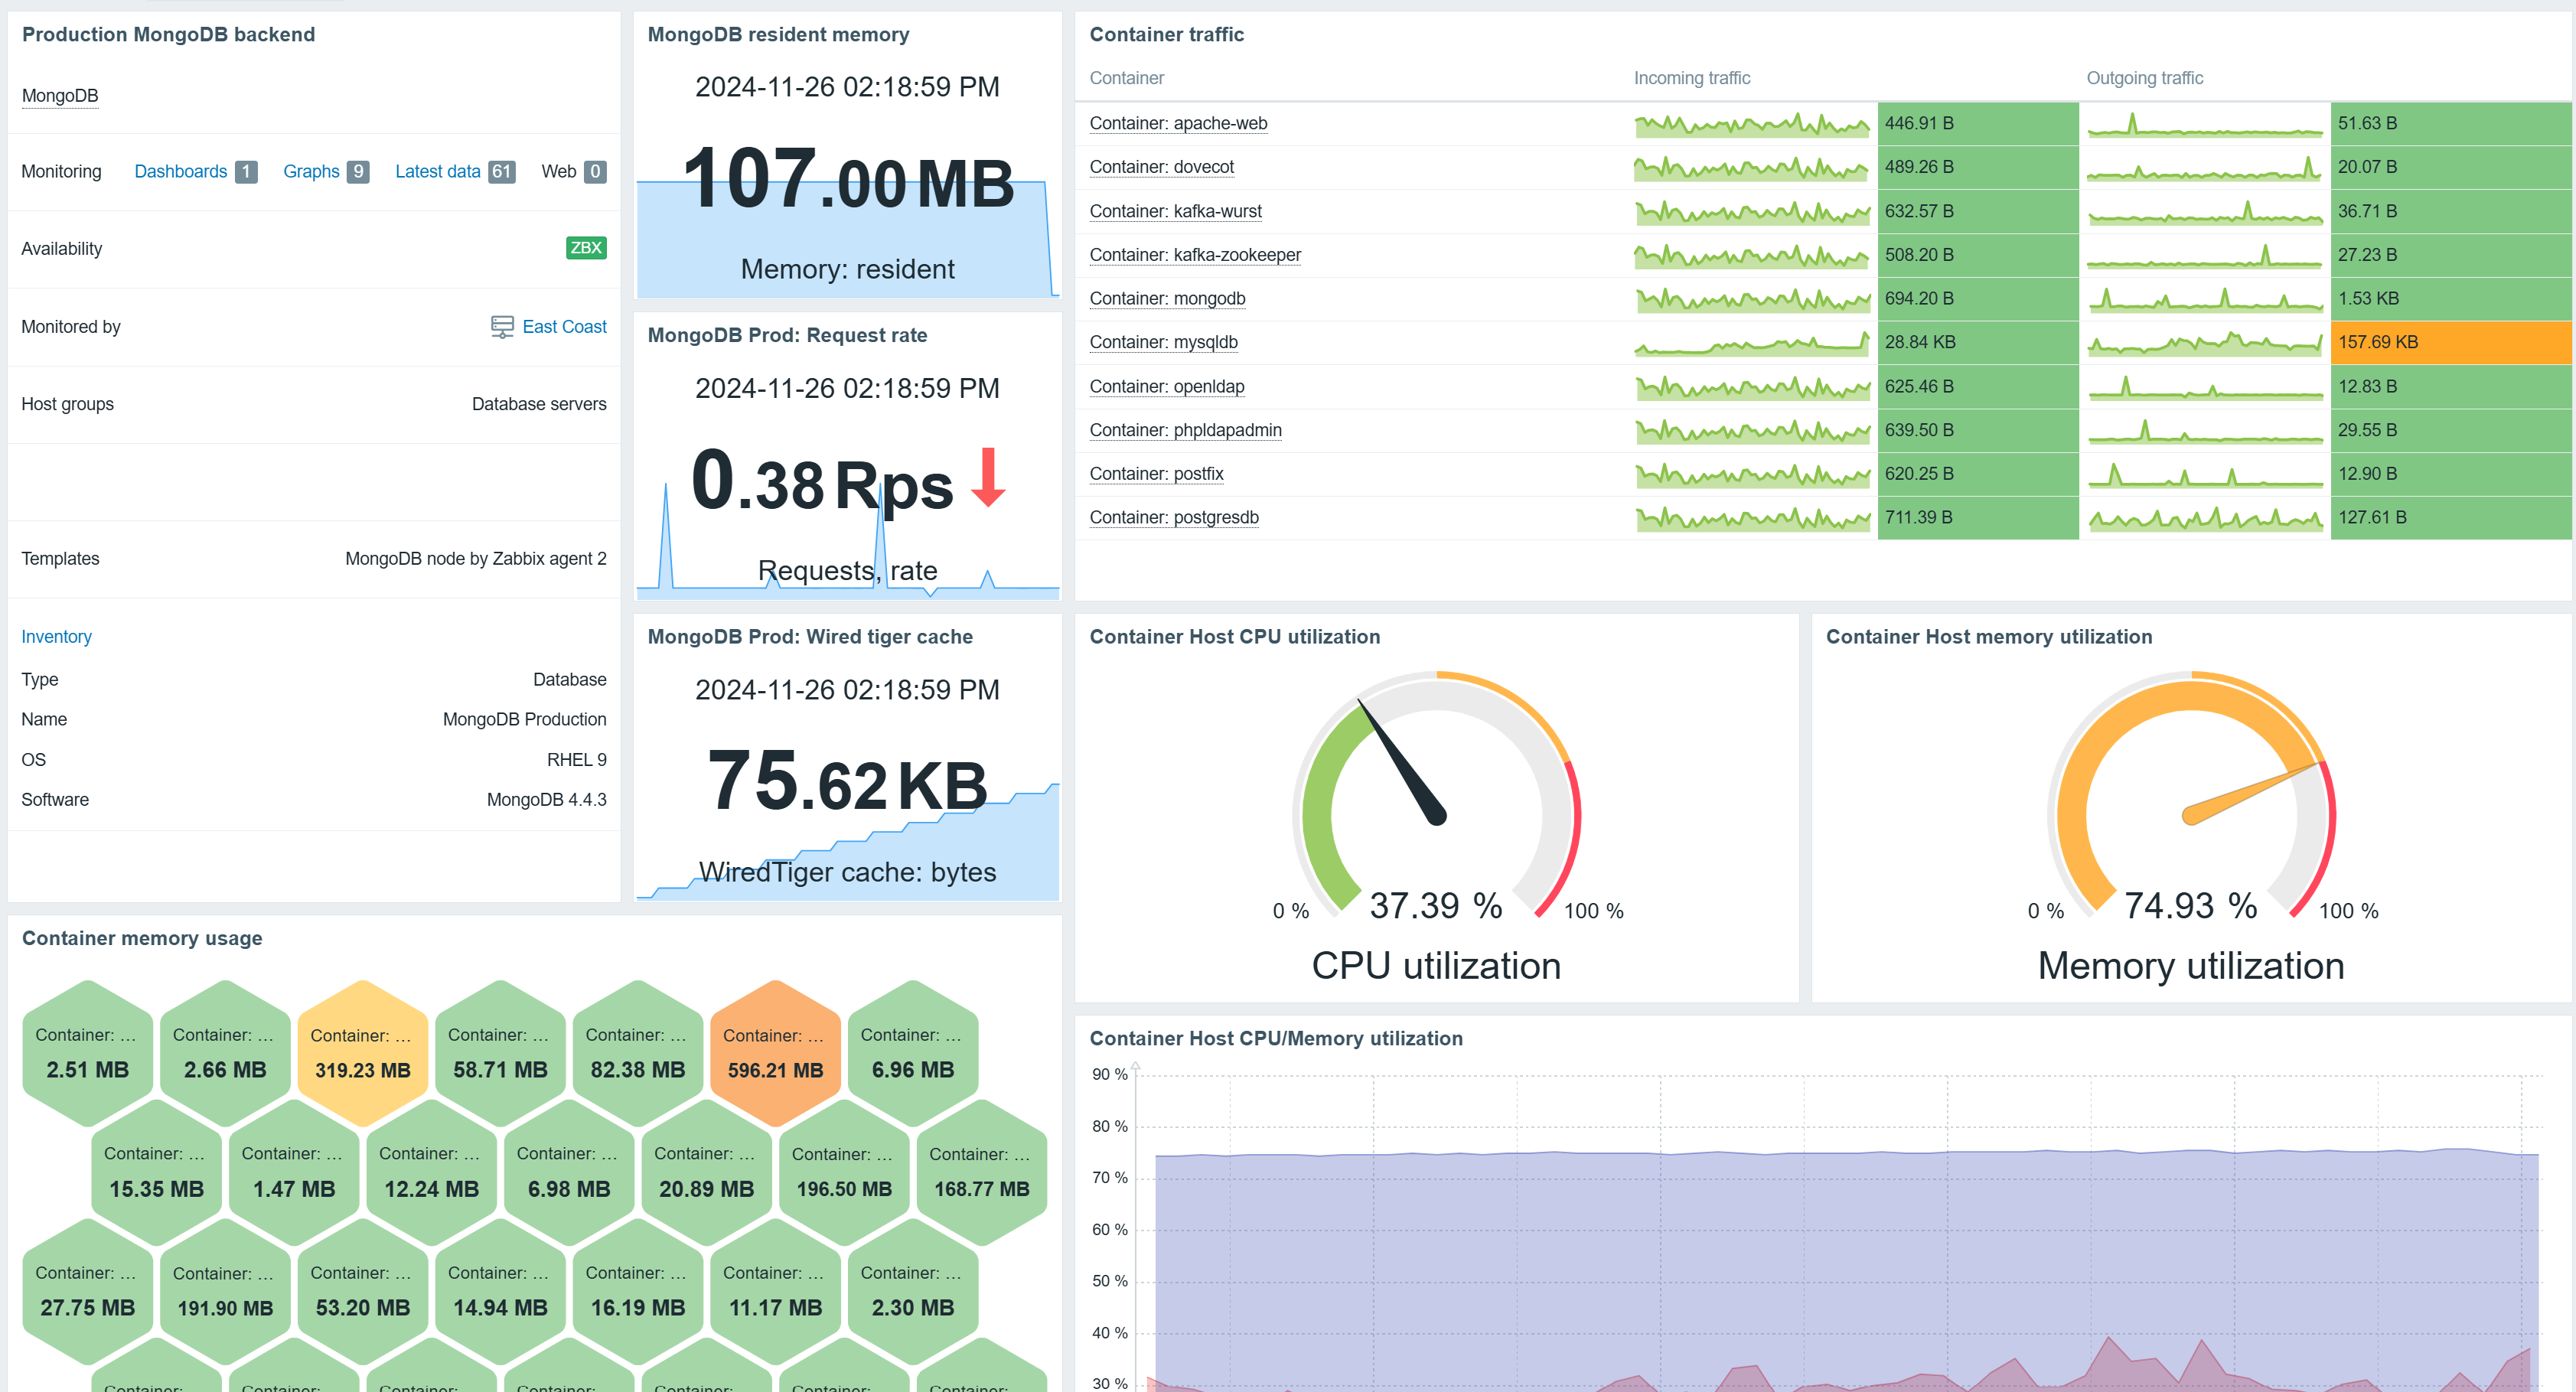
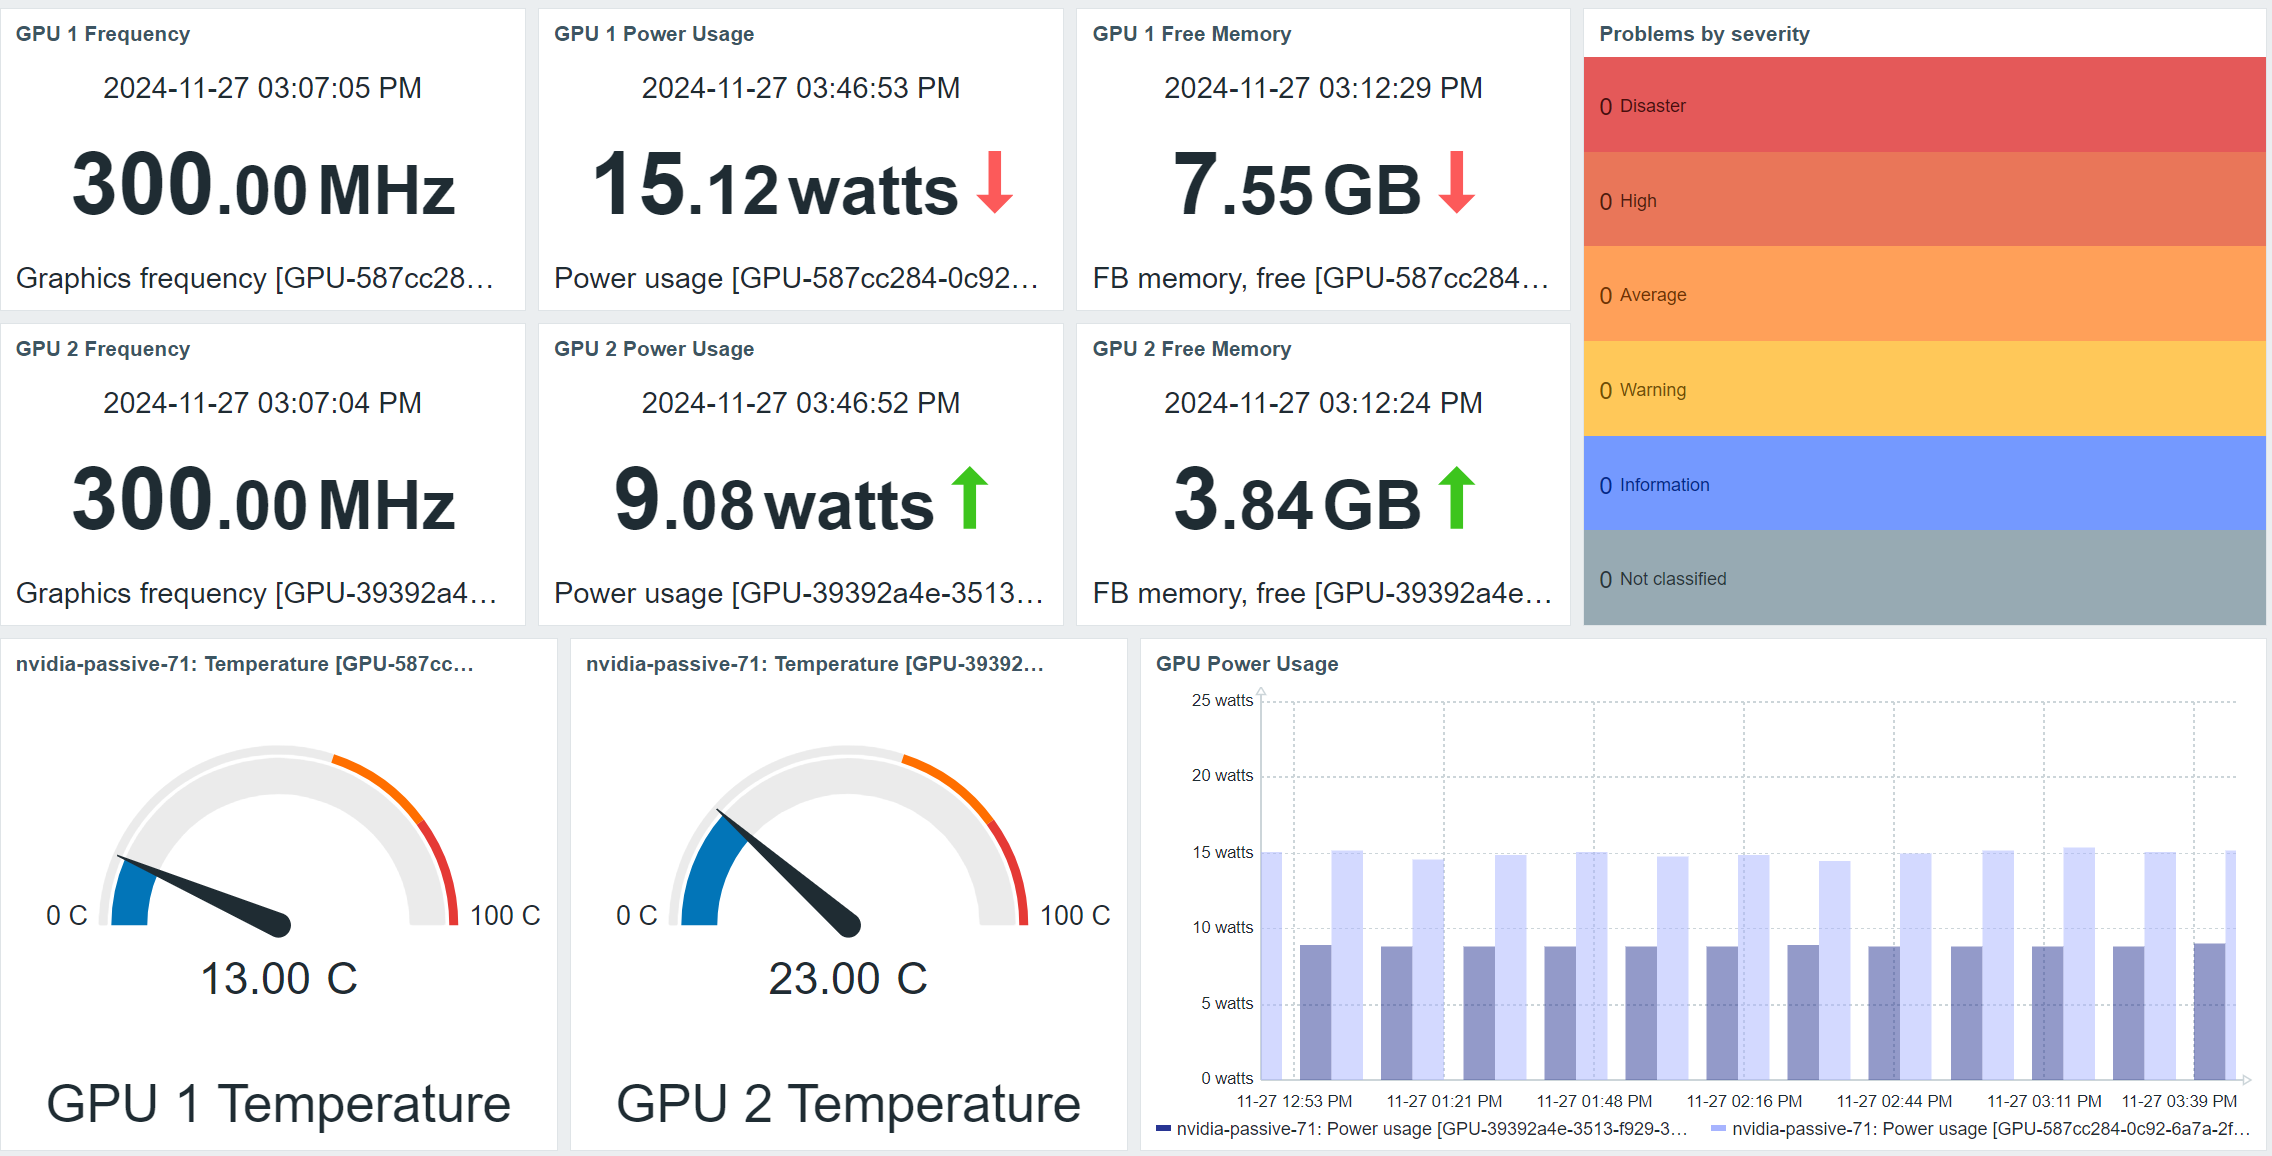
NVIDIA GPU monitoring template and Zabbix agent 2 plugin
Starting with Zabbix release 7.2.1, the newly released NVIDIA GPU monitoring template and Zabbix agent 2 plugin will allow agent 2 to automatically discover NVIDIA GPUs on Windows and Linux environments and start monitoring items such as GPU temperature, power usage, memory, frequency, and much more. The list of discovered and supported metrics may vary depending on the GPU model.
NETCONF monitoring with SSH item subsystem support
SSH subsystems are a set of remote commands predefined on the monitored endpoint. A common use case of an SSH subsystem is the NETCONF subsystem, used to manage network device configuration.
Zabbix 7.2 introduces a new parameter for the SSH monitoring item – ssh.run[unique short description,<ip>,<port>,<encoding>,<ssh options>,<subsystem>]
The subsystem parameter is used to specify an SSH subsystem and can be used to execute commands via SSH subsystems such as NETCONF or SFTP.
New and updated macros
- New {*.TIMESTAMP} macros can be used to populate alerts with the UNIXTIME value of problem detection, recovery, and update timestamps.
- The {EVENT.UPDATE.ACTIONJSON} macro resolves to a JSON array containing details of the actions performed during a problem update. This JSON value can be later used in integrations or scripts.
- The {SERVICE.ID} macro resolves to the numeric ID of the service that triggered the action.
- The {HOST.PORT} macro can now be used in the same locations as the {HOST.CONN} macro.
- The new {FUNCTION.VALUE<1-9>} and {FUNCTION.RECOVERY.VALUE<1-9>} macros can be used in expression macros to display a value of the Nth item-based function in the trigger expression. This can be used to display values in map labels or graph names.
VMware monitoring improvements
VMware monitoring has received multiple improvements and fixes in Zabbix 7.2:
- In addition to the previously supported VMware hypervisor discovery workflow, the template VMware Hypervisor can now be manually linked to a stand-alone hypervisor host.
- There is now a new item used to monitor the VMware virtual machine hypervisor maintenance status: vmware.vm.hv.maintenance[url,uuid]
- VMware event collection has been improved by adding the support of pagination. This reduces memory consumption resulting from a large number of collected VMware events.
New and updated templates
Zabbix 7.2 introduces multiple new templates:
- A variety of templates for LAMP stack monitoring by Zabbix agent active
- NVIDIA GPU
- Juniper MX series
- Huawei OceanStor V6 Dorado
- Nutanix Prism Element
- Website certificate by Zabbix agent 2 active
The following existing templates have also received fixes and updates:
- Dell iDrac and PowerEdge updated to use SNMP walk items
- Proxmox VE by HTTP – new disk space usage items/triggers
- MSSQL by ODBC performance counter query fixes
- Linux and Nextcloud – removed unnecessary discard unchanged preprocessing from LLD rules
- Microsoft 365 reports by HTTP description fixes
Additional changes and improvements
Additional changes and improvements introduced in Zabbix 7.2:
- Added support for CP_SPIN CPU state on OpenBSD
- Implemented new column configuration options in the Top hosts widget and support for binary item display
- Added support for LLD Macro {#UNIT.SERVICETYPE} in systemd.unit.discovery for Zabbix agent 2
- Updated maximum supported TimescaleDB version to 2.17
- Updated maximum supported PostgreSQL version to 17
- Added PubkeyAcceptedKeyTypes SSH public key algorithm configuration option
- Items now become unsupported when there are no pollers
- Removed support for Oracle DB
- Removed the dependent item count limit
- Added support of logarithmic Y-axis scaling in graphs
- Increased the max number of rows for some widgets, such as Top hosts
- Enabled usage of the mediatype.get method for users with the User role with a limited field scope
- Added the ability to assign override host (Widget, Dashboard) for graph widget data sets
- Implemented automatic selection of the first element of a broadcast-capable widget
- Implemented a new filter in media type list view to filter out media types by their usage in action
Download and install Zabbix 7.2
You can find instructions and download the new version on the download page .
In order to upgrade to Zabbix 7.2 you need to upgrade your repository package and download and install the new Zabbix component packages (Zabbix server, proxy, frontend, and other Zabbix components). When you start the Zabbix server, an automatic database schema upgrade will be performed. Zabbix agents are backward compatible, so installing the new agent versions is not required. Agent upgrade can be performed at a later time.
You can find detailed step-by-step upgrade instructions on our Upgrade procedure page.
Learn about new features and changes introduced in Zabbix 7.2 by visiting the “What’s new in Zabbix 7.2” page .
A detailed description of the new features can be found in the “What’s new” documentation section .
Take a look at the release notes to see the full list of new features and improvements.
The post See what’s possible in Zabbix 7.2! appeared first on Zabbix Blog.
„Той е моя вяра, мой свят, болест моя, лекар мой.“ Хомосексуалност и ислям
Post Syndicated from Атанас Шиников original https://www.toest.bg/toy-e-moya-vyara-moy-svyat-bolest-moya-lekar-moy-homoseksualnost-i-islyam/

Този път използвам като трамплин предишния си текст тук – за алкохола в обществата, където мюсюлманите са мнозинство, за да надзърнем към една малко по-чувствителна тема. Без да го обличаме в сложна терминология, е ясно, че често съществува разрив между доктрина и дела. Това важи за всички религии, нали? Естествено, с различно съдържание. С други думи, за да не ме обвинят в прекомерна абстрактност – мюсюлманите пият. Понякога ядат свинска пържола и сланина. Правят секс преди брака, че и извънбрачен (зина). А дори се случва да не изпълняват задължителните пет молитви (салат) на ден. Нарушават поста (саум) по време на месеца за пост (рамадан). Не дават задължителната милостиня (закат). Или имат хомосексуални връзки.
А за всяка от изброените по-горе примерни простъпки огромният, непроницаем и исторически развил се конструкт на мюсюлманския свещен закон (шари‘а) определя различни санкции. Затова и тук предлагам да повдигнем леко булото на арабския език и сложната, определяна пейоративно като „средновековна“ мюсюлманска доктрина относно хомосексуалността чрез някои едри исторически и религиозни щрихи.
Но преди да се превърна в оня Кирчо, когото „техните го търсят да го бият“ от филма „С деца на море“, да погледнем отново заглавното изображение.
Какво виждате?
На пръв поглед – това, което е. Нали според правилата на „патешкия тест“, ако изглежда като патица, плува като патица, квака като патица, вероятно е патица. Двама брадати мъже на възраст, в роби и с тюрбани, яхнали камили, се прегръщат, хванати за ръце. Не само се прегръщат, ами и направо се целуват уста в уста. Ако се подхлъзнем по първото впечатление, лесно може да се подведем и да пуснем на воля фантазията си. Погледнете и камилите – пъргави, палави, игриви, с преплитащи се крачета. Ами интимността на преплетените пръсти?
Обърнете внимание на детайлите: сочещия към главата на сивата камила крак на белобрадия, докато е обърнат към чернобрадия си другар. Вижте и колко хармонично белият тюрбан си хармонира с бялата дреха на другия, а синият тюрбан – със синята дреха. Не е ли всичко това пример за един чувствен мъжки съюз? За да не си мислите, че преувеличавам, има представители на академията, които смятат точно това.
В статия от 2022 г. австралийската изследователка на хомосексуалността Айся Захарин използва горната миниатюра. А тезата ѝ е, че консервативните религиозни авторитети в исляма винаги са представяли хомосексуалността през призмата на цис-хетеро морални стандарти, а не толкова от гледна точка на задълбочено разбиране на мюсюлманското Свещено писание (Корана) и традицията (Сунна). И като част от изложението се появява по-горното изображение. Както се обяснява в статията, то е илюстрация в ръкопис от XIII век, включващ истории (макамат) в поетична форма от Ал-Харири (1054–1122) от Басра. Ръкописът съдържа 99 запазени до днес миниатюри, които са високоценени, защото показват автентично живота на мюсюлманите през онова столетие. В изображението, категорично твърди авторката, са изобразени Абу Зайд и Ал-Харис, основните герои на „Макамите“ на Ал-Харири, яхнали камилите си, докато са се прегърнали през раменете, ръка за ръка, лице в лице, всъщност, „може би по-точно казано, уста в уста“. А над главите им, продължава авторката, има „сърцевидна форма“. Оттук и се прави вметката, че в обществата в исляма от дълго време съществуват сведения както за еротично привличане, така и за сексуални отношения между хора от един и същ пол.
Но ако се върна към патешкия тест, понякога сме склонни да припознаваме патица там, където такава няма.
Миниатюрата наистина е от препис на „Макамите“ на Ал-Харири, съхраняван във френската Национална библиотека. Но е твърде съмнително доколко въобще показва хомосексуални отношения. Гледането и четенето на стари извори може да бъде много хлъзгава територия. Или „совите не са това, което са“.
Тук ключът се крие в самия текст на историята. Цялото съчинение се води стара класика, преподавана в часовете по арабска литература. Представлява сборник от 50 на брой истории, че и в един от любимите ми периоди, единадесетото столетие, времето на Абасидския халифат. Разказвачът в историите се нарича Ал-Харис ибн Хаммам, но той разказва предимно за Абу Зайд. А Абу Зайд е типичен сладкодумен хитрец и в повечето случаи прави неща, които сега англоговорещите биха нарекли pranks. Гевезлъци, тарикатлъци и маймунджилъци, казано по нашенски. Всяка от тези истории в повечето случаи си има заглавие, свързано с някакво име на място. Например №9 – „От Александрия“ или „Александрийска“. №12 – „Дамаска“. №28 – „Самаркандска“, и т.н. Историята, в която се появяват двамата другари, е №31. Така се чете и в ръкописа, който гледаме, с малки сини букви под заглавието „Трийсет и първа макама (нещо като седянка)“ – „Рамлия“. Тоест „от Рамла“, което сега е в Израел.
Историята разказва за група поклонници, които попадат на Абу Зайд. Той им дръпва назидателна реч в поезия около ползата от поклонничеството и духовния път на правоверните, след което тайнствено се отдръпва. А Ал-Харис, разбрал, че това е неговият стар познайник, се опитва да го прегърне, но Абу Зайд изчезва в пустинята, поел обет за самотно поклонение по пътя към светите места на исляма. Няма и най-малък намек за хомоеротичност. И тук, и в целия текст на Ал-Харири. Има други смешни и позорни моменти, свързани с показване на срамни части, но не и свързани с мъжката любов. Ала в капана на подлъгващата привидност падат и други автори, които масово започват да използват тази илюстрация като визуален материал по темата за сексуалното привличане между мъже, например тук или тук, в материали, свързани с халифите гейове.
С други думи, ако искаме да покажем, че в мюсюлманския свят съществуват хомосексуални практики, може да стъпим на други, по-солидни доказателства. А такива никак не липсват. И докато през първите векове след появата на исляма свидетелствата за хомосексуални отношения са оскъдни, положението се променя с династията на Абасидите от средата на VIII век нататък. Тогава живее и enfant terrible на поезията Абу Нуас, чиято любов към младите момчета е равна само на любовта му към виното, откъдето и двете му слабости намират въплъщение във фигурата на младежа виночерпец (саки). Хомоеротичната му поезия и до днес е еталон в жанра. Но Абу Нуас не е сам.
Любовта към младежите е възпята от персийските поети, при които „тюрк“ започва да обозначава любовник,
доколкото робите – войници и слуги, обект на въжделение, са с такъв произход. А думата за момче, младеж, слуга, роб (гулам, мн.ч. гилман) носи отчетливи сексуални конотации, при все че изначално се появява в Корана като описание на прислужващите в Рая (Джанна) „юноши, които сякаш са скрити бисери“ (52:24). Оттук и е някак логично да открием мистична окраска в тези на пръв поглед хомоеротични мотиви.
Самите халифи, чиято титла означава ни повече, ни по-малко, а „наместник“, и то на самия Пророк, не остават настрани от историческата мода. Злите езици говорят за пламенната любов между халифа Ал-Амин, син на Харун ар-Рашид (онзи, когото познавате от „Хиляда и една нощ“), и неговия верен роб Каусар.
Той е моя вяра, мой свят, болест моя, лекар мой,
бил казал халифът. И заради този възлюбен майката на халифа Зубайда се опитва да привлече вниманието му и да го приклони към по-традиционната любов към нежния пол. Хитростта, която използва, е да му изпраща жени, облечени в мъжки дрехи. Тактиката не сработва, разказва средновековната историопис, но пък научаваме един любопитен термин – гуламийат, тоест „жени, които се обличат като момчета“, днес може да означава и „мъжкарани“.
Братът на Ал-Амин – халифът Ал-Мамун, също не изостава. Поел властта след кървав братоубийствен конфликт, той става известен и с любовта си към двата пола. Отвъд тази информация за жълтата преса, на нас в полето на арабистиката ни е познат повече като владетел, при когото процъфтяват интелектуалният живот, отношенията с Византия и преводаческата дейност на античното наследство от гръцки на арабски.
Възходът в описанието на любовта между възрастни мъже и младежи в този исторически период е забелязан от багдадски интелектуалци като Ал-Джахиз от VIII–IX век, който съставя краткото съчинение „Възхвала на робините и юношите“. Кратък, пикантен, че и нелишен от ирония, трактатът представлява въображаема размяна на реплики между любителите на юношите и на женската красота. А предимството на юношите пред робините ясно си личи – ако искат да опишат някоя робиня, че е красива, казвали: „Като че ли е юноша!“
И тенденцията не изчезва. Дворцовият живот, пировете и хамамите на владетелите и елита от мюсюлманска Испания, през Египет и Османската империя, до Иран и Индия – всички те стават свидетели на любовни увлечения между мъже. Западните ориенталисти през XIX век с почуда, отвращение и любопитство описват феномени като
мъжките танцьори в Египет, облечени като жени (хауал), или турските женствени момчета танцьори (осм.-тур. кючек).
И забавленията, предлагани от хауалите, далеч не се изчерпват с визуално-сценичните изкуства.
Днес пък същата дума, която обозначава пасивната страна в една мъжка хомосексуална връзка, се използва в Египет като обида, еквивалент е на нашенската, започваща с п. Впрочем научих я от египетски дипломати, които така наричаха софийските автоджигити по улиците.
А пък османската „порнотопия“, както я нарича изследователят на османската еротика Ирвин Джемил Шик, успява да произведе и илюстрации на гей практиките от XVIII век. Няма да ги привеждаме тук, за да не скандализираме по-чувствителните читатели. Не е ли вярно, че на едно по-прозаично и съвременно ниво винаги ще се намери някой познат, пътувал в арабския свят, който ни носи истории как там е „пълно с мъже, които се държат за ръка“. Доколко това непременно афишира влечение към същия пол, е съмнително, но знае ли човек? Във всеки случай привлича вниманието ни.
Тази нишка на един исторически и съвременен разказ върви доста приемливо от съвременна гледна точка, нали? Ориентът, от една страна, погледнато на повърхността, е традиционен и патриархален. Но
отвъд привидната консервативност, в пласта на едно бълбукащо от екзотизъм ежедневие, той се оказва пищен, щедър, пъстър и приемащ.
В него има ниша за всякакви сантименти и влечения. Да не се преструваме, че такива не съществуват. Тук една основна популярна аргументативна пътечка върви така – от много рано в мюсюлманските общества са налице хомосексуални практики. Те са масови. Значи всичко е наред. Ако има доказателства за наличието на нещо, съществуването му го оправдава и от нормативна гледна точка. Какво правим, е по-важно от това, което някой твърди, че е правилно.

Но да погледнем от другата страна на бариерата. Защото такава съществува.
Тук може да оставим забавните разкази и да започнем с шокиращата част. Помните какво правеха от ИДИЛ с мъжете, заподозрени в хомосексуални връзки. Имаха си доста постоянна практика. Хвърляха ги от покривите на сгради или ги пребиваха с камъни, като документираха с видеа или снимки „налагането на наказание според шариата“.
Това беше отразено и в докладите на Държавния департамент на САЩ от 2016 г. относно човешките права в Ирак и Сирия. „Собственият ми баща би оставил ИДИЛ да ме убие“, казва в материал за BBC през 2015 г. Таим, тогава 24-годишен студент по медицина, който успява да избегне подобна злочеста участ, като бяга от Ирак в Ливан. Там продължава да бъде тормозен от рода си заради това, че е гей. Както разкрива статия на Вашингтонския институт за близкоизточна политика,
може да се идентифицират поне 27 случая на убийство на хора, за които се твърди, че са гей. Предпочитаният метод е хвърляне от високо, но има и случаи на убиване с камъни, обезглавяване или застрелване.
За да не си помислите, че ИДИЛ е изолиран случай, уязвимото положение на ЛГБТ общността се отбелязва и в справки като тази на Комисията по международна религиозна свобода в САЩ под надслова „Шариатът и ЛГБТИ хората“. Там се прокарва и връзката между свещения закон и смъртното наказание на членове на ЛГБТИ общността в страни, в които правната регулация е повлияна от шариата. Публикувано през 2021 г., в обобщението се отбелязва, че в подобни страни съществуват и наказания относно сексуални отношения извън брака, богохулство и отстъпничество. Според по-нови справки, към 2024 г. хомосексуалността е криминализирана в 64 страни в глобален план, а смъртно наказание е възможно да получите в Афганистан, Бруней, Иран, Йемен, Катар, Мавритания, Нигерия, ОАЕ, Пакистан, Саудитска Арабия, Сомалия и Уганда.
Като гротесков случай може да припомним и как скандалният Абу Нуас попада в арабските медии през 2001 г. Новинарските емисии на арабски съобщават, че
египетското Министерство на културата е подложило на аутодафе около 6000 тома с поезия на средновековния любител на виното и юношите заради хомоеротично съдържание,
което подрива обществения морал и обижда добрите нрави. Министерството отрича, но новината стига и до The Economist.
В тази връзка е възможно да си помислим следното: исторически наблюдаваме изключително много хомосексуални практики в общества с мюсюлманско мнозинство. Групировки като ИДИЛ са инцидентни, предимно модерни и изразяват изключително фундаментализирани, радикализирани, уродливи и следователно нелегитимни гледни точки. Отприщванията на хомофобски прояви са спорадични и непредставителни, пък и понякога могат да бъдат приписани на външно влияние, промени в обществения контекст, местни племенни или общностни традиции. Следователно
няма как тази чудовищност да бъде устойчиво мотивирана от религиозна гледна точка, тоест почива на напълно погрешна интерпретация на догмата.
Но нека се върнем крачка назад и потърсим историческата перспектива към хомосексуалните практики в мюсюлманския свещен закон.
(Следва продължение.)
В рубриката „Ориент кафе“ Атанас Шиников поднася любопитни теми, свързани не толкова с горещата политика, колкото с историята и културата на Близкия изток. А той, древен и днешен, е по-близко до нас и съвремието ни, отколкото си представяме.
Third Largest Ships in the US Navy: Mercy and Comfort
Post Syndicated from The History Guy: History Deserves to Be Remembered original https://www.youtube.com/watch?v=bk2RTx-kXJo
Comic for 2024.12.11 – Groper Comic
Post Syndicated from Explosm.net original https://explosm.net/comics/groper-comic
New Cyanide and Happiness Comic
The Maritime Approximation
Post Syndicated from xkcd.com original https://xkcd.com/3023/
 is a circle.")
A Note from our Executive Director
Post Syndicated from Let's Encrypt original https://letsencrypt.org/2024/12/11/eoy-letter-2024/

This letter was originally published in our 2024 Annual Report.
The past year at ISRG has been a great one and I couldn’t be more proud of our staff,
community, funders, and other partners that made it happen. Let’s Encrypt continues to
thrive, serving more websites around the world than ever before with excellent security
and stability. Our understanding of what it will take to make more privacy-preserving
metrics more mainstream via our Divvi Up project is evolving in important ways.
Prossimo has made important investments in making software critical infrastructure safer, from TLS and DNS to the Linux kernel.
Next year is the 10th anniversary of the launch of Let’s Encrypt. Internally things have changed dramatically from what they looked like ten years ago, but outwardly our service hasn’t changed much since launch. That’s because the vision we had for how best to do our job remains as powerful today as it ever was: free 90-day TLS certificates via an automated API. Pretty much as many as you need. More than 500,000,000 websites benefit from this offering today, and the vast majority of the web is encrypted.
Our longstanding offering won’t fundamentally change next year, but we are going to introduce a new offering that’s a big shift from anything we’ve done before – short-lived certificates. Specifically, certificates with a lifetime of six days. This is a big upgrade for the security of the TLS ecosystem because it minimizes exposure time during a key compromise event.
Because we’ve done so much to encourage automation over the past decade, most of our subscribers aren’t going to have to do much in order to switch to shorter lived certificates. We, on the other hand, are going to have to think about the possibility that we will need to issue 20x as many certificates as we do now. It’s not inconceivable that at some point in our next decade we may need to be prepared to issue 100,000,000 certificates per day.
That sounds sort of nuts to me today, but issuing 5,000,000 certificates per day
would have sounded crazy to me ten years ago. Here’s the thing though, and this is
what I love about the combination of our staff, partners, and funders – whatever it
is we need to do to doggedly pursue our mission, we’re going to get it done. It was
hard to build Let’s Encrypt. It was difficult to scale it to serve half a billion websites. Getting our Divvi Up service up and running from scratch in three months to service exposure notification applications was not easy. Our Prossimo project was a primary contributor to the creation of a TLS library that provides memory safety while outperforming its peers – a heavy lift.
Charitable contributions from people like you and organizations around the world
make this stuff possible. Since 2015, tens of thousands of people have donated.
They’ve made a case for corporate sponsorship, given through their DAFs, or set up
recurring donations, sometimes to give $3 a month. That’s all added up to millions
of dollars that we’ve used to change the Internet for nearly everyone using it. I hope
you’ll join these people and help lay the foundation for another great decade.
Josh Aas
Executive Director
He Stole a Marine A-4.
Post Syndicated from The History Guy: History Deserves to Be Remembered original https://www.youtube.com/watch?v=Gdzk0d9Rw1I
Systemd 257 released
Post Syndicated from corbet original https://lwn.net/Articles/1001657/
Systemd 257 has been released. As usual, the list of changes is long; it
includes support for multipath TCP in socket units, the ability to run
processes as init in their own PID namespace, a new tool for signing EFI
binaries for secure boot,
and a superhero emoji in the run0 shell prompt, among many other things.
Also, support for version-1 control groups has been disabled and requires
an elaborate dance to re-enable; it will be removed entirely in the next
release, along with support for System V service scripts.
Patch Tuesday – December 2024
Post Syndicated from Adam Barnett original https://blog.rapid7.com/2024/12/10/patch-tuesday-december-2024/

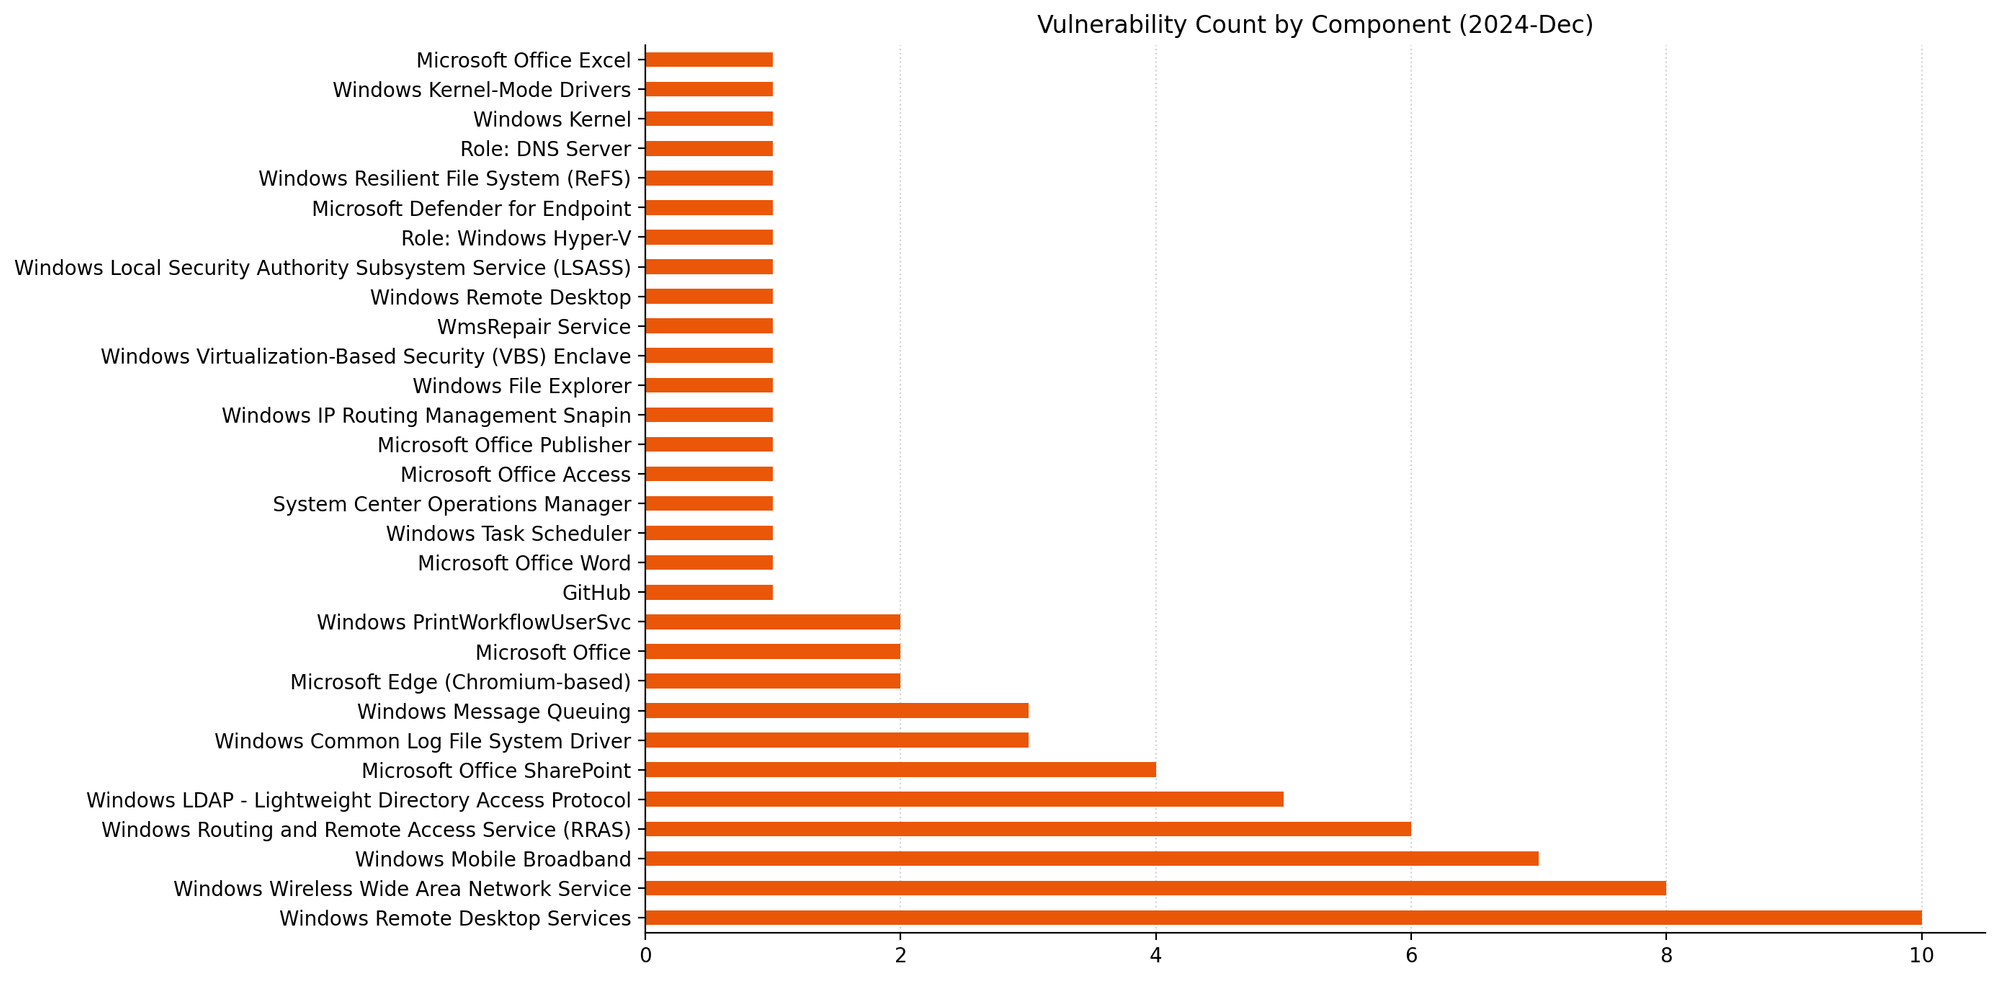
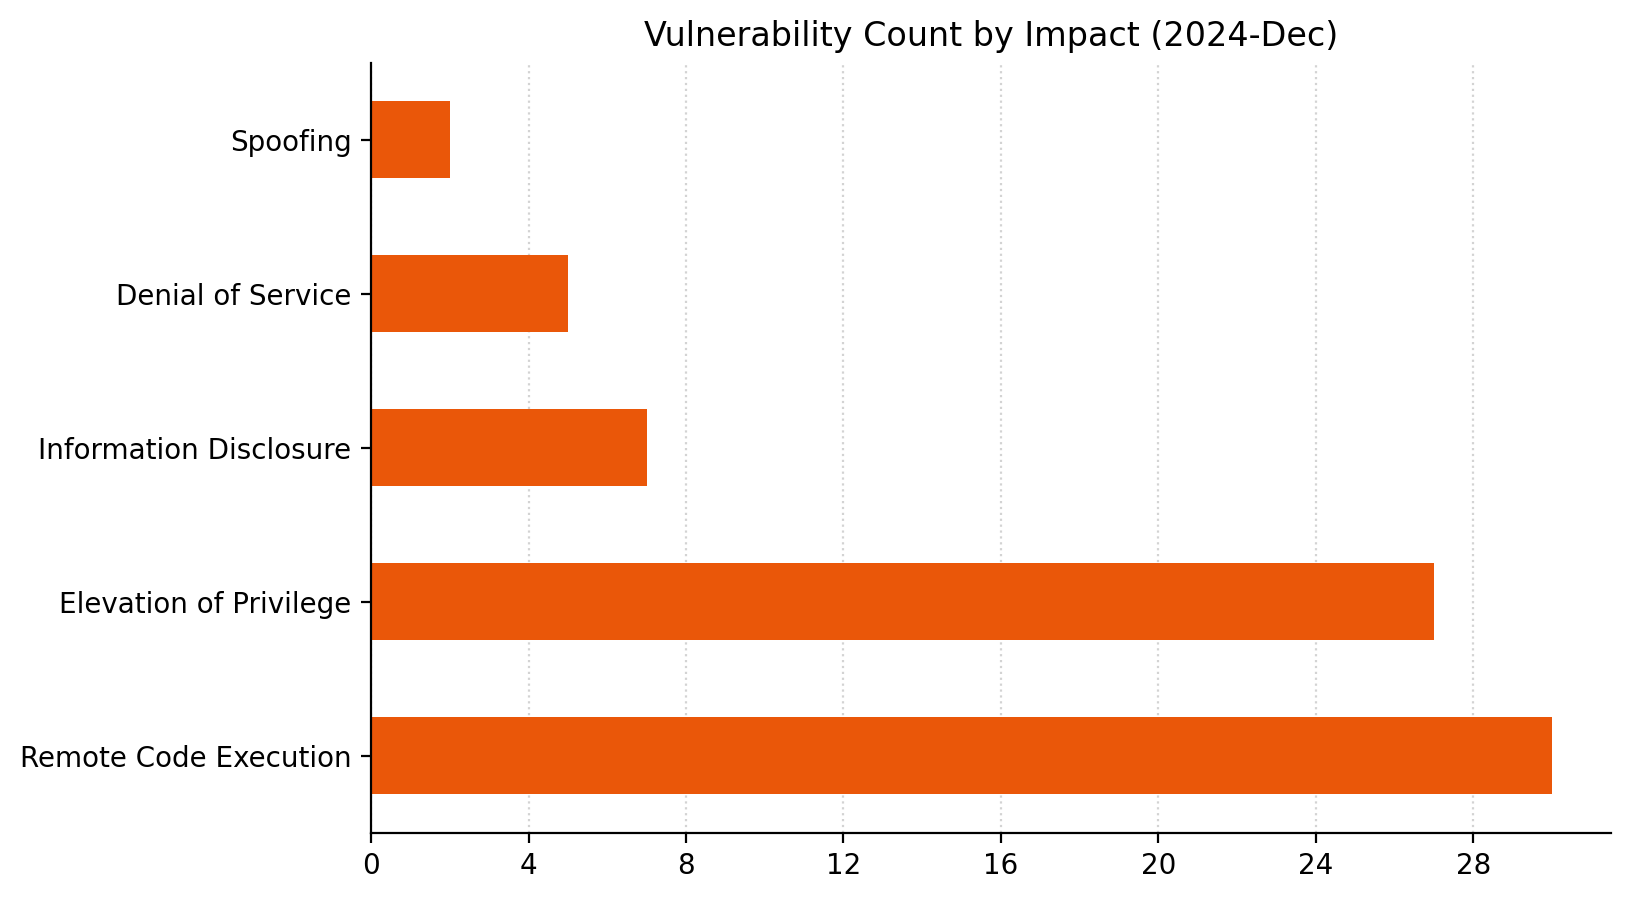
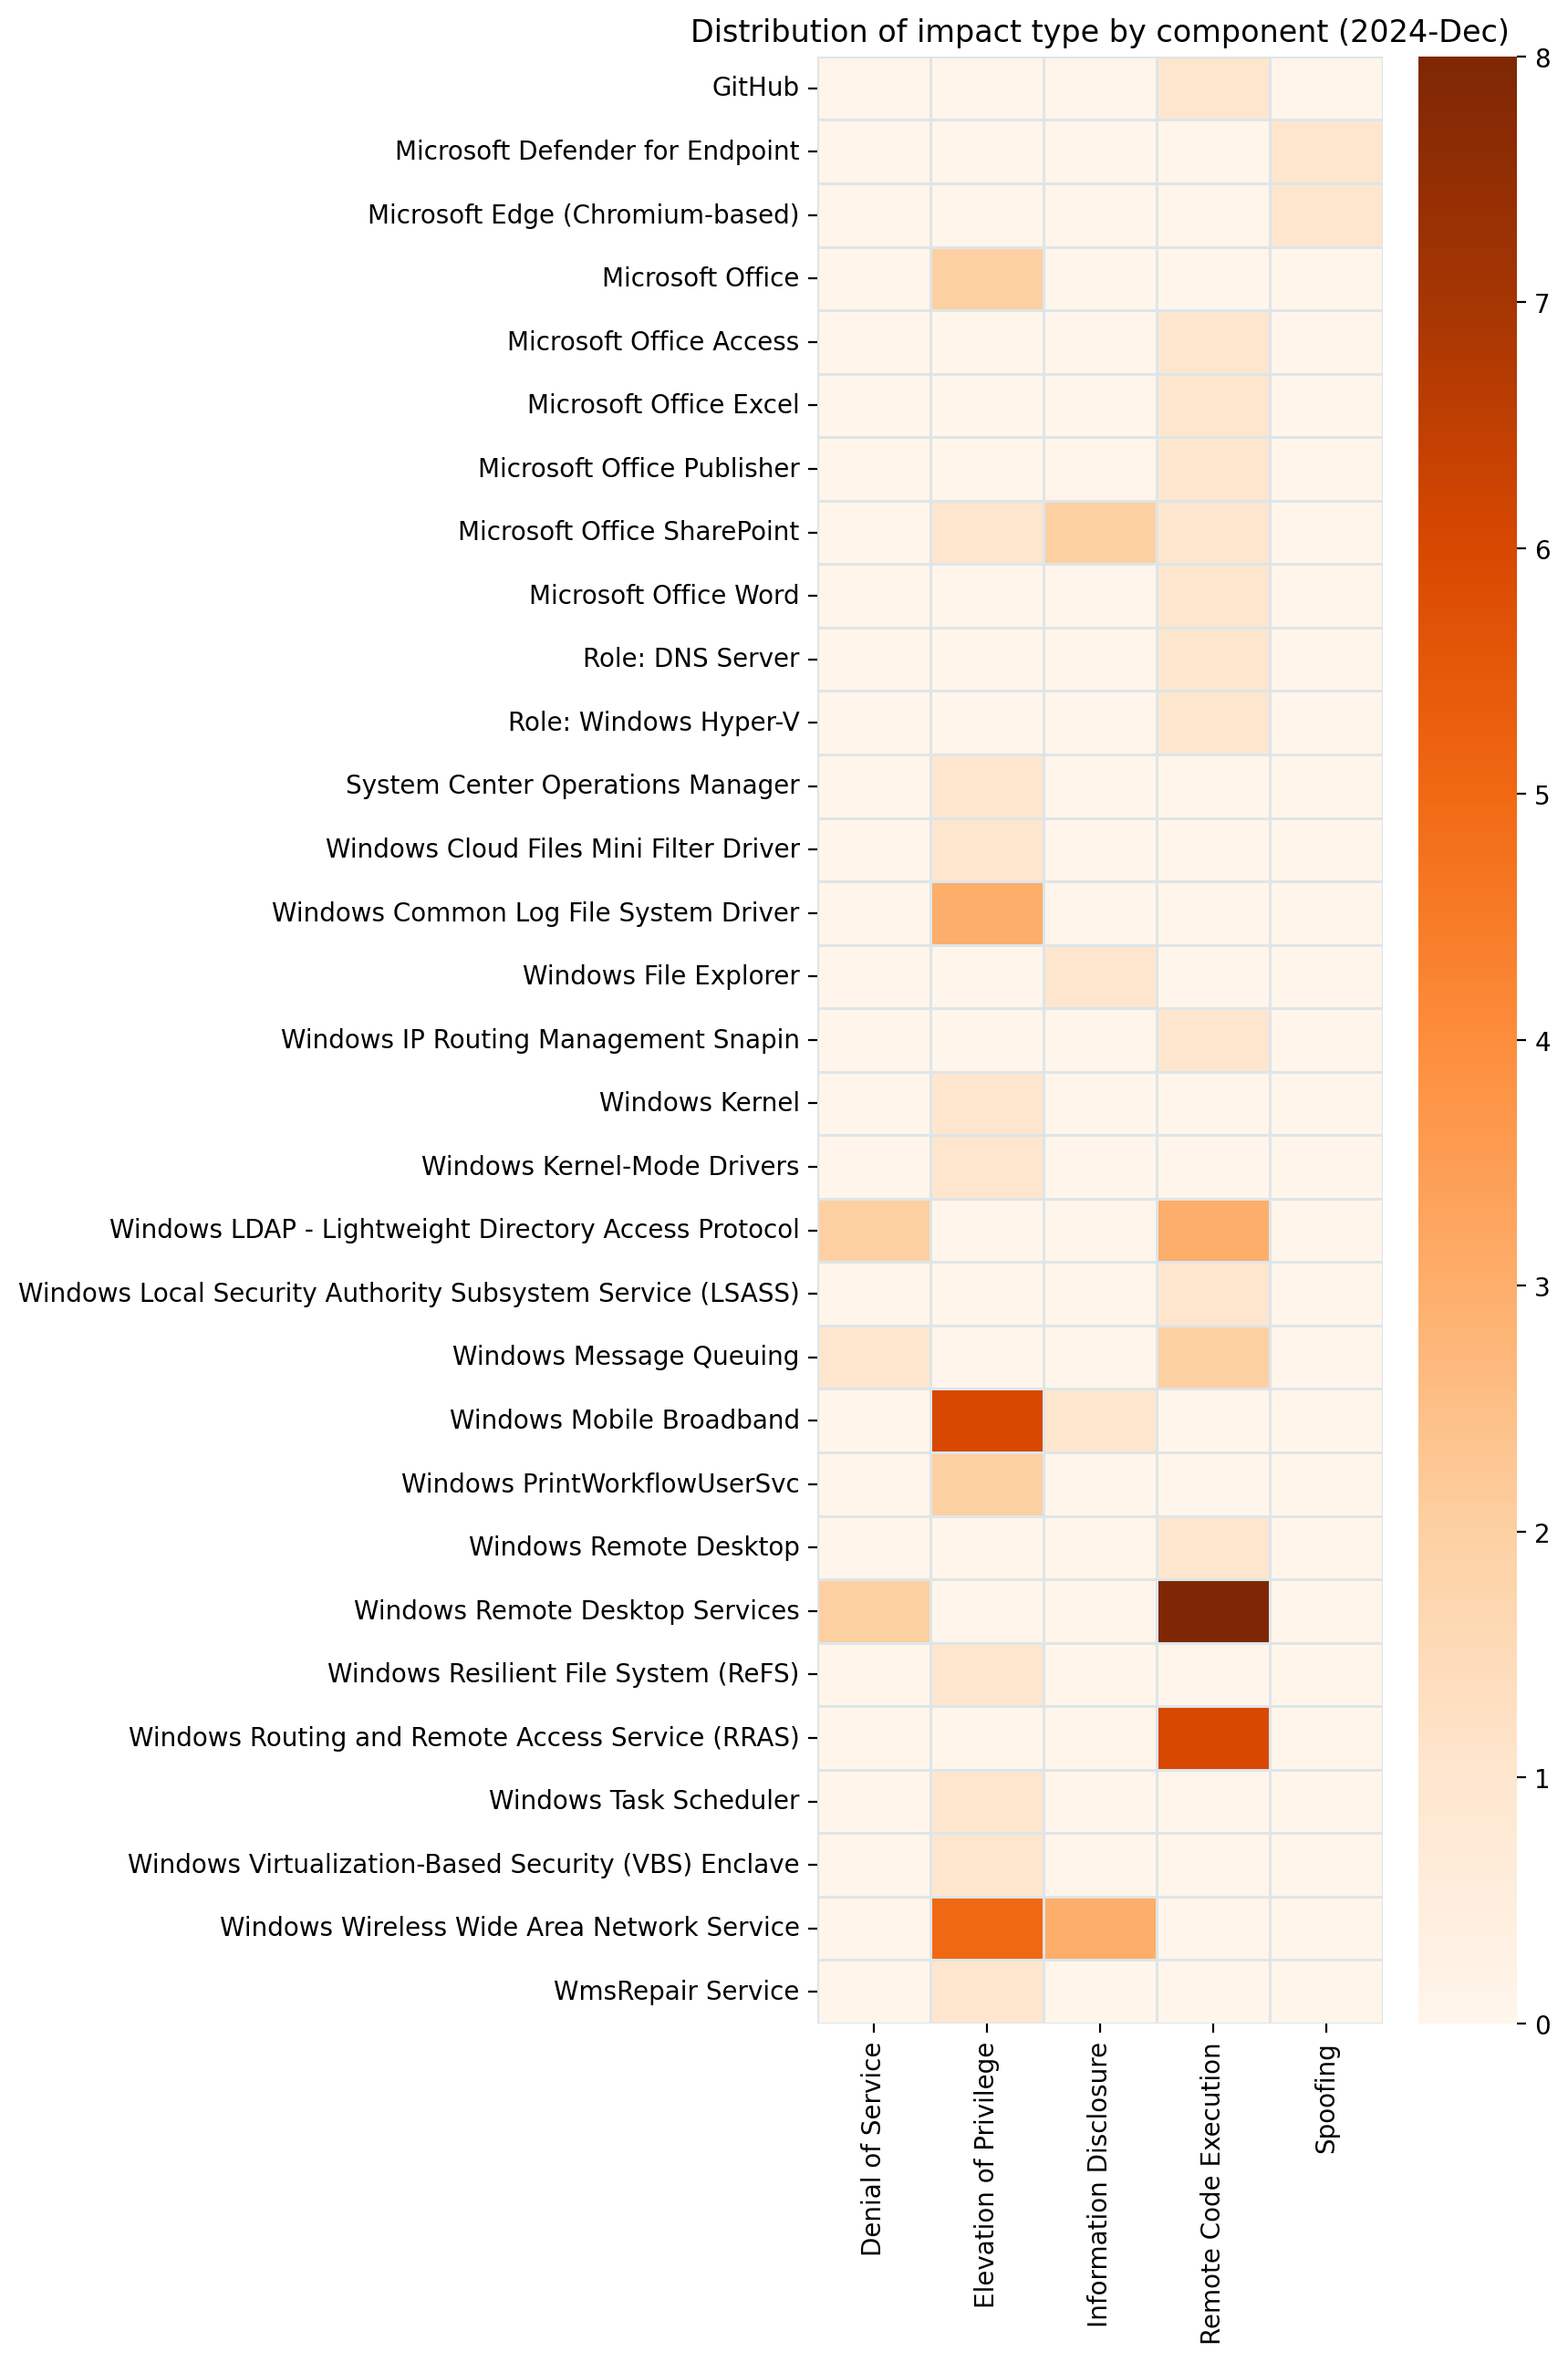
Microsoft is addressing 70 vulnerabilities this December 2024 Patch Tuesday. Microsoft has evidence of in-the-wild exploitation and public disclosure for one of the vulnerabilities published today, and this is reflected in a CISA KEV entry. For the third month in a row, Microsoft has published zero-day vulnerabilities on Patch Tuesday without evaluating any of them as critical severity at time of publication. Today sees the publication of 16 critical remote code execution (RCE) vulnerabilities, which is more than usual. Two browser vulnerabilities have already been published separately this month, and are not included in the total.
Common Log File System: zero-day EoP
This month’s zero-day vulnerability is CVE-2024-49138, an elevation of privilege vulnerability in the Windows Common Log File System (CLFS) driver, a general-purpose Windows logging service that can be used by software clients running in user-mode or kernel-mode. Exploitation leads to SYSTEM privileges, and if this all sounds familiar, it should.
There have been a series of zero-day elevation of privilege vulnerabilities in CLFS over the past few years. Past offenders are CVE-2022-24521, CVE-2023-23376, CVE-2022-37969, and CVE-2023-28252; today’s addition of CVE-2024-49138 is the first CLFS zero-day vulnerability which Microsoft has published in 2024. Although the advisory doesn’t provide much detail on the means of exploitation, the weakness is CWE-122: Heap-based Buffer Overflow, which most commonly leads to crashes/denial of service, but can also lead to code execution.
Ransomware authors who have abused previous CLFS vulnerabilities will be only too pleased to get their hands on a fresh one. Expect more CLFS zero-day vulnerabilities to emerge in the future, unless Microsoft decides to perform a full replacement of the aging CLFS codebase instead of offering spot fixes for specific flaws. Patches are available for all versions of Windows.
Groups of critical RCE
Patterns emerge when we consider the 16 critical RCE vulnerabilities published today as a whole, which might somewhat reduce the level of alarm that unusually large number might otherwise cause weary defenders.
LDAP: critical RCE
A trio of Windows LDAP critical RCE vulnerabilities receive patches this month, including CVE-2024-49112, which has a CVSSv3 base score of 9.8, which is the highest of any of the vulnerabilities which Microsoft has published today. Exploitation is via a specially crafted set of LDAP calls, and leads to code execution within the context of the LDAP service; although the advisory doesn’t specify, the LDAP service runs in a SYSTEM context. Microsoft advises defenders who still permit domain controllers to receive inbound RPC calls from untrusted networks or to access the internet to stop doing that.
LSASS: critical RCE
Another potential cause for concern this month: CVE-2024-49126 is a critical RCE in the Local Security Authority Subsystem Service (LSASS). Exploitation could potentially be carried out remotely, and the attacker needs no privileges, nor does the user need to perform any action; the only silver lining is that an attacker must win a race condition. Although the advisory says that code execution would be in the context of the server’s account, it might be safest to assume that code execution would be in a SYSTEM context.
Hyper-V: container escape
CVE-2024-49117 describes a container escape for Hyper-V; exploitation requires that the attacker make specially crafted file operation requests on the virtual machine (VM) to hardware resources on the VM, which could result in remote code execution on the hypervisor. The FAQ on the advisory sets out that no special privileges are required in the context of the VM, so any level of access is enough to break free from the VM. We also learn that the container escape could be lateral, where an attacker moves from one VM to another, rather than to the hypervisor.
Remote Desktop Services: 8 critical RCEs
All eight critical RCE vulnerabilities in Remote Desktop Services published today (e.g. CVE-2024-49106) share a number of similarities: they have identical CVSS vectors, exploitation requires that an attacker win a race condition, and the same research group is credited in each case.
Microsoft lifecycle update
There are no significant Microsoft product lifecycle transitions this month.
Summary charts
Summary tables
Browser vulnerabilities
| CVE | Title | Exploited? | Publicly disclosed? | CVSSv3 base score |
|---|---|---|---|---|
| CVE-2024-49041 | Microsoft Edge (Chromium-based) Spoofing Vulnerability | No | No | 4.3 |
| CVE-2024-12053 | Chromium: CVE-2024-12053 Type Confusion in V8 | No | No | N/A |
Developer Tools vulnerabilities
| CVE | Title | Exploited? | Publicly disclosed? | CVSSv3 base score |
|---|---|---|---|---|
| CVE-2024-49063 | Microsoft/Muzic Remote Code Execution Vulnerability | No | No | 8.4 |
Microsoft Office vulnerabilities
| CVE | Title | Exploited? | Publicly disclosed? | CVSSv3 base score |
|---|---|---|---|---|
| CVE-2024-49068 | Microsoft SharePoint Elevation of Privilege Vulnerability | No | No | 8.2 |
| CVE-2024-43600 | Microsoft Office Elevation of Privilege Vulnerability | No | No | 7.8 |
| CVE-2024-49069 | Microsoft Excel Remote Code Execution Vulnerability | No | No | 7.8 |
| CVE-2024-49142 | Microsoft Access Remote Code Execution Vulnerability | No | No | 7.8 |
| CVE-2024-49070 | Microsoft SharePoint Remote Code Execution Vulnerability | No | No | 7.4 |
| CVE-2024-49059 | Microsoft Office Elevation of Privilege Vulnerability | No | No | 7 |
| CVE-2024-49064 | Microsoft SharePoint Information Disclosure Vulnerability | No | No | 6.5 |
| CVE-2024-49062 | Microsoft SharePoint Information Disclosure Vulnerability | No | No | 6.5 |
| CVE-2024-49065 | Microsoft Office Remote Code Execution Vulnerability | No | No | 5.5 |
System Center vulnerabilities
| CVE | Title | Exploited? | Publicly disclosed? | CVSSv3 base score |
|---|---|---|---|---|
| CVE-2024-49057 | Microsoft Defender for Endpoint on Android Spoofing Vulnerability | No | No | 8.1 |
| CVE-2024-43594 | System Center Operations Manager Elevation of Privilege Vulnerability | No | No | 7.3 |
Windows vulnerabilities
| CVE | Title | Exploited? | Publicly disclosed? | CVSSv3 base score |
|---|---|---|---|---|
| CVE-2024-49093 | Windows Resilient File System (ReFS) Elevation of Privilege Vulnerability | No | No | 8.8 |
| CVE-2024-49117 | Windows Hyper-V Remote Code Execution Vulnerability | No | No | 8.8 |
| CVE-2024-49106 | Windows Remote Desktop Services Remote Code Execution Vulnerability | No | No | 8.1 |
| CVE-2024-49108 | Windows Remote Desktop Services Remote Code Execution Vulnerability | No | No | 8.1 |
| CVE-2024-49115 | Windows Remote Desktop Services Remote Code Execution Vulnerability | No | No | 8.1 |
| CVE-2024-49119 | Windows Remote Desktop Services Remote Code Execution Vulnerability | No | No | 8.1 |
| CVE-2024-49123 | Windows Remote Desktop Services Remote Code Execution Vulnerability | No | No | 8.1 |
| CVE-2024-49132 | Windows Remote Desktop Services Remote Code Execution Vulnerability | No | No | 8.1 |
| CVE-2024-49116 | Windows Remote Desktop Services Remote Code Execution Vulnerability | No | No | 8.1 |
| CVE-2024-49076 | Windows Virtualization-Based Security (VBS) Enclave Elevation of Privilege Vulnerability | No | No | 7.8 |
| CVE-2024-49074 | Windows Kernel-Mode Driver Elevation of Privilege Vulnerability | No | No | 7.8 |
| CVE-2024-49114 | Windows Cloud Files Mini Filter Driver Elevation of Privilege Vulnerability | No | No | 7.8 |
| CVE-2024-49075 | Windows Remote Desktop Services Denial of Service Vulnerability | No | No | 7.5 |
| CVE-2024-49107 | WmsRepair Service Elevation of Privilege Vulnerability | No | No | 7.3 |
| CVE-2024-49097 | Windows PrintWorkflowUserSvc Elevation of Privilege Vulnerability | No | No | 7 |
| CVE-2024-49095 | Windows PrintWorkflowUserSvc Elevation of Privilege Vulnerability | No | No | 7 |
| CVE-2024-49073 | Windows Mobile Broadband Driver Elevation of Privilege Vulnerability | No | No | 6.8 |
| CVE-2024-49092 | Windows Mobile Broadband Driver Elevation of Privilege Vulnerability | No | No | 6.8 |
| CVE-2024-49077 | Windows Mobile Broadband Driver Elevation of Privilege Vulnerability | No | No | 6.8 |
| CVE-2024-49078 | Windows Mobile Broadband Driver Elevation of Privilege Vulnerability | No | No | 6.8 |
| CVE-2024-49083 | Windows Mobile Broadband Driver Elevation of Privilege Vulnerability | No | No | 6.8 |
| CVE-2024-49110 | Windows Mobile Broadband Driver Elevation of Privilege Vulnerability | No | No | 6.8 |
| CVE-2024-49094 | Wireless Wide Area Network Service (WwanSvc) Elevation of Privilege Vulnerability | No | No | 6.6 |
| CVE-2024-49101 | Wireless Wide Area Network Service (WwanSvc) Elevation of Privilege Vulnerability | No | No | 6.6 |
| CVE-2024-49111 | Wireless Wide Area Network Service (WwanSvc) Elevation of Privilege Vulnerability | No | No | 6.6 |
| CVE-2024-49081 | Wireless Wide Area Network Service (WwanSvc) Elevation of Privilege Vulnerability | No | No | 6.6 |
| CVE-2024-49109 | Wireless Wide Area Network Service (WwanSvc) Elevation of Privilege Vulnerability | No | No | 6.6 |
| CVE-2024-49087 | Windows Mobile Broadband Driver Information Disclosure Vulnerability | No | No | 4.6 |
| CVE-2024-49098 | Windows Wireless Wide Area Network Service (WwanSvc) Information Disclosure Vulnerability | No | No | 4.3 |
| CVE-2024-49099 | Windows Wireless Wide Area Network Service (WwanSvc) Information Disclosure Vulnerability | No | No | 4.3 |
| CVE-2024-49103 | Windows Wireless Wide Area Network Service (WwanSvc) Information Disclosure Vulnerability | No | No | 4.3 |
Windows ESU vulnerabilities
| CVE | Title | Exploited? | Publicly disclosed? | CVSSv3 base score |
|---|---|---|---|---|
| CVE-2024-49112 | Windows Lightweight Directory Access Protocol (LDAP) Remote Code Execution Vulnerability | No | No | 9.8 |
| CVE-2024-49085 | Windows Routing and Remote Access Service (RRAS) Remote Code Execution Vulnerability | No | No | 8.8 |
| CVE-2024-49086 | Windows Routing and Remote Access Service (RRAS) Remote Code Execution Vulnerability | No | No | 8.8 |
| CVE-2024-49102 | Windows Routing and Remote Access Service (RRAS) Remote Code Execution Vulnerability | No | No | 8.8 |
| CVE-2024-49104 | Windows Routing and Remote Access Service (RRAS) Remote Code Execution Vulnerability | No | No | 8.8 |
| CVE-2024-49125 | Windows Routing and Remote Access Service (RRAS) Remote Code Execution Vulnerability | No | No | 8.8 |
| CVE-2024-49080 | Windows IP Routing Management Snapin Remote Code Execution Vulnerability | No | No | 8.8 |
| CVE-2024-49120 | Windows Remote Desktop Services Remote Code Execution Vulnerability | No | No | 8.1 |
| CVE-2024-49128 | Windows Remote Desktop Services Remote Code Execution Vulnerability | No | No | 8.1 |
| CVE-2024-49126 | Windows Local Security Authority Subsystem Service (LSASS) Remote Code Execution Vulnerability | No | No | 8.1 |
| CVE-2024-49127 | Windows Lightweight Directory Access Protocol (LDAP) Remote Code Execution Vulnerability | No | No | 8.1 |
| CVE-2024-49122 | Microsoft Message Queuing (MSMQ) Remote Code Execution Vulnerability | No | No | 8.1 |
| CVE-2024-49118 | Microsoft Message Queuing (MSMQ) Remote Code Execution Vulnerability | No | No | 8.1 |
| CVE-2024-49124 | Lightweight Directory Access Protocol (LDAP) Client Remote Code Execution Vulnerability | No | No | 8.1 |
| CVE-2024-49072 | Windows Task Scheduler Elevation of Privilege Vulnerability | No | No | 7.8 |
| CVE-2024-49138 | Windows Common Log File System Driver Elevation of Privilege Vulnerability | Yes | Yes | 7.8 |
| CVE-2024-49088 | Windows Common Log File System Driver Elevation of Privilege Vulnerability | No | No | 7.8 |
| CVE-2024-49090 | Windows Common Log File System Driver Elevation of Privilege Vulnerability | No | No | 7.8 |
| CVE-2024-49079 | Input Method Editor (IME) Remote Code Execution Vulnerability | No | No | 7.8 |
| CVE-2024-49129 | Windows Remote Desktop Gateway (RD Gateway) Denial of Service Vulnerability | No | No | 7.5 |
| CVE-2024-49121 | Windows Lightweight Directory Access Protocol (LDAP) Denial of Service Vulnerability | No | No | 7.5 |
| CVE-2024-49113 | Windows Lightweight Directory Access Protocol (LDAP) Denial of Service Vulnerability | No | No | 7.5 |
| CVE-2024-49096 | Microsoft Message Queuing (MSMQ) Denial of Service Vulnerability | No | No | 7.5 |
| CVE-2024-49089 | Windows Routing and Remote Access Service (RRAS) Remote Code Execution Vulnerability | No | No | 7.2 |
| CVE-2024-49091 | Windows Domain Name Service Remote Code Execution Vulnerability | No | No | 7.2 |
| CVE-2024-49084 | Windows Kernel Elevation of Privilege Vulnerability | No | No | 7 |
| CVE-2024-49082 | Windows File Explorer Information Disclosure Vulnerability | No | No | 6.8 |
Hidden Router Vulnerabilities Identified by Fing Agent!
Post Syndicated from Crosstalk Solutions original https://www.youtube.com/watch?v=tE9VuE8fstU
Simplify Multi-Region Email Sending with Simple Email Service’s Deterministic Easy DKIM
Post Syndicated from Zip Zieper original https://aws.amazon.com/blogs/messaging-and-targeting/simplify-multi-region-email-sending-with-simple-email-services-deterministic-easy-dkim/
Introduction
Amazon Simple Email Service (SES) provides customers with a robust, scalable email solution to send large-scale, global email communications. The service offers customers many benefits, including scalability, high deliverability rates, cost effective pay-as-you go pricing, availability in over a dozen AWS regions, and tight integration with other AWS services.
We’ve heard from customers who want to synchronise domain identities across multiple AWS regions that it can be difficult to configure and maintain. These customers have shared that establishing and maintaining AWS region specific domain verifications can be confusing, time-consuming, and that it’s difficult to coordinate the many details across their users, customers and service providers.
In this post, we’ll explore the newly introduced SES feature called Deterministic Easy DKIM (aka “DEED”), which solves critical challenges in multi-region email identity management for SES customers. DEED generates consistent DKIM tokens across multiple AWS Regions based on a Parent (domain) Identity that is configured with SES Easy DKIM. DEED uses the Parent Identity’s Easy DKIM configuration to automatically provide the same DKIM signing configuration for a Replica (domain) Identity in a AWS Replica Region. With DEED, you only need to publish DNS records once for the Parent Identity. The Replica Identity will automatically use these same DNS records to verify domain ownership and manage DKIM signing. DEED streamlines multi-region email operations by simplifying DNS management and ensuring consistent DKIM signing across AWS regions, maintaining best-practice email authentication while reducing operational complexity.
Background and key challenges
SES introduced Easy DKIM over a decade ago as an innovative, streamlined solution to help customers create, verify, and manage domain identities with automated DKIM signing. Easy DKIM is simple to set-up, and works by generating pre-determined tokens that customers add to their DNS configurations. Once Easy DKIM is enabled, SES generates a public/private signing key for each domain identity and updates the verified identity’s CNAME public key. SES’ Easy DKIM simplifies email authentication by managing and rotating DKIM keys on behalf of customers.
Before DEED, customers who wanted to expand their SES email infrastructure across multiple regions faced complexity, operational challenges and a substantial administrative burden configuring and maintaining DKIM across AWS regions. This made it very difficult for customers to scale their email infrastructure efficiently, and often dissuaded customers from fully leveraging the potential of a multi-region email sending strategy. These challenges are more pronounced for Independent Software Vendors (ISVs) and email service providers using SES. Frequently these organizations don’t own or control the domains used by their end-customers, who must manually update their DNS entries each time the ISV expanded or shifted their SES sending infrastructure between AWS regions.
Solution Overview
Deterministic Easy DKIM (DEED) allows SES customers to set up email identities across multiple regions, leveraging an existing domain identity configuration in a single region without the need to make companion DNS changes in all other regions. This innovative approach eliminates the manual overhead of creating region-specific DNS entries, and provides a streamlined solution to configure and maintain global email infrastructure for organizations and ISVs alike.
The key benefits of using DEED include:
- Simplified DNS Management – Publish DNS records once for the Parent Identity and the replica identity is automatically synced.
- Easier Multi-Region Operations – Simplifies the process of expanding email sending operations to new AWS regions.
Reduced Administrative Overhead – Manage DKIM configurations centrally from the Parent Identity.
Terminology:
To understand DEED, let’s explore the key terminology that underpins this innovative approach:
- Deterministic – a process or system where the same input will always produce the same output, with no randomness or unpredictability involved. In other words, if all the starting conditions are known, the outcome can be precisely predicted or determined.
- Parent Region – The original AWS Region where the primary email identity is initially established.
- Parent Identity – A verified email identity configured with Easy DKIM that serves as the authoritative source for DKIM configuration across regions.
- Replica Region – An AWS Region where an identical email identity is replicated without additional configuration.
- Replica Identity – An identity that shares identical DNS configuration and DKIM signing configuration of a parent identity.
- DEED Identity – Any identity that is used as either a parent identity or a replica identity. (When a new identity is created, it is initially treated as a regular (non-DEED) identity. However, once a replica is created, the identity is then considered a DEED identity.)
How DEED works

DEED is built on the existing Easy DKIM framework:
- Using Easy DKIM, SES generates a public-private key pair and automatically adds a DKIM signature to every message sent from a SES verified identity in the Parent Region.
- To accommodate authenticated SES sending from multiple AWS regions, DEED automatically synchronizes the signing keys from the Parent Region and Parent Identity to the Replica Region and Replica Identity.
- This automated process ensures that both the Parent and Replica Identities receive and use identical keys for DKIM signing, maintaining consistent authentication across different AWS regions.
- SES manages the complex process of key rotation across Parent Identity and Replica Identities, further simplifying email infrastructure management across multiple AWS regions.
- Replica Identities inherit the DKIM signing configuration of the parent identity. Because of this dependency, you cannot delete a Parent Identity until all Replica Identities are deleted.
- The receiving email server/service validates DKIM from DNS.
We recommend customers take advantage of DEED for single-Region sending, as this new capability is included, at no additional cost, in the base SES pricing.
Steps to setup SES DEED Replica in a second AWS region
These steps assume that you are already using SES in the Parent Region, and have a fully verified domain identity that is configured to use Easy DKIM. You can also use the AWS CLI.
Step 1 – Update the Parent Identity
- Login to the AWS SES Console in the Parent Region
- Click on the Identities link in the SES navigation panel (far left) and click on the verified identity you want to use in other AWS regions.
- The Parent Identity must have Easy DKIM enabled.
- You cannot create Replicas of Identities that use BYODKIM or self-signed identities.
- Click on the Authorization tab
- Click Create Policy and select Create custom policy from the drop-down menu.
- Name the policy (for example, DEED-example_com)
- Modify the IAM policy (below) with your AWS account ID and AWS region, and paste it into the IAM Policy document to grant permission on the Parent Identity to allow the desired Replica Region to replicate the Parent Identity’s DKIM Signing Attributes:
{
"Version": "2012-10-17",
"Statement": [
{
"Sid": "AllowDKIMReplication",
"Effect": "Allow",
"Principal": {
"AWS": "arn:aws:iam::YOUR_ACCOUNT_ID:root"
},
"Action": "ses:ReplicateEmailIdentityDKIMSigningKey",
"Resource": "arn:aws:ses:us-east-1:123456789124:identity/example.com",
"Condition": {
"ForAllValues:StringEquals": {
"ses:ReplicaRegion": ["us-west-2", "eu-west-1"]
}
}
}
]
}
Note – Use consistent IAM policies that all allow for DKIM replication across intended Replica Regions.
Step -2 – Setup DEED Replica Identity
- Login to the AWS SES Console in the Replica Region
- Click on the Identities link in the SES navigation panel (far left) and click Create identity
- Under Identity details, Identity type, click Domain
- Type the domain name exactly as it appears in the Parent Identity
- Under Verifying your domain, click Deterministic Easy DKIM
- Select the Parent Region in the Parent region drop-down
- Ensure DKIM Signature is Enabled
- Click Create identity

- The Replica Identity in the Replica Region will now automatically synchronize DKIM with the Parent Identity in the Parent Region and your apps/services can be configured to use either Parent or Replica Region & Identity to send DKIM authenticated email.
- Repeat the process if you want to create additional Replica Regions.
You can verify that the replica identity was configured correctly with the parent identity’s DKIM signing configuration by using the get-email-identity command and specifying the Replica’s domain name and region:
`aws sesv2 get-email-identity --email-identity [example.com](http://example.com/) —region us-west-2`
The response will include the value of the Parent Region in the DomainSigningAttributesOrigin parameter, signifying that the Replica Identity has been successfully configured with the Parent Identity’s DKIM signing configuration:
{
"DkimAttributes": {
"SigningAttributesOrigin": "AWS_SES_US_EAST_1"
}
}
Conclusion
Deterministic Easy DKIM (DEED) represents a significant leap forward in multi-region email management for Amazon SES users. By eliminating the need for manually configured region-specific DNS configurations, DEED streamlines the process of expanding email operations across multiple AWS regions. This innovation not only reduces administrative overhead but also opens up new possibilities for organizations and ISVs to implement robust, globally distributed email infrastructures. With DEED, businesses can now leverage the full potential of Amazon SES across regions, ensuring consistent authentication, improved disaster recovery, and optimal performance without the previous complexities of multi-region setup.
Call to Action
Are you ready to simplify your multi-region email strategy with Amazon SES and DEED? Take the next step in optimizing your email infrastructure:
- Explore the DEED feature in your Amazon SES console today.
- Set up a test environment to experience the seamless multi-region configuration firsthand.
- For more detailed information, check out our comprehensive documentation on implementing DEED.
- Have questions or need assistance? Reach out to our AWS support team or join the AWS community forums to connect with other users.
Don’t let regional boundaries limit your email capabilities. Embrace the power of Deterministic Easy DKIM and transform your global email strategy with Amazon SES. Start your DEED journey today and unlock new levels of efficiency and scalability in your email operations.
Run Apache Spark Structured Streaming jobs at scale on Amazon EMR Serverless
Post Syndicated from Anubhav Awasthi original https://aws.amazon.com/blogs/big-data/run-apache-spark-structured-streaming-jobs-at-scale-on-amazon-emr-serverless/
As data is generated at an unprecedented rate, streaming solutions have become essential for businesses seeking to harness near real-time insights. Streaming data—from social media feeds, IoT devices, e-commerce transactions, and more—requires robust platforms that can process and analyze data as it arrives, enabling immediate decision-making and actions.
This is where Apache Spark Structured Streaming comes into play. It offers a high-level API that simplifies the complexities of streaming data, allowing developers to write streaming jobs as if they were batch jobs, but with the power to process data in near real time. Spark Structured Streaming integrates seamlessly with various data sources, such as Amazon Managed Streaming for Apache Kafka (Amazon MSK) and Amazon Kinesis Data Streams, providing a unified solution that supports complex operations like windowed computations, event-time aggregation, and stateful processing. By using Spark’s fast, in-memory processing capabilities, businesses can run streaming workloads efficiently, scaling up or down as needed, to derive timely insights that drive strategic and critical decisions.
The setup of a computing infrastructure to support such streaming workloads poses its challenges. Here, Amazon EMR Serverless emerges as a pivotal solution for running streaming workloads, enabling the use of the latest open source frameworks like Spark without the need for configuration, optimization, security, or cluster management.
Starting with Amazon EMR 7.1, we introduced a new job --mode on EMR Serverless called Streaming. You can submit a streaming job from the EMR Studio console or the StartJobRun API:
In this post, we highlight some of the key enhancements introduced for streaming jobs.
Performance
The Amazon EMR runtime for Apache Spark delivers a high-performance runtime environment while maintaining 100% API compatibility with open source Spark. Additionally, we have introduced the following enhancements to provide improved support for streaming jobs.
Amazon Kinesis connector with Enhanced Fan-Out Support
Traditional Spark streaming applications reading from Kinesis Data Streams often face throughput limitations due to shared shard-level read capacity, where multiple consumers compete for the default 2 MBps per shard throughput. This bottleneck becomes particularly challenging in scenarios requiring real-time processing across multiple consuming applications.
To address this challenge, we released the open source Amazon Kinesis Data Streams Connector for Spark Structured Streaming that supports enhanced fan-out for dedicated read throughput. Compatible with both provisioned and on-demand Kinesis Data Streams, enhanced fan-out provides each consumer with dedicated throughput of 2 MBps per shard. This enables streaming jobs to process data concurrently without the constraints of shared throughput, significantly reducing latency and facilitating near real-time processing of large data streams. By eliminating competition between consumers and enhancing parallelism, enhanced fan-out provides faster, more efficient data processing, which boosts the overall performance of streaming jobs on EMR Serverless. Starting with Amazon EMR 7.1, the connector comes pre-packaged on EMR Serverless, so you don’t need to build or download any packages.
The following diagram illustrates the architecture using shared throughput.

The following diagram illustrates the architecture using enhanced fan-out and dedicated throughput.

Refer to Build Spark Structured Streaming applications with the open source connector for Amazon Kinesis Data Streams for additional details on this connector.
Cost optimization
EMR Serverless charges are based on the total vCPU, memory, and storage resources utilized during the time workers are active, from when they are ready to execute tasks until they stop. To optimize costs, it is crucial to scale streaming jobs effectively. We have introduced the following enhancements to improve scaling at both the task level and across multiple tasks.
Fine-Grained Scaling
In practical scenarios, data volumes can be unpredictable and exhibit sudden spikes, necessitating a platform capable of dynamically adjusting to workload changes. EMR Serverless eliminates the risks of over- or under-provisioning resources for your streaming workloads. EMR Serverless scaling uses Spark dynamic allocation to correctly scale the executors according to demand. The scalability of a streaming job is also influenced by its data source to make sure Kinesis shards or Kafka partitions are also scaled accordingly. Each Kinesis shard and Kafka partition corresponds to a single Spark executor core. To achieve optimal throughput, use a one-to-one ratio of Spark executor cores to Kinesis shards or Kafka partitions.
Streaming operates through a sequence of micro-batch processes. In cases of short-running tasks, overly aggressive scaling can lead to resource wastage due to the overhead of allocating executors. To mitigate this, consider modifying spark.dynamicAllocation.executorAllocationRatio. The scaling down process is shuffle aware, avoiding executors holding shuffle data. Although this shuffle data is usually subject to garbage collection, if it’s not being cleared fast enough, the spark.dynamicAllocation.shuffleTracking.timeout setting can be adjusted to determine when executors should be timed out and removed.
Let’s examine fine-grained scaling with an example of a spiky workload where data is periodically ingested, followed by idle intervals. The following graph illustrates an EMR Serverless streaming job processing data from an on-demand Kinesis data stream. Initially, the job handles 100 records per second. As tasks queue, dynamic allocation adds capacity, which is quickly released due to short task durations (adjustable using executorAllocationRatio). When we increase input data to 10,000 records per second, Kinesis adds shards, triggering EMR Serverless to provision more executors. Scaling down happens as executors complete processing and are released after the idle timeout (spark.dynamicAllocation.executorIdleTimeout, default 60 seconds), leaving only the Spark driver running during the idle window. (Full scale-down is source dependent. For example, a provisioned Kinesis data stream with a fixed number of shards may have limitations in fully scaling down even when shards are idle.) This pattern repeats as bursts of 10,000 records per second alternate with idle periods, allowing EMR Serverless to scale resources dynamically. This job uses the following configuration:

Resiliency
EMR Serverless ensures resiliency in streaming jobs by leveraging automatic recovery and fault-tolerant architectures
Built-in Availability Zone resiliency
Streaming applications drive critical business operations like fraud detection, real-time analytics, and monitoring systems, making any downtime particularly costly. Infrastructure failures at the Availability Zone level can cause significant disruptions to distributed streaming applications, potentially leading to extended downtime and data processing delays.
Amazon EMR Serverless now addresses this challenge with built-in Availability Zone failover capabilities: jobs are initially provisioned in a randomly selected Availability Zone, and, in the event of an Availability Zone failure, the service automatically retries the job in a healthy Availability Zone, minimizing interruptions to processing. Although this feature greatly enhances application reliability, achieving full resiliency requires input data sources that also support Availability Zone failover. Additionally, if you’re using a custom virtual private cloud (VPC) configuration, it is recommended to configure EMR Serverless to operate across multiple Availability Zones to optimize fault tolerance.
The following diagram illustrates a sample architecture.

Auto retry
Streaming applications are susceptible to various runtime failures caused by transient issues such as network connectivity problems, memory pressure, or resource constraints. Without proper retry mechanisms, these temporary failures can lead to permanently stopping jobs, requiring manual intervention to restart the jobs. This not only increases operational overhead but also risks data loss and processing gaps, especially in continuous data processing scenarios where maintaining data consistency is crucial.
EMR Serverless streamlines this process by automatically retrying failed jobs. Streaming jobs use checkpointing to periodically save the computation state to Amazon Simple Storage Service (Amazon S3), allowing failed jobs to restart from the last checkpoint, minimizing data loss and reprocessing time. Although there is no cap on the total number of retries, a thrash prevention mechanism allows you to configure the number of retry attempts per hour, ranging from 1–10, with the default being set to five attempts per hour.
See the following example code:
Observability
EMR Serverless provides robust log management and enhanced monitoring, enabling users to efficiently troubleshoot issues and optimize the performance of streaming jobs.
Event log rotation and compression
Spark streaming applications continuously process data and generate substantial amounts of event log data. The accumulation of these logs can consume significant disk space, potentially leading to degraded performance or even system failures due to disk space exhaustion.
Log rotation mitigates these risks by periodically archiving old logs and creating new ones, thereby maintaining a manageable size of active log files. Event log rotation is enabled by default for both batch as well as streaming jobs and can’t be disabled. Rotating logs doesn’t affect the logs uploaded to the S3 bucket. However, they will be compressed using zstd standard. You can find rotated event logs under the following S3 folder:
The following table summarizes key configurations that govern event log rotation.
| Configuration | Value | Comment |
| spark.eventLog.rotation.enabled | TRUE | |
| spark.eventLog.rotation.interval | 300 seconds | Specifies time interval for the log rotation |
| spark.eventLog.rotation.maxFilesToRetain | 2 | Specifies how many rotated log files to keep during cleanup |
| spark.eventLog.rotation.minFileSize | 1 MB | Specifies a minimum file size to rotate the log file |
Application log rotation and compression
One of the most common errors in Spark streaming applications is the no space left on disk errors, primarily caused by the rapid accumulation of application logs during continuous data processing. These Spark streaming application logs from drivers and executors can grow exponentially, quickly consuming available disk space.
To address this, EMR Serverless has introduced rotation and compression for driver and executor stderr and stdout logs. Log files are refreshed every 15 seconds and can range from 0–128 MB. You can find the latest log files at the following Amazon S3 locations:
Rotated application logs are pushed to archive available under the following Amazon S3 locations:
Enhanced monitoring
Spark provides comprehensive performance metrics for drivers and executors, including JVM heap memory, garbage collection, and shuffle data, which are valuable for troubleshooting performance and analyzing workloads. Starting with Amazon EMR 7.1, EMR Serverless integrates with Amazon Managed Service for Prometheus, enabling you to monitor, analyze, and optimize your jobs using detailed engine metrics, such as Spark event timelines, stages, tasks, and executors. This integration is available when submitting jobs or creating applications. For setup details, refer to Monitor Spark metrics with Amazon Managed Service for Prometheus. To enable metrics for Structured Streaming queries, set the Spark property --conf spark.sql.streaming.metricsEnabled=true
You can also monitor and debug jobs using the Spark UI. The web UI presents a visual interface with detailed information about your running and completed jobs. You can dive into job-specific metrics and information about event timelines, stages, tasks, and executors for each job.
Service integrations
Organizations often struggle with integrating multiple streaming data sources into their data processing pipelines. Managing different connectors, dealing with varying protocols, and providing compatibility across diverse streaming platforms can be complex and time-consuming.
EMR Serverless supports Kinesis Data Streams, Amazon MSK, and self-managed Apache Kafka clusters as input data sources to read and process data in near real time.
Whereas the Kinesis Data Streams connector is natively available on Amazon EMR, the Kafka connector is an open source connector from the Spark community and is available in a Maven repository.
The following diagram illustrates a sample architecture for each connector.

Refer to Supported streaming connectors to learn more about using these connectors.
Additionally, you can refer to the aws-samples GitHub repo to set up a streaming job reading data from a Kinesis data stream. It uses the Amazon Kinesis Data Generator to generate test data.
Conclusion
Running Spark Structured Streaming on EMR Serverless offers a robust and scalable solution for real-time data processing. By taking advantage of the seamless integration with AWS services like Kinesis Data Streams, you can efficiently handle streaming data with ease. The platform’s advanced monitoring tools and automated resiliency features provide high availability and reliability, minimizing downtime and data loss. Furthermore, the performance optimizations and cost-effective serverless model make it an ideal choice for organizations looking to harness the power of near real-time analytics without the complexities of managing infrastructure.
Try out using Spark Structured Streaming on EMR Serverless for your own use case, and share your questions in the comments.
About the Authors
 Anubhav Awasthi is a Sr. Big Data Specialist Solutions Architect at AWS. He works with customers to provide architectural guidance for running analytics solutions on Amazon EMR, Amazon Athena, AWS Glue, and AWS Lake Formation.
 Kshitija Dound is an Associate Specialist Solutions Architect at AWS based in New York City, focusing on data and AI. She collaborates with customers to transform their ideas into cloud solutions, using AWS big data and AI services. In her spare time, Kshitija enjoys exploring museums, indulging in art, and embracing NYC’s outdoor scene.
 Paul Min is a Solutions Architect at AWS, where he works with customers to advance their mission and accelerate their cloud adoption. He is passionate about helping customers reimagine what’s possible with AWS. Outside of work, Paul enjoys spending time with his wife and golfing.
Introducing an enhanced version of the AWS Secrets Manager transform: AWS::SecretsManager-2024-09-16
Post Syndicated from Sanjay Varma Datla original https://aws.amazon.com/blogs/security/introducing-an-enhanced-version-of-the-aws-secrets-manager-transform-awssecretsmanager-2024-09-16/
We’re pleased to announce an enhanced version of the AWS Secrets Manager transform: AWS::SecretsManager-2024-09-16. This update is designed to simplify infrastructure management by reducing the need for manual security updates, bug fixes, and runtime upgrades.
AWS Secrets Manager helps you manage, retrieve, and rotate database credentials, API keys, and other secrets throughout their lifecycles. Some AWS services offer managed rotation of secrets, but for other secrets, you perform rotation by using an AWS Lambda function that updates your secret and the database or service.
Transforms are macros hosted by AWS CloudFormation that enable you to create or manage complex infrastructure setups. For general information on transforms, see the AWS CloudFormation documentation.
The AWS::SecretsManager transforms are used in conjunction with the AWS::SecretsManager::RotationSchedule resource type and HostedRotationLambda property to automatically extend your CloudFormation template to include a nested stack that creates the appropriate rotation Lambda function for your database or service. The transforms provide a convenient way to deploy an AWS vended rotation Lambda function into your own account as part of your CloudFormation templates, without having to rely on creating rotation Lambda functions through the AWS Serverless Application Repository or the AWS Management Console.
In this post, we’ll explore the new features of the transform, compare them to the previous version, and guide you through updating an existing Lambda function that was created using the old transform version to use the new transform version.
New features in AWS::SecretsManager-2024-09-16
The new transform version introduces several enhancements over the previous version (AWS::SecretsManager-2020-07-23):
- Automatic Lambda upgrades: Your rotation Lambda functions’ runtime configuration and internal dependencies now update automatically when you update your CloudFormation stacks. This helps you verify that you’re using the most secure and stable versions of Secrets Manager vended rotation Lambda function code and runtimes. Currently, AWS Lambda supports Python runtimes 3.9 and above. With Python 3.8 being deprecated, this feature allows for a seamless transition to newer supported runtimes. For more information on runtime deprecations, see the AWS Lambda runtimes documentation and the Python version guide.
- Additional resource attributes: The new transform now supports additional resource attributes for the
AWS::SecretsManager::RotationScheduleresource type when used with theHostedRotationLambdaproperty. The following attributes are applied to the nested stack (of typeAWS::CloudFormation::Stack) that creates the rotation Lambda function:CreationPolicyDependsOnMetadataUpdatePolicyCondition
For more information on these resource attributes, see the AWS CloudFormation resource attribute reference.
Resource attributes comparison
The following table shows which resource attributes are supported by the two versions of the Secrets Manager transform.
| Attribute | AWS::SecretsManager-2020-07-23 | AWS::SecretsManager-2024-09-16 |
| DeletionPolicy | Supported | Supported |
| UpdateReplacePolicy | Supported | Supported |
| CreationPolicy | Not Supported | Supported |
| DependsOn | Not Supported | Supported |
| Metadata | Not Supported | Supported |
| UpdatePolicy | Not Supported | Supported |
| Condition | Not Supported | Supported |
Important considerations
Before you use the AWS::SecretsManager-2024-09-16 transform, it’s essential to be aware of the following considerations so that you can make sure your CloudFormation stacks are properly created or updated:
- Non-backward compatibility: The new transform version isn’t backward compatible with the previous version. If you downgrade from
AWS::SecretsManager-2024-09-16toAWS::SecretsManager-2020-07-23, the additional resource attributes won’t be supported, which might change the behavior of existing stacks. - Rollback behavior during upgrade: When you upgrade to the
AWS::SecretsManager-2024-09-16transform from the previous version and a stack rollback occurs for any reason, the rotation Lambda function might not revert to its previous state. This is because the older transform’s nested stack might not use the same Lambda deployment package that was used before the upgrade. - Direct Lambda changes: If you make direct changes to the Lambda function created by the new transform outside of a CloudFormation stack update, those modifications might be overwritten during subsequent CloudFormation stack updates or rollbacks.
- Lambda runtime management: When you use the new transform version, the rotation Lambda function’s runtime aligns with the compiled binaries that are vended in Secrets Manager rotation Lambda templates, without you needing to specify a
Runtimevalue in theHostedRotationLambdaproperty. If you specify aRuntimevalue, make sure it’s the same version that is supported by Secrets Manager vended rotation Lambda templates. Otherwise, the Lambda runtime will be incompatible with the binaries that are published in the rotation Lambda function. For more information on the supported runtime, see the rotation function templates documentation. - End of support plans: AWS Secrets Manager will end support for the previous transform version (
AWS::SecretsManager-2020-07-23) in the future. We recommend that you migrate your stacks to the new transform to benefit from improvements and security enhancements going forward.
How to upgrade
To upgrade to the new transform version, follow these steps:
- Review your existing CloudFormation stacks that use the
AWS::SecretsManager-2020-07-23transform. - Update your CloudFormation stack templates to use
AWS::SecretsManager-2024-09-16in theTransformkey at the top of your template:Transform: AWS::SecretsManager-2024-09-16 - If you have previously defined a
Runtimevalue in theHostedRotationLambdaproperty, remove it from your template so that your rotation Lambda function’s runtime is updated properly in future stack updates. - Incorporate the new resource attributes as needed. We recommend that you minimize all other template changes while upgrading to reduce the likelihood of rollbacks.
- Deploy the changes by updating your CloudFormation stack with the revised template.
By following these steps, your Secrets Manager vended rotation Lambda functions will benefit from the latest improvements and security enhancements. Remember to test the changes in a non-production environment before you apply them to your production stacks. If you encounter any issues during the upgrade process, refer to our documentation or contact AWS Support for assistance.
If you have feedback about this post, submit comments in the Comments section below. If you have questions about this post, contact AWS Support.
Marvell Custom HBM Compute Architecture for Custom Hyper-Scale XPUs
Post Syndicated from Patrick Kennedy original https://www.servethehome.com/marvell-custom-hbm-compute-architecture-for-custom-hyper-scale-xpus/
The Marvell Custom HBM Compute Architecture uses cHBM for higher performance and density while offering lower power for hyper-scale XPUs
The post Marvell Custom HBM Compute Architecture for Custom Hyper-Scale XPUs appeared first on ServeTheHome.
Federate to Amazon Redshift Query Editor v2 with Microsoft Entra ID
Post Syndicated from Koushik Konjeti original https://aws.amazon.com/blogs/big-data/federate-to-amazon-redshift-query-editor-v2-with-microsoft-entra-id/
Amazon Redshift is a fast, petabyte-scale, cloud data warehouse that tens of thousands of customers rely on to power their analytics workloads. With its massively parallel processing (MPP) architecture and columnar data storage, Amazon Redshift delivers high price-performance for complex analytical queries against large datasets.
To interact with and analyze data stored in Amazon Redshift, AWS provides the Amazon Redshift Query Editor V2, a web-based tool that allows you to explore, analyze, and share data using SQL. The Query Editor V2 offers a user-friendly interface for connecting to your Redshift clusters, executing queries, and visualizing results.
As organizations increasingly adopt cloud-based solutions and centralized identity management, the need for seamless and secure access to data warehouses like Amazon Redshift becomes crucial. Many customers have already implemented identity providers (IdPs) like Microsoft Entra ID (formerly Azure Active Directory) for single sign-on (SSO) access across their applications and services. For more information about using Microsoft Entra ID for federation to Amazon Redshift with SQL clients, see Federate Amazon Redshift access with Microsoft Azure AD single sign-on. This post focuses on setting up federation for accessing the Redshift Query Editor.
Through this federated setup, users can connect to the Redshift Query Editor using their existing Microsoft Entra ID credentials, allowing you to control permissions for database objects based on business groups defined in your Active Directory. This approach provides a seamless user experience while centralizing the governance of authentication and permissions for end-users, eliminating the need to manage separate credentials for data warehousing. Additionally, you can restrict access to specific datasets based on the user’s business group, so users only have access to the data they are authorized to view and manage.
In the following sections, we explore the process of federating into AWS using Microsoft Entra ID and AWS Identity and Access Management (IAM), and how to restrict access to datasets based on permissions linked to AD groups. Although the integration with AWS IAM Identity Center is the recommended approach, this post focuses on setups where IAM Identity Center might not be applicable due to compliance constraints, such as organizations requiring FedRAMP Moderate compliance, which IAM Identity Center doesn’t yet meet. We cover the prerequisites, guide you through the setup process, and demonstrate how to seamlessly connect to the Redshift Query Editor while making sure data access permissions are accurately enforced based on your Microsoft Entra ID groups.
Solution overview
The following diagram illustrates the authentication flow of Microsoft Entra ID with a Redshift cluster using federated IAM roles.

The configuration of federation between Microsoft Entra ID and IAM to enable seamless access to Amazon Redshift through a SQL client such as the Redshift Query Editor V2 involves the following main components:
- Users start by authenticating with their Microsoft Entra ID credentials by accessing the enterprise application’s user access URL.
- Upon successful authentication, the custom claims provider triggers the custom authentication extension’s token issuance start event listener.
- The custom authentication extension calls an Azure function (your REST API endpoint) with information about the event, user profile, session data, and other context.
- The Azure function makes a call to the Microsoft Graph API to retrieve the authenticated user’s group membership information.
- The Microsoft Graph API responds with the user’s group membership details.
- The Azure function takes the group information and transforms it into a colon-separated list, such as
group1:group2:group3, and passes this colon-separated group information back to the custom authentication extension as a response payload. - The custom authentication extension processes the response and augments the token with the user’s group information as SAML claims (principal tags). The token, now enriched with the group membership, is returned to the enterprise application.
- The enterprise application in Azure AD generates a SAML assertion with principal tags. It sends an HTTP POST to the user’s browser containing an HTML form. This form includes the SAML assertion and specifies the AWS sign-in SAML endpoint (
https://signin.aws.amazon.com/saml) as the destination where the SAML assertion should be submitted. - The browser automatically submits this SAML assertion, sending an HTTP POST to the AWS SAML endpoint. This endpoint validates and processes the SAML assertion. If multiple IAM roles are available, the user selects one. The AWS SAML endpoint then uses AWS Security Token Service (AWS STS) to generate temporary credentials for that specific role, creates a console sign-in URL, and redirects the user to the AWS Management Console. From there, the user can access the Redshift Query Editor V2. To learn more about this process, refer to Enabling SAML 2.0 federated users to access the AWS Management Console.
- Inside Redshift Query Editor V2, the user selects the option to authenticate using their IAM identity. This triggers the Redshift Query Editor V2 to call the
GetClusterCredentialsWithIAMAPI, which checks the principal tags to determine the user’s database roles. If this is the user’s first login, the API automatically creates a database user and assigns the necessary database roles. - The
GetClusterCredentialsWithIAMAPI issues a temporary user name and password to the user. Using these credentials, the user logs in to the Redshift database. This login authorizes the user based on the Redshift database roles assigned earlier and allows them to run queries on the datasets.
Prerequisites
On the Microsoft Entra ID side, you need the following prerequisites to set up this solution:
- A Microsoft Entra ID tenant – Required to set up and configure the Microsoft Entra ID service for managing and securing access to AWS resources through federation.
- An Azure Subscription – Needed to access and use Azure services like Azure Functions.
Users should be members of specific Azure AD groups based on their access needs:
- User A – Member of the
"redshift_sales"group for access to sales datasets in Amazon Redshift, and the"AWS-<acctno>_dev-bdt-team"group for access to AWS services in the development environment.<acctno>is the AWS account where you have your Redshift cluster. - User B – Member of the
"redshift_product"group for access to product datasets in Amazon Redshift, and the"AWS-<acctno>_dev-bdt-team"group for access to AWS services. - User C – Member of both
"redshift_sales"and"redshift_product"groups for access to both datasets, and the"AWS-<acctno>_dev-bdt-team"group for access to AWS services.
The "AWS-<acctno>_dev-bdt-team" group in Azure AD is configured to allow users to assume an IAM role in AWS, providing the necessary permissions to access the AWS account. For a multi-account setup, create multiple groups for different environments or accounts and add users based on their access needs. For example, "AWS-<acctno>_prd-bdt-team" could be used for access to the production environment, where <acctno> reflects the account number for the production account.
On the Amazon Redshift side, you need the following resources:
- Redshift cluster – A Redshift cluster should be available in the AWS account specified by
<acctno>in theAWS-<acctno>_dev-bdt-teamgroup. If not, follow the instructions to create a sample Redshift cluster. - Redshift database roles – Create database roles in Amazon Redshift that correspond to Microsoft Entra ID groups:
- redshift_sales – For users with access to sales datasets.
- redshift_product – For users with access to product datasets.
- Redshift schemas – You need a Redshift schema named
saleswith the tablesales_table, which can be accessed by users of the groupredshift_sales. You also need a Redshift schema namedproductwith the tableproduct_table, which can be accessed by users of the groupredshift_productin thedevdatabase. You can use the following SQL statements on your Redshift cluster to create the groups and tables, inserting data into the created tables and granting access to the appropriate groups:
-- Create Redshift Roles
CREATE ROLE redshift_sales;
CREATE ROLE redshift_product;
-- Create sales schema and sales_table
CREATE SCHEMA sales;
CREATE TABLE sales.sales_table (
    id INT PRIMARY KEY,
    item VARCHAR(255),
    quantity INT,
    price DECIMAL(10,2)
);

-- Create product schema and product_table
CREATE SCHEMA product;
CREATE TABLE product.product_table (
    id INT PRIMARY KEY,
    name VARCHAR(255),
    category VARCHAR(255),
    price DECIMAL(10,2)
);
-- Insert data into sales_table
INSERT INTO sales.sales_table (id, item, quantity, price) VALUES
(1, 'Laptop', 10, 999.99),
(2, 'Smartphone', 20, 499.99),
(3, 'Headphones', 15, 199.99),
(4, 'Keyboard', 12, 89.99),
(5, 'Mouse', 30, 29.99);
-- Insert data into product_table
INSERT INTO product.product_table (id, name, category, price) VALUES
(1, 'Laptop', 'Electronics', 999.99),
(2, 'Smartphone', 'Electronics', 499.99),
(3, 'Blender', 'Home Appliances', 199.99),
(4, 'Mixer', 'Home Appliances', 89.99),
(5, 'Desk Lamp', 'Furniture', 29.99);
-- Grant usage on schema and select on all tables in the schema to redshift_sales
GRANT USAGE ON SCHEMA sales TO ROLE redshift_sales;
GRANT SELECT ON ALL TABLES IN SCHEMA sales TO ROLE redshift_sales;
-- Grant usage on schema and select on all tables in the schema to redshift_product
GRANT USAGE ON SCHEMA product TO ROLE redshift_product;
GRANT SELECT ON ALL TABLES IN SCHEMA product TO ROLE redshift_product;
Setup Azure Functions and custom authentication extensions
Complete the steps in this section to set up Azure Function and custom authentication extensions.
Create a new function app
Complete the following steps to create a new function app:
- Open your web browser and navigate to the Azure Portal (
portal.azure.com). - Log in with your Azure account credentials.
- Choose Create a resource.
- Choose Create under Function App.

- Select the Consumption hosting plan and then choose Select.
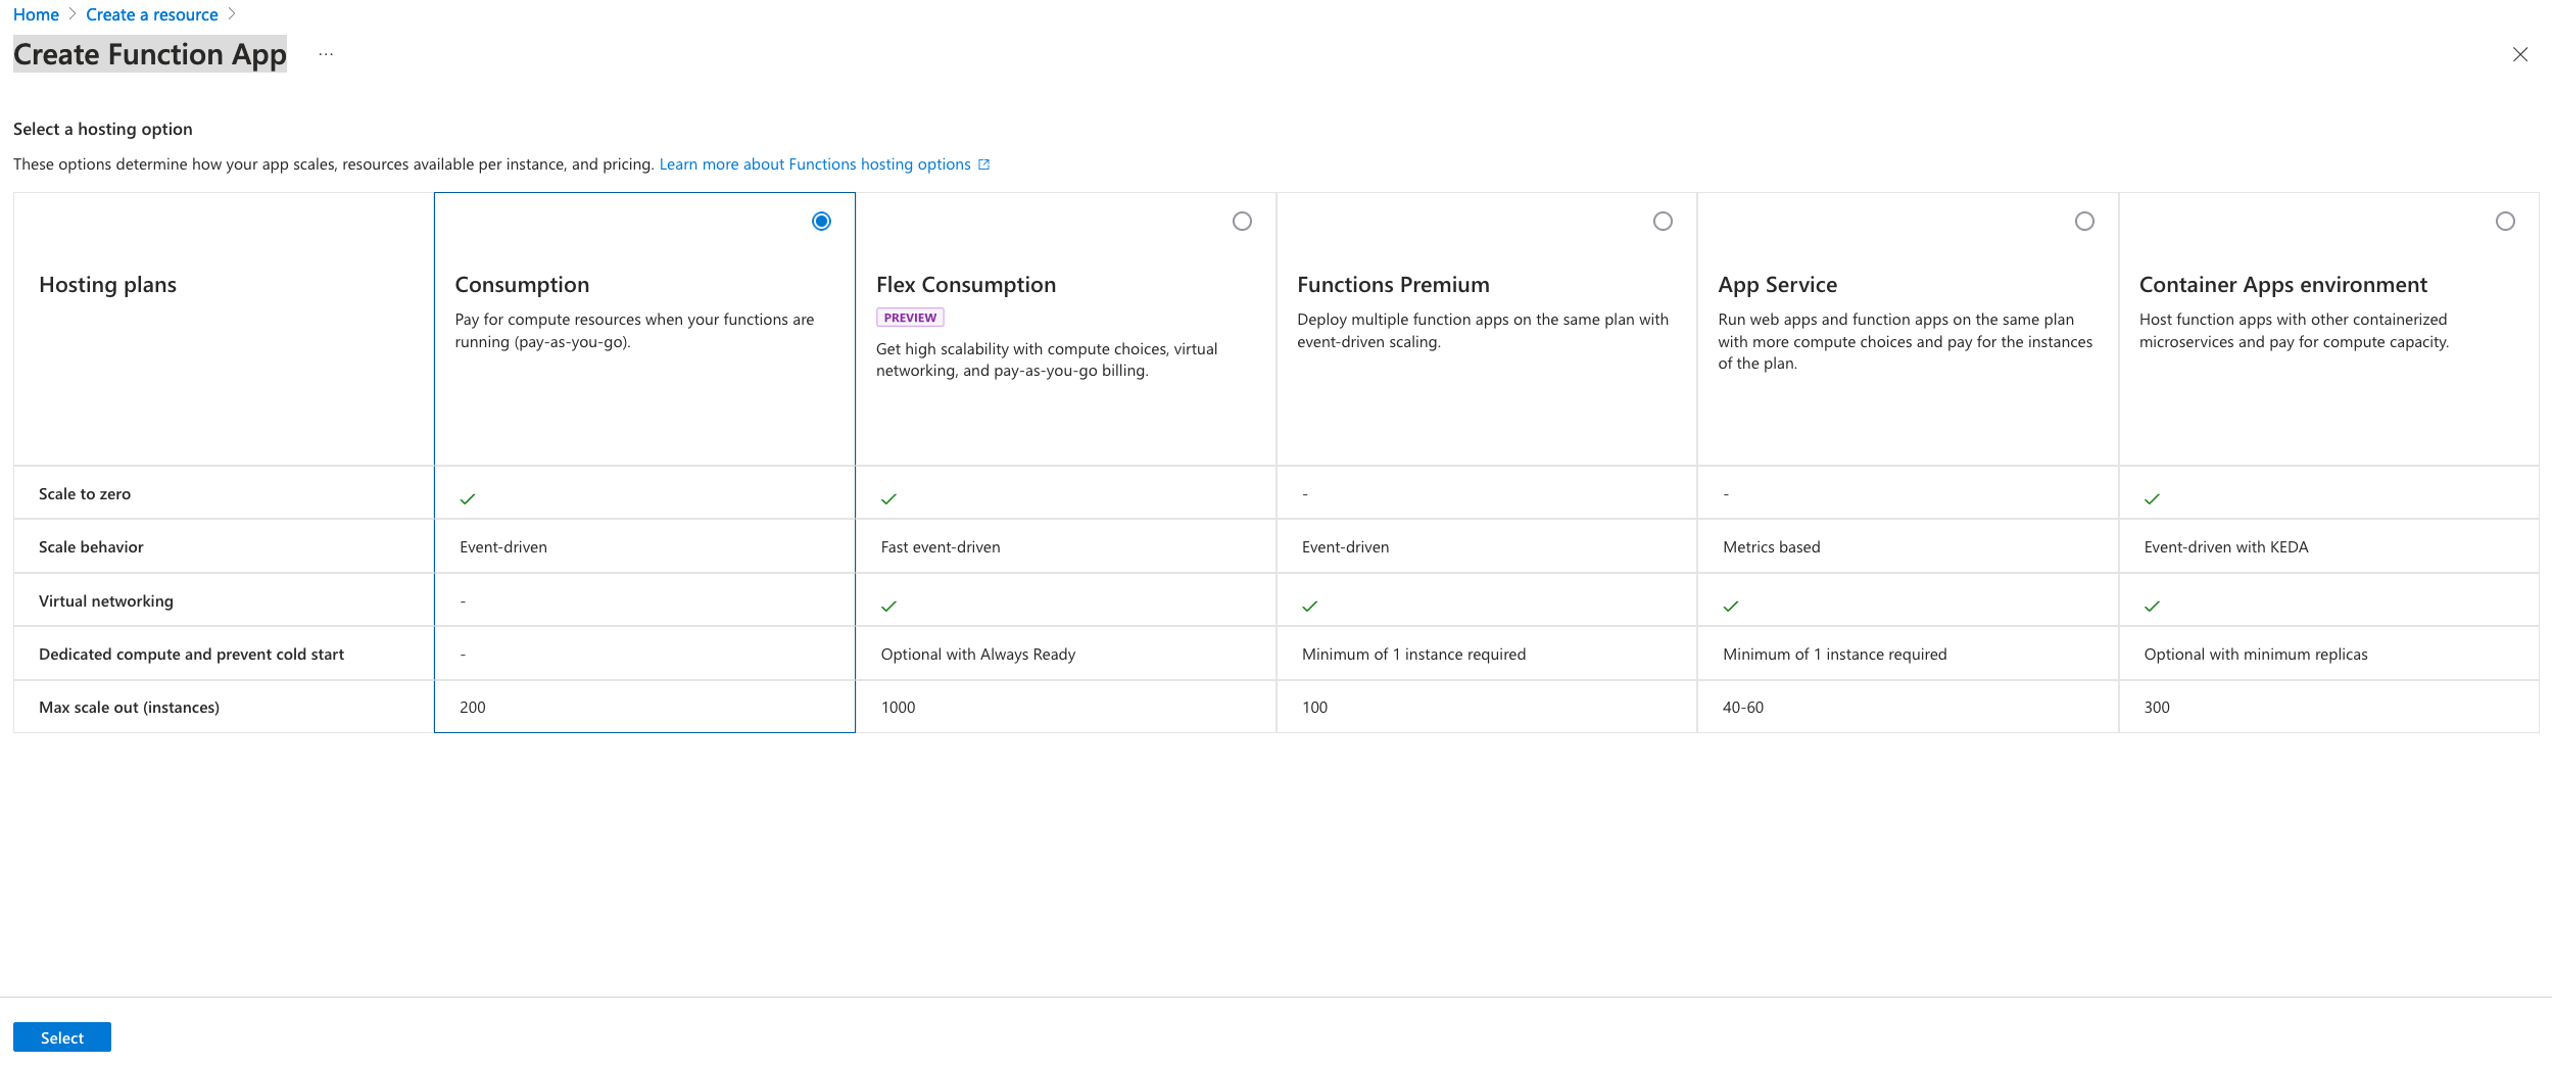
- On the Basics tab, for Subscription, provide the subscription you want to use. For this example, we use our default subscription, Azure subscription 1.
- Choose or create a new resource group to organize your Azure resources. We name our resource group
rg-redshift-federated-sso.
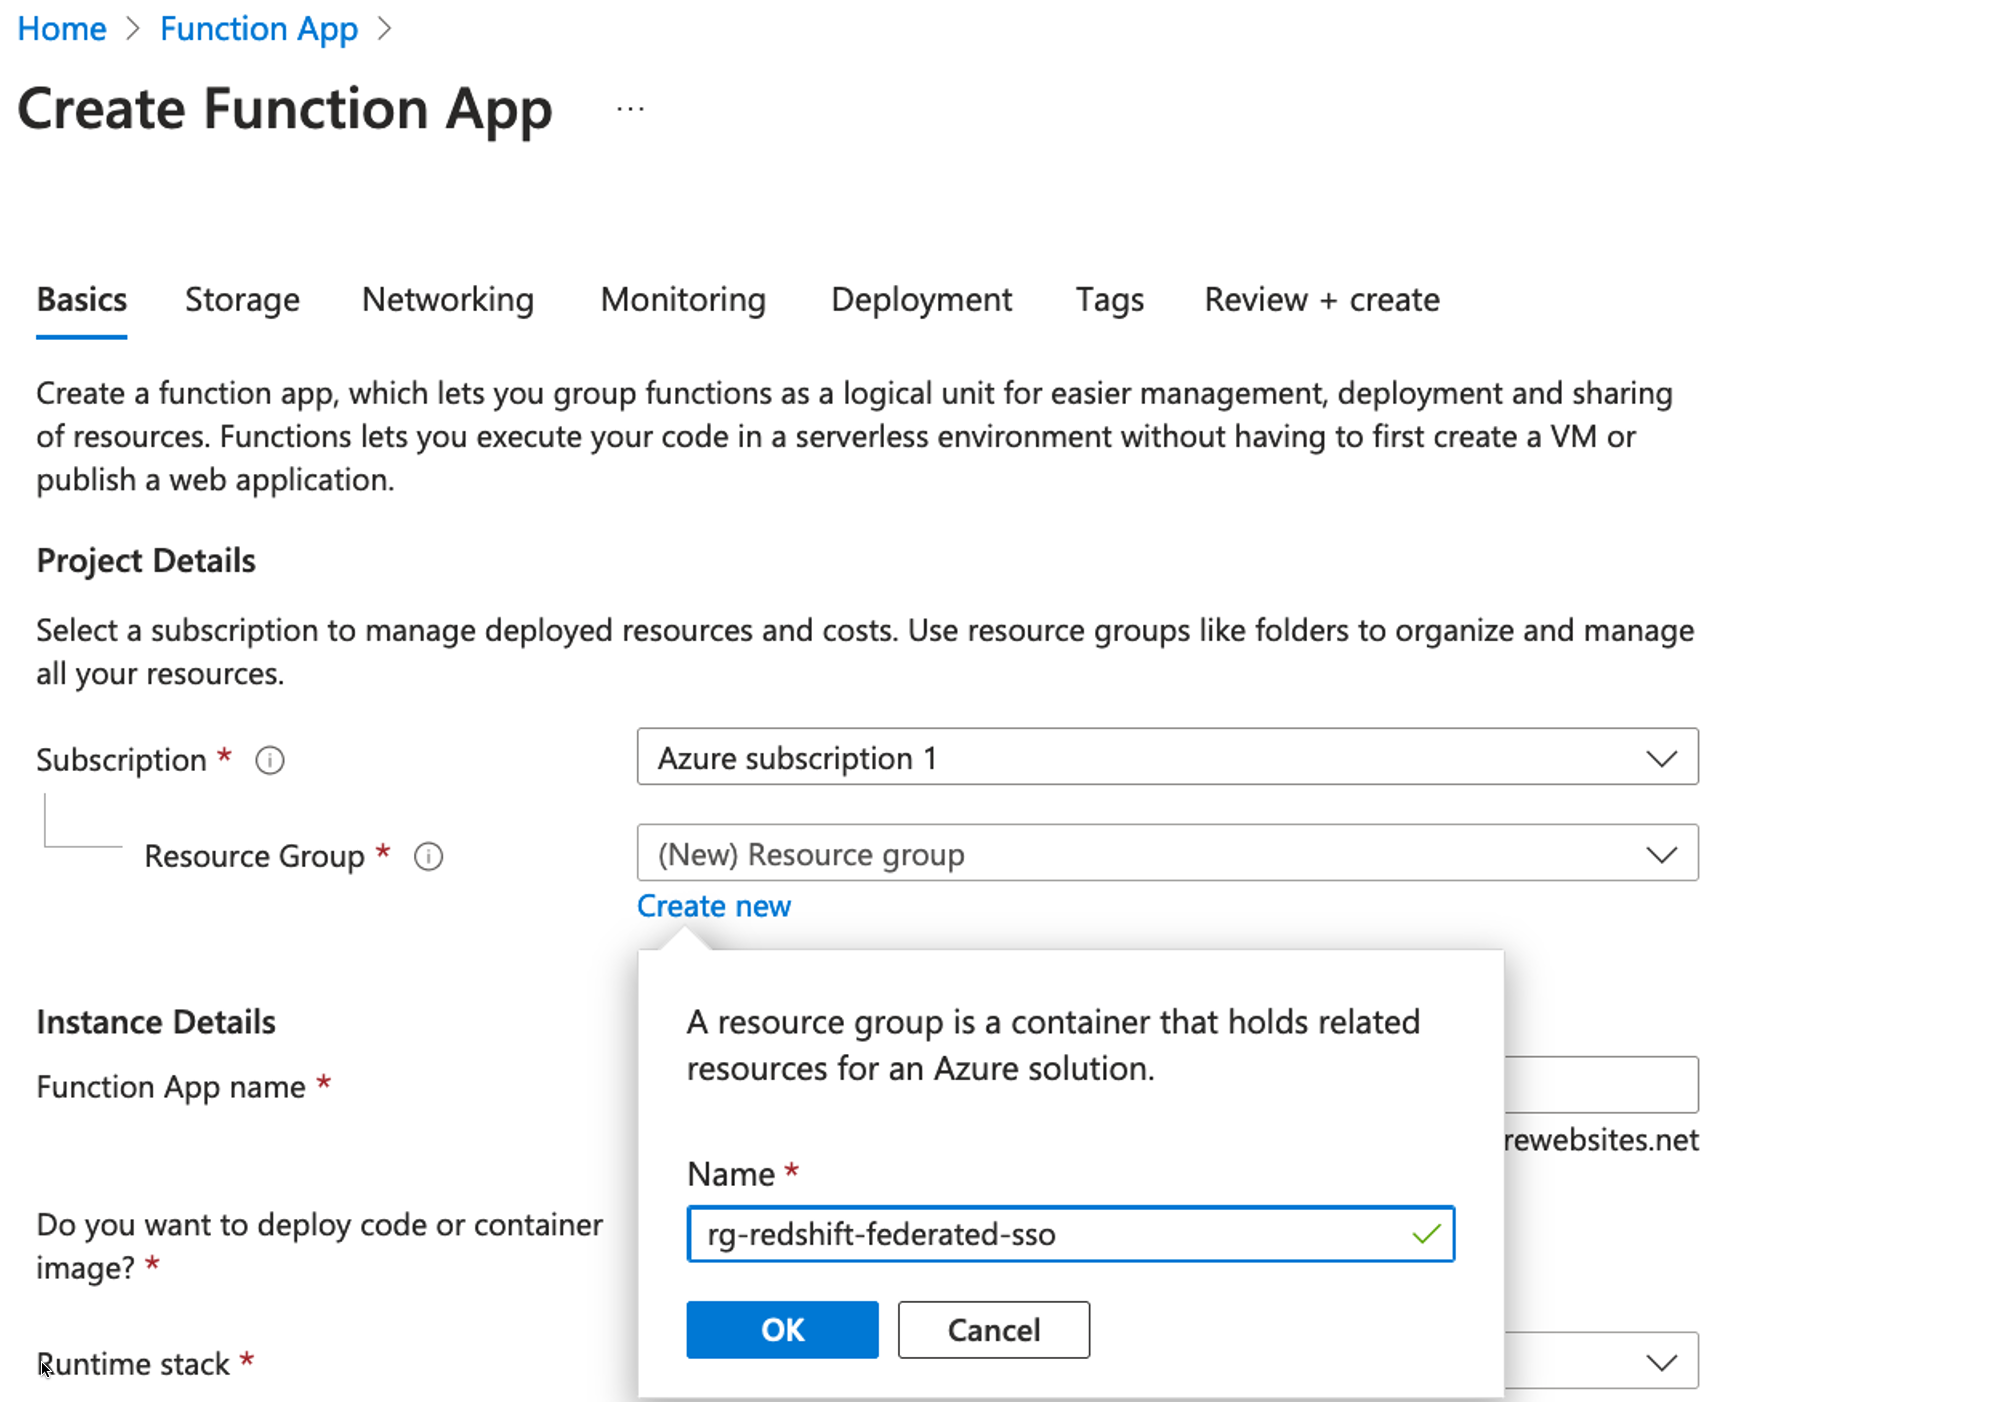
- Under Instance Details, enter a globally unique name. For this post, we use the name
fn-entra-id-transformer. - For Runtime stack, choose as Python.
- For Version, choose 3.11.
- For Region, choose East Us.
- For Operating System, select Linux.
- Choose Review + create to review the app configuration.
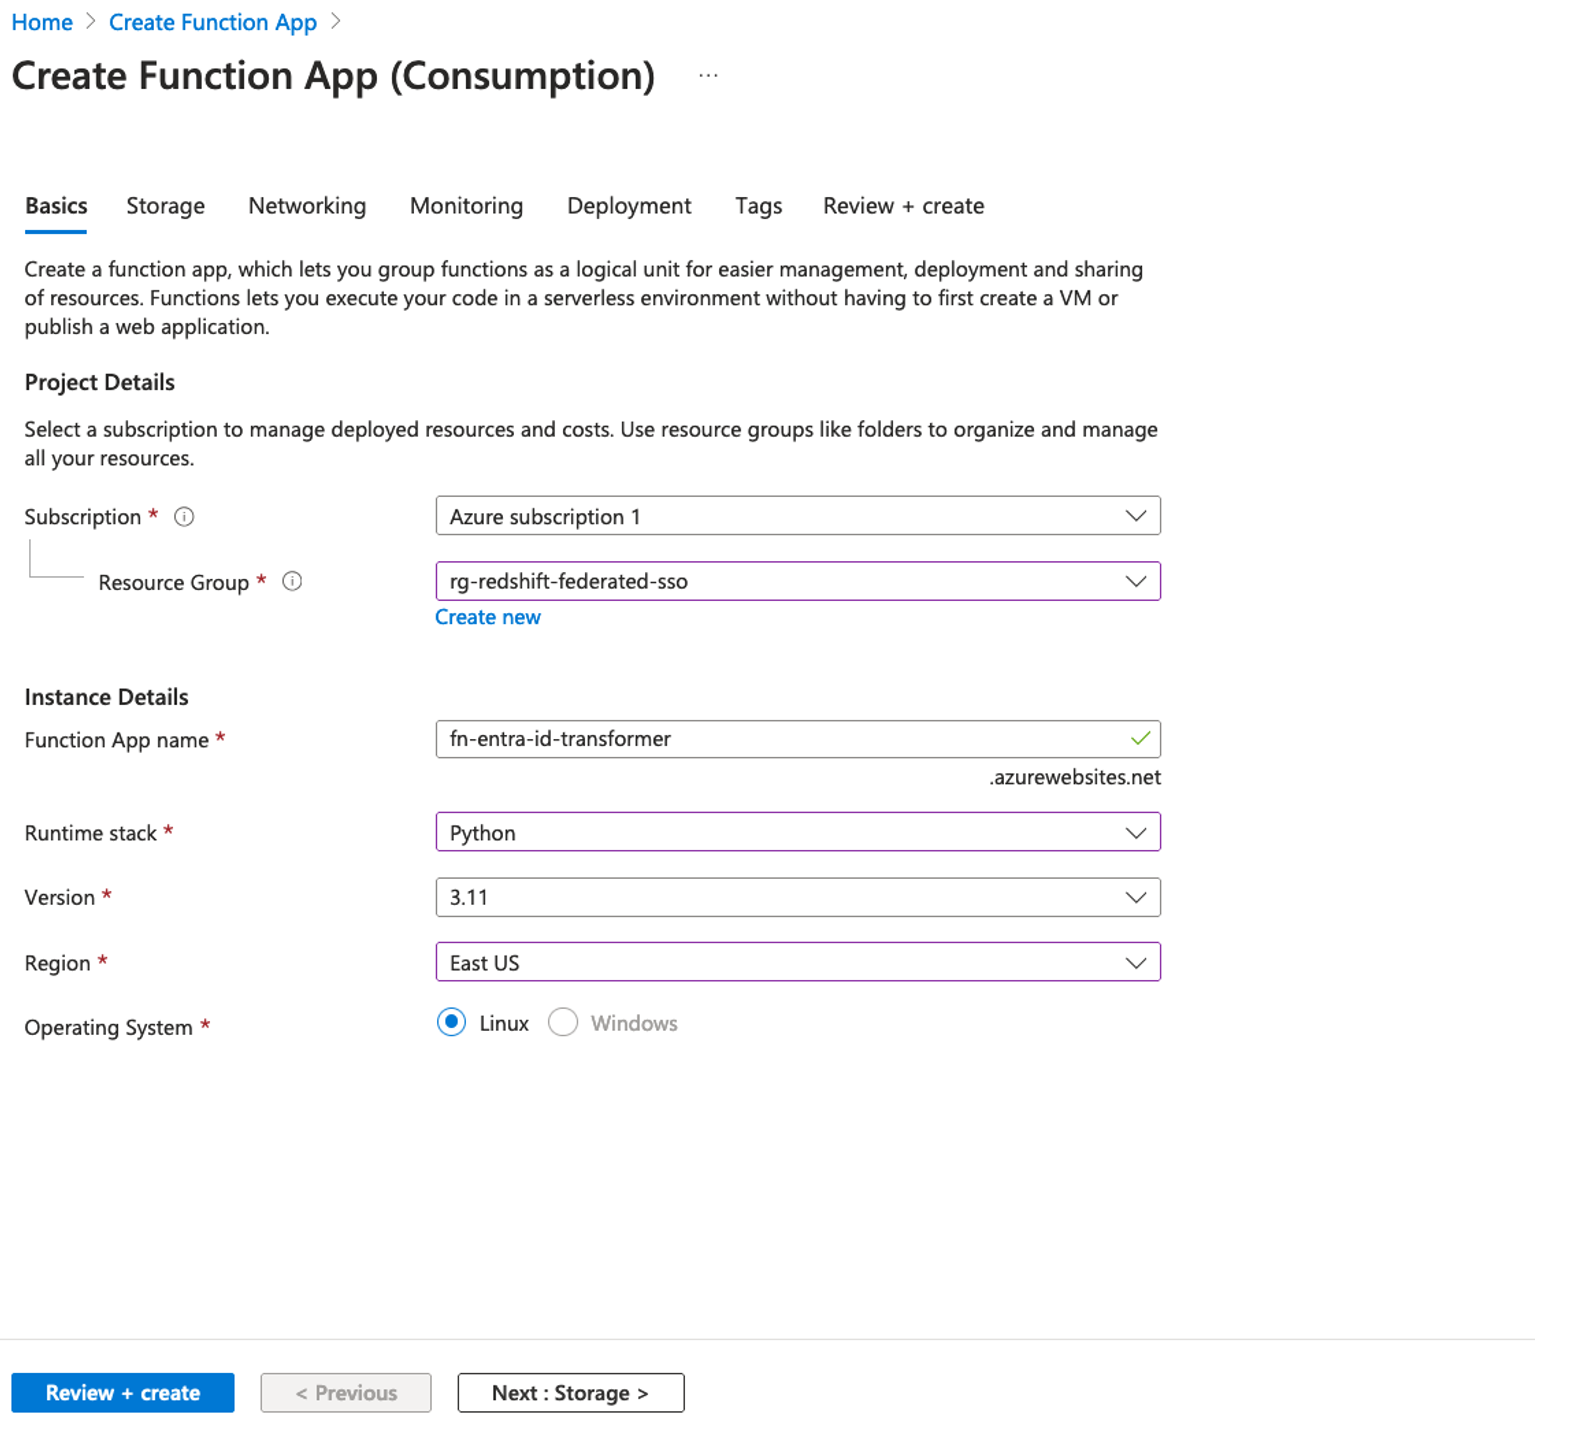
- Choose Create to create the Azure Functions app.
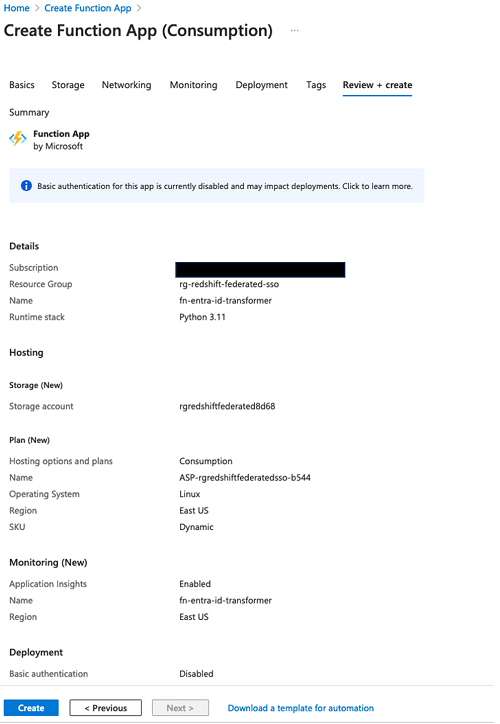
- Choose Go to resource in the notification message or deployment output window to navigate directly to your newly created app.
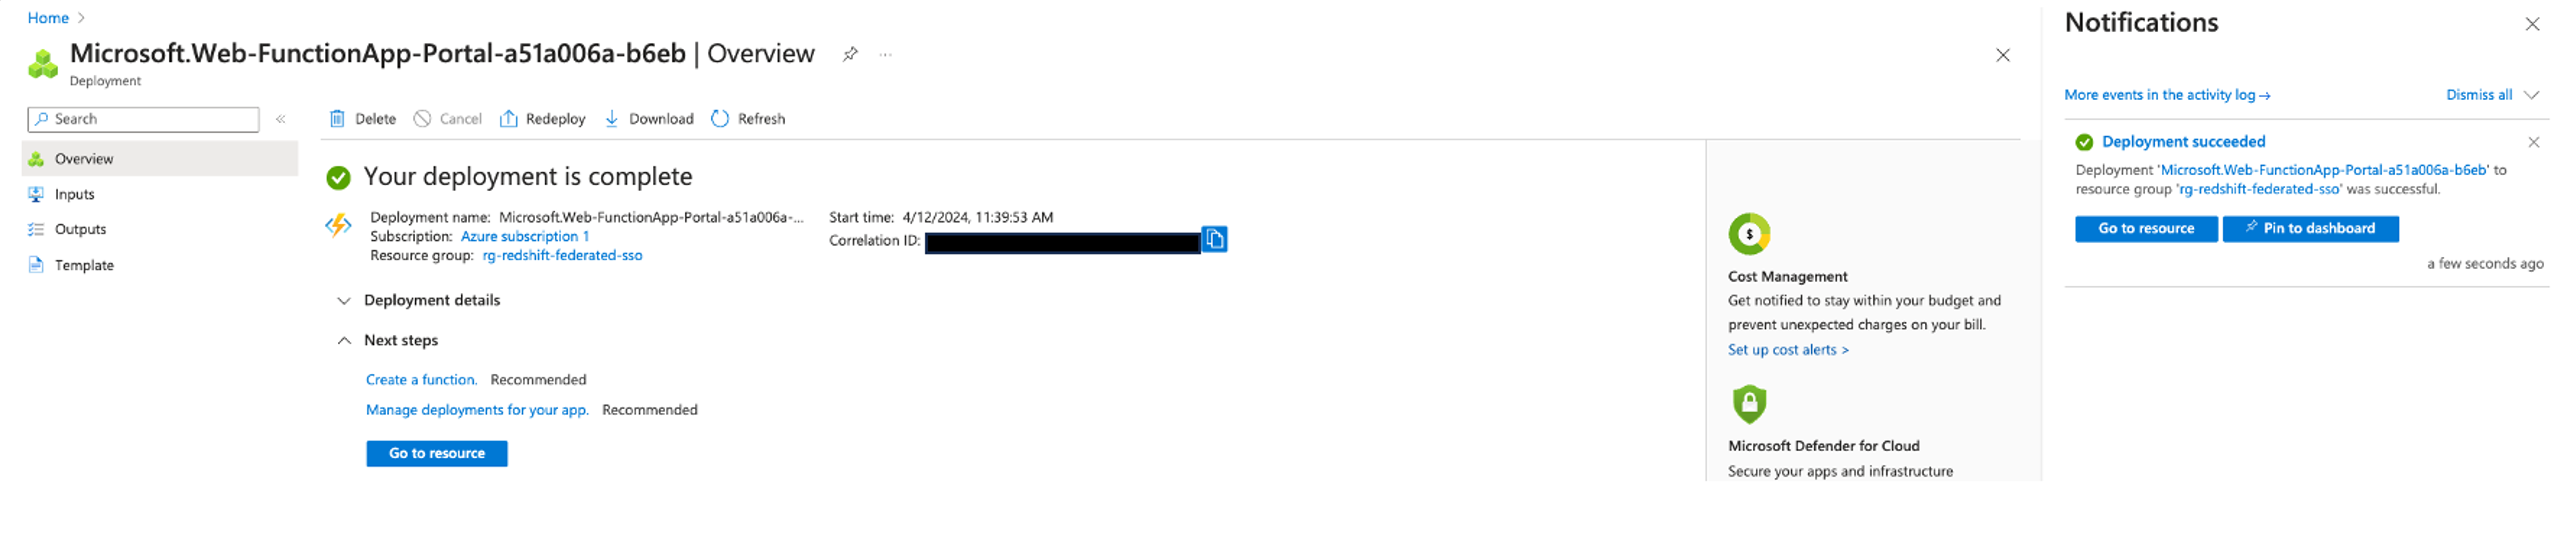
Create a function
Next, we create a HTTP trigger function in the newly created function app, called fn-entra-id-transformer.
- In the function app, choose Overview, then choose Create function in the Functions section.

- In the Create function pane, provide the following information:
- For Select a template, choose v2 Programming Model.
- For Programming Model, choose the HTTP trigger template.
- choose Next.

- In the Template details section, provide the following information:
- For Job type, choose Create new app.
- For Provide a function name, enter
CustomAuthenticationFunction. - Leave the Authorization level unchanged, which is set to Function by default.
- Choose Create.

- After the function is created, choose Get function URL and copy the value for default (Function key).

- Store the copied URL securely; you’ll need to use this URL later when setting up a custom authentication extension later in the section.
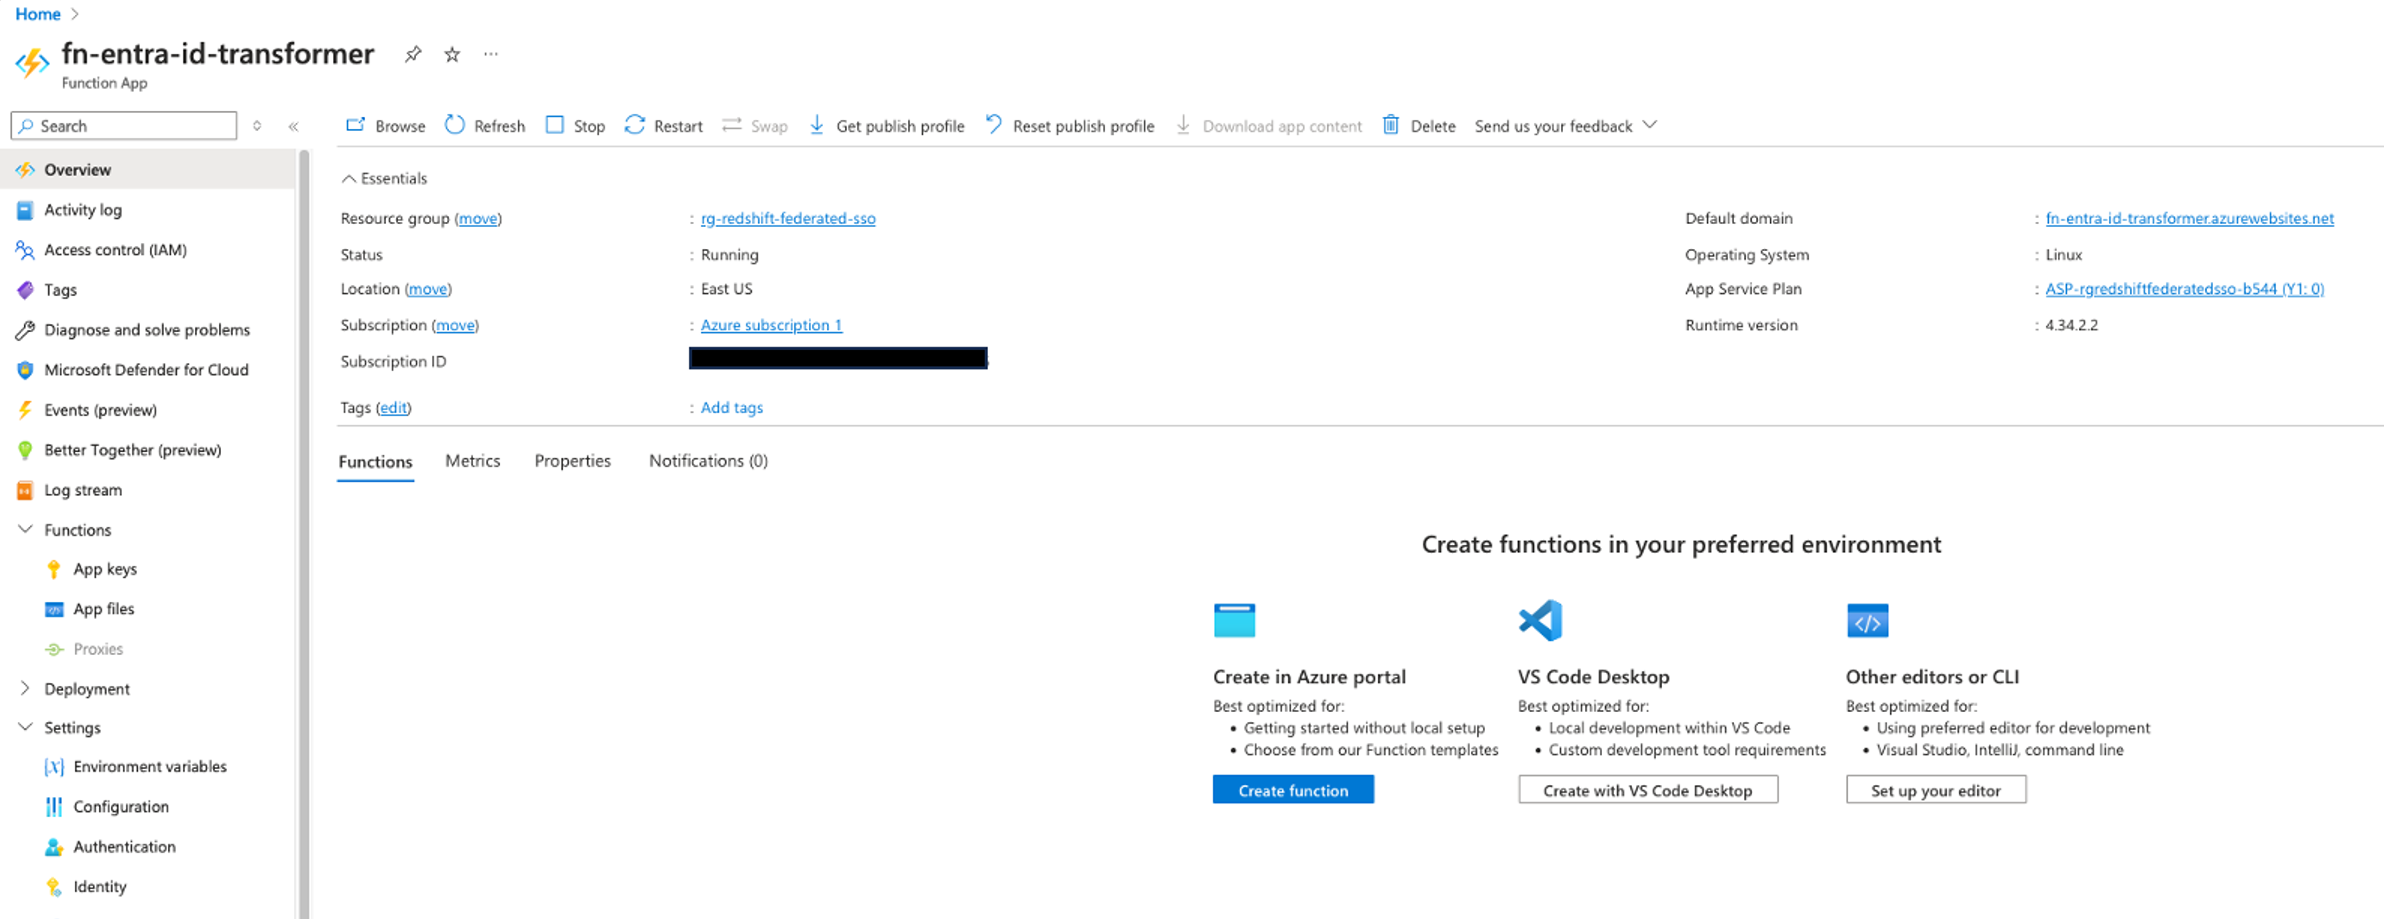
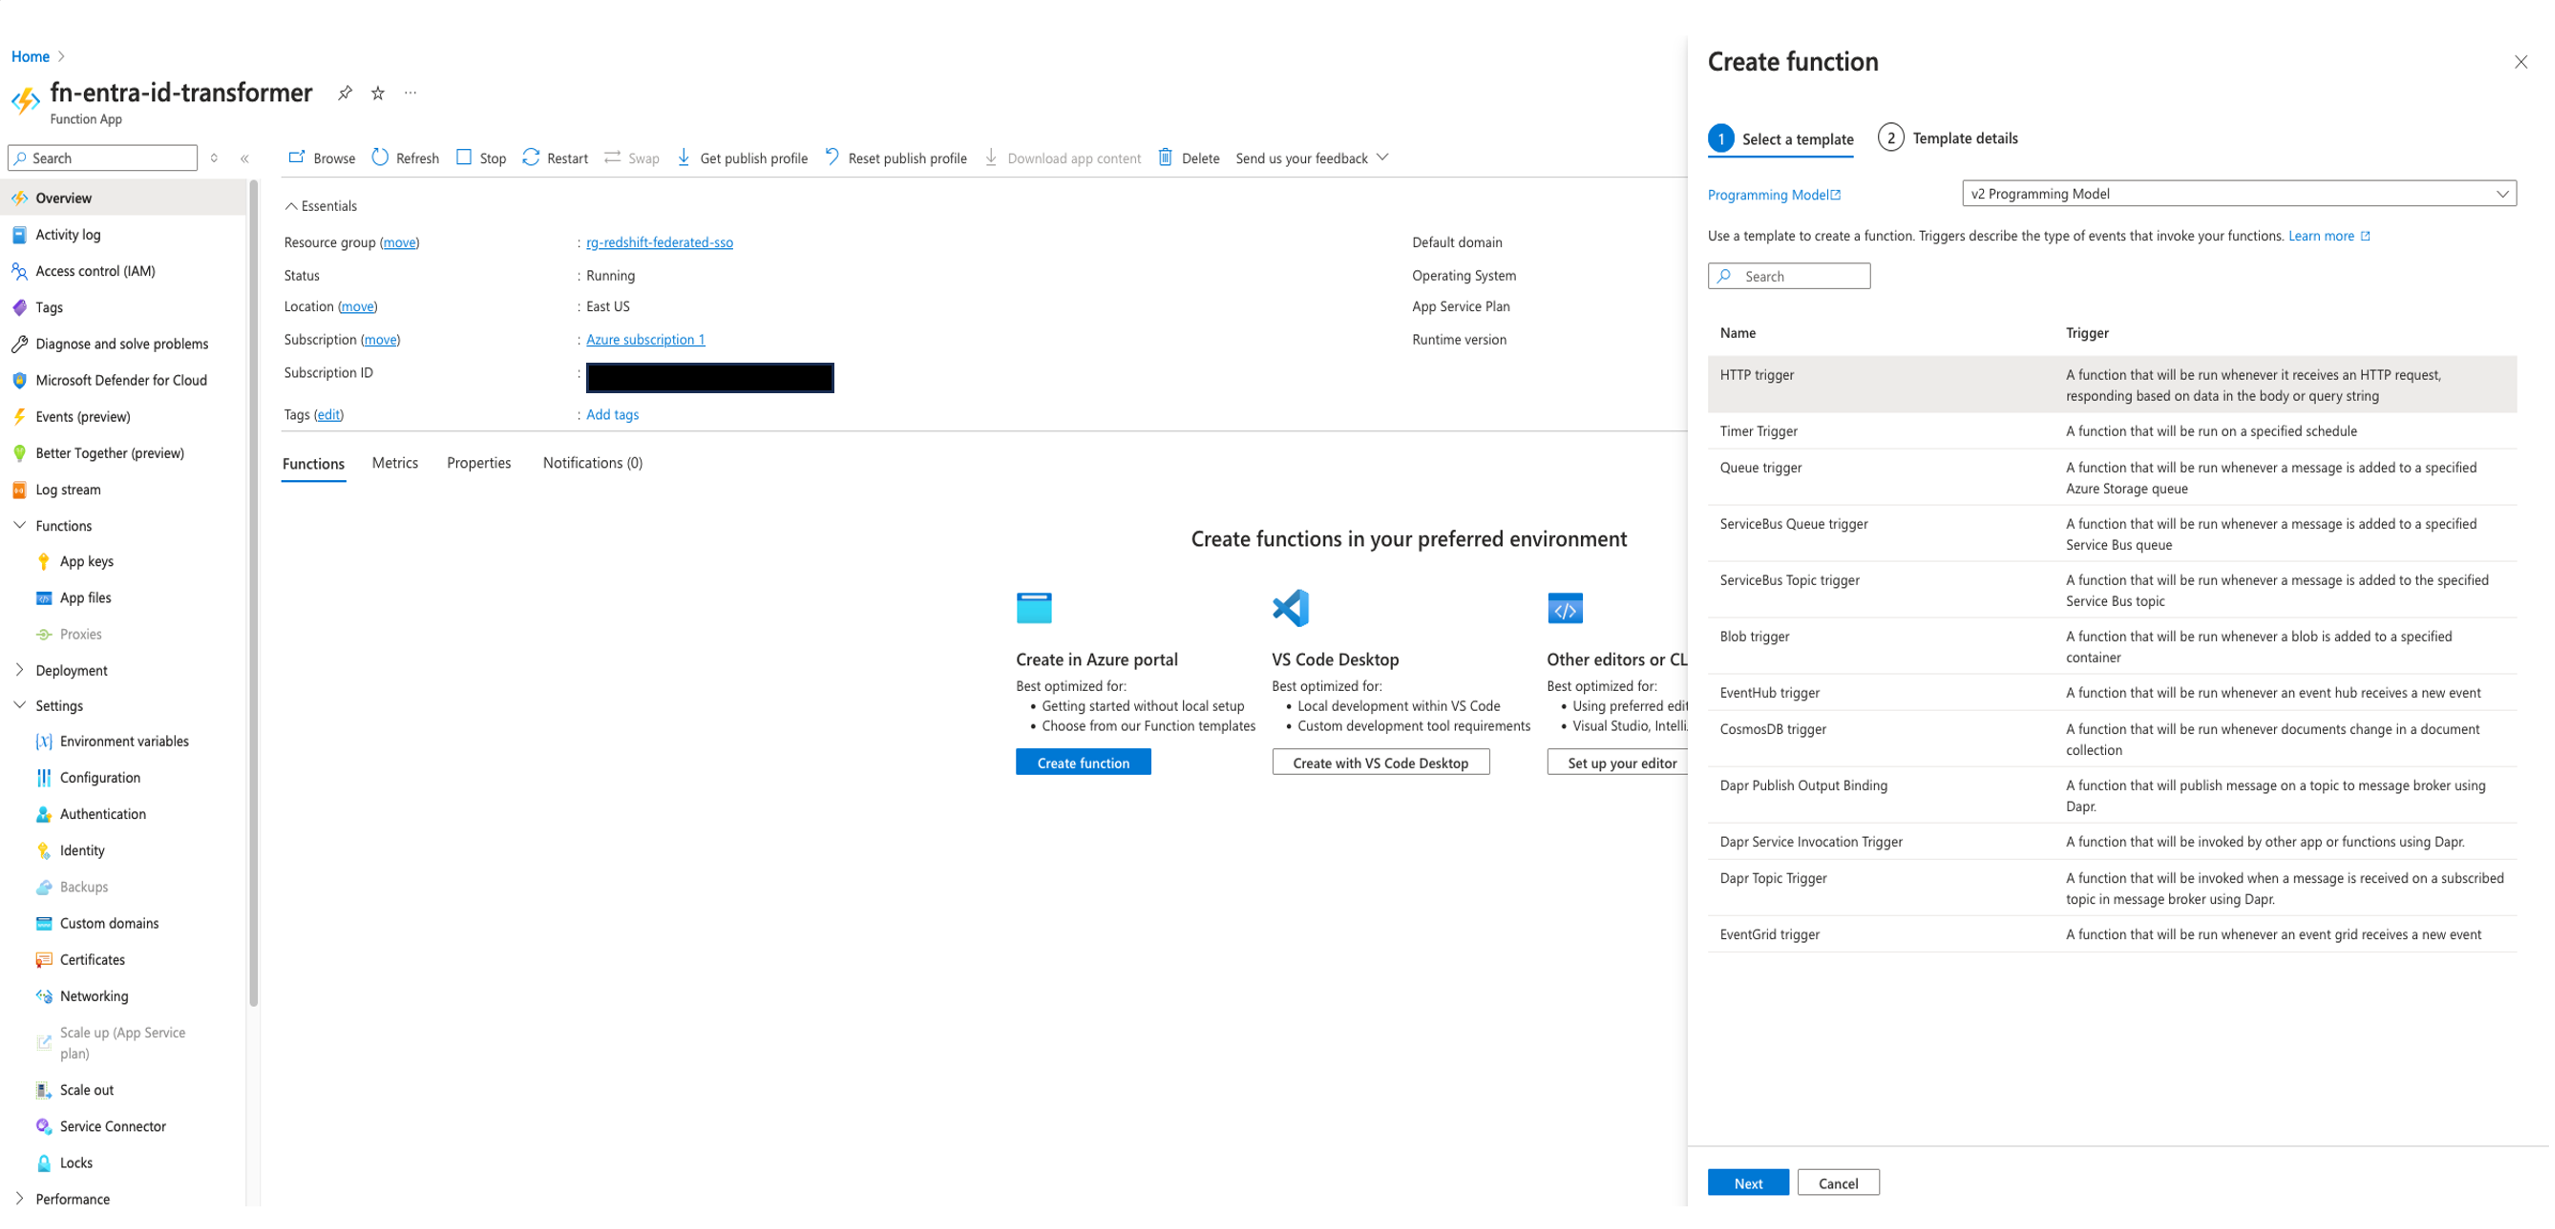
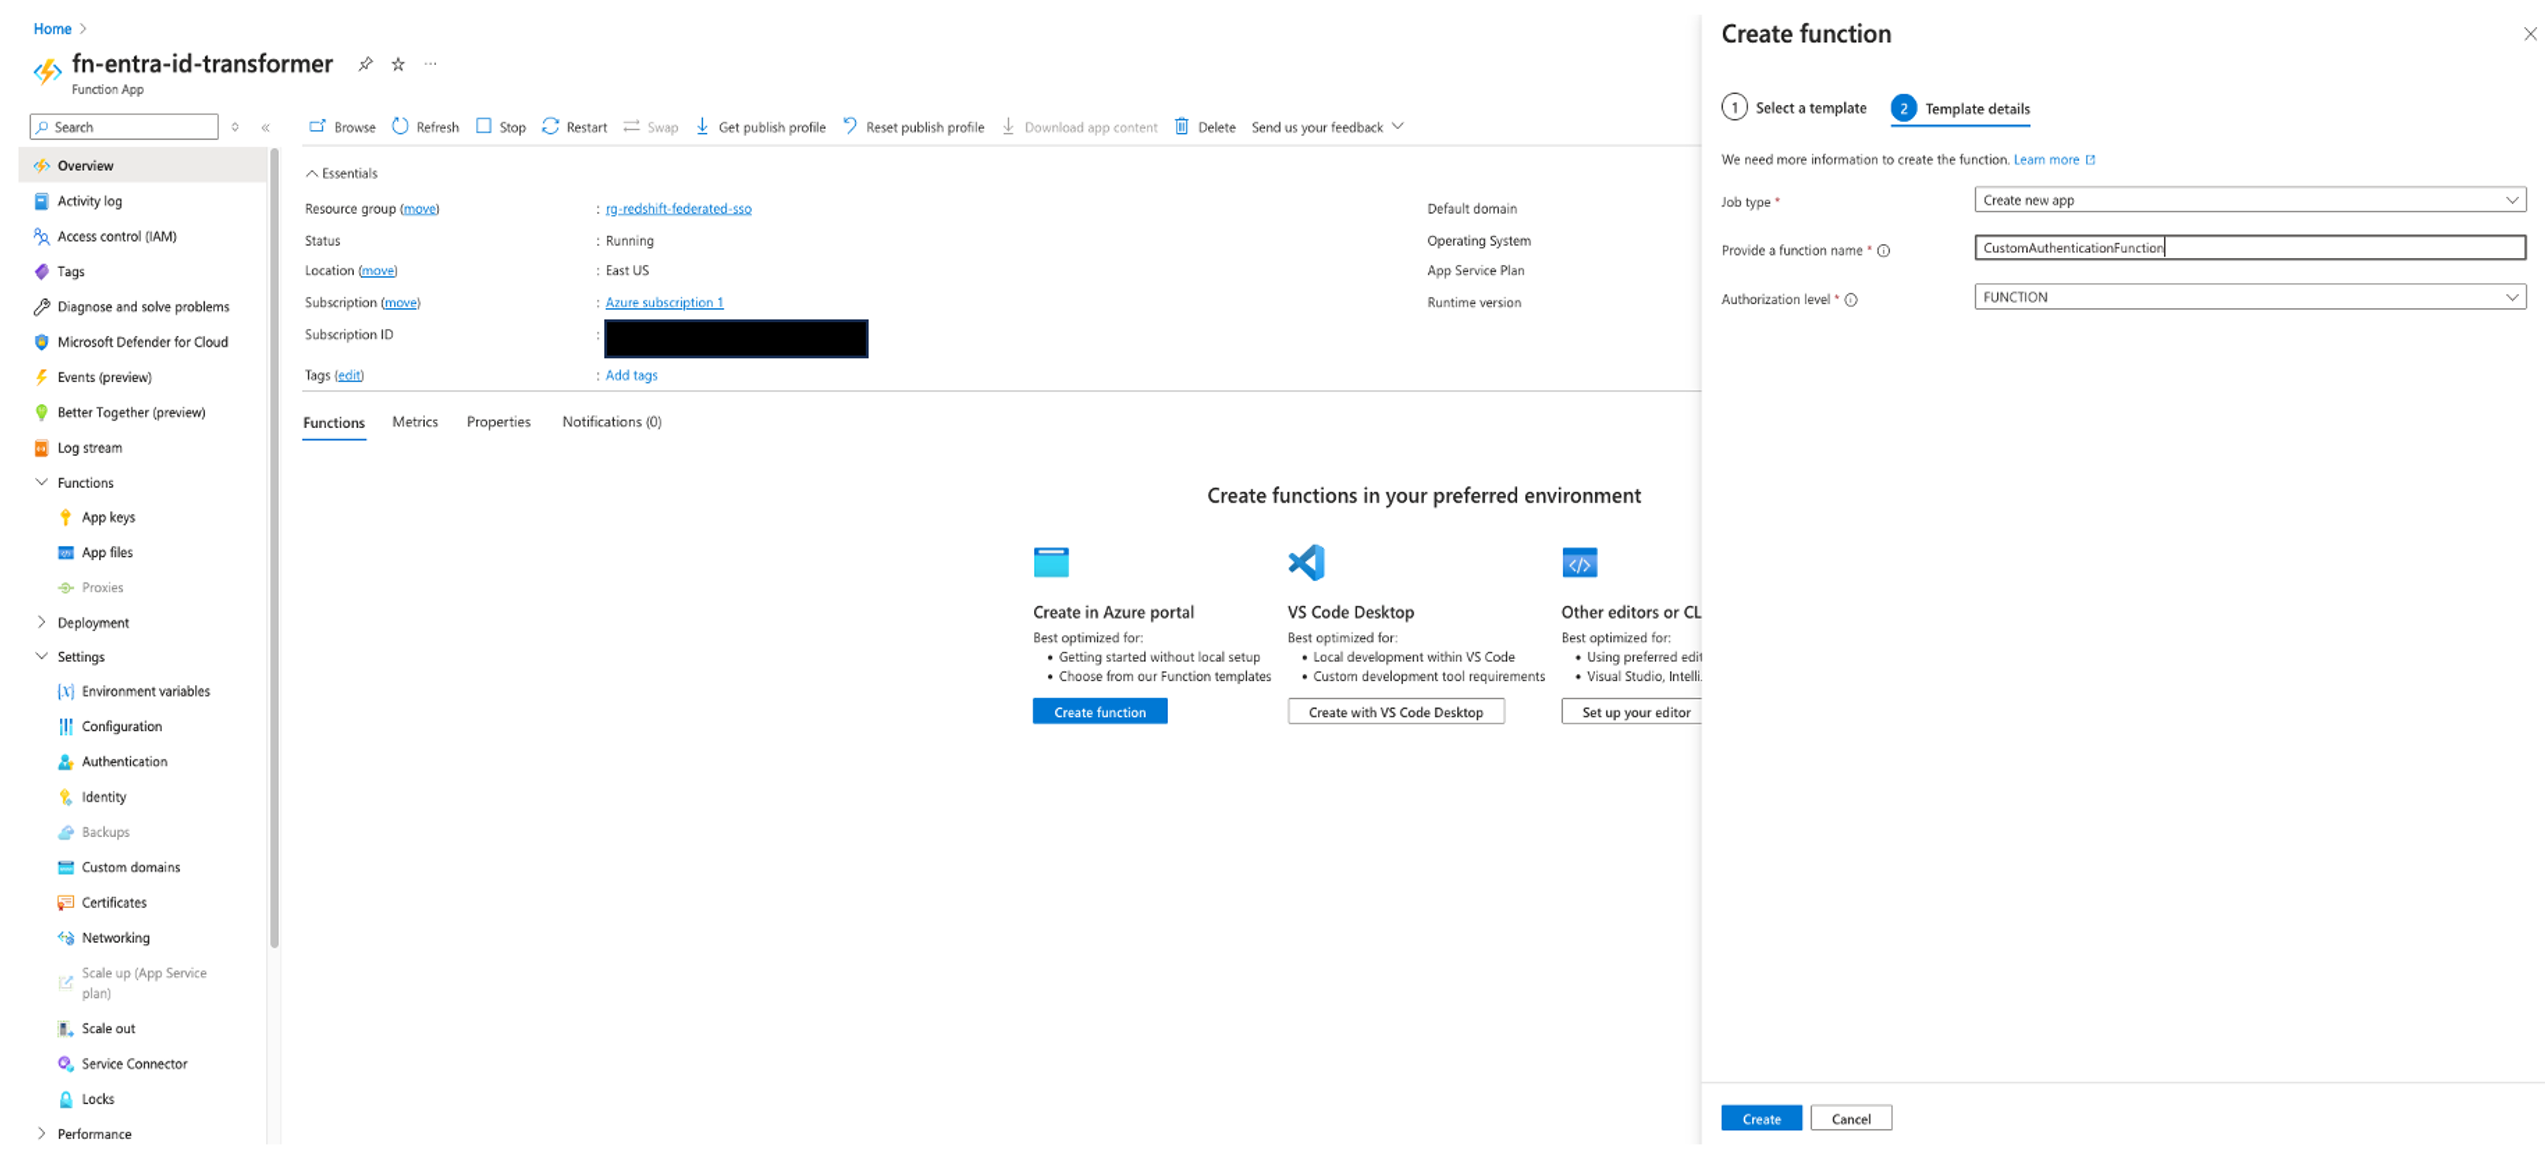
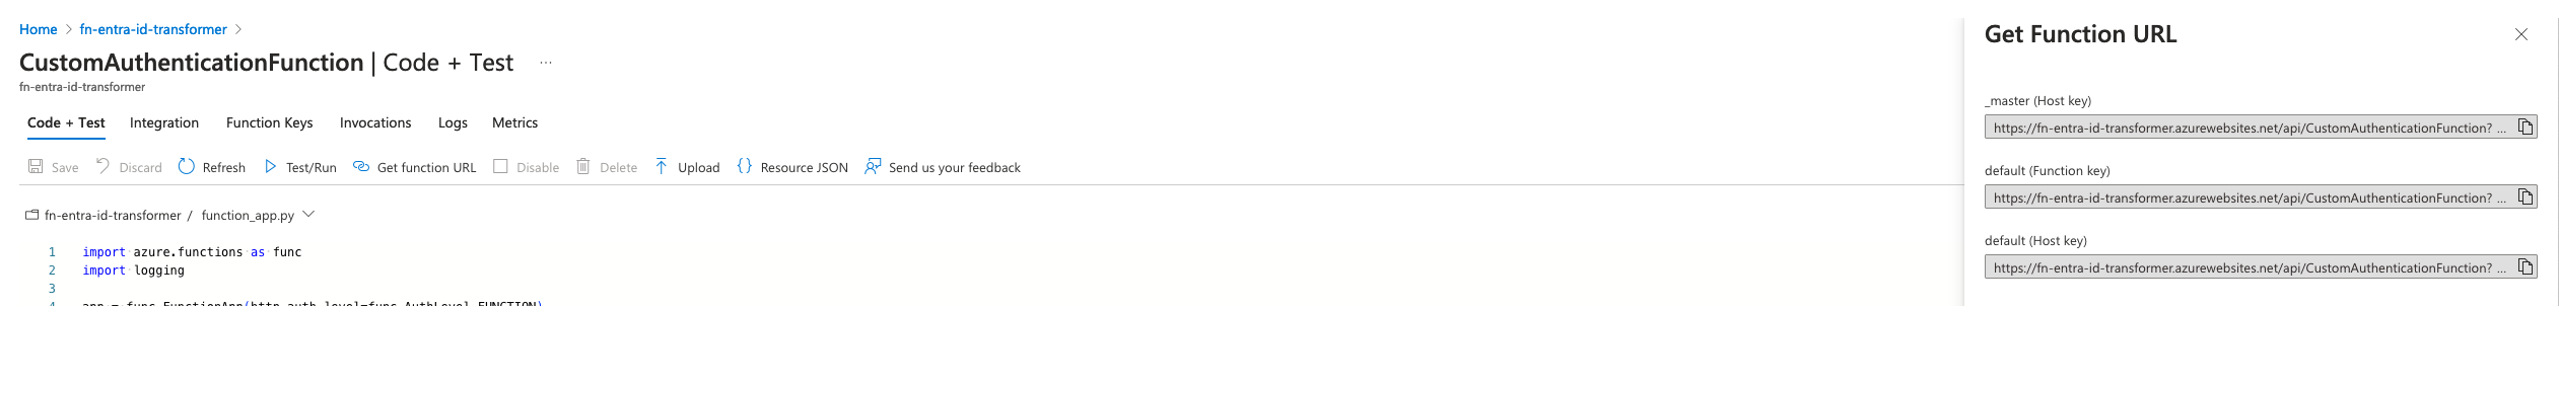
We will come back to this function later to update the code to retrieve group information.
Create a custom authentication extension
Next, we create a custom authentication extension. Complete the following steps:
- Navigate to Microsoft Entra ID, Enterprise applications, Custom authentication extensions.
- Choose Create a custom extension.

- In the Basics section, provide the following information:
- Leave Event type as
TokenIssuanceStart(which is the default option). - Select it and choose Next.
- Leave Event type as
- In the Endpoint Configuration section, provide the following information:
- For Name, enter
Retrieve_user_group_information. - For Target URL, enter the function URL you stored earlier.
- Leave Timeout in milliseconds and Maximum Retries as the default values.
- Choose Next.

- For Name, enter
- In the Api Authentication section, provide the following information:
- Select Create new app registration for App registration type.
- For Name, enter
Retrieve_user_group_information. - Choose Next.

- In the Claims section, provide the following information:
- For Claim name, enter
dbGroupsqueryeditoranddbGroupssqltools. - Choose Next.

- For Claim name, enter
- In the Review section, review the configuration details, and if everything looks correct, choose Create.After the creation is completed, you will be redirected to the overview page of the newly created custom authentication extension.On the overview page, in the API Authentication section, you will see a message indicating that admin consent is required.
- Choose Grant admin consent to grant the required permissions.
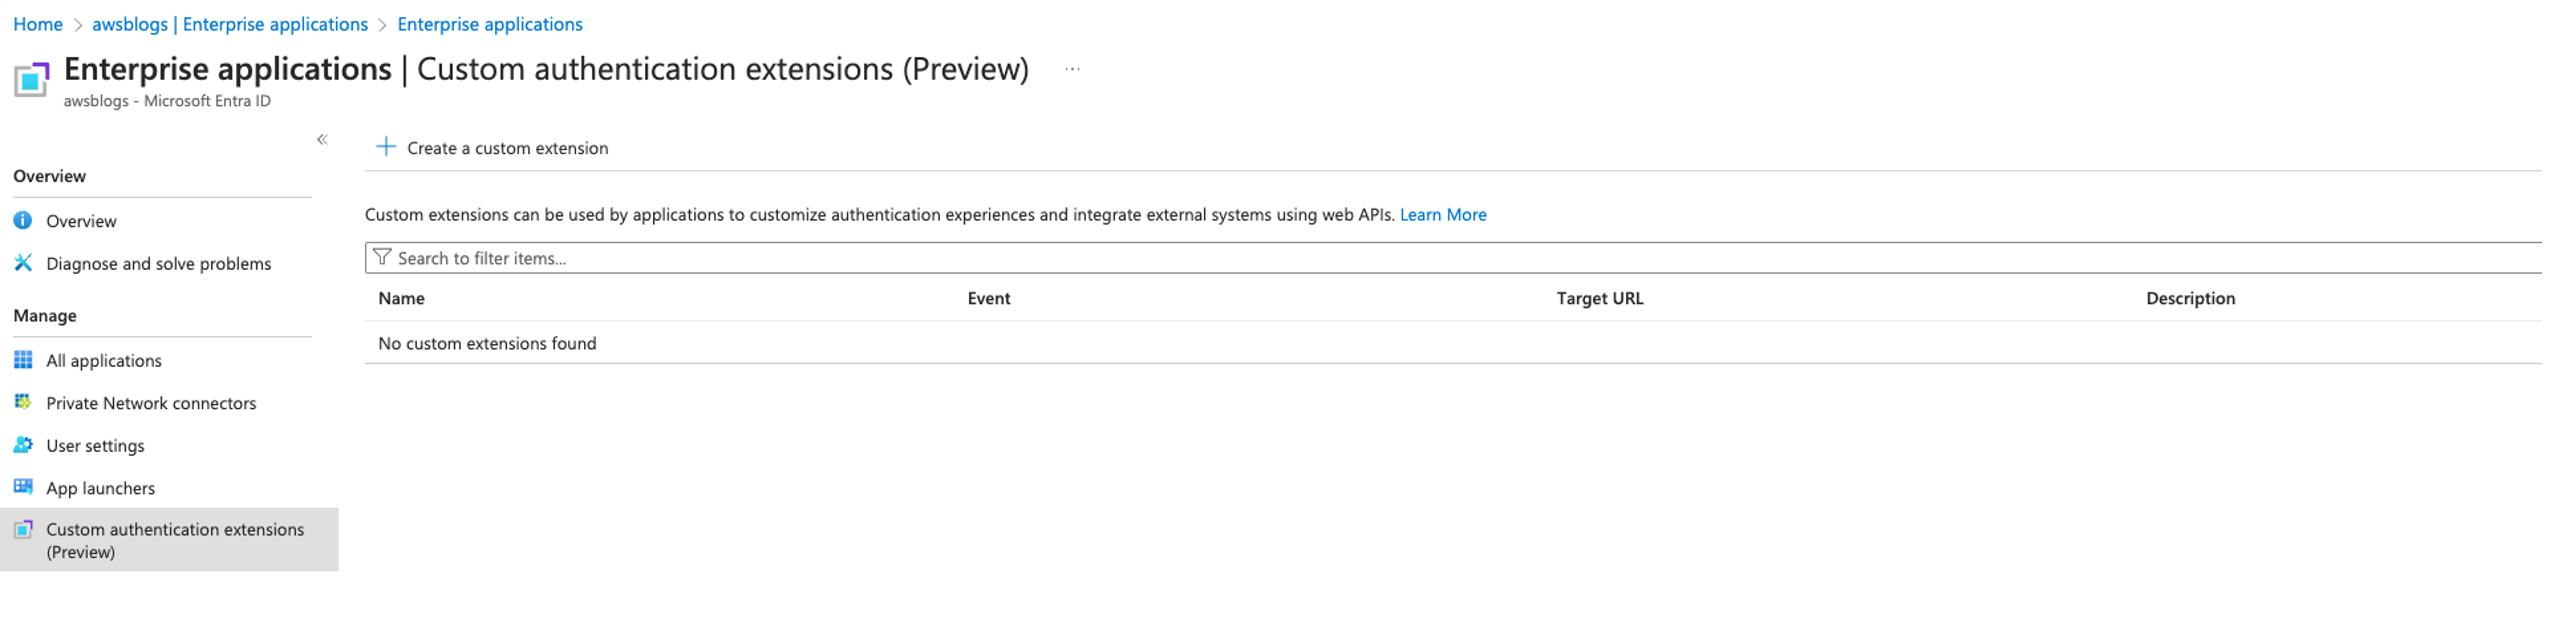
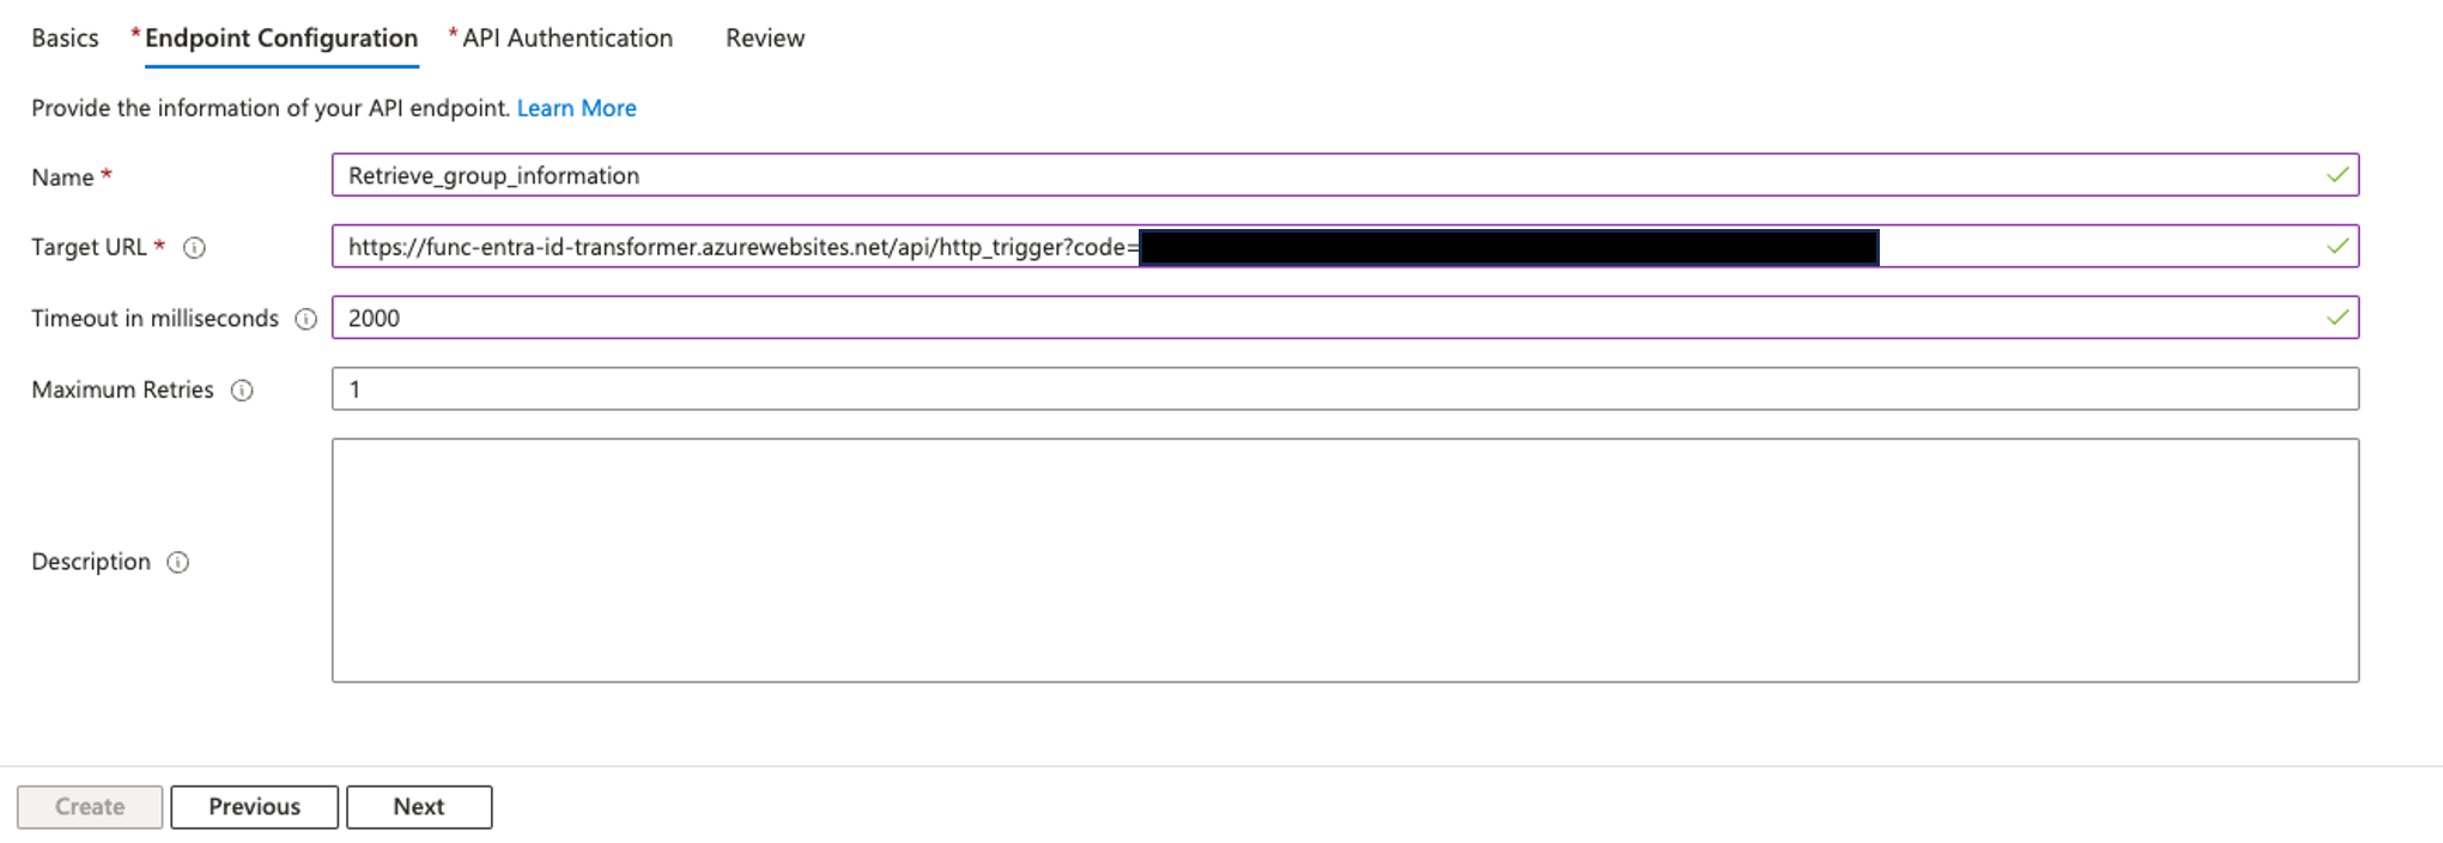
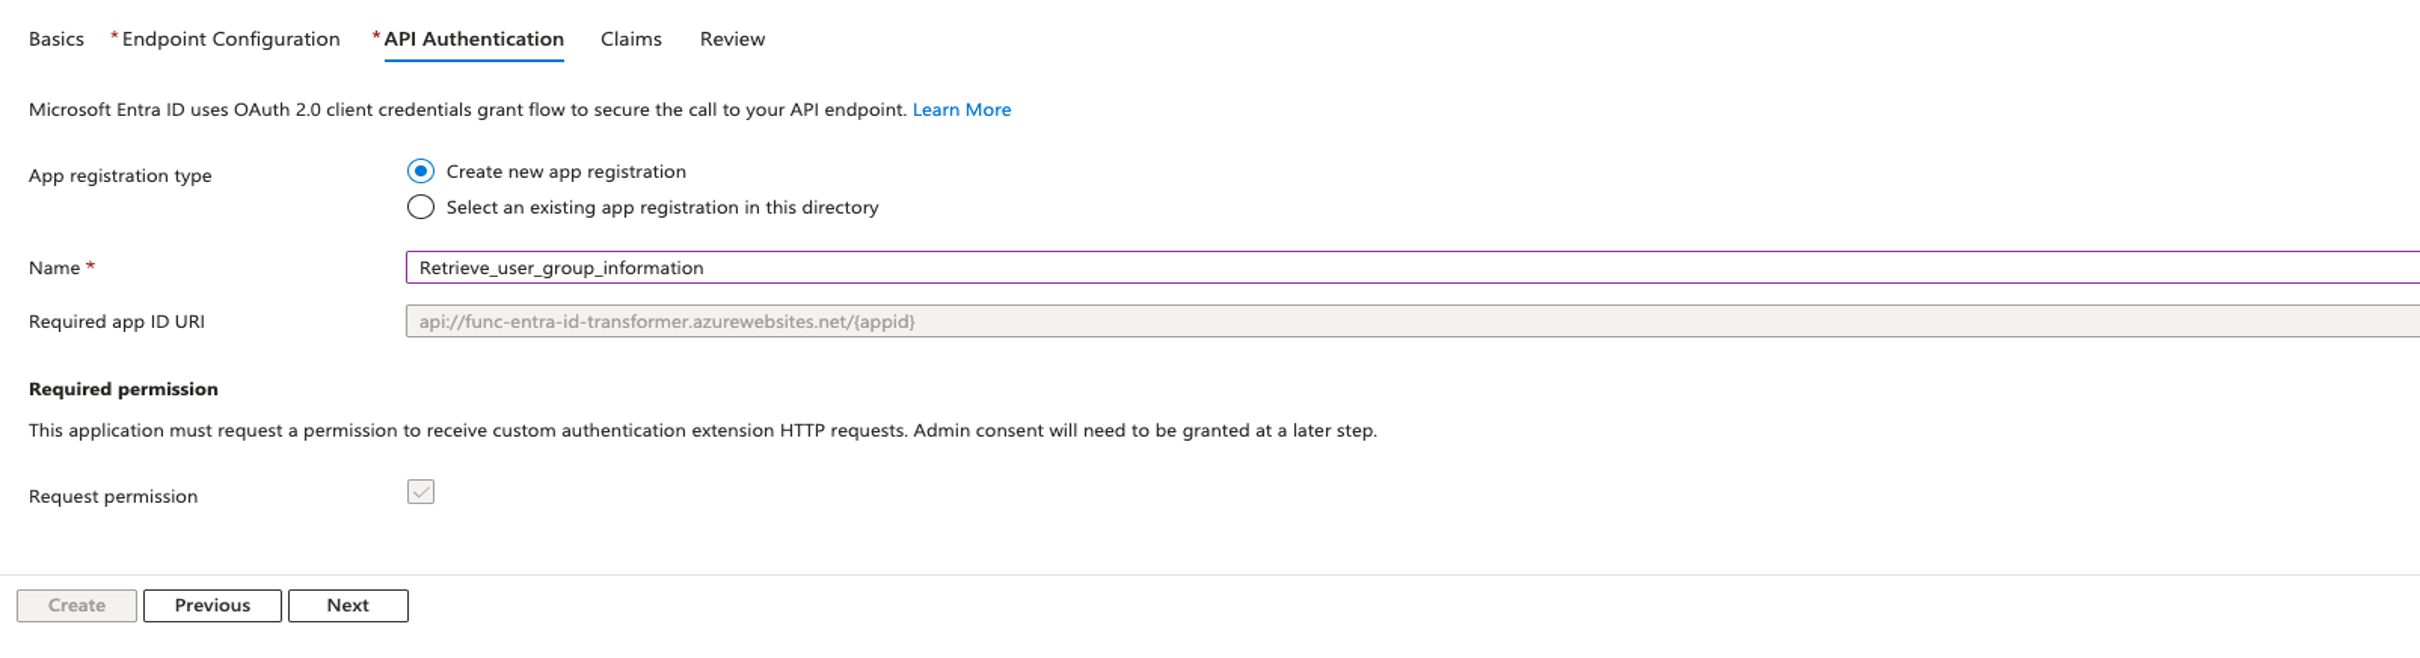
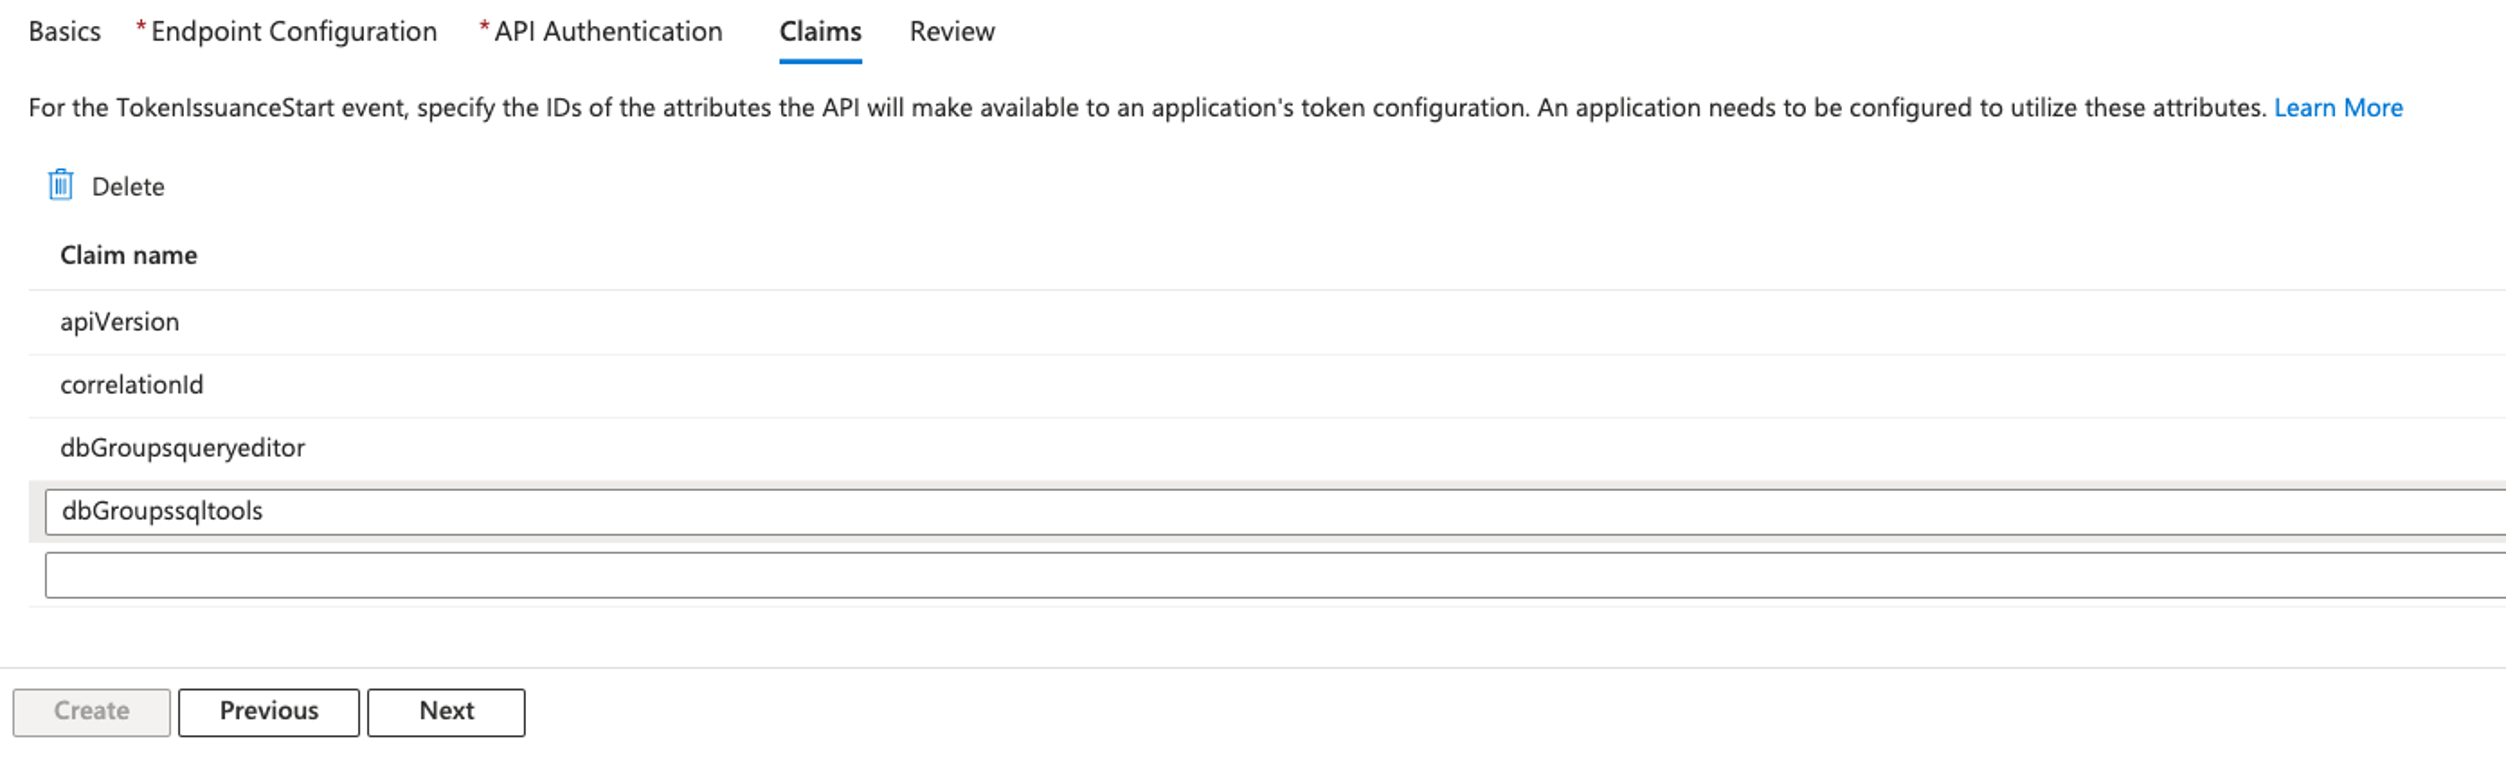

After the admin consent is granted successfully, the API Authentication section will show the status as Configured.
Now you can proceed to create the enterprise application.
Set up the Azure enterprise application
Complete the steps in this section to configure the Azure enterprise application.
Create a new Azure enterprise application
Complete the following steps to create an Azure Enterprise application:
- Navigate to Microsoft Entra ID, Enterprise applications, New application.

- Under Cloud platforms, choose Amazon Web Services (AWS).

- For Name, enter
AWS Single-Account Access. - Choose Create.

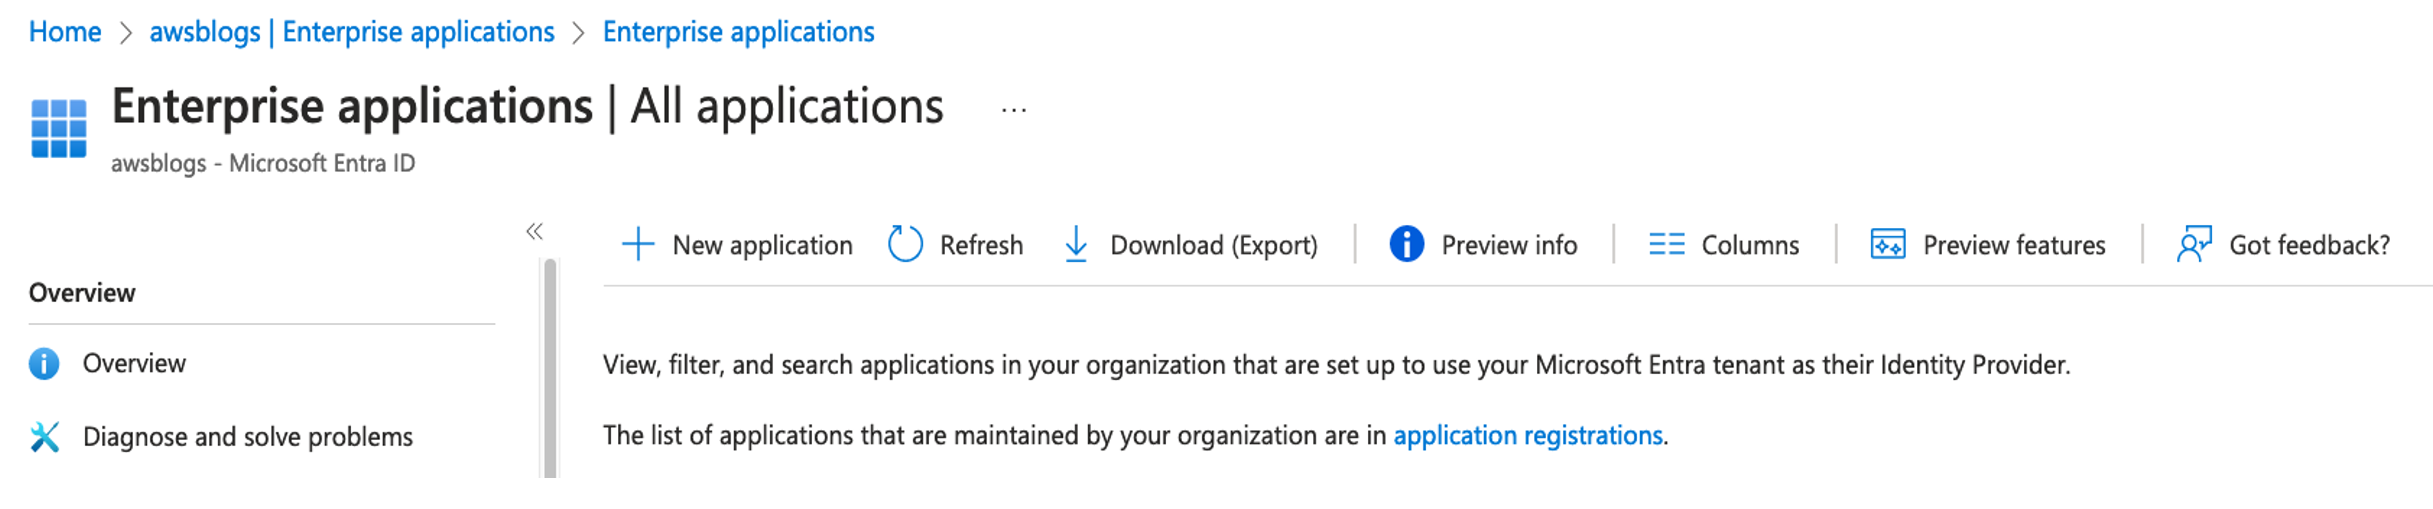
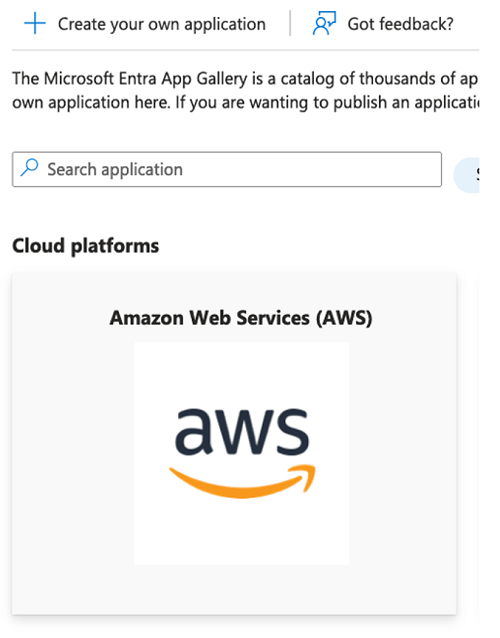
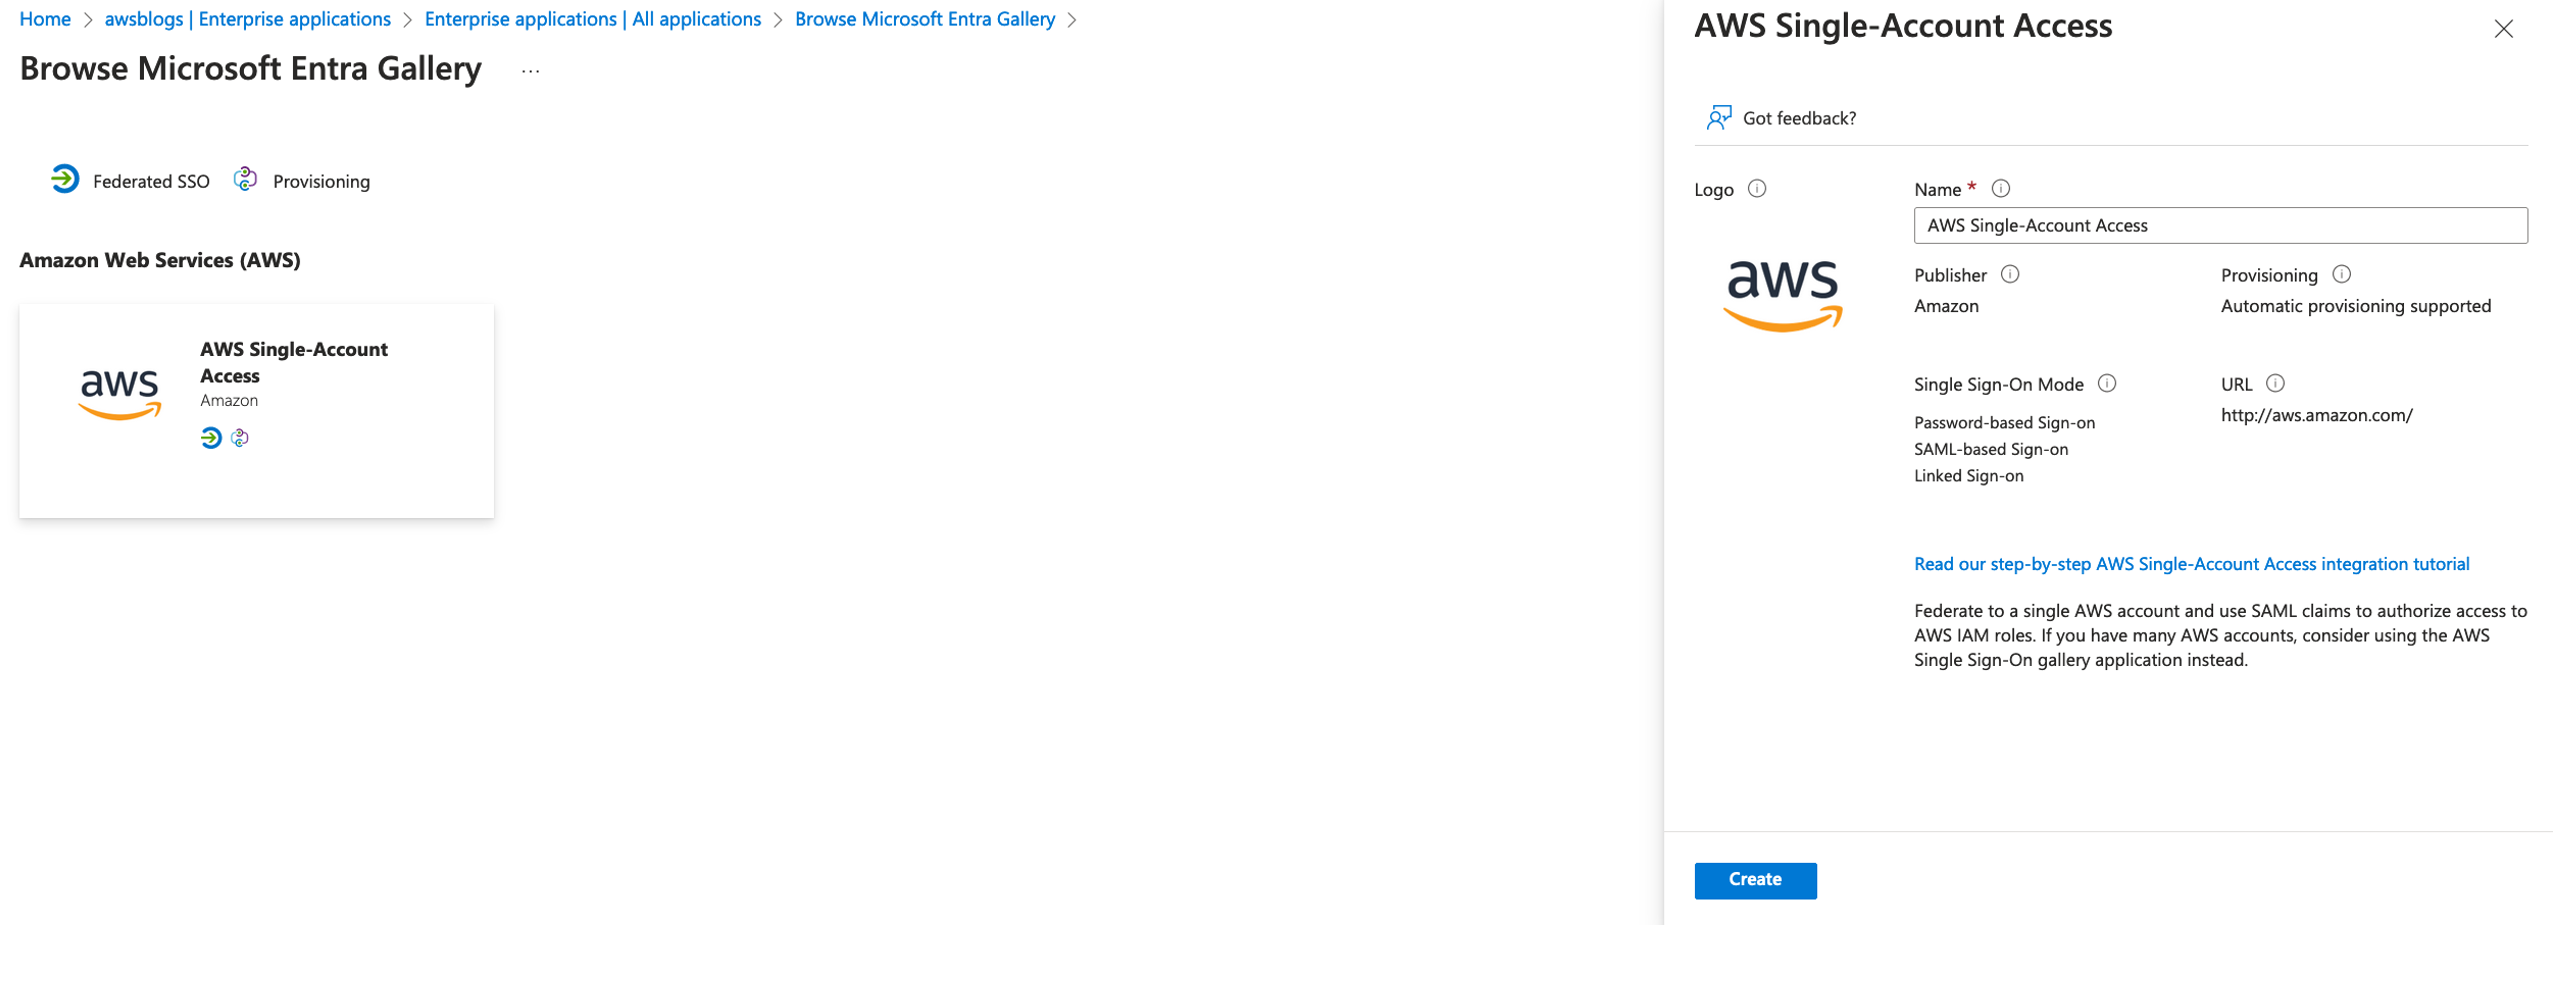
When the create process is complete, you will be redirected to the newly created enterprise application.
Configure SSO
Complete the following steps to configure SSO for your application:
- On the enterprise application page, choose Get started under Set up single sign on.

- Choose SAML.

- In the Basic SAML Configuration section, choose Edit.
- For Identifier (Entity ID) and Reply URL, enter
https://signin.aws.amazon.com/saml. - Choose Save.

- For Identifier (Entity ID) and Reply URL, enter
- In the Attributes & Claims section, choose Edit.
- In the Advanced settings section, choose Configure next to the custom claims provider setting.
- For Custom claims provider, choose
Retrieve_user_group_information. - Choose Save.

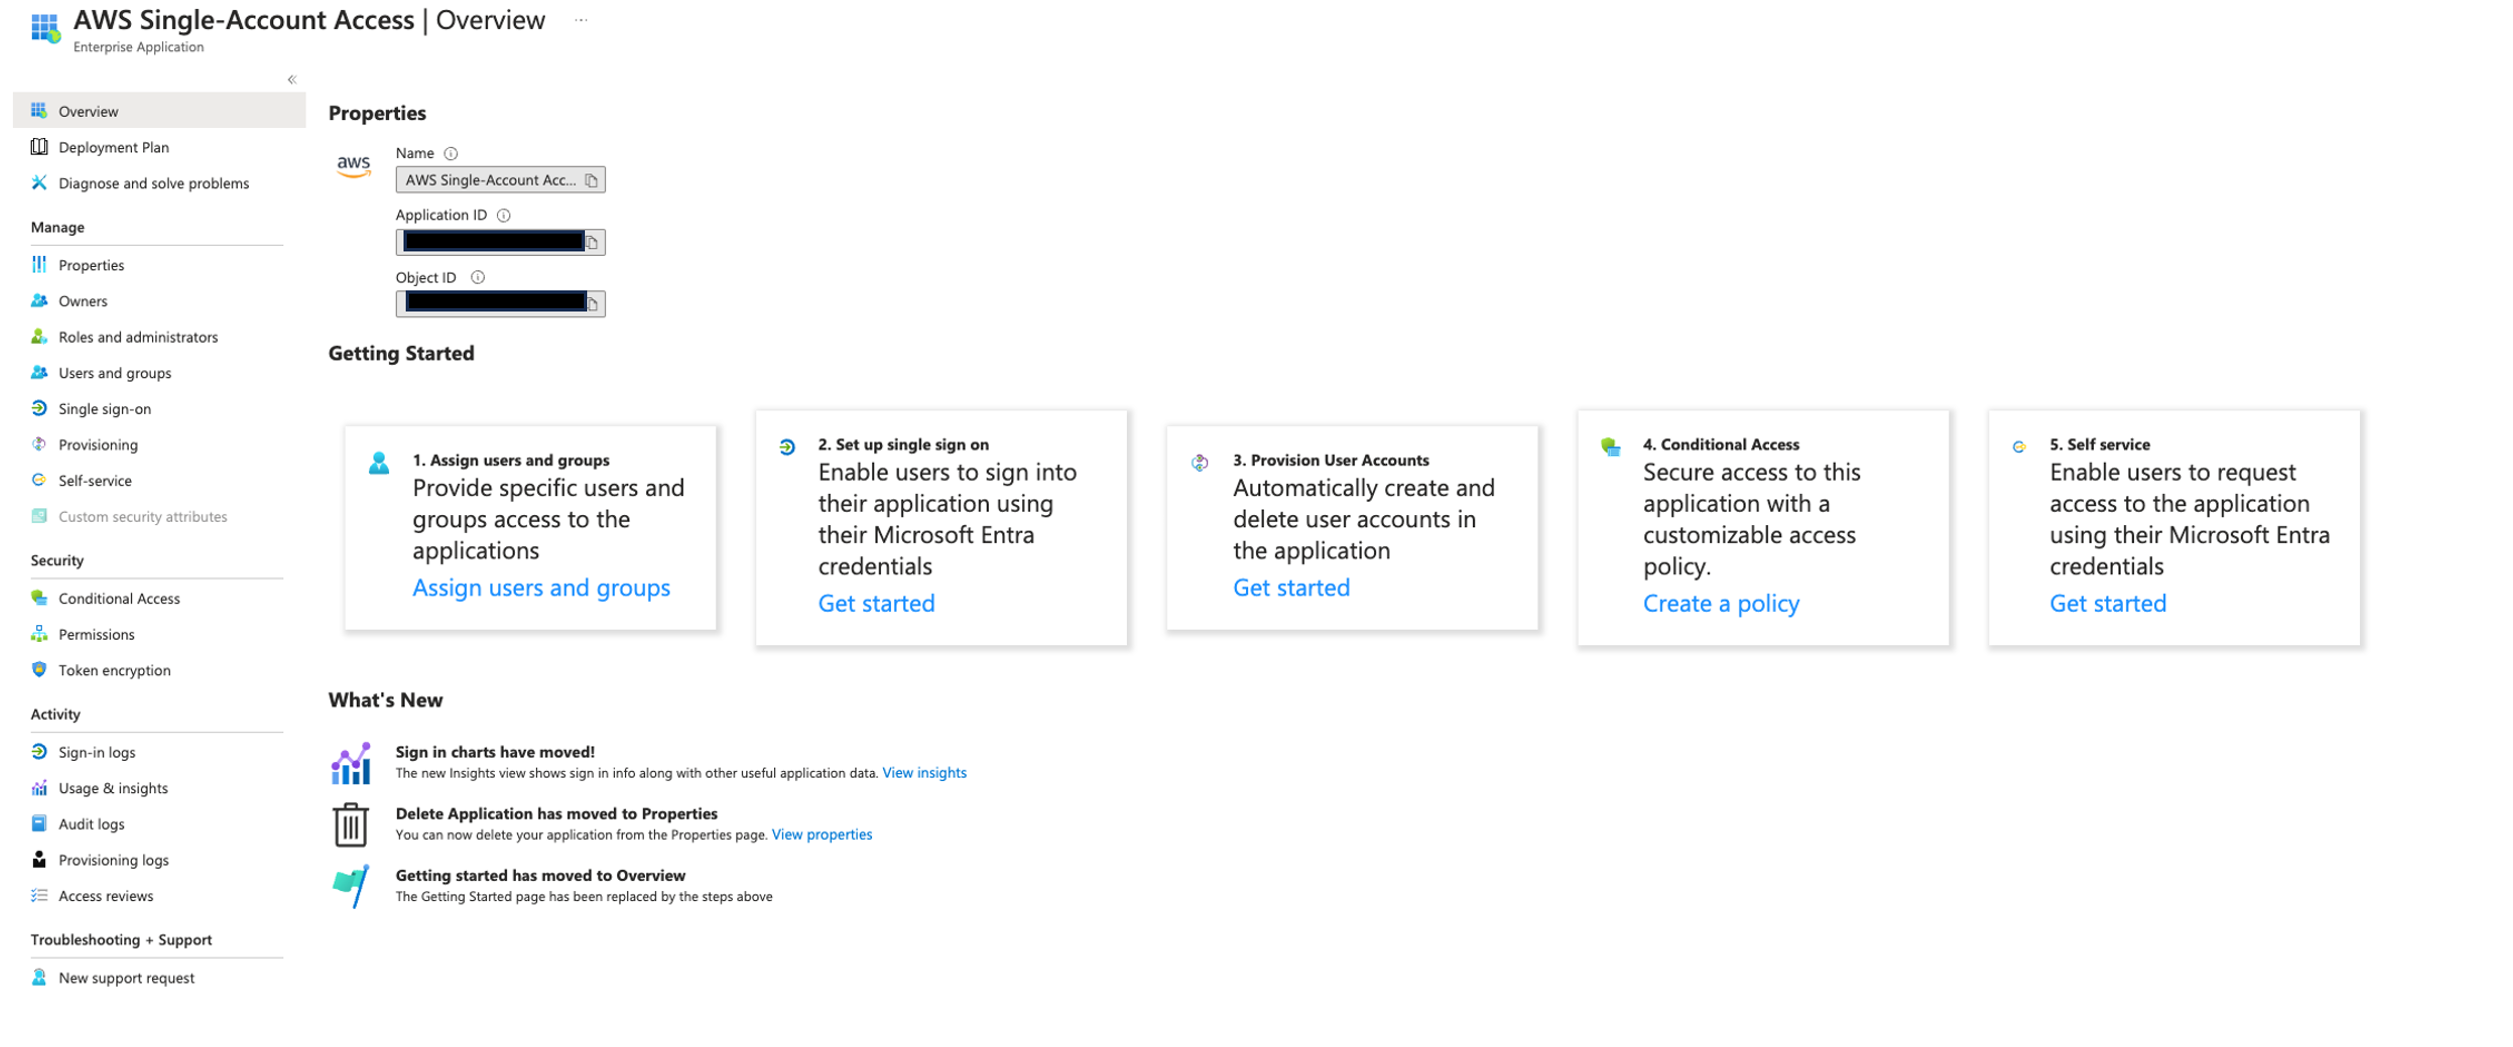
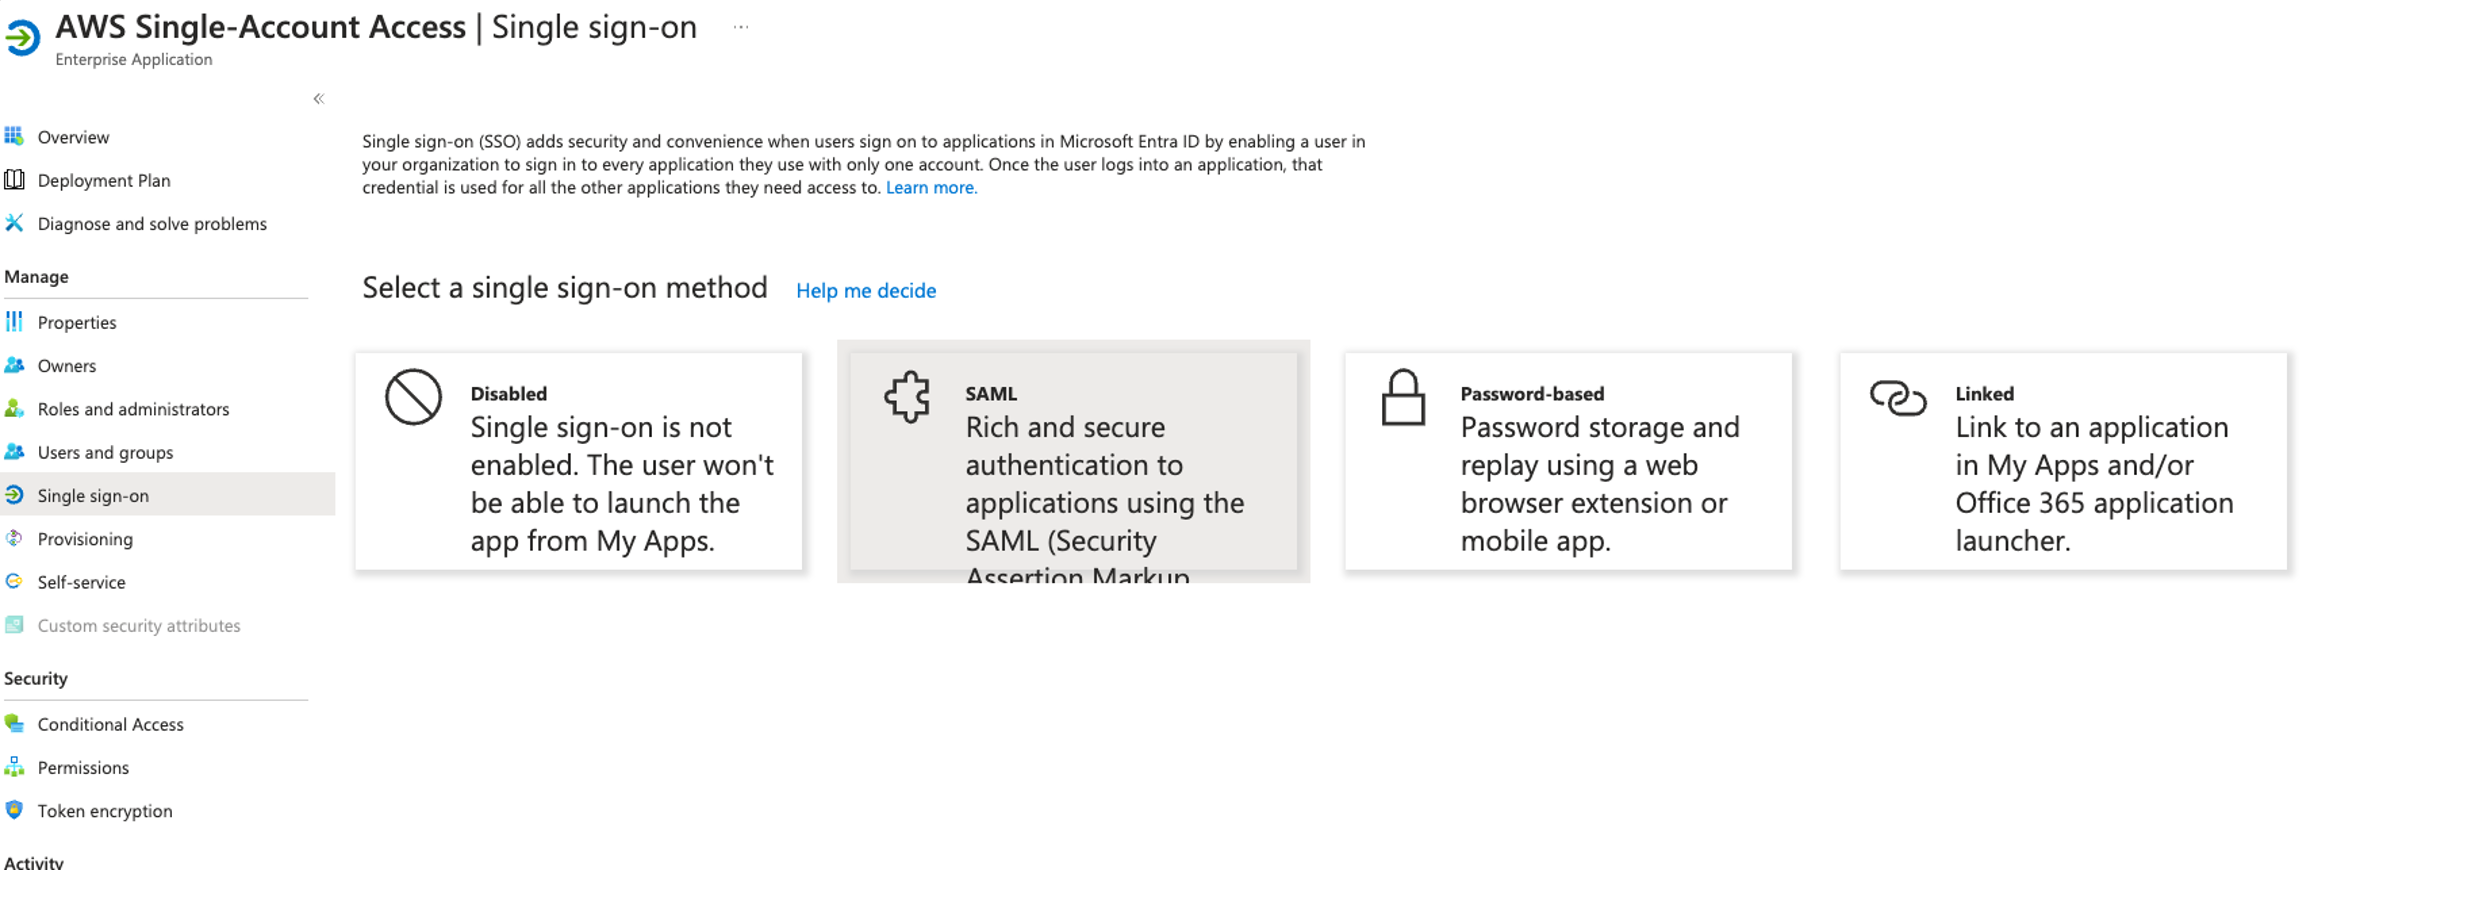
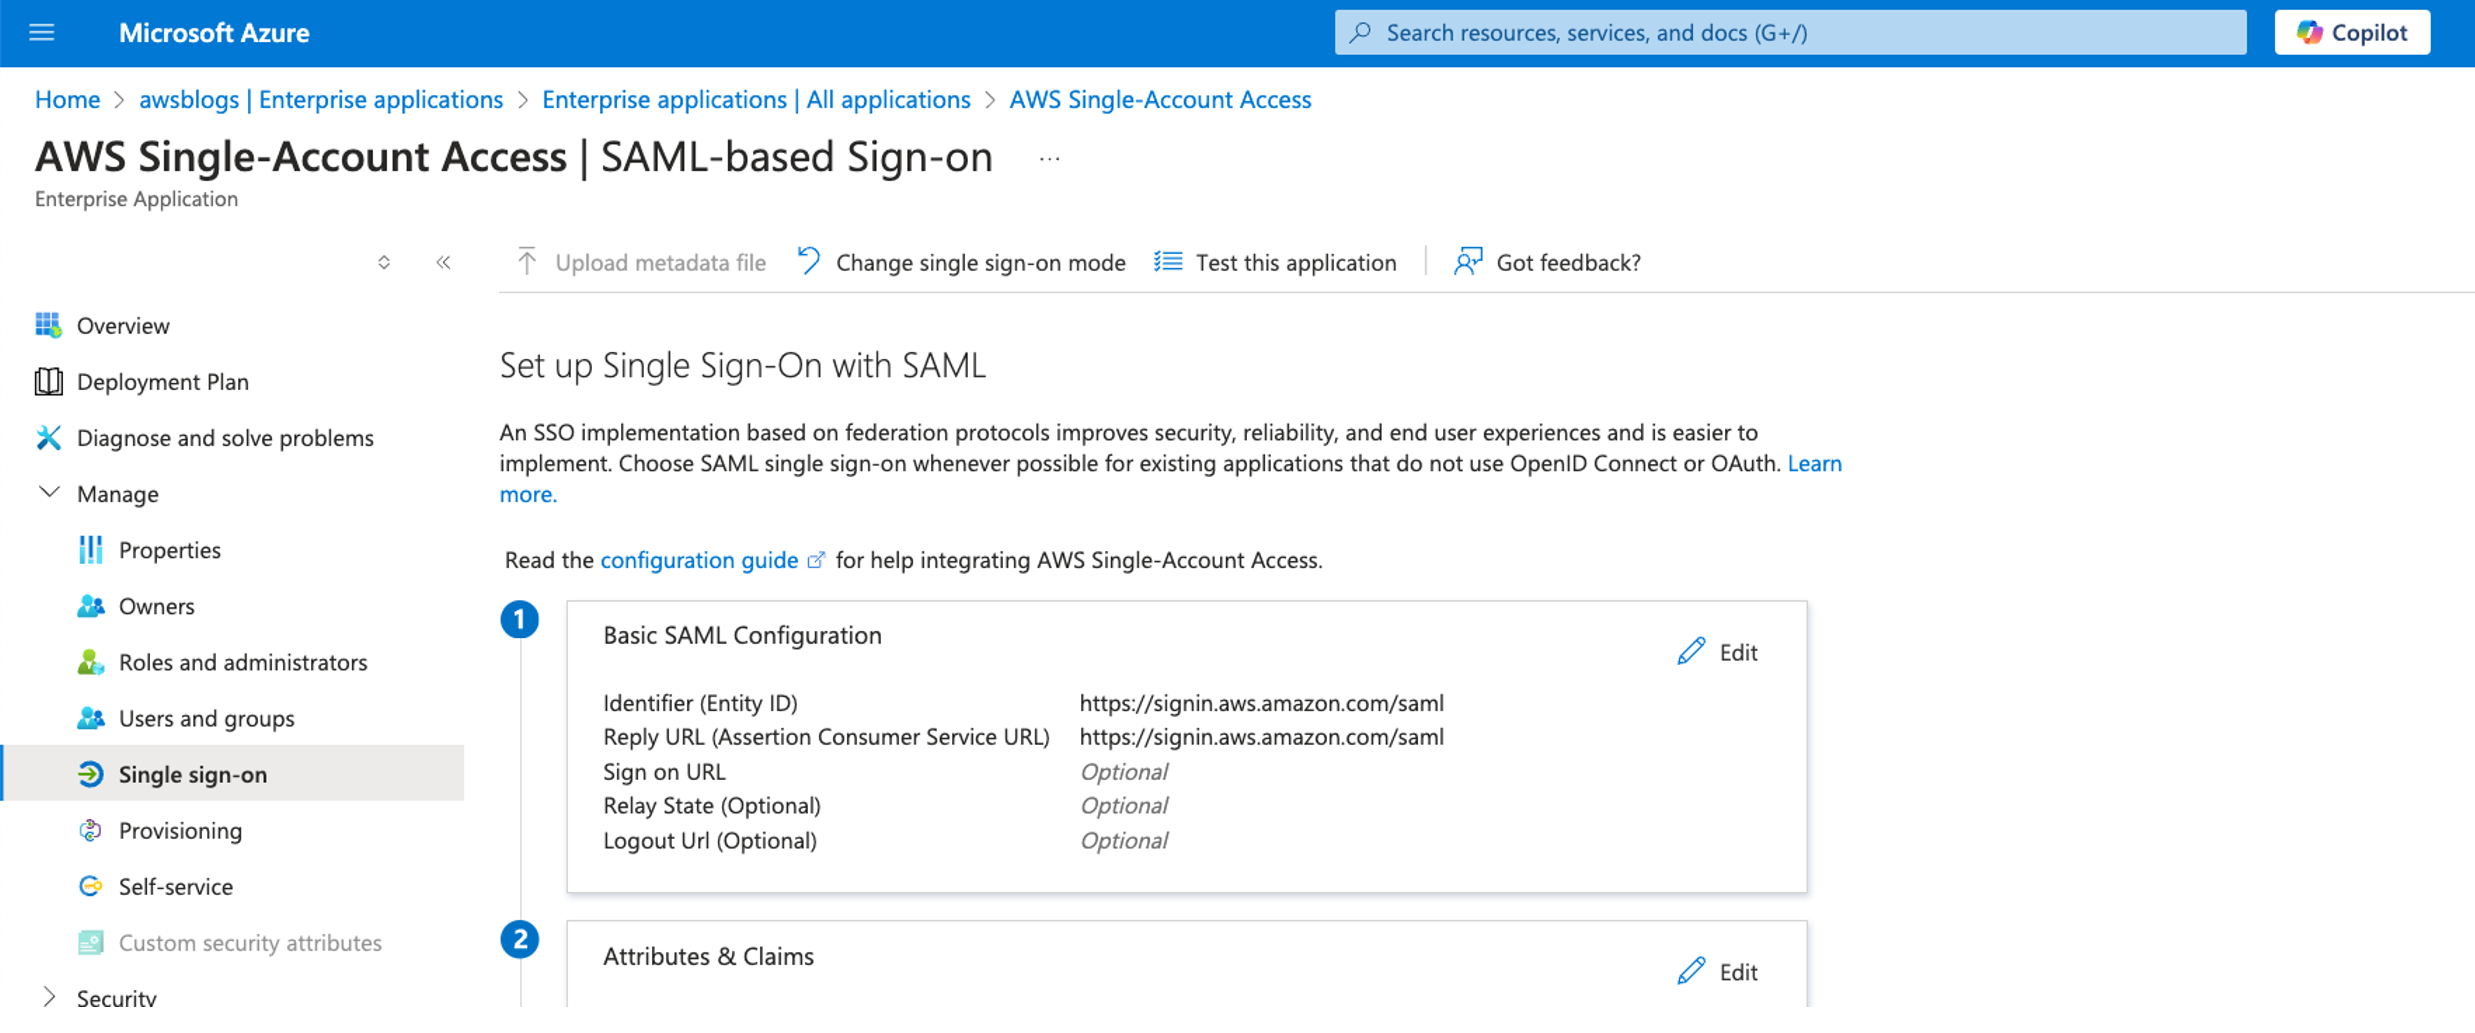
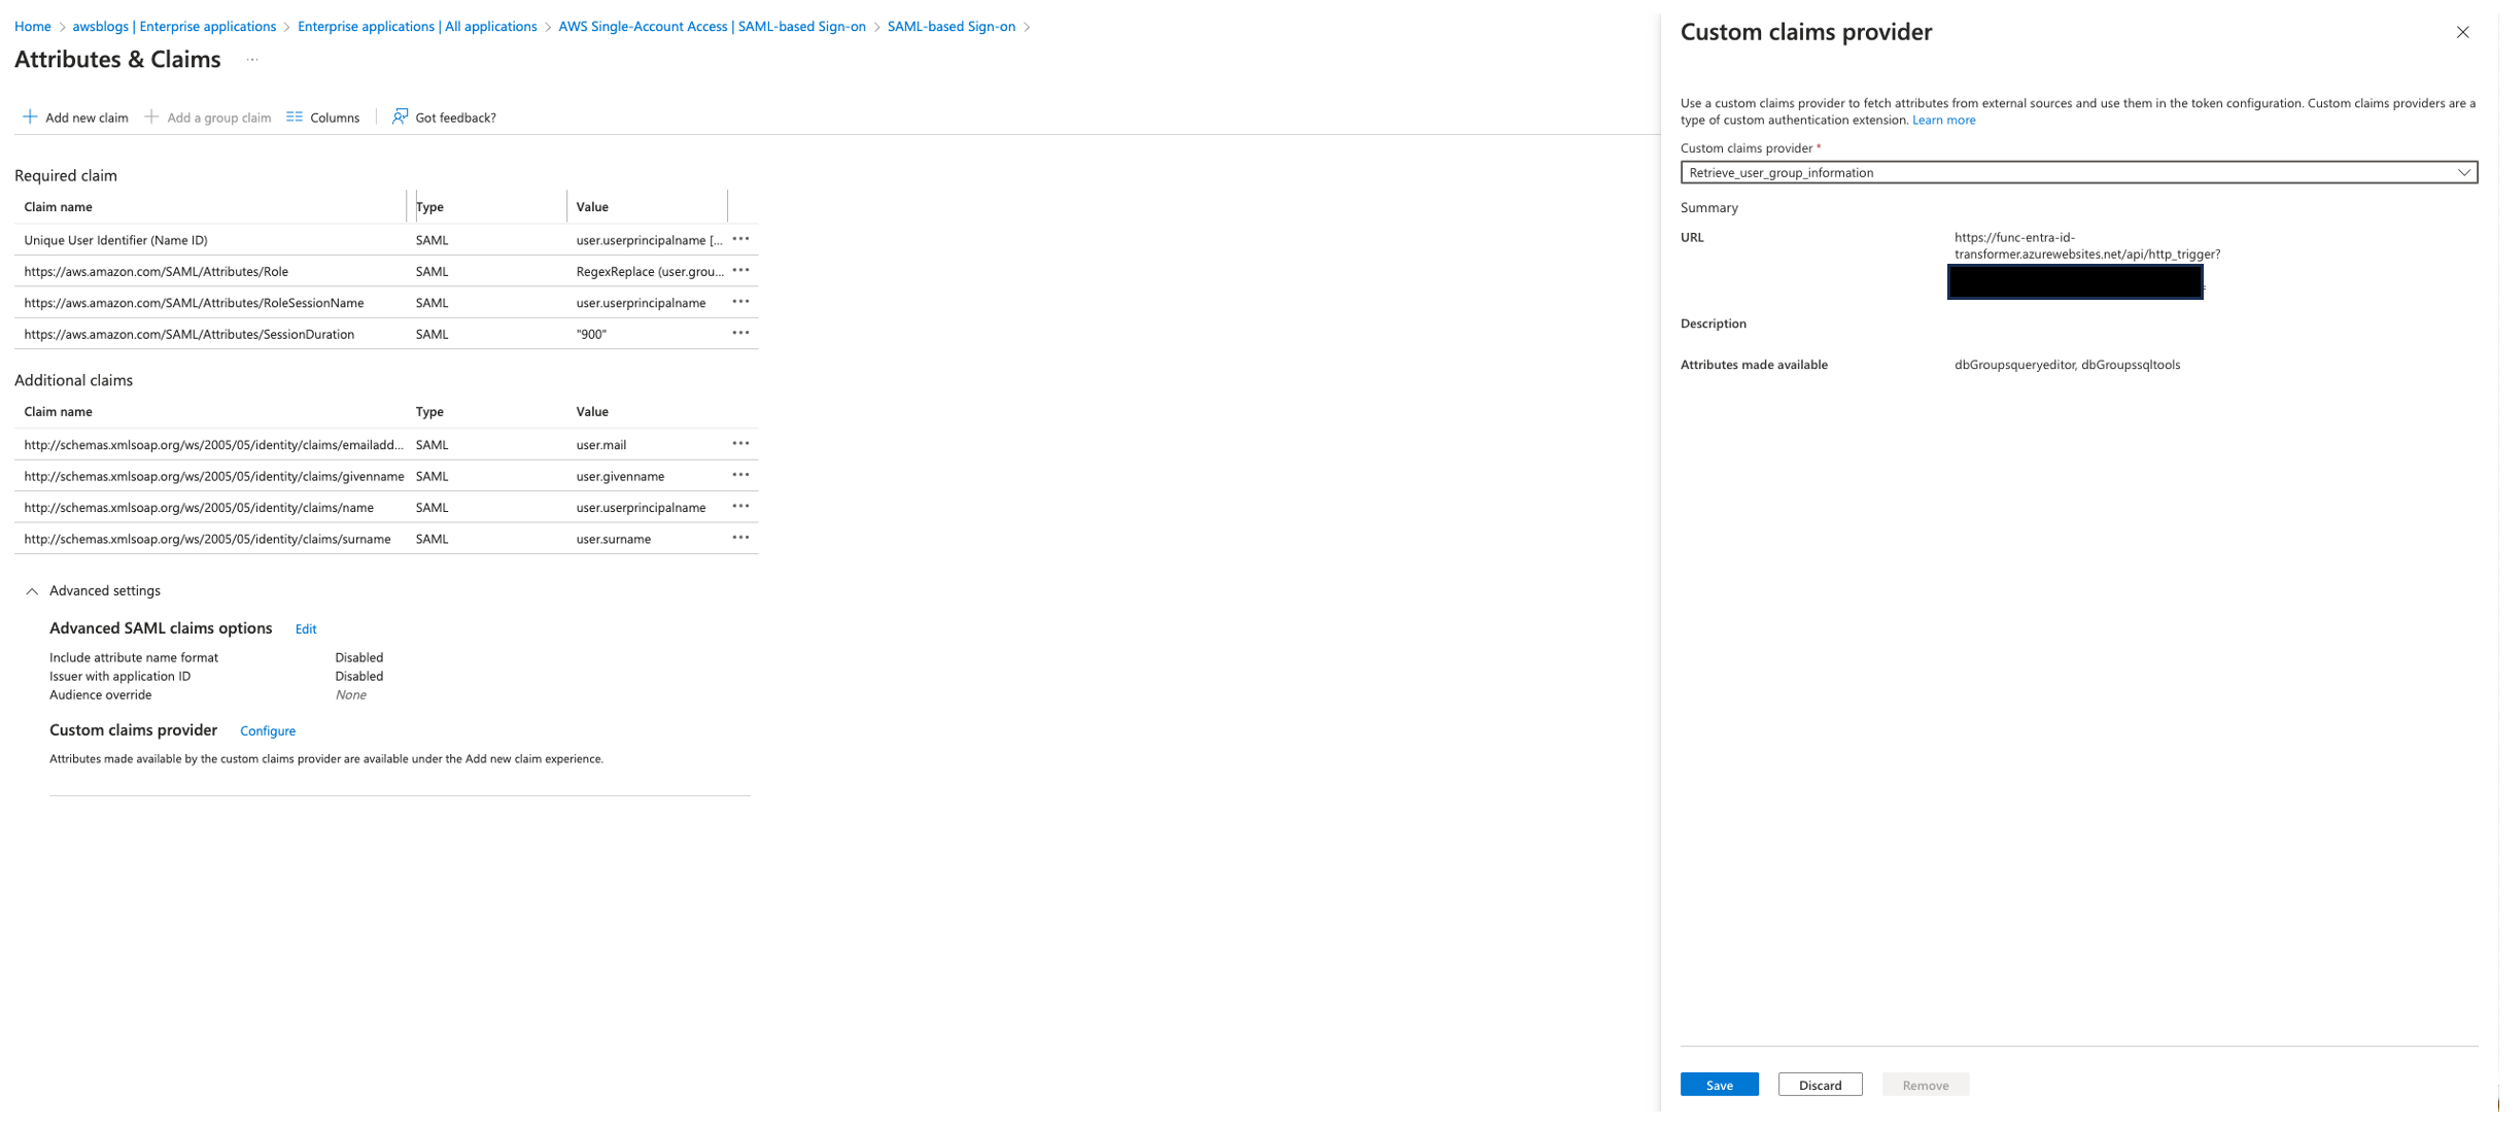
Configure a group claim
We use the group claim to transform the Azure AD group assignments into corresponding IAM roles. By applying a regular expression pattern, the group names are mapped to appropriate Amazon Resource Names (ARNs) for IAM roles and SAML providers. Complete the following steps to configure the group claim:
- On the Attributes & Claims page, delete claim name
https://aws.amazon.com/SAML/Attributes/Role. - Choose Add a group claim.

- Select Groups assigned to the application for the associated groups.
- For Source attribute, choose Cloud-only group display names.
- Under Advanced options, select Filter groups and provide the following information:
- For Attribute to match, choose Display name.
- For Match with, choose Prefix.
- For String, enter AWS-.
- Select Customize the name of group claim and provide the following information:
- For Name, choose Role.
- For Namespace, enter
https://aws.amazon.com/SAML/Attributes. - Select Apply regex replace to groups claim content.
- For Regex pattern, enter
AWS-(?'accountid'[\d]{12})_(?'env'[a-z]+)-(?'app'[a-z]+)-(?'role'[a-z]+). - For Regex replacement pattern, enter
arn:aws:iam::{accountid}:saml-provider/AzureADDemo,arn:aws:iam::{accountid}:role/{env}-{app}-{role}
- Choose Save.
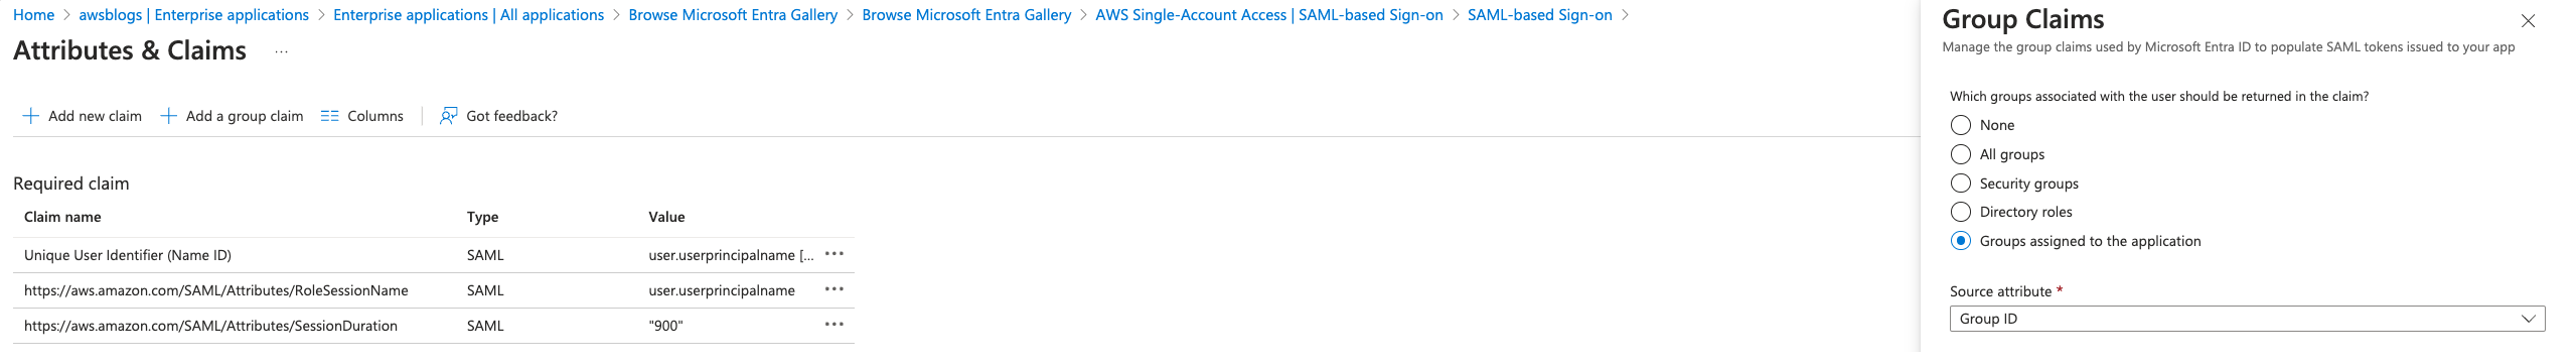

Add new claims
Complete the following steps to add new claims:
- On the Attributes & Claims page, choose Add new claim.

- Add claims with the following values:
- Choose Add a new claim, name the new claim
https://aws.amazon.com/SAML/Attributes/PrincipalTag:RedshiftDbRoles, select Attribute for Source, entercustomclaimsprovider.dbGroupsqueryeditorfor Source attribute, and choose Save.

- Choose Add a new claim, name the new claim
https://aws.amazon.com/SAML/Attributes/PrincipalTag:RedshiftDbUser, select Attribute for Source, enteruser.userprincipalnamefor Source attribute, and choose Save. - Choose Add a new claim, name the new claim
https://redshift.amazon.com/SAML/Attributes/AutoCreate, select Attribute for Source, entertruefor Source attribute, and choose Save.

- Choose Add a new claim, name the new claim
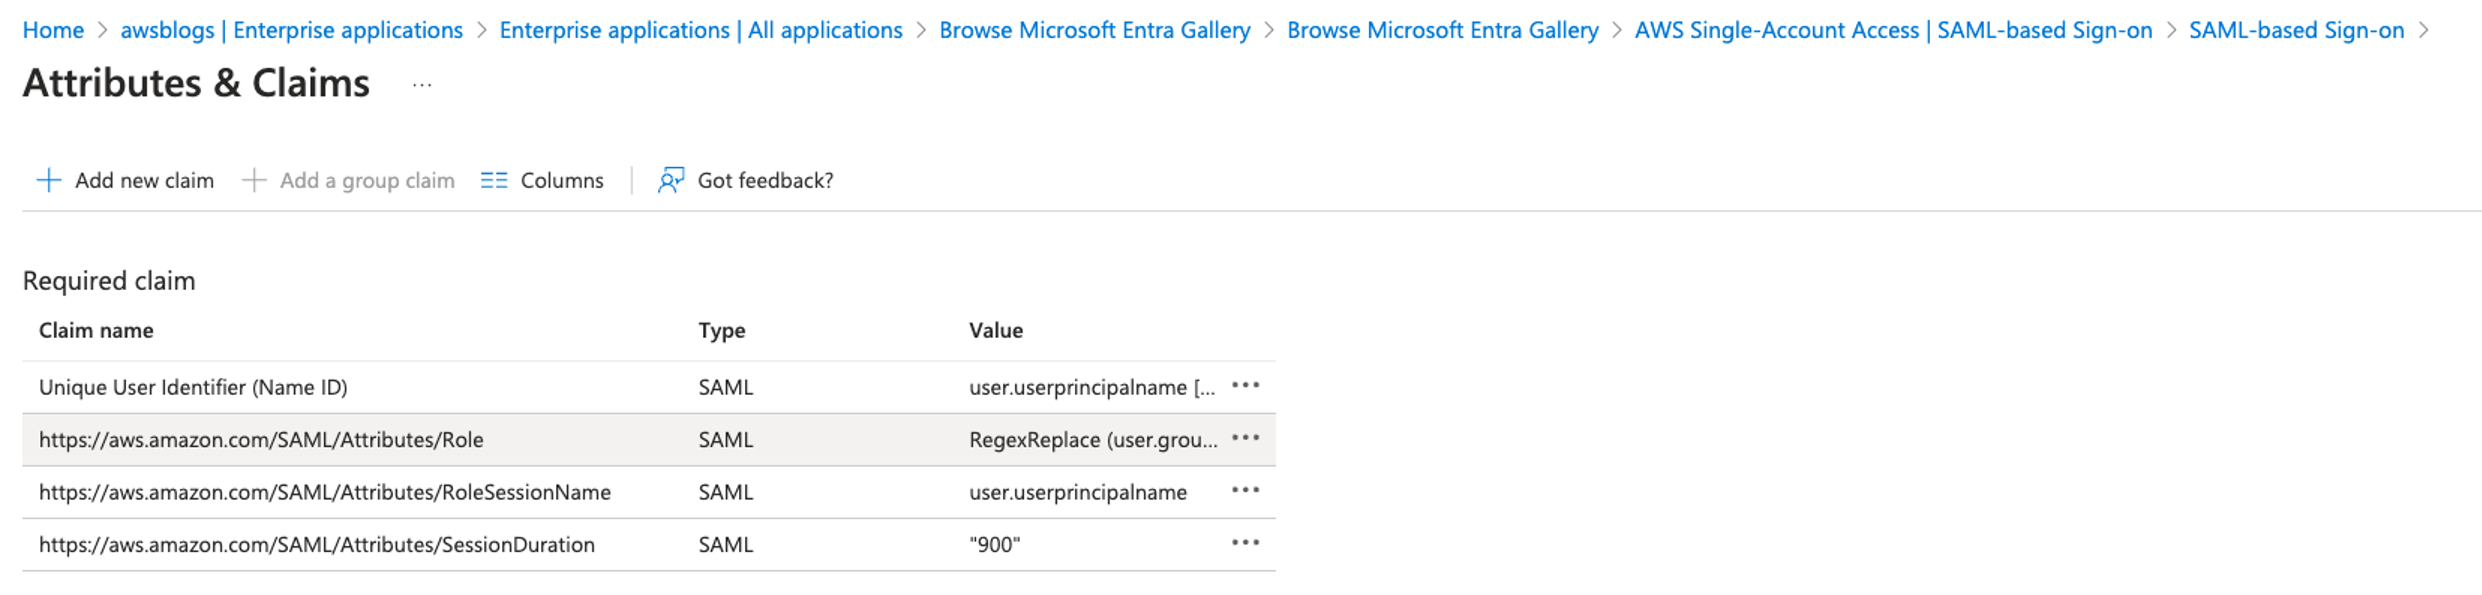
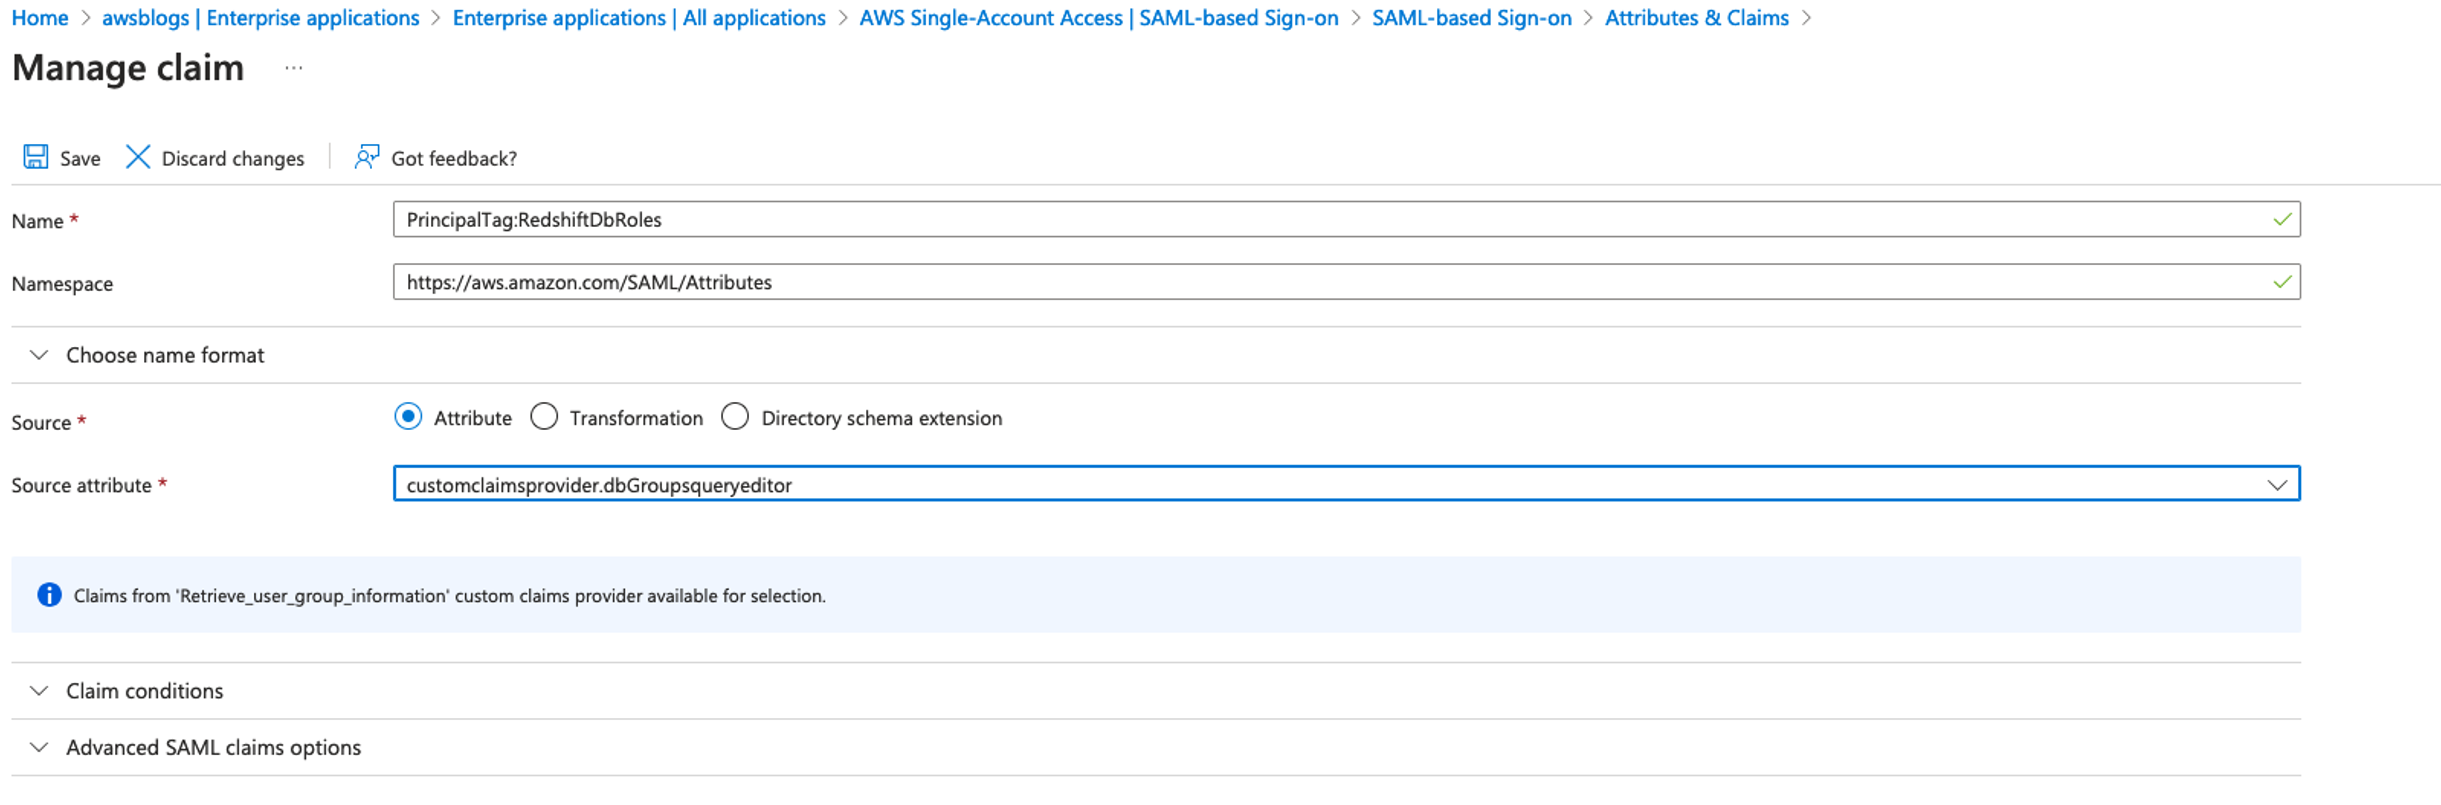
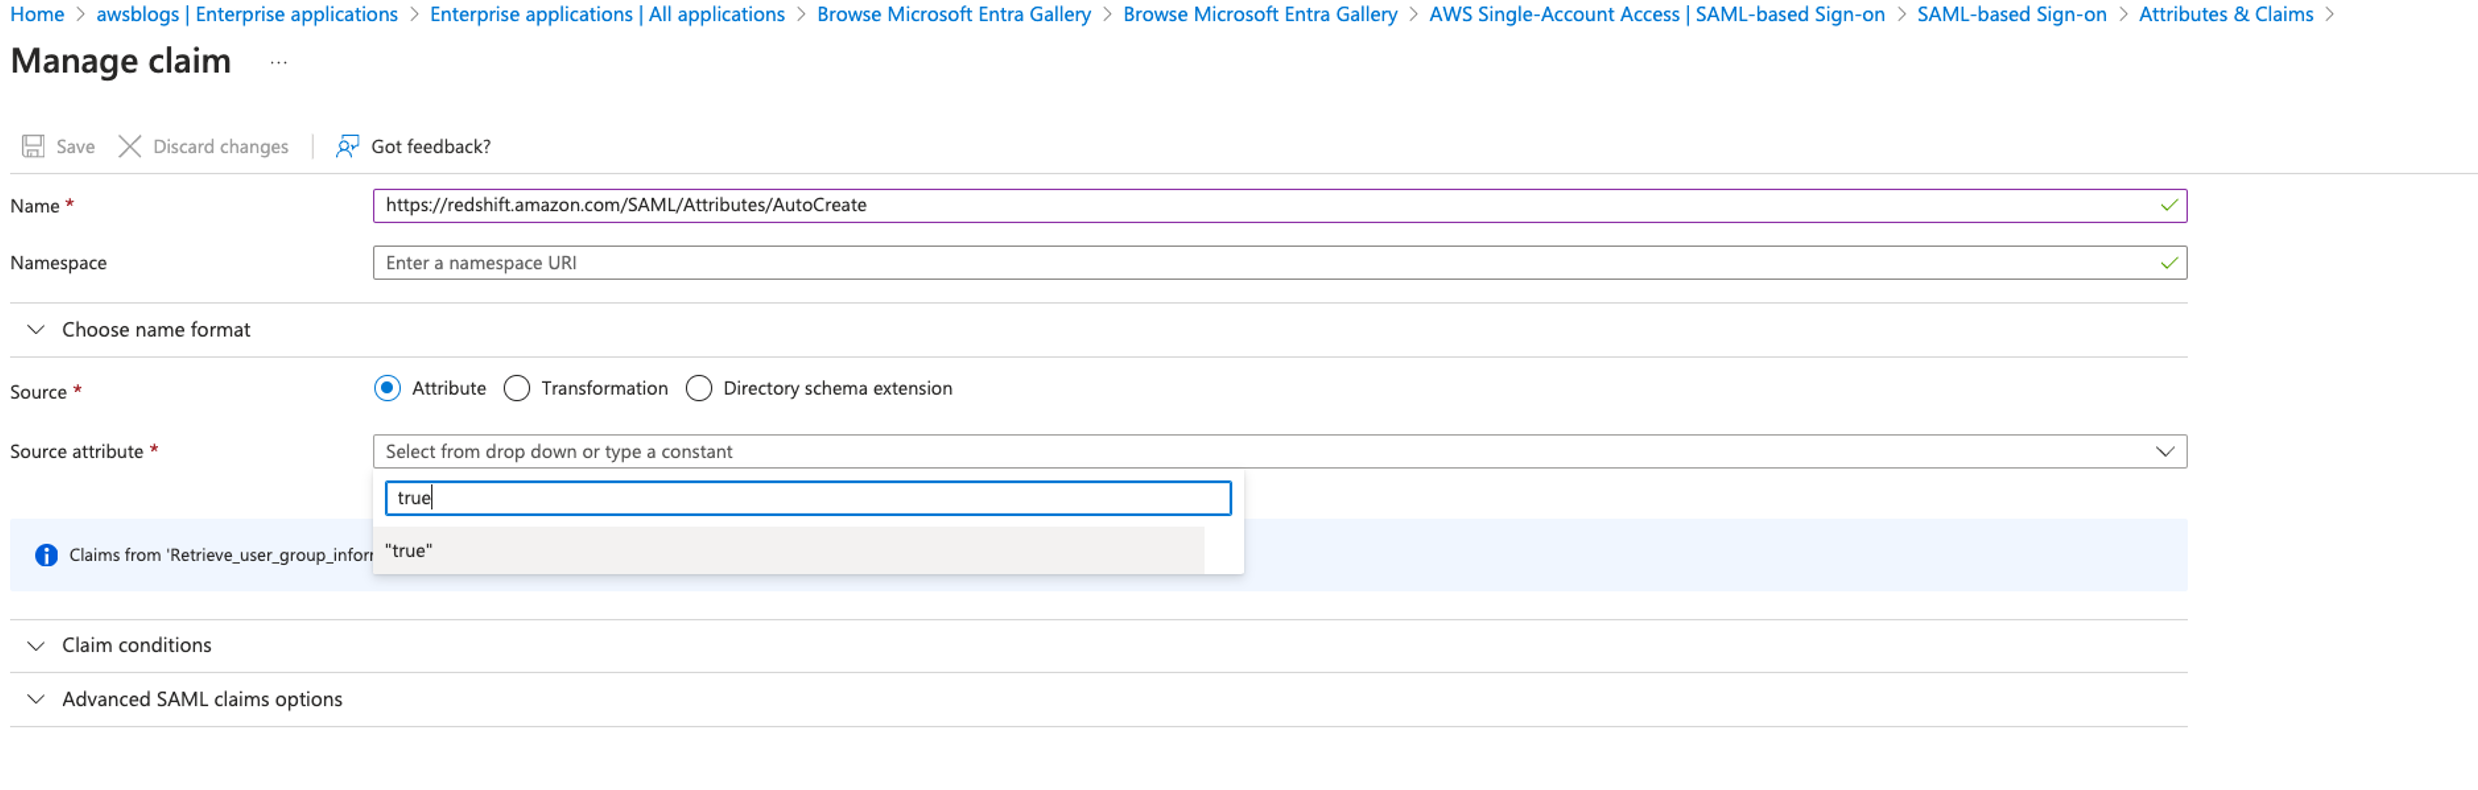
The values of PrincipalTag:RedshiftDbUser and PrincipalTag:RedshiftDbGroups must be lowercase; begin with a letter; contain only alphanumeric characters, underscore (_), plus sign (+), dot (.), at (@), or hyphen (-); and be less than 128 characters.
When you complete adding all the claims, your Attributes & Claims page should look like the following screenshot.
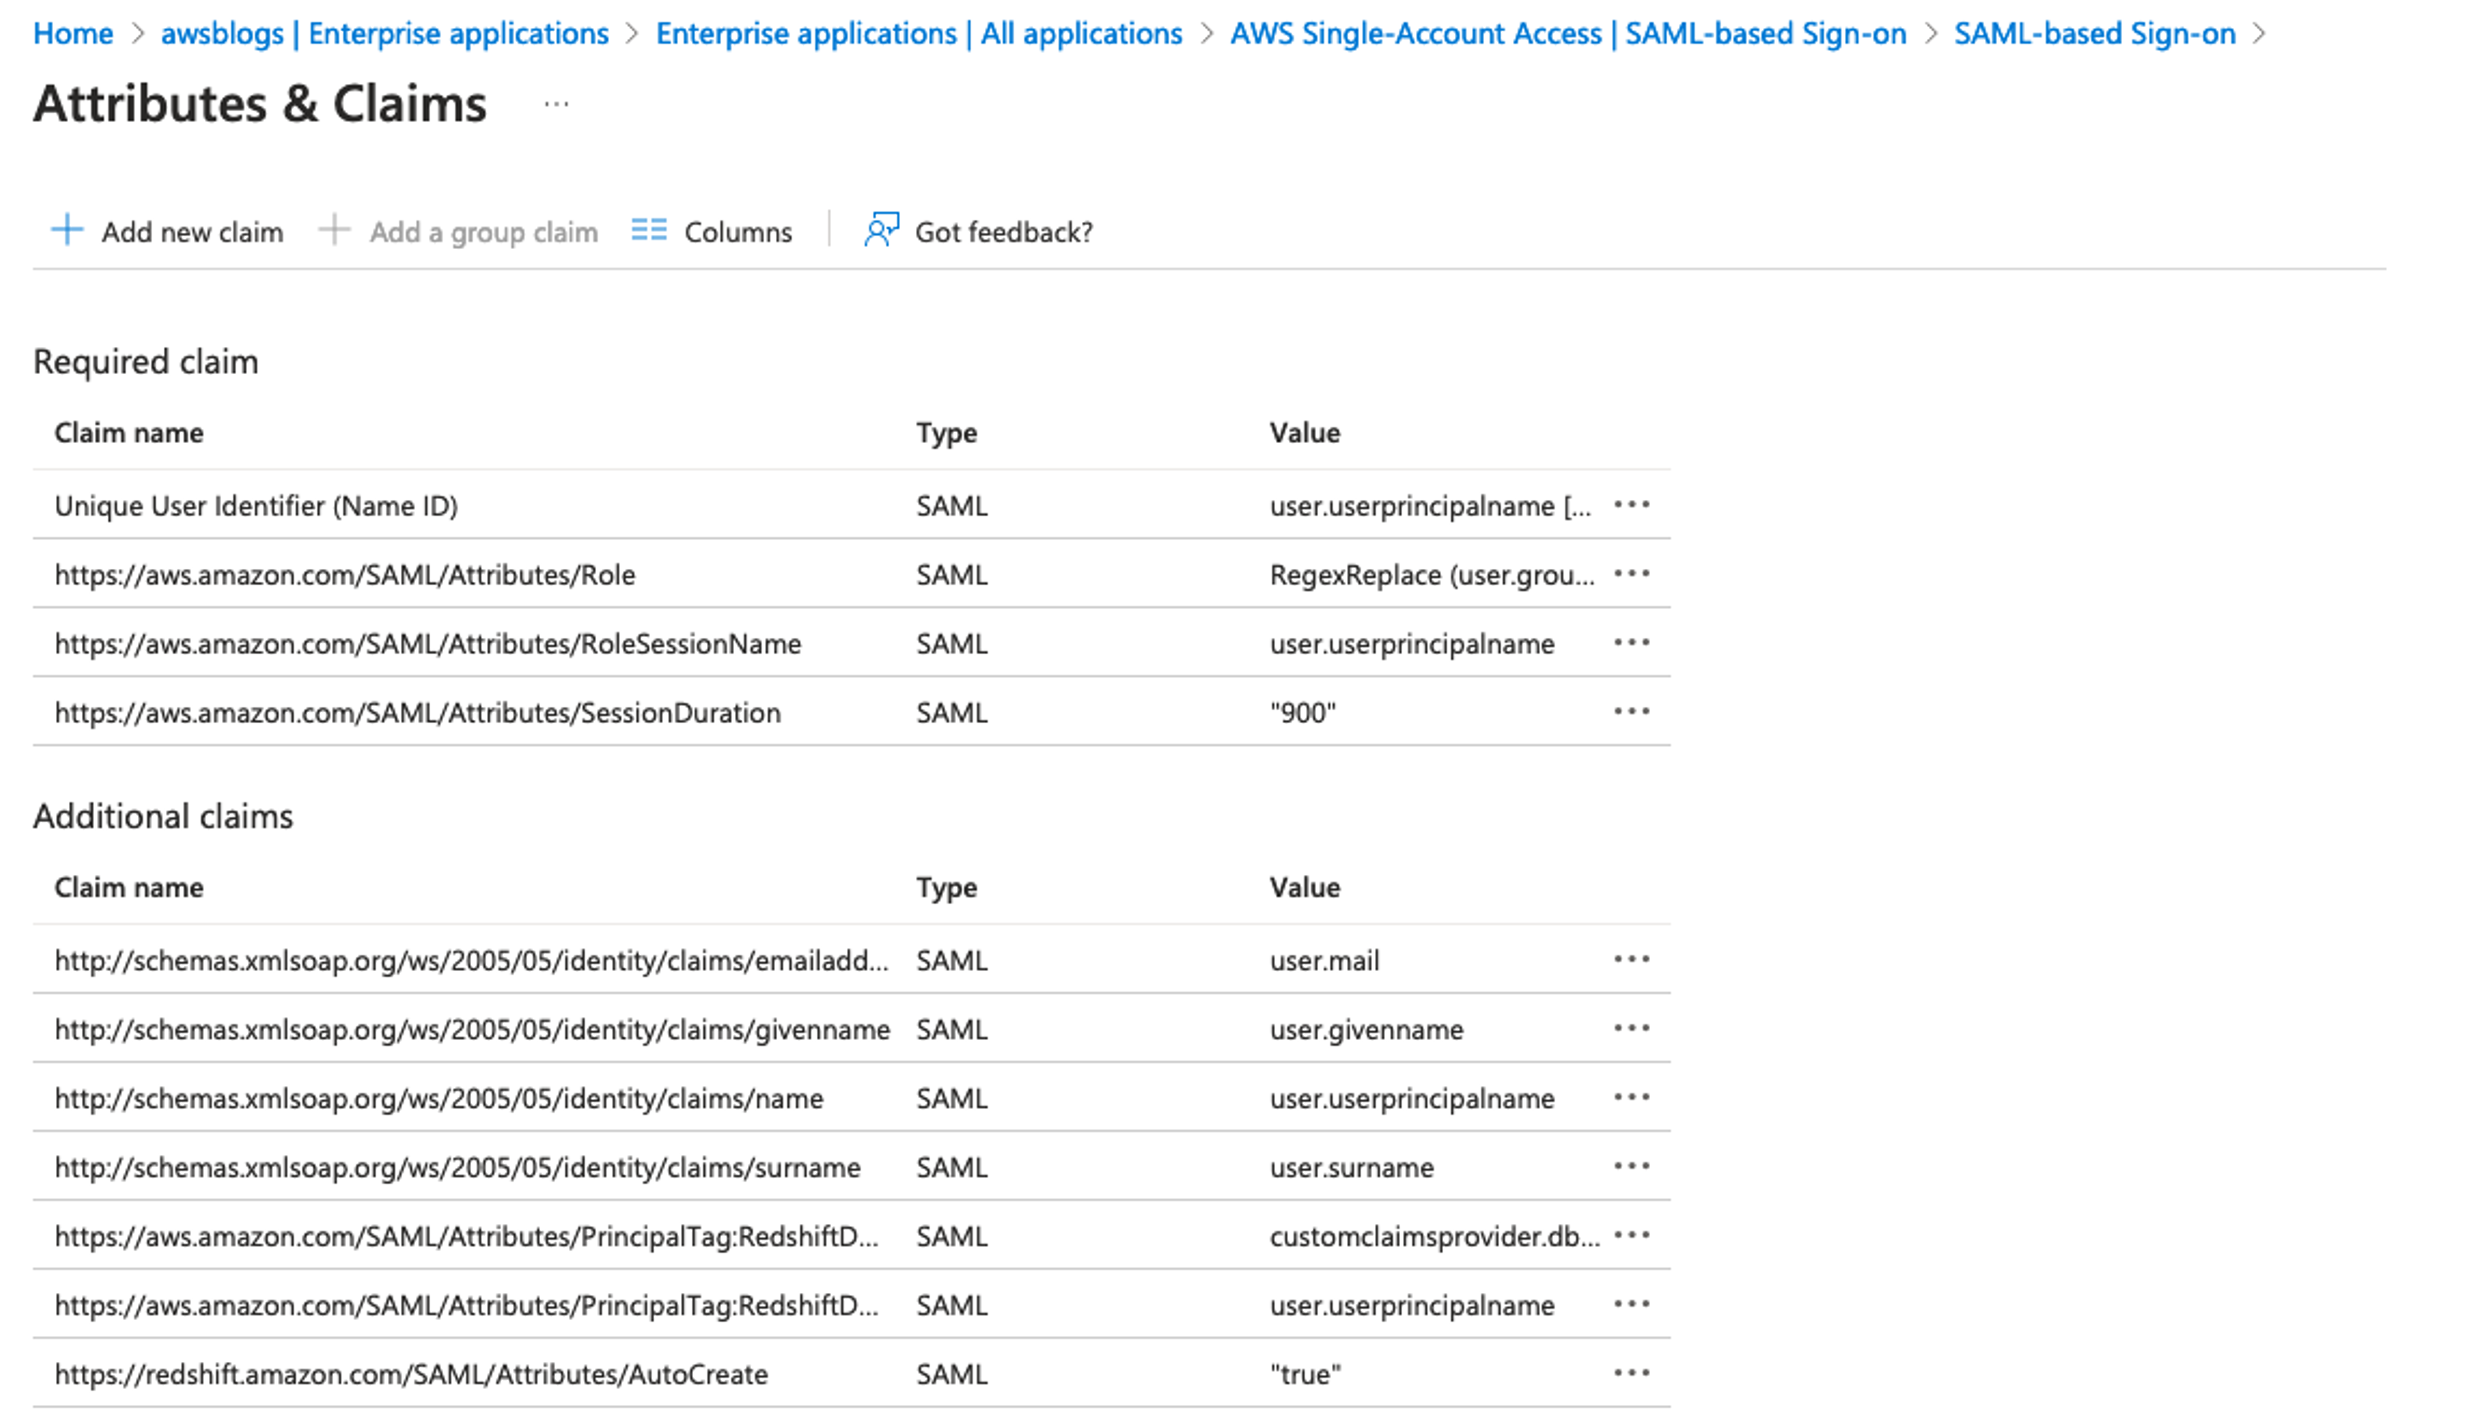
Save the federation metadata XML file
You use the federation metadata file to configure the IAM IdP in a later step. Complete the following steps to download the file:
- Navigate back to your SAML-based sign-in page.
- In the Single sign-on section, under SAML Certificates, choose Download for Federation Metadata XML.

- Save this file locally.
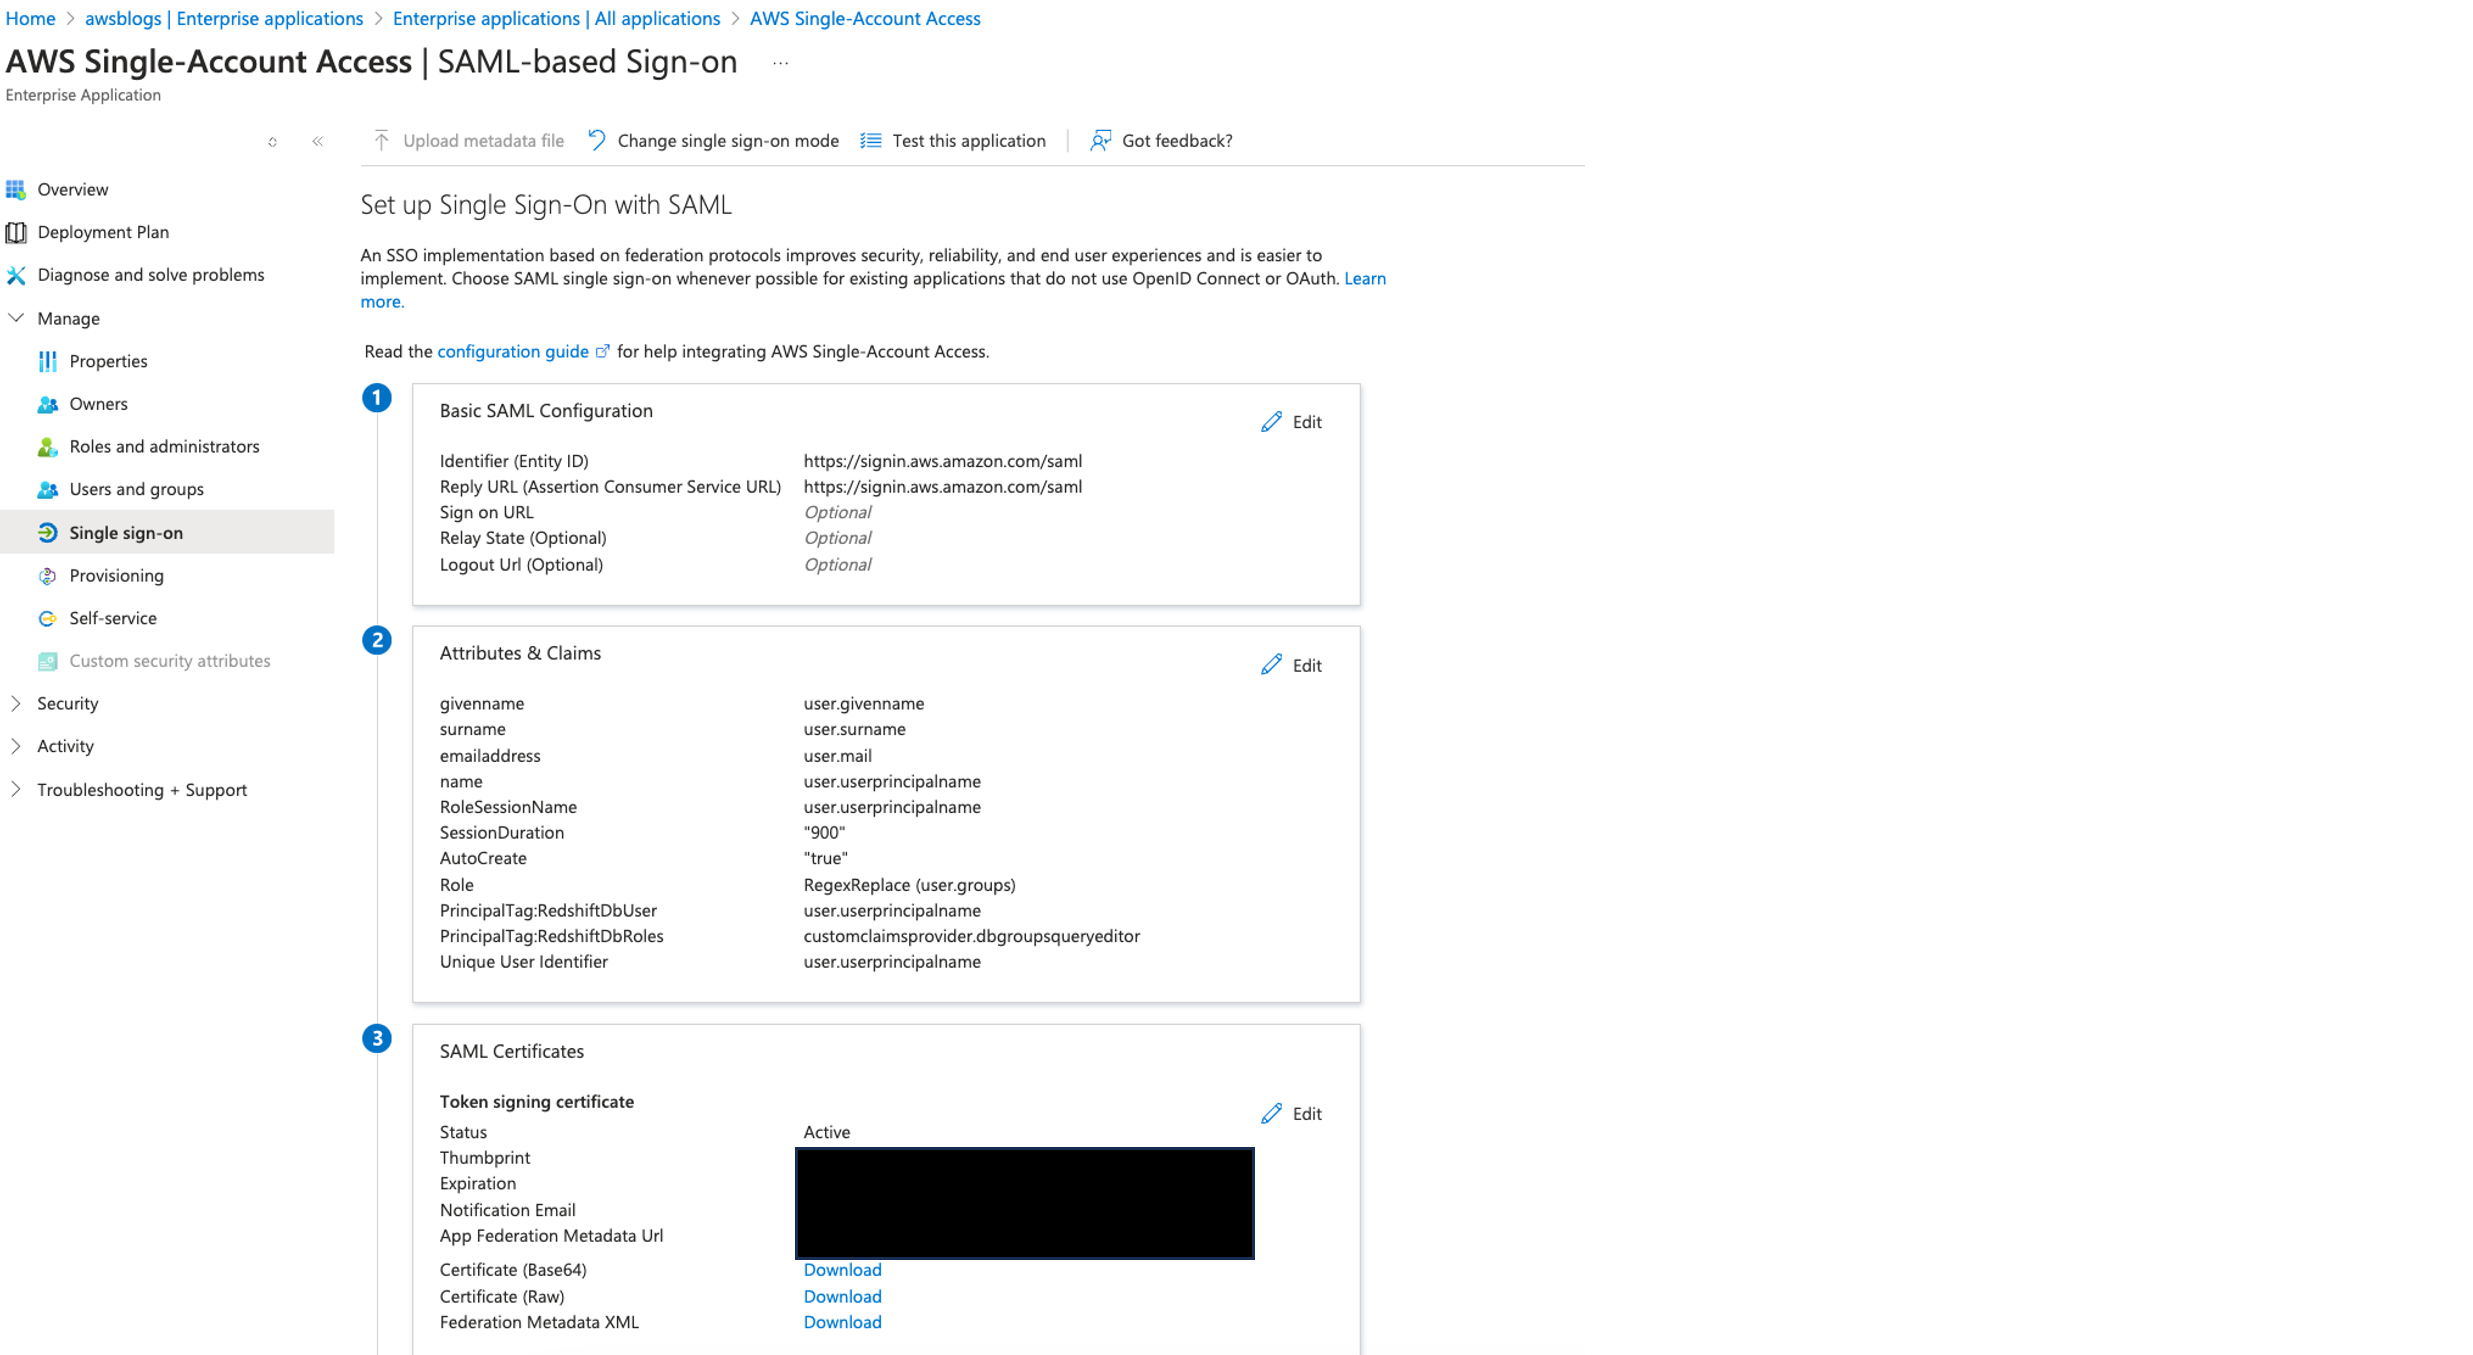
The name of the file is often the same as the application name; for example, AWS Single-Account Access.xml.
Create a new client secret
Complete the following steps to create a new client secret:
- Return to the Azure directory overview and navigate to App registrations.
- Choose the application
AWS Single-Account Access. - If you don’t see your application in the list, choose the All applications tab and register it if it’s not registered.
- Record the values for Application (client) ID and Directory (tenant) ID.
- Under Certificates & secrets, choose New client secret.
- In the Add a client secret pane, provide the following information:
- For Description, enter
AWSRedshiftFederationsecret. - For Expires, choose select the Microsoft’s recommended value of 180 days.
- Choose Add.
- For Description, enter
- Copy the secret value and store it securely.
The secret expires after 180 days. Make sure there is a process in place to update with a new secret before the current secret expires in your environment.
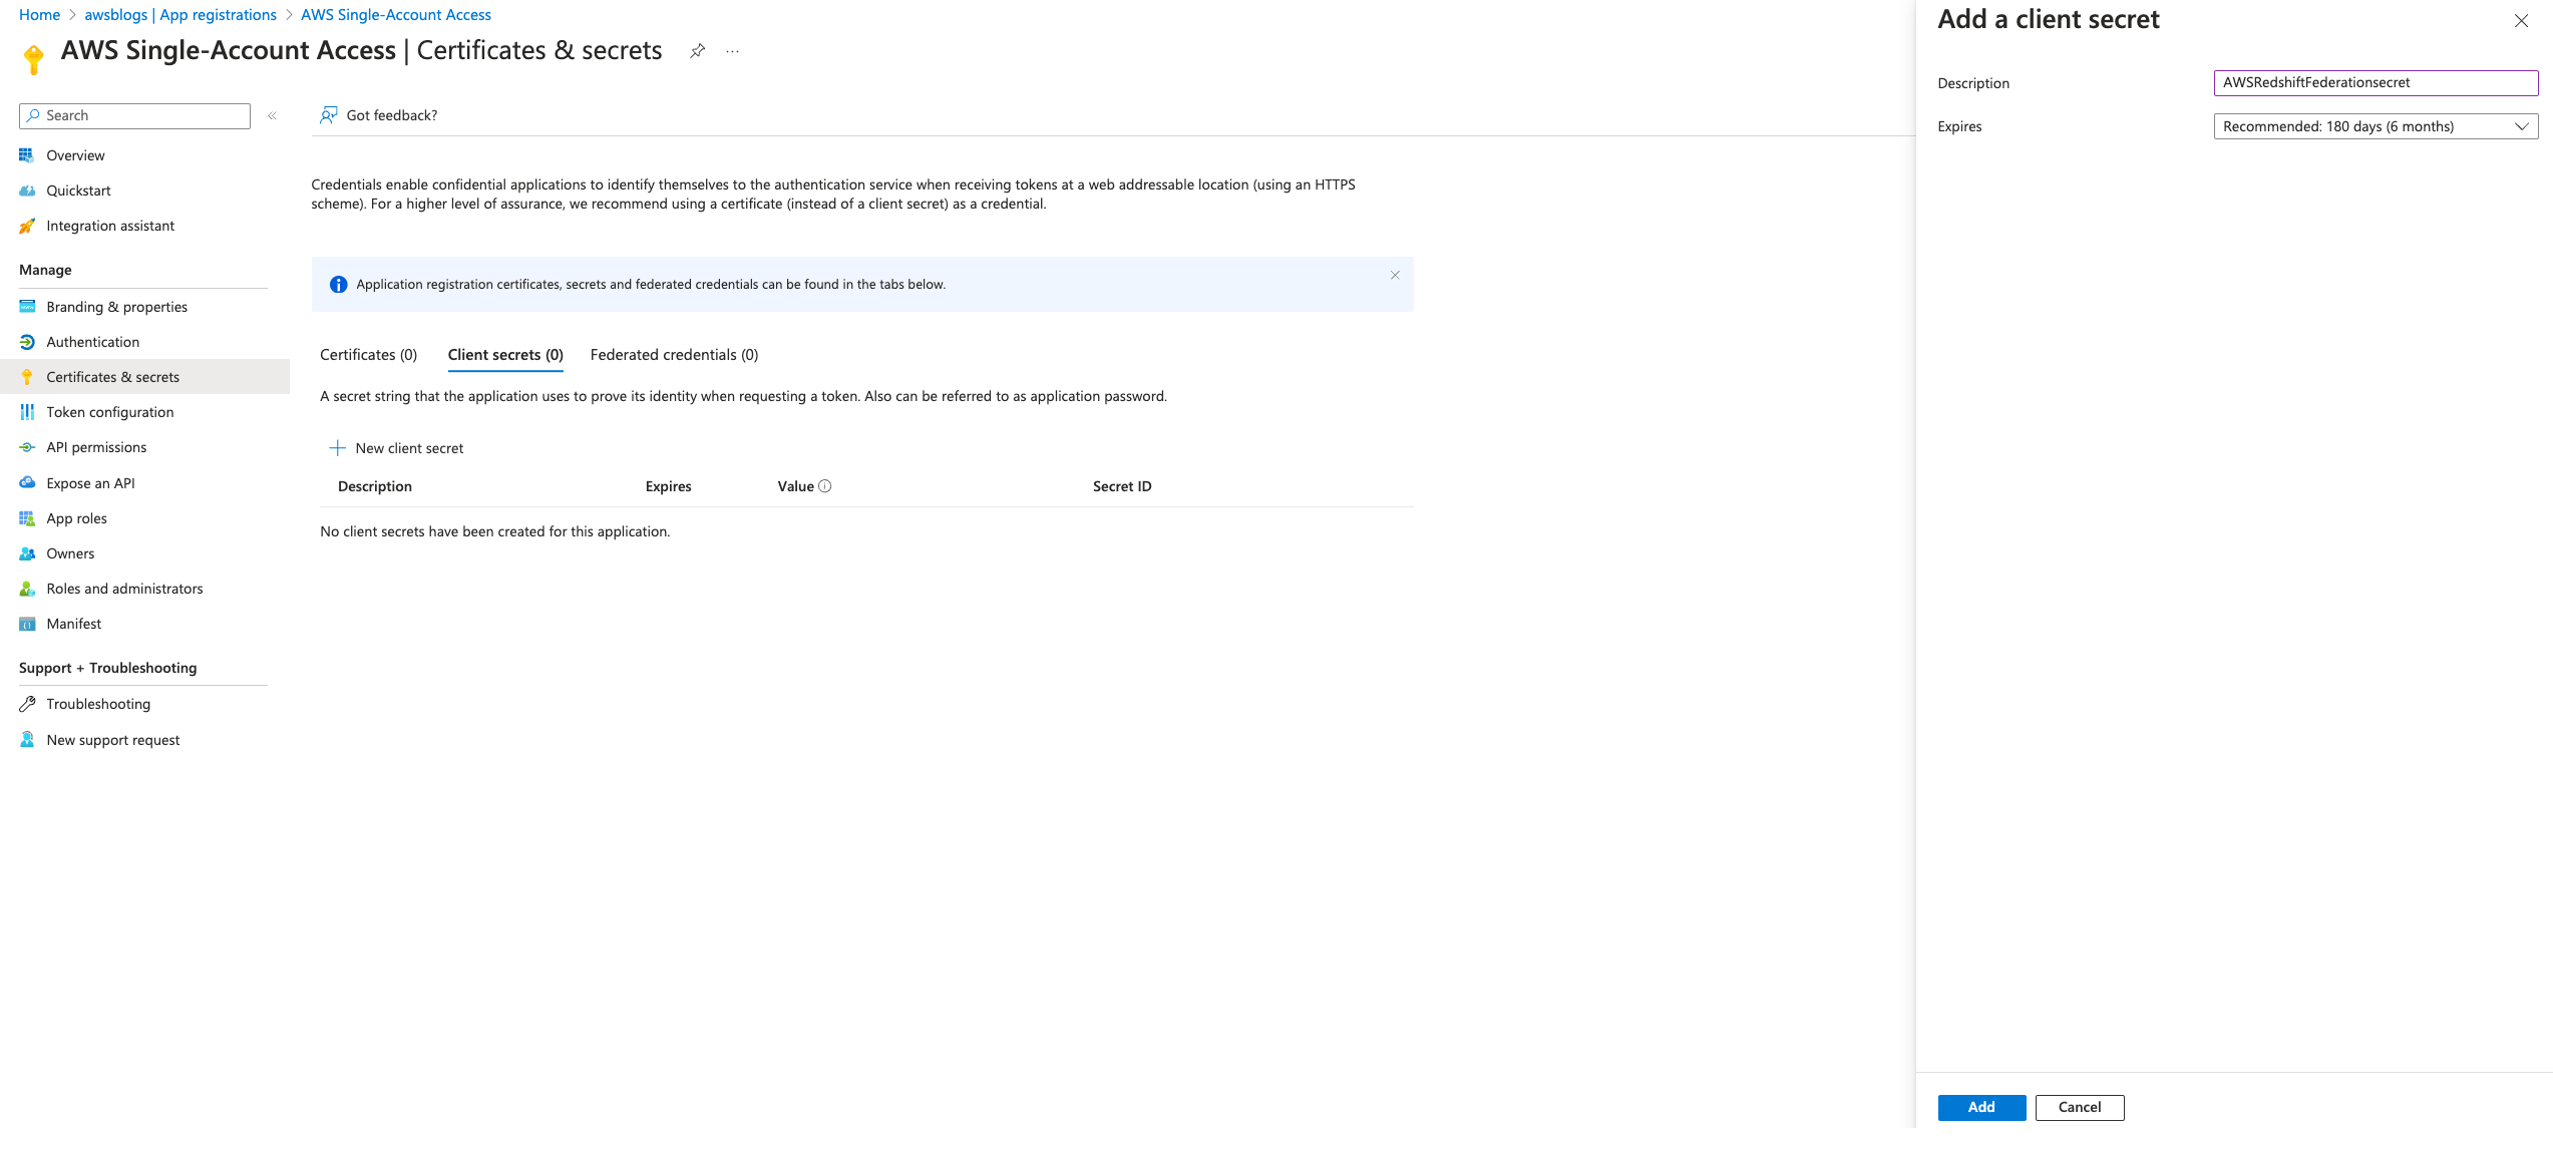
Add permissions
Complete the following steps to add permissions:
- Navigate to API permissions for application AWS Single-Account Access.
- Choose Add a permission and provide the following information:
- For Select an API, choose Microsoft Graph.

- Select Delegated permissions for the type of permission your application requires.
- In Select permissions, choose User and then User.Read.

- Choose Application permissions for the type of permission your application requires.
- In Select permissions, choose Directory and then Directory.Read.All.

- For Select an API, choose Microsoft Graph.
- Choose Add permissions.
This allows the Redshift enterprise application to grant admin consent to read the user profile and group data associated with the user and perform the login using SSO. - Under Configured permissions, choose Grant admin consent for added permissions.
- In the confirmation pane, choose Yes to grant consent for the requested permissions for all accounts to the enterprise application.

- Navigate to your enterprise applications and select
AWS Single-Account Accessand choose Users and groups. - Choose Add user/group.
- Under Users and groups select the groups
redshift_product,redshift_sales, andAWS-<acctno>_dev-bdt-team, which are created as part of the prerequisites, and choose Select.

- On the Add Assignment page, choose Assign.
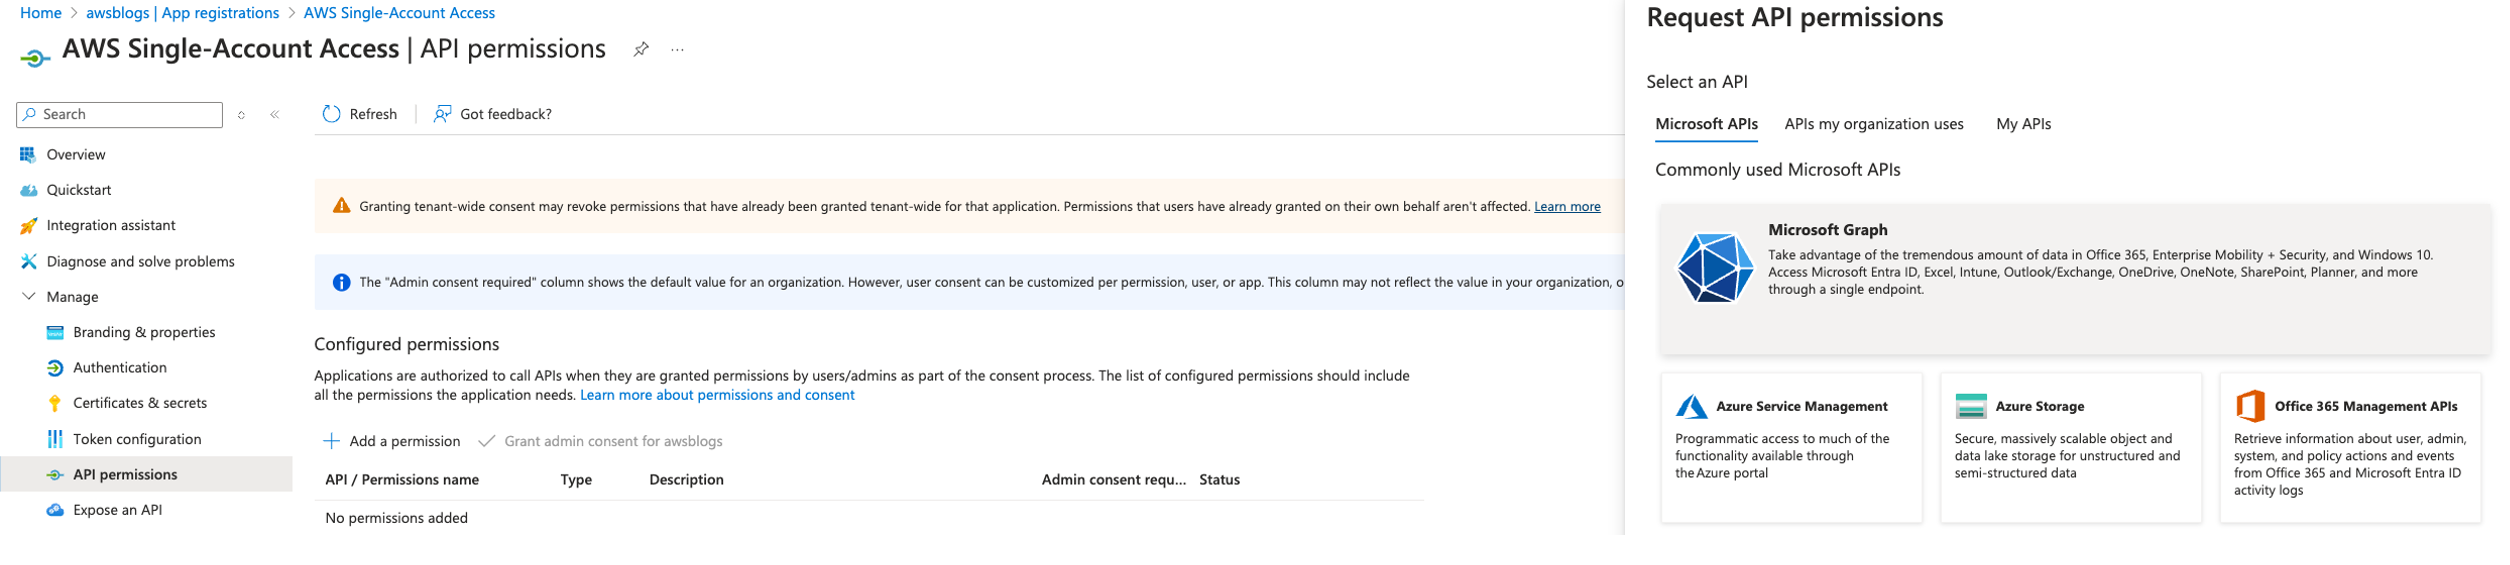
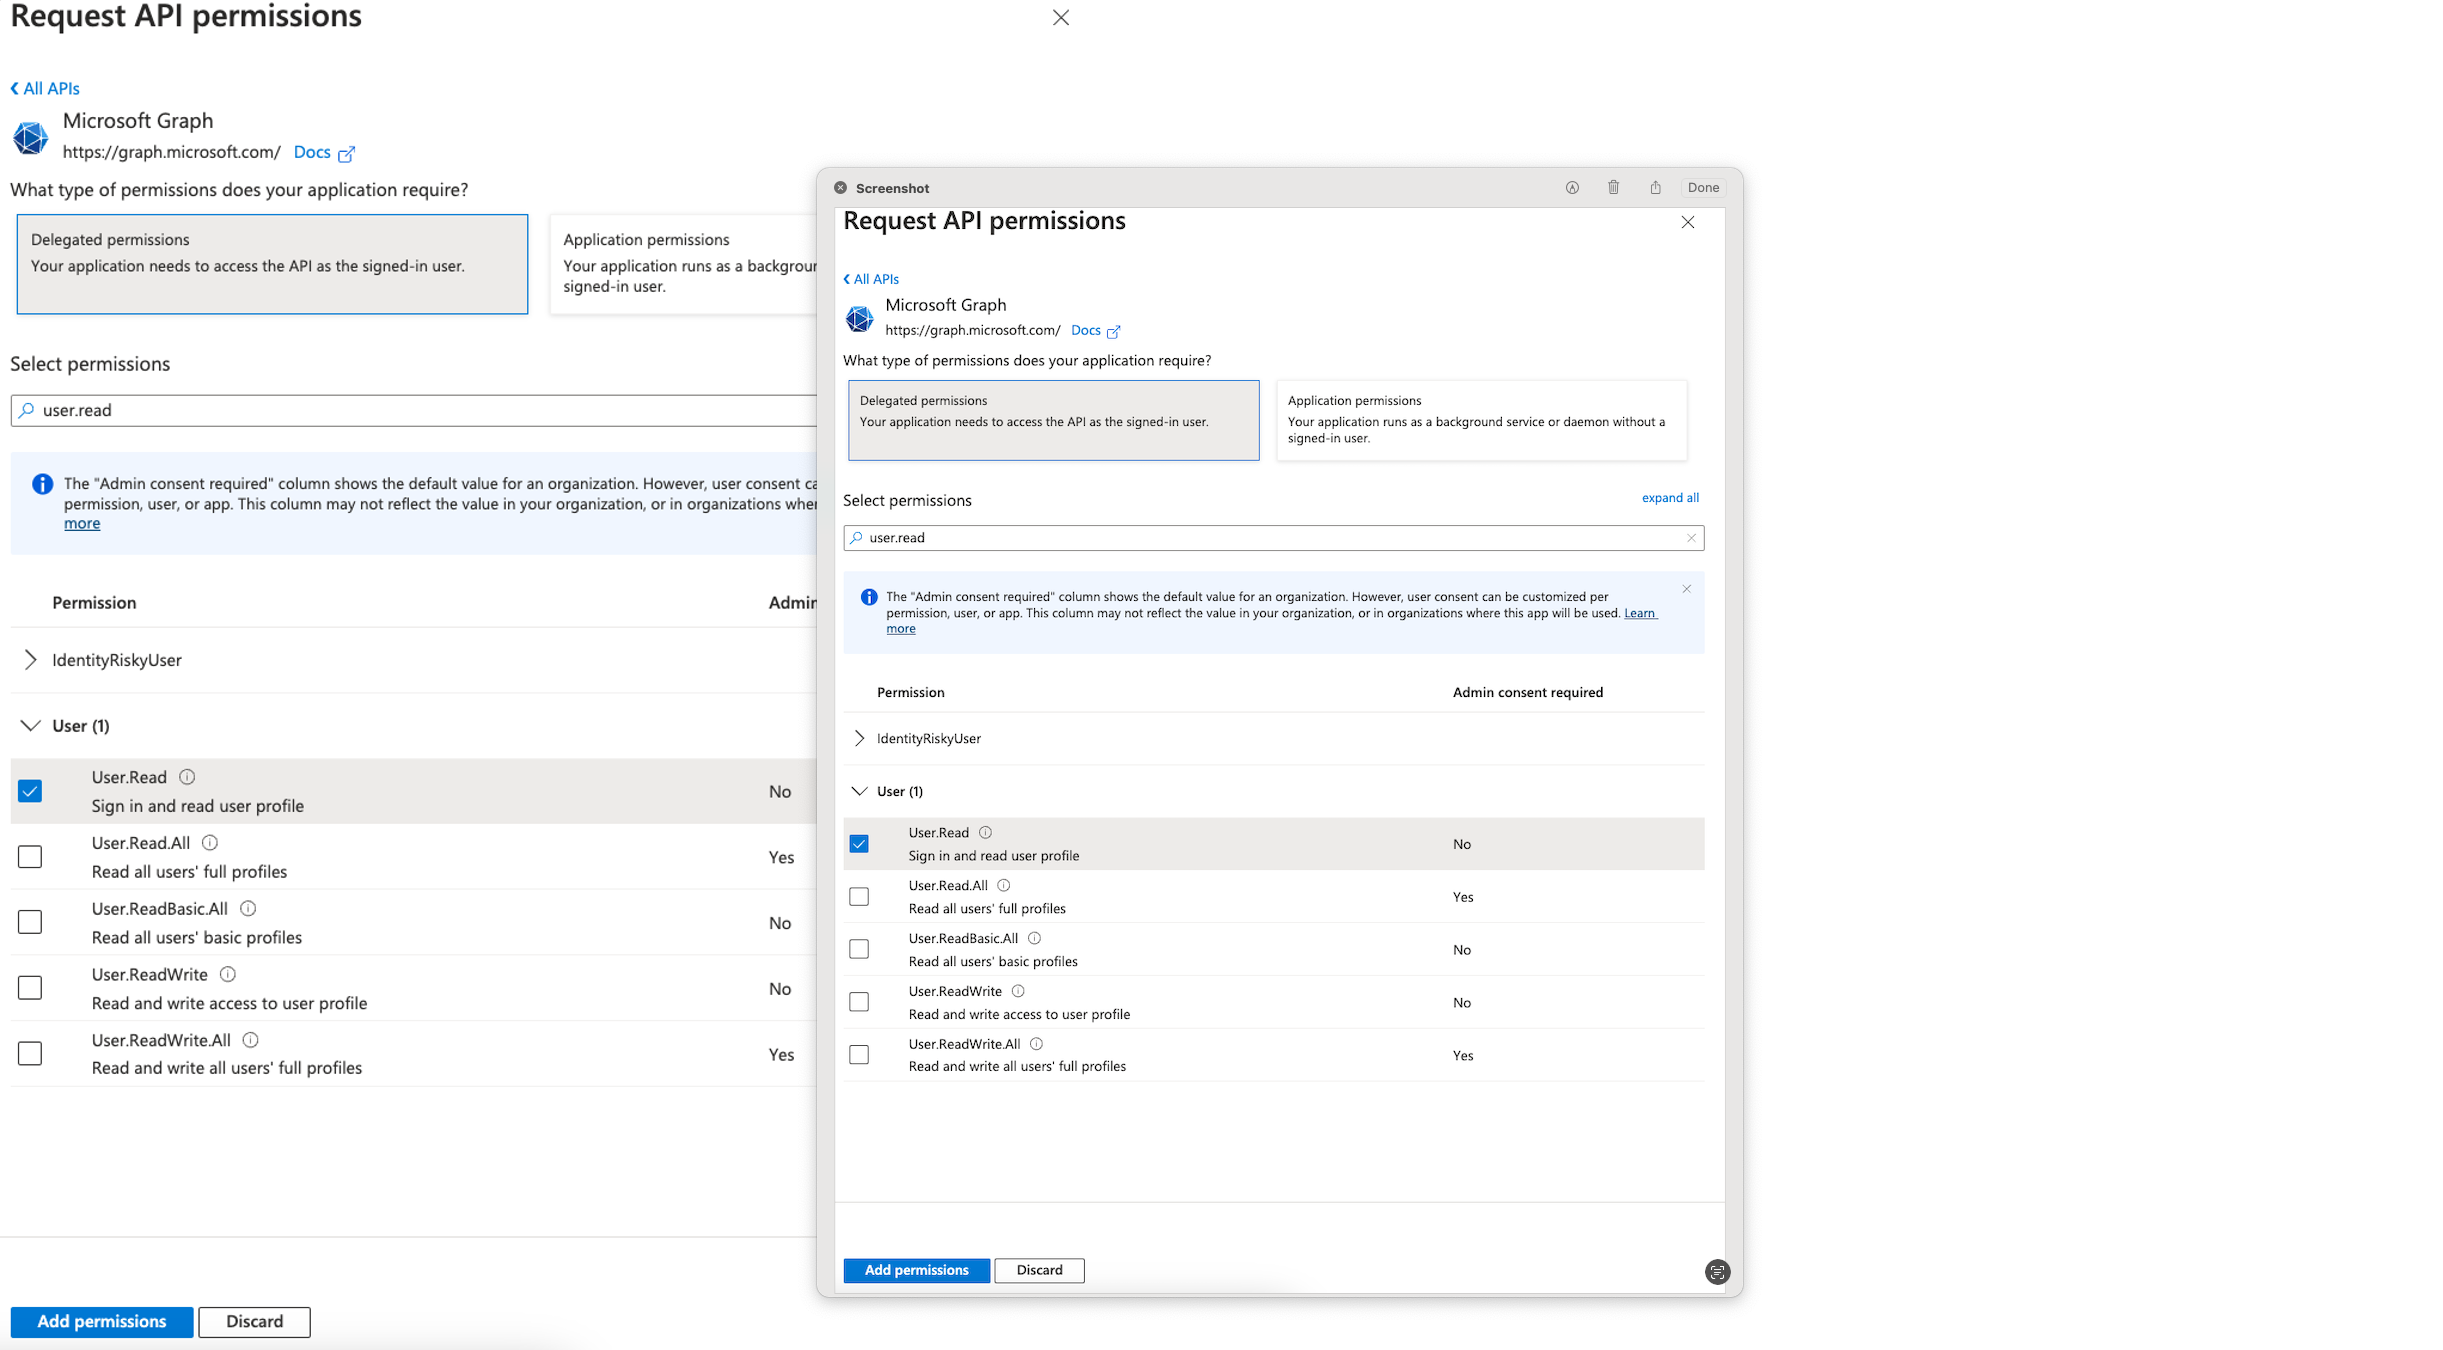
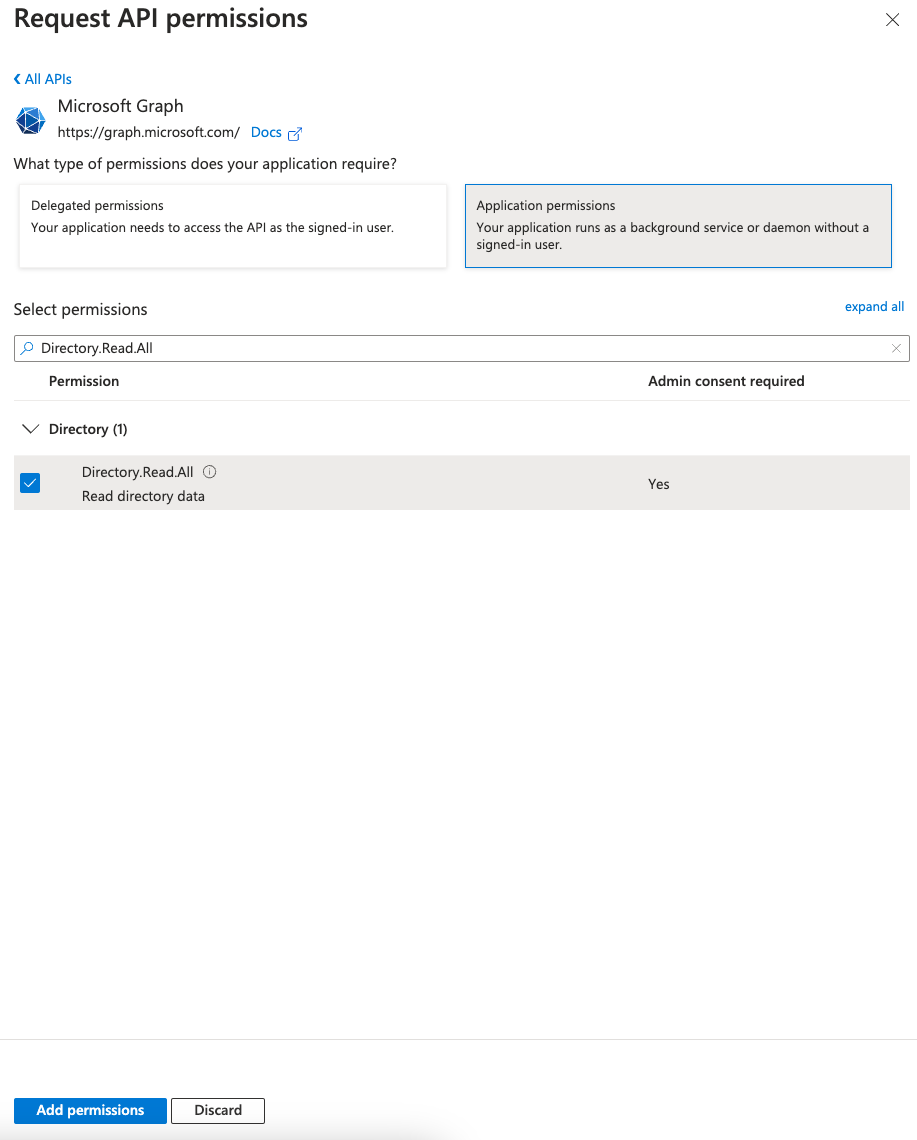
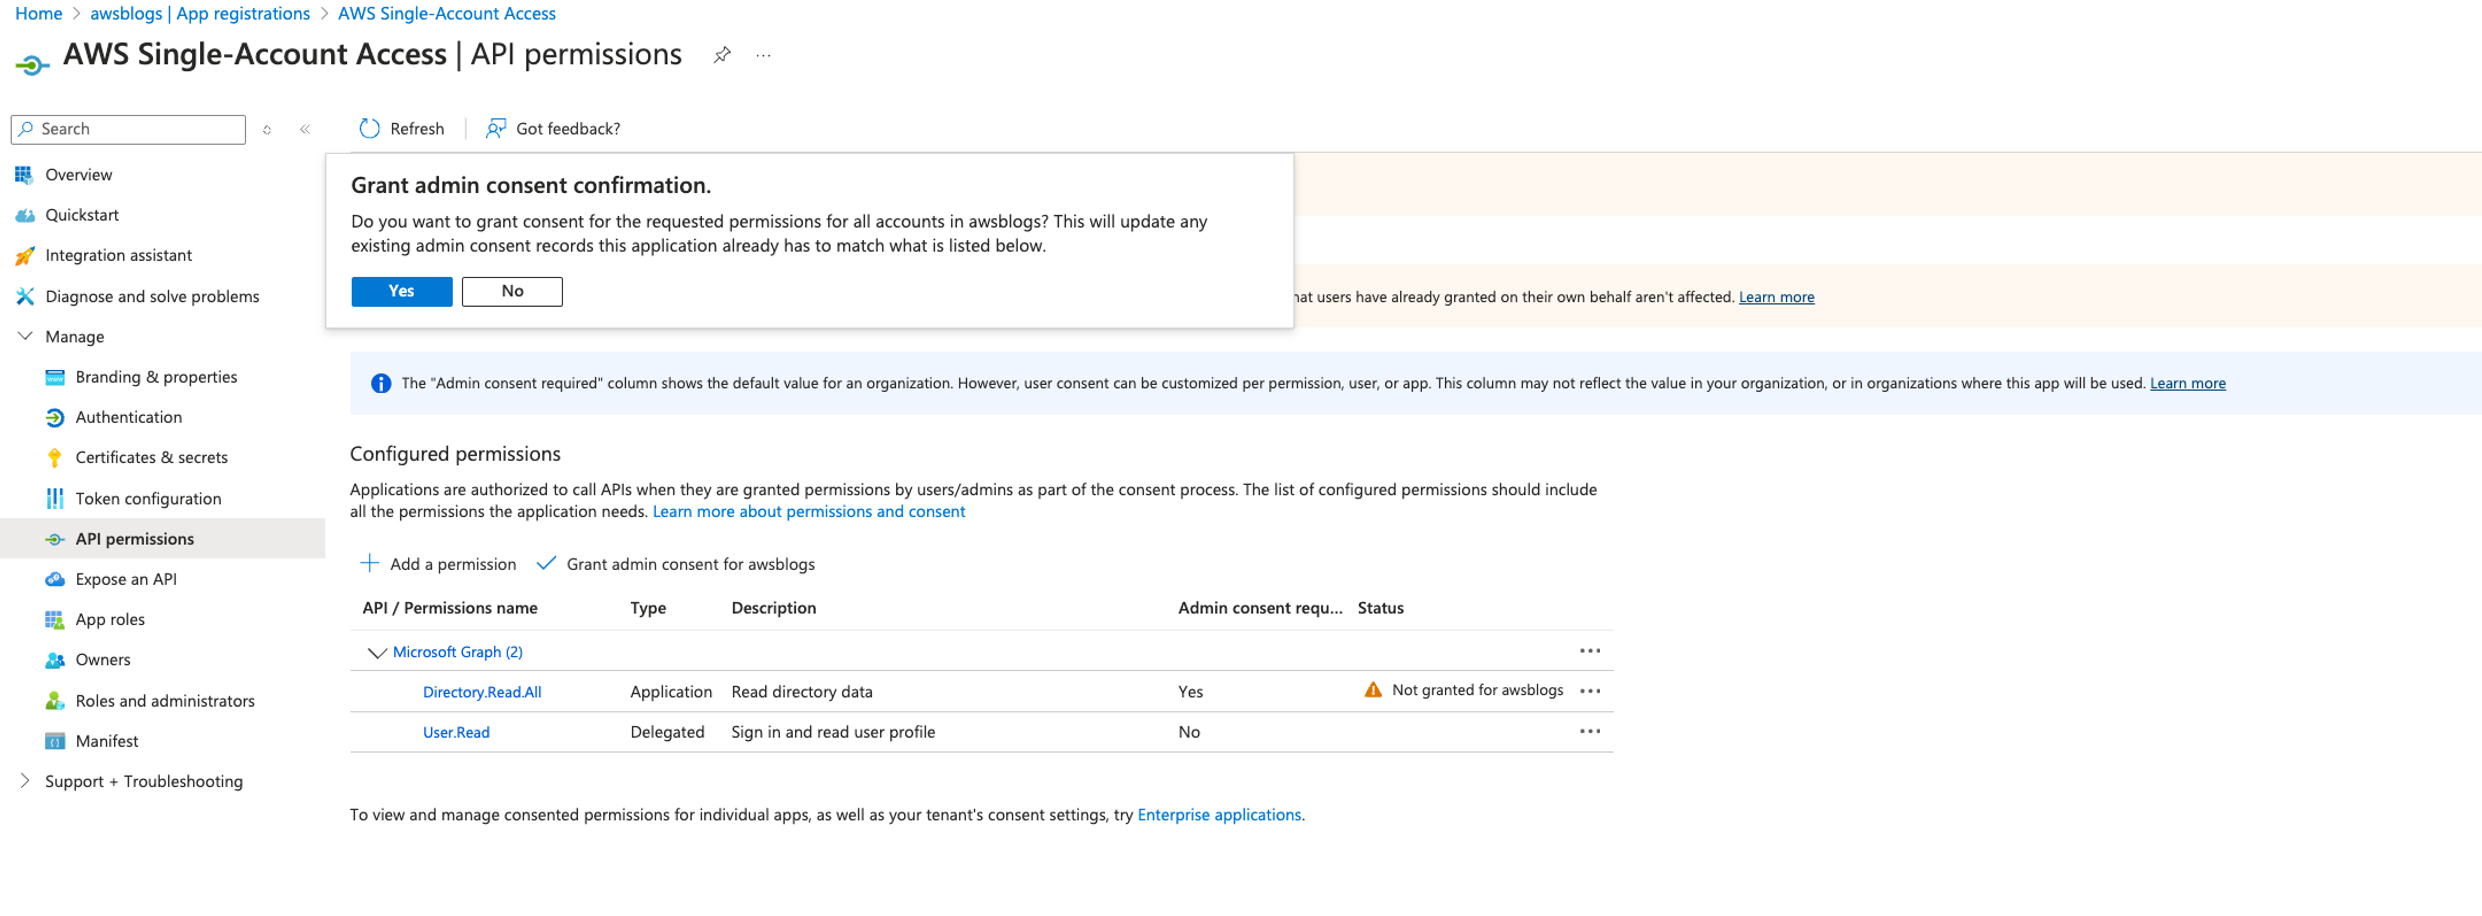
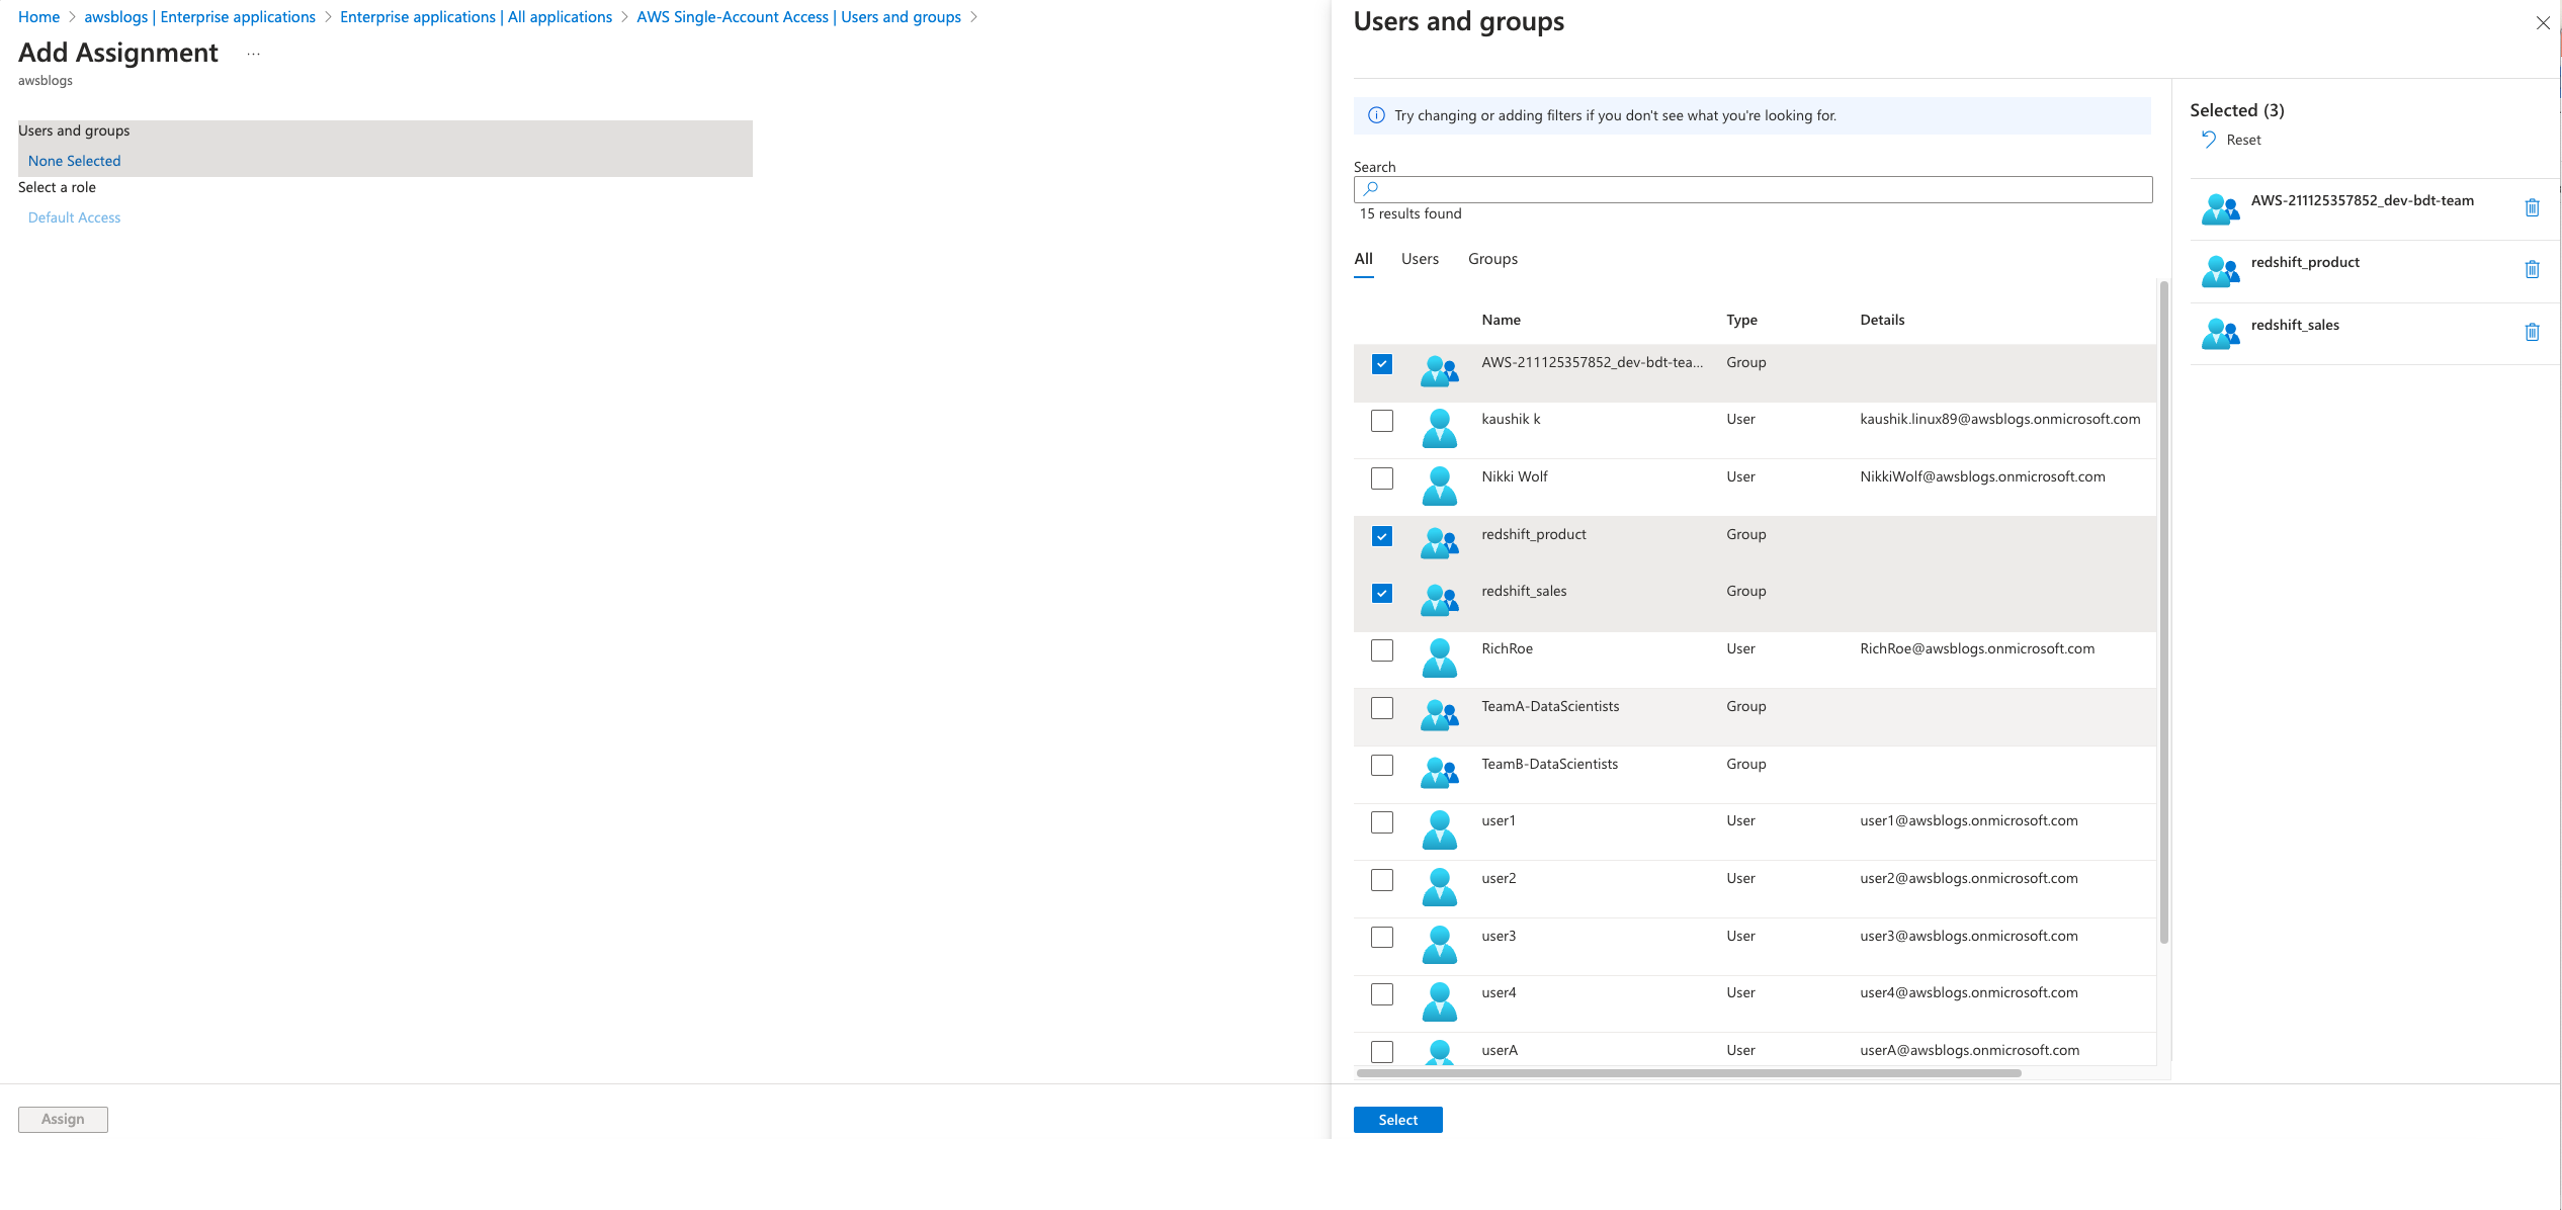
Update Azure Function code
Complete the following steps to update the Azure Function code:
- Return to Home and navigate to
fn-entra-id-transformerunder Function App. - Choose
CustomAuthenticationFunctionunder Functions.

- On the Code + Test page, replace the sample code with the following code, which retrieves the user’s group membership, and choose Save.
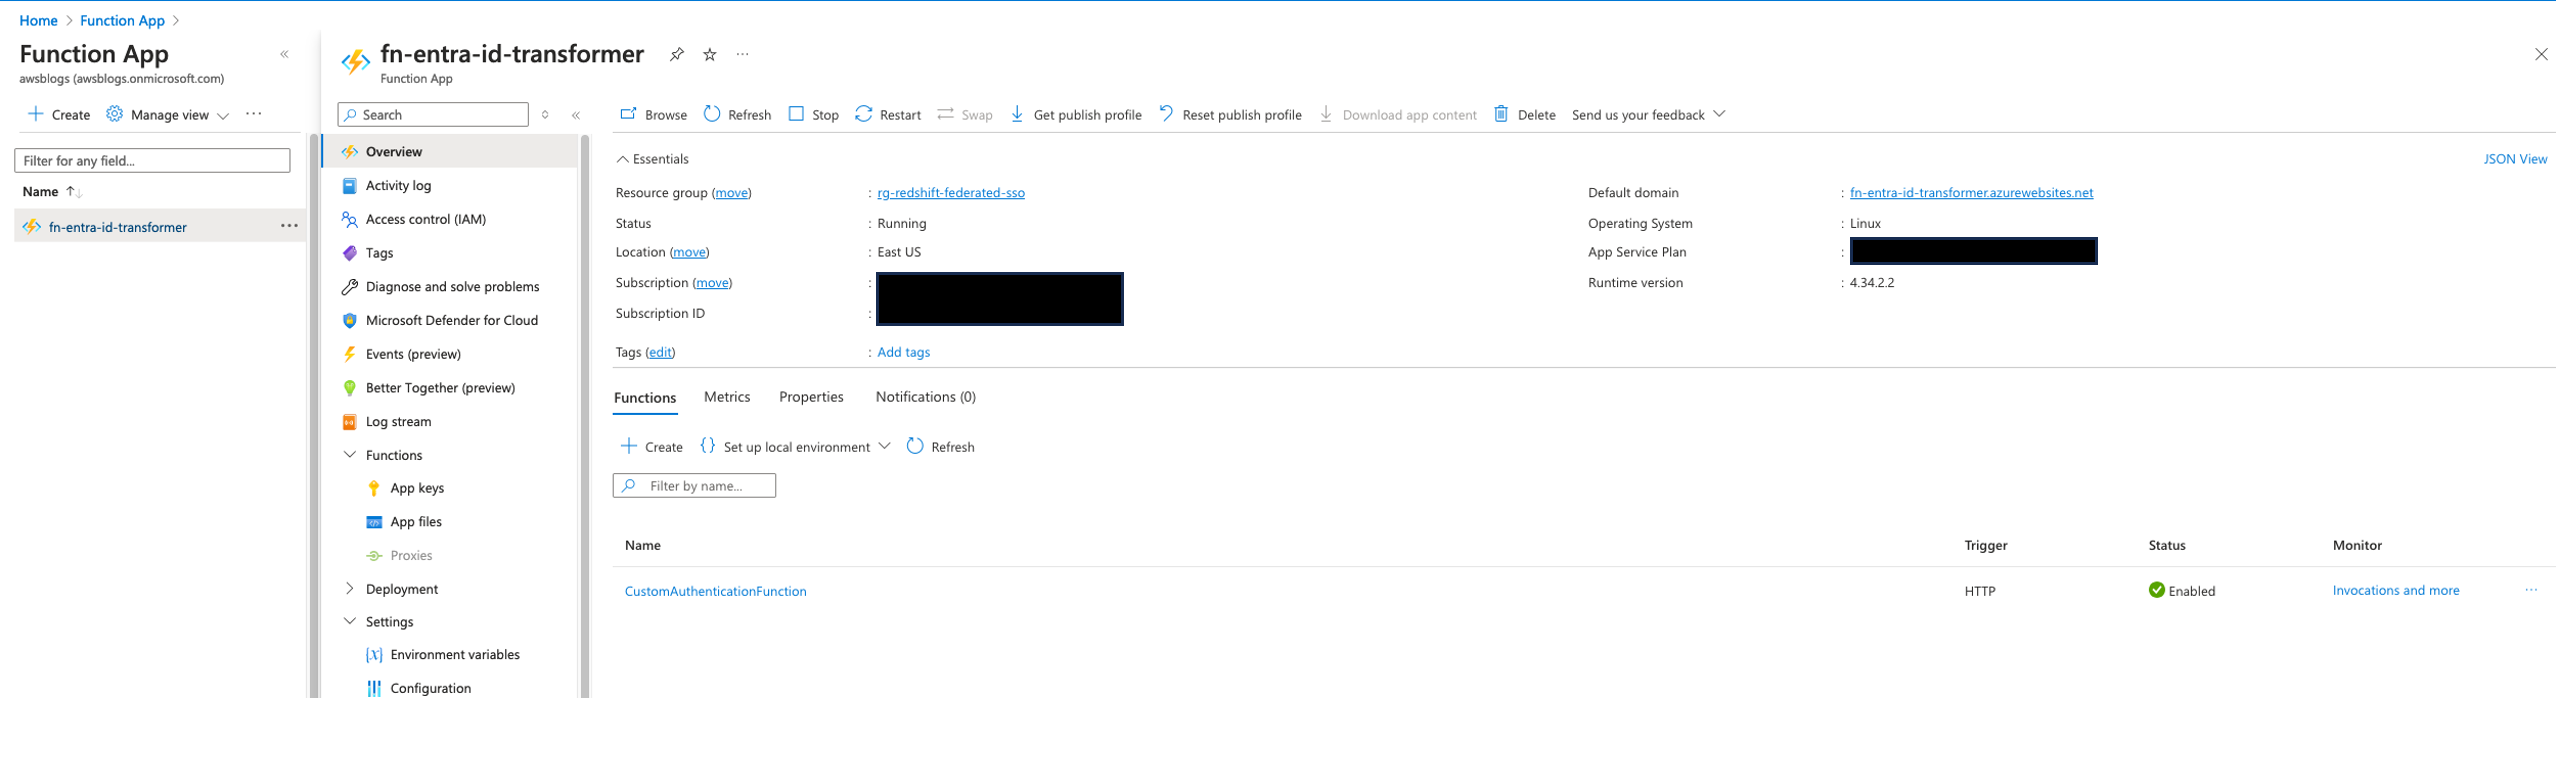
In this code, replace the values of clientId, clientSecret, and tenantId with the values recorded previously. Also, in enterprise environments, use secret management service to store these secrets and use requirements file to install required packages such as requests.
import azure.functions as func
import logging
import json
import sys
import subprocess

def install(package):
    allowed_pattern = r'^[a-zA-Z0-9\-_\.]+$'
    if not re.match(allowed_pattern, package):
        raise ValueError("Invalid package name")

    subprocess.check_call([sys.executable, "-m", "pip", "install", package], shell=False)

# Ensure the requests package is installed
try:
    import requests
except ImportError:
    install("requests")
    import requests

app = func.FunctionApp(http_auth_level=func.AuthLevel.FUNCTION)

@app.route(route="custom-extension")
def custom_extension(req: func.HttpRequest) -> func.HttpResponse:
    logging.info("Azure AD Custom Extension function triggered")

    try:
        request_body = req.get_body().decode('utf-8')
        data = json.loads(request_body)
        user_id = data['data']['authenticationContext']['user']['id']

        # Fetch access token for Microsoft Graph API
        access_token = get_access_token()
        if not access_token:
            error_response = {"error": "Failed to obtain access token for Graph API"}
            return func.HttpResponse(body=json.dumps(error_response), status_code=200, headers={"Content-Type": "application/json"})

        # Fetch user groups
        user_groups = fetch_user_groups(user_id, access_token)
        if user_groups is None:
            error_response = {"error": "Failed to fetch user groups"}
            return func.HttpResponse(body=json.dumps(error_response), status_code=200, headers={"Content-Type": "application/json"})

        # Format groups as : seperated values as needed by redshift query editor
        groups_colon_separated = ":".join(user_groups)

        # Construct response as per the required JSON structure
        response_content = {
            "data": {
                "@odata.type": "microsoft.graph.onTokenIssuanceStartResponseData",
                "actions": [
                    {
                        "@odata.type": "microsoft.graph.tokenIssuanceStart.provideClaimsForToken",
                        "claims": {
                            "dbGroupsqueryeditor": groups_colon_separated,
                            "dbGroupssqltools": user_groups
                        }
                    }
                ]
            }
        }

        return func.HttpResponse(body=json.dumps(response_content), status_code=200, headers={"Content-Type": "application/json"})

    except Exception as e:
        logging.error(f"Error in function execution: {str(e)}")
        error_response = {"error": str(e)}
        return func.HttpResponse(body=json.dumps(error_response), status_code=200, headers={"Content-Type": "application/json"})

def get_access_token():
    # Hardcoded credentials for demonstration; replace with secure storage before production
    client_id = 'client_id'
    client_secret = 'client_secret'
    tenant_id = 'tenant_id'
    token_url = f"https://login.microsoftonline.com/{tenant_id}/oauth2/v2.0/token"

    body = {
        "client_id": client_id,
        "scope": "https://graph.microsoft.com/.default",
        "client_secret": client_secret,
        "grant_type": "client_credentials"
    }

    try:
        response = requests.post(token_url, data=body, timeout=10)
        response.raise_for_status()
        return response.json()['access_token']
    except requests.RequestException as e:
        logging.error(f"Failed to retrieve access token: {str(e)}")
        return None

def fetch_user_groups(user_id, access_token):
    graph_url = f"https://graph.microsoft.com/v1.0/users/{user_id}/memberOf?$select=displayName"

    headers = {
        "Authorization": f"Bearer {access_token}"
    }

    try:
        response = requests.get(graph_url, headers=headers, timeout=10)
        response.raise_for_status()
        return [group['displayName'] for group in response.json().get('value', []) if group["@odata.type"] == "#microsoft.graph.group"]
    except requests.RequestException as e:
        logging.error(f"Failed to fetch user groups: {str(e)}")
        return None
Now you can create an IAM IdP and role.
In IAM, an IdP represents a trusted external authentication service like Microsoft Entra ID that supports SAML 2.0, allowing AWS to recognize user identities authenticated by that service. It’s crucial to name this IdP AzureADDemo to match the previously configured SAML claims for role creation.
Create your IAM SAML IdP
Complete the following steps to create your IAM SAML IdP:
- On the IAM console, choose Identity providers in the navigation pane.
- Choose Add provider.

- For Provider type, select SAML.
- For Provider name, enter a descriptive name, such as
AzureADDemo. - Upload the SAML metadata document, which you downloaded as
Federation Metadata.xmland stored asAWS Single-Account Access.xml. - Choose Add provider.

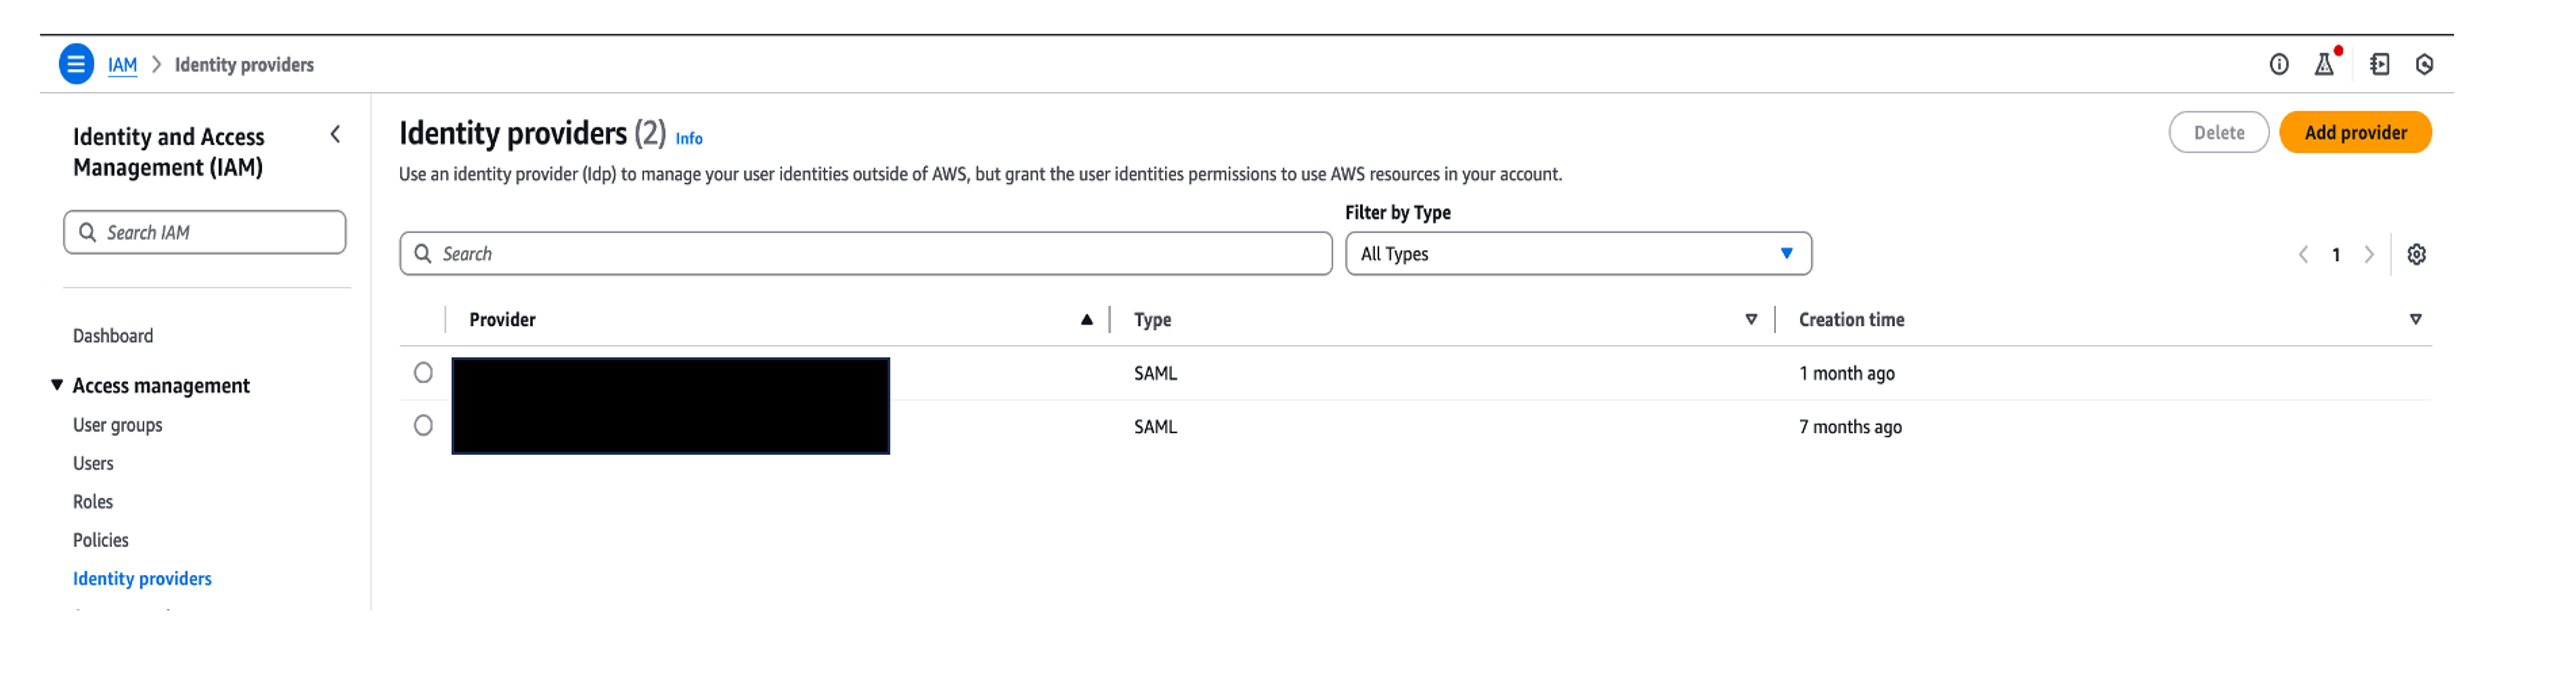
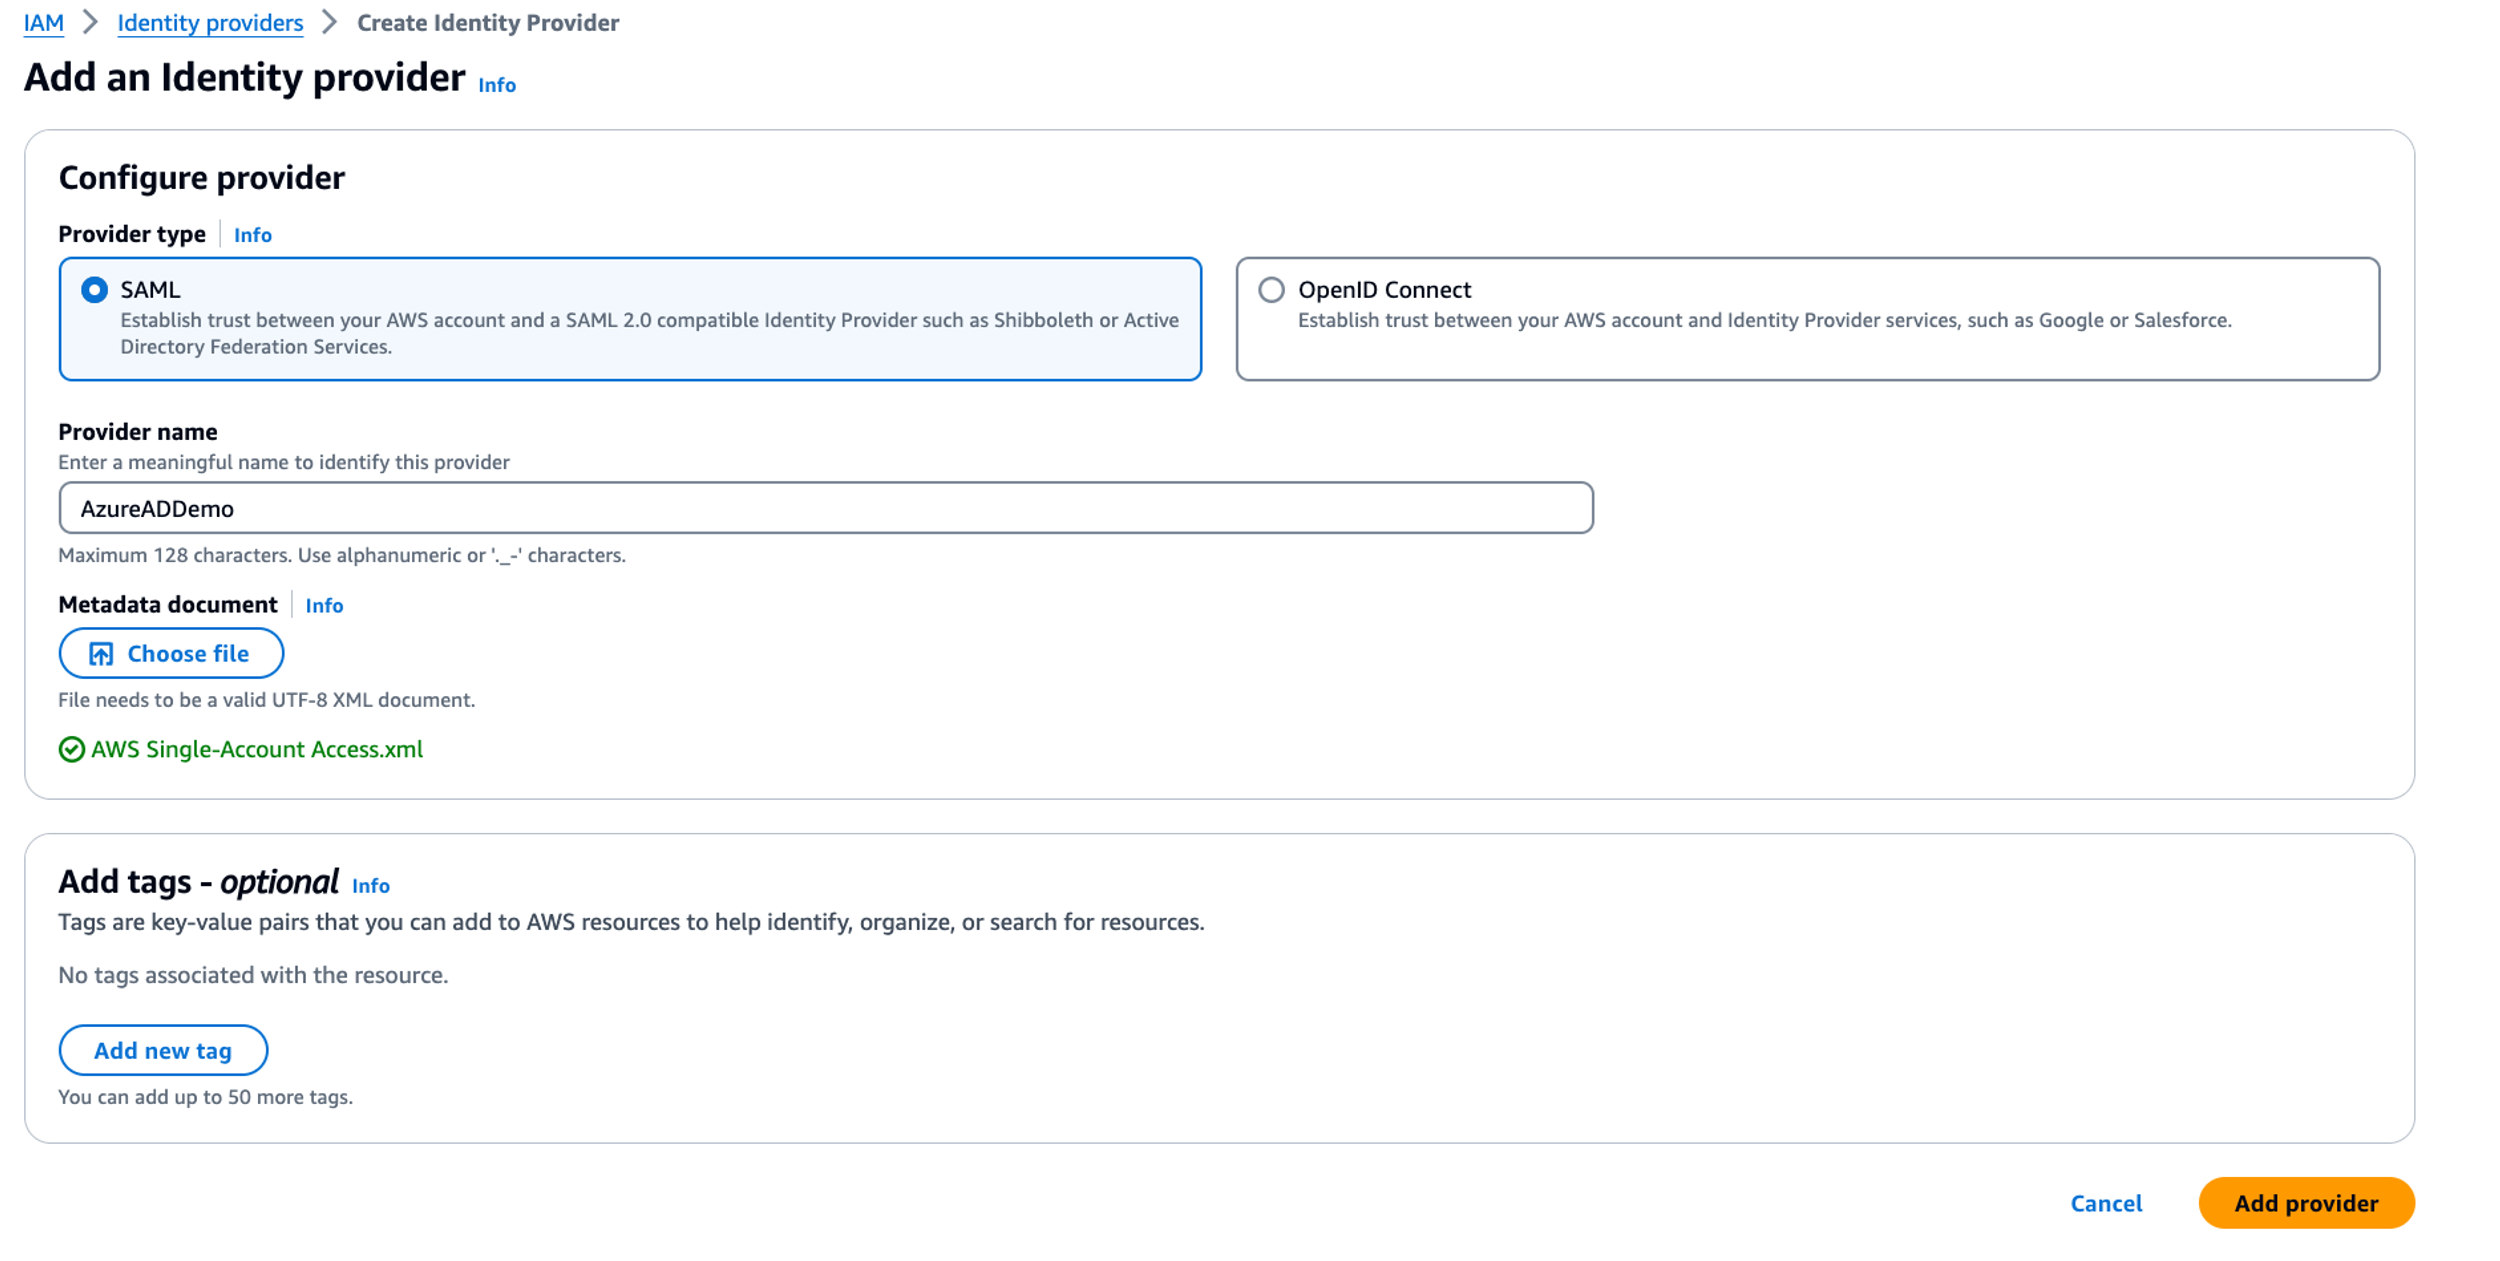
Create an IAM role
Next, you create an IAM role for SAML-based federation, which will be used to grant access to the Redshift Query Editor and Redshift cluster. Complete the following steps:
- On the IAM console, choose Roles in the navigation pane.
- Choose Create role.
- For Trusted identity type, select SAML 2.0 federation.
- For SAML 2.0-based provider, choose
AzureADDemo. - For Access to be allowed, select Allow programmatic and AWS Management Console access.
- Choose Next.

- Add the permissions
AmazonRedshiftQueryEditorV2ReadSharingandReadOnlyAccess, and choose Next. - For Role name, enter a descriptive name, such as
dev-bdt-team. - Choose Create role.

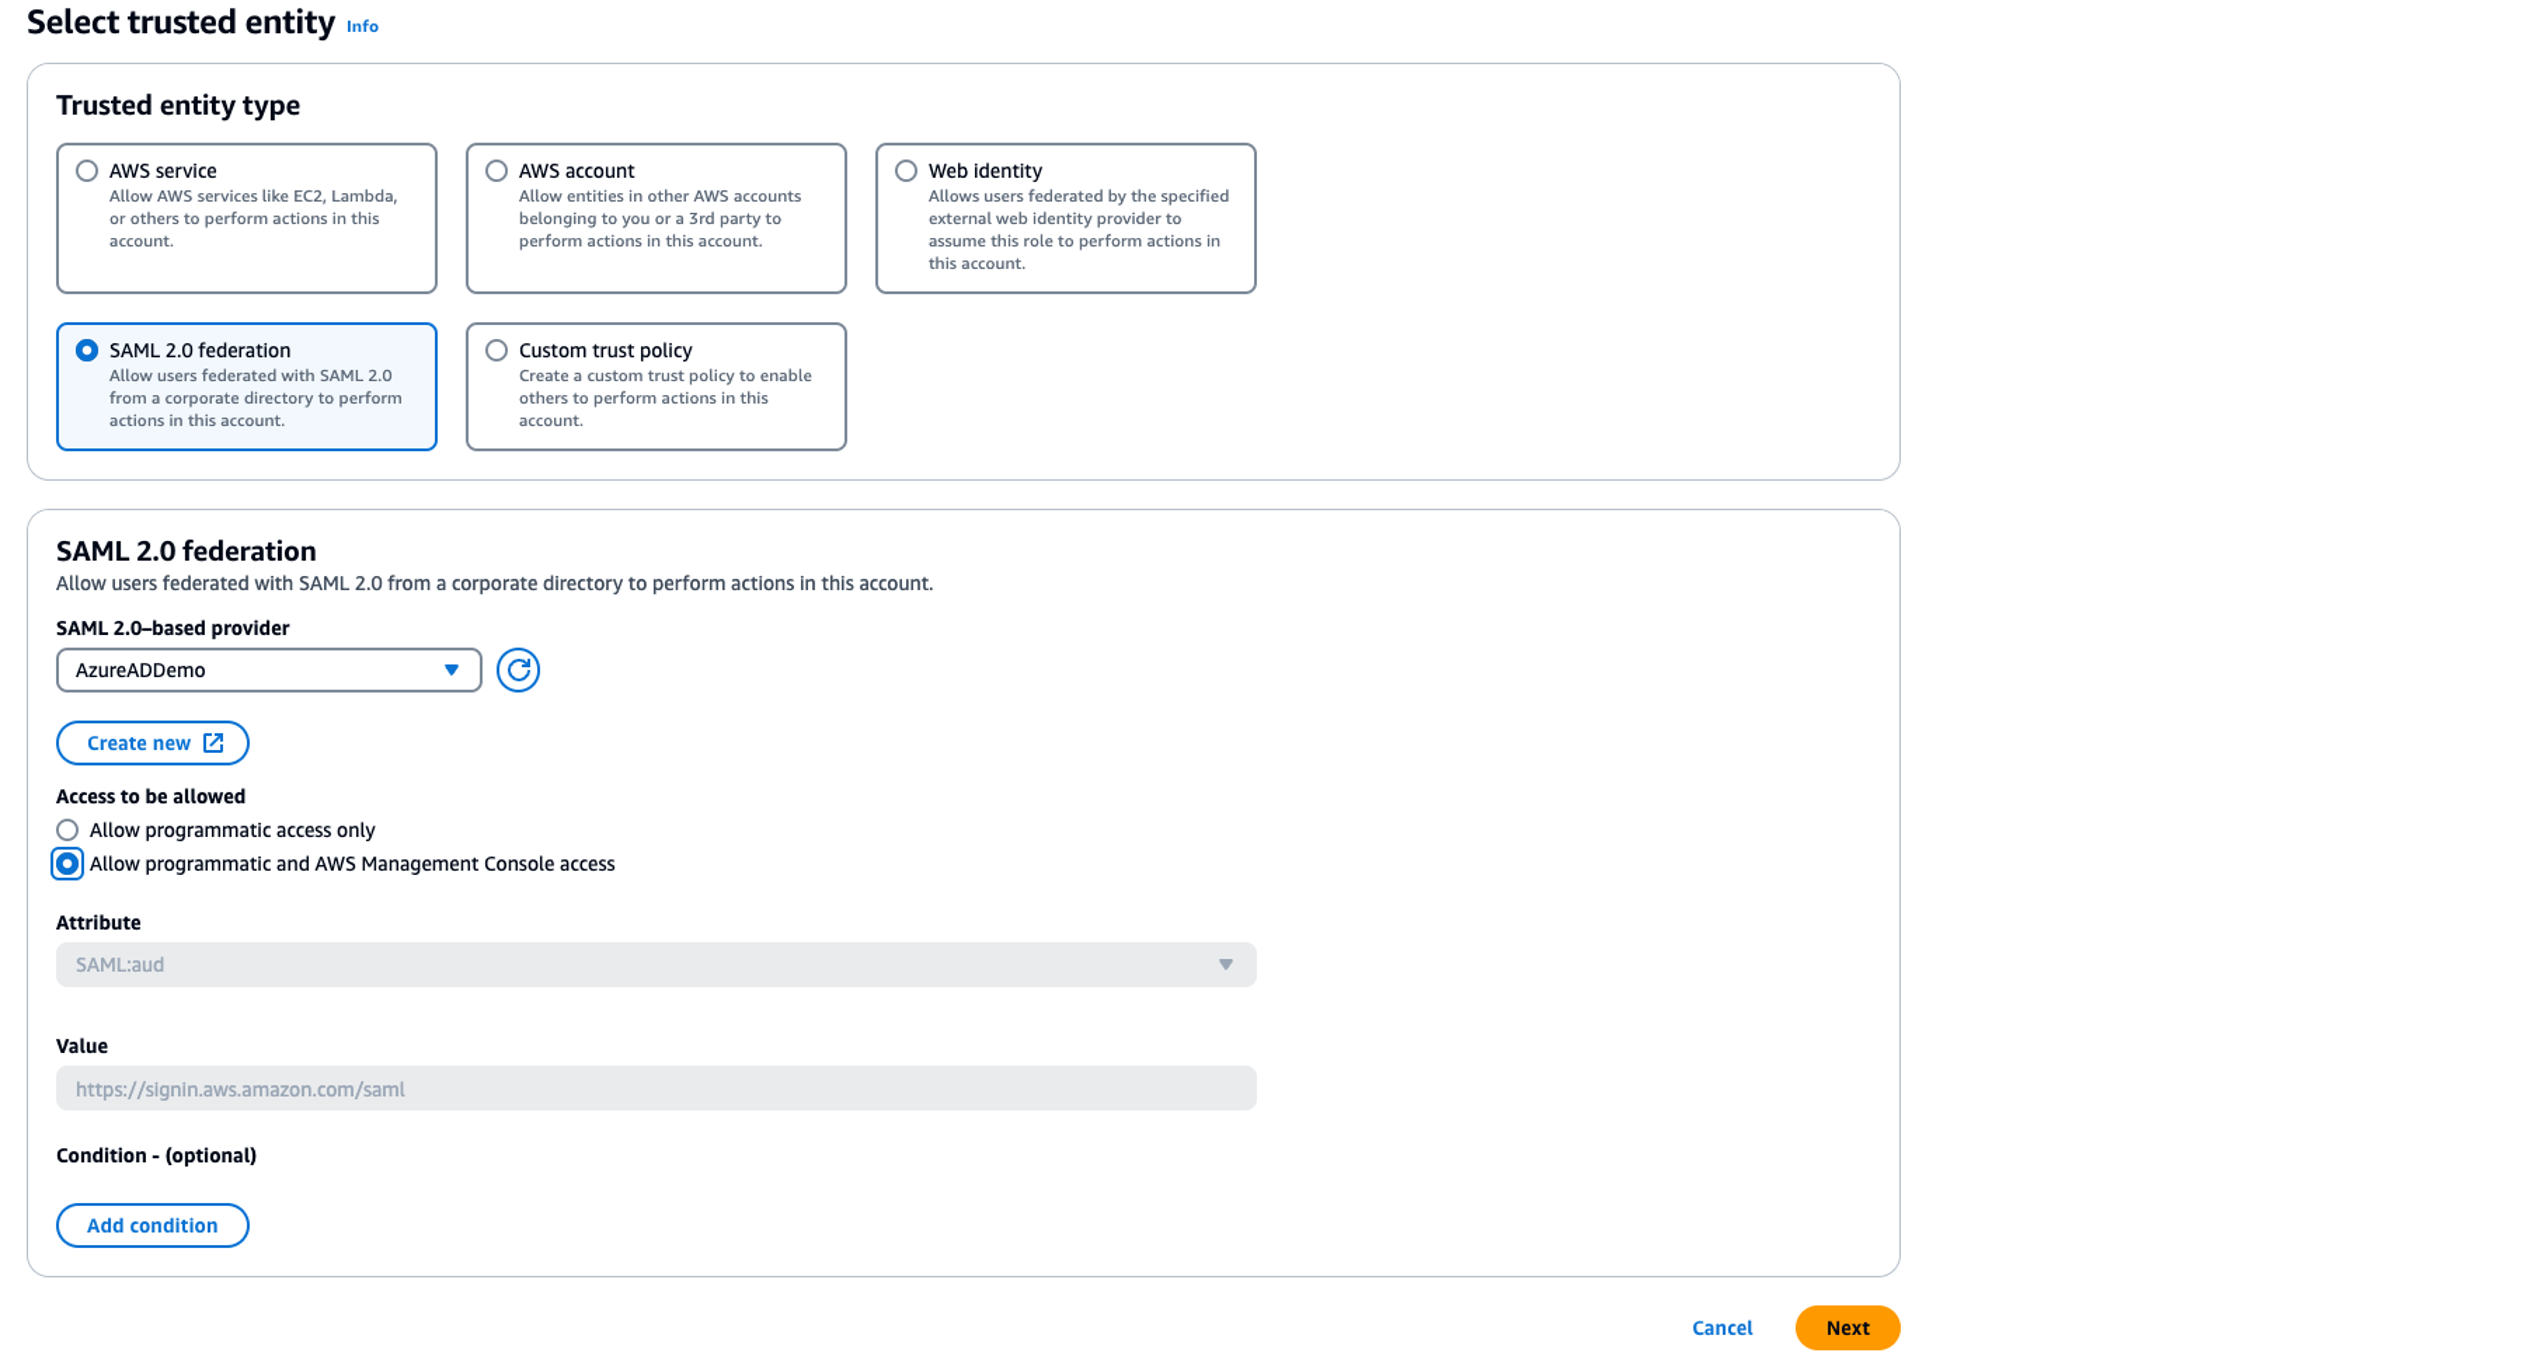
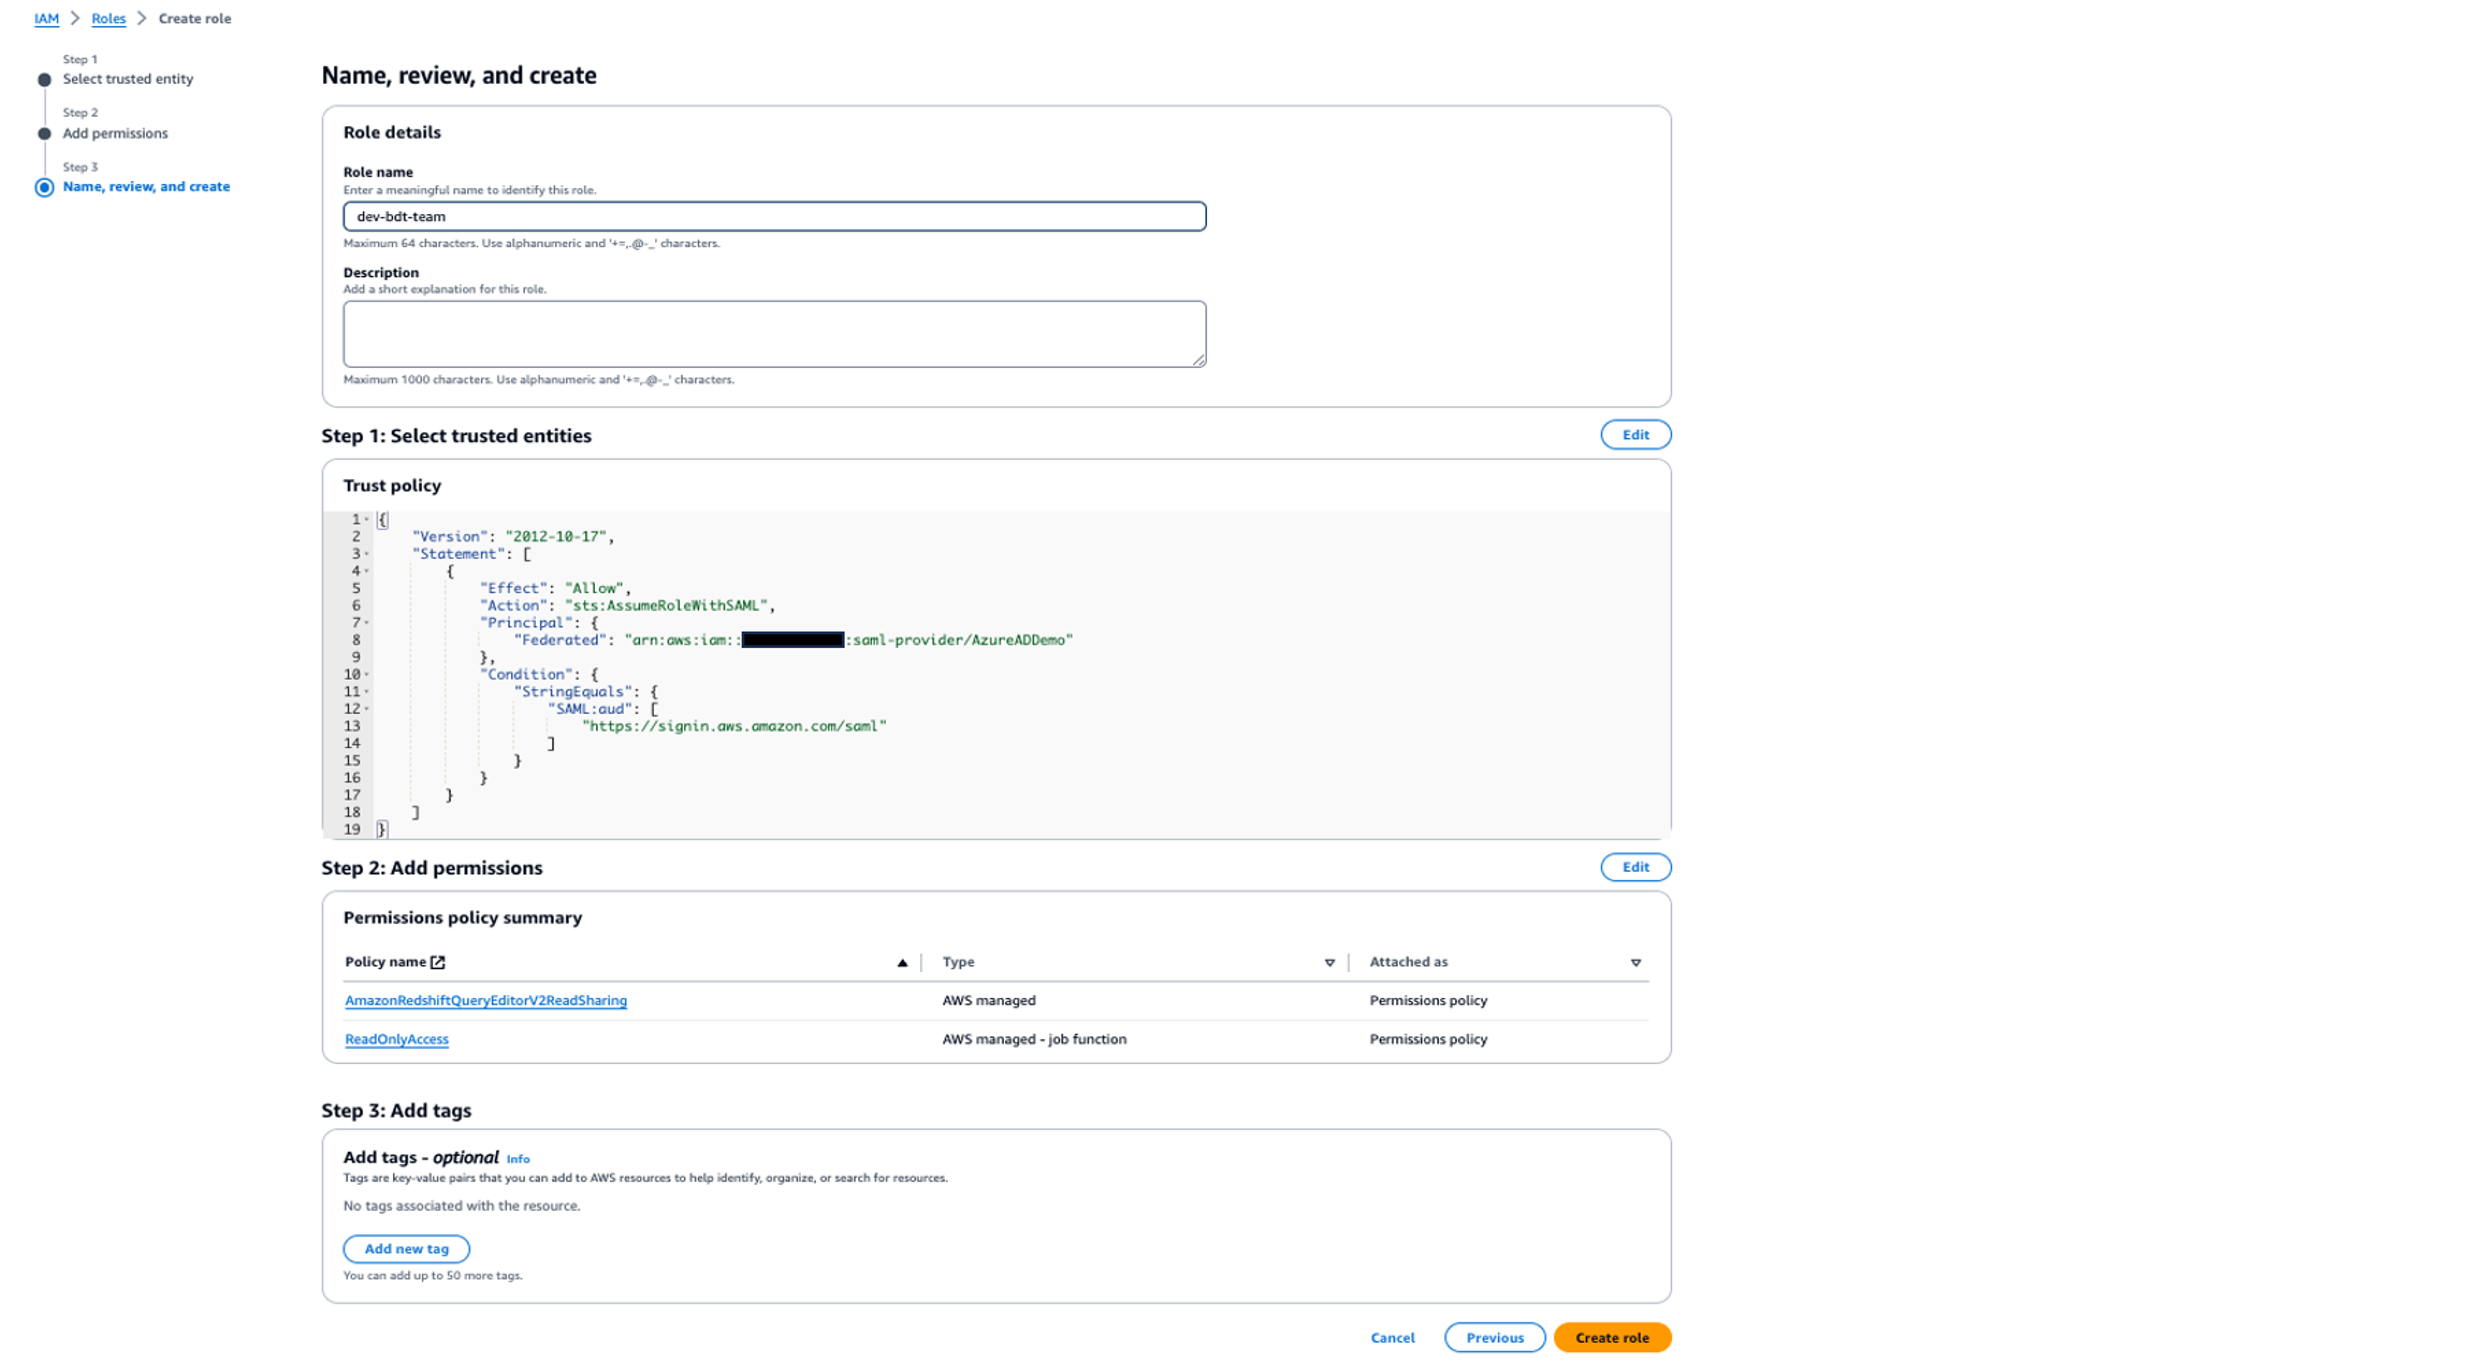
Update trust policy
- On the IAM console, choose Roles in the navigation pane, and search for and choose the role
dev-bdt-team.

- In the Trusted entities section, choose Edit trust policy.

- Add the action
sts:TagSessionby removing the Action line and adding the following code:"Action": [
"sts:AssumeRoleWithSAML",
"sts:TagSession"
], - Choose Update policy.

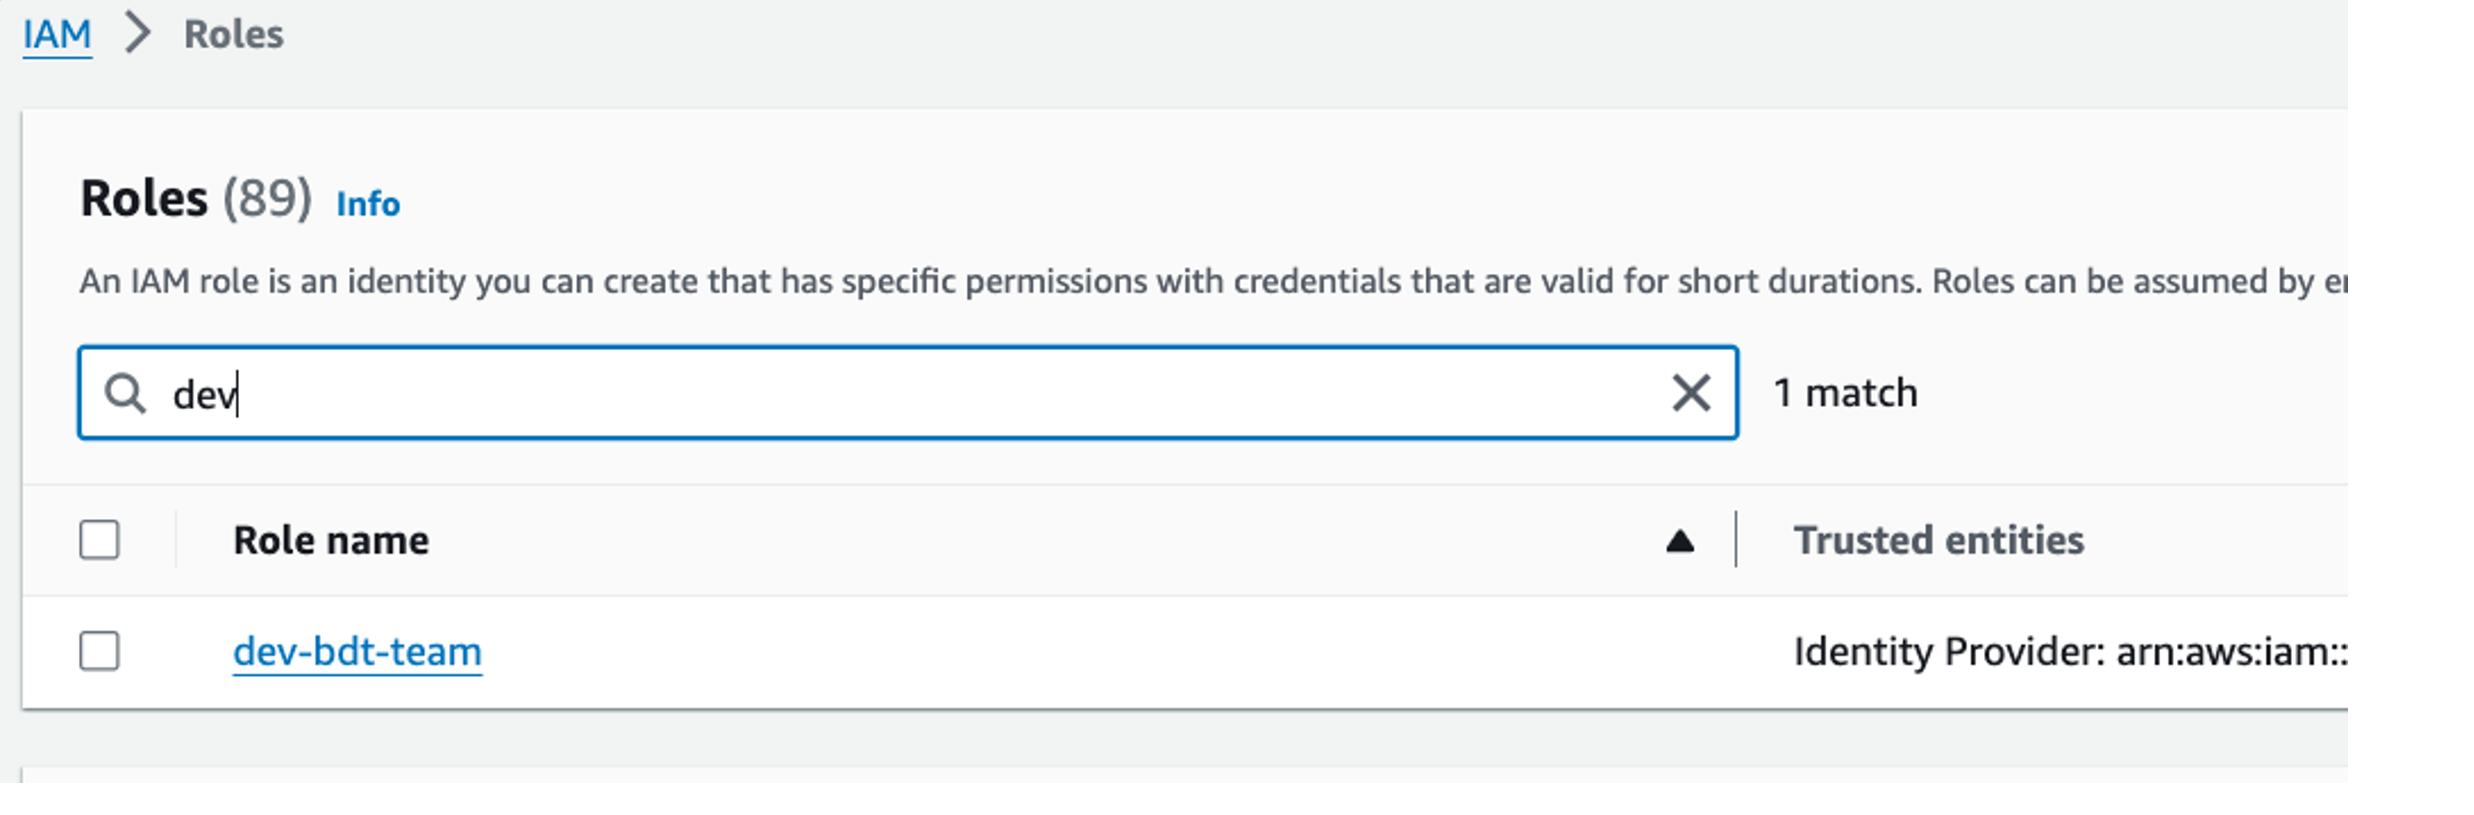
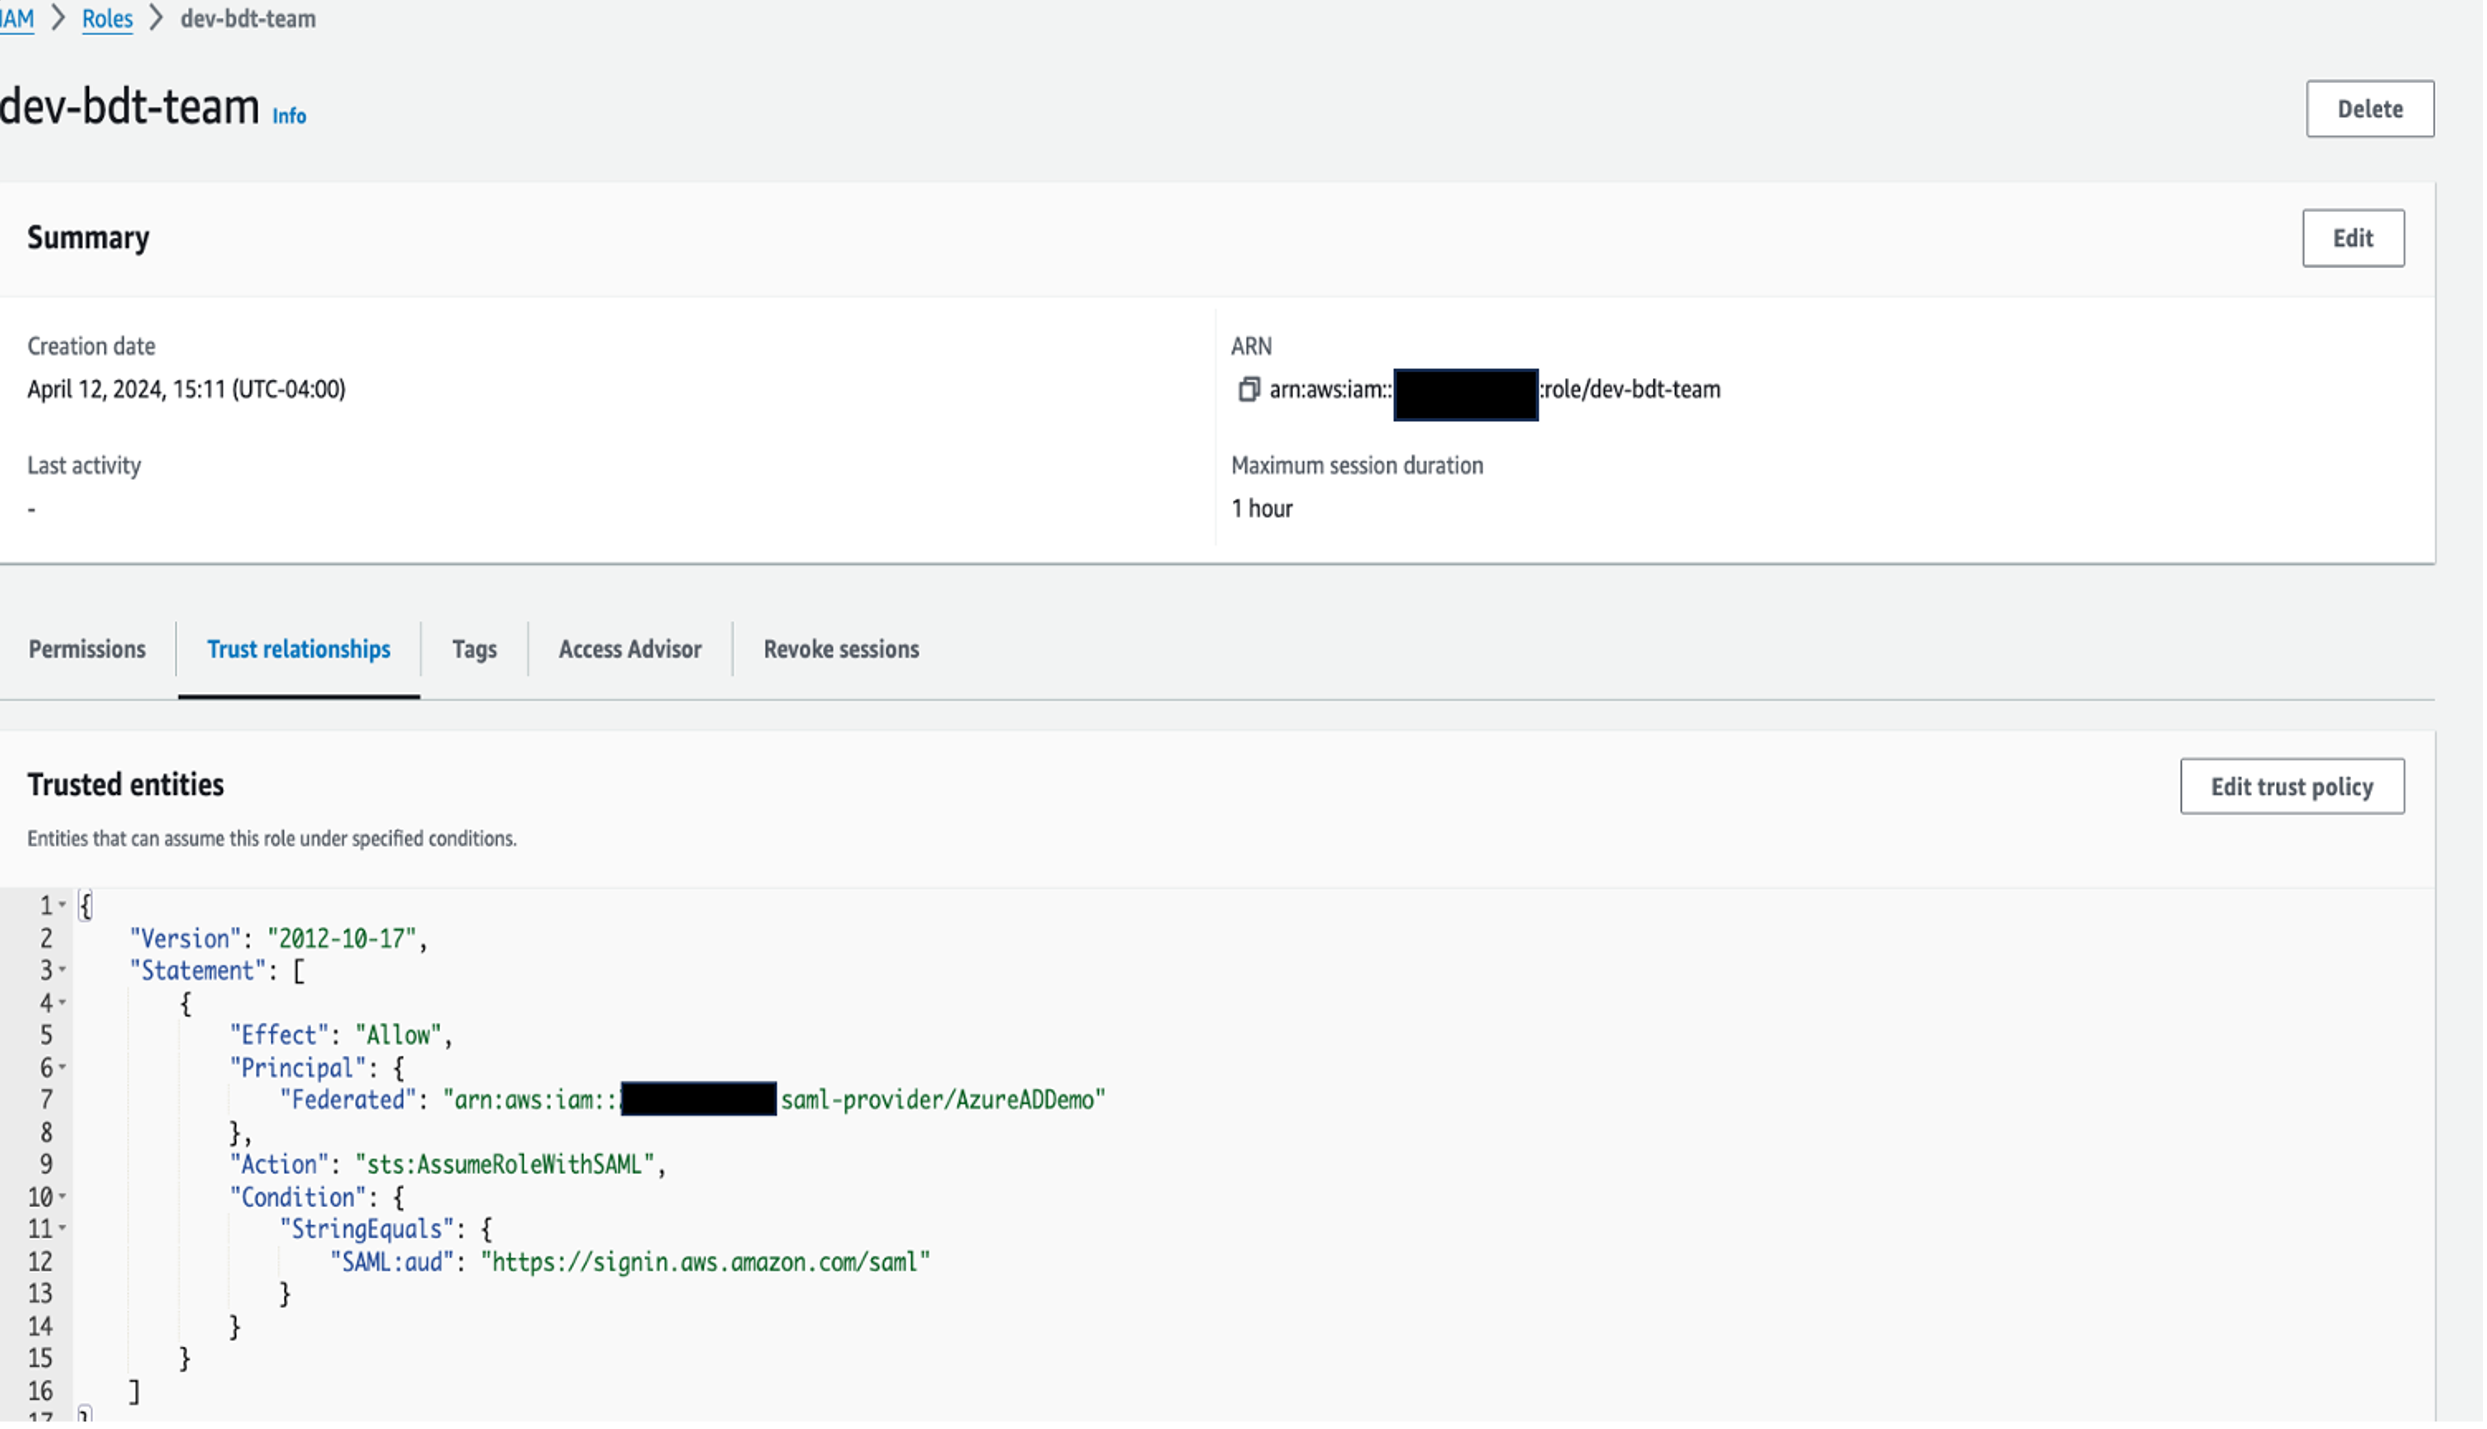
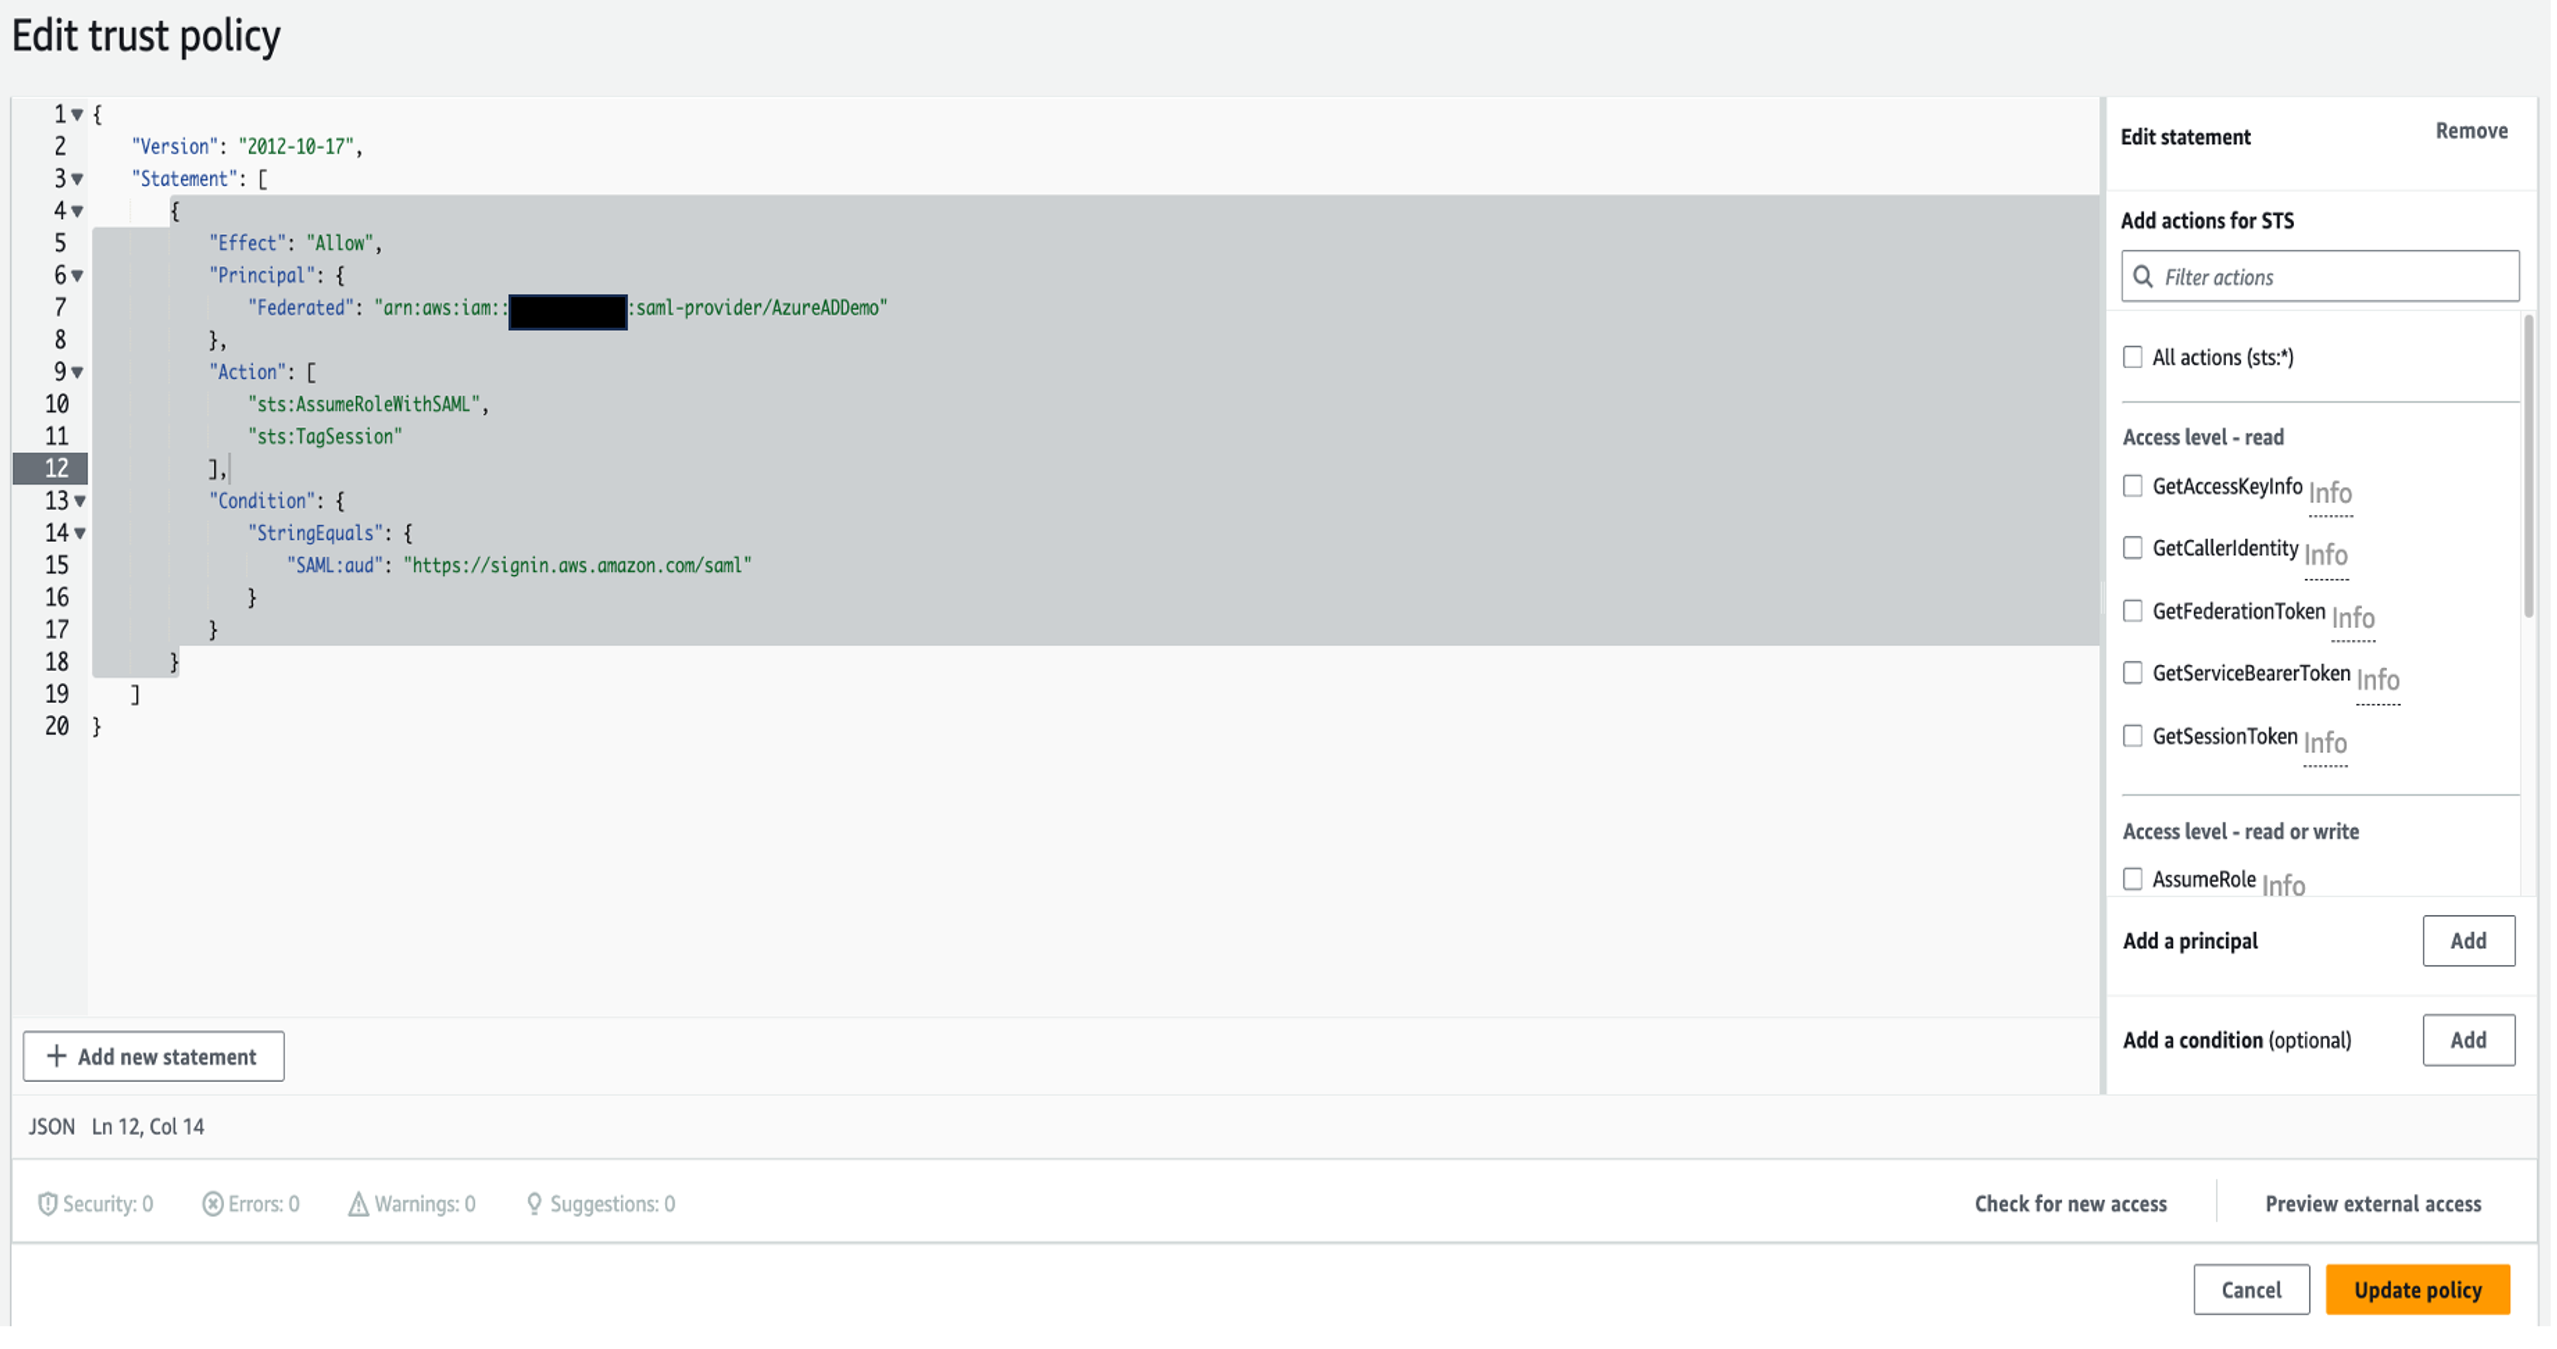
Create an IAM policy
In the following steps, you create an IAM policy to allow the dev-bdt-team role to obtain temporary credentials for connecting to Amazon Redshift using IAM:
- On the IAM console, choose Policies in the navigation pane.
- Choose Create policy.
- On the JSON tab, enter the following policy document, replacing placeholders with appropriate values:
{ "Version": "2012-10-17", "Statement": [ { "Sid": "VisualEditor0", "Effect": "Allow", "Action": "redshift:GetClusterCredentialsWithIAM", "Resource": "arn:aws:redshift:<YOUR-REGION>:<AWS-ACCOUNT-NUMBER>:dbname::<YOUR-REDSHIFT-CLUSTER-NAME>/*" } ] } - Review the policy details and provide a descriptive name for your policy, such as
redshiftAccessPolicy. - Review the policy summary and resolve any warnings or errors.
- Choose Create policy to finalize the policy creation process.
- On the Roles page, search for and open
dev-bdt-teamrole. - On the Add permissions menu, choose Attach policies.
- Attach
redshiftAccessPolicyto the role.
Your permissions under the role dev-bdt-team should look like the following screenshot.
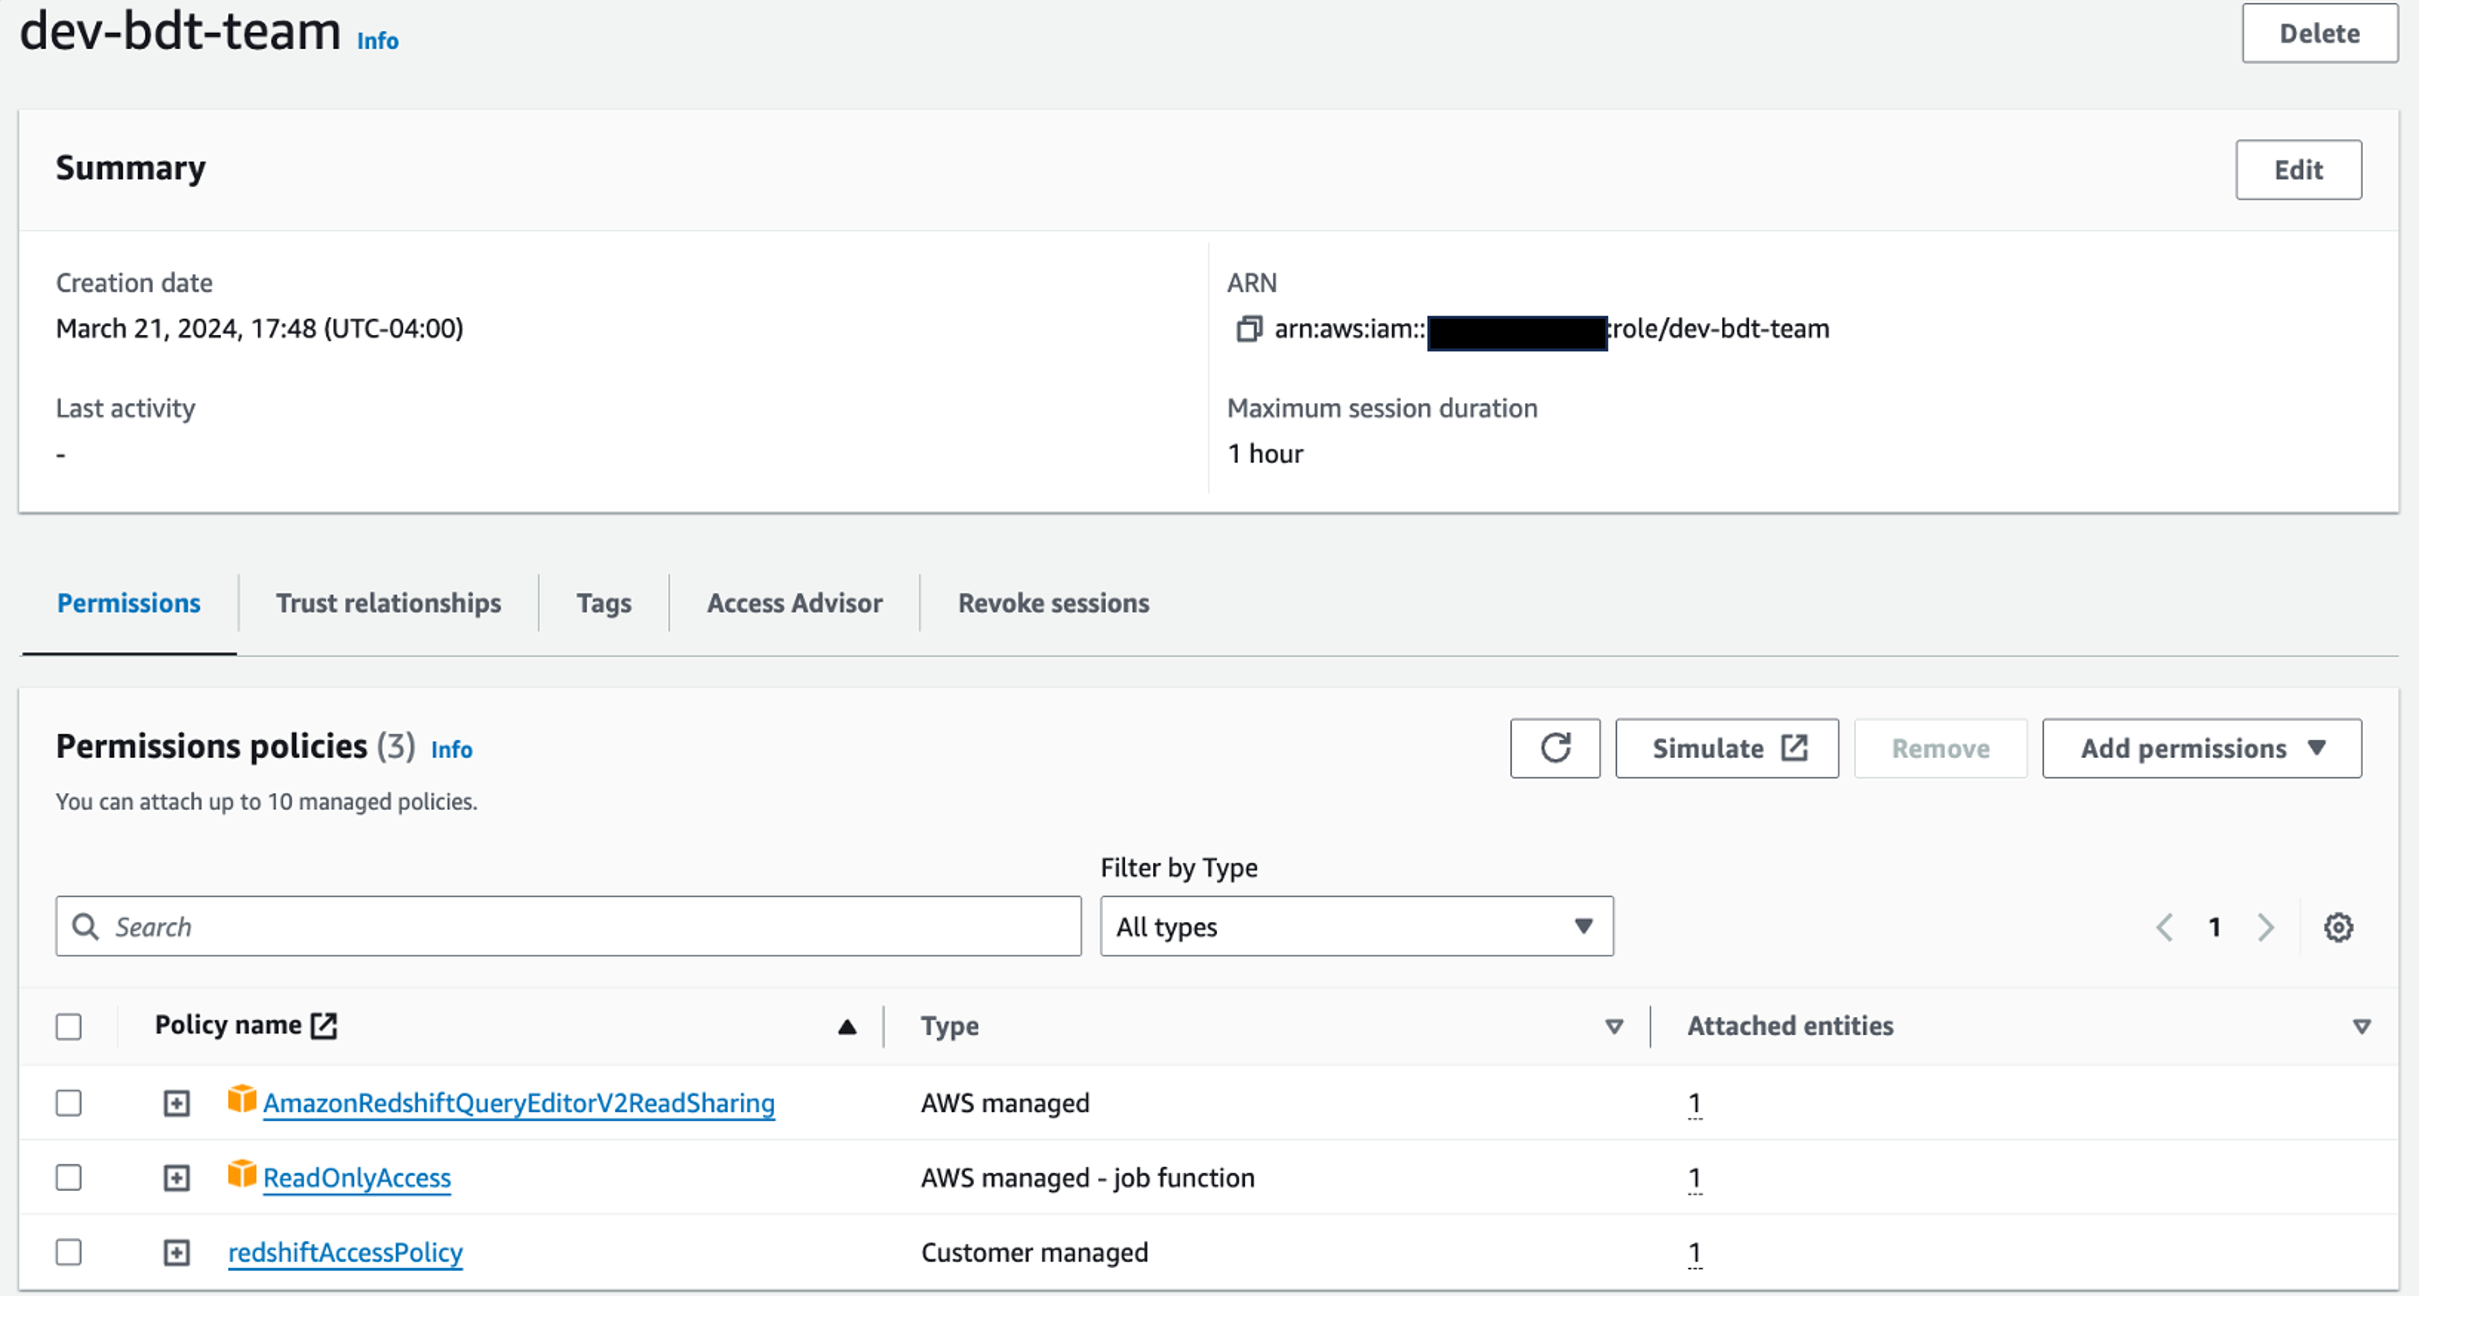
Test the SSO setup
You can now test the SSO setup. Complete the following steps:
- On the Azure Portal, for your
AWS Single-Account Accessapplication, choose Single sign-on. - Choose Test this application.
- Choose Sign in as current user.
If the setup is correct, you’re redirected to the AWS Management Console (which might be in a new tab for some browsers).
Test with Redshift Query Editor
Complete the following steps:
- Navigate to Microsoft Entra ID, Enterprise applications, AWS Single-Account Access.
- Go to Properties and copy the user access URL.

- Launch your preferred web browser and enter the user access URL to navigate to the Microsoft sign-in page.
- Log in with user A credentials.

- You will be directed to AWS console, and you will be logged in as
dev-bdt-role.

- Open the Amazon Redshift console and choose Provisioned clusters dashboard.
- Choose the cluster
examplecluster.

- On the Query data menu, choose Query in query editor v2.
- Select Temporary credentials using your IAM identity.
- For Database, enter dev.
- Choose Create connection.

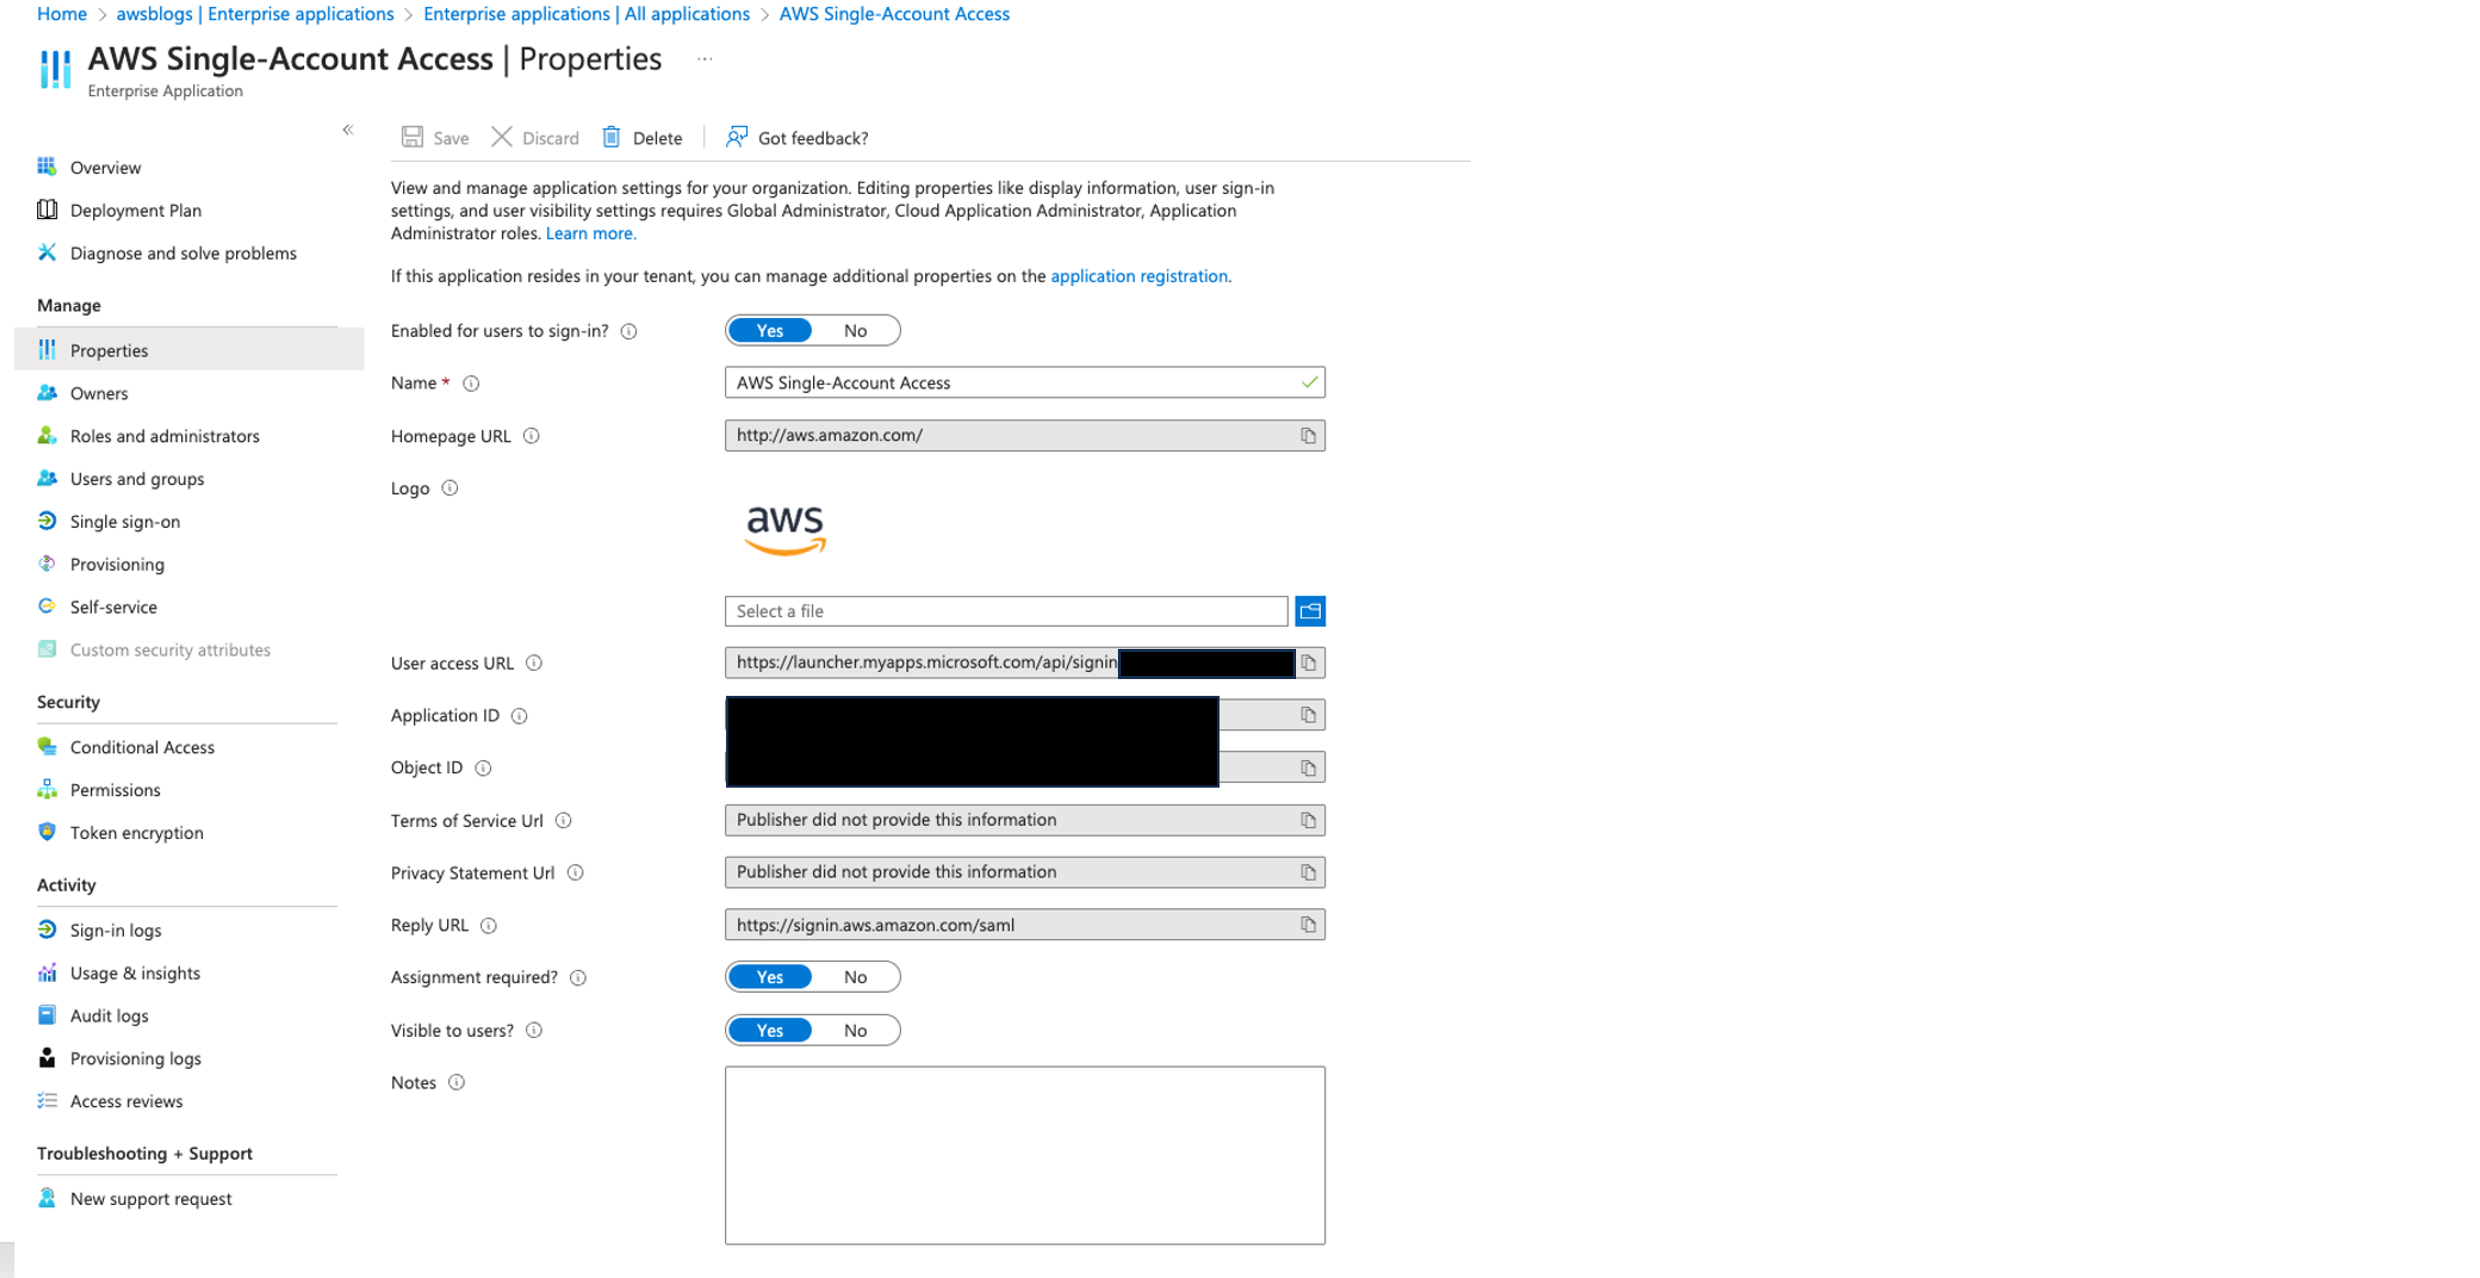

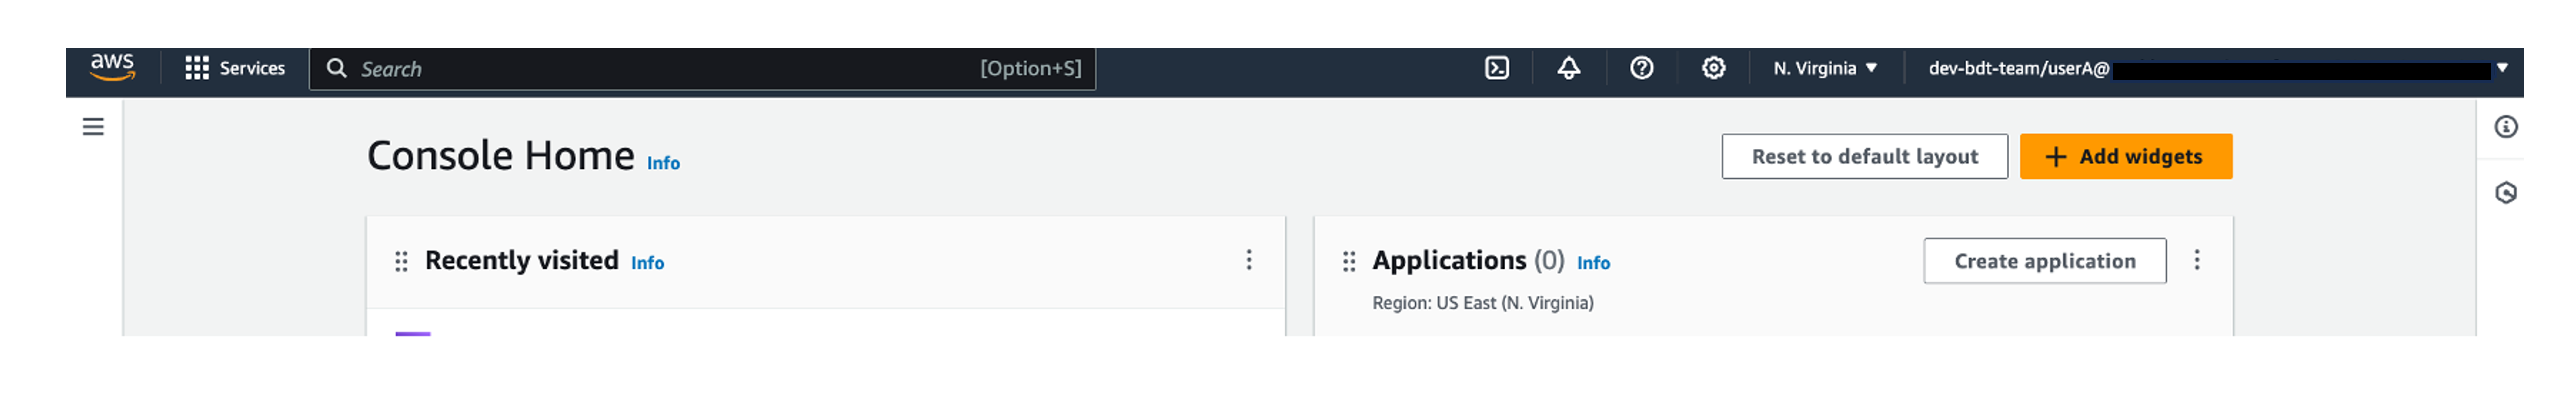
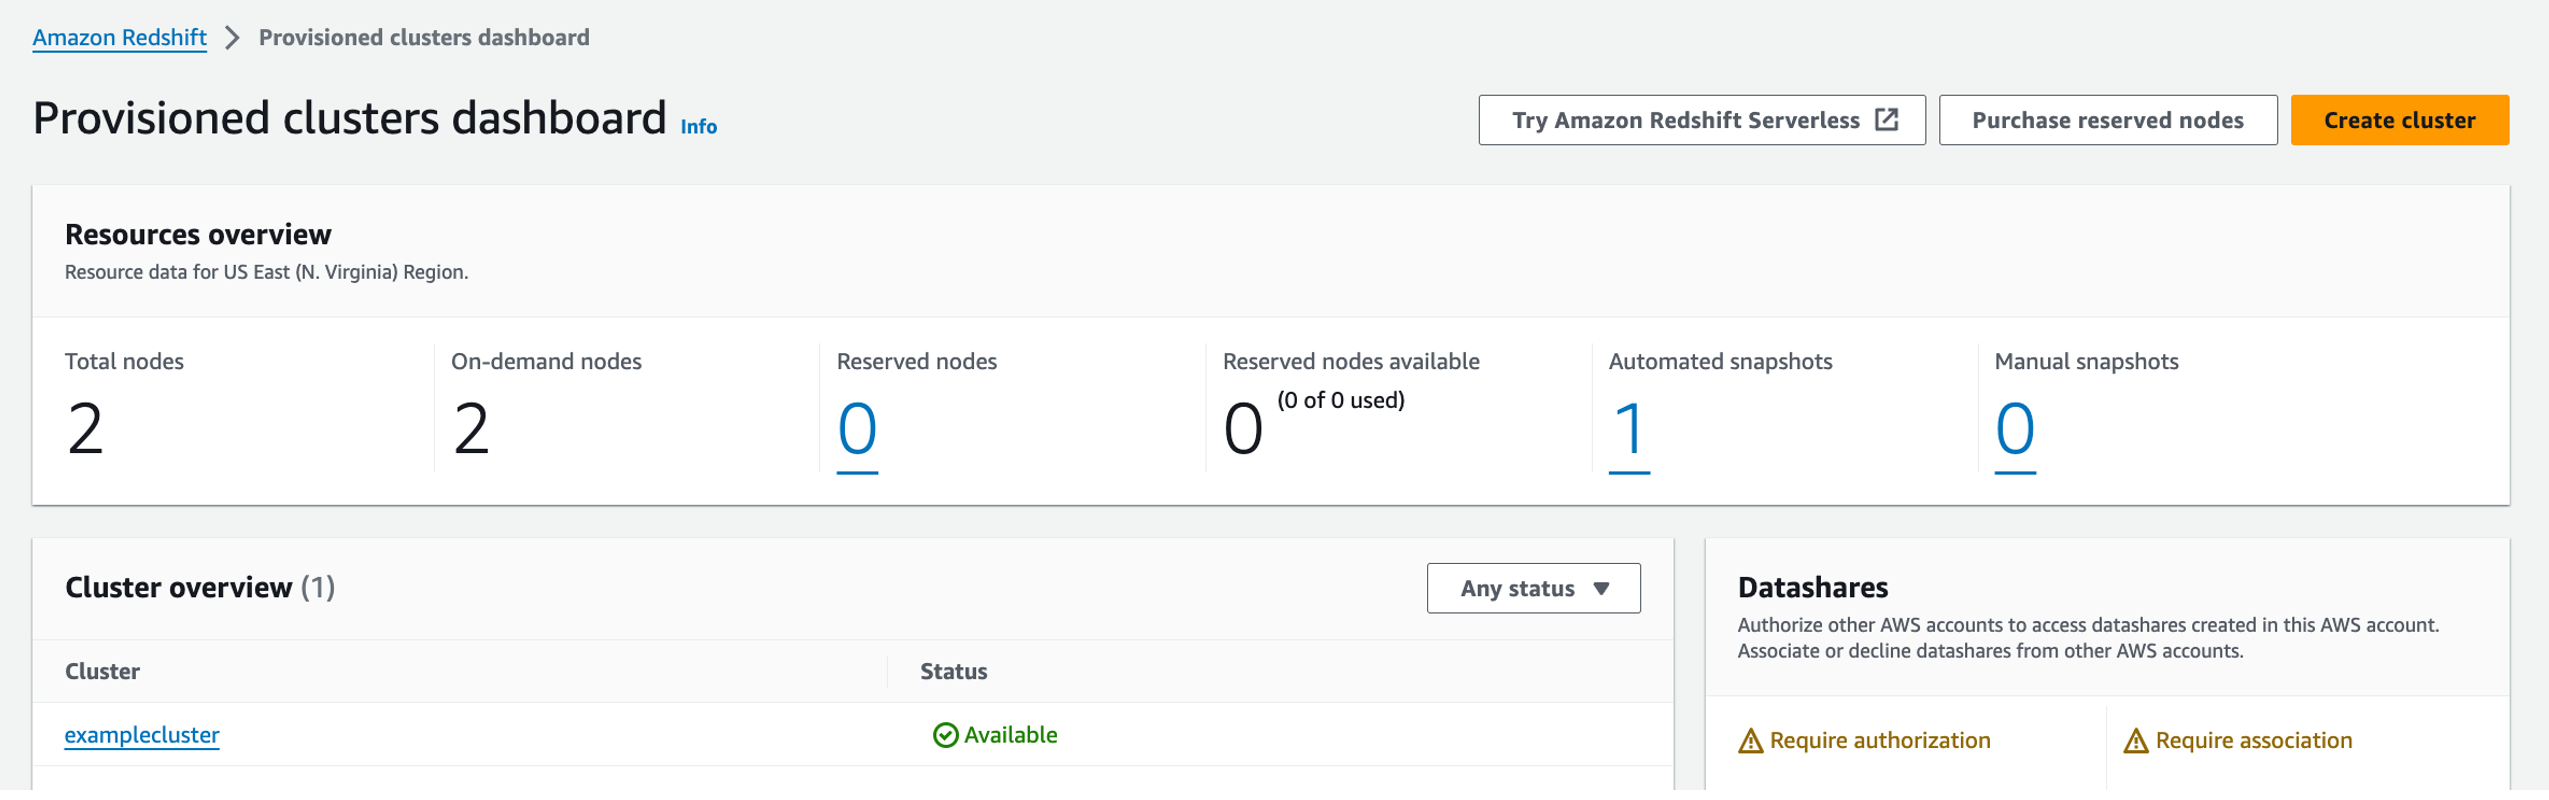
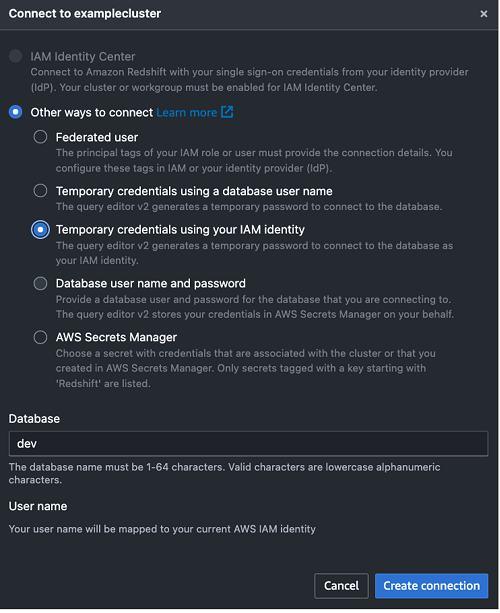
After the connection is established, you should be able to see your dev database and schemas under it, as shown in the following screenshot.
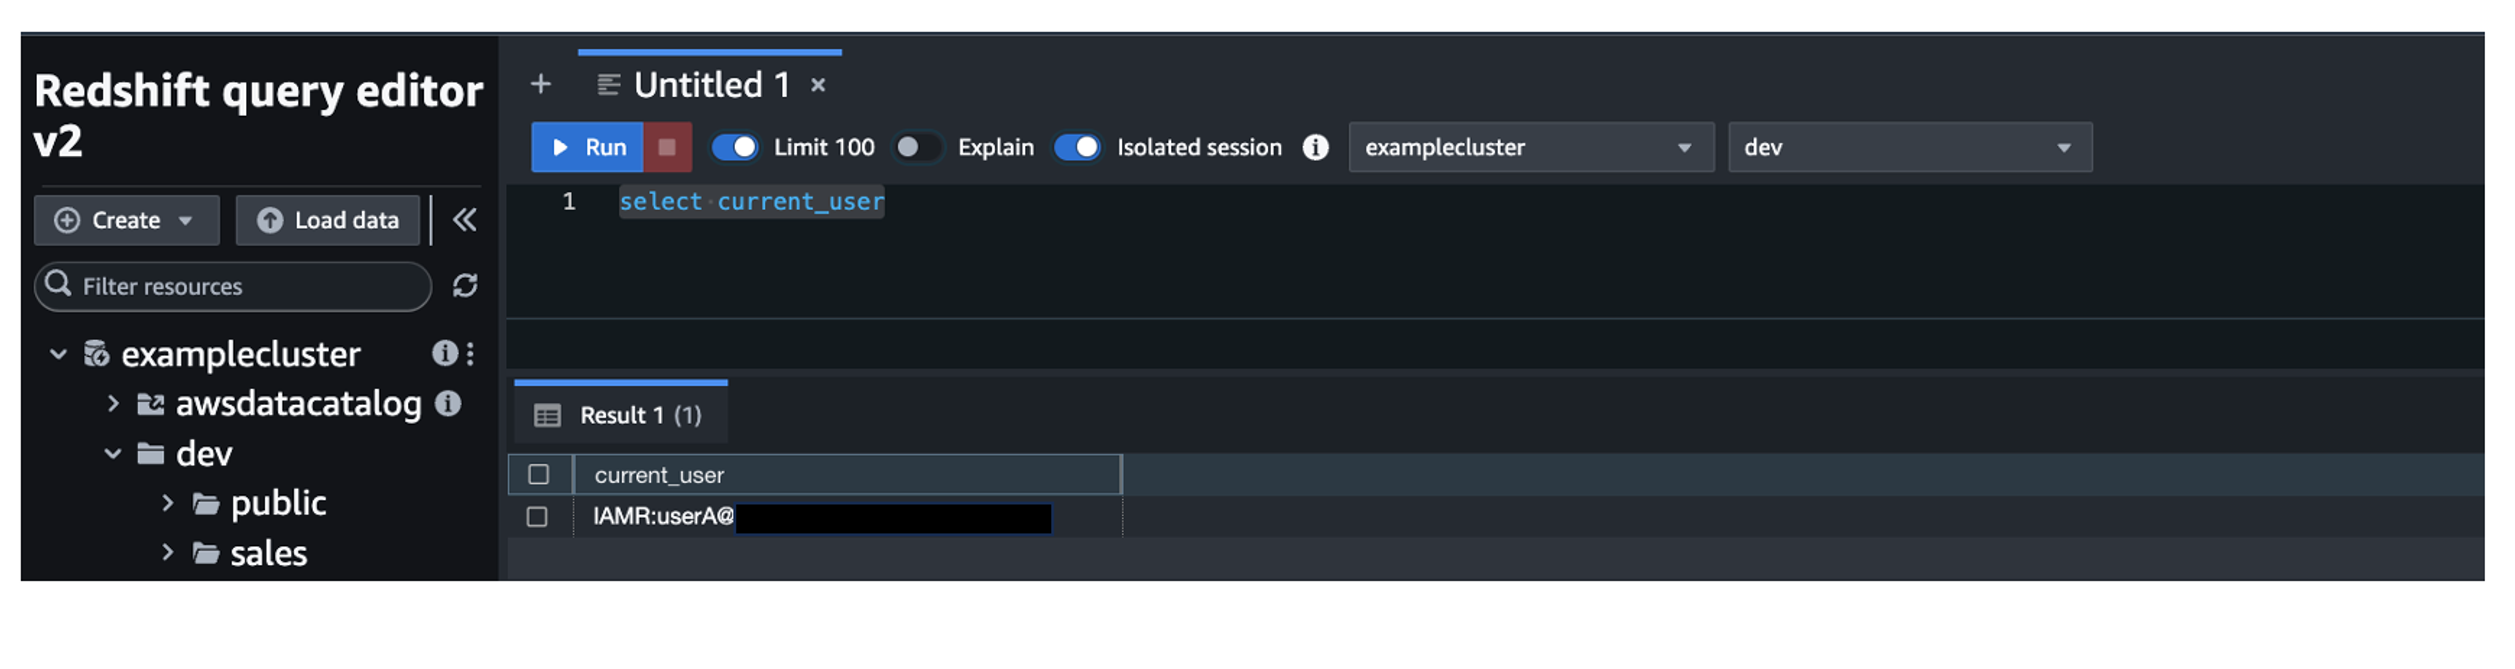
Because user A is only part of group redshift_sales, they will be able to see only the sales schema.
- Run a SQL statement to get data from
sales_table.
Because user A has access to the table, you can see output like the following screenshot.
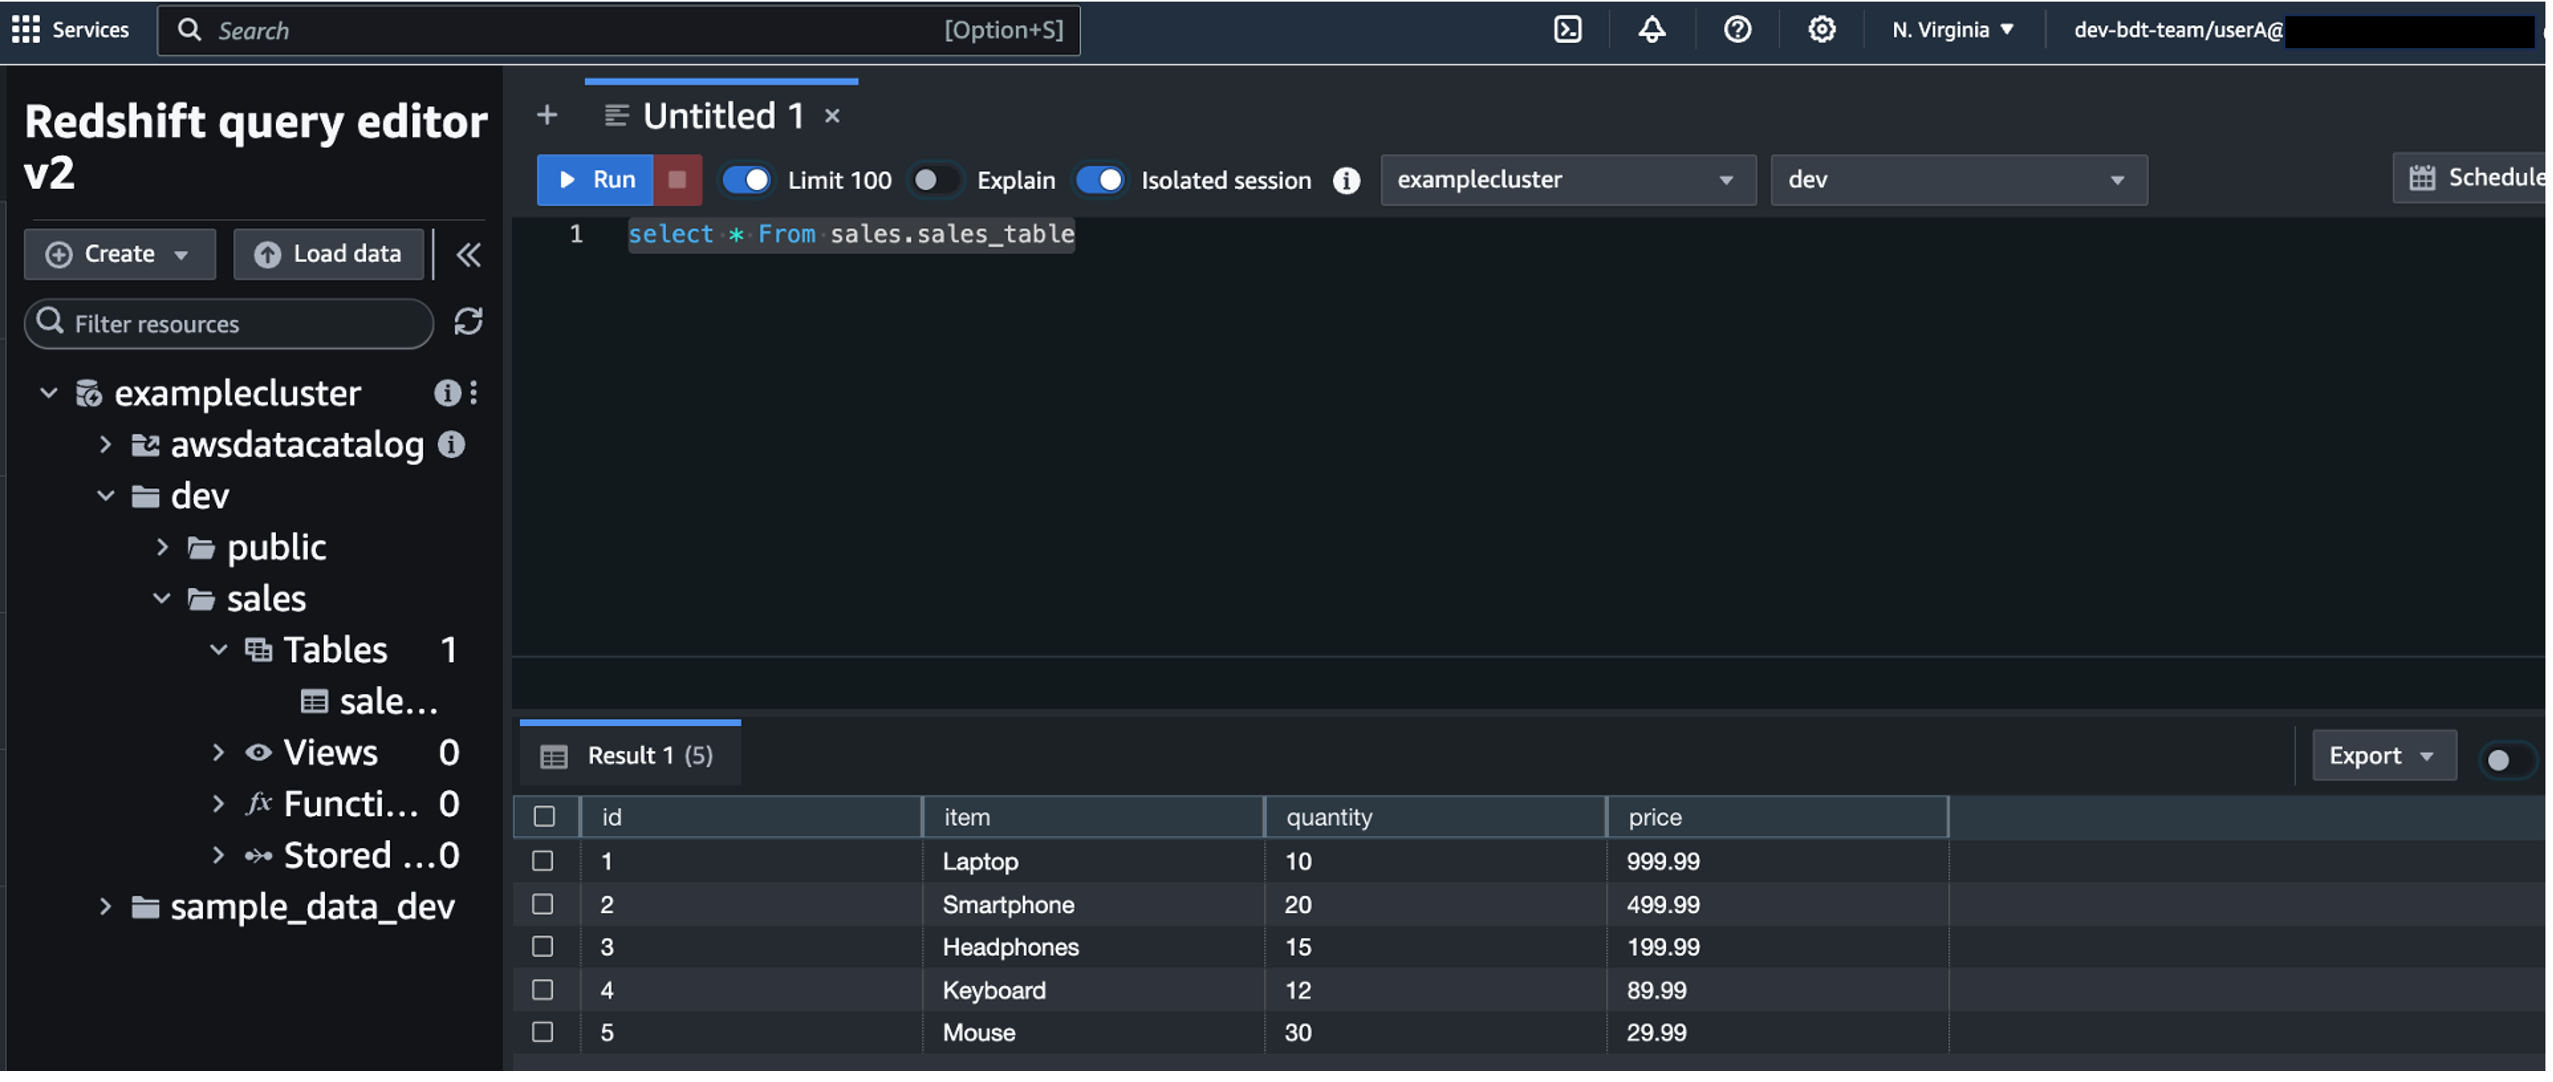
- Log in as user C to test access for user C.
User C is able to see both the product and sales schemas because they’re part of both the redshift_product and redshift_sales groups.
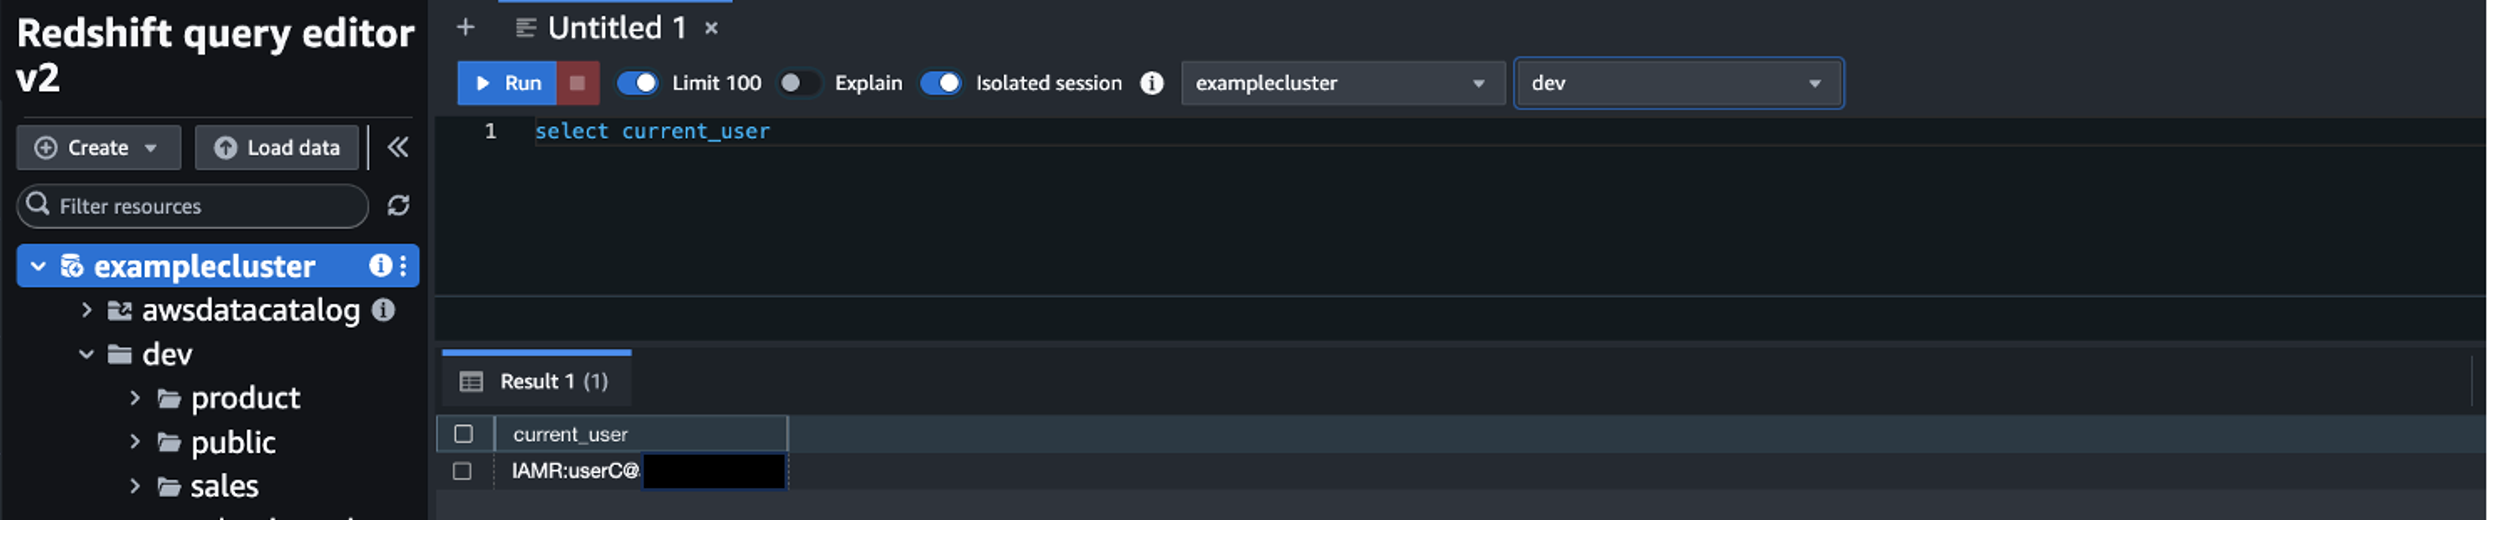
- Run a SQL statement to get data from both
sales_tableandproduct_table.
User C has access to both tables, as you can see in the following screenshot.
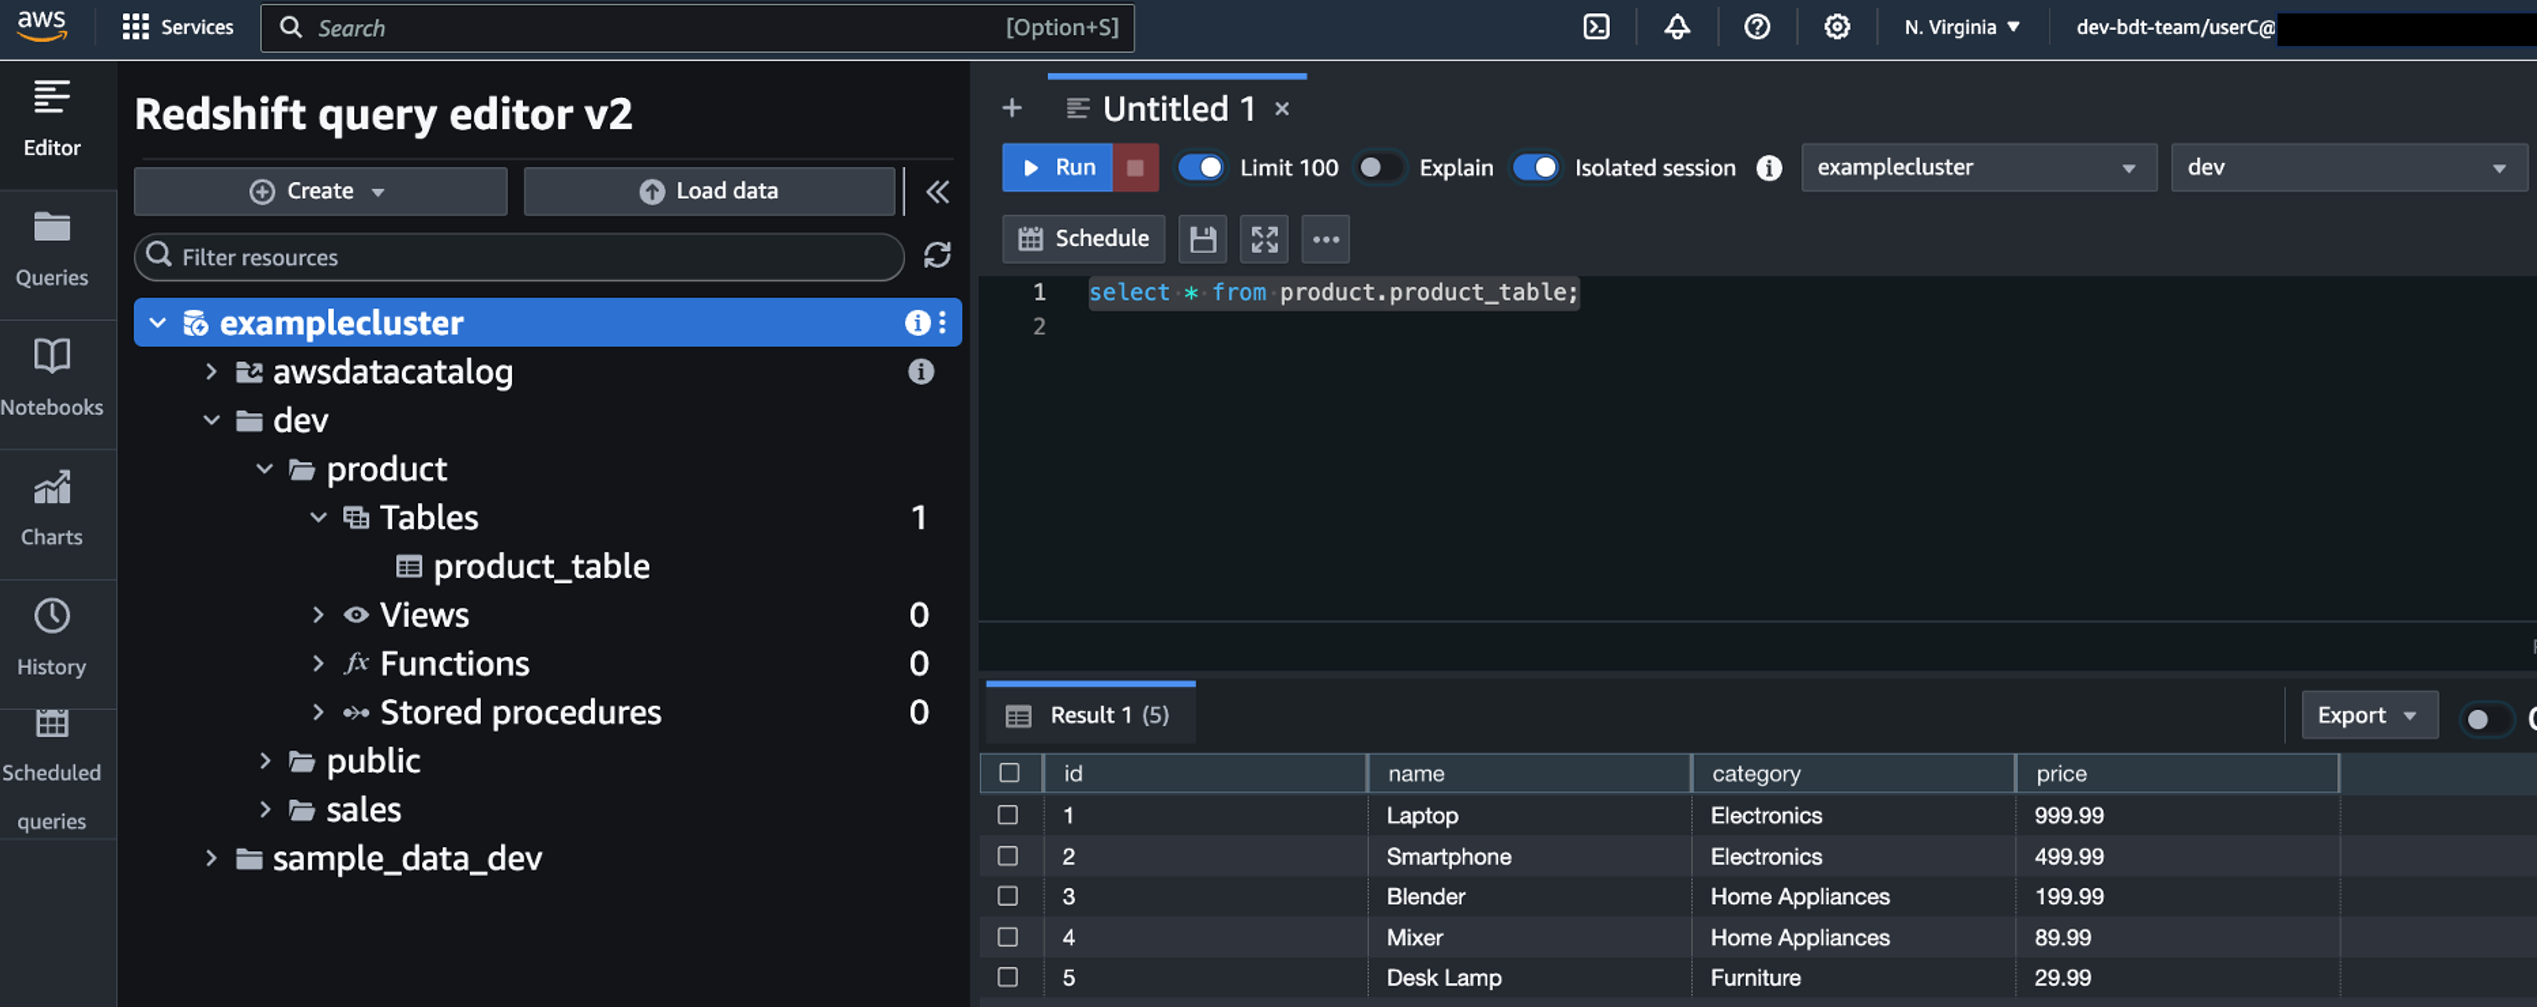

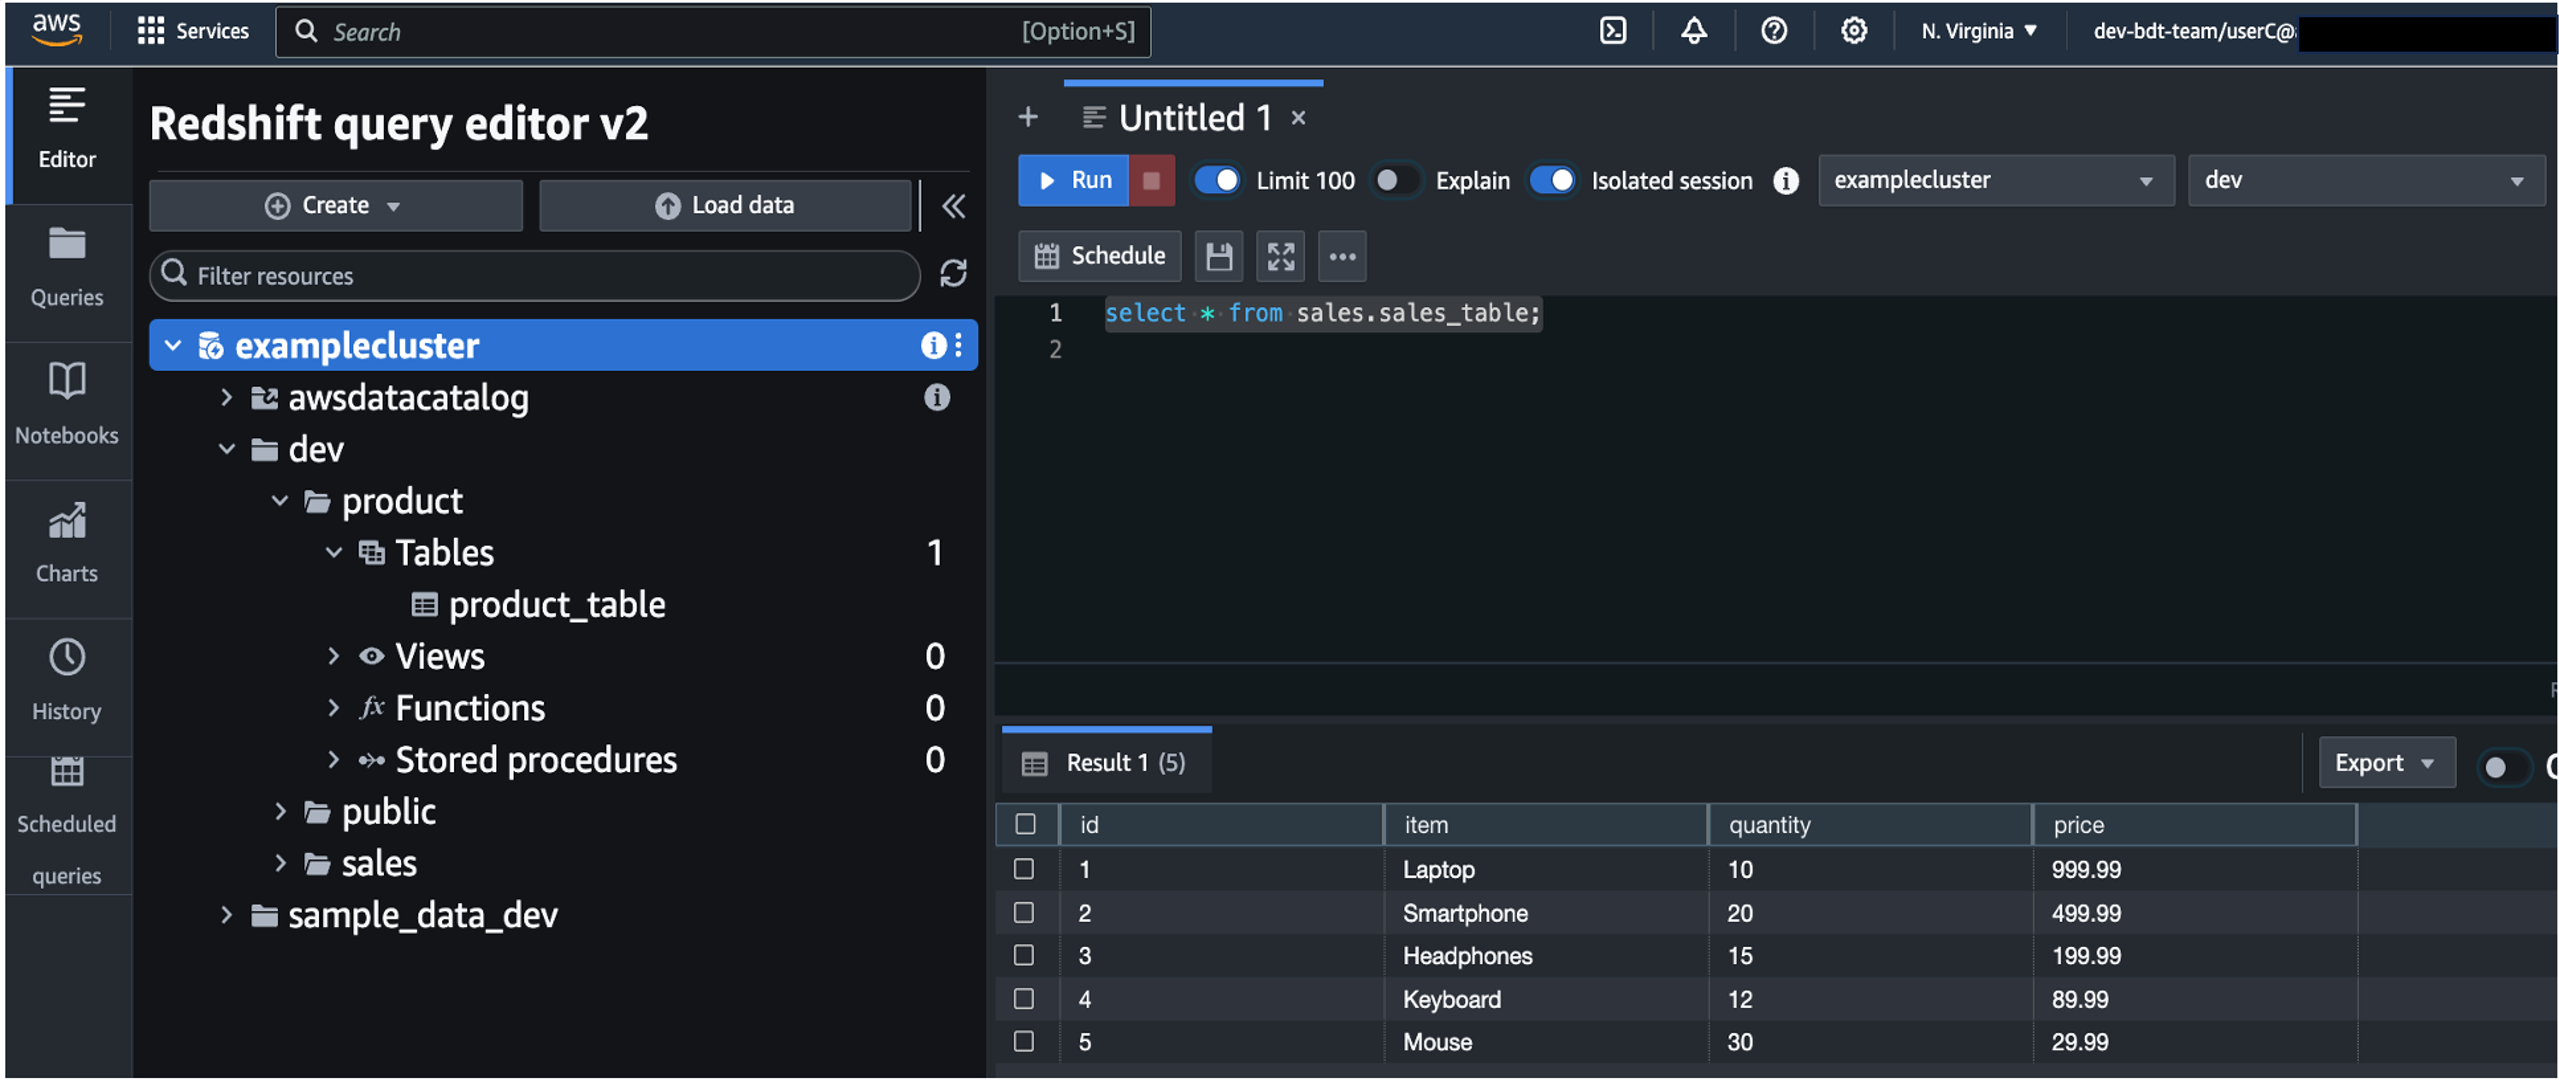
Clean up
To avoid incurring future charges, delete the resources you created, including the Redshift cluster, IAM role, IAM policy, Microsoft Entra ID application, and Azure Functions app.
Conclusion
In this post, we demonstrated how to use Microsoft Entra ID to federate into your AWS account and use the Redshift Query Editor V2 to connect to a Redshift cluster and access the schemas based on the AD groups associated with the user.
About the author
 Koushik Konjeti is a Senior Solutions Architect at Amazon Web Services. He has a passion for aligning architectural guidance with customer goals, ensuring solutions are tailored to their unique requirements. Outside of work, he enjoys playing cricket and tennis.
A change of hats! (Fedora Magazine)
Post Syndicated from jzb original https://lwn.net/Articles/1001634/
Fedora Project Leader (FPL) Matthew Miller writes that he will soon be hanging up the FPL hat:
Stay tuned for a job posting from Red Hat, and details about all
that. I’m hoping we can hire someone awesome early in 2025, and make
the official handover on the release of auspiciously-numbered Fedora
Linux 42.I’m not going to leave Fedora, though. As I said above, although it
might not always feel like it from the outside, Red Hat support for
Fedora is stronger than ever, and I plan on helping that grow even
more. I’m stepping into a full-time management role in the Community
Linux Engineering organization, so Fedora will still be part of my day
job, just in a different way.
[$] A Zephyr-based camera trap for seagrass monitoring
Post Syndicated from jake original https://lwn.net/Articles/998893/
In a session at
Open Source Summit Europe
(OSSEU) back in September, Alex Bucknall gave an overview of a camera “trap”—a
device to capture images in a non-intrusive way—that he helped develop
which is being used to monitor seagrass. He works for
the Arribada Initiative, which is a
non-profit organization
focused on creating open-source technology for studying wildlife and ecosystems.
The camera system uses the Zephyr
realtime operating system (RTOS) on an open platform that is designed to be
inexpensive and usable for multiple applications.
AWS-LC FIPS 3.0: First cryptographic library to include ML-KEM in FIPS 140-3 validation
Post Syndicated from Jake Massimo original https://aws.amazon.com/blogs/security/aws-lc-fips-3-0-first-cryptographic-library-to-include-ml-kem-in-fips-140-3-validation/
 We’re excited to announce that AWS-LC FIPS 3.0 has been added to the National Institute of Standards and Technology (NIST) Cryptographic Module Validation Program (CMVP) modules in process list. This latest validation of AWS-LC introduces support for Module Lattice-Based Key Encapsulation Mechanisms (ML-KEM), the new FIPS standardized post-quantum cryptographic algorithm. This is a significant step towards enhancing the long-term confidentiality of our most sensitive customer workflows, including U.S. federal government communications.
This validation makes AWS LibCrypto (AWS-LC) the first open source cryptographic module to provide post-quantum algorithm support within the FIPS module. Organizations that require FIPS-validated cryptographic modules—such as those operating under FedRAMP, FISMA, HIPAA, and other federal compliance frameworks—can now use these algorithms within AWS-LC.
This announcement is part of the long-term promise made by AWS-LC of continuous validation to obtain new FIPS 140-3 certificates. AWS-LC obtained its first certificate in October 2023 for AWS-LC-FIPS 1.0. A subsequent version of the library, AWS-LC-FIPS 2.0, was certified in October 2024. In this post, we discuss our FIPS-validation of post-quantum cryptographic algorithm ML-KEM, the performance improvements of existing algorithms in AWS-LC FIPS 2.0 and 3.0, and the new algorithm support added for version 3.0. We also discuss how you can use the new algorithms to implement hybrid post-quantum cipher suites, along with configuration options that you can set up today to help protect against future threats.
FIPS post-quantum cryptography
Large-scale quantum computers pose a threat to the long-term confidentiality of the data that we protect under public-key cryptography today. In what’s known as a record-now, decrypt-later attack, an adversary records internet traffic today, capturing key exchanges and encrypted communication. Then, when a sufficiently powerful quantum computer is available, the adversary can retroactively recover shared secrets and encryption keys by solving the underlying hardness problem.
ML-KEM is one of the new key encapsulation mechanisms that’s being standardized by NIST in an effort to protect the uses of public key cryptography from quantum threats. Much like RSA, Diffie-Hellman (DH), or Elliptic-curve Diffie-Hellman (ECDH) key exchange, it works by establishing a shared secret between two parties. However, unlike RSA or DH, ML-KEM bases the key exchange on an underlying problem that is believed to be hard for quantum computers to solve.
Today, we don’t know how to build such a large-scale quantum computer. Significant scientific research is needed before such a computer can be built. However, you can mitigate the risk of record-now, decrypt-later attacks by introducing post-quantum algorithms such as ML-KEM into your key exchange protocols today. We recommend adopting a hybrid key exchange approach that combines a traditional key exchange method—such as ECDH—with ML-KEM to hedge against current and future adversaries. Later in this post, we show you how you can implement hybrid post-quantum cipher suites today to protect against future threats.
AWS-LC FIPS 3.0 includes the ML-KEM algorithm for all three provided parameter sets, ML-KEM-512, ML-KEM-768, and ML-KEM-1024. The three parameter sets provide differing levels of security strength as specified by NIST (see FIPS 203 [9, Sect. 5.6] or the post-quantum security evaluation criteria). ML-KEM-768 is recommended for general-purpose use cases, ML-KEM-1024 is designed for applications that require a higher security level or adherence to explicit directives such as the Commercial National Security Algorithm Suite (CNSA) 2.0 for National Security System owners and operators.
| Algorithm | NIST security category | Public key (B) | Private key (B) | Ciphertext (B) |
| ML-KEM-512 | 1 | 800 | 1632 | 768 |
| ML-KEM-768 | 3 | 1184 | 2400 | 1088 |
| ML-KEM-1024 | 5 | 1568 | 3168 | 1568 |
Table 1. Security strength category, public key, private key, and ciphertext sizes in bytes for the three parameter sets of ML-KEM
Integration with s2n-tls
ML-KEM is now available in our open source TLS implementation, s2n-tls, through hybrid key exchange for TLS 1.3 (draft-ietf-tls-hybrid-design). We’ve also added support for hybrid ECDHE-ML-KEM key agreement for TLS 1.3 (draft-kwiatkowski-tls-ecdhe-mlkem), along with new key share identifiers for Curve x25519 and ML-KEM-768.
For hybrid key establishment in FIPS 140-approved mode, one component algorithm must be a NIST-approved mechanism (detailed in NIST post-quantum FAQs). With ML-KEM added to the list of NIST-approved algorithms, you can now include non-FIPS standardized algorithms like Curve x25519 in hybrid cipher suites. By configuring your TLS cipher suite to use ML-KEM-768 and x25519 (draft-kwiatkowski-tls-ecdhe-mlkem), you can use x25519 within a FIPS-validated cryptographic module for the first time. This can facilitate more efficient key exchange through the highly optimized and functionally verified Curve x25519 implementation provided by AWS-LC.
New algorithms and new implementations
Two integral parts of our commitment to continuous validation of AWS-LC FIPS are to include new algorithms as approved cryptographic services and new implementations of existing algorithms that provide performance improvements and functional correctness.
New algorithms
We’re committed to continually validating new algorithms so that builders can adopt FIPS-validated cryptography by including the latest revisions of approved cryptographic algorithms and supporting new primitives. Validating new algorithms in their latest standardized revision helps ensure that our cryptographic tool-kit is providing high-assurance implementations that achieve compliance with globally recognized standards.
In AWS-LC FIPS 3.0 we’ve added the latest member of the Secure Hash Algorithm standard SHA-3 to the module. The SHA-3 family is a cryptographic primitive used to support a variety of algorithms. In AWS-LC FIPS 3.0, we’ve integrated ECDSA and RSA signature generation and verification with SHA-3 and within the post-quantum algorithm ML-KEM. In AWS-LC, ML-KEM calls into our FIPS-validated SHA-3 functions, which provide optimized implementations of SHA-3 and SHAKE hashing procedures. This means that as we continually refine and optimize our AWS-LC SHA-3 implementation, we’ll continue to see performance increases across algorithms that use the primitive, such as ML-KEM.
EdDSA is a digital signature algorithm based on elliptic curves using the curve Ed25519. It was added to NIST’s updated Digital Signature Standard (DSS), FIPS 186-5. This signature algorithm is now offered as part of the AWS-LC 3.0 FIPS module. For key agreement, the Single-step Key Derivation Function (SSKDF) used to derive keys from a shared secret (SP 800-56Cr2) is available both in the digest-based and HMAC-based specifications. It can be used, for example, to derive a key from a shared secret produced by KMS when using ECDH. Further keys can be derived from that original key using a Key-based Key Derivation Function (KBKDF)—SP 800-108r1—which is available using a counter-mode based on HMAC.
Performance improvements
We focused on increasing the performance of public-key cryptography algorithms widely used in transport protocols such as the TLS protocol. For example, RSA signatures on Graviton2 are 81 percent faster for bit-length 2048, 33 percent for 3072, and 94 percent for 4096, with added formal verification of functional correctness of the main operation. Using Intel’s AVX512 Integer Fused Multiply Add (IFMA) instructions—available starting from 3rd Gen Intel Xeon—Intel developers contributed an RSA implementation that employs these instruction and the wide AVX512 registers, which are twice as fast as the existing implementation.
We increased throughput for EdDSA signing by an average of 108 percent and for verifying by 37 percent. This average is taken over three environments: Graviton2, Graviton3, and Intel Ice Lake (Intel Xeon Platinum 8375C CPU). This boost in performance is achieved by integrating assembly implementations of the core operation for each target from the s2n-bignum library. That, in addition to the careful constant-time implementation of the core operations, is how each one has been proven to be functionally correct.
In Figure 1 that follows, we highlight the percentage of performance improvements compared to AWS-LC FIPS 1.0 in versions 2.0 and 3.0. The improvements achieved in 2.0 are maintained in 3.0 and are not repeated in the graph. The graph also includes symmetric-key improvements. In AES-256-GCM, which is widely used in TLS to encrypt the communication after the session has been established, the increase is on average 115 percent across Intel Ice Lake and Graviton4 to encrypt a 16 KB message. In AES-256-XTS, which is used in disk storage, encrypting a 256 B input is 360 percent faster on Intel Ice Lake and 90 percent faster on Graviton4.

Figure 1: Graph of performance improvements in versions 2.0 and 3.0 of AWS-LC FIPS
How to use ML-KEM today
You can configure both s2n-tls and AWS-LC TLS libraries to enable hybrid post-quantum security with ML-KEM today by enabling X25519MLKEM768 and SecP256r1MLKEM768 for key exchange. We’ve integrated support for both of these hybrid algorithms in AWS-LC libssl and s2n-tls using each library’s exisiting TLS configuration APIs. To negotiate a TLS connection, use one of the following commands:
# AWS-LC Client CLI Example
./aws-lc/build/tool/bssl s_client -curves X25519MLKEM768:SecP256r1MLKEM768:X25519 -connect <hostname>:<port>
# S2N-tls Client CLI Example
./s2n/build/bin/s2nc -c default_pq -i <hostname> <port>Conclusion
In this post, we described the ongoing development, optimization, and validation of the cryptography that we provide to our customers and products through our open source cryptographic library, AWS-LC. We introduced the addition of FIPS-validated post-quantum algorithms and provided configuration options to begin using these algorithms today to protect against future threats.
AWS-LC-FIPS 3.0 is part of our commitment to continually validate new versions of AWS-LC as we add new algorithms within the FIPS boundary as they become specified, and as we raise the performance and formal verification bar on existing algorithms. Through this commitment, we continue to support the wider developer community of Rust, Java and Python developers by providing integrations into the AWS Libcrypto for Rust (aws-lc-rs) and ACCP 2.0 libraries. We facilitate integration into CPython so that you can build against AWS-LC and use it for all cryptography in the Python standard library. We enabled rustls to provide FIPS support.
If you have feedback about this post, submit comments in the Comments section below. If you have questions about this post, contact AWS Support.