Post Syndicated from Explosm.net original https://explosm.net/comics/third-person
New Cyanide and Happiness Comic
Post Syndicated from Explosm.net original https://explosm.net/comics/third-person
New Cyanide and Happiness Comic
Post Syndicated from Ryan Smith original https://www.servethehome.com/meta-talks-world-lock-rendering-for-ar-mr-at-hot-chips-2025/
The final graphics-related talk of the day comes from Meta, who has perhaps the most novel presentation on the graphics track. Rather than talking about GPU architectures that have already been shipping to customers for several months, Meta’s ex-Oculus headset division is at the show to talk about using dedicated ICs for accelerating world-locked rendering […]
The post Meta Talks World-Lock Rendering for AR/MR at Hot Chips 2025 appeared first on ServeTheHome.
Post Syndicated from Ryan Smith original https://www.servethehome.com/nvidia-geforce-rtx-5090-and-the-age-of-neural-rendering-at-hot-chips-2025/
The second presentation on today’s graphics track comes from NVIDIA. Like AMD, NVIDIA is mid-cycle on its current generation of graphics products, having launched the first of them back in late 2024. As a result, their Hot Chips presentation is more of a recap, with a focus on what the Blackwell architecture offers for graphics […]
The post NVIDIA GeForce RTX 5090 and the Age of Neural Rendering at Hot Chips 2025 appeared first on ServeTheHome.
Post Syndicated from Ryan Smith original https://www.servethehome.com/amd-rdna-4-gpu-architecture-at-hot-chips-2025/
Kicking off this afternoon’s graphics track at Hot Chips 2025 is AMD. The company launched its RDNA 4 architecture and associated Radeon RX 9000 series video cards earlier this year, releasing two GPUs thus far. As AMD is now well into this generation of Radeon GPUs, the company doesn’t necessarily have any grand revelations to […]
The post AMD RDNA 4 GPU Architecture at Hot Chips 2025 appeared first on ServeTheHome.
Post Syndicated from Venugopalan Vasudevan original https://aws.amazon.com/blogs/devops/accelerating-legacy-code-modernization-epams-journey-with-amazon-q-developer/
This post is co-written with Nazariy Popov, Volodymyr Konchuk, and Andrii Davydenko from EPAM
Legacy code modernization presents significant challenges for organizations looking to stay competitive in today’s rapidly evolving digital landscape. Organizations face the dual challenge of maintaining business continuity while modernizing their legacy systems for cloud environments. This transformation requires organizations to carefully navigate between preserving essential business logic and implementing modern architectural patterns. This is where AI-powered development tools can make a transformative impact, as demonstrated in EPAM’s recent legacy modernization project using Amazon Q Developer.
Amazon Q Developer, an AI code assistant, seamlessly integrates into the development pipeline to address these challenges. This innovative AI code assistant helps teams tackle various tasks, from generating new features, automating language upgrades, and refactoring legacy code to fixing bugs and automating deployments. By providing detailed explanations for its code suggestions while maintaining high quality standards, Amazon Q Developer significantly improves developer efficiency across the entire software development lifecycle, resulting in substantial time and effort savings.
EPAM, an AWS Premier Partner, collaborated with one of their customers to modernize their legacy applications to AWS Cloud. The modernization initiative focused on multiple business-critical applications, primarily built in Java 8 with Oracle Database backend.
In this post, you’ll learn how Amazon Q Developer helped EPAM engineers transform these complex legacy systems into modern cloud-native architectures on AWS. The tool enabled the team to autonomously perform a range of tasks—from implementing new microservices and documenting code to testing, reviewing, and refactoring Java code, as well as performing critical platform upgrades.
Before diving into the details, here’s an overview of how Amazon Q Developer helped EPAM across various aspects of the modernization project:
Summary of Amazon Q Developer Use Cases in EPAM’s Modernization Journey:
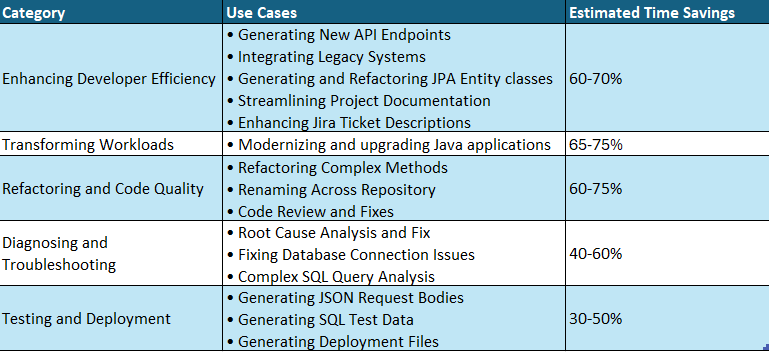
Let’s explore each of these areas in detail.
Amazon Q Developer played a crucial role in boosting EPAM’s development productivity. By automating routine tasks and providing intelligent code suggestions, the tool enabled developers to focus on more strategic aspects of the modernization project. Let’s explore how EPAM leveraged these capabilities.
Creating new API endpoints traditionally requires developers to invest 1-2 days per endpoint, involving multiple steps from designing the API contract to writing unit tests and documentation. Using Amazon Q Developer, the team dramatically accelerated this process for three new API endpoints in an existing microservice. Q Developer efficiently generated the initial code implementation along with comprehensive unit test coverage, requiring only minor modifications such as renaming variables, enhancing error handling, and refining test cases. The unit tests generated proved remarkably reliable with minimal adjustments needed. Along with this, Q Developer also generated comprehensive comments/documentation of the code improving the maintainability. This reduced the total development time to just 4 hours for all three endpoints – a 70% time saving compared to the traditional approach, allowing developers to focus on fine-tuning business logic rather than writing boilerplate code.
Integrating a legacy monolith application with modern microservices traditionally requires developers to manually write extensive integration code, taking 1-2 weeks per integration point. Amazon Q Developer accelerated this process by automatically generating REST API client code in the monolith to consume microservice endpoints, along with data transfer objects (DTOs), error handling, and retry logic with integration test templates. While developers still needed to validate business rules and fine-tune error scenarios, Q Developer’s ability to understand both the legacy monolith’s structure and modern microservice patterns reduced the integration time to 2-3 days per integration point – a 70% time saving. This significantly streamlined the integration process while maintaining the robustness required for production systems.
During the modernization effort, new database tables were required to support additional business functionality in both the monolith and microservices. Instead of manually coding the data access layer, Amazon Q Developer automated the process by generating Spring JPA Entity classes from SQL DDL statements. Amazon Q Developer maintained consistency with existing data models by following established naming conventions, applying standard annotations, and implementing required interfaces from the existing codebase. What stood out was Q Developer’s ability to provide detailed explanations for its implementation choices, such as why specific annotations were used or how the new entities aligned with existing persistence patterns, enabling the team to quickly validate the generated code against their architectural standards. Amazon Q Developer generated the complete Java Spring entity class with all the fields. Additionally, Amazon Q Developer refactored the Entity class as well.
Creating and maintaining up-to-date project documentation is often a time-consuming task for developers. Amazon Q Developer simplified this process by assisting in the generation of README files for the team’s projects. By analyzing the project structure, dependencies, and key components, Q Developer produced initial drafts of README files that included project overviews, setup instructions, and API documentation. This allowed developers to quickly review and refine the documentation, ensuring it met team standards while saving significant time compared to writing everything from scratch.
Writing detailed, informative Jira ticket descriptions can be a challenge, especially for complex features or bug fixes. Amazon Q Developer aided the team by suggesting detailed descriptions for Jira tickets based on the context of the code changes and related discussions. For example, when creating a ticket for a new feature, Q Developer could propose a description that included the feature’s purpose, key implementation details, and potential impact on other system components. While developers still needed to review and adjust these descriptions, the AI-generated starting point significantly reduced the time spent on ticket management, allowing the team to focus more on actual development work.
Moving legacy applications to the cloud requires careful planning and execution. EPAM utilized Amazon Q Developer’s Java upgrade capabilities to streamline the transformation of monolithic applications into modern, cloud-native architectures. Here’s how the Amazon Q Developer facilitated this process.
Amazon Q Developer assisted in upgrading older Java applications to Java 21 to leverage modern features like Java Streams API and adapting it for Spring Boot tech stack. It not only upgraded the code, but also updated deprecated code components, dependencies and libraries as well. This modernization improved the code’s performance and also aligned it with the current best practices adopted by the development teams. For large monolithic applications, breaking/decomposing the monolith into logical groups while identifying and separating common modules as shared dependencies helped break down the problem into manageable pieces for the agent to do a better job, resulting in a more maintainable and modular structure for the transformation process. This modular approach significantly enhanced Q Developer’s ability to analyze and transform the codebase while reducing the complexity of the modernization effort.
One of the most challenging aspects of modernization is refactoring legacy code and maintaining high code quality standards. Amazon Q Developer assisted EPAM’s team in analyzing complex codebases and suggesting improvements, optimizing the code while preserving business logic and ensuring consistent code quality. The following examples demonstrate this capability in action.
Legacy code often includes methods with high cyclomatic complexity, making them difficult to maintain. Amazon Q Developer helped the development team refactor large, complex methods into smaller, more readable, and better-structured methods. It also provided a detailed explanation of the changes, highlighting how the refactored code improved maintainability and readability.
When tasked with renaming ‘YTD Tax Report‘ to ‘Withholding Tax Report‘ across the entire repository, Amazon Q Developer demonstrated capabilities beyond simple search and replace functionality found in traditional IDEs. It performed context-aware renaming, distinguishing between instances where ‘YTD Tax Report‘ was part of larger phrases or variable names, while simultaneously updating related components including unit tests, integration tests, and logging statements. The tool intelligently refactored method signatures where the report name was part of method names or parameters, analyzed and updated database queries, and maintained consistency across different file types including Java, XML, and properties files. What set Q Developer apart was its ability to provide detailed change logs explaining each modification and the rationale behind more complex refactoring decisions, significantly reducing the risk of missed references or inconsistencies that often occur with manual search-and-replace operations.
The code review capabilities of Amazon Q Developer, seamlessly integrated into the IDE, enabled the development team to detect potential issues spanning multiple classes. Beyond merely identifying problems, Q Developer provided actionable fix recommendations that could be easily reviewed and implemented. This proactive approach to code quality allowed the team to address issues during the early stages of development, significantly reducing the likelihood of defects making their way to production environments.
Quick error resolution is crucial for maintaining development momentum. Amazon Q Developer’s advanced error analysis capabilities helped EPAM’s team identify and fix issues efficiently, reducing debugging time significantly. Here are some examples of how this worked in practice.
During the development phase, the team encountered an unexpected error in one of the Java services: java.lang.IllegalArgumentException: Property 'http://javax.xml.XMLConstants/property/accessExternalDTD' is not recognized. Q Developer conducted a deeper analysis based on the context provided and suggested a more targeted fix and generated the necessary Java code changes, provided unit tests to verify the fix, and outlined potential security implications of the change. This comprehensive solution not only resolved the immediate error but also improved the overall security posture of the XML processing in the application. The team was able to implement and verify the fix within minutes, significantly reducing development.
While troubleshooting an issue where the application became unresponsive due to JDBC connection problems, Amazon Q Developer analyzed the project code and identified the missing connection pool configuration. Q Developer suggested implementing essential connection pool parameters like 'maximumPoolSize=20' and 'connectionTimeout=30000' based on the application’s traffic patterns and code. After implementing its suggested configuration, the issue was resolved, significantly improving the application’s stability.
Debugging complex SQL queries constructed dynamically in Java code can be challenging. Amazon Q Developer analyzed such queries, broke them down into their component parts, and provided descriptions for query parameters. For instance, when presented with a complex query involving multiple joins and subqueries, Q Developer dissected it into logical blocks, explaining how each part contributed to the overall result set. This made it easier for the team to understand and debug the queries.
When testing new APIs, Amazon Q Developer generated JSON request bodies based on the corresponding Java classes. It provided detailed descriptions of each field and suggested realistic and meaningful default values, making it easier to validate API functionality with real-world scenarios.
Amazon Q Developer generated SQL insert statements with test data based on our existing Java Entity classes. This automation saved us a significant amount of time in creating realistic test data for database validation and integration testing.
Amazon Q Developer helped the development team generate essential deployment artifacts, including a Docker file, a startup shell script that was used as an entry point, and a Kubernetes deployment file for a new service. Automating this process not only saves time but also improves consistency across environments.
EPAM’s experience with Amazon Q Developer has been transformative, significantly accelerating their application modernization efforts while maintaining high code quality. By leveraging Amazon Q Developer, EPAM reduced development time by approximately 70% and improved code quality metrics across the client’s portfolio. This efficiency gains not only accelerated the client’s cloud migration timeline but also resulted in substantial cost savings and faster time-to-market for new features.
Now, it’s your turn to explore Amazon Q Developer:
Schedule a demo: Experience firsthand how Amazon Q Developer can accelerate your development lifecycle. Connect with our team for a personalized demonstration tailored to your specific use case.
Start Your Proof of Concept: Begin your journey with Amazon Q Developer today through a proof of concept. See how it can enhance your team’s productivity and code quality, just as it did for EPAM.
Connect with EPAM: Learn more about EPAM’s success story and best practices for implementing Amazon Q Developer in your organization’s development workflow.
Take the next step in revolutionizing your development process. Visit Amazon Q Developer website or contact your AWS account team to get started.
EPAM
 |
Nazariy Popov, Delivery Head of GenAI Engineering and Modernization Practice Delivery management professional and technology leader with over 15 years of experience in the IT industry. At EPAM, he drives large-scale transformation programs, focusing on enterprise software development, cloud solutions, and AI assisted engineering and modernization. |
 |
Volodymyr Konchuk, Lead Software Engineer Java engineer with more than 11 years of production experience in Java-based web and enterprise applications. Has experience in building ecommerce and retail business applications using Java, Spring tech stack, and Amazon Web Services. |
 |
Andrii Davydenko, Delivery Manager |
AWS
 |
Venugopalan Vasudevan (Venu) is a Senior Specialist Solutions Architect focusing on Next Generation Developer Experience and AWS Generative AI services. In this role, Venu, helps organizations optimize their development processes and accelerate their digital transformation journeys using Amazon Q Developer and other AWS Generative AI Services. Also, Venu partners with enterprises to architect and implement Generative AI solutions while establishing robust development practices. |
 |
Arun Chandapillai is a Senior Engineering Architect with a strong history of leading cross-functional teams and collaborating with executive stakeholders. He is passionate about helping customers accelerate IT modernization through business-first cloud adoption strategies, with a focus on leveraging generative AI and MLOps. Outside of technology, he is an automotive enthusiast who loves the thrill of the open road, an engaging public speaker, and a philanthropist who lives by the motto ‘you get (back) what you give’. |
 |
Jasmine Rasheed Syed is a Senior Customer Solutions manager, focused in accelerating time to value for the customers in their in cloud journey by adopting best practices and mechanisms to transform their business at scale. Jasmine is a seasoned, result oriented leader with 20+ years of progressive experience in Insurance, Retail & CPG with exemplary track record spanning across Business Development, Cloud/Digital Transformation, Delivery, Operational & Process Excellence and Executive Management. |
 |
Oscar Hernandez is a Senior Account Executive, helping global organizations drive digital and AI transformation at scale. He works closely with executive teams to integrate cloud and AI-driven solutions that address complex business challenges and deliver measurable enterprise-wide impact. With over 15 years of experience across IT, telecom, financial services, retail, and HR technology, he focuses on enabling innovation, optimizing operations, and maximizing the value of emerging technologies. |
Post Syndicated from Patrick Kennedy original https://www.servethehome.com/microsoft-azure-hardware-security-to-help-thwart-the-worlds-3rd-largest-gdp/
At Hot Chips 2025, Microsoft went into its Azure Hardware Security that it uses to help keep its cloud services secure
The post Microsoft Azure Hardware Security to Help Thwart the World’s 3rd Largest GDP appeared first on ServeTheHome.
Post Syndicated from Explosm.net original https://explosm.net/comics/blindness
New Cyanide and Happiness Comic
Post Syndicated from Ryan Smith original https://www.servethehome.com/intel-xeon-clearwater-forest-with-288-cores-on-intel-18a-at-hot-chips-2025/
At Hot Chips 2025, Intel went into its next-gen 288 core processor constructed on Intel 18A process and using 3D packaging technology
The post Intel Xeon Clearwater Forest with 288 Cores on Intel 18A at Hot Chips 2025 appeared first on ServeTheHome.
Post Syndicated from Ryan Smith original https://www.servethehome.com/ibms-power11-processor-architecture-at-hot-chips-2025/
Third up on today’s CPU track is IBM. Big Blue is at the conference to talk about its latest generation Power architecture chip, the Power11. IBM starts off by recapping Power. Why it exists, and what IBM’s goals are for the processor and architecture. IBM is very system-focused, rather than focusing on selling just CPUs. […]
The post IBM’s Power11 Processor Architecture at Hot Chips 2025 appeared first on ServeTheHome.
Post Syndicated from Ankur Bhanawat original https://aws.amazon.com/blogs/big-data/best-practices-for-migrating-teradata-bteq-scripts-to-amazon-redshift-rsql/
When migrating from Teradata BTEQ (Basic Teradata Query) to Amazon Redshift RSQL, following established best practices helps ensure maintainable, efficient, and reliable code. While the AWS Schema Conversion Tool (AWS SCT) automatically handles the basic conversion of BTEQ scripts to RSQL, it primarily focuses on SQL syntax translation and basic script conversion. However, to achieve optimal performance, better maintainability, and full compatibility with the architecture of Amazon Redshift, additional optimization and standardization are needed.
The best practices that we share in this post complement the automated conversion supplied by AWS SCT by addressing areas such as performance tuning, error handling improvements, script modularity, logging enhancements, and Amazon Redshift-specific optimizations that AWS SCT might not fully implement. These practices can help you transform automatically converted code into production-ready, efficient RSQL scripts that fully use the capabilities of Amazon Redshift.
BTEQ is Teradata’s legacy command-line SQL tool that has served as the primary interface for Teradata databases since the 1980s. It’s a powerful utility that combines SQL querying capabilities with scripting features; you can use it to perform various tasks from data extraction and reporting to complex database administration. BTEQ’s robustness lies in its ability to handle direct database interactions, manage sessions, process variables, and execute conditional logic while providing comprehensive error handling and report formatting capabilities.
RSQL is a modern command-line client tool provided by Amazon Redshift and is specifically designed to execute SQL commands and scripts in the AWS ecosystem. Similar to PostgreSQL’s psql but optimized for the unique architecture of Amazon Redshift, RSQL offers seamless SQL query execution, efficient script processing, and sophisticated result set handling. It stands out for its native integration with AWS services, making it a powerful tool for modern data warehousing operations.
The transition from BTEQ to RSQL has become increasingly relevant as organizations embrace cloud transformation. This migration is driven by several compelling factors. Businesses are moving from on-premises Teradata systems to Amazon Redshift to take advantage of cloud benefits. Cost optimization plays a crucial role in these moves, because Amazon Redshift typically offers more economical data warehousing solutions with its pay-as-you-go pricing model.
Furthermore, organizations want to modernize their data architecture to take advantage of enhanced security features, better scalability, and seamless integration with other AWS services. The migration also brings performance benefits through columnar storage, parallel processing capabilities, and optimized query performance offered by Amazon Redshift, making it an attractive destination for enterprises looking to modernize their data infrastructure.
Let’s explore key practices across code structure, performance optimization, error handling, and Redshift-specific considerations that will help you create robust and efficient RSQL scripts.
Parameters in RSQL function as variables that store and pass values to your scripts, similar to BTEQ’s .SET VARIABLE functionality. Instead of hardcoding schema names, table names, or configuration values directly in RSQL scripts, use dynamic parameters that can be modified for different environments (dev, test, prod). This approach reduces manual errors, simplifies maintenance, and supports better version control by keeping sensitive values separate from code.
Create a separate shell script containing environment variables:
Then import these parameters into your RSQL scripts using:
For better security and maintainability, use JDBC or ODBC temporary AWS Identity and Access Management (IAM) credentials for database authentication. For details, see Connect to a cluster with Amazon Redshift RSQL.
Debugging and troubleshooting SQL scripts can be challenging, especially when dealing with complex queries or error scenarios. To simplify this process, it’s recommended to enable query logging in RSQL scripts.
RSQL provides the echo-queries option, which prints the executed SQL queries along with their execution status. By invoking the RSQL client with this option, you can track the progress of your script and identify potential issues.
rsql --echo-queries -D testiam
Here testiam represents a DSN connection configured in odbc.ini with an IAM profile.
You can store these logs by redirecting the output when executing your RSQL script:
With query logging is enabled, you can examine the output and identify the specific query that caused an error or unexpected behavior. This information can be invaluable when troubleshooting and optimizing your RSQL scripts.
Implement robust error handling using incremental exit codes to identify specific failure points. Proper error handling is crucial in a scripting environment, and RSQL is no exception. In BTEQ scripts, errors were typically handled by checking the error code and taking appropriate actions. However, in RSQL, the approach is slightly different. To help ensure robust error handling and straightforward troubleshooting, it’s recommended that you implement incremental exit codes at the end of each SQL operation.The incremental exit code approach works as follows:
SELECT, INSERT, UPDATE, and so on.), check the value of the :ERROR variable.:ERROR variable is non-zero, it indicates that an error occurred during the execution of the SQL statement.\echo, \remark, and so on.\exit command, where the exit code represents the specific operation that failed.By using incremental exit codes, you can identify the point of failure within the script. This approach not only aids in troubleshooting but also allows for better integration with continuous integration and deployment (CI/CD) pipelines, where specific exit codes can trigger appropriate actions.
Example:
In the preceding example, if the SELECT statement fails, the script will exit with an exit code of 1. If the INSERT statement fails, the script will exit with an exit code of 2. By using unique exit codes for different operations, you can quickly identify the point of failure and take appropriate actions.
When troubleshooting issues in your RSQL scripts, it can be helpful to identify the root cause by analyzing query logs. By using query groups, you can label a group of queries that are run during the same session, which can help pinpoint problematic queries in the logs.
To set a query group at the session level, you can use the following command:
set query_group to $QUERY_GROUP;
By setting a query group, queries executed within that session will be associated with the specified label. This technique can significantly aid in effective troubleshooting when you need to identify the root cause of an issue.
When creating an RSQL script that refers to tables from the same schema multiple times, you can simplify the script by setting a search path. By using a search path, you can directly reference table names without specifying the schema name in your queries (for example, SELECT, INSERT, and so on).
To set the search path at the session level, you can use the following command:
After setting the search path to $STAGING_TABLE_SCHEMA, you can refer to tables within that schema directly, without including the schema name.
For example:
If you haven’t set a search path, you need to specify the schema name in the query, as shown in the following example:
It’s recommended to use a fully qualified path for an object in an RSQL script, but adding the search path prevents abrupt execution failure because of not providing a fully qualified path.
In BTEQ scripts, it might have multiple sequential UPDATE statements for the same table. However, this approach can be inefficient and lead to performance issues, especially when dealing with large datasets, because of I/O intensive operations.
To address this concern, it’s recommended to combine all or some of the UPDATE statements into a single INSERT statement. This can be achieved by creating a temporary table, converting the UPDATE statements into a LEFT JOIN with the staging table using a SELECT statement, and then inserting the temporary table data into the staging table.
Example:
The existing BTEQ SQLs in the following example first INSERT the data into staging_table from staging_table1 and then UPDATE the columns for inserted data if certain condition is satisfied:
The following RSQL operation below achieves the same result by first loading the data into a staging table, then executing the UPDATE using a temporary table as an intermediate step and then completes UPDATE using a temporary table. After this, it will truncate staging_tables and insert temporary table staging_table_temp1 data into staging_table.
The following is an overview of the preceding logic:
INSERT statement that combines the logic of all the UPDATE statements from the BTEQ script. The INSERT statement uses a LEFT JOIN to merge data from the staging table and the staging_table2 table, applying the necessary transformations and conditions.By consolidating multiple UPDATE statements into a single INSERT operation, you can improve the overall performance and efficiency of the script, especially when dealing with large datasets. This approach also promotes better code readability and maintainability.
Troubleshooting and debugging scripts can be a challenging task, especially when dealing with complex logic or error scenarios. To aid in this process, it’s recommended to generate execution logs for RSQL scripts.
Execution logs capture the output and error messages produced during the script’s execution, providing valuable information for identifying and resolving issues. These logs can be especially helpful when running scripts on remote servers or in automated environments, where direct access to the console output might be limited.
To generate execution logs, you can execute the RSQL script from the Amazon Elastic Compute Cloud (Amazon EC2) machine and redirect the output to a log file using the following command:
The preceding command executes the RSQL script and redirects the output, including error messages or debugging information to the specified log file. It’s recommended to add a time parameter in the log file name to have distinct files for each run of RSQL script.
By maintaining execution logs, you can review the script’s behavior, track down errors, and gather relevant information for troubleshooting purposes. Additionally, these logs can be shared with teammates or support teams for collaborative debugging efforts.
Audit parameters such as start time, end time, and the exit code of an RSQL script are important for troubleshooting, monitoring, and performance analysis. You can capture the start time at the beginning of your script and the end time and exit code after the script completes.
Here’s an example of how you can implement this:
The preceding example captures the start time in start= $(date +%s). After the RSQL code is complete, it captures the exit code in rsqlexitcode=$? and the end time in end=$(date +%s).
The following is a sample RSQL script that follows the best practices outlined in the preceding sections:
In this post, we’ve explored crucial best practices for migrating Teradata BTEQ scripts to Amazon Redshift RSQL. We’ve shown you essential techniques including parameter management, secure credential handling, comprehensive logging, and robust error handling with incremental exit codes. We’ve also discussed query optimization strategies and methods that you can use to improve data modification operations. By implementing these practices, you can create efficient, maintainable, and production-ready RSQL scripts that fully use the capabilities of Amazon Redshift. These approaches not only help ensure a successful migration, but also set the foundation for optimized performance and straightforward troubleshooting in your new Amazon Redshift environment.
To get started with your BTEQ to RSQL migration, explore these additional resources:
 Ankur Bhanawat is a Consultant with the Professional Services team at AWS based out of Pune, India. He’s an AWS certified professional in three areas and specialized in databases and serverless technologies. He has experience in designing, migrating, deploying, and optimizing workloads on the AWS Cloud.
 Raj Patel is AWS Lead Consultant for Data Analytics solutions based out of India. He specializes in building and modernizing analytical solutions. His background is in data warehouse architecture, development, and administration. He has been in data and analytical field for over 14 years.
Post Syndicated from Ryan Smith original https://www.servethehome.com/pezy-computings-pezy-sc4s-a-mimd-many-core-architecture-at-hot-chips-2025/
Second on today’s Hot Chip 2025 CPU track is Pezy Computing, the quirky Japanese CPU development firm who specializes in Multiple Instructions Multiple Data (MIMD) CPU designs. MIMD is an old concept in CPU design, but it’s not a CPU design we see too much of in the real world. Most designs are variations on […]
The post Pezy Computing’s PEZY-SC4s, A MIMD Many-Core Architecture at Hot Chips 2025 appeared first on ServeTheHome.
Post Syndicated from The Atlantic original https://www.youtube.com/shorts/tncDRVhIffQ
Post Syndicated from Ryan Smith original https://www.servethehome.com/condor-computings-cuzco-a-high-perf-risc-v-design-at-hot-chip-2025/
Hot Chips, the semiconductor industry’s leading conferences on high-performance microprocessors and related integrated circuits is taking place this week. Living up to its name, the show offers a rather deep look at some of the latest and hottest chips in the industry, from smaller vendors specializing in RISC-V all the way up to the big […]
The post Condor Computing’s Cuzco, a High-Perf RISC-V Design at Hot Chip 2025 appeared first on ServeTheHome.
Post Syndicated from Betty Zheng (郑予彬) original https://aws.amazon.com/blogs/aws/aws-weekly-roundup-amazon-aurora-10th-anniversary-amazon-ec2-r8-instances-amazon-bedrock-and-more-august-25-2025/
As I was preparing for this week’s roundup, I couldn’t help but reflect on how database technology has evolved over the past decade. It’s fascinating to see how architectural decisions made years ago continue to shape the way we build modern applications. This week brings a special milestone that perfectly captures this evolution in cloud database innovation as Amazon Aurora celebrated 10 years of database innovation.

Amazon Web Services (AWS) Vice President Swami Sivasubramanian reflected on LinkedIn about his journey with Amazon Aurora, calling it “one of the most interesting products” he’s worked on. When Aurora launched in 2015, it shifted the database landscape by separating compute and storage. Now trusted by hundreds of thousands of customers across industries, Aurora has grown from a MySQL-compatible database to a comprehensive platform featuring innovations such as Aurora DSQL, serverless capabilities, I/O-Optimized pricing, zero-ETL integrations, and generative AI support. Last week’s celebration on August 21 highlighted this decade-long transformation that continues to simplify database scaling for customers.
Last week’s launches
In addition to the inspiring celebrations, here are some AWS launches that caught my attention:
Other AWS news
Here are some additional projects and blog posts that you might find interesting:
Upcoming AWS events
Check your calendars and sign up for these upcoming AWS events:
Join the AWS Builder Center to learn, build, and connect with builders in the AWS community. Browse here for upcoming in-person and virtual developer-focused events.
That’s all for this week. Check back next Monday for another Weekly Roundup!
– Betty
Post Syndicated from LastWeekTonight original https://www.youtube.com/shorts/eP5vqvGLC1I
Post Syndicated from jzb original https://lwn.net/Articles/1034959/
The PyCon team has announced
that all PyCon US 2025 recordings are now available on its
YouTube channel.
We had an amazing and diverse group of community members join us for
PyCon US 2025, attending from 58 different countries! By the numbers,
we welcomed a total attendance of 2,225 Pythonistas to the David
L. Lawrence Convention Center. We couldn’t be more grateful for all
who supported the Python ecosystem and helped make PyCon US 2025 a
huge success.
See the LWN
conference index for coverage of some of the talks from
PyCon US 2025.
Post Syndicated from John Lee original https://www.servethehome.com/nvidia-jetson-agx-thor-developer-kit-blackwell-for-robotics/
We check out the new NVIDIA Jetson AGX Thor developer kit that brings NVIDIA Blackwell to robotics in a major shift for the company
The post NVIDIA Jetson AGX Thor Developer Kit Hands-on Blackwell for Robotics appeared first on ServeTheHome.
Post Syndicated from daroc original https://lwn.net/Articles/1033809/
In July 2024,
Let’s Encrypt, the nonprofit TLS certificate authority (CA),
announced
that it would be ending support for the
online certificate status protocol
(OCSP), which is used to determine when a server’s signing certificate has been
revoked. This prevents a compromised key from being used to impersonate a web
server.
The organization cited privacy concerns, and recommended that people
rely on
certificate revocation lists (CRLs)
instead. On August 6, Let’s Encrypt
followed through and disabled its OCSP service. This poses a
problem for Linux systems that must now rely on CRLs because, unlike on other
operating systems, there is no standardized way for Linux programs to share a
CRL cache.
Post Syndicated from Noelle Kagan original https://blog.cloudflare.com/shadow-AI-analytics/
The digital landscape of corporate environments has always been a battleground between efficiency and security. For years, this played out in the form of “Shadow IT” — employees using unsanctioned laptops or cloud services to get their jobs done faster. Security teams became masters at hunting these rogue systems, setting up firewalls and policies to bring order to the chaos.
But the new frontier is different, and arguably far more subtle and dangerous.
Imagine a team of engineers, deep into the development of a groundbreaking new product. They’re on a tight deadline, and a junior engineer, trying to optimize his workflow, pastes a snippet of a proprietary algorithm into a popular public AI chatbot, asking it to refactor the code for better performance. The tool quickly returns the revised code, and the engineer, pleased with the result, checks it in. What they don’t realize is that their query, and the snippet of code, is now part of the AI service’s training data, or perhaps logged and stored by the provider. Without anyone noticing, a critical piece of the company’s intellectual property has just been sent outside the organization’s control, a silent and unmonitored data leak.
This isn’t a hypothetical scenario. It’s the new reality. Employees, empowered by these incredibly powerful AI tools, are now using them for everything from summarizing confidential documents to generating marketing copy and, yes, even writing code. The data leaving the company in these interactions is often invisible to traditional security tools, which were never built to understand the nuances of a browser tab interacting with a large language model. This quiet, unmanaged usage is “Shadow AI,” and it represents a new, high-stakes security blind spot.
To combat this, we need a new approach—one that provides visibility into this new class of applications and gives security teams the control they need, without impeding the innovation that makes these tools so valuable.
This is where the Cloudflare Shadow IT Report comes in. It’s not a list of threats to be blocked, but rather a visibility and analytics tool designed to help you understand the problem before it becomes a crisis. Instead of relying on guesswork or trying to manually hunt down every unsanctioned application, Cloudflare One customers can use the insights from their traffic to gain a clear, data-driven picture of their organization’s application usage.
The report provides a detailed, categorized view of your application activity, and is easily narrowed down to AI activity. We’ve leveraged our network and threat intelligence capabilities to identify and classify AI services, identifying general-purpose models like ChatGPT, code-generation assistants like GitHub Copilot, and specialized tools used for marketing, data analysis, or other content creation, like Leonardo.ai. This granular view allows security teams to see not just that an employee is using an AI app, but which AI app, and what users are accessing it.
Sharp eyed users may have noticed that we’ve had a shadow IT feature for a while — so what changed? While Cloudflare Gateway, our secure web gateway (SWG), has recorded some of this data for some time, users have wanted deeper insights and reporting into their organization’s application usage. Cloudflare Gateway processes hundreds of millions of rows of app usage data for our biggest users daily, and that scale was causing issues with queries into larger time windows. Additionally, the original implementation lacked the filtering and customization capabilities to properly investigate the usage of AI applications. We knew this was information that our customers loved, but we weren’t doing a good enough job of showing it to them.
Solving this was a cross-team effort requiring a complete overhaul by our analytics and reporting engineers. You may have seen our work recently in this July 2025 blog post detailing how we adopted TimescaleDB to support our analytics platform, unlocking our analytics, allowing us to aggregate and compress long term data to drastically improve query performance. This solves the issue we originally faced around our scale, letting our biggest customers query their data for long time periods. Our crawler collects the original HTTP traffic data from Gateway, which we store into a Timescale database.
Once the data are in our database, we built specific, materialized views in our database around the Shadow IT and AI use case to support analytics for this feature. Whereas the existing HTTP analytics we built are centered around the HTTP requests on an account, these specific views are centered around the information relevant to applications, for example: Which of my users are going to unapproved applications? How much bandwidth are they consuming? Is there an end-user in an unexpected geographical location interacting with an unreviewed application? What devices are using the most bandwidth?
Over the past year, the team has defined a set framework for the analytics we surface. Our timeseries graphs and top-n graphs are all filterable by duration and the relevant data points shown, allowing users to drill down to specific data points and see the details of their corporate traffic. We overhauled Shadow IT by examining the data we had and researching how AI applications were presenting visibility challenges for customers. From there we leveraged our existing framework and built the Shadow IT dashboard. This delivered the application-level visibility that we know our customers needed.
The core of the system is Cloudflare Gateway, an in-line filter and proxy for all your organization’s Internet traffic, regardless of where your users are. When an employee tries to access an AI application, their traffic flows through Cloudflare’s global network. Cloudflare can inspect the traffic, including the hostname, and map the traffic to our application definitions. TLS inspection is optional for Gateway customers, but it is required for ShadowIT analytics.
Interactions are logged and tied to user identity, device posture, bandwidth consumed and even the geographic location. This rich context is crucial for understanding who is using which AI tools, when, and from where.
All this granular data is then presented in an our Shadow IT Report within your Cloudflare One dashboard. Simply filter for AI applications so you can:
High-Level Overview: Get an immediate sense of your organization’s AI adoption. See the top AI applications in use, overall usage trends, and the volume of data being processed. This will help you identify and target your security and governance efforts.
Granular Drill-Downs: Need more detail? Click on any AI application to see specific users or groups accessing it, their usage frequency, location, and the amount of data transferred. This detail helps you pinpoint teams using AI around the company, as well as how much data is flowing to those applications.

ShadowIT analytics dashboard
We understand that not all AI tools are created equal, and your organization’s comfort level will vary. The Shadow AI Report introduces a flexible framework for Application Approval Status, allowing you to formally categorize each detected AI application:
Approved: These are the AI applications that have passed your internal security vetting, comply with your policies, and are officially sanctioned for use.
Unapproved: These are the red-light applications. Perhaps they have concerning data privacy policies, a history of vulnerabilities, or simply don’t align with your business objectives.
In Review: For those gray-area applications, or newly discovered tools, this status lets your teams acknowledge their usage while conducting thorough due diligence. It buys you time to make an informed decision without immediate disruption.

Review and mark application statuses in the dashboard
These approval statuses come alive when integrated with Cloudflare Gateway policies. This allows you to automatically enforce your AI decisions at the edge of Cloudflare’s network, ensuring consistent security for every employee, anywhere they work.
Here’s how you can translate your decisions into inline protection:
Block unapproved AI: The simplest and most direct action. Create a Gateway HTTP policy that blocks all traffic to any AI application marked as “Unapproved.” This immediately shuts down risky data exfiltration.
Limit “In Review” exposure: For applications still being assessed, you might not want a hard block, but rather a soft limit on potential risks:
Data Loss Prevention (DLP): Cloudflare DLP inspects and analyzes traffic for indicators of sensitive data (e.g., credit card numbers, PII, internal project names, source code) and can then block the transfer. By applying DLP to “In Review” AI applications, you can prevent AI prompts containing this proprietary data, as well as notify the user why the prompt was blocked. This could have saved our poor junior engineer from their well-intended mistake..
Restrict Specific Actions: Block only file uploads allowing basic interaction but preventing mass data egress.
Isolate Risky Sessions: Route traffic for “In Review” applications through Cloudflare’s Browser Isolation. Browser Isolation executes the browser session in a secure, remote container, isolating all data interactions from your corporate network. With it, you can control file uploads, clipboard actions, reduce keyboard inputs and more, reducing interaction with the application while you review it.
Audit “Approved” usage: Even for AI tools you trust, you might want to log all interactions for compliance auditing or apply specific data handling rules to ensure ongoing adherence to internal policies.
This workflow enables your team to consistently audit your organization’s AI usage and easily update policies to quickly and easily reduce security risk.
While the Shadow AI Report provides excellent insights, security teams often need to perform deeper forensic investigations. For these advanced scenarios, we offer Cloudflare Log Explorer.
Log Explorer allows you to store and query your Cloudflare logs directly within the Cloudflare dashboard or via API, eliminating the need to send massive log volumes to third-party SIEMs for every investigation. It provides raw, unsampled log data with full context, enabling rapid and detailed analysis.
Log Explorer customers can dive into Shadow AI logs with pre-populated SQL queries from Cloudflare Analytics, enabling deeper investigations into AI usage:

Log Search’s SQL query interface
How to investigate Shadow AI with Log Explorer:
Trace Specific User Activity: If the Shadow AI Report flags a user with high activity on an “In Review” or “Unapproved” AI app, you can jump into Log Explorer and query by user, application category, or specific AI services.
Analyze Data Exfiltration Attempts: If you have DLP policies configured, you can search for DLP matches in conjunction with AI application categories. This helps identify attempts to upload sensitive data to AI applications and pinpoint exactly what data was being transmitted.
Identify Anomalous AI Usage: The Shadow AI Report might show a spike in usage for a particular AI application. In Log Explorer, you can filter by application status (In Review or Unapproved) for a specific time range. Then, look for unusual patterns, such as a high number of requests from a single source IP address, or unexpected geographic origins, which could indicate compromised accounts or policy evasion attempts.
If AI visibility is a challenge for your organization, the Shadow AI Report is available now for Cloudflare One customers, as part of our broader shadow IT discovery capabilities. Log in to your dashboard to start regaining visibility and shaping your AI governance strategy today.
Ready to modernize how you secure access to AI apps? Reach out for a consultation with our Cloudflare One security experts about how to regain visibility and control.
Or if you’re not ready to talk to someone yet, nearly every feature in Cloudflare One is available at no cost for up to 50 users. Many of our largest enterprise customers start by exploring the products themselves on our free plan, and you can get started here.
If you’ve got feedback or want to help shape how Cloudflare enhances visibility across shadow AI, please consider joining our user research program.
Post Syndicated from Peter Saulitis original https://blog.cloudflare.com/welcome-to-ai-avenue/
If you’re here on the Cloudflare blog, chances are you already understand AI pretty well. But step outside our circle, and you’ll find a surprising number of people who still don’t know what it really is — or why it matters.
We wanted to come up with a way to make AI intuitive, something you can actually see and touch to get what’s going on. Hands on, not just hand-wavy.
The idea we landed on is simple: nothing comes into the world fully formed. Like us, and like the Internet, AI didn’t show up fully formed. So we asked ourselves: what if we told the story of AI as it learns and grows?
Episode by episode, we’d give it new capabilities, explain how those capabilities work, and explore how they change the way AI interacts with the world. Giving it a voice. Letting it see. Helping it learn. And maybe even letting it imagine the future.
So we made AI Avenue, a show where I (Craig) explore the fun, human, and sometimes surprising sides of AI… with a little help from my co-host Yorick, a robot hand with a knack for comic timing and the occasional eye-roll. Together, we travel, talk to incredible people, and get hands-on with AI to show it’s not just something to read about. It’s something you can touch, try, and enjoy.

We wanted to make something that would strip away the jargon and make AI approachable, friendly, and most importantly, fun.
In AI Avenue, we address people’s fears, show them the art of the possible, and highlight the positive human stories where AI is augmenting — not replacing — what people can do. And yes, we even let people touch AI themselves. Also yes, the previous paragraphs “intentionally included” a few em-dashes.
The result? A fast-paced, playful series that mixes demos, interviews, and real-world examples, all showing AI as something you can explore, question, and use in ways that matter to you.
You can sign up now to be notified when each episode drops and learn more about the journey at aiavenue.show.

We had an absolute blast partnering with some of the most exciting players in the space:
Anthropic — on building safe, aligned AI models.
Engineered Arts — creators of the humanoid robot Ameca, who makes several appearances throughout the series.
ElevenLabs — powering lifelike voice synthesis.
HeyGen — creating realistic AI-generated video avatars and translations.
Roboflow — enabling computer vision projects with powerful image datasets and tools.
Be My Eyes — using AI and volunteers to make the world more accessible for people who are blind or have low vision.
Writer — bringing enterprise-grade generative AI into real-world workflows.
Across six episodes, we follow Yorick’s upgrades and occasional misadventures as he learns to talk, see, think, and even imagine the future.
Episode 1: Voice — We start in London where Yorick gets his voice and immediately starts chiming in on everything.
Episode 2: Vision — In San Francisco, Yorick tries computer vision for the first time. We watch someone go shopping for the first time.
Episode 3: Thinking — Hosting a live trivia stream online, Yorick begins confidently spouting answers that aren’t quite true. We head to New York City to meet someone whose life was saved by ChatGPT.
Episode 4: Learning — Yorick discovers generative AI and decides he can make the show himself, spawning multiple Craig clones and raising questions about ethics and creativity.
Episode 5: Doing — It turns out everyone we talk to just wants a robot to do their dishes. We dig into what “doing” means in AI and robotics and whether Yorick is on board.
Episode 6: Smell — In our finale, we explore the agentic AI future, quantum computing, and big sci-fi dreams, then hang out with a 9-year-old vibe coder because, well, the children are the future.
Every episode is paired with developer tutorials so you can experiment with the same AI tools that we feature. No matter your skill level, you can tinker, build, and see for yourself what AI can do. We strongly believe the most important thing you can do right now is to touch AI, play with it. Now is the time.
Yorick and I will be releasing each episode of AI Avenue as it’s ready, and we’d love to have you along for the ride.
Sign up to be notified when new episodes launch and explore more about the show at aiavenue.show.
