2023년 4분기 DDoS 위협 보고서

Post Syndicated from Omer Yoachimik http://blog.cloudflare.com/author/omer/ original https://blog.cloudflare.com/ddos-threat-report-2023-q4-ko-kr


Cloudflare DDoS 위협 보고서 제16호에 오신 것을 환영합니다. 이번 호에서는 2023년 4분기이자 마지막 분기의 DDoS 동향과 주요 결과를 다루며, 연중 주요 동향을 검토합니다.

DDoS 공격이란 무엇일까요?

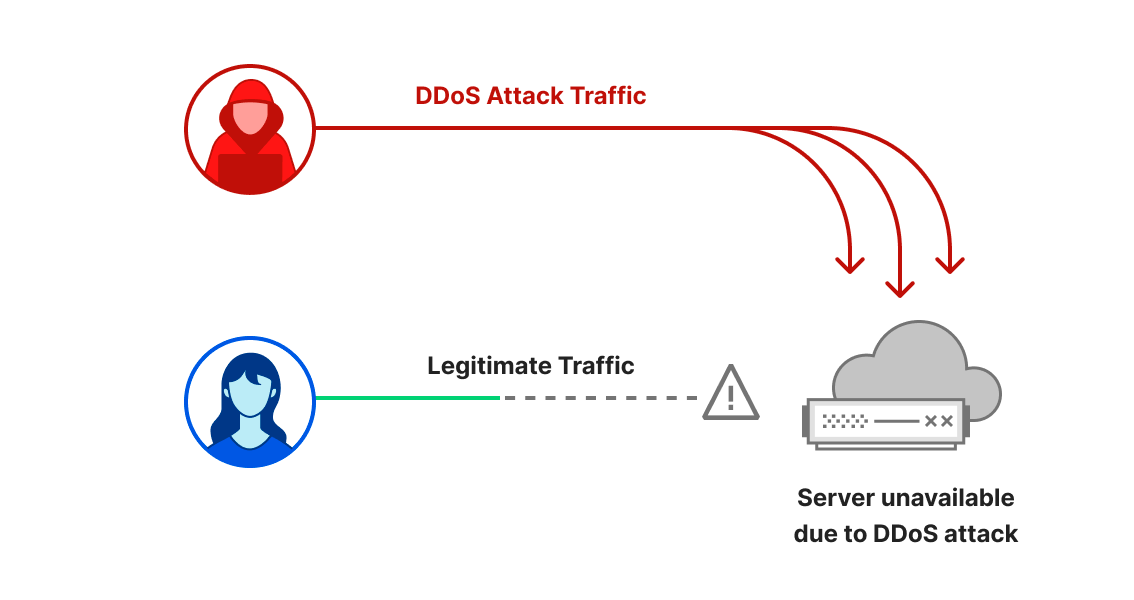
DDoS 공격 또는 분산 서비스 거부 공격은 웹 사이트와 온라인 서비스가 처리할 수 있는 트래픽을 초과하여 사용자를 방해하고 서비스를 사용할 수 없게 만드는 것을 목표로 하는 사이버 공격의 한 유형입니다. 이는 교통 체증으로 길이 막혀 운전자가 목적지에 도착하지 못하는 것과 유사합니다.

이 보고서에서 다룰 DDoS 공격에는 크게 세 가지 유형이 있습니다. 첫 번째는 HTTP 서버가 처리할 수 있는 것보다 더 많은 요청으로 서버를 압도하여 서비스 거부 이벤트를 발생시키는 것을 목표로 하는 HTTP 요청집중형 DDoS 공격입니다. 두 번째는 라우터, 방화벽, 서버 등의 인라인 장비에서 처리할 수 있는 패킷보다 많은 패킷을 전송하여 서버를 압도하는 것을 목표로 하는IP 패킷집중형 DDoS 공격입니다. 세 번째는 비트 집중형 공격으로, 인터넷 링크를 포화 상태로 만들어 막히게 함으로써 앞서 설명한 ‘정체’를 유발하는 것을 목표로 합니다. 이 보고서에서는 세 가지 유형의 공격에 대해 다양한 기법과 인사이트를 중점적으로 다룹니다.

보고서의 이전 버전은 여기에서 확인할 수 있으며, 대화형 허브인Cloudflare Radar에서도 확인할 수 있습니다. Cloudflare Radar는 전 세계 인터넷 트래픽, 공격, 기술 동향, 인사이트를 보여주며, 드릴 다운 및 필터링 기능을 통해 특정 국가, 산업, 서비스 공급자에 대한 인사이트를 확대할 수 있습니다. Cloudflare Radar는 학자, 데이터 전문가, 기타 웹 애호가가 전 세계 인터넷 사용량을 조사할 수 있는 무료 API도 제공합니다.

Cloudflare에서 이 보고서를 작성한 방법을 알아보려면 방법론을 참조하세요.

핵심 결과

  1. Cloudflare에서 관찰한 바에 따르면, 4분기에는 네트워크 계층 DDoS 공격이 전년 동기 대비 117% 증가했으며, 블랙 프라이데이와 연말연시를 전후해 소매, 배송, 홍보 웹 사이트를 겨냥한 DDoS 활동이 전반적으로 증가했습니다.
  2. 4분기에 대만을 겨냥한 DDoS 공격 트래픽은 총선이 다가오고 중국과의 긴장이 고조된 가운데 전년 대비     3,370% 증가했습니다. 이스라엘과 하마스 간의 군사적 갈등이 지속됨에 따라 이스라엘 웹 사이트를 겨냥한     DDoS 공격 트래픽의 비율은 전 분기 대비 27% 증가했으며, 팔레스타인 웹 사이트를 의 군사적 갈등이 지속됨에 따라 이스라엘 웹 사이트를 겨냥한 DDoS 공격 트래픽의 비율은 전 분기 대비 1,126% 증가했습니다.
  3. 4분기에는 제28차 유엔 기후변화회의(COP 28)가 열린 시기와 맞물려 환경 서비스 웹 사이트를 겨냥한 DDoS 공격 트래픽이 전년 대비 무려 61,839% 급증했습니다.

이러한 주요 조사 결과에 대한 심층 분석과 현재의 사이버 보안 과제에 대한 이해를 새롭게 정의할 수 있는 추가 인사이트를 확인하려면 계속 읽어보세요!

DDoS 공격에 대한 그림

대규모 볼류메트릭 HTTP DDoS 공격

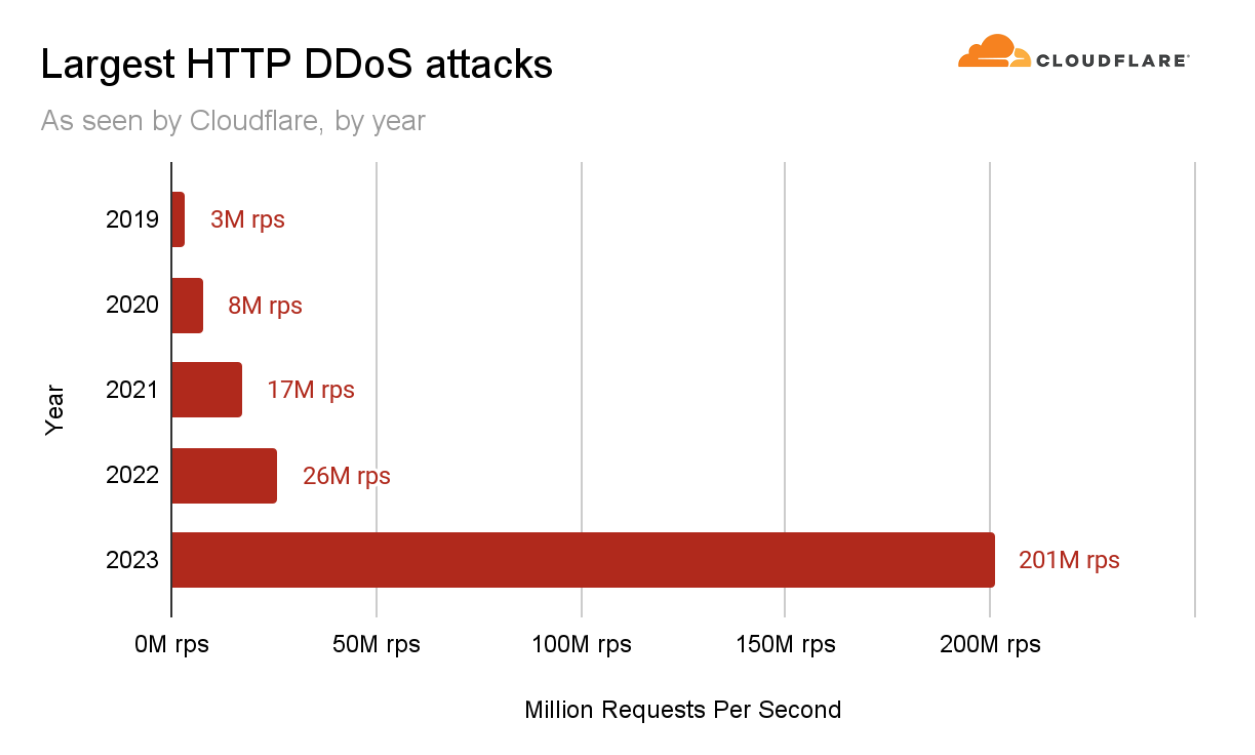
2023년은 미지의 영역이 펼쳐지는 해였습니다. DDoS 공격은 규모와 정교함에 있어서 새로운 차원에 도달했습니다. Cloudflare를 포함한 광범위한 인터넷 커뮤니티에서는 전례 없는 속도로 수천 건에 이르며 지속적이고 의도적으로 설계된 대규모 볼류메트릭 DDoS 공격 캠페인에 직면했습니다.

이러한 공격은 매우 복잡하고 HTTP/2 취약점을 악용했습니다. Cloudflare에서는 취약점의 영향을 완화하기 위해 특수하게 마련한 기술을 개발했으며, 업계의 다른 기업들과 협력하여 취약점을 공개하는 일을 담당했습니다.

이러한 DDoS 캠페인의 일환으로 3분기에 Cloudflare의 시스템에서는 초당 2억 100만 건에 달하는 사상 최대 규모의 요청으로 이루어진 공격을 방어했습니다. 이는 지난 2022년의 기록인 초당 2,600만 요청보다 거의 8배나 많은 수치입니다.

Cloudflare에서 관찰한 연도별 최대 HTTP DDoS 공격 규모

네트워크 계층 DDoS 공격의 증가

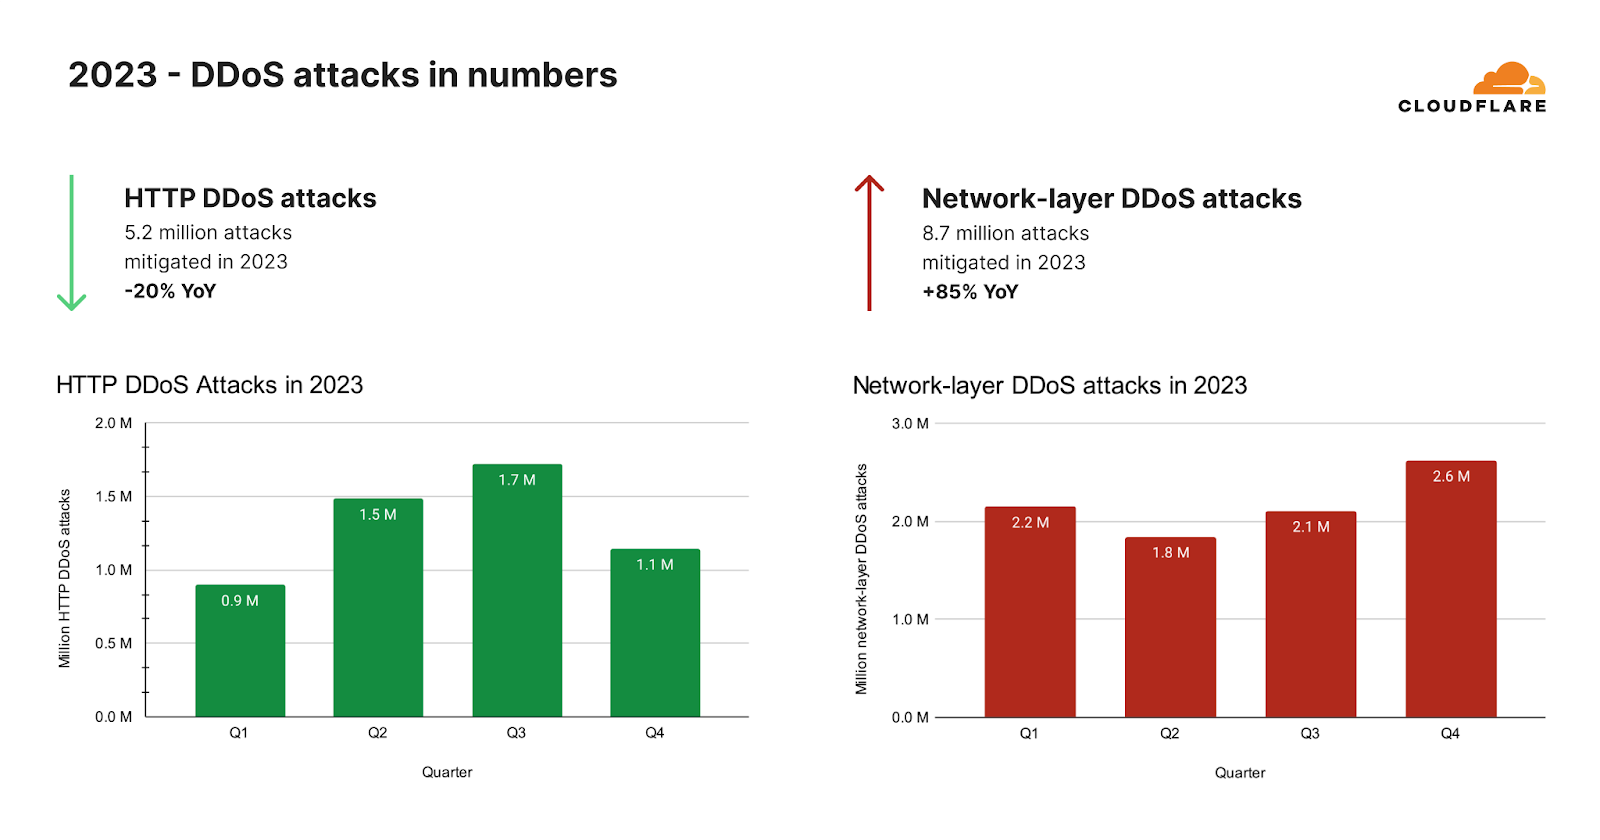
대규모 캠페인이 진정된 후 우리는 HTTP DDoS 공격이 예상치 않게 감소하는 것을 확인했습니다. 2023년 전체적으로는 26조 건이 넘는 요청으로 이루어진 520만 건 이상의 HTTP DDoS 공격을 자동화된 방어 기능으로 막아냈습니다. 이는 시간당 평균 594건의 HTTP DDoS 공격과 30억 건의 요청을 완화한 수치입니다.

이러한 천문학적 수치에도 불구하고 HTTP DDoS 공격 요청량은 실제로 2022년에 비해 20% 감소했습니다. 이러한 감소세는 연간뿐만 아니라 2023년 4분기에도 관찰되었는데, HTTP DDoS 공격 요청 건수는 전년 동기 대비 7%, 전 분기 대비 18% 감소했습니다.

네트워크 계층에서는 완전히 다른 추세를 확인했습니다. Cloudflare에서는 자동화된 방어 기능으로2023년에 870만 건의 네트워크 계층 DDoS 공격을 방어했습니다. 이는 2022년에 비해 85% 증가한 수치입니다.

2023년 4분기에 Cloudflare에서는 자동화된 방어 기능으로 80페타바이트가 넘는 네트워크 계층 공격을 완화했습니다. 평균적으로 우리 시스템에서는 매시간 996건의 네트워크 계층 DDoS 공격과 27테라바이트를 자동으로 방어했습니다. 2023년 4분기의 네트워크 계층 DDoS 공격 건수는 전년 동기 대비 175%, 전 분기 대비25% 증가했습니다.

분기별 HTTP 및 네트워크 계층 DDoS 공격

COP 28 기간과 그 전후의DDoS 공격 증가

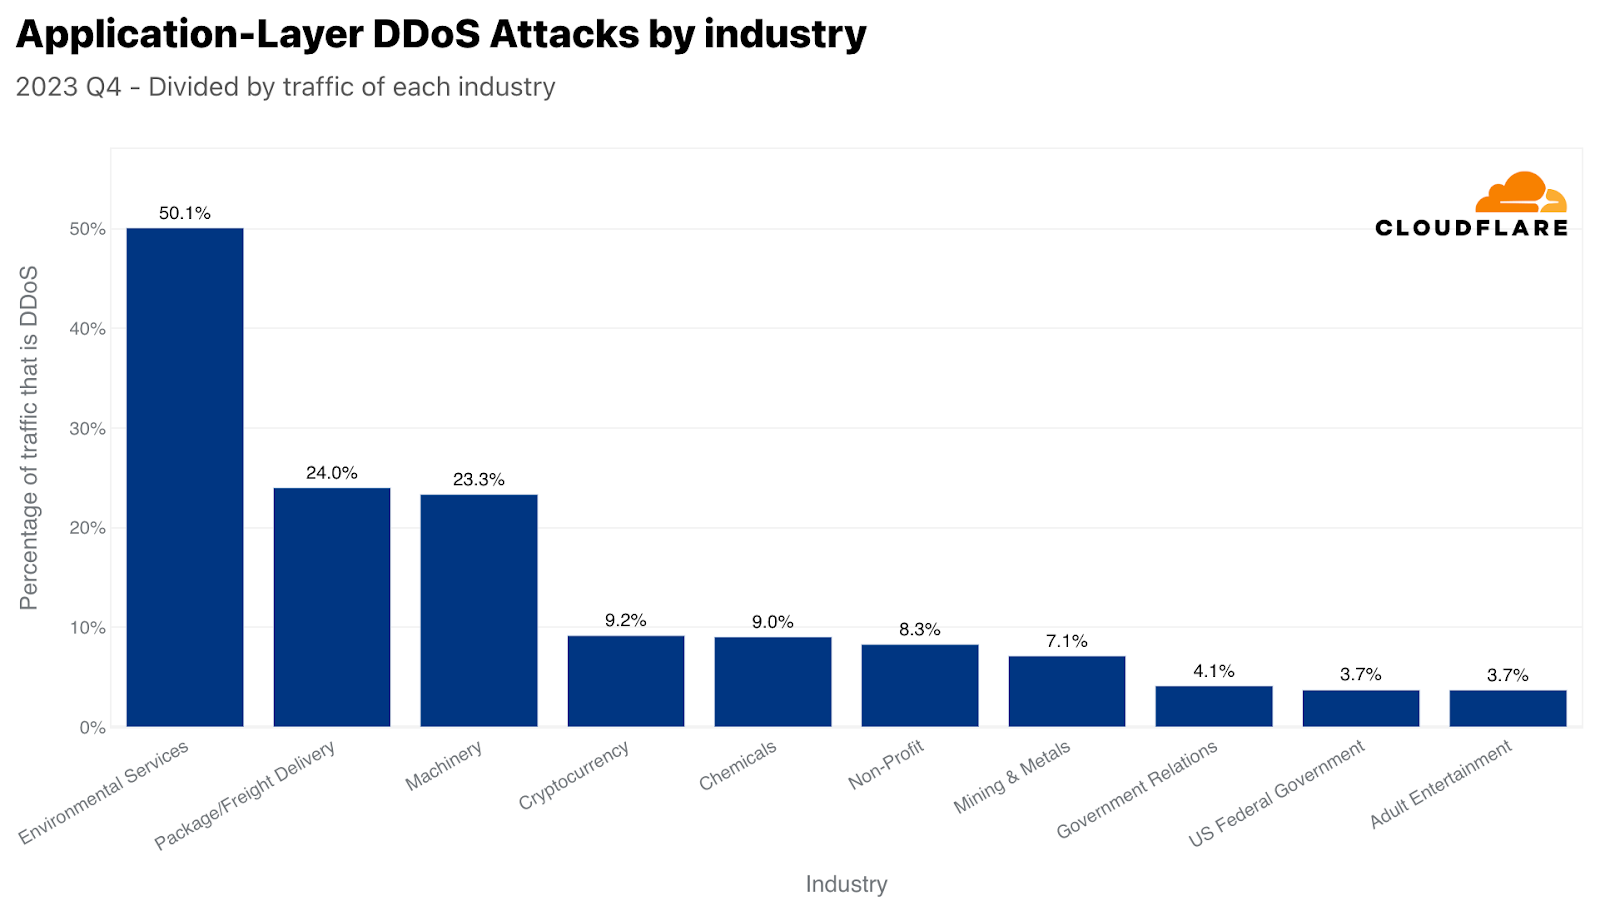
2023년 마지막 분기에는 사이버 위협의 환경이 크게 변화했습니다. 초기에는 암호화폐 분야가 HTTP DDoS 공격 요청량 측면에서 선두를 달리고 있었지만, 새로운 공격 대상이 주요 피해자로 등장했습니다. 환경 서비스 업계를 겨냥한 HTTP DDoS 공격이 전례 없이 급증했으며, 이 공격이 전체 HTTP 트래픽의 절반을 차지했습니다. 이는 전년 대비 무려 618배 증가한 수치로, 사이버 위협 환경의 불안한 추세를 보여줍니다.

이처럼 사이버 공격이 급증한 시기는 2023년 11월 30일부터 12월12일까지 열린 유엔기후변화협약 당사국총회(COP 28)와 맞물렸습니다. 이 회의는 중추적인 이벤트로, 많은 사람이 화석 연료 시대의 ‘종말의 시작’이라고 생각했던 것을 알리는 신호탄이었습니다. COP 28을 앞둔 기간 동안 환경 서비스 웹 사이트를 겨냥한 HTTP 공격이 눈에 띄게 급증한 것으로 관찰되었습니다. 이러한 패턴은 이 이벤트에만 국한된 것이 아니었습니다.

특히 COP 26과 COP 27, 그리고 다른 유엔 환경 관련 결의안이나 발표의 과거 데이터를 살펴보면 비슷한 패턴이 나타납니다. 이러한 이벤트가 있을 때마다 환경 서비스 웹 사이트를 겨냥한 사이버 공격도 함께 증가했습니다.

2023년 2월과 3월, 유엔의 기후 정의 결의안과 유엔환경계획의 담수 챌린지시작과 같은 중요한 환경 이벤트 때문에 환경 웹 사이트의 인지도가 높아졌고, 이는 이러한 사이트에 대한 공격의 증가와 관련이 있을 수 있습니다.

이러한 반복적인 패턴을 보면 환경 문제와 사이버 보안이 점점 더 밀접하게 연관되어 있으며, 사이버 보안은 디지털 시대에 점점 더 공격자의 초점이 되고 있음을 실감할 수 있습니다.

DDoS 공격과 철검

DDoS 공격을 촉발하는 것은 유엔 결의안만이 아닙니다. 사이버 공격, 특히 DDoS 공격은 오랫동안 전쟁과 혼란의 도구로 사용되어 왔습니다. 우크라이나와 러시아 사이의 전쟁에서 DDoS 공격 활동이 증가되는 것이 관찰되었고, 이제는 이스라엘과 하마스 사이의 전쟁에서도 DDoS 공격이 증가하고 있습니다. Cloudflare에서는 이스라엘-하마스 전쟁에서의 사이버 공격 보고서에서 사이버 활동을 처음 보고했으며, 4분기 내내 지속해서 사이버 활동을 모니터링했습니다.

“철검” 작전은 하마스가 주도한 10월 7일 공격 이후 이스라엘이 하마스를 상대로 시작한 군사 공격입니다. 이 무력 충돌이 계속되는 Cloudflare에서는 동안 양측을 겨냥한DDoS 공격을 계속 목격하고 있습니다.

이스라엘 및 팔레스타인 웹 사이트를 겨냥한 DDoS 공격, 산업별

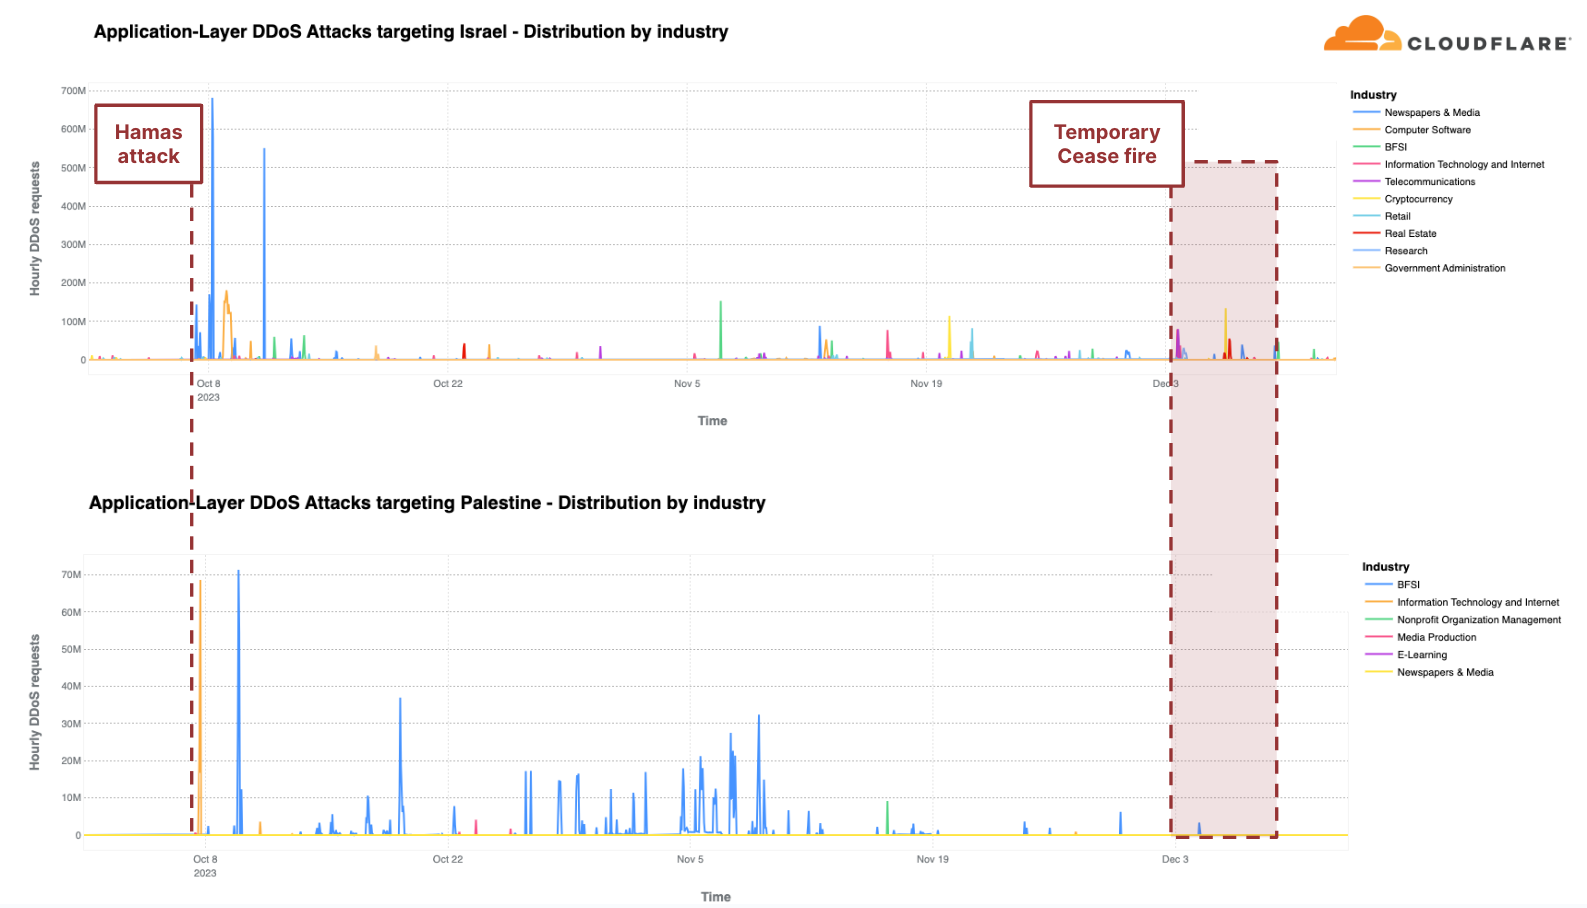
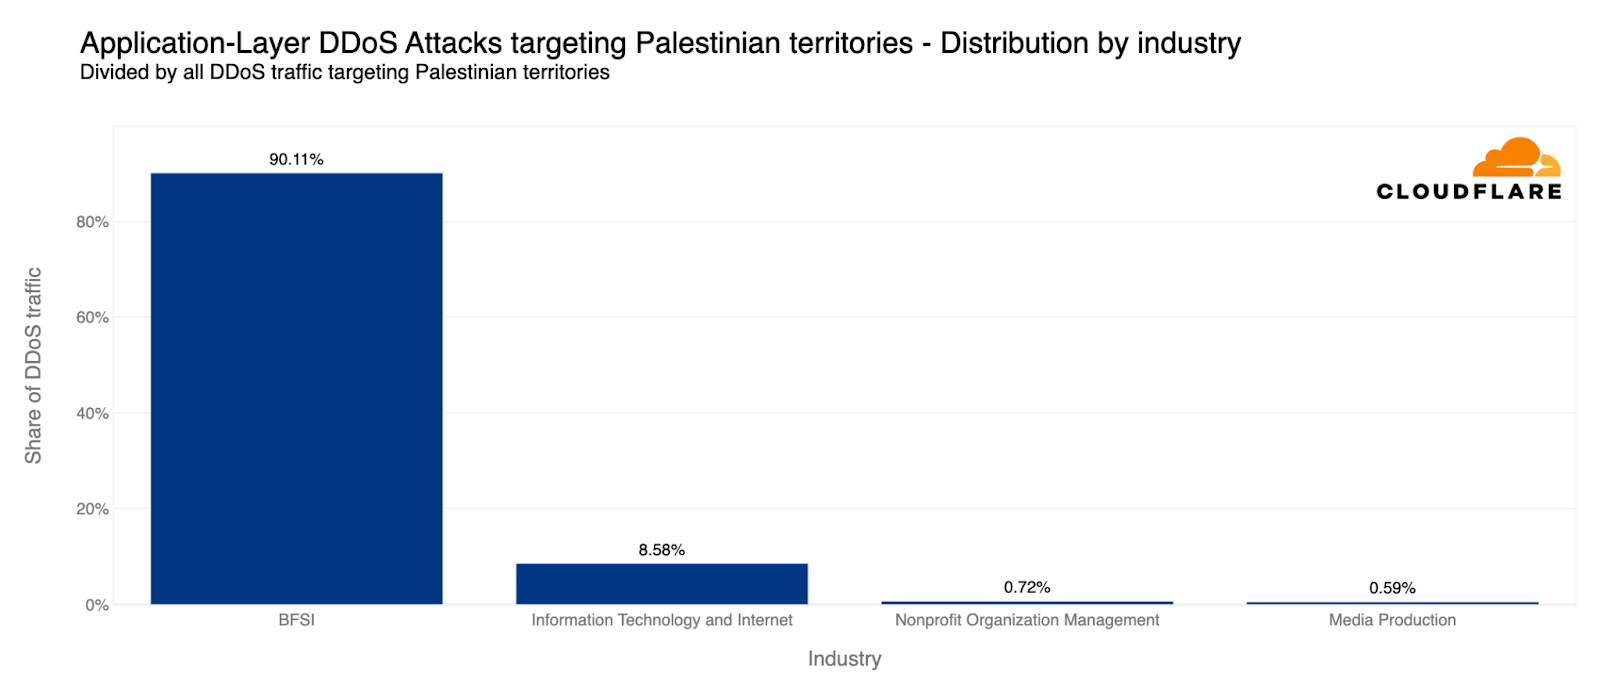
지역별 트래픽을 기준으로 볼 때, 팔레스타인 지역은 4분기에 HTTP DDoS 공격이 두 번째로 많이 발생한 지역이었습니다. 팔레스타인 웹 사이트를 향한 전체 HTTP 요청의 10% 이상이 DDoS 공격이었으며, 총 13억 건의DDoS 요청이 발생하여 전 분기 대비 1,126% 증가했습니다. 이러한 DDoS 공격의 90%는 팔레스타인 은행 웹 사이트를 겨냥했습니다. 또 다른 8%는 정보 기술 및 인터넷 플랫폼을 겨냥했습니다.

가장 많이 공격받은 팔레스타인 산업

유사하게, Cloudflare의 시스템에서는 이스라엘 웹 사이트를 겨냥한 22억 건 이상의 HTTP DDoS 요청을 자동으로 방어했습니다. 22억 건은 전 분기 및 전년 동기 대비 감소한 수치이지만, 이스라엘로 향하는 전체 트래픽 중에서 차지하는 비중은 여전히 높았습니다. 이 정규화 수치는 전 분기 대비 27% 증가했지만, 전년 동기 대비로는 92% 감소한 수치입니다. 공격 트래픽의 양이 많음에도 불구하고 이스라엘은 자국 트래픽 대비 77번째로 공격을 많이 받은 지역이었습니다. 또한 총 공격 건수 기준으로는 33번째로 공격을 많이 받은 반면 팔레스타인 영토는 42번째로 공격을 많이 받았습니다.

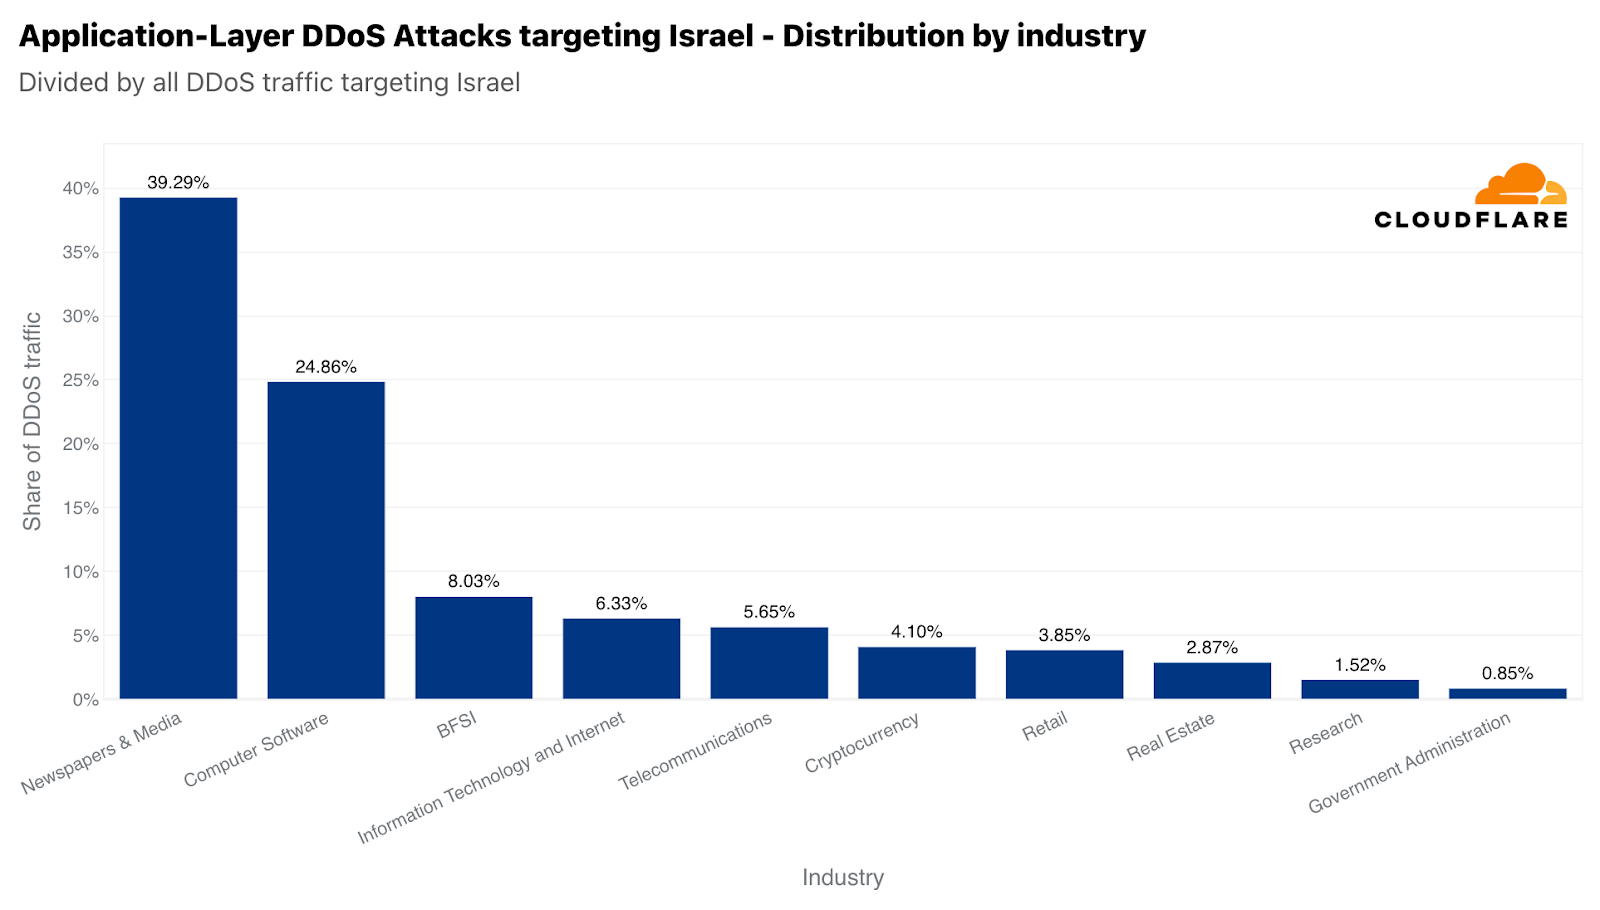
공격받은 이스라엘 웹 사이트 중 신문 및 미디어가 주요 표적이었으며, 이스라엘을 향하는 HTTP DDoS 공격의 약 40%를 신문 및 미디어 부문에서 받았습니다. 두 번째로 공격을 많이 받은 산업은 컴퓨터 소프트웨어 산업이었습니다. 은행, 금융 기관 및 보험(BFSI) 산업이 3위를 차지했습니다.

가장 많이 공격받은 이스라엘 산업

네트워크 계층에서도 동일한 추세를 확인할 수 있습니다. 팔레스타인 네트워크는 470테라바이트에 이르는 공격 트래픽의 표적이 되었으며, 이는 팔레스타인 네트워크에 대한 전체 트래픽의 68% 이상을 차지했습니다. 이는 중국에만 뒤지는 수치로, 팔레스타인 지역으로 향하는 모든 트래픽을 기준으로, 팔레스타인이 네트워크 계층 DDoS 공격이 세계에서 두 번째로 많이 발생한 지역이 되었습니다. 절대적인 트래픽 규모로는 3위를 차지했습니다. 이 470테라바이트는 Cloudflare에서 완화한 전체 DDoS 트래픽의 약 1%를 차지합니다.

하지만 이스라엘 네트워크에서 받은 공격 트래픽은 2.4테라바이트 밖에 되지 않아, 네트워크 계층 DDoS 공격을 가장 많이 받은 국가(정상화 기준) 순위에서 8위에 올랐습니다. 이 2.4테라바이트는 이스라엘 네트워크로 향하는 전체 트래픽의 거의 10%를 차지했습니다.

가장 많이 공격받은 국가

우리는 이스라엘에 위치한 우리 데이터 센터에서 수집된 전체 바이트의 3%가 네트워크 계층 DDoS 공격이라는 사실을 확인했습니다. 팔레스타인에 위치한 우리 데이터 센터에서는 이 수치가 전체 바이트의 약 17%로 훨씬 더 높았습니다.

애플리케이션 계층에서는 팔레스타인 IP 주소에서 시작된 HTTP 요청의 4%가 DDoS 공격이며, 이스라엘 IP 주소에서 시작된 HTTP 요청의 약 2%도 DDoS 공격인 것으로 나타났습니다.

DDoS 공격의 주요 출처

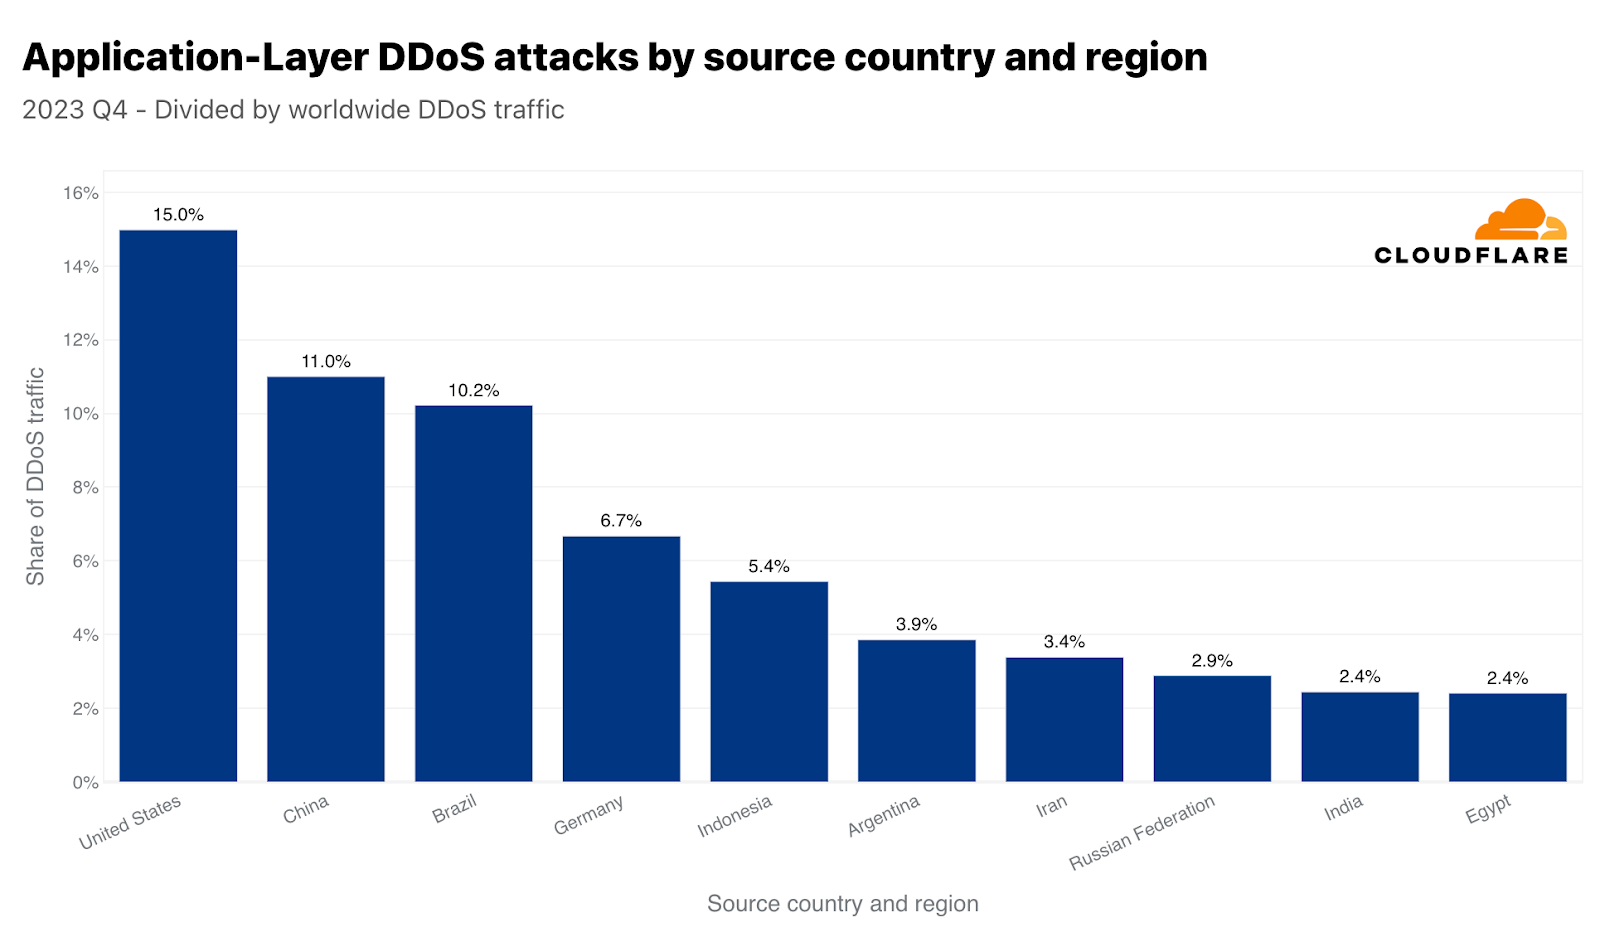
2022년 3분기에는 중국이 HTTP DDoS 공격 트래픽의 최대 출처였습니다. 그러나 2022년 4분기부터는 미국이 HTTP DDoS 공격의 최대 출처가 되었으며, 이후 5분기 연속으로 이 바람직하지 않은 위치를 유지하고 있습니다. 마찬가지로 미국의 데이터 센터는 전체 공격 바이트의 38%가 넘는 네트워크 레이어 DDoS 공격 트래픽을 가장 많이 수집하는 곳입니다.

중국과 미국에서 기원한 분기별 HTTP DDoS 공격 건수

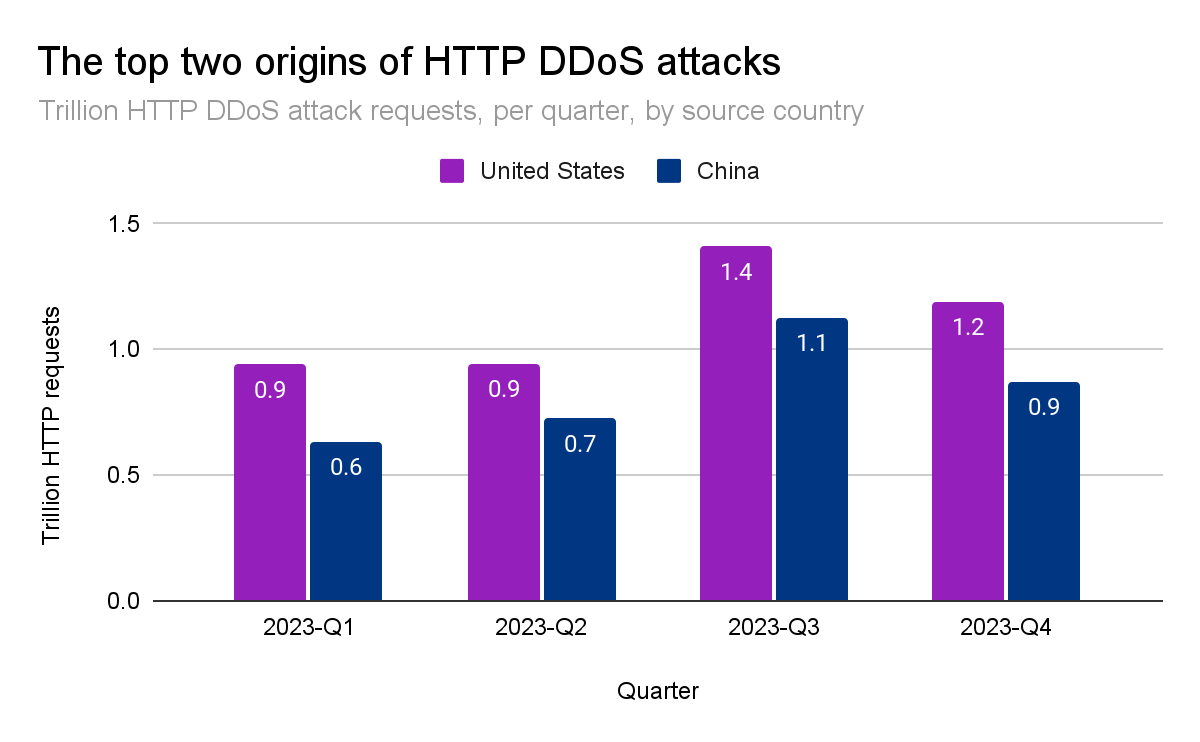
중국과 미국은 함께 전 세계 HTTP DDoS 공격 트래픽의 4분의 1 이상을 차지합니다. 브라질, 독일, 인도네시아, 아르헨티나가 그 다음 25%를 차지합니다.

HTTP DDoS 공격의 상위 출처

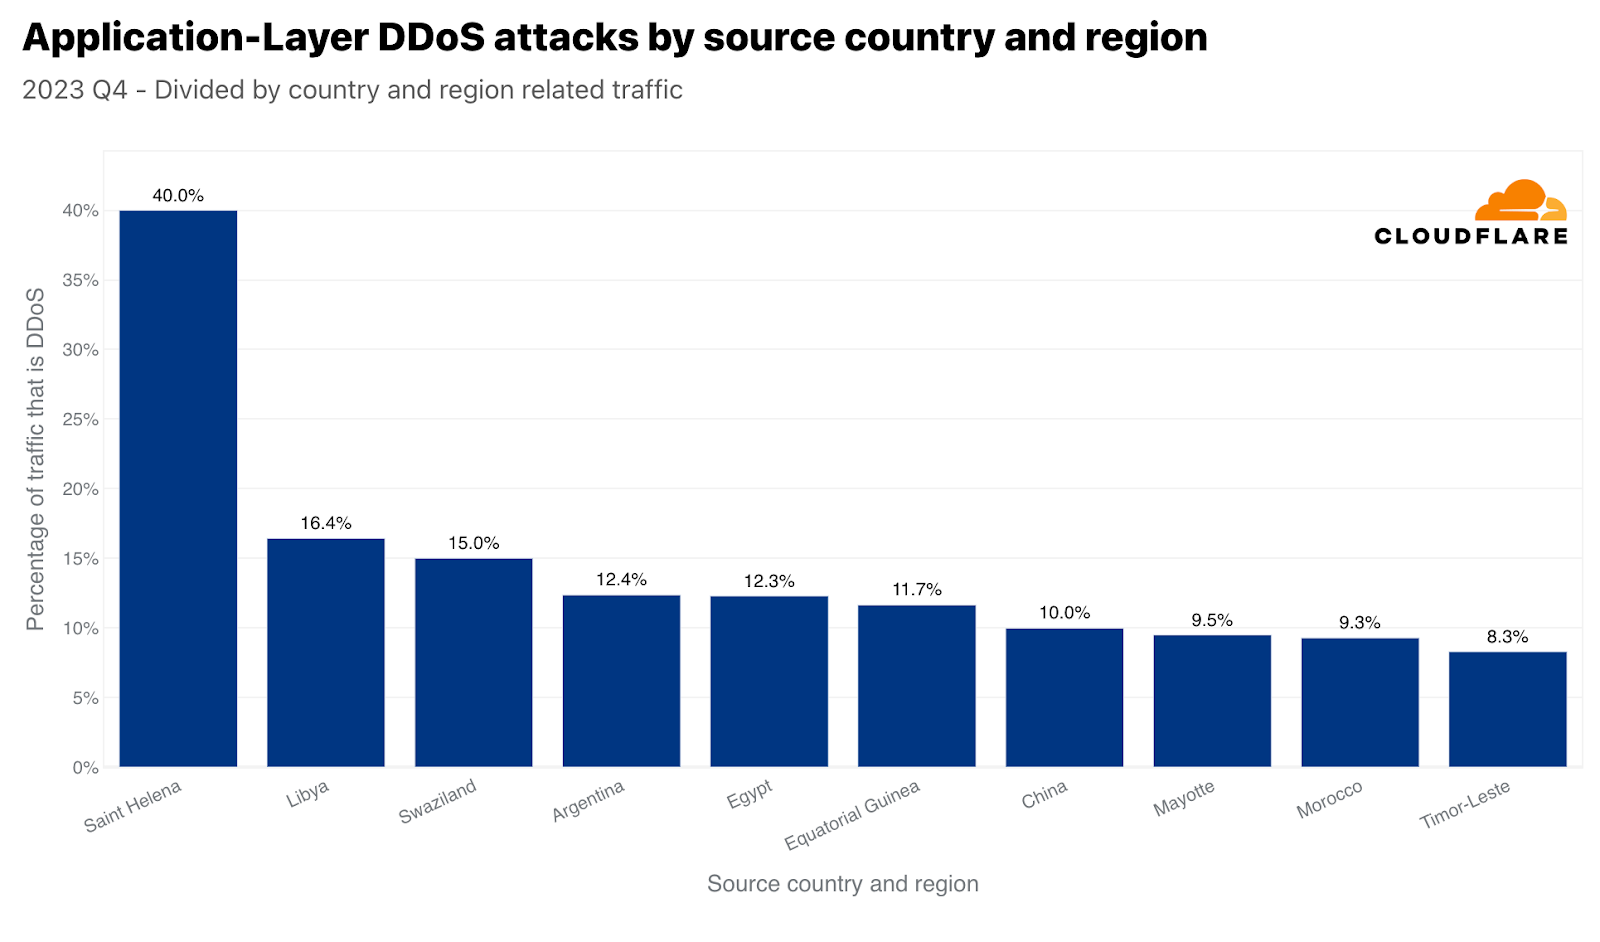
이러한 큰 수치는 일반적으로 큰 시장에 들어맞습니다. 그러한 이유로 각 국가의 아웃바운드 트래픽을 비교하여 각 국가에서 기원하는 공격 트래픽을 정규화하기도 합니다. 이 작업을 수행하면 작은 섬나라나 시장 규모가 작은 국가에서 불균형적인 공격 트래픽이 기원하는 경우가 종종 있습니다. 4분기에는, 세인트 헬레나의 아웃바운드 트래픽 중 40%가 HTTP DDoS 공격으로 1위를 차지했습니다. 이 ‘외딴 열대 화산 섬‘에 이어 리비아가 2위, 스와질란드(에스와티니라고도 함)가 3위를 차지했습니다. 아르헨티나와 이집트가 그 뒤를 이어 각각 4위와 5위를 차지했습니다.

국가별 트래픽과 관련한 HTTP DDoS 공격의 상위 출처

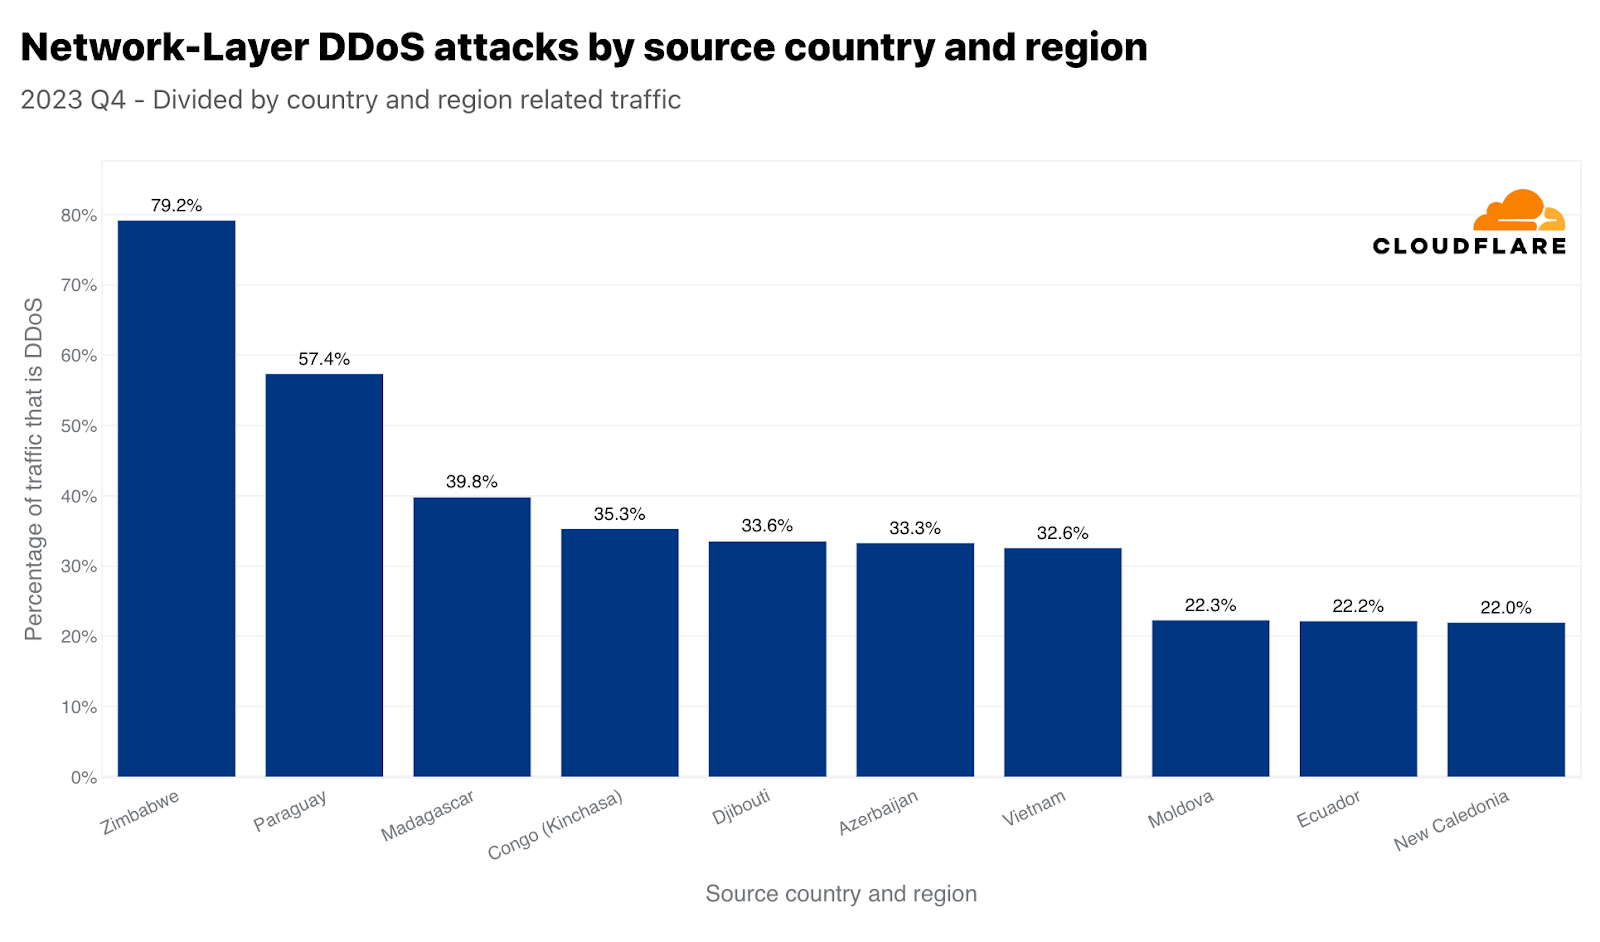
네트워크 계층에서는 짐바브웨가 1위에 올랐습니다. 짐바브웨에 위치한 Cloudflare 데이터 센터에서 수집한 전체 트래픽의 거의 80%가 악의적 트래픽이었습니다. 2위는 파라과이, 3위는 마다가스카르가 차지했습니다.

국가별 트래픽과 관련한 네트워크 계층 DDoS 공격의 상위 출처

가장 많이 공격받는 산업

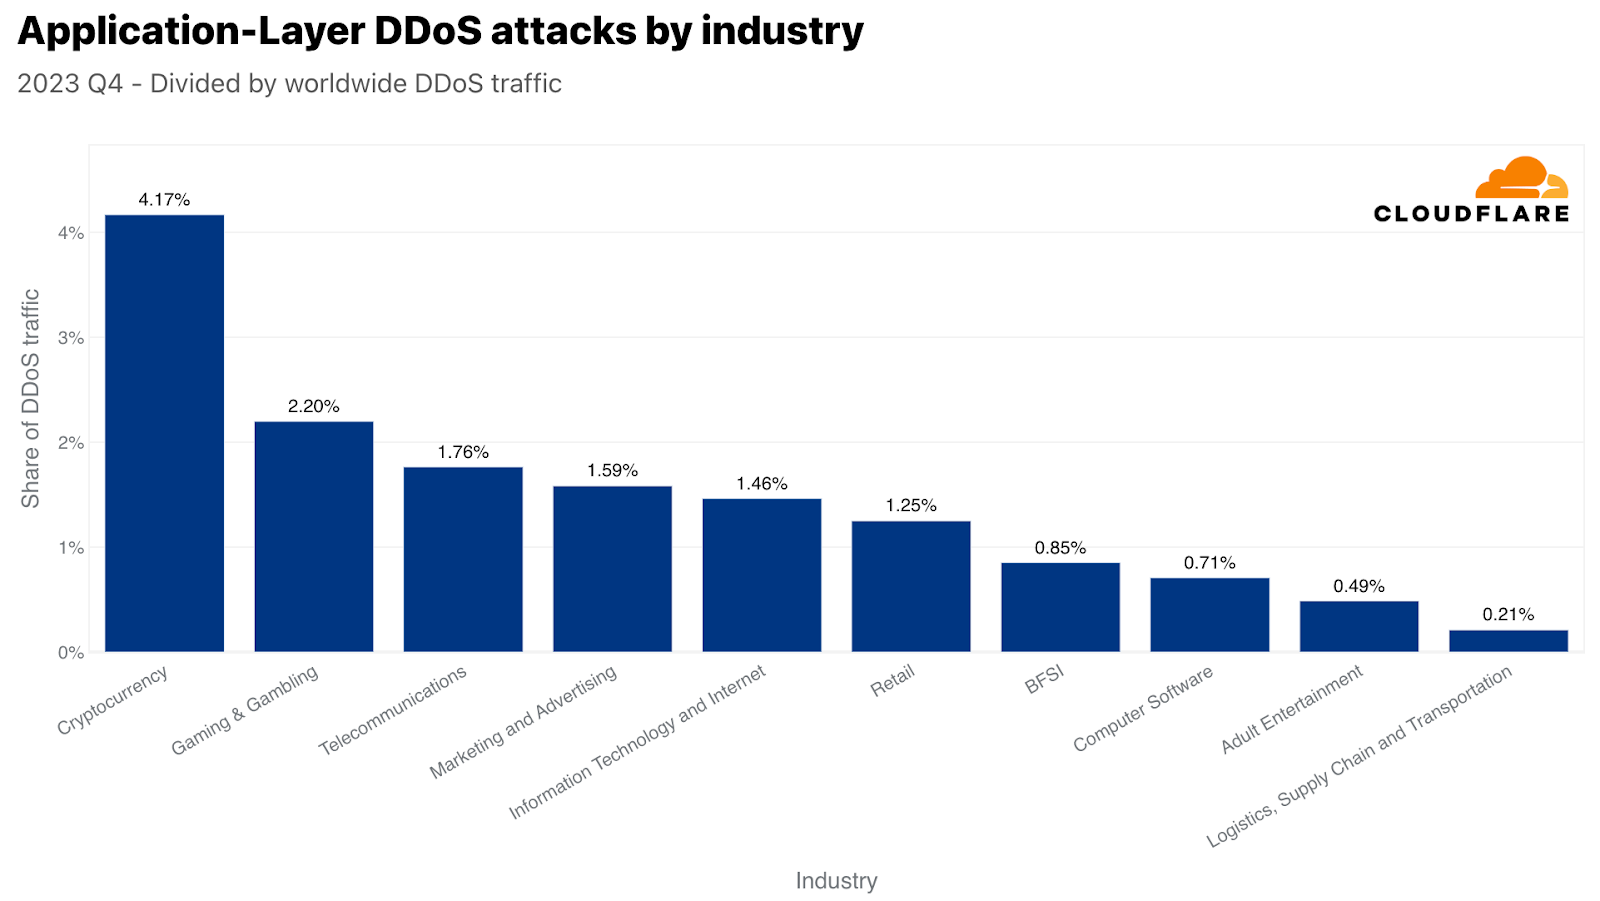
공격 트래픽 규모 기준으로 4분기에 가장 많이 공격을 받은 산업은 암호화폐 산업이었습니다. 3,300억 건 이상의 HTTP 요청이 이 산업을 겨냥했습니다. 이 수치는 해당 분기 전체 HTTP DDoS 트래픽의 4% 이상을 차지합니다. 두 번째로 공격을 많이 받은 산업은 게임 및 도박이었습니다. 이들 산업은 탐나는 표적으로 알려져 있으며 많은 트래픽과 공격을 유발합니다.

HTTP DDoS 공격의 표적이 된 상위 산업

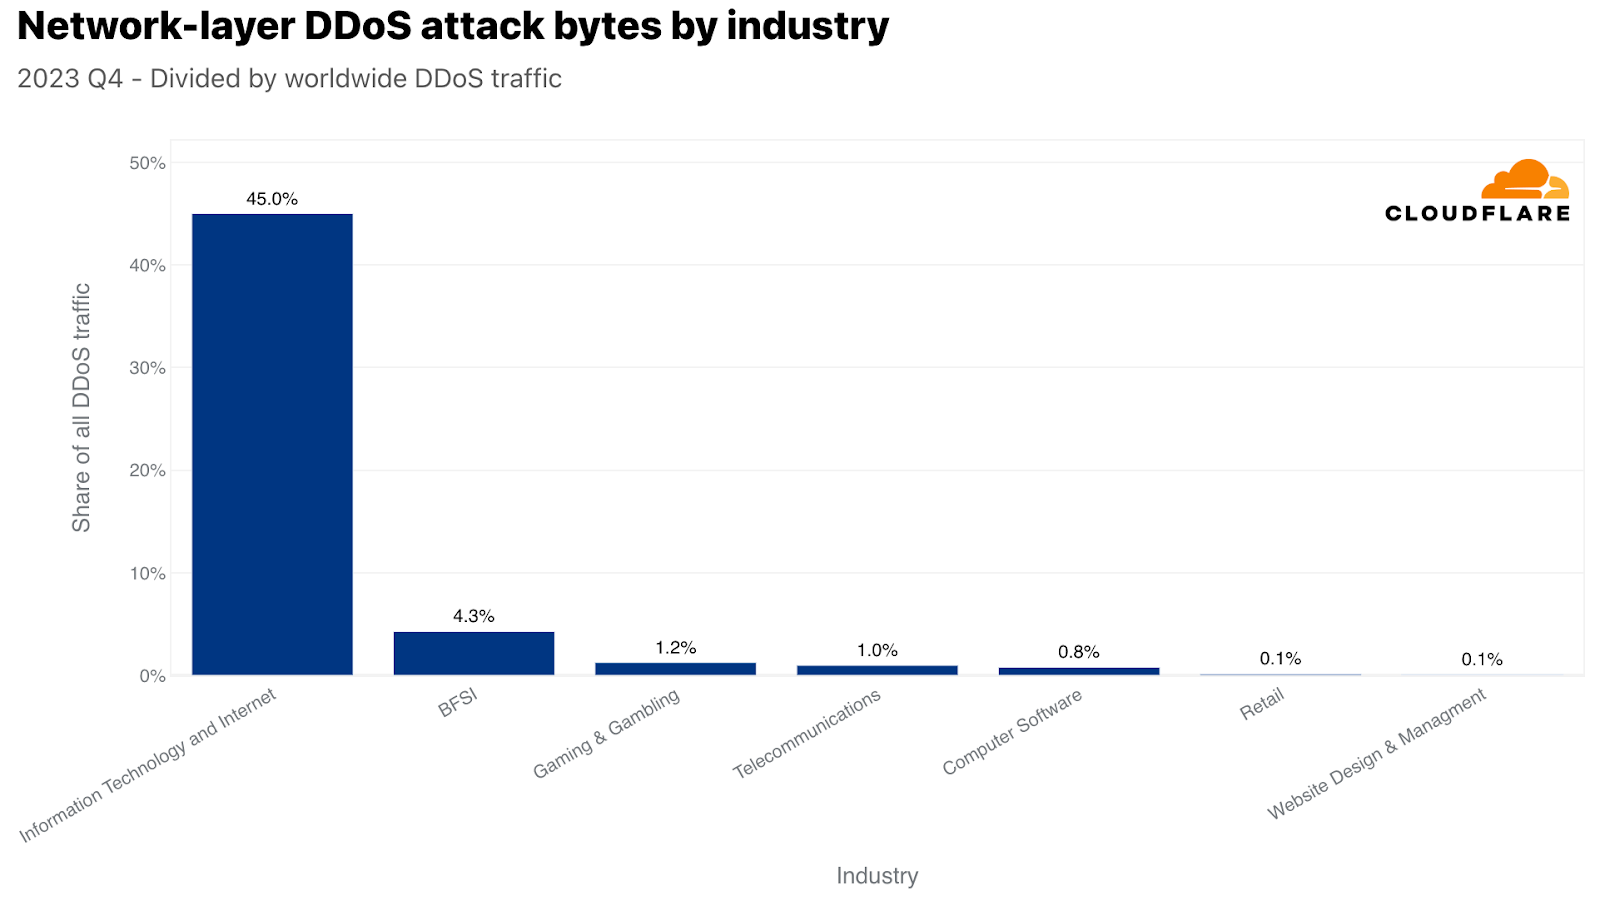
네트워크 계층에서는 정보 기술 및 인터넷 산업이 가장 많은 공격을 받았으며, 전체 네트워크 계층 DDoS 공격 트래픽의 45% 이상이 이 산업을 겨냥했습니다. 은행, 금융 서비스, 보험(BFSI), 게임 및 도박, 통신 산업이 그 뒤를 이었습니다.

네트워크 계층 DDoS 공격의 표적이 된 상위 산업

관점을 바꾸기 위해 여기에서도 공격 트래픽을 특정 산업의 전체 트래픽으로 정규화했습니다. 그럴 경우 그림이 달라집니다.

HTTP DDoS 공격으로 가장 많이 공격받은 산업, 지역별 현황

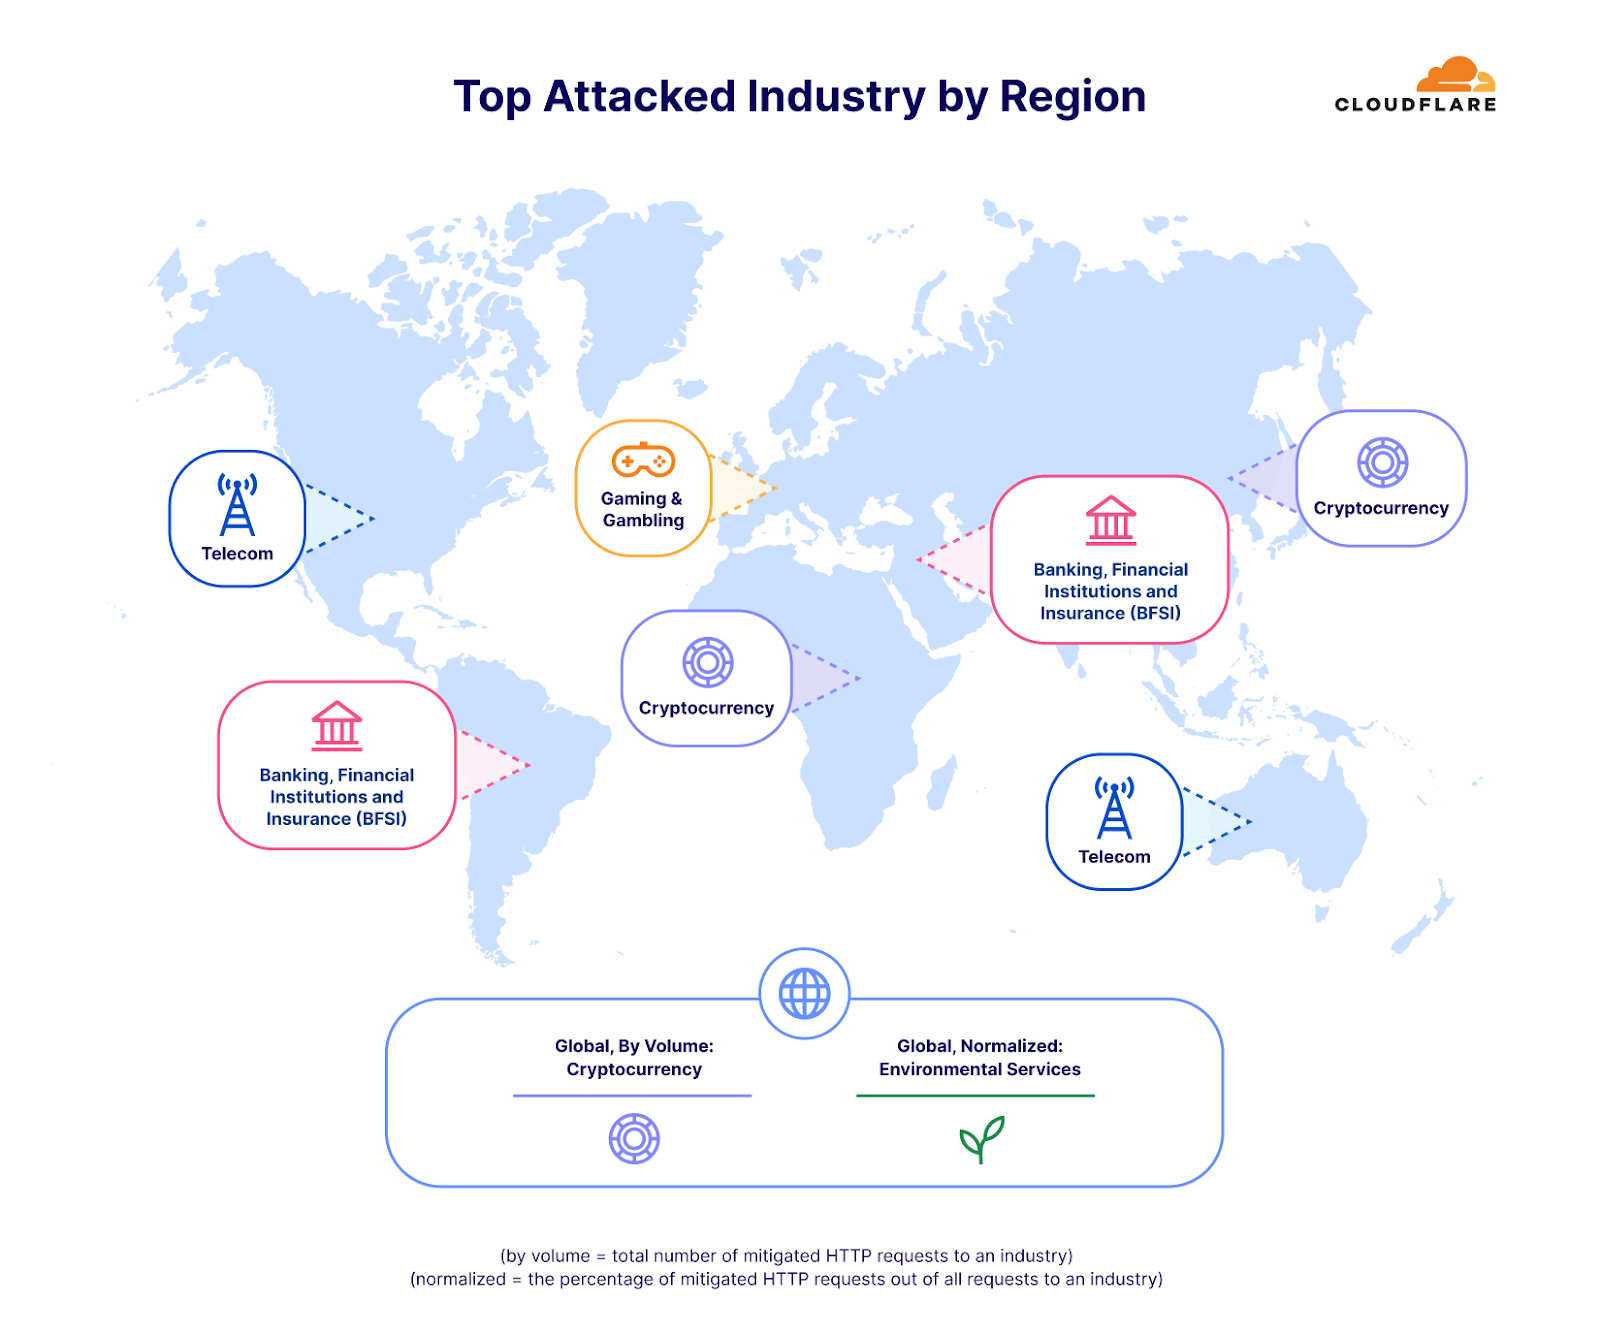
이 보고서의 서두에서 이미 환경 서비스 산업이 자체 트래픽 대비 가장 많은 공격을 받았다고 언급한 바 있습니다. 2위는 포장 및 화물 배송 산업으로, 블랙 프라이데이 및 겨울 휴가철 온라인 쇼핑과 시기상으로 상관관계가 있다는 점에서 흥미로웠습니다. 판매된 선물과 상품을 어떻게든 목적지에 보내야 하는데, 공격자가 이를 방해하려고 시도한 것으로 보입니다. 마찬가지로 소매업체에 대한 DDoS 공격도 전년 대비 23% 증가했습니다.

각 산업별 트래픽과 관련하여 HTTP DDoS 공격의 표적이 된 상위 산업

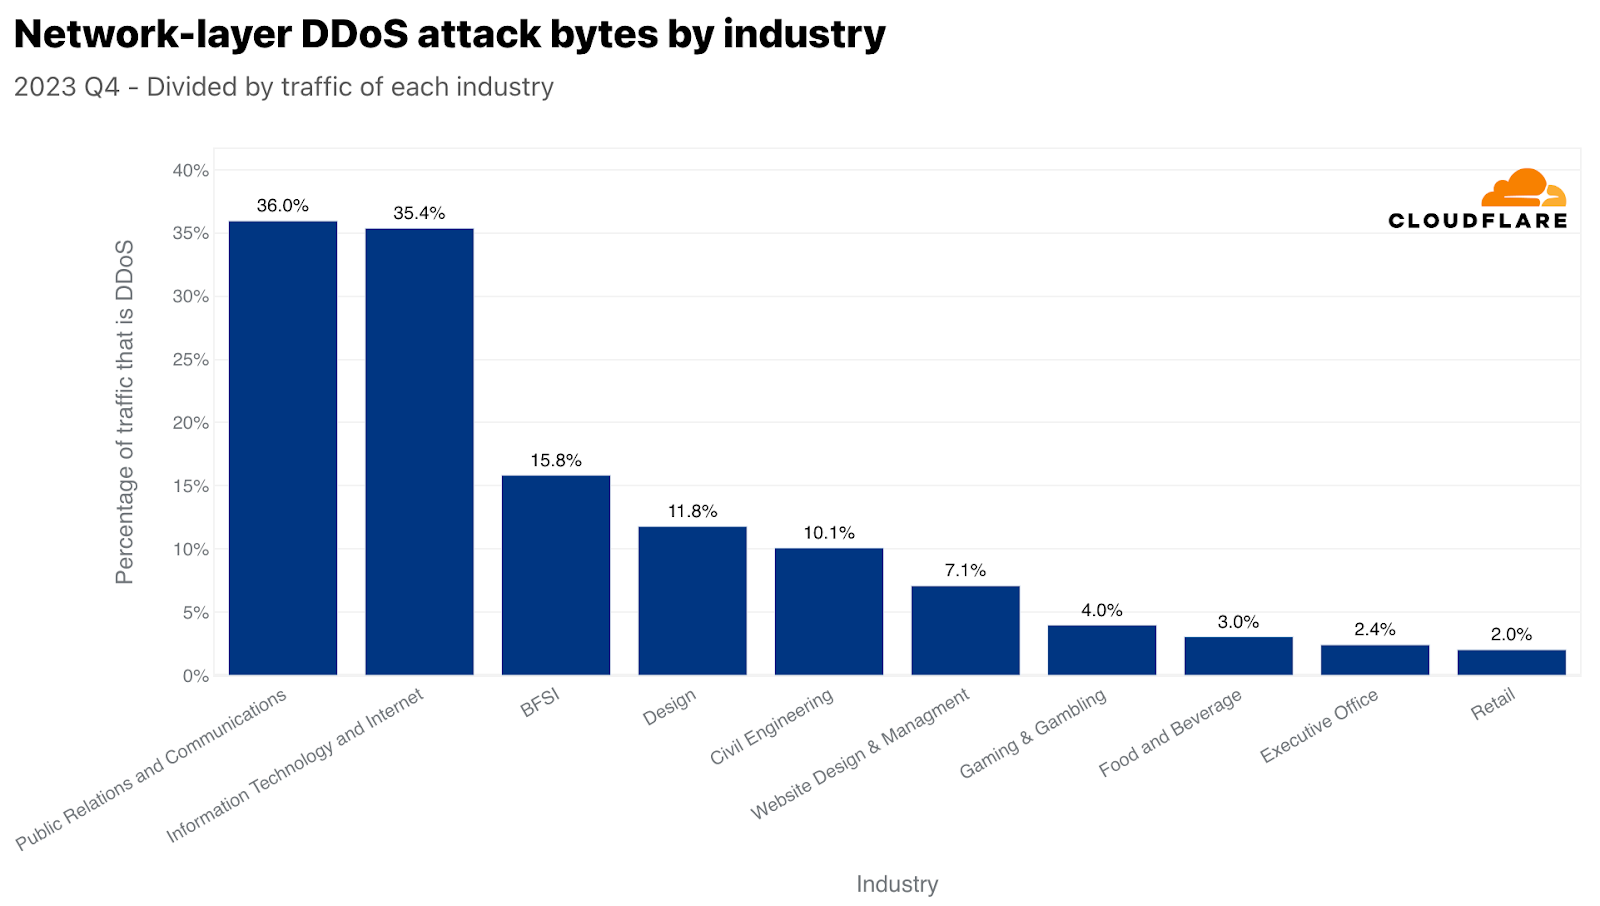
네트워크 계층에서 가장 많이 표적이 된 산업은 홍보 및 커뮤니케이션으로, 전체 트래픽의 36%가 악의적 트래픽이었습니다. 이 역시 시기를 고려할 때 매우 흥미롭습니다. 홍보 및 커뮤니케이션 기업은 일반적으로 대중의 인식 및 커뮤니케이션 관리와 관련이 있습니다. 이러한 기업의 운영이 중단되면 평판에 즉각적이고 광범위한 영향이 미칠 수 있으며, 이는 4분기 연말연시 시즌에 더욱 중요해집니다. 이 분기에는 휴일, 연말 결산, 새해 준비 등으로 인해 홍보 및 커뮤니케이션 활동이 증가하는 경우가 많습니다. 따라서 일부에서는 이 시기를 누군가가 업무를 방해하기를 원할 수 있는 중요한 운영 기간으로 여기기도 합니다.

각 산업 트래픽과 관련하여 네트워크 계층 DDoS 공격의 표적이 된 상위 산업

가장 많이 공격받은 국가 및 지역

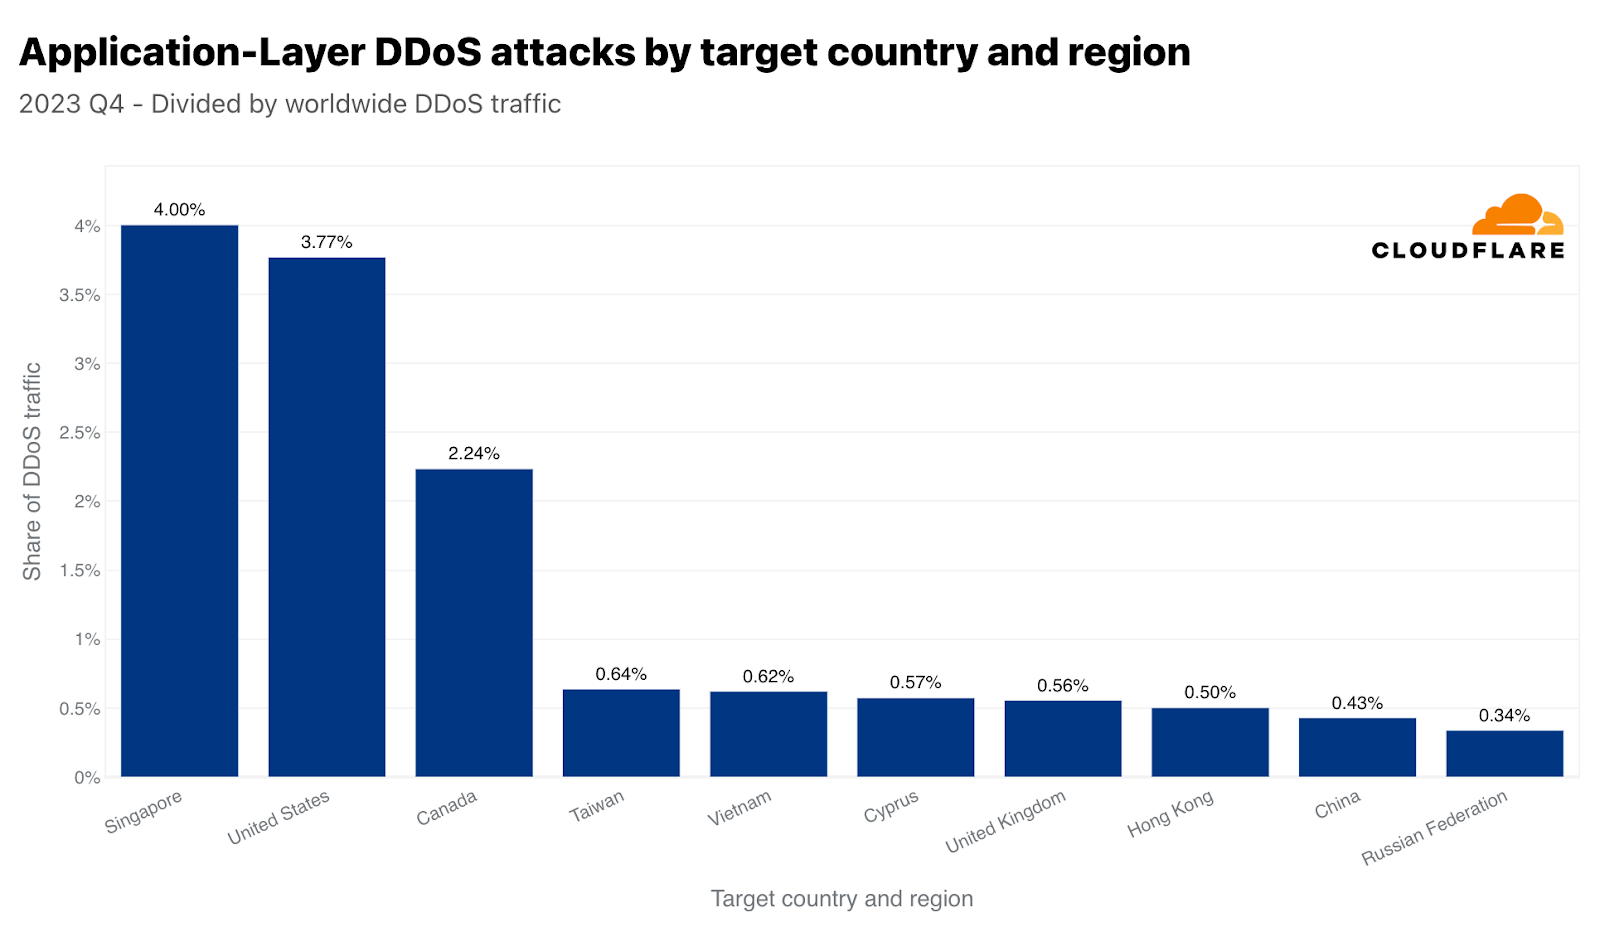
싱가포르는 4분기에 HTTP DDoS 공격의 주요 표적이었습니다. 전 세계 DDoS 트래픽의 4%인3,170억 건이 넘는 HTTP 요청이 싱가포르 웹 사이트를 겨냥했습니다. 뒤이어 미국이 2위, 캐나다가 3위를 차지했습니다. 대만은 다가오는 총선과 중국과의 긴장 관계로 인해 네 번째로 공격을 많이 받은 지역으로  기록되었습니다. 4분기에 대만을 향한 공격 트래픽은 전년 대비 847%, 전 분기 대비2,858% 증가했습니다. 이러한 증가는 절대값에만 국한되지 않습니다. 정규화했을 때, 대만을 향한 전체 트래픽 대비 대만을 겨냥한HTTP DDoS 공격 트래픽의 비율도 전 분기 대비 624%, 전년 동기 대비 3,370%로 크게 증가했습니다.

HTTP DDoS 공격 상위 대상 국가

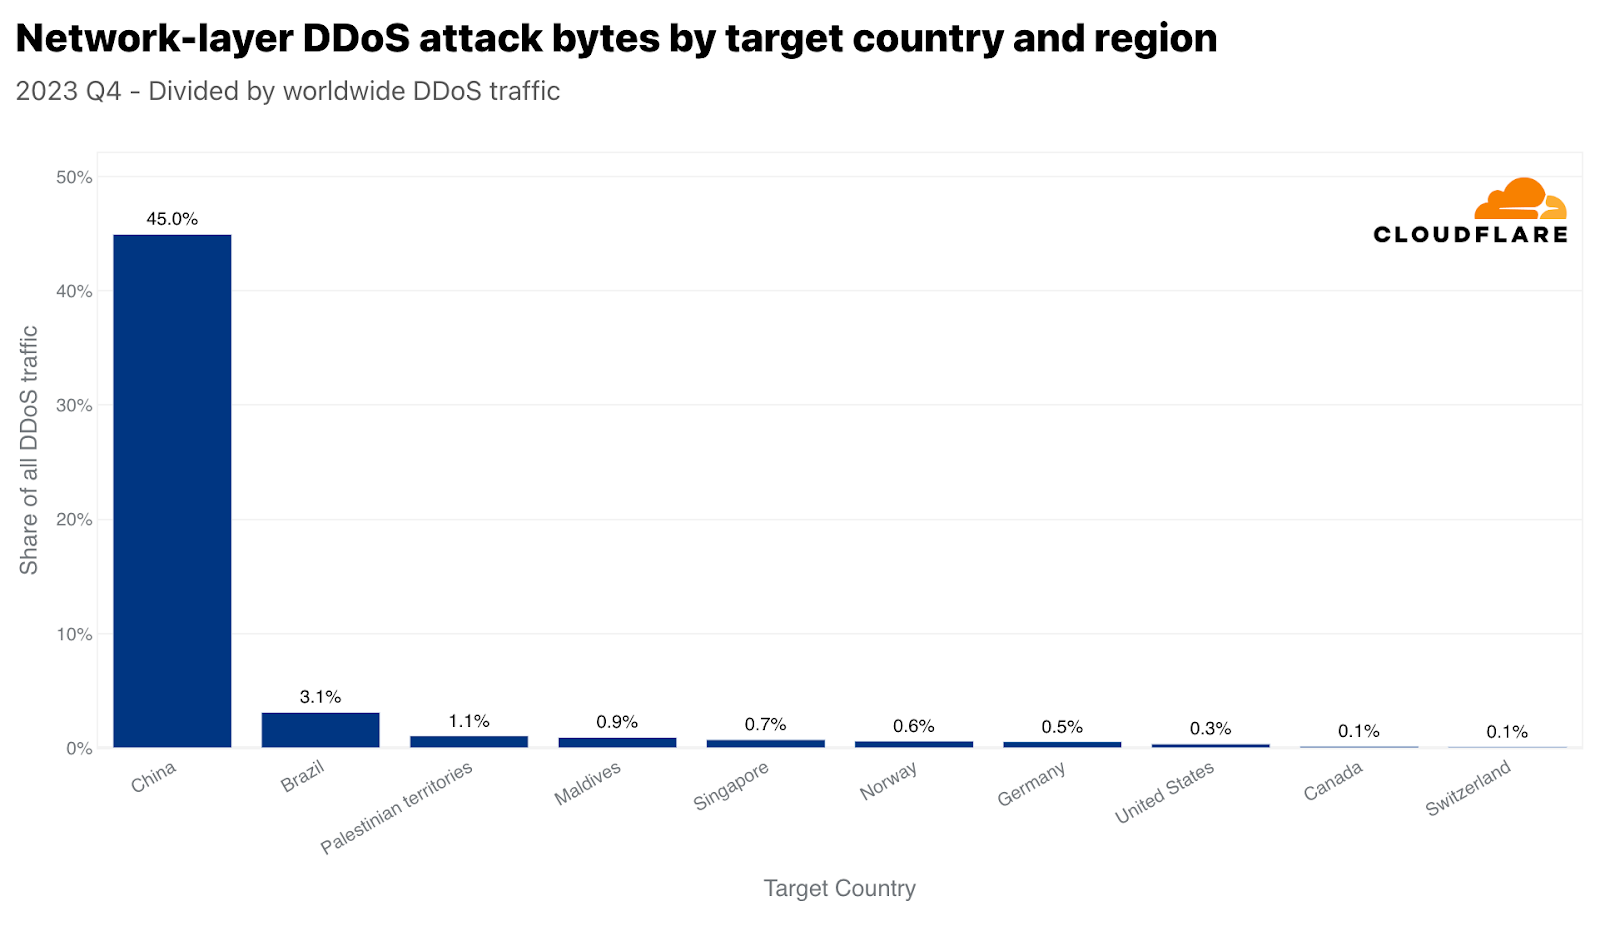
중국은 HTTP DDoS 공격을 가장 많이 받은 국가 중 9번째이지만, 네트워크 계층 공격을 가장 많이 받은 국가로는 1위에 올랐습니다. Cloudflare에서 전 세계에 걸쳐 완화한 모든 네트워크 계층 DDoS 트래픽의 45%가 중국을 향한 트래픽이었습니다. 나머지 국가들은 거의 무시할 수 있을 정도로 뒤져 있었습니다.

네트워크 계층 DDoS 공격을 받은 상위 대상 국가

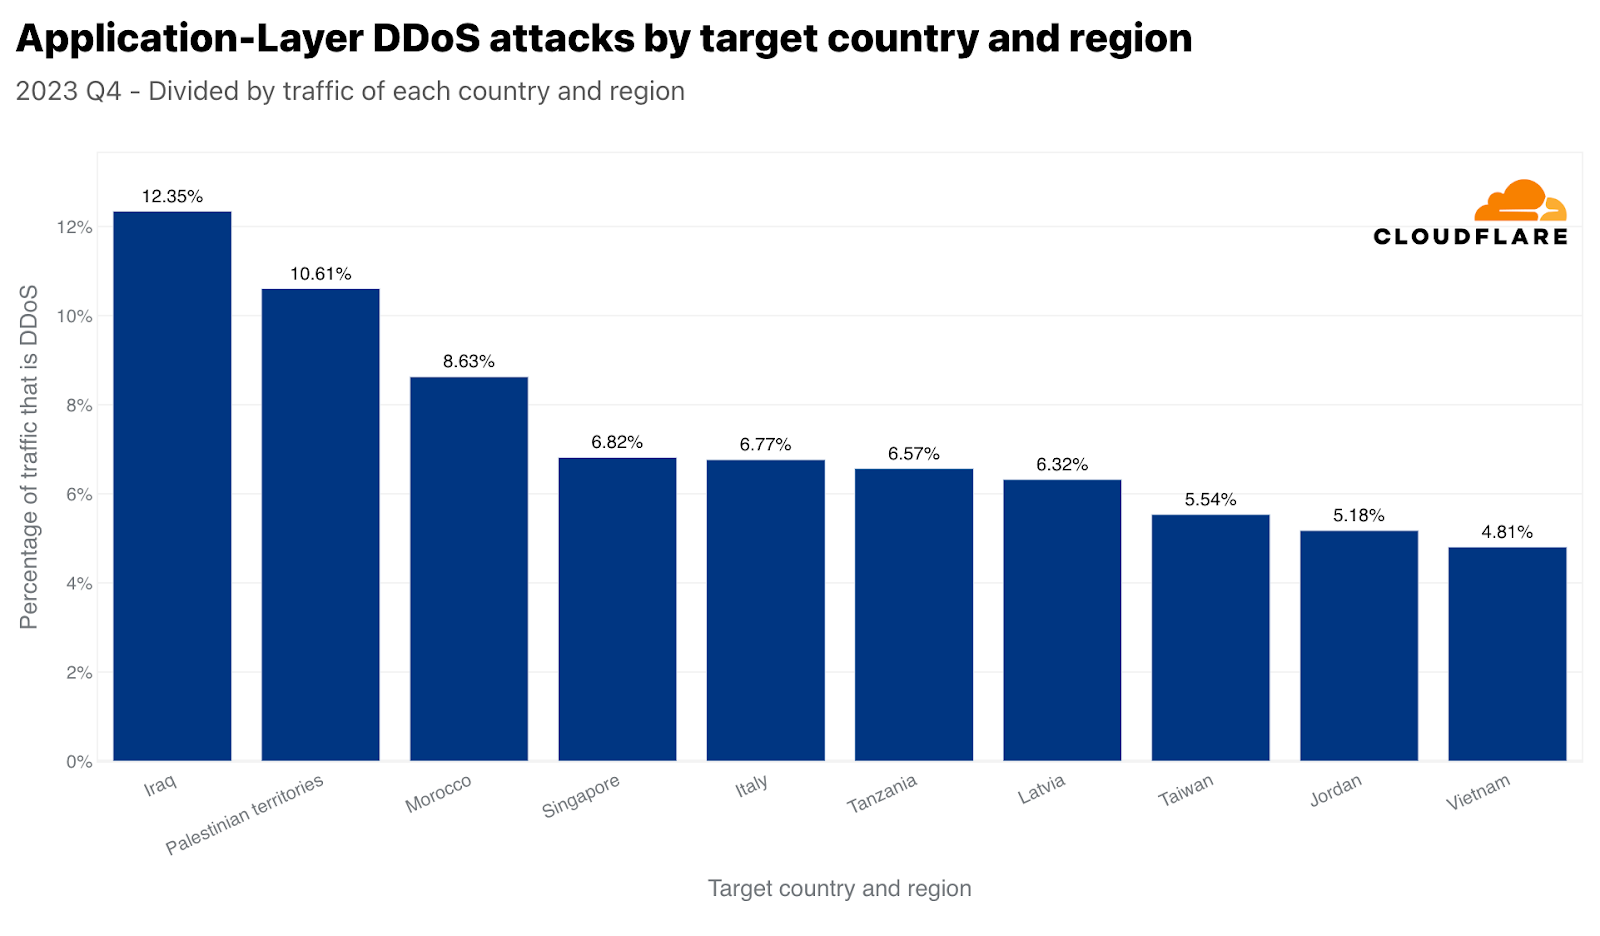
데이터를 정규화하면 이라크, 팔레스타인 지역, 모로코가 총 인바운드 트래픽 대비 가장 많은 공격을 받은 지역으로 나타났습니다. 흥미롭게도 싱가포르가 4위에 올랐습니다. 따라서 싱가포르는 가장 많은 양의 HTTP DDoS 공격 트래픽에 직면해 있을 뿐만 아니라 해당 트래픽은 싱가포르를 향한 전체 트래픽의 상당 부분을 차지합니다. 이와는 대조적으로, 미국은(위의 애플리케이션 계층 그래프에 따르면) 양적으로는 두 번째로 많은 공격을 받았지만, 미국으로 향하는 전체 트래픽을 기준으로 보면 50위에 그쳤습니다.

국가별 트래픽과 관련하여 HTTP DDoS 공격을 많이 받은 상위 국가

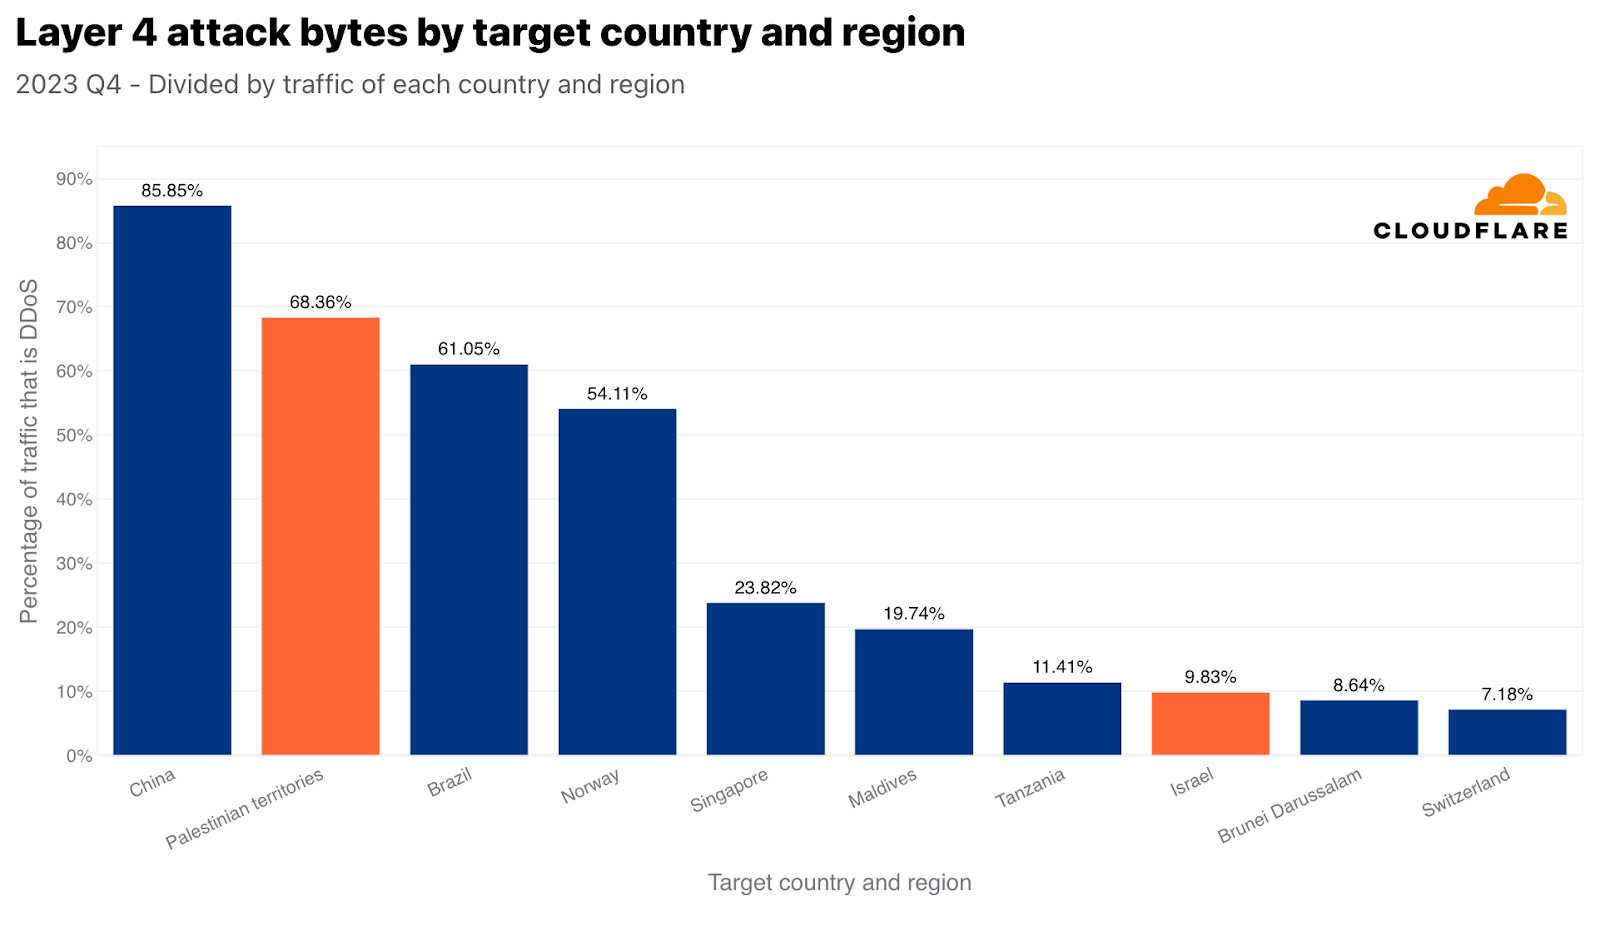
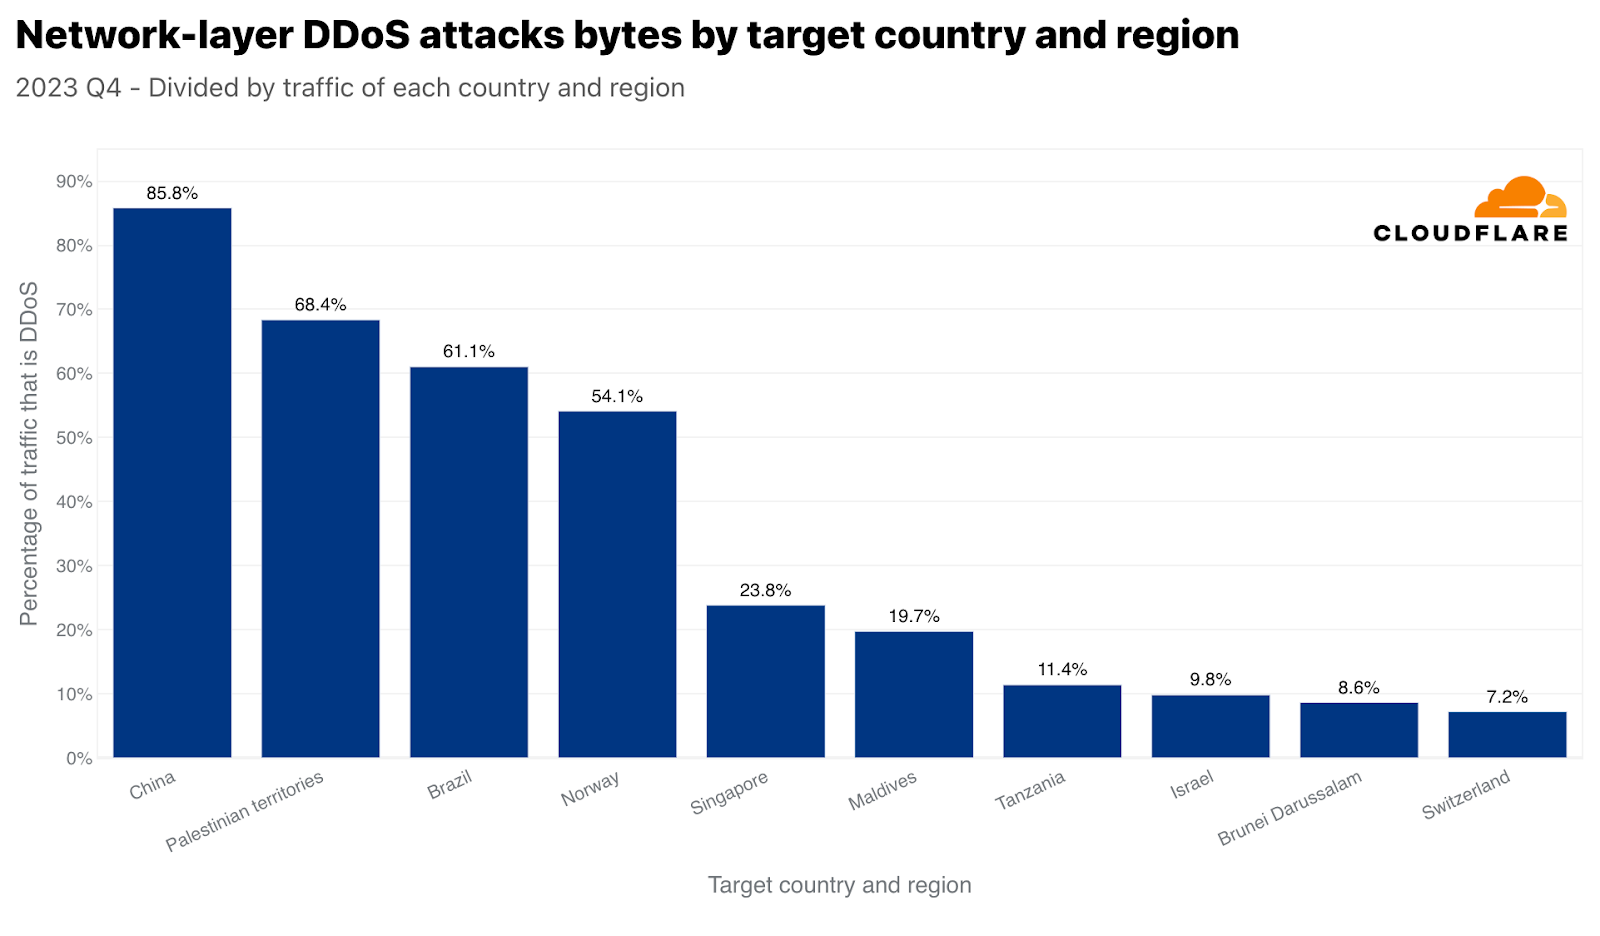
싱가포르와 유사하지만, 훨씬 더 극적일 수 있는 중국은 네트워크 계층 DDoS 공격 트래픽 및 중국으로 향하는 모든 트래픽에 있어서 가장 많이 공격받는 국가입니다. 중국으로 향하는 전체 트래픽의 거의 86%가 네트워크 계층 DDoS 공격으로, Cloudflare에 의해 완화되었습니다. 팔레스타인 지역, 브라질, 노르웨이, 그리고 다시 싱가포르가 공격 트래픽 비율이 높은 국가로 그 뒤를 이었습니다.

국가별 트래픽과 관련하여 네트워크 계층 DDoS 공격을 많이 받은 상위 국가

공격 벡터 및 속성

대부분의 DDoS 공격은 Cloudflare의 기준으로 볼 때 짧고 규모가 작습니다. 그러나 보호되지 않은 웹 사이트와 네트워크는 적절한 인라인 자동 보호 기능이 없으면 짧은 소규모의 공격으로도 중단될 수 있으며, 따라서 조직에서 강력한 보안 태세를 선제적으로 도입해야 할 필요성이 강조됩니다.

2023년 4분기에는 공격의 91%가 10분 이내에 종료되었고, 97%는 정점에서도 초당 500메가비트(mbps) 미만이었으며, 88%는 초당 5만 패킷(pps)을 넘은 적이 없었습니다.

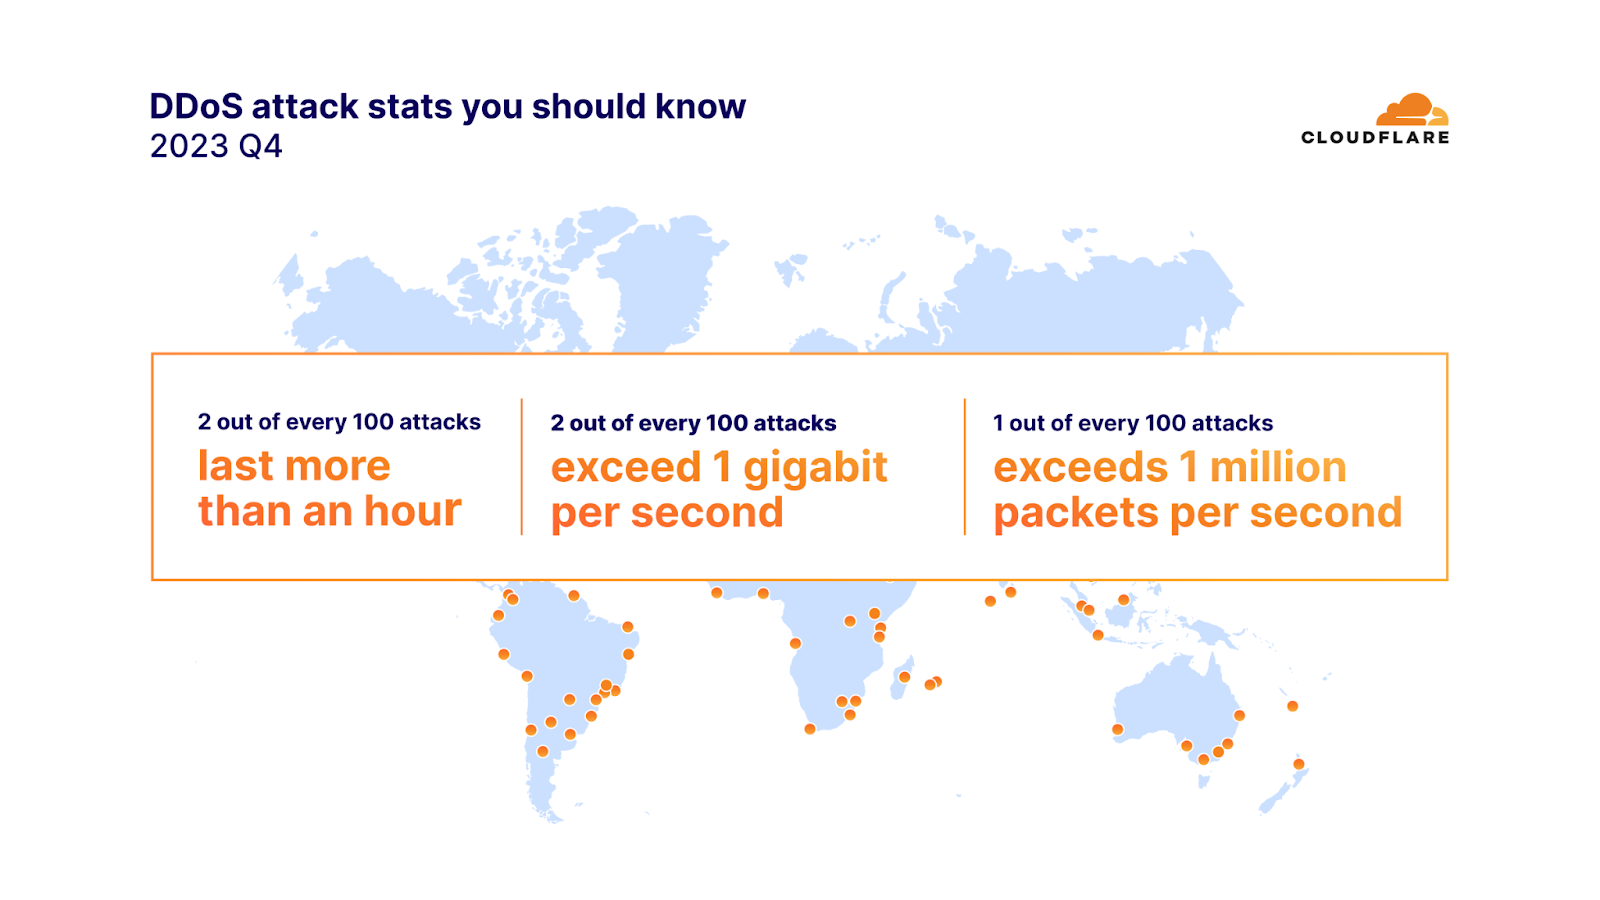
네트워크 계층 DDoS 공격 100건 중 2건은 1시간 이상 지속되었고, 초당 1기가비트(gbps)를 초과했습니다. 100건 중 1건의 공격이 초당 100만 패킷을 초과했습니다. 또한 초당 1억 패킷을 초과하는 네트워크 계층 DDoS 공격의 양은 전 분기 대비 15% 증가했습니다.

알아두어야 할 DDoS 공격 통계

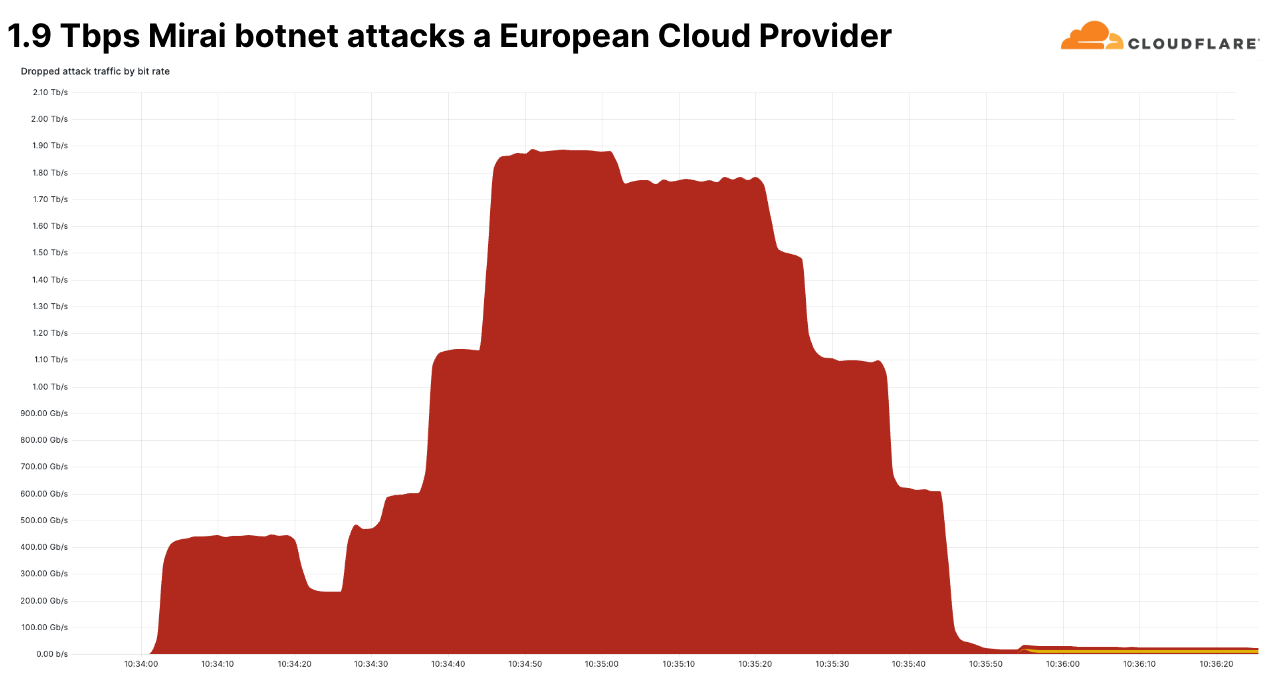
이러한 대규모 공격 중 하나는 초당 1억 6천만 개의 패킷을 전송한 Mirai 봇넷 공격이었습니다. 초당 패킷 전송량은 역대 최대가 아니었습니다. 역대 최대 규모는 초당 7억 5,400만 패킷이었습니다. 이 공격은 2020년에 발생했으며, 이보다 더 큰 규모의 공격은 아직 관찰된 적이 없습니다.

하지만 최근에 발생한 이 공격은 초당 비트 전송률이 특이했습니다. 이 공격은 4분기에 발생한 네트워크 계층 공격 중 가장 큰 규모의 DDoS 공격이었습니다. 이 공격은 초당 1.9 테라비트로 최고치를  기록했으며 Mirai 봇넷으로부터 시작되었습니다. 이 공격은 여러 가지 공격 방법이 결합된 멀티 벡터 공격이었습니다. 이러한 방법 중 일부에는 UDP 조각 폭주, UDP/Echo 폭주, SYN 폭주, ACK 폭주, TCP 기형 폭주가 포함되었습니다.

이 공격은 알려진 유럽 클라우드 공급자를 겨냥했으며, 스푸핑된 것으로 추정되는 18,000여 개의 고유 IP 주소에서 시작되었습니다. 이 공격은 Cloudflare의 방어 기능에서 자동으로 감지되어 완화되었습니다.

이는 최대 규모의 공격도 매우 빠르게 종료된다는 것을 보여줍니다. Cloudflare에서 확인한 이전의 대규모 공격들은 몇 초 만에 종료되었으므로 인라인 자동 방어 시스템의 필요성이 강조되었습니다. 아직은 드물지만, 테라비트 규모 범위의 공격이 점점 더 두드러지고 있습니다.

초당 1.9 테라비트 Mirai DDoS 공격

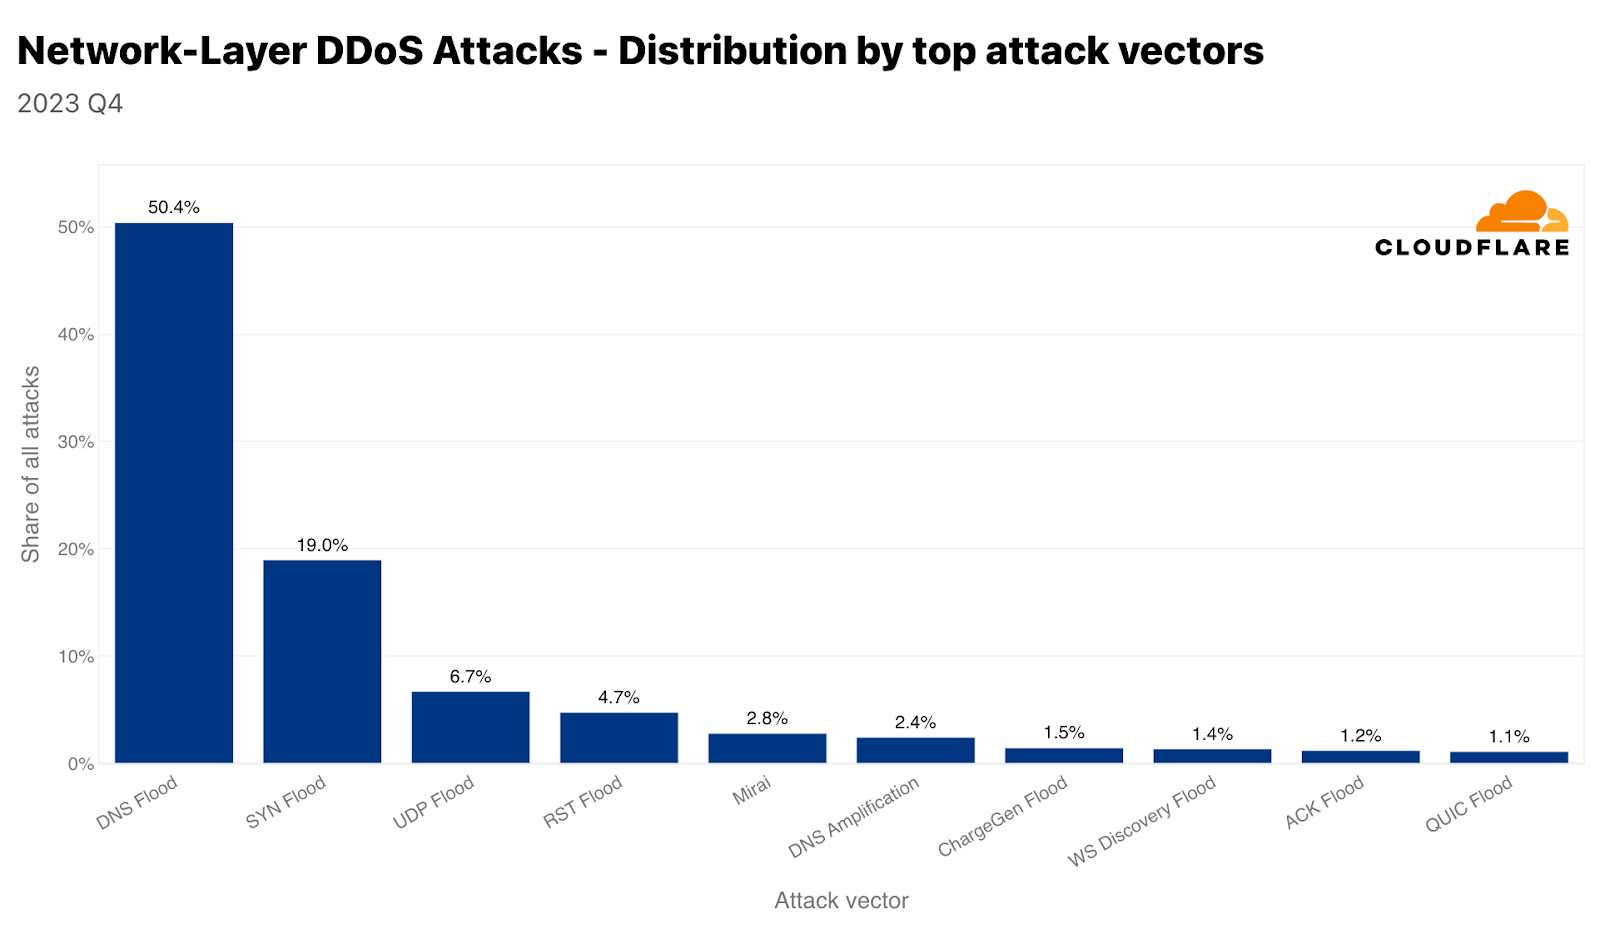
Mirai 변종 봇넷의 사용은 여전히 아주 흔합니다. 4분기에는 전체 공격의 약 3%가 Mirai에서 비롯되었습니다. 하지만 모든 공격 방법 중에서 DNS 기반 공격은 여전히 공격자들이 가장 선호하는 방법입니다. DNS 폭주와 DNS 증폭 공격을 합할 경우 4분기 전체 공격의 약 53%를 차지합니다. SYN 폭주가 뒤를 이어  2위, UDP 폭주가 3위를 차지했습니다. 여기에서는 두 가지 DNS 공격 유형에 대해 다루며, 학습 센터에서 하이퍼링크로 이동하여 UDP 폭주와 SYN 폭주에 대해 자세히 알아볼 수 있습니다.

DNS 폭주 및 증폭 공격

DNS 폭주와 DNS 증폭 공격은 모두 도메인 네임 시스템(DNS)을 악용하지만, 작동 방식은 다릅니다. DNS는 인터넷의 전화번호부와 같습니다. “www.cloudfare.com”과 같이 사람에게 친숙한 도메인 이름을 숫자로 된 IP 주소로 변환하며, 이를 컴퓨터가 네트워크에서 상호 식별하는 데 사용하는 합니다.

간단히 말해, DNS 기반 DDoS 공격은 실제로 서버를 ‘다운’시키지 않고도 컴퓨터와 서버가 서로를 식별하여 서비스 중단 또는 장애를 유발하는 방법입니다. 예를 들어 서버는 가동 중이지만, DNS 서버가 다운되었을 수 있습니다. 따라서 클라이언트는 DNS 서버에 연결할 수 없으며 중단을 경험하게 됩니다.

DNS 폭주 공격은 압도적인 수의 DNS 쿼리로 DNS 서버를 폭주시키는 공격입니다. 이는 일반적으로 DDoS 봇넷을 사용하여 수행됩니다. 엄청난 양의 쿼리로 DNS 서버가 압도되어 정상적인 쿼리에 응답하기 어렵거나 불가능하게 될 수 있습니다. 이로 인해 앞서 언급한 서비스 중단, 지연, 심지어는 웹 사이트나 공격 대상 DNS 서버에 의존하는 서비스에 액세스하려는 사용자의 서비스 중단이 발생할 수 있습니다.

반면, DNS 증폭 공격은 스푸핑된 IP 주소(피해자의 주소)가 포함된 작은 쿼리를 DNS 서버로 전송하는 것입니다. 여기서 비결은 DNS 응답이 요청보다 훨씬 크다는 것입니다. 그러면 서버는 이 큰 응답을 피해자의 IP 주소로 보냅니다. 공격자는 개방형 DNS 확인자를 악용하여 피해자에게 전송되는 트래픽의 양을 증폭시켜 훨씬 더 큰 영향을 미칠 수 있습니다. 이러한 유형의 공격은 피해자를 방해할 뿐만 아니라 전체 네트워크를 정체시킬 수 있습니다.

두 경우 모두 공격자는 네트워크 운영에서DNS의 중요한 역할을 악용합니다. 완화 전략에는 일반적으로 DNS 서버 오용 방지, 트래픽 관리를 위한 레이트 리미팅 구현, 악의적 요청 식별 및 차단을 위한 DNS 트래픽 필터링이 포함됩니다.

상위 공격 벡터

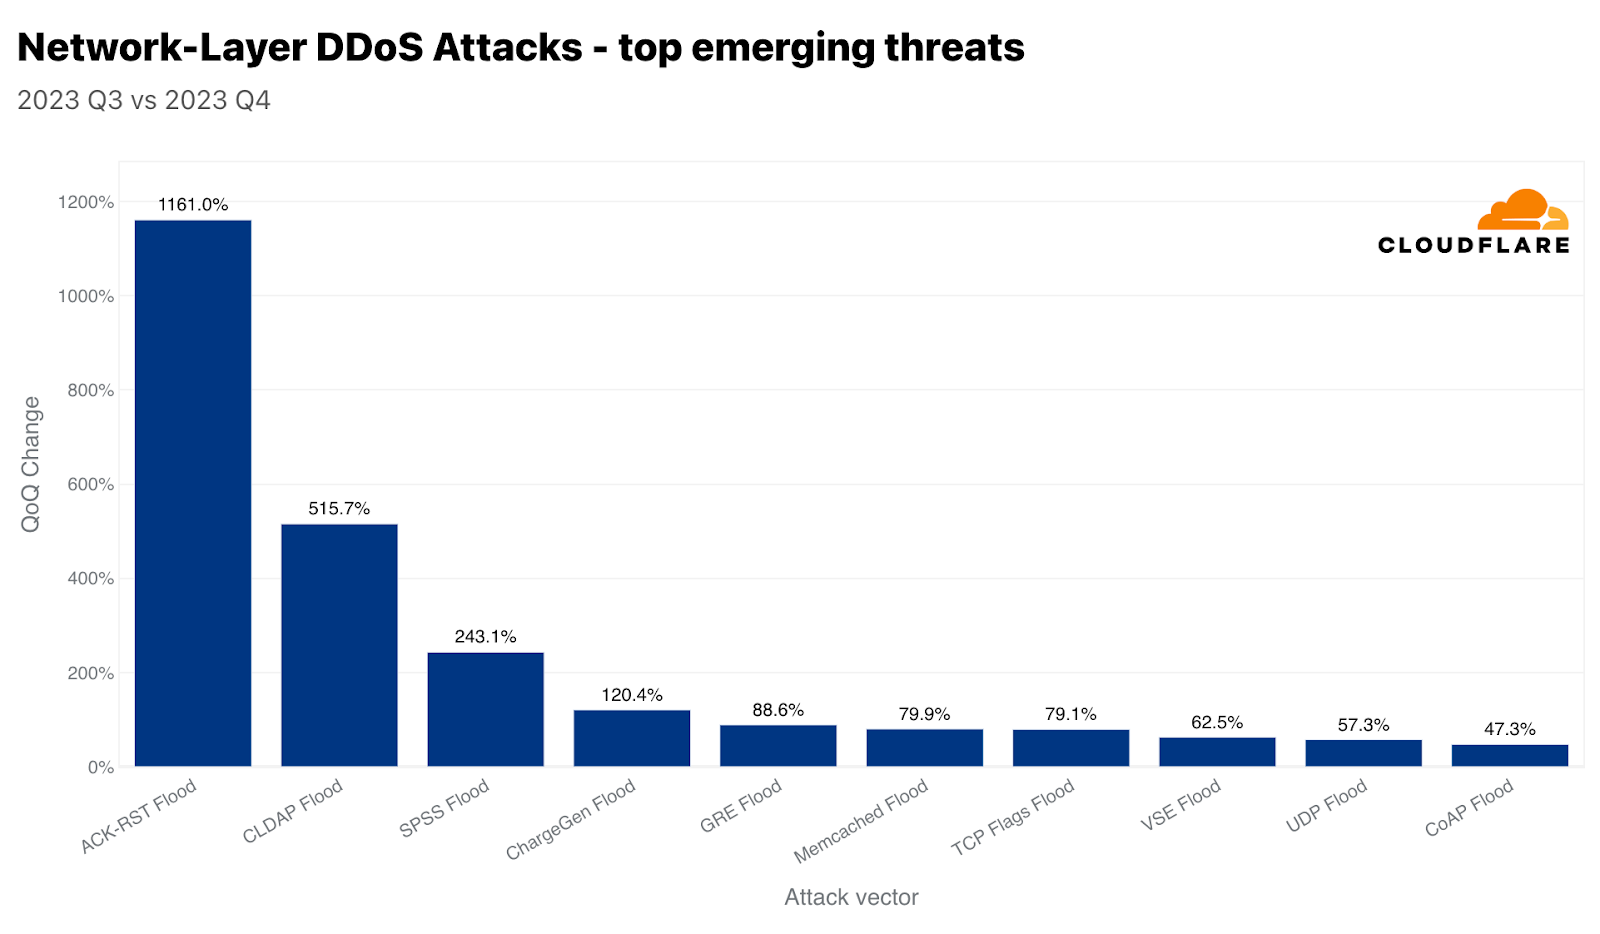
Cloudflare에서 추적하는, 새롭게 떠오르는 위협 중 지난 분기에 비해ACK-RST 폭주가 1,161%, CLDAP 폭주가 515%, SPSS 폭주가 243% 각각 증가했습니다. 이들 공격의 종류와 이들 공격이 어떻게 업무 중단을 유발하는지를 살펴보겠습니다.

새롭게 떠오르는 상위 공격 벡터

ACK-RST 폭주

ACK-RST 폭주는 피해자에게 많은 ACK 및 RST 패킷을 전송하여 전송 제어 프로토콜(TCP)을 악용합니다. 이로 인해 피해자가 이 패킷을 처리하고 응답하는 능력이 과부하되어 서비스 중단으로 이어집니다. 이 공격은 각 ACK 또는 RST 패킷이 피해자의 시스템에서 응답을 유도하여 리소스를 소모하기 때문에 효과적입니다. ACK-RST 폭주는 합법적인 트래픽을 모방하므로 필터링이 어려운 경우가 많아 감지 및 방어가 어렵습니다.

CLDAP 폭주

연결 없는 경량 디렉터리 액세스 프로토콜(CLDAP)는 경량 디렉터리 액세스 프로토콜(LDAP)의 변형입니다. CLDAP는 IP 네트워크에서 실행되는 디렉터리 서비스를 쿼리하고 수정하는 데 사용됩니다. CLDAP는 연결이 필요 없고 TCP 대신 UDP를 사용하므로 더 빠르지만, 안정성이 떨어집니다. UDP를 사용하므로 공격자가 IP 주소를 스푸핑할 수 있는 핸드셰이크가 필요하지 않으므로 공격자가 이를 반사 벡터로 악용할 수 있습니다. 이러한 공격에서는 스푸핑된 소스 IP 주소(피해자의 IP)로 작은 쿼리를 전송하여 서버가 피해자에게 대량의 응답을 전송하여 서버를 과부하시키도록 합니다. 완화 조치에는 비정상적인 CLDAP 트래픽을 필터링하고 모니터링하는 것이 포함됩니다.

SPSS 폭주

Source Port Service Sweep(SPSS) 프로토콜을 악용하는 폭주는 무작위 또는 스푸핑된 많은 원본 포트에서 표적 시스템 또는 네트워크의 다양한 대상 포트로 패킷을 전송하는 네트워크 공격 방법입니다. 이 공격의 목적은 두 가지입니다. 첫째, 피해자의 처리 능력을 압도하여 서비스 중단 또는 네트워크 중단을 유발하고, 둘째, 열린 포트를 검색하고 취약한 서비스를 식별하는 데 사용하는 것입니다. 폭주는 대량의 패킷을 전송하여 피해자의 네트워크 리소스를 포화시키고 방화벽과 침입 감지 시스템의 용량을 소진시켜 이루어질 수 있습니다. 이 공격을 완화하려면 인라인 자동 감지 기능을 활용하는 것이 필수적입니다.

공격 유형, 규모, 기간과 관계없이 Cloudflare에서 지원합니다

Cloudflare의 사명은 더 나은 인터넷을 구축하는 것이며, 더 나은 인터넷이란 안전하고 성능이 뛰어나며 누구나 이용할 수 있는 인터넷이라고 믿습니다. 공격 유형, 공격 규모, 공격 지속 시간, 공격의 동기와 상관없이 Cloudflare의 방어는 강력합니다. Cloudflare에서는 2017년 무제한 DDoS 방어를 선도적으로 출시한 이래, 모든 조직에서 성능 저하 없이 엔터프라이즈급 DDoS 방어를 무료로 이용할 수 있도록 하겠다는 약속을 지키기 위해 노력해 왔습니다. 이러한 약속을 지킬 수 있었던 것은 Cloudflare의 독보적인 기술과 강력한 네트워크 아키텍처 덕분입니다.

보안은 하나의 제품이나 스위치 하나로 해결되는 것이 아니라 하나의 프로세스라는 점을 기억해야 합니다. 자동화된DDoS 방어 시스템 외에도 우리는 방화벽, 봇 감지, API 보호, 캐싱 등의 포괄적인 기능을 번들로 제공하여 방어 체계를 강화합니다. Cloudflare에서는 다계층 접근 방식을 통해 보안 태세를 최적화하고 잠재적 영향을 최소화합니다. 또한  DDoS 공격에 대한 방어를 최적화하는 데 도움이 되는 권장 사항 목록을 마련했으며, 고객은 단계별 마법사를 따라 애플리케이션을 보호하고 DDoS 공격을 방지할 수 있습니다. DDoS 및 기타 인터넷 공격에 대한 업계 최고의 보호 기능을 간편하게 이용하고 싶으시면 Cloudflare.com에서 무료로 가입하실 수 있습니다! 공격을 받고 있다면 여기에 표시된 사이버 긴급 핫라인 번호로 등록하거나 전화하여 신속하게 대응하세요.

Serverless ICYMI Q4 2023

Post Syndicated from Eric Johnson original https://aws.amazon.com/blogs/compute/serverless-icymi-q4-2023/

Welcome to the 24th edition of the AWS Serverless ICYMI (in case you missed it) quarterly recap. Every quarter, we share all the most recent product launches, feature enhancements, blog posts, webinars, live streams, and other interesting things that you might have missed!

In case you missed our last ICYMI, check out what happened last quarter here.

2023 Q4 Calendar

2023 Q4 Calendar

ServerlessVideo

ServerlessVideo at re:Invent 2024

ServerlessVideo at re:Invent 2024

ServerlessVideo is a demo application built by the AWS Serverless Developer Advocacy team to stream live videos and also perform advanced post-video processing. It uses several AWS services including AWS Step Functions, Amazon EventBridge, AWS Lambda, Amazon ECS, and Amazon Bedrock in a serverless architecture that makes it fast, flexible, and cost-effective. Key features include an event-driven core with loosely coupled microservices that respond to events routed by EventBridge. Step Functions orchestrates using both Lambda and ECS for video processing to balance speed, scale, and cost. There is a flexible plugin-based architecture using Step Functions and EventBridge to integrate and manage multiple video processing workflows, which include GenAI.

ServerlessVideo allows broadcasters to stream video to thousands of viewers using Amazon IVS. When a broadcast ends, a Step Functions workflow triggers a set of configured plugins to process the video, generating transcriptions, validating content, and more. The application incorporates various microservices to support live streaming, on-demand playback, transcoding, transcription, and events. Learn more about the project and watch videos from reinvent 2023 at video.serverlessland.com.

AWS Lambda

AWS Lambda enabled outbound IPv6 connections from VPC-connected Lambda functions, providing virtually unlimited scale by removing IPv4 address constraints.

The AWS Lambda and AWS SAM teams also added support for sharing test events across teams using AWS SAM CLI to improve collaboration when testing locally.

AWS Lambda introduced integration with AWS Application Composer, allowing users to view and export Lambda function configuration details for infrastructure as code (IaC) workflows.

AWS added advanced logging controls enabling adjustable JSON-formatted logs, custom log levels, and configurable CloudWatch log destinations for easier debugging. AWS enabled monitoring of errors and timeouts occurring during initialization and restore phases in CloudWatch Logs as well, making troubleshooting easier.

For Kafka event sources, AWS enabled failed event destinations to prevent functions stalling on failing batches by rerouting events to SQS, SNS, or S3. AWS also enhanced Lambda auto scaling for Kafka event sources in November to reach maximum throughput faster, reducing latency for workloads prone to large bursts of messages.

AWS launched support for Python 3.12 and Java 21 Lambda runtimes, providing updated libraries, smaller deployment sizes, and better AWS service integration. AWS also introduced a simplified console workflow to automate complex network configuration when connecting functions to Amazon RDS and RDS Proxy.

Additionally in December, AWS enabled faster individual Lambda function scaling allowing each function to rapidly absorb traffic spikes by scaling up to 1000 concurrent executions every 10 seconds.

Amazon ECS and AWS Fargate

In Q4 of 2023, AWS introduced several new capabilities across its serverless container services including Amazon ECS, AWS Fargate, AWS App Runner, and more. These features help improve application resilience, security, developer experience, and migration to modern containerized architectures.

In October, Amazon ECS enhanced its task scheduling to start healthy replacement tasks before terminating unhealthy ones during traffic spikes. This prevents going under capacity due to premature shutdowns. Additionally, App Runner launched support for IPv6 traffic via dual-stack endpoints to remove the need for address translation.

In November, AWS Fargate enabled ECS tasks to selectively use SOCI lazy loading for only large container images in a task instead of requiring it for all images. Amazon ECS also added idempotency support for task launches to prevent duplicate instances on retries. Amazon GuardDuty expanded threat detection to Amazon ECS and Fargate workloads which users can easily enable.

Also in November, the open source Finch container tool for macOS became generally available. Finch allows developers to build, run, and publish Linux containers locally. A new website provides tutorials and resources to help developers get started.

Finally in December, AWS Migration Hub Orchestrator added new capabilities for replatforming applications to Amazon ECS using guided workflows. App Runner also improved integration with Route 53 domains to automatically configure required records when associating custom domains.

AWS Step Functions

In Q4 2023, AWS Step Functions announced the redrive capability for Standard Workflows. This feature allows failed workflow executions to be redriven from the point of failure, skipping unnecessary steps and reducing costs. The redrive functionality provides an efficient way to handle errors that require longer investigation or external actions before resuming the workflow.

Step Functions also launched support for HTTPS endpoints in AWS Step Functions, enabling easier integration with external APIs and SaaS applications without needing custom code. Developers can now connect to third-party HTTP services directly within workflows. Additionally, AWS released a new test state capability that allows testing individual workflow states before full deployment. This feature helps accelerate development by making it faster and simpler to validate data mappings and permissions configurations.

AWS announced optimized integrations between AWS Step Functions and Amazon Bedrock for orchestrating generative AI workloads. Two new API actions were added specifically for invoking Bedrock models and training jobs from workflows. These integrations simplify building prompt chaining and other techniques to create complex AI applications with foundation models.

Finally, the Step Functions Workflow Studio is now integrated in the AWS Application Composer. This unified builder allows developers to design workflows and define application resources across the full project lifecycle within a single interface.

Amazon EventBridge

Amazon EventBridge announced support for new partner integrations with Adobe and Stripe. These integrations enable routing events from the Adobe and Stripe platforms to over 20 AWS services. This makes it easier to build event-driven architectures to handle common use cases.

Amazon SNS

In Q4, Amazon SNS added native in-place message archiving for FIFO topics to improve event stream durability by allowing retention policies and selective replay of messages without provisioning separate resources. Additional message filtering operators were also introduced including suffix matching, case-insensitive equality checks, and OR logic for matching across properties to simplify routing logic implementation for publishers and subscribers. Finally, delivery status logging was enabled through AWS CloudFormation.

Amazon SQS

Amazon SQS has introduced several major new capabilities and updates. These improve visibility, throughput, and message handling for users. Specifically, Amazon SQS enabled AWS CloudTrail logging of key SQS APIs. This gives customers greater visibility into SQS activity. Additionally, SQS increased the throughput quota for the high throughput mode of FIFO queues. This was significantly increased in certain Regions. It also boosted throughput in Asia Pacific Regions. Furthermore, Amazon SQS added dead letter queue redrive support. This allows you to redrive messages that failed and were sent to a dead letter queue (DLQ).

Serverless at AWS re:Invent

Serverless videos from re:Invent

Serverless videos from re:Invent

Visit the Serverless Land YouTube channel to find a list of serverless and serverless container sessions from reinvent 2023. Hear from experts like Chris Munns and Julian Wood in their popular session, Best practices for serverless developers, or Nathan Peck and Jessica Deen in Deploying multi-tenant SaaS applications on Amazon ECS and AWS Fargate.

EDA Day Nashville

EDA Day Nashville

EDA Day Nashville

The AWS Serverless Developer Advocacy team hosted an event-driven architecture (EDA) day conference on October 26, 2022 in Nashville, Tennessee. This inaugural GOTO EDA day convened over 200 attendees ranging from prominent EDA community members to AWS speakers and product managers. Attendees engaged in 13 sessions, two workshops, and panels covering EDA adoption best practices. The event built upon 2022 content by incorporating additional topics like messaging, containers, and machine learning. It also created opportunities for students and underrepresented groups in tech to participate. The full-day conference facilitated education, inspiration, and thoughtful discussion around event-driven architectural patterns and services on AWS.

Videos from EDA Day are now available on the Serverless Land YouTube channel.

Serverless blog posts

October

November

December

Serverless container blog posts

October

November

December

Serverless Office Hours

Serverless office hours: Q4 videos

October

November

December

Containers from the Couch

Containers from the Couch

October

November

December

FooBar

FooBar

October

November

December

Still looking for more?

The Serverless landing page has more information. The Lambda resources page contains case studies, webinars, whitepapers, customer stories, reference architectures, and even more Getting Started tutorials.

You can also follow the Serverless Developer Advocacy team on Twitter to see the latest news, follow conversations, and interact with the team.

And finally, visit the Serverless Land and Containers on AWS websites for all your serverless and serverless container needs.

PIN-Stealing Android Malware

Post Syndicated from Bruce Schneier original https://www.schneier.com/blog/archives/2024/01/pin-stealing-android-malware.html

This is an old piece of malware—the Chameleon Android banking Trojan—that now disables biometric authentication in order to steal the PIN:

The second notable new feature is the ability to interrupt biometric operations on the device, like fingerprint and face unlock, by using the Accessibility service to force a fallback to PIN or password authentication.

The malware captures any PINs and passwords the victim enters to unlock their device and can later use them to unlock the device at will to perform malicious activities hidden from view.

Happy New Year! AWS Weekly Roundup – January 8, 2024

Post Syndicated from Channy Yun original https://aws.amazon.com/blogs/aws/happy-new-year-aws-weekly-roundup-january-8-2024/

Happy New Year! Cloud technologies, machine learning, and generative AI have become more accessible, impacting nearly every aspect of our lives. Amazon CTO Dr. Werner Vogels offers four tech predictions for 2024 and beyond:

  • Generative AI becomes culturally aware
  • FemTech finally takes off
  • AI assistants redefine developer productivity
  • Education evolves to match the speed of technology

Read how these technology trends will converge to help solve some of society’s most difficult problems. Download the Werner Vogels’ Tech Predictions for 2024 and Beyond ebook or read Werner’s All Things Distributed blog.

AWS re:Invent 2023To hear insights from AWS and industry thought leaders, grow your skills, and get inspired, watch AWS re:Invent 2023 videos on demand for keynotes, innovation talks, breakout sessions, and AWS Hero guide playlists.

Launches from the last few weeks
Since our last week in review on December 18, 2023, I’d like to highlight some launches from year end, as well as last week:

New AWS Canada West (Calgary) Region – We are opening a new and second Region and in Canada, AWS Canada West (Calgary). At the end of 2023, AWS had 33 AWS Regions and 105 Availability Zones (AZs) globally. We preannounced 12 additional AZs in four future Regions in Malaysia, New Zealand, Thailand, and the AWS European Sovereign Cloud. We will share more information on these Regions in 2024. Please stay tuned.

DNS over HTTPS in Amazon Route 53 Resolver – You can use the DNS over HTTPS (DoH) protocol for both inbound and outbound Route 53 Resolver endpoints. As the name suggests, DoH supports HTTP or HTTP/2 over TLS to encrypt the data exchanged for Domain Name System (DNS) resolutions.

Automatic enrollment to Amazon RDS Extended Support – Your MySQL 5.7 and PostgreSQL 11 database instances running on Amazon Aurora and Amazon RDS will be automatically enrolled into Amazon RDS Extended Support starting on February 29, 2024. You can have more control over when you want to upgrade the major version of your database after the community end of life (EoL).

New Amazon CloudWatch Network Monitor – This is a new feature of Amazon CloudWatch that helps monitor network availability and performance between AWS and your on-premises environments. Network Monitor needs zero manual instrumentation and gives you access to real-time network visibility to proactively and quickly identify issues within the AWS network and your own hybrid environment. For more information, read Monitor hybrid connectivity with Amazon CloudWatch Network Monitor.

Amazon Aurora PostgreSQL integrations with Amazon Bedrock – You can use two methods to integrate Aurora PostgreSQL databases with Amazon Bedrock to power generative AI applications. You can use the SQL query with Aurora ML integration with Amazon Bedrock and Aurora vector store with Knowledge Bases for Amazon Bedrock for Retrieval Augmented Generation (RAG).

New WordPress setup on Amazon Lightsail – Set up your WordPress website on Amazon Lightsail with the new workflow to eliminate complexity and time spent configuring your website. The workflow allows you to complete all the necessary steps, including setting up a Secure Sockets Layer (SSL) certificate to secure your website with HTTPS.

For a full list of AWS announcements, be sure to keep an eye on the What’s New at AWS page.

Other AWS News
Here are some other news items that you may find interesting in the new year:

Book recommendations for AWS customer executives – Plan for the new year and catch up on what others are doing and thinking. AWS Enterprise Strategy team recommends what books are most important for our AWS customer executives to read.

Best practices for scaling AWS CDK adoption with Platform Engineering – A recent evolution in DevOps is the introduction of platform engineering teams to build services, toolchains, and documentation to support workload teams. This blog post introduces strategies and best practices for accelerating CDK adoption within your organization. You can learn how to scale the lessons learned from the pilot project across your organization through platform engineering.

High performance running HPC applications on AWS Graviton instances – When running the Parallel Lattice Boltzmann Solver (Palabos) on Amazon EC2 Hpc7g instances to solve computational fluid dynamics (CFD) problems, performance increased by up to 70% and price performance was up to 3x better than on the previous generation of Graviton instances.

The new AWS open source newsletter, #181 – Check up on all the latest open source content, which this week includes AWS Amplify, Amazon Corretto, dbt, Apache Flink, Karpenter, LangChain, Pinecone, and more.

Upcoming AWS Events
Check your calendars and sign up for these AWS events in the new year:

AWS at CES 2024 (January 9-12) – AWS will be representing some of the latest cloud services and solutions that are purpose built for the automotive, mobility, transportation, and manufacturing industries. Join us to learn about the latest cloud capabilities across generative AI, software define vehicles, product engineering, sustainability, new digital customer experiences, connected mobility, autonomous driving, and so much more in Amazon Experience Area.

APJ Builders Online Series (January 18) – This online conference is designed for you to learn core AWS concepts, and step-by-step architectural best practices, including demonstrations to help you get started and accelerate your success on AWS.

You can browse all upcoming AWS-led in-person and virtual events, and developer-focused events such as AWS DevDay.

That’s all for this week. Check back next Monday for another Week in Review!

— Channy

This post is part of our Week in Review series. Check back each week for a quick roundup of interesting news and announcements from AWS!

Looking beyond code coverage with Amazon CodeWhisperer

Post Syndicated from Saurabh Kumar original https://aws.amazon.com/blogs/devops/looking-beyond-code-coverage-with-amazon-codewhisperer/

Code coverage is a code quality metric leveraging unit tests. Coming up with test cases with every combination of parameters requires developer’s time, which is already scarce. Developers’ focus is (mis)directed at just meeting the coverage threshold. In doing so, quality of code may be compromised and resulting code may still result in unexpected outcomes.

In this blog, we will walk you through a Java application and demonstrate how to look beyond code coverage by leveraging Amazon CodeWhisperer, an AI coding companion, for generating a combination of test cases, including boundary conditions which are often overlooked due to time and resource constraints. Taking this approach, you can improve code quality as well as improve your productivity.

Prerequisites

  1. Create an AWS Account. If you don’t already have an AWS account, you’ll need to create one in order to follow the steps outlined to AWS Management Console. For this, it is recommended to create a new user.
  2. To set up CodeWhisperer for your development environment, follow the setup instructions AWS Toolkit.
  3. Download and set up Java: Install the Java SE Development Kit.
  4. Install Maven.
  5. You can use any IDE of your choice such as Eclipse, Spring Tools, VS Code or IntelliJ. For this blog, we have used IntelliJ community edition which you can download from here. You can use IntelliJ Ultimate if you have a license for it.
  6. Clone repo: Looking beyond code coverage with CodeWhisperer.
  7. Import cloned project in IntelliJ following importing-a-project guide.

Following the above steps, you would have setup the project locally. Figure1 below shows how the initial project should look after you have imported it as maven project in your IDE:

Figure1. initial Java project

Figure1. initial Java project

The following screen recording shows how you can use CodeWhisperer to generate code for ‘add’ method using the comment “//method for adding two numbers”.

ScreenRecording 1. Initial application code generation

ScreenRecording 1. Initial application code generation

Now let’s generate one simple test case using CodeWhisperer as shown in the ScreenRecording 2. First test case generation:

ScreenRecording 2. First test case generation

ScreenRecording 2. First test case generation

Let’s run the test case with code coverage. In figure2. “First test with code coverage”, you can see that we have achieved 100% coverage on the Calculator class. If we just go by the coverage, we can conclude that the code is ready.

Figure2. First test with code coverage

Figure2. First test with code coverage

Just one unit test is not sufficient to ensure quality and side-effect-free code. Next, you will see how CodeWhisperer can assist in generating additional test cases. As soon as you begin typing a comment like, “// Test,” it provides suggestions for new test cases, such as “// test with one negative number,” “// test with two negative numbers,” “Test with one zero number,” etc. This feature, as shown in the ScreenRecording 3 titled ‘Generating additional test cases’ below, makes the task of generating a variety of test cases easier and enables developers to create more tests in a shorter amount of time.

ScreenRecording 3. Generating additional test cases

ScreenRecording 3. Generating additional test cases

So far, we have generated test cases with different arguments and still have 100% code coverage. Let’s now turn our focus towards safety of the code and think about different arguments that can lead to unexpected outcomes. Each argument should fall within the range of -2,147,483,648 (the minimum value of type int) to 2,147,483,647 (the maximum value of type int). Let’s use CodeWhisperer to generate additional test cases to challenge code safety as shown in the screen recording below:

ScreenRecording 4. Generating test for boundary conditions

ScreenRecording 4. Generating test for boundary conditions

Here, CodeWhisperer first generated a test case which adds 1 to maximum value of integer. We have also added a statement to print the result to console so that we can see the actual value ‘add’ method returns when this use case is executed. Point to note here: the generated test case is expecting the output to be the MINIMUM value of type int. Upon execution, the test case prints something unexpected. Because of the way signed integer operations work, adding 1 to max int results in the min value.

Let’s consider this in more practical terms. Imagine using the ‘add’ method in a banking system, where every time a customer deposits money into their bank account, you add up the recent deposit to calculate the final amount in their account. Now, imagine a customer’s reaction when they find their balance to be negative after depositing $2.14 billion, and they now owe huge overdraft charges.

This example demonstrates that even code with 100% coverage has unexpected side effects. The focus should be identifying combinations of parameters which can potentially produce unexpected outcomes so that code can be corrected before it manifests this behavior in production.

Now, let’s use CodeWhisperer to generate another test case that could create an unexpected result: “add -1 to the minimum value of ‘int’”. Again, adding -1 to the minimum int value results in the MAXIMUM value. Using the same example as above, a customer would be more than happy to notice that they still have money in their bank account, even after withdrawing $2.14 billion.

Again, the point is that developers should focus on ensuring that the code doesn’t have unwanted, unexpected consequences, rather than chasing a coverage target.

Now that we have seen that the add methods runs into integer overflow in certain conditions, let’s improve the code using CodeWhisperer using comment “check a and b for integer overflow”:

ScreenRecording 5. Code improvement- overflow check

ScreenRecording 5. Code improvement- overflow check

After adding the safety checks, the test cases are not resulting in unexpected outcomes and resulting in ArithmaticException as shown in the above screen recording. However, the test cases are failing, and failing test cases can interrupt the CI/CD pipeline. So, let’s refactor these test cases to expect this runtime exception and pass the test case as shown in the screen recording below.

ScreenRecording 6. Test case improvement- overflow checks

ScreenRecording 6. Test case improvement- overflow checks

Having rerun the test cases with coverage, you can see that the test cases are not only passing, but also have 100% code coverage.

For this blog, the majority of the code and its corresponding test cases are generated by CodeWhisperer, an AI coding companion. This tool enables us to enhance code by easily exploring libraries. In our example, this led us to the ‘Math.addExact’ method, which provides checks for boundary conditions relevant to our task. Let’s refactor the code to utilize this method, as shown below in Figure 3 final code.

Figure 3. Final code

Figure 3. Final code

If we rerun the test suite with coverage, we find that all the test cases are passing and coverage is also maintained at 100%.

Figure 4. Final tests with coverage

Figure 4. Final tests with coverage

Conclusion:

Through this blog post, we have demonstrated that high code coverage alone does not guarantee high quality code. Tools like Amazon CodeWhisperer can boost developer productivity by generating code and as well as corresponding test suite, including boundary conditions. This frees up developers to concentrate on business logic and to learn new frameworks and libraries, thereby resulting in overall improvement in quality and safety of code.

While our example focused on Java, this concept applies to other programming languages as well. Checkout the complete list of programming languages and IDEs supported by CodeWhisperer in the FAQs.

Try out CodeWhisperer Individual Tier for free to see how it can help you write high-quality code more efficiently using CodeWhisperer getting started guides.

Happy coding!

      
Saurabh Kumar's picture

Saurabh Kumar

Saurabh Kumar is a Solutions Architect at AWS based out of Raleigh, NC. He is passionate about helping customers solve their business challenges and technical problems from migration to modernization and optimization. Outside of work, he likes gardening and spending time with his family.

Bineesh Ravindran's picture

Bineesh Ravindran

Bineesh is Solutions Architect at Amazon Webservices (AWS) who is passionate about technology and love to help customers solve problems. Bineesh has over 20 years of experience in designing and implementing enterprise applications. He works with AWS partners and customers to provide them with architectural guidance for building scalable architecture and execute strategies to drive adoption of AWS services. When he’s not working, he enjoys biking, aqua scaping and playing badminton.

Architectural patterns for real-time analytics using Amazon Kinesis Data Streams, part 1

Post Syndicated from Raghavarao Sodabathina original https://aws.amazon.com/blogs/big-data/architectural-patterns-for-real-time-analytics-using-amazon-kinesis-data-streams-part-1/

We’re living in the age of real-time data and insights, driven by low-latency data streaming applications. Today, everyone expects a personalized experience in any application, and organizations are constantly innovating to increase their speed of business operation and decision making. The volume of time-sensitive data produced is increasing rapidly, with different formats of data being introduced across new businesses and customer use cases. Therefore, it is critical for organizations to embrace a low-latency, scalable, and reliable data streaming infrastructure to deliver real-time business applications and better customer experiences.

This is the first post to a blog series that offers common architectural patterns in building real-time data streaming infrastructures using Kinesis Data Streams for a wide range of use cases. It aims to provide a framework to create low-latency streaming applications on the AWS Cloud using Amazon Kinesis Data Streams and AWS purpose-built data analytics services.

In this post, we will review the common architectural patterns of two use cases: Time Series Data Analysis and Event Driven Microservices. In the subsequent post in our series, we will explore the architectural patterns in building streaming pipelines for real-time BI dashboards, contact center agent, ledger data, personalized real-time recommendation, log analytics, IoT data, Change Data Capture, and real-time marketing data. All these architecture patterns are integrated with Amazon Kinesis Data Streams.

Real-time streaming with Kinesis Data Streams

Amazon Kinesis Data Streams is a cloud-native, serverless streaming data service that makes it easy to capture, process, and store real-time data at any scale. With Kinesis Data Streams, you can collect and process hundreds of gigabytes of data per second from hundreds of thousands of sources, allowing you to easily write applications that process information in real-time. The collected data is available in milliseconds to allow real-time analytics use cases, such as real-time dashboards, real-time anomaly detection, and dynamic pricing. By default, the data within the Kinesis Data Stream is stored for 24 hours with an option to increase the data retention to 365 days. If customers want to process the same data in real-time with multiple applications, then they can use the Enhanced Fan-Out (EFO) feature. Prior to this feature, every application consuming data from the stream shared the 2MB/second/shard output. By configuring stream consumers to use enhanced fan-out, each data consumer receives dedicated 2MB/second pipe of read throughput per shard to further reduce the latency in data retrieval.

For high availability and durability, Kinesis Data Streams achieves high durability by synchronously replicating the streamed data across three Availability Zones in an AWS Region and gives you the option to retain data for up to 365 days. For security, Kinesis Data Streams provide server-side encryption so you can meet strict data management requirements by encrypting your data at rest and Amazon Virtual Private Cloud (VPC) interface endpoints to keep traffic between your Amazon VPC and Kinesis Data Streams private.

Kinesis Data Streams has native integrations with other AWS services such as AWS Glue and Amazon EventBridge to build real-time streaming applications on AWS. Refer to Amazon Kinesis Data Streams integrations for additional details.

Modern data streaming architecture with Kinesis Data Streams

A modern streaming data architecture with Kinesis Data Streams can be designed as a stack of five logical layers; each layer is composed of multiple purpose-built components that address specific requirements, as illustrated in the following diagram:

The architecture consists of the following key components:

  • Streaming sources – Your source of streaming data includes data sources like clickstream data, sensors, social media, Internet of Things (IoT) devices, log files generated by using your web and mobile applications, and mobile devices that generate semi-structured and unstructured data as continuous streams at high velocity.
  • Stream ingestion – The stream ingestion layer is responsible for ingesting data into the stream storage layer. It provides the ability to collect data from tens of thousands of data sources and ingest in real time. You can use the Kinesis SDK for ingesting streaming data through APIs, the Kinesis Producer Library for building high-performance and long-running streaming producers, or a Kinesis agent for collecting a set of files and ingesting them into Kinesis Data Streams. In addition, you can use many pre-build integrations such as AWS Database Migration Service (AWS DMS), Amazon DynamoDB, and AWS IoT Core to ingest data in a no-code fashion. You can also ingest data from third-party platforms such as Apache Spark and Apache Kafka Connect
  • Stream storage – Kinesis Data Streams offer two modes to support the data throughput: On-Demand and Provisioned. On-Demand mode, now the default choice, can elastically scale to absorb variable throughputs, so that customers do not need to worry about capacity management and pay by data throughput. The On-Demand mode automatically scales up 2x the stream capacity over its historic maximum data ingestion to provide sufficient capacity for unexpected spikes in data ingestion. Alternatively, customers who want granular control over stream resources can use the Provisioned mode and proactively scale up and down the number of Shards to meet their throughput requirements. Additionally, Kinesis Data Streams can store streaming data up to 24 hours by default, but can extend to 7 days or 365 days depending upon use cases. Multiple applications can consume the same stream.
  • Stream processing – The stream processing layer is responsible for transforming data into a consumable state through data validation, cleanup, normalization, transformation, and enrichment. The streaming records are read in the order they are produced, allowing for real-time analytics, building event-driven applications or streaming ETL (extract, transform, and load). You can use Amazon Managed Service for Apache Flink for complex stream data processing, AWS Lambda for stateless stream data processing, and AWS Glue & Amazon EMR for near-real-time compute. You can also build customized consumer applications with Kinesis Consumer Library, which will take care of many complex tasks associated with distributed computing.
  • Destination – The destination layer is like a purpose-built destination depending on your use case. You can stream data directly to Amazon Redshift for data warehousing and Amazon EventBridge for building event-driven applications. You can also use Amazon Kinesis Data Firehose for streaming integration where you can light stream processing with AWS Lambda, and then deliver processed streaming into destinations like Amazon S3 data lake, OpenSearch Service for operational analytics, a Redshift data warehouse, No-SQL databases like Amazon DynamoDB, and relational databases like Amazon RDS to consume real-time streams into business applications. The destination can be an event-driven application for real-time dashboards, automatic decisions based on processed streaming data, real-time altering, and more.

Real-time analytics architecture for time series

Time series data is a sequence of data points recorded over a time interval for measuring events that change over time. Examples are stock prices over time, webpage clickstreams, and device logs over time. Customers can use time series data to monitor changes over time, so that they can detect anomalies, identify patterns, and analyze how certain variables are influenced over time. Time series data is typically generated from multiple sources in high volumes, and it needs to be cost-effectively collected in near real time.

Typically, there are three primary goals that customers want to achieve in processing time-series data:

  • Gain insights real-time into system performance and detect anomalies
  • Understand end-user behavior to track trends and query/build visualizations from these insights
  • Have a durable storage solution to ingest and store both archival and frequently accessed data.

With Kinesis Data Streams, customers can continuously capture terabytes of time series data from thousands of sources for cleaning, enrichment, storage, analysis, and visualization.

The following architecture pattern illustrates how real time analytics can be achieved for Time Series data with Kinesis Data Streams:

Build a serverless streaming data pipeline for time series data

The workflow steps are as follows:

  1. Data Ingestion & Storage – Kinesis Data Streams can continuously capture and store terabytes of data from thousands of sources.
  2. Stream Processing – An application created with Amazon Managed Service for Apache Flink can read the records from the data stream to detect and clean any errors in the time series data and enrich the data with specific metadata to optimize operational analytics. Using a data stream in the middle provides the advantage of using the time series data in other processes and solutions at the same time. A Lambda function is then invoked with these events, and can perform time series calculations in memory.
  3. Destinations – After cleaning and enrichment, the processed time series data can be streamed to Amazon Timestream database for real-time dashboarding and analysis, or stored in databases such as DynamoDB for end-user query. The raw data can be streamed to Amazon S3 for archiving.
  4. Visualization & Gain insights – Customers can query, visualize, and create alerts using Amazon Managed Service for Grafana. Grafana supports data sources that are storage backends for time series data. To access your data from Timestream, you need to install the Timestream plugin for Grafana. End-users can query data from the DynamoDB table with Amazon API Gateway acting as a proxy.

Refer to Near Real-Time Processing with Amazon Kinesis, Amazon Timestream, and Grafana showcasing a serverless streaming pipeline to process and store device telemetry IoT data into a time series optimized data store such as Amazon Timestream.

Enriching & replaying data in real time for event-sourcing microservices

Microservices are an architectural and organizational approach to software development where software is composed of small independent services that communicate over well-defined APIs. When building event-driven microservices, customers want to achieve 1. high scalability to handle the volume of incoming events and 2. reliability of event processing and maintain system functionality in the face of failures.

Customers utilize microservice architecture patterns to accelerate innovation and time-to-market for new features, because it makes applications easier to scale and faster to develop. However, it is challenging to enrich and replay the data in a network call to another microservice because it can impact the reliability of the application and make it difficult to debug and trace errors. To solve this problem, event-sourcing is an effective design pattern that centralizes historic records of all state changes for enrichment and replay, and decouples read from write workloads. Customers can use Kinesis Data Streams as the centralized event store for event-sourcing microservices, because KDS can 1/ handle gigabytes of data throughput per second per stream and stream the data in milliseconds, to meet the requirement on high scalability and near real-time latency, 2/ integrate with Flink and S3 for data enrichment and achieving while being completely decoupled from the microservices, and 3/ allow retry and asynchronous read in a later time, because KDS retains the data record for a default of 24 hours, and optionally up to 365 days.

The following architectural pattern is a generic illustration of how Kinesis Data Streams can be used for Event-Sourcing Microservices:

The steps in the workflow are as follows:

  1. Data Ingestion and Storage – You can aggregate the input from your microservices to your Kinesis Data Streams for storage.
  2. Stream processing Apache Flink Stateful Functions simplifies building distributed stateful event-driven applications. It can receive the events from an input Kinesis data stream and route the resulting stream to an output data stream. You can create a stateful functions cluster with Apache Flink based on your application business logic.
  3. State snapshot in Amazon S3 – You can store the state snapshot in Amazon S3 for tracking.
  4. Output streams – The output streams can be consumed through Lambda remote functions through HTTP/gRPC protocol through API Gateway.
  5. Lambda remote functions – Lambda functions can act as microservices for various application and business logic to serve business applications and mobile apps.

To learn how other customers built their event-based microservices with Kinesis Data Streams, refer to the following:

Key considerations and best practices

The following are considerations and best practices to keep in mind:

  • Data discovery should be your first step in building modern data streaming applications. You must define the business value and then identify your streaming data sources and user personas to achieve the desired business outcomes.
  • Choose your streaming data ingestion tool based on your steaming data source. For example, you can use the Kinesis SDK for ingesting streaming data through APIs, the Kinesis Producer Library for building high-performance and long-running streaming producers, a Kinesis agent for collecting a set of files and ingesting them into Kinesis Data Streams, AWS DMS for CDC streaming use cases, and AWS IoT Core for ingesting IoT device data into Kinesis Data Streams. You can ingest streaming data directly into Amazon Redshift to build low-latency streaming applications. You can also use third-party libraries like Apache Spark and Apache Kafka to ingest streaming data into Kinesis Data Streams.
  • You need to choose your streaming data processing services based on your specific use case and business requirements. For example, you can use Amazon Kinesis Managed Service for Apache Flink for advanced streaming use cases with multiple streaming destinations and complex stateful stream processing or if you want to monitor business metrics in real time (such as every hour). Lambda is good for event-based and stateless processing. You can use Amazon EMR for streaming data processing to use your favorite open source big data frameworks. AWS Glue is good for near-real-time streaming data processing for use cases such as streaming ETL.
  • Kinesis Data Streams on-demand mode charges by usage and automatically scales up resource capacity, so it’s good for spiky streaming workloads and hands-free maintenance. Provisioned mode charges by capacity and requires proactive capacity management, so it’s good for predictable streaming workloads.
  • You can use the Kinesis Shared Calculator to calculate the number of shards needed for provisioned mode. You don’t need to be concerned about shards with on-demand mode.
  • When granting permissions, you decide who is getting what permissions to which Kinesis Data Streams resources. You enable specific actions that you want to allow on those resources. Therefore, you should grant only the permissions that are required to perform a task. You can also encrypt the data at rest by using a KMS customer managed key (CMK).
  • You can update the retention period via the Kinesis Data Streams console or by using the IncreaseStreamRetentionPeriod and the DecreaseStreamRetentionPeriod operations based on your specific use cases.
  • Kinesis Data Streams supports resharding. The recommended API for this function is UpdateShardCount, which allows you to modify the number of shards in your stream to adapt to changes in the rate of data flow through the stream. The resharding APIs (Split and Merge) are typically used to handle hot shards.

Conclusion

This post demonstrated various architectural patterns for building low-latency streaming applications with Kinesis Data Streams. You can build your own low-latency steaming applications with Kinesis Data Streams using the information in this post.

For detailed architectural patterns, refer to the following resources:

If you want to build a data vision and strategy, check out the AWS Data-Driven Everything (D2E) program.


About the Authors

Raghavarao Sodabathina is a Principal Solutions Architect at AWS, focusing on Data Analytics, AI/ML, and cloud security. He engages with customers to create innovative solutions that address customer business problems and to accelerate the adoption of AWS services. In his spare time, Raghavarao enjoys spending time with his family, reading books, and watching movies.

Hang Zuo is a Senior Product Manager on the Amazon Kinesis Data Streams team at Amazon Web Services. He is passionate about developing intuitive product experiences that solve complex customer problems and enable customers to achieve their business goals.

Shwetha Radhakrishnan is a Solutions Architect for AWS with a focus in Data Analytics. She has been building solutions that drive cloud adoption and help organizations make data-driven decisions within the public sector. Outside of work, she loves dancing, spending time with friends and family, and traveling.

Brittany Ly is a Solutions Architect at AWS. She is focused on helping enterprise customers with their cloud adoption and modernization journey and has an interest in the security and analytics field. Outside of work, she loves to spend time with her dog and play pickleball.

Джентълмените с късмет. Ротацията продължава

Post Syndicated from Емилия Милчева original https://www.toest.bg/dzentulmenite-s-kusmet-rotatsiyata-produlzhava/

Джентълмените с късмет. Ротацията продължава

Мюретата са част от политическата игра. Когато общественото внимание и енергия упорито биват насочвани към конкретна тема, обикновено става въпрос за договаряне далеч от камерите – и за съвсем друго. Ето че технологията на ротацията на премиера на ПП–ДБ акад. Николай Денков с настоящата вицепремиерка Мария Габриел от ГЕРБ измести темата за смените на министри и далеч по-важната – за механизма за номинации за членове на регулаторите. 

След като е налице желанието на съдружниците в управлението то да продължи, значи ротацията ще се осъществи. Останалото е несъществено от гледна точка на обществения интерес.

Смяна през март ще има, правителството с премиер Мария Габриел ще е с мандата на ГЕРБ–СДС. Двама-трима министри ще бъдат сменени. Асен Василев остава министър на финансите, вероятно ще е и вицепремиер. Под въпрос е дали настоящият министър-председател акад. Николай Денков ще е вицепремиер – освен министър на образованието и науката. Наред с това ще се състои и смяната на председателя на 49-тото НС Росен Желязков от ГЕРБ с Никола Минчев от „Продължаваме промяната“.

Можеше да е другояче

Всичко можеше да е по-честно и обществено приемливо, ако беше подписано коалиционно споразумение, където фигурира и механизмът на ротация, както го направиха в Румъния Националнолибералната и Социалдемократическата партия, със срок до провеждането на следващите редовни парламентарни избори. (Третият партньор, подписал споразумението – Демократичният съюз на унгарците в Румъния, напусна коалицията.) Документът предвижда ротация на премиера и размяна на няколко министерства между двете партии. Но в България ПП–ДБ и ГЕРБ–СДС заложиха на джентълменска дума, упорито избягвайки да подпишат документ, легитимиращ партньорството им. 

Лидерът на ГЕРБ Бойко Борисов искаше коалиционно споразумение. От ПП–ДБ упорстваха за някакъв Механизъм за гарантиране на реформаторската програма на правителството, първа точка в който отново бяха назначенията в регулаторите. Нито едното бе възприето, нито другото, но след като управленският съюз укрепва, „коалиция“ звучи далеч по-добре от обидното „сглобка“ или ироничното „не-коалиция“. А и внася известна прозрачност. 

Бездруго вече няма защо да се крият. 

Но пък заради ДПС „узаконяването“ на връзката става някак… комплицирано – хем за управление са се разбрали две коалиции, хем управляващото мнозинство в действителност е на три крака.

Черно на бяло – ДПС го няма, но е във властта

Какво имаме дотук? Декларация за национално отговорно управление на ПП–ДБ и ГЕРБ–СДС от май миналата година, в която са записани няколко принципа освен известните цели за Шенген и еврозоната. Ротация „за последователни периоди“ от по 9 месеца (с неуточнен брой). Излъчване на правителство с втория мандат. Задължението да бъдат подготвени и приети промени в Конституцията, включително в структурата на прокуратурата и ВСС. „Механизъм за предварително съгласуване между парламентарните групи на номинациите за регулаторните органи, избирани от парламента, с оглед гарантиране на най-добрия подбор на личности с високи професионални и морални качества.“ 

В края на първата и началото на новата „бременност“ с власт такъв механизъм още не е подготвен или поне не е обществено известен, и то в годината, в която предстои обновяването на регулаторите и на съдебните кадровици. 

Налице е и управленска програма на правителството „Денков–Габриел“ от 146 страници плюс законодателни приоритети. Стоп. Законодателните приоритети, обявени през септември миналата година, са договорени обаче не само между ПП–ДБ и ГЕРБ–СДС, но и с участието на ДПС. Конституционните промени бяха приети и с гласовете на Движението, което е вкарано и при назначенията в регулаторите. Но въпреки че ДПС са част от конституционното и евроатлантическото мнозинство, изобщо от мнозинството зад правителството, джентълменската дума е само между ПП–ДБ и ГЕРБ–СДС. 

Логично би било и едно (eвентуално) коалиционно споразумение да е между тях – но къде тогава остава ДПС! Партията на Доган отсъства от декларацията с принципи за управление, където фигурира механизмът за назначения. Допускайки я до квота, двете коалиции в действителност нарушават декларирани принципи, качвайки на автостоп третия партньор във властта. 

В ПП–ДБ не обичат думата „квота“, убеждавайки, че ще се излъчват безспорни професионалисти с обществена подкрепа и доверие. Някак трудно е за вярване при повече от десетилетие негативна селекция в съдебната система, констатирана от експерти и анализатори и целенасочено осъществявана от ГЕРБ и ДПС къде с помощта, къде с мълчаливото съгласие на БСП. Първо, че отнякъде ще се изнамерят такива кадри, второ – че ще бъдат допуснати в системата. 

Вторият кабинет – с мандата на първите

Този път се очаква правителството, което ще бъде гласувано през март, да е с мандата на ГЕРБ–СДС – политическата сила, първа на парламентарните избори на 2 април. И Борисов, и премиерът Николай Денков отбелязаха, че така ротацията на премиерите ще е най-лесна. Това е и компенсация за ГЕРБ, които отказаха първия мандат след вота, за да се сглоби кабинет с втория – на ПП–ДБ. Сега, в четвъртия триместър управление, получават и своето правителство. 

В крайна сметка няма значение кой е носителят на мандата, след като има зад гърба си същото мнозинство – ГЕРБ–СДС, ПП–ДБ, ДПС, и това мнозинство ще диктува какво да се приеме и какво да се отхвърли. 

Включването на ДПС помогна за приемане на конституционните промени. Но се оказа най-удобно за ГЕРБ. Двете политически сили често се обединяваха, проваляйки достатъчно смислени предложения, за да защитят свои бизнес интереси. Например изобщо отхвърлиха каквито и да било промени при търговете за онколекарства и така беше запазена досегашната практика НЗОК да плаща на различните болници лекарства с до 20 пъти разлика в цените. 

Отрязаха предложението и частните болници да обявяват обществени поръчки, защото настоящата ситуация води до същото – оскъпяване на едни и същи лекарства, тъй като повечето частни лечебни заведения имат свои дистрибуторски фирми, а НЗОК плаща и на едните, и на другите с обществен ресурс. А в самото начало при разпределянето на парламентарните комисии ГЕРБ отстъпиха част от своите председателски места на ДПС.

Тандемът ГЕРБ–ДПС има отработено стиковане и в тройното мнозинство представлява един друг политически сбор, на който допреди година се противопоставяха „Продължаваме промяната“ и „Демократична България“. 

Технологията не е тайна

Технологията за ротацията е като при оставка на правителството и преди дни конституционалисти обясниха как ще се случи. Премиерът подава оставка, което означава оставка и на правителството, и започва въртележката с мандатите. Президентът връчва мандата на лице, посочено от ГЕРБ–СДС, в случая Мария Габриел, и следват номинациите на министрите. До началото на март обаче трите политически сили – да, и ДПС също – ще трябва да се разберат кои министри да бъдат сменени и кои ще са новите персони за тези овакантени позиции. 

Но на първо време в дневния ред на парламента и управляващото мнозинство е изборът на двама конституционни съдии, забавен повече от две години. Според сайта Lex.bg най-спряганите имена са на проф. Екатерина Михайлова и на настоящия правосъден министър доц. Атанас Славов.

Така че коалицията ще продължи да управлява и през 2024 г. Само някакъв черен лебед би попречил на второто 9-месечие. Но понякога и черните лебеди са мюрета.

Security updates for Monday

Post Syndicated from jake original https://lwn.net/Articles/957146/

Security updates have been issued by Debian (exim4), Fedora (chromium, perl-Spreadsheet-ParseExcel, python-aiohttp, python-pysqueezebox, and tinyxml), Gentoo (Apache Batik, Eclipse Mosquitto, firefox, R, Synapse, and util-linux), Mageia (libssh2 and putty), Red Hat (squid), SUSE (libxkbcommon), and Ubuntu (gnutls28).

An overview of Cloudflare’s logging pipeline

Post Syndicated from Colin Douch http://blog.cloudflare.com/author/colin/ original https://blog.cloudflare.com/an-overview-of-cloudflares-logging-pipeline


One of the roles of Cloudflare’s Observability Platform team is managing the operation, improvement, and maintenance of our internal logging pipelines. These pipelines are used to ship debugging logs from every service across Cloudflare’s infrastructure into a centralised location, allowing our engineers to operate and debug their services in near real time. In this post, we’re going to go over what that looks like, how we achieve high availability, and how we meet our Service Level Objectives (SLOs) while shipping close to a million log lines per second.

Logging itself is a simple concept. Virtually every programmer has written a Hello, World! program at some point. Printing something to the console like that is logging, whether intentional or not.

Logging pipelines have been around since the beginning of computing itself. Starting with putting string lines in a file, or simply in memory, our industry quickly outgrew the concept of each machine in the network having its own logs. To centralise logging, and to provide scaling beyond a single machine, we invented protocols such as the BSD Syslog Protocol to provide a method for individual machines to send logs over the network to a collector, providing a single pane of glass for logs over an entire set of machines.

Our logging infrastructure at Cloudflare is a bit more complicated, but still builds on these foundational principles.

The beginning

Logs at Cloudflare start the same as any other, with a println. Generally systems don’t call println directly however, they outsource that logic to a logging library. Systems at Cloudflare use various logging libraries such as Go’s zerolog, C++’s KJ_LOG, or Rusts log, however anything that is able to print lines to a program’s stdout/stderr streams is compatible with our pipeline. This offers our engineers the greatest flexibility in choosing tools that work for them and their teams.

Because we use systemd for most of our service management, these stdout/stderr streams are generally piped into systemd-journald which handles the local machine logs. With its RateLimitBurst and RateLimitInterval configurations, this gives us a simple knob to control the output of any given service on a machine. This has given our logging pipeline the colloquial name of the “journal pipeline”, however as we will see, our pipeline has expanded far beyond just journald logs.

Syslog-NG

While journald provides us a method to collect logs on every machine, logging onto each machine individually is impractical for debugging large scale services. To this end, the next step of our pipeline is syslog-ng. Syslog-ng is a daemon that implements the aforementioned BSD syslog protocol. In our case, it reads logs from journald, and applies another layer of rate limiting. It then applies rewriting rules to add common fields, such as the name of the machine that emitted the log, the name of the data center the machine is in, and the state of the data center that the machine is in. It then wraps the log in a JSON wrapper and forwards it to our Core data centers.

journald itself has an interesting feature that makes it difficult for some of our use cases – it guarantees a global ordering of every log on a machine. While this is convenient for the single node case, it imposes the limitation that journald is single-threaded. This means that for our heavier workloads, where every millisecond of delay counts, we provide a more direct path into our pipeline. In particular, we offer a Unix Domain Socket that syslog-ng listens on. This socket operates as a separate source of logs into the same pipeline that the journald logs follow, but allows greater throughput by eschewing the need for a global ordering that journald enforces. Logging in this manner is a bit more involved than outputting logs to the stdout streams, as services have to have a pipe created for them and then manually open that socket to write to. As such, this is generally reserved for services that need it, and don’t mind the management overhead it requires.

log-x

Our logging pipeline is a critical service at Cloudflare. Any potential delays or missing data can cause downstream effects that may hinder or even prevent the resolving of customer facing incidents. Because of this strict requirement, we have to offer redundancy in our pipeline. This is where the operation we call “log-x” comes into play.

We operate two main core data centers. One in the United States, and one in Europe. From each machine, we ship logs to both of these data centers. We call these endpoints log-a, and log-b. The log-a and log-b receivers will insert the logs into a Kafka topic for later consumption. By duplicating the data to two different locations, we achieve a level of redundancy that can handle the failure of either data center.

The next problem we encounter is that we have many data centers all around the world, which at any time due to changing Internet conditions may become disconnected from one, or both core data centers. If the data center is disconnected for long enough we may end up in a situation where we drop logs to either the log-a or log-b receivers. This would result in an incomplete view of logs from one data center and is unacceptable; Log-x was designed to alleviate this problem. In the event that syslog-ng fails to send logs to either log-a or log-b, it will actually send the log twice to the available receiver. This second copy will be marked as actually destined for the other log-x receiver. When a log-x receiver receives such a log, it will insert it into a different Kafka queue, known as the Dead Letter Queue (DLQ). We then use Kafka Mirror Maker to sync this DLQ across to the data center that was inaccessible. With this logic log-x allows us to maintain a full copy of all the logs in each core data center, regardless of any transient failures from any of our data centers.

Kafka

When logs arrive in the core data centers, we buffer them in a Kafka queue. This provides a few benefits. Firstly, it means that any consumers of the logs can be added without any changes – they only need to register with Kafka as a consumer group on the logs topic. Secondly, it allows us to tolerate transient failures of the consumers without losing any data. Because the Kafka clusters in the core data centers are much larger than any single machine, Kafka allows us to tolerate up to eight hours of total outage for our consumers without losing any data. This has proven to be enough to recover without data loss from all but the largest of incidents.

When it comes to partitioning our Kafka data, we have an interesting dilemma. Rather arbitrarily, the syslog protocol only supports timestamps up to microseconds. For our faster log emitters, this means that the syslog protocol cannot guarantee ordering with timestamps alone. To work around this limitation, we partition our logs using a key made up of both the host, and the service name. Because Kafka guarantees ordering within a partition, this means that any logs from a service on a machine are guaranteed to be ordered between themselves. Unfortunately, because logs from a service can have vastly different rates between different machines, this can result in unbalanced Kafka partitions. We have an ongoing project to move towards Open Telemetry Logs to combat this.

Onward to storage

With the logs in Kafka, we can proceed to insert them into a more long term storage. For storage, we operate two backends. An ElasticSearch/Logstash/Kibana (ELK) stack, and a Clickhouse cluster.

For ElasticSearch, we split our cluster of 90 nodes into a few types. The first being “master”

nodes. These nodes act as the ElasticSearch masters, and coordinate insertions into the cluster. We then have “data” nodes that handle the actual insertion and storage. Finally, we have the “HTTP” nodes that handle HTTP queries. Traditionally in an ElasticSearch cluster, all the data nodes will also handle HTTP queries, however because of the size of our cluster and shards we have found that designating only a few nodes to handle HTTP requests greatly reduces our query times by allowing us to take advantage of aggressive caching.

On the Clickhouse side, we operate a ten node Clickhouse cluster that stores our service logs. We are in the process of migrating this to be our primary storage, but at the moment it provides an alternative interface into the same logs that ElasticSearch provides, allowing our Engineers to use either Lucene through the ELK stack, or SQL and Bash scripts through the Clickhouse interface.

What’s next?

As Cloudflare continues to grow, our demands on our Observability systems, and our logging pipeline in particular continue to grow with it. This means that we’re always thinking ahead to what will allow us to scale and improve the experience for our engineers. On the horizon, we have a number of projects to further that goal including:

  • Increasing our multi-tenancy capabilities with better resource insights for our engineers
  • Migrating our syslog-ng pipeline towards Open Telemetry
  • Tail sampling rather than our probabilistic head sampling we have at the moment
  • Better balancing for our Kafka clusters

If you’re interested in working with logging at Cloudflare, then reach out – we’re hiring!

Building a Partner Program: The Zabbix Advantage

Post Syndicated from Michael Kammer original https://blog.zabbix.com/building-a-partner-program-the-zabbix-advantage/27164/

At Zabbix, our emphasis on high performance, functionality, and reliability has led to the creation of one of the most popular monitoring solutions on the market. It’s so popular, in fact, that we get near-constant requests for Zabbix professional consulting, advice, support, and training from almost every corner of the world.

That’s why we created the Zabbix Partner Program. Our partner program was designed with one goal in mind – to get our services to the widest possible audience of qualified buyers by allowing customers to purchase them through a network of verified Zabbix partners as well as from Zabbix directly.

Our partners create high value for thousands of customers who would not otherwise enjoy access to Zabbix services by providing complete localization in terms of linguistic and cultural compatibility, availability across time zones, in-person access, and flexibility around currencies and payments.

To do that as effectively as possible, we’ve divided our partners into 3 categories:

Resellers. These are companies that promote and resell Zabbix services. Their job is to locate leads, present and promote Zabbix products and services, consult the leads regarding their ideal solutions, and arrange the contracts. At that point, Zabbix steps in and provides the services. Resellers are a great resource for customers who are limited by local regulations when it comes to buying Zabbix services in their local currency or from companies registered in their own country.

Certified Partners. Certified partners can also promote and resell Zabbix services, but they’re also officially authorized to deliver selected Zabbix services and solutions in their local languages. The ease of access and a common language allows certified partners to stay in close contact with customers. They can also sell their own value-adding services alongside Zabbix services.

Premium Partners. A premium partner has the same authorization as certified partners, but premium partner status is reserved for partners with the highest expertise and experience. Premium partners can participate in highly sophisticated Zabbix implementation, integration, and support projects.

Building a winning partner program has taught us a few things about the process, so without further ado, we’d like to share 6 best practices that we adhere to when it comes to cultivating and expanding our network of partners.

Set realistic goals

Years of running a partner program have taught us that success is impossible without clearly defined goals and success metrics. Setting firm, realistic goals for a program is the only way to measure its effectiveness and ROI. After a few quarters, it should be possible to compare performance to goals and see whether changes need to be made.

Accordingly, we make sure that Zabbix executives, sales teams, and partners are aware that getting a new program up and running (or making changes to an existing program) takes time. Expecting instant results is not realistic – we’ve learned that a ramp-up period of a few months is usually reasonable.

Make expectations clear

Nothing kills momentum faster than confusion. That’s why it’s important to make sure that partners have a solid understanding of everything that’s being asked of them. We’ve learned to give partners concise goals and objectives so that everyone is on the same page. We also create annual business plans for all three partnership programs, review them quarterly, and reward success.

Having the same KPIs as partners is also important. When different metrics for success exist, we run the risk of our partners being less enthusiastic about taking actions that will increase the success of Zabbix but may do less for them. In our experience, it’s better to build partnerships around a joint success target so that when partners win, we win.

Support your partners

At Zabbix, supporting our partners means providing outstanding sales, marketing, and technical support, all of which shows that we’re invested in their success as much as our own. Our partnership team helps partners with all presales-related questions, organizes demo calls, manages the deal registration to protect partner deals, patriciates in joint calls with customers, and helps with all possible legal questions and certifications.

Apart from day-to-day pre-sales support, we organize and participate in joint Zabbix marketing events of different formats together with our partners. These meetups, meetings, conferences, and external events organized by other vendors around the globe are designed to spread the word about Zabbix solutions and services while helping our partners generate new leads. During these events, our partners demonstrate their recent use-cases and serve as experts for the rest of the partner network and the wider Zabbix community.

Build Trust

Trust is the foundation of all partnerships, and we find that our partners trust us because we deliver the support and tools they need to be successful. It’s why we work hard to keep our partners updated with product developments and industry trends, and we continuously educate them on how to sell and overcome roadblocks.

We even allow some of our partners to conduct official Zabbix trainings, provided they have a certified trainer available. When an existing partner wants to become a training partner, we discuss their needs and plan their training certification together.

Measure and monitor

Whether launching a new program or scaling up an existing one, measuring the right key performance indicators (KPIs) can mean the difference between growth and chaos. If a business doesn’t know what to measure and optimize for their partner program, they won’t know what to improve if growth stalls out, and you’ll struggle to explain how partnerships contribute value.

It’s impossible to get far on the road to success without measuring progress along the way. That’s why we review goals and metrics with our partners every quarter, assess what’s working well and what’s missing the mark, and adapt and adjust if needed. We’ve learned not to change things up too often, but we’re always open to making tweaks that will amplify success.

Communicate effectively

One of the most important ingredients of any successful partner program is communication. It’s essential to keep partners informed about new products, promotions, and other important updates. That involves knowing the audience and understanding what each partner type and their respective employees are interested in and when.

A cornerstone of the Zabbix Partner Program is our ability to actively listen to our partners’ feedback. Our experience is that getting ahead of issues and concerns strengthens relationships, maintains trust, and guarantees that our partners feel supported and valued.

Conclusion

Becoming a Zabbix Partner is an ideal way to get recognized by potential customers and increase the visibility of your business, while also getting a leg up on your competitors by using technical support according to a professional service-level agreement.

In addition, you can count on discounts on all Zabbix services, the ability to access pre-sale consulting services, and participation in joint marketing events.

To find out more about our partner program and sign up, visit the Zabbix Partners page.

The post Building a Partner Program: The Zabbix Advantage appeared first on Zabbix Blog.

Second Interdisciplinary Workshop on Reimagining Democracy

Post Syndicated from Bruce Schneier original https://www.schneier.com/blog/archives/2024/01/second-interdisciplinary-workshop-on-reimagining-democracy.html

Last month, I convened the Second Interdisciplinary Workshop on Reimagining Democracy (IWORD 2023) at the Harvard Kennedy School Ash Center. As with IWORD 2022, the goal was to bring together a diverse set of thinkers and practitioners to talk about how democracy might be reimagined for the twenty-first century.

My thinking is very broad here. Modern democracy was invented in the mid-eighteenth century, using mid-eighteenth-century technology. Were democracy to be invented from scratch today, with today’s technologies, it would look very different. Representation would look different. Adjudication would look different. Resource allocation and reallocation would look different. Everything would look different, because we would have much more powerful technology to build on and no legacy systems to worry about.

Such speculation is not realistic, of course, but it’s still valuable. Everyone seems to be talking about ways to reform our existing systems. That’s critically important, but it’s also myopic. It represents a hill-climbing strategy of continuous improvements. We also need to think about discontinuous changes that you can’t easily get to from here; otherwise, we’ll be forever stuck at local maxima.

I wrote about the philosophy more in this essay about IWORD 2022. IWORD 2023 was equally fantastic, easily the most intellectually stimulating two days of my year. The event is like that; the format results in a firehose of interesting.

Summaries of all the talks are in the first set of comments below. (You can read a similar summary of IWORD 2022 here.) Thank you to the Ash Center and the Belfer Center at Harvard Kennedy School, and the Knight Foundation, for the funding to make this possible.

Next year, I hope to take the workshop out of Harvard and somewhere else. I would like it to live on for as long as it is valuable.

Now, I really want to explain the format in detail, because it works so well.

I used a workshop format I and others invented for another interdisciplinary workshop: Security and Human Behavior, or SHB. It’s a two-day event. Each day has four ninety-minute panels. Each panel has six speakers, each of whom presents for ten minutes. Then there are thirty minutes of questions and comments from the audience. Breaks and meals round out the day.

The workshop is limited to forty-eight attendees, which means that everyone is on a panel. This is important: every attendee is a speaker. And attendees commit to being there for the whole workshop; no giving your talk and then leaving. This makes for a very collaborative environment. The short presentations means that no one can get too deep into details or jargon. This is important for an interdisciplinary event. Everyone is interesting for ten minutes.

The final piece of the workshop is the social events. We have a night-before opening reception, a conference dinner after the first day, and a final closing reception after the second day. Good food is essential.

Honestly, it’s great but it’s also it’s exhausting. Everybody is interesting for ten minutes. There’s no down time to zone out or check email. And even though a shorter event would be easier to deal with, the numbers all fit together in a way that’s hard to change. A one-day event means only twenty-four attendees/speakers, and that’s not a critical mass. More people per panel doesn’t work. Not everyone speaking creates a speaker/audience hierarchy, which I want to avoid. And a three-day, slower-paced event is too long. I’ve thought about it long and hard; the format I’m using is optimal.

The collective thoughts of the interwebz