Getting your SMS short code production-ready with AWS End User Messaging

Post Syndicated from Harshvardhan Chunawala original https://aws.amazon.com/blogs/messaging-and-targeting/getting-your-sms-short-code-production-ready-with-aws-end-user-messaging/

Getting your Short Message Service (SMS) short code production-ready requires you to configure the Amazon Web Services (AWS) infrastructure that controls how your messages are sent, monitored, and protected. You have provisioned your short code, and it is active on carrier networks. In this post, we walk through that setup using AWS End User Messaging SMS, covering 12 configuration steps from compliance through phased traffic migration. Total estimated time is 2 to 4 hours of configuration plus 1 to 3 business days for limit increase approvals.mess

The guide to SMS short codes with AWS End User Messaging covers the application and registration process up through provisioning. This post picks up from that point and provides an operational readiness walkthrough that takes you from “Active” status to confidently sending your first production message, including a final validation step to confirm readiness.

The following diagram shows the end-to-end message flow and event routing architecture covered in this walkthrough.
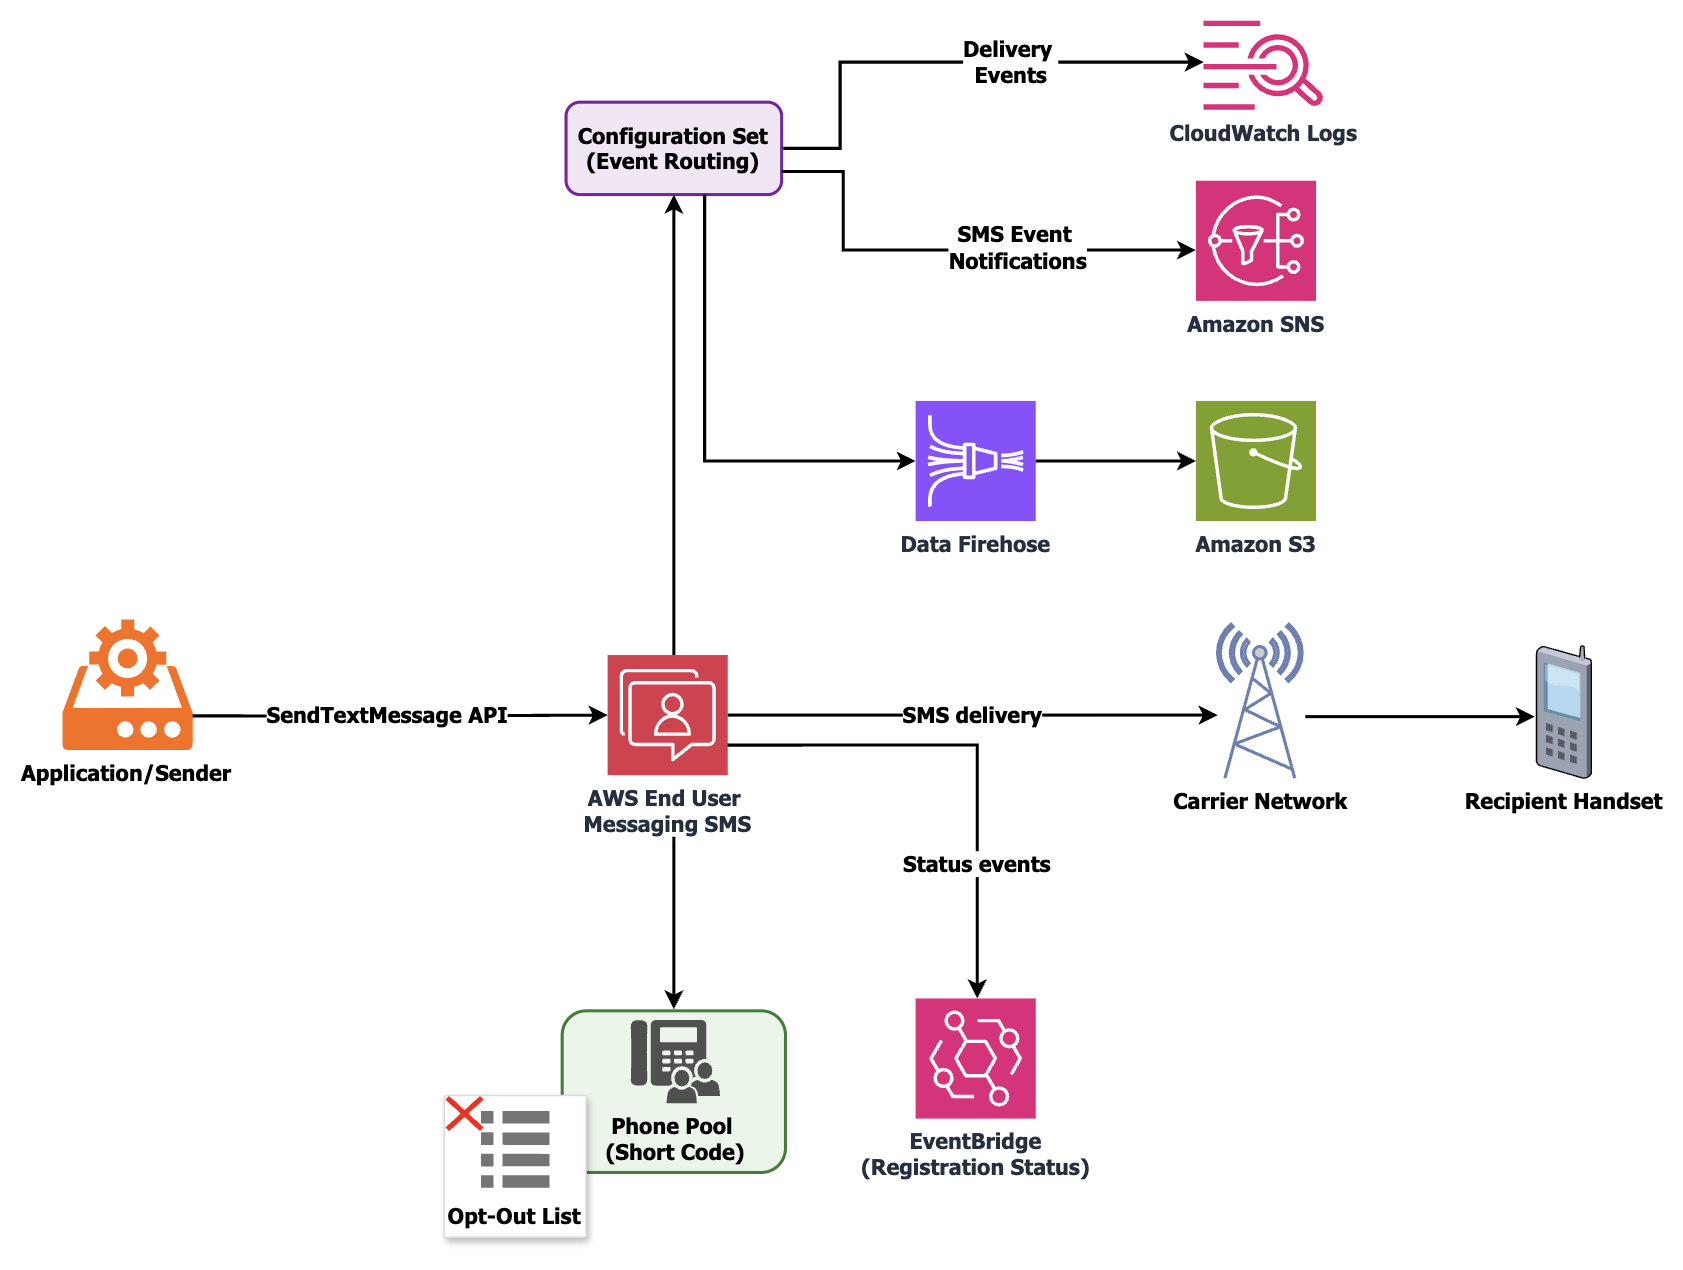
End-to-end SMS short code architecture showing message flow from sender through AWS End User Messaging SMS to carriers and recipient handsets, with event routing to Amazon CloudWatch, Amazon Simple Notification Service (Amazon SNS), and Amazon Data Firehose destinations

Prerequisites

You need the following to follow along with this walkthrough:

  1. An AWS account with access to the AWS End User Messaging SMS console.
  2. A short code with Active status in the AWS Management Console (carrier provisioning finished).
  3. Permissions to create AWS Identity and Access Management (IAM) roles, Amazon CloudWatch Log Groups, and Amazon Simple Notification Service (Amazon SNS) topics.
  4. AWS Command Line Interface (AWS CLI) v2 or an AWS SDK installed and configured.
  5. Your approved registration documentation, including the service name, keyword responses, and message templates submitted to carriers.

Step 1: Verify your short code is active and delivering

Navigate to the AWS End User Messaging SMS console, choose Phone numbers, and locate your provisioned short code. Confirm that the status shows Active, then send a test message to a phone number you control using the SendTextMessage API or the console test feature. Verify delivery on your handset.

Carrier-side activation can take up to 24 to 48 hours to fully propagate across all networks after provisioning finishes. If the console shows Active but your test message does not arrive, submit a support case so the team can verify propagation status with the carrier.

You can also verify using the AWS CLI:

aws pinpoint-sms-voice-v2 send-text-message \
    --destination-phone-number "+15555550100" \
    --origination-identity "12345" \
    --message-body "Test message from short code" \
    --message-type TRANSACTIONAL \
    --configuration-set-name "prod-otp-shortcode"
# Replace +15555550100 with your test phone number, 12345 with your short
# code, and prod-otp-shortcode with your configuration set name from Step 3.

Step 2: Configure keywords and verify message compliance

US carriers require every short code to respond to HELP and STOP keywords. You defined these during your registration, and this step confirms they are configured correctly in your account.

In the SMS console, choose Phone numbers, select your short code, and choose the Keywords tab. Verify that STOP returns the opt-out response you submitted during registration, and that HELP returns your support contact response (which must include a phone number or email). Add any custom keywords your use case requires, such as YES for double opt-in confirmation flows. You can manage keywords programmatically using the PutKeyword API.

To add or update a keyword programmatically:

aws pinpoint-sms-voice-v2 put-keyword \
    --origination-identity "12345" \
    --keyword "YES" \
    --keyword-message "You have confirmed your subscription to Acme Health Alerts. Msg&data rates may apply. Reply STOP to opt out." \
    --keyword-action AUTOMATIC_RESPONSE
# Replace 12345 with your short code, YES with your custom keyword, and the
# keyword-message text with your approved response.

To verify your current keyword configuration:

aws pinpoint-sms-voice-v2 describe-keywords \
    --origination-identity "12345"
# Replace 12345 with your short code.

Beyond keyword configuration, carrier compliance does not end at registration approval. The content you send in production must stay aligned with what carriers reviewed and approved. Here is what to keep consistent.

Use the exact brand or program name from your approved registration across all keyword responses, confirmation messages, and outbound templates. If carriers approved your registration under “Acme Health Alerts,” every message your short code sends should reference that name. Mixing variations creates inconsistencies that auditors flag during reviews. For example, do not use the company name in one message and the product name in another.

Your HELP, STOP, and confirmation responses must match the templates submitted during registration. Do not add or remove opt-out language, change frequency disclosures, or alter customer care contact details post-approval without updating the registration through a support case. If your organization operates multiple domains, use the domain documented in the registration. For example, you might have one domain for the application and another for marketing. Carrier reviewers cross-reference message content, opt-in screenshots, and privacy policy URLs with what was submitted.

Humans conduct carrier reviews, and message content that is concise and limited to the essentials is reviewed consistently. All messages must remain under 160 characters.

Step 3: Create a configuration set with event destinations

A configuration set controls where your SMS delivery events are streamed and which event types are captured. Without one, you are limited to the basic events that AWS End User Messaging SMS sends to Amazon EventBridge by default. These default events omit recipient details and full carrier response context.

Create a configuration set with a descriptive name such as prod-otp-shortcode or marketing-sc-us. Then create at least one event destination. The three main options are Amazon CloudWatch Logs (for operational monitoring and alarming), Amazon SNS (for real-time event fanout to downstream systems), and Amazon Data Firehose (for durable archival and analytics).

Amazon Data Firehose typically delivers to an Amazon Simple Storage Service (Amazon S3) bucket, where you can query delivery history using Amazon Athena for compliance audits or delivery pattern analysis.

# Create the configuration set
aws pinpoint-sms-voice-v2 create-configuration-set \
    --configuration-set-name "prod-otp-shortcode"

# Add a CloudWatch Logs event destination
aws pinpoint-sms-voice-v2 create-event-destination \
    --configuration-set-name "prod-otp-shortcode" \
    --event-destination-name "otp-delivery-logs" \
    --matching-event-types TEXT_DELIVERED TEXT_FAILED TEXT_QUEUED TEXT_CARRIER_UNREACHABLE TEXT_TTL_EXPIRED \
    --cloud-watch-logs-destination '{
        "IamRoleArn": "arn:aws:iam::123456789012:role/SMSEventsToCloudWatch",
        "LogGroupArn": "arn:aws:logs:us-east-1:123456789012:log-group:/aws/sms/prod-otp-shortcode"
    }'
# Replace prod-otp-shortcode with your configuration set name, otp-delivery-logs
# with a descriptive destination name, and the ARN values with your IAM role ARN
# (must have logs:PutLogEvents permission) and CloudWatch Log Group ARN.

Important: When sending messages with SendTextMessage, always specify your ConfigurationSetName parameter so events route to the appropriate destination.

Required event types

Event type Description
TEXT_DELIVERED Message successfully delivered to recipient handset.
TEXT_FAILED Message delivery failed.
TEXT_QUEUED Message accepted and queued for delivery.
TEXT_CARRIER_UNREACHABLE Carrier network unreachable.
TEXT_TTL_EXPIRED Message expired before delivery.

For a detailed walkthrough of configuration sets including multi-tenant architectures, see How to send SMS using configuration sets with AWS End User Messaging.

Step 4: Create a phone pool and associate your short code

A pool is a logical container that groups origination identities and controls routing behavior. Creating one gives you deterministic control over which number sends your messages and how opt-outs are enforced.

# Create the pool
aws pinpoint-sms-voice-v2 create-pool \
    --origination-identity "12345" \
    --iso-country-code "US" \
    --message-type TRANSACTIONAL

# Disable shared routes so only your short code is used
aws pinpoint-sms-voice-v2 update-pool \
    --pool-id "pool-1234567890abcdef0" \
    --shared-routes-enabled false
# Replace 12345 with your short code, US with your destination country code,
# and pool-1234567890abcdef0 with the Pool ID returned by create-pool.

Configuration parameters

Parameter Recommended value Rationale
Pool name us-otp-pool Descriptive, environment-prefixed.
SharedRoutesEnabled False Prevents fallback to shared routes; only your short code is used.
Opt-out list Associate one Manages opt-out state per use case.
IsoCountryCode US Restricts to destination country your short code serves.

If you operate multiple use cases on separate short codes, create a dedicated pool for each. For example, use one short code for one-time password (OTP) traffic and another for transactional notifications. This isolation means a recipient opting out of marketing messages does not lose access to authentication codes.

Step 5: Request your throughput increase

Short codes start at a default of 100 messages per second (MPS). If your production volume will exceed this, request an increase before your launch date rather than after traffic is flowing.

Create a case in the AWS Support Center, choose Service limit increase, then choose End User Messaging SMS. Provide your short code phone number, requested MPS, use case description, and expected peak volume. Allow 1 to 3 business days for processing.

To estimate your required MPS:

Required MPS = (Peak hourly volume / 3,600) x 2

Short codes support scaling to thousands of MPS, so start with a value that covers your expected peak and request further increases as traffic grows.

Step 6: Request a spending limit increase

AWS accounts have a default monthly SMS spending limit. To keep delivery uninterrupted at your expected volume, request an increase that accommodates your projected monthly spend before you begin sending.

Create a support case under Service limit increase > End User Messaging SMS > Account Spend Threshold. Provide your estimated monthly spend, use case description, and website URL.

For details, see Requesting increases to your monthly SMS spending quota.

Step 7: Restrict destination countries

If your short code serves a single country (US-only, for example), restrict sending to that country. This protects your account from artificially inflated traffic (SMS pumping). In pumping attacks, messages are routed to international premium-rate numbers, generating significant charges.

In the SMS console, navigate to Account settings, then choose Countries and keep only the countries you intend to send to. The pool-level IsoCountryCode restriction from Step 4 provides an additional enforcement layer at the sending path. Combining account-level country restrictions with pool-level country codes gives you two independent controls that both must be satisfied before a message is sent internationally.

For a detailed walkthrough on SMS fraud prevention controls, see Defending against SMS pumping: new AWS features to help combat artificially inflated traffic.

Step 8: Set up monitoring and alarms

With event destinations configured in Step 3, build proactive alerting that surfaces delivery trends before they affect your end users.

Alarm Metric / Source Threshold
Delivery success rate CloudWatch SMS metrics Alert when below 95%.
Spend threshold CloudWatch billing metric Alert at 80% of monthly limit.
Delivery failures Amazon EventBridge rule on TEXT_FAILED Route to Amazon SNS topic or AWS Lambda.
Carrier unreachable Amazon EventBridge rule on TEXT_CARRIER_UNREACHABLE Route to Amazon SNS topic or AWS Lambda.

Build a CloudWatch dashboard showing messages sent per minute, success versus failure breakdown, and spend accumulation over time.

You can also configure Amazon EventBridge to notify you of registration status changes. AWS End User Messaging SMS publishes events for statuses including REQUIRES_UPDATES, REVIEWING, and PROVISIONING, which is useful if a carrier requests changes during a proactive audit after your short code is already active.

For metric details, see Monitoring SMS activity with Amazon CloudWatch.

Step 9: Track OTP verification success (if applicable)

If your short code delivers OTP or two-factor authentication (2FA) codes, track end-to-end verification success in addition to carrier delivery receipts. A “delivered” status at the carrier level does not confirm the end user received and entered the code.

Tracking verification rates gives you insight into latency patterns when codes expire before arrival, geographic delivery trends, and opportunities to improve conversion. Some use cases involve asynchronous processing where several minutes of computation occur before the SMS is sent. For these, measure the full round-trip from the triggering action to message delivery. This separates application-side latency from carrier-side delivery latency.

For implementation guidance, see Track OTP success with AWS End User Messaging SMS feedback.

Step 10: Set up cost visibility

SMS costs include AWS charges plus per-message carrier surcharges. Setting up cost visibility from day one lets you track spend trends, catch anomalies early, and optimize over time.

Start by activating AWS Cost Explorer and creating a cost allocation tag for your SMS workload. Then configure an AWS Budget with threshold alerts. For example, you might notify at 80% of projected monthly spend. This gives you advance warning of unexpected cost increases, whether from traffic spikes, retry loops, or blocked-country leakage.

Step 11: Plan your traffic migration

A phased rollout validates delivery performance at each stage before you increase volume.

Start with a canary phase (Day 1 to 3) where you route 5 to 10% of traffic to the short code and monitor delivery rates, latency, and event logs. Move to a ramp phase (Day 3 to 7) at 50%, validating throughput and carrier-level delivery across your recipient base. Finish the full migration (Day 7+) at 100%. Decommission your previous origination identity only after confirming stability for at least 48 hours.

Step 12: Validate production readiness and send

Before declaring your short code production-ready, run through the following validation checks:

  1. Confirm your CloudWatch dashboard shows events flowing for TEXT_DELIVERED and TEXT_FAILED (from Step 3).
  2. Send a test message that triggers your STOP keyword. Verify the correct opt-out response is returned and the phone number appears in your opt-out list.
  3. Send a test message that triggers your HELP keyword. Verify the response matches your approved registration.
  4. Check your MPS quota in the support case response (from Step 5). Confirm it matches or exceeds your calculated peak.
  5. Review your country restrictions (from Step 7). Attempt to send a message to a blocked country and confirm it is rejected.
  6. Verify your CloudWatch alarm fires by temporarily lowering the threshold, or by checking that the alarm state is not INSUFFICIENT_DATA.

After all six checks pass, you are ready to begin your phased migration (Step 11) and scale to full production traffic. At this point, your short code is configured, monitored, compliant, and protected.

Automate with a validation script

You can use an AI coding assistant such as Kiro to generate a validation script tailored to your environment. Try a prompt like: “Write a boto3 script that validates my SMS short code is production-ready by checking Active status, HELP/STOP keywords, configuration set existence, and pool association using the pinpoint-sms-voice-v2 client.”

Refine the prompt with specifics from the following reference implementation, such as exact API names, filter parameters, and output format, to match your requirements.

The following script is an example of what that output looks like:

import boto3
import sys

SHORT_CODE = "12345"  # TODO: Replace with your short code (e.g., "67890")
POOL_ID = "pool-1234567890abcdef0"  # TODO: Replace with your pool ID from Step 4
CONFIG_SET_NAME = "prod-otp-shortcode"  # TODO: Replace with your configuration set name from Step 3

client = boto3.client("pinpoint-sms-voice-v2")

# Note: For accounts with many resources, implement NextToken pagination
# on describe_* calls. This script assumes results fit in a single page.


def check_short_code_active():
    """Step 1: Verify short code is Active."""
    response = client.describe_phone_numbers(
        Filters=[
            {"Name": "status", "Values": ["ACTIVE"]},
            {"Name": "number-type", "Values": ["SHORT_CODE"]}
        ]
    )
    numbers = [
        n for n in response["PhoneNumbers"]
        if n["PhoneNumber"] == SHORT_CODE
    ]
    assert len(numbers) > 0, f"Short code {SHORT_CODE} not found or not Active"
    print(f"[PASS] Short code {SHORT_CODE} is Active")


def check_keywords_configured():
    """Step 2: Verify HELP and STOP keywords exist."""
    response = client.describe_keywords(OriginationIdentity=SHORT_CODE)
    keyword_names = [kw["Keyword"].upper() for kw in response["Keywords"]]
    assert "STOP" in keyword_names, "STOP keyword not configured"
    assert "HELP" in keyword_names, "HELP keyword not configured"
    print("[PASS] HELP and STOP keywords configured")


def check_configuration_set():
    """Step 3: Verify configuration set exists."""
    response = client.describe_configuration_sets(
        ConfigurationSetNames=[CONFIG_SET_NAME]
    )
    assert len(response["ConfigurationSets"]) > 0, f"Configuration set {CONFIG_SET_NAME} not found"
    print(f"[PASS] Configuration set '{CONFIG_SET_NAME}' exists")


def check_pool_association():
    """Step 4: Verify pool exists and short code is associated to it."""
    response = client.describe_pools(PoolIds=[POOL_ID])
    assert len(response["Pools"]) > 0, f"Pool {POOL_ID} not found"

    # Verify short code is associated to the pool
    assoc_response = client.list_pool_origination_identities(PoolId=POOL_ID)
    identities = [
        oi["OriginationIdentity"]
        for oi in assoc_response["OriginationIdentities"]
    ]
    assert any(SHORT_CODE in oi for oi in identities), \
        f"Short code {SHORT_CODE} not associated with pool {POOL_ID}"
    print(f"[PASS] Pool '{POOL_ID}' exists and short code is associated")


if __name__ == "__main__":
    checks = [
        check_short_code_active,
        check_keywords_configured,
        check_configuration_set,
        check_pool_association,
    ]
    for check in checks:
        try:
            check()
        except Exception as e:
            print(f"[FAIL] {check.__doc__} - {e}")
            sys.exit(1)
    print("\nAll validation checks passed. Ready for production traffic.")

Cleaning up

If you created test resources while following this walkthrough, you can delete them through the AWS End User Messaging SMS console or with the API to avoid confusion with your production configuration. This includes a test configuration set, test pool, or test event destinations used for validation. Do not delete your production configuration set, pool, or keyword settings.

If you requested a test-level MPS increase or spending limit for validation, update these to your production values through a new support case before going live.

Quick reference checklist

Step Action Key API / Service
1 Verify short code is Active and test delivery SendTextMessage
2 Configure keywords and verify message compliance PutKeyword
3 Create configuration set with event destinations CreateConfigurationSet
4 Create pool and associate short code CreatePool, AssociateOriginationIdentity
5 Request MPS increase for expected throughput AWS Support
6 Request spending limit increase AWS Support
7 Restrict destination countries Console / UpdateAccount
8 Set up CloudWatch alarms and dashboards Amazon CloudWatch
9 Track OTP verification success (if applicable) SMS Feedback events
10 Set up cost visibility AWS Cost Explorer, AWS Budgets
11 Plan phased traffic migration Application-level routing
12 Validate production readiness and send All of the preceding

Conclusion

In this post, we walked through how to configure a newly provisioned SMS short code for production use with AWS End User Messaging SMS. The 12 steps cover keyword verification, message compliance, event monitoring, throughput planning, country restrictions, cost visibility, phased traffic migration, and a final production validation.

You can adapt the sequence to your specific use case and volume profile. For the full registration and application process, see A guide to SMS short codes with AWS End User Messaging. To start configuring, navigate to the AWS End User Messaging SMS console. For the full API reference, see the AWS End User Messaging SMS documentation.


About the author

Sunsetting Tor 0.4.8

Post Syndicated from jzb original https://lwn.net/Articles/1079119/

The Tor Project has announced
that it is planning to actively stop supporting Tor 0.4.8 and earlier
C Tor versions soon.

Usually, we try not to break existing releases, even if they are
unsupported, unless we have a pretty good reason. In this case, we
have several reasons. […]

The most important reason is this: in 0.4.9, we have made some
former fields in our directory data obsolete — specifically, TAP
onion keys
and family
lines
. Removing these fields will let us save a great deal of
client directory bandwidth for everyone. This, in turn, will make all
Tor clients bootstrap a little faster, especially those on slow
connections. But when we remove these fields, clients and relays
running earlier versions of Tor will no longer work, since they expect
the TAP onion keys to be present. Therefore, in order to deliver
improved performance faster, we need to accelerate the date on which
0.4.8 will stop working.

The target sunset date is currently September 1,
2026, after which any version prior to Tor 0.4.9 will cease to work on
the network. The first stable release in the 0.4.9.x series was
announced
in February 2026, and the Tor 0.4.8.x series reached end of life on
June 1.

Security updates for Tuesday

Post Syndicated from jzb original https://lwn.net/Articles/1079083/

Security updates have been issued by Debian (ffmpeg), Fedora (erlang, ffmpeg, prometheus, python-scrapy, python3-docs, python3.14, thorvg, tigervnc, and vips), Mageia (mumble and sslh), Oracle (389-ds:1.4, dracut, firefox, hplip, kernel, openssh, postgresql:15, redis:6, and uek-kernel), Red Hat (delve, gvisor-tap-vsock, nginx, nginx:1.24, nginx:1.26, osbuild-composer, podman, rhc, skopeo, and yggdrasil), SUSE (containerized-data-importer, graphite2, kernel, libarchive, openssh, openssh-askpass-gnome, openvswitch, openvswitch3, postfix, python-lxml, python-nltk, python-python-multipart, python-urllib3, rmt-server, terraform-provider-local, terraform-provider-null, and util-linux), and Ubuntu (google-guest-agent, haproxy, libxml2, linux-azure, linux-intel-iotg-5.15, linux-lowlatency, linux-lowlatency-hwe-5.15, linux-oracle-5.15, mysql-8.0, mysql-8.4, and nginx).

Backblaze Announces Five-Year Multi-Exabyte Data Storage Agreement with CoreWeave

Post Syndicated from Gleb Budman original https://www.backblaze.com/blog/coreweave-announcement-2026/

A decorative image showing cubes on a gradient background.

Backblaze, Inc. (Nasdaq: BLZE), the cloud storage platform for the AI era, today announced an agreement with CoreWeave, Inc. (Nasdaq: CRWV), The Essential Cloud for AI™. 

Under the multi-exabyte, $335 million agreement, Backblaze will provide cost-efficient storage capacity that supports portions of CoreWeave’s managed storage infrastructure, helping optimize placement of data across performance tiers while preserving high-performance storage resources for the demands of AI workloads. The Backblaze technology supports HDD-based storage tiers in CoreWeave AI Object Storage. Customers already utilizing CoreWeave AI Object Storage with its patented LOTA distributed cache will immediately have access to new service tiers without any code modifications.

Every stage of the AI lifecycle depends on the ability to store and move massive volumes of data efficiently. Training, inference, checkpointing, data preparation, model outputs, and retrieval-augmented generation (RAG) all require storage that performs at the speed and scale modern AI demands.

“Storage is the foundation every AI workflow is built on — without it, even the world’s most powerful compute sits idle,” said Gleb Budman, co-founder and CEO, Backblaze. “We’re pleased to work with CoreWeave on elements of their storage environment. This collaboration demonstrates how our platform can help organizations meet growing infrastructure demands.”

Backblaze serves more than 100,000 customers worldwide and has extensive experience operating large-scale storage infrastructure. Its cloud platform is designed to deliver reliable, cost-efficient storage services across a range of enterprise and data-intensive use cases.

“Backblaze has built a reputation for making complex, HDD-based storage infrastructure reliable and easy-to-consume at scale. We’re pleased to work with them as we continue expanding our platform and managed service offerings to support AI workloads at scale,” said Nick Hoover, Vice President at CoreWeave.

CoreWeave’s AI cloud platform spans infrastructure, technology, tools, and services. The company serves leading AI model developers, enterprises, and research organizations, including 9 of the top 10 AI model providers.

Contact the Sales team to learn more about Backblaze storage for neoclouds.

Contact Sales

The post Backblaze Announces Five-Year Multi-Exabyte Data Storage Agreement with CoreWeave appeared first on Backblaze Blog | Cloud Storage & Cloud Backup

How to design and present clear computing lessons

Post Syndicated from Sean Sayers original https://www.raspberrypi.org/blog/how-to-design-and-present-clear-computing-lessons-mayers-principles/

Learning something new requires effort. Learners take in new information by listening and observing. When a lot of information is presented at once in a lesson, that can create too much cognitive load for learners — a barrier to understanding and engagement.

To help you design and deliver great computing lessons, we’ve written two new Pedagogy Quick Reads focused on Mayer’s Principles of Multimedia Learning. These research-backed principles give you practical strategies to lower your students’ unnecessary cognitive load during lessons, leading to better learning outcomes.

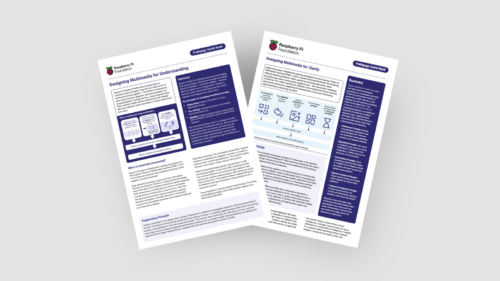
A snapshot of our pedagogy quick reads.

In this blog, we introduce the two new Quick Reads (Designing multimedia for clarity and Designing multimedia for understanding), which you can download for free to:

  • Find practical tips for how you can apply Mayer’s Principles to your lessons
  • Read a summary of the research behind them

The blog also includes some examples for how to apply the principles in your computing lessons.

If you’d like an introduction to the idea of cognitive load, you can find the Quick Read about cognitive load theory here.

In a computing classroom, a girl looks at a computer screen.

What are Mayer’s Principles?

Mayer’s Principles of Multimedia Learning are practical principles that will help you create clearer resources and present information in a way that avoids unnecessary cognitive load for your learners.

Mayer’s Principles are based on three related facts:

  1. You can present information to learners in auditory form (e.g. spoken explanations) and visual form (e.g. written text, diagrams)
  2. There are limits on how much new information people can take in at the same time
  3. Teaching materials that are not well-structured can cause too much cognitive load, which negatively affects learning

Designing lessons for clarity

Our first new Quick Read focuses on the following Mayer’s Principles for making your lessons as clear as possible, so that learners can connect the information they see and hear in real time.

  • Make all the information you include coherent, meaning that it is directly relevant to the learning objectives and does not distract learners’ attention
  • Guide your learners’ attention by using signals such as arrows, bold text, colour, or auditory cues
  • Avoid redundant information, such as a slide with a diagram and a paragraph explaining the diagram, or a slide that you speak about without adding new, complementing information
  • Present related words and visuals in the same space, e.g. place your text labels, or explanations directly adjacent to diagrams, images or code segments they describe
  • Present related words and visuals at the same time, e.g. by pairing narration with imagery

Designing lessons for understanding

Our second new Quick Read shares three Mayer’s Principles for how you can structure your lesson delivery to support your learners’ understanding:

  • Structure lessons or demonstrations into clear, manageable stages or segments, rather than presenting the information all at once
  • When you start a new topic, begin with some pre-training by introducing key terms, components, or goals and how they relate
  • When you present diagrams, flowcharts, or code examples, explain this visual information using the other modality, meaning spoken narration, instead of using paragraphs of text

Applying Mayer’s Principles to your computing lessons

We suggest you consider implementing Mayer’s Principles when you next design new lessons or want to adapt materials that you reuse regularly.

Here are some ideas on how you use both sets of principles in common computing teaching scenarios.

Live coding and code walkthroughs

When displaying a new Python script or Scratch project, avoid adding long, written paragraphs of commentary to explain the code. Instead, place short text annotations or sub-goal labels directly next to the relevant lines or blocks. As you run through the code, use your pointer or live typing to guide your learners’ focus (signalling) and explain in words how the program works at the same time.

Starting a new topic such as networking

Before students move to a new topic, for example networking, consider what words or concepts your class needs to be familiar with. Allocate a few minutes at the start of your lesson for pre-training to introduce terms like LAN or bandwidth and how they relate to the lesson.

Learners in a computing classroom.

Consider how your lesson can be divided into stages to allow for better understanding (segmenting). Each stage should build on the previous one and feed into the next one. For example, when you explain how data moves across a network, you can introduce each step separately before combining them all into a complete model of a network.

Consider how you display visual information to your class. Ensuring related diagrams and labels appear close together, only include relevant materials and no decoration on your slides (coherence), and avoid simply reading out words on the slide identical forms of information (redundancy).

Supporting multilingual learners with Mayer’s Principles

Mayer’s Principles are even more important for educators teaching multilingual learners or non-native speakers. When learners need to work harder to understand the language, poor lesson design can slow down their learning significantly.

Mayer’s Principles can help you with this challenge:

  • Applying the coherence and redundancy principles will allow you to make your explanations and slides as clear and concise as possible
  • Using signaling will mean you help learners to follow along and know what is most important
  • Presenting diagrams that illustrate computing concepts clearly will help your multilingual learners understand your spoken explanation much more easily (modality)

Intentional design for lasting understanding

By intentionally designing and presenting lessons to give the right amount of information in the clearest way, you make it easier for your students to focus and build a lasting understanding of computing concepts. When your lesson materials align with how our brains process information, learners can build stronger mental models and approach independent learning activities with greater confidence.

Read our new Quick Reads to find out more and discover the research behind Mayer’s Principles:

The post How to design and present clear computing lessons appeared first on Raspberry Pi Foundation.

Backblaze Generative Media Hackathon: Build with B2, Genblaze, and GMI Cloud

Post Syndicated from Jeronimo De Leon original https://www.backblaze.com/blog/backblaze-generative-media-hackathon-build-with-b2-genblaze-and-gmi-cloud/

The generative AI wave is moving from text into media. ChatGPT taught a generation of developers how to wire up an LLM. The next chapter is harder and more interesting: video, image, audio, and multimodal workflows that combine them. New models for each of these are landing every few weeks, from established labs and from teams nobody had heard of a quarter ago. The quality keeps climbing, and the catalog keeps expanding.

That pace is good news, but it asks more of the apps that depend on it. A pipeline that hard-codes today’s best video model is going to feel dated in a month. The apps that come out ahead will be the ones built on reactive architectures: pipelines that stream progress as events, fan out concurrent work, fall back when a provider stalls, and let you swap in a new model with a single line of code.

That’s where the moat is now. If you’re building an AI media product, the differentiation is in the pipeline: which models you call, in what order, how you fall back when one is slow, how you keep latency tolerable, where the assets land, and how you prove what was generated. The teams winning this space treat the orchestration layer as their core IP. The frontend on top is the easy part.

We’re looking for builds that solve real-world use cases. Show us what becomes possible when the pipeline stops being a bottleneck.

What we’re running

The Backblaze Generative Media Hackathon is an online competition for developers building generative media apps. $10,000 in cash prizes, 10 GB of free Backblaze B2 storage to start with, and GMI Cloud credits for the first 270 eligible participants.

  • Grand Prize: $7,000
  • Second Place: $2,000
  • Third Place: $1,000

Registration and submissions run June 22 through August 3, 2026 (5 pm ET). Winners are announced August 12.

The stack

Backblaze B2, Genblaze, and GMI Cloud are the three pieces of a media pipeline that’s both easy to vibe code and serious enough to take to production.

Backblaze B2 is S3-compatible object storage for the generated assets, the metadata, the provenance manifests, the thumbnails, and the logs. Durable URLs that never expire. Event Notifications fire downstream work without polling. Object Lock makes your provenance records tamper-evident. Lifecycle Rules handle cleanup so intermediate artifacts don’t pile up.

Genblaze is our open-source Python SDK for orchestrating generative media workflows. One Pipeline API spans OpenAI, Google, Runway, Luma, Decart, ElevenLabs, Stability Audio, NVIDIA NIM, GMI Cloud, and others. Every run produces a SHA-256-verified provenance manifest. Swap providers with a one-line change. New models drop every couple of months, and your app doesn’t need a rewrite each time.

GMI Cloud is a unified inference platform for open source AI. Image, video, audio, chat, reasoning, and multimodal models behind a single API key. If you want to try five video models in a weekend, this is the easiest way.

What to build

Anything that turns a generative AI capability into something a real person would actually use. Some directions:

  • AI video generation or editing apps
  • Image generation, remixing, or transformation tools
  • Audio, music, or voice generation workflows
  • Multimodal apps that combine text, image, video, and audio
  • AI media libraries for storing, organizing, and searching generated assets
  • Provenance-aware workflows that track how each piece of media was generated
  • Agentic media pipelines that generate, evaluate, retry, and store outputs
  • Tools for creators, marketers, educators, entertainers, or developers

Judges will weigh real-world utility, production readiness, and how meaningfully your app uses B2 and Genblaze. We’re looking for projects where the pipeline is doing real work. Apps that handle multiple providers, recover from errors, track provenance, and store assets reliably.

How to enter

Visit the hackathon page on Devpost for registration details, eligibility requirements, prizes, submission guidelines, and important dates:

https://www.backblaze-generative-media.devpost.com

Build your generative AI media application using Backblaze B2 and Genblaze, then submit your project before the deadline.

Join the Hackathon

If you want a head start on what a Genblaze + B2 app looks like in code, two reference repos already exist. genblaze-gen-media-multi-provider-sample chains five providers into one prompt-to-MP4 pipeline. genblaze-gmicloud-pipeline is a deep multi-model composition inside one provider.

We’re looking forward to seeing what you build.

The post Backblaze Generative Media Hackathon: Build with B2, Genblaze, and GMI Cloud appeared first on Backblaze Blog | Cloud Storage & Cloud Backup

Toward More Controllable AI Video Editing: An Early Research Exploration at Netflix

Post Syndicated from Netflix Technology Blog original https://netflixtechblog.com/toward-more-controllable-ai-video-editing-an-early-research-exploration-at-netflix-eb8160ed60a2

By Zhuoning Yuan, Ta-Ying Cheng, Benjamin Klein, Bahareh Azarnoush

Introduction

At Netflix, we build technology to help storytellers bring their creative visions to life and to help members discover the stories they love.

To connect stories with diverse audiences around the world, we produce promotional assets, including trailers, teasers, and social short‑form videos, that build on and elevate the original footage. Through close collaboration with the teams crafting these assets, we identified a recurring gap in current tools. Transforming raw footage into a polished final asset often requires complex edits like seamlessly adding new visual elements, patching or replacing backgrounds, or removing unwanted objects without breaking the scene’s physical continuity. These tasks typically demand hours of specialized manual editing work. While recent generative video editing models show promise, they often struggle to preserve the integrity of the source footage. Many methods regenerate every pixel to make an edit, which can fail to isolate changes and inadvertently alter elements that should remain untouched. To execute these tasks effectively, artists need tools that empower them to dictate exactly what changes and how it changes.

Our research goal is to make this process easier for artists. We’re deliberate about where and how AI is applied, ensuring that the technology always serves the creative intent. That principle drives our recent work: exploring the benefits of generative AI in ways that protect and expand creative choice, and keeping artists in precise control of their final vision. Recent advancements in AI video editing have demonstrated impressive capabilities in streamlining complex manual editing workflows, but key challenges remain before they can reliably support professional use:

  • Unintended edits: When editing a specific element in a video clip, many methods regenerate the entire video, which can inadvertently alter identity, performance, and other elements like objects, backgrounds, or critical scene details.
Left: input video. Right: output from Ditto using the prompt “change the background to a winding coastal highway in California,” which completely changes the scene.
  • Unnatural physics: When removing objects, many methods focus only on erasing the target while ignoring the scene’s physical continuity. This can lead to inconsistent motion and implausible interactions, making the results look unnatural.
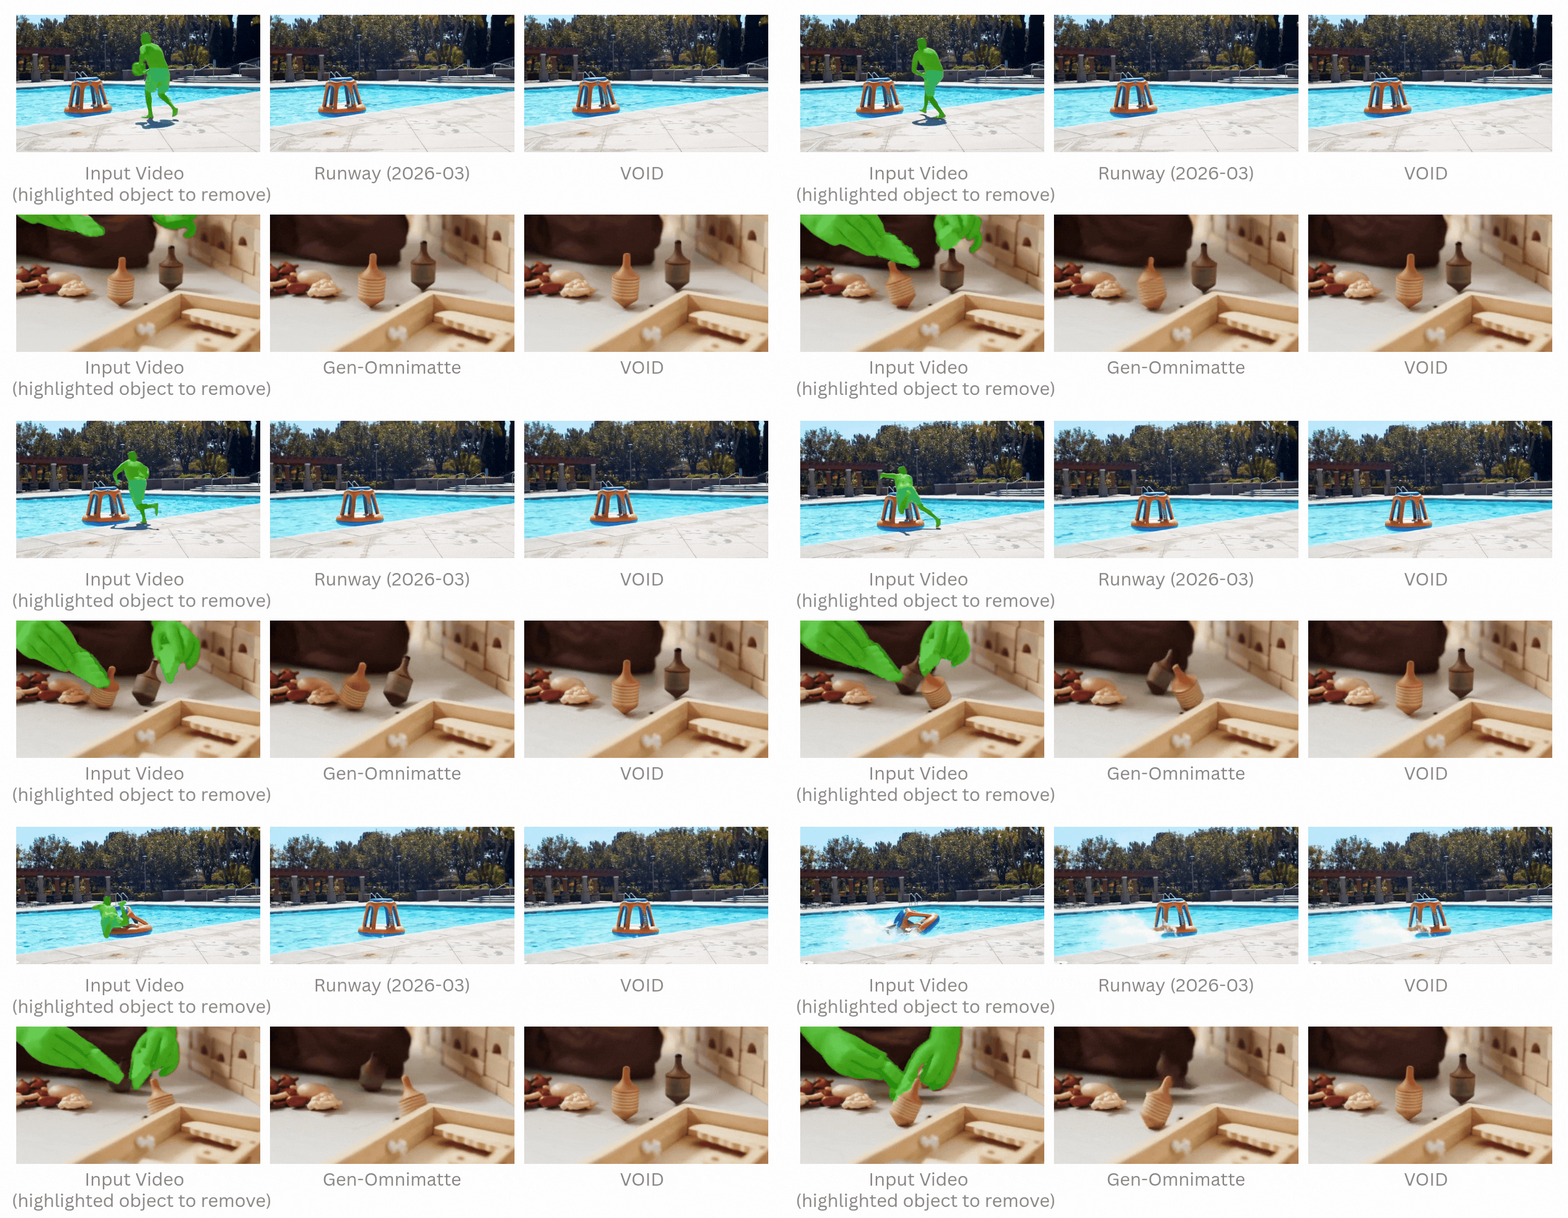
Left: the green mask denotes the target to be removed. Right: output from Gen-Omnimatte where the target was removed, but the physical continuity of the scene was ignored — the pool float shouldn’t move if there’s no interaction with it.

Today, we’re sharing two research explorations that aim to address these challenges. We believe this work can help advance the field in a way that’s both meaningful and responsible:

  • Vera: a layered video diffusion model. Vera generates only what needs to change as separate edit layers while leaving the rest of the video untouched, preserving the identities, performances, and other details from the source footage exactly as filmed.
  • VOID: a video inpainting model for video object and interaction deletion. VOID performs physically plausible inpainting in complex scenes: it doesn’t just remove an object, but also reconstructs the scene as if the object was never there.

Along with this blog post, we’re also publicly releasing the research papers that detail the algorithmic innovations behind Vera and VOID. We hope these publications will enable other researchers to experiment with these ideas, build upon our findings, and further advance the field.

Vera: A Layered Video Diffusion Model

Existing video editing models regenerate the entire clip, coupling the intended edit with regions that should remain unchanged. This increases the risk of altering details of the original footage. To tackle this challenge, we introduce Vera, a novel layered video diffusion framework for content-preserving video editing.

Teaser for Vera (disclaimer: This is a research prototype, not an official product).

Inference Pipeline

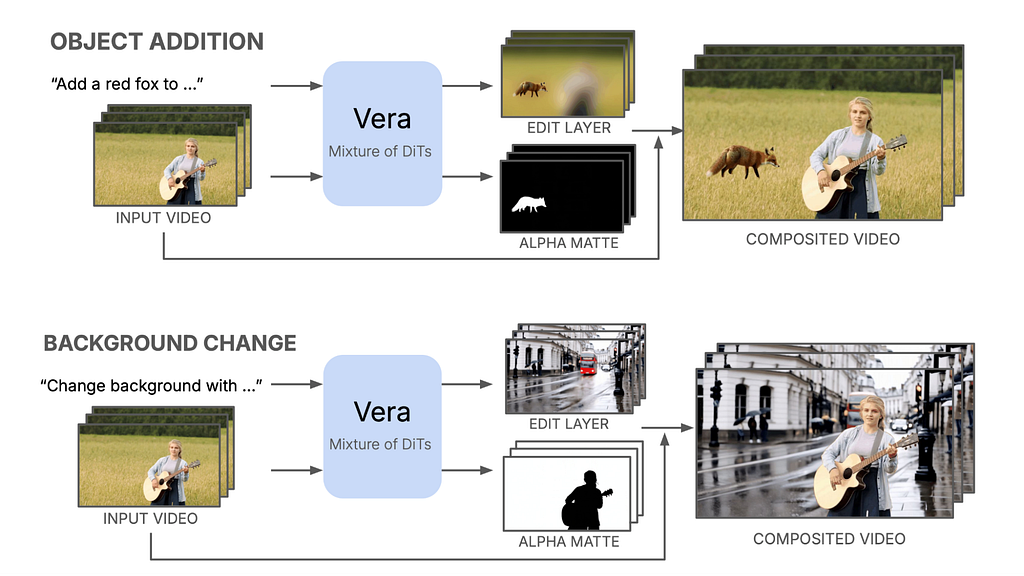
Given a source video and a text editing instruction, Vera jointly generates an edit layer and an alpha matte. These layers are then seamlessly composed with the original footage to produce the final edited result. By design, Vera supports complex tasks such as object addition and background change, while ensuring that the pixels outside the edited regions from the source video remain perfectly intact.

Inference pipeline for Vera: object addition and background replacement.

Training Data

One of the main challenges in developing Vera was the lack of suitable training data. Since no public dataset provides the high-quality layered data we need (clean input, alpha matte, edit layer, composite video), we built our own. Using a combination of existing open-source videos and human annotation, we constructed a layered video dataset with a total of 486k frames at 832×480 resolution. We organized it into three subsets of increasing complexity:

  • Synthetic Composites: Clips with high-quality foreground alpha mattes are composited over diverse, automatically generated backgrounds. This subset provides strong and reliable supervision for alpha matting in object addition and background change tasks.
  • Realistic Single-Object Videos: Real-world clips are processed through segmentation, matting, background inpainting/generation, and human quality filtering. This subset increases scene diversity and camera motion, improving composition quality across both tasks.
  • Realistic Multi-Object Videos with Effects: This extends the previous subset by isolating individual objects with curated alpha mattes, including their associated effects such as shadows and reflections. This subset improves compositing and editing in more complex, dynamic scenes.

Model Architecture

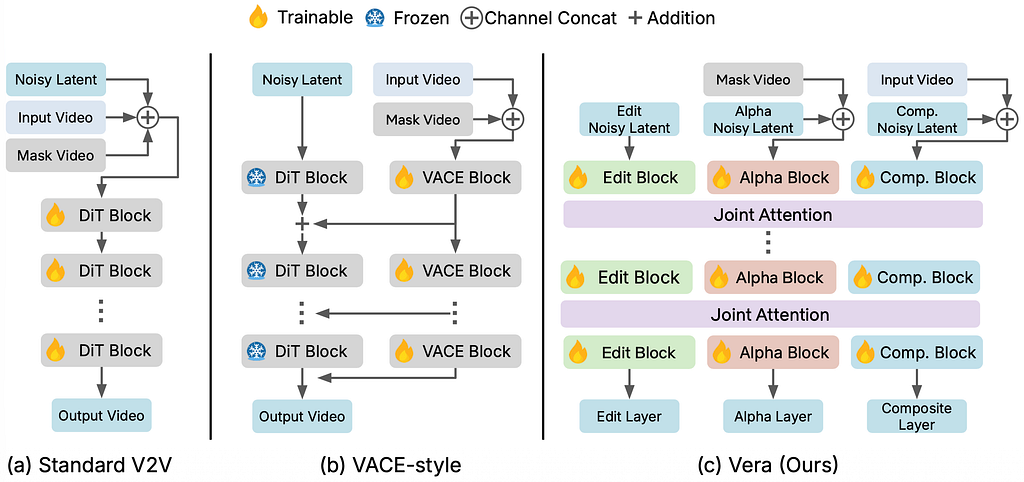
Beyond data, model design is another key challenge. The three target outputs Vera generates — an edit layer (decoupled creative edits), an alpha matte layer (a grayscale mask that depends on the edit content and scene interactions such as occlusions), and a composite layer (natural footage) — have substantially different distributions. In practice, using a single shared architecture to reconcile these differences proved data-inefficient. To address this, Vera uses a MoT (Mixture-of-Transformers) design. Instead of a single DiT, we use three separate DiTs, one for each output:

  • Each DiT maintains its own QKV projections and FFN weights, but we concatenate the output tokens from all three branches and then pass it to joint self-attention. This enables cross-layer interaction while allowing each branch to specialize.
  • All three DiTs are initialized from the same pretrained T2V base model. We add two additional patch-embedding layers for the input video and an optional mask video. Source-video tokens are added to the composite tokens, while mask tokens are added to the noisy alpha tokens.
  • All layers share the same RoPE (Rotary Positional Encoding). We also add zero-initialized learnable embeddings to the alpha and composite tokens to help the model distinguish between layers.
Architecture of Vera compared to other methods. We train two Vera variants: 1.3B and 14B parameters.

Evaluations and Results

To evaluate Vera, we curated a benchmark of test video-prompt pairs: 72 for object addition and 69 for background change, using open-source videos. The test set spans a range of difficulty, including slow and fast motions, various camera motions, single and multiple objects, and both simple and complex scenes. We evaluated the performance across three complementary dimensions:

  • Content Preservation: Measures whether regions outside the targeted edit remain strictly unaltered, evaluated using pixel-level and perceptual similarity.
  • Instruction Compliance: Measures how faithfully the edited video executes the text prompt.
  • Video Quality: Assesses the temporal coherence and per-frame spatial quality of the final edited video.

In our results, both Vera-1.3B and Vera-14B significantly outperform existing baselines on content preservation, while maintaining similar video quality and instruction compliance performance compared to strongest baselines (please see the paper for full results).

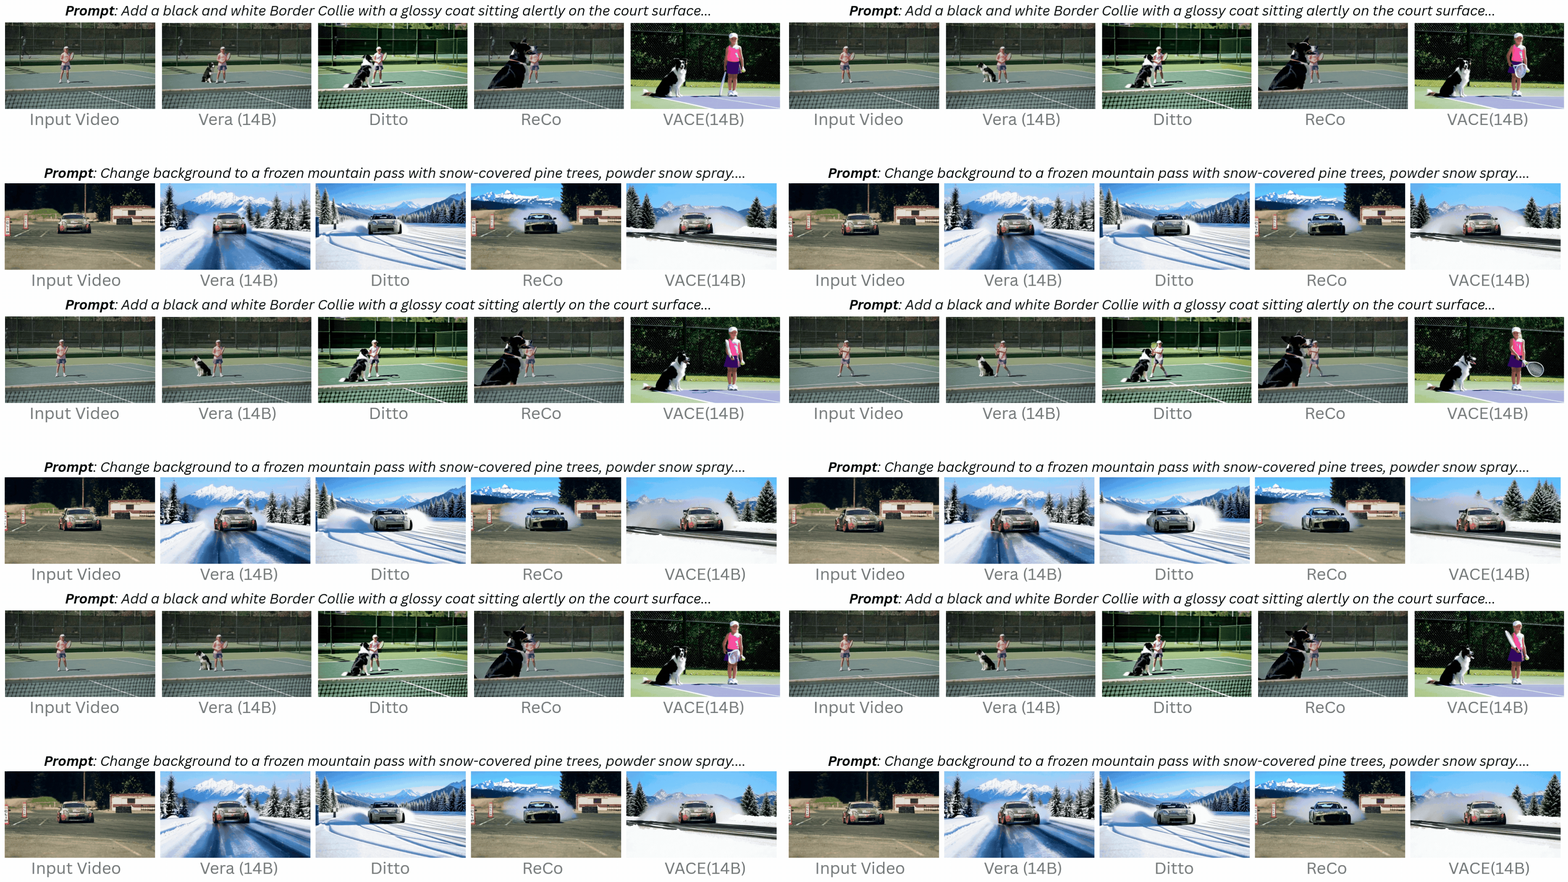
Qualitative comparisons between Vera and baselines (please see more examples on Vera’s project website).

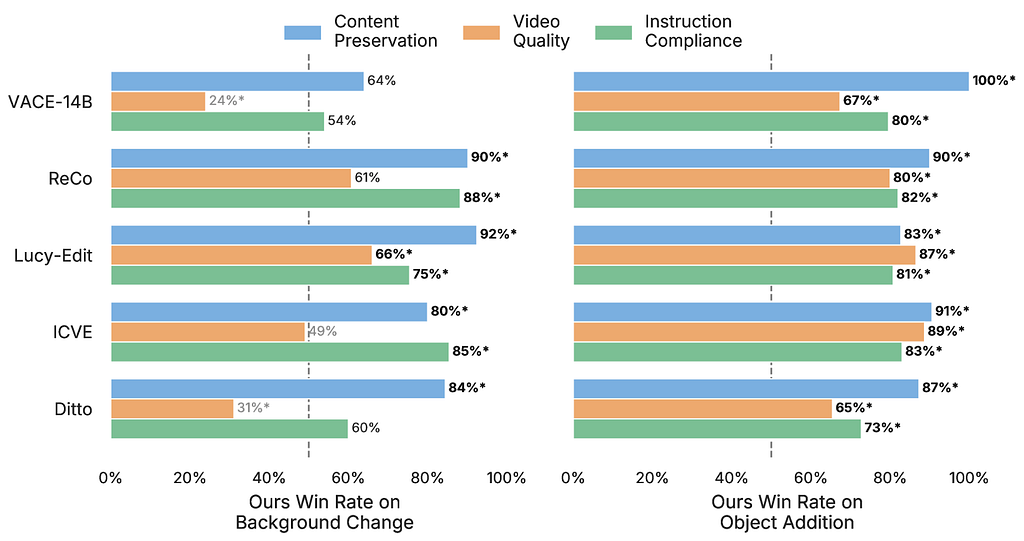
To complement automated metrics, we ran a human preference study comparing Vera against five baselines. We collaborated with 19 creative reviewers who evaluated 512 video trials in total. In each trial, reviewers were shown randomized side-by-side comparisons between the Vera model and a baseline model. The human consensus strongly aligned with our quantitative findings: Vera-1.3B was preferred over all baselines for content preservation and instruction compliance. Furthermore, reviewers rated Vera’s video quality as comparable to baselines on background change tasks, and noted a clear advantage for Vera on object addition tasks.

User study on test set: Vera-1.3B vs. five strong baselines.

VOID: Video Object and Interaction Deletion

Existing video object removal methods excel at inpainting content “behind” the object and correcting appearance-level artifacts such as shadows and reflections. However, when the removed object has more significant interactions — such as collisions with other objects — current models fail to correct them and produce implausible results. To address this, we present VOID, a video object removal framework designed to perform physically-plausible inpainting in these complex scenarios.

Teaser for VOID (disclaimer: This is a research prototype, not an official product).

A Two-Pass Inference Pipeline

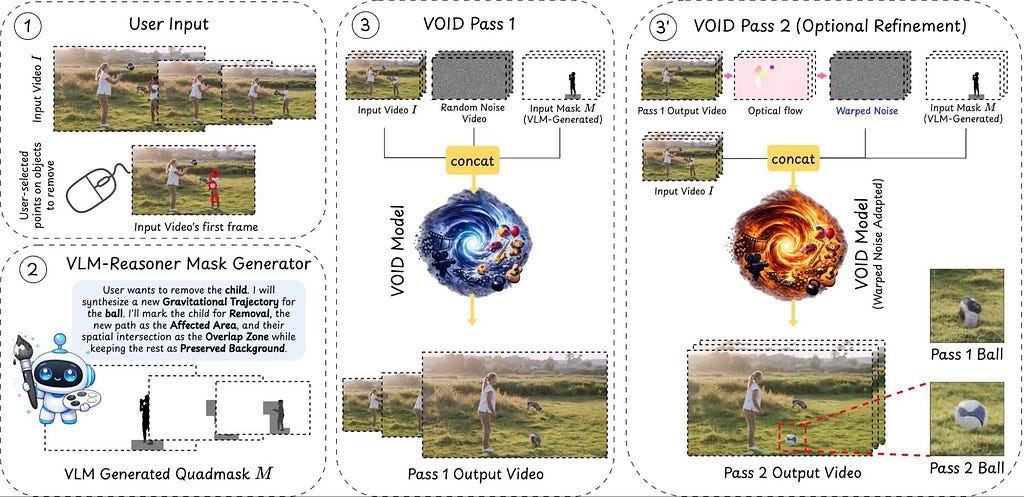
Given an input video, the user clicks on an object to remove. A VLM-based reasoning pipeline then analyzes the scene to identify other regions that will be causally affected, e.g., objects that will fall, collide, or change trajectory. This physical reasoning is encoded into a quadmask to guide the diffusion model:

  • First Pass: VOID takes the video and the quadmasks as input and generates a physically plausible counterfactual video in which the object — and its interactions — are removed.
  • Second Pass: Smaller video diffusion models occasionally suffer from “object morphing” when generating moving objects. If VOID detects this failure mode, it triggers a second pass that re-runs inference using flow-warped noise derived from the first pass, stabilizing the object’s shape along its newly synthesized trajectory.
Overview of VOID’s two-pass inference pipeline.

Training Data

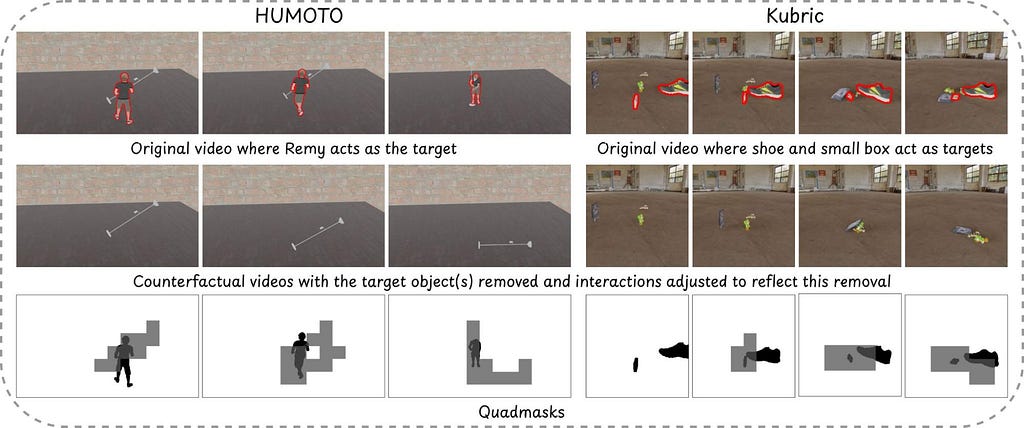
We built on top of the Kubric simulation engine and the HUMOTO human motion capture dataset to generate synthetic counterfactual video pairs along with their corresponding quadmasks. Specifically, the counterfactual videos are generated by re-simulating the exact scene from the original video, but with the target object(s) or human removed. This resimulation creates an alternate outcome based on strict laws of physics. For example, if a person holding a lamp is removed from the scene, the simulation ensures the lamp obeys gravity and falls to the ground. The quadmasks then capture the removed object (black), the affected regions (grey), their overlaps (dark grey), and the unchanged parts of the scene (white).

Overview of VOID data engine.

Model Training

During model training for VOID, we introduce two improvements over prior work: (i) quadmask conditioning, which explicitly identifies regions in each frame that may change after the object is removed, and (ii) a second-pass video appearance refiner that reduces artifacts such as unwanted object morphing. VOID is finally trained on the CogVideoX-Fun-V1.5–5b-InP backbone with Gen-Omnimatte’s checkpoint and fine-tuned for video inpainting with interaction-aware quadmask conditioning.

Evaluations and Results

Experiments across both synthetic and real data demonstrate that VOID preserves consistent scene dynamics far better than prior video object removal methods (please see the paper for full results). VOID successfully maintains object structure and produces plausible motion over time across a wide variety of real-world cases. By contrast, results from both open- and closed-source baselines consistently exhibit physically inaccurate artifacts. For instance, baselines generate water splashes without human impact (see top row of the figure below) or show spinning tops being disrupted without the presence of interacting hands.

Comparison of VOID with other strong baselines (please see more examples on VOID’s project website).

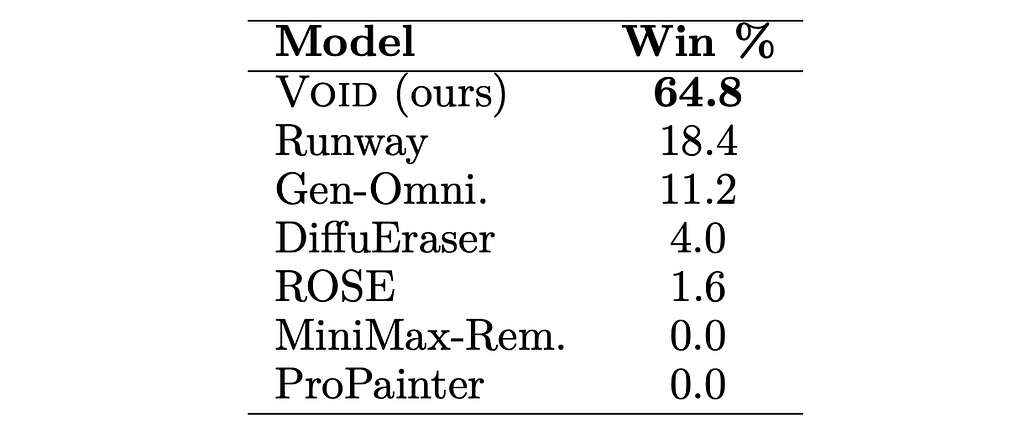
To complement our quantitative evaluation, we conducted a user study with 25 creative reviewers to measure the perceptual realism and physical plausibility of our counterfactual edits. Each participant was randomly assigned 5 out of 75 real-world scenarios, resulting in 125 total comparisons. For each video, participants viewed the original input alongside the outputs of VOID and six baselines (seven models total) in a randomized order. Participants were asked to select the video that best reflected how the scene should realistically appear after the object was removed, factoring in visual quality, temporal consistency, blending, the realism of scene evolution, and the absence of artifacts. VOID was selected 64.8% of the time, substantially outperforming all baseline models.

User study on real-world test examples: VOID vs. six baselines.

Looking Ahead

Applying AI in ways that serve both member and creator needs is core to our research philosophy, and these projects reflect that approach. While Vera and VOID show promising early results, reaching production-ready quality will require addressing several limitations we encountered. For example, Vera struggles with some complex effects such as lightning or smoke due to the limited training data, and in some cases, it fails to keep background motion fully consistent with the input camera movement. Despite the various generalization capabilities VOID exhibits, we still observe domain gaps. For instance, it cannot handle videos with unusual camera angles or shots captured very close to the target object, and it currently has constraints on supported video length and resolution.

These limitations motivate continued investment in this line of research. Vera and VOID are important early efforts toward making complex video editing more controllable and accessible for artists. For this work, we used publicly available datasets with additional annotation efforts for experiments, and we hope that sharing our research will encourage the broader community to build on these ideas and advance them further.


Toward More Controllable AI Video Editing: An Early Research Exploration at Netflix was originally published in Netflix TechBlog on Medium, where people are continuing the conversation by highlighting and responding to this story.

Run isolated sandboxes with full lifecycle control: AWS Lambda introduces MicroVMs

Post Syndicated from Micah Walter original https://aws.amazon.com/blogs/aws/run-isolated-sandboxes-with-full-lifecycle-control-aws-lambda-introduces-microvms/

Today, we are announcing AWS Lambda MicroVMs, a new serverless compute primitive within AWS Lambda that lets you run code generated by users or AI in isolated, stateful execution environments. You get virtual machine level isolation, near-instant launch and resume, and direct control over environment lifecycle and state, all without managing infrastructure or building expertise in complex virtualization technologies. Lambda MicroVMs are powered by Firecracker, the same lightweight virtualization technology that has powered over 15 trillions of monthly Lambda function invocations.

Why customers need this
Over the past few years a new class of multi-tenant applications has emerged that all share the need to hand each end user their own dedicated execution environment in which to safely run code that the application developer did not write. AI coding assistants, interactive code environments, data analytics platforms, vulnerability scanners, and game servers that run user-supplied scripts all fit this pattern. Building that capability today means making a difficult choice. Virtual machines deliver strong isolation but take minutes to start. Containers launch in seconds, yet their shared-kernel architecture requires significant custom hardening to safely contain untrusted code. Functions as a service are optimized for event-driven, request-response workloads, but are not designed for long-running interactive sessions that need to retain environment state across user interactions. That leaves developers either accepting tradeoffs between performance and isolation, or investing significant engineering resources to build and operate custom virtualization infrastructure to achieve isolated execution while delivering low-latency experiences to end-users. This presents an effort that demands deep expertise and pulls engineering time away from the product they are actually trying to build.

Lambda MicroVMs is purpose-built for exactly this gap. Each MicroVM gives a single end user or session its own isolated environment that launches rapidly, retains memory and disk state for the length of the session, and pauses to a low idle cost when the user steps away. Because the same Firecracker technology already underpins AWS Lambda Functions, you inherit the operational maturity of a service that has been running this stack at scale.

Let’s try it out
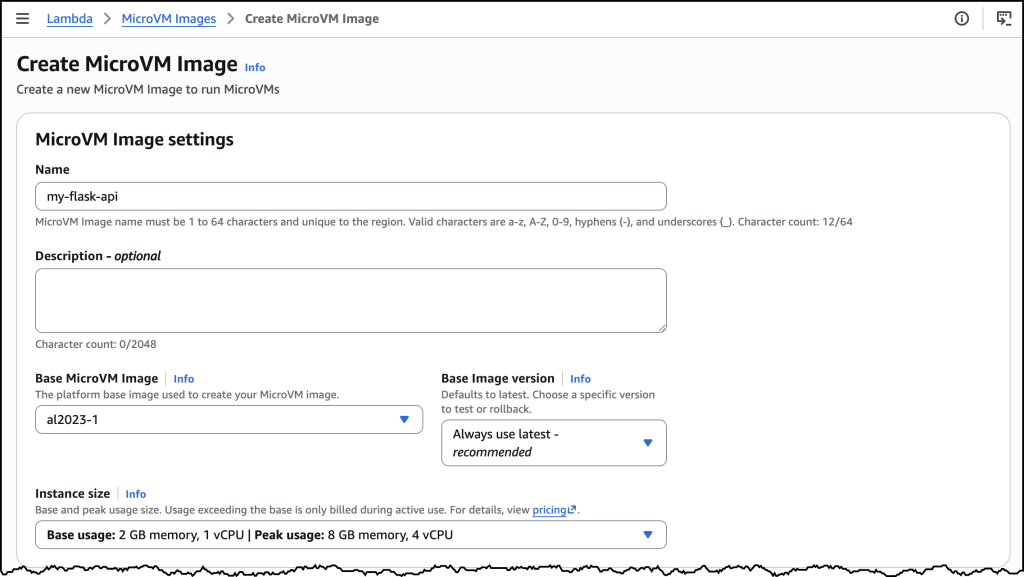
To get started, I navigated to the AWS Lambda console, where Lambda MicroVMs now appears in the left-hand navigation menu. I first need to create a MicroVM Image.

I packaged a Flask web app and its Dockerfile into a zip file, uploaded it to an Amazon Simple Storage Service (Amazon S3) bucket.

My Flask API – app.py

import logging

from flask import Flask, jsonify

app = Flask(__name__)
logging.basicConfig(level=logging.INFO)


@app.route("/")
def hello():
    app.logger.info("Received request to hello world endpoint")
    return jsonify(message="Hello, World!")


if __name__ == "__main__":
    app.run(host="0.0.0.0", port=5000)

My Dockerfile


FROM public.ecr.aws/lambda/microvms:al2023-minimal
RUN dnf install -y python3 python3-pip && dnf clean all

WORKDIR /app

COPY requirements.txt .
RUN pip install --no-cache-dir -r requirements.txt

COPY app.py .

EXPOSE 5000

CMD ["gunicorn", "--bind", "0.0.0.0:5000", "app:app"]

I used the following command to create my MicroVM Image.

aws lambda-microvms create-microvm-image \
--code-artifact uri=<path/to/s3/artifact.zip> --name <VM_image_name> \
--base-image-arn arn:aws:lambda:us-east-1:aws:microvm-image:al2023-1 \
--build-role-arn <IAM role ARN>

You can also create the MicroVM Image in the AWS Console as in the image above. Once I ran the command, Lambda retrieved the zip, ran the Dockerfile, initialized the application, and took a Firecracker snapshot of the running disk and memory state. Build logs streamed in real time to Amazon CloudWatch under /aws/lambda/microvms/<image-name>, and when the image was ready it appeared in the console with its Amazon Resource Name (ARN) and version number.

aws lambda-microvms run-microvm \
--image-identifier arn:aws:lambda:<region>:<acct>:microvm-image:my-image \
--execution-role-arn arn:aws:iam::<acct>:role/MicroVMExecutionRole \
--idle-policy '{"maxIdleDurationSeconds":900,"suspendedDurationSeconds":300,"autoResumeEnabled":true}'

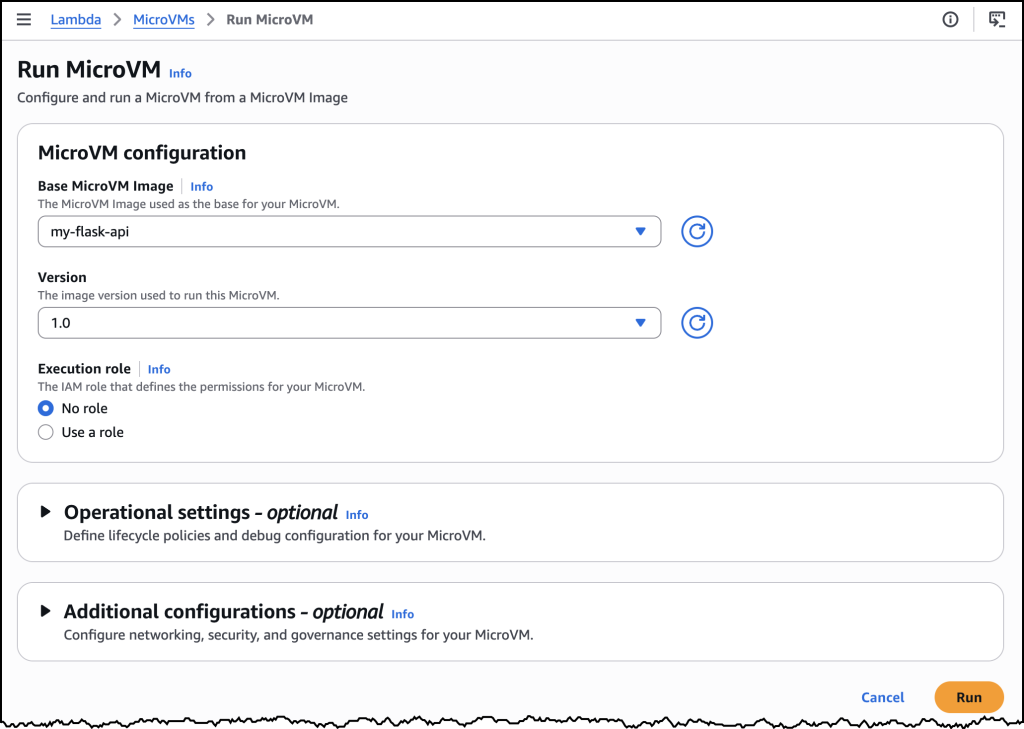
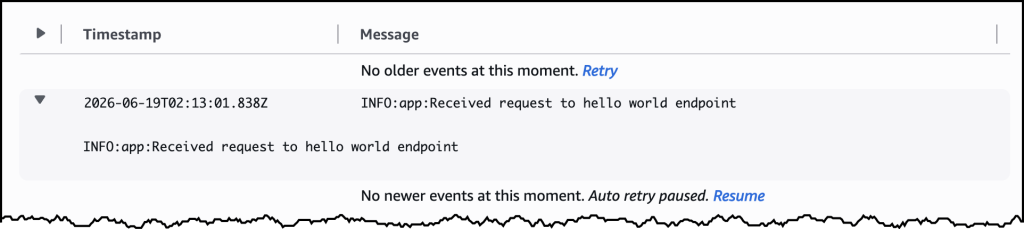
Launching can also be done via the AWS Console or the CLI. I passed the image ARN and an idle policy configured to auto-suspend after 15 minutes of inactivity and auto-resume on the next incoming request. No networking setup was required. Lambda assigned the MicroVM a unique ID, returned a dedicated endpoint URL, and started a new MicroVM with my Flask app already running, since it was resumed from a snapshot. My Flask app was already running the moment the launch completed. One API call to get a fully initialized, bootstrapped compute environment.

To send traffic, I generated a short-lived auth token with the CLI and attached it to a plain HTTPS request using the X-aws-proxy-auth header. The request landed on my Flask app immediately. I then let the MicroVM sit idle past the suspend threshold, at which point the MicroVM was suspended, with its memory and disk state snapshotted and stored. I then sent another request, and it resumed with the application state fully intact. From the client side, the pause never happened.

How it works
Under the covers, Lambda MicroVMs delivers three capabilities that, until today, no single AWS compute service offered together. The first is virtual machine level isolation, which comes from Firecracker. Each session runs in its own dedicated MicroVM with no shared kernel and no shared resources between users, so untrusted code supplied by one user is contained to their execution environment, without access to other environments or the underlying system. The second is rapid launch and resume. The model is image-then-launch: you create a MicroVM Image by supplying a Dockerfile and code packaged as a zip artifact in Amazon S3, and Lambda runs your Dockerfile, initializes your application, and takes a Firecracker snapshot of the running environment’s memory and disk state. Every subsequent MicroVM launched from that image resumes from the pre-initialized snapshot rather than booting cold, which means launches and idle resumes both achieve near-instant startup latency. Even a multi-gigabyte interactive session comes back online quickly enough to feel responsive to the end user. The third is stateful execution. A running MicroVM retains memory, disk, and running processes across the user’s session. During idle periods, a MicroVM can be suspended – with memory and disk state intact – and resumed when traffic arrives. Installed packages, loaded models, and working filesets are readily available when the user resumes their session. MicroVMs support up to 8 hours of total runtime and can be suspended automatically after a configurable idle window, which makes it straightforward to build products as varied as software vulnerability scans that complete in minutes, data analytics applications that run for hours, and interactive coding sessions with extended idle periods. As Lambda MicroVMs are started from pre-initialized snapshots, applications generating unique content, establishing network connections, or loading ephemeral data during initialization may need to integrate with service-provided hooks for compatibility.

Lambda MicroVMs is a new resource within AWS Lambda, with a distinct API surface. Lambda Functions remain the right choice for event-driven, request-response workloads, and Lambda MicroVMs is purpose-built for multi-tenant applications that need to hand each end user or session their own isolated environment to execute user- or AI-generated code. The two complement each other. An application using Lambda Functions for its event-driven backbone can call into Lambda MicroVMs for the steps that need to run untrusted code in isolation. You bring the application, and the service delivers the execution environment.

Now available
AWS Lambda MicroVMs is available today in the US East (N. Virginia, Ohio), US West (Oregon), Europe (Ireland) and Asia Pacific (Tokyo) Regions, on the ARM64 architecture, with up to 16 vCPUs, 32 GB of memory, and 32 GB of disk per MicroVM. Idle MicroVMs can be suspended explicitly through an API call or automatically through a lifecycle policy, which reduces the running cost while preserving full state for fast resume. Pricing details can be found on the AWS Lambda pricing page.

To get started, visit the AWS Lambda console, or learn more on the Lambda MicroVMs product page. For documentation, see the Lambda MicroVMs Developer Guide.

Building and running custom code transformations without leaving your editor

Post Syndicated from David Hasani original https://aws.amazon.com/blogs/devops/building-and-running-custom-code-transformations-without-leaving-your-editor/

Custom code transformations are the work that no off-the-shelf migrator covers for you. Moving your services off an internal library, enforcing your team’s error-handling conventions, standardizing logging across your fleet of services: that work piles up on your backlog because general-purpose tools weren’t written with your codebase in mind.

AWS Transform custom tackles that kind of work. It’s an agentic AI service that lets you describe your own code transformations in natural language and run them across your codebase. With the Kiro power for AWS Transform, the AWS Transform agent skill, and the AWS Transform IDE plugin (VS Code and Open VSX), you can design and run those transformations from your editor. You can transform up to 3 repositories in parallel on your laptop, or fan out to hundreds of repositories in parallel on AWS Batch with AWS Fargate, without leaving the chat or IDE you already work in.

This post shows you what AWS Transform custom is, how to request a new transformation definition (TD) from chat, and how to run TDs through the power, skill, or IDE plugin. The authoring walkthrough focuses on the chat-driven request workflow. The agent drafts and publishes the TD on your behalf, so you won’t see raw TD syntax in this post.

What makes AWS Transform “custom”

AWS Transform ships with a catalog of out-of-the-box transformation definitions for common scenarios, including Java version upgrades, boto2 to boto3, AWS SDK migrations, framework transitions, and x86 to AWS Graviton. Those cover a lot of ground, but the real unlock is when you define your own.

A transformation definition is a reusable recipe that describes how to perform a transformation. With AWS Transform custom, you author TDs in natural language. A few examples of what that looks like in practice:

  • “Upgrade my codebase from C++11 to C++17”
  • “Replace calls to our deprecated internal auth-sdk-v1 with auth-sdk-v2, keeping the retry configuration intact.”
  • “Enforce our team’s error-handling standard: no bare except blocks, and every exception includes context.”
  • “Standardize our REST controllers to use our internal @TracedEndpoint annotation.”

Each one encodes something specific to your organization. Once you publish a custom TD to your AWS account, you can apply it to a matching repository, whether that’s one project or a hundred.

Three common ways to work with AWS Transform custom

You can pick the surface that fits how you already work. The power lives inside Kiro IDE, the skill plugs into your compatible agent, and the IDE plugin gives you a UI in VS Code or Open VSX-compatible IDEs. These three surfaces talk to the same underlying service and share your TDs, so you can mix and match across a team.

The Kiro power for AWS Transform brings the full AWS Transform workflow into Kiro IDE. You describe what you want in chat, and Kiro inspects your project, matches it against your available TDs, asks for the configuration it needs, and runs the transformation. Progress, artifacts, and diffs show up in your editor.

The AWS Transform agent skill follows the open Agent Skills standard. The same package works across more than 40 compatible agents, including Kiro CLI, Claude Code, Cursor, GitHub Copilot, Gemini CLI, and Windsurf. You get the same workflow you get from the Power, portable across the tools you already use.

The AWS Transform IDE plugin is for when you prefer a UI over chat. You can install it from the VS Code Marketplace and Open VSX. The plugin exposes AWS Transform custom features as first-class IDE actions, including browsing your published TDs and launching transformations.

Creating a custom TD right from chat

Historically, creating a custom TD meant dropping to the terminal and running the AWS Transform custom CLI to step through an interactive authoring session. That path still works and is a good fit for scripting. With the power, skill, or IDE plugin, you can do the same thing entirely in chat.

Tell your agent what you want, for example:

Create a custom AWS Transform custom TD that migrates our internal logger-v1 package to logger-v2. The new API uses logger.info(msg, context) instead of logger.log(level, msg). Keep existing log levels intact.

From there, the agent walks you through a short loop. It asks clarifying questions about the transformation’s scope and behavior, drafts the TD based on your description, lets you review and refine it, and then publishes it to your AWS account. After publishing, your TD is immediately available to the power, skill, and plugin. The next time you ask to run a transformation on a matching repo, your new TD shows up as a candidate.

The CLI path is still there if you prefer it. Run this in a new terminal:

atx

Then follow the interactive prompts.

Running your custom TDs

Once you have one or more TDs published, running them looks the same regardless of surface. When you ask Kiro to run a transformation, the Kiro Power walks through the following steps with you:

  1. Inspect your repositories. The agent reads pom.xml, package.json, requirements.txt, Dockerfiles, and similar config files to understand what it’s looking at.
  2. Match against your TDs. It compares your repos to your published TDs (custom and out-of-the-box) and presents a report showing which ones apply and why.
  3.  Collect the configuration it needs. Some TDs require inputs like a target version. The agent prompts you for those before it runs.
  4. Confirm the plan. Nothing executes until you approve.
  5. Execute and monitor. The agent launches the transformation through the AWS Transform CLI, streams progress, and opens artifacts (for example, plan, worklog, and validation summary) in your editor.
  6. Show results. Every change is a normal git commit you can review.

Local mode and remote mode: scale without the setup tax

Running locally, you can transform up to 3 repositories in parallel on your machine. That’s fine for one-off work, but it doesn’t scale to a real modernization campaign.

Remote mode is where scale comes in. It runs your transformations on AWS Batch with AWS Fargate, so you can fan out to hundreds of repositories in parallel. No local compute bottleneck, and no leaving your laptop running overnight.

The agent sets remote mode up for you. Ask to run in remote mode, and it provisions the AWS Batch compute environment, job queue, job definitions, IAM roles, and networking automatically. You don’t hand-write CloudFormation, and you don’t navigate the AWS console. Once the infrastructure is in place, you kick off a run the same way as local mode, and the agent streams progress back to your editor while Fargate does the heavy lifting.

Your inputs can be local paths, git URLs, or S3 locations, and the same applies to remote runs. Point the agent at a list of repos and let it go.

Getting started

The first time you use the power, skill, or IDE plugin, the agent walks you through setup. If you’d rather do it by hand, you need a few things in place first.

Install the power (Kiro IDE)

Before you install the power, make sure you have:

  1. AWS Command Line Interface (CLI) installed and configured with aws configure.
  2. AWS credentials with the AWSTransformCustomFullAccess managed policy (or at minimum, transform-custom:* permissions).
  3. macOS or Linux. Native Windows isn’t supported, so use WSL.

A straightforward way to install the power:

  1. Open Kiro IDE and open the Powers panel.
  2. Find AWS Transform in the list and install it.
  3. Open Kiro Chat, then select the Power and choose Try power.

To install from source instead:

  1. In the Powers panel, choose Add Custom Power, then Import power from GitHub.
  2. Paste: https://github.com/kirodotdev/powers/tree/main/aws-transform

Install the skill (any compatible agent)

Before you install the skill, install the AWS Transform custom CLI:

curl -fsSL https://transform-cli.awsstatic.com/install.sh | bash

Then add the skill to your agent:

npx skills add https://github.com/awslabs/agent-plugins/tree/main/plugins/aws-transform/skills/aws-transform  

Follow the prompts to finish the installation. You can also drop the skill folder into your agent’s skills directory manually, for example, .kiro/skills/ for Kiro CLI or .claude/skills/ for Claude Code.

Install the IDE plugin

The IDE plugin is published to two marketplaces:

  • VS Code Marketplace
  • Open VSX

Install it the same way you install any other extension in your editor.

Your first custom TD

Once you have a surface installed, try something like:

Create a custom AWS Transform transformation that [describe your transformation].

Then run it against a repo:

Use AWS Transform to run my new transformation on /path/to/my-project.

The agent walks you through creating the TD, modifying it, publishing it, and running it on your repos from start to finish.

Cleanup

If you ran any transformations in remote mode, once they complete, the agent will ask if you want to keep or clean up the remote mode resources deployed to your AWS account. To clean up, simply tell the agent that you want to clean up. The agent will then delete the resources that were created in your AWS account as a part of the initial setup for the remote mode transformations. To delete any user-managed transformation definition that you chose to publish to your registry, simply run atx in a terminal, ask to list all transformation definitions, find your recently published user-managed transformation definition, and ask to delete it from the registry.

Wrapping up: making your migrations faster

The value of AWS Transform custom is in the transformations only you can write, the ones that encode your organization’s libraries, conventions, and standards. The power, skill, and IDE plugin make both sides of that loop, authoring and running, feel native to your editor.

If you’ve been putting off your migrations because the tooling wasn’t there, now’s the time to take another look.

Learn more

About the author

DAVID

David Hasani

David Hasani is a Software Development Engineer at AWS, based out of the Bay Area. He works on AWS Transform custom and is excited about leveraging AI to solve the most critical business and technology challenges.

How Netflix Simplified Batch Compute with Kueue

Post Syndicated from Netflix Technology Blog original https://netflixtechblog.com/how-netflix-simplified-batch-compute-with-kueue-87860682629c

By Alvin Bao, Alex Petrov, Jennifer Lai, Aidan Sherr, and Samartha Chandrashekar

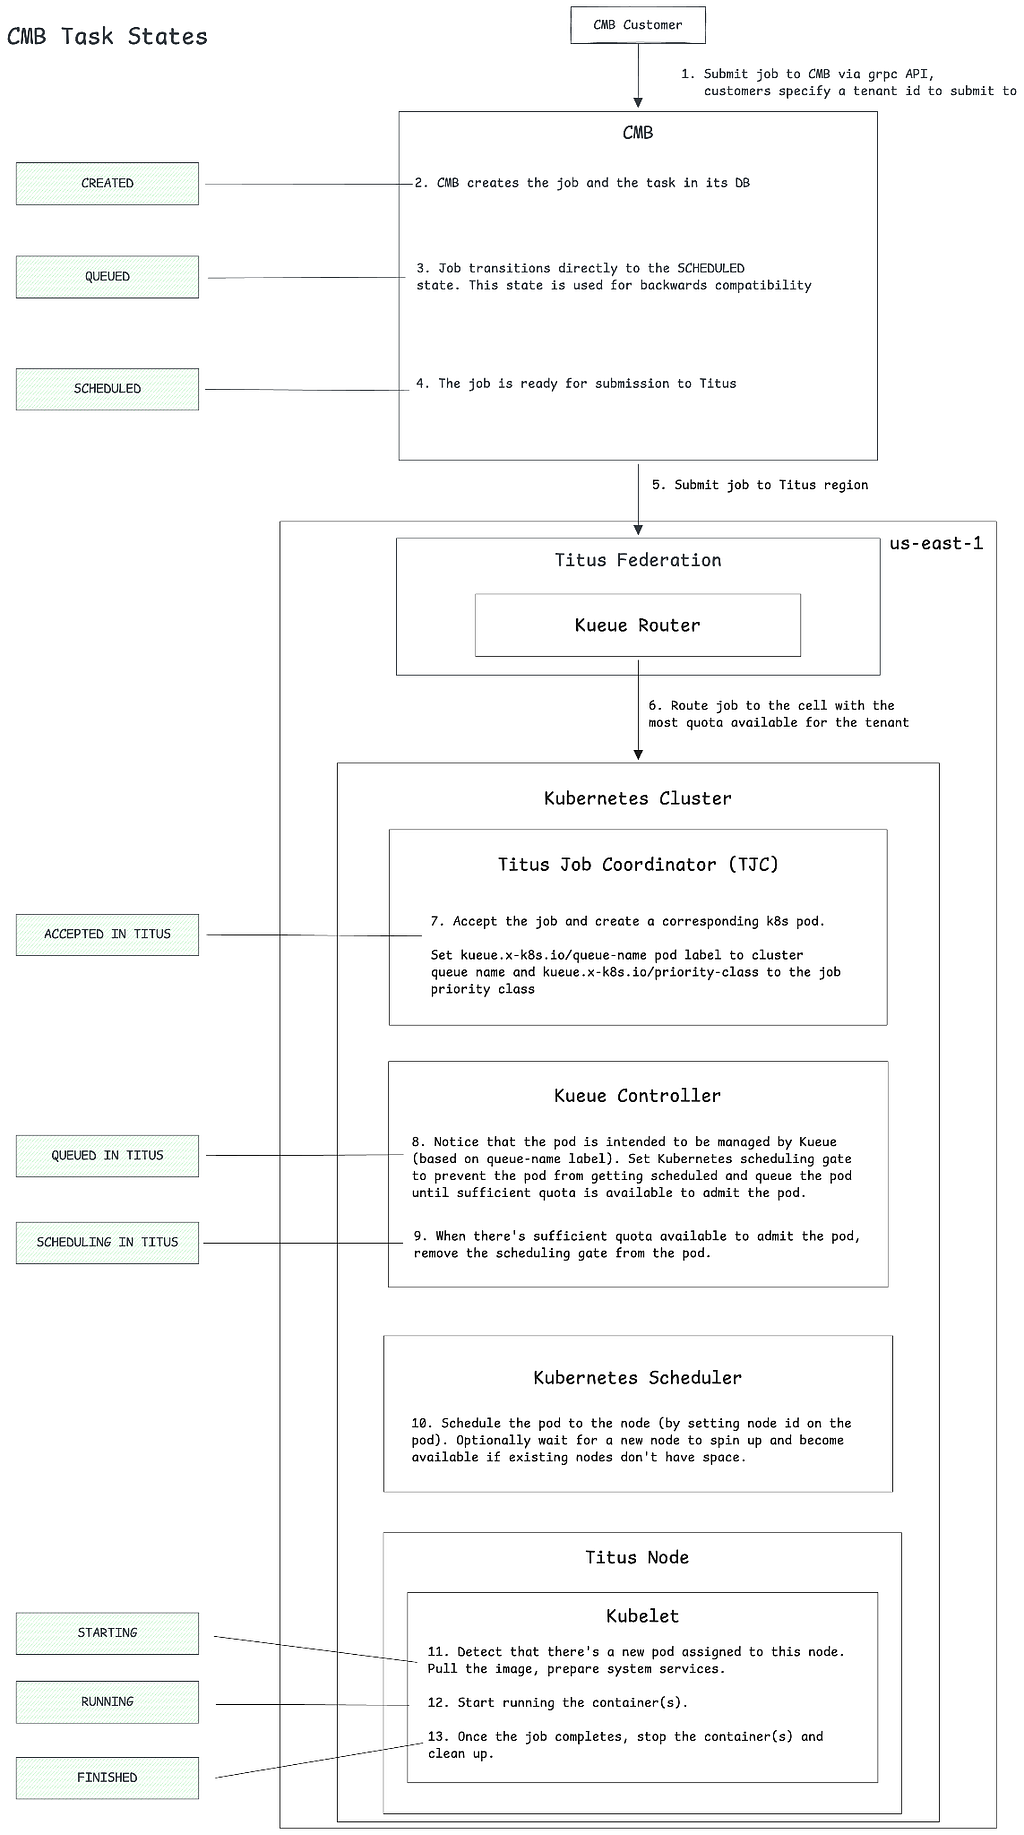
As a part of the journey to transition Netflix’s compute infrastructure to be more Kubernetes-native, we have leaned into incorporating components from the Kubernetes ecosystem into our container platform Titus. One example of this is our use of Kueue, a cloud-native job queueing system for batch workloads, which has largely replaced the custom queuing and scheduling logic in our homegrown managed batch solution Compute Managed Batch (CMB). In this post, we’ll give an overview of what motivated the migration, how we migrated millions of batch jobs to use Kueue, and what Kueue allows us to offer as a Compute platform.

Brief Overview of CMB and Titus

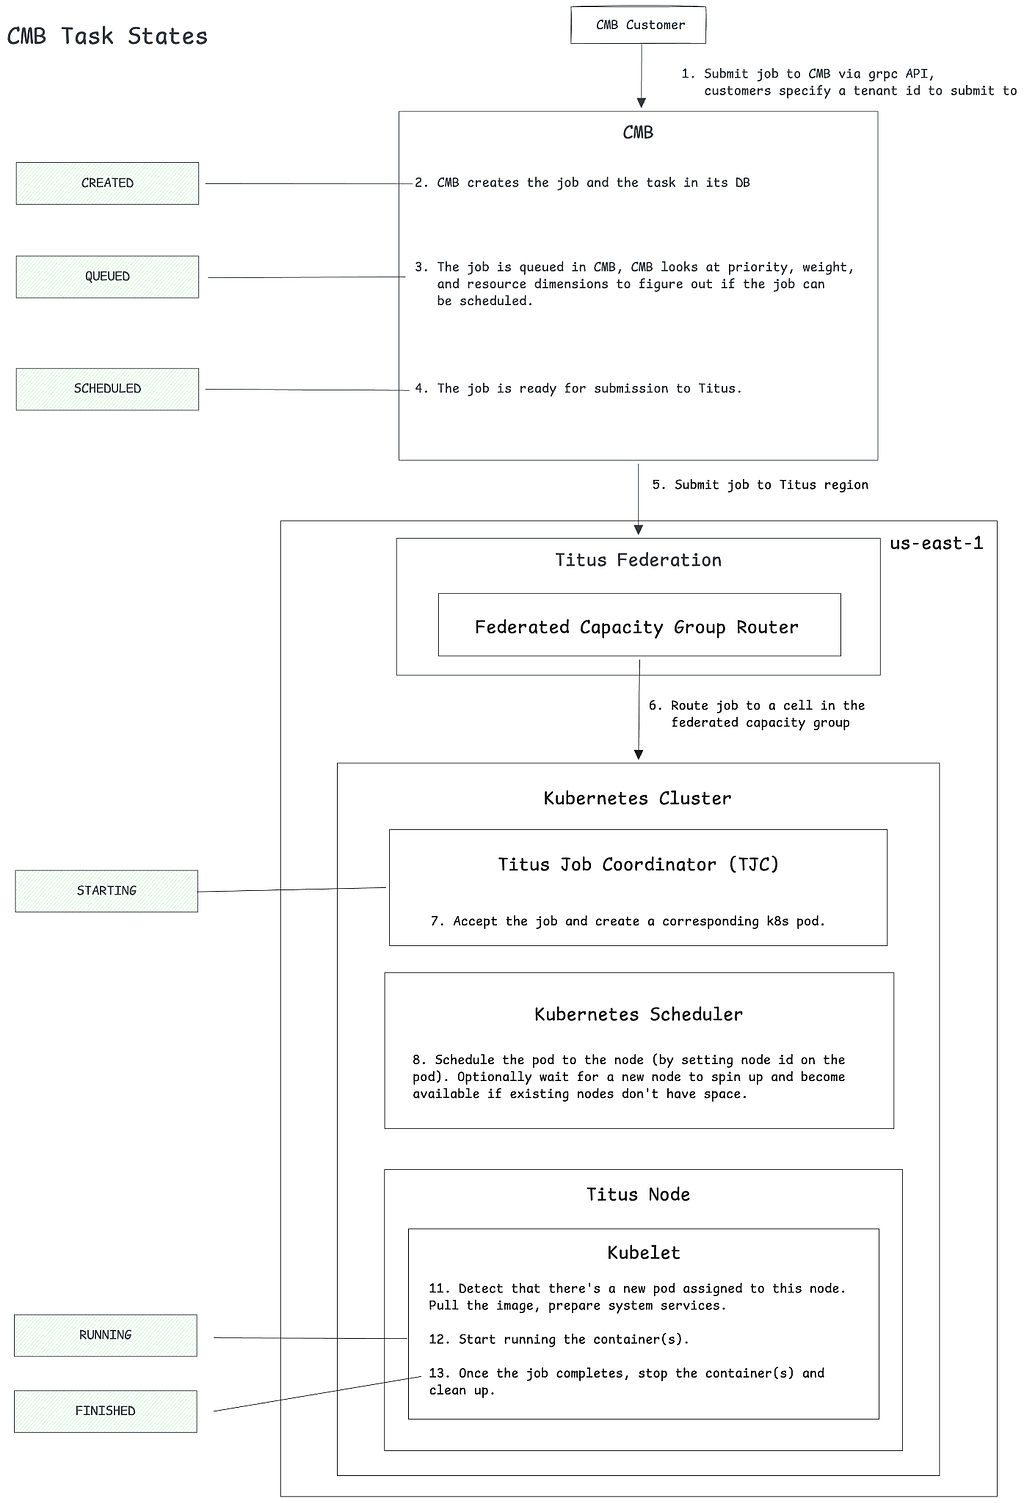
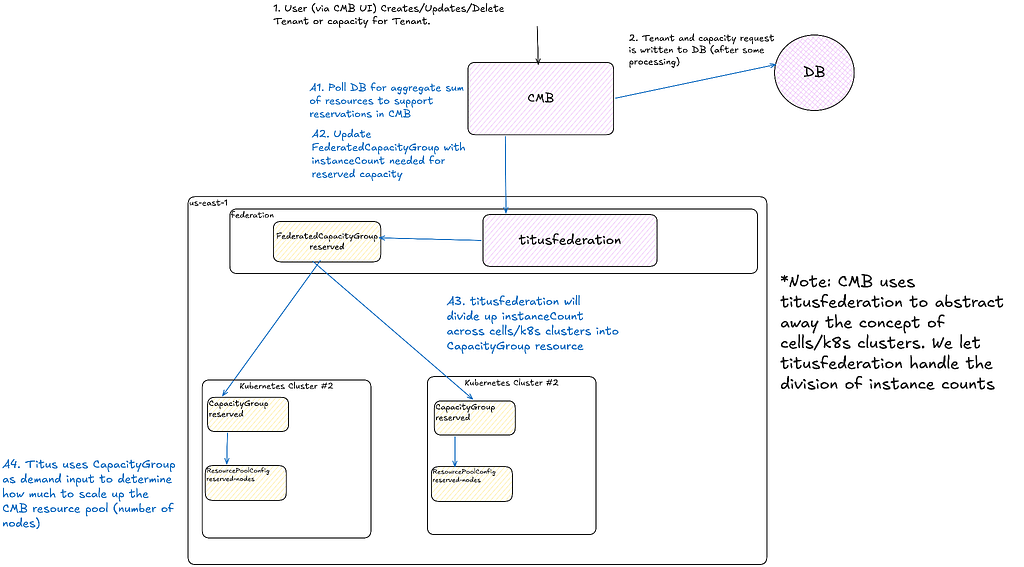
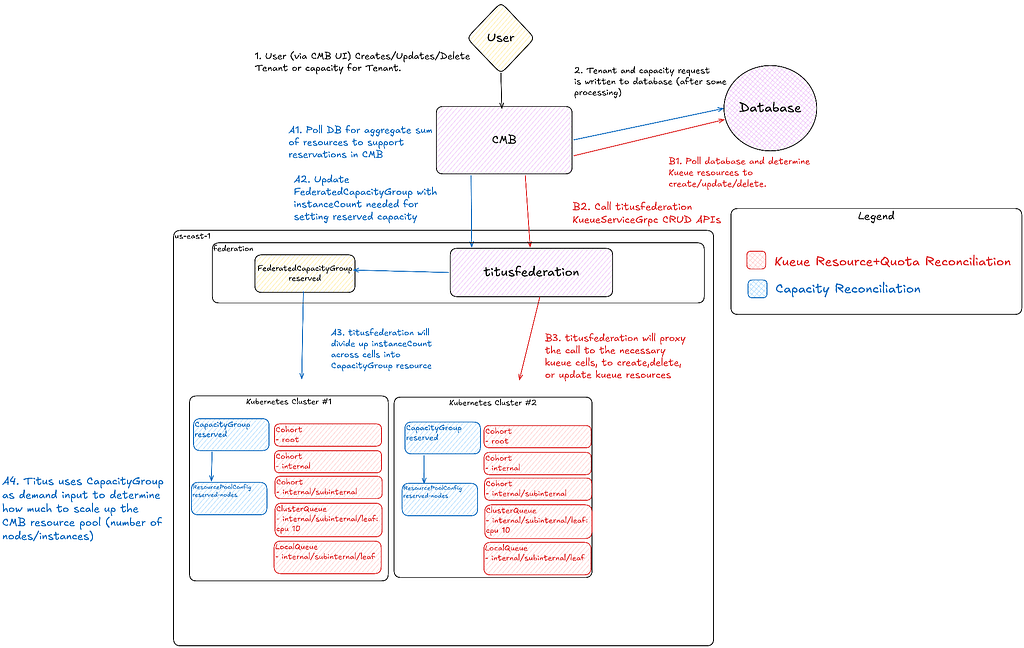
CMB is a managed batch solution that allows users and applications to execute and manage workloads that run to completion. Using a tenant hierarchy, workloads are managed and queued with ordered execution through priorities, and capacity is managed on a per-tenant basis. Workloads that are submitted to CMB are then run on Titus. The features of Titus relevant to CMB are workload federation across multiple cells (Kubernetes clusters) and federated capacity reservations. This means CMB can talk to a single Titus endpoint to get/submit workloads and update capacity reservations without having to worry about the underlying cell/cluster topology.

CMB Tenant Hierarchy

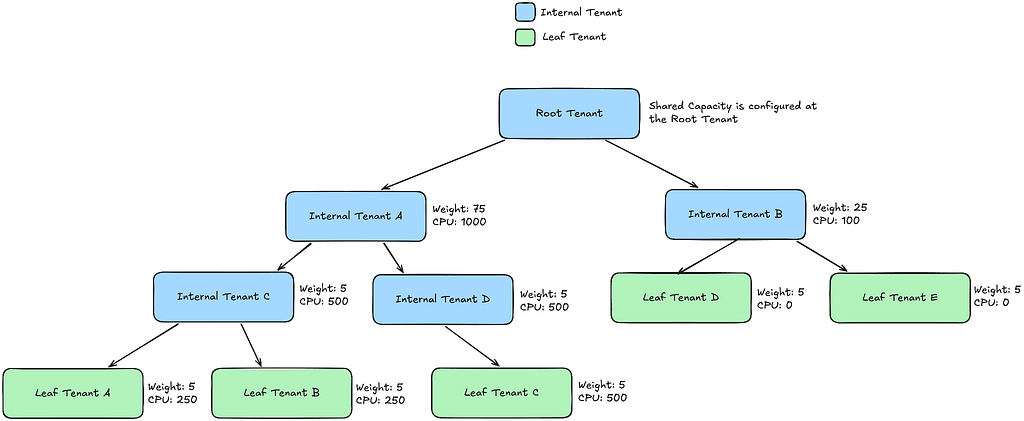
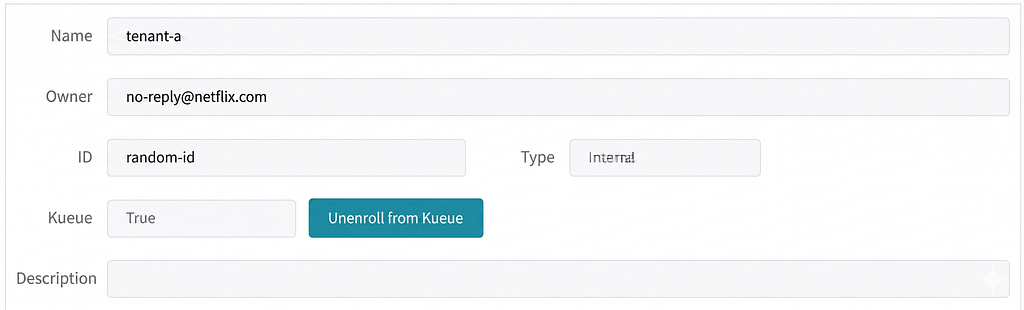
Tenants provide a grouping mechanism for jobs submitted on behalf of certain organizations, platforms, or applications. Users can create and organize tenants however best suits their organization or use case. For example, an organization may use a single tenant across several applications or a complex hierarchical structure that matches its team and application ownership structure.

Tenants are associated with a capacity configuration. The capacity configuration defines the amount of compute capacity available to the tenant and provides certain guarantees around isolation from other tenants. The capacity configuration contains weight (used for fair sharing) and resource dimensions.

There are two types of tenants in CMB:

  1. Internal Tenants — meant to facilitate the creation of a tree of tenants. Internal tenants’ children can be both internal and leaf tenants. Internal tenants themselves do not accept work and thus do not have associated queues.
  2. Leaf Tenants — can accept work and have queues associated with them. Leaf tenants cannot have any children.

With regards to capacity configuration, tenants can use 2 types of capacity:

Reserved Capacity

For internal tenants, if a user specifies reserved capacity, it is fair-shared across the subtree and usable by the leaf tenants under that internal tenant.

For leaf tenants, if a user specifies reserved capacity, it partitions capacity within the hierarchy so that other tenants cannot reserve the same resources. Those reserved resources are not shared with any other tenant, ensuring throughput for a given leaf tenant.

Shared Capacity

The Compute team maintains a global pool of shared capacity that any tenant can burst into, in addition to its reserved capacity. Reservations are not required to use CMB, so a tenant can run out of shared capacity entirely. The pool is fair-shared across tenants, but in CMB, this applied only at admission: CMB had no preemption, so once a job was admitted, it ran to completion regardless of shifts in fair-share demand.

Kueue changes the semantics for both types of capacity, which the fair sharing and preemption section covers.

Here is an example of what a tenant hierarchy looks like:

CMB User/Application Workload Submission Flow

CMB User/Application Tenant Management Flow

Why Kueue?

CMB was created in 2018, before or alongside many of the open-source batch compute offerings available today. Over the years, as the Kubernetes ecosystem has evolved, many of the features that CMB offered or strived to offer have been included in these open source projects e.g., fair sharing, hierarchical tenants, capacity management, priority queuing. In addition, it became increasingly cumbersome to develop new features such as preemption when CMB was so far removed from the underlying Kubernetes cluster.

The team took a look at what it would take to modernize our batch abstraction and settled on Kueue for the following reasons:

  1. Unlike other options such as YuniKorn or Volcano, Kueue does not replace pod scheduling by the kube-scheduler, allowing integration with existing Titus scheduling profiles. Replacing Titus scheduler profiles can fragment job placement, potentially harming efficiency.
  2. Adoption momentum and pace of innovation.
  3. Kueue supports multi-tenant quota management over heterogeneous hardware.
  4. Kueue can operate on primitives such as v1.Pod and batch/v1.Job, and also supports higher-level abstractions such as RayJob / RayCluster for future extensibility.
  5. Kueue has native features that the team would have liked to implement in CMB, such as preemption, all-or-nothing scheduling, topology aware scheduling.

Migrating to Kueue

This initiative of migrating CMB workloads to Kueue became known as Netflix Batch. The key tenets of our migration were the following:

  1. Migration should require zero lift for CMB end users and be completely transparent to them
  2. No regressions in container launch rate and overall max throughput
  3. Replace CMB queuing and scheduling with Kueue

Netflix Batch User/Application Workload Submission Flow

The key difference between the old and new flows is that we defer queuing and scheduling to Kueue, which is enabled in each Kueue-enabled Titus cell. Titus federation routes the job to Kueue cells using our custom Kueue router.

Netflix Batch User/Application Tenant Management Flow

For us as operators, the migration was as simple as clicking a button on a tenant in our UI (as shown in the example above). This also allows us to easily rollback changes if there were issues.

Under the hood, this enrollment converts internal tenants to Cohorts and leaf tenants to a ClusterQueue + LocalQueue. The capacity configuration on a given tenant is converted into resource flavors and nominal quotas. The architecture for this looks as follows:

Lessons Learned

  1. Maintaining API parity with the existing system (vs exposing a new API surface) and migrating the underlying components as a first step derisked the project by unstacking bets while also ensuring we didn’t disrupt the customer experience.
  2. Don’t wait until the end to migrate the most complex use case. We decided early on to migrate our largest and most complex customer first. This allowed us to build confidence that we could later migrate other customers to Netflix Batch without issues, and resulted in the production migration lasting only 4 weeks.
  3. We had to run Kueue with much higher QPS, Burst, and groupKindConcurrency than the default configuration to meet our throughput needs. This was derisked early on by running load tests in a development environment that mimics Titus.

Current State of Kueue at Netflix

Kueue is fully rolled out in production, with it managing millions of batch workloads. In the future, we’re looking at options to enroll more of Titus batch workloads into this more managed experience. We have also productionized more fair sharing and preemptions to address better utilization of reserved capacity. In addition, our learnings are being leveraged by other internal teams, including those building Kubernetes-native training infrastructure, to inform their job scheduling and queuing configurations.

Fair Sharing and Preemption

With Kueue, Preemption-based Fair Sharing allows Netflix Batch to maintain reservation semantics while lending resources to other tenants when those reservations are not in use. In addition, preemption allows Netflix Batch to preempt lower-priority workloads for higher-priority workloads. For our customers, this means that tenants can use more idle capacity from reservations, submit more jobs without the risk of starvation, and have quicker turnaround times for business-critical workloads.

An example preemption configuration on a ClusterQueue that we would be using is as follows:

apiVersion: kueue.x-k8s.io/v1beta2
kind: ClusterQueue
metadata:
name: "team-a-cq"
spec:
preemption:
reclaimWithinCohort: Any
withinClusterQueue: LowerPriority

With these features deployed, Compute has seen a significant increase in average resource utilization.

Acknowledgement

This work would not have been possible without the great work of the entire Compute team at Netflix.


How Netflix Simplified Batch Compute with Kueue was originally published in Netflix TechBlog on Medium, where people are continuing the conversation by highlighting and responding to this story.

Simplify AWS Outposts lifecycle management with new self-service capabilities

Post Syndicated from Akshata Ketkar original https://aws.amazon.com/blogs/compute/simplify-aws-outposts-lifecycle-management/

AWS Outposts extends AWS infrastructure, services, and APIs to customer-managed locations for workloads that require low latency, local data processing, or data residency. AWS has continuously improved the Outposts delivery and operational experience. However, managing the lifecycle from ordering through renewal has required coordination with multiple AWS teams for tasks like configuration, cost estimates, and end-of-term decisions.

With this feature launch, we have introduced self-service capabilities that give you direct control over the full Outposts lifecycle. A new configuration and quoting tool generates configurations with real-time cost estimates, so you can independently compare options and place orders. Subscription details, including term dates and billing, are now visible directly in the AWS Outposts console and through the AWS Command Line Interface (AWS CLI) or Outposts API. When your term ends, new workflows let you renew or decommission Outposts without contacting AWS.

In this post, we walk through each capability and show you how to get started.

Self-service configuration and quoting

The new quoting tool lets you build Outposts configurations, get real-time cost estimates, and place orders directly from the console or API.

Three capabilities make this powerful:

  1. Real-time cost estimates across different configurations, payment options, and term lengths to compare configurations and cost estimates.
  2. Reduced time to order by removing the need to engage AWS teams for cost estimates and configuration.
  3. Proactive validation that identifies issues like account readiness gaps or regional constraints before you submit an order.

You can request quotes for new deployments or for adding capacity to existing Outposts. When you quote for an existing Outpost, your current capacity and configuration details are pre-populated. The tool integrates with AWS Identity and Access Management (IAM), so you can restrict who generates quotes using standard IAM policies.

The quote-to-order process follows three steps. First, get a quote by specifying your requirements. Next, place your order after reviewing cost estimates. Then, await delivery and installation. Quotes are generated within seconds and are valid for 30 days.

To generate a quote using the console, follow these steps:

  1. Log in to your AWS Outposts console, select Quotes from the left navigation pane, then choose Get Quote.
  2. Under General Information, select New Outpost for a new deployment, or Existing Outpost to add capacity to a deployed Outpost. For new Outposts, select the country where your Outpost will be installed (this affects cost estimates and determines regional availability). For existing Outposts, select the Outpost ID.

Figure 1: General information form showing New Outpost and Existing Outpost options

  1. Select your compute capacity. You have two options:
    • By capacity type: Select individual Amazon Elastic Compute Cloud (Amazon EC2) instance types and quantities that match your compute requirements.
    • By configuration: Choose from predefined configurations designed for common use cases or reuse previously ordered configurations from your account history.

    Use the filter capability to narrow results by Outpost generation, form factor, vCPUs, or other properties. You can only select instance capacities from the same Outpost generation. When you add capacity, the wizard automatically calculates and displays total vCPUs and memory.

    Figure 2: Capacity selection table with filters applied for 2nd Generation Outpost, showing selected capacities panel with total vCPUs and memory

  2. Specify your storage requirements:
    • Amazon Elastic Block Store (Amazon EBS) storage (in TB): Required for new Outposts. Provides persistent block storage for your EC2 instances.
    • Amazon Simple Storage Service (Amazon S3) storage (in TB): Optional. Adds Amazon S3 on Outposts capacity for local object storage.

    Storage is provisioned in fixed tiers. Your requested amount is rounded up to the nearest supported tier.

    Figure 3: Storage requirements entry showing Amazon EBS and Amazon S3 fields

  3. Optionally provide site details. Although these do not affect cost estimates, they help confirm the recommended configuration fits your facility:
    • Maximum supported weight limit: The maximum weight (in pounds) your site’s floor can safely support for a single rack. Check your floor’s load rating with your facilities team.
    • Number of rack positions available: Count the empty available floor positions at your site, see first-generation Outposts racks and second-generation Outposts racks site requirements for exact space needed.
    • Power draw: The maximum power (in kVA) your site can supply to a single rack. Check the capacity of your circuit breakers or power distribution units (PDUs).

    Although site details are optional for quotes, full site information (including operating address, shipping address, and rack physical properties) is required to place your order.

    Figure 4: Site details form with weight limit menu, rack positions field, and power draw radio buttons

  4. Choose Get Quote. The tool generates a detailed quote containing the following:
    • Recommended rack configurations showing what your setup looks like.
    • Cost estimates across all available payment options (All Upfront, No Upfront, Partial Upfront).
    • Selectable term lengths (1, 3, or 5 years).
    • A summary of the inputs you provided.

    For capacity addition quotes, cost estimates are prorated to align with the remaining term of your current Outpost commitment, so you only pay for the remaining period.

    Figure 5: Quote summary showing ‘Your quote at a glance’ with cost estimates for All Upfront, No Upfront, and Partial Upfront options, plus proposed rack configuration and specifications

  5. Review your quote and choose Download a PDF to create a shareable summary for stakeholders.

You can save multiple quotes, compare configurations, and revisit them later. If a quote expires after 30 days, use the Refresh quote button to populate a new form with your previous selections and receive updated cost estimates. You can also edit existing quotes directly from the console.

Placing an order

Once you have reviewed your quote, you can convert it to an active order. Once you have placed an order, order details cannot be modified. Before placing an order, verify you have:

  • An Outpost created with an associated site.
  • An active AWS Enterprise Support or AWS Unified Operations plan.
  • Full site details including operating address, shipping address, and rack physical properties.

To place your order, follow these steps:

  1. Navigate to your quote in the AWS Outposts console and choose Place order.
  2. Select your payment terms (term length and payment option).
  3. If your quote was created with only a country selected, select an Outpost before proceeding.
  4. Resolve any issues flagged by validation (incomplete site details, unsupported configurations, or account requirements).
  5. Confirm your order. You receive an order confirmation email with next steps.

AWS Outposts follows the Shared Responsibility Model. AWS secures the underlying infrastructure, while you are responsible for securing your workloads, OS, network configuration and, additionally, the physical location of the Outpost. After placing your order, an AWS team will finalize site preparation requirements, schedule a site assessment, coordinate installation, and complete any regional compliance requirements. Once validated, your Outpost is manufactured, delivered, and installed by an AWS technician who coordinates with onsite resources who power on the rack, perform activation, and validate encrypted connectivity to the AWS Region. For details on how Outposts communicates securely with the parent Region, see Security in AWS Outposts.

Outpost subscription details

When you order an Outpost, you commit to a subscription term of 1, 3, or 5 years. Your chosen payment option determines the monthly payments for the duration of the term. Tracking subscription end dates is essential for planning ahead, whether that means renewing, adding capacity, or decommissioning at end of term.

Previously, viewing this information required contacting AWS. Subscription details are now available directly in the AWS Outposts console and programmatically through the AWS CLI or Outposts API. The information includes subscription start and end dates, payment terms, upfront costs, and monthly charges. If you have added capacity to your Outpost during the term, you see multiple subscriptions with individual pricing for each. Because subscription and pricing details might be sensitive, you can use IAM policies to restrict access to GetOutpostBillingInformation.

Viewing subscription details in the AWS Outposts console

Open the AWS Outposts console, select Outposts from the left navigation pane, then choose the Outpost you want to inspect.

The summary page shows your renewal date, total monthly payments, and remaining contract time.

For detailed billing information, select the Billing tab. You can filter subscriptions by status (Active, Pending) and download the data as a CSV file.

Figure 6: Subscription information page showing subscription status, end dates, and pricing details

Viewing subscription details through the AWS CLI

You might prefer using the AWS CLI or Outposts API for viewing subscription data. To support this, a new CLI and API action is available: get-outpost-billing-information / GetOutpostBillingInformation.

For example, to request billing information for a single Outpost with ID op-1234567890abcdefg, run the following command:

aws outposts get-outpost-billing-information --outpost-identifier op-1234567890abcdefg

By default, the resulting output is in JSON format and includes all the information visible in the AWS Outposts console:

{
  "Subscriptions": [
    {
      "SubscriptionId": "1234512345",
      "SubscriptionType": "ORIGINAL",
      "SubscriptionStatus": "ACTIVE",
      "OrderIds": [
        "oo-123456789abcdefg"
      ],
      "BeginDate": "2024-10-12T00:00:00+00:00",
      "EndDate": "2027-10-11T23:59:59+00:00",
      "MonthlyRecurringPrice": 27385.95,
      "UpfrontPrice": 0.0
    }
  ],
  "ContractEndDate": "Mon Oct 11 23:59:59 UTC 2027"
}

Self-service renewal and decommissioning

At end of term, you no longer need to open a support case. New self-service workflows guide you through the renewal or decommission of your Outpost directly in the AWS Outposts console.

Renewing your Outpost

You can initiate a renewal after your subscription is within 3 months of the end date by following this process:

  1. Open the AWS Outposts console and select Outposts from the left navigation pane.
  2. Select the Outpost you want to renew, choose Actions, then choose Renew Outpost.
  3. Review your current contract terms. Select a new term length (1, 3, or 5 years) and payment option. These do not need to match your original contract.Figure 7: Contract terms screen showing selectable term lengths and payment options
  4. Choose Review to see a summary including any upfront charges that are applied immediately and when monthly charges will begin.
  5. Choose Submit to confirm the renewal.

After submission, the renewal appears in the Billing tab with a subscription type of Renewal. If you select all upfront or partial upfront, the upfront payment is charged at the point of submission. Monthly charges begin on the renewal start date shown during the review step.

Decommissioning your Outpost

Unlike renewals, you can choose to decommission your Outpost at any point during the term. To decommission through the console, follow these steps:

  1. Open the AWS Outposts console and select Outposts from the left navigation pane.
  2. Select the Outpost you want to decommission, choose Actions, then choose Decommission Outpost.
  3. Review the process overview explaining the steps that are taken, then choose Next.
  4. Confirm the Outpost ID and installed location.
  5. Review active resources running on the Outpost in your account (EC2 instances, AWS Resource Access Manager (AWS RAM) shares, virtual interfaces). Choose Delete Resources to have AWS automatically remove them, or delete them manually and return to the workflow. Before decommissioning, we recommend creating Amazon EBS snapshots of any volumes you want to retain. Snapshots are stored in the parent Region and remain encrypted with the same AWS Key Management Service (AWS KMS) key. If you choose to automatically remove resources, AWS does not take any snapshots of data stored, and no resources can be recovered after removal.Figure 8: Delete Resource screen showing resources on the Outpost that must be removed before proceeding
  6. After all resources are removed, review the final summary and choose Submit Request.

Decommissioning does not cancel outstanding subscription charges. You remain responsible for any remaining payments. Month-to-month charges are not prorated and are always charged for a full month. To avoid additional charges, submit your decommissioning request at least 5 days before your next billing date.

Considerations

These new features let you build, quote, and order configurations without involving AWS teams. Consider the following factors when you use these tools:

Planning and sizing

  • Capacity planning: Provision at least N+1 hosts for each instance family to protect against host failure. Your resilience requirements might dictate additional spare capacity.
  • Minimum configurations: All quotes are subject to minimum requirements that vary by type:
    • New first-generation rack orders: minimum 4 compute hosts without Amazon EBS capacity, or 2 compute hosts with Amazon EBS capacity.
    • New second-generation rack orders: minimum compute capacity of 960 vCPUs.
    • Capacity additions: minimum 3 compute hosts or any storage tier increase.
  • Generation compatibility: Outposts hardware cannot be mixed between Outposts generations. For example, C7i or M8i capacity cannot be added to a first-generation Outpost.
  • Storage tiers: Amazon EBS and Amazon S3 are provisioned in fixed step tiers. Your requested amount is rounded up to the nearest supported tier.

Quoting and ordering

  • Quote validity: Quotes expire after 30 days and must be refreshed. Use the Refresh quote button to quickly regenerate with current cost estimates.
  • Capacity addition requirements: Your Outpost must have a valid subscription with at least 30 days remaining. Month-to-month subscriptions cannot have additional capacity provided and must be renewed to a valid term of 1, 3, or 5 years.
  • Enterprise Support required: An active AWS Enterprise Support or AWS Unified Operations plan is required to place an order.

Operational limits

  • Capacity reduction: Reducing Amazon EBS or Amazon S3 storage, or decommissioning individual compute hosts within an Outpost, is not supported.
  • Decommissioning: When you use automatic resource deletion as part of the decommissioning workflow, AWS does not take snapshots or backups of any data. After resources are removed, they cannot be recovered. Verify that you back up your data and transfer it off the Outpost before removing resources.

Conclusion

In this post, we introduced new self-service capabilities for managing the full AWS Outposts lifecycle: configuration and quoting, subscription visibility, and end-of-term renewal and decommissioning. These capabilities reduce the time and coordination previously required, giving you direct control over your Outposts from evaluation through end of term. These tools are available now in all commercial AWS Regions that support AWS Outposts. To learn more, see the AWS Outposts documentation. To get started, open the AWS Outposts console.

To discuss Outposts with an expert on any of these topics, submit this contact form.

GIMP 0.54.1 in a Flatpak

Post Syndicated from jzb original https://lwn.net/Articles/1078969/

The GIMP project reports that
GNOME contributor “balooii” has worked to package GIMP
0.54.1—released in 1996—as a Flatpak that will build and
run on modern 64-bit Linux systems. This is a Motif-based
version, and the same version that was used
by Larry Ewing
to create Tux.

While not likely to be useful for serious graphics work today, it
should be interesting for users who would like to see what a
30-year-old version of GIMP was capable of.

How we found a bug in the hyper HTTP library

Post Syndicated from Deanna Lam original https://blog.cloudflare.com/hyper-bug/

The Images service, built in Rust on Workers, runs on every machine in Cloudflare’s edge network. To handle client connections, we use hyper, an open-source HTTP library for Rust.

Last year, we introduced the Images binding to enable custom, programmatic workflows for processing remote images in Workers. At the end of 2025, we rearchitected the binding to provide a more direct, local connection between the Workers runtime and the Images service.

Shortly after rollout, we received reports that transformation requests from the binding were failing — but only intermittently and only for larger images. Even stranger, the responses for these requests returned a 200 status without any errors logged. The image data was simply cut short: A response that should have been two megabytes might arrive with a few hundred kilobytes instead.

We spent six weeks chasing a nearly invisible bug — a race condition that occurred only under specific conditions — in the hyper library that impacted how the Images binding returned processed image data back to the client. In the end, it took four lines of code to fix it.

Hops, handoffs, and hyper

When developers build on Cloudflare, they compose full-stack applications from a set of platform services that are accessible to Workers through bindings. Bindings provide direct APIs to resources on the Developer Platform like compute, storage, AI inference, and media processing.

The Images binding decouples image optimization from delivery; you can transcode, composite, or manipulate images without needing to return the output as an HTTP response. It also lets you apply optimization parameters in any order, rather than following the fixed sequence imposed by the URL interface. Here, a worker can pass image data directly to the Images API, chain operations together, and get the processed result back as a stream:

const result = await env.IMAGES
  .input(image)
  .transform({ width: 800, rotate: 90 })
  .output({ format: "image/avif" });
return result.response();

At a high level, this is how image data moves through our various services:


The pipe represents a socket connection between the intermediary and Images, where data is handed off from one process to the next through the kernel’s buffer.

The binding communicates with Images through a socket connection managed by the Workers runtime. A socket connection is a communication channel between two processes. Each end of the socket has buffers that are managed by the operating system’s kernel; these buffers are temporary holding areas where data sits after one side writes it but before the other side reads it.

Hyper manages the connection on the Images service’s side, reading incoming requests from the socket and writing responses back to it.

When a request uses the Images binding, the Images service reads the input, performs the requested optimization operations, and encodes the result. It then passes the entire encoded image to hyper as a single in-memory block. 

Hyper writes this response data into its own internal buffer. At this point, hyper considers the encoding work as complete, since it has all the bytes that it needs to send. The next step is to flush its internal buffer to the socket’s outbound buffer, moving the data from the Images service to the intermediary on the other end.

If the reader on the other end is fast, then hyper can flush everything in one pass — the outbound buffer will have room because the reader is consuming data as quickly as it arrives. Once all data is sent, hyper issues a shutdown on the socket, signaling that the connection is finished and no more data will be written. But if the reader is slower (even by a few milliseconds), then the outbound buffer fills up, and hyper needs to wait until there’s room to continue writing.

Taking the local

All incoming traffic on Cloudflare’s network passes through FL, an internal intermediary service that runs security and performance features and routes requests to the appropriate backend. When we first launched the binding, image data flowed from the Workers runtime, through FL, to the Images service.

This path was a natural fit for our initial release and follows the same architecture as our URL interface. Over time, though, this coupling with FL became a constraint: Every change to the binding had to follow FL’s release cycle.

In December 2025, the Images team replaced FL with a new intermediary service, an internal worker binding that runs on the same machine. In the original architecture, data moved through FL over network sockets; this path carried the overhead of FL’s full processing pipeline, such as DNS lookups and routing.

The internal binding replaced these with Unix sockets to directly connect the services on the same machine, bypassing FL and the overhead of the network stack. This made the request path to Images faster and gave the team independent control over binding releases.

Within days of the rollout, we received our first customer report.

200 OK (not OK)

The first sign of trouble came from a customer with a non-standard setup: two layers of image processing, where one pipeline was nested inside another.

First, their worker used the Images binding to composite multiple large source images from R2 — a JPEG background plus PNG overlay layers — into a single combined JPEG. Second, they further compressed, transcoded, and resized the result through the URL interface.


The bug originated in the inner pipeline’s return path, where the response was truncated before reaching the outer pipeline.

The inner pipeline (transformation binding) handled compositing. The outer pipeline (transformation URL) handled delivery optimizations like scaling and format conversion. This layered approach meant that when the inner pipeline silently returned a truncated response, the only visible error appeared one level up:

error reading a body from connection: end of file before message length reached

The outer pipeline received HTTP 200 from the inner one, with a Content-Length header that promised several megabytes. The actual body was only a fraction of that: In one request, only ~200 KB arrived out of an expected 3.3 MB. The error surfaced in the outer pipeline, but the truncation could have originated in the binding, the intermediary service, the Images service, or somewhere in between.

When a browser receives a truncated image, the result is visible. Depending on the format, the image either renders partially (e.g., with the bottom half missing or gray) or fails to decode entirely, instead displaying a broken image.

Debugging in the dark

From here, we worked inward through the request path, testing each layer to isolate where the truncation was happening. Some of these efforts hit dead ends; others left breadcrumbs that narrowed the search:

  • Building a reproduction. We built a worker that mimicked the customer’s nested setup, then stripped away layers until we could trigger the bug with the binding alone. A small script let us fire requests in batches. In one early run, 19 out of 25 requests failed. The amount of data that did arrive — roughly 200 KB — was suspiciously close to the size of the socket buffer in production. This confirmed that the problem wasn’t tied to the customer’s configuration and gave us a reliable way to trigger the bug on demand.

  • Investigating timeouts. Early on, we suspected the truncation might be related to timeout behavior (i.e., the connection was being closed after a time limit). This theory didn’t hold, as the truncation wasn’t correlated with request duration.

  • Updating hyper version. When the bug was first reported, we were running 0.14.x, while the latest hyper version was around 1.8.x. We tested across hyper versions 0.14, 1.7, and 1.8, just in case the most obvious answer was the correct (and easiest) one. But the bug appeared in each version, which meant that there wasn’t an upstream fix.

  • Reproducing locally. We ran local integration tests on macOS and a Debian VM. Even under considerable load, our local requests never triggered any failure. Making direct curl requests to the binding socket and replaying captured requests always seemed to work. The bug only appeared on the full production path when there was real concurrency and a real Workers runtime client on the other end of the socket. This led us to suspect the runtime itself.

  • Ruling out the Workers runtime. We examined the HTTP client that the Workers runtime uses to communicate with Images through the binding socket. None of the traces from either side of the connection showed any syscalls that indicated an unexpected close or early termination. We observed that the client behaved correctly and multiple other services used the same client without issues.

  • Distributed tracing. By inspecting request traces end-to-end, we confirmed that the truncated body was already present before it reached the outer transformation layer in the customer’s setup. That narrowed the problem to the inner pipeline — the binding path through the Images service.

  • Instrumenting the intermediary service. We added instrumentation to the intermediary service to measure body sizes before forwarding the response data. The bodies were already truncated by the time they left the Images service, so the intermediary was ruled out.

  • Deeper tracing within the Images service. At the service level, the request was processed, the image was properly encoded, and the response was sent with HTTP 200.

The only consistent signal was that the bug was timing-dependent: It appeared only on the production path, with real concurrency, and only for larger images.

A kernel of truth

Tools for application-level debugging told only what the system thought it was doing. But according to the system, everything was fine: Tracing said the response was sent; logging reported no errors, and the Images service returned 200 on every request.

To see what the system was actually doing, we attached strace to the Images service. strace records the syscalls that a process makes to the kernel, which could show us exactly which bytes were written, when a shutdown was called, and whether the client sent any termination signal.

Setting up the trace was delicate. strace works by intercepting syscalls as they happen, which adds a small amount of timing overhead to each one. Filtering for a narrow set of syscalls kept that overhead minimal. Broadening the filter, however, slowed the process just enough to shift the timing between the flush and the shutdown check — and make the bug disappear entirely. That alone reinforced our theory that the issue was timing-sensitive.

Using a reproduction worker, we triggered the bug and compared the syscall output between successful and failing requests.

In a successful request, the response is written in chunks as the socket buffer allows, with shutdown called only after all the data is sent. For example, this may look like:

sendto(42, "HTTP/1.1 200 OK\r\nContent-Length: 14991808\r\n...", ...) = 219264
sendto(42, "\xff\xd8\xff\xe0...", 292352) = 292352
// ... keeps writing until buffer drains ...
sendto(42, "...", 292352) = 292352
shutdown(42, SHUT_WR) = 0

When we reproduced the bug, a failing request looked like:

sendto(42, "HTTP/1.1 200 OK\r\nContent-Length: 14991808\r\n...", ...) = 219264
shutdown(42, SHUT_WR) = 0

Here, there is only one write — just enough for the headers and a sliver of the body — before the shutdown is immediately called. Out of a 14.9 MB response, only about 219 KB was sent. The remaining ~14.8 MB of image data never left hyper’s internal buffer, nor was there any termination signal from the client between the write and the shutdown. Instead, the Images service prematurely shut down the connection on its own, genuinely believing it was finished.

The failing requests confirmed that the bug was a race condition that triggered intermittently. Whether a request succeeded or failed depended on whether the flush and shutdown operations overlapped, which changed from request to request. When the buffer was still full at the exact moment that hyper decided the connection was finished, data was lost.


When the reader consumes slower than hyper writes, the outbound buffer fills up. If hyper shuts down the connection before the buffer drains, then only a fraction of the response makes it to the intermediary; this incomplete data gets forwarded back to the Workers runtime and the client.

The December rearchitecture didn’t introduce this bug, which had been present in hyper for years across multiple major versions. But the new intermediary changed who was reading on the response side of the socket. Our working theory is that FL, the previous intermediary, consumed data fast enough that the socket buffer rarely filled during a response. The new reader read at a pace that occasionally let the buffer fill during larger responses.

These few milliseconds of backpressure, introduced by an improvement that made everything else faster, were all it took to surface a flaw that had been hiding in plain sight.

Inside the dispatch loop

Hyper’s HTTP/1 connection lifecycle is driven by a state machine in a file called dispatch.rs. It runs a loop that reads requests, writes responses, flushes the write buffer to the socket, and decides when to shut down. In simplified form:

fn poll_loop(&mut self, cx: &mut Context<'_>) -> Poll<Result<(), Error>> {
    loop {
        let _ = self.poll_read(cx)?;
        let _ = self.poll_write(cx)?;
        let _ = self.poll_flush(cx)?;

        if !self.conn.wants_read_again() {
            return Poll::Ready(Ok(()));
        }
    }
}

More precisely, the let _ before poll_flush is where the bug lives.

In Rust, let _ = expr discards the expression’s result, including Poll::Pending, the signal that the flush isn’t done yet. The flush might still have megabytes sitting in its buffer, but the loop never finds out.

When a request fails, this is the exact sequence of events:

  1. The Images service finishes encoding the image and hands the entire response to hyper as a single in-memory block.

  2. Hyper writes the block into its internal buffer and marks its write state as Writing::Closed. From an encoding standpoint, the work is done — there is nothing left to encode.

  3. Hyper calls poll_flush to move the buffered data to the socket. In our previous example, the socket accepted about 219 KB. The remaining ~14.8 MB stays in hyper’s buffer. The socket is full, so the kernel returns Poll::Pending.

  4. poll_loop discards the Poll::Pending with let _.

  5. It checks wants_read_again(). The full request was already received, so this returns false.

  6. poll_loop returns Poll::Ready(Ok(())), signaling that the loop is finished, even though the flush is not.

  7. poll_shutdown() fires. The SHUT_WR syscall is issued.

  8. The client receives 219 KB and an EOF (end-of-file) indicating that the connection is closed, even though it expects 14.9 MB.

In the second step, hyper marks the write operation as complete as soon as the response body is buffered (i.e., when encoding is finished), rather than when it has actually been flushed. Most of the time, the flush completes in a single pass and this distinction is invisible. On the rare occasions when the socket buffer is full, the flush has to wait — even though hyper doesn’t. The bytes are still sitting in hyper’s buffer, waiting to be flushed to the socket. Hyper proceeds to shut down the connection with this data still in the buffer.

This also explains why curl never triggered the bug. Curl reads data as fast as it arrives: The socket buffer never fills, the flush always completes immediately, and the discarded return value is harmless. The production path, with a reader that occasionally paused for a few milliseconds, was the only configuration where the buffer filled at exactly the wrong moment.

Don’t forget to flush

After weeks of investigation, the fix itself was conceptually simple. Hyper needed to check whether the flush was actually done before moving on.

Our reproduction worker confirmed that the bug existed, but it couldn’t tell us why a given request failed. Before writing the fix, we needed a test that could trigger the exact socket conditions inside hyper.

We knew the conditions that triggered the bug: a socket that accepts one chunk of data and then blocks. To test with a controlled scenario, we built a custom wrapper around a TCP stream that simulated a full socket buffer. The wrapper accepted 8 KB on the first write, then returned Poll::Pending on every subsequent write, mimicking a reader that stopped draining the buffer.

The test sent a 500 KB response through this constrained socket and checked whether hyper called shutdown while 492 KB was still buffered. Without a fix, it did. With the fix, it waited.

Initially, we applied the fix in hyper’s dispatch loop. Instead of discarding the result of poll_flush, we checked to see whether the flush was actually done:

let flush_result = self.poll_flush(cx)?;

if flush_result.is_pending() {
    return Poll::Pending;
}

if !self.conn.wants_read_again() {
    return Poll::Ready(Ok(()));
}

If the flush hasn’t completed, then the loop returns Poll::Pending to the asynchronous runtime. The runtime waits for the socket to become writable, then wakes the task back up to continue the flush. The connection shuts down only after all data has been sent.

When we deployed this fix, we observed that every byte was written and the shutdown was called only after the buffer was actually empty. The customer who made the first report also confirmed that the issue disappeared.

While our initial solution worked, the dispatch loop wasn’t the right place for the fix. Returning Poll::Pending early could slow down other operations on the same connection by reducing how frequently reads are polled, causing unintended backpressure. It also doesn’t correctly handle keepalive connections, where a single connection handles multiple requests in sequence — these should remain reusable even while the previous response is still being flushed. Neither issue affected our particular service (where keepalive is disabled), but both could affect other hyper users if the fix were contributed upstream.

We traced through hyper’s connection lifecycle and found a more targeted approach. Rather than changing how the dispatch loop behaves, we applied the fix at the point where shutdown is actually called. Before shutting down the socket, hyper should first flush any remaining data in its buffer:

pub(crate) fn poll_shutdown(
    &mut self,
    cx: &mut Context<'_>,
) -> Poll<io::Result<()>> {
    ready!(self.poll_flush(cx)?);
    Pin::new(&mut self.io).poll_shutdown(cx)
}

This leaves the dispatch loop unchanged. It adds a flush only at the exact point where data loss would otherwise occur — the moment before shutdown.

What stayed with us

None of the tools at the application level surfaced any errors, crashes, or log entries that provided useful clues. Application-level observability can have a blind spot for bugs that live below its awareness.

The failure occurred intermittently, scaled with response size, couldn’t be reproduced with simple tools like curl, and disappeared when we observed the system more closely. These signals pointed to a timing-dependent bug in the connection layer, not in the application logic.

Our breakthrough came from using kernel-level tooling with strace, the one layer that records what actually happened on the socket. The underlying bug lived in the few milliseconds between a partial flush and a premature shutdown — a window that opened only after we made the system faster.

We merged our fix and the deterministic test into hyperium/hyper via PR #4018. It will be available in a future hyper release, ensuring that any service using hyper’s HTTP/1 implementation won’t lose response data to the same race condition.

In the meantime, we’re running an internal fork with the patch applied. This fix stabilized the binding’s architecture, creating a reliable foundation to expand its functionality.

The Images binding initially covered only transformations of remote images. Earlier this month, we announced that the Images binding now supports operations for hosted images, giving developers a unified way to build media-rich applications on Cloudflare.

Read more about how the binding works in our documentation.

This is the Storage of Spaceborne Computer 4 Bringing AI Compute to the Moon

Post Syndicated from Patrick Kennedy original https://www.servethehome.com/this-is-the-storage-kioxia-hpe-spaceborne-computer-4-bringing-ai-compute-to-the-moon/

We found a HPE Spaceborne Computer 4 compute module bringing AI inference to the moon later this year and the storage may surprise you

The post This is the Storage of Spaceborne Computer 4 Bringing AI Compute to the Moon appeared first on ServeTheHome.

The collective thoughts of the interwebz