Post Syndicated from Julian Wood original https://aws.amazon.com/blogs/compute/introducing-aws-lambda-runtime-management-controls/
This blog post is written by Jonathan Tuliani, Principal Product Manager.
Today, AWS Lambda is announcing runtime management controls which provide more visibility and control over when Lambda applies runtime updates to your functions. Lambda is also changing how it rolls out automatic runtime updates to your functions. Together, these changes provide more flexibility in how you take advantage of the latest runtime features, performance improvements, and security updates.
By default, all functions will continue to receive automatic runtime updates. You do not need to change how you use Lambda to continue to benefit from the security and operational simplicity of the managed runtimes Lambda provides. The runtime controls are optional capabilities for advanced customers that require more control over their runtime changes.
This post explains what new runtime management controls are available and how you can take advantage of this new capability.
Overview
For each runtime, Lambda provides a managed execution environment. This includes the underlying Amazon Linux operating system, programming language runtime, and AWS SDKs. Lambda takes on the operational burden of applying patches and security updates to all these components. Customers tell us how much they appreciate being able to deploy a function and leave it, sometimes for years, without having to apply patches. With Lambda, patching ‘just works’, automatically.
Lambda strives to provide updates which are backward compatible with existing functions. However, as with all software patching, there are rare cases where a patch can expose an underlying issue with an existing function that depends on the previous behavior. For example, consider a bug in one of the runtime OS packages. Applying a patch to fix the bug is the right choice for the vast majority of customers and functions. However, in rare cases, a function may depend on the previous (incorrect) behavior. Customers with critical workloads running in Lambda tell us they would like a way to further mitigate even this slight risk of disruption.
With the launch of runtime management controls, Lambda now offers three new capabilities. First, Lambda provides visibility into which patch version of a runtime your function is using and when runtime updates are applied. Second, you can optionally synchronize runtime updates with function deployments. This provides you with control over when Lambda applies runtime updates and enables early detection of rare runtime update incompatibilities. Third, in the rare case where a runtime update incompatibility occurs, you can roll back your function to an earlier runtime version. This keeps your function working and minimizes disruption, providing time to remedy the incompatibility before returning to the latest runtime version.
Runtime identifiers and runtime versions
Lambda runtimes define the components of the execution environment in which your function code runs. This includes the OS, programming language runtime, environment variables, and certificates. For Python, Node.js and Ruby, the runtime also includes the AWS SDK. Each Lambda runtime has a unique runtime identifier, for example, nodejs18.x, or python3.9. Each runtime identifier represents a distinct major release of the programming language.
Runtime management controls introduce the concept of Lambda runtime versions. A runtime version is an immutable version of a particular runtime. Each Lambda runtime, such as Node.js 16, or Python 3.9, starts with an initial runtime version. Every time Lambda updates the runtime, it adds a new runtime version to that runtime. These updates cover all runtime components (OS, language runtime, etc.) and therefore use a Lambda-defined numbering scheme, independent of the version numbers used by the programming language. For each runtime version, Lambda also publishes a corresponding base image for customers who package their functions as container images.
New runtime identifiers represent a major release for the programming language, and sometimes other runtime components, such as the OS or SDK. Lambda cannot guarantee compatibility between runtime identifiers, although most times you can upgrade your functions with little or no modification. You control when you upgrade your functions to a new runtime identifier. In contrast, new runtime versions for the same runtime identifier have a very high level of backward compatibility with existing functions. By default, Lambda automatically applies runtime updates by moving functions from the previous runtime version to a newer runtime version.
Each runtime version has a version number, and an Amazon Resource Name (ARN). You can view the version in a new platform log line, INIT_START. Lambda emits this log line each time it creates a new execution environment during the cold start initialization process.
INIT_START Runtime Version: python:3.9.v14 Runtime Version ARN: arn:aws:lambda:eu-south-1::runtime:7b620fc2e66107a1046b140b9d320295811af3ad5d4c6a011fad1fa65127e9e6I
INIT_START Runtime Version: python:3.9.v14 Runtime Version ARN: arn:aws:lambda:eu-south-1::runtime:7b620fc2e66107a1046b140b9d320295811af3ad5d4c6a011fad1fa65127e9e6I
Runtime versions improve visibility into managed runtime updates. You can use the INIT_START log line to identify when the function transitions from one runtime version to another. This helps you investigate whether a runtime update might have caused any unexpected behavior of your functions. Changes in behavior caused by runtime updates are very rare. If your function isn’t behaving as expected, by far the most likely cause is an error in the function code or configuration.
Runtime management modes
With runtime management controls, you now have more control over when Lambda applies runtime updates to your functions. You can now specify a runtime management configuration for each function. You can set the runtime management configuration independently for $LATEST and each published function version.
You can specify one of three runtime update modes: auto, function update, or manual. The runtime update mode controls when Lambda updates the function version to a new runtime version. By default, all functions receive runtime updates automatically, the alternatives are for advanced users in specific cases.
Automatic
Auto updates are the default, and are the right choice for most customers to ensure that you continue to benefit from runtime version updates. They help minimize your operational overheads by letting Lambda take care of runtime updates.
While Lambda has always provided automatic runtime updates, this release includes a change to how automatic runtime updates are rolled out. Previously, Lambda applied runtime updates to all functions in each region, following a region-by-region deployment sequence. With this release, functions configured to use the auto runtime update mode now receive runtime updates in two phases. Initially, Lambda only applies a new runtime version to newly created or updated functions. After this initial period is complete, Lambda then applies the runtime update to any remaining functions configured to use the auto runtime update mode.
This two-phase rollout synchronizes runtime updates with function updates for customers who are actively developing their functions. This makes it easier to detect and respond to any unexpected changes in behavior. For functions not in active development, auto mode continues to provide the operational benefits of fully automatic runtime updates.
Function update
In function update mode, Lambda updates your function to the latest available runtime version whenever you change your function code or configuration. This is the same as the first phase of auto mode. The difference is that, in auto mode, there is a second phase when Lambda applies runtime updates to functions which have not been changed. In function update mode, if you do not change a function, it continues to use the current runtime version indefinitely. This means that when using function update mode, you must update your functions regularly to keep their runtimes up-to-date. If you do not update a function regularly, you should use the auto runtime update mode.
Synchronizing runtime updates with function deployments gives you control over when Lambda applies runtime updates. For example, you can avoid applying updates during business-critical events, such as a product launch or holiday sales.
When used with CI/CD pipelines, function update mode enables early detection and mitigation in the rare event of a runtime update incompatibility. This is especially effective if you create a new published function version with each deployment. Each published function version captures a static copy of the function code and configuration, so that you can roll back to a previously published function version if required. Using function update mode extends the published function version to also capture the runtime version. This allows you to synchronize rollout and rollback of the entire Lambda execution environment, including function code, configuration, and runtime version.
Manual
Consider the rare event that a runtime update is incompatible with one of your functions. With runtime management controls, you can now roll back to an earlier runtime version. This keeps your function working and minimizes disruption, giving you time to remedy the incompatibility before returning to the latest runtime version.
There are two ways to implement a runtime version rollback. You can use function update mode with a published function version to synchronize the rollback of code, configuration, and runtime version. Or, for functions using the default auto runtime update mode, you can roll back your runtime version by using manual mode.
The manual runtime update mode provides you with full control over which runtime version your function uses. When enabling manual mode, you must specify the ARN of the runtime version to use, which you can find from the INIT_START log line.
Lambda does not impose a time limit on how long you can use any particular runtime version. However, AWS strongly recommends using manual mode only for short-term remediation of code incompatibilities. Revert your function back to auto mode as soon as you resolve the issue. Functions using the same runtime version for an extended period may eventually stop working due to, for example, a certificate expiry.
Using runtime management controls
You can configure runtime management controls via the Lambda AWS Management Console and AWS Command Line Interface (AWS CLI). You can also use infrastructure as code tools such as AWS CloudFormation and the AWS Serverless Application Model (AWS SAM).
Console
From the Lambda console, navigate to a specific function. You can find runtime management controls on the Code tab, in the Runtime settings panel. Expand Runtime management configuration to view the current runtime update mode and runtime version ARN.

Runtime settings
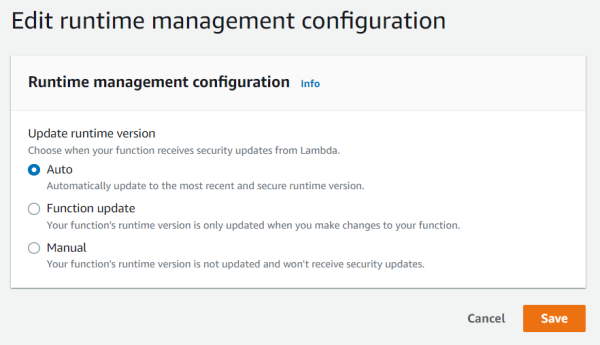
To change runtime update mode, select Edit runtime management configuration. You can choose between automatic, function update, and manual runtime update modes.

Edit runtime management configuration (Auto)
In manual mode, you must also specify the runtime version ARN.

Edit runtime management configuration (Manual)
AWS SAM
AWS SAM is an open-source framework for building serverless applications. You can specify runtime management settings using the RuntimeManagementConfig property.
Resources:
  HelloWorldFunction:
    Type: AWS::Serverless::Function
    Properties:
      Handler: lambda_function.handler
      Runtime: python3.9
      RuntimeManagementConfig:
        UpdateOn: Manual
        RuntimeVersionArn: arn:aws:lambda:eu-west-1::runtime:7b620fc2e66107a1046b140b9d320295811af3ad5d4c6a011fad1fa65127e9e6
AWS CLI
You can also manage runtime management settings using the AWS CLI. You configure runtime management controls via a dedicated command aws lambda put-runtime-management-config, rather than aws lambda update-function-configuration.
aws lambda put-runtime-management-config --function-name <function_arn> --update-runtime-on Manual --runtime-version-arn <runtime_version_arn>
To view the existing runtime management configuration, use aws lambda get-runtime-management-config.
aws lambda get-runtime-management-config --function-name <function_arn>
The current runtime version ARN is also returned by aws lambda get-function and aws lambda get-function-configuration.
Conclusion
Runtime management controls provide more visibility and flexibility over when and how Lambda applies runtime updates to your functions. You can specify one of three update modes: auto, function update, or manual. These modes allow you to continue to take advantage of Lambda’s automatic patching, synchronize runtime updates with your deployments, and rollback to an earlier runtime version in the rare event that a runtime update negatively impacts your function.
For more information on runtime management controls, see our documentation page.
For more serverless learning resources, visit Serverless Land.