Tag Archives: Amazon EC2

Optimize EC2 costs with AWS Compute Optimizer right sizing

Post Syndicated from Darshan Patel original https://aws.amazon.com/blogs/compute/optimize-ec2-costs-with-aws-compute-optimizer-right-sizing/

One of the most impactful ways to improve the ROI on your Amazon Elastic Compute Cloud (Amazon EC2) investment is rightsizing — when you match your instance types and sizes to the actual resource demands of your workloads. However, doing this manually across hundreds or thousands of instances is time-consuming and error-prone. AWS Compute Optimizer analyzes your AWS resources’ configuration and utilization metrics to provide rightsizing recommendations designed to help you identify opportunities to reduce cost while helping to maintain performance and capacity requirements.

In this post, we walk you through how to evaluate AWS Compute Optimizer’s EC2 rightsizing recommendations, configure recommendation preferences that align with your organization’s priorities, enrich recommendations with memory utilization data, and assess Graviton-based alternatives — all to help you make more informed, data-driven rightsizing decisions.

Prerequisites

To follow along with the best practices in this post, you need:

  • An AWS account with access to AWS Compute Optimizer
  • At least one running EC2 instance with 30+ hours of Amazon CloudWatch metric data in the past 14 days

Optional (for enhanced recommendations):

The challenge: balancing cost and performance at scale

Most organizations don’t have clear insights into the best performance-cost ratio for their EC2 instances — leading to overprovisioning and wasted spend on one side, or undersized instances and degraded user experience on the other. The key questions engineering and FinOps teams face are:

  • Which instances are oversized? Where are we paying for capacity we don’t use?
  • Which instances are undersized? Where are we risking performance degradation?
  • What’s the right trade-off? How do we optimize cost without introducing performance risk?

AWS Compute Optimizer analyzes up to 93 days of utilization data from Amazon CloudWatch and delivers recommendations classified by savings opportunity and performance risk to help you address these questions.

How Compute Optimizer evaluates EC2 instances

Compute Optimizer analyzes the following CloudWatch metrics for your EC2 instances, with recommendations refreshed daily:

  • CPU utilization — the percentage of allocated EC2 compute units in use on the instance. Metric: CPUUtilization
  • Memory utilization — the percentage of memory in use during the sample period (when enabled — see below). Metric: MemoryUtilization
  • Network I/O — the volume of incoming/outgoing traffic and packets on all network interfaces. Metrics: NetworkIn, NetworkOut, NetworkPacketsIn, NetworkPacketsOut
  • Disk I/O — read/write operations and throughput for instance store volumes. Metrics: DiskReadOps, DiskWriteOps, DiskReadBytes, DiskWriteBytes
  • EBS throughput and IOPS — read/write throughput and operations for attached EBS volumes. Metrics: VolumeReadBytes, VolumeWriteBytes, VolumeReadOps, VolumeWriteOps
  • GPU utilization — the percentage of allocated GPUs in use, GPU memory usage, and active encoder sessions (when enabled via the CloudWatch Agent with NVIDIA GPU metrics). Metrics: GPUUtilization, GPUMemoryUtilization, GPUEncoderStatsSessionCount

Based on these metrics, Compute Optimizer classifies each instance as:

Finding Meaning
Over-provisioned Instance resources exceed workload needs — downsize opportunity
Under-provisioned Workload demands exceed instance capacity — performance risk
Optimized Current instance is well-matched to workload requirements
Idle Instance has very low utilization — candidate for termination or consolidation (shown on a dedicated Idle Resource Recommendations page; criteria: peak CPU below 5% and network I/O under 5 MB/day over the 14-day lookback period; GPU instances (G/P families) have additional GPU-specific idle criteria)

When AWS Cost Optimization Hub is enabled, Compute Optimizer factors in your existing pricing commitments (AWS Savings Plans, Reserved Instances and other specific pricing discounts) when generating savings estimates — see Best practice 1 below for details.

For each finding, Compute Optimizer lists up to three optimization recommendations for a specific instance, ranked by estimated savings, performance risk, and migration effort.

Note: While this post focuses on EC2 instance rightsizing, Compute Optimizer also generates recommendations for Amazon EC2 Auto Scaling groups (including mixed instance types and scaling policies), Amazon Elastic Block Store (Amazon EBS) volumes, AWS Lambda functions, Amazon Elastic Container Service (Amazon ECS) services on AWS Fargate, commercial software licenses, and Amazon Aurora/Amazon Relational Database Service (Amazon RDS) databases. Idle resource detection extends further — covering EC2 instances, Auto Scaling groups, EBS volumes, ECS on Fargate, Aurora/RDS, and NAT Gateways. For the full list of supported resources, see Supported resources.

Evaluating recommendations in the console

In the Compute Optimizer console, navigate to EC2 Instances and select any instance to view its detail page. From here you can:

  1. Compare utilization metrics — View side-by-side graphs showing how your current instance’s CPU, memory, network, and disk metrics map to the recommended instance’s capacity.
  2. Review estimated savings — See projected monthly cost savings for each recommended option. With AWS Cost Optimization Hub enabled, savings reflect your actual pricing discounts rather than On-Demand rates (see Best practice 1).
  3. Assess performance risk — Understand the likelihood that switching to the recommended instance may result in resource contention.
  4. Evaluate migration effort — Compute Optimizer rates each recommendation from Very low to High based on CPU architecture compatibility and inferred workload type. Same architecture is Very low effort; AWS Graviton (ARM64) recommendation with a known compatible workload (for example, Amazon EMR) is Low; Graviton with an unidentified workload is Medium; and a different architecture with no known compatible version is High effort.
  5. Toggle CPU architecture preferences — Use the architecture drop-down to compare x86-based recommendations against AWS Graviton (ARM64) alternatives for additional price-performance improvements.

Best practice 1: Enable Cost Optimization Hub for after-discount savings

Why this matters: Enabling Cost Optimization Hub gives Compute Optimizer visibility into your Savings Plans, Reserved Instances, and other pricing discounts — so every recommendation reflects what you would actually save given your existing commitments. This is especially valuable for organizations with significant discount coverage, where On-Demand savings estimates may be significantly higher than what you would actually realize after accounting for existing commitments.

When you enable Cost Optimization Hub, Compute Optimizer automatically switches to AfterDiscounts mode and uses your organization-specific pricing discounts to generate recommendations. The console then displays two savings columns — Estimated monthly savings (after discounts) and Estimated monthly savings (On-Demand) — giving you both views side by side. To enable Cost Optimization Hub for your organization, see Getting started with Cost Optimization Hub. The savings estimation mode preference allows Compute Optimizer to analyze specific pricing discounts when generating the estimated cost savings of rightsizing recommendations. You can verify or override the savings estimation mode under Preferences > Savings estimation mode in the Compute Optimizer console. See Savings estimation mode for details.

Best practice 2: Enable memory metrics for accurate recommendations

Why this matters: Memory utilization is not collected by default in CloudWatch. By enabling it, you give Compute Optimizer a complete picture of your workload — CPU, network, disk, and memory together. This is especially valuable for memory-intensive workloads (databases, caching layers, JVM-based applications), where memory is often the critical sizing factor. With full visibility, Compute Optimizer can factor memory needs into every recommendation, resulting in higher-confidence suggestions that your teams can implement with greater assurance.

Option A: CloudWatch Agent

Deploy the unified CloudWatch Agent on your instances to publish memory utilization metrics. Compute Optimizer automatically incorporates these metrics once they’re available in CloudWatch.

Note: Collecting memory metrics with the CloudWatch Agent incurs charges. See Amazon CloudWatch Pricing.

Key steps:

  1. Install the CloudWatch Agent via AWS Systems Manager or manually.
  2. Configure the agent to collect memory metrics.
  3. Verify metrics appear in CloudWatch.
  4. Allow up to 24 hours for Compute Optimizer to incorporate the new data.

Option B: External metrics ingestion

If your organization uses a third-party observability platform, Compute Optimizer supports ingesting EC2 memory utilization metrics from:

  • Datadog
  • Dynatrace
  • Instana
  • New Relic

When external metrics ingestion is enabled, Compute Optimizer analyzes external memory data alongside native CloudWatch metrics to generate enhanced recommendations.

Learn more: Configuring external metrics ingestion

Best practice 3: Configure rightsizing preferences to match your strategy

Why this matters: Compute Optimizer’s defaults — P99.5 threshold (sizes instances to handle 99.5% of observed CPU peaks), 20% headroom (adds a 20% capacity buffer above those peaks for future growth), and 14-day lookback — work well for many workloads. Customizing these preferences lets you go further — extending the lookback to 32 or 93 days captures monthly or seasonal patterns for even more accurate recommendations, while adjusting headroom and threshold lets you fine-tune the balance between savings and performance for each environment. The result: recommendations tailored to your actual risk tolerance and workload patterns, producing suggestions your teams will trust and confidently implement.

Compute Optimizer supports configurable rightsizing preferences that tailor recommendations to your workload requirements. Preferences can be set at the organization level (applies to all member accounts in your AWS Organizations), account level (applies to a specific account — useful when production and dev/test accounts need different settings), or regional level (applies within a specific region — useful when workloads differ across regions). This hierarchy lets you set conservative defaults org-wide and override for specific accounts or regions that need different treatment.

Key preference options include:

Preference Description When to use
CPU utilization threshold Before generating recommendations, Compute Optimizer filters your CPU data through this percentile. Think of it as a noise filter: P99.5 (default) keeps 99.5% of your data and only discards the rarest 0.5% of spikes — so the recommendation is sized to handle almost every peak you’ve ever seen. P90 discards the top 10% of spikes, treating them as anomalies, and produces smaller (cheaper) recommendations. Options: P90, P95, P99.5 Use P99.5 for production where you can’t afford to miss peaks; P90 for dev/test where occasional spikes from deployments or one-off events are acceptable to ignore
CPU utilization headroom After Compute Optimizer determines the right instance size based on your historical peaks, it adds this percentage as a safety cushion for future growth. For example: if your analyzed peak needs 60% of an instance’s CPU, a 20% headroom means the recommended instance will still have 20 percentage points of spare capacity above that peak — room to grow without needing another resize. Options: 30%, 20% (default), 0% Use 30% for workloads with unpredictable or growing traffic; 20% for typical production; 0% for steady-state workloads where you want maximum savings and accept a tight fit
Memory utilization headroom Added memory capacity buffer (30%, 20%, or 10%) above analyzed usage to accommodate future increases. Default is 20% Use 30% for memory-sensitive workloads; 10% for steady-state where you want maximum savings
Lookback period Choose 14 days (default, no additional charge), 32 days (no additional charge), or 93 days (requires Enhanced Infrastructure Metrics (EIM), a paid feature). You can enable EIM at the organization, account, or individual resource level — useful for activating it only on production workloads where the cost is justified Use 32 days for monthly patterns; 93 days for seasonal or quarterly workloads
Preferred instance types Restrict recommendations to specific instance families or types. For example, if you have purchased Savings Plans and Reserved Instances, you can specify instances only covered by those pricing models. Or, if you want to use only instances equipped with certain processors or non-burstable instances because of your application design, you can specify those instances for your recommendation output When organizational standards, procurement commitments (RIs/SPs), or application design require approved instance families

Learn more: How to take advantage of rightsizing recommendation preferences

Best practice 4: Evaluate Graviton recommendations carefully

Why this matters: Compute Optimizer can recommend migrating x86 workloads to AWS Graviton instances, which deliver up to 40% better price-performance. However, unlike same-architecture rightsizing (which is a configuration change), Graviton involves a CPU architecture shift from x86 to ARM64 — so a structured evaluation process helps you validate compatibility and capture the full savings with confidence.

Before migrating to Graviton:

  1. Assess architecture compatibility — Verify that your application binaries, libraries, and dependencies support ARM64. Container-based workloads (using multi-arch images) typically require less modification to migrate.
  2. Check software dependencies — Confirm third-party agents, drivers, and monitoring tools are available for ARM64.
  3. Test in non-production first — Deploy the recommended Graviton instance in a staging environment.
  4. Run load tests — Validate performance parity with the current instance.
  5. Use the Graviton Transition Guide — Follow the AWS Graviton Getting Started guide for a structured migration approach.
  6. How to identify a good target workload — A good candidate for Graviton adoption is a workload running on Linux or BSD, built either using open-source components or source code that you control. Having full access to the source code of every component allows you to make any necessary changes quickly and easily as part of this adoption plan. If you use third-party software, many ISVs already support the Arm64 architecture implemented by AWS Graviton processors.

When to defer Graviton recommendations:

  • Legacy applications compiled for x86 without source code access.
  • Workloads with licensing tied to specific CPU architectures.
  • Applications with untested third-party binary dependencies.

Learn more: AWS Compute Optimizer Graviton migration guidance

Best practice 5: Implement a rightsizing workflow

Why this matters: A structured workflow turns Compute Optimizer’s recommendations into sustained, measurable cost savings. By establishing a regular cadence — reviewing, validating with stakeholders, and tracking results — your organization builds a continuous optimization loop that adapts as workloads evolve, compounds savings over time, and gives finance teams clear visibility into realized cost reductions.

To operationalize Compute Optimizer recommendations across your organization:

  1. Establish a regular review cadence — Schedule weekly or bi-weekly rightsizing reviews with your FinOps or cloud operations team.
  2. Prioritize by savings and confidence — Focus first on Over-provisioned instances with high estimated savings and low performance risk.
  3. Validate with application owners — Share recommendations with workload owners for context on usage patterns that metrics alone may not reveal (for example, seasonal traffic, scheduled batch jobs).
  4. Track implementation — Use AWS Cost Explorer to measure realized savings after rightsizing changes.

Note: Tag instances for effective rightsizing at scale. Compute Optimizer recommendations become more actionable when your instances carry consistent tags. At minimum, tag with Environment (prod/staging/dev) to drive review priority, and Application/Workload and Owner/Team to route recommendations to the right team. Compute Optimizer’s console, exports, and API all support tag-based filtering (tag:key and tag-key filters).

Taking it further — automate your workflow: For organizations ready to move beyond manual reviews, Compute Optimizer offers built-in automation that allows you to create automation rules that continuously clean up unattached volumes and upgrade volume types based on Compute Optimizer’s data-driven recommendations. For EC2 instance rightsizing, AWS provides a reference architecture for automating Compute Optimizer recommendations using AWS Step Functions, Amazon EventBridge, and AWS Lambda. See: Optimize costs by automating AWS Compute Optimizer recommendations

Clean up

If you installed the CloudWatch Agent as part of best practice 2 and no longer need memory metrics, stop and remove the agent to avoid ongoing custom metric charges.

Conclusion

AWS Compute Optimizer provides data-driven recommendations to help you make more informed EC2 rightsizing decisions. By enabling memory metrics, configuring recommendation preferences aligned to your workload needs, carefully evaluating Graviton alternatives, and establishing a systematic review process, you can identify opportunities to help optimize your EC2 fleet and help reduce costs while considering the performance your applications require.

Further reading

Now available: Amazon EC2 M9g and M9gd instances powered by new AWS Graviton5 processors

Post Syndicated from Esra Kayabali original https://aws.amazon.com/blogs/aws/now-available-amazon-ec2-m9g-and-m9gd-instances-powered-by-new-aws-graviton5-processors/

AWS Graviton processors have improved steadily across generations, with each iteration delivering advances in compute performance, price-performance, and energy efficiency. At re:Invent 2025, we announced Amazon EC2 M9g, the first Graviton5-powered instances, in preview. Since then, customers have tested M9g across a wide range of workloads and shared their results. ClickHouse saw a 36% performance boost compared to M8g, with zero code changes. Honeycomb achieved 36% better throughput per core compared to Graviton4, across a 6-month A/B test of production observability workloads. HubSpot deployed M9g for MySQL databases and saw query duration drop by up to 60%. Today, M9g instances are generally available, alongside the new M9gd instances for customers who need high-speed, low-latency local NVMe SSD storage. Both are powered by Graviton5, the most powerful and most energy efficient processor AWS has ever built.

While many Arm-based instances have been introduced across the industry, no one comes close to the breadth and depth of the AWS Graviton footprint. After five generations of custom silicon and eight years of continuous investment, Graviton powers over 350 instance types serving more than 120,000 customers, from startups to large enterprises, a robust ISV partner ecosystem, and a broad set of managed services. You can use Graviton for a broad variety of workloads, including web applications, microservices, analytics, databases, machine learning (ML) inference, electronic design automation (EDA), gaming, and video encoding. As workloads grow more compute-intensive and data-driven, many have asked for more processing power, along with greater network and storage bandwidth to move more data and complete workloads faster. We’ve also designed these instances to efficiently package compute, memory, and I/O to maximize energy utilization.

As AI shifts from answering questions to taking actions, running code, using tools, evaluating results, and orchestrating multi-step tasks, the demand for CPU compute is growing rapidly. Graviton5 is built for this shift. With 192 cores, a 5x larger L3 cache, up to 33% lower inter-core latency, and DDR5 memory delivering high bandwidth, Graviton5 helps agents spend less time waiting on CPU-bound steps, processing more instructions, handling large numbers of concurrent environments, and keeping accelerators moving.

Meta is deploying Graviton at scale starting with tens of millions of cores to support its agentic AI efforts, making Meta one of the largest Graviton customers in the world. Agentic AI workloads, including real-time reasoning, code generation, and the orchestration of multi-step tasks, are CPU-intensive and benefit from the higher compute performance, larger caches, higher memory bandwidth, and core density in Graviton5.

What’s new in M9g and M9gd
Built on the sixth-generation AWS Nitro System, M9g instances are powered by AWS Graviton5 processors that deliver higher compute performance, larger caches, and improved memory and I/O scalability compared to Graviton4 processors. Graviton5 offers up to 25% better compute performance compared to Graviton4-based instances, with up to 35% faster performance for web applications, up to 35% for machine learning inference, and up to 30% for databases. As the first CPU in the AWS fleet to support the latest generation of PCIe Gen6 and DDR5-8800 memory, AWS Graviton5 instances deliver the fastest memory of any processor instances in the cloud, and 5 times more L3 cache compared to the previous generation. These improvements also come with better energy efficiency, helping you meet sustainability targets without compromising capability.

Networking and storage bandwidth have been expanded to keep pace with compute growth. M9g and M9gd instances offer up to 15% higher network bandwidth and 20% higher Amazon Elastic Block Store (Amazon EBS) bandwidth on average across sizes, with up to twice the network bandwidth for the largest instance size. M9g and M9gd instances also support Instance Bandwidth Configuration (IBC), a feature that helps you adjust the allocation of bandwidth between Amazon EBS and Amazon Virtual Private Cloud (Amazon VPC) networking for an Amazon EC2 instance by up to 25%. IBC can help optimize performance for workloads with specific bandwidth requirements, such as database read and write performance, query processing, and logging. These enhancements support faster data movement and improved throughput for workloads that rely on high I/O performance.

Security and isolation are foundational requirements for running workloads in the cloud. Within the Nitro System, the AWS Nitro Hypervisor is designed to isolate instances from each other as well as AWS operators. With M9g and M9gd instances we are raising the bar on security even further with the introduction of Nitro Isolation Engine. Nitro Isolation Engine is an enhancement to the Nitro System, which enforces isolation of instances and harnesses formal verification to provide assurances of isolation with mathematical precision. Nitro Isolation Engine is a purpose-built component that is responsible for enforcing isolation between virtual machines, including mediation of all access to virtual machine memory, CPU register state, and I/O devices through a minimal set of APIs. Nitro Isolation Engine leverages formal verification, a technique to mathematically demonstrate that the hardware or software behaves as intended, and not just in specific test cases. This intensive verification technique establishes Nitro as the first formally verified cloud hypervisor, pioneering a new standard for mathematically proven cloud security.

M9g instances provide one vCPU for every four GiB of memory and are well suited for a broad range of general-purpose workloads, including application servers, microservices, midsize data stores, gaming servers, caching fleets, containerized applications, large-scale Java applications, code repositories, web applications, and agentic AI.

For workloads that need high-speed, low-latency local storage, M9gd instances provide up to 11.4 TB of NVMe SSD storage and 30% higher IOPS and storage performance compared to Graviton4-based M8gd instances. M9gd instances are well suited for general-purpose workloads that require a balance of compute and memory with high-speed, low-latency local storage, including application servers, microservices, gaming servers, midsize key-value data stores, caching fleets, data logging, media processing, batch and log processing, and applications that need temporary storage such as caches and scratch files.

Here are the key specifications across the family:

M9g vCPUs Memory (GiB) Network bandwidth (Gbps) EBS bandwidth (Gbps)
medium 1 4 Up to 15 Up to 12
large 2 8 Up to 15 Up to 12
xlarge 4 16 Up to 15 Up to 12
2xlarge 8 32 Up to 17 Up to 12
4xlarge 16 64 Up to 17 Up to 12
8xlarge 32 128 17 12
12xlarge 48 192 25 18
16xlarge 64 256 34 24
24xlarge 96 384 50 36
48xlarge 192 768 100 72
metal-48xl 192 768 100 72

M9gd instances include local NVMe SSD storage. The table below shows the instance storage for each size. Compute, memory, network, and EBS bandwidth specifications are the same as M9g.

M9gd vCPUs Memory (GiB) Instance storage (GB) Network bandwidth (Gbps) EBS bandwidth (Gbps)
medium 1 4 1 x 59 NVMe SSD Up to 15 Up to 12
large 2 8 1 x 118 NVMe SSD Up to 15 Up to 12
xlarge 4 16 1 x 237 NVMe SSD Up to 15 Up to 12
2xlarge 8 32 1 x 475 NVMe SSD Up to 17 Up to 12
4xlarge 16 64 1 x 950 NVMe SSD Up to 17 Up to 12
8xlarge 32 128 1 x 1900 NVMe SSD 17 12
12xlarge 48 192 3 x 950 NVMe SSD 25 18
16xlarge 64 256 1 x 3800 NVMe SSD 34 24
24xlarge 96 384 3 x 1900 NVMe SSD 50 36
48xlarge 192 768 3 x 3800 NVMe SSD 100 72
metal-48xl 192 768 3 x 3800 NVMe SSD 100 72

Now available
M9g and M9gd instances are available in the US East (N. Virginia), US East (Ohio), US West (Oregon), and Europe (Frankfurt) Regions. M9g and M9gd instances are available for purchase through Savings Plans, On-Demand, Spot Instances, Dedicated Instances, or Dedicated Hosts. For more information, visit Amazon EC2 pricing.

To get started with M9g and M9gd instances, several resources are available. The AWS Graviton Getting Started Guide is a technical guide covering how to build, run, and optimize workloads on Graviton-based instances. The Graviton Savings Dashboard helps you track and measure the cost savings from running workloads on Graviton-based instances. And AWS Transform is an AI-powered service that automates code transformations for migrating Java applications from x86 to Graviton-based Amazon EC2 instances, handling compatibility analysis, automated recompilation, dependency updates, and validation.

To learn more about Graviton-based instances, visit AWS Graviton Processors or Level up your compute with AWS Graviton.

— Esra

Debug deployment failures faster with the Deployments tab in AWS Elastic Beanstalk

Post Syndicated from Ben Lazar original https://aws.amazon.com/blogs/devops/debug-deployment-failures-faster-with-the-deployments-tab-in-aws-elastic-beanstalk/

Introduction

When a deployment fails, finding the root cause often means piecing together information from multiple sources. You wait for the deployment to finish, request a log bundle, download it, and then search through files like eb-engine.log and cfn-init.log to find the error. If you’re not familiar with Elastic Beanstalk’s log file structure, you might not know which file to check first, and the process can take longer than fixing the actual problem.

Elastic Beanstalk now provides a Deployments tab in the environment dashboard that gives you a consolidated view of your deployment history and real-time deployment logs. You can see what’s happening during a deployment as it runs, and when something fails, the deployment log shows you the error output directly in the console.

In this post, you create an Elastic Beanstalk environment, trigger different types of deployments, deploy a broken application to see how the Deployments tab surfaces errors, and then fix and redeploy. By the end, you’ll know how to use deployment logs to diagnose failures without connecting to instances over SSH or downloading log bundles.

Solution overview

The Deployments tab displays a history of recent deployments for your environment, including application deployments, configuration updates, and environment launches. Each deployment has a detail page with two tabs: Events, which shows a filtered timeline of events for that deployment, and Deployment Logs, which shows a consolidated log from the instance.

Deployment logs capture each step of the deployment process: dependency installation, application builds, .ebextensions commands, platform hooks, and application startup output. The logs are designed to be concise. On success, you see summary messages showing which steps ran and completed. On failure, the log includes up to 50 lines of output from the failed step, so you can see what went wrong without searching through verbose output.

During a deployment, one instance uploads its log to Amazon Simple Storage Service (Amazon S3) as the deployment progresses. The Elastic Beanstalk console reads from Amazon S3, which means you can monitor progress in real time without connecting to the instance. After the deployment completes, the console fetches the final log to ensure you see the complete output. For environments with multiple instances, the deployment log is captured from one representative instance. To view logs from all instances, use the Request Logs feature.

Prerequisites

Before getting started, ensure that you have the following:

  • An AWS account with permissions to create Elastic Beanstalk environments and associated resources (Amazon Elastic Compute Cloud (Amazon EC2) instances, Amazon S3 buckets, security groups). For the minimum AWS Identity and Access Management (IAM) permissions required, see Managing Elastic Beanstalk service roles. Follow the principle of least privilege and avoid using AWS account root or unrestricted administrator credentials.
  • The default Elastic Beanstalk instance profile, aws-elasticbeanstalk-ec2-role. New AWS accounts may not have this role created automatically. If your environment fails to launch because the role is missing, see Instance profile for Amazon EC2 instances in your Elastic Beanstalk environment.
  • A supported Elastic Beanstalk platform version. Deployment logs are available on Amazon Linux 2 and Amazon Linux 2023 platform versions released on or after March 11, 2026, and on Windows Server platform versions 2.23.0 and later.
  • AWS Command Line Interface (AWS CLI) installed and configured with appropriate permissions. See Installing the AWS CLI.
  • A Bash-compatible shell (Bash or Zsh). The commands in this walkthrough use Bash syntax (heredocs, &&, and shell variables).

Walkthrough

Follow the steps below to create an environment, explore the Deployments tab, deploy a broken application, and then fix it.

Open your terminal and set the following variables. Replace the values with your own unique Amazon S3 bucket name and the latest Node.js solution stack for your Region. This walkthrough uses us-east-1. You can substitute your preferred Region, but use the same Region consistently across all commands in the walkthrough. To find the latest solution stack, run aws elasticbeanstalk list-available-solution-stacks.

S3_BUCKET="your-unique-bucket-name"

# Replace with the latest Node.js solution stack for your Region
SOLUTION_STACK_NAME="64bit Amazon Linux 2023 v6.11.1 running Node.js 22"

Setting up the application

This walkthrough uses two versions of a Node.js application. The first version is a working HTTP server. The second version introduces a dependency on a non-existent npm package, simulating a common deployment failure where a dependency cannot be installed.

Create a project directory:

mkdir deployments-tab-demo && cd deployments-tab-demo

Create the working application file:

cat << 'EOF' > workingapp.js
const http = require('http');

const server = http.createServer((req, res) => {
  res.writeHead(200, { 'Content-Type': 'application/json' });
  res.end(JSON.stringify({ status: 'healthy', message: 'App is running' }));
});

const port = process.env.PORT || 8080;
server.listen(port, () => {
  console.log(`Server running on port ${port}`);
});
EOF

Create the working package.json:

cat << 'EOF' > working-package.json
{
  "name": "deployments-tab-demo",
  "version": "1.0.0",
  "description": "Sample app for Deployments tab walkthrough",
  "main": "app.js",
  "scripts": {
    "start": "node app.js"
  }
}
EOF

Create the broken package.json with a non-existent dependency:

cat << 'EOF' > broken-package.json
{
  "name": "deployments-tab-demo",
  "version": "2.0.0",
  "description": "Sample app for Deployments tab walkthrough",
  "main": "app.js",
  "scripts": {
    "start": "node app.js"
  },
  "dependencies": {
    "this-package-does-not-exist-abc123": "^1.0.0"
  }
}
EOF

Create the working application source bundle:

cp workingapp.js app.js
cp working-package.json package.json
zip -r nodejs-working-app.zip app.js package.json

Create the broken application source bundle:

cp broken-package.json package.json
zip -r nodejs-broken-app.zip app.js package.json

Step 1: Create an environment and explore the Deployments tab

Create an Amazon S3 bucket and upload the source bundles. This walkthrough uses default bucket settings for simplicity. For production workloads, enable server-side encryption and restrict bucket access to only the principals that need it.

aws s3 mb s3://$S3_BUCKET --region us-east-1

aws s3 cp nodejs-working-app.zip s3://$S3_BUCKET/nodejs-working-app.zip
aws s3 cp nodejs-broken-app.zip s3://$S3_BUCKET/nodejs-broken-app.zip

Create the Elastic Beanstalk application and the working version:

aws elasticbeanstalk create-application \
--application-name deployments-tab-demo \
--description "Deployments tab walkthrough" \
--region us-east-1

aws elasticbeanstalk create-application-version \
--application-name deployments-tab-demo \
--version-label v1-working \
--source-bundle S3Bucket="$S3_BUCKET",S3Key="nodejs-working-app.zip" \
--region us-east-1

Create the environment:

aws elasticbeanstalk create-environment \
--application-name deployments-tab-demo \
--environment-name deployments-tab-demo-env \
--solution-stack-name "$SOLUTION_STACK_NAME" \
--version-label v1-working \
--option-settings \
Namespace=aws:elasticbeanstalk:environment,OptionName=EnvironmentType,Value=SingleInstance \
Namespace=aws:autoscaling:launchconfiguration,OptionName=IamInstanceProfile,Value=aws-elasticbeanstalk-ec2-role \
--region us-east-1

Don’t wait for the environment to finish creating. Instead, open the Elastic Beanstalk console right away, navigate to your environment, and choose the Deployments tab.

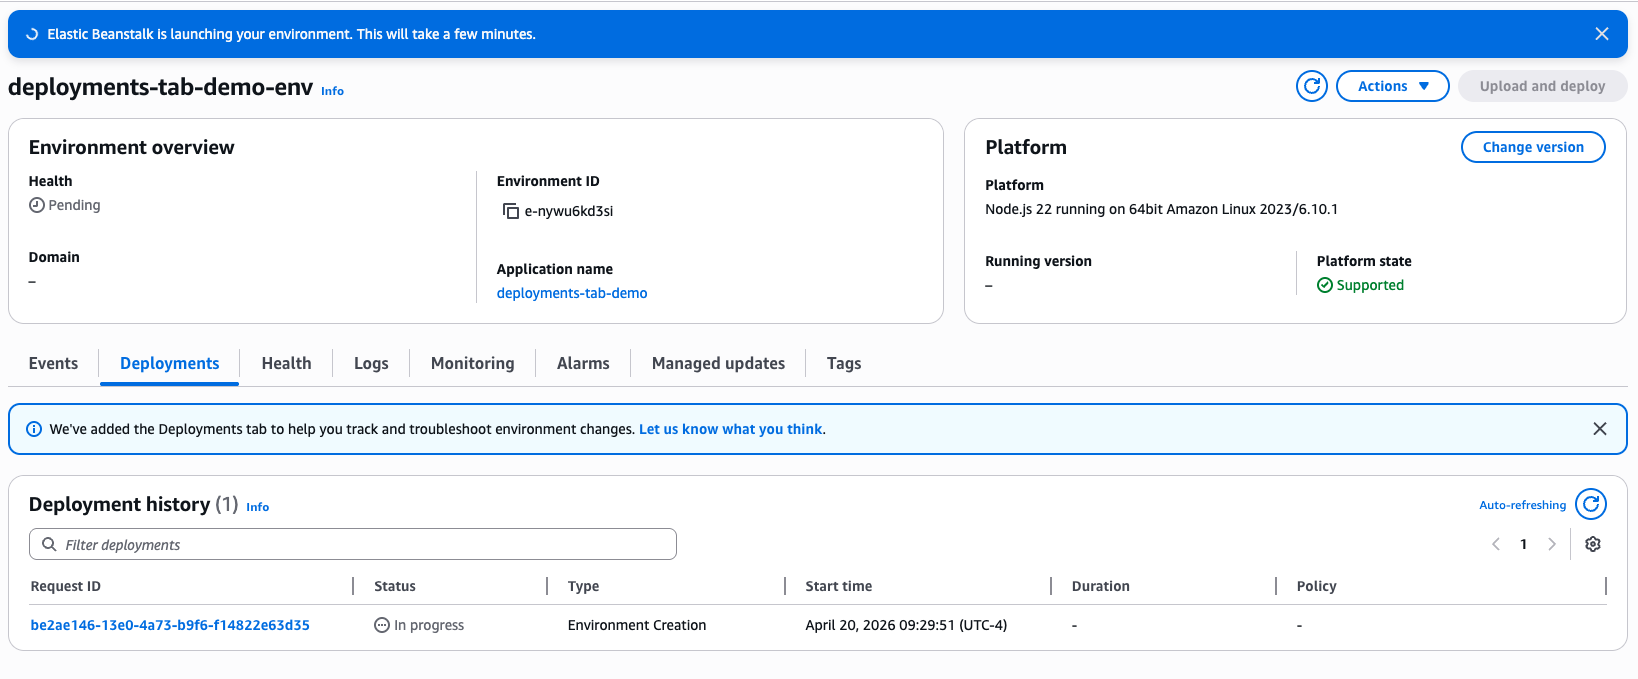
You should see one deployment in the history table with a status of In Progress and a type of Environment Creation. The table also shows the request ID, start time, and duration (which updates as the deployment runs). Choose the Request ID link to open the deployment detail page.

Elastic Beanstalk environment overview page showing the new Deployments tab selected, with a Deployment history table listing one in-progress Environment Creation deployment.

Figure 1 – Deployments tab history table showing the in-progress Environment Creation deployment

The detail page has a summary section with the deployment metadata and two tabs below it:

  • Events shows a filtered timeline of events for this deployment. As the environment creation progresses, new events appear automatically.
  • Deployment Logs shows the consolidated deployment log from the instance.

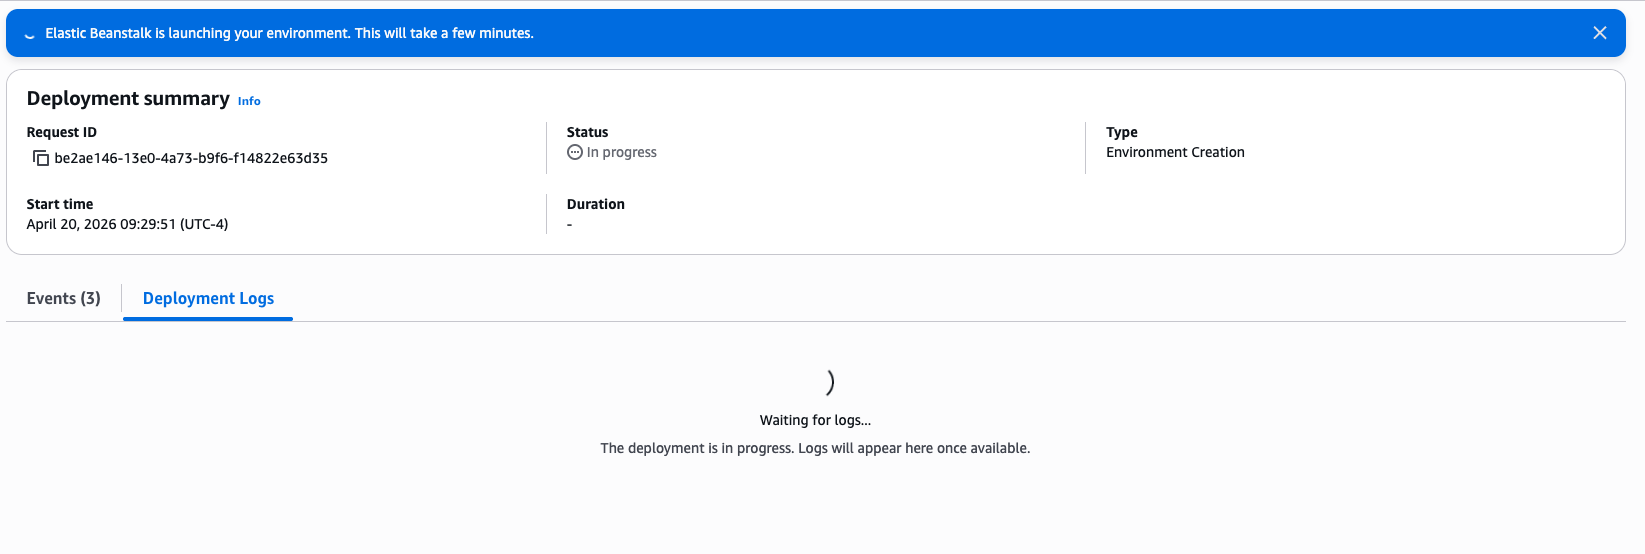
Select the Deployment Logs tab. At first, the tab may show a message indicating that the log is not yet available. This is expected. The deployment log is written on the EC2 instance and uploaded to Amazon S3, so it won’t appear until the instance launches and begins the deployment process. Once the instance is running, log entries start appearing and the tab refreshes automatically to show new entries as they are written. You can watch dependency installation, platform hooks, and application startup happen in real time.

Deployment details page showing a Deployment summary card (Request ID, Status: In progress, Type: Environment Creation) with the Deployment Logs tab selected and a "Waiting for logs..." placeholder.

Figure 2 – Deployment Logs tab showing “log not yet available” message during early environment creation

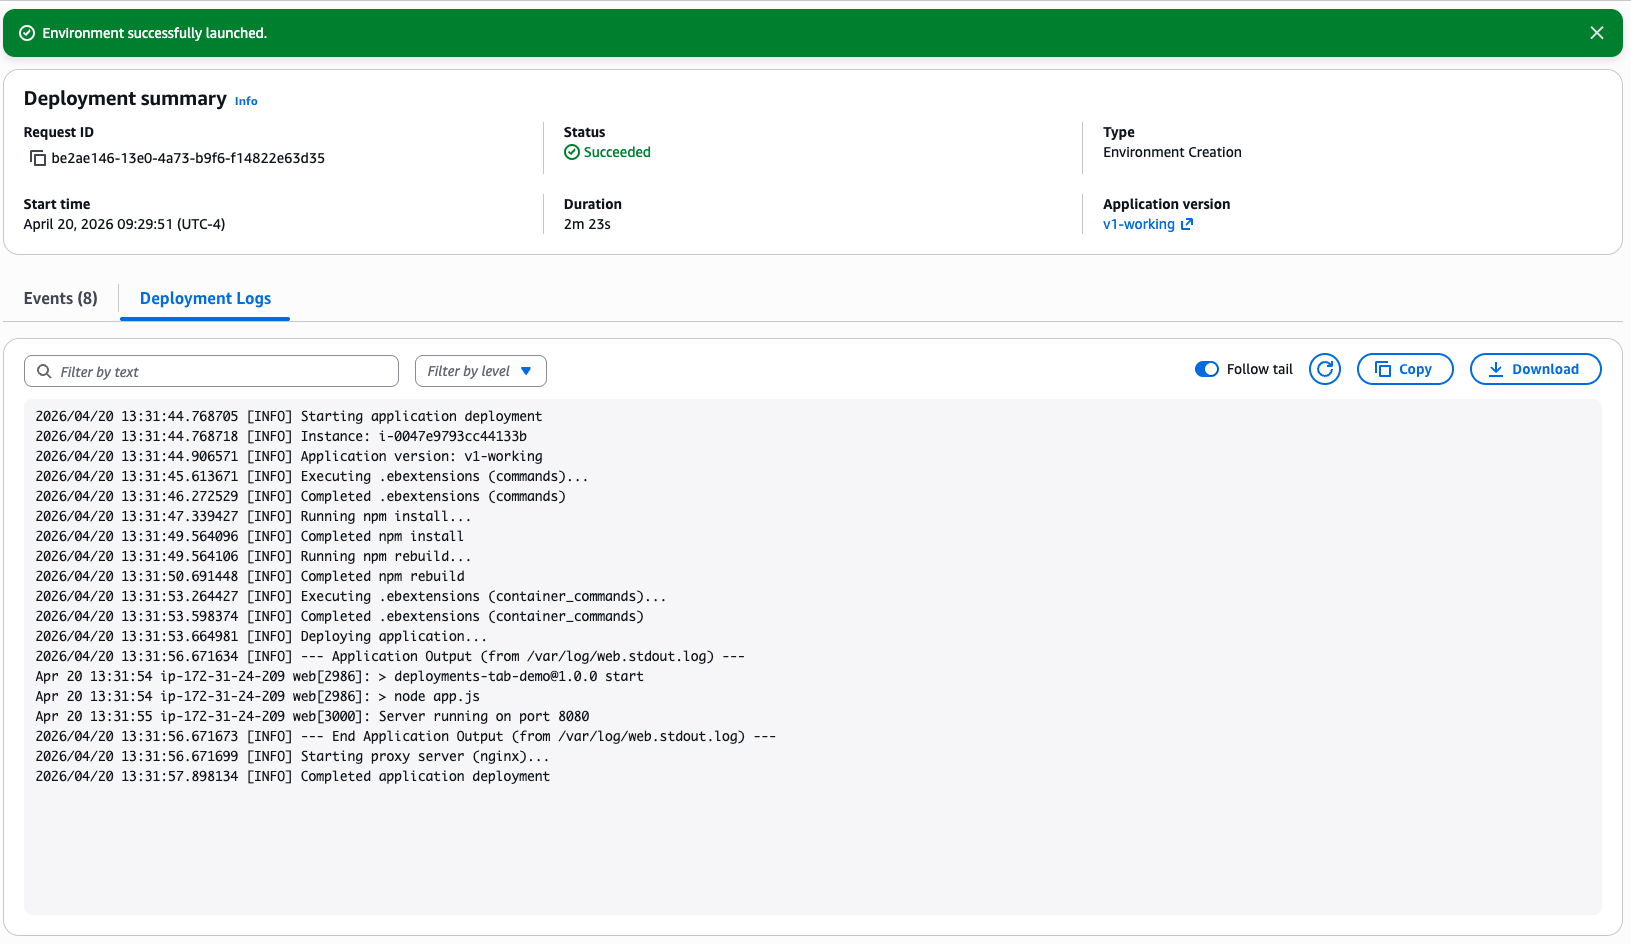
After the environment creation completes, the deployment status changes to Succeeded and the log shows the final state. Because this deployment succeeded, the log contains only summary messages for each step. Take notice of how the log captures each phase of the deployment in order: .ebextensions commands, dependency installation (npm), container commands, and then the application startup. Pay attention to the Application Output section near the end of the log. It shows the initial stdout from your application process, confirming that it started and is listening on the expected port. This section is useful for verifying that your application launched correctly after a deployment.

You can also check the environment status from the CLI:

aws elasticbeanstalk describe-environments \
--environment-names deployments-tab-demo-env \
--query 'Environments[0].{Status:Status,Health:Health}' \
--region us-east-1
Successful deployment details page with green "Environment successfully launched" banner, Deployment summary showing Status: Succeeded, and the Deployment Logs tab displaying streamed eb-engine and eb-hooks log entries.

Figure 3 – Deployment detail page showing the completed Deployment Logs tab with successful log output

Step 2: Trigger a configuration update

To see how different deployment types appear in the Deployments tab, add an environment variable to your environment:

aws elasticbeanstalk update-environment \
--environment-name deployments-tab-demo-env \
--option-settings \
Namespace=aws:elasticbeanstalk:application:environment,OptionName=APP_ENV,Value=production \
--region us-east-1

While the update is in progress, go back to the Deployments tab in the console. You should see a second deployment appear in the history with a status of In Progress and a type of Environment Update. Choose the request ID to open the detail page, and select the Deployment Logs tab. The log updates automatically as new entries are written, so you can watch the deployment progress in real time.

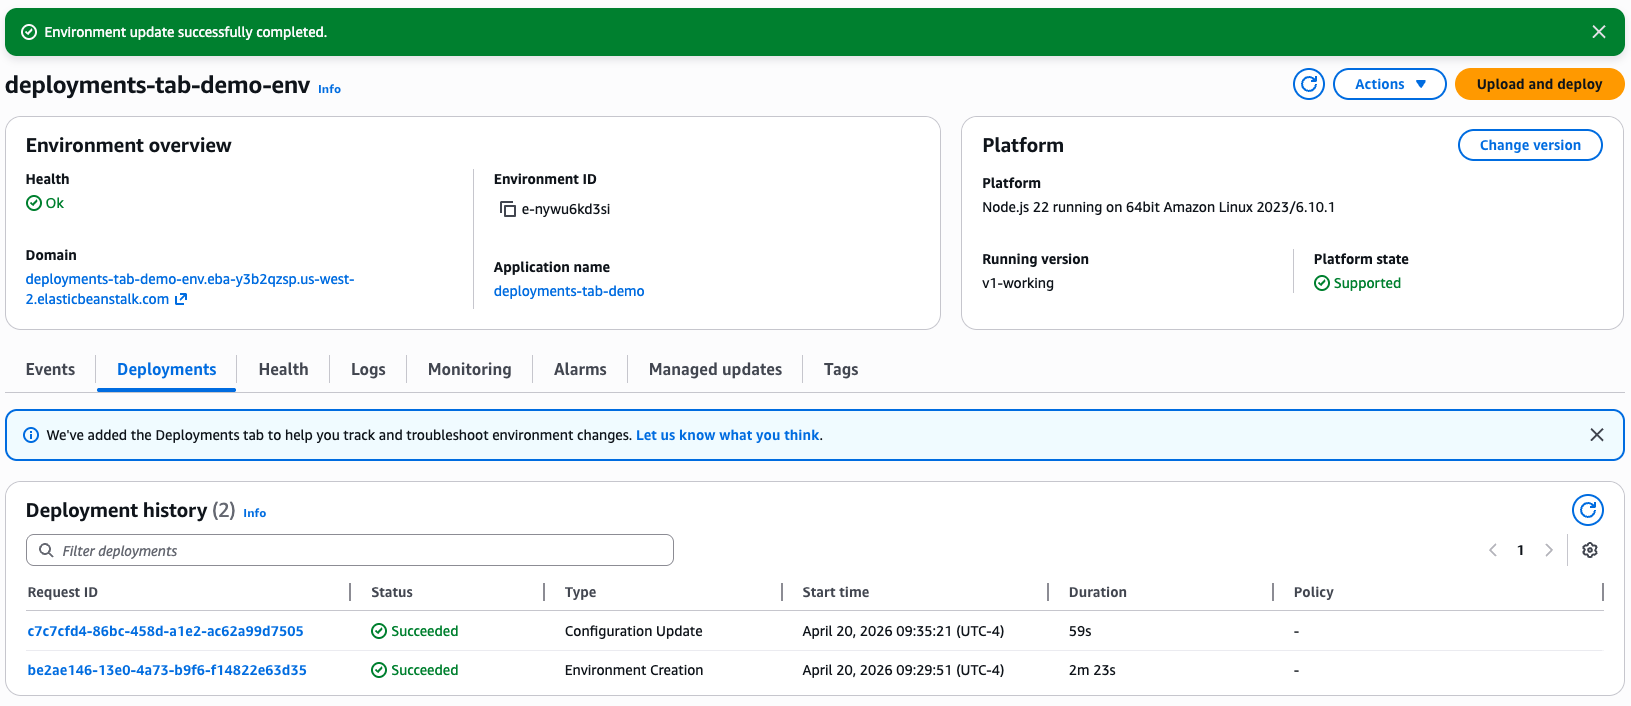
After the update completes, the deployment status changes to Succeeded. You now have two deployments in your history, each with its own type and duration.

Elastic Beanstalk environment page after a successful configuration update, showing Health: Ok and a Deployment history table with two Succeeded entries: a Configuration Update and an Environment Creation.

Figure 4 – Deployments tab showing two deployments: Environment Creation and Environment Update

Step 3: Deploy a broken application

This is where the Deployments tab shows its value. Create and deploy a broken application version that references a non-existent npm package:

aws elasticbeanstalk create-application-version \
--application-name deployments-tab-demo \
--version-label v2-broken \
--source-bundle S3Bucket="$S3_BUCKET",S3Key="nodejs-broken-app.zip" \
--region us-east-1

aws elasticbeanstalk update-environment \
--environment-name deployments-tab-demo-env \
--version-label v2-broken \
--region us-east-1

As soon as the deployment starts, go back to the Deployments tab in the console. You should see a new Application Deployment with a status of In Progress. Choose the request ID to open the deployment detail page and select the Deployment Logs tab.

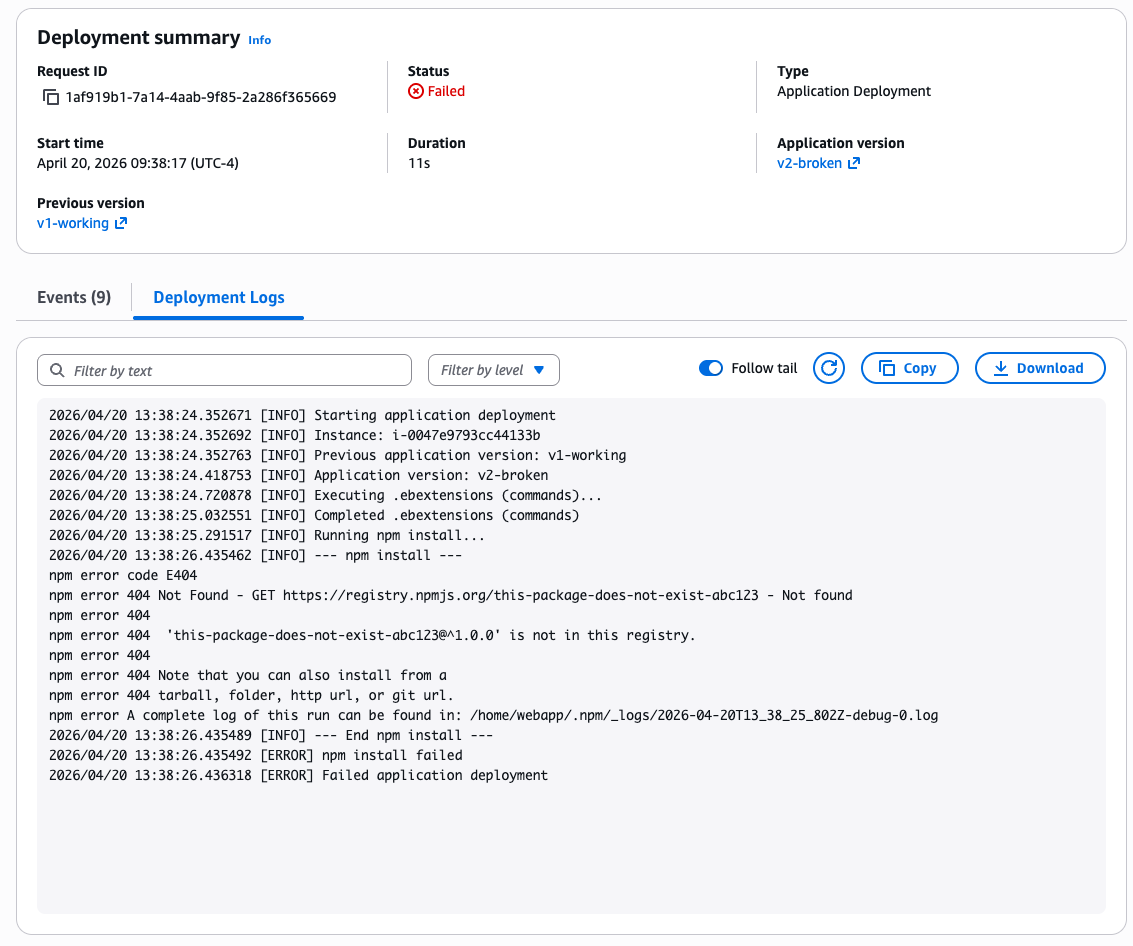
Watch as the log streams in real time. You will see the deployment start, .ebextensions commands run, and then npm install begin. Shortly after, the error appears with the relevant output from the failed step, showing the exact npm error indicating that the package could not be found. The deployment status changes to Failed.

Elastic Beanstalk automatically rolls back to the previous working version, so your environment returns to a healthy state. Without the Deployments tab, diagnosing what went wrong would still require requesting a log bundle, downloading it, extracting it, and searching through the log files. With the Deployments tab, the diagnosis is immediate. There is no need to connect to the instance via SSH or download log bundles. The error is right there in the console.

Deployment details page for a failed Application Deployment, showing Status: Failed in the summary and Deployment Logs containing yum package errors ("No package eb-noti-abc123-1.0.0 available").

Figure 5 – Deployment detail page showing the failed deployment error and npm install output

Compare this to the successful deployment logs from Step 1. The successful log showed only summary messages. The failed log automatically includes the detailed error output. This smart verbosity means you don’t have to search through verbose logs on success, but you get the detail you need on failure.

Step 4: Deploy a fixed version

Although Elastic Beanstalk rolled back to the working version automatically, let’s deploy it explicitly to see what a successful application deployment log looks like after a failure:

aws elasticbeanstalk update-environment \
--environment-name deployments-tab-demo-env \
--version-label v1-working \
--region us-east-1

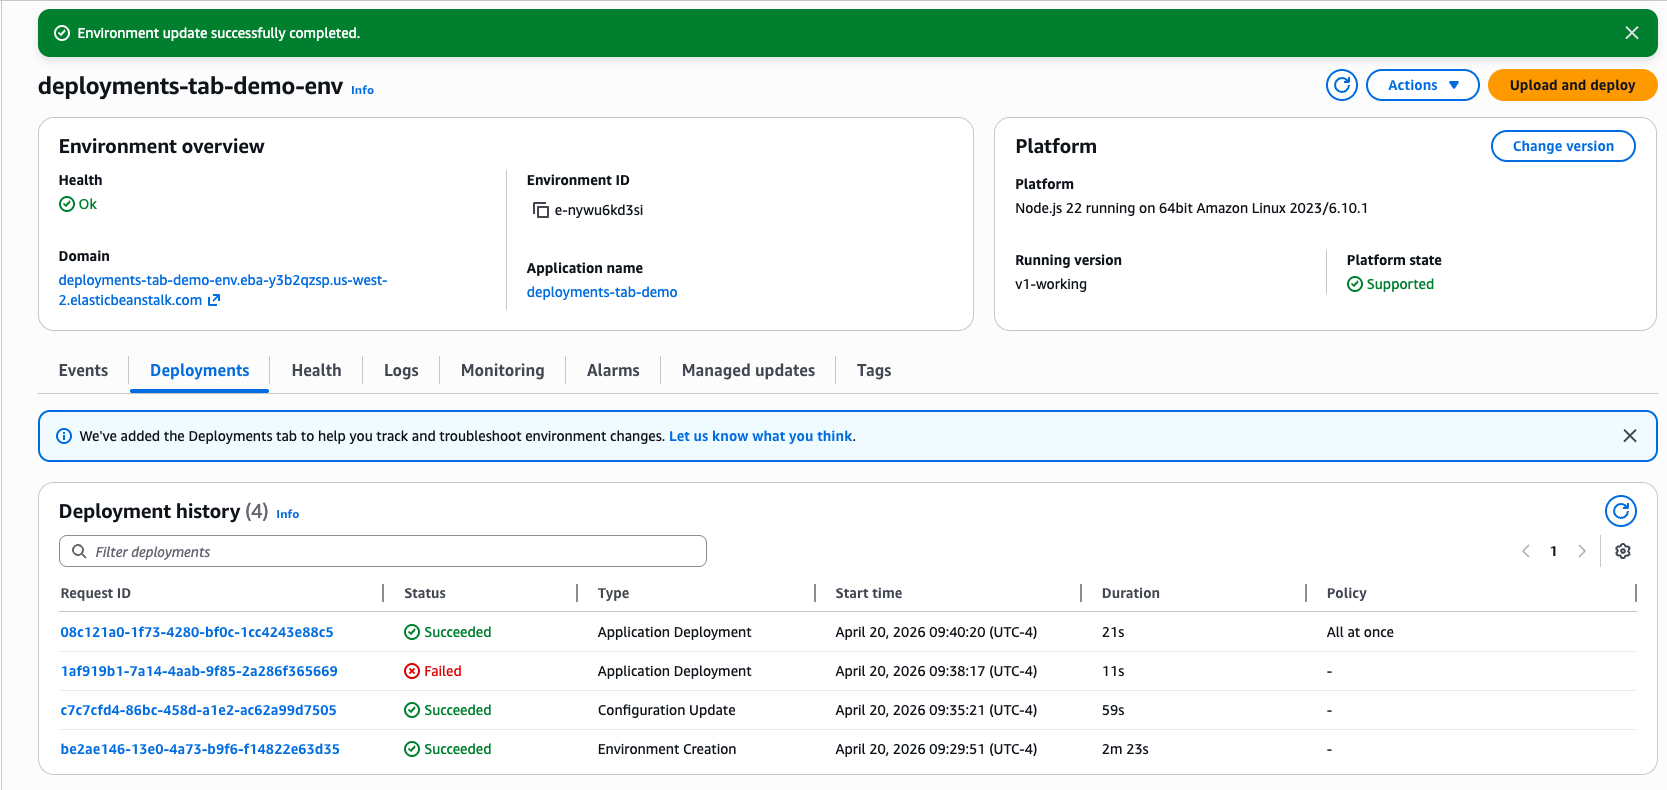
After the deployment completes, open the deployment detail page from the Deployments tab. The deployment log shows only summary messages for each step. The npm step completes without errors, the application starts, and the deployment finishes. Compare this to the failed deployment log from Step 3, where the error and detailed npm output appeared automatically.

Elastic Beanstalk environment Deployments tab showing a Deployment history of four entries — two Application Deployments (one Succeeded, one Failed), one Configuration Update, and one Environment Creation.

Figure 6 – Deployments tab showing all four deployments with their statuses

Cleaning up

To avoid ongoing charges, terminate the environment and delete the associated resources.

Terminate the environment:

aws elasticbeanstalk terminate-environment \
--environment-name deployments-tab-demo-env \
--region us-east-1

Delete the application (after the environment is terminated):

aws elasticbeanstalk delete-application \
--application-name deployments-tab-demo \
--terminate-env-by-force \
--region us-east-1

Delete the S3 bucket used for source bundles:

aws s3 rb s3://$S3_BUCKET --force --region us-east-1

Remove the local project directory. Before running the following command, make sure your current working directory is not inside deployments-tab-demo:

rm -rf deployments-tab-demo

Conclusion

The Deployments tab in AWS Elastic Beanstalk gives you a single place to view your deployment history and read deployment logs, including while a deployment is still running. When a deployment fails, the log shows you the error output from the failed step directly in the console, so you can identify the root cause without connecting to instances over SSH or downloading log bundles.

Deployment logs are available on Amazon Linux 2 and Amazon Linux 2023 platform versions released on or after March 11, 2026, and on Windows Server platform versions 2.23.0 and later, in all AWS Commercial Regions and AWS GovCloud (US) Regions. To get started, update your environment to a supported platform version and navigate to the Deployments tab in the Elastic Beanstalk console.

To learn more about deployment logs, see Viewing deployment logs in the AWS Elastic Beanstalk Developer Guide. For more information about AWS Elastic Beanstalk, visit the product page.

Ben Lazar

Ben Lazar is a Software Development Engineer II at Amazon Web Services (AWS) on the Elastic Beanstalk team. He maintains the Elastic Beanstalk platforms that customers use to run their web applications.

Building highly available Oracle databases with Amazon FSx for NetApp ONTAP

Post Syndicated from Vignyanand Penumatcha original https://aws.amazon.com/blogs/architecture/building-highly-available-oracle-databases-with-amazon-fsx-for-netapp-ontap/

Oracle databases power mission-critical enterprise applications, making their continuous availability essential for business operations. Traditional Oracle high availability (HA) solutions require complex clustering software, expensive shared storage arrays, and specialized database administration teams. These conventional approaches often introduce single points of failure while demanding significant operational overhead.

Modern cloud architectures offer a transformative approach that combines Amazon FSx for NetApp ONTAP (FSxN) with Amazon EC2 Auto Scaling groups, automated AMI creation, AWS Lambda-driven orchestration, and AWS Systems Manager Parameter Store (SSM Parameter). This solution removes traditional Oracle HA complexities while delivering enterprise-grade availability, automated recovery, and makes sure new instances launch with the latest Oracle configuration.

This post shows how to build a highly available Oracle database architecture using FSxN shared storage, Auto Scaling groups with dynamic AMI updates, and serverless orchestration to help reduce recovery times with current configurations.

Solution overview

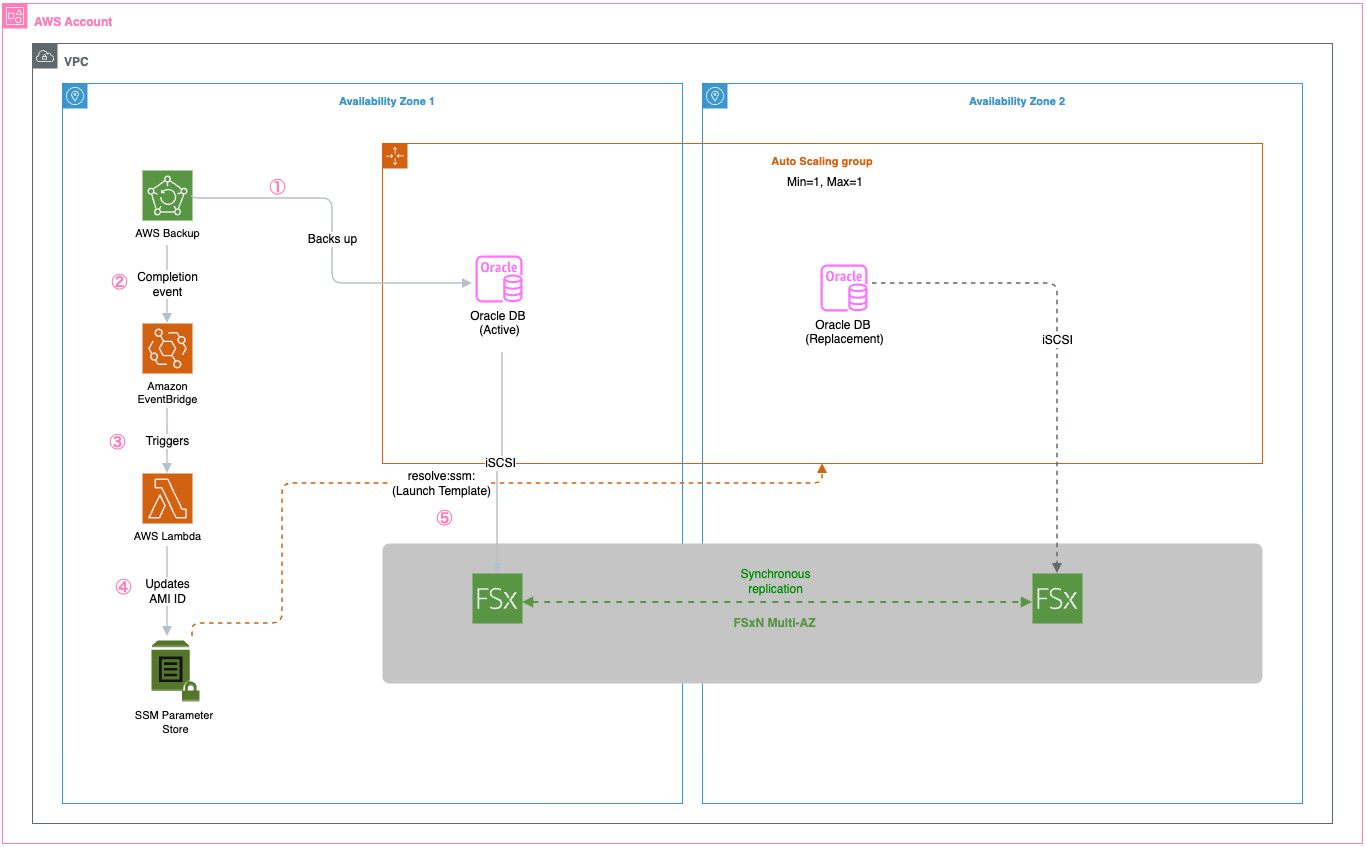
The solution uses multiple AWS services working together to create a comprehensive high availability architecture. FSxN Multi-AZ provides persistent shared storage spanning availability zones for Oracle database files, software, and configurations, so that data remains accessible when EC2 instances are replaced. Auto Scaling groups deliver automated instance lifecycle management with the latest AMI configurations, so failed instances are quickly replaced with identical configurations that can immediately access the existing Oracle database files on FSxN. AWS Backup creates AMIs that capture the latest Oracle host configurations including patches and settings, preserving the complete server state for consistent deployments. AWS Lambda extracts the AMI ID from backup recovery points and updates the SSM Parameter, orchestrating the entire configuration management workflow. Systems Manager Parameter Store stores the current AMI ID for Auto Scaling group launch templates, so new instances always launch with the most recent configuration and can immediately connect to the Oracle database on shared storage.

The following diagram shows the complete architecture with all AWS services and their interactions:

AWS architecture diagram showing Oracle Database disaster recovery across two Availability Zones using FSx for ONTAP synchronous replication, AWS Backup automation with EventBridge and Lambda, and Auto Scaling group with SSM Parameter Store for AMI management.

Key benefits include:

  • Recovery Time Objective (RTO): Can help achieve 2–5 minutes with latest Oracle configuration
  • Recovery Point Objective (RPO): Near-zero through synchronous Multi-AZ replication
  • Configuration consistency: New instances launch with identical Oracle host setup
  • Automated AMI management: Scheduled AMI creation with Parameter Store updates

Walkthrough

This walkthrough demonstrates implementing Oracle HA using Amazon FSx for NetApp ONTAP shared storage, AWS Backup-driven AMI creation, Lambda orchestration, and Auto Scaling groups with Parameter Store integration for configuration consistency and automated failover.

Prerequisites

For this walkthrough, you should have the following prerequisites:

  • An AWS account with appropriate permissions for Amazon FSx, Auto Scaling, EC2, Lambda, and Systems Manager
  • A VPC with subnets in at least two Availability Zones
  • Oracle database software

Keep in mind that customers are responsible for their own Oracle licensing compliance.

  • An EC2 instance with Oracle database installed and configured
  • AWS Identity and Access Management (IAM) roles for AMI creation and cross-service communication
  • Basic knowledge of Oracle database administration and AWS automation

Assumptions

This post is a conceptual illustration of the architecture. Your specific implementation will vary based on your VPC layout, Oracle version, storage requirements, and organizational security policies.

We assume the reader is familiar with:

  • Creating and configuring Amazon FSx for NetApp ONTAP file systems through the AWS console
  • iSCSI concepts including initiators, targets, and multipath I/O
  • Oracle database startup and shutdown procedures
  • AWS Backup, Lambda, and Auto Scaling group fundamentals

For detailed step-by-step instructions on specific AWS services, refer to the additional resources section.

Step 1: Create an Amazon FSx for NetApp ONTAP file system

FSxN Multi-AZ provides the persistent shared storage foundation for this architecture. Unlike Amazon Elastic Block Store (Amazon EBS) volumes, which are bound to a single AZ, FSxN Multi-AZ replicates data synchronously across two AZs with automatic failover. This means that when an EC2 instance is replaced (whether in the same AZ or a different one), the new instance can immediately access the existing Oracle database files without restoring from backup.

To create the file system, navigate to the Amazon FSx console and select Amazon FSx for NetApp ONTAP as the file system type.

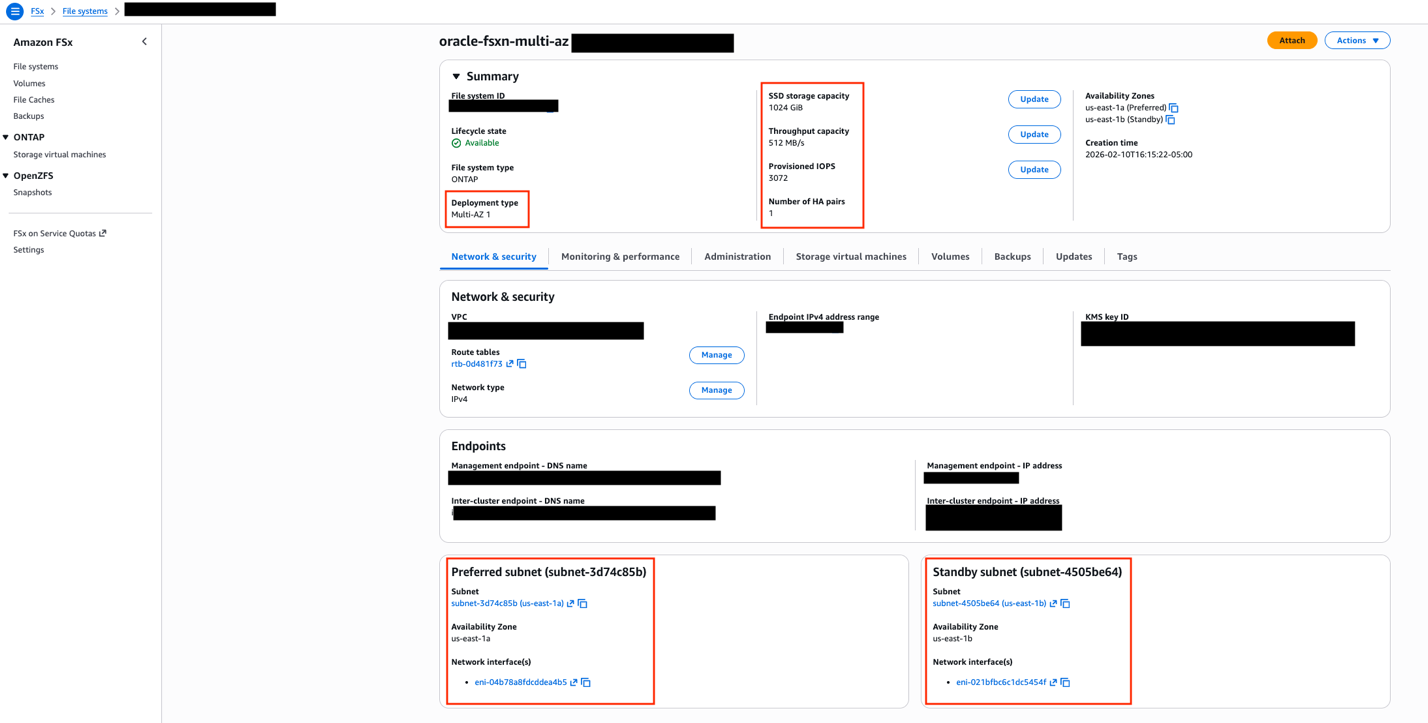
The critical configuration choice is selecting Multi-AZ deployment, which places an active file server in one AZ and a standby in another.

Amazon FSx console showing oracle-fsxn-multi-az file system configuration with ONTAP Multi-AZ 1 deployment, 1024 GiB SSD storage, 512 MB/s throughput, spanning us-east-1a preferred and us-east-1b standby subnets.

FSxN console showing Multi-AZ deployment type selection with preferred and standby subnets in separate availability zones.

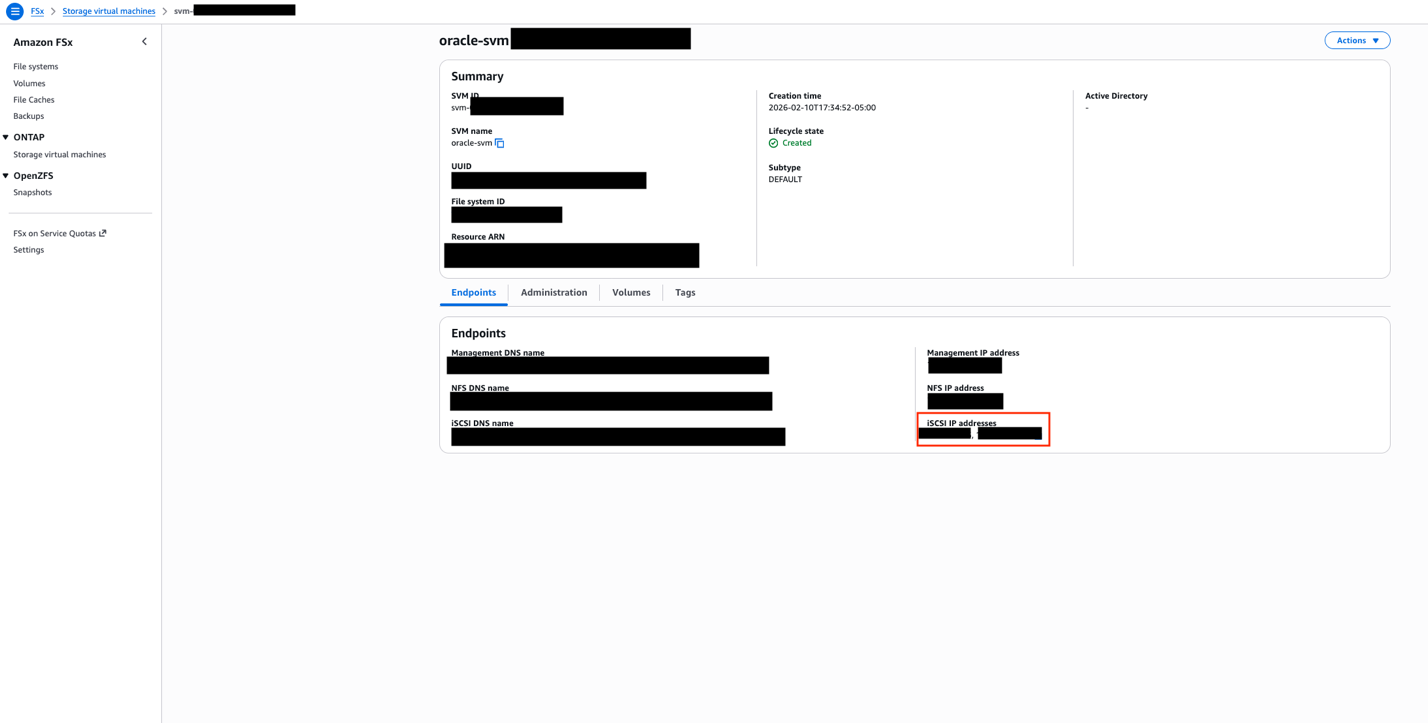
After the file system is created, you need to set up a Storage Virtual Machine (SVM), which acts as a logical storage container providing data access to your Oracle instances. The SVM creation is done from the FSx console under your file system’s details.With the SVM in place, the next step is configuring iSCSI access. FSxN exposes iSCSI endpoints—these are IP addresses (one per AZ) that your EC2 instances use to connect to the storage over the iSCSI protocol. You can find these endpoint addresses in the FSx console under your SVM’s Endpoints tab.

Amazon FSx Storage Virtual Machine configuration page showing oracle-svm with Created lifecycle state, NFS, iSCSI, and management endpoints for Oracle Database storage connectivity.

SVM Endpoints tab showing iSCSI endpoint IP addresses for each availability zone. These addresses are used in the EC2 instance’s iSCSI discovery configuration.

The iSCSI setup involves creating iGroups (which define which EC2 instances can access the storage) and LUNs (logical storage units mapped to those groups) through the NetApp ONTAP CLI. On the EC2 side, you configure the iSCSI initiator to discover and connect to the FSxN endpoints, then mount the resulting block devices. Using multipath I/O with both endpoints makes sure that Oracle data remains accessible even during an AZ failover. For detailed iSCSI configuration steps, see mounting iSCSI LUNs on Linux clients.

A dedicated security group is required for FSxN access. At minimum, the security group must allow inbound traffic on ports 111 (NFS portmapper), 635 (NFS mountd), 2049 (NFS), 3260 (iSCSI), 4045–4046 (NFS lock), 443 (HTTPS for management), and 22 (SSH for ONTAP CLI). Restrict the source to only your Oracle EC2 instances’ security group.

Step 2: Set up AWS Backup for EC2 instance protection

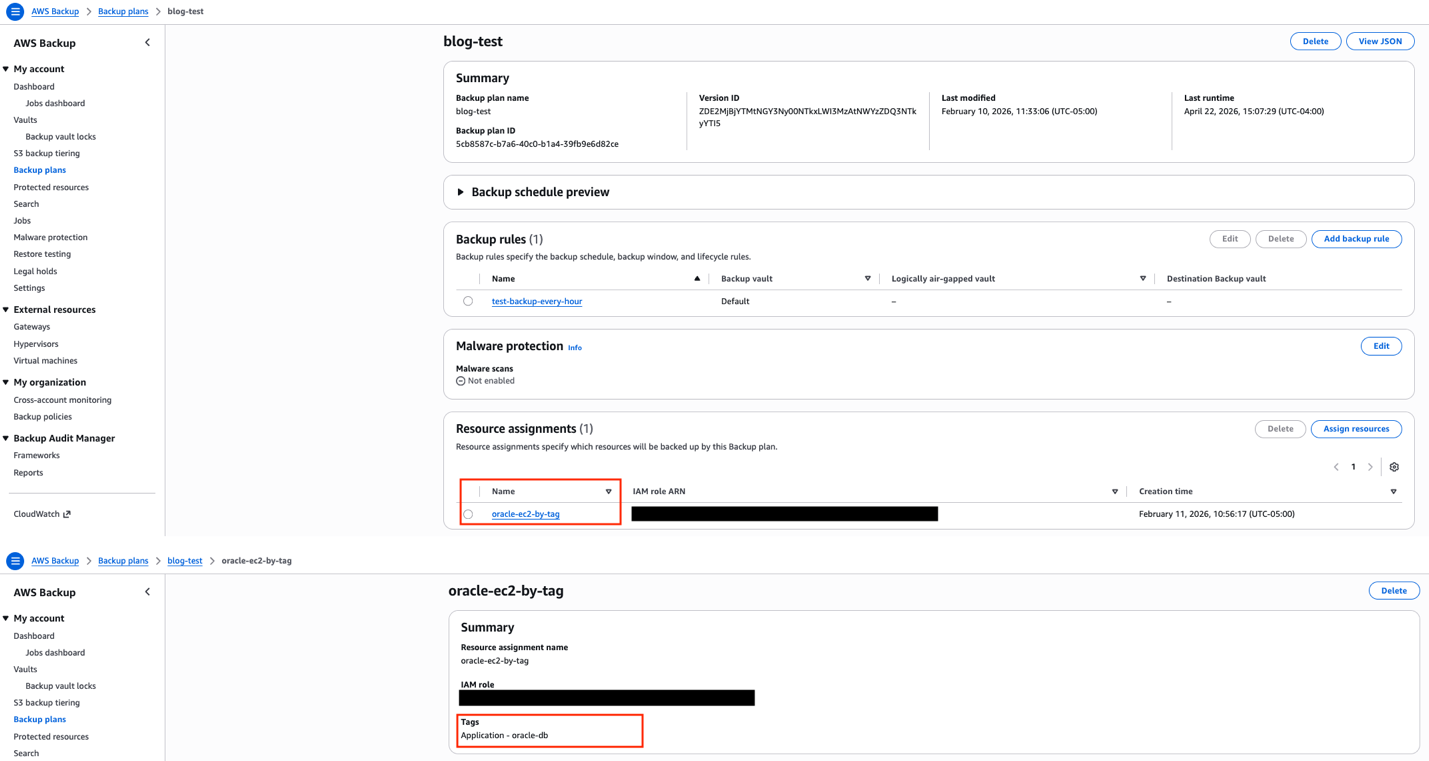
AWS Backup captures the complete state of your Oracle EC2 instance. The key design choice here is using tag-based resource selection rather than specifying instance IDs directly. Because Auto Scaling groups replace instances (and generate new instance IDs), tag-based selection makes sure that any new instance with the correct tags are automatically included in the backup plan.Configure a backup plan with a frequency appropriate for your environment and set the resource assignment to select EC2 instances matching your application tag (for example, ‘Application: Oracle’).

AWS Backup console showing blog-test backup plan with hourly backup rule targeting Oracle EC2 instances identified by the Application:oracle-db tag.

AWS Backup resource assignment configured with tag-based selection. Any EC2 instances tagged with the application tag are automatically included in the backup plan.

Step 3: Configure Lambda for AMI management

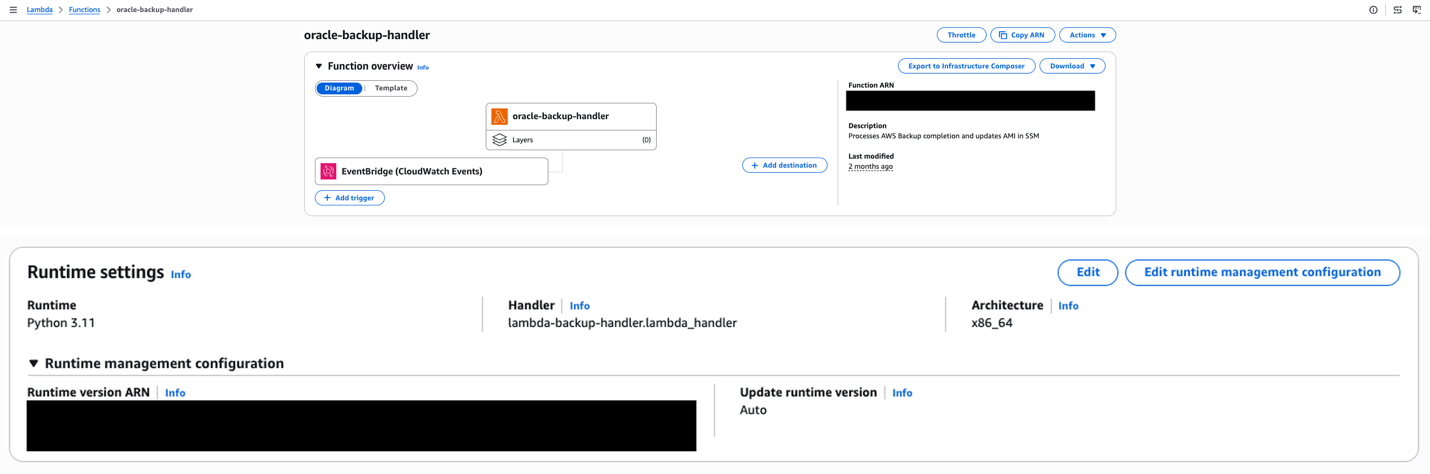
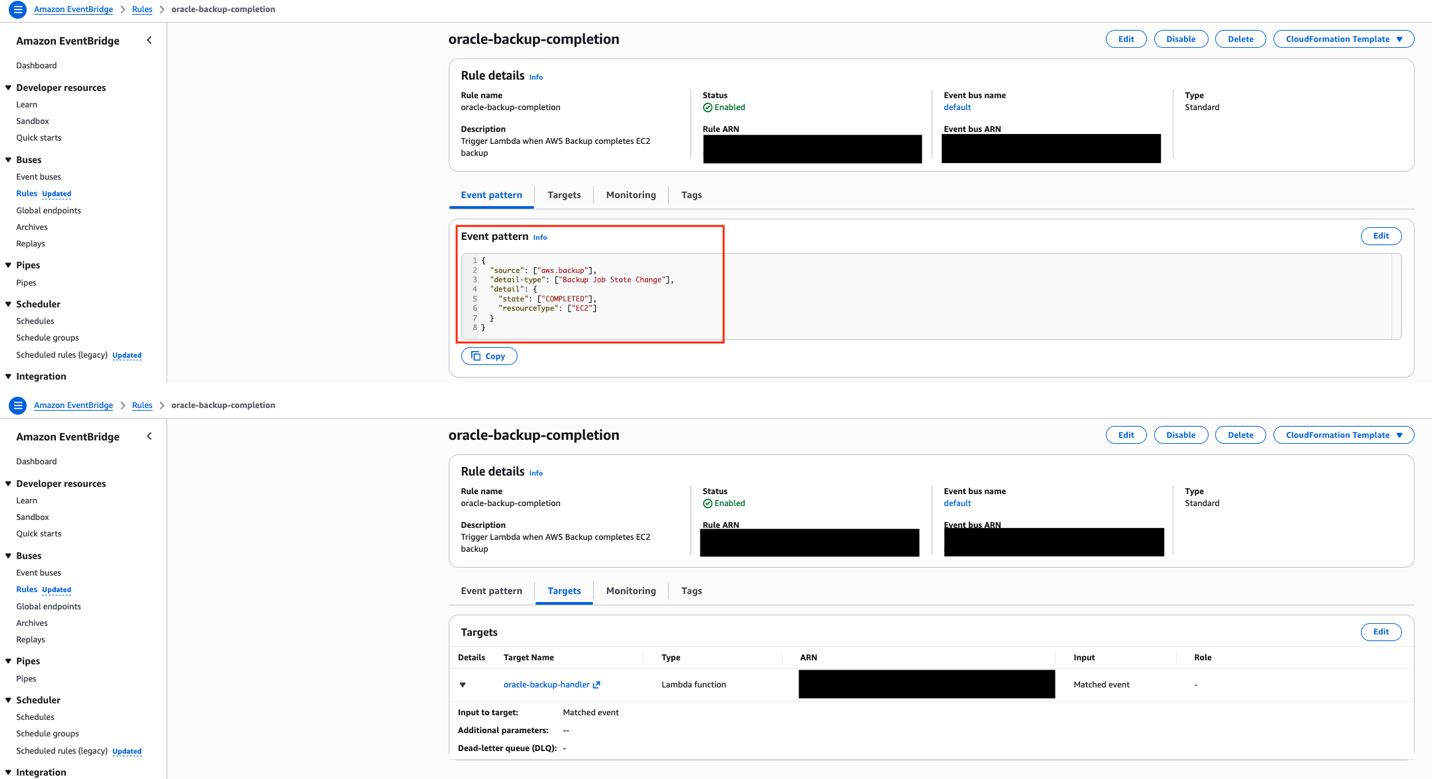
When AWS Backup completes an EC2 backup, it creates an AMI as the recovery point. An Amazon EventBridge rule detects this completion event and triggers a Lambda function. The function extracts the AMI ID from the backup recovery point, updates the SSM Parameter Store parameter with the new AMI ID, and cleans up older AMIs to control storage costs.

AWS Lambda function configuration for oracle-backup-handler showing Python 3.11 runtime, EventBridge trigger, and description indicating it processes AWS Backup completion events and updates AMI in SSM.

Lambda function overview showing the EventBridge trigger, Python 3.11 runtime, and function description indicating its role in processing backup completions and updating AMI references in SSM.

This event-driven approach means the latest AMI is available without manual intervention. The Lambda function needs IAM permissions for EC2 (to manage AMIs), SSM (to update the parameter), and Backup (to read recovery point metadata).

Amazon EventBridge rule oracle-backup-completion configured to trigger the oracle-backup-handler Lambda function when AWS Backup completes an EC2 backup job, with event pattern filtering for COMPLETED state.

EventBridge rule configured to match AWS Backup job completion events for EC2 resources, with the Lambda function as the target.

Step 4: Configure the Systems Manager Parameter Store

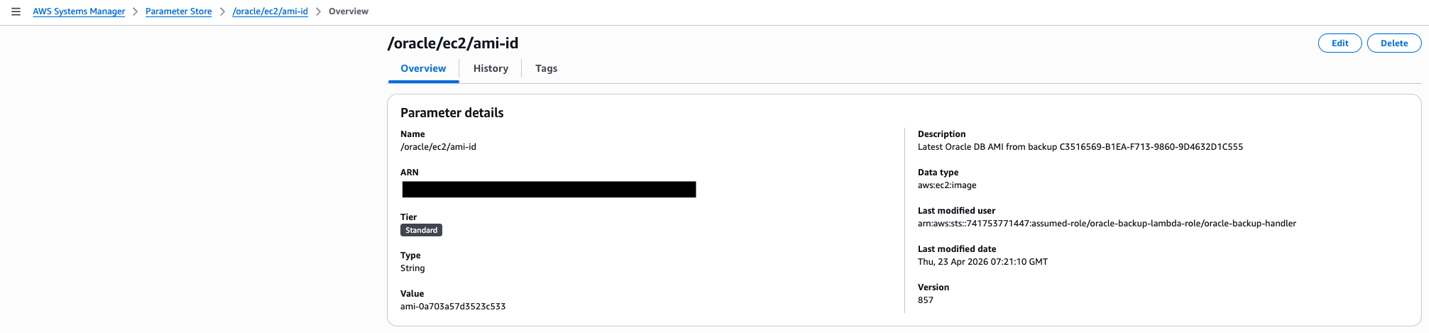
The SSM Parameter Store holds the current AMI ID that the Auto Scaling group’s launch template references. The parameter is created with the aws:ec2:image data type, which enables the launch template’s resolve:ssm: functionality, a feature that allows the launch template to dynamically resolve the AMI ID at instance launch time without requiring a template version update.

AWS Systems Manager Parameter Store showing /oracle/ec2/ami-id parameter with AMI value ami-0a705a7d5523c555, version 857, last modified by the oracle-backup-lambda-role on April 25, 2026.

SSM Parameter Store showing the /oracle/ec2/ami-id parameter with aws:ec2:image data type. The “Last modified user” confirms the Lambda function is automatically updating this parameter after each backup cycle.

When Lambda updates this parameter after each backup cycle, the next instance launched by the Auto Scaling group will automatically use the latest AMI. This removes the operational burden of manually updating launch template versions.

Step 5: Set up an Auto Scaling Group with dynamic AMI

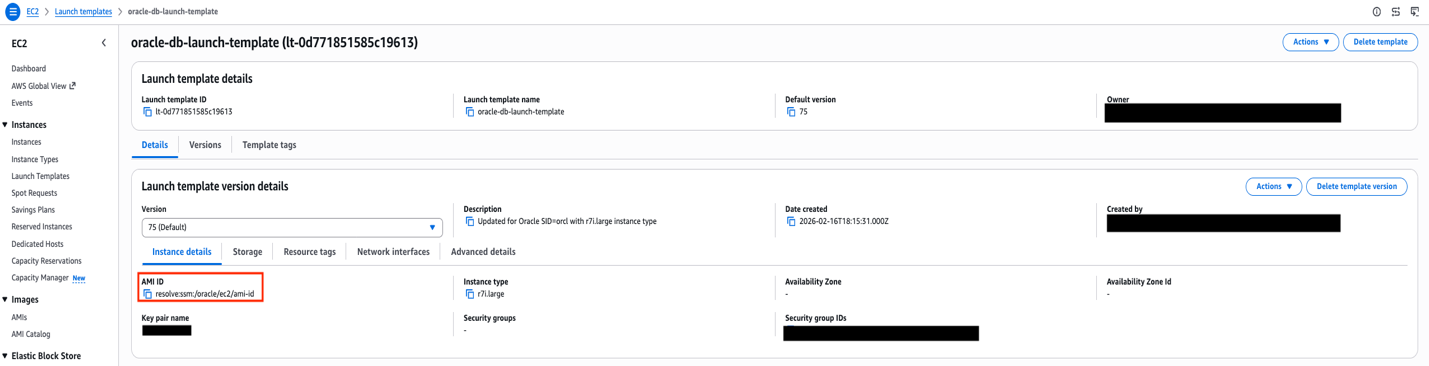
The launch template references the SSM parameter using the resolve:ssm: prefix for the AMI ID field. This is the mechanism that ties the entire automation pipeline together. The mechanism backups trigger AMI creation, AMI IDs flow into Parameter Store, and the launch template resolves the latest AMI at launch time.

EC2 Launch Template oracle-db-launch-template version 75 showing AMI ID resolved from SSM parameter resolve:ssm:/oracle/ec2/ami-id with r7i.large instance type for Oracle Database deployment.

Launch template AMI configuration showing the ‘resolve:ssm:’ prefix, which dynamically retrieves the latest AMI ID from Parameter Store at instance launch time.

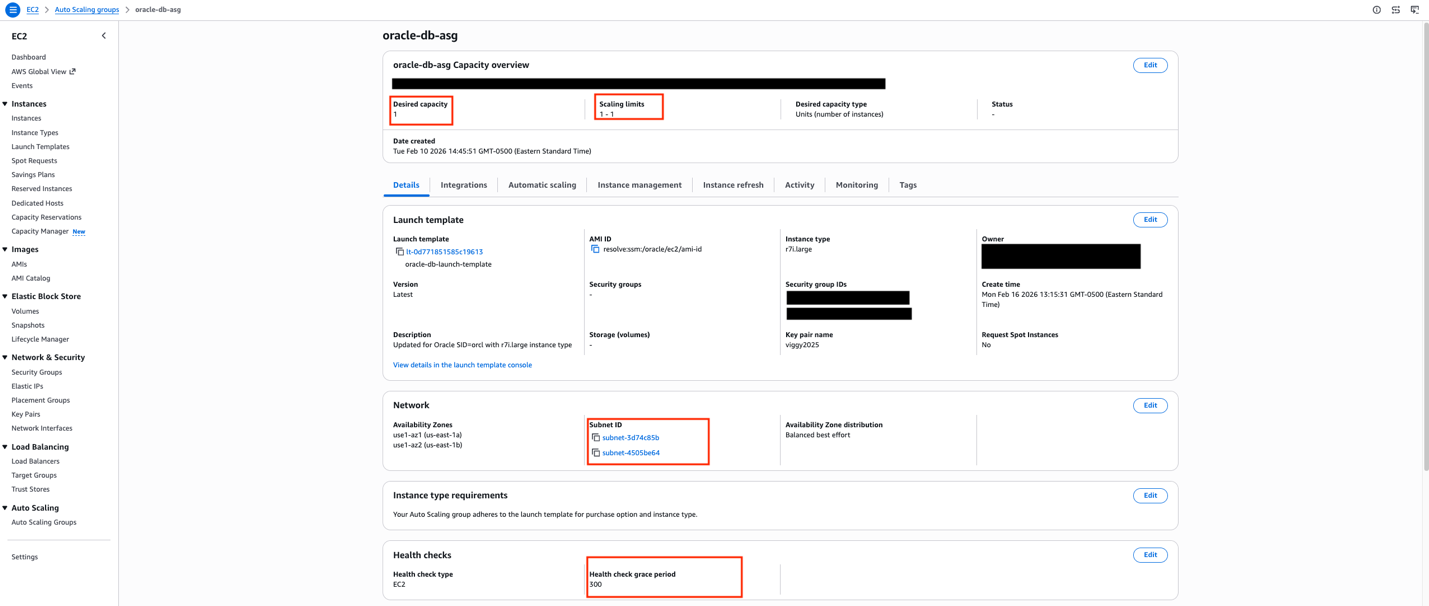
The Auto Scaling group is configured with minimum, maximum, and desired capacity all set to 1. This is not traditional auto-scaling, it’s a self-healing pattern. The sole purpose is to detect when the Oracle instance becomes unhealthy and automatically launch a replacement. The health check grace period should be set to at least 300 seconds (5 minutes) to allow Oracle sufficient time to start before health checks begin evaluating the new instance.

The launch template also includes a User Data script that runs on each new instance. This script configures the iSCSI initiator, discovers and connects to the FSxN endpoints, mounts the Oracle data volumes, and starts the Oracle database through a systemd service. This automation makes sure that a replacement instance is fully operational without manual intervention.

EC2 Auto Scaling group oracle-db-asg configuration showing desired capacity of 1, scaling limits 1-1, r7i.large instance type, oracle-db-launch-template with Latest version, spanning two availability zone subnets.

Auto Scaling group configured with min=max=desired=1 across two availability zones, providing self-healing capability.

Test the complete workflow

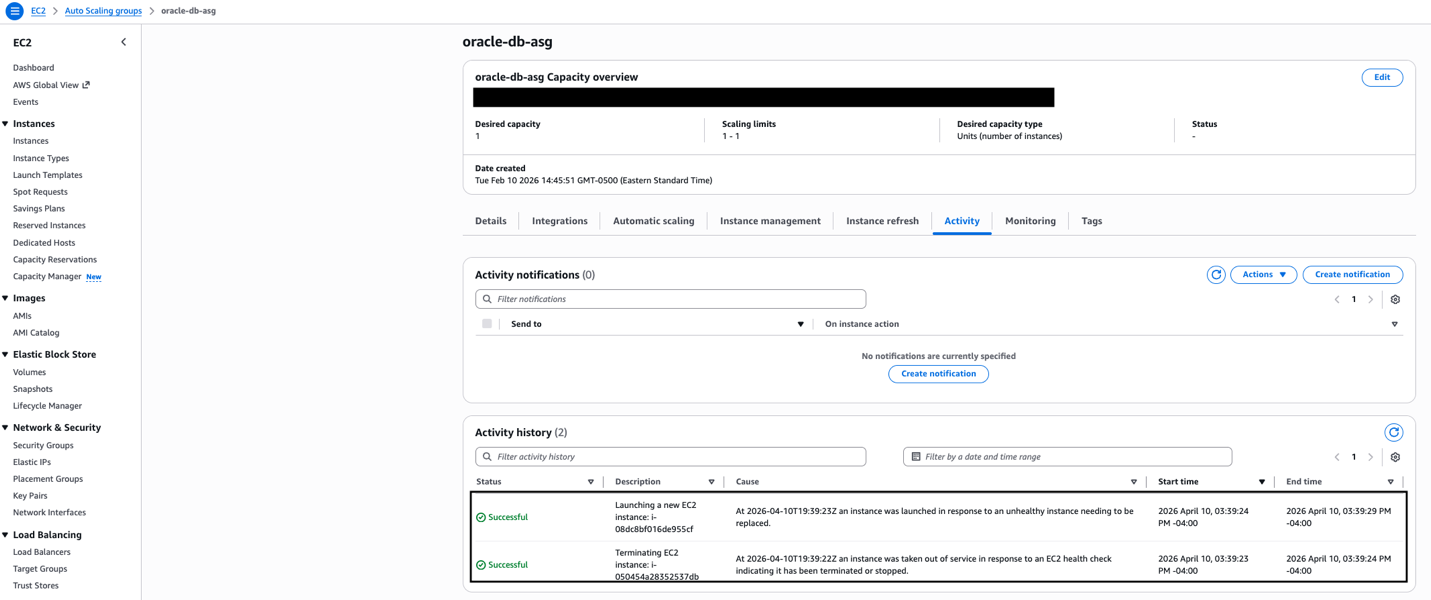
To validate the architecture, simulate an instance failure by terminating the current Oracle EC2 instance.

The expected sequence is:

  1. The Auto Scaling group detects the instance is unhealthy (within approximately 30 seconds)
  2. A new instance launches from the latest AMI resolved from Parameter Store (approximately 2 minutes)
  3. The User Data script connects to FSxN using iSCSI and starts Oracle (approximately 2–3 minutes)
  4. The Oracle database is available and accepting connections (total elapsed: approximately 5 minutes)

Auto Scaling group Activity History showing the self-healing sequence — the unhealthy instance is terminated, and a replacement is launched automatically within seconds.

The new instance automatically inherits the application tags from the Auto Scaling group, which means AWS Backup includes it in the next backup cycle without manual configuration.

Cleaning up

To avoid incurring future charges, delete the resources:

  • Delete Lambda functions and EventBridge rules
  • Remove Parameters from Systems Manager Parameter Store
  • Delete AWS Backup plans and backup vault
  • Deregister created AMIs
  • Terminate Auto Scaling group instances
  • Delete the Amazon FSx for NetApp ONTAP file system

Conclusion

This architecture facilitates Oracle high availability with configuration consistency by combining FSxN persistent shared storage with automated AMI management and AWS Backup protection. The Lambda-driven AMI management from backup recovery points and Parameter Store integration helps make sure that replacement instances launched by Auto Scaling groups always use the latest Oracle host configuration and can immediately connect to the existing Oracle database files stored on FSxN. Replacements occur only when health checks fail. Organizations can target high availability while maintaining configuration consistency across instance replacements. The automated AMI management alleviates configuration drift and makes sure that disaster recovery scenarios restore Oracle instances with identical host-level configurations that can immediately access the persistent Oracle database on shared storage. Healthy instances continue running unchanged, with replacements occurring only, when necessary, because of health check failures.Next steps include implementing cross-Region AMI replication, adding AMI validation testing, and developing custom health checks that verify both Oracle database and host configuration consistency.

Additional resources

Streamline your infrastructure: Automating AMI creation with Kiro CLI and EC2 Image Builder

Post Syndicated from Malini Chatterjee original https://aws.amazon.com/blogs/compute/streamline-your-infrastructure-automating-ami-creation-with-kiro-cli-and-ec2-image-builder/

Managing infrastructure at scale requires robust automation tools that reduce manual effort while maintaining consistency and security. The combination of Kiro CLI and AWS EC2 Image Builder offers a powerful solution for automating the creation, testing, and deployment of Amazon Machine Images (AMIs).

The challenge of manual image management

Traditional approaches of creating and maintaining AMIs often involve manual processes that are time-consuming, error-prone, and difficult to scale. Teams struggle with:

  • Inconsistent configurations across development, testing, and production environments
  • Security vulnerabilities from outdated base images and missing patches
  • Compliance gaps due to manual validation processes
  • Slow deployment cycles caused by repetitive manual tasks

With EC2 Image Builder and Kiro CLI, teams can replace these manual workflows with automated, and secure AMI pipelines. EC2 Image Builder provides the fully managed automation engine, while Kiro CLI brings AI-powered assistance to help you build, iterate, and troubleshoot those pipelines faster — using natural language.

EC2 Image Builder

EC2 Image Builder is a fully managed AWS service that simplifies the creation, maintenance, and deployment of customized, secure, and up-to-date server images. The service provides the following key capabilities:

  • Automated build pipelines: Define your image configuration once, automatically build images on a schedule or trigger basis, and manage the lifecycle of the AMI. Image Builder handles the entire lifecycle of custom AMI creation, testing, distributing and managing the lifecycle of the AMIs.
  • Built-in security: Automatically apply the latest security patches and validate images against AWS security best practices. EC2 Image Builder can enforce security with every created AMI using update-linux/update-windows components patch OS vulnerabilities at build time, IMDSv2 can be enforced at the pipeline level, and Amazon Inspector validates CVE posture before image distribution — all automated, no manual intervention
  • Testing and validation: Run automated tests to verify your images meet functional and security requirements before deployment. This ensures only validated images reach production environments.
  • Multi-region distribution: Automatically distribute your AMIs across multiple AWS regions and share them with specific AWS accounts, streamlining deployment across complex organizational structures.

Kiro CLI: AI-powered infrastructure automation

Kiro CLI brings generative AI capabilities directly to your terminal, enabling natural language interactions with AWS services. This AI-powered command-line interface transforms how developers and operators interact with infrastructure automation tools.

What makes Kiro CLI powerful

  • Natural language commands: Instead of memorizing complex CLI syntax or hand-authoring CloudFormation templates, simply describe what you want to accomplish. Kiro CLI interprets your intent and generates Infrastructure as Code — such as CloudFormation or CDK — that you can review, version-control, and deploy through your existing CI/CD pipelines. For quick, non-destructive exploration (e.g., listing resources or describing configurations), Kiro can also execute AWS API calls directly.
  • Context-aware assistance: Kiro understands your AWS environment and provides intelligent suggestions based on your current context, resources, and best practices. You can connect Kiro CLI to remote tools and systems via Model Context Protocol (MCP), for example, you can connect to AWS MCP servers for and documentation and troubleshooting assistance.
  • Workflow automation: Chain multiple operations together using conversational commands, reducing the cognitive load of managing complex infrastructure tasks.
  • Integration with AWS services: Seamlessly interact with EC2 Image Builder, Systems Manager, and other AWS services without switching between different tools or interfaces.

The synergy: Kiro CLI + EC2 Image Builder, automated pipeline creation

When combined, these tools create a streamlined workflow infrastructure automation:

  • Faster onboarding: Seamless AMI creation and faster maintenance with Kiro CLI. Rather than switching between the AWS Console and AWS CloudFormation documentation during initial exploration, Kiro CLI lets you describe your requirements conversationally — giving you a fast path to a working pipeline that you can then manage and refine through the Console or CloudFormation as your production needs mature.
  • Improved security posture: Automated patching and compliance validation built into every image. Describe your patching requirements conversationally, and Kiro CLI includes the appropriate build components that apply OS-level patches, kernel updates, and CVE fixes directly into the AMI at build time.
  • Consistent deployments: Version-controlled AMI pipelines that produce identical, pre-tested images promoted across dev, staging, and production without manual changes. EC2 Image Builder ensures every build follows the same recipe, components, and validation steps.
  • Reduced operational overhead: Eliminates manual, repetitive tasks around image creation, distribution, and lifecycle management accelerating iteration cycles for pipeline builds.
  • Faster troubleshooting: Kiro CLI parses error output and explains root cause in plain language, cutting the time spent deciphering CloudFormation stack traces and Image Builder build logs.

Getting started

Before implementing this solution, ensure you have the pre-requisites:

  1. Kiro CLI installed (installation guide: for Linux, macOS or Windows) and configured.
  2. Configure the AWS Documentation MCP server , refer the detailed steps here.
  3. AWS account with access permissions for the following services:
    • EC2 Image Builder
    • IAM (for role creation and policy attachment)
    • EC2 (for AMI management)
    • Systems Manager
    • VPC (for network configuration)
  4. An existing VPC with public/private subnets configured

To begin automating your infrastructure using Kiro-CLI, here are some sample prompts that you can use as a baseline:

Example 1: Amazon Linux for EKS nodes

Use case: Teams running Kubernetes on Amazon EKS need custom node AMIs that include the correct container runtime, kubelet version, and security hardening — and that stay current with weekly base image updates. This prompt automates that pipeline and keeps your EKS node groups up to date automatically.

Prompt:

Create a production-ready EC2 Image Builder pipeline using a direct APIs 
for custom EKS-optimized Amazon Linux 2023 AMIs with the following requirements:

- Weekly automated builds triggered by base AMI updates
- AWS managed components for container runtime, kubelet and CloudWatch agent
- Automatic launch template updates for EKS managed node groups

What Kiro CLI generates:

Kiro CLI produces the API calls and supporting configuration to set up:

  • An EC2 Image Builder pipeline with a weekly schedule and base AMI change detection
  • Image recipe based on the EKS-optimized Amazon Linux 2023 AMI
  • Component definitions for container runtime (containerd), kubelet, and CloudWatch Agent
  • Automation to update EKS managed node group launch templates with the new AMI ID after each build
  • If we use a short prompt, Kiro will pick the default values, which customer can definitely change/edit accordingly. However, if we want to be more presriptive, then one can follow a detailed prompt like Example 2 below.

Example 2: Windows server golden image

Use case: Enterprise teams running Windows-based workloads often need a standardized, hardened base image that meets compliance requirements (such as CIS benchmarks) and includes approved software. Manually maintaining this image is error-prone and time-consuming. This prompt automates the full pipeline — from build to distribution.

Prompt:

Create a production-ready EC2 Image Builder pipeline for a Windows Server 2025 
golden image as a single CloudFormation template:

- Monthly automated builds via cron schedule
- Using latest public Windows Server 2025 AMI from AWS
- Components: AWS-managed CloudWatch Agent, AWS CLI, Windows Updates
- Apply AWS-managed STIG components (stig-build-windows) for build-time hardening 
  and corresponding stig-validate-windows for validation.
- For the EC2 instance profile role, use only these AWS-managed policies: 
  EC2InstanceProfileForImageBuilder, EC2InstanceProfileForImageBuilderECRContainerBuilds,
  and AmazonSSMManagedInstanceCore. Do NOT use any policy containing "FullAccess".
- Create a KMS multi-region primary key (MRK) in the pipeline region for AMI
  encryption, with a key policy granting cross-account access to
  [ACCOUNT_1, ACCOUNT_2, ACCOUNT_3] for kms:CreateGrant, kms:DescribeKey,
  and kms:Decrypt. Include a KMS alias. Output the key ARN for replica
  creation in target regions.
- Amazon Inspector vulnerability scanning
- Single pipeline deployed in one region. Use EC2 Image Builder
  DistributionConfiguration to share the output AMI to accounts
  [ACCOUNT_1, ACCOUNT_2, ACCOUNT_3] in regions us-east-1 and us-west-2.
  Do NOT create separate pipelines or stacks per region.
- In the DistributionConfiguration, use AmiDistributionConfiguration's
  built-in SsmParameterConfigurations to write the output AMI ID to
  /golden-image/windows-server-2025/latest in each distribution region.
  Do NOT use Lambda functions or custom resources for SSM parameter updates.
- Create an SNS topic for build notifications. Use the
  InfrastructureConfiguration's built-in SnsTopicArn property for pipeline
  status notifications. Do NOT create EventBridge rules for notifications.
- Lifecycle policy: Disable AMIs after 180 days, delete after 360 days
- Least-privilege IAM roles for Image Builder, EC2 instance profile,
  and lifecycle
- All resource names (KMS alias, IAM roles, SNS topics, Image Builder
  components, recipes, pipelines, infrastructure configs, distribution
  configs, lifecycle policies, EventBridge rules, and SSM parameter paths)
  must include !Sub "${AWS::StackName}" or a parameterized prefix to ensure
  uniqueness. This prevents conflicts if the template is deployed multiple
  times in the same account/region.
- Use AWS-managed components where available
- Parameterize account IDs and regions
- Do NOT create multiple stacks or deploy resources in multiple regions

What Kiro CLI generates:

Kiro CLI interprets this prompt and produces a complete CloudFormation template that includes:

  • An EC2 Image Builder pipeline with a monthly build schedule
  • Image recipe referencing the latest Windows Server 2025 AMI from AWS Systems Manager public parameter
  • AWS-managed components for CloudWatch Agent, AWS CLI, and Windows Updates
  • STIG hardening build component with corresponding validation component
  • KMS key and encryption settings applied to the output AMI
  • Amazon Inspector integration for CVE scanning before distribution
  • Distribution configuration targeting 3 AWS accounts across 2 regions
  • Built-in SsmParameterConfigurations writing the AMI ID to /golden-image/windows-server-2025/latest in each distribution region
  • SNS topic and subscriptions for build success/failure notifications
  • Lifecycle policy: disable AMIs after 180 days, delete after 360 days
  • Least-privilege IAM roles for Image Builder service, EC2 instance profile, and lifecycle management

Once the execution is complete, you can navigate to the EC2 Image Builder  console. Once you are in the AWS Console EC2 Image Builder, you will be on the page for Image Pipelines. You will see in the screenshot below that the new pipeline is now Enabled.

Please note that the name of the pipeline will vary based on your specific inputs. This image is just a sample “enabled” pipeline looks like in EC2 Image Builder  console.

Fig 1: Sample EC2 Image Builder console, after the pipeline is “enabled”

Fig 1: Sample EC2 Image Builder console, after the pipeline is “enabled”.

For more examples and scenarios, you can check Infrastructure Automation with Kiro CLI and EC2 Image Builder workshop.

Cleanup

To avoid ongoing charges, remove all resources created during this walkthrough. The cleanup steps depend on which example you followed.

Example 1: Amazon Linux for EKS nodes cleanup

If you created resources via direct API calls, delete them in the following order:

  • Disable and delete the Image Builder pipeline — this stops the weekly automated builds triggered by base AMI updates.
  • Delete the image recipe based on the EKS-optimized Amazon Linux 2023 AMI.
  • Delete the component definitions for container runtime (containerd), kubelet, and CloudWatch Agent.
  • Delete the infrastructure configuration and distribution configuration.
  • Revert your EKS managed node group launch templates to their previous AMI ID, or point them to a known-good image, before removing the custom AMIs.
  • Deregister any AMIs produced by the pipeline and delete their associated EBS snapshots.
  • Remove IAM roles and instance profiles created for Image Builder and the EC2 instance profile.

Example 2: Windows server golden image cleanup

If you deployed the CloudFormation template, navigate to the AWS CloudFormation console, select your stack, and choose Delete. This removes the pipeline, recipe, components, IAM roles, KMS resources, SNS topic, and lifecycle policy in a single operation.

After the stack is deleted, manually clean up these resources that CloudFormation does not remove:

  • Deregister distributed AMIs — In each target account (ACCOUNT_1, ACCOUNT_2, ACCOUNT_3) and region (us-east-1, us-west-2), deregister the shared Windows Server 2025 AMIs and delete their associated EBS snapshots.
  • Delete SSM parameters — Remove /golden-image/windows-server-2025/latest in each distribution region where it was written by the SsmParameterConfigurations.
  • Schedule KMS key deletion — If the multi-region primary key (MRK) was replicated to other regions, delete the replica keys first, then schedule deletion of the primary key. Revoke any cross-account grants issued to ACCOUNT_1, ACCOUNT_2, and ACCOUNT_3.
  • Remove Amazon Inspector associations — If Inspector was enabled solely for this pipeline, disable it to avoid ongoing scanning charges.
  • Verify lifecycle policy cleanup — Confirm that the lifecycle policy (disable after 180 days, delete after 360 days) was removed with the stack. If any AMIs were already marked for lifecycle action, manually deregister and delete them.

Please note that AMI de-registration and snapshot deletion must be performed in every account and region where images were distributed. Ensure receiving accounts also deregister their copies to stop incurring storage costs.

Conclusion

The combination of AI-powered tools like Kiro CLI with robust automation services like EC2 Image Builder represents the future of infrastructure management. Whether you’re managing dozens or thousands of instances, automating your AMI creation pipeline is no longer optional—it’s essential for maintaining security, consistency, and agility in modern cloud environments.

In this post, we highlighted the benefits of AI-assisted infrastructure management using Kiro CLI. You can start using the workshop Infrastructure Automation with Kiro CLI and EC2 Image Builder for detailed prompts for building production-ready golden AMI pipeline with minimal manual coding.

How Synthesia optimizes generative AI video inference on Amazon EC2 G7e instances

Post Syndicated from Moises Hernandez original https://aws.amazon.com/blogs/architecture/how-synthesia-optimizes-generative-ai-video-inference-on-amazon-ec2-g7e-instances/

Synthesia, an enterprise-focused AI video platform, has transformed content creation, helping everyone to create video content without cameras or microphones. To achieve this, Synthesia allows its users to create video avatars that synthesize the likeness and voice of real people. Synthesia achieves this through a series of in-house developed models based on various architectures, including latent diffusion video generation models.
Customers like Synthesia often choose to host their models on Amazon Elastic Compute Cloud (Amazon EC2) instances because of the flexibility and control over the underlying hardware that the service provides, and among them they find the G7e instance family to be a cost-efficient option to serve GPU-memory intensive generative AI video models, giving customers access to NVIDIA RTX PRO 6000 Blackwell GPUs, with 96GB of GPU memory.

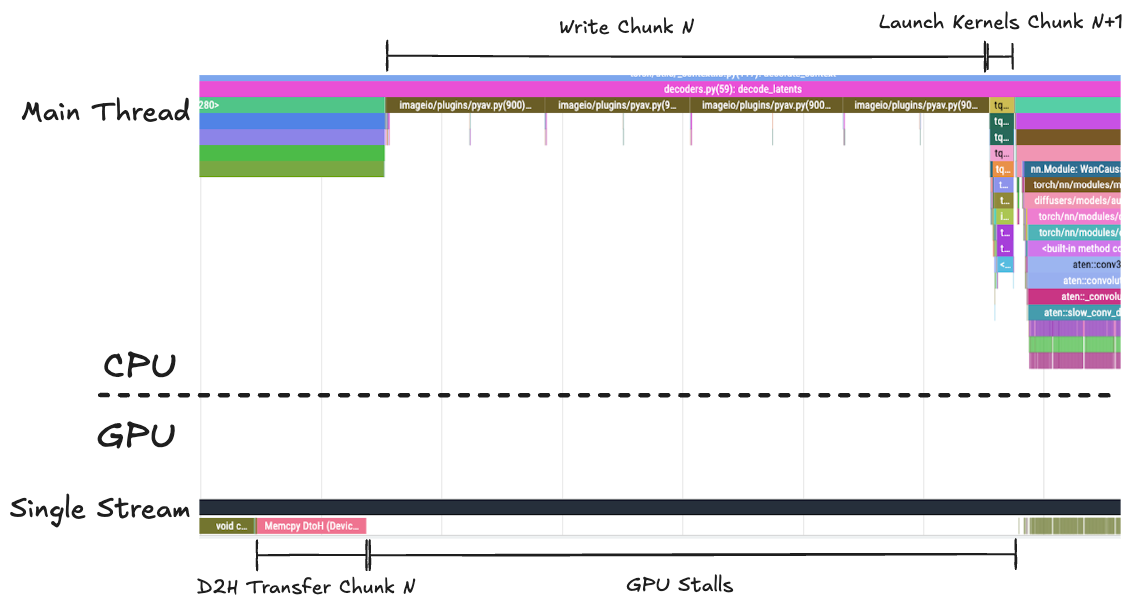
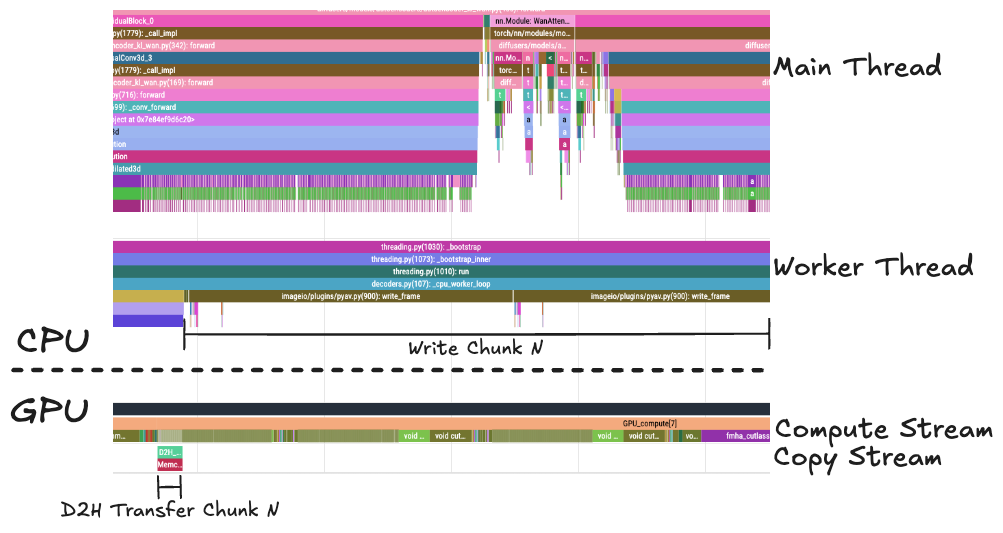
When generating videos using AI models with a Variational Auto Encoder (VAE) Decoder in the architecture, customers often find the GPU utilization is bottlenecked by the saving rate of the video frames to a file held on storage. This causes GPU stalls and reduces average GPU kernel utilization, which is the percentage of time the GPU is actively executing compute kernels rather than idle.

This post introduces a video decoding optimization technique that we have ideated in collaboration with Synthesia Research Engineering team, which we call Asynchronous Frame Generation Pipeline. Adopting this technique allows you to overlap GPU compute, device-to-host (D2H) data transfer, and host-side post-processing. In this post, we apply this technique to the VAE decoder of a Wan video generation model as an example, where our benchmarks on G7e show increased GPU kernel utilization from 82% to 99.9%, in turn leading to an 8.2% decrease in latency (and increase in throughput) for video decoding. We expect this technique to benefit any customer with a chunked video generation pipeline that transfers frames to host memory.

You can find an end-to-end example implementation of the Asynchronous Generation Pipeline applied to the Hugging Face Diffusers format of the Wan 2.2 14B Model in the associated GitHub repository.

In the following section, you will see how latent diffusion models generate video and why the traditional sequential decoding approach can lead to inefficient GPU utilization.

Understanding the sequential decoding bottleneck

Latent diffusion video generation models have emerged as powerful tools for generating temporally coherent video sequences. To reduce compute and memory requirements, these models perform the diffusion process in a compressed latent space of a variational auto-encoder (VAE), as depicted in the below figure, which has generally a much lower dimensionality than the originating video pixel space.

Fig. 1 High-level architecture of a VAE model. The depicted frames are taken from the Wan 2.2 repository sample video used in the example implementation in the next sections.

At inference time, a latent representation is initialized with noise and iteratively denoised via a Diffusion Process. To make sure that the output follows the text prompt, every denoising step is conditioned on the text input if present. After the final denoising step, the Diffusion Process yields a generated video that is still represented in the latent space of the VAE. The last step therefore consists in decoding the latent video back into a human-readable pixel video using the decoder part of the VAE.

Processing the whole latent or pixel video at once is usually too resource-intensive, even on large GPUs. It is therefore common to split the video along the temporal dimension and to decode video frames one latent frame at a time, resulting in a chunk of, for example, 4 consecutive pixel frames, as shown in Fig 2.

Fig.2 Decoding one latent results in a chunk of 4 time-consecutive pixel frames which are transferred from the GPU to the host.

Once a chunk has been decoded and processed on the GPU, the corresponding pixel frames must be transferred back to host (CPU) memory with a D2H transfer, so they can be written to a file or further processed. If you wait to transfer the video frames once the entire video has been decoded, the full decoded video must fit in GPU memory before being transferred, making this strategy hard to scale for arbitrarily long videos. A more memory-efficient alternative is to transfer the decoded frames every time a chunk is decoded, so that the GPU memory footprint of the decoder scales with the size of the chunk instead of the full video.

Traditionally, a newly generated set of frames in a chunk N is passed from GPU memory to CPU RAM synchronously, and it is committed to storage before the CPU can launch the CUDA kernels (referred to as kernels from now on) that process the N+1 chunk. This leads to systematic GPU stalls between chunks, as the copy from device to host prevents the GPU from immediately starting work on the next chunk, reducing overall hardware utilization, and in turn increasing processing time. We will refer to this synchronous process as Sequential Frame Generation Pipeline, which is depicted in Fig. 3.


Fig.3 Schematic representation of the Sequential Frame Generation Pipeline. Launching the kernels processing Chunk N+1 needs to wait for the full copy and storage of the frames in Chunk N.

In the following section, you will learn how to overcome this bottleneck using an asynchronous pipeline that overlaps GPU computation with data transfers and host-side processing.

Asynchronous Frame Generation Pipeline

To minimize GPU stalling, and in turn increase GPU utilization, you need to modify the Sequential Frame Generation Pipeline introduced in the previous section, so that all host-side CPU work (such as appending decoded frames to a file) runs in parallel with a stream of uninterrupted device-side kernels. This section shows you how to achieve this using as an example the implementation of an Asynchronous Wan VAE Decoder, which is implemented with PyTorch and you can find in the associated GitHub repository.

By default, PyTorch schedules work on a single (default) CUDA stream per device which executes the operations in issue order unless additional streams are explicitly created. To decouple compute and D2H copies, the implementation uses two CUDA streams so that the GPU is allowed to overlap compute kernels, which are enqueued on the default stream, and D2H copies on a dedicated copy stream. Compute kernels are enqueued on the default stream, which from now on can be referred to as Compute Stream, and D2H copies on a dedicated copy stream, namely the Copy Stream. In Fig. 4 you can find the full setup on a GPU accelerated instance (G7e in our example) depicted.


Fig. 4 High level diagram of the key components in our implementation of the Asynchronous Frame Generation Pipeline.

On the host side, kernel submissions are interleaved with D2H transfers and post-transfer processing and, to avoid host-side blocking calls and maximize GPU utilization the Asynchronous Frame Generation Pipeline introduces two mechanics:

  • A dedicated Worker CPU thread responsible for reading chunks from Host Memory (RAM), and writing them to file, leaving the main Python thread to focus on launching kernels and scheduling D2H transfers.
  • Two in-memory Buffers on the GPU Memory (VRAM), and on the Host Memory (RAM), and page-lock the required Host Memory buffers to make sure D2H copies are performed fully asynchronously.

Using a double-buffer strategy makes sure that for adjacent chunks the compute, D2H transfer, and host processing can overlap safely as they operate on distinct memory buffers.


Fig. 5 Schematic representation of the interplay between Events, Streams, Buffers, and Worker component in the Asynchronous Frame Generation Pipeline implementation. Events are depicted as left and right conditions, expressing what the process WAITs for, and ISSUEs when it has completed. The size of the boxes representing operations has been scaled to fit the text, and therefore not representative of the actual processing time.

Since buffers can be accessed concurrently by different components, the implementation introduces a synchronization mechanism to avoid different kernels and threads corrupting data held in the buffer. This can be achieved using CUDA Events which are used as a barrier that clears if it can answer closed questions such as: Has decoding of chunk N completed? You can find the interplay between Streams, Threads and Events depicted in Fig. 5.

G7e benchmark results

To quantify the impact of the Asynchronous Frame Generation pipeline, you can benchmark the decoding of a single 41 latent-frames test video for both the Synchronous and Asynchronous pipeline on a g7e.2xlarge EC2 instance using this sample notebook. To have a common baseline, the benchmarks are based on the unoptimized Hugging Face Diffusers Wan 2.2 14B model, and, in both cases, the benchmarking loop performs an initial full decoding cycle to let CUDA and PyTorch initialize and allocate memory pools and cache. After warmup, the benchmarking session carries out 10 consecutive full video decoding cycles. We have run an end-to-end run as an example and present the results in Table 1.

Metric Synchronous (time s /video) Asynchronous (time s / video)
min 21.98 20.16
mean 21.99 20.17
P99 22.01 20.20

Table. 1 Benchmark results for 10 consecutive decoding runs for the Synchronous and Asynchronous pipelines.

The example results show a speed gain of up to 8.2% on this benchmark, decreasing the Real Time Factor of the decoder from 3.21 to 2.95. Considering the g7e.2xlarge pricing as of writing this post ($3.36 per GPU on-demand in the Ohio region), this leads to an average saving of $896 for decoding 1,000 hours of video on a single GPU. This is a theoretical saving, calculated assuming that the underlying model operates at full computational efficiency without bottlenecks.

To have a qualitative understanding of how this performance boost is achieved, you can profile both the Synchronous and Asynchronous pipelines using this sample notebook. The results for an example run are reported in Fig. 6 and Fig. 7, showing the absence of GPU stalls in the Asynchronous pipeline as opposed to the Synchronous pipeline.


Fig. 6 Profile of the Synchronous pipeline single thread and stream. As the main CPU thread is writing Chunk N frames to disk, the GPU stream stalls, waiting for the CPU to launch the kernels needed to process Chunk N+1


Fig.7 In the Asynchronous pipeline, the Compute Stream is not interrupted by the copying and writing of the frames to disk. The Main Thread is free to launch the processing kernels. This figure is displayed with a different zoom level than Fig. 6 to highlight the qualitative differences.

By focusing on the temporal axis for two consecutive chunks in the steady state, you can quantify the GPU kernel utilization increase, which, in our example run was 82% for the Synchronous case, increasing to 99.9% for the Asynchronous case.

Conclusion

In this post, we demonstrated how the Asynchronous Frame Generation Pipeline can improve GPU utilization when decoding latent videos on Amazon EC2 G7e instances. By decoupling GPU compute from device-to-host transfers and host-side I/O using dual CUDA streams, pinned memory buffers, and a dedicated worker thread, we eliminated the GPU stalls inherent in traditional synchronous decoding pipelines.

The sample benchmarks on the Wan 2.2 14B VAE decoder show an 8.2% reduction in decoding latency, translating to approximately $896 in savings per 1,000 hours of decoded video on a single GPU when considering the g7e.2xlarge pricing as of writing this post ($3.36 per GPU on-demand in the Ohio region). These gains come without any changes to model weights or inference quality, purely from better hardware utilization. We expect the kernel utilization gain to be even more impactful on optimized and compiled models, which make more efficient use of the GPU.

The techniques presented here are not specific to the Wan architecture, nor to the specific GPU utilized. Any chunked video generation pipeline that transfers frames to host memory can benefit from this approach. We encourage you to explore the associated sample implementation to experiment with how the Asynchronous Frame Generation Pipeline could be integrated into your own video generation workloads.

To get started with G7e instances for your generative AI video workloads, visit the Amazon EC2 G7e instance page.


About the authors

Sharing Capacity Blocks for ML Across Your AWS Organization

Post Syndicated from Tyler Klimas original https://aws.amazon.com/blogs/compute/sharing-capacity-blocks-for-ml-across-your-aws-organization/

When your data science team reserves GPU instances for a two-week training job but completes it in four days, that capacity has the potential to sit unused while your computer vision team waits another week to start their project. Now you can eliminate this GPU waste and scheduling conflict by sharing Capacity Blocks for ML across your AWS Organization. This scheduling mismatch between teams creates bottlenecks that delay product launches, increase infrastructure costs, and slow your ability to deliver machine learning (ML) powered features to customers. With cross-account sharing for Amazon Elastic Compute Cloud (Amazon EC2) Capacity Blocks for ML, you can now distribute reserved graphics processing unit (GPU) capacity across teams based on actual demand rather than rigid scheduling predictions. This means your computer vision team can use the capacity as soon as the data science team is done.

In this post, we’ll show you how to configure cross-account sharing for Capacity Blocks for ML, set up monitoring for your shared resources, and optimize instance utilization through alerting. By increasing the utilization rates and reducing over-provisioning, you improve your resource efficiency and cost optimization for your organization.

You can reduce idle resources in your ML team’s account by sharing capacity with other teams waiting for GPUs. Additionally, you can maintain Capacity Blocks for ML centrally. This lets you control which teams have access to the capacity and helps you reduce waste and bottlenecks in your organization. Before starting into the tutorial, let’s review how Capacity Blocks for ML and AWS RAM work together.

Overview

Capacity Blocks for ML let you reserve GPU-based accelerated compute instances ahead of time for short duration ML workloads. When you launch instances in Capacity Blocks for ML, Amazon EC2 automatically places the instances in Amazon EC2 UltraClusters, giving you low-latency, petabit scale networking. UltraClusters provide the high performance networking your training workloads require.

You see exactly when GPU capacity is available and schedule your Capacity Blocks for ML to start when it makes sense for your project. You pay upfront for the entire reservation period. This makes Capacity Blocks for ML useful when you need GPUs for days to months. It provides predictable capacity without long-term commitments.

When you purchase Capacity Blocks for ML, you can share it with other accounts in your AWS Organization using AWS Resource Access Manager (AWS RAM). With AWS RAM, you can share AWS resources across accounts within your organization. When you share with other accounts, those accounts become consumer accounts that can launch instances using your capacity. As the owner account, you pay the upfront reservation cost and retain ownership. If you’re launching instances from a consumer account, you are responsible for additional costs such as operating system licensing charges. Capacity Blocks can be shared to multiple accounts simultaneously, with the entire Capacity Block reservation being shared on a first come, first served basis.

Overview of AWS Organizations showing an owner account sharing to two consumer accounts using an AWS RAM resource share.

Figure 1: Capacity Block sharing using Resource Access Manager.

With the share feature, you benefit from flexible GPU capacity management when your priorities shift, or teams finish work at different times. Now, when your data science team completes experimentation early, your other teams can use that capacity for production training. If priorities shift mid-quarter, you can move capacity where it’s needed most.

In this tutorial, you’ll share a Capacity Block for ML across accounts and then create an alarm to monitor utilization when it drops below a threshold. Before you start, complete the following prerequisites.

Prerequisites

To share Capacity Blocks for ML, you must first find and purchase a Capacity Block. Only standard Capacity Blocks for ML can be shared using AWS RAM. UltraServer Capacity Blocks are not eligible for sharing.

You can share Capacity Blocks only within your AWS Organization. Verify the owner of the Capacity Blocks as well as the consumer(s) are within the same organization. For guidance, see Creating and configuring an organization.

Before sharing Capacity Blocks, you must configure resource sharing with AWS Organizations. Only the management account with the following required AWS Identity and Access Management (IAM) permissions can enable resource sharing within an Organization:

ram:EnableSharingWithAwsOrganization

iam:CreateServiceLinkedRole

organizations:EnableAWSServiceAccess

organizations:DescribeOrganization

Using the AWS Management Console of the management account:

  1. Navigate to the AWS RAM console.
  2. In the left navigation pane, choose Settings.
  3. Select Enable sharing with AWS Organizations.

Enable sharing with AWS Organizations in Settings of Resource Access Manager.

Figure 2: Enable sharing with AWS Organizations in AWS RAM.

Using the AWS Command Line Interface (CLI):

  1. Run this command to give AWS RAM trusted access to your organization’s account structure:
        aws organizations enable-aws-service-access --service-principal ram.amazonaws.com
  2. Turn on resource sharing within your organization so accounts and OUs can access shared resources without manual acceptance:
        aws ram enable-sharing-with-aws-organization

After you turn on sharing in your organization, you need the following IAM permissions to create resource shares:

ram:CreateResourceShare

ram:AssociateResourceShare

ram:GetResourceShares

Now that you’ve completed the prerequisites, you’ll learn how to share the Capacity Blocks for ML to other accounts of your organization.

Tutorial

You’ll complete this sharing process in four steps:

  1. Create a resource share.
  2. Attach Capacity Block to the resource share.
  3. Verify the share in your consumer account.
  4. Monitor the resource share.

Verify Capacity Reservation (console)

  1. In your Capacity Block owner’s account, navigate to the Amazon EC2 console.
  2. In the left navigation pane, choose Capacity Reservations.
  3. Confirm your Capacity Blocks for ML is in Active or Scheduled state.
  4. If you have a Resource share already configured, choose Actions, Share and select your Resource share.

Figure 3: EC2 Capacity Reservation

Share Capacity Blocks for ML (console)

You now will create a Resource Share and associate the following resources.

  1. Navigate to the AWS RAM console in your Capacity Block owner’s account.
  2. In the left navigation pane, choose Resource shares.
  3. Choose Create resource share.

Create Resource share in AWS RAM Console

Figure 4: Create Resource share in AWS RAM

  1. Enter a name for your resource share.
  2. Under Select resource type, choose Capacity Reservations.
  3. Select your Capacity Block from the list.
  4. Under Principals, specify the accounts, organizational units, or organization to share with.Select principals to share resources in AWS RAM.Figure 5: Select principals to share resources with
  5. Choose Create resource share.

Share Capacity Blocks for ML (AWS CLI)

Replace the placeholder values in the following CLI commands below with your actual values:

  • arn:aws:ec2:us-east-2:123456789012:capacity-reservation/cr-1234abcd56EXAMPLE → Your Capacity Reservation ARN
  • 111122223333 → The AWS account ID of the principal you’re sharing with
  • arn:aws:ram:us-east-2:123456789012:resource-share/7ab63972-b505-7e2a-420d-6f5d3EXAMPLE → Your RAM resource share ARN


  1. Create resource share with Capacity Block and principals:
    aws ram create-resource-share \
         --name capacity-block-share \
         --resource-arns arn:aws:ec2:us-east-2:123456789012:capacity-reservation/cr-1234abcd56EXAMPLE \ 
         --principals 111122223333
  1. To add a Capacity Block to existing resource share:
    aws ram associate-resource-share \
         --resource-share-arn arn:aws:ram:us-east-2:123456789012:resource-share/7ab63972-b505-7e2a-420d-6f5d3EXAMPLE \
         --resource-arns arn:aws:ec2:us-east-2:123456789012:capacity-reservation/cr-1234abcd56EXAMPLE

Access and Launch shared Capacity Blocks (console)

After you add the Capacity Block to a resource share, your consumer accounts automatically gain access when you share the Capacity Block within the same AWS Organization.

  1. Navigate to the AWS RAM console in your consumer account.
  2. In the left navigation pane, choose Shared with me, Resource shares. Verify the Resource share is Active.Within your consumer account, verify resource share.Figure 6: In your consumer account, verify the resource share
  3. Navigate to the Amazon EC2 console. In the left navigation pane, choose Capacity Reservations.
  4. Confirm the shared Capacity Block appears and is in Active or Scheduled state. Because sharing is asynchronous, the Capacity Block may take a few moments to appear even after the resource share shows Active.
  5. Navigate to the Amazon EC2 console and choose Launch instance.
  6. Configure your instance as required (AMI, instance type, key pair, etc.).
  7. Under Advanced details, for Purchasing option, choose Capacity Blocks.
  8. For Capacity reservation, choose Specify Capacity Reservation.
  9. For Capacity reservation targeted ID, select or enter your Capacity Block reservation ID.
  10. Launch the instance.

Access shared Capacity Blocks (AWS CLI)

Replace the placeholder values in the following CLI commands below with your actual values:

  • ami-0abcdef1234567890 → Your AMI ID
  • cr-0c54f6734d944345a → Your Capacity Reservation ID
  1. List resource shares in your consumer account:
    aws ram get-resource-shares --resource-owner OTHER-ACCOUNTS
  1. Verify that capacity reservation is available:
    aws ec2 describe-capacity-reservations
  1. Launch EC2 instance from Capacity Block:
    aws ec2 run-instances \
         --image-id ami-0abcdef1234567890 \
         --count 1 \
         --instance-type p5.48xlarge \
         --key-name my-key-pair \
         --subnet-id subnet-0abcdef1234567890 \
         --instance-market-options MarketType='capacity-block' \
         --capacity-reservation-specification CapacityReservationTarget={CapacityReservationId=cr-0c54f6734d944345a}

Monitor usage (console)

You can create Amazon CloudWatch alarms to proactively identify low utilization of your Capacity Block. This helps you to improve the usage of your capacity reservation. This section shows you how to create an Amazon Simple Notification Service (Amazon SNS) email notification when the number of running instances drops below a certain threshold.

In addition to monitoring usage, AWS CloudTrail logs capture API events related to your Capacity Block, including the CapacityReservationId. As the owner, you can see which accounts are consuming instances and when.

Step 1: Create an SNS Topic for Notifications

  1. Open the Amazon SNS console.
  2. In the left navigation pane, choose Topics.
  3. Choose Create topic.
  4. For Type, select Standard.

Create SNS Topic for CloudWatch alarm.

Figure 7: Create SNS Topic

  1. For Name, enter capacity-block-alerts.
  2. Choose Create topic.

Step 2: Create an SNS Subscription:

  1. In the left navigation pane, choose Create subscription.Create SNS SubscriptionFigure 8: Create SNS Subscription
  2. For Protocol, choose Email.
  3. For Endpoint, enter your email address.
  4. Choose Create subscription.

Step 3: Create the CloudWatch Alarm

  1. Navigate to the Amazon CloudWatch console.
  2. In the left navigation pane, choose Alarms, All alarms.
  3. Choose Create alarm.
  4. Choose Select metric.
  5. Choose EC2 Capacity Reservations.
  6. Choose By Capacity Reservation.
  7. Find your Capacity Block ID (e.g., cr-12345678abcdef).
  8. Select the checkbox next to InstanceUtilization.
  9. Choose Select metric.

Step 4: Configure the Metric

  1. Under Metric:
  2. For Statistic: Select Average.
  3. For Period: Select 5 minutes.
  4. Under Conditions choose Threshold type: Select Static.
  5. Whenever InstanceUtilization is…: Select Lower than…: Enter 20 (This metric is measured in percentage).
  6. Choose Next.

Step 5: Configure Actions

  1. Under Notifications:
  2. Alarm state trigger: Select In alarm.
  3. Select an SNS topic: Choose Select an existing SNS topic.
  4. Send a notification to…: Select capacity-block-alerts.Configure CloudWatch AlarmFigure 9: Configure CloudWatch Alarm
  5. Choose Next.

Step 6: Name and Create Alarm

  1. For Alarm name, enter: CapacityBlock-LowUtilization-cr-123456789abcdef.
  2. For Alarm description, enter: Alert when Capacity Block utilization drops below 20%.
  3. Choose Next.
  4. Review your configuration and choose Create alarm.

Monitor usage (AWS CLI)

Replace the placeholder values in the following CLI commands below with your actual values:

  • 123456789012 → Your 12-digit AWS account number
  • cr-0c54f6734d944345a → Your Capacity Reservation ID
  • 7ab63972-b505-7e2a-420d-6f5d3EXAMPLE → Your RAM resource share ID
  • [email protected] → Your email address for notifications


  1. Create the SNS topic:
    aws sns create-topic \
        --name capacity-block-alerts
  1. Using the TopicArn from the output, subscribe your email:
    aws sns subscribe \
        --topic-arn arn:aws:sns:us-east-2:123456789012:capacity-block-alerts \
        --protocol email \
        --notification-endpoint [email protected]
  1. Create the full CloudWatch alarm:
    aws cloudwatch put-metric-alarm \
        --alarm-name "CapacityBlock-LowUtilization-cr-1234EXAMPLE" \
        --alarm-description "Alert when Capacity Block utilization drops below 20%" \
        --namespace "AWS/EC2CapacityReservations" \
        --metric-name "InstanceUtilization" \
        --dimensions Name=CapacityReservationId,Value=cr-0c54f6734d944345a \
        --statistic Average \
        --period 300 \
        --evaluation-periods 1 \
        --threshold 20 \
        --comparison-operator LessThanThreshold \
        --alarm-actions arn:aws:sns:us-east-2:123456789012:capacity-block-alerts

Clean up (console)

As the owner of the Capacity Block, you retain the ability to modify the resource share. However, owners cannot modify instances that consumers launch into Capacity Blocks they have shared. This section outlines how to clean up your previous work.

Using the AWS Management Console:

Stop sharing the Capacity Block

  1. Navigate to AWS RAM console.
  2. In the left navigation, choose Shared by me, Resource shares.
  3. Select your resource share.
  4. Choose Modify.
  5. Remove the Capacity Block from the resource share or delete the entire resource share.

Delete the CloudWatch Alarm

  1. Navigate to the Amazon CloudWatch console.
  2. In the left navigation, choose Alarms, All alarms.
  3. Select the alarm you created.
  4. Choose Actions, Delete.
  5. Confirm deletion.

Delete the SNS Topic and Subscription

  1. Navigate to the Amazon SNS console.
  2. In the left navigation, choose Subscriptions.
  3. Select the subscription and choose Delete.
  4. In the left navigation, choose Topics.
  5. Select capacity-block-alerts and choose Delete.
  6. Confirm deletion.

Clean up (AWS CLI)

Replace the placeholder values in the following CLI commands below with your actual values:

  • 123456789012 → Your 12-digit AWS account number
  • 7ab63972-b505-7e2a-420d-6f5d3EXAMPLE → Your RAM resource share ID
  • cr-0c54f6734d944345a → Your Capacity Reservation ID
  • a1b2c3d4-5678-90ab-cdef-EXAMPLE → Your SNS subscription ID
  1. Remove the Capacity Block from the resource share
        aws ram disassociate-resource-share \
            --resource-share-arn arn:aws:ram:us-east-2:123456789012:resource-share/7ab63972-b505-7e2a-420d-6f5d3EXAMPLE \
            --resource-arns arn:aws:ec2:us-east-2:123456789012:capacity-reservation/cr-0c54f6734d944345a 
  2. Delete the resource share
        aws ram delete-resource-share \
            --resource-share-arn arn:aws:ram:us-east-2:123456789012:resource-share/7ab63972-b505-7e2a-420d-6f5d3EXAMPLE 
  3. Delete the CloudWatch Alarm
        aws cloudwatch delete-alarms \
             --alarm-names "CapacityBlock-LowUtilization-cr-123456789" 
  4. Delete the SNS Topic and Subscription
    1. List subscriptions to get the subscription ARN
          aws sns list-subscriptions-by-topic \
               --topic-arn arn:aws:sns:us-east-2:123456789012:capacity-block-alerts
    2. Delete the subscription
          aws sns unsubscribe \
               --subscription-arn arn:aws:sns:us-east-2:123456789012:capacity-block-alerts:a1b2c3d4-5678-90ab-cdef-EXAMPLE
    3. Delete the Topic
          aws sns delete-topic \
               --topic-arn arn:aws:sns:us-east-2:123456789012:capacity-block-alerts

Conclusion

In this post, we showed you how to share Capacity Blocks for ML across your AWS Organization using AWS RAM. We covered configuring the AWS RAM integration with Organizations, creating resource shares, and accessing shared Capacity Blocks for ML from consumer accounts. Finally, we showed you how to monitor and alert on low instance utilization.

By sharing Capacity Blocks across your organization, you can reduce idle GPU capacity, eliminate scheduling bottlenecks between teams, and maximize the return on your reserved compute investment. To take this further, consider building dashboards in Amazon CloudWatch to track utilization trends across multiple Capacity Blocks.

You can get started by purchasing Capacity Blocks for ML and sharing it across your organization today. For more details on other resources you can share with AWS RAM, visit the Shareable AWS resources in the user guide. If you have questions, contact your AWS account team or leave a comment below.

AWS Weekly Roundup: Amazon Bedrock AgentCore payments, Agent Toolkit for AWS, and more (May 11, 2026)

Post Syndicated from Channy Yun (윤석찬) original https://aws.amazon.com/blogs/aws/aws-weekly-roundup-amazon-bedrock-agentcore-payments-agent-toolkit-for-aws-and-more-may-11-2026/

My most exciting news of last week: Amazon Bedrock AgentCore previewed the first managed payment capabilities enabling AI agents to autonomously access and pay for APIs, MCP servers, web content, and other agents. Built in partnership with Coinbase and Stripe, it removes the undifferentiated heavy lifting of building customized systems for billing, credential management, and compliance.

You can connect a Coinbase CDP wallet or Stripe Privy wallet as a payment connection, set session-level spending limits, and your agent transacts autonomously during execution. What excites me most is what AgentCore payments can unlock—like a research agent that can pay for real-time market data on the fly, or a coding agent calling paid APIs mid-task.

To learn more, visit the blog post, dive deeper using the documentation, and get started with the AgentCore CLI.

Last week’s launches
Here are last week’s launches that caught my attention:

  • Agent Toolkit for AWS – A production-ready suite of tools and guidance, available at no additional charge, that helps AI coding agents build on AWS with fewer errors, lower token costs, and enterprise-grade security controls. The Agent Toolkit for AWS is the successor to the MCP servers, plugins, and skills available on AWS Labs. To get started, visit the quick start guide or browse the available skills and plugins on GitHub.
  • AWS MCP Server GA – You can use a managed remote Model Context Protocol (MCP) server that gives AI agents and coding assistants secure, authenticated access to all AWS services through a small, fixed set of tools. It is part of the Agent Toolkit for AWS. To learn more, visit Seb Stormacq’s blog post.
  • Amazon WorkSpaces for AI agents (Preview) – You can use AI agents to securely access and operate desktop applications through managed WorkSpaces environments. This capability allows organizations to automate everyday workflows at scale while maintaining full enterprise-grade governance and compliance. To learn more, visit Micah Walter’s blog post.
  • Amazon EC2 M8idn/M8idb and R8idn/R8idb instances – These instances are powered by custom sixth-generation Intel Xeon Scalable processors available only on AWS and the latest sixth-generation AWS Nitro cards. These instances deliver up to 43% better compute performance per vCPU compared to previous-generation instances. M8idn/R8idn instances offer up to 600 Gbps network bandwidth, and M8idb/R8idb instances deliver up to 300 Gbps EBS bandwidth.

For a full list of AWS announcements, be sure to keep an eye on the What’s New with AWS page.

Additional updates
Here are some additional news items that you might find interesting:

  • Valkey turns two – Valkey stands as proof that open, community-driven technology innovates faster, scales further, and delivers more value than any single-vendor model. Valkey has surpassed 100 million Docker pulls (up 17x year over year) and attracted more than 225 contributors who have submitted over 1,500 pull requests, roughly double the development pace of Redis over the same period. You can also use the latest Valkey 9.0 in Amazon ElastiCache.
  • Query billion-scale vectors with SQL – You can learn how to query Amazon S3 Vectors from Amazon Aurora PostgreSQL-Compatible Edition using standard SQL, and how to combine vector similarity results with relational filters in a single query, for example, finding the most semantically similar products and then filtering by price, stock status, or tenant in one SQL statement.
  • Building an end-to-end agentic SRE using AWS DevOps Agent – Learn how to configure DevOps Agent Spaces that define an investigation scope, integrating seamlessly with Amazon CloudWatch, Splunk, GitHub, and Slack. You can also learn how to trigger automated investigations via webhooks, generate mitigation plans, and hand off agent-ready specs to coding agents like Kiro for implementation.

For a full list of AWS blog posts, be sure to keep an eye on the AWS Blogs page.

Learn more about AWS, browse and join upcoming AWS-led in-person and virtual events, startup events, and developer-focused events as well as AWS Summits and AWS Community Days. Join the AWS Builder Center to connect with builders, share solutions, and access content that supports your development.

That’s all for this week. Check back next Monday for another Weekly Roundup!

Channy

Securing open proxies in your AWS environment

Post Syndicated from Dodd Mitchell original https://aws.amazon.com/blogs/security/securing-open-proxies-in-your-aws-environment/

This article shows you how to identify and secure open proxies in your AWS environment to prevent abuse, protect your IP address reputation, and control costs.

An open proxy is a server that forwards traffic on behalf of internet users without requiring authentication. While proxies can support legitimate use cases such as load balancing or caching, open proxies allow unrestricted access that threat actors can use to hide harmful activity. In Amazon Web Services (AWS) environments, open proxies often result from misconfigured Amazon Elastic Compute Cloud (Amazon EC2) instances, containers, or compute resources such as AWS Lambda functions. These resources expose proxy functionality without access controls.

Open proxies come in several forms. Common open proxies can include:

  • HTTP proxies: HTTP proxies forward HTTP requests to web servers, making them useful for web traffic management. These proxies can create potential issues when they’re unsecured.
  • SOCKS proxies: SOCKS proxies support a wider range of traffic types and provide more flexibility. These proxies create a broader potential for misuse.
  • Transparent proxies: Transparent proxies intercept traffic without the client’s knowledge and are often used to filter content. These proxies can become security liabilities when misconfigured.
  • Reverse proxies: Reverse proxies help with internal routing. Unauthorized users can misuse these proxies if they’re exposed.

Knowing these risks can help you better protect your AWS environment.

Security risks

Because of the unrestricted configuration of open proxy servers, threat actors target them to conduct denial of service (DoS) events, intrusion attempts, distribute spam, and other forms of unauthorized activity. These open proxy servers allow threat actors to hide their actual IP address and other forms of identification from the intended targets.

When your AWS infrastructure hosts an open proxy, several risks emerge that can affect both your operations and customers:

  • Threat actors can misuse your resources, which can result in your IP address being added to security service and reputation system block lists. This can affect your legitimate business operations and customer access. When external parties use your infrastructure for harmful activities, the reputation damage extends beyond immediate technical concerns to affect your ability to reach customers and partners.
  • Unexpected costs from resource consumption occur when threat actors use your bandwidth and compute capacity. The traffic patterns that proxy abuse generate can also alert AWS security monitoring systems and create additional operational overhead as you investigate and respond to these alerts.
  • Service disruptions might affect your legitimate workloads because unauthorized traffic competes for resources with your business-critical applications. This competition for resources can potentially degrade performance or cause availability issues for your customers.

Implementing security measures

To prevent the risks associated with open proxies, it’s essential to implement proper security controls for proxy services in AWS environments. The following guidance is a comprehensive approach that you can follow to secure your proxy infrastructure.

Access control implementation

An important security step is to use passwords and authentication mechanisms to restrict access to proxy services. Configure your proxies to accept connections only from known, trusted IP address ranges. For Elastic Load Balancing (ELB), limit access based on source IP addresses and add authentication to proxies behind the load balancers. When you create new instances in Amazon Elastic Kubernetes Service (Amazon EKS), limit access to your balancer in each instance. If instances don’t have public IP addresses, then you can limit access to the balancer instead. If instances have public IP addresses, then you must limit access to those IP addresses.

When possible, use AWS PrivateLink virtual private cloud (VPC) endpoints to provide private connectivity to AWS services without exposing them to the internet. Deploy proxy services in private subnets with controlled outbound access through NAT gateways or other controlled channels. For Amazon EC2 and Amazon Lightsail resources, update the attached security group to prevent public internet access. To secure the proxy, you must either limit access to specific IP addresses or implement authentication on the endpoint.

Authentication and authorization

Turn on authentication for the proxy software and use strong credentials, certificates, or integration with AWS Identity and Access Management (IAM) and AWS Directory Service. Apply IAM policies with the principle of least privilege to limit access to only what users need to perform their tasks. This approach reduces the potential effects of credential compromise and helps maintain clear accountability for resource access.

Monitoring and detection

To detect unusual proxy activity, configure Amazon Virtual Private Cloud (Amazon VPC) Flow Logs, AWS CloudTrail, and Amazon GuardDuty. Use Amazon CloudWatch alarms to notify you of abnormal traffic patterns that might indicate unauthorized use of your proxy services. These monitoring capabilities provide visibility into your network traffic patterns and help you identify both legitimate usage and potential security concerns.

Deployment best practices

Use HTTPS for ELB traffic to protect data in transit, and restrict security groups to necessary ports to minimize the surface area for potential misuse. Integrate AWS WAF with balancers to filter web traffic based on rules that you define. You can also use AWS Network Firewall for advanced traffic filtering capabilities. For APIs, deploy Amazon API Gateway with authentication and authorization controls to manage access to your backend services. This layered approach to security helps protect your infrastructure at multiple points in the traffic flow.

Regular security assessments

Run Amazon Inspector to scan for misconfigurations in your infrastructure, and use AWS Security Hub to centralize security findings across your AWS environment. Conduct penetration tests in accordance with AWS policy to identify potential security issues before they can result in unintended access.

Incident response planning

Automate remediation with AWS Config rules and Automation, a capability of AWS Systems Manager, to respond rapidly to security events. Maintain incident response runbooks that outline clear steps for addressing proxy-related security incidents, and decommission unused resources that could become security liabilities.

Documented procedures and automated responses reduce the time between detection and remediation and minimizes the potential effects of security incidents on your operations.

Benefits of proper proxy security

When you implement these security measures, you gain the following advantages for your AWS environment:

  • Protection of your IP address reputation helps maintain customer trust and prevents security services from blocking your legitimate traffic. When your infrastructure maintains a positive reputation, your business communications reach their intended recipients without interference.
  • Cost control prevents unauthorized users from consuming your AWS resources and generating unexpected charges on your account. When you restrict access to legitimate users and use cases, you maintain predictable costs that align with your business needs.
  • Operational stability reduces the risk of service disruptions that abuse of your proxy infrastructure can cause. When you dedicate your resources to serving your customers rather than supporting unauthorized activity, you can deliver consistent performance and availability.
  • Enhanced visibility into your network traffic patterns helps you identify both legitimate usage and potential security concerns. This awareness allows you to make informed decisions about capacity planning, security improvements, and operational optimizations.

Conclusion

Open proxies present a serious risk in AWS environments, but you can effectively secure proxies with the right measures. By implementing strict access controls and additional security practices such as authentication, monitoring, and regular assessments, you can prevent misuse, protect your infrastructure, and maintain your IP address reputation.

Taking proactive steps strengthens your own environment and supports the broader security of the internet ecosystem. Under the AWS shared responsibility model, you’re responsible for the configuration and maintenance of these security controls, while AWS provides the underlying secure infrastructure. By following the guidance in this article, you can build a robust security posture that protects your proxy infrastructure while supporting your legitimate business needs.

If you have feedback about this post, submit comments in the Comments section below.

Dodd Mitchell

Dodd Mitchell

Dodd is a member of the AWS Trust and Safety team in Virginia, supporting customers in navigating abuse, phishing, and content-related risks. He works closely with partners to strengthen response processes and build more resilient, trustworthy platforms.

AWS Weekly Roundup: What’s Next with AWS 2026, Amazon Quick, OpenAI partnership, and more (May 4, 2026)

Post Syndicated from Esra Kayabali original https://aws.amazon.com/blogs/aws/aws-weekly-roundup-whats-next-with-aws-2026-amazon-quick-openai-partnership-and-more-may-4-2026/

Last week, I took some time off in York, England, often described as the most haunted city in the country. I wandered through the ruins of abbeys that have stood for nearly a thousand years, walked along medieval walls, and spent an evening on a ghost tour hearing stories passed down through centuries. There’s something grounding about standing in a place that has witnessed so much history. Now I’m back at my desk, and the contrast is hard to miss: those abbey stones have stood for a thousand years largely unchanged, while in the span of a single week away, the pace of technological change has moved forward yet again.

The ruins of Whitby Abbey in North Yorkshire. Stones that have seen a thousand years, while this week alone brought another wave of change.

Now, let’s get into this week’s AWS news.

Headlines
On April 28, Matt Garman, CEO of AWS, Colleen Aubrey, SVP Amazon Applied AI Solutions, Julia White, CMO of AWS, and OpenAI leaders took the stage to share how customers are changing the way businesses operate with agents. The event brought a packed slate of announcements across Amazon Quick, Amazon Connect, and a deeper partnership with OpenAI. Here’s a roundup of the biggest announcements from the event.

Amazon Quick expands with a desktop app, new pricing plans, and visual asset generation – Amazon Quick is an AI assistant for work that connects to your apps, learns what matters to you, and takes action on your behalf. This week, Quick introduced a new desktop app (Preview) that keeps you connected to your local files, calendar, and communications without opening a browser. You can sign up within minutes using your personal email address or existing Google, Apple, Github, or Amazon credentials—no AWS account required. Quick can now generate polished documents, presentations, infographics, and images directly from the chat interface, and native integrations expand to include Google Workspace, Zoom, Airtable, Dropbox, and Microsoft Teams. A new Build custom apps with Quick capability (Preview) lets you create intelligent apps, dashboards, and web pages connected to the rest of your business using natural language.

Amazon Connect expands into four agentic AI solutions – Amazon Connect is expanding from a single product into a set of four agentic AI solutions designed to work within your existing workflows. Amazon Connect Decisions is a supply chain planning and intelligence solution that shifts teams from crisis management to proactive planning, combining 30 years of Amazon operational science with more than 25 specialized supply chain tools. Amazon Connect Talent (Preview) is an agentic AI hiring solution that delivers AI-led interviews, science-backed assessments, and consistent evaluation for talent acquisition leaders managing scaled hiring. Amazon Connect Customer, previously known as Amazon Connect, delivers personalized customer experiences across voice, chat, and digital channels, with new configuration capabilities that enable organizations to set up conversational AI in weeks rather than months. Amazon Connect Health delivers agentic patient verification, appointment management, patient insights, ambient documentation, and medical coding, giving patients faster access to care and clinicians more time to deliver it.

AWS and OpenAI expand their partnership across Amazon Bedrock – AWS and OpenAI are bringing the latest OpenAI models to Amazon Bedrock, launching Codex on Amazon Bedrock, and introducing Amazon Bedrock Managed Agents powered by OpenAI — all in limited preview. OpenAI models on Amazon Bedrock (Limited preview) brings the latest OpenAI models, including GPT-5.5 and GPT-5.4, to the Bedrock APIs you already use, with unified security, governance, and cost controls. No additional infrastructure to configure, no new security model to learn. Codex on Amazon Bedrock (Limited preview) lets you access the OpenAI coding agent within your existing AWS environments, authenticating with your AWS credentials, processing inference through Bedrock, and applying Codex usage toward your AWS cloud commitments. Codex on Bedrock is available through the Bedrock API, starting with the Codex CLI, the Codex desktop app, and a Visual Studio Code extension. Amazon Bedrock Managed Agents, powered by OpenAI (Limited preview) combines OpenAI frontier models with AWS infrastructure to build production-ready OpenAI-powered agents in the cloud, built with the OpenAI harness for faster execution, sharper reasoning, and reliable steering of long-running tasks.

To learn more, visit Top announcements of the What’s Next with AWS, 2026.

Last week’s launches
Here are some launches and updates from this past week that caught my attention:

  • Amazon EC2 M8in and M8ib instances are now generally available – Powered by custom 6th-gen Intel Xeon Scalable processors and 6th-gen AWS Nitro cards, these instances deliver up to 43% higher performance over M6in and M6ib. M8in offers 600 Gbps network bandwidth, while M8ib delivers up to 300 Gbps EBS bandwidth. Available in US East (N. Virginia), US West (Oregon), Asia Pacific (Tokyo), and Europe (Spain).
  • Amazon EC2 R8in and R8ib instances are now generally available – Memory-optimized instances built on the same 6th-gen Intel Xeon Scalable processors and Nitro cards, with the same 600 Gbps network and 300 Gbps EBS bandwidth profiles. Well-suited for large commercial databases, data lakes, and in-memory databases such as SAP HANA. Available in US East (N. Virginia, Ohio), US West (Oregon), and Europe (Spain).
  • Amazon EC2 C8ine and M8ine instances are now generally available – Network-optimized instances offering up to 2.5x higher packet performance per vCPU and up to 2x higher network throughput for traffic through internet gateways compared to C6in and M6in. Designed for security and network virtual appliances including virtual firewalls, load balancers, and 5G UPF workloads. Available in US East (N. Virginia), US West (Oregon), and Asia Pacific (Tokyo) for C8ine; US East (N. Virginia) and US West (Oregon) for M8ine.
  • Amazon Bedrock AgentCore adds optimization capabilities (Preview) – AgentCore now offers recommendations, batch evaluations, and A/B tests to complete the observe-evaluate-improve loop for agents in production. Recommendations analyze production traces and evaluation outputs to propose optimized system prompts and tool descriptions, which you can validate with batch evaluations against pre-defined test cases or A/B tests against live traffic. Every recommendation requires your approval before it ships.
  • AWS Lambda adds support for Ruby 4.0 – Ruby 4.0, the latest LTS release, is available as a Lambda managed runtime and container base image. It includes support for Lambda advanced logging controls, including JSON structured logs, configurable logging levels, and target CloudWatch log group configuration. Available in all AWS Regions, including China Regions and AWS GovCloud (US).

For a full list of AWS announcements, be sure to keep an eye on the What’s New with AWS page.

Other AWS news
Here are some additional posts and resources that you might find interesting:

  • Amazon Q Developer end-of-support announcement – Amazon Q Developer IDE plugins and paid subscriptions will reach end of support on April 30, 2027, giving customers 12 months to transition to Kiro. New signups will be blocked starting May 15, 2026, although existing subscriptions can continue to add users. Starting May 29, 2026, Opus 4.6 will no longer be available on Q Developer Pro; Opus 4.5 and other existing models remain available, and the latest coding models including Opus 4.7 are available exclusively on Kiro. Amazon Q Developer in the AWS Management Console and first-party AWS experiences (documentation, mobile app, Slack, and Microsoft Teams) are not affected.
  • AWS 10,000 AIdeas Competition: Meet the Winners – AWS announced the 20 winners of the 10,000 AIdeas Competition, a global challenge where builders submitted AI applications built entirely with Kiro and the AWS Free Tier, with submissions from 115 countries narrowed down through four rounds of evaluation and two rounds of community voting. Winners span Global Champions, Regional Champions, Innovation Awards, and Creative Track categories, with cash prizes and AWS credits awarded across each tier.
  • AWS Student Builder Groups – AWS Cloud Clubs is evolving to AWS Student Builder Groups. The community now spans 600+ colleges and universities across 63 countries. Existing Cloud Club memberships, badges, and progress carry forward, and Cloud Club Captains become Group Leaders. Membership is open to any learner 18 or older. You can find a group near you on AWS Builder Center or apply to launch a new group on your campus.

Upcoming AWS events
Check your calendar and sign up for upcoming AWS events:

Visit the AWS Builder Center to meet other builders, contribute solutions, and find resources that help you keep building. You can also browse upcoming AWS-led in-person and virtual events, plus developer-focused sessions.

— Esra

This post is part of our Weekly Roundup series. Check back each week for a quick roundup of interesting news and announcements from AWS!

Troubleshooting environment with AI analysis in AWS Elastic Beanstalk

Post Syndicated from Chandu Utlapalli original https://aws.amazon.com/blogs/devops/troubleshooting-environment-with-ai-analysis-in-aws-elastic-beanstalk/

Introduction

AWS Elastic Beanstalk simplifies the process of deploying and scaling web applications. You upload your code, and Elastic Beanstalk handles capacity provisioning, load balancing, auto scaling, and application health monitoring.

Elastic Beanstalk now offers AI Analysis to help troubleshoot environment health issues. When you request an analysis, Elastic Beanstalk triggers a script on the Amazon EC2 instance in your environment. The script collects environment events, health data, and instance logs, sends them to Amazon Bedrock for analysis, and uploads the results to Amazon S3. The result is a set of step-by-step troubleshooting recommendations tailored to your environment’s specific issues, helping you reduce mean time to resolution (MTTR).

In the Elastic Beanstalk console, the AI Analysis button appears on the environment overview page when your environment’s health status changes to Warning, Degraded, or Severe. AI analysis is also accessible from the logs page in the console, the AWS CLI, or the EB CLI.

Prerequisites

Before getting started, ensure that you have the following:

  • An AWS account with access to AWS Elastic Beanstalk and Amazon Bedrock.
  • A supported Elastic Beanstalk platform version – AI analysis is available on Amazon Linux 2 and AL2023 based platform versions released on or after February 16, 2026. Update your environment to a supported platform version if needed.
  • Instance profile with required permissions – The managed policies AWSElasticBeanstalkWebTier, AWSElasticBeanstalkWorkerTier, and AWSElasticBeanstalkMulticontainerDocker now include the necessary permissions for AI analysis. Attach one or more of these managed policies to your environment’s instance profile based on your environment tier. If you use a custom instance profile, ensure it includes the following permissions:
    • bedrock:InvokeModel
    • bedrock:ListFoundationModels
    • elasticbeanstalk:DescribeEvents
    • elasticbeanstalk:DescribeEnvironmentHealth
  • AWS CLI installed and configured with appropriate permissions. See Installing the AWS CLI.
  • Anthropic use case details – AI analysis uses Anthropic Claude models through Amazon Bedrock. Anthropic requires you to submit a one-time use case details form before you can invoke their models. To submit this form, select an Anthropic model from the model catalog in the Amazon Bedrock console, or call the PutUseCaseForModelAccess API. You only need to do this once per AWS account. If you submit the form from the AWS Organizations management account, it automatically covers member accounts in the organization. For more information, see Access Amazon Bedrock foundation models.
  • GovCloud Regions – If you are using AWS GovCloud (US) Regions, you must enable access to the latest Anthropic Claude Sonnet and/or Opus model in Amazon Bedrock before using AI analysis. For instructions on enabling model access in GovCloud Regions, see Manage access to Amazon Bedrock foundation models. For information about the latest available Anthropic Claude Sonnet and/or Opus model, see Supported Regions and models for inference profiles.

Solution Overview

In the following sections, we demonstrate how to use AI Analysis to diagnose a Node.js application that fails after a deployment.

  1. Create a working environment: Deploy a Node.js application to Elastic Beanstalk using the code snippets provided below.
  2. Break the environment: Update the application with code that requires missing environment variables. This causes the environment health status to transition to Degraded.
  3. Use AI Analysis: Request an AI Analysis from the Elastic Beanstalk console or the AWS CLI to identify the root cause of the health degradation.
  4. Apply the fix and verify: Apply the recommendations generated by AI Analysis and confirm that the environment health returns to Ok.

The following figure shows how AI Analysis works:

Figure 1 – AI Analysis architecture

  1. You initiate a request through the Elastic Beanstalk console (AI Analysis button) or the AWS CLI (RequestEnvironmentInfo API with InfoType set to “analyze”).
  2. Elastic Beanstalk collects environment data, analyzes it using Amazon Bedrock (a fully managed service that provides access to foundation models through API), and stores the results in Amazon S3.
  3. You retrieve the results through the console or the RetrieveEnvironmentInfo API using CLI.

Walkthrough

Follow the steps below to set up the sample application, break it, troubleshoot with AI Analysis, and restore the environment to a healthy state.

To try this feature, open your terminal and follow the steps below to create a sample Elastic Beanstalk environment. First, set the following variables. Replace the values with your own unique S3 bucket name and the latest Node.js solution stack for your region. To find the latest solution stack, run aws elasticbeanstalk list-available-solution-stacks.

S3_BUCKET="your-unique-bucket-name"

SOLUTION_STACK_NAME="64bit Amazon Linux 2023 v6.9.0 running Node.js 22"

Setting up the application

We use two versions of a simple Node.js application. The first version (v1-working) is a basic HTTP server that responds to requests successfully. The second version (v2-broken) introduces a dependency on environment variables that are not configured in the Elastic Beanstalk environment, simulating a common deployment issue.

Create a project directory:

mkdir test-app && cd test-app

Create the working application file (v1-working):

cat << 'EOF' > workingapp.js
const http = require('http');

const server = http.createServer((req, res) => {
    res.writeHead(200, { 'Content-Type': 'application/json' });
    res.end(JSON.stringify({ status: 'healthy', message: 'App is running' }));
});

const port = process.env.PORT || 8080;
server.listen(port, () => {
    console.log(`Server running on port ${port}`);
});
EOF

Create the broken application file (v2-broken):

cat << 'EOF' > brokenapp.js
const http = require('http');

// Application requires these environment variables to function
const VAR_1 = process.env.TEST_VARIABLE_1;
const VAR_2 = process.env.TEST_VARIABLE_2;
const VAR_3 = process.env.TEST_VARIABLE_3;

if (!VAR_1 || !VAR_2 || !VAR_3) {
    throw new Error(
        `Missing required environment variables. ` +
        `TEST_VARIABLE_1: ${VAR_1 ? 'set' : 'MISSING'}, ` +
        `TEST_VARIABLE_2: ${VAR_2 ? 'set' : 'MISSING'}, ` +
        `TEST_VARIABLE_3: ${VAR_3 ? 'set' : 'MISSING'}`
    );
}

const server = http.createServer((req, res) => {
    res.writeHead(200, { 'Content-Type': 'application/json' });
    res.end(JSON.stringify({ status: 'healthy', db: VAR_1 }));
});

const port = process.env.PORT || 8080;
server.listen(port, () => {
    console.log(`Server running on port ${port}`);
});
EOF

Create the package.json:

cat << 'EOF' > package.json
{
  "name": "test-app",
  "version": "1.0.0",
  "description": "Sample app that requires environment variables",
  "main": "app.js",
  "scripts": {
    "start": "node app.js"
  }
}
EOF

Create the working application source bundle:

cp workingapp.js app.js

zip -r nodejs-working-app.zip app.js package.json

Create the broken application source bundle:

cp brokenapp.js app.js

zip -r nodejs-broken-app.zip app.js package.json

Step 1: Create a working environment

First, create the Elastic Beanstalk application and deploy the working version.

Create an S3 bucket:

aws s3 mb s3://$S3_BUCKET --region us-east-1

Upload the working application source bundle:

aws s3 cp nodejs-working-app.zip s3://$S3_BUCKET/nodejs-working-app.zip

Create the Elastic Beanstalk application:

aws elasticbeanstalk create-application \
    --application-name test-app \
    --description "Test application" \
    --region us-east-1

Create the application version:

aws elasticbeanstalk create-application-version \
    --application-name test-app \
    --version-label v1-working \
    --source-bundle S3Bucket="$S3_BUCKET",S3Key="nodejs-working-app.zip" \
    --region us-east-1

Create the environment with the working version:

aws elasticbeanstalk create-environment \
    --application-name test-app \
    --environment-name test-app-env \
    --solution-stack-name "$SOLUTION_STACK_NAME" \
    --version-label v1-working \
    --option-settings \
        Namespace=aws:elasticbeanstalk:environment,OptionName=EnvironmentType,Value=SingleInstance \
        Namespace=aws:autoscaling:launchconfiguration,OptionName=IamInstanceProfile,Value=aws-elasticbeanstalk-ec2-role \
    --region us-east-1

Once your environment is created, verify the health:

aws elasticbeanstalk describe-environment-health \
    --environment-name test-app-env \
    --attribute-names All \
    --region us-east-1

Output:

{
    "EnvironmentName": "test-app-env",
    "HealthStatus": "Ok",
    "Status": "Ready",
    "Color": "Green",
    "Causes": [
        "Initialization completed 31 seconds ago and took 2 minutes."
    ],
    "ApplicationMetrics": {
        "RequestCount": 0
    },
    "InstancesHealth": {
        "NoData": 0,
        "Unknown": 0,
        "Pending": 0,
        "Ok": 1,
        "Info": 0,
        "Warning": 0,
        "Degraded": 0,
        "Severe": 0
    },
    "RefreshedAt": "2026-03-25T16:39:11Z"
}

Figure 2 – Environment health showing Ok (Green) status after initial deployment

Step 2: Break the environment

Now, deploy the broken version that requires missing environment variables.

Upload the broken version:

aws s3 cp nodejs-broken-app.zip s3://$S3_BUCKET/nodejs-broken-app.zip

Create the broken application version:

aws elasticbeanstalk create-application-version \
    --application-name test-app \
    --version-label v2-broken \
    --source-bundle S3Bucket="$S3_BUCKET",S3Key="nodejs-broken-app.zip" \
    --region us-east-1

Deploy the broken version:

aws elasticbeanstalk update-environment \
    --environment-name test-app-env \
    --version-label v2-broken \
    --region us-east-1

Within seconds of the deployment completing, the environment health transitions from Ok to Degraded:

aws elasticbeanstalk describe-environment-health \
    --environment-name test-app-env \
    --attribute-names All \
    --region us-east-1

Output:

{
    "EnvironmentName": "test-app-env",
    "HealthStatus": "Degraded",
    "Status": "Ready",
    "Color": "Red",
    "Causes": [
        "Impaired services on all instances."
    ],
    "ApplicationMetrics": {
        "RequestCount": 0
    },
    "InstancesHealth": {
        "NoData": 0,
        "Unknown": 0,
        "Pending": 0,
        "Ok": 0,
        "Info": 0,
        "Warning": 0,
        "Degraded": 0,
        "Severe": 1
    },
    "RefreshedAt": "2026-03-25T16:43:19Z"
}

Figure 3 – Environment health showing Degraded (Red) status with the AI Analysis button visible

Step 3: Use AI Analysis

Request AI analysis from the AWS CLI or the Elastic Beanstalk console. Both methods produce the same results. The CLI approach is useful for automation and scripting, while the console provides a visual workflow where you can view results directly on the environment page. We’ll cover both options below.

Using the AWS CLI

Request the analysis:

aws elasticbeanstalk request-environment-info \
    --environment-name test-app-env \
    --info-type analyze \
    --region us-east-1

Once the request environment operation is completed, retrieve the results:

aws elasticbeanstalk retrieve-environment-info \
    --environment-name test-app-env \
    --info-type analyze \
    --region us-east-1

The response includes an EnvironmentInfo array with a Message field containing a pre-signed S3 URL to the analysis results:

{
    "EnvironmentInfo": [
        {
            "InfoType": "analyze",
            "Ec2InstanceId": "i-1234567890abcdef0",
            "SampleTimestamp": "2026-03-20T20:49:22.763Z",
            "Message": "https://elasticbeanstalk-us-east-1-123456789012.s3.us-east-1.amazonaws.com/resources/environments/logs/analyze/..."
        }
    ]
}

Download and view the analysis:

ANALYSIS_URL=$(aws elasticbeanstalk retrieve-environment-info \
    --environment-name test-app-env \
    --info-type analyze \
    --region us-east-1 \
    --query 'sort_by(EnvironmentInfo, &SampleTimestamp)[-1].Message' \
    --output text)

curl -s "$ANALYSIS_URL"

Figure 4 – AI analysis output retrieved via AWS CLI

Using the Elastic Beanstalk console

When your environment’s health status is Warning, Degraded, or Severe, the AI Analysis button appears in the environment overview section of the Elastic Beanstalk console.

  1. Navigate to the Elastic Beanstalk console.
  2. Select your environment (test-app-env).
  3. On the environment overview page, locate the AI Analysis button that appears when the health status indicates an issue.
  4. Choose AI Analysis to initiate the analysis.

Video 1 – Requesting AI analysis from the Elastic Beanstalk console

If you want to restart the analysis workflow, you can click on the Reanalyze button to start a new analysis.

Step 4: Apply the fix and verify

The AI analysis identified that the application crashes because the environment does not have three required environment variables configured: TEST_VARIABLE_1, TEST_VARIABLE_2, and TEST_VARIABLE_3. As recommended by the AI analysis, set these environment variables to resolve the issue:

aws elasticbeanstalk update-environment \
    --environment-name test-app-env \
    --option-settings \
        Namespace=aws:elasticbeanstalk:application:environment,OptionName=TEST_VARIABLE_1,Value=value1 \
        Namespace=aws:elasticbeanstalk:application:environment,OptionName=TEST_VARIABLE_2,Value=value2 \
        Namespace=aws:elasticbeanstalk:application:environment,OptionName=TEST_VARIABLE_3,Value=value3 \
    --region us-east-1

After the environment update completes, the application starts successfully and the environment health returns to Ok:

aws elasticbeanstalk describe-environment-health \
    --environment-name test-app-env \
    --attribute-names All \
    --region us-east-1

Output:

{
    "EnvironmentName": "test-app-env",
    "HealthStatus": "Ok",
    "Status": "Ready",
    "Color": "Green",
    "Causes": [
        "Configuration update completed 72 seconds ago and took 54 seconds."
    ],
    "ApplicationMetrics": {
        "RequestCount": 0
    },
    "InstancesHealth": {
        "NoData": 0,
        "Unknown": 0,
        "Pending": 0,
        "Ok": 1,
        "Info": 0,
        "Warning": 0,
        "Degraded": 0,
        "Severe": 0
    },
    "RefreshedAt": "2026-03-25T17:42:47Z"
}

Figure 5 – Environment health restored to Ok (Green) after setting environment variables

Note: The steps in this walkthrough can also be performed using the EB CLI. For more information, see the EB CLI Command Reference.

Best practices

Consider these recommendations to get the most out of AI analysis for your environments.

  1. Use supported platform versions: Ensure your environment is running an Amazon Linux 2 or AL2023 platform version released on or after February 16, 2026. Update your platform if you don’t see the AI Analysis option.
  2. Implement fixes incrementally: If the analysis recommends multiple actions, implement them one at a time to isolate which change resolves the issue.
  3. Review data privacy considerations: The analysis sends environment events and logs to Amazon Bedrock running in your account. For more information about how Amazon Bedrock handles your data, see the Amazon Bedrock security documentation.

Cleaning up

Terminate the environment:

aws elasticbeanstalk terminate-environment \
    --environment-name test-app-env \
    --region us-east-1

Delete the application (after the environment is terminated):

aws elasticbeanstalk delete-application \
    --application-name test-app \
    --terminate-env-by-force \
    --region us-east-1

Delete the S3 bucket used for source bundles:

aws s3 rb s3://$S3_BUCKET --force --region us-east-1

Remove the local project directory:

rm -rf test-app

Conclusion

AI-powered environment analysis in AWS Elastic Beanstalk significantly reduces the time and effort required to diagnose environment health issues. Instead of manually parsing through log files and cross-referencing documentation, you can now get targeted, actionable recommendations with a click of the AI Analysis button in the console or an API call.

Whether you prefer using the Elastic Beanstalk console for visual workflows or the AWS CLI/EB CLI for scripting and automation, AI analysis provides a consistent experience that helps you quickly identify root causes and resolve issues.

To learn more about AI-powered environment analysis, see the AWS Elastic Beanstalk Developer Guide. To learn more about AWS Elastic Beanstalk, visit the product page.

About the Author

Chandu Utlapalli

Chandu is a Software Development Engineer at AWS, working on the Elastic Beanstalk service. He focuses on building scalable cloud solutions and integrating AI capabilities to enhance developer productivity and cloud operations. Outside of work, Chandu enjoys playing cricket.

AWS Weekly Roundup: Claude Sonnet 4.6 in Amazon Bedrock, Kiro in GovCloud Regions, new Agent Plugins, and more (February 23, 2026)

Post Syndicated from Channy Yun (윤석찬) original https://aws.amazon.com/blogs/aws/aws-weekly-roundup-claude-sonnet-4-6-in-amazon-bedrock-kiro-in-govcloud-regions-new-agent-plugins-and-more-february-23-2026/

Last week, my team met many developers at Developer Week in San Jose. My colleague, Vinicius Senger delivered a great keynote about renascent software—a new way of building and evolving applications where humans and AI collaborate as co-developers using Kiro. Other colleagues spoke about building and deploying production-ready AI agents. Everyone stayed to ask and hear the questions related to agent memory, multi-agent patterns, meta-tooling and hooks. It was interesting how many developers were actually building agents.

We are continuing to meet developers and hear their feedback at third-party developer conferences. You can meet us at the dev/nexus, the largest and longest-running Java ecosystem conference on March 4-6 in Atlanta. My colleague, James Ward will speak about building AI Agents with Spring and MCP, and Vinicius Senger and Jonathan Vogel will speak about 10 tools and tips to upgrade your Java code with AI. I’ll keep sharing places for you to connect with us.

Last week’s launches
Here are some of the other announcements from last week:

  • Claude Sonnet 4.6 model in Amazon Bedrock – You can now use Claude Sonnet 4.6 which offers frontier performance across coding, agents, and professional work at scale. Claude Sonnet 4.6 approaches Opus 4.6 intelligence at a lower cost. It enables faster, high-quality task completion, making it ideal for high-volume coding and knowledge work use cases.
  • Amazon EC2 Hpc8a instances powered by 5th Gen AMD EPYC processors – You can use new Hpc8a instances delivering up to 40% higher performance, increased memory bandwidth, and 300 Gbps Elastic Fabric Adapter networking. You can accelerate compute-intensive simulations, engineering workloads, and tightly coupled HPC applications.
  • Amazon SageMaker Inference for custom Amazon Nova models – You can now configure the instance types, auto-scaling policies, and concurrency settings for custom Nova model deployments with Amazon SageMaker Inference to best meet your needs.
  • Nested virtualization on virtual Amazon EC2 instances – You can create nested virtual machines by running KVM or Hyper-V on virtual EC2 instances. You can leverage this capability for use cases such as running emulators for mobile applications, simulating in-vehicle hardware for automobiles, and running Windows Subsystem for Linux on Windows workstations.
  • Server-Side Encryption by default in Amazon Aurora – Amazon Aurora further strengthens your security posture by automatically applying server-side encryption by default to all new databases clusters using AWS-owned keys. This encryption is fully managed, transparent to users, and with no cost or performance impact.
  • Kiro in AWS GovCloud (US) Regions – You can use Kiro for the development teams behind government missions. Developers in regulated environments can now leverage Kiro’s agentic AI tool with the rigorous security controls required.

For a full list of AWS announcements, be sure to keep an eye on the What’s New with AWS page.

Additional updates
Here are some additional news items that you might find interesting:

  • Introducing Agent Plugins for AWS – You can see how new open-source Agent Plugins for AWS extend coding agents with skills for deploying applications to AWS. Using the deploy-on-aws plugin, you can generate architecture recommendations, cost estimates, and infrastructure-as-code directly from your coding agent.
  • A chat with Byron Cook on automated reasoning and trust in AI systems – You can hear how to verify AI systems doing the right thing using automated reasoning when they generate code or manage critical decisions. Byron Cook’s team has spent a decade proving correctness in AWS and apply those techniques to agentic systems.
  • Best practices for deploying AWS DevOps Agent in production – You can read best practices for setting up DevOps Agent Spaces that balance investigation capability with operational efficiency. According to Swami Sivasubramanian, AWS DevOps Agent, a frontier agent that resolves and proactively prevents incidents, has handled thousands of escalations, with an estimated root cause identification rate of over 86% within Amazon.

From AWS community
Here are my personal favorite posts from AWS community:

Join the AWS Builder Center to connect with community, share knowledge, and access content that supports your development.

Upcoming AWS events
Check your calendar and sign up for upcoming AWS events:

  • AWS Summits – Join AWS Summits in 2026, free in-person events where you can explore emerging cloud and AI technologies, learn best practices, and network with industry peers and experts. Upcoming Summits include Paris (April 1), London (April 22), and Bengaluru (April 23–24).
  • Amazon Nova AI Hackathon – Join developers worldwide to build innovative generative AI solutions using frontier foundation models and compete for $40,000 in prizes across five categories including agentic AI, multimodal understanding, UI automation, and voice experiences during this six-week challenge from February 2nd to March 16th, 2026.
  • AWS Community Days – Community-led conferences where content is planned, sourced, and delivered by community leaders, featuring technical discussions, workshops, and hands-on labs. Upcoming events include Ahmedabad (February 28), JAWS Days in Tokyo (March 7), Chennai (March 7), Slovakia (March 11), and Pune (March 21).

Browse here for upcoming AWS led in-person and virtual events, startup events, and developer-focused events.

That’s all for this week. Check back next Monday for another Weekly Roundup!

Channy

Amazon EC2 Hpc8a Instances powered by 5th Gen AMD EPYC processors are now available

Post Syndicated from Channy Yun (윤석찬) original https://aws.amazon.com/blogs/aws/amazon-ec2-hpc8a-instances-powered-by-5th-gen-amd-epyc-processors-are-now-available/

Today, we’re announcing the general availability of Amazon Elastic Compute Cloud (Amazon EC2) Hpc8a instances, a new high performance computing (HPC) optimized instance type powered by latest 5th Generation AMD EPYC processors with a maximum frequency of up to 4.5 GHz. These instances are ideal for compute-intensive tightly coupled HPC workloads, including computational fluid dynamics, simulations for faster design iterations, high-resolution weather modeling within tight operational windows, and complex crash simulations that require rapid time-to-results.

The new Hpc8a instances deliver up to 40% higher performance, 42% greater memory bandwidth, and up to 25% better price-performance compared to previous generation Hpc7a instances. Customers benefit from the high core density, memory bandwidth, and low-latency networking that helped them scale efficiently and reduce job completion times for their compute-intensive simulation workloads.

Hpc8a instances
Hpc8a instances are available with 192 cores, 768 GiB memory, and 300 Gbps Elastic Fabric Adapter (EFA) networking to run applications requiring high levels of inter node communications at scale.

Instance Name Physical Cores Memory (Gib) EFA Network Bandwidth (Gbps) Network Bandwidth (Gbps) Attached Storage
Hpc8a.96xlarge 192 768 Up to 300 75 EBS Only

Hpc8a instances are available in a single 96xlarge size with a 1:4 core-to-memory ratio. You will have the capability to right size based on HPC workload requirements by customizing the number of cores needed at launch instances. These instances also use sixth-generation AWS Nitro cards, which offload CPU virtualization, storage, and networking functions to dedicated hardware and software, enhancing performance and security for your workloads.

You can use Hpc8a instances with AWS ParallelCluster and AWS Parallel Computing Service (AWS PCS) to simplify workload submission and cluster creation and Amazon FSx for Lustre for sub-millisecond latencies and up to hundreds of gigabytes per second of throughput for storage. To achieve the best performance for HPC workloads, these instances have Simultaneous Multithreading (SMT) disabled.

Now available
Amazon EC2 Hpc8a instances are now available in US East (Ohio) and Europe (Stockholm) AWS Regions. For Regional availability and a future roadmap, search the instance type in the CloudFormation resources tab of AWS Capabilities by Region.

You can purchase these instances as On-Demand Instances and Savings Plan. To learn more, visit the Amazon EC2 Pricing page.

Give Hpc8a instances a try in the Amazon EC2 console. To learn more, visit the Amazon EC2 Hpc8a instances page and send feedback to AWS re:Post for EC2 or through your usual AWS Support contacts.

Channy

AWS Weekly Roundup: Claude Opus 4.6 in Amazon Bedrock, AWS Builder ID Sign in with Apple, and more (February 9, 2026)

Post Syndicated from Sébastien Stormacq original https://aws.amazon.com/blogs/aws/aws-weekly-roundup-claude-opus-4-6-in-amazon-bedrock-aws-builder-id-sign-in-with-apple-and-more-february-9-2026/

Here are the notable launches and updates from last week that can help you build, scale, and innovate on AWS.

Last week’s launches
Here are the launches that got my attention this week.

Let’s start with news related to compute and networking infrastructure:

  • Introducing Amazon EC2 C8id, M8id, and R8id instances: These new Amazon EC2 C8id, M8id, and R8id instances are powered by custom Intel Xeon 6 processors. These instances offer up to 43% higher performance and 3.3x more memory bandwidth compared to previous generation instances.
  • AWS Network Firewall announces new price reductions: The service has added the hourly and data processing discounts on NAT Gateways that are service-chained with Network Firewall secondary endpoints. Additionally, AWS Network Firewall has removed additional data processing charges for Advanced Inspection, which enables Transport Layer Security (TLS) inspection of encrypted network traffic.
  • Amazon ECS adds Network Load Balancer support for Linear and Canary deployments: Applications that commonly use NLB, such as those requiring TCP/UDP-based connections, low latency, long-lived connections, or static IP addresses, can take advantage of managed, incremental traffic shifting natively from ECS when rolling out updates.
  • AWS Config now supports 30 new resource types: These range across key services including Amazon EKS, Amazon Q, and AWS IoT. This expansion provides greater coverage over your AWS environment, enabling you to more effectively discover, assess, audit, and remediate an even broader range of resources.
  • Amazon DynamoDB global tables now support replication across multiple AWS accounts: DynamoDB global tables are a fully managed, serverless, multi-Region, and multi-active database. With this new capability, you can replicate tables across AWS accounts and Regions to improve resiliency, isolate workloads at the account level, and apply distinct security and governance controls.
  • Amazon RDS now provides an enhanced console experience to connect to a database: The new console experience provides ready-made code snippets for Java, Python, Node.js, and other programming languages as well as tools like the psql command line utility. These code snippets are automatically adjusted based on your database’s authentication settings. For example, if your cluster uses IAM authentication, the generated code snippets will use token-based authentication to connect to the database. The console experience also includes integrated CloudShell access, offering the ability to connect to your databases directly from within the RDS console.

Then, I noticed three news items related to security and how you authenticate on AWS:

  • AWS Builder ID now supports Sign in with Apple: AWS Builder ID, your profile for accessing AWS applications including AWS Builder Center, AWS Training and Certification, AWS re:Post, AWS Startups, and Kiro, now supports sign-in with Apple as a social login provider. This expansion of sign-in options builds on the existing sign-in with Google capability, providing Apple users with a streamlined way to access AWS resources without managing separate credentials on AWS.
  • AWS STS now supports validation of select identity provider specific claims from Google, GitHub, CircleCI and OCI: You can reference these custom claims as condition keys in IAM role trust policies and resource control policies, expanding your ability to implement fine-grained access control for federated identities and help you establish your data perimeters. This enhancement builds upon IAM’s existing OIDC federation capabilities, which allow you to grant temporary AWS credentials to users authenticated through external OIDC-compatible identity providers.
  • AWS Management Console now displays Account Name on the Navigation bar for easier account identification: You now have an easy way to identify your accounts at a glance. You can now quickly distinguish between accounts visually using the account name that appears in the navigation bar for all authorized users in that account.
  • Amazon CloudFront announces mutual TLS support for origins: Now with origin mTLS support, you can implement a standardized, certificate-based authentication approach that eliminates operational burden. This enables organizations to enforce strict authentication for their proprietary content, ensuring that only verified CloudFront distributions can establish connections to backend infrastructure ranging from AWS origins and on-premises servers to third-party cloud providers and external CDNs.

Finally, there is not a single week without news around AI :

  • Claude Opus 4.6 now available in Amazon Bedrock: Opus 4.6 is Anthropic’s most intelligent model to date and a premier model for coding, enterprise agents, and professional work. Claude Opus 4.6 brings advanced capabilities to Amazon Bedrock customers, including industry-leading performance for agentic tasks, complex coding projects, and enterprise-grade workflows that require deep reasoning and reliability.
  • Structured outputs now available in Amazon Bedrock: Amazon Bedrock now supports structured outputs, a capability that provides consistent, machine-readable responses from foundation models that adhere to your defined JSON schemas. Instead of prompting for valid JSON and adding extra checks in your application, you can specify the format you want and receive responses that match it—making production workflows more predictable and resilient.

Upcoming AWS events
Check your calendars so that you can sign up for this upcoming event:

AWS Community Day Romania (April 23–24, 2026): This community-led AWS event brings together developers, architects, entrepreneurs, and students for more than 10 professional sessions delivered by AWS Heroes, Solutions Architects, and industry experts. Attendees can expect expert-led technical talks, insights from speakers with global conference experience, and opportunities to connect during dedicated networking breaks, all hosted at a premium venue designed to support collaboration and community engagement.

If you’re looking for more ways to stay connected beyond this event, join the AWS Builder Center to learn, build, and connect with builders in the AWS community.

Check back next Monday for another Weekly Roundup.

— seb

Amazon EC2 C8id, M8id, and R8id instances with up to 22.8 TB local NVMe storage are generally available

Post Syndicated from Channy Yun (윤석찬) original https://aws.amazon.com/blogs/aws/amazon-ec2-c8id-m8id-and-r8id-instances-with-up-to-22-8-tb-local-nvme-storage-are-generally-available/

Last year, we launched the Amazon Elastic Compute Cloud (Amazon EC2) C8i instances, M8i instances, and R8i instances powered by custom Intel Xeon 6 processors available only on AWS with sustained all-core 3.9 GHz turbo frequency. They deliver the highest performance and fastest memory bandwidth among comparable Intel processors in the cloud.

Today we’re announcing new Amazon EC2 C8id, M8id, and R8id instances backed by up to 22.8TB of NVMe-based SSD block-level instance storage physically connected to the host server. These instances offer 3 times more vCPUs, memory and local storage compared to previous sixth-generation instances.

These instances deliver up to 43% higher compute performance and 3.3 times more memory bandwidth compared to previous sixth-generation instances. They also deliver up to 46% higher performance for I/O intensive database workloads, and up to 30% faster query results for I/O intensive real-time data analytics compared to previous sixth generation instances.

  • C8id instances are ideal for compute-intensive workloads, including those that need access to high-speed, low-latency local storage like video encoding, image manipulation, and other forms of media processing.
  • M8id instances are best for workloads that require a balance of compute and memory resources along with high-speed, low-latency local block storage, including data logging, media processing, and medium-sized data stores.
  • R8id instances are designed for memory-intensive workloads such as large-scale SQL and NoSQL databases, in-memory databases, large-scale data analytics, and AI inference.

C8id, M8id, and R8id instances now scale up to 96xlarge (versus 32xlarge sizes in the sixth generation) with up to 384 vCPUs, 3TiB of memory, and 22.8TB of local storage that make it easier to scale up applications and drive greater efficiencies. These instances also offer two bare metal sizes (metal-48xl and metal-96xl), allowing you to right size your instances and deploy your most performance sensitive workloads that benefit from direct access to physical resources.

The instances are available in 11 sizes per family, as well as two bare metal configurations each:

Instance Name vCPUs Memory (GiB) (C/M/R) Local NVMe storage (GB) Network bandwidth (Gbps) EBS bandwidth (Gbps)
large 2 4/8/16* 1 x 118 Up to 12.5 Up to 10
xlarge 4 8/16/32* 1 x 237 Up to 12.5 Up to 10
2xlarge 8 16/32/64* 1 x 474 Up to 15 Up to 10
4xlarge 16 32/64/128* 1 x 950 Up to 15 Up to 10
8xlarge 32 64/128/256* 1 x 1,900 15 10
12xlarge 48 96/192/384* 1 x 2,850 22.5 15
16xlarge 64 128/256/512* 1 x 3,800 30 20
24xlarge 96 192/384/768* 2 x 2,850 40 30
32xlarge 128 256/512/1024* 2 x 3,800 50 40
48xlarge 192 384/768/1536* 3 x 3,800 75 60
96xlarge 384 768/1536/3072* 6 x 3,800 100 80
metal-48xl 192 384/768/1536* 3 x 3,800 75 60
metal-96xl 384 768/1536/3072* 6 x 3,800 100 80

*Memory values are for C8id/M8id/R8id respectively.

These instances support the Instance Bandwidth Configuration (IBC) feature like other eighth-generation instance types, offering flexibility to allocate resources between network and Amazon Elastic Block Store (Amazon EBS) bandwidth. You can scale network or EBS bandwidth by 25%, allocating resources optimally for each workload. These instances also use sixth-generation AWS Nitro cards offloading CPU virtualization, storage, and networking functions to dedicated hardware and software, enhancing performance and security for your workloads.

You can use any Amazon Machine Images (AMIs) that include drivers for the Elastic Network Adapter (ENA) and NVMe to fully utilize the performance and capabilities. All current generation AWS Windows and Linux AMIs come with the AWS NVMe driver installed by default. If you use an AMI that does not have the AWS NVMe driver, you can manually install AWS NVMe drivers.

As I noted in my previous blog post, here are a couple of things to remind you about the local NVMe storage on these instances:

  • You don’t have to specify a block device mapping in your AMI or during the instance launch; the local storage will show up as one or more devices (/dev/nvme[0-26]n1 on Linux) after the guest operating system has booted.
  • Each local NVMe device is hardware encrypted using the XTS-AES-256 block cipher and a unique key. Each key is destroyed when the instance is stopped or terminated.
  • Local NVMe devices have the same lifetime as the instance they are attached to and do not persist after the instance has been stopped or terminated.

To learn more, visit Amazon EBS volumes and NVMe in the Amazon EBS User Guide.
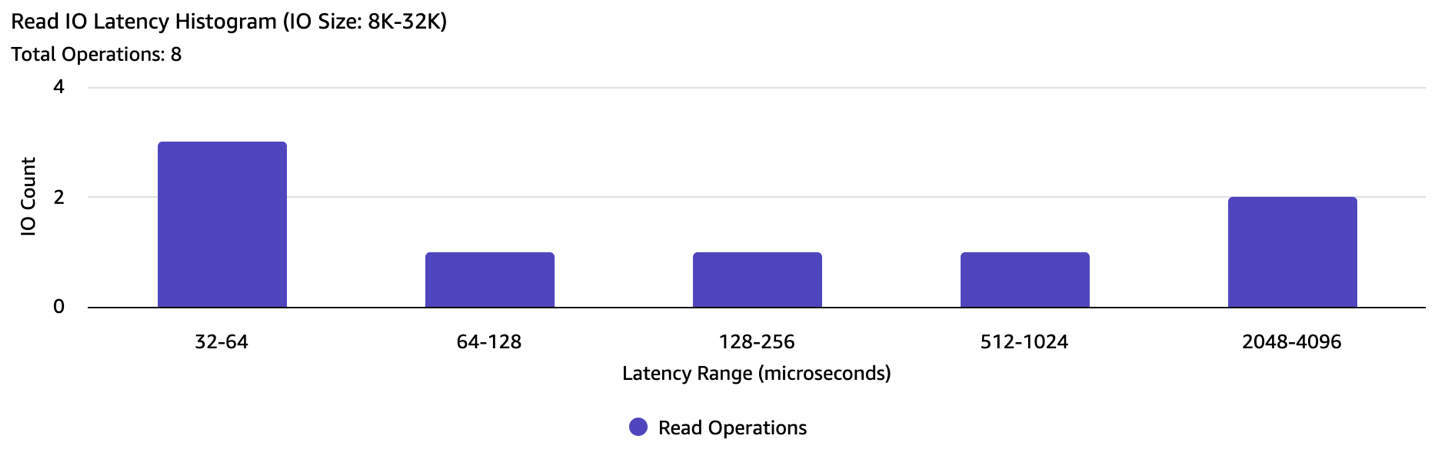
Now available
Amazon EC2 C8id, M8id and R8id instances are available in US East (N. Virginia), US East (Ohio), and US West (Oregon) AWS Regions. R8id instances are additionally available in Europe (Frankfurt) Region. For Regional availability and a future roadmap, search the instance type in the CloudFormation resources tab of AWS Capabilities by Region.

You can purchase these instances as On-Demand Instances, Savings Plans, and Spot Instances. These instances are also available as Dedicated Instances and Dedicated Hosts. To learn more, visit the Amazon EC2 Pricing page.

Give C8id, M8id, and R8id instances a try in the Amazon EC2 console. To learn more, visit the EC2 C8i instances, M8i instances, and R8i instances page and send feedback to AWS re:Post for EC2 or through your usual AWS Support contacts.

Channy

Announcing Amazon EC2 G7e instances accelerated by NVIDIA RTX PRO 6000 Blackwell Server Edition GPUs

Post Syndicated from Channy Yun (윤석찬) original https://aws.amazon.com/blogs/aws/announcing-amazon-ec2-g7e-instances-accelerated-by-nvidia-rtx-pro-6000-blackwell-server-edition-gpus/

Today, we’re announcing the general availability of Amazon Elastic Compute Cloud (Amazon EC2) G7e instances that deliver cost-effective performance for generative AI inference workloads and the highest performance for graphics workloads.

G7e instances are accelerated by the NVIDIA RTX PRO 6000 Blackwell Server Edition GPUs and are well suited for a broad range of GPU-enabled workloads including spatial computing and scientific computing workloads. G7e instances deliver up to 2.3 times inference performance compared to G6e instances.

Improvements made compared to predecessors:

  • NVIDIA RTX PRO 6000 Blackwell GPUs — NVIDIA RTX PRO 6000 Blackwell Server Edition GPUs offer two times the GPU memory and 1.85 times the GPU memory bandwidth compared to G6e instances. By using the higher GPU memory offered by G7e instances, you can run medium-sized models of up to 70B parameters with FP8 precision on a single GPU.
  • NVIDIA GPUDirect P2P — For models that are too large to fit into the memory of a single GPU, you can split the model or computations across multiple GPUs. G7e instances reduce the latency of your multi-GPU workloads with support for NVIDIA GPUDirect P2P, which enables direct communication between GPUs over PCIe interconnect. These instances offer the lowest peer to peer latency for GPUs on the same PCIe switch. Additionally, G7e instances offer up to four times the inter-GPU bandwidth compared to L40s GPUs featured in G6e instances, boosting the performance of multi-GPU workloads. These improvements mean you can run inference for larger models across multiple GPUs offering up to 768 GB of GPU memory in a single node.
  • Networking — G7e instances offer four times the networking bandwidth compared to G6e instances, which means you can use the instance for small-scale multi-node workloads. Additionally, multi-GPU G7e instances support NVIDIA GPUDirect Remote Direct Memory Access (RDMA) with Elastic Fabric Adapter (EFA), which reduces the latency of remote GPU-to-GPU communication for multi-node workloads. These instance sizes also support NVIDIA GPUDirectStorage with Amazon FSx for Lustre, which increases throughput by up to 1.2 Tbps to the instances compared to G6e instances, which means you can quickly load your models.

EC2 G7e specifications
G7e instances feature up to 8 NVIDIA RTX PRO 6000 Blackwell Server Edition GPUs with up to 768 GB of total GPU memory (96 GB of memory per GPU) and Intel Emerald Rapids processors. They also support up to 192 vCPUs, up to 1,600 Gbps of network bandwidth, up to 2,048 GiB of system memory, and up to 15.2 TB of local NVMe SSD storage.

Here are the specs:

Instance name
 GPUs GPU memory (GB) vCPUs Memory (GiB) Storage (TB) EBS bandwidth (Gbps) Network bandwidth (Gbps)
g7e.2xlarge 1 96 8 64 1.9 x 1 Up to 5 50
g7e.4xlarge 1 96 16 128 1.9 x 1 8 50
g7e.8xlarge 1 96 32 256 1.9 x 1 16 100
g7e.12xlarge 2 192 48 512 3.8 x 1 25 400
g7e.24xlarge 4 384 96 1024 3.8 x 2 50 800
g7e.48xlarge 8 768 192 2048 3.8 x 4 100 1600

To get started with G7e instances, you can use the AWS Deep Learning AMIs (DLAMI) for your machine learning (ML) workloads. To run instances, you can use AWS Management Console, AWS Command Line Interface (AWS CLI) or AWS SDKs. For a managed experience, you can use G7e instances with Amazon Elastic Container Service (Amazon ECS), Amazon Elastic Kubernetes Service (Amazon EKS). Support for Amazon SageMaker AI is also coming soon.

Now available
Amazon EC2 G7e instances are available today in the US East (N. Virginia) and US East (Ohio) AWS Regions. For Regional availability and a future roadmap, search the instance type in the CloudFormation resources tab of AWS Capabilities by Region.

The instances can be purchased as On-Demand Instances, Savings Plan, and Spot Instances. G7e instances are also available in Dedicated Instances and Dedicated Hosts. To learn more, visit the Amazon EC2 Pricing page.

Give G7e instances a try in the Amazon EC2 console. To learn more, visit the Amazon EC2 G7e instances page and send feedback to AWS re:Post for EC2 or through your usual AWS Support contacts.

Channy

AWS Weekly Roundup: Kiro CLI latest features, AWS European Sovereign Cloud, EC2 X8i instances, and more (January 19, 2026)

Post Syndicated from Veliswa Boya original https://aws.amazon.com/blogs/aws/aws-weekly-roundup-kiro-cli-latest-features-aws-european-sovereign-cloud-ec2-x8i-instances-and-more-january-19-2026/

At the end of 2025 I was happy to take a long break to enjoy the incredible summers that the southern hemisphere provides. I’m back and writing my first post in 2026 which also happens to be my last post for the AWS News Blog (more on this later).

The AWS community is starting the year strong with various AWS re:invent re:Caps being hosted around the globe, with some communities already hosting their AWS Community Day events, the AWS Community Day Tel Aviv 2026 was hosted last week.

Last week’s launches
Here are last week’s launches that caught my attention:

  • Kiro CLI latest features – Kiro CLI now has granular controls for web fetch URLs, keyboard shortcuts for your custom agents, enhanced diff views, and much more. With these enhancements, you can now use allowlists or blocklists to restrict which URLs the agent can access, ensure a frictionless experience when working with multiple specialized agents in a single session, to name a few.
  • AWS European Sovereign Cloud – Following an announcement in 2023 of plans to build a new, independent cloud infrastructure, last week we announced the general availability of the AWS European Sovereign Cloud to all customers. The cloud is ready to meet the most stringent sovereignty requirements of European customers with a comprehensive set of AWS services.
  • Amazon EC2 X8i instancesPreviously launched in preview at AWS re:Invent 2025, last week we announced the general availability of new memory-optimized Amazon Elastic Compute Cloud (Amazon EC2) X8i instances. These instances are powered by custom Intel Xeon 6 processors with a sustained all-core turbo frequency of 3.9 GHz, available only on AWS. These SAP certified instances deliver the highest performance and fastest memory bandwidth among comparable Intel processors in the cloud.

Additional updates
These projects, blog posts, and news articles also caught my attention:

  • 5 core features in Amazon Quick Suite – AWS VP Agentic AI Swami Sivasubramanian talks about how he uses Amazon Quick Suite for just about everything. In October 2025 we announced Amazon Quick Suite, a new agentic teammate that quickly answers your questions at work and turns insights into actions for you. Amazon Quick Suite has become one of my favorite productivity tools, helping me with my research on various topics in addition to providing me with multiple perspectives on a topic.
  • Deploy AI agents on Amazon Bedrock AgentCore using GitHub Actions – Last year we announced Amazon Bedrock AgentCore, a flexible service that helps you seamlessly create and manage AI agents across different frameworks and models, whether hosted on Amazon Bedrock or other environments. Learn how to use a GitHub Actions workflow to automate the deployment of AI agents on AgentCore Runtime. This approach delivers a scalable solution with enterprise-level security controls, providing complete continuous integration and delivery (CI/CD) automation.

Upcoming AWS events
Join us January 28 or 29 (depending on your time zone) for Best of AWS re:Invent, a free virtual event where we bring you the most impactful announcements and top sessions from AWS re:Invent. Jeff Barr, AWS VP and Chief Evangelist, will share his highlights during the opening session.

There is still time until January 21 to compete for $250,000 in prizes and AWS credits in the Global 10,000 AIdeas Competition (yes, the second letter is an I as in Idea, not an L as in like). No code required yet: simply submit your idea, and if you’re selected as a semifinalist, you’ll build your app using Kiro within AWS Free Tier limits. Beyond the cash prizes and potential featured placement at AWS re:Invent 2026, you’ll gain hands-on experience with next-generation AI tools and connect with innovators globally.

Earlier this month, the 2026 application for the Community Builders program launched. The application is open until January 21st, midnight PST so here’s your last chance to ensure that you don’t miss out.

If you’re interested in these opportunities, join the AWS Builder Center to learn with builders in the AWS community.

With that, I close one of my most meaningful chapters here at AWS. It’s been an absolute pleasure to write for you and I thank you for taking the time to read the work that my team and I pour our absolute hearts into. I’ve grown from the close collaborations with the launch teams and the feedback from all of you. The Sub-Sahara Africa (SSA) community has grown significantly, and I want to dedicate more time focused on this community, I’m still at AWS and I look forward to meeting at an event near you!

Check back next Monday for another Weekly Roundup!

Veliswa Boya

Amazon EC2 X8i instances powered by custom Intel Xeon 6 processors are generally available for memory-intensive workloads

Post Syndicated from Channy Yun (윤석찬) original https://aws.amazon.com/blogs/aws/amazon-ec2-x8i-instances-powered-by-custom-intel-xeon-6-processors-are-generally-available-for-memory-intensive-workloads/

Since a preview launch at AWS re:Invent 2025, we’re announcing the general availability of new memory-optimized Amazon Elastic Compute Cloud (Amazon EC2) X8i instances. These instances are powered by custom Intel Xeon 6 processors with a sustained all-core turbo frequency of 3.9 GHz, available only on AWS. These SAP certified instances deliver the highest performance and fastest memory bandwidth among comparable Intel processors in the cloud.

X8i instances are ideal for memory-intensive workloads including in-memory databases such as SAP HANA, traditional large-scale databases, data analytics, and electronic design automation (EDA), which require high compute performance and a large memory footprint.

These instances provide 1.5 times more memory capacity (up to 6 TB), and 3.4 times more memory bandwidth compared to previous generation X2i instances. These instances offer up to 43% higher performance compared to X2i instances, with higher gains on some of the real-world workloads. They deliver up to 50% higher SAP Application Performance Standard (SAPS) performance, up to 47% faster PostgreSQL performance, up to 88% faster Memcached performance, and up to 46% faster AI inference performance.

During the preview, customers like RISE with SAP utilized up to 6 TB of memory capacity with 50% higher compute performance compared to X2i instances. This enabled faster transaction processing and improved query response times for SAP HANA workloads. Orion reduced the number of active cores on X8i instances compared to X2idn instances while maintaining performance thresholds, cutting SQL Server licensing costs by 50%.

X8i instances
X8i instances are available in 14 sizes including three larger instance sizes (48xlarge, 64xlarge, and 96xlarge), so you can choose the right size for your application to scale up, and two bare metal sizes (metal-48xl and metal-96xl) to deploy workloads that benefit from direct access to physical resources. X8i instances feature up to 100 Gbps of network bandwidth with support for the Elastic Fabric Adapter (EFA) and up to 80 Gbps of throughput to Amazon Elastic Block Store (Amazon EBS).

Here are the specs for X8i instances:

Instance name vCPUs Memory
(GiB)
Network bandwidth (Gbps) EBS bandwidth (Gbps)
x8i.large 2 32 Up to 12.5 Up to 10
x8i.xlarge 4 64 Up to 12.5 Up to 10
x8i.2xlarge 8 128 Up to 15 Up to 10
x8i.4xlarge 16 256 Up to 15 Up to 10
x8i.8xlarge 32 512 15 10
x8i.12xlarge 48 768 22.5 15
x8i.16xlarge 64 1,024 30 20
x8i.24xlarge 96 1,536 40 30
x8i.32xlarge 128 2,048 50 40
x8i.48xlarge 192 3,072 75 60
x8i.64xlarge 256 4,096 80 70
x8i.96xlarge 384 6,144 100 80
x8i.metal-48xl 192 3,072 75 60
x8i.metal-96xl 384 6,144 100 80

X8i instances support the instance bandwidth configuration (IBC) feature like other eighth-generation instance types, offering flexibility to allocate resources between network and EBS bandwidth. You can scale network or EBS bandwidth by up to 25%, improving database performance, query processing speeds, and logging efficiency. These instances also use sixth-generation AWS Nitro cards, which offload CPU virtualization, storage, and networking functions to dedicated hardware and software, enhancing performance and security for your workloads.

Now available
Amazon EC2 X8i instances are now available in US East (N. Virginia), US East (Ohio), US West (Oregon), and Europe (Frankfurt) AWS Regions. For Regional availability and a future roadmap, search the instance type in the CloudFormation resources tab of AWS Capabilities by Region.

You can purchase these instances as On-Demand Instances, Savings Plan, and Spot Instances. To learn more, visit the Amazon EC2 Pricing page.

Give X8i instances a try in the Amazon EC2 console. To learn more, visit the Amazon EC2 X8i instances page and send feedback to AWS re:Post for EC2 or through your usual AWS Support contacts.

Channy

Happy New Year! AWS Weekly Roundup: 10,000 AIdeas Competition, Amazon EC2, Amazon ECS Managed Instances and more (January 5, 2026)

Post Syndicated from Prasad Rao original https://aws.amazon.com/blogs/aws/happy-new-year-aws-weekly-roundup-10000-aideas-competition-amazon-ec2-amazon-ecs-managed-instances-and-more-january-5-2026/

Happy New Year! I hope the holidays gave you time to recharge and spend time with your loved ones.

Like every year, I took a few weeks off after AWS re:Invent to rest and plan ahead. I used some of that downtime to plan the next cohort for Become a Solutions Architect (BeSA). BeSA is a free mentoring program that I, along with a few other Amazon Web Services (AWS) employees, volunteer to host as a way to help people excel in their cloud and AI careers. We’re kicking off a 6-week cohort on “Agentic AI on AWS” starting February 21, 2026. Visit the BeSA website to learn more.

There is still time to submit your idea for the Global 10,000 AIdeas Competition and compete for $250,000 in cash prizes, AWS credits, and recognition, including potential featured placement at AWS re:Invent 2026 and across AWS channels.

You will gain hands-on experience with next-generation AI development tools, connect with innovators globally, and access technical enablement through biweekly workshops, AWS User Groups, and AWS Builder Center resources.

The deadline is January 21, 2026, and no code is required yet. If you’re selected as a semifinalist, you’ll build your app then. Your finished app needs to use Kiro for at least part of development, stay within AWS Free Tier limits, and be completely original and not yet published.

If you haven’t yet caught up with all the new releases and announcements from AWS re:Invent 2025, check out our top announcements post or watch the keynotes, innovation talks, and breakout sessions on-demand.

Launches from the last few weeks
I’d like to highlight some launches that got my attention since our last Week in Review on December 15, 2025:

  • Amazon EC2 M8gn and M8gb instances – New M8gn and M8gb instances are powered by AWS Graviton4 processors to deliver up to 30% better compute performance than AWS Graviton3 processors. M8gn instances feature the latest 6th generation AWS Nitro Cards, and offer up to 600 Gbps network bandwidth, the highest network bandwidth among network-optimized EC2 instances. M8gb offer up to 150 Gbps of Amazon EBS bandwidth to provide higher EBS performance compared to same-sized equivalent Graviton4-based instances.
  • AWS Direct Connect supports resilience testing with AWS Fault Injection Service – You can now use AWS Fault Injection Service to test how your applications handle Direct Connect Border Gateway Protocol (BGP) failover in a controlled environment. For example, you can validate that traffic routes to redundant virtual interfaces when a primary virtual interface’s BGP session is disrupted and your applications continue to function as expected.
  • New AWS Security Hub controls in AWS Control Tower – AWS Control Tower now supports 176 additional Security Hub controls in the Control Catalog, covering use cases including security, cost, durability, and operations. With this launch, you can search, discover, enable, and manage these controls directly from AWS Control Tower to govern additional use cases across your multi-account environment.
  • AWS Transform supports network conversion for hybrid data center migrations – You can now use AWS Transform for VMware to automatically convert networks from hybrid data centers. This removes manual network mapping for environments running both VMware and other workloads. The service analyzes VLANs and IP ranges across all exported source networks and maps them to AWS constructs such as virtual private clouds (VPCs), subnets, and security groups.
  • NVIDIA Nemotron 3 Nano available on Amazon Bedrock – Amazon Bedrock now supports NVIDIA Nemotron 3 Nano 30B A3B model, NVIDIA’s latest breakthrough in efficient language modeling that delivers high reasoning performance, built-in tool calling support, and extended context processing with 256K token context window.
  • Amazon EC2 supports Availability Zone ID across its APIs – You can specify the Availability Zone ID (AZ ID) parameter directly in your Amazon EC2 APIs to guarantee consistent placement of resources. AZ IDs are consistent and static identifiers that represent the same physical location across all AWS accounts, helping you optimize resource placement. Prior to this launch, you had to use an AZ name while creating a resource, but these names could map to different physical locations. This mapping made it difficult to ensure resources were always co-located, especially when operating with multiple accounts.
  • Amazon ECS Managed Instances supports Amazon EC2 Spot Instances – Amazon ECS Managed Instances now supports Amazon EC2 Spot Instances, extending the range of capabilities available with AWS managed infrastructure. You can use spare EC2 capacity at up to 90% discount compared to On-Demand prices for fault-tolerant workloads in Amazon ECS Managed Instances.

See AWS What’s New for more launch news that I haven’t covered here. That’s all for this week. Check back next Monday for another Weekly Roundup!

Here’s to a fantastic start to 2026. Happy building!

– Prasad

Modernize Apache Spark workflows using Spark Connect on Amazon EMR on Amazon EC2

Post Syndicated from Philippe Wanner original https://aws.amazon.com/blogs/big-data/modernize-apache-spark-workflows-using-spark-connect-on-amazon-emr-on-amazon-ec2/

Apache Spark Connect, introduced in Spark 3.4, enhances the Spark ecosystem by offering a client-server architecture that separates the Spark runtime from the client application. Spark Connect enables more flexible and efficient interactions with Spark clusters, particularly in scenarios where direct access to cluster resources is limited or impractical.

A key use case for Spark Connect on Amazon EMR is to be able to connect directly from your local development environments to Amazon EMR clusters. By using this decoupled approach, you can write and test Spark code on your laptop while using Amazon EMR clusters for execution. This capability reduces development time and simplifies data processing with Spark on Amazon EMR.

In this post, we demonstrate how to implement Apache Spark Connect on Amazon EMR on Amazon Elastic Compute Cloud (Amazon EC2) to build decoupled data processing applications. We show how to set up and configure Spark Connect securely, so you can develop and test Spark applications locally while executing them on remote Amazon EMR clusters.

Solution architecture

The architecture centers on an Amazon EMR cluster with two node types. The primary node hosts both the Spark Connect API endpoint and Spark Core components, serving as the gateway for client connections. The core node provides additional compute capacity for distributed processing. Although this solution demonstrates the architecture with two nodes for simplicity, it scales to support multiple core and task nodes based on workload requirements.

In Apache Spark Connect version 4.x, TLS/SSL network encryption is not inherently supported. We show you how to implement secure communications by deploying an Amazon EMR cluster with Spark Connect on Amazon EC2 using an Application Load Balancer (ALB) with TLS termination as the secure interface. This approach enables encrypted data transmission between Spark Connect clients and Amazon Virtual Private Cloud (Amazon VPC) resources.

The operational flow is as follows:

  1. Bootstrap script – During Amazon EMR initialization, the primary node fetches and executes the start-spark-connect.sh file from Amazon Simple Storage Service (Amazon S3). This script starts the Spark Connect server.
  2. Server availability – When the bootstrap process is complete, the Spark Server enters a waiting state, ready to accept incoming connections. The Spark Connect API endpoint becomes available on the configured port (typically 15002), listening for gRPC connection from remote clients.
  3. Client interaction – Spark Connect clients can establish secure connections to an Application Load Balancer. These clients translate DataFrame operations into unresolved logical query plans, encode these plans using protocol buffers, and send them to the Spark Connect API using gRPC.
  4. Encryption in transit – The Application Load Balancer receives incoming gRPC or HTTPS traffic, performs TLS termination (decrypting the traffic), and forwards the requests to the primary node. The certificate is stored in AWS Certificate Manager (ACM).
  5. Request processing – The Spark Connect API receives the unresolved logical plans, translates them into Spark’s built-in logical plan operators, passes them to Spark Core for optimization and execution, and streams results back to the client as Apache Arrow-encoded row batches.
  6. (Optional) Operational access – Administrators can securely connect to both primary and core nodes through Session Manager, a capability of AWS Systems Manager, enabling troubleshooting and maintenance without exposing SSH ports or managing key pairs.

The following diagram depicts the architecture of this post’s demonstration for submitting Spark unresolved logical plans to EMR clusters using Spark Connect.

Apache Spark Connect on Amazon EMR solution architecture diagram

Apache Spark Connect on Amazon EMR solution architecture diagram

Prerequisites

To proceed with this post, ensure you have the following:

Implementation steps

In this recipe, through AWS CLI commands, you will:

  1. Prepare the bootstrap script, a bash script starting Spark Connect on Amazon EMR.
  2. Set up the permissions for Amazon EMR to provision resources and perform service-level actions with other AWS services.
  3. Create the Amazon EMR cluster with these associated roles and permissions and eventually attach the prepared script as a bootstrap action.
  4. Deploy the Application Load Balancer and certificate with ACM secure data in transit over the internet.
  5. Modify the primary node’s security group to allow Spark Connect clients to connect.
  6. Connect with a test application connecting the client to Spark Connect server.

Prepare the bootstrap script

To prepare the bootstrap script, follow these steps:

  1. Create an Amazon S3 bucket to host the bootstrap bash script:
    REGION=
    BUCKET_NAME=
    aws s3api create-bucket \
       --bucket $BUCKET_NAME \ 
       --region $REGION \
       --create-bucket-configuration LocationConstraint=$REGION

  2. Open your preferred text editor, add the following commands in a new file with a name such start-spark-connect.sh. If the script runs on the primary node, it starts Spark Connect server. If it runs on a task or core node, it does nothing:
    #!/bin/bash
    if grep isMaster /mnt/var/lib/info/instance.json | grep false;
    then
        echo "This is not master node, do nothing."
        exit 0
    fi
    echo "This is master, continuing to execute script"
    SPARK_HOME=/usr/lib/spark
    SPARK_VERSION=$(spark-submit --version 2>&1 | grep "version" | head -1 | awk '{print $NF}' | grep -oE '[0-9]+\.[0-9]+\.[0-9]+')
    SCALA_VERSION=$(spark-submit --version 2>&1 | grep -o "Scala version [0-9.]*" | awk '{print $3}' | grep -oE '[0-9]+\.[0-9]+')
    echo "Spark version ${SPARK_VERSION} is installed under ${SPARK_HOME} running with scala version ${SCALA_VERSION}"
    sudo "${SPARK_HOME}"/sbin/start-connect-server.sh --packages org.apache.spark:spark-connect_"${SCALA_VERSION}:${SPARK_VERSION}"

  3. Upload the script into the bucket created in step 1:
    aws s3 cp start-spark-connect.sh s3://$BUCKET_NAME
    

Set up the permissions

Before creating the cluster, you must create the service role, and instance profile. A service role is an IAM role that Amazon EMR assumes to provision resources and perform service-level actions with other AWS services. An EC2 instance profile for Amazon EMR assigns a role to every EC2 instance in a cluster. The instance profile must specify a role that can access the resources for your bootstrap action.

  1. Create the IAM role:
    aws iam create-role \
    --role-name AmazonEMR-ServiceRole-SparkConnectDemo \
    --assume-role-policy-document '{
    	"Version": "2012-10-17",
    	"Statement": [{
    		"Effect": "Allow",
    		"Principal": {"Service": "elasticmapreduce.amazonaws.com"},
    		"Action": "sts:AssumeRole"
    		}]
    }'
    

  2. Attach the necessary managed policies to the service role to allow Amazon EMR to manage the underlying services Amazon EC2 and Amazon S3 on your behalf and optionally grant an instance to interact with Systems Manager:
    aws iam attach-role-policy \
    --role-name AmazonEMR-ServiceRole-SparkConnectDemo \
    --policy-arn arn:aws:iam::aws:policy/service-role/AmazonEMRServicePolicy_v2
    
    aws iam attach-role-policy \
    --role-name AmazonEMR-ServiceRole-SparkConnectDemo \
    --policy-arn arn:aws:iam::aws:policy/AmazonSSMManagedInstanceCore
    
    aws iam attach-role-policy \
    --role-name AmazonEMR-ServiceRole-SparkConnectDemo \
    --policy-arn arn:aws:iam::aws:policy/service-role/AmazonElasticMapReduceRole
    

  3. Create an Amazon EMR instance role to grant permissions to EC2 instances to interact with Amazon S3 or other AWS services:
    aws iam create-role \
    --role-name EMR_EC2_SparkClusterNodesRole \
    --assume-role-policy-document '{
    "Version": "2012-10-17",
    "Statement": [{
       "Effect": "Allow",
       "Principal": {"Service": "ec2.amazonaws.com"},
       "Action": "sts:AssumeRole"
       }]
    }'
    

  4. To allow the primary instance to read from Amazon S3, attach the AmazonS3ReadOnlyAccess policy to the Amazon EMR instance role. For production environments, this access policy should be reviewed and replaced with a custom policy following the principle of least privilege, granting only the specific permissions needed for your use case:
    aws iam attach-role-policy \
    --role-name EMR_EC2_SparkClusterNodesRole \
    --policy-arn arn:aws:iam::aws:policy/AmazonS3ReadOnlyAccess
    

  5. Attaching AmazonSSMManagedInstanceCore policy enables the instances to use core Systems Manager features, such as Session Manager, and Amazon CloudWatch:
    aws iam attach-role-policy \
    --role-name EMR_EC2_SparkClusterNodesRole \
    --policy-arn arn:aws:iam::aws:policy/AmazonSSMManagedInstanceCore
    

  6. To pass the EMR_EC2_SparkClusterInstanceProfile IAM role information to the EC2 instances when they start, create the Amazon EMR EC2 instance profile:
    aws iam create-instance-profile \
    --instance-profile-name EMR_EC2_SparkClusterInstanceProfile
    

  7. Attach the role EMR_EC2_SparkClusterNodesRole created in step 3 to the newly instance profile:
    aws iam add-role-to-instance-profile \
    --instance-profile-name EMR_EC2_SparkClusterInstanceProfile \
    --role-name EMR_EC2_SparkClusterNodesRole
    

Create the Amazon EMR cluster

To create the Amazon EMR cluster, follow these steps:

  1. Set the environment variables, where your EMR cluster and load-balancer must be deployed:
    VPC_ID=<vpc-emr-and-alb>
    EMR_PRI_SB_ID_1=<emr-private-subnet-id-az1>
    ALB_PUB_SB_ID_1=<alb-public-subnet-id-az1>
    ALB_PUB_SB_ID_2=<alb-public-subnet-id-az2>
    

  2. Create the EMR cluster with the latest Amazon EMR release. Replace the placeholder value with your actual S3 bucket name where the bootstrap action script is stored:
    CLUSTER_ID=$(aws emr create-cluster \
    --name "Spark Connect cluster demo" \
    --applications Name=Spark \
    --release-label emr-7.9.0 \
    --service-role AmazonEMR-ServiceRole-SparkConnectDemo \
    --ec2-attributes InstanceProfile=EMR_EC2_SparkClusterInstanceProfile,SubnetId=$EMR_PRI_SB_ID_1 \
    --instance-groups InstanceGroupType=MASTER,InstanceCount=1,InstanceType=m5.xlarge InstanceGroupType=CORE,InstanceCount=1,InstanceType=m5.xlarge \
    --bootstrap-actions Path="s3://$BUCKET_NAME/start-spark-connect.sh" \
    --query 'ClusterId' --output text)
    echo CLUSTER_ID="$CLUSTER_ID"
    

    To modify primary node’s security group to allow Systems Manager to start a session.

  3. Get the primary node’s security group identifier. Record the identifier because you’ll need it for subsequent configuration steps in which primary-node-security-group-id is mentioned:
    PRIMARY_NODE_SG=$(aws emr describe-cluster \
    --cluster-id $CLUSTER_ID \
    --query 'Cluster.Ec2InstanceAttributes.EmrManagedMasterSecurityGroup' \
    --output text)
    echo PRIMARY_NODE_SG=$PRIMARY_NODE_SG
    

  4. Find the EC2 instance connect prefix list ID for your Region. You can use the EC2_INSTANCE_CONNECT filter with the describe-managed-prefix-lists command. Using a managed prefix list provides a dynamic security configuration to authorize Systems Manager EC2 instances to connect the primary and core nodes by SSH:
    IC_PREFIX_LIST=$(aws ec2 describe-managed-prefix-lists \
    --filters Name=prefix-list-name,Values=com.amazonaws.$REGION.ec2-instance-connect \
    --query 'PrefixLists[0].PrefixListId' \
    --output text)
    echo IC_PREFIX_LIST=$IC_PREFIX_LIST
    

  5. Modify the primary node security group inbound rules to allow SSH access (port 22) to the EMR cluster’s primary node from resources that are part of the specified Instance Connect service contained in the prefix list:
    aws ec2 authorize-security-group-ingress \
    --region $REGION \
    --group-id $PRIMARY_NODE_SG \
    --ip-permissions "[{\"IpProtocol\":\"tcp\",\"FromPort\":22,\"ToPort\":22,\"PrefixListIds\":[{\"PrefixListId\":\"$IC_PREFIX_LIST\"}]}]"
    

Optionally, you can repeat the preceding steps 1–3 for the core (and tasks) cluster’s nodes to allow Amazon EC2 Instance Connect to access the EC2 instance through SSH.

Deploy the Application Load Balancer and certificate

To deploy the Application Load Balancer and certificate, follow these steps:

  1. Create a load balancer’s security group:
    ALB_SG_ID=$(aws ec2 create-security-group \
    --group-name spark-connect-alb-sg \
    --description "Security group for Spark Connect ALB" \
    --region $REGION \
    --vpc-id $VPC_ID \
    --query 'GroupId' \
    --output text)
    

  2. Add rule to accept TCP traffic from a trusted IP on port 443. We recommend that you use the local development machine’s IP address. You can check your current public IP address here: https://checkip.amazonaws.com:
    aws ec2 authorize-security-group-ingress \
    --group-id $ALB_SG_ID \
    --protocol tcp \
    --port 443 \
    --cidr <replace-with-trusted-IP>/32
    

  3. Create a new target group with gRPC protocol, which targets the Spark Connect server instance and the port the server is listening to:
    ALB_TG_ARN=$(aws elbv2 create-target-group \
    --name spark-connect-tg \
    --protocol HTTP \
    --protocol-version GRPC \
    --port 15002 \
    --target-type instance \
    --health-check-enabled \
    --health-check-protocol HTTP \
    --health-check-path / \
    --vpc-id $VPC_ID \
    --query 'TargetGroups[0].TargetGroupArn' \
    --output text)
    echo "ALB TG created (ARN)=$ALB_TG_ARN"
    

  4. Create the Application Load Balancer:
    ALB_ARN=$(aws elbv2 create-load-balancer \
    --name spark-connect-alb \
    --type application \
    --scheme internet-facing \
    --subnets $ALB_PUB_SB_ID_1 $ALB_PUB_SB_ID_2 \
    --security-groups $ALB_SG_ID \
    --query 'LoadBalancers[0].LoadBalancerArn' \
    --output text)
    echo "ALB created (ARN)=$ALB_ARN"
    

  5. Get the load balancer DNS name:
    ALB_DNS=$(aws elbv2 describe-load-balancers \
    --load-balancer-arns $ALB_ARN \
    --query 'LoadBalancers[0].DNSName' \
    --output text)
    echo "ALB DNS=$ALB_DNS"
    

  6. Retrieve the Amazon EMR primary node ID:
    PRIMARY_NODE_ID=$(aws emr list-instances --cluster-id $CLUSTER_ID --instance-group-types MASTER --query 'Instances[0].Ec2InstanceId' --output text)
    echo PRIMARY_NODE_ID=$PRIMARY_NODE_ID
    

  7. (Optional) To encrypt and decrypt the traffic, the load balancer needs a certificate. You can skip this step if you already have a trusted certificate in ACM. Otherwise, create a self-signed certificate:
    PRIVATE_KEY_PATH=./sc-private-key.key
    CERTIFICATE_PATH=./sc-certificate.cert
    sudo openssl req -x509 -nodes -days 365 -newkey rsa:2048 -keyout $PRIVATE_KEY_PATH -out $CERTIFICATE_PATH -subj "/CN=$ALB_DNS"
    

  8. Upload to ACM:
    ACM_CERT_ARN=$(aws acm import-certificate \
    --certificate fileb://$CERTIFICATE_PATH \
    --private-key fileb://$PRIVATE_KEY_PATH \
    --region $REGION \
    --query CertificateArn \
    --output text)
    echo "Certificate created (ARN)=$ACM_CERT_ARN"
    

  9. Create the load balancer listener:
    ALB_LISTENER_ARN=$(aws elbv2 create-listener \
    --load-balancer-arn $ALB_ARN \
    --protocol HTTPS \
    --port 443 \
    --certificates CertificateArn=$ACM_CERT_ARN \
    --ssl-policy ELBSecurityPolicy-TLS13-1-2-2021-06 \
    --default-actions Type=forward,TargetGroupArn=$ALB_TG_ARN \
    --region $REGION \
    --query 'Listeners[0].ListenerArn' \
    --output text)
    echo "ALB listener created (ARN)=$ALB_LISTENER_ARN"
    

  10. After the listener has been provisioned, register the primary node to the target group:
    aws elbv2 register-targets \
    --target-group-arn $ALB_TG_ARN \
    --targets Id=$PRIMARY_NODE_ID
    

Modify the primary node’s security group to allow Spark Connect clients to connect

To connect to Spark Connect, amend only the primary security group. Add an inbound rule to the primary’s node security group to accept Spark Connect TCP connection on port 15002 from your chosen trusted IP address:

aws ec2 authorize-security-group-ingress \
--group-id $PRIMARY_NODE_SG \
--protocol tcp \
--port 15002 \
--source-group $ALB_SG_ID

Connect with a test application

This example demonstrates that a client running a newer Spark version (4.0.1) can successfully connect to an older Spark version on the Amazon EMR cluster (3.5.5), showcasing Spark Connect’s version compatibility feature. This version combination is for demonstration only. Running older versions might pose security risks in production environments.

To test the client-to-server connection, we provide the following test Python application. We recommend that you create and activate a Python virtual environment (venv) before installing the packages. This helps isolate the dependencies for this specific project and prevents conflicts with other Python projects. To install packages, run the following command:

pip install pyspark-client==4.0.1

In your integrated development environment (IDE), copy and paste the following code, replace the placeholder, and invoke it. The code creates a Spark DataFrame containing two rows and it shows its data:

from pyspark.sql import SparkSession
import os
os.environ['GRPC_DEFAULT_SSL_ROOTS_FILE_PATH'] = os.path.expanduser('sc-certificate.cert')
spark = SparkSession.builder \
    .remote("sc://:443/;use_ssl=true") \
    .config('spark.sql.execution.pandas.inferPandasDictAsMap', True) \
    .config('spark.sql.pyspark.legacy.inferMapTypeFromFirstPair.enabled', True) \
    .getOrCreate()
spark.createDataFrame([("sue", 32),("li", 3)],["first_name", "age"]).show()

The following shows the application output:

+----------+---+
|first_name|age|
+----------+---+
|       sue| 32|
|        li|  3|
+----------+---+

Clean up

When you no longer need the cluster, release the following resources to stop incurring charges:

  1. Delete the Application Load Balancer listener, target group, and the load balancer.
  2. Delete the ACM certificate.
  3. Delete the load balancer and Amazon EMR node security groups.
  4. Terminate the EMR cluster.
  5. Empty the Amazon S3 bucket and delete it.
  6. Remove AmazonEMR-ServiceRole-SparkConnectDemo and EMR_EC2_SparkClusterNodesRole roles and EMR_EC2_SparkClusterInstanceProfile instance profile.

Considerations

Security considerations with Spark Connect:

  • Private subnet deployment – Keep EMR clusters in private subnets with no direct internet access, using NAT gateways for outbound connectivity only.
  • Access logging and monitoring – Enable VPC Flow Logs, AWS CloudTrail, and bastion host access logs for audit trails and security monitoring.
  • Security group restrictions – Configure security groups to allow Spark Connect port (15002) access only from bastion host or specific IP ranges.

Conclusion

In this post, we showed how you can adopt modern development workflows and debug Spark applications from local IDEs or notebooks, so you can step through code execution. With Spark Connect’s client-server architecture, the Spark cluster can run on a different version than the client applications, so operations teams can perform infrastructure upgrades and patches independently.

As the cluster operators gain experience, they can customize the bootstrap actions and add steps to process data. Consider exploring Amazon Managed Workflows for Apache Airflow (MWAA) for orchestrating your data pipeline.


About the authors

Philippe Wanner

Philippe Wanner

Philippe is EMEA Tech Lead at AWS. His role is to accelerate the digital transformation for large organizations. His current focus is in a multidisciplinary area involving business transformation, technical strategy, and distributed systems.

Ege Oguzman

Ege Oguzman

Ege is a Software Development Engineer at AWS, and previously he was a Solutions Architect in the public sector. As a builder and cloud enthusiast, he specializes in distributed systems and dedicates his time to infrastructure development and helping organizations build solutions on AWS.