Post Syndicated from Jon Handler original https://aws.amazon.com/blogs/big-data/amazon-opensearch-h2-2023-in-review/
2023 was been a busy year for Amazon OpenSearch Service! Learn more about the releases that OpenSearch Service launched in the first half of 2023.
In the second half of 2023, OpenSearch Service added the support of two new OpenSearch versions: 2.9 and 2.11 These two versions introduce new features in the search space, machine learning (ML) search space, migrations, and the operational side of the service.
With the release of zero-ETL integration with Amazon Simple Storage Service (Amazon S3), you can analyze your data sitting in your data lake using OpenSearch Service to build dashboards and query the data without the need to move your data from Amazon S3.
OpenSearch Service also announced a new zero-ETL integration with Amazon DynamoDB through the DynamoDB plugin for Amazon OpenSearch Ingestion. OpenSearch Ingestion takes care of bootstrapping and continuously streams data from your DynamoDB source.
OpenSearch Serverless announced the general availability of the Vector Engine for Amazon OpenSearch Serverless along with other features to enhance your experience with time series collections, manage your cost for development environments, and quickly scale your resources to match your workload demands.
In this post, we discuss the new releases in OpenSearch Service to empower your business with search, observability, security analytics, and migrations.
Build cost-effective solutions with OpenSearch Service
With the zero-ETL integration for Amazon S3, OpenSearch Service now lets you query your data in place, saving cost on storage. Data movement is an expensive operation because you need to replicate data across different data stores. This increases your data footprint and drives cost. Moving data also adds the overhead of managing pipelines to migrate the data from one source to a new destination.
OpenSearch Service also added new instance types for data nodes—Im4gn and OR1—to help you further optimize your infrastructure cost. With a maximum 30 TB non-volatile memory (NVMe) solid state drives (SSD), the Im4gn instance provides dense storage and better performance. OR1 instances use segment replication and remote-backed storage to greatly increase throughput for indexing-heavy workloads.
Zero-ETL from DynamoDB to OpenSearch Service
In November 2023, DynamoDB and OpenSearch Ingestion introduced a zero-ETL integration for OpenSearch Service. OpenSearch Service domains and OpenSearch Serverless collections provide advanced search capabilities, such as full-text and vector search, on your DynamoDB data. With a few clicks on the AWS Management Console, you can now seamlessly load and synchronize your data from DynamoDB to OpenSearch Service, eliminating the need to write custom code to extract, transform, and load the data.

Direct query (zero-ETL for Amazon S3 data, in preview)
OpenSearch Service announced a new way for you to query operational logs in Amazon S3 and S3-based data lakes without needing to switch between tools to analyze operational data. Previously, you had to copy data from Amazon S3 into OpenSearch Service to take advantage of OpenSearch’s rich analytics and visualization features to understand your data, identify anomalies, and detect potential threats.
However, continuously replicating data between services can be expensive and requires operational work. With the OpenSearch Service direct query feature, you can access operational log data stored in Amazon S3, without needing to move the data itself. Now you can perform complex queries and visualizations on your data without any data movement.
Support of Im4gn with OpenSearch Service
Im4gn instances are optimized for workloads that manage large datasets and need high storage density per vCPU. Im4gn instances come in sizes large through 16xlarge, with up to 30 TB in NVMe SSD disk size. Im4gn instances are built on AWS Nitro System SSDs, which offer high-throughput, low-latency disk access for best performance. OpenSearch Service Im4gn instances support all OpenSearch versions and Elasticsearch versions 7.9 and above. For more details, refer to Supported instance types in Amazon OpenSearch Service.
Introducing OR1, an OpenSearch Optimized Instance family for indexing heavy workloads
In November 2023, OpenSearch Service launched OR1, the OpenSearch Optimized Instance family, which delivers up to 30% price-performance improvement over existing instances in internal benchmarks and uses Amazon S3 to provide 11 9s of durability. A domain with OR1 instances uses Amazon Elastic Block Store (Amazon EBS) volumes for primary storage, with data copied synchronously to Amazon S3 as it arrives. OR1 instances use OpenSearch’s segment replication feature to enable replica shards to read data directly from Amazon S3, avoiding the resource cost of indexing in both primary and replica shards. The OR1 instance family also supports automatic data recovery in the event of failure. For more information about OR1 instance type options, refer to Current generation instance types in OpenSearch Service.
Enable your business with security analytics features
The Security Analytics plugin in OpenSearch Service supports out-of-the-box prepackaged log types and provides security detection rules (SIGMA rules) to detect potential security incidents.
In OpenSearch 2.9, the Security Analytics plugin added support for customer log types and native support for Open Cybersecurity Schema Framework (OCSF) data format. With this new support, you can build detectors with OCSF data stored in Amazon Security Lake to analyze security findings and mitigate any potential incident. The Security Analytics plugin has also added the possibility to create your own custom log types and create custom detection rules.
Build ML-powered search solutions
In 2023, OpenSearch Service invested in eliminating the heavy lifting required to build next-generation search applications. With features such as search pipelines, search processors, and AI/ML connectors, OpenSearch Service enabled rapid development of search applications powered by neural search, hybrid search, and personalized results. Additionally, enhancements to the kNN plugin improved storage and retrieval of vector data. Newly launched optional plugins for OpenSearch Service enable seamless integration with additional language analyzers and Amazon Personalize.
Search pipelines
Search pipelines provide new ways to enhance search queries and improve search results. You define a search pipeline and then send your queries to it. When you define the search pipeline, you specify processors that transform and augment your queries, and re-rank your results. The prebuilt query processors include date conversion, aggregation, string manipulation, and data type conversion. The results processor in the search pipeline intercepts and adapts results on the fly before rendering to next phase. Both request and response processing for the pipeline are performed on the coordinator node, so there is no shard-level processing.
Optional plugins
OpenSearch Service lets you associate preinstalled optional OpenSearch plugins to use with your domain. An optional plugin package is compatible with a specific OpenSearch version, and can only be associated to domains with that version. Available plugins are listed on the Packages page on the OpenSearch Service console. The optional plugin includes the Amazon Personalize plugin, which integrates OpenSearch Service with Amazon Personalize, and new language analyzers such as Nori, Sudachi, STConvert, and Pinyin.
Support for new language analyzers
OpenSearch Service added support for four new language analyzer plugins: Nori (Korean), Sudachi (Japanese), Pinyin (Chinese), and STConvert Analysis (Chinese). These are available in all AWS Regions as optional plugins that you can associate with domains running any OpenSearch version. You can use the Packages page on the OpenSearch Service console to associate these plugins to your domain, or use the Associate Package API.
Neural search feature
Neural search is generally available with OpenSearch Service version 2.9 and later. Neural search allows you to integrate with ML models that are hosted remotely using the model serving framework. When you use a neural query during search, neural search converts the query text into vector embeddings, uses vector search to compare the query and document embedding, and returns the closest results. During ingestion, neural search transforms document text into vector embedding and indexes both the text and its vector embeddings in a vector index.
Integration with Amazon Personalize
OpenSearch Service introduced an optional plugin to integrate with Amazon Personalize in OpenSearch versions 2.9 or later. The OpenSearch Service plugin for Amazon Personalize Search Ranking allows you to improve the end-user engagement and conversion from your website and application search by taking advantage of the deep learning capabilities offered by Amazon Personalize. As an optional plugin, the package is compatible with OpenSearch version 2.9 or later, and can only be associated to domains with that version.
Efficient query filtering with OpenSearch’s k-NN FAISS
OpenSearch Service introduced efficient query filtering with OpenSearch’s k-NN FAISS in version 2.9 and later. OpenSearch’s efficient vector query filters capability intelligently evaluates optimal filtering strategies—pre-filtering with approximate nearest neighbor (ANN) or filtering with exact k-nearest neighbor (k-NN)—to determine the best strategy to deliver accurate and low-latency vector search queries. In earlier OpenSearch versions, vector queries on the FAISS engine used post-filtering techniques, which enabled filtered queries at scale, but potentially returning less than the requested “k” number of results. Efficient vector query filters deliver low latency and accurate results, enabling you to employ hybrid search across vector and lexical techniques.
Byte-quantized vectors in OpenSearch Service
With the new byte-quantized vector introduced with 2.9, you can reduce memory requirements by a factor of 4 and significantly reduce search latency, with minimal loss in quality (recall). With this feature, the usual 32-bit floats that are used for vectors are quantized or converted to 8-bit signed integers. For many applications, existing float vector data can be quantized with little loss in quality. Comparing benchmarks, you will find that using byte vectors rather than 32-bit floats results in a significant reduction in storage and memory usage while also improving indexing throughput and reducing query latency. An internal benchmark showed the storage usage was reduced by up to 78%, and RAM usage was reduced by up to 59% (for the glove-200-angular dataset). Recall values for angular datasets were lower than those of Euclidean datasets.
AI/ML connectors
OpenSearch 2.9 and later supports integrations with ML models hosted on AWS services or third-party platforms. This allows system administrators and data scientists to run ML workloads outside of their OpenSearch Service domain. The ML connectors come with a supported set of ML blueprints—templates that define the set of parameters you need to provide when sending API requests to a specific connector. OpenSearch Service provides connectors for several platforms, such as Amazon SageMaker, Amazon Bedrock, OpenAI ChatGPT, and Cohere.
OpenSearch Service console integrations
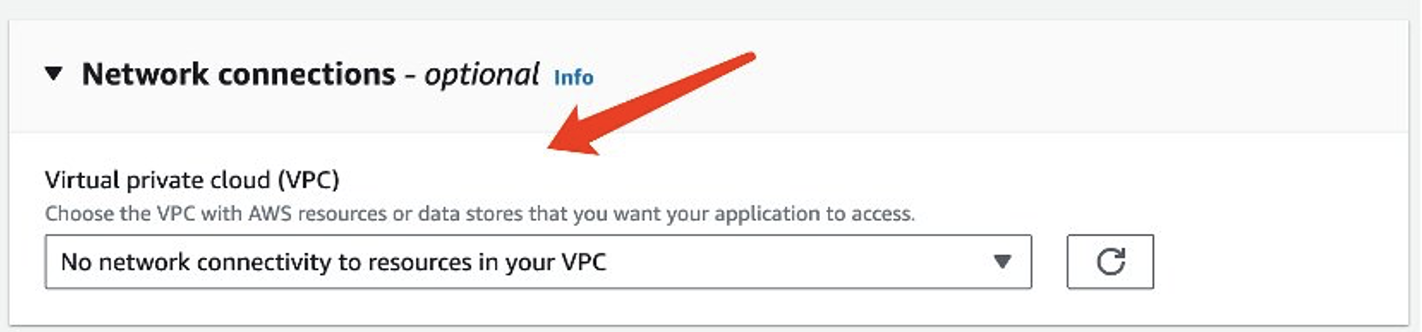
OpenSearch 2.9 and later added a new integrations feature on the console. Integrations provides you with an AWS CloudFormation template to build your semantic search use case by connecting to your ML models hosted on SageMaker or Amazon Bedrock. The CloudFormation template generates the model endpoint and registers the model ID with the OpenSearch Service domain you provide as input to the template.
Hybrid search and range normalization
The normalization processor and hybrid query builds on top of the two features released earlier in 2023—neural search and search pipelines. Because lexical and semantic queries return relevance scores on different scales, fine-tuning hybrid search queries was difficult.
OpenSearch Service 2.11 now supports a combination and normalization processor for hybrid search. You can now perform hybrid search queries, combining a lexical and a natural language-based k-NN vector search queries. OpenSearch Service also enables you to tune your hybrid search results for maximum relevance using multiple scoring combination and normalization techniques.
Multimodal search with Amazon Bedrock
OpenSearch Service 2.11 launches the support of multimodal search that allows you to search text and image data using multimodal embedding models. To generate vector embeddings, you need to create an ingest pipeline that contains a text_image_embedding processor, which converts the text or image binaries in a document field to vector embeddings. You can use the neural query clause, either in the k-NN plugin API or Query DSL queries, to do a combination of text and images searches. You can use the new OpenSearch Service integration features to quickly start with multimodal search.
Neural sparse retrieval
Neural sparse search, a new efficient method of semantic retrieval, is available in OpenSearch Service 2.11. Neural sparse search operates in two modes: bi-encoder and document-only. With the bi-encoder mode, both documents and search queries are passed through deep encoders. In document-only mode, only documents are passed through deep encoders, while search queries are tokenized. A document-only sparse encoder generates an index that is 10.4% of the size of a dense encoding index. For a bi-encoder, the index size is 7.2% of the size of a dense encoding index. Neural sparse search is enabled by sparse encoding models that create sparse vector embeddings: a set of <token: weight> pairs representing the text entry and its corresponding weight in the sparse vector. To learn more about the pre-trained models for sparse neural search, refer to Sparse encoding models.
Neural sparse search reduces costs, improves search relevance, and has lower latency. You can use the new OpenSearch Service integrations features to quickly start with neural sparse search.
OpenSearch Ingestion updates
OpenSearch Ingestion is a fully managed and auto scaled ingestion pipeline that delivers your data to OpenSearch Service domains and OpenSearch Serverless collections. Since its release in 2023, OpenSearch Ingestion continues to add new features to make it straightforward to transform and move your data from supported sources to downstream destinations like OpenSearch Service, OpenSearch Serverless, and Amazon S3.
New migration features in OpenSearch Ingestion
In November 2023, OpenSearch Ingestion announced the release of new features to support data migration from self-managed Elasticsearch version 7.x domains to the latest versions of OpenSearch Service.
OpenSearch Ingestion also supports the migration of data from OpenSearch Service managed domains running OpenSearch version 2.x to OpenSearch Serverless collections.
Learn how you can use OpenSearch Ingestion to migrate your data to OpenSearch Service.

Improve data durability with OpenSearch Ingestion
In November 2023, OpenSearch Ingestion introduced persistent buffering for push-based sources likes HTTP sources (HTTP, Fluentd, FluentBit) and OpenTelemetry collectors.
By default, OpenSearch Ingestion uses in-memory buffering. With persistent buffering, OpenSearch Ingestion stores your data in a disk-based store that is more resilient. If you have existing ingestion pipelines, you can enable persistent buffering for these pipelines, as shown in the following screenshot.

Support of new plugins
In early 2023, OpenSearch Ingestion added support for Amazon Managed Streaming for Apache Kafka (Amazon MSK). OpenSearch Ingestion uses the Kafka plugin to stream data from Amazon MSK to OpenSearch Service managed domains or OpenSearch Serverless collections. To learn more about setting up Amazon MSK as a data source, see Using an OpenSearch Ingestion pipeline with Amazon Managed Streaming for Apache Kafka.
OpenSearch Serverless updates
OpenSearch Serverless continued to enhance your serverless experience with OpenSearch by introducing the support of a new collection of type vector search to store embeddings and run similarity search. OpenSearch Serverless now supports shard replica scaling to handle spikes in query throughput. And if you are using a time series collection, you can now set up your custom data retention policy to match your data retention requirements.
Vector Engine for OpenSearch Serverless
In November 2023, we launched the vector engine for Amazon OpenSearch Serverless. The vector engine makes it straightforward to build modern ML-augmented search experiences and generative artificial intelligence (generative AI) applications without needing to manage the underlying vector database infrastructure. It also enables you to run hybrid search, combining vector search and full-text search in the same query, removing the need to manage and maintain separate data stores or a complex application stack.
OpenSearch Serverless lower-cost dev and test environments
OpenSearch Serverless now supports development and test workloads by allowing you to avoid running a replica. Removing replicas eliminates the need to have redundant OCUs in another Availability Zone solely for availability purposes. If you are using OpenSearch Serverless for development and testing, where availability is not a concern, you can drop your minimum OCUs from 4 to 2.
OpenSearch Serverless supports automated time-based data deletion using data lifecycle policies
In December 2023, OpenSearch Serverless announced support for managing data retention of time series collections and indexes. With the new automated time-based data deletion feature, you can specify how long you want to retain data. OpenSearch Serverless automatically manages the lifecycle of the data based on this configuration. To learn more, refer to Amazon OpenSearch Serverless now supports automated time-based data deletion.
OpenSearch Serverless announced support for scaling up replicas at shard level
At launch, OpenSearch Serverless supported increasing capacity automatically in response to growing data sizes. With the new shard replica scaling feature, OpenSearch Serverless automatically detects shards under duress due to sudden spikes in query rates and dynamically adds new shard replicas to handle the increased query throughput while maintaining fast response times. This approach proves to be more cost-efficient than simply adding new index replicas.
AWS user notifications to monitor your OCU usage
With this launch, you can configure the system to send notifications when OCU utilization is approaching or has reached maximum configured limits for search or ingestion. With the new AWS User Notification integration, you can configure the system to send notifications whenever the capacity threshold is breached. The User Notification feature eliminates the need to monitor the service constantly. For more information, see Monitoring Amazon OpenSearch Serverless using AWS User Notifications.
Enhance your experience with OpenSearch Dashboards
OpenSearch 2.9 in OpenSearch Service introduced new features to make it straightforward to quickly analyze your data in OpenSearch Dashboards. These new features include the new out-of-the box, preconfigured dashboards with OpenSearch Integrations, and the ability to create alerting and anomaly detection from an existing visualization in your dashboards.
OpenSearch Dashboard integrations
OpenSearch 2.9 added the support of OpenSearch integrations in OpenSearch Dashboards. OpenSearch integrations include preconfigured dashboards so you can quickly start analyzing your data coming from popular sources such as AWS CloudFront, AWS WAF, AWS CloudTrail, and Amazon Virtual Private Cloud (Amazon VPC) flow logs.

Alerting and anomalies in OpenSearch Dashboards
In OpenSearch Service 2.9, you can create a new alerting monitor directly from your line chart visualization in OpenSearch Dashboards. You can also associate the existing monitors or detectors previously created in OpenSearch to the dashboard visualization.
This new feature helps reduce context switching between dashboards and both the Alerting or Anomaly Detection plugins. Refer to the following dashboard to add an alerting monitor to detect drops in average data volume in your services.

OpenSearch expands geospatial aggregations support
With OpenSearch version 2.9, OpenSearch Service added the support of three types of geoshape data aggregation through API: geo_bounds, geo_hash, and geo_tile.
The geoshape field type provides the possibility to index location data in different geographic formats such as a point, a polygon, or a linestring. With the new aggregation types, you have more flexibility to aggregate documents from an index using metric and multi-bucket geospatial aggregations.
OpenSearch Service operational updates
OpenSearch Service removed the need to run blue/green deployment when changing the domain managed nodes. Additionally, the service improved the Auto-Tune events with the support of new Auto-Tune metrics to track the changes within your OpenSearch Service domain.
OpenSearch Service now lets you update domain manager nodes without blue/green deployment
As of early H2 of 2023, OpenSearch Service allowed you to modify the instance type or instance count of dedicated cluster manager nodes without the need for blue/green deployment. This enhancement allows quicker updates with minimal disruption to your domain operations, all while avoiding any data movement.
Previously, updating your dedicated cluster manager nodes on OpenSearch Service meant using a blue/green deployment to make the change. Although blue/green deployments are meant to avoid any disruption to your domains, because the deployment utilizes additional resources on the domain, it is recommended that you perform them during low-traffic periods. Now you can update cluster manager instance types or instance counts without requiring a blue/green deployment, so these updates can complete faster while avoiding any potential disruption to your domain operations. In cases where you modify both the domain manager instance type and count, OpenSearch Service will still use a blue/green deployment to make the change. You can use the dry-run option to check whether your change requires a blue/green deployment.
Enhanced Auto-Tune experience
In September 2023, OpenSearch Service added new Auto-Tune metrics and improved Auto-Tune events that give you better visibility into the domain performance optimizations made by Auto-Tune.
Auto-Tune is an adaptive resource management system that automatically updates OpenSearch Service domain resources to improve efficiency and performance. For example, Auto-Tune optimizes memory-related configuration such as queue sizes, cache sizes, and Java virtual machine (JVM) settings on your nodes.
With this launch, you can now audit the history of the changes, as well as track them in real time from the Amazon CloudWatch console.
Additionally, OpenSearch Service now publishes details of the changes to Amazon EventBridge when Auto-Tune settings are recommended or applied to an OpenSearch Service domain. These Auto-Tune events will also be visible on the Notifications page on the OpenSearch Service console.
Accelerate your migration to OpenSearch Service with the new Migration Assistant solution
In November 2023, the OpenSearch team launched a new open-source solution—Migration Assistant for Amazon OpenSearch Service. The solution supports data migration from self-managed Elasticsearch and OpenSearch domains to OpenSearch Service, supporting Elasticsearch 7.x (<=7.10), OpenSearch 1.x, and OpenSearch 2.x as migration sources. The solution facilitates the migration of the existing and live data between source and destination.
Conclusion
In this post, we covered the new releases in OpenSearch Service to help you innovate your business with search, observability, security analytics, and migrations. We provided you with information about when to use each new feature in OpenSearch Service, OpenSearch Ingestion, and OpenSearch Serverless.
Learn more about OpenSearch Dashboards and OpenSearch plugins and the new exciting OpenSearch assistant using OpenSearch playground.
Check out the features described in this post, and we appreciate you providing us your valuable feedback.
About the Authors
 Jon Handler is a Senior Principal Solutions Architect at Amazon Web Services based in Palo Alto, CA. Jon works closely with OpenSearch and Amazon OpenSearch Service, providing help and guidance to a broad range of customers who have search and log analytics workloads that they want to move to the AWS Cloud. Prior to joining AWS, Jon’s career as a software developer included 4 years of coding a large-scale, ecommerce search engine. Jon holds a Bachelor of the Arts from the University of Pennsylvania, and a Master of Science and a PhD in Computer Science and Artificial Intelligence from Northwestern University.
 Hajer Bouafif is an Analytics Specialist Solutions Architect at Amazon Web Services. She focuses on Amazon OpenSearch Service and helps customers design and build well-architected analytics workloads in diverse industries. Hajer enjoys spending time outdoors and discovering new cultures.
 Aruna Govindaraju is an Amazon OpenSearch Specialist Solutions Architect and has worked with many commercial and open source search engines. She is passionate about search, relevancy, and user experience. Her expertise with correlating end-user signals with search engine behavior has helped many customers improve their search experience.
 Prashant Agrawal is a Sr. Search Specialist Solutions Architect with Amazon OpenSearch Service. He works closely with customers to help them migrate their workloads to the cloud and helps existing customers fine-tune their clusters to achieve better performance and save on cost. Before joining AWS, he helped various customers use OpenSearch and Elasticsearch for their search and log analytics use cases. When not working, you can find him traveling and exploring new places. In short, he likes doing Eat → Travel → Repeat.
 Muslim Abu Taha is a Sr. OpenSearch Specialist Solutions Architect dedicated to guiding clients through seamless search workload migrations, fine-tuning clusters for peak performance, and ensuring cost-effectiveness. With a background as a Technical Account Manager (TAM), Muslim brings a wealth of experience in assisting enterprise customers with cloud adoption and optimize their different set of workloads. Muslim enjoys spending time with his family, traveling and exploring new places.


 Brandon Abear is a Principal Data Engineer in the Data & Analytics (DnA) organization at GoDaddy. He enjoys all things big data. In his spare time, he enjoys traveling, watching movies, and playing rhythm games.
 Dinesh Sharma is a Principal Data Engineer in the Data & Analytics (DnA) organization at GoDaddy. He is passionate about user experience and developer productivity, always looking for ways to optimize engineering processes and saving cost. In his spare time, he loves reading and is an avid manga fan.
 John Bush is a Principal Software Engineer in the Data & Analytics (DnA) organization at GoDaddy. He is passionate about making it easier for organizations to manage data and use it to drive their businesses forward. In his spare time, he loves hiking, camping, and riding his ebike.
 Ozcan Ilikhan is the Director of Engineering for the Data and ML Platform at GoDaddy. He has over two decades of multidisciplinary leadership experience, spanning startups to global enterprises. He has a passion for leveraging data and AI in creating solutions that delight customers, empower them to achieve more, and boost operational efficiency. Outside of his professional life, he enjoys reading, hiking, gardening, volunteering, and embarking on DIY projects.
 Harsh Vardhan is an AWS Solutions Architect, specializing in big data and analytics. He has over 8 years of experience working in the field of big data and data science. He is passionate about helping customers adopt best practices and discover insights from their data.


 Jeremy Ber has been working in the telemetry data space for the past 10 years as a Software Engineer, Machine Learning Engineer, and most recently a Data Engineer. At AWS, he is a Streaming Specialist Solutions Architect, supporting both Amazon Managed Streaming for Apache Kafka (Amazon MSK) and Amazon Managed Service for Apache Flink.
 Lorenzo Nicora works as Senior Streaming Solution Architect at AWS, helping customers across EMEA. He has been building cloud-native, data-intensive systems for over 25 years, working in the finance industry both through consultancies and for FinTech product companies. He has leveraged open-source technologies extensively and contributed to several projects, including Apache Flink.


 Edvin Hallvaxhiu is a Senior Global Security Architect with AWS Professional Services and is passionate about cybersecurity and automation. He helps customers build secure and compliant solutions in the cloud. Outside work, he likes traveling and sports.
 Rahul Shaurya is a Principal Big Data Architect with AWS Professional Services. He helps and works closely with customers building data platforms and analytical applications on AWS. Outside of work, Rahul loves taking long walks with his dog Barney.
 Andrea Montanari is a Senior Big Data Architect with AWS Professional Services. He actively supports customers and partners in building analytics solutions at scale on AWS.
 María Guerra is a Big Data Architect with AWS Professional Services. Maria has a background in data analytics and mechanical engineering. She helps customers architecting and developing data related workloads in the cloud.
 Pushpraj Singh is a Senior Data Architect with AWS Professional Services. He is passionate about Data and DevOps engineering. He helps customers build data driven applications at scale.


 Manjit Chakraborty is a Senior Solutions Architect at AWS. He is a Seasoned & Result driven professional with extensive experience in Financial domain having worked with customers on advising, designing, leading, and implementing core-business enterprise solutions across the globe. In his spare time, Manjit enjoys fishing, practicing martial arts and playing with his daughter.
 Neeraj Roy is a Principal Solutions Architect at AWS based out of London. He works with Global Financial Services customers to accelerate their AWS journey. In his spare time, he enjoys reading and spending time with his family.


 Amy Tseng is a Managing Director of Data and Analytics(DnA) Integration at BMO. She is one of the AWS Data Hero. She has over 7 years of experiences in Data and Analytics Cloud migrations in AWS. Outside of work, Amy loves traveling and hiking.
 Jack Lin is a Director of Engineering on the Data Platform at BMO. He has over 20 years of experience working in platform engineering and software engineering. Outside of work, Jack loves playing soccer, watching football games and traveling.
 Regis Chow is a Director of DnA Integration at BMO. He has over 5 years of experience working in the cloud and enjoys solving problems through innovation in AWS. Outside of work, Regis loves all things outdoors, he is especially passionate about golf and lawn care.
 Nishchai JM is an Analytics Specialist Solutions Architect at Amazon Web services. He specializes in building Big-data applications and help customer to modernize their applications on Cloud. He thinks Data is new oil and spends most of his time in deriving insights out of the Data.
 Harshida Patel is a Principal Solutions Architect, Analytics with AWS.
 Raghu Kuppala is an Analytics Specialist Solutions Architect experienced working in the databases, data warehousing, and analytics space. Outside of work, he enjoys trying different cuisines and spending time with his family and friends.
 Rahul Sharma is a Technical Account Manager at Amazon Web Services. He is passionate about the data technologies that help leverage data as a strategic asset and is based out of New York city, New York.
 Farhan Angullia is a Cloud Application Architect at AWS Professional Services, based in Singapore. He primarily focuses on modern applications with microservice software patterns, and advocates for implementing robust CI/CD practices to optimize the software delivery lifecycle for customers. He enjoys contributing to the open source Terraform ecosystem in his spare time.
 Arjun Nambiar is a Product Manager with Amazon OpenSearch Service. He focusses on ingestion technologies that enable ingesting data from a wide variety of sources into Amazon OpenSearch Service at scale. Arjun is interested in large scale distributed systems and cloud-native technologies and is based out of Seattle, Washington.


 Rajesh, a Senior Database Solution Architect. He specializes in assisting customers with designing, migrating, and optimizing database solutions on Amazon Web Services, ensuring scalability, security, and performance. In his spare time, he loves spending time outdoors with family and friends.
 Sylvia, a Senior DevOps Architect, specializes in designing and automating DevOps processes to guide clients through their DevOps transformation journey. During her leisure time, she finds joy in activities such as biking, swimming, practicing yoga, and photography.


 Kanwar Bajwa is an Enterprise Support Lead at AWS who works with customers to optimize their use of AWS services and achieve their business objectives.
 Swapna Bandla is a Senior Solutions Architect in the AWS Analytics Specialist SA Team. Swapna has a passion towards understanding customers data and analytics needs and empowering them to develop cloud-based well-architected solutions. Outside of work, she enjoys spending time with her family.


 Venkata Kampana is a Senior Solutions Architect in the AWS Health and Human Services team and is based in Sacramento, CA. In that role, he helps public sector customers achieve their mission objectives with well-architected solutions on AWS.
 Jim Daniel is the Public Health lead at Amazon Web Services. Previously, he held positions with the United States Department of Health and Human Services for nearly a decade, including Director of Public Health Innovation and Public Health Coordinator. Before his government service, Jim served as the Chief Information Officer for the Massachusetts Department of Public Health.

 Shijian Tang is a Analytics Specialist Solution Architect at Amazon Web Services.
 Matthew Liem is a Senior Solution Architecture Manager at Amazon Web Services.
 Dalei Xu is a Analytics Specialist Solution Architect at Amazon Web Services.
 Yuanjun Xiao is a Senior Solution Architect at Amazon Web Services.


 Pramod Nayak is the Director of Product Management of the Low Latency Group at LSEG. Pramod has over 10 years of experience in the financial technology industry, focusing on software development, analytics, and data management. Pramod is a former software engineer and passionate about market data and quantitative trading.
 LakshmiKanth Mannem is a Product Manager in the Low Latency Group of LSEG. He focuses on data and platform products for the low-latency market data industry. LakshmiKanth helps customers build the most optimal solutions for their market data needs.
 Vivek Aggarwal is a Senior Data Engineer in the Low Latency Group of LSEG. Vivek works on developing and maintaining data pipelines for processing and delivery of captured market data feeds and reference data feeds.
 Alket Memushaj is a Principal Architect in the Financial Services Market Development team at AWS. Alket is responsible for technical strategy, working with partners and customers to deploy even the most demanding capital markets workloads to the AWS Cloud.


 Pathik Shah is a Sr. Analytics Architect on Amazon Athena. He joined AWS in 2015 and has been focusing in the big data analytics space since then, helping customers build scalable and robust solutions using AWS analytics services.
 Raj Devnath is a Product Manager at AWS on Amazon Athena. He is passionate about building products customers love and helping customers extract value from their data. His background is in delivering solutions for multiple end markets, such as finance, retail, smart buildings, home automation, and data communication systems.