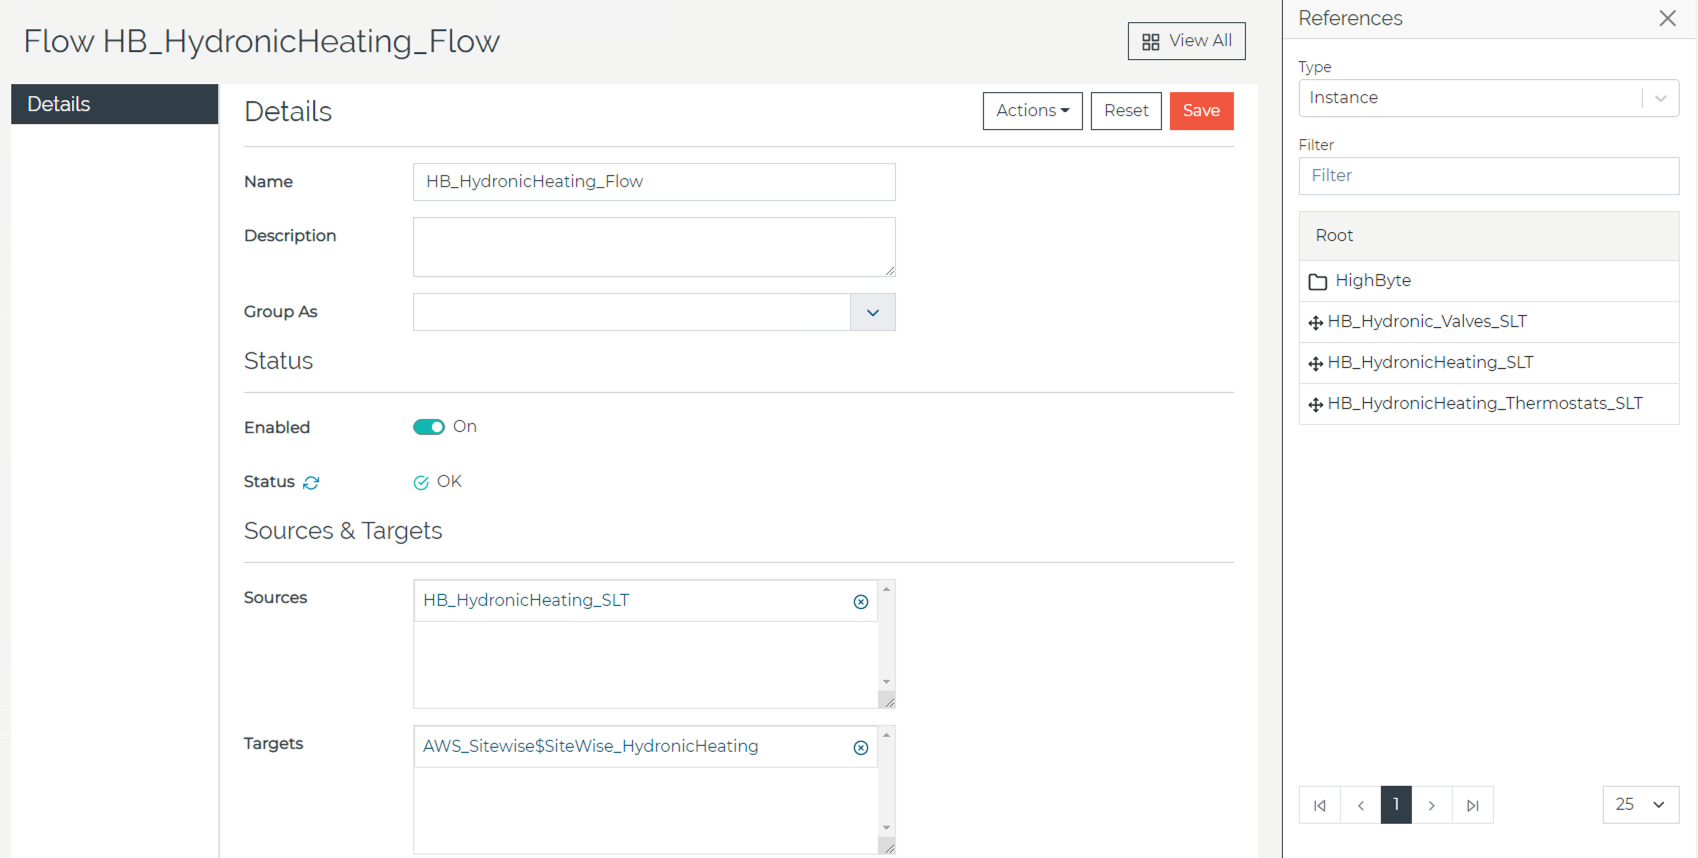
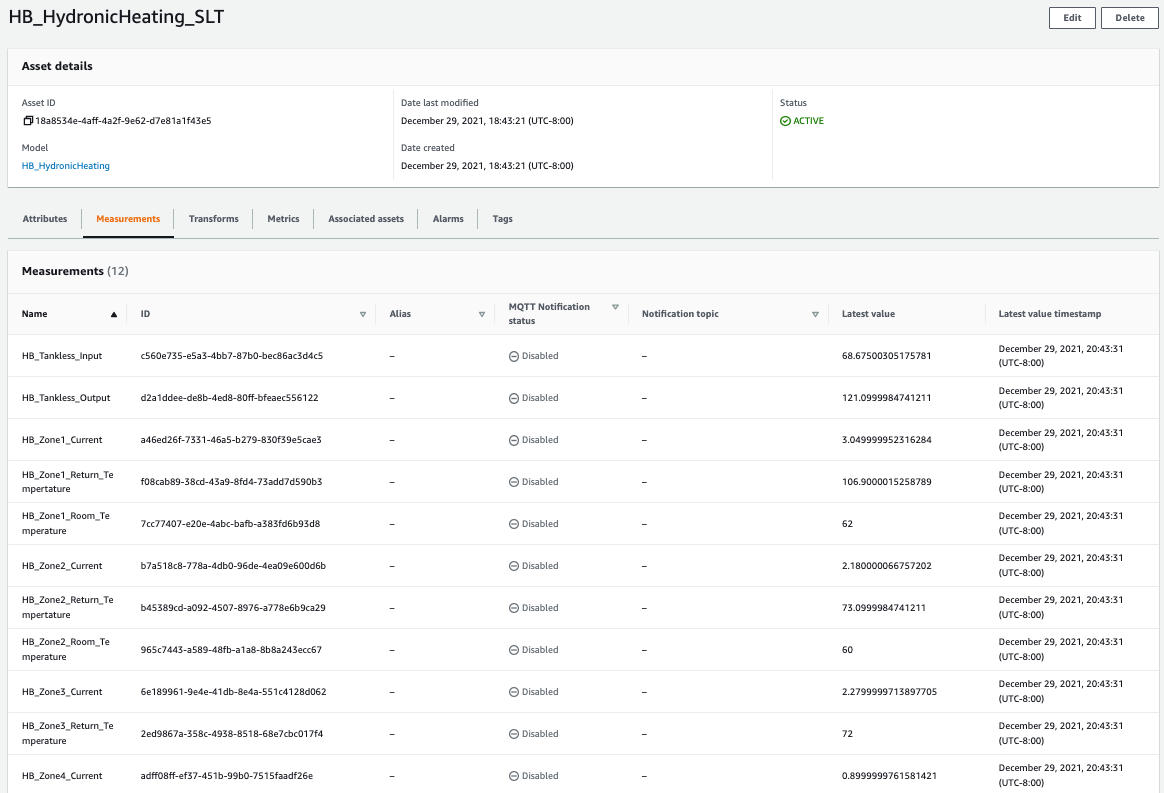
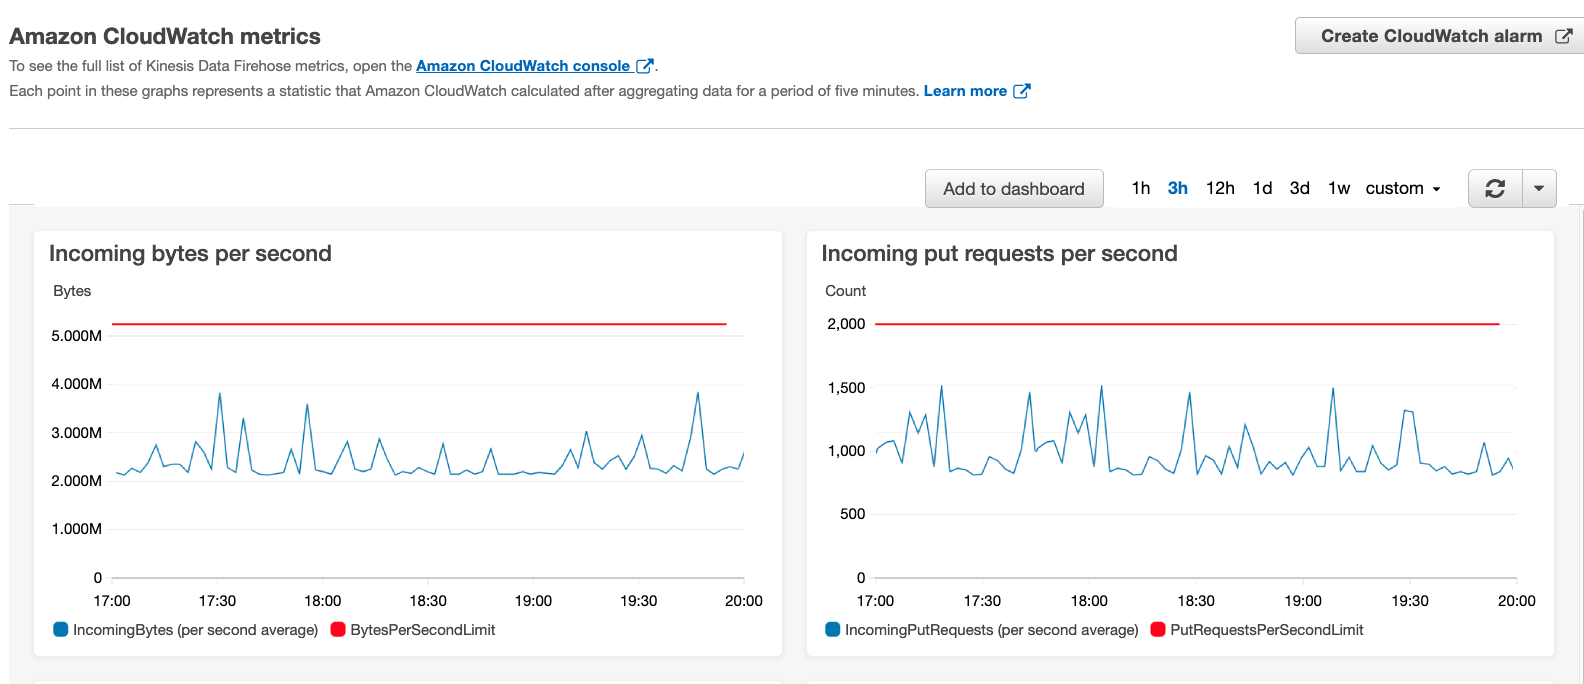
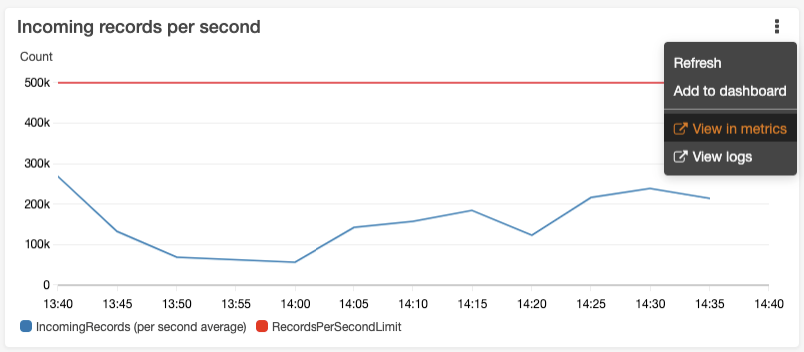
Tag Archives: Kinesis Data Firehose

Maintain visibility over the use of cloud architecture patterns

Post Syndicated from Rostislav Markov original https://aws.amazon.com/blogs/architecture/maintain-visibility-over-the-use-of-cloud-architecture-patterns/

Cloud platform and enterprise architecture teams use architecture patterns to provide guidance for different use cases. Cloud architecture patterns are typically aggregates of multiple Amazon Web Services (AWS) resources, such as Elastic Load Balancing with Amazon Elastic Compute Cloud, or Amazon Relational Database Service with Amazon ElastiCache. In a large organization, cloud platform teams often have limited governance over cloud deployments, and, therefore, lack control or visibility over the actual cloud pattern adoption in their organization.

While having decentralized responsibility for cloud deployments is essential to scale, a lack of visibility or controls leads to inefficiencies, such as proliferation of infrastructure templates, misconfigurations, and insufficient feedback loops to inform cloud platform roadmap.

To address this, we present an integrated approach that allows cloud platform engineers to share and track use of cloud architecture patterns with:

  1. AWS Service Catalog to publish an IT service catalog of codified cloud architecture patterns that are pre-approved for use in the organization.
  2. Amazon QuickSight to track and visualize actual use of service catalog products across the organization.

This solution enables cloud platform teams to maintain visibility into the adoption of cloud architecture patterns in their organization and build a release management process around them.

Publish architectural patterns in your IT service catalog

We use AWS Service Catalog to create portfolios of pre-approved cloud architecture patterns and expose them as self-service to end users. This is accomplished in a shared services AWS account where cloud platform engineers manage the lifecycle of portfolios and publish new products (Figure 1). Cloud platform engineers can publish new versions of products within a portfolio and deprecate older versions, without affecting already-launched resources in end-user AWS accounts. We recommend using organizational sharing to share portfolios with multiple AWS accounts.

Application engineers launch products by referencing the AWS Service Catalog API. Access can be via infrastructure code, like AWS CloudFormation and TerraForm, or an IT service management tool, such as ServiceNow. We recommend using a multi-account setup for application deployments, with an application deployment account hosting the deployment toolchain: in our case, using AWS developer tools.

Although not explicitly depicted, the toolchain can be launched as an AWS Service Catalog product and include pre-populated infrastructure code to bootstrap initial product deployments, as described in the blog post Accelerate deployments on AWS with effective governance.

Launching cloud architecture patterns as AWS Service Catalog products

Figure 1. Launching cloud architecture patterns as AWS Service Catalog products

Track the adoption of cloud architecture patterns

Track the usage of AWS Service Catalog products by analyzing the corresponding AWS CloudTrail logs. The latter can be forwarded to an Amazon EventBridge rule with a filter on the following events: CreateProduct, UpdateProduct, DeleteProduct, ProvisionProduct and TerminateProvisionedProduct.

The logs are generated no matter how you interact with the AWS Service Catalog API, such as through ServiceNow or TerraForm. Once in EventBridge, Amazon Kinesis Data Firehose delivers the events to Amazon Simple Storage Service (Amazon S3) from where QuickSight can access them. Figure 2 depicts the end-to-end flow.

Tracking adoption of AWS Service Catalog products with Amazon QuickSight

Figure 2. Tracking adoption of AWS Service Catalog products with Amazon QuickSight

Depending on your AWS landing zone setup, CloudTrail logs from all relevant AWS accounts and regions need to be forwarded to a central S3 bucket in your shared services account or, otherwise, centralized logging account. Figure 3 provides an overview of this cross-account log aggregation.

Aggregating AWS Service Catalog product logs across AWS accounts

Figure 3. Aggregating AWS Service Catalog product logs across AWS accounts

If your landing zone allows, consider giving permissions to EventBridge in all accounts to write to a central event bus in your shared services AWS account. This avoids having to set up Kinesis Data Firehose delivery streams in all participating AWS accounts and further simplifies the solution (Figure 4).

Aggregating AWS Service Catalog product logs across AWS accounts to a central event bus

Figure 4. Aggregating AWS Service Catalog product logs across AWS accounts to a central event bus

If you are already using an organization trail, you can use Amazon Athena or AWS Lambda to discover the relevant logs in your QuickSight dashboard, without the need to integrate with EventBridge and Kinesis Data Firehose.

Reporting on product adoption can be customized in QuickSight. The S3 bucket storing AWS Service Catalog logs can be defined in QuickSight as datasets, for which you can create an analysis and publish as a dashboard.

In the past, we have reported on the top ten products used in the organization (if relevant, also filtered by product version or time period) and the top accounts in terms of product usage. The following figure offers an example dashboard visualizing product usage by product type and number of times they were provisioned. Note: the counts of provisioned and terminated products differ slightly, as logging was activated after the first products were created and provisioned for demonstration purposes.

Example Amazon QuickSight dashboard tracking AWS Service Catalog product adoption

Figure 5. Example Amazon QuickSight dashboard tracking AWS Service Catalog product adoption

Conclusion

In this blog, we described an integrated approach to track adoption of cloud architecture patterns using AWS Service Catalog and QuickSight. The solution has a number of benefits, including:

  • Building an IT service catalog based on pre-approved architectural patterns
  • Maintaining visibility into the actual use of patterns, including which patterns and versions were deployed in the organizational units’ AWS accounts
  • Compliance with organizational standards, as architectural patterns are codified in the catalog

In our experience, the model may compromise on agility if you enforce a high level of standardization and only allow the use of a few patterns. However, there is the potential for proliferation of products, with many templates differing slightly without a central governance over the catalog. Ideally, cloud platform engineers assume responsibility for the roadmap of service catalog products, with formal intake mechanisms and feedback loops to account for builders’ localization requests.

Analyze logs with Dynatrace Davis AI Engine using Amazon Kinesis Data Firehose HTTP endpoint delivery

Post Syndicated from Erick Leon original https://aws.amazon.com/blogs/big-data/analyze-logs-with-dynatrace-davis-ai-engine-using-amazon-kinesis-data-firehose-http-endpoint-delivery/

This blog post is co-authored with Erick Leon, Sr. Technical Alliance Manager from Dynatrace.

Amazon Kinesis Data Firehose is the easiest way to reliably load streaming data into data lakes, data stores, and analytics services. With just a few clicks, you can create fully-managed delivery streams that auto scale on demand to match the throughput of your data. Customers already use Kinesis Data Firehose to ingest raw data from various data sources, including logs from AWS services. Kinesis Data Firehose now supports delivering streaming data to Dynatrace. Dynatrace begins analyzing incoming data within minutes of Amazon CloudWatch data generation.

Starting today, you can use Kinesis Data Firehose to send CloudWatch Metrics and Logs directly to the Dynatrace observability platform to perform your explorations and analysis. Dynatrace, an AWS Partner Network (APN) has provided full observability into AWS Services by ingesting CloudWatch metrics that are published by AWS services. Dynatrace ingests this data to perform root-cause analysis using the Dynatrace Davis AI engine.

In this post, we describe the Kinesis Data Firehose and related Dynatrace integration.

Prerequisites

For this walkthrough, you should have the following prerequisites:

  • AWS account.
  • Access to the CloudWatch and Kinesis Data Firehose with permissions to manage HTTP endpoints.
  • Dynatrace Intelligent Observability Platform account, or get a free 15 day trial here.
  • Dynatrace version 1.182+.
  • An updated AWS monitoring policy to include the additional AWS services.
    To update the AWS Identity and Access Management (IAM) policy, use the JSON in the link above, containing the monitoring policy (permissions) for all supporting services.
  • Dynatrace API token: create token with the following permission and keep readily available in a notepad.
Dynatrace API Token

Figure 1 – Dynatrace API Token

How it works

Amazon Kinesis Data Firehose HTTP endpoint delivery

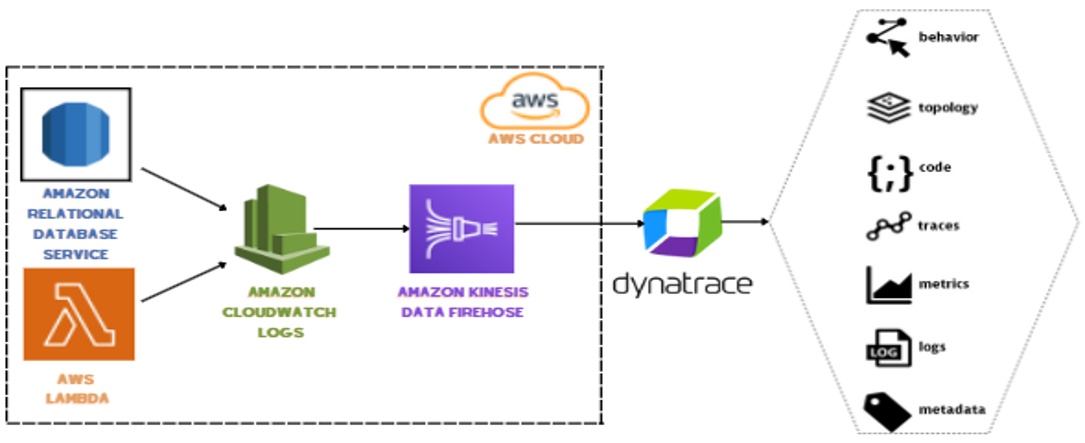
Figure 2 – Amazon Kinesis Data Firehose HTTP endpoint delivery

Simply create a log stream for your Amazon services to deliver your context rich logs to the Amazon CloudWatch Logs service. Next, select your Dynatrace HTTP endpoint to enhance your logs streams with the power of the Dynatrace Intelligence Platform. Finally, you can also back up your logs to an Amazon Simple Storage Service (Amazon S3) bucket.

Setup instructions

To add a service to monitoring, follow these steps:

  1. In the Dynatrace menu, go to Settings > Cloud and virtualization, and select AWS.
  2. On the AWS overview page, scroll down and select the desired AWS instance. Select the Edit button.
  3. Scroll down and select Add service. Choose the service name from the drop-down, and select Add service.
  4. Select Save changes.

To process and deliver AWS CloudWatch Metrics to Dynatrace, follow these steps.

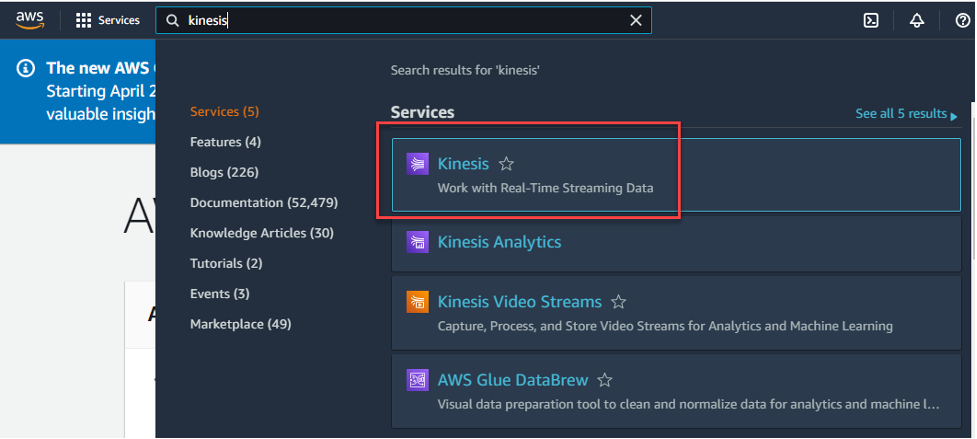
  1. Log in to the AWS console and type “Kinesis” in the text search bar. Select Kinesis
AWS Console

Figure 3 – AWS Console

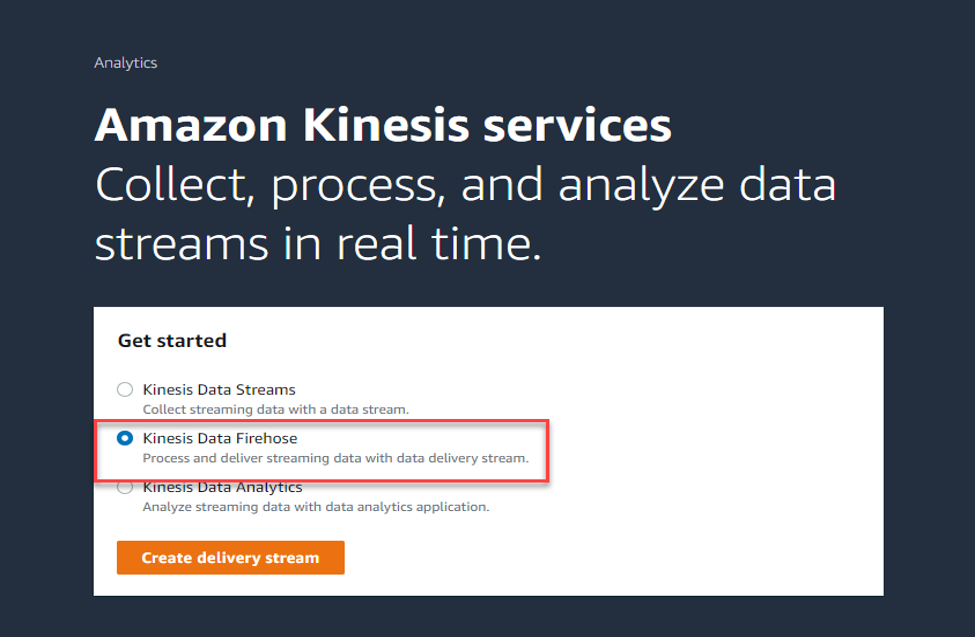
  1. On the Amazon Kinesis services page, select the radio button for Kinesis Data Firehose and select the Create delivery stream button.
Amazon Kinesis

Figure 4 – Amazon Kinesis

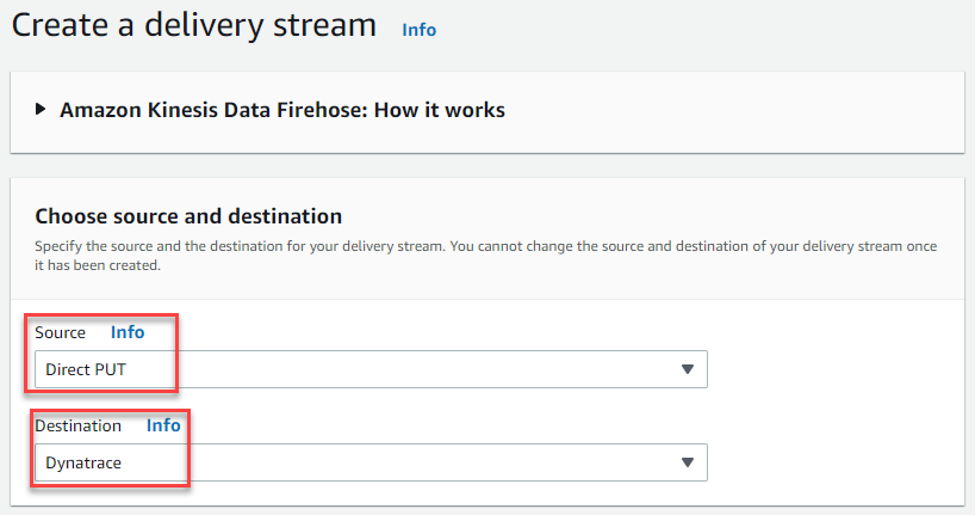
  1. Choose the “Direct PUT” from the drop down, and from Destination drop down, choose “Dynatrace”.
Amazon Kinesis Data Firehose

Figure 5 – Amazon Kinesis Data Firehose

  1. Delivery stream name – Give your stream a new name, for example: – “KFH-StreamToDynatrace”

Figure 6 – Delivery stream name

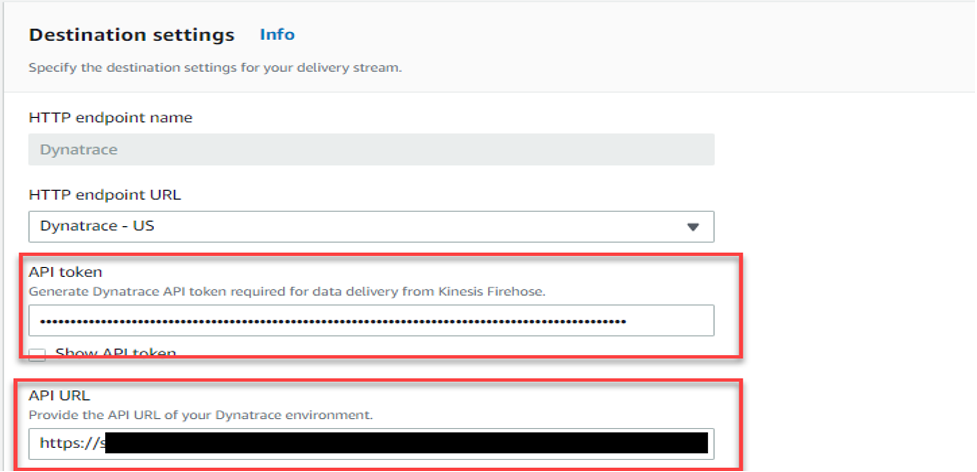
  1. In the section “Destination settings”:
Destination settings

Figure 7 – Destination settings

  1. HTTP endpoint name – “Dynatrace”.
  2. HTTP endpoint URL – From the drop down, select “Dynatrace – US”.
  3. API token – Enter Dynatrace API TOKEN created in the prerequisite section.
  4. API URL – enter the Dynatrace URL for your tenant, for example: https://xxxxx.live.dynatrace.com
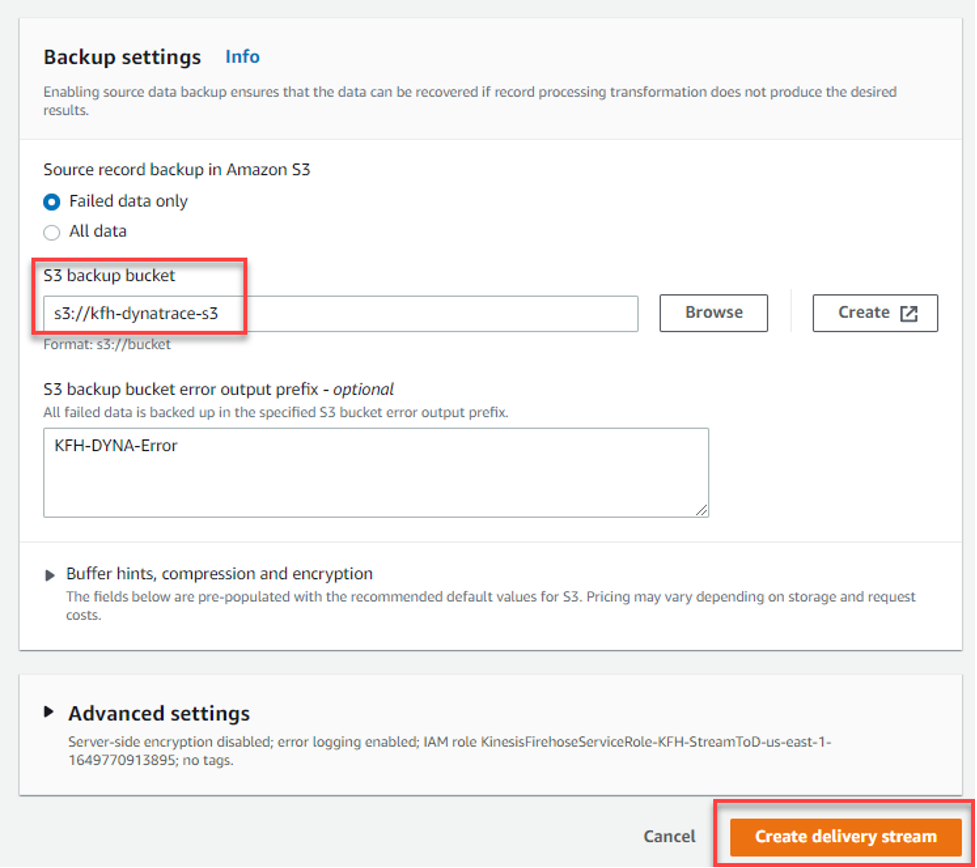
  5. Back Up Settings – Either select an existing S3 bucket or create a new one and add details and select the Create delivery stream button.
Backup settings

Figure 8 – Backup settings

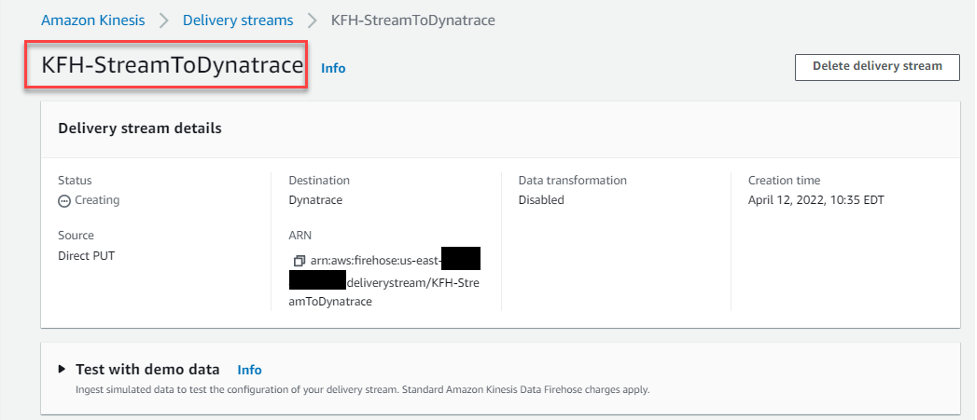
Once successful, your AWS Console will look like the following:

Amazon Kinesis Data Firehose

Figure 9 – Amazon Kinesis Data Firehose

The Dynatrace Experience

Once the initial setups are completed in both Dynatrace and the AWS Console, follow these steps to visualize your new KHF stream data in the Dynatrace console.

  1. Log in to the Dynatrace Console, and on the left side menu expand the “infrastructure” section, and select “AWS
  2. From the screen, select the AWS account that you want to add the KFH stream to.
  3. Next, you’ll see a virtualization of your AWS assets for the account selected. Select the box marked “Supporting Services”.
  4. Next, press the “Configure services” button.
  5. Next, select “Add service”.
  6. From the drop down, select “Kinesis Data Firehose”.
  7. Next, select the “Add metric” button, and select the metrics that you want to see for this stream. Dynatrace has a comprehensive list of metrics that can be selected from the UI. The list can be found in this link.

Troubleshooting

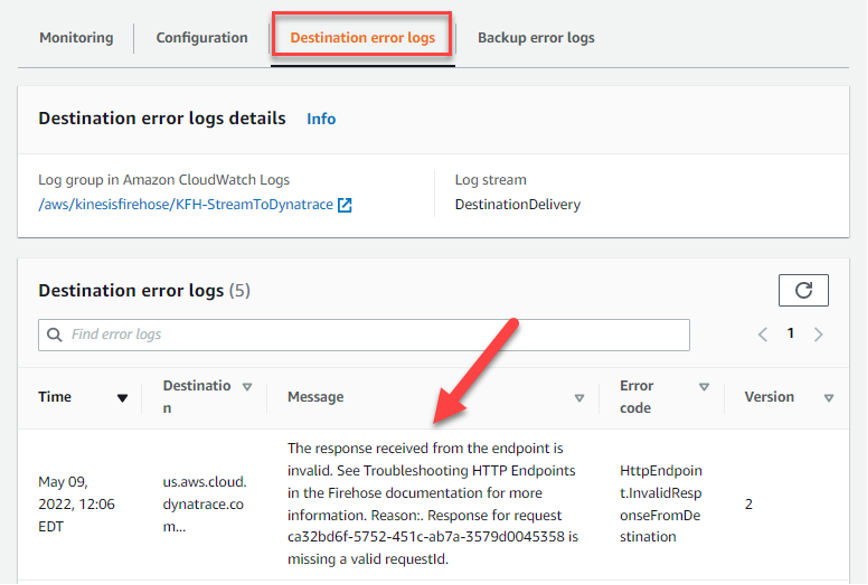
  1. After configuration, load to the new KFH stream no data in the Dynatrace Console.
    1. Check the Error Logs tab check to make sure that the Destination URL is correct for the Dynatrace Tenant.
Destination error logs

Figure 10 – Destination error logs

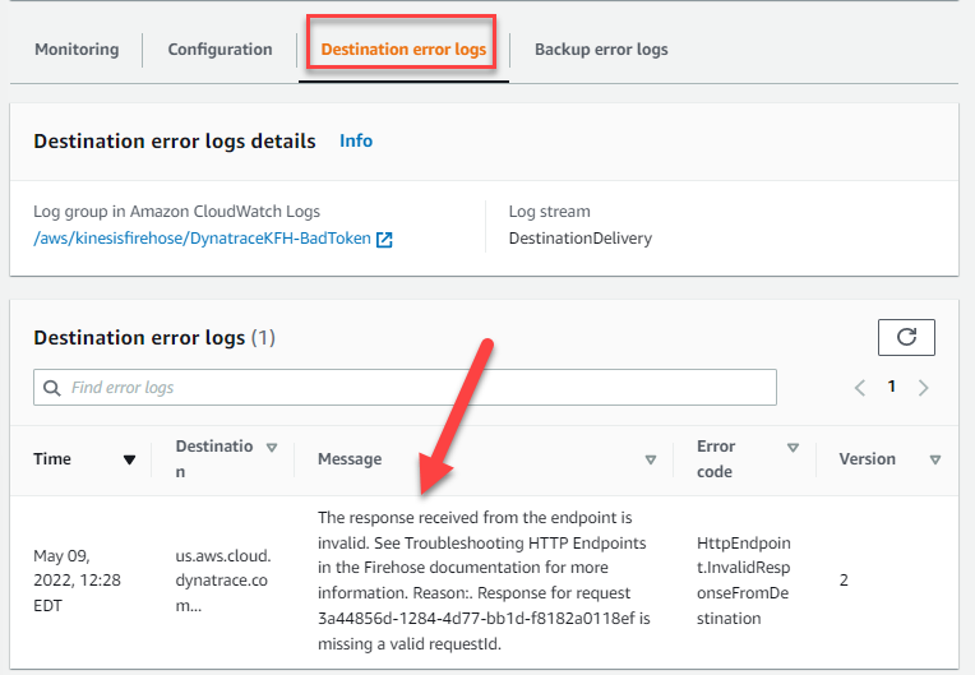
  1. Invalid or misconfigured Dynatrace API token or scope isn’t properly set.
Destination error logs

Figure 11 – Destination error logs

Conclusion

In this post, we demonstrate the Kinesis Data Firehose and related Dynatrace integration. In addition, engineers can use CloudWatch Metrics to explore their production systems alongside events in Dynatrace. This provides a seamless, current view of your system (from logs to events and traces) in a single data store.

To learn more about CloudWatch Service, see the Amazon CloudWatch home page. If you have any questions, post them on the AWS CloudWatch service forum.

If you haven’t yet signed up for Dynatrace, then you can try out Kinesis Data Firehose with Dynatrace with a free Dynatrace trial.


About the Authors

Erick Leon is a Technical Alliances Sr. Manager at Dynatrace, Observability Practice Architect, and Customer Advocate. He promotes strong technical integrations with a focus on AWS. With over 15 years as a Dynatrace customer, his real-world experiences and lessons learned bring valuable insights into the Dynatrace Intelligent Observability Platform.

Shashiraj Jeripotula (Raj) is a San Francisco-based Sr. Partner Solutions Architect at AWS. He works with various independent software vendors (ISVs), and partners who specialize in cloud management tools and DevOps to develop joint solutions and accelerate cloud adoption on AWS.

Analyzing Amazon SES event data with AWS Analytics Services

Post Syndicated from Oscar Mendoza original https://aws.amazon.com/blogs/messaging-and-targeting/analyzing-amazon-ses-event-data-with-aws-analytics-services/

In this post, we will walk through using AWS Services, such as, Amazon Kinesis Firehose, Amazon Athena and Amazon QuickSight to monitor Amazon SES email sending events with the granularity and level of detail required to get insights from your customers engage with the emails you send.

Nowadays, email Marketers rely on internal applications to create their campaigns or any communications requirements, such us newsletters or promotional content. From those activities, they need to collect as much information as possible to analyze and improve their pipeline to get better interaction with the customers. Data such us bounces, rejections, success reception, delivery delays, complaints or open rate can be a powerful tool to understand the customers. Usually applications work with high-level data points without detailed logging or granular information that could help improve even better the effectiveness of their campaigns.

Amazon Simple Email Service (SES) is a smart tool for companies that wants a cost-effective, flexible, and scalable email service solution to easily integrate with their own products. Amazon SES provides methods to control your sending activity with built-in integration with Amazon CloudWatch Metrics and also provides a mechanism to collect the email sending events data.

In this post, we propose an architecture and step-by-step guide to track your email sending activities at a granular level, where you can configure several types of email sending events, including sends, deliveries, opens, clicks, bounces, complaints, rejections, rendering failures, and delivery delays. We will use the configuration set feature of Amazon SES to send detailed logging to our analytics services to store, query and create dashboards for a detailed view.

Overview of solution

This architecture uses Amazon SES built-in features and AWS analytics services to provide a quick and cost-effective solution to address your mail tracking requirements. The following services will be implemented or configured:

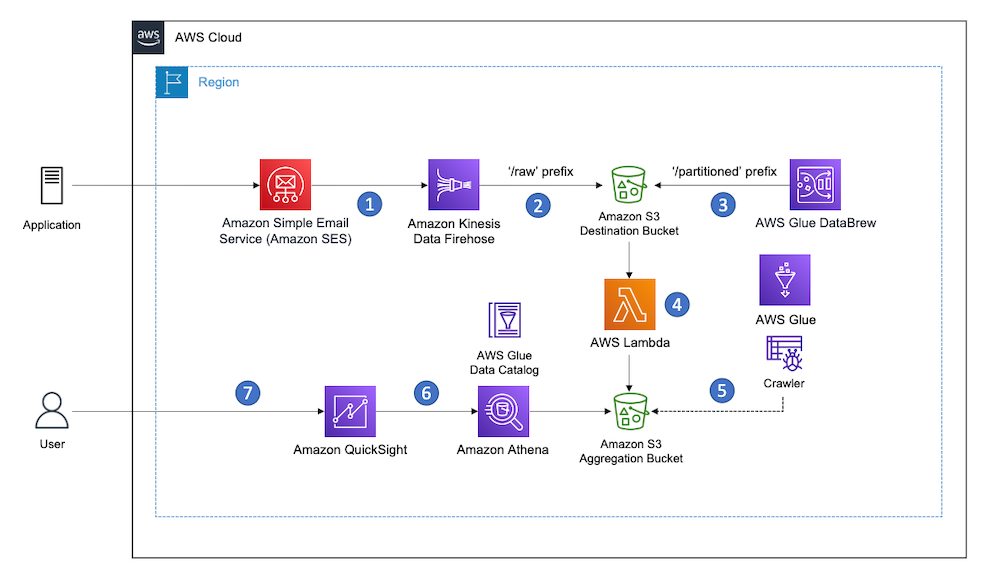
The following diagram shows the architecture of the solution:

Serverless Architecture to Analyze Amazon SES events

Figure 1. Serverless Architecture to Analyze Amazon SES events

The flow of the events starts when a customer uses Amazon SES to send an email. Each of those send events will be capture by the configuration set feature and forward the events to a Kinesis Firehose delivery stream to buffer and store those events on an Amazon S3 bucket.

After storing the events, it will be required to create a database and table schema and store it on AWS Glue Data Catalog in order for Amazon Athena to be able to properly query those events on S3. Finally, we will use Amazon QuickSight to create interactive dashboard to search and visualize all your sending activity with an email level of detailed.

Prerequisites

For this walkthrough, you should have the following prerequisites:

Walkthrough

Step 1: Use AWS CloudFormation to deploy some additional prerequisites

You can get started with our sample AWS CloudFormation template that includes some prerequisites. This template creates an Amazon S3 Bucket, an IAM role needed to access from Amazon SES to Amazon Kinesis Data Firehose.

To download the CloudFormation template, run one of the following commands, depending on your operating system:

In Windows:

curl https://raw.githubusercontent.com/aws-samples/amazon-ses-analytics-blog/main/SES-Blog-PreRequisites.yml -o SES-Blog-PreRequisites.yml

In MacOS

wget https://raw.githubusercontent.com/aws-samples/amazon-ses-analytics-blog/main/SES-Blog-PreRequisites.yml

To deploy the template, use the following AWS CLI command:

aws cloudformation deploy --template-file ./SES-Blog-PreRequisites.yml --stack-name ses-dashboard-prerequisites --capabilities CAPABILITY_NAMED_IAM

After the template finishes creating resources, you see the IAM Service role and the Delivery Stream on the stack Outputs tab. You are going to use these resources in the following steps.

IAM Service role and Delivery Stream created by CloudFormation template

Figure 2. CloudFormation template outputs

Step 2: Creating a configuration set in SES and setting the default configuration set for a verified identity

SES can track the number of send, delivery, open, click, bounce, and complaint events for each email you send. You can use event publishing to send information about these events to other AWS service. In this case we are going to send the events to Kinesis Firehose. To do this, a configuration set is required.

To create a configuration set, complete the following steps:

  1. On the AWS Console, choose the Amazon Simple Email Service.
  2. Choose Configuration sets.
  3. Click on Create set.

    Create a configuration set in Amazon SES

    Figure 3. Amazon SES Create Configuration Set

  4. Set a Configuration set name.
  5. Leave the other configurations by default.

    Write a name for your configuration set

    Figure 4. Configuration Set Name

  6. Once the configuration set is created, select Event destinations

    Configuration set created successfully

    Figure 5. Configuration set created successfully

  7. Click on Add destination
  8. Select the event types you would like to analyze and then click on next.

    Sending Events to analyze

    Figure 6. Sending Events to analyze

  9. Select Amazon Kinesis Data Firehose as the destination, choose the delivery stream and the IAM role created previously, click on next and in the review page, click on Add destination.

    Destination for Amazon SES sending events

    Figure 7. Destination for Amazon SES sending events

  10. Once you have created the configuration set and added the event destination, you can define the Default configuration set for the verified identity (domain or email address). In the SES console, choose Verified identities.

    Amazon SES Verified Identity

    Figure 8 Amazon SES Verified Identity

  11. Choose the verified identity from which you want to collect events and select Configuration set. Click on Edit.

    Edit Configuration Set for Verified Identity

    Figure 9. Edit Configuration Set for Verified Identity

  12. Click on the checkbox Assign a default configuration set and choose the configuration set created previously.

    Assign default configuration set

    Figure 10. Assign default configuration set

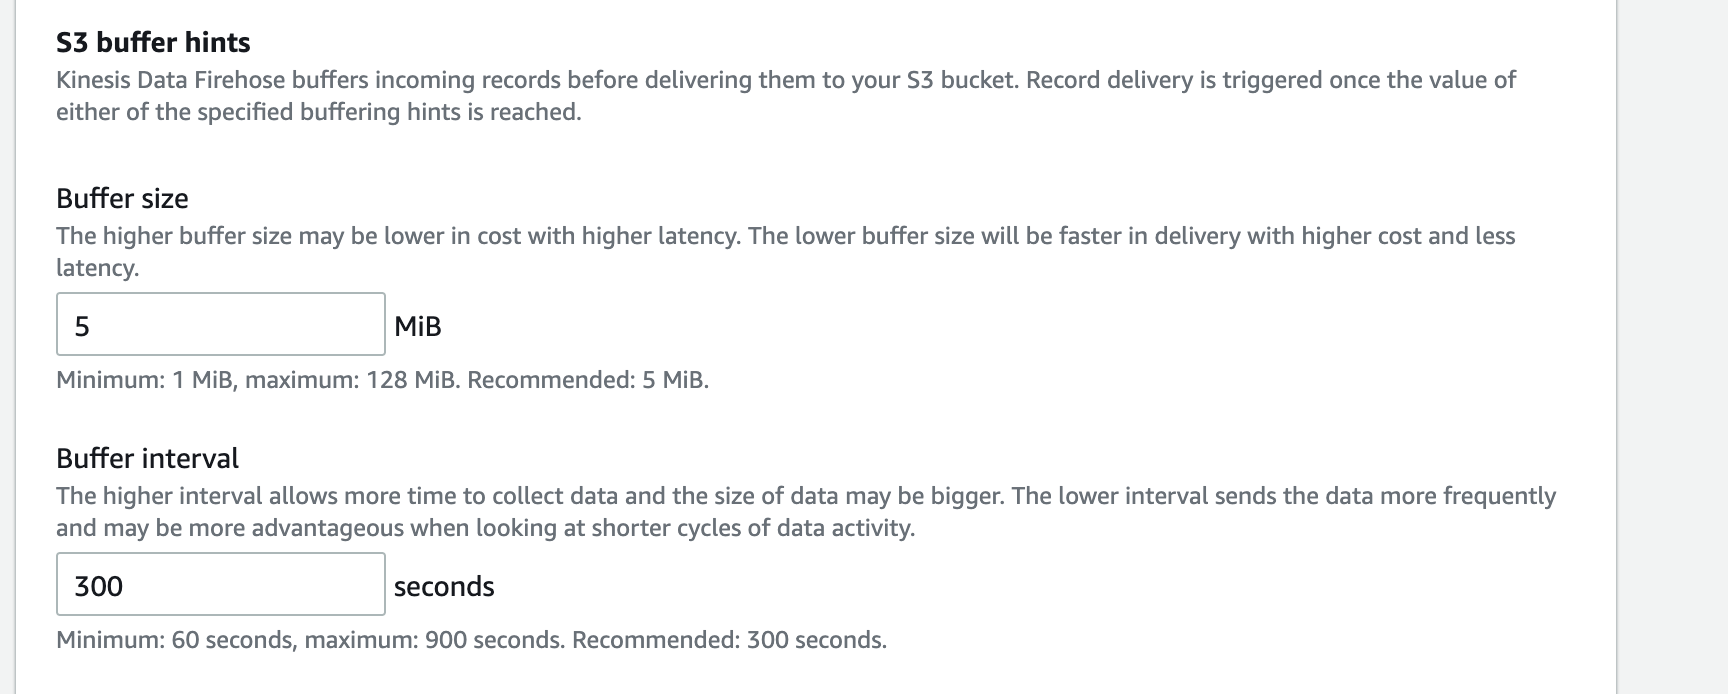
  13. Once you have completed the previous steps, your events will be sent to Amazon S3. Due to the buffer’s configuration on the Kinesis Delivery Stream, the data will be loaded every 5 minutes or every 5 MiB to Amazon S3. You can check the structure created on the bucket and see json logs with SES events data.

    Amazon S3 bucket structure

    Figure 11. Amazon S3 bucket structure

Step 3: Using Amazon Athena to query the SES event logs

Amazon SES publishes email sending event records to Amazon Kinesis Data Firehose in JSON format. The top-level JSON object contains an eventType string, a mail object, and either a Bounce, Complaint, Delivery, Send, Reject, Open, Click, Rendering Failure, or DeliveryDelay object, depending on the type of event.

  1. In order to simplify the analysis of email sending events, create the sesmaster table by running the following script in Amazon Athena. Don’t forget to change the location in the following script with your own bucket containing the data of email sending events.
    CREATE EXTERNAL TABLE sesmaster (
    eventType string,
    complaint struct < arrivaldate: string,
    complainedrecipients: array < struct < emailaddress: string >>,
    complaintfeedbacktype: string,
    feedbackid: string,
    `timestamp`: string,
    useragent: string >,
    bounce struct < bouncedrecipients: array < struct < action: string,
    diagnosticcode: string,
    emailaddress: string,
    status: string >>,
    bouncesubtype: string,
    bouncetype: string,
    feedbackid: string,
    reportingmta: string,
    `timestamp`: string >,
    mail struct < timestamp: string,
    source: string,
    sourcearn: string,
    sendingaccountid: string,
    messageid: string,
    destination: string,
    headerstruncated: boolean,
    headers: array < struct < name: string,
    value: string >>,
    commonheaders: struct < `from`: array < string >,
    to: array < string >,
    messageid: string,
    subject: string >,
    tags: struct < ses_source_tls_version: string,
    ses_operation: string,
    ses_configurationset: string,
    ses_source_ip: string,
    ses_outgoing_ip: string,
    ses_from_domain: string,
    ses_caller_identity: string >>,
    send string,
    delivery struct < processingtimemillis: int,
    recipients: array < string >,
    reportingmta: string,
    smtpresponse: string,
    `timestamp`: string >,
    open struct < ipaddress: string,
    `timestamp`: string,
    userAgent: string >,
    reject struct < reason: string >,
    click struct < ipAddress: string,
    `timestamp`: string,
    userAgent: string,
    link: string >
    )
    ROW FORMAT SERDE 'org.openx.data.jsonserde.JsonSerDe'
    WITH SERDEPROPERTIES (
    "mapping.ses_caller_identity" = "ses:caller-identity",
    "mapping.ses_configurationset" = "ses:configuration-set",
    "mapping.ses_from_domain" = "ses:from-domain",
    "mapping.ses_operation" = "ses:opeation",
    "mapping.ses_outgoing_ip" = "ses:outgoing-ip",
    "mapping.ses_source_ip" = "ses:source-ip",
    "mapping.ses_source_tls_version" = "ses:source-tls-version"
    )
    LOCATION 's3://aws-s3-ses-analytics-<aws-account-number>/'
    

    The sesmaster table uses the org.openx.data.jsonserde.JsonSerDe SerDe library to deserialize the JSON data.

    We have leveraged the support for JSON arrays and maps and the support for nested data structures. Those features ease the process of preparation and visualization of data.

    In the sesmaster table, the following mappings were applied to avoid errors due to name of JSON fields containing colons.

    • “mapping.ses_configurationset”=”ses:configuration-set”
    • “mapping.ses_source_ip”=”ses:source-ip”
    • “mapping.ses_from_domain”=”ses:from-domain”
    • “mapping.ses_caller_identity”=”ses:caller-identity” “mapping.ses_outgoing_ip”=”ses:outgoing-ip”
  2. Once the sesmaster table is ready, it is a good strategy to create curated views of its data. The first view called vwSESMaster contains all the records of email sending events and all the fields which are unique on each event. Create the vwSESMaster view by running the following script in Amazon Athena.
    CREATE OR REPLACE VIEW vwSESMaster AS
    SELECT
    eventtype as eventtype
    , mail.messageId as mailmessageid
    , mail.timestamp as mailtimestamp
    , mail.source as mailsource
    , mail.sendingAccountId as mailsendingAccountId
    , mail.commonHeaders.subject as mailsubject
    , mail.tags.ses_configurationset as mailses_configurationset
    , mail.tags.ses_source_ip as mailses_source_ip
    , mail.tags.ses_from_domain as mailses_from_domain
    , mail.tags.ses_outgoing_ip as mailses_outgoing_ip
    , delivery.processingtimemillis as deliveryprocessingtimemillis
    , delivery.reportingmta as deliveryreportingmta
    , delivery.smtpresponse as deliverysmtpresponse
    , delivery.timestamp as deliverytimestamp
    , delivery.recipients[1] as deliveryrecipient
    , open.ipaddress as openipaddress
    , open.timestamp as opentimestamp
    , open.userAgent as openuseragent
    , bounce.bounceType as bouncebounceType
    , bounce.bouncesubtype as bouncebouncesubtype
    , bounce.feedbackid as bouncefeedbackid
    , bounce.timestamp as bouncetimestamp
    , bounce.reportingMTA as bouncereportingmta
    , click.ipAddress as clickipaddress
    , click.timestamp as clicktimestamp
    , click.userAgent as clickuseragent
    , click.link as clicklink
    , complaint.timestamp as complainttimestamp
    , complaint.userAgent as complaintuseragent
    , complaint.complaintFeedbackType as complaintcomplaintfeedbacktype
    , complaint.arrivalDate as complaintarrivaldate
    , reject.reason as rejectreason
    FROM
    sesmaster

    The sesmaster table contains some fields which are represented by nested arrays, so it is necessary to flatten them into multiples rows. Following you can see the event types and the fields which need to be flatten.

    • Event type SEND: field mail.commonHeaders
    • Event type BOUNCE: field bounce.bouncedrecipients
    • Event type COMPLAINT: field complaint.complainedrecipients

    To flatten those arrays into multiple rows, we used the CROSS JOIN in conjunction with the UNNEST operator using the following strategy for all the three events:

    • Create a temporal view with the mail.messageID and the field to be flattened.
    • Create another temporal view with the array flattened into multiple rows.
    • Create the final view joining the sesmaster table with the second temporal view by event type and mail.messageID.

    To create those views, follow the next steps.

  3. Run the following scripts in Amazon Athena to flat the mail.commonHeaders array in the SEND event type
    CREATE OR REPLACE VIEW vwSendMailTmpSendTo AS 
    SELECT
    mail.messageId as messageid
    , mail.commonHeaders.to as recipients
    FROM
    sesmaster
    WHERE 
    eventtype='Send'
    
    CREATE OR REPLACE VIEW vwsendmailrecipients AS 
    SELECT
    messageid
    , recipient
    FROM
    ("vwSendMailTmpSendTo"
    CROSS JOIN UNNEST(recipients) t (recipient))
    
    CREATE OR REPLACE VIEW vwSentMails AS
    SELECT 
    eventtype as eventtype
    , mail.messageId as mailmessageid
    , mail.timestamp as mailtimestamp
    , mail.source as mailsource
    , mail.sendingAccountId as mailsendingAccountId
    , mail.commonHeaders.subject as mailsubject
    , mail.tags.ses_configurationset as mailses_configurationset
    , mail.tags.ses_source_ip as mailses_source_ip
    , mail.tags.ses_from_domain as mailses_from_domain
    , mail.tags.ses_outgoing_ip as mailses_outgoing_ip
    , dest.recipient as mailto
    FROM
    sesmaster as sm
    ,vwsendmailrecipients as dest
    WHERE
    sm.eventtype = 'Send'
    and sm.mail.messageid = dest.messageid
  4. Run the following scripts in Amazon Athena to flat the bounce.bouncedrecipients array in the BOUNCE event type
    CREATE OR REPLACE VIEW vwbouncemailtmprecipients AS 
    SELECT
    mail.messageId as messageid
    , bounce.bouncedrecipients
    FROM
    sesmaster
    WHERE (eventtype = 'Bounce')
    
    CREATE OR REPLACE VIEW vwbouncemailrecipients AS 
    SELECT
    messageid
    , recipient.action
    , recipient.diagnosticcode
    , recipient.emailaddress
    FROM
    (vwbouncemailtmprecipients
    CROSS JOIN UNNEST(bouncedrecipients) t (recipient))
    
    CREATE OR REPLACE VIEW vwBouncedMails AS
    SELECT
    eventtype as eventtype
    , mail.messageId as mailmessageid
    , mail.timestamp as mailtimestamp
    , mail.source as mailsource
    , mail.sendingAccountId as mailsendingAccountId
    , mail.commonHeaders.subject as mailsubject
    , mail.tags.ses_configurationset as mailses_configurationset
    , mail.tags.ses_source_ip as mailses_source_ip
    , mail.tags.ses_from_domain as mailses_from_domain
    , mail.tags.ses_outgoing_ip as mailses_outgoing_ip
    , bounce.bounceType as bouncebounceType
    , bounce.bouncesubtype as bouncebouncesubtype
    , bounce.feedbackid as bouncefeedbackid
    , bounce.timestamp as bouncetimestamp
    , bounce.reportingMTA as bouncereportingmta
    , bd.action as bounceaction
    , bd.diagnosticcode as bouncediagnosticcode
    , bd.emailaddress as bounceemailaddress
    FROM
    sesmaster as sm
    ,vwbouncemailrecipients as bd
    WHERE
    sm.eventtype = 'Bounce'
    and sm.mail.messageid = bd.messageid
    
  5. Run the following scripts in Amazon Athena to flat the complaint.complainedrecipients array in the COMPLAINT event type
    CREATE OR REPLACE VIEW vwcomplainttmprecipients AS 
    SELECT
    mail.messageId as messageid
    , complaint.complainedrecipients
    FROM
    sesmaster
    WHERE (eventtype = 'Complaint')
    
    CREATE OR REPLACE VIEW vwcomplainedrecipients AS 
    SELECT
    messageid
    , recipient.emailaddress
    FROM
    (vwcomplainttmprecipients 
    CROSS JOIN UNNEST(complainedrecipients) t (recipient))
    

    At the end we have one table and four views which can be used in Amazon QuickSight to analyze email sending events:

    • Table sesmaster
    • View vwSESMaster
    • View vwSentMails
    • View vwBouncedMails
    • View vwComplainedemails

Step 4: Analyze and visualize data with Amazon QuickSight

 In this blog post, we use Amazon QuickSight to analyze and to visualize email sending events from the sesmaster and the four curated views created previously. Amazon QuickSight can directly access data through Athena. Its pay-per-session pricing enables you to put analytical insights into the hands of everyone in your organization.

Let’s set this up together. We first need to select our table and our views to create new data sources in Athena and then we use these data sources to populate the visualization. We are creating just an example of visualization. Feel free to create your own visualization based on your information needs.

Before we can use the data in Amazon QuickSight, we need to first grant access to the underlying S3 bucket. If you haven’t done so already for other analyses, see our documentation on how to do so.

  1. On the Amazon QuickSight home page, choose Datasets from the menu on the left side, then choose New dataset from the upper-right corner, set and pick Athena as data source. In the following dialog box, give the data source a descriptive name and choose Create data source.

    Create New Athena Data Source

    Figure 12. Create New Athena Data Source

  2. In the following dialog box, select the Catalog and the Database containing your sesmaster and curated views. Let’s select the sesmaster table in order to create some basic Key Performance Indicators. Select the table sesmaster and click on the Select

    Select Sesmaster Table

    Figure 13. Select Sesmaster Table

  3. Our sesmaster table now is a data source for Amazon QuickSight and we can turn to visualizing the data.

    QuickSight Visualize Data

    Figure 14. QuickSight Visualize Data

  4. You can see the list fields on the left. The canvas on the right is still empty. Before we populate it with data, let’s select Key Performance Indicator from the available visual types.

    QuickSight Visual Types

    Figure 15. QuickSight Visual Types

  5. To populate the graph, drag and drop the fields from the field list on the left onto their respective destinations. In our case, we put the field send onto the value well and use count as aggregation.

    Add Send field to visualization

    Figure 16. Add Send field to visualization

  6. Add another visual from the left-upper side and select Key Performance Indicator as visual type.
    Add a new visual

    Figure 17. Add a new visual

    Key Performance Indicator Visual Type

    Figure 18. Key Performance Indicator Visual Type

  7. Put the field Delivery onto the value well and use count as aggregation.

    Add Delivery Field to visualization

    Figure 19. Add Delivery Field to visualization

  8. Repeat the same procedure, (steps 1 to 4) to count the number of Open, Click, Bounce, Complaint and Reject Events. At the end, you should see something similar to the following visualization. After resizing and rearranging the visuals, you should get an analysis like the shown in the image below.

    Preview of Key Performance Indicators

    Figure 20. Preview of Key Performance Indicators

  9. Let´s add another dataset by clicking the pencil on the right of the current Dataset.

    Add a New Dataset

    Figure 21. Add a New Dataset

  10. On the following dialog box, select Add Dataset.

    Add a New Dataset

    Figure 22. Add a New Dataset

  11. Select the view called vwsesmaster and click Select.
    Add vwsesmaster dataset

    Figure 23. Add vwsesmaster dataset

    Now you can see all the available fields of the vwsesmaster view.

    New fields from vwsesmaster dataset

    Figure 24. New fields from vwsesmaster dataset

  12. Let’s create a new visual and select the Table visual type.

    QuickSight Visual Types

    Figure 25. QuickSight Visual Types

  13. Drag and drop the fields from the field list on the left onto their respective destinations. In our case, we put the fields eventtype, mailmessageid, and mailsubject onto the Group By well, but you can add as many fields as you need.

    Add eventtype, mailmessageid and mailsubject fields

    Figure 26. Add eventtype, mailmessageid and mailsubject fields

  14. Now let’s create a filter for this visual in order to filter by type of event. Be sure you select the table and then click on Filter on the left menu.

    Add a Filter

    Figure 27. Add a Filter

  15. Click on Create One and select the field eventtype on the popup window. Now select the eventtype filter to see the following options.

    Create eventtype filter

    Figure 28. Create eventtype filter

  16. Click on the dots on the right of the eventtype filter and select Add to Sheet.

    Add filter to sheet

    Figure 29. Add filter to sheet

  17. Leave all the default values, scroll down and select Apply

    Apply filters with default values

    Figure 30. Apply filters with default values

  18. Now you can filter the vwsesmaster view by eventtype.

    Filter vwsesmasterview by eventtype

    Figure 31. Filter vwsesmasterview by eventtype

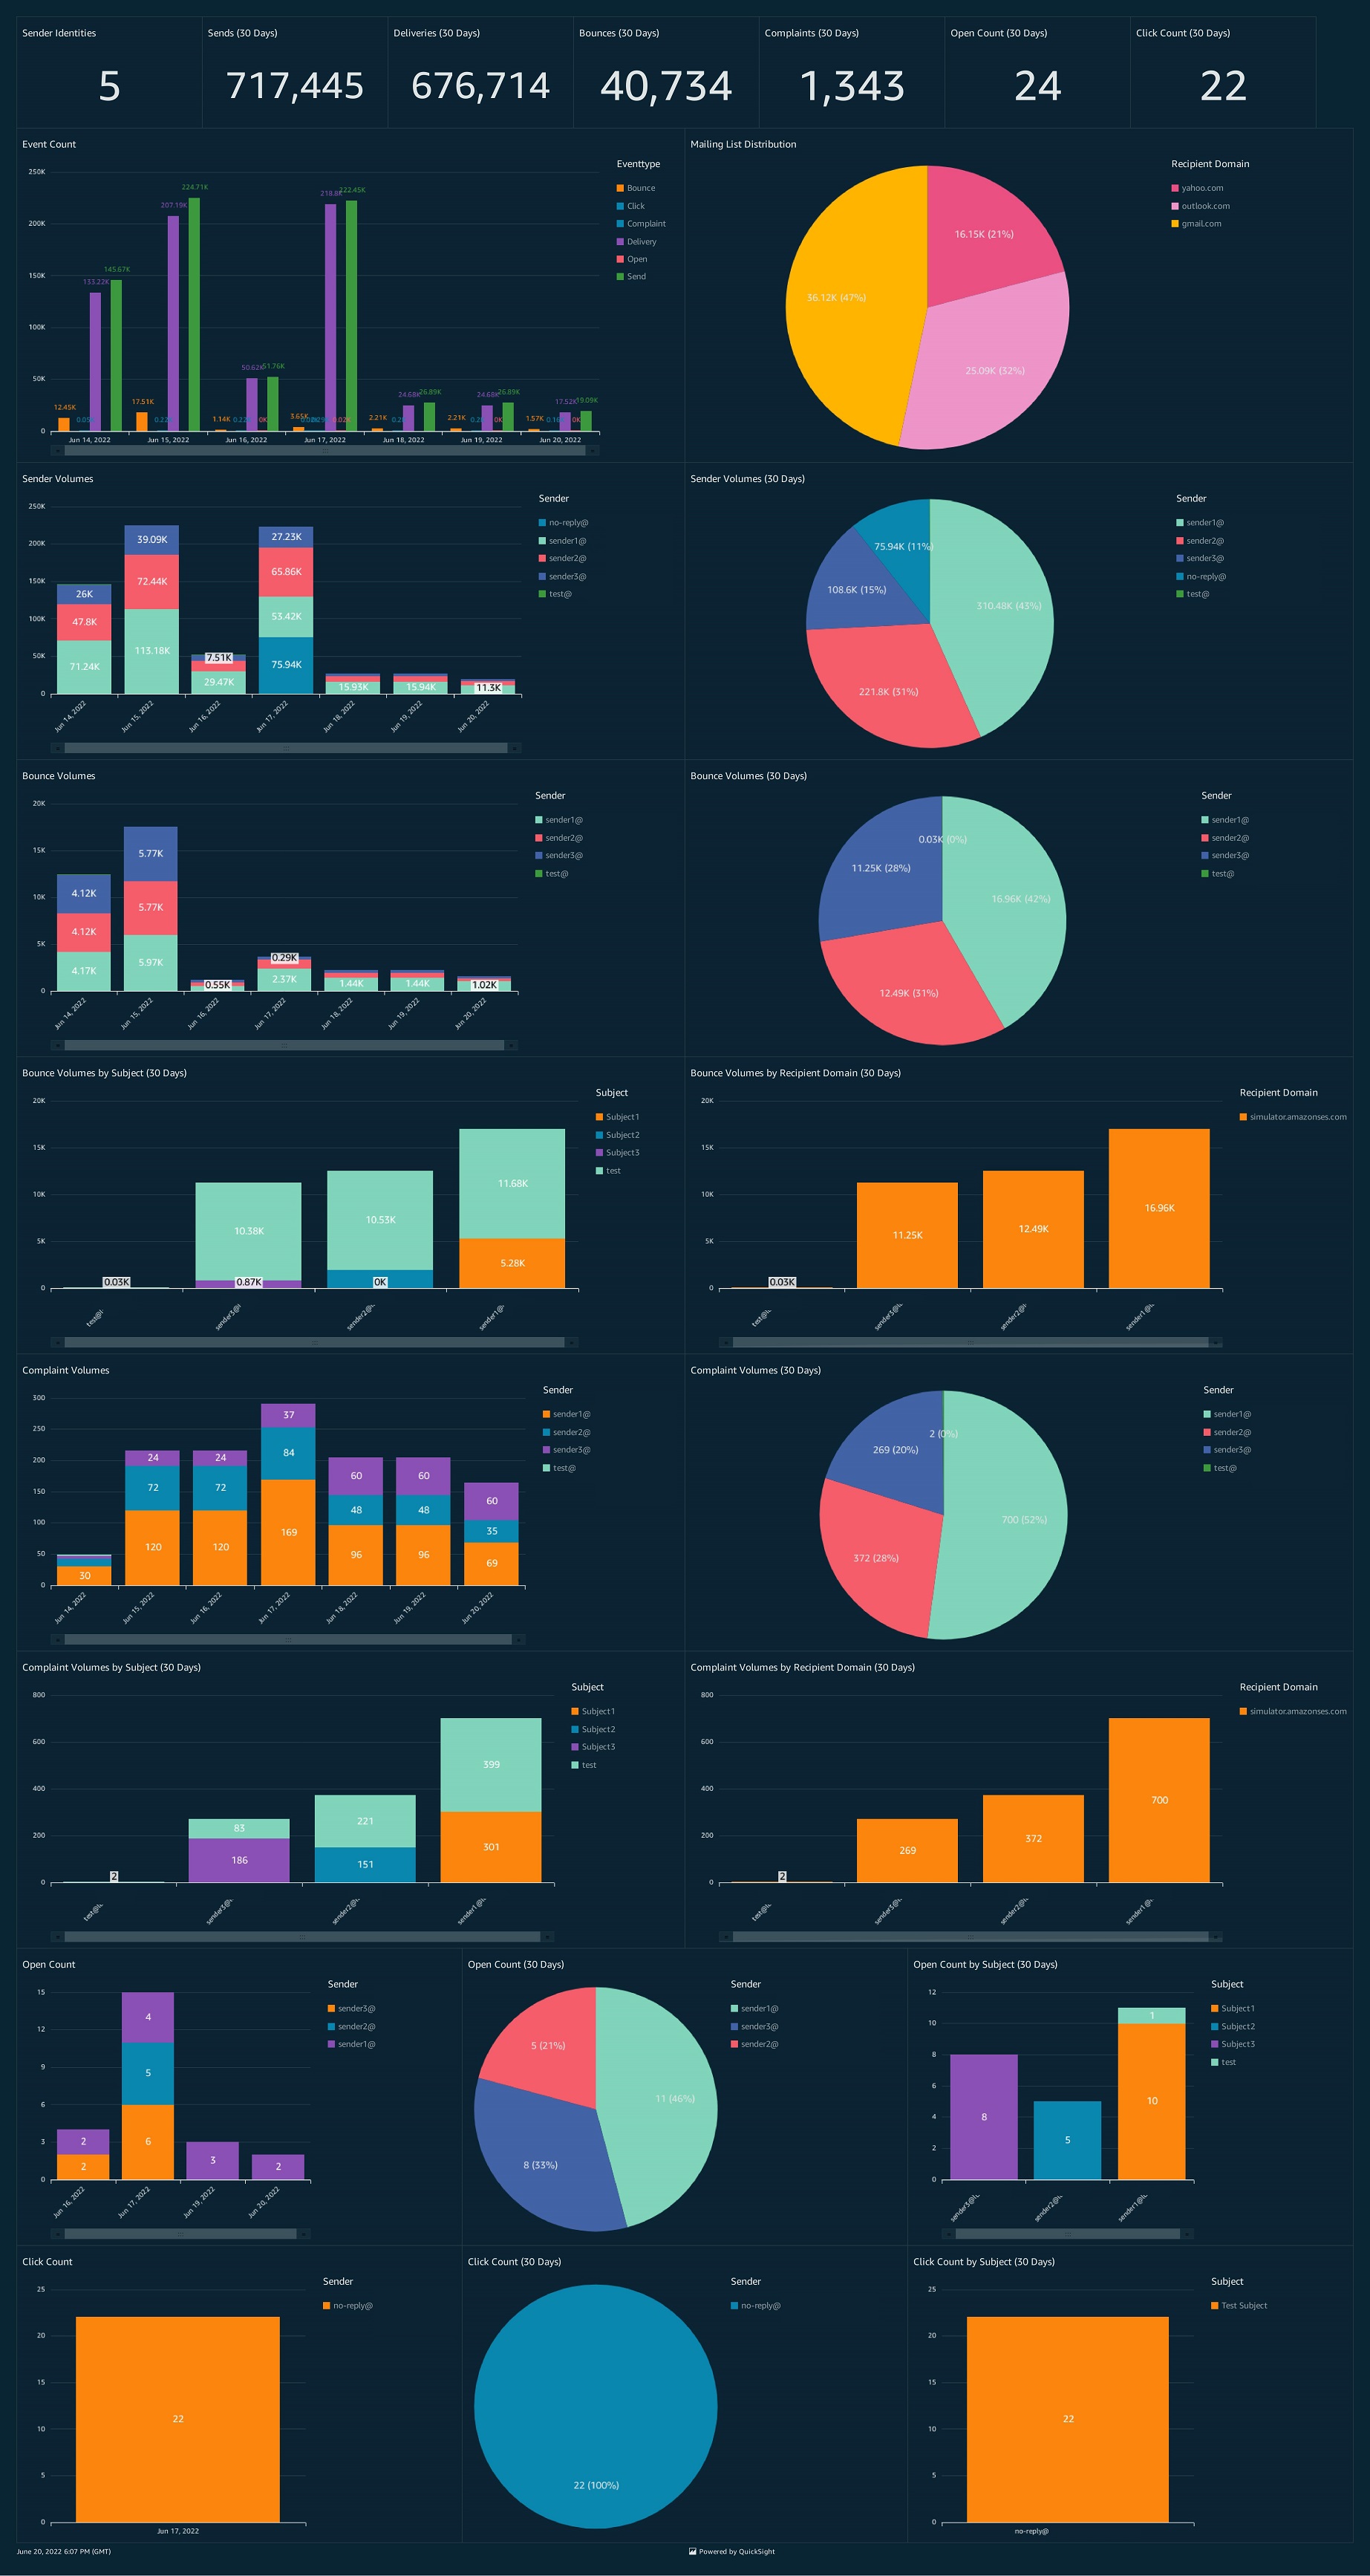
  19. You can continue customizing your visualization with all the available data in the sesmaster table, the vwsesmaster view and even add more datasets to include data from the vwSentMails, vwBouncedMails, and vwComplainedemails views. Below, you can see some other visualizations created from those views.
    Final visualization 1

    Figure 32. Final visualization 1

    Final visualization 2

    Figure 33. Final visualization 2

    Final visualization 3

    Figure 34. Final visualization 3

Clean up

To avoid ongoing charges, clean up the resources you created as part of this post:

  1. Delete the visualizations created in Amazon Quicksight.
  2. Unsubscribe from Amazon QuickSight if you are not using it for other projects.
  3. Delete the views and tables created in Amazon Athena.
  4. Delete the Amazon SES configuration set.
  5. Delete the Amazon SES events stored in S3.
  6. Delete the CloudFormation stack in order to delete the Amazon Kinesis Delivery Stream.

Conclusion

In this blog we showed how you can use AWS native services and features to quickly create an email tracking solution based on Amazon SES events to have a more detailed view on your sending activities. This solution uses a full serverless architecture without having to manage the underlying infrastructure and giving you the flexibility to use the solution for small, medium or intense Amazon SES usage, without having to take care of any servers.

We showed you some samples of dashboards and analysis that can be built for most of customers requirements, but of course you can evolve this solution and customize it according to your needs, adding or removing charts, filters or events to the dashboard. Please refer to the following documentation for the available Amazon SES Events, their structure and also how to create analysis and dashboards on Amazon QuickSight:

From a performance and cost efficiency perspective there are still several configurations that can be done to improve the solution, for example using a columnar file formant like parquet, compressing with snappy or setting your S3 partition strategy according to your email sending usage. Another improvement could be importing data into SPICE to read data in Amazon Quicksight. Using SPICE results in the data being loaded from Athena only once, until it is either manually refreshed or automatically refreshed using a schedule.

You can use this walkthrough to configure your first SES dashboard and start visualizing events detail. You can adjust the services described in this blog according to your company requirements.

About the authors

Oscar Mendoza AWS Solutions Architect Oscar Mendoza is a Solutions Architect at AWS based in Bogotá, Colombia. Oscar works with our customers to provide guidance in architectural best practices and to build Well Architected solutions on the AWS platform. He enjoys spending time with his family and his dog and playing music.
Luis Eduardo Torres AWS Solutions Architect Luis Eduardo Torres is a Solutions Architect at AWS based in Bogotá, Colombia. He helps companies to build their business using the AWS cloud platform. He has a great interest in Analytics and has been leading the Analytics track of AWS Podcast in Spanish.
Santiago Benavidez AWS Solutions Architect Santiago Benavídez is a Solutions Architect at AWS based in Buenos Aires, Argentina, with more than 13 years of experience in IT, currently helping DNB/ISV customers to achieve their business goals using the breadth and depth of AWS services, designing highly available, resilient and cost-effective architectures.

Build a big data Lambda architecture for batch and real-time analytics using Amazon Redshift

Post Syndicated from Jagadish Kumar original https://aws.amazon.com/blogs/big-data/build-a-big-data-lambda-architecture-for-batch-and-real-time-analytics-using-amazon-redshift/

With real-time information about customers, products, and applications in hand, organizations can take action as events happen in their business application. For example, you can prevent financial fraud, deliver personalized offers, and identify and prevent failures before they occur in near real time. Although batch analytics provides abilities to analyze trends and process data at scale that allow processing data in time intervals (such as daily sales aggregations by individual store), real-time analytics is optimized for low-latency analytics, ensuring that data is available for querying in seconds. Both paradigms of data processing operate in silos, which results in data redundancy and operational overhead to maintain them. A big data Lambda architecture is a reference architecture pattern that allows for the seamless coexistence of the batch and near-real-time paradigms for large-scale data for analytics.

Amazon Redshift allows you to easily analyze all data types across your data warehouse, operational database, and data lake using standard SQL. In this post, we collect, process, and analyze data streams in real time. With data sharing, you can share live data across Amazon Redshift clusters for read purposes with relative security and ease out of the box. In this post, we discuss how we can harness the data sharing ability of Amazon Redshift to set up a big data Lambda architecture to allow both batch and near-real-time analytics.

Solution overview

Example Corp. is a leading electric automotive company that revolutionized the automotive industry. Example Corp. operationalizes the connected vehicle data and improves the effectiveness of various connected vehicle and fleet use cases, including predictive maintenance, in-vehicle service monetization, usage-based insurance. and delivering exceptional driver experiences. In this post, we explore the real-time and trend analytics using the connected vehicle data to illustrate the following use cases:

  • Usage-based insurance – Usage-based insurance (UBI) relies on analysis of near-real-time data from the driver’s vehicle to access the risk profile of the driver. In addition, it also relies on the historical analysis (batch) of metrics (such as the number of miles driven in a year). The better the driver, the lower the premium.
  • Fleet performance trends – The performance of a fleet (such as a taxi fleet) relies on the analysis of historical trends of data across the fleet (batch) as well as the ability to drill down to a single vehicle within the fleet for near-real-time analysis of metrics like fuel consumption or driver distraction.

Architecture overview

In this section, we discuss the overall architectural setup for the Lambda architecture solution.

The following diagram shows the implementation architecture and the different computational layers:

  • Data ingestion from AWS IoT Core
  • Batch layer
  • Speed layer
  • Serving layer

Data ingestion

Vehicle telemetry data is ingested into the cloud through AWS IoT Core and routed to Amazon Kinesis Data Streams. The Kinesis Data Streams layer acts as a separation layer for the speed layer and batch layer, where the incoming telemetry is consumed by the speed layer’s Amazon Redshift cluster and Amazon Kinesis Data Firehose, respectively.

Batch layer

Amazon Kinesis Data Firehose is a fully managed service that can batch, compress, transform, and encrypt your data streams before loading them into your Amazon Simple Storage Service (Amazon S3) data lake. Kinesis Data Firehose also allows you to specify a custom expression for the Amazon S3 prefix where data records are delivered. This provides the ability to filter the partitioned data and control the amount of data scanned by each query, thereby improving performance and reducing cost.

The batch layer persists data in Amazon S3 and is accessed directly by an Amazon Redshift Serverless endpoint (serving layer). With Amazon Redshift Serverless, you can efficiently query and retrieve structured and semistructured data from files in Amazon S3 without having to load the data into Amazon Redshift tables.

The batch layer can also optionally precompute results as batch views from the immutable Amazon S3 data lake and persist them as either native tables or materialized views for very high-performant use cases. You can create these precomputed batch views using AWS Glue, Amazon Redshift stored procedures, Amazon Redshift materialized views, or other options.

The batch views can be calculated as:

batch view = function (all data)

In this solution, we build a batch layer for Example Corp. for two types of queries:

  • rapid_acceleration_by_year – The number of rapid accelerations by each driver aggregated per year
  • total_miles_driven_by_year – The total number of miles driven by the fleet aggregated per year

For demonstration purposes, we use Amazon Redshift stored procedures to create the batch views as Amazon Redshift native tables from external tables using Amazon Redshift Spectrum.

Speed layer

The speed layer processes data streams in real time and aims to minimize latency by providing real-time views into the most recent data.

Amazon Redshift Streaming Ingestion uses SQL to connect with one or more Kinesis data streams simultaneously. The native streaming ingestion feature in Amazon Redshift lets you ingest data directly from Kinesis Data Streams and enables you to ingest hundreds of megabytes of data per second and query it at exceptionally low latency—in many cases only 10 seconds after entering the data stream.

The speed cluster uses materialized views to materialize a point-in-time view of a Kinesis data stream, as accumulated up to the time it is queried. The real-time views are computed using this layer, which provide a near-real-time view of the incoming telemetry stream.

The speed views can be calculated as a function of recent data unaccounted for in the batch views:

speed view = function (recent data)

We calculate the speed views for these batch views as follows:

  • rapid_acceleration_realtime – The number of rapid accelerations by each driver for recent data not accounted for in the batch view rapid_acceleration_by_month
  • miles_driven_realtime – The number of miles driven by each driver for recent data not in miles_driven_by_month

Serving layer

The serving layer comprises an Amazon Redshift Serverless endpoint and any consumption services such as Amazon QuickSight or Amazon SageMaker.

Amazon Redshift Serverless (preview) is a serverless option of Amazon Redshift that makes it easy to run and scale analytics in seconds without the need to set up and manage data warehouse infrastructure. With Amazon Redshift Serverless, any user—including data analysts, developers, business professionals, and data scientists—can get insights from data by simply loading and querying data in the data warehouse.

Amazon Redshift data sharing enables instant, granular, and fast data access across Amazon Redshift clusters without the need to maintain redundant copies of data.

The speed cluster provides outbound data shares of the real-time materialized views to the Amazon Redshift Serverless endpoint (serving cluster).

The serving cluster joins data from the batch layer and speed layer to get near-real-time and historical data for a particular function with minimal latency. The consumption layer (such as Amazon API Gateway or QuickSight) is only aware of the serving cluster, and all the batch and stream processing is abstracted from the consumption layer.

We can view the queries to the speed layer from data consumption layer as follows:

query = function (batch views, speed views)

Deploy the CloudFormation template

We have provided an AWS CloudFormation template to demonstrate the solution. You can download and use this template to easily deploy the required AWS resources. This template has been tested in the us-east-1 Region.

The template requires you to provide the following parameters:

  • DatabaseName – The name of the first database to be created for speed cluster
  • NumberOfNodes – The number of compute nodes in the cluster.
  • NodeType – The type of node to be provisioned
  • MasterUserName – The user name that is associated with the master user account for the cluster that is being created
  • MasterUserPassword – The password that is associated with the master user account
  • InboundTraffic – The CIDR range to allow inbound traffic to the cluster
  • PortNumber – The port number on which the cluster accepts incoming connections
  • SQLForData – The source query to extract from AWS IOT Core topic

Prerequisites

When setting up this solution and using your own application data to push to Kinesis Data Streams, you can skip setting up the IoT Device Simulator and start creating your Amazon Redshift Serverless endpoint. This post uses the simulator to create related database objects and assumes use of the simulator in the solution walkthrough.

Set up the IoT Device Simulator

We use the IoT Device simulator to generate and simulate vehicle IoT data. The solution allows you to create and simulate hundreds of connected devices, without having to configure and manage physical devices or develop time-consuming scripts.

Use the following CloudFormation template to create the IoT Device Simulator in your account for trying out this solution.

Configure devices and simulations

To configure your devices and simulations, complete the following steps:

  1. Use the login information you received in the email you provided to log in to the IoT Device Simulator.
  2. Choose Device Types and Add Device Type.
  3. Choose Automotive Demo.
  4. For Device type name, enter testVehicles.
  5. For Topic, enter the topic where the sensor data is sent to AWS IoT Core.
  6. Save your settings.
  7. Choose Simulations and Add simulation.
  8. For Simulation name, enter testSimulation.
  9. For Simulation type¸ choose Automotive Demo.
  10. For Select a device type¸ choose the device type you created (testVehicles).
  11. For Number of devices, enter 15.

You can choose up to 100 devices per simulation. You can configure a higher number of devices to simulate large data.

  1. For Data transmission interval, enter 1.
  2. For Data transmission duration, enter 300.

This configuration runs the simulation for 5 minutes.

  1. Choose Save.

Now you’re ready to simulate vehicle telemetry data to AWS IoT Core.

Create an Amazon Redshift Serverless endpoint

The solution uses an Amazon Redshift Serverless endpoint as the serving layer cluster. You can set up Amazon Redshift Serverless in your account.

Set up Amazon Redshift Query Editor V2

To query data, you can use Amazon Redshift Query Editor V2. For more information, refer to Introducing Amazon Redshift Query Editor V2, a Free Web-based Query Authoring Tool for Data Analysts.

Get namespaces for the provisioned speed layer cluster and Amazon Redshift Serverless

Connect to speed-cluster-iot (the speed layer cluster) through Query Editor V2 and run the following SQL:

select current_namespace; -- (Save as <producer_namespace>)

Similarly, connect to the Amazon Redshift Serverless endpoint and get the namespace:

select current_namespace; -- (Save as <consumer_namespace>)

You can also get this information via the Amazon Redshift console.

Now that we have all the prerequisites set up, let’s go through the solution walkthrough.

Implement the solution

The workflow includes the following steps:

  1. Start the IoT simulation created in the previous section.

The vehicle IoT is simulated and ingested through IoT Device Simulator for the configured number of vehicles. The raw telemetry payload is sent to AWS IoT Core, which routes the data to Kinesis Data Streams.

At the batch layer, data is directly put from Kinesis Data Streams to Kinesis Data Firehose, which converts the data to parquet and delivers to Amazon with the prefix s3://<Bucketname>/vehicle_telematics_raw/year=<>/month=<>/day=<>/.

  1. When the simulation is complete, run the pre-created AWS Glue crawler vehicle_iot_crawler on the AWS Glue console.

The serving layer Amazon Redshift Serverless endpoint can directly access data from the Amazon S3 data lake through Redshift Spectrum external tables. In this demo, we compute batch views through Redshift Spectrum and store them as Amazon Redshift tables using Amazon Redshift stored procedures.

  1. Connect to the Amazon Redshift Serverless endpoint through Query Editor V2 and create the stored procedures using the following SQL script.
  2. Run the two stored procedures to create the batch views:
call rapid_acceleration_by_year_sp();
call total_miles_driven_by_year_sp();

The two stored procedures create batch views as Amazon Redshift native tables:

    • batchlayer_rapid_acceleration_by_year
    • batchlayer_total_miles_by_year

You can also schedule these stored procedures as batch jobs. For more information, refer to Scheduling SQL queries on your Amazon Redshift data warehouse.

At the speed layer, the incoming data stream is read and materialized by the speed layer Amazon Redshift cluster in the materialized view vehicleiotstream_mv.

  1. Connect to the provisioned speed-cluster-iot and run the following SQL script to create the required objects.

Two real-time views are created from this materialized view:

    • batchlayer_rapid_acceleration_by_year
    • batchlayer_total_miles_by_year
  1. Refresh the materialized view vehicleiotstream_mv at the required interval, which triggers Amazon Redshift to read from the stream and load data into the materialized view.
    REFRESH MATERIALIZED VIEW vehicleiotstream_mv;

Refreshes are currently manual, but can be automated using the query scheduler.

The real-time views are shared as an outbound data share by the speed cluster to the serving cluster.

  1. Connect to speed-cluster-iot and create an outbound data share (producer) with the following SQL:
    -- Create Datashare from Primary (Producer) to Serverless (Consumer)
    CREATE DATASHARE speedlayer_datashare SET PUBLICACCESSIBLE TRUE;
    ALTER DATASHARE speedlayer_datashare ADD SCHEMA public;
    ALTER DATASHARE speedlayer_datashare ADD ALL TABLES IN SCHEMA public;
    GRANT USAGE ON DATASHARE speedlayer_datashare TO NAMESPACE '<consumer_namespace>'; -- (replace with consumer namespace created in prerequisites 5)

  2. Connect to speed-cluster-iot and create an inbound data share (consumer) with the following SQL:
    CREATE DATABASE vehicleiot_shareddb FROM DATASHARE speedlayer_datashare OF NAMESPACE '< producer_namespace >'; -- (replace with producer namespace created in prerequisites 5)

Now that the real-time views are available for the Amazon Redshift Serverless endpoint, we can run queries to get real-time metrics or historical trends with up-to-date data by accessing the batch and speed layers and joining them using the following queries.

For example, to calculate total rapid acceleration by year with up-to-the-minute data, you can run the following query:

-- Rapid Acceleration By Year

select SUM(rapid_acceleration) rapid_acceleration, vin, year from 
(
select rapid_acceleration, vin,year
  from public.batchlayer_rapid_acceleration_by_year batch
union all
select rapid_acceleration, vin,year
from speedlayer_shareddb.public.speedlayer_rapid_acceleration_by_year speed)
group by VIN, year;

Similarly, to calculate total miles driven by year with up-to-the-minute data, run the following query:

-- Total Miles Driven By Year

select SUM(total_miles) total_miles_driven , year from 
(
select total_miles, year
  from public.batchlayer_total_miles_by_year batch
union all
select total_miles, year
from speedlayer_shareddb.public.speedlayer_total_miles_by_year speed)
group by year;

For only access to real-time data to power daily dashboards, you can run queries against real-time views shared to your Amazon Redshift Serverless cluster.

For example, to calculate the average speed per trip of your fleet, you can run the following SQL:

select CAST(measuretime as DATE) "date",
vin,
trip_id,
avg(vehicleSpeed)
from speedlayer_shareddb.public.vehicleiotstream_mv 
group by vin, date, trip_id;

Because this demo uses the same data as a quick start, there are duplicates in this demonstration. In actual implementations, the serving cluster manages the data redundancy and duplication by creating views with date predicates that consume non-overlapping data from batch and real-time views and provide overall metrics to the consumption layer.

You can consume the data with QuickSight for dashboards, with API Gateway for API-based access, or via the Amazon Redshift Data API or SageMaker for AI and machine learning (ML) workloads. This is not included as part of the provided CloudFormation template.

Best practices

In this section, we discuss some best practices and lessons learned when using this solution.

Provisioned vs. serverless

The speed layer is a continuous ingestion layer reading data from the IoT streams often running 24/7 workloads. There is less idle time and variability in the workloads and it is advantageous to have a provisioned cluster supporting persistent workloads that can scale elastically.

The serving layer can be provisioned (in case of 24/7 workloads) or Amazon Redshift Serverless in case of sporadic or ad hoc workloads. In this post, we assumed sporadic workloads, so serverless is the best fit. In addition, the serving layer can house multiple Amazon Redshift clusters, each consuming their data share and serving downstream applications.

RA3 instances for data sharing

Amazon Redshift RA3 instances enable data sharing to allow you to securely and easily share live data across Amazon Redshift clusters for reads. You can combine the data that is ingested in near-real time with the historical data using the data share to provide personalized driving characteristics to determine the insurance recommendation.

You can also grant fine-grained access control to the underlying data in the producer to the consumer cluster as needed. Amazon Redshift offers comprehensive auditing capabilities using system tables and AWS CloudTrail to allow you to monitor the data sharing permissions and usage across all the consumers and revoke access instantly when necessary. The permissions are granted by the superusers from both the producer and the consumer clusters to define who gets access to what objects, similar to the grant commands used in the earlier section. You can use the following commands to audit the usage and activities for the data share.

Track all changes to the data share and the shared database imported from the data share with the following code:

Select username, share_name, recordtime, action, 
         share_object_type, share_object_name 
  from svl_datashare_change_log
   order by recordtime desc;

Track data share access activity (usage), which is relevant only on the producer, with the following code:

Select * from svl_datashare_usage;

Pause and Resume

You can pause the producer cluster when batch processing is complete to save costs. The pause and resume actions on Amazon Redshift allow you to easily pause and resume clusters that may not be in operation at all times. It allows you to create a regularly-scheduled time to initiate the pause and resume actions at specific times or you can manually initiate a pause and later a resume. Flexible on-demand pricing and per-second billing gives you greater control of costs of your Redshift compute clusters while maintaining your data in a way that is simple to manage.

Materialized views for fast access to data

Materialized views allow pre-composed results from complex queries on large tables for faster access. The producer cluster exposes data as materialized views to simplify access for the consumer cluster. This also allows flexibility at the producer cluster to update the underlying table structure to address new business use cases, without affecting consumer-dependent queries and enabling a loose coupling.

Conclusion

In this post, we demonstrated how to process and analyze large-scale data from streaming and batch sources using Amazon Redshift as the core of the platform guided by the Lambda architecture principles.

You started by collecting real-time data from connected vehicles, and storing the streaming data in an Amazon S3 data lake through Kinesis Data Firehose. The solution simultaneously processes the data for near-real-time analysis through Amazon Redshift streaming ingestion.

Through the data sharing feature, you were able to share live, up-to-date data to an Amazon Redshift Serverless endpoint (serving cluster), which merges the data from the speed layer (near-real time) and batch layer (batch analysis) to provide low-latency access to data from near-real-time analysis to historical trends.

Click here to get started with this solution today and let us know how you implemented this solution in your organization through the comments section.


About the Authors

Jagadish Kumar is a Sr Analytics Specialist Solutions Architect at AWS. He is deeply passionate about Data Architecture and helps customers build analytics solutions at scale on AWS. He is an avid college football fan and enjoys reading, watching sports and riding motorcycle.

Thiyagarajan Arumugam is a Big Data Solutions Architect at Amazon Web Services and designs customer architectures to process data at scale. Prior to AWS, he built data warehouse solutions at Amazon.com. In his free time, he enjoys all outdoor sports and practices the Indian classical drum mridangam.

Eesha Kumar is an Analytics Solutions Architect with AWS. He works with customers to realize business value of data by helping them building solutions leveraging AWS platform and tools.

Use Amazon Kinesis Data Firehose to extract data insights with Coralogix

Post Syndicated from Tal Knopf original https://aws.amazon.com/blogs/big-data/use-amazon-kinesis-data-firehose-to-extract-data-insights-with-coralogix/

This is a guest blog post co-written by Tal Knopf at Coralogix.

Digital data is expanding exponentially, and the existing limitations to store and analyze it are constantly being challenged and overcome. According to Moore’s Law, digital storage becomes larger, cheaper, and faster with each successive year. The advent of cloud databases is just one example of how this is happening. Previous hard limits on storage size have become obsolete since their introduction.

In recent years, the amount of available data storage in the world has increased rapidly, reflecting this new reality. If you took all the information just from US academic research libraries and lumped it together, it would add up to 2 petabytes.

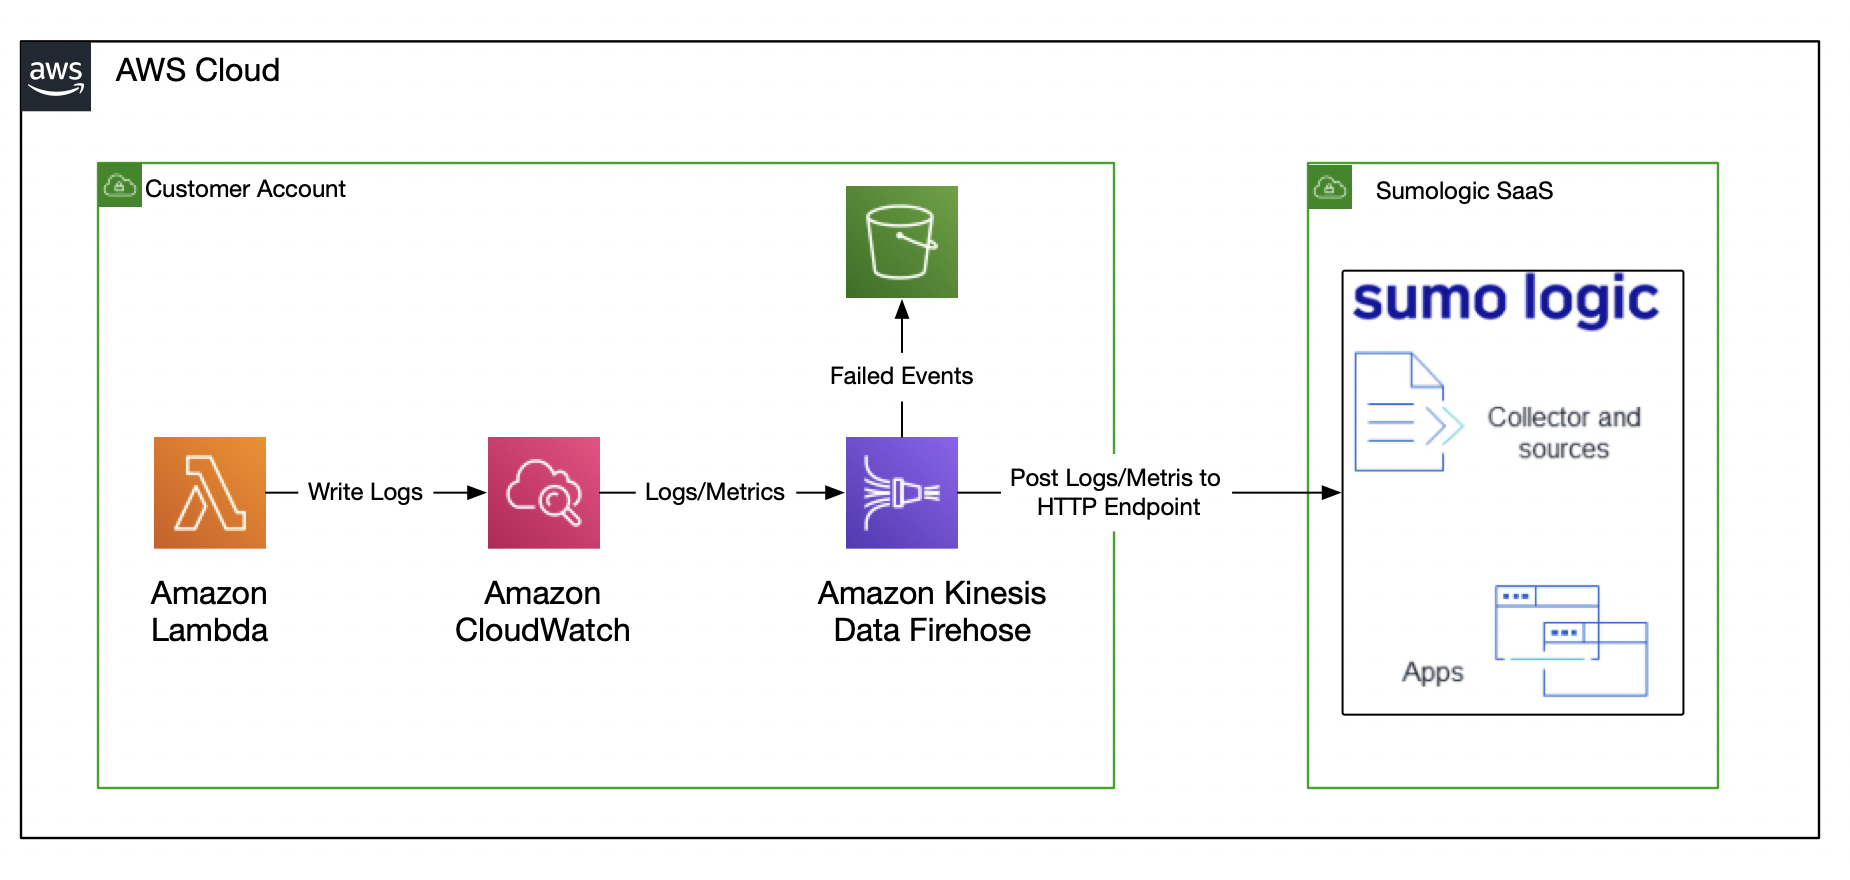
Coralogix has worked with AWS to bring you a solution to allow for the flawless integration of high volumes of data with the Coralogix platform for analysis, using Amazon Kinesis Data Firehose.

Kinesis Data Firehose and Coralogix

Kinesis Data Firehose delivers real-time streaming data to destinations like Amazon Simple Storage Service (Amazon S3), Amazon Redshift, or Amazon OpenSearch Service (successor to Amazon Elasticsearch Service), and now supports delivering streaming data to Coralogix. There is no limit on the number of delivery streams, so you can use it to get data from multiple AWS services.

Kinesis Data Firehose provides built-in, fully managed error handling, transformation, conversion, aggregation, and compression functionality, so you don’t need to write applications to handle these complexities.

Coralogix is an AWS Partner Network (APN) Advanced Technology Partner with AWS DevOps Competency. The platform enables you to easily explore and analyze logs to gain deeper insights into the state of your applications and AWS infrastructure. You can analyze all your AWS service logs while storing only the ones you need, and generate metrics from aggregated logs to uncover and alert on trends in your AWS services.

Solution overview

Imagine a pipe flowing with data—messages, to be more specific. These messages can contain log lines, metrics, or any other type of data you want to collect.

Clearly, there must be something pushing data into the pipe; this is the provider. There must also be a mechanism for pulling data out of the pipe; this is the consumer.

Kinesis Data Firehose makes it easy to collect, process, and analyze real-time, streaming data by grouping the pipes together in the most efficient way to help with management and scaling.

It offers a few significant benefits compared to other solutions:

  • Keeps monitoring simple – With this solution, you can configure AWS Web Application Firewall (AWS WAF), Amazon Route 53 Resolver Query Logs, or Amazon API Gateway to deliver log events directly to Kinesis Data Firehose.
  • Integrates flawlessly – Most AWS services use Amazon CloudWatch by default to collect logs, metrics, and additional events data. CloudWatch logs can easily be sent using the Firehose delivery stream.
  • Flexible with minimum maintenance – To configure Kinesis Data Firehose with the Coralogix API as a destination, you only need to set up the authentication in one place, regardless of the amount of services or integrations providing the actual data. You can also configure an S3 bucket as a backup plan. You can back up all log events or only those exceeding a specified retry duration.
  • Scale, scale, scale – Kinesis Data Firehose scales up to meet your needs with no need for you to maintain it. The Coralogix platform is also built for scale and can meet all your monitoring needs as your system grows.

Prerequisites

To get started, you must have the following:

  • A Coralogix account. If you don’t already have an account, you can sign up for one.
  • A Coralogix private key.

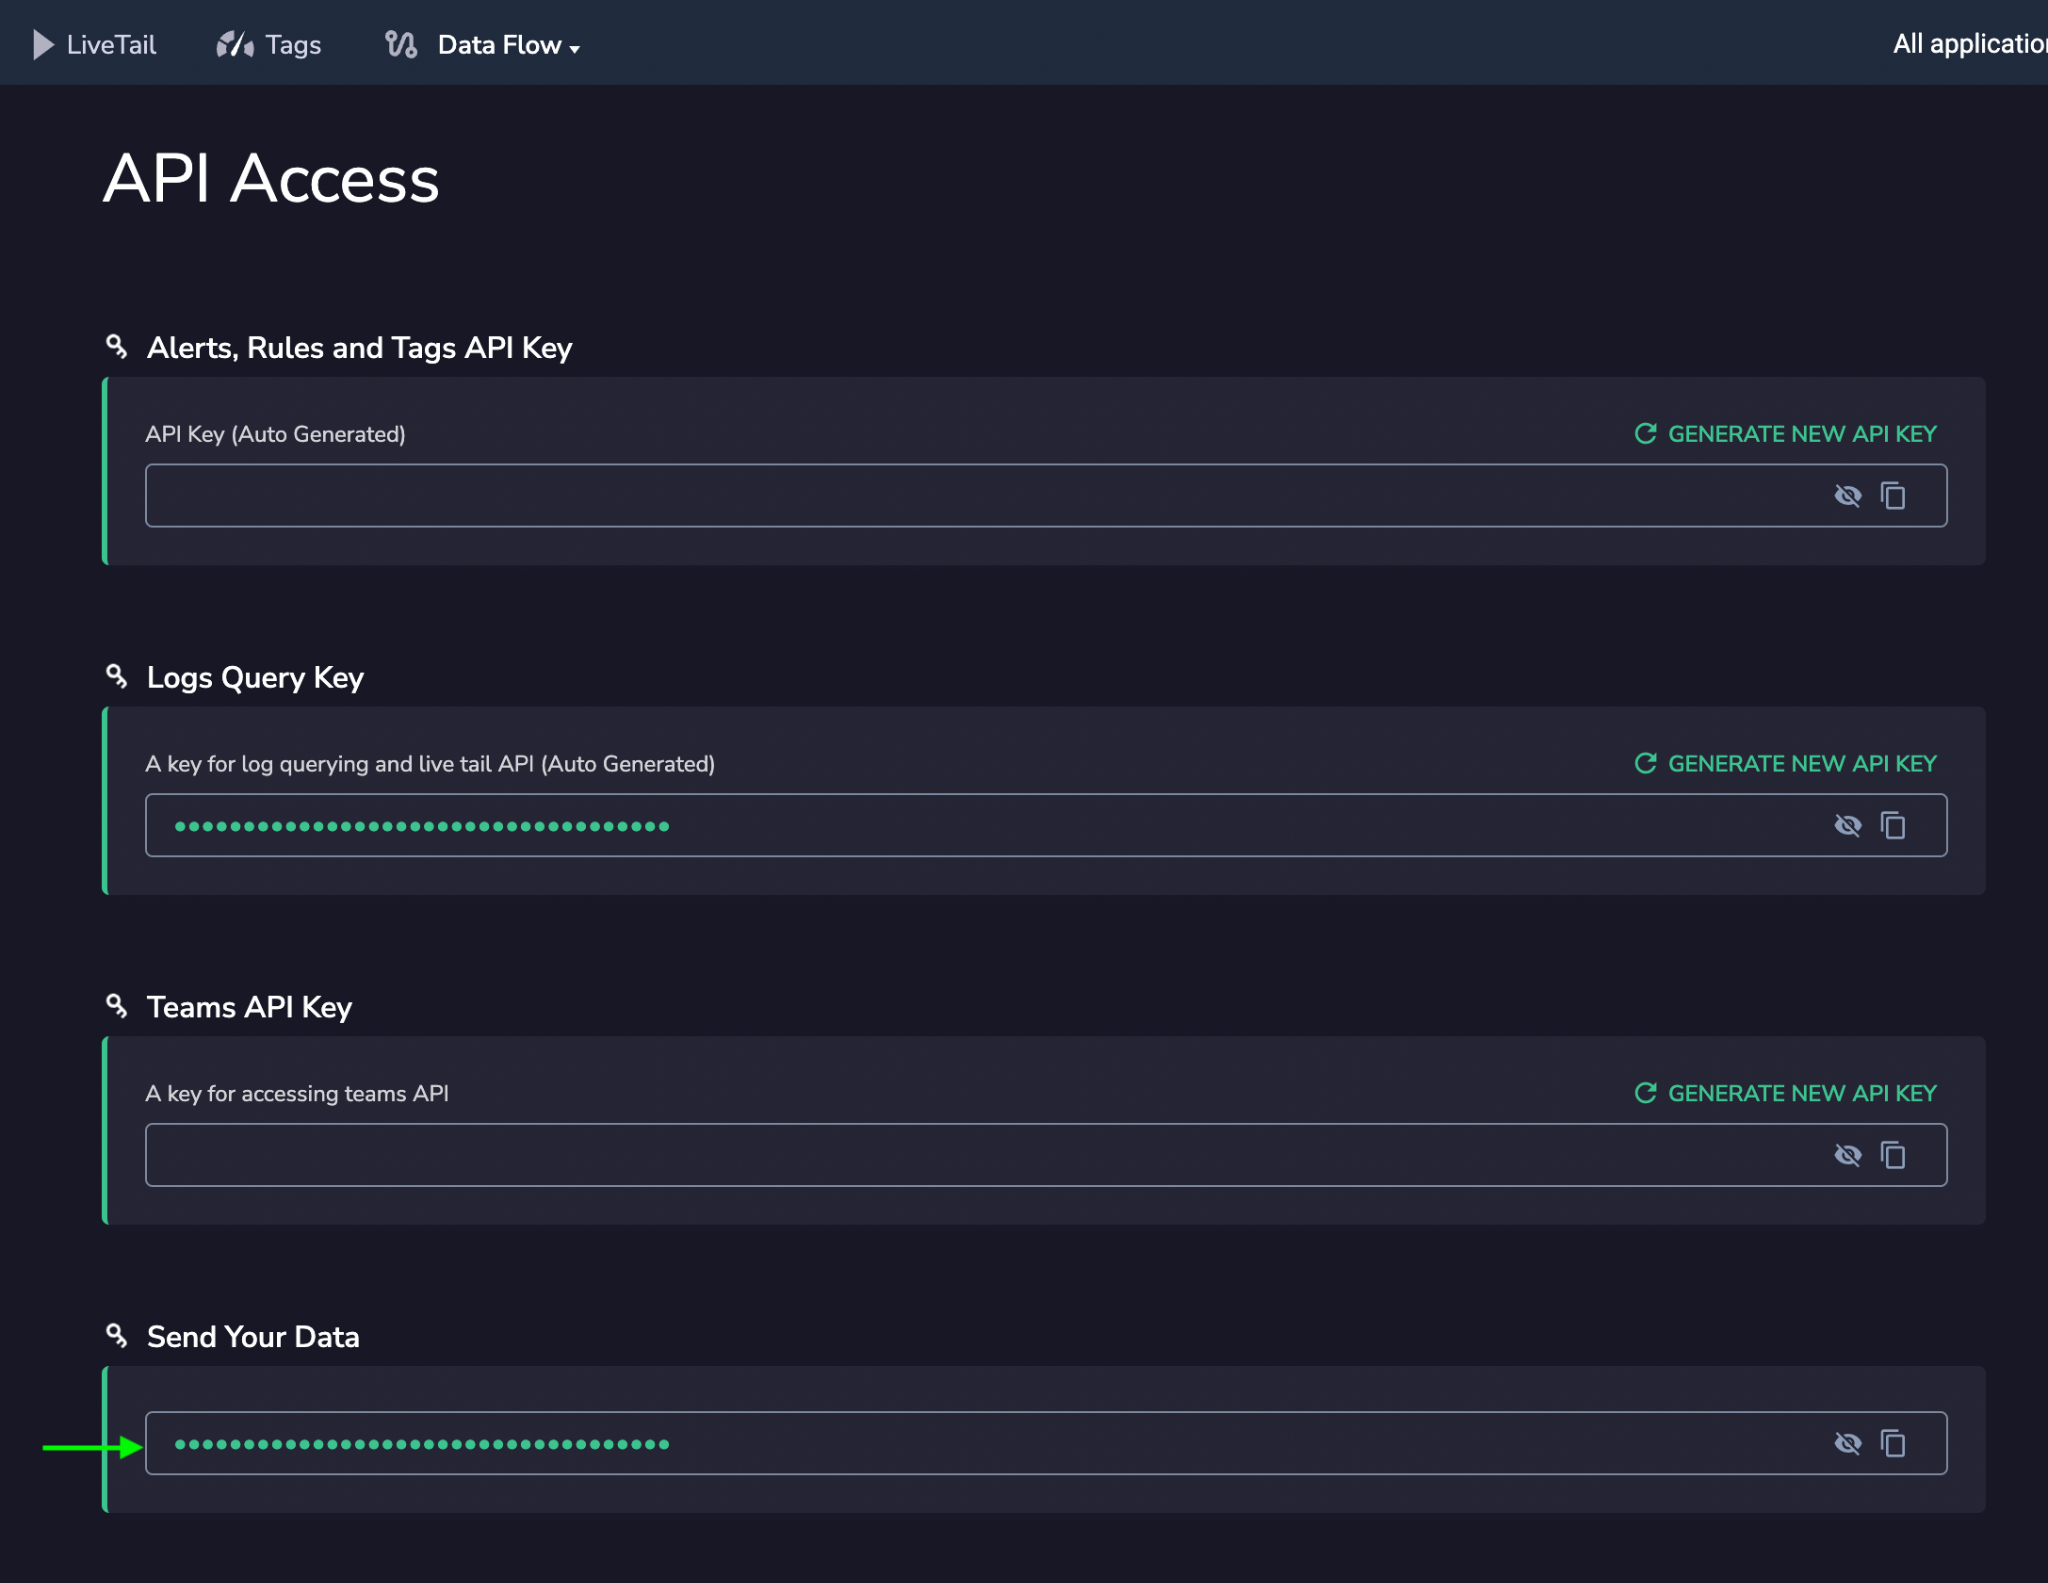
To find your key, in your Coralogix account, choose API Keys on the Data Flow menu.

Locate the key for Send Your Data.

Set up your delivery stream

To configure your deliver stream, complete the following steps:

  1. On the Kinesis Data Firehose console, choose Create delivery stream.
  2. Under Choose source and destination, for Source, choose Direct PUT.
  3. For Destination, choose Coralogix.
  4. For Delivery stream name¸ enter a name for your stream.
  5. Under Destination settings, for HTTP endpoint name, enter a name for your endpoint.
  6. For HTTP endpoint URL, enter your endpoint URL based on your Region and Coralogix account configuration.
  7. For Access key, enter your Coralogix private key.
  8. For Content encoding¸ select GZIP.
  9. For Retry duration, enter 60.

To override the logs applicationName, subsystemName, or computerName, complete the optional steps under Parameters.

  1. For Key, enter the log name.
  2. For Value, enter a new value to override the default.
  3. For this post, leave the configuration under Buffer hints as is.
  4. In the Backup settings section, for Source record in Amazon S3, select Failed data only (recommended).
  5. For S3 backup bucket, choose an existing bucket or create a new one.
  6. Leave the settings under Advanced settings as is.
  7. Review your settings and choose Create delivery stream.

Logs subscribed to your delivery stream are immediately sent and available for analysis within Coralogix.

Conclusion

Coralogix provides you with full visibility into your logs, metrics, tracing, and security data without relying on indexing to provide analysis and insights. When you use Kinesis Data Firehose to send data to Coralogix, you can easily centralize all your AWS service data for streamlined analysis and troubleshooting.

To get the most out of the platform, check out Getting Started with Coralogix, which provides information on everything from parsing and enrichment to alerting and data clustering.


About the Authors

Tal Knopf is the Head of Customer DevOps at Coralogix. He uses his vast experience in designing and building customer-focused solutions to help users extract the full value from their observability data. Previously, he was a DevOps engineer in Akamai and other companies, where he specialized in large-scale systems and CDN solutions.

Ilya Rabinov is a Solutions Architect at AWS. He works with ISVs at late stages of their journey to help build new products, migrate existing applications, or optimize workloads on AWS. His ares of interest include machine learning, artificial intelligence, security, DevOps culture, CI/CD, and containers.

Audit AWS service events with Amazon EventBridge and Amazon Kinesis Data Firehose

Post Syndicated from Anand Shah original https://aws.amazon.com/blogs/big-data/audit-aws-service-events-with-amazon-eventbridge-and-amazon-kinesis-data-firehose/

Amazon EventBridge is a serverless event bus that makes it easy to build event-driven applications at scale using events generated from your applications, integrated software as a service (SaaS) applications, and AWS services. Many AWS services generate EventBridge events. When an AWS service in your account emits an event, it goes to your account’s default event bus.

The following are a few event examples:

By default, these AWS service-generated events are transient and therefore not retained. This post shows how you can forward AWS service-generated events or custom events to Amazon Simple Storage Service (Amazon S3) for long-term storage, analysis, and auditing purposes using EventBridge rules and Amazon Kinesis Data Firehose.

Solution overview

In this post, we provide a working example of AWS service-generated events ingested to Amazon S3. To make sure we have some service events available in default event bus, we use Parameter Store, a capability of AWS Systems Manager to store new parameters manually. This action generates a new event, which is ingested by the following pipeline.

Architecture Diagram

The pipeline includes the following steps:

  1. AWS service-generated events (for example, a new parameter created in Parameter Store) goes to the default event bus at EventBridge.
  2. The EventBridge rule matches all events and forwards those to Kinesis Data Firehose.
  3. Kinesis Data Firehose delivers events to the S3 bucket partitioned by detail-type and receipt time using its dynamic partitioning capability.
  4. The S3 bucket stores the delivered events, and their respective event schema is registered to the AWS Glue Data Catalog using an AWS Glue crawler.
  5. You query events using Amazon Athena.

Deploy resources using AWS CloudFormation

We use AWS CloudFormation templates to create all the necessary resources for the ingestion pipeline. This removes opportunities for manual error, increases efficiency, and provides consistent configurations over time. The template is also available on GitHub.

Complete the following steps:

  1. Click here to
    Launch Stack
  2. Acknowledge that the template may create AWS Identity and Access Management (IAM) resources.
  3. Choose Create stack.

The template takes about 10 minutes to complete and creates the following resources in your AWS account:

  • An S3 bucket to store event data.
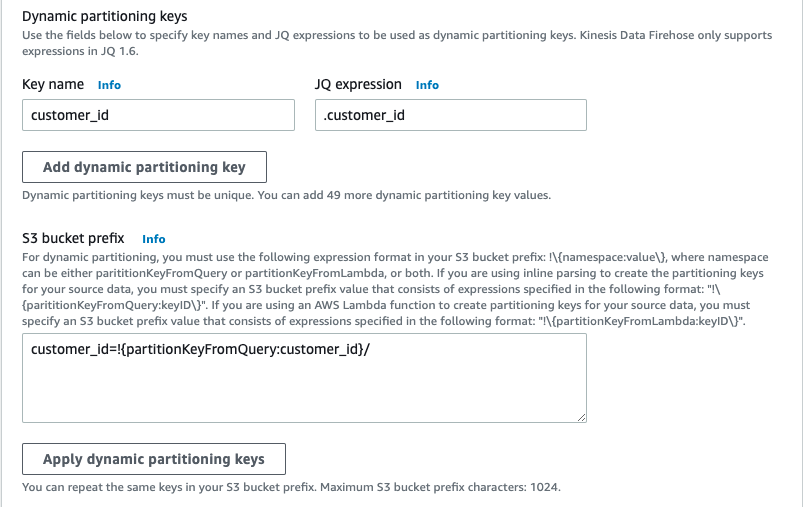
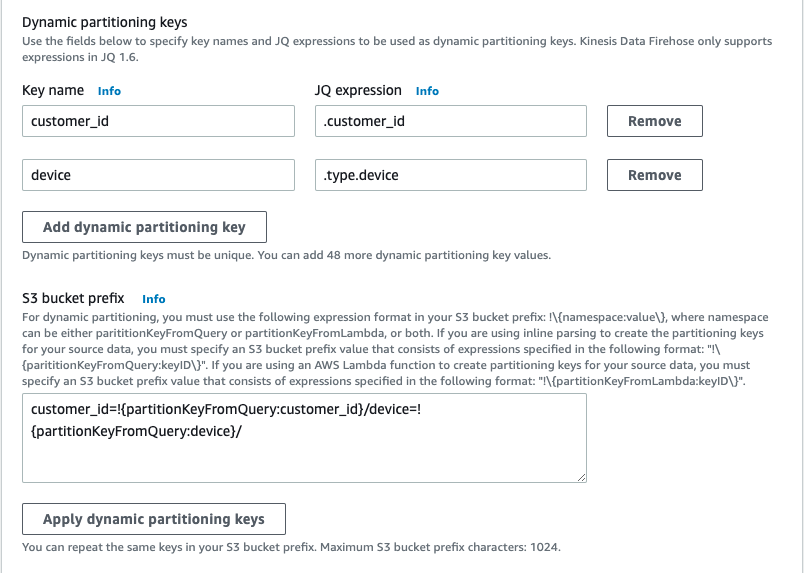
  • A Firehose delivery stream with dynamic partitioning configuration. Dynamic partitioning enables you to continuously partition streaming data in Kinesis Data Firehose by using keys within the data (for example, customer_id or transaction_id) and then deliver the data grouped by these keys into corresponding S3 prefixes.
  • An EventBridge rule that forwards all events from the default event bus to Kinesis Data Firehose.
  • An AWS Glue crawler that references the path to the event data in the S3 bucket. The crawler inspects data landed to Amazon S3 and registers tables as per the schema with the AWS Glue Data Catalog.
  • Athena named queries for you to query the data processed by this example.

Trigger a service event

After you create the CloudFormation stack, you trigger a service event.

  1. On the AWS CloudFormation console, navigate to the Outputs tab for the stack.
  2. Choose the link for the key CreateParameter.

Create Parameter

You’re redirected to the Systems Manager console to create a new parameter.

  1. For Name, enter a name (for example, my-test-parameter).
  2. For Value, enter the test value of your choice (for example, test-value).

My Test parameter

  1. Leave everything else as default and choose Create parameter.

This step saves the new Systems Manager parameter and pushes the parameter-created event to the default EventBridge event bus, as shown in the following code:

{
  "version": "0",
  "id": "6a7e4feb-b491-4cf7-a9f1-bf3703497718",
  "detail-type": "Parameter Store Change",
  "source": "aws.ssm",
  "account": "123456789012",
  "time": "2017-05-22T16:43:48Z",
  "region": "us-east-1",
  "resources": [
    "arn:aws:ssm:us-east-1:123456789012:parameter/foo"
  ],
  "detail": {
    "operation": "Create",
    "name": "my-test-parameter",
    "type": "String",
    "description": ""
  }
}

Discover the event schema

After the event is triggered by saving the parameter, wait at least 2 minutes for the event to be ingested via Kinesis Data Firehose to the S3 bucket. Now complete the following steps to run an AWS Glue crawler to discover and register the event schema in the Data Catalog:

  1. On the AWS Glue console, choose Crawlers in the navigation pane.
  2. Select the crawler with the name starting with S3EventDataCrawler.
  3. Choose Run crawler.

Run Crawler

This step runs the crawler, which takes about 2 minutes to complete. The crawler discovers the schema from all events and registers it as tables in the Data Catalog.

Query the event data

When the crawler is complete, you can start querying event data. To query the event, complete the following steps:

  1. On the AWS CloudFormation console, navigate to the Outputs tab for your stack.
  2. Choose the link for the key AthenaQueries.

Athena Queries

You’re redirected to the Saved queries tab on the Athena console. If you’re running Athena queries for the first time, set up your S3 output bucket. For instructions, see Working with Query Results, Recent Queries, and Output Files.

  1. Search for Blog to find the queries created by this post.
  2. Choose the query Blog – Query Parameter Store Events.

Find Athena Saved Queries

The query opens on the Athena console.

  1. Choose Run query.

You can update the query to search the event you created earlier.

  1. Apply a WHERE clause with the parameter name you selected earlier:
SELECT * FROM "AwsDataCatalog"."eventsdb-randomId"."parameter_store_change"
WHERE detail.name = 'Your event name'

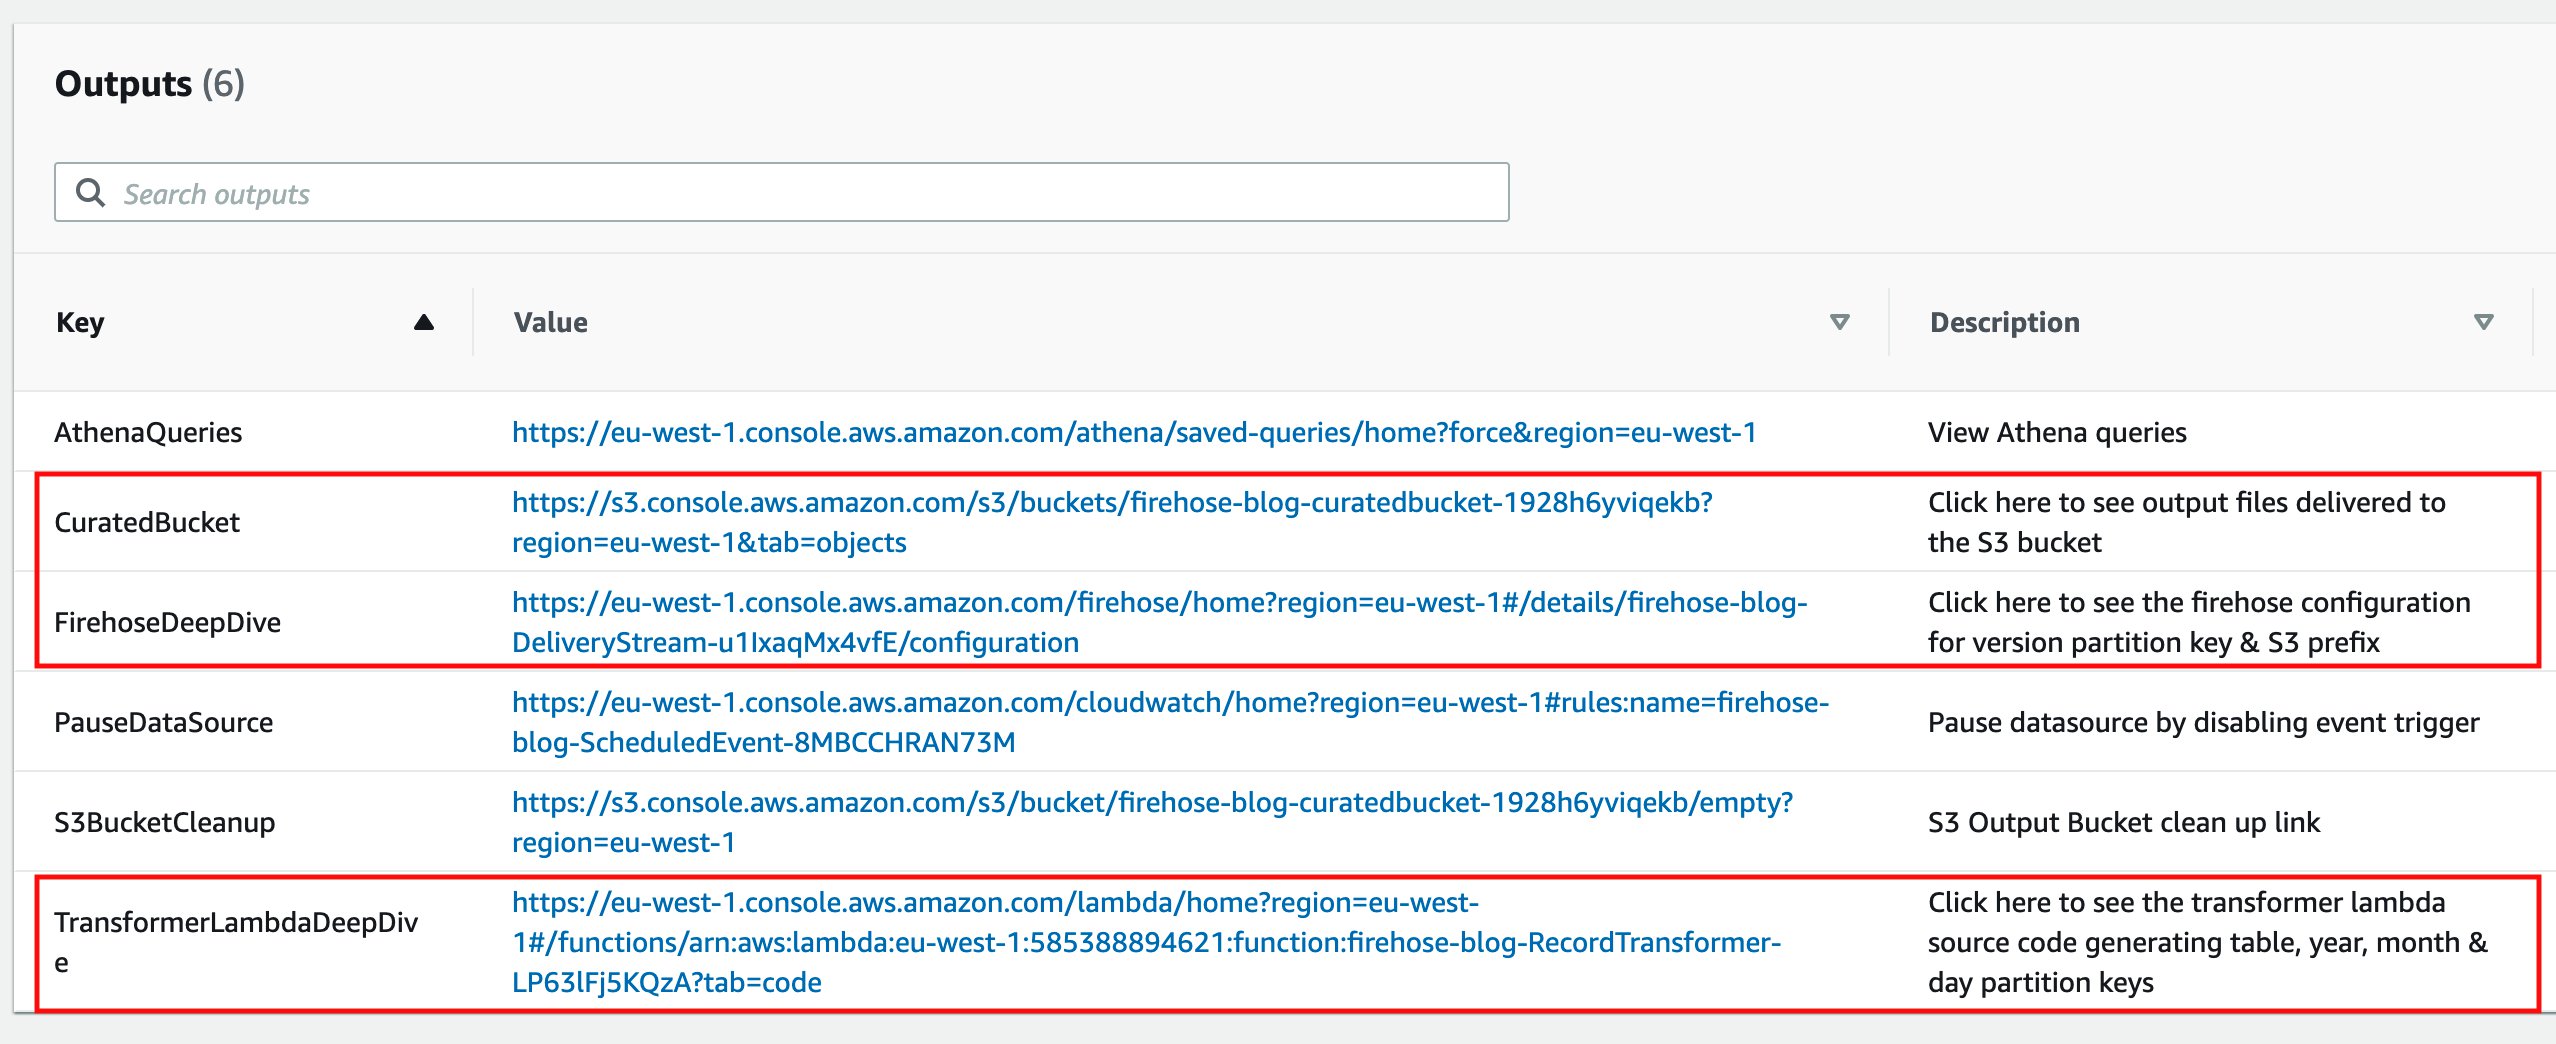
You can also choose the link next to the key CuratedBucket from the CloudFormation stack outputs to see paths and the objects loaded to the S3 bucket from other event sources. Similarly, you can query them via Athena.

Clean up

Complete the following steps to delete your resources and stop incurring costs:

  1. On the AWS CloudFormation console, select the stack you created and choose Delete.
  2. On the Amazon S3 console, find the bucket with the name starting with eventbridge-firehose-blog-curatedbucket.
  3. Select the bucket and choose Empty.
  4. Enter permanently delete to confirm the choice.
  5. Select the bucket again and choose Delete.
  6. Confirm the action by entering the bucket name when prompted.
  7. On the Systems Manager console, go to the parameter store and delete the parameter you created earlier.

Summary

This post demonstrates how to use an EventBridge rule to redirect AWS service-generated events or custom events to Amazon S3 using Kinesis Data Firehose to use for long-term storage, analysis, querying, and audit purposes.

For more information, see the Amazon EventBridge User Guide. To learn more about AWS service events supported by EventBridge, see Events from AWS services.


About the Author

Anand ShahAnand Shah is a Big Data Prototyping Solution Architect at AWS. He works with AWS customers and their engineering teams to build prototypes using AWS analytics services and purpose-built databases. Anand helps customers solve the most challenging problems using the art of the possible technology. He enjoys beaches in his leisure time.

Capturing client events using Amazon API Gateway and Amazon EventBridge

Post Syndicated from James Beswick original https://aws.amazon.com/blogs/compute/capturing-client-events-using-amazon-api-gateway-and-amazon-eventbridge/

This post is written by Tim Bruce, Senior Solutions Architect, DevAx.

Event producers are one of the three main components in an event-driven architecture. Event producers create and publish events to event routers, which send them to event consumers. Any portion of a system, including a mobile or web client, can be an event producer.

To extend the event model to your mobile and web clients, you must implement standards for security, messaging formats, and event storage.

This post shows how to build a client-enabled event-handling solution. It uses Amazon EventBridge, Amazon API Gateway, AWS Lambda, and Amazon Cognito. This architecture supports routing client events to internal and external destinations. It provides a blueprint that you can use to simplify the integration.

Overview

This example creates a RESTful API using API Gateway. It sends events directly to EventBridge without the need for compute services. In production, you have more requirements than only receiving and forwarding events. Additional requirements include security, user identification, validation, enrichment, transformation, event forwarding, and storing.

In this example, API Gateway provides security and user identification by invoking a Lambda authorizer. The authorizer generates a policy and returns client identification to API Gateway. API Gateway then performs request validation and message enrichment before forwarding the events to EventBridge.

EventBridge evaluates the events against rules and forwards the events to targets. The rules apply transformation to the events and forward an event to up to five targets. Targets include AWS services, such as Amazon Kinesis Data Firehose, and many third-party solutions, such as Zendesk, with HTTPS endpoints.

Lastly, Kinesis Data Firehose provides a cost-effective solution to store events into an Amazon S3 bucket. Before storing the events, Kinesis Data Firehose transforms records via Lambda transformers. It also partitions records using data in the record or calculated data via a Lambda function. Kinesis Data Firehose uses this partitioning data to create keys in the bucket and store matching records within the keys.

Example architecture

Example architecture

The example consists of the following resources defined in the AWS SAM template:

Data flow

Data flow

  1. Application clients collect or generate the events.
  2. The client sends the events to API Gateway as URL-encoded JSON. The client includes the user’s JWT in an authorization header with the request for validation.
  3. The Lambda authorizer validates the JWT with Amazon Cognito and returns the user’s unique clientID value to API Gateway.
  4. API Gateway transforms the request into events, appending clientId, the bus name, and environment.
  5. API Gateway sends the events to EventBridge.
  6. EventBridge rules match the events and:
    1. Forwards all client events to Kinesis Data Firehose.
    2. Forwards client events with detail.eventType of “loyaltypurchase” to Zendesk.
  7. Kinesis Data Firehose receives the records.
  8. The Kinesis Data Firehose data transformation processes each record, moving the client ID to the detail object.
  9. Kinesis Data Firehose partitions the records and stores them in an S3 bucket.

Overall design

The following sections discuss details of the solution, starting from the event in a web or mobile client. This solution requires the client to create an HTTPS request, including the user’s JWT as an authorization header.

{"entries": [{"entry": "{\"eventType\": \"searching\", \"schemaVersion\":1, \"data\": {\"searchTerm\":\"games\"}}"}]}

The preceding JSON shows a sample request body for this solution. The top-level item “entries” is an array of “entry” items. API Gateway will translate each “entry” to the event-detail field in EventBridge events. The client must escape the data for “entry” to prevent translation errors.

API Gateway and Lambda authorizer

API Gateway receives the request and validates the JWT by invoking the Lambda authorizer. The authorizer generates a policy allowing the request for valid tokens. It adds the Amazon Cognito “custom:clientId” custom attribute to the response context before returning the response to API Gateway. The “custom:clientId” attribute is a unique client identifier in the form of a UUID that downstream systems can use to retrieve data about the customer.

API Gateway validates the request by matching the request body against a model. Models represent what a request should look like. A mapping template then transforms valid requests to the format required by EventBridge. Mapping templates use velocity templating language (VTL) to do this.

VTL template
This mapping template uses a #foreach loop to process the array “entries” from the request body. The process enriches each event with the user’s “custom:clientId” and stage variables for bus name and environment from API Gateway.

Integration request

The preceding API Gateway AWS integration enables API Gateway to send the events to EventBridge without using compute services, such as Lambda or Amazon EC2. The integration and IAM execution role enable API Gateway to call the EventBridge PutEvents API to do this.

EventBridge rules and transformations

EventBridge rules match events against criteria, transform the events, and forward the events to targets. There are two rules in this example. One processes events for Zendesk tickets and the other forwards data to Kinesis Data Firehose to store events for triage and analytics.

This example creates service tickets in the Zendesk ticketing system. The tickets trigger agents to contact customers who are expecting a call to complete their purchases. The software client, by sending the event directly, reducing time-to-action for back-office processes and helping improve customer satisfaction.

Matching EventBridge rule

This rule matches client event messages for loyalty purchases and forwards details to the Zendesk API. The rule includes a transformation, which selects a portion of the event before sending the information to the target.

EventBridge uses an API destination to store details about the HTTP endpoint and usage policies. Additionally, an EventBridge connection and an AWS Secrets Manager secret store details. These include the authentication policy and authentication credentials to connect to the API destination.

Zendesk dashboard

Successfully processed events open tickets in Zendesk using the API destination. Agents now have a list of customers to contact.

Enterprises often require storing the events for troubleshooting or analytics. EventBridge does not include a newline between records when forwarding events to Kinesis Data Firehose. Because of this, it may be more challenging to discern each record when analyzing the data.

Rule to transform events
A rule for all client events changes this behavior. This AWS CloudFormation snippet defines the rule that will transform each event, adding a new line after each. The “\n” character in the InputTemplate field adds the separator between records before forwarding the data to Kinesis Data Firehose.

After, Kinesis Data Firehose receives each record separated by a new line, enabling both triage and analytics without extra overhead.

Kinesis Data Firehose to S3

Kinesis Data Firehose is a cost-effective way to batch and write records to S3. It offers optional transformation capabilities by invoking a Lambda function. This example uses a Lambda function that moves the “clientID” field to the detail section of the event record.

Kinesis Data Firehose to S3

Kinesis Data Firehose also supports dynamic partitioning of records when writing to S3. It selects data from the records or data calculated by a Lambda function. In this example, it selects data from the records to store data in separate folders in S3.

Event durability considerations

You can extend this example using an EventBridge archive and Amazon Kinesis Data Streams. Archiving allows you to create an encrypted archive of matching events. You can define the data retention in days, from one through indefinite. You can replay events from your archive when you must re-process data.

Kinesis Data Streams is a serverless data streaming solution. The EventBridge rule for all records can forward data to Kinesis Data Streams instead of Kinesis Data Firehose. Multiple applications can consume the Kinesis Data Streams. Kinesis Data Firehose would consume this stream of data and store it in S3.

Prerequisites

You need the following prerequisites to deploy the example solution:

Implementation

The full source of the solution is in the GitHub repository and is deployed with AWS SAM.

  1. Create a Secrets Manager secret using the command the AWS CLI:
    aws secretsmanager create-secret --name proto/Zendesk --secret-string '{"username":"<YOUR EMAIL>","apiKey":"<YOUR APIKEY>"}
  2. Clone the solution repository using git:
    git clone https://github.com/aws-samples/client-event-sample
  3. Build the AWS SAM project:
    sam build --use-container
  4. Deploy the project using AWS SAM:
    sam deploy --guided --capabilities CAPABILITY_NAMED_IAMAWS SAM deployment output
  5. From the outputs from the deployment, set the following shell variables:
    APPCLIENTID=<output APPCLIENTID>
    APIID=<output APIID>
    REGION=<region you deployed to>
  6. Create a user in Amazon Cognito using the AWS CLI:
    aws cognito-idp sign-up --client-id $APPCLIENTID --username <YOUR USER ID> --password <YOUR PASSWORD> --user-attributes Name=email,Value=<YOUR EMAIL>
  7. After you receive the confirmation code, confirm the user using the AWS CLI:
    aws cognito-idp confirm-sign-up --client-id $APPCLIENTID --username <userid> --confirmation-code <confirmation code>
  8. Test the user login with the AWS CLI:
    aws cognito-idp initiate-auth --auth-flow USER_PASSWORD_AUTH --client-id $APPCLIENTID --auth-parameters USERNAME=<YOUR USER ID>,PASSWORD=<YOUR PASSWORD>

If successful, this returns a JSON web token (JWT).

Testing the client event solution

  1. The sample repository includes an event generator in the util directory. The generator uses your credentials and simulates events from a user’s software client. From the utils directory, run the generator:
    python3 generator.py
    --minutes <minutes to run generator> --batch <batch size from 1-10>
    --errors <True|False> --userid <YOUR USER ID> --password <YOUR
    PASSWORD> --region $REGION --appclientid $APPCLIENTID --apiid $APIID
  2. Log in to your Zendesk console and view the created tickets.
  3. After five minutes, review the “clientevents” bucket to view the event records.

Cleaning up

To remove the example:

  1. Delete the data stored in the clientevents buckets created from the template.
  2. Delete the stack using the command:
    sam delete --stack-name clientevents
  3. Delete the secret using the command:
    aws secretsmanager delete-secret --secret-id <arn of secret>

Conclusion

This post shows how to send client events to an API and EventBridge to enable new customer experiences. The example covers enabling new experiences by creating a way for software clients to send events with minimal custom code. This blueprint shows how you can include client events in your solution, featuring validation, enrichment, transformation, and storage.

You can modify the example code provided here for your use in your organization. This enables your client software to register events without modifying backend code.

For more serverless learning resources, visit Serverless Land.

Automating Anomaly Detection in Ecommerce Traffic Patterns

Post Syndicated from Aditya Pendyala original https://aws.amazon.com/blogs/architecture/automating-anomaly-detection-in-ecommerce-traffic-patterns/

Many organizations with large ecommerce presences have procedures to detect major anomalies in their user traffic. Often, these processes use static alerts or manual monitoring. However, the ability to detect minor anomalies in traffic patterns near real-time can be challenging. Early detection of these minor anomalies in ecommerce traffic (such as website page visits and order completions) helps organizations take corrective actions to address issues. This decreases negative impacts to business key performance indicators (KPIs).

In this blog post, we will demonstrate an artificial intelligence/machine learning (AI/ML) solution using AWS services. We’ll show how Amazon Kinesis and Amazon Lookout for Metrics can be used to detect major and minor anomalies near-real time, based on historical and current traffic trends.

The inconsistency of ecommerce traffic

The ecommerce traffic (and number of orders placed) varies based on season, month, date, and time of day. For example, ecommerce websites experience high traffic during weekday evening hours, compared to morning hours. Similarly, there is a spike in web traffic on weekends, compared to weekdays. However, the ecommerce traffic on holiday events (for example, Black Friday, Cyber Monday) does not follow this trend. Due to such dynamic and varying patterns, detecting minor anomalies in user traffic near-real time becomes difficult.

We need a smart solution that can detect the smallest deviation in user traffic based on historical data (date and time). As you can imagine, programming these trends based on static rules is time-intensive. In the next section, we discuss a solution that can help organizations automate and detect minor (and major) anomalies while still accounting for varying traffic trends.

The components of our anomaly detection solution

The architecture consists of three functional components:

  • The ecommerce application that customers use for interaction
  • The data ingesting, transforming, and storage platform
  • Anomaly detection and notification

This solution automates data ingestion and anomaly detection, and provides a graphical user interface to interact, tweak, and filter anomalies based on severity.

Figure 1 illustrates the architecture of this solution:

Figure 1. Architecture diagram of an anomaly detection solution for ecommerce traffic

Figure 1. Architecture diagram of an anomaly detection solution for ecommerce traffic

Let’s look at the individual components of this architecture before reviewing the overall solution.

The ecommerce application that customers use for interaction 

A customer’s journey of purchasing a product online involves user actions that include:

  • Searching for and viewing the product on the “Product Display Page” (PDP)
  • Adding to the “cart”
  • Completing the purchase on the “checkout“ page

The traffic on these pages is broken down into chunks based on time intervals. These serve as the data points that we can use to understand traffic patterns.

The data ingesting, transforming, and storage platform

Ecommerce applications generate data in multiple formats and in different volumes. This data must be fed into a streaming platform that can ingest and collect data continuously. Typically, the data must be transformed and stored for analysis and machine learning purposes. To satisfy these requirements, we will use Amazon Kinesis Data Streams as a streaming platform for data ingestion. Amazon Kinesis Data Firehose with AWS Lambda can transform the data. And we’ll store the data in Amazon Simple Storage Service (S3).

Anomaly detection and notification in near-real time

Once our data is ready, we must analyze it near-real time to identify anomalies. We must notify the concerned team about this anomaly so that they can take necessary corrective actions, if needed. We will use Lookout for Metrics and Amazon Simple Notification Service (SNS) to satisfy these requirements.

Lookout for Metrics can detect and diagnose anomalies in traffic patterns using ML. Amazon Lookout for Metrics accepts feedback on detected anomalies and tunes the results to improve accuracy over time. Lookout for Metrics is also capable of integrating with Amazon SNS, which can send notifications via SMS, mobile push, and emails.

Monitoring ecommerce traffic with Lookout for Metrics

As shown in Figure 1, data from user traffic and user interactions with the ecommerce application is captured as a function of time, and ingested into Kinesis Data Streams. Using Kinesis Data Firehose and Lambda, data is transformed and stored in an S3 bucket. We then create a detector in Lookout for Metrics and use the S3 bucket as the data source. Because of seamless integration between S3 and Lookout for Metrics, data from S3 bucket is automatically ingested into the detector we created.

Once the detector is activated, Lookout for Metrics will start monitoring the data for anomalies, and start identifying the anomalies near-real time. Lookout for Metrics also provides a mechanism to adjust severity threshold on a scale of 0-100, which will help decrease false positives as much as desired. In addition, it integrates with SNS, and can publish notifications to an SNS Topic. An email/ SMS or mobile push subscription can be created on this topic, which will notify users about any current anomalies.

 Conclusion

In this post, we discussed how minor anomalies are hard to detect near-real time in ecommerce traffic of organizations. We also discussed the services that can be used to monitor these anomalies, such as Lookout for Metrics. Use this architecture to help you monitor, detect anomalies in near-real time, and reduce any negative impact to your business KPIs.

For further reading:

Automate Amazon Connect Data Streaming using AWS CDK

Post Syndicated from Tarik Makota original https://aws.amazon.com/blogs/architecture/automate-amazon-connect-data-streaming-using-aws-cdk/

Many customers want to provision Amazon Web Services (AWS) cloud resources quickly and consistently with lifecycle management, by treating infrastructure as code (IaC). Commonly used services are AWS CloudFormation and HashiCorp Terraform. Currently, customers set up Amazon Connect data streaming manually, as the service is not available under CloudFormation resource types. Customers may want to extend it to retrieve real-time contact and agent data. Integration is done manually and can result in issues with IaC.

Amazon Connect contact trace records (CTRs) capture the events associated with a contact in the contact center. Amazon Connect agent event streams are Amazon Kinesis Data Streams that provide near real-time reporting of agent activity within the Amazon Connect instance. The events published to the stream include these contact control panel (CCP) events:

  • Agent login
  • Agent logout
  • Agent connects with a contact
  • Agent status change, such as to available to handle contacts, or on break, or at training.

In this blog post, we will show you how to automate Amazon Connect data streaming using AWS Cloud Development Kit (AWS CDK). AWS CDK is an open source software development framework to define your cloud application resources using familiar programming languages. We will create a custom CDK resource, which in turn uses Amazon Connect API. This can be used as a template to automate other parts of Amazon Connect, or for other AWS services that don’t expose its full functionality through CloudFormation.

Overview of Amazon Connect automation solution

Amazon Connect is an omnichannel cloud contact center that helps you provide superior customer service. We will stream Amazon Connect agent activity and contact trace records to Amazon Kinesis. We will assume that data will then be used by other services or third-party integrations for processing. Here are the high-level steps and AWS services that we are going use, see Figure 1:

  1. Amazon Connect: We will create an instance and enable data streaming
  2. Cloud Deployment Toolkit: We will create custom resource and orchestrate automation
  3. Amazon Kinesis Data Streams and Amazon Kinesis Data Firehose: To stream data out of Connect
  4. AWS Identity and Access Management (IAM): To govern access and permissible actions across all AWS services
  5. Third-party tool or Amazon S3: Used as a destination of Connect data via Amazon Kinesis data
Figure 1. Connect data streaming automation workflow

Figure 1. Connect data streaming automation workflow

Walkthrough and deployment tasks

Sample code for this solution is provided in this GitHub repo. The code is packaged as a CDK application, so the solution can be deployed in minutes. The deployment tasks are as follows:

  • Deploy the CDK app
  • Update Amazon Connect instance settings
  • Import the demo flow and data

Custom Resources enables you to write custom logic in your CloudFormation deployment. You implement the creation, update, and deletion logic to define the custom resource deployment.

CDK implements the AWSCustomResource, which is an AWS Lambda backed custom resource that uses the AWS SDK to provision your resources. This means that the CDK stack deploys a provisioning Lambda. Upon deployment, it calls the AWS SDK API operations that you defined for the resource lifecycle (create, update, and delete).

Prerequisites

For this walkthrough, you need the following prerequisites:

Deploy and verify

1. Deploy the CDK application.

The resources required for this demo are packaged as a CDK app. Before proceeding, confirm you have command line interface (CLI) access to the AWS account where you would like to deploy your solution.

  • Open a terminal window and clone the GitHub repository in a directory of your choice:
    git clone [email protected]:aws-samples/connect-cdk-blog
  • Navigate to the cdk-app directory and follow the deployment instructions. The default Region is usually us-east-1. If you would like to deploy in another Region, you can run:
    export AWS_DEFAULT_REGION=eu-central-1

2. Create the CloudFormation stack by initiating the following commands.

source .env/bin/activate
pip install -r requirements.txt
cdk synth
cdk bootstrap
cdk deploy  --parametersinstanceId={YOUR-AMAZON-CONNECT-INSTANCE-ID}

--parameters ctrStreamName={CTRStream}

--parameters agentStreamName={AgentStream}

Note: By default, the stack will create contact trace records stream [ctrStreamName] as a Kinesis Data Stream. If you want to use an Amazon Kinesis Data Firehose delivery stream instead, you can modify this behavior by going to cdk.json and adding “ctr_stream_type”: “KINESIS_FIREHOSE” as a parameter under “context.”

Once the status of CloudFormation stack is updated to CREATE_COMPLETE, the following resources are created:

  • Kinesis Data Stream
  • IAM roles
  • Lambda

3. Verify the integration.

  • Kinesis Data Streams are added to the Amazon Connect instance
Figure 2. Screenshot of Amazon Connect with Data Streaming enabled

Figure 2. Screenshot of Amazon Connect with Data Streaming enabled

Cleaning up

You can remove all resources provisioned for the CDK app by running the following command under connect-app directory:

cdk destroy

This will not remove your Amazon Connect instance. You can remove it by navigating to the AWS Management Console -> Services -> Amazon Connect. Find your Connect instance and click Delete.

Conclusion

In this blog, we demonstrated how to maintain Amazon Connect as Infrastructure as Code (IaC). Using a custom resource of AWS CDK, we have shown how to automate setting Amazon Kinesis Data Streams to Data Streaming in Amazon Connect. The same approach can be extended to automate setting other Amazon Connect properties such as Amazon Lex, AWS Lambda, Amazon Polly, and Customer Profiles. This approach will help you to integrate Amazon Connect with your Workflow Management Application in a faster and consistent manner, and reduce manual configuration.

For more information, refer to Enable Data Streaming for your instance.

Connecting an Industrial Universal Namespace to AWS IoT SiteWise using HighByte Intelligence Hub

Post Syndicated from Michael Brown original https://aws.amazon.com/blogs/architecture/connecting-an-industrial-universal-namespace-to-aws-iot-sitewise-using-highbyte-intelligence-hub/

This post was co-authored with Michael Brown, Sr. Manufacturing Specialist Architect, AWS; Dr. Rajesh Gomatam, Sr. Partner Solutions Architect, Industrial Software Specialist, AWS; Scott Robertson, Sr. Partner Solutions Architect, Manufacturing, AWS; John Harrington, Chief Business Officer, HighByte; and Aron Semie, Chief Technology Officer, HighByte

Merging industrial and enterprise data across multiple on-premises deployments and industrial verticals can be challenging. This data comes from a complex ecosystem of industrial-focused products, hardware, and networks from various companies and service providers. This drives the creation of data silos and isolated systems that propagate one-to-one integration strategy.

To avoid these issues and scale industrial IoT implementations, you must have a universal namespace. This software solution acts as a centralized repository for data, information, and context, where any application or device can consume and publish data needed for a specific action.

HighByte Intelligence Hub does just that. It is a middleware solution for universal namespace that helps you build scalable, modern industrial data pipelines in AWS. It also allows users to collect data from various sources, add context to the data being collected, and transform it to a format that other systems can understand.

Overview of solution

HighByte Intelligence Hub, illustrated in Figure 1, lets you configure a single dedicated abstraction layer (HighByte refers to this as the DataOps layer). This allows you to connect with various vendor schema standards, protocols, and databases. From there, you can model data and apply context for data sustainability.

HighByte Intelligence Hub

Figure 1. HighByte Intelligence Hub

HighByte Intelligence Hub uses a unique modeling engine. This allows you to act on real-time data to transform, normalize, and combine it with other sources into an asset model. This model can be deployed and reused as necessary. It represents the real world, and it is available to multiple connections and configurable flow paths simultaneously.

For example, Figure 2 shows a model of a hydronic heating system that was created with HighByte Intelligence Hub.

Creating a model of a hydronic heating system in HighByte Intelligence Hub

Figure 2. Creating a model of a hydronic heating system in HighByte Intelligence Hub

With this model, you can define a connection to AWS IoT SiteWise and publish the model directly. This way, the general model and the instance of the model will immediately be available in AWS.

This model can also:

  • Send the temperature and current information from this system to a database for reporting. You can do this without changing anything from the original configuration.
  • Add another connection in HighByte Intelligence Hub for AWS IoT Core (MQTT) and publish the existing model information to the fully managed AWS IoT Core service.
  • Stream the hydronic data into an industrial data lake on AWS, as shown in Figure 3, by adding an Amazon Kinesis Data Firehose connection in HighByte Intelligence Hub and attaching the existing flows to it.
AWS reference architecture for HighByte Intelligence Hub

Figure 3. AWS reference architecture for HighByte Intelligence Hub

The next sections will take a closer look at how to configure HighByte Intelligence Hub to work with AWS.

Prerequisites

For this walkthrough, you must have the following prerequisites:

Note that this post shows the major steps to connect HighByte Intelligence Hub to AWS IoT SiteWise; we will not dive too deeply into all areas of configuration. Please refer to the HighByte Intelligence Hub documentation for specific questions and the AWS service documentation for a full explanation.

Let’s get started!

  1. After logging into HighByte Intelligence Hub, create connections to AWS by selecting the “Connections” tab on the menu on the top right corner of the screen.

Figure 4 shows the following four connections to AWS resources:

  • AWS IoT Core – US East 1 Region
  • AWS IoT SiteWise – US East 1 Region
  • Kinesis Data Firehose – US East 1 Region
  • AWS IoT Greengrass edge device – located on-premises
HighByte Intelligence Hub AWS connections

Figure 4. HighByte Intelligence Hub AWS connections

For each connection, HighByte Intelligence Hub uses native AWS security and connectivity patterns. Figure 5 shows the AWS IoT SiteWise connection settings as an example.

AWS IoT SiteWise connection settings

Figure 5. AWS IoT SiteWise connection settings

Figure 5 shows where to provide an AWS access key and secret key that’s attached to an appropriate AWS Identity and Access Management (IAM) role. This role must have the required AWS IoT SiteWise permissions.

  1. Now that you have your connections created, let’s build a model. Select “Modeling” on the menu on the top right corner of the screen. Define all the attribute names and the data types that you want to include in the model. When you are finished, you should have something that looks like Figure 6, which shows the attribute names, attribute types, if it is an array or not, and if it a required attribute for the model.
HighByte Intelligence Hub hydronic heating model

Figure 6. HighByte Intelligence Hub hydronic heating model

  1. Next, create an instance of the asset model. To do this, use the “Actions” dropdown menu on the upper right corner and select “create instance,” because it will preserve your model name.
Hydronic model instance

Figure 7. Hydronic model instance

As shown in Figure 7, you can produce a standardized model and attach normalized labels that map multiple protocols such as OPC, MQTT, and SQL data sources. In our example, our data sources are all MQTT.

  1. Now, take your new model instance and assign a flow (Figure 8) that details the source and destination.
HighByte Intelligence Hub flow

Figure 8. HighByte Intelligence Hub flow

In this step, as shown in Figure 8, drag and drop the instance of the hydronic model from the right side of the screen to the “Sources” box in the middle of the screen. Then, change the reference type to “Output” from the dropdown menu, select AWS IoT SiteWise as the connection, and drag and drop the AWS IoT SiteWise instance to the “Target” box.

From here, you’ll select the following flow settings, as shown on Figure 9:

  • Interval – How often you send data
  • Mode – Always send, On-Change, On-True, or While True
  • Publish Mode – All Data, Only Changes, Only Changes Compressed
  • Enabled – On or Off

Once you turn the Enabled switch to On and submit, your data will show up in AWS IoT SiteWise.

HighByte Intelligence Hub flow settings

Figure 9. HighByte Intelligence Hub flow settings

Now you’ve configured your MQTT data sources, created a HighByte Intelligence Hub model and instance, and defined a flow to send the data to AWS IoT SiteWise!

Next, let’s see how your model and data are represented.

When HighByte Intelligence Hub first connects to AWS IoT SiteWise, the hub creates an AWS IoT SiteWise model. The model is configured through the AWS IoT SiteWise API. As shown in Figure 10, the name and type from the HighByte Intelligence Hub model are copied to the measurement name and data type in the AWS IoT SiteWise model. Likewise, the AWS IoT SiteWise model name will inherit from the HighByte Intelligence Hub model name.

AWS IoT SiteWise model

Figure 10. AWS IoT SiteWise model

After the model has been created, HighByte Intelligence Hub will create an AWS IoT SiteWise asset using the model it just created. The asset name will be inherited from the hub instance name. As Figure 11 shows, data will flow from the HighByte Intelligence Hub input data source and through the flow definition, using the attributes defined in the model.

AWS IoT SiteWise asset

Figure 11. AWS IoT SiteWise asset

The final step in this process is to set up a visualization of the data in the AWS IoT SiteWise portal by creating a dashboard and adding visualization to it. After you do this, the display shown in Figure 12 will update as new data comes into AWS IoT SiteWise.

AWS IoT SiteWise portal dashboard

Figure 12. AWS IoT SiteWise portal dashboard

Conclusion

HighByte Intelligence Hub is the first industrial DataOps solution designed specifically for operational technology and information technology teams. It allows you to securely connect, merge, model, and flow industrial data to enterprise systems in AWS Cloud without writing or maintaining code.

This post showed you how to integrate HighByte Intelligence Hub with AWS to quickly model and extract data so that multiple teams can simultaneously analyze, interpret, and use the data without constraint and generate rich data models in minutes.

Ready to get started? Try out HighByte Intelligence Hub today.

Gain insights into your Amazon Kinesis Data Firehose delivery stream using Amazon CloudWatch

Post Syndicated from Alon Gendler original https://aws.amazon.com/blogs/big-data/gain-insights-into-your-amazon-kinesis-data-firehose-delivery-stream-using-amazon-cloudwatch/

The volume of data being generated globally is growing at an ever-increasing pace. Data is generated to support an increasing number of use cases, such as IoT, advertisement, gaming, security monitoring, machine learning (ML), and more. The growth of these use cases drives both volume and velocity of streaming data and requires companies to capture, processes, transform, analyze, and load the data into various data stores in near-real time.

Amazon Kinesis Data Firehose is the easiest way to reliably load streaming data into data lakes, data stores, and analytics services. As the volume of the data you stream into Kinesis Data Firehose grows, you should gain insights and monitor the health of your data ingestion, transformation, and delivery.

In this post, we review the capabilities of using Firehose delivery stream metrics and the Amazon CloudWatch dashboard located on your Kinesis Data Firehose console. These capabilities allow you to create alerts when, for example, if the destination you configured in Kinesis Data Firehose has missing privileges, misconfigurations, or other issues, then Firehose will be able to detect it for you and report it as a failure. Other errors that might also occur are if you configured data transformation using Lambda and your Lambda function invocation failed, or if you have reached the Kinesis Firehose quota limits associated with your AWS account. In these cases, the data delivery from Kinesis Data Firehose to its destination may delay or fail. The CloudWatch alerts described in this post should help identify such cases in a timely manner.

This post also covers the different proactive actions that you can take when alarms are being triggered, such as submitting a request to increase quota or adding exponential backoff to your data producers.

Monitoring the delivery streams and taking these actions makes sure that data is delivered to your destinations without interruptions, enabling your business to gain insights in near-real time.

Monitor data ingestion to Kinesis Data Firehose

You can deliver data from your data producers to Kinesis Data Firehose through Amazon Kinesis Data Streams (as described later in this post), using Kinesis Agent, or directly using the Kinesis Data Firehose API operations PutRecord and PutRecordBatch. When you use Kinesis Data Streams as a data source, Kinesis Data Firehose scales automatically as your Kinesis Data Stream scales. When using the API operations for direct ingestion, you need to check the quota limits associated with your AWS account to avoid API requests throttling. Depending on your data producer behavior, this throttling can cause your data producers to retry the operation, which results in a delay of the data delivery to your destination. This throttling can also result in data loss if your data producers don’t implement a retry mechanism.

To gain deeper insights into Firehose delivery stream usage, we provide additional CloudWatch metrics that help you monitor and proactively scale quota limits: ThrottledRecords, RecordsPerSecondLimit, BytesPerSecondLimit, and PutRequestsPerSecondLimit. You can use the CloudWatch metrics dashboard (on the Monitoring tab on your Kinesis Data Firehose console) to easily visualize current usage and the quota limits.

When ingesting data directly to your delivery stream using PutRecord or PutRecordBatch, you should monitor the ThrottledRecords metric. This metric represents the number of records that were actually throttled because data ingestion exceeded one of the delivery stream limits. Kinesis Data Firehose calculates the throttling rates during the ingestion at a 1-second granularity, but the data ingestion metrics we mentioned are aggregated and emitted to CloudWatch every 5 minutes. Because of that, you can get throttled within that 5-minute window even if the data ingestion metrics don’t show that you reached the limit.

To receive alerts before your data producers are actually throttled, you can use additional CloudWatch metrics to alert you when you’re about to reach one of the delivery stream limits. You can achieve this by using the CloudWatch metrics IncomingRecords, IncomingBytes, and IncomingPutRequests. To check the limits of these metrics, refer to Amazon Kinesis Data Firehose Quota.

You can use the following ingestion metrics and their corresponding limit metrics to create a CloudWatch alarm:

  • RecordsPerSecondLimit – The maximum number of records that can be ingested in a second (IncomingRecords)
  • BytesPerSecondLimit – The maximum volume of data that can be ingested in a second (IncomingBytes)
  • PutRequestsPerSecondLimit – The maximum number of successful PutRecord and PutRecordBatch API requests that can be performed in a second (IncomingPutRequests)

To set up an alarm that alerts you when your ingestion rates are close to a quota, you should look for a percentage relationship between the ingestion rate and its corresponding limit. Because Kinesis Data Firehose emits metrics to CloudWatch every 5 minutes, you need to divide your metric with the 5-minute aggregation period, expressed as seconds (300). For example, to generate an alert when the incoming records per second rate is breaching 80% of your API operations quota, your CloudWatch alarm should be defined as follows:

This gives you a way to proactively understand how close your ingestion rates are to your delivery stream limits, and the flexibility to modify the percentage levels based on your use case. To prevent a throttling bottleneck, you should separately monitor the three delivery stream ingestion rate metrics we discussed.

Define alerts using CloudWatch alarms

You can define CloudWatch alarms manually through the AWS Management Console or by using AWS CloudFormation. In this post we cover both methods, starting with the CloudFormation template.

The following template creates your CloudWatch alarms, which you can review and customize to suit your needs.

During the stack creation process, you provide the Firehose delivery stream name that you want to monitor, and the quota percentage where you want to be notified when it’s being breached, such as 80%. After the stack creation is successful, you have four CloudWatch alarms ready.

To create your CloudWatch alarms manually through the console, complete the following steps:

  1. On the Kinesis Data Firehose console, find your delivery stream.
  2. On the Monitoring tab, choose the more options icon of the metric you want to monitor (for this example, we monitor incoming records per second).
  3. On the options menu, choose View in metrics.

On the CloudWatch console, you can see a graph that represents your current API operations (blue line) and the quota limit (red line).

  1. To create an alarm, choose Math expression.
  2. Select Common and choose Percentage.
  3. For the metric name, enter Percentage of records per second quota.
  4. We use the metric expression 100*(e1/m2), which represents the formula 100*(BytesPerSecond/BytesPerSecondLimit) that was described earlier and reflects how close you are to your maximum in percentage.
  5. Change the expression of the metric e1 from METRICS("m1")/300 to m1/300.

You can also change the Y axis label.

  1. On the Graph options tab, under Left Y Axis, for Label, enter Percentage.
  2. Now that you have the expression to use for the alarm, deselect every other expression and metric on the page.

The only expression selected should be the one you just created. You should now see the desired percentage, as in the following screenshot.

Create a CloudWatch alarm

You have now created an expression on your IncomingRecords and RecordsPerSecond quota, which you can use as a base for the alarm. With this, you can configure the tolerance level that your business use case requires.

  1. Choose the alarm icon next to your expression.
  2. In the Specify metric and conditions section, choose to receive an alert when the alarms breach the 75% limit.
  3. In the Configure actions section, specify how to forward this alarm.

You can forward this alarm to your monitoring systems or to an email address through an Amazon Simple Notification Service (Amazon SNS) topic. For this post, we create a new SNS topic and subscribe [email protected] to it.

Actions you can take when approaching the limits

When you’re getting close to your limits, you can take several different actions, which we describe in this section.

Request a service quota increase

One action you can take when seeing an alert is to request an increase in quota using the Amazon Kinesis Data Firehose Limits form. The three quotas scale proportionally, for example, if you increase the throughput quota in US East (N. Virginia), US West (Oregon), or Europe (Ireland) from 5 MiB/second to 10 MiB/second, the other two quotas increase from 2,000 requests/second to 4,000 requests/second and from 500,000 records/second to 1 million records/second. For more information about the service quota limits by AWS Region, see Amazon Kinesis Data Firehose Quota.

Use the PutRecordBatch API

If you use the API call PutRecord to deliver events to a Firehose data stream and you’re reaching the request/second quota limit, consider using the PutRecordBatch API operation. PutRecordBatch writes multiple data records into a delivery stream in a single call to achieve higher throughput per producer than writing single records, and reduces the amount of requests per second to your delivery stream.

Implement exponential backoff

As we mentioned before, even when you’re monitoring your delivery stream, you can still have bursts in your data stream. This could be caused by sudden spikes in usage of your system or external events like high trading activity in financial markets. To protect the producers from multiple throttled records, you should implement an exponential backoff. Exponential backoff is a commonly used algorithm that you can use to decrease the rate of submitting records to Kinesis Data Firehose when being throttled, so that the producer can slowly retry in order to successfully send the records.

The following are the Kinesis Data Firehose API responses when records are throttled:

  • If you’re using the API operation PutRecord, the returned error from the service is ServiceUnavailableException with HTTP status code 500.
  • If you’re using PutRecordBatch, you should iterate through the RequestResponses array and look for individual PutRecordBatchResponseEntry with ErrorCode 500 and ErrorMessage ServiceUnavailableException. Also make sure to check the value of FailedPutCount in the response even when the API call succeeds.

In both cases, you should use exponential backoff and retry the operation. For more information about implementing exponential backoff, see Error retries and exponential backoff in AWS.

Use Kinesis Data Streams with Kinesis Data Firehose

Kinesis Data Streams is a massively scalable and durable real-time data streaming service. Your data producers can produce data directly to Kinesis Data Streams, and you can configure Kinesis Data Firehose to consume the data from Kinesis Data Streams and deliver it to your destination. When you use Kinesis Data Streams as the source for the Firehose delivery stream, the throughput limits mentioned before don’t apply. You don’t need to worry about throughput limits because Kinesis Data Firehose scales automatically to match the number of shards your Kinesis data stream has.

If you’re attaching a Firehose delivery stream as a consumer to your Kinesis data stream, and you have multiple consumer applications that read data from your Kinesis data stream such as AWS Lambda (see Using AWS Lambda with Amazon Kinesis), make sure that the total consumer applications aren’t breaching the shard’s 2 MB total read rate. This can cause the Kinesis data stream to throttle your consumer applications’ reading throughput, including Kinesis Data Firehose.

If more read capacity is required, some application consumers such as Lambda (see AWS Lambda supports Kinesis Data Streams Enhanced Fan-Out and HTTP/2 for faster streaming) or custom consumers that were developed with the Kinesis Consumer Library can support dedicated throughput from Kinesis Data Streams using enhanced fan-out, which currently isn’t supported by Kinesis Data Firehose. This feature provides these consumer applications isolated connection to the stream with 2 MB/second outbound throughput, so they don’t impact other consumer applications that are reading from the shards.

If you need more ingest capacity, you can easily scale up the number of shards in the stream using the console or the UpdateShardCount API.

Monitor data delivery of Kinesis Data Firehose

In case of network timeouts, missing privileges, or misconfigurations of your delivery stream such as incorrect destination configuration or AWS Key Management Service (AWS KMS) key ARN, the data delivery of your data from Kinesis Data Firehose to its destination may delay or fail. Errors might also occur if you configured data transformation using Lambda and your Lambda function invocation failed.

When Kinesis Data Firehose encounters delivery or processing errors, it retries until the configured retry duration expires. If the retry duration ends and the data hasn’t delivered successfully, Kinesis Data Firehose retains the data internally up to a maximum period of 24 hours. If the issue continues beyond the 24-hour maximum retention period, then Kinesis Data Firehose discards the data, resulting in a data loss.

When such data delivery issues persist, the data freshness metric, which is the age of the oldest record in Kinesis Data Firehose that hasn’t been delivered yet, constantly increases. To be alerted in such cases, you should create a CloudWatch alarm for when the data freshness metric exceeds the threshold of 4 hours. We also recommend setting an alarm to observe the historical p90 of the data freshness metric value. For example, set a certain tolerance level (such as 50% above the observed value) as an alarm threshold to detect data freshness variations.

You should monitor the data freshness metric that is relevant to your Kinesis Data Firehose destination, such as DeliveryToS3.DataFreshness, DeliveryToAmazonOpenSearchService.DataFreshness, DeliveryToSplunk.DataFreshness, or DeliveryToHttpEndpoint.DataFreshness. For more information, see Monitoring Kinesis Data Firehose Using CloudWatch Metrics.

If this alarm is triggered, you should take action to understand the root cause of the data freshness variation. A reason for such a variation could be a change in your Lambda transformation logic or configuration change of Lambda concurrency when using Kinesis Data Firehose data transformation. It could also be a result of change in the configuration parameters, format conversion schema, or ingested record type. For more information, see Data Freshness Metric Increasing or Not Emitted or you can submit a technical support request if needed.

When data delivery fails because of data transformation or an issue at the destination, in some cases you can find detailed failure logs in CloudWatch Logs, which can help you troubleshot the problem.

We also recommend monitoring the data delivery byte rate to your destination (for example, DeliveryToS3.Byte), which must match or exceed your data ingestion byte rate (IncomingBytes) on a sustained average basis to avoid increase of the data freshness metric and possible eventual data loss. If the observed delivery data rates are lower than the ingestion rates, consider tuning bottlenecks such as Lambda concurrency levels or your Lambda transformation logic if used with Kinesis Data Firehose data transformation.

To gain additional insights on the delivery of your data to its destination, we provide CloudWatch metrics you can monitor. For example, you can monitor the number of records delivered to keep track of data ingested into your destinations from Kinesis Data Firehose. For more information and additional metrics per destination, see Monitoring Kinesis Data Firehose Using CloudWatch Metrics.

Conclusion

In this post, we discussed the capabilities of using the Firehose delivery stream metrics and the CloudWatch dashboard located on your Kinesis Data Firehose console. This allows you to gain operational insights into the data ingestion and data delivery of your Firehose deliv­­ery stream, and also create CloudWatch alerts to be notified when one of your thresholds is breached. We also covered the different actions that you can take when these alarms are triggered, such as submitting a request to increase your quota or adding exponential backoff to your data producers.

Monitor your delivery streams and take these actions to make sure that your business data is delivered to your destinations without interruptions, enabling your business to gain insights in near-real time.


About the Author

Alon Gendler is a Startup Solutions Architect Manager at Amazon Web Services. He works with AWS customers to help them solve complex problems and architect secure, resilient, scalable and high performance applications in the cloud. Alon is passionate about Data and helping customers get the most out of it.

Unify log aggregation and analytics across compute platforms

Post Syndicated from Hari Ohm Prasath original https://aws.amazon.com/blogs/big-data/unify-log-aggregation-and-analytics-across-compute-platforms/

Our customers want to make sure their users have the best experience running their application on AWS. To make this happen, you need to monitor and fix software problems as quickly as possible. Doing this gets challenging with the growing volume of data needing to be quickly detected, analyzed, and stored. In this post, we walk you through an automated process to aggregate and monitor logging-application data in near-real time, so you can remediate application issues faster.

This post shows how to unify and centralize logs across different computing platforms. With this solution, you can unify logs from Amazon Elastic Compute Cloud (Amazon EC2), Amazon Elastic Container Service (Amazon ECS), Amazon Elastic Kubernetes Service (Amazon EKS), Amazon Kinesis Data Firehose, and AWS Lambda using agents, log routers, and extensions. We use Amazon OpenSearch Service (successor to Amazon Elasticsearch Service) with OpenSearch Dashboards to visualize and analyze the logs, collected across different computing platforms to get application insights. You can deploy the solution using the AWS Cloud Development Kit (AWS CDK) scripts provided as part of the solution.

Customer benefits

A unified aggregated log system provides the following benefits:

  • A single point of access to all the logs across different computing platforms
  • Help defining and standardizing the transformations of logs before they get delivered to downstream systems like Amazon Simple Storage Service (Amazon S3), Amazon OpenSearch Service, Amazon Redshift, and other services
  • The ability to use Amazon OpenSearch Service to quickly index, and OpenSearch Dashboards to search and visualize logs from its routers, applications, and other devices

Solution overview

In this post, we use the following services to demonstrate log aggregation across different compute platforms:

  • Amazon EC2 – A web service that provides secure, resizable compute capacity in the cloud. It’s designed to make web-scale cloud computing easier for developers.
  • Amazon ECS – A web service that makes it easy to run, scale, and manage Docker containers on AWS, designed to make the Docker experience easier for developers.
  • Amazon EKS – A web service that makes it easy to run, scale, and manage Docker containers on AWS.
  • Kinesis Data Firehose – A fully managed service that makes it easy to stream data to Amazon S3, Amazon Redshift, or Amazon OpenSearch Service.
  • Lambda – A compute service that lets you run code without provisioning or managing servers. It’s designed to make web-scale cloud computing easier for developers.
  • Amazon OpenSearch Service – A fully managed service that makes it easy for you to perform interactive log analytics, real-time application monitoring, website search, and more.

The following diagram shows the architecture of our solution.

The architecture uses various log aggregation tools such as log agents, log routers, and Lambda extensions to collect logs from multiple compute platforms and deliver them to Kinesis Data Firehose. Kinesis Data Firehose streams the logs to Amazon OpenSearch Service. Log records that fail to get persisted in Amazon OpenSearch service will get written to AWS S3. To scale this architecture, each of these compute platforms streams the logs to a different Firehose delivery stream, added as a separate index, and rotated every 24 hours.

The following sections demonstrate how the solution is implemented on each of these computing platforms.

Amazon EC2

The Kinesis agent collects and streams logs from the applications running on EC2 instances to Kinesis Data Firehose. The agent is a standalone Java software application that offers an easy way to collect and send data to Kinesis Data Firehose. The agent continuously monitors files and sends logs to the Firehose delivery stream.

BDB-1742-Ec2

The AWS CDK script provided as part of this solution deploys a simple PHP application that generates logs under the /etc/httpd/logs directory on the EC2 instance. The Kinesis agent is configured via /etc/aws-kinesis/agent.json to collect data from access_logs and error_logs, and stream them periodically to Kinesis Data Firehose (ec2-logs-delivery-stream).

Because Amazon OpenSearch Service expects data in JSON format, you can add a call to a Lambda function to transform the log data to JSON format within Kinesis Data Firehose before streaming to Amazon OpenSearch Service. The following is a sample input for the data transformer:

46.99.153.40 - - [29/Jul/2021:15:32:33 +0000] "GET / HTTP/1.1" 200 173 "-" "Mozilla/5.0 (Windows NT 6.1; WOW64) AppleWebKit/537.36 (KHTML, like Gecko) Chrome/51.0.2704.103 Safari/537.36"

The following is our output:

{
    "logs" : "46.99.153.40 - - [29/Jul/2021:15:32:33 +0000] \"GET / HTTP/1.1\" 200 173 \"-\" \"Mozilla/5.0 (Windows NT 6.1; WOW64) AppleWebKit/537.36 (KHTML, like Gecko) Chrome/51.0.2704.103 Safari/537.36\"",
}

We can enhance the Lambda function to extract the timestamp, HTTP, and browser information from the log data, and store them as separate attributes in the JSON document.

Amazon ECS

In the case of Amazon ECS, we use FireLens to send logs directly to Kinesis Data Firehose. FireLens is a container log router for Amazon ECS and AWS Fargate that gives you the extensibility to use the breadth of services at AWS or partner solutions for log analytics and storage.

BDB-1742-ECS

The architecture hosts FireLens as a sidecar, which collects logs from the main container running an httpd application and sends them to Kinesis Data Firehose and streams to Amazon OpenSearch Service. The AWS CDK script provided as part of this solution deploys a httpd container hosted behind an Application Load Balancer. The httpd logs are pushed to Kinesis Data Firehose (ecs-logs-delivery-stream) through the FireLens log router.

Amazon EKS

With the recent announcement of Fluent Bit support for Amazon EKS, you no longer need to run a sidecar to route container logs from Amazon EKS pods running on Fargate. With the new built-in logging support, you can select a destination of your choice to send the records to. Amazon EKS on Fargate uses a version of Fluent Bit for AWS, an upstream conformant distribution of Fluent Bit managed by AWS.

BDB-1742-EKS

The AWS CDK script provided as part of this solution deploys an NGINX container hosted behind an internal Application Load Balancer. The NGINX container logs are pushed to Kinesis Data Firehose (eks-logs-delivery-stream) through the Fluent Bit plugin.

Lambda

For Lambda functions, you can send logs directly to Kinesis Data Firehose using the Lambda extension. You can deny the records being written to Amazon CloudWatch.

BDB-1742-Lambda

After deployment, the workflow is as follows:

  1. On startup, the extension subscribes to receive logs for the platform and function events. A local HTTP server is started inside the external extension, which receives the logs.
  2. The extension buffers the log events in a synchronized queue and writes them to Kinesis Data Firehose via PUT records.
  3. The logs are sent to downstream systems.
  4. The logs are sent to Amazon OpenSearch Service.

The Firehose delivery stream name gets specified as an environment variable (AWS_KINESIS_STREAM_NAME).

For this solution, because we’re only focusing on collecting the run logs of the Lambda function, the data transformer of the Kinesis Data Firehose delivery stream filters out the records of type function ("type":"function") before sending it to Amazon OpenSearch Service.

The following is a sample input for the data transformer:

[
   {
      "time":"2021-07-29T19:54:08.949Z",
      "type":"platform.start",
      "record":{
         "requestId":"024ae572-72c7-44e0-90f5-3f002a1df3f2",
         "version":"$LATEST"
      }
   },
   {
      "time":"2021-07-29T19:54:09.094Z",
      "type":"platform.logsSubscription",
      "record":{
         "name":"kinesisfirehose-logs-extension-demo",
         "state":"Subscribed",
         "types":[
            "platform",
            "function"
         ]
      }
   },
   {
      "time":"2021-07-29T19:54:09.096Z",
      "type":"function",
      "record":"2021-07-29T19:54:09.094Z\tundefined\tINFO\tLoading function\n"
   },
   {
      "time":"2021-07-29T19:54:09.096Z",
      "type":"platform.extension",
      "record":{
         "name":"kinesisfirehose-logs-extension-demo",
         "state":"Ready",
         "events":[
            "INVOKE",
            "SHUTDOWN"
         ]
      }
   },
   {
      "time":"2021-07-29T19:54:09.097Z",
      "type":"function",
      "record":"2021-07-29T19:54:09.097Z\t024ae572-72c7-44e0-90f5-3f002a1df3f2\tINFO\tvalue1 = value1\n"
   },   
   {
      "time":"2021-07-29T19:54:09.098Z",
      "type":"platform.runtimeDone",
      "record":{
         "requestId":"024ae572-72c7-44e0-90f5-3f002a1df3f2",
         "status":"success"
      }
   }
]

Prerequisites

To implement this solution, you need the following prerequisites:

Build the code

Check out the AWS CDK code by running the following command:

mkdir unified-logs && cd unified-logs
git clone https://github.com/aws-samples/unified-log-aggregation-and-analytics .

Build the lambda extension by running the following command:

cd lib/computes/lambda/extensions
chmod +x extension.sh
./extension.sh
cd ../../../../

Make sure to replace default AWS region specified under the value of firehose.endpoint attribute inside lib/computes/ec2/ec2-startup.sh.

Build the code by running the following command:

yarn install && npm run build

Deploy the code

If you’re running AWS CDK for the first time, run the following command to bootstrap the AWS CDK environment (provide your AWS account ID and AWS Region):

cdk bootstrap \
    --cloudformation-execution-policies arn:aws:iam::aws:policy/AdministratorAccess \
    aws://<AWS Account Id>/<AWS_REGION>

You only need to bootstrap the AWS CDK one time (skip this step if you have already done this).

Run the following command to deploy the code:

cdk deploy --requires-approval

You get the following output:

 ✅  CdkUnifiedLogStack

Outputs:
CdkUnifiedLogStack.ec2ipaddress = xx.xx.xx.xx
CdkUnifiedLogStack.ecsloadbalancerurl = CdkUn-ecsse-PY4D8DVQLK5H-xxxxx.us-east-1.elb.amazonaws.com
CdkUnifiedLogStack.ecsserviceLoadBalancerDNS570CB744 = CdkUn-ecsse-PY4D8DVQLK5H-xxxx.us-east-1.elb.amazonaws.com
CdkUnifiedLogStack.ecsserviceServiceURL88A7B1EE = http://CdkUn-ecsse-PY4D8DVQLK5H-xxxx.us-east-1.elb.amazonaws.com
CdkUnifiedLogStack.eksclusterClusterNameCE21A0DB = ekscluster92983EFB-d29892f99efc4419bc08534a3d253160
CdkUnifiedLogStack.eksclusterConfigCommand515C0544 = aws eks update-kubeconfig --name ekscluster92983EFB-d29892f99efc4419bc08534a3d253160 --region us-east-1 --role-arn arn:aws:iam::xxx:role/CdkUnifiedLogStack-clustermasterroleCD184EDB-12U2TZHS28DW4
CdkUnifiedLogStack.eksclusterGetTokenCommand3C33A2A5 = aws eks get-token --cluster-name ekscluster92983EFB-d29892f99efc4419bc08534a3d253160 --region us-east-1 --role-arn arn:aws:iam::xxx:role/CdkUnifiedLogStack-clustermasterroleCD184EDB-12U2TZHS28DW4
CdkUnifiedLogStack.elasticdomainarn = arn:aws:es:us-east-1:xxx:domain/cdkunif-elasti-rkiuv6bc52rp
CdkUnifiedLogStack.s3bucketname = cdkunifiedlogstack-logsfailederrcapturebucket0bcc-xxxxx
CdkUnifiedLogStack.samplelambdafunction = CdkUnifiedLogStack-LambdatransformerfunctionFA3659-c8u392491FrW

Stack ARN:
arn:aws:cloudformation:us-east-1:xxxx:stack/CdkUnifiedLogStack/6d53ef40-efd2-11eb-9a9d-1230a5204572

AWS CDK takes care of building the required infrastructure, deploying the sample application, and collecting logs from different sources to Amazon OpenSearch Service.

The following is some of the key information about the stack:

  • ec2ipaddress – The public IP address of the EC2 instance, deployed with the sample PHP application
  • ecsloadbalancerurl – The URL of the Amazon ECS Load Balancer, deployed with the httpd application
  • eksclusterClusterNameCE21A0DB – The Amazon EKS cluster name, deployed with the NGINX application
  • samplelambdafunction – The sample Lambda function using the Lambda extension to send logs to Kinesis Data Firehose
  • opensearch-domain-arn – The ARN of the Amazon OpenSearch Service domain

Generate logs

To visualize the logs, you first need to generate some sample logs.

  1. To generate Lambda logs, invoke the function using the following AWS CLI command (run it a few times):
aws lambda invoke \
--function-name "<<samplelambdafunction>>" \
--payload '{"payload": "hello"}' /tmp/invoke-result \
--cli-binary-format raw-in-base64-out \
--log-type Tail

Make sure to replace samplelambdafunction with the actual Lambda function name. The file path needs to be updated based on the underlying operating system.

The function should return "StatusCode": 200, with the following output:

{
    "StatusCode": 200,
    "LogResult": "<<Encoded>>",
    "ExecutedVersion": "$LATEST"
}
  1. Run the following command a couple of times to generate Amazon EC2 logs:
curl http://ec2ipaddress:80

Make sure to replace ec2ipaddress with the public IP address of the EC2 instance.

  1. Run the following command a couple of times to generate Amazon ECS logs:
curl http://ecsloadbalancerurl:80

Make sure to replace ecsloadbalancerurl with the public ARN of the AWS Application Load Balancer.

We deployed the NGINX application with an internal load balancer, so the load balancer hits the health checkpoint of the application, which is sufficient to generate the Amazon EKS access logs.

Visualize the logs

To visualize the logs, complete the following steps:

  1. On the Amazon OpenSearch Service console, choose the hyperlink provided for the OpenSearch Dashboard 7URL.
  2. Configure access to the OpenSearch Dashboard.
  3. Under OpenSearch Dashboard, on the Discover menu, start creating a new index pattern for each compute log.

We can see separate indexes for each compute log partitioned by date, as in the following screenshot.

BDB-1742-create-index

The following screenshot shows the process to create index patterns for Amazon EC2 logs.

BDB-1742-ec2

After you create the index pattern, we can start analyzing the logs using the Discover menu under OpenSearch Dashboard in the navigation pane. This tool provides a single searchable and unified interface for all the records with various compute platforms. We can switch between different logs using the Change index pattern submenu.

BDB-1742-unified

Clean up

Run the following command from the root directory to delete the stack:

cdk destroy

Conclusion

In this post, we showed how to unify and centralize logs across different compute platforms using Kinesis Data Firehose and Amazon OpenSearch Service. This approach allows you to analyze logs quickly and the root cause of failures, using a single platform rather than different platforms for different services.

If you have feedback about this post, submit your comments in the comments section.

Resources

For more information, see the following resources:


About the author

HariHari Ohm Prasath is a Senior Modernization Architect at AWS, helping customers with their modernization journey to become cloud native. Hari loves to code and actively contributes to the open source initiatives. You can find him in Medium, Github & Twitter @hariohmprasath.

balluBallu Singh is a Principal Solutions Architect at AWS. He lives in the San Francisco Bay area and helps customers architect and optimize applications on AWS. In his spare time, he enjoys reading and spending time with his family.

Load CDC data by table and shape using Amazon Kinesis Data Firehose Dynamic Partitioning

Post Syndicated from Anand Shah original https://aws.amazon.com/blogs/big-data/load-cdc-data-by-table-and-shape-using-amazon-kinesis-data-firehose-dynamic-partitioning/

Amazon Kinesis Data Firehose is the easiest way to reliably load streaming data into data lakes, data stores, and analytics services. Customers already use Amazon Kinesis Data Firehose to ingest raw data from various data sources using direct API call or by integrating Kinesis Data Firehose with Amazon Kinesis Data Streams including “change data capture” (CDC) use case.

Customers typically use single Kinesis Data Stream per business domain to ingest CDC data. For example, related fact and dimension tables change data is sent to the same stream. Once the data is loaded to Amazon S3, customers use ETL tools to split the data by tables, shape, and desired partitions as the first step in the data enrichment process.

This post demonstrates how customers can use Amazon Kinesis Firehose Dynamic Partitioning to split the data by table, shape (by message schema/version), and by desired partitions on the fly to do this first step of data enrichment while ingesting data.

Solution Overview

In this post, we provide a working example of a CDC pipeline where fake customer, order, and transaction table data is pushed from the source and registered as tables to the AWS Glue Data Catalog. The following architecture diagram illustrates this overall flow. We are using AWS Lambda to generate test CDC data for this post. However, in the real world you would use AWS Data Migration Service (DMS) or a similar tool to push change data to the Amazon Kinesis Data Stream.

The workflow includes the following steps:

  1. An Amazon EventBridge event triggers an AWS Lambda function every minute.
  2. The Lambda function generates test transactions, customers and order CDC data, as well as sends the data to Amazon Kinesis Data Stream.
  3. Amazon Kinesis Data Firehose reads data from Amazon Kinesis Data Stream.
  4. Amazon Kinesis Data Firehose
    1. Applies Dynamic Partitioning configuration defined in the Firehose configuration
    2. Invokes AWS Lambda transform to derive custom Dynamic Partitioning.
  5. Amazon Kinesis Data Firehose saves data to Amazon Simple Storage Service (S3) bucket.
  6. The user runs queries on Amazon S3 bucket data using Amazon Athena, which internally uses the AWS Glue Data Catalog to supply meta data.

Deploying using AWS CloudFormation

You use CloudFormation templates to create all of the necessary resources for the data pipeline. This removes opportunities for manual error, increases efficiency, and ensures consistent configurations over time.

Steps to follow:

  1. Click here to Launch Stack:
  2. Acknowledge that the template may create AWS Identity and Access Management (IAM) resources.
  3. Choose Create stack.

This CloudFormation template takes about five minutes to complete and creates the following resources in your AWS account:

  • An S3 bucket to store ingested data
  • Lambda function to publish test data
  • Kinesis Data Stream connected to Kinesis Data Firehose
  • A Lambda function to compute custom dynamic partition for Kinesis Data Firehose transform
  • AWS Glue Data Catalog tables and Athena named queries for you to query data processed by this example

Once the AWS CloudFormation stack creation is successful, you should be able to see data automatically arriving to Amazon S3 in about five more minutes.

Data sources input

The Lambda function automatically publishes four types of messages to the Kinesis Data Stream at regular intervals with random data when invoked in the following format. In this example, we use three tables:

  • Customers: Has basic customer details.
  • Orders: Mimics orders placed by customers on the shopping website or mobile app.
  • Transactions: Mimics payment transaction done for the order. The transaction table showcases possible message schema evolution that can happen over time from message schema v1 to v2. It also shows how you can split messages by schema version if you don’t want to merge them into a universal schema.

Customer table sample message

{
   "version": 1,
   "table": "Customer",
   "data": {
        "id": 1,
        "name": "John",
        "country": "US"
   }
}

Orders table sample message

{
   "version": 1,
   "table": "Order",
   "data": {
        "id": 1,
        "customerId": 1,
        "qty": 1,
        "product": {
            "name": "Book 54",
            "price": 12.6265
        }
   }
}

Transactions in old message format (v1)

{
    "version": 1, 
    "txid": "52", 
    "amount": 32.6516
}

Transactions in new message format (v2 – latest)

This message example demonstrates message evolution over time. txid from old message format is now renamed to transactionId, and new information like source is added to the original old transaction message in the new message version v2.

{
   "version": 2,
   "transactionId": "52",
   "amount": 32.6516,
   "source": "Web"
}

Dynamic Partitioning Logic

Amazon Kinesis Data Firehose dynamic partitioning configuration is defined using jq style syntax. We will use the table field for the first partition and the version field for the second level partition. We can derive the table partition using dynamic partitioning jq syntax “.version”. As you can see, the version field is available in all of the messages. Therefore, we can use it directly in partitioning. However, the table field is not available for old and new transaction messages. Therefore, we derive the table field using custom transform Lambda function.

We check the existence of the table field from the incoming message and populate it with the static value “Transaction” if table field is not present. Lambda function also returns PartitionKeys for Kinesis Data Firehose to use as dynamic partition. The Lambda function also derives the year, month, and day from the current time.

for firehose_record_input in firehose_records_input['records']:
    # Get user payload
    payload = base64.b64decode(firehose_record_input['data'])
    json_value = json.loads(payload)


    # Create output Firehose record and add modified payload and record ID to it.
    firehose_record_output = {}

    table = "Transaction"
    if "table" in json_value:
        table = json_value["table"]

    now = datetime.datetime.now()
    partition_keys = {"table": table, "year": str(now.year), "month": str(now.month), "day": str(now.day)}

The Kinesis Data Firehose S3 destination Prefix is set to table=!{partitionKeyFromLambda:table}/version=!{partitionKeyFromQuery:version}/year=!{partitionKeyFromLambda:year}/month=!{partitionKeyFromLambda:month}/day=!{partitionKeyFromLambda:day}/

  • table partition key is coming from the Lambda function based on custom logic.
  • version partition key is extracted using jq expression using Kinesis Data Firehose dynamic partition configuration. Here, the version refers to the shape of the message and not the version of the data. For example, Updates to Customer record with same ID is not merged into one.
  • year, month, and day partition keys are coming from the Lambda function based on current time

You can follow the respective links from the CloudFormation stack Output tab to deep dive into the Kinesis Data Firehose configuration, record transformer Lambda function source code, and see output files in the Amazon S3 curated bucket. The entire code is also available in the GitHub repository.

Ingested data output

Kinesis Data Firehose processes all the messages and outputs result in the following S3 hive style partitioned paths:

# AWS Glue Data Catalog table transactions_v1
s3://curated-bucket/table=transaction/version=1/year=2021/month=9/day=20/file-name.gz
# AWS Glue Data Catalog table transactions
s3://curated-bucket/table=transaction/version=2/year=2021/month=9/day=20/file-name.gz
# AWS Glue Data Catalog table customers
s3://curated-bucket/table=customer/version=1/year=2021/month=9/day=20/file-name.gz
# Glue catalog table orders
s3://curated-bucket/table=order/version=1/year=2021/month=9/day=20/file-name.gz

Query output data stored in Amazon S3

Kinesis Data Firehose loads new data every minute to the Amazon S3 bucket, and the associated tables are already created by CloudFormation for you in the AWS Glue Data Catalog. You can directly query Amazon S3 bucket data using the following steps:

  1. Go to Amazon Athena service and select the database with the same name as the CloudFormation stack name without dashes.
  2. Select the three dots next to each table name to open the table menu and select Load Partitions. This will add a new partition to the AWS Glue Data Catalog.
  3. Go to the CloudFormation stack Output tab.
  4. Select the link mentioned next to the key AthenaQueries.
  5. This will take you to the Amazon Athena saved query console. Type the word Blog to search named queries created by this blog.
  6. Select the query called “Blog – Query Customer Orders”. This will open the query in the Athena query console. Select Run query to see the results.
  7. Select the Saved queries menu from the top bar to go back to the Amazon Athena saved query console. Repeat the steps for other Blog queries to see results from the “new and old transactions” queries.

Clean up

Complete the following steps to delete your resources and stop incurring costs:

  1. Go to the CloudFormation stack Output tab.
  2. Select the link mentioned next to the key PauseDataSource. This will take you to the Amazon EventBridge event rules console.
  3. Select the Actions button from the top right menu bar and select Disable.
  4. Confirm the choice by clicking the Disable button again on the prompt. This will disable Amazon EventBridge event trigger that invokes the data generator Lambda function. This lets us make sure that no new data is sent to the Kinesis data stream by Lambda from now onward.
  5. Wait for at least two minutes for all of the buffered events to reach to the S3 from the Kinesis Data Firehose.
  6. Go back to the CloudFormation stack Output tab.
  7. Select the link mentioned next to the key S3BucketCleanup.

You’re redirected to the Amazon S3 console.

  1. Enter permanently delete to delete all of the objects in your S3 bucket.
  2. Choose Empty.
  3. On the AWS CloudFormation console, select the stack you created and choose Delete.

Summary

This post demonstrates how to use the Kinesis Data Firehose Dynamic Partitioning feature to load CDC data on the fly in near real-time. It also shows how we can split CDC data by table and message schema version for backward compatibility and quick query capability. To learn more about dynamic partitioning, you can refer to this blog and this documentation. Provide us with any feedback you have about the new feature.


About the Author

Anand Shah is a Big Data Prototyping Solution Architect at AWS. He works with AWS customers and their engineering teams to build prototypes using AWS Analytics services and purpose-built databases. Anand helps customers solve the most challenging problems using the art of the possible technology. He enjoys beaches in his leisure time.

Ingesting PI Historian data to AWS Cloud using AWS IoT Greengrass and PI Web Services

Post Syndicated from Piyush Batwal original https://aws.amazon.com/blogs/architecture/ingesting-pi-historian-data-to-aws-cloud-using-aws-iot-greengrass-and-pi-web-services/

In process manufacturing, it’s important to fetch real-time data from data historians to support decisions-based analytics. Most manufacturing use cases require real-time data for early identification and mitigation of manufacturing issues. A limited set of commercial off-the-shelf (COTS) tools integrate with OSIsoft’s PI Historian for real-time data. However, each integration requires months of development effort, can lack full data integrity, and often doesn’t address data loss issues. In addition, these tools may not provide native connectivity to the Amazon Web Services (AWS) Cloud. Leveraging legacy COTS applications can limit your agility, both in initial setup and ongoing updates. This can impact time to value (TTV) for critical analytics.

In this blog post, we’ll illustrate how you can integrate your on-premises PI Historian with AWS services for your real-time manufacturing use cases. We will highlight the key connector features and a common deployment architecture for your multiple manufacturing use cases.

Scope of OSIsoft PI data historian use

OSIsoft’s PI System is a plant process historian. It collects machine data from various sensors and operational technology (OT) systems during the manufacturing process. PI Historian is the most widely used data historian in process industries such as Healthcare & Life Sciences (HCLS), Chemicals, and Food & Beverage. Large HCLS companies use the PI system extensively in their manufacturing plants.

The PI System usually contains years of historical data ranging from terabytes to petabytes. The data from the PI system can be used in preventive maintenance, bioreactor yield improvement, golden batch analysis, and other machine learning (ML) use cases. It can be a powerful tool when paired with AWS compute, storage, and AI/ML services.

Analyzing real-time and historical data can garner many business benefits. For example, your batch yield could improve by optimizing inputs or you could reduce downtime by proactive intervention and maintenance. You could improve overall equipment effectiveness (OEE) by improving productivity and reducing waste. This could give you the ability to conduct key analysis and deliver products to your end customers in a timely manner.

PI integration options

The data from the PI System can be ingested to AWS services in a variety of ways:

PI Connector for AWS IoT Greengrass

The PI Connector was developed by the AWS ProServe team as an extended AWS IoT Greengrass connector. The connector collects real-time and historical data from the PI system using PI Web Services. It publishes the data to various AWS services such as local ML models running at the edge, AWS IoT Core / AWS IoT SiteWise, and Amazon S3.

Connector requirements and design considerations

Specific requirements and design considerations were gathered in collaboration with various customers. These are essential for the most effective integration:

  • The connector should support reliable connectivity to the PI system for fetching real-time and historical data from the PI.
  • The connector should support subscription to various PI data modes like real-time, compressed/recorded, and interpolated, to support various use cases.
  • The initial setup and incremental updates to the PI tag configuration should be seamless without requiring any additional development effort.
  • The connector should support data contextualization in terms of asset/equipment hierarchy and process batch runs.
  • The connector should ensure full data integrity, reliable real-time data access, and support re-usability.
  • The connector should have support for handling data loss prevention scenarios for connectivity loss and/or maintenance/configuration updates.
  • The setup, deployment, and incremental updates should be fully automated.

Deployment architecture for PI Connector

The connector has been developed as part of AWS IoT Greengrass Connectivity Framework and can be deployed remotely on an edge machine. This can be running on-premises or in the AWS Cloud with access to the on-premises PI system. This machine can be run on a virtual machine (VM), a physical server, or a smaller device like a Raspberry Pi.

The connector incorporates a configuration file. You can specify connector functions such as authentication type, data access modes (polling or subscription), batch contextualization and validation on the data, or historical data access timeframe. It integrates with the PI Web APIs for subscription to real-time data for defined PI tags using secure WebSockets (wss). It can also invoke WebAPI calls for polling data with configured interval time.

The connector can be deployed as an AWS IoT Greengrass V1 AWS Lambda function or a Greengrass V2 component.

Figure 1. PI Connector architecture

Figure 1. PI Connector architecture

Connector features and benefits

  • The connector supports subscription to real-time and recorded data to track tag value changes in streaming mode. This is useful in situations where process parameter changes must be closely monitored for decision support, actions, and notifications. The connector supports data subscription for individual PI event tags, PI Asset Framework (AF), and PI Event Frames (EF).
  • The connector supports fetching recorded/compressed or interpolated data based on recorded timestamps or defined intervals, to sample all tags associated with an asset at those intervals.
  • The connector helps define asset hierarchy and batch tags as part of configuration, and contextualizes all asset data with hierarchy and batch context at the event level. This offloads heavy data post-processing for real-time use cases.
  • The connector initiates event processing at the edge and provides configurable options to push data to the Cloud. This occurs only when a valid batch is running and/or when a reported tag data quality attribute is good.
  • The connector ensures availability and data integrity by doing graceful reconnects in case of session closures from the PI side. It fetches, contextualizes, and pushes any missed data due to disconnections, maintenance, or update scenarios.
  • The connector accelerates the TTV for business by providing a reusable no-code, configuration-only PI integration capability.

Summary

The PI Connector developed by AWS Proserve makes your real-time, data ingestion from PI historian into AWS services fast, secure, scalable, and reliable. The connector can be configured and deployed into your edge network quickly.

With this connector, you can ingest data into many AWS services such as Amazon S3, AWS IoT Core, AWS IoT SiteWise, Amazon Timestream, and more. Try the PI Connector for your manufacturing use cases, and realize the full potential of OSI PI Historian data.

Further reading:

How Cimpress Built a Self-service, API-driven Data Platform Ingestion Service

Post Syndicated from Ethan Fahy original https://aws.amazon.com/blogs/architecture/how-cimpress-built-a-self-service-api-driven-data-platform-ingestion-service/

Cimpress is a global company that specializes in mass customization, empowering individuals and businesses to design, personalize and customize their own products – such as packaging, signage, masks, and clothing – and to buy those products affordably.

Cimpress is composed of multiple businesses that have the option to use the Cimpress data platform. To provide business autonomy and keep the central data platform team lean and nimble, Cimpress designed their data platform to be scalable, self-service, and API-driven. During a design update to River, the data platform’s data ingestion service, Cimpress engaged AWS to run an AWS Data Lab. In this post, we’ll show how River provides this data ingestion interface across all Cimpress businesses. If your company has a decentralized organizational structure and challenges with a centralized data platform, read on and consider how a self-service, API-driven approach might help.

Evaluating the legacy data ingestion platform and identifying requirements for its replacement

The collaboration process between AWS and Cimpress started with a discussion of pain points with the existing Cimpress data platform’s ingestion service:

  1. Changes were time consuming. The existing data ingestion service was built using Apache Kafka and Apache Spark. When a data stream owner needed new fields or changes in the stream payload schema, it could take weeks working with a data engineer. Spark configuration needed to be manually modified, tested, and then the Spark job had to be deployed to an operational platform.
  2. Scaling was not automated. The existing Spark clusters required large Amazon EC2 instances that were manually scaled. This led to an inefficient use of resources that was driving unnecessary cost.

Assessing these pain points led to the design of an improved data ingestion service that was:

  1. Fully automated and self-service via an API. This would reduce the dependency on engineering support from the central data platform team and decreased the time to production for new data streams.
  2. Serverless with automatic scaling. This would improve performance efficiency and cost optimization while freeing up engineering time.

The rearchitected Cimpress data platform ingestion service

Figure 1. River architecture diagram, depicting the flow of data from data producers through the River data ingestion service into Snowflake.

Figure 1. River architecture diagram, depicting the flow of data from data producers through the River data ingestion service into Snowflake.

The River data ingestion service provides data producers with a self-service mechanism to push their data into Snowflake, the Cimpress data platform’s data warehouse service. As seen in Figure 1, here are the steps involved in that process:

1. Data producers use the River API to create a new River data “stream.” Each Cimpress business is given its own Snowflake account in which they can create logically separated data ingestion “streams.” A River data stream can be configured with multiple data layers, fine-tuned permissions, entity tables, entry de-duplication, data delivery monitoring, and Snowflake data clustering.

2. Data producers get access to a River WebUI. In addition to the River API, end users are also able to access a web-based user interface for simplified configuration, monitoring, and management.

3. Data producers push data to the River API. The River RESTful API uses an Application Load Balancer (ALB) backed by AWS Lambda.

4. Data is processed by Amazon Kinesis Data Firehose.

5. Data is uploaded to Snowflake. Data objects that land on Amazon S3 initiate an event notification to Snowflake’s Snowpipe continuous data ingestion service. This loads the data from S3 into a Snowflake account.

All the AWS services used in the River architecture are serverless with automatic scaling. This means that the Cimpress data platform team can remain lean and agile. Engineering resources to infrastructure management tasks like capacity provisioning and patching are minimized. These AWS services also have pay-as-you-go pricing, so the cost scales predictably with the amount of data ingested.

Conclusions

The Cimpress data platform team redesigned their data ingestion service to be self-service, API-driven, and highly scalable. As usage of the Cimpress data platform has grown, Cimpress businesses operate more autonomously with speed and agility. As of today, the River data ingestion service reliably processes 2–3 billion messages per month across more than 1,000 different data streams. It drives data insights for more than 7,000 active users of the data platform across all of the Cimpress businesses.

Read more on the topics in this post and get started with building a data platform on AWS:

Continuous monitoring with Sumo Logic using Amazon Kinesis Data Firehose HTTP endpoints

Post Syndicated from Dilip Rajan original https://aws.amazon.com/blogs/big-data/continuous-monitoring-with-sumo-logic-using-amazon-kinesis-data-firehose-http-endpoints/

Amazon Kinesis Data Firehose streams data to AWS destinations such as Amazon Simple Storage Service (Amazon S3), Amazon Redshift, and Amazon OpenSearch Service (successor to Amazon Elasticsearch Service). Additionally, Kinesis Data Firehose supports destinations to third-party partners. This ability to send data to third-party partners is a vital feature for customers who already use these AWS partner platforms; especially partners specializing in continuous monitoring and intelligence. Kinesis Data Firehose includes sending logs and metrics to Sumo Logic—a cloud machine data analytics and AWS Advanced Technology partner with competencies in containers, data and analytics, DevOps, and security. Sumo Logic helps organizations get better real-time visibility into their IT infrastructure as a result of integrations across cloud and on-premises services, making it simple to aggregate data and giving a full view of your operational, business, and security analytics.

In this post, we go over the Kinesis Data Firehose and Sumo Logic integration and how you can use this feature to stream logs and metrics from Amazon CloudWatch and other AWS services to Sumo Logic. We also go over the key mechanism employed by Sumo Logic to consume logs and its benefits with CloudWatch and AWS Lambda with an example use case.

With this integration, AWS services via CloudWatch metrics have a dedicated and reliable delivery mechanism to Sumo Logic via Kinesis Data Firehose, along with automatic retry capabilities and performant and less intrusive log collection. Let’s look at these benefits in detail:

  • Reliable delivery – This streaming solution doesn’t consume your AWS quota by making calls to the CloudWatch APIs. This rules out the possibility of potential data loss due to API throttling events.
  • Automatic retry capabilities – Kinesis Data Firehose has an automatic retry mechanism and routes all failed logs and metrics to a customer-owned S3 bucket for later recovery.
  • Performant and less intrusive log collection – The solution eliminates the need for creating separate log forwarders such as Lambda functions, which require Sumo Logic to run proprietary code in customer AWS accounts that are limited by timeout, concurrency, and memory limits.
  • Cost benefits – This integration also addresses the additional overhead that comes with the lack of a managed and low code ingestion pipeline, manual management of API quotas, and other ingestion mechanisms such as polling that leads to additional cost.

Solution overview

To illustrate this integration, a sample Lambda function vends metrics and logs to CloudWatch, and are consumed by Sumo Logic through this integration. The following diagram illustrates consumption of CloudWatch logs and metrics for a Lambda function through a Kinesis Data Firehose HTTP endpoint for Sumo Logic.

In the subsequent sections, we show you the Sumo Logic hosted collector and Kinesis Data Firehose setup processes that convert the architecture into meaningful insights.

Prerequisites

Make sure that you have a Lambda function with logs and metrics forwarded to CloudWatch. To get started, use the sample Hello World application.

Configure CloudWatch logs and metrics to be forwarded to Kinesis Data Firehose. You can use the latest CloudWatch features such as subscription filters here as well.

Also sign up for a trial version of Sumo Logic, if you don’t have an account already.

Set up the integration on Sumo Logic

Complete the following instructions to set up a hosted collector on Sumo Logic for Kinesis Data Firehose metrics or logs:

  1. After logging in to Sumo logic, choose Manage Data.
  2. On the Collection menu, and choose Add source.
  3. For the collector selection source, choose Collector-Name.
  4. Choose AWS Kinesis Firehose for Logs or AWS Kinesis Firehose for Metrics.
  5. Provide a collector name and source category required for querying later.
    1. You also need a cross-account role (Sumo Logic provides an AWS CloudFormation template to create the role).
  6. Save your settings.

After you save, an HTTP source address is generated.

  1. Save this endpoint for use with Kinesis Data Firehose.

Sumo Logic provides different endpoints for logs and metrics, for example:

  • Logshttps://endpoint4.collection.us2.sumologic.com/receiver/v1/kinesis/log/<tokenid>
  • Metricshttps://endpoint4.collection.us2.sumologic.com/receiver/v1/kinesis/metric/<tokenid>

Note down the endpoints to use in the following section.

Set up Kinesis Data Firehose

To create a delivery stream on Kinesis Data Firehose, complete the following steps:

  1. On the Kinesis Data Firehose console, choose Create delivery stream.
  2. For Delivery stream name, enter a name.
  3. For Source, select Direct PUT of other sources.
  4. For Destination, choose Sumo Logic.
  5. For HTTP endpoint URL, enter the endpoint URL of the source from Sumo Logic (logs or metrics) that you noted earlier.
  6. In the Backup settings section, select Failed data only.
  7. Keep the rest of the settings at their default values and choose Next.
  8. For Sumo logic Buffer conditions, enter a buffer size of 5 MiB for logs or 1 MiB for metrics.

Configuring the preceding values by type (logs or metrics) is required to achieve optimum latency.

  1. Leave the rest of the settings at their default values and chose Next.
  2. Review your settings and choose Create delivery stream.

Logs and metrics to your delivery stream are now available in Sumo Logic. The following screenshot illustrates a Sumo Logic dashboard for Lambda, which comes out of the box and can be used for observability, analysis, and alerting.

Conclusion

With Kinesis Data Firehose HTTP endpoint delivery, AWS service logs and metrics are available for analysis quickly, so you can identify issues and challenges within your applications. Sumo Logic allows you to gain intelligence across your entire application lifecycle and stack along with analytics and insights to build, operate, and secure your modern applications and cloud infrastructure. As a fully managed service, Kinesis Data Firehose coupled with Sumo Logic compression techniques provides seamless access to logs and metrics.


About the Author

Dilip Rajan is a Partner Solutions Architect at AWS. His role is to help partners and customers design and build solutions at scale on AWS. Before AWS, he helped Amazon Fulfillment Operations migrate their Oracle Data Warehouse to Redshift while designing the next generation big data analytics platform using AWS technologies.

Vinay Maddi is a Senior Solutions Architect for AWS, and passionate about helping customers build modern event driven applications using latest AWS services. An experienced developer, he loves keeping up to date with the latest open-source projects. His main topics are serverless, IoT, AI/ML and blockchain.

Kinesis Data Firehose now supports dynamic partitioning to Amazon S3

Post Syndicated from Jeremy Ber original https://aws.amazon.com/blogs/big-data/kinesis-data-firehose-now-supports-dynamic-partitioning-to-amazon-s3/

Amazon Kinesis Data Firehose provides a convenient way to reliably load streaming data into data lakes, data stores, and analytics services. It can capture, transform, and deliver streaming data to Amazon Simple Storage Service (Amazon S3), Amazon Redshift, Amazon Elasticsearch Service, generic HTTP endpoints, and service providers like Datadog, New Relic, MongoDB, and Splunk. It is a fully managed service that automatically scales to match the throughput of your data and requires no ongoing administration. It can also batch, compress, transform, and encrypt your data streams before loading, which minimizes the amount of storage used and increases security.

Customers who use Amazon Kinesis Data Firehose often want to partition their incoming data dynamically based on information that is contained within each record, before sending the data to a destination for analysis. An example of this would be segmenting incoming Internet of Things (IoT) data based on what type of device generated it: Android, iOS, FireTV, and so on. Previously, customers would need to run an entirely separate job to repartition their data after it lands in Amazon S3 to achieve this functionality.

Kinesis Data Firehose data partitioning simplifies the ingestion of streaming data into Amazon S3 data lakes, by automatically partitioning data in transit before it’s delivered to Amazon S3. This makes the datasets immediately available for analytics tools to run their queries efficiently and enhances fine-grained access control for data. For example, marketing automation customers can partition data on the fly by customer ID, which allows customer-specific queries to query smaller datasets and deliver results faster. IT operations or security monitoring customers can create groupings based on event timestamps that are embedded in logs, so they can query smaller datasets and get results faster.

In this post, we’ll discuss the new Kinesis Data Firehose dynamic partitioning feature, how to create a dynamic partitioning delivery stream, and walk through a real-world scenario where dynamically partitioning data that is delivered into Amazon S3 could improve the performance and scalability of the overall system. We’ll then discuss some best practices around what makes a good partition key, how to handle nested fields, and integrating with Lambda for preprocessing and error handling. Finally, we’ll cover the limits and quotas of Kinesis Data Firehose dynamic partitioning, and some pricing scenarios.

Data partitioning with Kinesis Data Firehose

First, let’s discuss why you might want to use dynamic partitioning instead of Kinesis Data Firehose’s standard timestamp-based data partitioning. Consider a scenario where your analytical data lake in Amazon S3 needs to be filtered according to a specific field, such as a customer identification—customer_id. Using the standard timestamp-based strategy, your data will look something like this, where <DOC-EXAMPLE-BUCKET> stands for your bucket name.

s3://<DOC-EXAMPLE-BUCKET>/year=2021/month=06/day=01/part-0000.parquet
s3://<DOC-EXAMPLE-BUCKET>/year=2021/month=06/day=01/part-0001.parquet
s3://<DOC-EXAMPLE-BUCKET>/year=2021/month=06/day=02/part-0002.parquet
s3://<DOC-EXAMPLE-BUCKET>/year=2021/month=06/day=02/part-0003.parquet
s3://<DOC-EXAMPLE-BUCKET>/year=2021/month=06/day=03/part-0004.parquet
s3://<DOC-EXAMPLE-BUCKET>/year=2021/month=06/day=03/part-0005.parquet
s3://<DOC-EXAMPLE-BUCKET>/year=2021/month=06/day=04/part-0006.parquet
s3://<DOC-EXAMPLE-BUCKET>/year=2021/month=06/day=04/part-0007.parquet
s3://<DOC-EXAMPLE-BUCKET>/year=2021/month=06/day=05/part-0008.parquet
s3://<DOC-EXAMPLE-BUCKET>/year=2021/month=06/day=05/part-0009.parquet
s3://<DOC-EXAMPLE-BUCKET>/year=2021/month=06/day=06/part-0010.parquet

The difficulty in identifying particular customers within this array of data is that a full file scan will be required to locate any individual customer. Now consider the data partitioned by the identifying field, customer_id.

s3://<DOC-EXAMPLE-BUCKET>/customer_id=customer-000/part-0000.parquet
s3://<DOC-EXAMPLE-BUCKET>/customer_id=customer-001/part-0001.parquet
s3://<DOC-EXAMPLE-BUCKET>/customer_id=customer-002/part-0002.parquet
s3://<DOC-EXAMPLE-BUCKET>/customer_id=customer-003/part-0003.parquet
s3://<DOC-EXAMPLE-BUCKET>/customer_id=customer-004/part-0004.parquet
s3://<DOC-EXAMPLE-BUCKET>/customer_id=customer-005/part-0005.parquet
s3://<DOC-EXAMPLE-BUCKET>/customer_id=customer-006/part-0006.parquet
s3://<DOC-EXAMPLE-BUCKET>/customer_id=customer-007/part-0007.parquet
s3://<DOC-EXAMPLE-BUCKET>/customer_id=customer-008/part-0008.parquet
s3://<DOC-EXAMPLE-BUCKET>/customer_id=customer-009/part-0009.parquet
s3://<DOC-EXAMPLE-BUCKET>/customer_id=customer-010/part-0010.parquet

In this data partitioning scheme, you only need to scan one folder to find data related to a particular customer. This is how analytics query engines like Amazon Athena, Amazon Redshift Spectrum, or Presto are designed to work—they prune unneeded partitioning during query execution, thereby reducing the amount of data that is scanned and transferred. Partitioning data like this will result in less data scanned overall.

Key features

With the launch of Kinesis Data Firehose Dynamic Partitioning, you can now enable data partitioning to be dynamic, based on data content within the AWS Management Console, AWS Command Line Interface (AWS CLI), or AWS SDK when you create or update an existing Kinesis Data Firehose delivery stream.

At a high level, Kinesis Data Firehose Dynamic Partitioning allows for easy extraction of keys from incoming records into your delivery stream by allowing you to select and extract JSON data fields in an easy-to-use query engine.

Kinesis Data Firehose Dynamic Partitioning and key extraction will result in larger file sizes landing in Amazon S3, in addition to allowing for columnar data formats, like Apache Parquet, that query engines prefer.

With Kinesis Data Firehose Dynamic Partitioning, you have the ability to specify delimiters to detect or add on to your incoming records. This makes it possible to clean and organize data in a way that a query engine like Amazon Athena or AWS Glue would expect. This not only saves time but also cuts down on additional processes after the fact, potentially reducing costs in the process.

Kinesis Data Firehose has built-in support for extracting the keys for partitioning records that are in JSON format. You can select and extract the JSON data fields to be used in partitioning by using JSONPath syntax. These fields will then dictate how the data is partitioned when it’s delivered to Amazon S3. As we’ll discuss in the walkthrough later in this post, extracting a well-distributed set of partition keys is critical to optimizing your Kinesis Data Firehose delivery stream that uses  dynamic partitioning.

If the incoming data is compressed, encrypted, or in any other file format, you can include in the PutRecord or PutRecords API calls the data fields for partitioning. You can also use the integrated Lambda function with your own custom code to decompress, decrypt, or transform the records to extract and return the data fields that are needed for partitioning. This is an expansion of the existing transform Lambda function that is available today with Kinesis Data Firehose. You can transform, parse, and return the data fields by using the same Lambda function.

In order to achieve larger file sizes when it sinks data to Amazon S3, Kinesis Data Firehose buffers incoming streaming data to a specified size or time period before it delivers to Amazon S3. Buffer sizes range from 1 MB to 4 GB when data is delivered to Amazon S3, and the buffering interval ranges from 1 minute to 1 hour.

Example of a partitioning structure

Consider the following clickstream event.

{
    "type": {
        "device": "mobile",
        "event": "user_clicked_submit_button"
    },
    "customer_id": "1234",
    "event_timestamp":1630442383,
    "geo": "US"
}

You can now partition your data by customer_id, so Kinesis Data Firehose will automatically group all events with the same customer_id and deliver them to separate folders in your S3 destination bucket. The new folders will be created dynamically—you only specify which JSON field will act as dynamic partition key.

Assume that you want to have the following folder structure in your S3 data lake.

s3://<DOC-EXAMPLE-BUCKET>/customer_id=1234/part-0000.parquet
s3://<DOC-EXAMPLE-BUCKET>/customer_id=1234/part-0001.parquet

s3://<DOC-EXAMPLE-BUCKET>/customer_id=4567/part-0000.parquet
s3://<DOC-EXAMPLE-BUCKET>/customer_id=4567/part-0001.parquet 

The Kinesis Data Firehose configuration for the preceding example will look like the one shown in the following screenshot.

Kinesis Data Firehose evaluates the prefix expression at runtime. It groups records that match the same evaluated S3 prefix expression into a single dataset. Kinesis Data Firehose then delivers each dataset to the evaluated S3 prefix. The frequency of dataset delivery to S3 is determined by the delivery stream buffer setting.

You can do even more with the jq JSON processor, including accessing nested fields and create complex queries to identify specific keys among the data.

In the following example, I decide to store events in a way that will allow me to scan events from the mobile devices of a particular customer.

{
    "type": {
        "device": "mobile",
        "event": "user_clicked_submit_button"
    },
    "customer_id": "1234",
    "event_timestamp": 1630442383
    "geo": "US"
}

Given the same event, I’ll use both the device and customer_id fields in the Kinesis Data Firehose prefix expression, as shown in the following screenshot. Notice that the device is a nested JSON field.

The generated S3 folder structure will be as follows, where <DOC-EXAMPLE-BUCKET> is your bucket name.

s3://<DOC-EXAMPLE-BUCKET>/customer_id=1234/device=mobile/part-0000.parquet
s3://<DOC-EXAMPLE-BUCKET>/customer_id=1234/device=mobile/part-0001.parquet

s3://<DOC-EXAMPLE-BUCKET>/customer_id=1234/device=desktop/part-0000.parquet
s3://<DOC-EXAMPLE-BUCKET>/customer_id=1234/device=desktop/part-0001.parquet

Now assume that you want to partition your data based on the time when the event actually was sent, as opposed to using Kinesis Data Firehose native support for ApproximateArrivalTimestamp, which represents the time in UTC when the record was successfully received and stored in the stream. The time in the event_timestamp field might be in a different time zone.

With Kinesis Data Firehose Dynamic Partitioning, you can extract and transform field values on the fly. I’ll use the event_timestamp field to partition the events by year, month, and day, as shown in the following screenshot.

The preceding expression will produce the following S3 folder structure, where <DOC-EXAMPLE-BUCKET> is your bucket name.

s3://<DOC-EXAMPLE-BUCKET>/customer_id=1234/year=2021/month=05/day=21/part-0000.parquet
s3://<DOC-EXAMPLE-BUCKET>/customer_id=1234/year=2021/month=05/day=21/part-0001.parquet

s3://<DOC-EXAMPLE-BUCKET>/customer_id=1234/year=2021/month=05/day=22/part-0000.parquet
s3://<DOC-EXAMPLE-BUCKET>/customer_id=1234/year=2021/month=05/day=22/part-0001.parquet

Create a dynamically partitioned delivery stream

To begin delivering dynamically partitioned data into Amazon S3, navigate to the Amazon Kinesis console page by searching for or selecting Kinesis.

From there, choose Create Delivery Stream, and then select your source and sink.

For this example, you will receive data from a Kinesis Data Stream, but you can also choose Direct PUT or other sources as the source of your delivery stream.

For the destination, choose Amazon S3.

Next, choose the Kinesis Data Stream source to read from. If you have a Kinesis Data Stream previously created, simply choose Browse and select from the list. If not, follow this guide on how to create a Kinesis Data Stream.

Give your delivery stream a name and continue on to the Transform and convert records section of the create wizard.

In order to transform your source records with AWS Lambda, you can enable data transformation. This process will be covered in the next section, and we’ll leave both the AWS Lambda transformation as well as the record format conversion disabled for simplicity.

For your S3 destination, select or create an S3 bucket that your delivery stream has permissions to.

Below that setting, you can now enable dynamic partitioning on the incoming data in order to deliver data to different S3 bucket prefixes based on your specified JSONPath query.

You now have the option to enable the following features, shown in the screenshot below:

  • Multi record deaggregation – Separate records that enter your delivery stream based on valid JSON criteria or a new line delimiter such as \n. This can be useful for data that comes in to your delivery stream in a specific format, but needs to be reformatted according to the downstream analysis engine.
  • New line delimiter – Configure your delivery stream to add a new line delimiter between records within objects delivered to Amazon S3, such as \n.
  • Inline parsing for JSON – Specify data record parameters to be used as dynamic partitioning keys, and provide a value for each key.

You can simply add your key/value pairs, then choose Apply dynamic partitioning keys to apply the partitioning scheme to your S3 bucket prefix. Keep in mind that you will also need to supply an error prefix for your S3 bucket before continuing.

Set your S3 buffering conditions appropriately for your use case. In my example, I’ve lowered the buffering to the minimum of 1 MiB of data delivered, or 60 seconds before delivering data to Amazon S3.

Keep the defaults for the remaining settings, and then choose Create delivery stream.

After data begins flowing through your pipeline, within the buffer interval you will see data appear in S3, partitioned according to the configurations within your Kinesis Data Firehose.

For delivery streams without the dynamic partitioning feature enabled, there will be one buffer across all incoming data. When data partitioning is enabled, Kinesis Data Firehose will have a buffer per partition, based on incoming records. The delivery stream will deliver each buffer of data as a single object when the size or interval limit has been reached, independent of other data partitions.

Lambda transformation of non-JSON records

If the data flowing through a Kinesis Data Firehose is compressed, encrypted, or in any non-JSON file format, the dynamic partitioning feature won’t be able to parse individual fields by using the JSONPath syntax specified previously. To use the dynamic partitioning feature with non-JSON records, use the integrated Lambda function with Kinesis Data Firehose to transform and extract the fields needed to properly partition the data by using JSONPath.

The following Lambda function will decode a user payload, extract the necessary fields for the Kinesis Data Firehose dynamic partitioning keys, and return a proper Kinesis Data Firehose file, with the partition keys encapsulated in the outer payload.

# This is an Amazon Kinesis Data Firehose stream processing Lambda function that  
# replays every read record from input to output  
# and extracts partition keys from the records.  
  
from __future__ import print_function  
import base64  
import json  
import datetime  
  
# Signature for all Lambda functions that user must implement  
def lambda_handler(firehose_records_input, context):  
      
    # Create return value.  
    firehose_records_output = {}  
    # Create result object.  
    firehose_records_output['records'] = []  
  
    print("\n")  
    # Go through records and process them.  
    for firehose_record_input in firehose_records_input['records']:  
  
        # Get user payload.  
        payload = base64.b64decode(firehose_record_input['data'])  
        jsonVal = json.loads(payload)  
          
        print("Record that was received")  
        print(jsonVal)  
        print("\n")  
        # Create output Firehose record and add modified payload and record ID to it.  
        firehose_record_output = {}  
        eventTimestamp = datetime.datetime.fromtimestamp(jsonVal['eventTimestamp'])  
        partitionKeys = {}  
        partitionKeys["customerId"] = jsonVal['customerId']  
        partitionKeys["year"] = eventTimestamp.strftime('%Y')  
        partitionKeys["month"] = eventTimestamp.strftime('%m')  
        partitionKeys["date"] = eventTimestamp.strftime('%d')  
        partitionKeys["hour"] = eventTimestamp.strftime('%H')  
        partitionKeys["minute"] = eventTimestamp.strftime('%M')  
  
          
        # Must set proper record ID.  
        firehose_record_output['recordId'] = firehose_record_input['recordId']  
        firehose_record_output['data'] = firehose_record_input['data']  
        firehose_record_output['result'] =  'Ok'  
        firehose_record_output['partitionKeys'] =  partitionKeys  
  
        # Add the record to the list of output records.  
        firehose_records_output['records'].append(firehose_record_output)  
  
    # At the end return processed records.  
    return firehose_records_output  

Using Lambda to extract the necessary fields for dynamic partitioning provides both the benefit of encrypted and compressed data and the benefit of dynamically partitioning data based on record fields.

Limits and quotas

Kinesis Data Firehose Dynamic Partitioning has a limit of 500 active partitions per delivery stream while it is actively buffering data—in other words, how many active partitions exist in the delivery stream during the configured buffering hints. This limit is adjustable, and if you want to increase it, you’ll need to submit a support ticket for a limit increase.

Each new value that is determined by the JSONPath select query will result in a new partition in the Kinesis Data Firehose delivery stream. The partition has an associated buffer of data that will be delivered to Amazon S3 in the evaluated partition prefix. Upon delivery to Amazon S3, the buffer that previously held that data and the associated partition will be deleted and deducted from the active partitions count in Kinesis Data Firehose.

Consider the following records that were ingested to my delivery stream.

{"customer_id": "123"}
{"customer_id": "124"}
{"customer_id": "125"}

If I decide to use customer_id for my dynamic data partitioning and deliver records to different prefixes, I’ll have three active partitions if the records keep ingesting for all of my customers. When there are no more records for "customer_id": "123", Kinesis Data Firehose will delete the buffer and will keep only two active partitions.

If you exceed the maximum number of active partitions, the rest of the records in the delivery stream will be delivered to the S3 error prefix. For more information, see the Error Handling section of this blog post.

A maximum throughput of 25 MB per second is supported for each active partition. This limit is not adjustable. You can monitor the throughput with the new metric called PerPartitionThroughput.

Best practices

The right partitioning can help you to save costs related to the amount of data that is scanned by analytics services like Amazon Athena. On the other hand, over-partitioning may lead to the creation of smaller objects and wipe out the initial benefit of cost and performance. See Top 10 Performance Tuning Tips for Amazon Athena.

We advise you to align your partitioning keys with your analysis queries downstream to promote compatibility between the two systems. At the same time, take into consideration how high cardinality can impact the dynamic partitioning active partition limit.

When you decide which fields to use for the dynamic data partitioning, it’s a fine balance between picking fields that match your business case and taking into consideration the partition count limits. You can monitor the number of active partitions with the new metric PartitionCount, as well as the number of partitions that have exceeded the limit with the metric PartitionCountExceeded.

Another way to optimize cost is to aggregate your events into a single PutRecord and PutRecordBatch API call. Because Kinesis Data Firehose is billed per GB of data ingested, which is calculated as the number of data records you send to the service, times the size of each record rounded up to the nearest 5 KB, you can put more data per each ingestion call.

Data partition functionality is run after data is de-aggregated, so each event will be sent to the corresponding Amazon S3 prefix based on the partitionKey field within each event.

Error handling

Imagine that the following record enters your Kinesis Data Firehose delivery stream.

{“customerID”: 1000}

When your dynamic partition query scans over this record, it will be unable to locate the specified key of customer_id, and therefore will result in an error. In this scenario, we suggest using S3 error prefix when you create or modify your Kinesis Data Firehose stream.

All failed records will be delivered to the error prefix. The records you might find there are the events without the field you specified as your partition key.

Cost and pricing examples

Kinesis Data Firehose Dynamic Partitioning is billed per GB of partitioned data delivered to S3, per object, and optionally per jq processing hour for data parsing. The cost can vary based on the AWS Region where you decide to create your stream.

For more information, see our pricing page.

Summary

In this post, we discussed the Kinesis Data Firehose Dynamic Partitioning feature, and explored the use cases where this feature can help improve pipeline performance. We also covered how to develop and optimize a Kinesis Data Firehose pipeline by using dynamic partitioning and the best practices around building a reliable delivery stream.

Kinesis Data Firehose dynamic partitioning will be available in all Regions at launch, and we urge you to try the new feature to see how it can simplify your delivery stream and query engine performance. Be sure to provide us with any feedback you have about the new feature.


About the Authors

Jeremy Ber has been working in the telemetry data space for the past 5 years as a Software Engineer, Machine Learning Engineer, and most recently a Data Engineer. In the past, Jeremy has supported and built systems that stream in terabytes of data per day and process complex machine learning algorithms in real time. At AWS, he is a Solutions Architect Streaming Specialist, supporting both Amazon Managed Streaming for Apache Kafka (Amazon MSK) and Amazon Kinesis.

Michael Greenshtein’s career started in software development and shifted to DevOps. Michael worked with AWS services to build complex data projects involving real-time, ETLs, and batch processing. Now he works in AWS as Solutions Architect in the Europe, Middle East, and Africa (EMEA) region, supporting a variety of customer use cases.

How MEDHOST’s cardiac risk prediction successfully leveraged AWS analytic services

Post Syndicated from Pandian Velayutham original https://aws.amazon.com/blogs/big-data/how-medhosts-cardiac-risk-prediction-successfully-leveraged-aws-analytic-services/

MEDHOST has been providing products and services to healthcare facilities of all types and sizes for over 35 years. Today, more than 1,000 healthcare facilities are partnering with MEDHOST and enhancing their patient care and operational excellence with its integrated clinical and financial EHR solutions. MEDHOST also offers a comprehensive Emergency Department Information System with business and reporting tools. Since 2013, MEDHOST’s cloud solutions have been utilizing Amazon Web Services (AWS) infrastructure, data source, and computing power to solve complex healthcare business cases.

MEDHOST can utilize the data available in the cloud to provide value-added solutions for hospitals solving complex problems, like predicting sepsis, cardiac risk, and length of stay (LOS) as well as reducing re-admission rates. This requires a solid foundation of data lake and elastic data pipeline to keep up with multi-terabyte data from thousands of hospitals. MEDHOST has invested a significant amount of time evaluating numerous vendors to determine the best solution for its data needs. Ultimately, MEDHOST designed and implemented machine learning/artificial intelligence capabilities by leveraging AWS Data Lab and an end-to-end data lake platform that enables a variety of use cases such as data warehousing for analytics and reporting.

Since you’re reading this post, you may also be interested in the following:

Getting started

MEDHOST’s initial objectives in evaluating vendors were to:

  • Build a low-cost data lake solution to provide cardiac risk prediction for patients based on health records
  • Provide an analytical solution for hospital staff to improve operational efficiency
  • Implement a proof of concept to extend to other machine learning/artificial intelligence solutions

The AWS team proposed AWS Data Lab to architect, develop, and test a solution to meet these objectives. The collaborative relationship between AWS and MEDHOST, AWS’s continuous innovation, excellent support, and technical solution architects helped MEDHOST select AWS over other vendors and products. AWS Data Lab’s well-structured engagement helped MEDHOST define clear, measurable success criteria that drove the implementation of the cardiac risk prediction and analytical solution platform. The MEDHOST team consisted of architects, builders, and subject matter experts (SMEs). By connecting MEDHOST experts directly to AWS technical experts, the MEDHOST team gained a quick understanding of industry best practices and available services allowing MEDHOST team to achieve most of the success criteria at the end of a four-day design session. MEDHOST is now in the process of moving this work from its lower to upper environment to make the solution available for its customers.

Solution

For this solution, MEDHOST and AWS built a layered pipeline consisting of ingestion, processing, storage, analytics, machine learning, and reinforcement components. The following diagram illustrates the Proof of Concept (POC) that was implemented during the four-day AWS Data Lab engagement.

Ingestion layer

The ingestion layer is responsible for moving data from hospital production databases to the landing zone of the pipeline.

The hospital data was stored in an Amazon RDS for PostgreSQL instance and moved to the landing zone of the data lake using AWS Database Migration Service (DMS). DMS made migrating databases to the cloud simple and secure. Using its ongoing replication feature, MEDHOST and AWS implemented change data capture (CDC) quickly and efficiently so MEDHOST team could spend more time focusing on the most interesting parts of the pipeline.

Processing layer

The processing layer was responsible for performing extract, tranform, load (ETL) on the data to curate them for subsequent uses.

MEDHOST used AWS Glue within its data pipeline for crawling its data layers and performing ETL tasks. The hospital data copied from RDS to Amazon S3 was cleaned, curated, enriched, denormalized, and stored in parquet format to act as the heart of the MEDHOST data lake and a single source of truth to serve any further data needs. During the four-day Data Lab, MEDHOST and AWS targeted two needs: powering MEDHOST’s data warehouse used for analytics and feeding training data to the machine learning prediction model. Even though there were multiple challenges, data curation is a critical task which requires an SME. AWS Glue’s serverless nature, along with the SME’s support during the Data Lab, made developing the required transformations cost efficient and uncomplicated. Scaling and cluster management was addressed by the service, which allowed the developers to focus on cleaning data coming from homogenous hospital sources and translating the business logic to code.

Storage layer

The storage layer provided low-cost, secure, and efficient storage infrastructure.

MEDHOST used Amazon S3 as a core component of its data lake. AWS DMS migration tasks saved data to S3 in .CSV format. Crawling data with AWS Glue made this landing zone data queryable and available for further processing. The initial AWS Glue ETL job stored the parquet formatted data to the data lake and its curated zone bucket. MEDHOST also used S3 to store the .CSV formatted data set that will be used to train, test, and validate its machine learning prediction model.

Analytics layer

The analytics layer gave MEDHOST pipeline reporting and dashboarding capabilities.

The data was in parquet format and partitioned in the curation zone bucket populated by the processing layer. This made querying with Amazon Athena or Amazon Redshift Spectrum fast and cost efficient.

From the Amazon Redshift cluster, MEDHOST created external tables that were used as staging tables for MEDHOST data warehouse and implemented an UPSERT logic to merge new data in its production tables. To showcase the reporting potential that was unlocked by the MEDHOST analytics layer, a connection was made to the Redshift cluster to Amazon QuickSight. Within minutes MEDHOST was able to create interactive analytics dashboards with filtering and drill-down capabilities such as a chart that showed the number of confirmed disease cases per US state.

Machine learning layer

The machine learning layer used MEDHOST’s existing data sets to train its cardiac risk prediction model and make it accessible via an endpoint.

Before getting into Data Lab, the MEDHOST team was not intimately familiar with machine learning. AWS Data Lab architects helped MEDHOST quickly understand concepts of machine learning and select a model appropriate for its use case. MEDHOST selected XGBoost as its model since cardiac prediction falls within regression technique. MEDHOST’s well architected data lake enabled it to quickly generate training, testing, and validation data sets using AWS Glue.

Amazon SageMaker abstracted underlying complexity of setting infrastructure for machine learning. With few clicks, MEDHOST started Jupyter notebook and coded the components leading to fitting and deploying its machine learning prediction model. Finally, MEDHOST created the endpoint for the model and ran REST calls to validate the endpoint and trained model. As a result, MEDHOST achieved the goal of predicting cardiac risk. Additionally, with Amazon QuickSight’s SageMaker integration, AWS made it easy to use SageMaker models directly in visualizations. QuickSight can call the model’s endpoint, send the input data to it, and put the inference results into the existing QuickSight data sets. This capability made it easy to display the results of the models directly in the dashboards. Read more about QuickSight’s SageMaker integration here.

Reinforcement layer

Finally, the reinforcement layer guaranteed that the results of the MEDHOST model were captured and processed to improve performance of the model.

The MEDHOST team went beyond the original goal and created an inference microservice to interact with the endpoint for prediction, enabled abstracting of the machine learning endpoint with the well-defined domain REST endpoint, and added a standard security layer to the MEDHOST application.

When there is a real-time call from the facility, the inference microservice gets inference from the SageMaker endpoint. Records containing input and inference data are fed to the data pipeline again. MEDHOST used Amazon Kinesis Data Streams to push records in real time. However, since retraining the machine learning model does not need to happen in real time, the Amazon Kinesis Data Firehose enabled MEDHOST to micro-batch records and efficiently save them to the landing zone bucket so that the data could be reprocessed.

Conclusion

Collaborating with AWS Data Lab enabled MEDHOST to:

  • Store single source of truth with low-cost storage solution (data lake)
  • Complete data pipeline for a low-cost data analytics solution
  • Create an almost production-ready code for cardiac risk prediction

The MEDHOST team learned many concepts related to data analytics and machine learning within four days. AWS Data Lab truly helped MEDHOST deliver results in an accelerated manner.


About the Authors

Pandian Velayutham is the Director of Engineering at MEDHOST. His team is responsible for delivering cloud solutions, integration and interoperability, and business analytics solutions. MEDHOST utilizes modern technology stack to provide innovative solutions to our customers. Pandian Velayutham is a technology evangelist and public cloud technology speaker.


George Komninos is a Data Lab Solutions Architect at AWS. He helps customers convert their ideas to a production-ready data product. Before AWS, he spent 3 years at Alexa Information domain as a data engineer. Outside of work, George is a football fan and supports the greatest team in the world, Olympiacos Piraeus.

Choosing between AWS services for streaming data workloads

Post Syndicated from James Beswick original https://aws.amazon.com/blogs/compute/choosing-between-aws-services-for-streaming-data-workloads/

Traditionally, streaming data can be complex to manage due to the large amounts of data arriving from many separate sources. Managing fluctuations in traffic and durably persisting messages as they arrive is a non-trivial task. Using a serverless approach, AWS provides a number of services that help manage large numbers of messages, alleviating much of the infrastructure burden.

In this blog post, I compare several AWS services and how to choose between these options in streaming data workloads.

Comparing Amazon Kinesis Data Streams with Amazon SQS queues

While you can use both services to decouple data producers and consumers, each is suited to different types of workload. Amazon SQS is primarily used as a message queue to store messages durably between distributed services. Amazon Kinesis is primarily intended to manage streaming big data.

Kinesis supports ordering of records and the ability for multiple consumers to read messages from the same stream concurrently. It also allows consumers to replay messages from up to 7 days previously. Scaling in Kinesis is based upon shards and you must reshard to scale a data stream up or down.

With SQS, consumers pull data from a queue and it’s hidden from other consumers until processed successfully (known as a visibility timeout). Once a message is processed, it’s deleted from the queue. A queue may have multiple consumers but they all receive separate batches of messages. Standard queues do not provide an ordering guarantee but scaling in SQS is automatic.

Amazon Kinesis Data Streams

Amazon SQS

Ordering guarantee Yes, by shard No for standard queues; FIFO queues support ordering by group ID.
Scaling Resharding required to provision throughput Automatic for standard queues; up to 30,000 message per second for FIFO queues (more details).
Exactly-once delivery No No for standard queues; Yes for FIFO queues.
Consumer model Multiple concurrent Single consumer
Configurable message delay No Up to 15 minutes
Ability to replay messages Yes No
Encryption Yes Yes
Payload maximum 1 MB per record 256 KB per message
Message retention period 24 hours (default) to 365 days (additional charges apply) 1 minute to 14 days. 4 days is the default
Pricing model Per shard hour plus PUT payload unit per million. Additional charges for some features No minimum; $0.24-$0.595 per million messages, depending on Region and queue type
AWS Free Tier included No Yes, 1 million messages per month – see details
Typical use cases

Real-time metrics/reporting

Real-time data analytics

Log and data feed processing

Stream processing

Application integration

Asynchronous processing

Batching messages/smoothing throughput

Integration with Kinesis Data Analytics Yes No
Integration with Kinesis Data Firehose Yes No

While some functionality of both services is similar, Kinesis is often a better fit for many streaming workloads. Kinesis has a broader range of options for ingesting large amounts of data, such as the Kinesis Producer Library and Kinesis Aggregation Library. You can also use the PutRecords API to send up to 500 records (up to a maximum 5 MiB) per request.

Additionally, it has powerful integrations not available to SQS. Amazon Kinesis Data Analytics allows you to transform and analyze streaming data with Apache Flink. You can also use streaming SQL to run windowed queries on live data in near-real time. You can also use Amazon Kinesis Data Firehose as a consumer for Amazon Kinesis Data Streams, which is also not available to SQS queues.

Choosing between Kinesis Data Streams and Kinesis Data Firehose

Both of these services are part of Kinesis but they have different capabilities and target use-cases. Kinesis Data Firehose is a fully managed service that can ingest gigabytes of data from a variety of producers. When Kinesis Data Streams is the source, it automatically scales up or down to match the volume of data. It can optionally process records as they arrive with AWS Lambda and deliver batches of records to services like Amazon S3 or Amazon Redshift. Here’s how the service compares with Kinesis Data Streams:

Kinesis Data Streams

Kinesis Data Firehose

Scaling Resharding required Automatic
Supports compression No Yes (GZIP, ZIP, and SNAPPY)
Latency ~200 ms per consumer (~70 ms if using enhanced fan-out) Seconds (depends on buffer size configuration); minimum buffer window is 60 seconds
Retention 1–365 days None
Message replay Yes No
Quotas See quotas See quotas
Ingestion capacity Determined by number of shards (1,000 records or 1 MB/s per shard) No limit if source is Kinesis Data Streams; otherwise see quota page
Producer types

AWS SDK or AWS CLI

Kinesis Producer Library

Kinesis Agent

Amazon CloudWatch

Amazon EventBridge

AWS IoT Core

AWS SDK or AWS CLI

Kinesis Producer Library

Kinesis Agent

Amazon CloudWatch

Amazon EventBridge

AWS IoT Core

Kinesis Data Streams

Number of consumers Multiple, sharing 2 MB per second per shard throughput One per delivery stream
Consumers

AWS Lambda

Kinesis Data Analytics

Kinesis Data Firehose

Kinesis Client Library

Amazon S3

Amazon Redshift

Amazon Elasticsearch Service

Third-party providers

HTTP endpoints

Pricing Hourly charge plus data volume. Some features have additional charges – see pricing Based on data volume, format conversion and VPC delivery – see pricing

The needs of your workload determine the choice between the two services. To prepare and load data into a data lake or data store, Kinesis Data Firehose is usually the better choice. If you need low latency delivery of records and the ability to replay data, choose Kinesis Data Streams.

Using Kinesis Data Firehose to prepare and load data

Kinesis Data Firehose buffers data based on two buffer hints. You can configure a time-based buffer from 1-15 minutes and a volume-based buffer from 1-128 MB. Whichever limit is reached first causes the service to flush the buffer. These are called hints because the service can adjust the settings if data delivery falls behind writing to the stream. The service raises the buffer settings dynamically to allow the service to catch up.

This is the flow of data in Kinesis Data Firehose from a data source through to a destination, including optional settings for a delivery stream:

Kinesis Dat Firehose flow

  1. The service continuously loads from the data source as it arrives.
  2. The data transformation Lambda function processes individual records and returns these to the service.
  3. Transformed records are delivered to the destination once the buffer size or buffer window is reached.
  4. Any records that could not be delivered to the destination are written to an intermediate S3 bucket.
  5. Any records that cannot be transformed by the Lambda function are written to an intermediate S3 bucket.
  6. Optionally, the original, untransformed records are written to an S3 bucket.

Data transformation using a Lambda function

The data transformation process enables you to modify the contents of individual records. Kinesis Data Firehose synchronously invokes the Lambda function with a batch of records. Your custom code modifies the records and then returns an array of transformed records.

Transformed records

The incoming payload provides the data attribute in base64 encoded format. Once the transformation is complete, the returned array must include the following attributes per record:

  • recordId: This must match the incoming recordId to enable the service to map the new data to the record.
  • result: “Ok”, “Dropped”, or “ProcessingFailed”. Dropped means that your logic has intentionally removed the record whereas ProcessingFailed indicates that an error has occurred.
  • data: The transformed data must be base64 encoded.

The returned array must be the same length as the incoming array. The Alleycat example application uses the following code in the data transformation function to add a calculated field to the record:

exports.handler = async (event) => {
    const output = event.records.map((record) => {
        
      // Extract JSON record from base64 data
      const buffer = Buffer.from(record.data, 'base64').toString()
      const jsonRecord = JSON.parse(buffer)

	// Add the calculated field
	jsonRecord.output = ((jsonRecord.cadence + 35) * (jsonRecord.resistance + 65)) / 100

	// Convert back to base64 + add a newline
	const dataBuffer = Buffer.from(JSON.stringify(jsonRecord) + '\n', 'utf8').toString('base64')

       return {
            recordId: record.recordId,
            result: 'Ok',
            data: dataBuffer
        }
    })
    
    console.log(`Output records: ${output.length}`)
    return { records: output }
}

Comparing scaling and throughput with Kinesis Data Streams and Kinesis Data Firehose

Kinesis Data Firehose manages scaling automatically. If the data source is a Kinesis Data Stream, there is no limit to the amount of data the service can ingest. If the data source is a direct put using the PutRecordBatch API, there are soft limits of up to 500,000 records per second, depending upon the Region. See the Kinesis Data Firehose quota page for more information.

Kinesis Data Firehose invokes a Lambda transformation function synchronously and scales up the function as the number of records in the stream grows. When the destination is S3, Amazon Redshift, or the Amazon Elasticsearch Service, Kinesis Data Firehose allows up to five outstanding Lambda invocations per shard. When the destination is Splunk, the quota is 10 outstanding Lambda invocations per shard.

With Kinesis Data Firehose, the buffer hints are the main controls for influencing the rate of data delivery. You can decide between more frequent delivery of small batches of message or less frequent delivery of larger batches. This can impact the PUT cost when using a destination like S3. However, this service is not intended to provide real-time data delivery due to the transformation and batching processes.

With Kinesis Data Streams, the number of shards in a stream determines the ingestion capacity. Each shard supports ingesting up to 1,000 messages or 1 MB per second of data. Unlike Kinesis Data Firehose, this service does not allow you to transform records before delivery to a consumer.

Data Streams has additional capabilities for increasing throughput and reducing the latency of data delivery. The service invokes Lambda consumers every second with a configurable batch size of messages. If the consumers are falling behind data production in the stream, you can increase the parallelization factor. By default, this is set to 1, meaning that each shard has a single instance of a Lambda function it invokes. You can increase this up to 10 so that multiple instances of the consumer function process additional batches of messages.

Increase the parallelization factor

Data Streams consumers use a pull model over HTTP to fetch batches of records, operating in serial. A stream with five standard consumers averages 200 ms of latency each, taking up to 1 second in total. You can improve the overall latency by using enhanced fan-out (EFO). EFO consumers use a push model over HTTP/2 and are independent of each other.

With EFO, all five consumers in the previous example receive batches of messages in parallel using dedicated throughput. The overall latency averages 70 ms and typically data delivery speed is improved by up to 65%. Note that there is an additional charge for this feature.
Kinesis Data Streams EFO consumers

Conclusion

This blog post compares different AWS services for handling streaming data. I compare the features of SQS and Kinesis Data Streams, showing how ordering, ingestion throughput, and multiple consumers often make Kinesis the better choice for streaming workloads.

I compare Data Streams and Kinesis Data Firehose and show how Kinesis Data Firehose is the better option for many data loading operations. I show how the data transformation process works and the overall workflow of a Kinesis Data Firehose stream. Finally, I compare the scaling and throughput options for these two services.

For more serverless learning resources, visit Serverless Land.