A lot of people rely on Cloudflare. We serve over 46 million HTTP requests per second on average; millions of customers use our services, including 31% of the Fortune 1000. And these numbers are only growing.
That’s why today we are excited to announce Incident Alerts — available via email, webhook, or PagerDuty. These notifications are accessible easily in the Cloudflare dashboard, and they’re customizable to prevent notification overload. And best of all, they’re available to everyone; you simply need a free account to get started.
Lifecycle of an incident
Without proper transparency, incidents cause confusion and waste resources for anyone that relies on the Internet. With so many different entities working together to make the Internet operate, diagnosing and troubleshooting can be complicated and time-consuming. By far the best solution is for providers to have transparent and proactive alerting, so any time something goes wrong, it’s clear exactly where the problem is.
Cloudflare incident response
We understand the importance of proactive and transparent alerting around incidents. We have worked to improve communications by directly alerting enterprise level customers and allowing everyone to subscribe to an RSS feed or leverage the Cloudflare Status API. Additionally, we update the Cloudflare status page — which catalogs incident reports, updates, and resolutions — throughout an incident’s lifecycle, as well as tracking scheduled maintenance.
However, not everyone wants to use the Status API or subscribe to an RSS feed. Both of these options require some infrastructure and programmatic efforts from the customer’s end, and neither offers simple configuration to filter out noise like scheduled maintenance. For those who don’t want to build anything themselves, visiting the status page is still a pull, rather than a push, model. Customers themselves need to take it upon themselves to monitor Cloudflare’s status — and timeliness in these situations can make a world of difference.
Without a proactive channel of communication, there can be a disconnect between Cloudflare and our customers during incidents. Although we update the status page as soon as possible, the lack of a push notification represents a gap in meeting our customers’ expectations. The new Cloudflare Incident Alerts aim to remedy that.
Simple, free, and fast notifications
We want to proactively notify you as soon as a Cloudflare incident may be affecting your service —- without any programmatic steps on your end. Unlike the Status API and an RSS feed, Cloudflare Incident Alerts are configurable through just a few clicks in the dashboard, and you can choose to receive email, PagerDuty, or web hook alerts for incidents involving specific products at different levels of impact. The Status API will continue to be available.
With this multidimensional granularity, you can filter notifications by specific service and severity. If you are, for example, a Cloudflare for SaaS customer, you may want alerts for delays in custom hostname activation but not for increased latency on Stream. Likewise, you may only care about critical incidents instead of getting notified for minor incidents. Incident Alerts give you the ability to choose.
Lifecycle of an Incident
How to filter incidents to fit your needs
You can filter incident notifications with the following categories:
Cloudflare Sites and Services: get notified when an incident is affecting certain products or product areas.
Impact level: get notified for critical, major, and/or minor incidents.
These categories are not mutually exclusive. Here are a few possible configurations:
Notify me via email for all critical incidents.
Notify me via webhook for critical & major incidents affecting Pages.
Notify me via PagerDuty for all incidents affecting Stream.
With over fifty different alerts available via the dashboard, you can tailor your notifications to what you need. You can customize not only which alerts you are receiving but also how you would like to be notified. With PagerDuty, webhooks, and email integrated into the system, you have the flexibility of choosing what will work best with your working environment. Plus, with multiple configurations within many of the available notifications, we make it easy to only get alerts about what you want, when you want them.
Try it out
You can start to configure incident alerts on your Cloudflare account today. Here’s how:
Navigate to the Cloudflare dashboard → Notifications.
Select “Add”.
Select “Incident Alerts”.
Enter your notification name and description.
Select the impact level(s) and component(s) for which you would like to be notified. If either field is left blank, it will default to all impact levels or all components, respectively.
Select how you want to receive the notifications:
Check PagerDuty
Add Webhook
Add email recipient
Select “Save”.
Test the notification by selecting “Test” on the right side of its row.
For more information on Cloudflare’s Alert Notification System, visit our documentation here.
Stream Live lets users easily scale their live-streaming apps and websites to millions of creators and concurrent viewers while focusing on the content rather than the infrastructure — Stream manages codecs, protocols, and bit rate automatically.
For Speed Week this year, we introduced a closed beta of Low-Latency HTTP Live Streaming (LL-HLS), which builds upon the high-quality, feature-rich HTTP Live Streaming (HLS) protocol. Lower latency brings creators even closer to their viewers, empowering customers to build more interactive features like chat and enabling the use of live-streaming in more time-sensitive applications like live e-learning, sports, gaming, and events.
Today, in celebration of Birthday Week, we’re opening this beta to all customers with even lower latency. With LL-HLS, you can deliver video to your audience faster, reducing the latency a viewer may experience on their player to as little as three seconds. Low Latency streaming is priced the same way, too: $1 per 1,000 minutes delivered, with zero extra charges for encoding or bandwidth.
Broadcast with latency as low as three seconds.
LL-HLS is an extension of the HLS standard that allows us to reduce glass-to-glass latency — the time between something happening on the broadcast end and a user seeing it on their screen. That includes factors like network conditions and transcoding for HLS and adaptive bitrates. We also include client-side buffering in our understanding of latency because we know the experience is driven by what a user sees, not when a byte is delivered into a buffer. Depending on encoder and player settings, broadcasters' content can be playing on viewers' screens in less than three seconds.
On the left, OBS Studio broadcasting from my personal computer to Cloudflare Stream. On the right, watching this livestream using our own built-in player playing LL-HLS with three second latency!
Same pricing, lower latency. Encoding is always free.
Our addition of LL-HLS support builds on all the best parts of Stream including simple, predictable pricing. You never have to pay for ingress (broadcasting to us), compute (encoding), or egress. This allows you to stream with peace of mind, knowing there are no surprise fees and no need to trade quality for cost. Regardless of bitrate or resolution, Stream costs \$1 per 1,000 minutes of video delivered and \$5 per 1,000 minutes of video stored, billed monthly.
Stream also provides both a built-in web player or HLS/DASH manifests to use in a compatible player of your choosing. This enables you or your users to go live using the same protocols and tools that broadcasters big and small use to go live to YouTube or Twitch, but gives you full control over access and presentation of live streams. We also provide access control with signed URLs and hotlinking prevention measures to protect your content.
Powered by the strength of the network
And of course, Stream is powered by Cloudflare's global network for fast delivery worldwide, with points of presence within 50ms of 95% of the Internet connected population, a key factor in our quest to slash latency. We ingest live video close to broadcasters and move it rapidly through Cloudflare’s network. We run encoders on-demand and generate player manifests as close to viewers as possible.
Getting started with LL-HLS
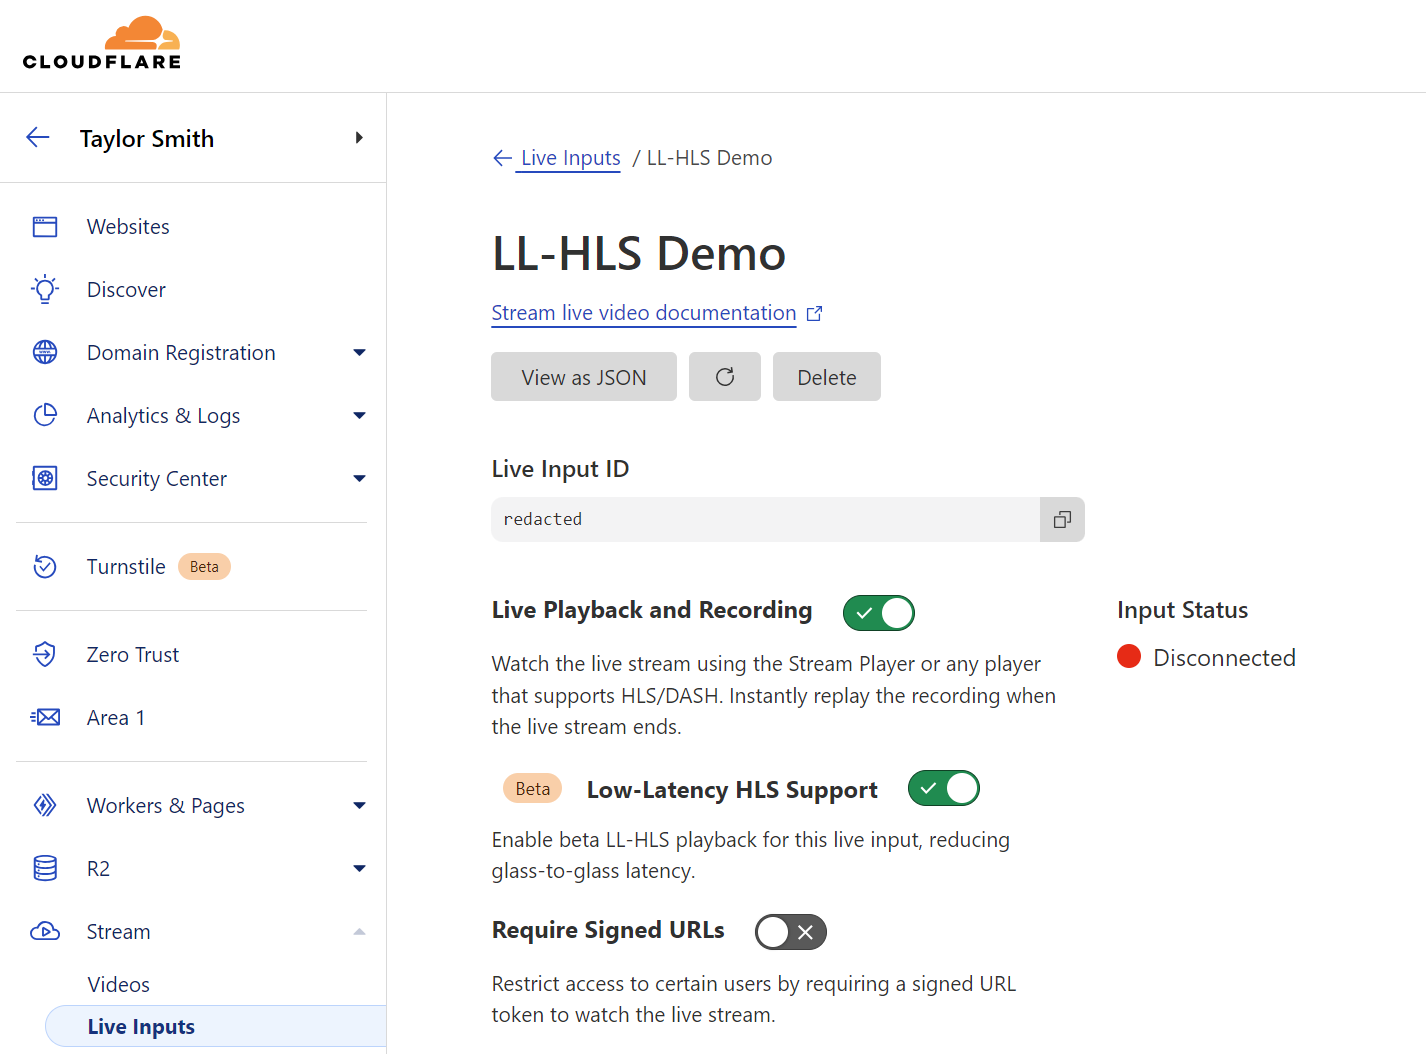
Getting started with Stream Live only takes a few minutes, and by using Live Outputs for restreaming, you can even test it without changing your existing infrastructure. First, create or update a Live Input in the Cloudflare dashboard. While in beta, Live Inputs will have an option to enable LL-HLS called “Low-Latency HLS Support.” Activate this toggle to enable the new pipeline.
Stream will automatically provide the RTMPS and SRT endpoints to broadcast your feed to us, just as before. For the best results, we recommend the following broadcast settings:
Codec: h264
GOP size / keyframe interval: 1 second
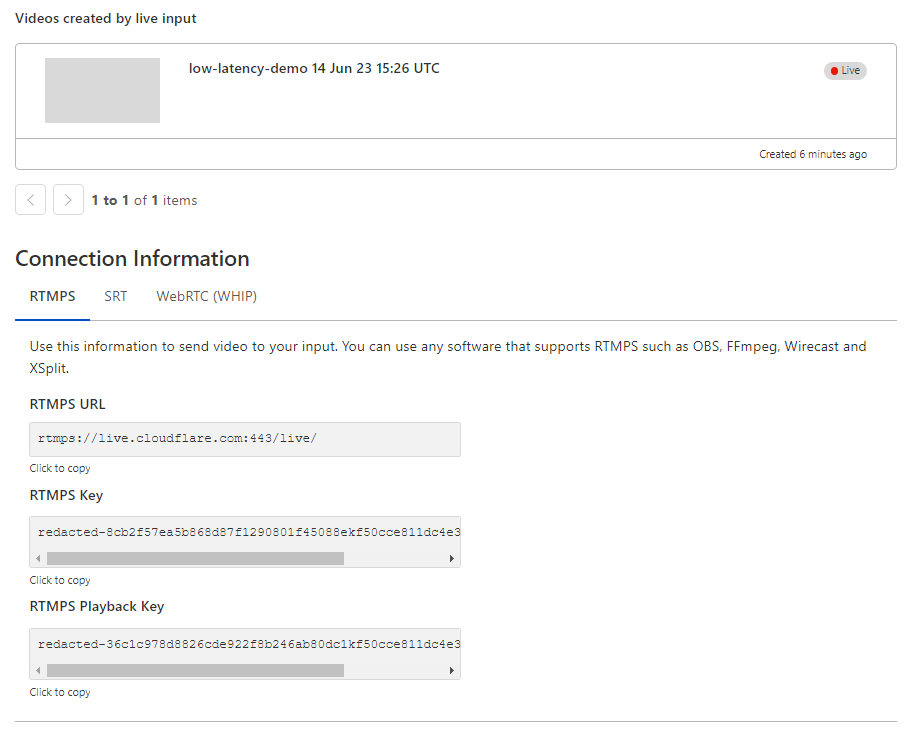
Optionally, configure a Live Output to point to your existing video ingest endpoint via RTMPS or SRT to test Stream while rebroadcasting to an existing workflow or infrastructure.
Stream will automatically provide RTMPS and SRT endpoints to broadcast your feed to us as well as an HTML embed for our built-in player.
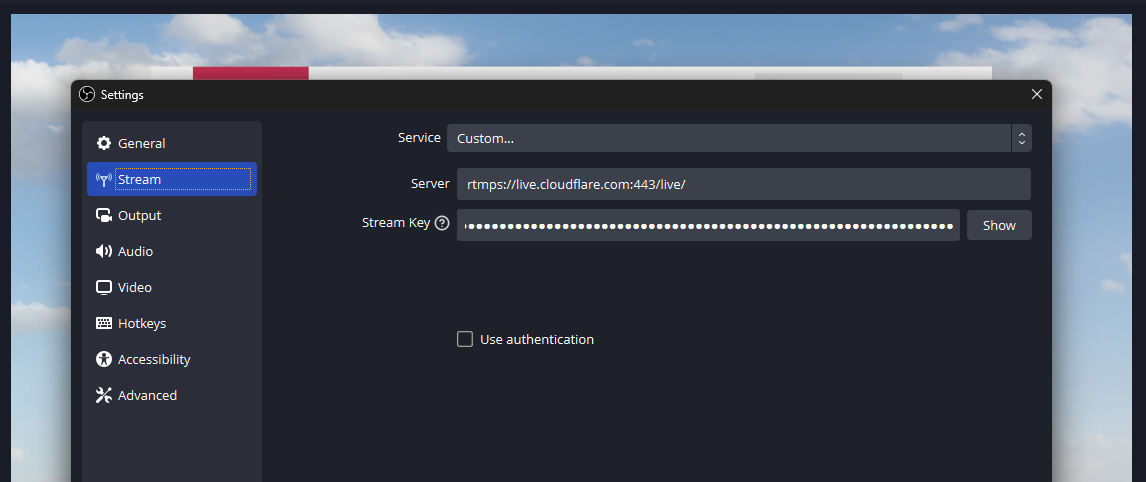
This connection information can be added easily to a broadcast application like OBS to start streaming immediately:
During the beta, our built-in player will automatically attempt to use low-latency for any enabled Live Input, falling back to regular HLS otherwise. If LL-HLS is being used, you’ll see “Low Latency” noted in the player.
During this phase of the beta, we are most closely focused on using OBS to broadcast and Stream’s built-in player to watch — which uses HLS.js under the hood for LL-HLS support. However, you may test the LL-HLS manifest in a player of your own by appending ?protocol=llhls to the end of the HLS manifest URL. This flag may change in the future and is not yet ready for production usage; watch for changes in DevDocs.
Sign up today
Low-Latency HLS is Stream Live’s latest tool to bring your creators and audiences together. All new and existing Stream subscriptions are eligible for the LL-HLS open beta today, with no pricing changes or contract requirements — all part of building the fastest, simplest serverless live-streaming platform. Join our beta to start test-driving Low-Latency HLS!
We are thrilled to introduce Cloudflare Fonts! In the coming weeks sites that use Google Fonts will be able to effortlessly load their fonts from the site’s own domain rather than from Google. All at a click of a button. This enhances both privacy and performance. It enhances users' privacy by eliminating the need to load fonts from Google’s third-party servers. It boosts a site's performance by bringing fonts closer to end users, reducing the time spent on DNS lookups and TLS connections.
Sites that currently use Google Fonts will not need to self-host fonts or make complex code changes to benefit – Cloudflare Fonts streamlines the entire process, making it a breeze.
Fonts and privacy
When you load fonts from Google, your website initiates a data exchange with Google's servers. This means that your visitors' browsers send requests directly to Google. Consequently, Google has the potential to accumulate a range of data, including IP addresses, user agents (formatted descriptions of the browser and operating system), the referer (the page on which the Google font is to be displayed) and how often each IP makes requests to Google. While Google states that they do not use this data for targeted advertising or set cookies, any time you can prevent sharing your end user’s personal data unnecessarily is a win for privacy.
With Cloudflare Fonts, when you serve fonts directly from your own domain. This means no font requests are sent to third-party domains like Google, which some privacy regulators have found to be a problem in the past. Our pro-privacy approach means your end user’s IP address and other data are not sent to another domain. All that information stays within your control, within your domain. In addition, because Cloudflare Fonts eliminates data transmission to third-party servers like Google's, this can enhance your ability to comply with any potential data localization requirements.
Faster Google Font delivery through Cloudflare
Now that we have established that Cloudflare Fonts can improve your privacy, let's flip to the other side of the coin – how Cloudflare Fonts will improve your performance.
To do this, we first need to delve into how Google Fonts affects your website's performance. Subsequently, we'll explore how Cloudflare Fonts addresses and rectifies these performance challenges.
Google Fonts is a fantastic resource that offers website owners a range of royalty-free fonts for website usage. When you decide on the fonts you would like to incorporate, it’s super easy to integrate. You just add a snippet of HTML to your site. You then add styles to apply these fonts to various parts of your page:
But this ease of use comes with a performance penalty.
Upon loading your webpage, your visitors' browser fetches the CSS file as soon as the HTML starts to be parsed. Then, when the browser starts rendering the page and identifies the need for fonts in different text sections, it requests the required font files.
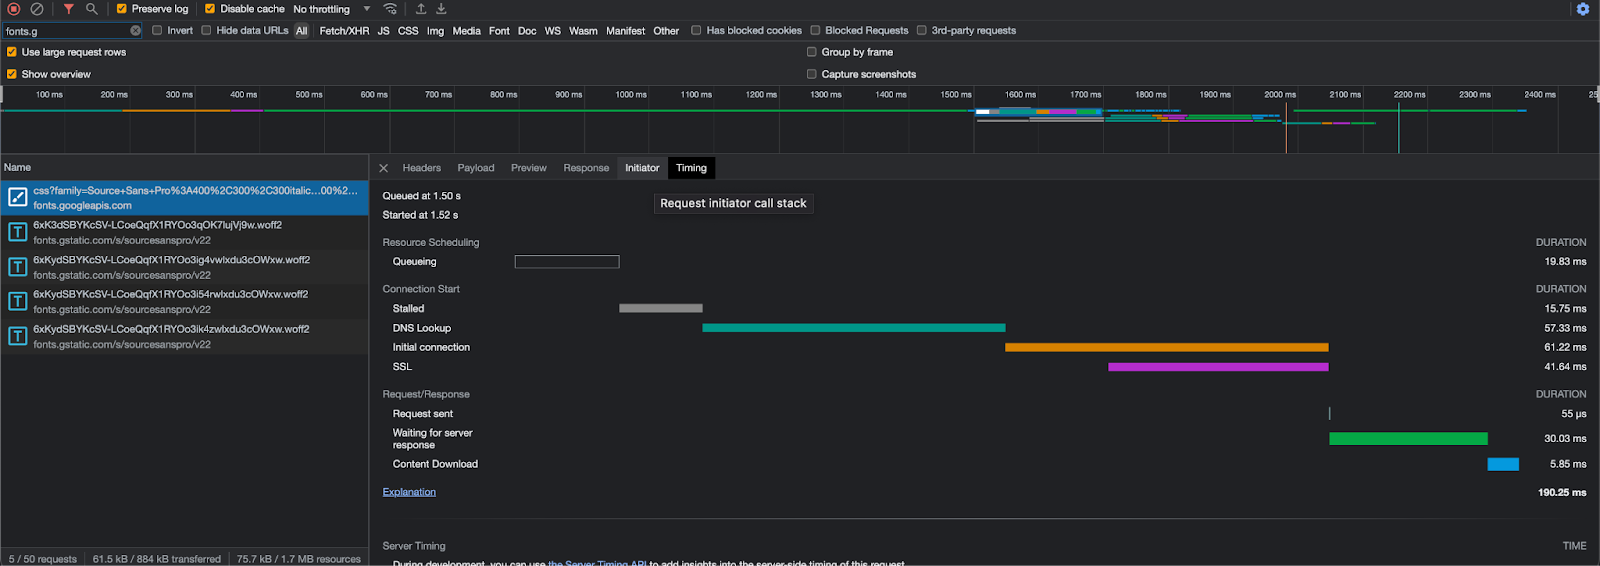
This is where the performance problem arises. Google Fonts employs a two-domain system: the CSS resides on one domain – fonts.googleapis.com – while the font files reside on another domain – fonts.gstatic.com.
This separation results in a minimum of four round trips to the third-party servers for each resource request. These round trips are DNS lookup, socket connection establishment, TLS negotiation (for HTTPS), and the final round trip for the actual resource request. Ultimately, getting a font from Google servers to a browser requires eight round trips.
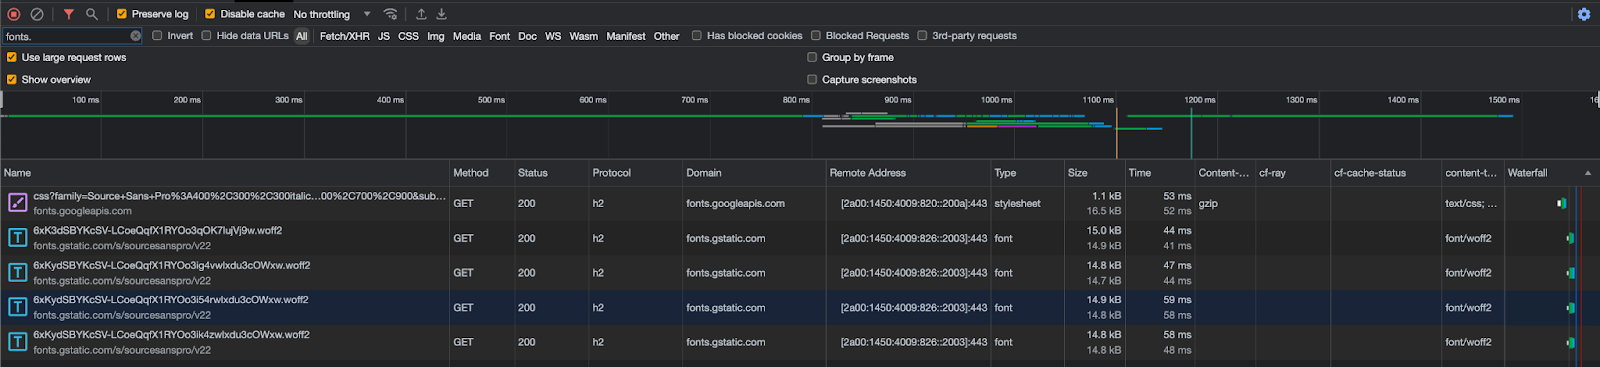
Users can see this. If they are using Google Fonts they can open their network tab and filter for these Google domains.
You can visually see the impact of the extra DNS request and TLS connection that these requests add to your website experience. For example on my WordPress site that natively uses Google Fonts as part of the theme adds an extra ~150ms.
Fast fonts
Cloudflare Fonts streamlines this process, by reducing the number of round trips from eight to one. Two sets of DNS lookups, socket connections and TLS negotiations to third-parties are no longer required because there is no longer a third-party server involved in serving the CSS or the fonts. The only round trip involves serving the font files directly from the same domain where the HTML is hosted. This approach offers an additional advantage: it allows fonts to be transmitted over the same HTTP/2 or HTTP/3 connection as other page resources, benefiting from proper prioritization and preventing bandwidth contention.
The eagle-eyed amongst you might be thinking “Surely it is still two round trips – what about the CSS request?”. Well, with Cloudflare Fonts, we have also removed the need for a separate CSS request. This means there really is only one round-trip – fetching the font itself.
To achieve both the home-routing of font requests and the removal of the CSS request, we rewrite the HTML as it passes through Cloudflare’s global network. The CSS response is embedded, and font URL transformations are performed within the embedded CSS.
These transformations adjust the font URLs to align with the same domain as the HTML content. These modified responses seamlessly pass through Cloudflare's caching infrastructure, where they are automatically cached for a substantial performance boost. In the event of any cache misses, we use Fontsource and NPM to load these fonts and cache them within the Cloudflare infrastructure. This approach ensures that there's no inadvertent data exposure to Google's infrastructure, maintaining both performance and data privacy.
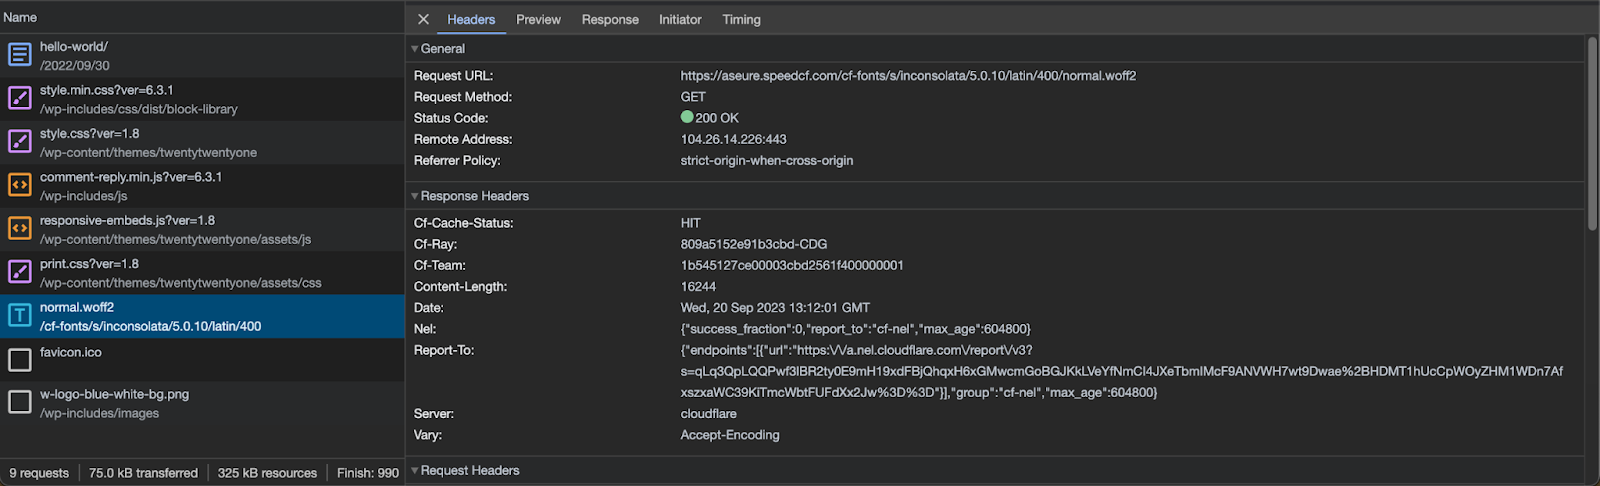
With Cloudflare Fonts enabled, you are able to see within your Network Tab that font files are now loaded from your own hostname from the /cf-fonts path and served from Cloudflare’s closest cache to the user, as indicated by the cf-cache-status: HIT.
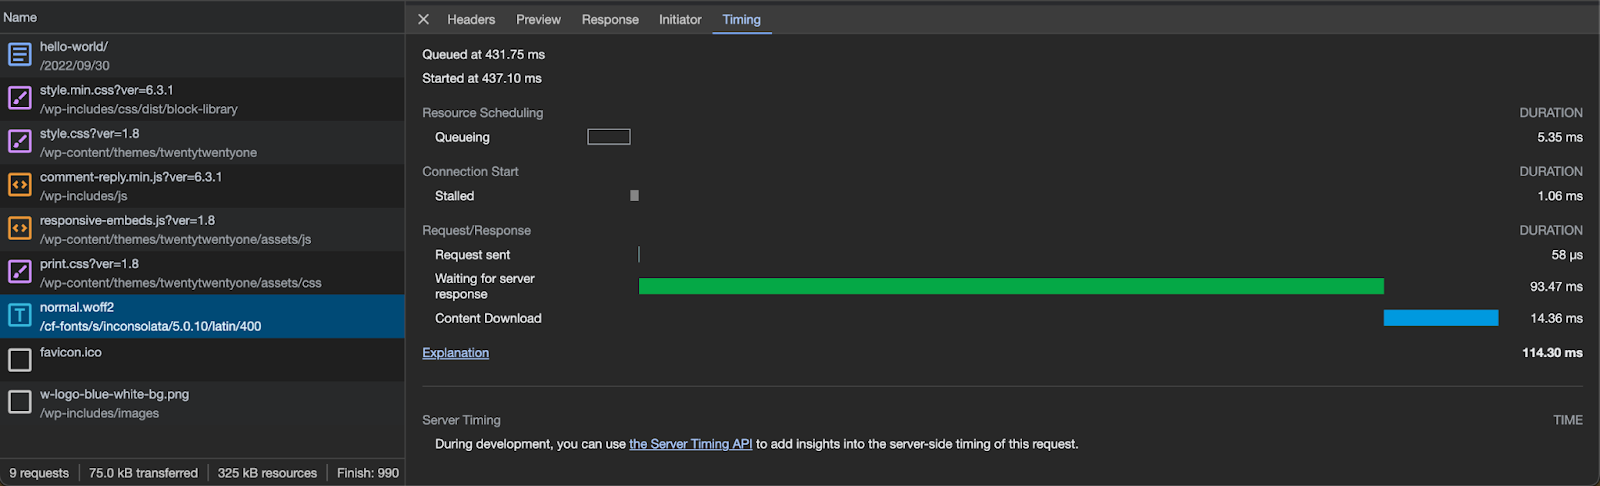
Additionally, you can notice that the timings section in the browser no longer needs an extra DNS lookup for the hostname or the setup of a TLS connection. This happens because the content is served from your hostname, and the browser has already cached the DNS response and has an open TLS connection.
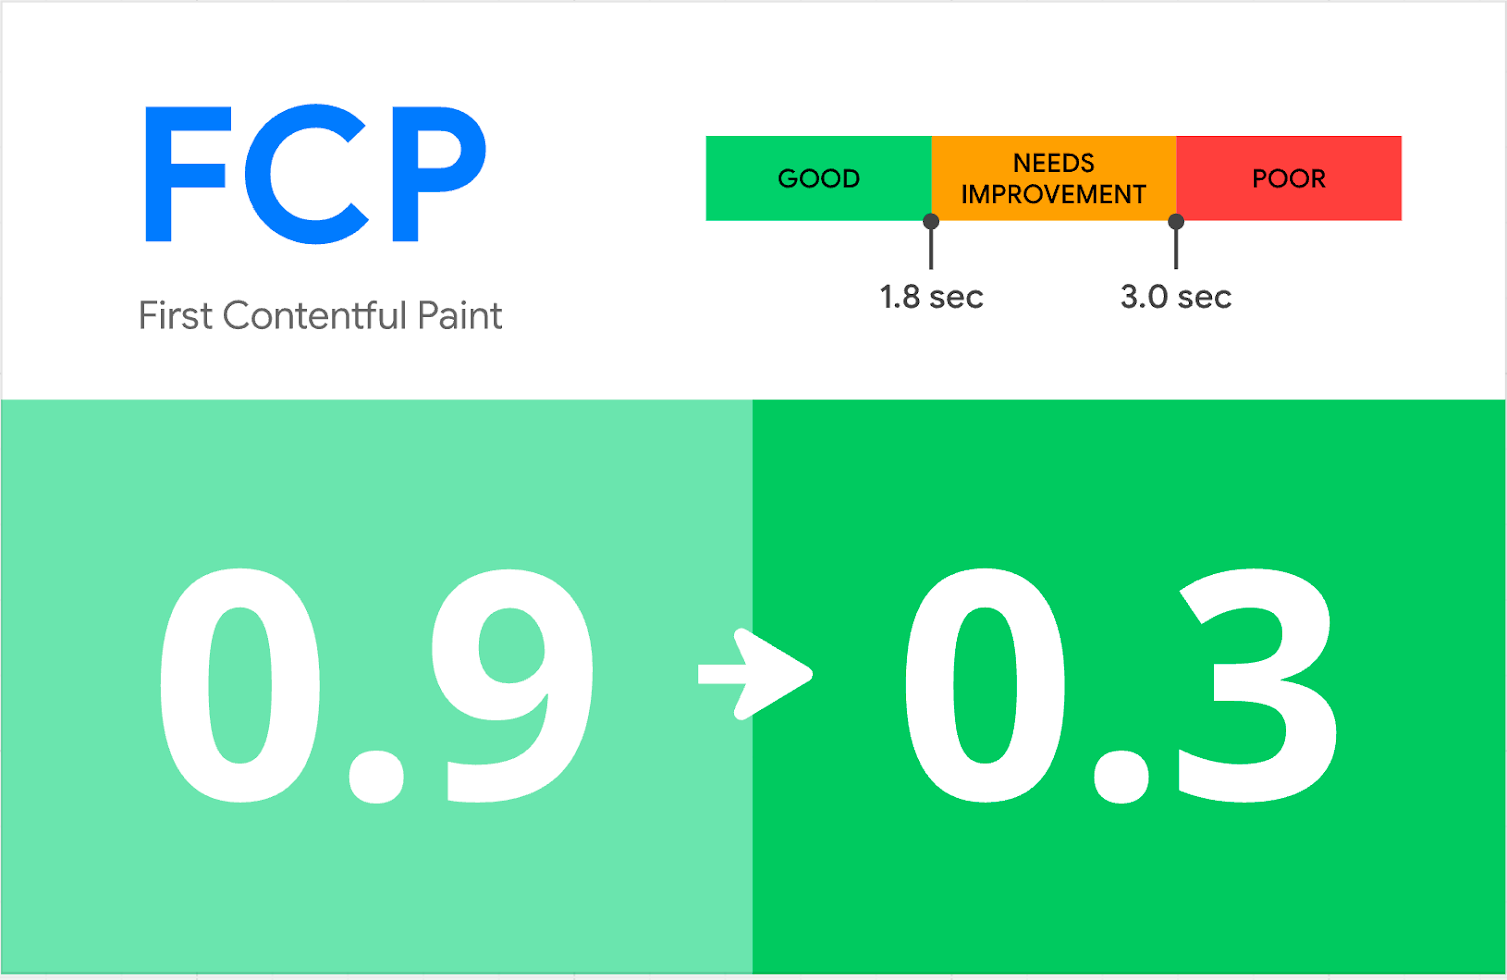
Finally, you can see the real-world performance benefits of Cloudflare Fonts. We conducted synthetic Google Lighthouse tests before enabling Cloudflare Fonts on a straightforward page that displays text. First Contentful Paint (FCP), which represents the time it takes for the first content element to appear on the page, was measured at 0.9 seconds in the Google fonts tests. After enabling Cloudflare Fonts, the First Contentful Paint (FCP) was reduced to 0.3 seconds, and our overall Lighthouse performance score improved from 98 to a perfect 100 out of 100.
Making Cloudflare Fonts fast with ROFL
In order to make Cloudflare Fonts this performant, we needed to make blazing-fast HTML alterations as responses stream through Cloudflare’s network. This has been made possible by leveraging one of Cloudflare’s more recent technologies.
Earlier this year, we finished rewriting one of Cloudflare's oldest components, which played a crucial role in dynamically altering HTML content. But as described in this blog post, a new solution was required to replace the old – A memory-safe solution, able to scale to Cloudflare’s ever-increasing load.
This new module is known as ROFL (Response Overseer for FL). It now powers various Cloudflare products that need to alter HTML as it streams, such as Email Obfuscation, Rocket Loader, and HTML Minification.
ROFL was developed entirely in Rust. This decision was driven by Rust's memory safety, performance, and security. The memory-safety features of Rust are indispensable to ensure airtight protection against memory leaks while we process a staggering volume of requests, measuring in the millions per second. Rust's compiled nature allows us to finely optimize our code for specific hardware configurations, delivering impressive performance gains compared to interpreted languages.
ROFL paved the way for the development of Cloudflare Fonts. The performance of ROFL allows us to rewrite HTML on-the-fly and modify the Google Fonts links quickly, safely and efficiently. This speed helps us reduce any additional latency added by processing the HTML file and improve the performance of your website.
Unlock the power of Cloudflare Fonts today! 🚀
Cloudflare Fonts will be available to all Cloudflare customers in October. If you're using Google Fonts, you will be able to supercharge your site's privacy and speed. By enabling this feature, you can seamlessly enhance your website's performance while safeguarding your user’s privacy.
Today, we are excited to announce Cloudflare Trace! Cloudflare Trace is available to all our customers. Cloudflare Trace enables you to understand how HTTP requests traverse your zone's configuration and what Cloudflare Rules are being applied to the request.
For many Cloudflare customers, the journey their customers' traffic embarks on through the Cloudflare ecosystem was a mysterious black box. It's a complex voyage, routed through various products, each capable of introducing modification to the request.
Consider this scenario: your web traffic could get blocked by WAF Custom Rules or Managed Rules (WAF); it might face rate limiting, or undergo modifications via Transform Rules, Where a Cloudflare account has many admins, modifying different things it can be akin to a game of "hit and hope," where the outcome of your web traffic's journey is uncertain as you are unsure how another admins rule will impact the request before or after yours. While Cloudflare's individual products are designed to be intuitive, their interoperation, or how they work together, hasn't always been as transparent as our customers need it to be. Cloudflare Trace changes this.
Running a trace
Cloudflare Trace allows users to set a number of request variables, allowing you to tailor your trace precisely to your needs. A basic trace will require users to define two settings. A URL that is being proxied through Cloudflare and an HTTP method such as GET. However, customers can also set request headers, add a request body and even set a bot score to allow users to validate the correct behavior of their security rules.
Once a trace is initiated, the dashboard returns a visualization of the products that were matched on a request, such as Configuration Rules, Transform Rules, and Firewall Rules, along with the specific rules inside these phases that were applied. Customers can then view further details of the filters and actions the specific rule undertakes. Clicking the rule id will take you directly to that specific rule in the Cloudflare Dashboard, allowing you to edit filters and actions if needed.
The user interface also generates a programmatic version of the trace that can be used by customers to run traces via a command line. This enables customers to use tools like jq to further investigate the extensive details returned via the trace output.
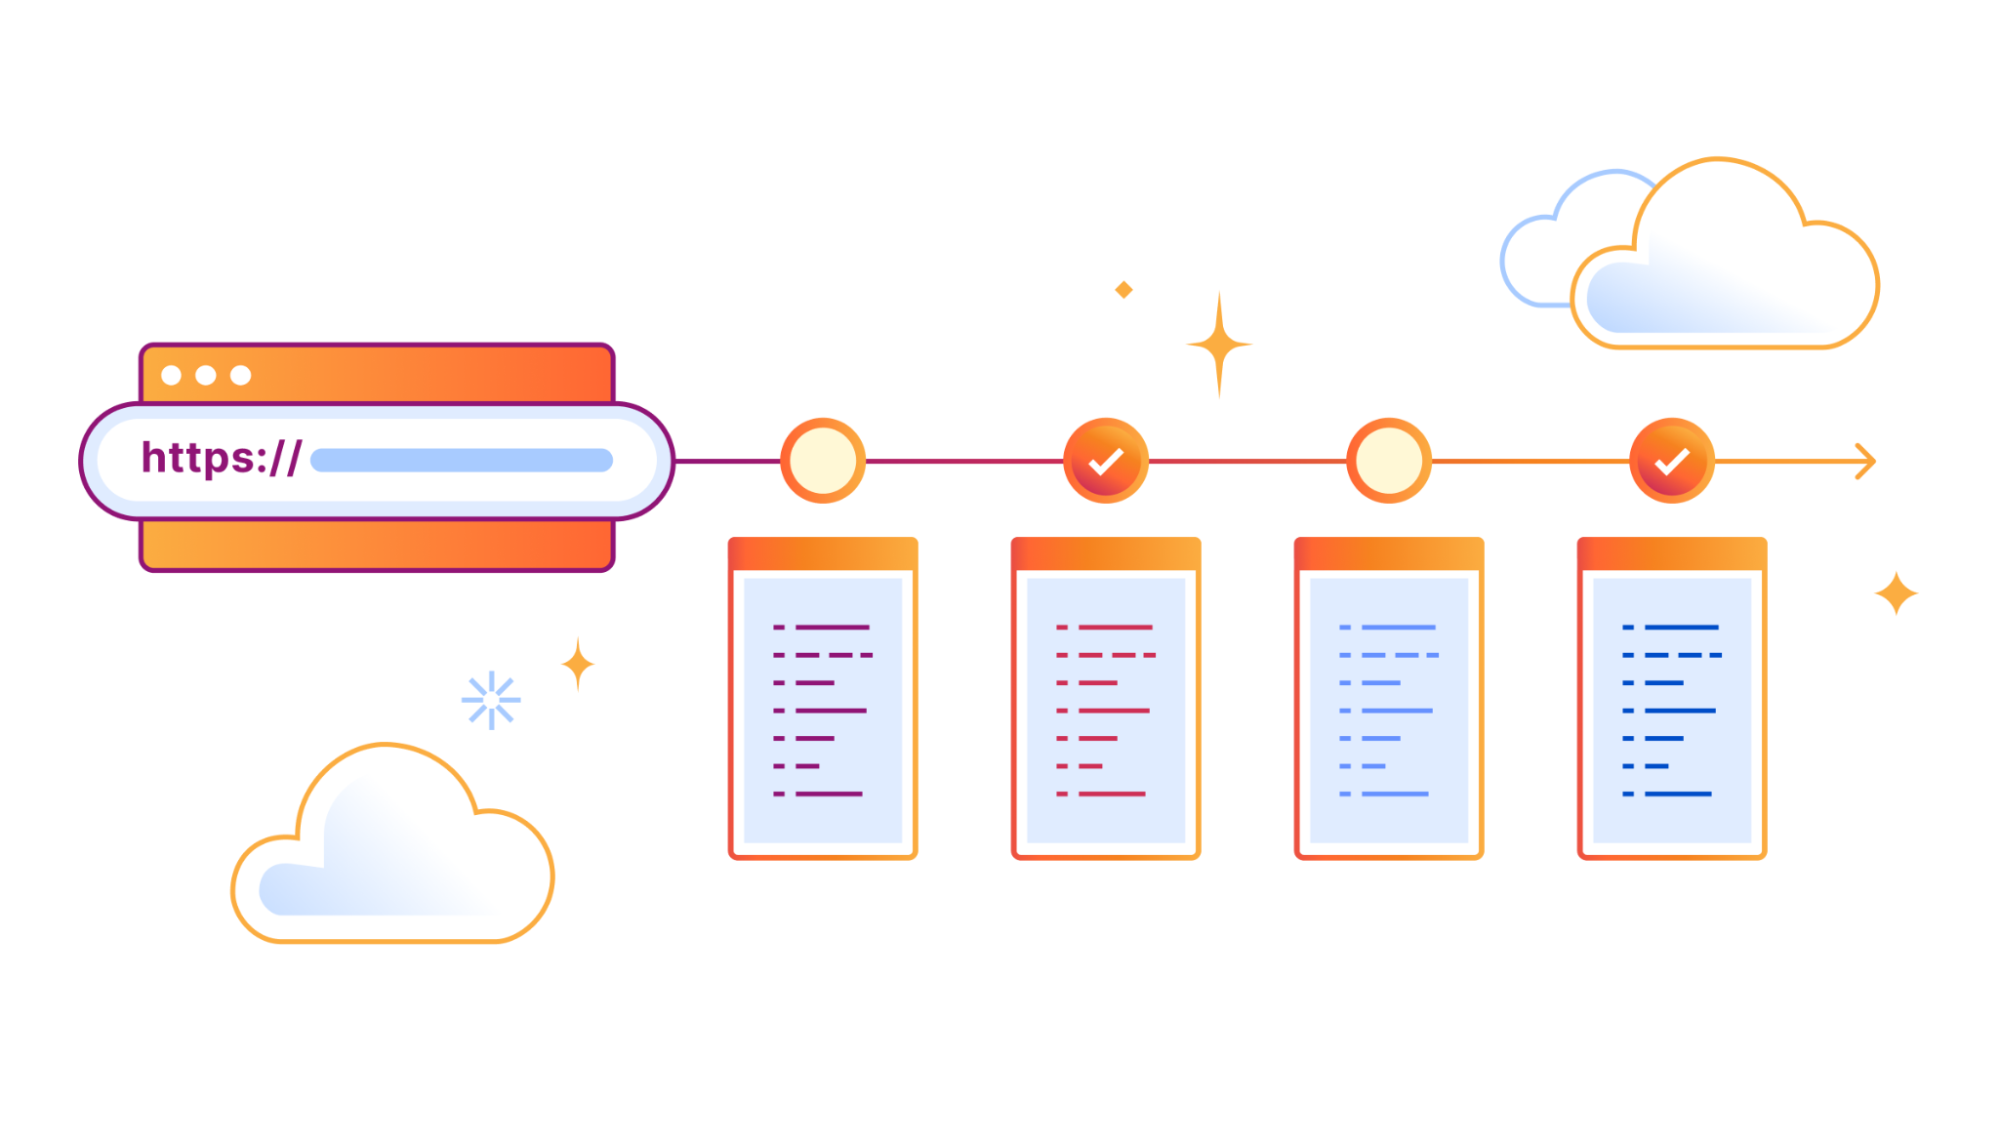
The life of a Cloudflare request
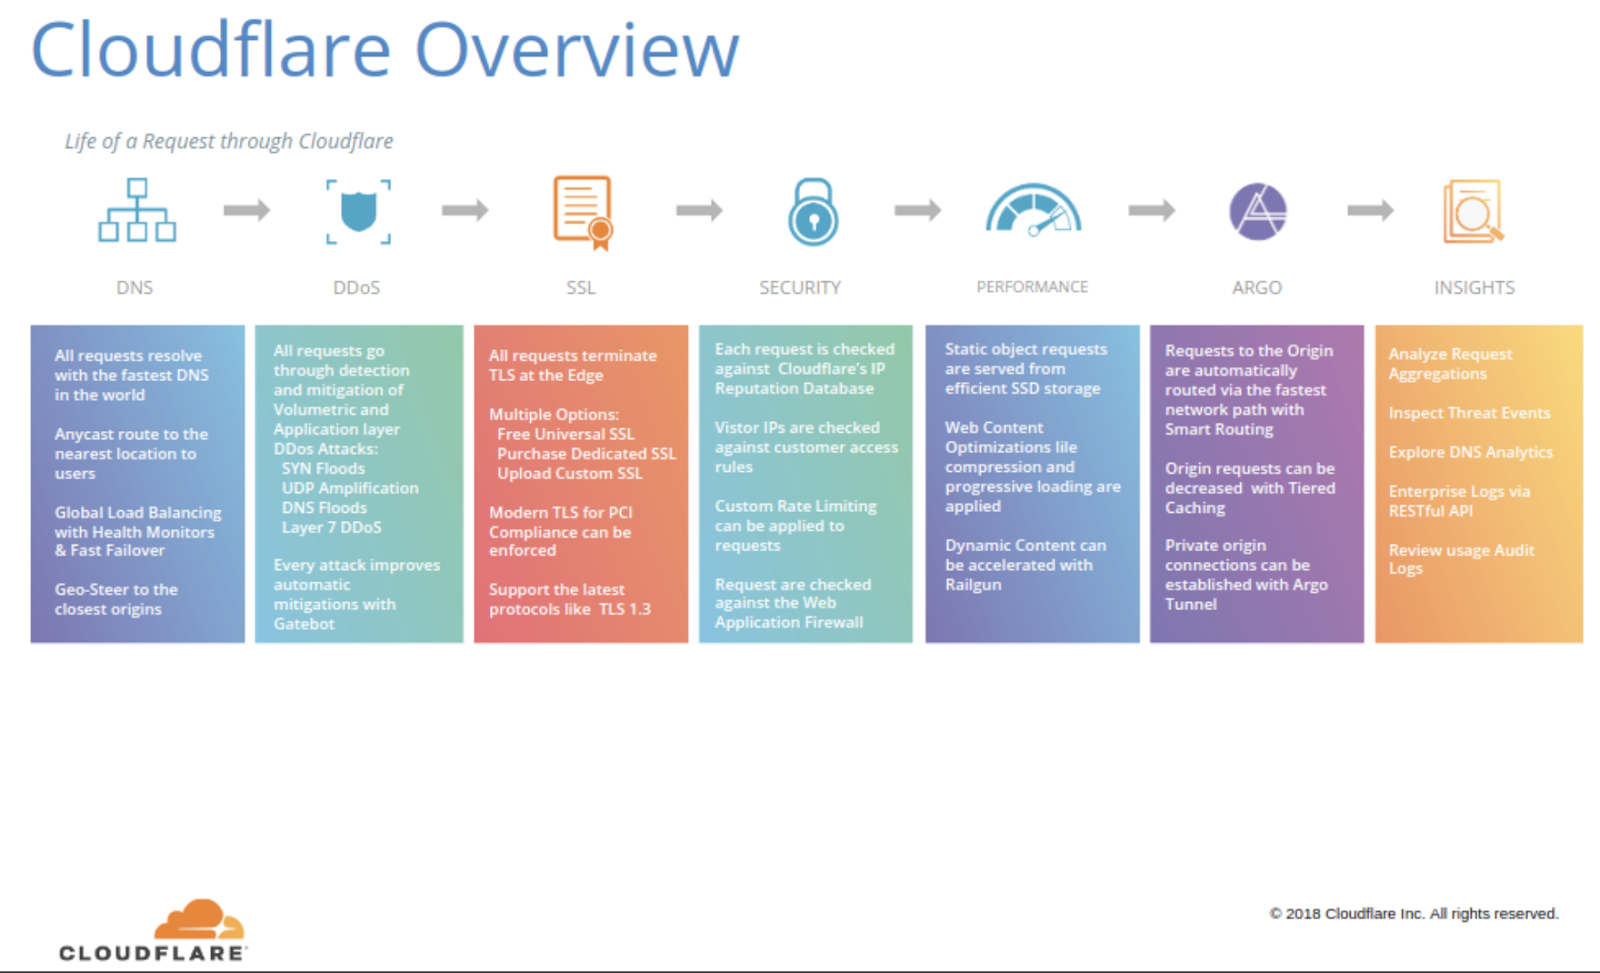
Understanding the intricate journey that your traffic embarks on within Cloudflare can be a challenging task for many of our customers and even for Cloudflare employees. This complexity often leads to questions within our Cloudflare Community or direct inquiries to our support team. Internally, over the past 13 years at Cloudflare, numerous individuals have attempted to explain this journey through diagrams. We maintain an internal Wiki page titled 'Life of a Request Museum.' This page archives all the attempts made over the years by some of the first Cloudflare engineers, heads of product, and our marketing team, where the following image was used in our 2018 marketing slides.
The "problem" (a rather positive one) is that Cloudflare is innovating so rapidly. New products are being added, code is removed, and existing products are continually enhanced. As a result, a diagram created just a few weeks ago can quickly become outdated and challenging to keep up to date.
Finding a happy medium
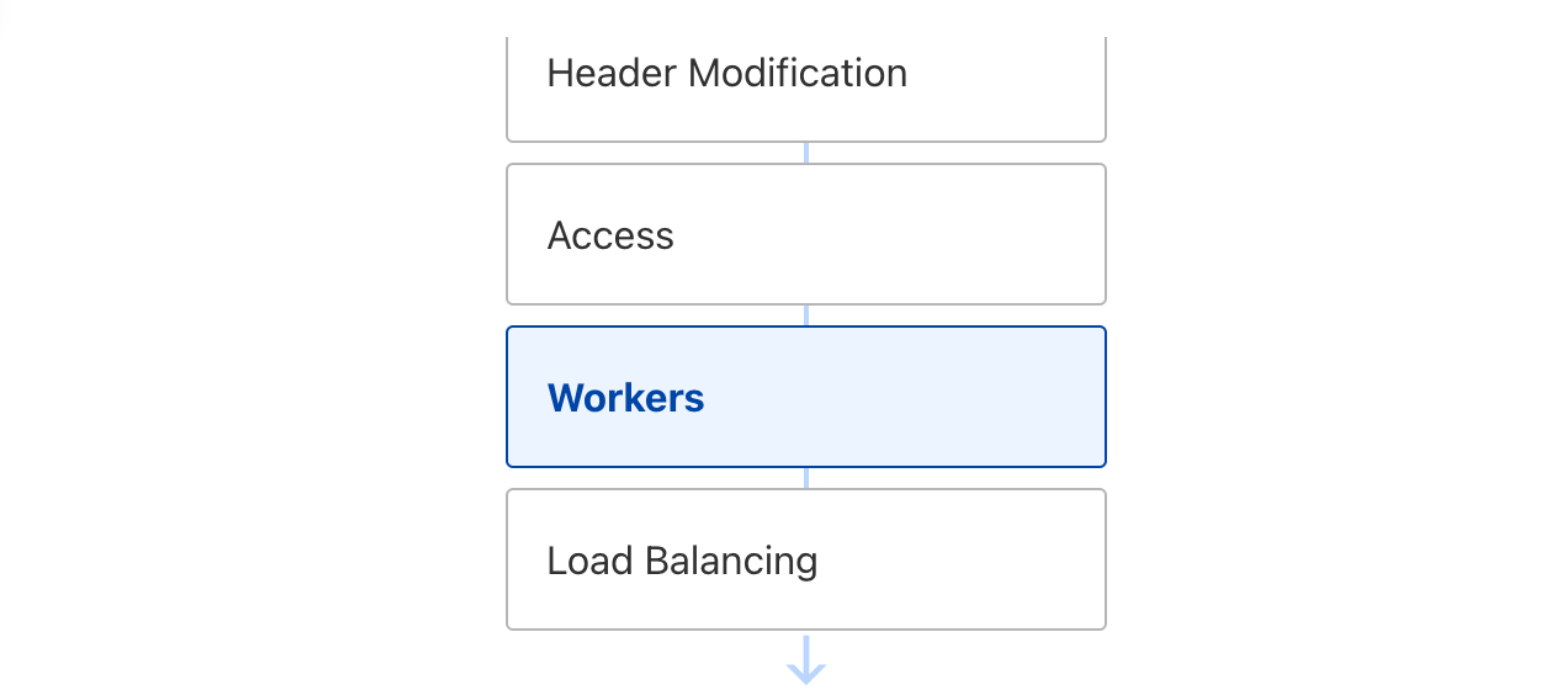
However, customers still want to understand, “The life of a request.” Striking the ideal balance between providing just enough detail without overwhelming our users posed a problem akin to the Goldilocks principle. One of our first attempts to detail the ordering of Cloudflare products was Traffic Sequence, a straightforward dashboard illustration that provides a basic, high-level overview of the interactions between Cloudflare products. While it does not detail every intricacy, it helps our customers understand the order and flow of products that interacted with an HTTP request and was a welcome addition to the Cloudflare dashboard.
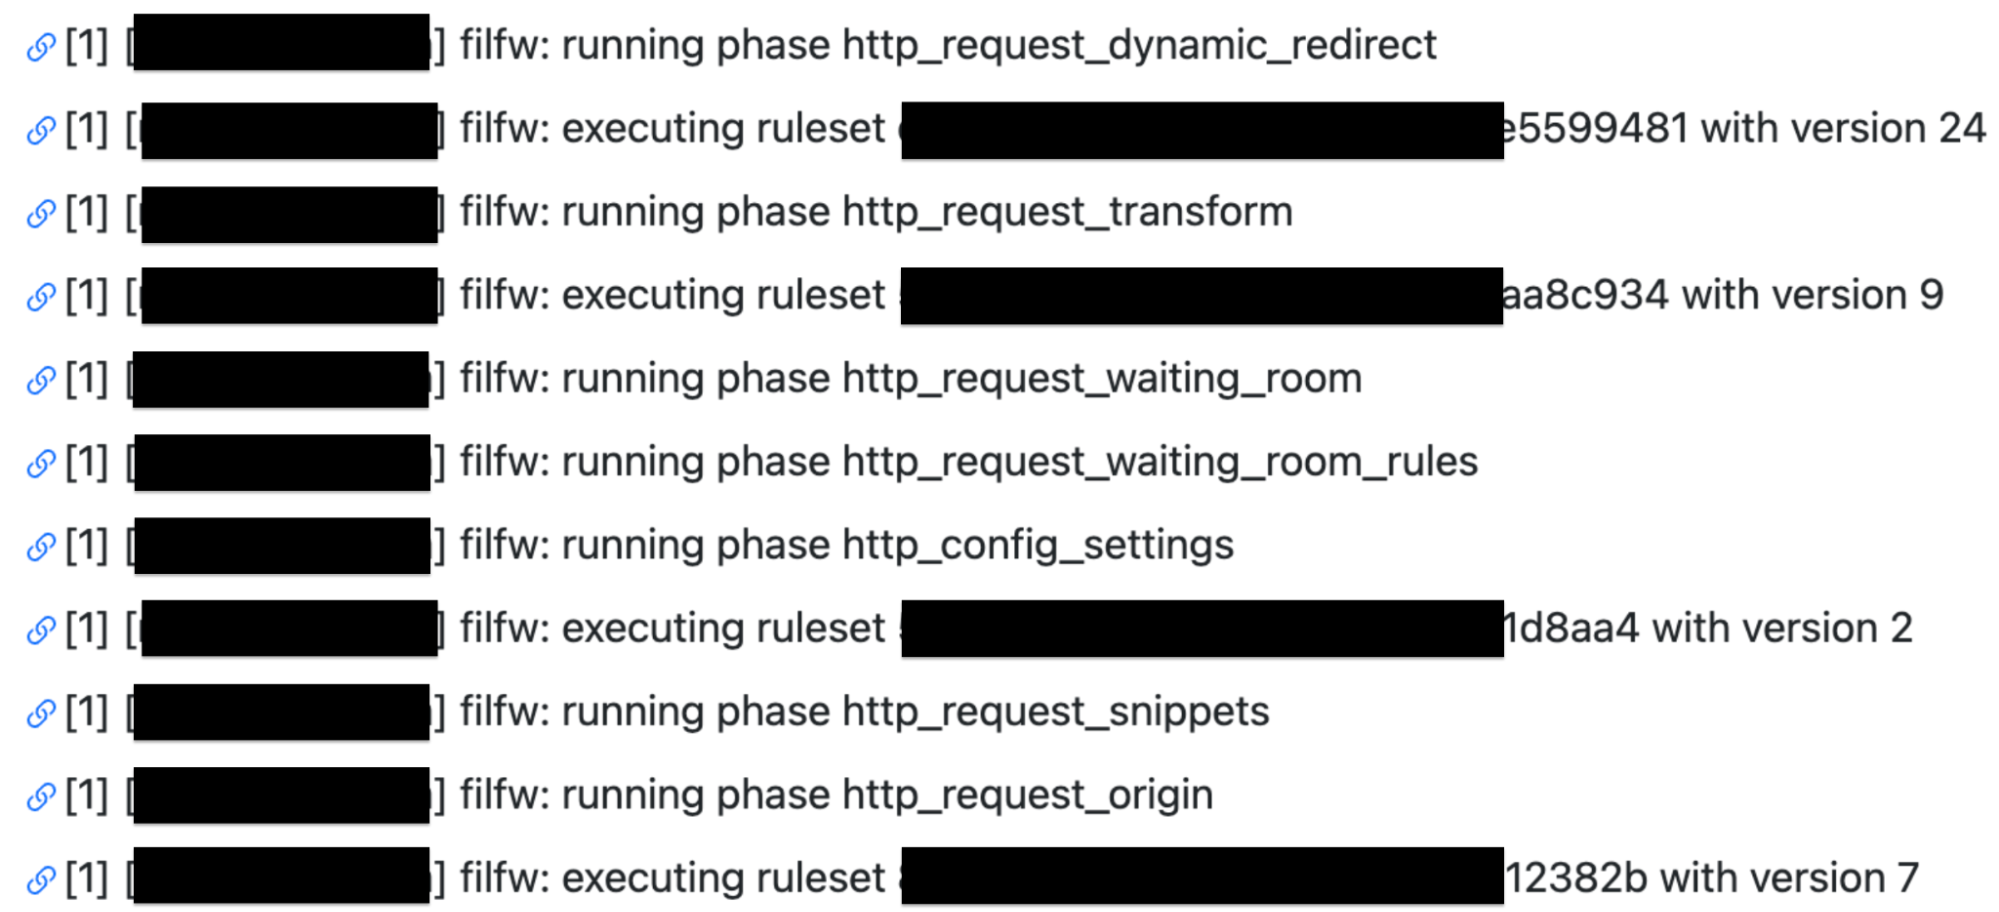
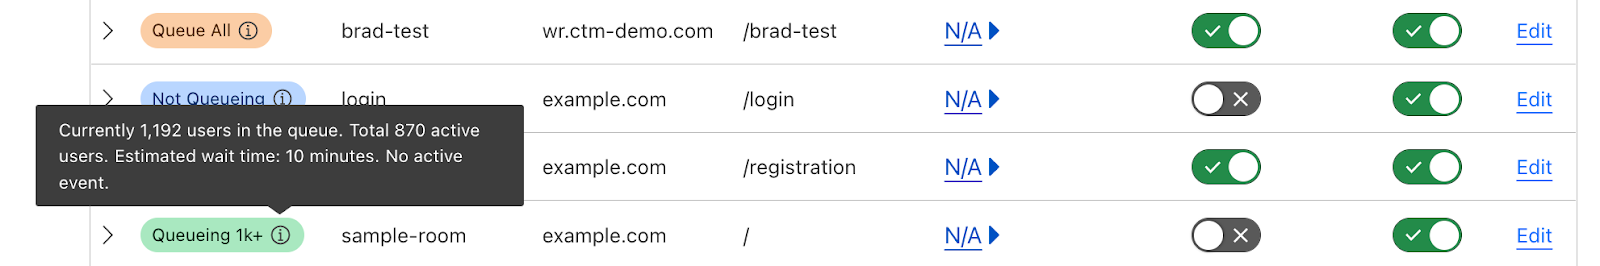
However, customers still requested further insights and details. Especially around debugging issues. Internally Cloudflare teams utilize a number of self created products to trace a request. One of these products is Flute. This product gives a verbose output of all rules, Cloudflare features and codepaths a request undertakes. This allows our engineers and support teams to investigate an issue and identify if something is awry. For example in the following Flute trace image you can see how a request for my domain is evaluated against Single Redirects, Waiting Room, Configuration Settings, Snippets and Origin Rules.
The Flute tool became one of the key focal points in the development of Cloudflare Trace. However, it can be quite intricate and packed with extensive details, potentially leading to more questions than solutions if copied verbatim and exposed to our customers.
To understand the happy medium in developing Cloudflare Trace. We closely collaborated with our Support team to gain a deeper understanding of the challenges our customers faced specifically around Cloudflare Rulesets. The primary challenge centered around understanding which rules were applicable to specific requests. Customers often raised queries, and in certain instances, these inquiries had to be escalated for further investigation into the reasons behind a request's specific behavior. By empowering our customers to independently investigate and comprehend these issues, we identified a second area where Cloudflare Trace proves invaluable—by reducing the workload of our support team and enabling them to operate more efficiently while focusing on other support tickets.
For customers encountering genuine problems, they have the capability to export the JSON response of a trace, which can then be directly uploaded to a support ticket. This streamlined process significantly reduces the time required to investigate and resolve support tickets.
Trace examples
Cloudflare Trace has been available via API for the last nine months. We have been working with a number of customers and stakeholders to understand where tracing is beneficial and solving customer problems. Here are some of the real world examples that we have solved using Cloudflare Trace.
Transform Rules inconsistently matching
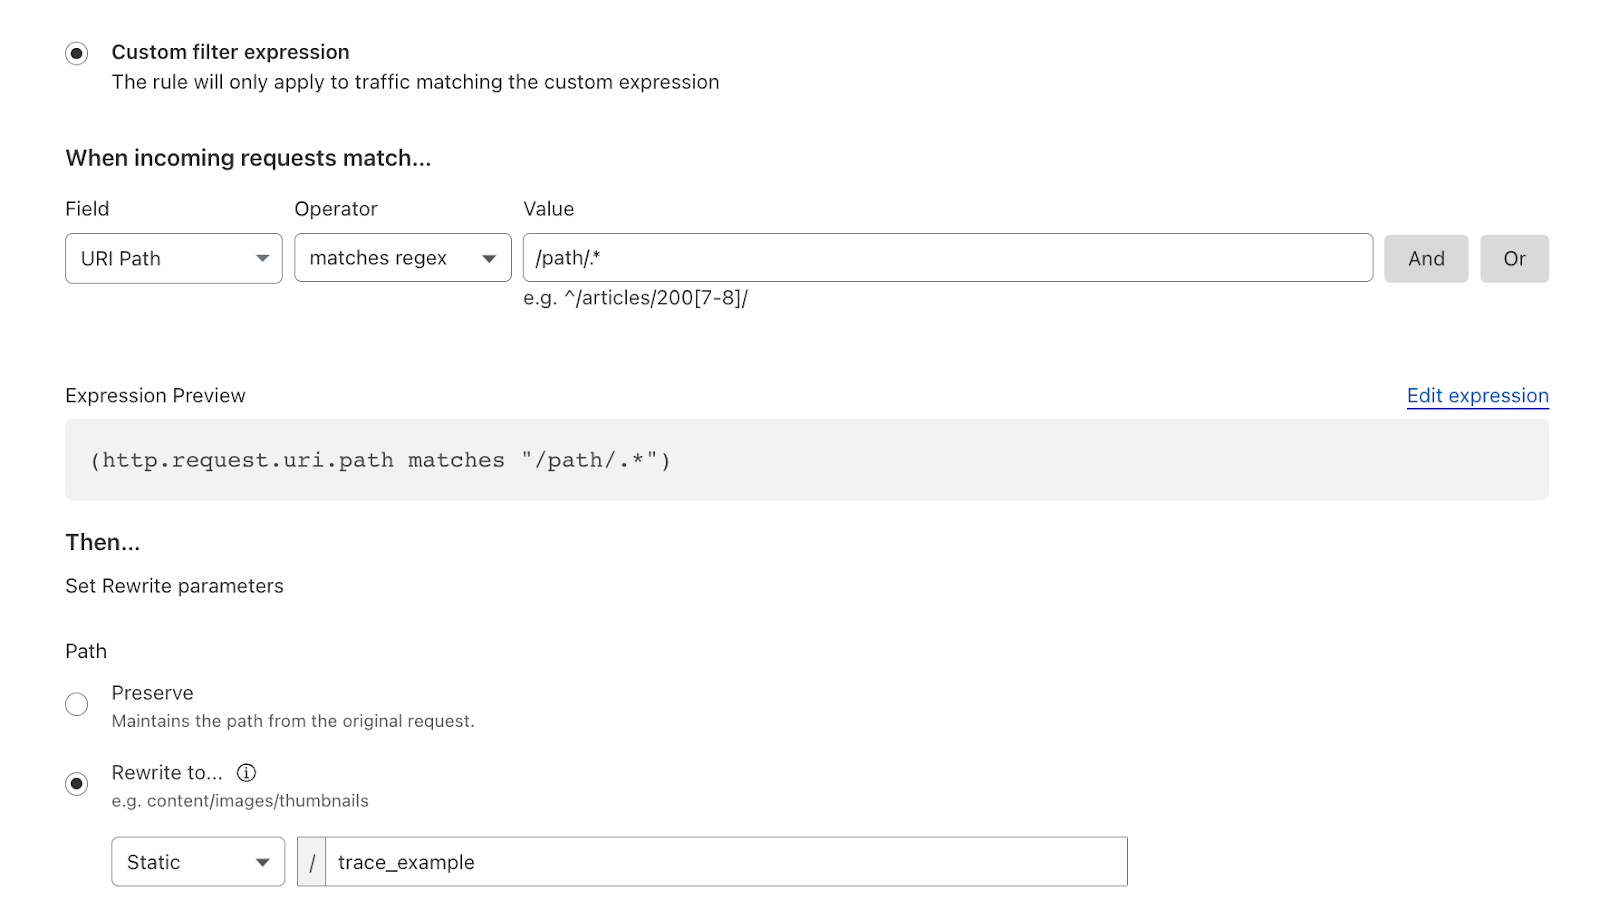
A customer encountered an issue while attempting to rewrite a URL to their origin for specific paths using Transform rules. The Cloudflare account created a filter that employed regex to match against a specific path.
A systems administrator monitoring their web server observed in their logs that the URLs for a small percentage of requests were not transforming correctly, causing disruptions to the application. They decided to investigate by comparing a correctly functioning request with one that was not, and subsequently conducted traces.
In the problematic trace, only one rule matched the trace parameters and was setting incorrect parameters.
Whereas on the other URL the rule that contained the regex matched as intended and set the correct URL parameters.
This allowed the sysadmin to pinpoint the problem: the regex was specifically designed to handle requests with subdirectories, but it failed to address cases where requests directly targeted the root or a non-subdirectory path. After identifying this issue within the traces, the sysadmin updated the filter. Subsequently, both cases matched successfully, leading to the resolution of the problem.
What origin?
When a request encounters a Cloudflare ruleset, such as Origin Rules, all the rules are evaluated, and any rule that is matched is applied in sequential order of priority. This means that multiple settings could be applied from different rules. For example, a Host Header could be set in rule 1, and a DNS origin could be assigned in rule 3. This means that the request will exit the Origin Rules phase with a new Host Header and be routed to a different origin. Cloudflare Trace allows users to easily see all the rules that matched and altered the request.
Tracing the future
Cloudflare Trace will be available to all our customers over this coming week. And located within the Account section of your Cloudflare Dashboard for all plans. We are excited to introduce additional features and products to Cloudflare Trace in the coming months. In the future will also be developing scheduling and alerts, which will enable you to monitor if a newly deployed rule is impacting the critical path of your application. As with all our products, we value your feedback. Within the Trace dashboard, you'll find a form for providing feedback and feature requests to help us enhance the product before its general release.
Having been at Cloudflare since it was tiny it’s hard to believe that we’re hitting our teens! But here we are 13 years on from launch. Looking back to 2010 it was the year of iPhone 4, the first iPad, the first Kinect, Inception was in cinemas, and TiK ToK was hot (well, the Kesha song was). Given how long ago all that feels, I'd have a hard time predicting the next 13 years, so I’ll stick to predicting the future by creating it (with a ton of help from the Cloudflare team).
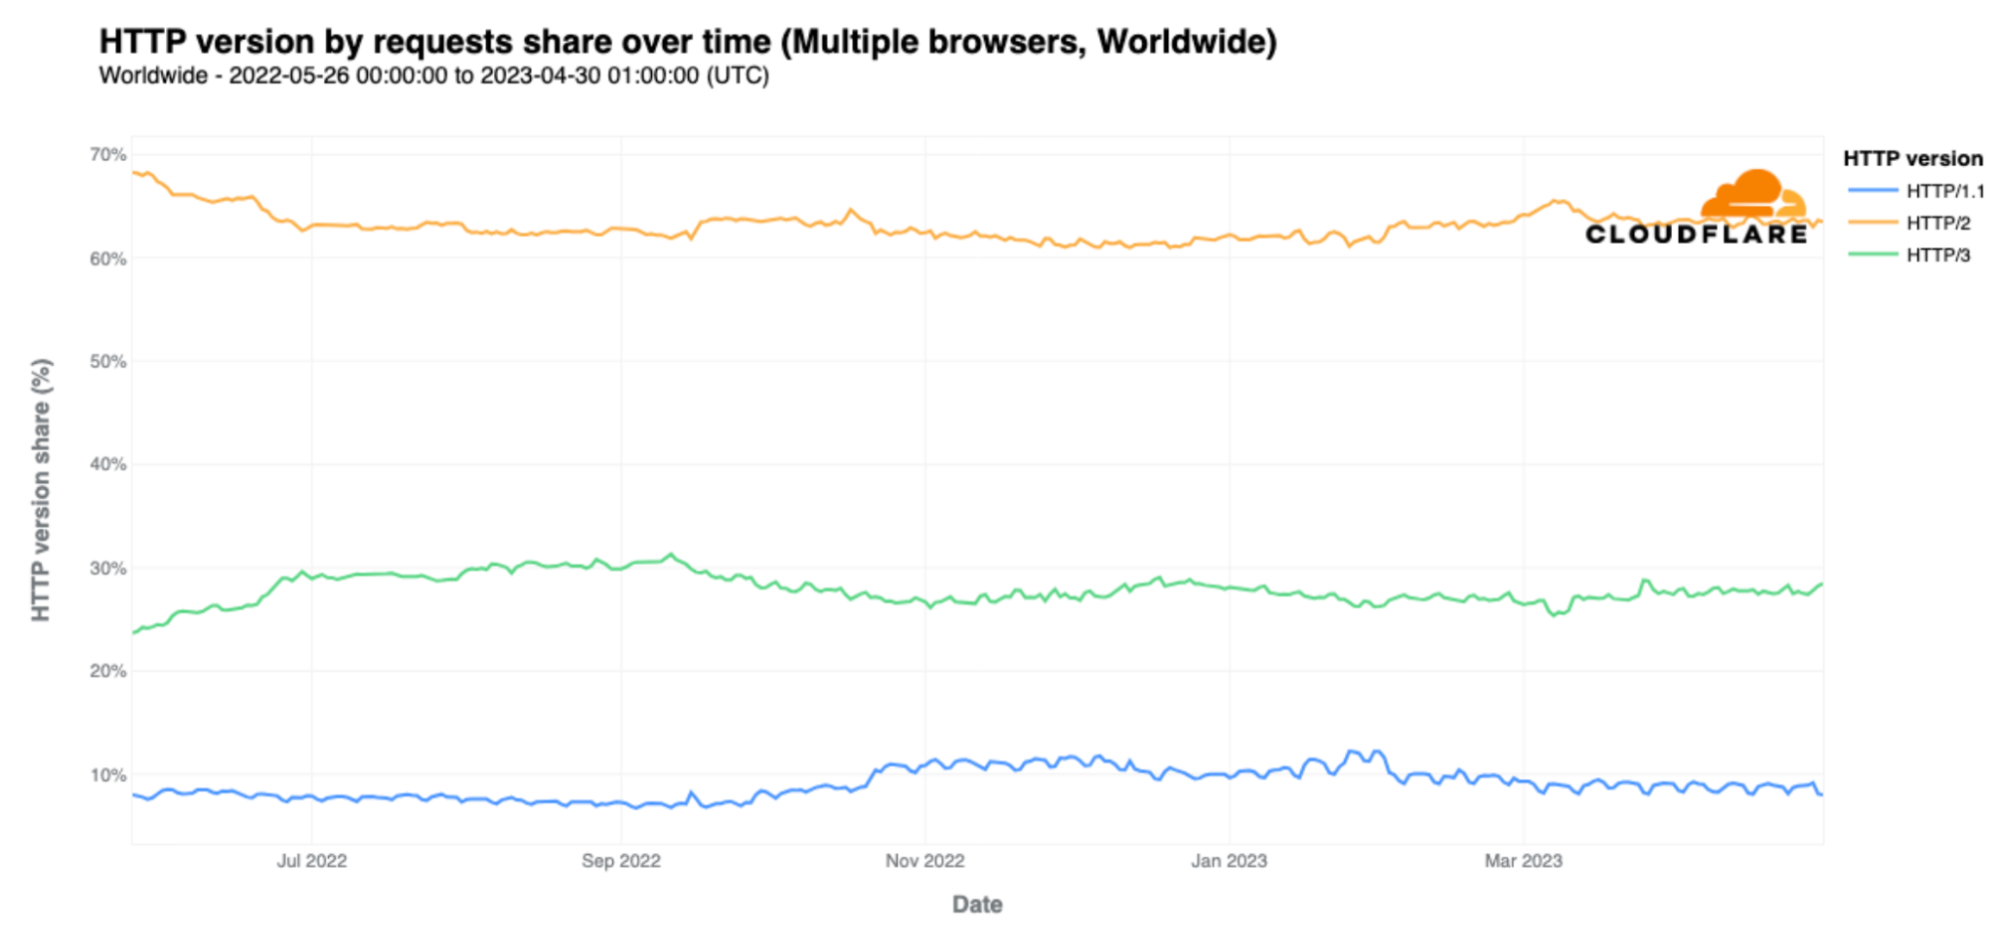
Building the future is, in part, what Birthday Week is about. Over the past 13 years we’ve announced things like Universal SSL (doubling the size of the encrypted web overnight and helping to usher in the largely encrypted web we all use; Cloudflare Radar shows that worldwide 99% of HTTP requests are encrypted), or Cloudflare Workers (helping change the way people build and scale applications), or unmetered DDoS protection (to help with the scourge of DDoS).
This year will be no different.
Winding back to the year I joined Cloudflare we made our first Birthday Week announcement: our automatic IPv6 gateway. Fast-forward to today and Cloudflare Radar says that 37% of connections to Cloudflare use IPv6, so this year there’s a special offer to help make IPv6 ever more widespread and counter those who’d try to bind us to IPv4. So let’s build an IPv6 future together.
Last year we announced Turnstile, our privacy-preserving replacement for CAPTCHAs. This year we’ll be closing a big privacy hole in the encrypted Internet and showing how cryptography can be used to make measurements anonymous and private. Plus even more encrypted, anonymous connections from your computer to the Internet. And there’s more on what’s next for Turnstile itself, and helping make fonts faster and more private too. So let’s build a privacy-preserving Internet together.
AI, of course, is a huge topic and one quarter of all this week's blog posts are about AI, machine learning, GPUs, and all things building, managing, and measuring applications that use AI and machine learning. If it’s not obvious already, it will be after this week: the future involves AI everywhere, on device, in the cloud, and deep inside the Cloudflare global network.
Cloudflare WARP wasn’t a Birthday Week announcement (it was one of our April 1 releases like 1.1.1.1) but this year we’ll be switching from Star Trek to Star Wars with a new product called Hyperdrive. You’ll have to wait until Thursday to read all about it. But if you love databases, you’ll want to make the jump to lightspeed with us.
Speaking of speed… speed! It’s not all AI, privacy, and cool products. We also need to continue our mission to explore strange new worlds help make everyone’s use of the Internet faster. So, we’ll update you on our network performance, talk about how we keep our network running smoothly in face of ever-changing Internet weather, help you stream with low latency, and use caching in new smart ways.
Lastly, we’ll be talking about the impact of Cloudflare on the climate and our climate commitments. Helping with climate change is yet another thing we need to do together.
And, of course, there’s much more than just that. But I wouldn’t want to spoil the birthday surprise by unwrapping the blogs early.
Data continues to explode in volume, variety, and velocity, and security teams at organizations of all sizes are challenged to keep up. Businesses face escalating risks posed by varied SaaS environments, the emergence of generative artificial intelligence (AI) tools, and the exposure and theft of valuable source code continues to keep CISOs and Data Officers up at night.
Over the past few years, Cloudflare has launched capabilities to help organizations navigate these risks and gain visibility and controls over their data — including the launches of our data loss prevention (DLP) and cloud access security broker (CASB) services in the fall of 2022.
Announcing Cloudflare One’s data protection suite
Today, we are building on that momentum and announcing Cloudflare One for Data Protection — our unified suite to protect data everywhere across web, SaaS, and private applications. Built on and delivered across our entire global network, Cloudflare One’s data protection suite is architected for the risks of modern coding and increased usage of AI.
A separate blog post published today looks back on what technologies and features we delivered over the past year and previews new functionality that customers can look forward to.
In this blog, we focus more on what impact those technologies and features have for customers in addressing modern data risks — with examples of practical use cases. We believe that Cloudflare One is uniquely positioned to deliver better data protection that addresses modern data risks. And by “better,” we mean:
Helping security teams be more effective protecting data by simplifying inline and API connectivity together with policy management
Helping employees be more productive by ensuring fast, reliable, and consistent user experiences
Helping organizations be more agile by innovating rapidly to meet evolving data security and privacy requirements
Harder than ever to secure data
Data spans more environments than most organizations can keep track of. In conversations with customers, three distinctly modern risks stick out:
The growing diversity of cloud and SaaS environments: The apps where knowledge workers spend most of their time — like cloud email inboxes, shared cloud storage folders and documents, SaaS productivity and collaboration suites like Microsoft 365 — are increasingly targeted by threat actors for data exfiltration.
Emerging AI tools: Business leaders are concerned about users oversharing sensitive information with opaque large language model tools like ChatGPT, but at the same time, want to leverage the benefits of AI.
Source code exposure or theft: Developer code fuels digital business, but that same high-value source code can be exposed or targeted for theft across many developer tools like GitHub, including in plain sight locations like public repositories.
These latter two risks, in particular, are already intersecting. Companies like Amazon, Apple, Verizon, Deutsche Bank, and more are blocking employees from using tools like ChatGPT for fear of losing confidential data, and Samsung recently had an engineer accidentally upload sensitive code to the tool. As organizations prioritize new digital services and experiences, developers face mounting pressure to work faster and smarter. AI tools can help unlock that productivity, but the long-term consequences of oversharing sensitive data with these tools is still unknown.
All together, data risks are only primed to escalate, particularly as organizations accelerate digital transformation initiatives with hybrid work and development continuing to expand attack surfaces. At the same time, regulatory compliance will only become more demanding, as more countries and states adopt more stringent data privacy laws.
Traditional DLP services are not equipped to keep up with these modern risks. A combination of high setup and operational complexity plus negative user experiences means that, in practice, DLP controls are often underutilized or bypassed entirely. Whether deployed as a standalone platform or integrated into security products or SaaS applications, DLP products can often become expensive shelfware. And backhauling traffic through on-premise data protection hardware – whether, DLP, firewall and SWG appliances, or otherwise — create costs and slow user experiences that hold businesses back in the long run.
Figure 1: Modern data risks
How customers use Cloudflare for data protection
Today, customers are increasingly turning to Cloudflare to address these data risks, including a Fortune 500 natural gas company, a major US job site, a regional US airline, an Australian healthcare company and more. Across these customer engagements, three use cases are standing out as common focus areas when deploying Cloudflare One for data protection.
Use case #1: Securing AI tools and developer code (Applied Systems)
Applied Systems, an insurance technology & software company, recently deployed Cloudflare One to secure data in AI environments.
Specifically, the company runs the public instance of ChatGPT in an isolated browser, so that the security team can apply copy-paste blocks: preventing users from copying sensitive information (including developer code) from other apps into the AI tool. According to Chief Information Security Officer Tanner Randolph, “We wanted to let employees take advantage of AI while keeping it safe.”
This use case was just one of several Applied Systems tackled when migrating from Zscaler and Cisco to Cloudflare, but we see a growing interest in securing AI and developer code among our customers.
Use case #2: Data exposure visibility
Customers are leveraging Cloudflare One to regain visibility and controls over data exposure risks across their sprawling app environments. For many, the first step is analyzing unsanctioned app usage, and then taking steps to allow, block, isolate, or apply other controls to those resources. A second and increasingly popular step is scanning SaaS apps for misconfigurations and sensitive data via a CASB and DLP service, and then taking prescriptive steps to remediate via SWG policies.
A UK ecommerce giant with 7,5000 employees turned to Cloudflare for this latter step. As part of a broader migration strategy from Zscaler to Cloudflare, this company quickly set up API integrations between its SaaS environments and Cloudflare’s CASB and began scanning for misconfigurations. Plus, during this integration process, the company was able to sync DLP policies with Microsoft Pureview Information Protection sensitivity labels, so that it could use its existing framework to prioritize what data to protect. All in all, the company was able to begin identifying data exposure risks within a day.
Use case #3: Compliance with regulations
Comprehensive data regulations like GDPR, CCPA, HIPAA, and GLBA have been in our lives for some time now. But new laws are quickly emerging: for example, 11 U.S. states now have comprehensive privacy laws, up from just 3 in 2021. And updates to existing laws like PCI DSS now include stricter, more expansive requirements.
Customers are increasingly turning to Cloudflare One for compliance, in particular by ensuring they can monitor and protect regulated data (e.g. financial data, health data, PII, exact data matches, and more). Some common steps include first, detecting and applying controls to sensitive data via DLP, next, maintaining detailed audit trails via logs and further SIEM analysis, and finally, reducing overall risk with a comprehensive Zero Trust security posture.
Let’s look at a concrete example. One Zero Trust best practice that is increasingly required is multi-factor authentication (MFA). In the payment cards industry, PCI DSS v4.0, which takes effect in 2025, requires that requests to MFA be enforced for every access request to the cardholder data environment, for every user and for every location – including cloud environments, on-prem apps, workstations and more. (requirement 8.4.2). Plus, those MFA systems must be configured to prevent misuse – including replay attacks and bypass attempts – and must require at least two different factors that must be successful (requirement 8.5). To help organizations comply with both of these requirements, Cloudflare helps organizations enforce MFA across all apps and users – and in fact, we use our same services to enforce hard key authentication for our own employees.
Figure 2: Data protection use cases
The Cloudflare difference
Cloudflare One’s data protection suite is built to stay at the forefront of modern data risks to address these and other evolving use cases.
With Cloudflare, DLP is not just integrated with other typically distinct security services, like CASB, SWG, ZTNA, RBI, and email security, but converged onto a single platform with one control plane and one interface. Beyond the acronym soup, our network architecture is really what enables us to help organizations be more effective, more productive, and more agile with protecting data.
We simplify connectivity, with flexible options for you to send traffic to Cloudflare for enforcement. Those options include API-based scans of SaaS suites for misconfigurations and sensitive data. Unlike solutions that require security teams to get full app permissions from IT or business teams, Cloudflare can find risk exposure with read-only app permissions. Clientless deployments of ZTNA to secure application access and of browser isolation to control data within websites and apps are scalable for all users — employees and third-parties like contractors — for the largest enterprises. And when you do want to forward proxy traffic, Cloudflare offers one device client with self-enrollment permissions or wide area network on-ramps across security services. With so many practical ways to deploy, your data protection approach will be effective and functional — not shelfware.
Just like your data, our global network is everywhere, now spanning over 300 cities in over 100 countries. We have proven that we enforce controls faster than vendors like Zscaler, Netskope, and Palo Alto Networks — all with single-pass inspection. We ensure security is quick, reliable, and unintrusive, so you can layer on data controls without disruptive work productivity.
Our programmable network architecture enables us to build new capabilities quickly. And we rapidly adopt new security standards and protocols (like IPv6-only connections or HTTP/3 encryption) to ensure data protection remains effective. Altogether, this architecture equips us to evolve alongside changing data protection use cases, like protecting code in AI environments, and quickly deploy AI and machine learning models across our network locations to enforce higher precision, context-driven detections.
Figure 3: Unified data protection with Cloudflare
How to get started
Modern data risks demand modern security. We feel that Cloudflare One’s unified data protection suite is architected to help organizations navigate their priority risks today and in the future — whether that is securing developer code and AI tools, regaining visibility over SaaS apps, or staying compliant with evolving regulations.
If you’re ready to explore how Cloudflare can protect your data, request a workshop with our experts today.
In the announcement post, we focused on how the data protection suite helps customers navigate modern data risks, with recommended use cases and real-world customer examples.
In this companion blog post, we recap the capabilities built into the Cloudflare One suite over the past year and preview new functionality that customers can look forward to. This blog is best for practitioners interested in protecting data and SaaS environments using Cloudflare One.
DLP & CASB capabilities launched in the past year
Cloudflare launched both DLP and CASB services in September 2022, and since then have rapidly built functionality to meet the growing needs of our organizations of all sizes. Before previewing how these services will evolve, it is worth recapping the many enhancements added in the past year.
Cloudflare’s DLP solution helps organizations detect and protect sensitive data across their environment based on its several characteristics. DLP controls can be critical in preventing (and detecting) damaging leaks and ensuring compliance for regulated classes of data like financial, health, and personally identifiable information.
Improvements to DLP detections and policies can be characterized by three major themes:
Customization: making it easy for administrators to design DLP policies with the flexibility they want.
Deep detections: equipping administrators with increasingly granular controls over what data they protect and how.
Detailed detections: providing administrators with more detailed visibility and logs to analyze the efficacy of their DLP policies.
Cloudflare’s CASB helps organizations connect to, scan, and monitor third-party SaaS applications for misconfigurations, improper data sharing, and other security risks — all via lightweight API integrations. In this way, organizations can regain visibility and controls over their growing investments in SaaS apps.
CASB product enhancements can similarly be summarized by three themes:
Expanding API integrations: Today, our CASB integrates with 18 of the most popular SaaS apps — Microsoft 365 (including OneDrive), Google Workspace (including Drive), Salesforce, GitHub, and more. Setting up these API integrations takes fewer clicks than first-generation CASB solutions, with comparable coverage to other vendors in the Security Services Edge (SSE) space.
Strengthening findings of CASB scans: We have made it easier to remediate the misconfigurations identified by these CASB scans with both prescriptive guides and in-line policy actions built into the dashboard.
Converging CASB & DLP functionality: We started enabling organizations to scan SaaS apps for sensitive data, as classified by DLP policies. For example, this helps organizations detect when credit cards or social security numbers are in Google documents or spreadsheets that have been made publicly available to anyone on the Internet.
This last theme, in particular, speaks to the value of unifying data protection capabilities on a single platform for simple, streamlined workflows. The below table highlights some major capabilities launched since our general availability announcements last September.
Table 1: Select DLP and CASB capabilities shipped since 2022 Q4
After a quick API integration, Cloudflare syncs continuously with the Microsoft Information Protection (MIP) labels you already use to streamline how you build DLP policies.
Administrators can create custom detections using the same regex policy builder used across our entire Zero Trust platform for a consistent configuration experience across services.
Administrators can set minimum thresholds for the number of times a detection is made before an action (like block or log) is triggered. This way, customers can create policies that allow individual transactions but block up/downloads with high volumes of sensitive data.
Context analysis helps reduce false positive detections by analyzing proximity keywords (for example: seeing “expiration date” near a credit card number increases the likelihood of triggering a detection).
Cloudflare now captures more wide-ranging and granular details of DLP-related activity in logs, including payload analysis, file names, and higher fidelity details of individual files. A large percentage of our customers prefer to push these logs to SIEM tools like DataDog and Sumo Logic.
Today, Cloudflare integrates with 18 of the most widely used SaaS apps, including productivity suites, cloud storage, chat tools, and more. API-based scans not only reveal misconfigurations, but also offer built-in HTTP policy creation workflows and step-by-step remediation guides.
Today, organizations can set up CASB to scan every publicly accessible file in Google Workspace for text that matches a DLP profile (financial data, personal identifiers, etc.).
New and upcoming DLP & CASB functionality
Today’s launch of Cloudflare One’s data protection suite crystalizes our commitment to keep investing in DLP and CASB functionality across these thematic areas. Below we wanted to preview a few new and upcoming capabilities on the Cloudflare One’s data protection suite roadmap that will become available in the coming weeks for further visibility and controls across data environments.
Exact data matching with custom wordlists
Already shipped: Exact Data Match, moves from out of beta to general availability, allowing customers to tell Cloudflare’s DLP exactly what data to look for by uploading a dataset, which could include names, phone numbers, or anything else.
Next 30 days: Customers will soon be able to upload a list of specific words, create DLP policies to search for those important keywords in files, and block and log that activity.
How customers benefit: Administrators can be more specific about what they need to protect and save time creating policies by bulk uploading the data and terms that they care most about. Over time, many organizations have amassed long lists of terms configured for incumbent DLP services, and these customizable upload capabilities streamline migration from other vendors to Cloudflare. Just as with all other DLP profiles, Cloudflare searches for these custom lists and keywords within in-line traffic and in integrated SaaS apps.
Detecting source code and health data
Next 30 days: Soon, Clouflare’s DLP will include predefined profiles to detect developer source code and protected health information (PHI). Initially, code data will include languages like Python, Javascript, Java, and C++ — four of the most popular languages today — and PHI data will include medication and diagnosis names — two highly sensitive medical topics.
How customers benefit: These predefined profiles expand coverage to some of the most valuable — and in the case of PHI, one of the most regulated — types of data within an organization.
Converging API-driven CASB & DLP for data-at-rest protections
Next 30 days: Soon, organizations will be able to scan for sensitive data at rest in Microsoft 365 (e.g. OneDrive). API-based scans of these environments will flag, for example, whether credit card numbers, source code, or other data configured via DLP policies reside within publicly accessible files. Administrators can then take prescriptive steps to remediate via in-line CASB gateway policies.
Shipping by the end of the year: Within the next few months, this same integration will be available with GitHub.
How customers benefit: Between the existing Google Workspace integration and this upcoming Microsoft 365 integration, customers can scan for sensitive data across two of the most prominent cloud productivity suites — where users spend much of their time and where large percentages of organizational data lives. This new Microsoft integration represents a continued investment in streamlining security workflows across the Microsoft ecosystem — whether for managing identity and application access, enforcing device posture, or isolating risky users.
The GitHub integration also restores visibility over one of the most critical developer environments that is also increasingly a risk for data leaks. In fact, according to GitGuardian, 10 million hard-coded secrets were exposed in public GitHub commits in 2022, a figure that is up 67% from 2021 and only expected to grow. Preventing source code exposure on GitHub is a problem area our product team regularly hears from our customers, and we will continue to prioritize securing developer environments.
Layering on Zero Trust context: User Risk Score
Next 30 days: Cloudflare will introduce a risk score based on user behavior and activities that have been detected across Cloudflare One’s services. Organizations will be able to detect user behaviors that introduce risk from action like an Impossible Travel anomaly or detections from too many DLP violations in a given period of time. Shortly following the detection capabilities will be the option to take preventative or remediative policy actions, within the wider Cloudflare One suite. In this way, organizations can control access to sensitive data and applications based on changing risk factors and real-time context.
How customers benefit: Today, intensive time, labor, and money are spent on analyzing large volumes of log data to identify patterns of risk. Cloudflare's ‘out-of-the-box’ risk score simplifies that process, helping organizations gain visibility into and lock down suspicious activity with speed and efficiency.
How to get started
These are just some of the capabilities on our short-term roadmap, and we can’t wait to share more with you as the data protection suite evolves. If you’re ready to explore how Cloudflare One can protect your data, request a workshop with our experts today.
Cloudflare Radar was launched in September 2020, almost three years ago, when the pandemic was affecting Internet traffic usage. It is a free tool to show Internet usage patterns from both human and automated systems, as well as attack trends, top domains, and adoption and usage of browsers and protocols. As Cloudflare has been publishing data-driven insights related to the general Internet for more than 10 years now, Cloudflare Radar is a natural evolution.
This year, we have introduced several new features to Radar, also available through our public API, that enables deeper data exploration. We’ve also launched an Internet Quality section, a Trending Domains section, a URL Scanner tool, and a Routing section to track network interconnection, routing security, and observed routing anomalies.
In this reading list, we want to highlight some of those new additions, as well as some of the Internet disruptions and trends we’ve observed and published posts about during this year, including the war in Ukraine, the impact of Easter, and exam-related shutdowns in Iraq and Algeria.
We also encourage everyone to explore Cloudflare Radar and its new features, and to give you a partial review of the year, in terms of Internet insights — our 2023 Year in Review is coming later this year.
New additions to Cloudflare Radar
In 2022, Cloudflare Radar 2.0 was released last September, refreshing the look & feel and building on a new platform that allows us to easily add new features in the future. At that time, we added two new sections:
Cloudflare Radar’s 2022 Year in Review and the related blog were published at the end of the year.
Without further ado, here are some of the new features launched in 2023.
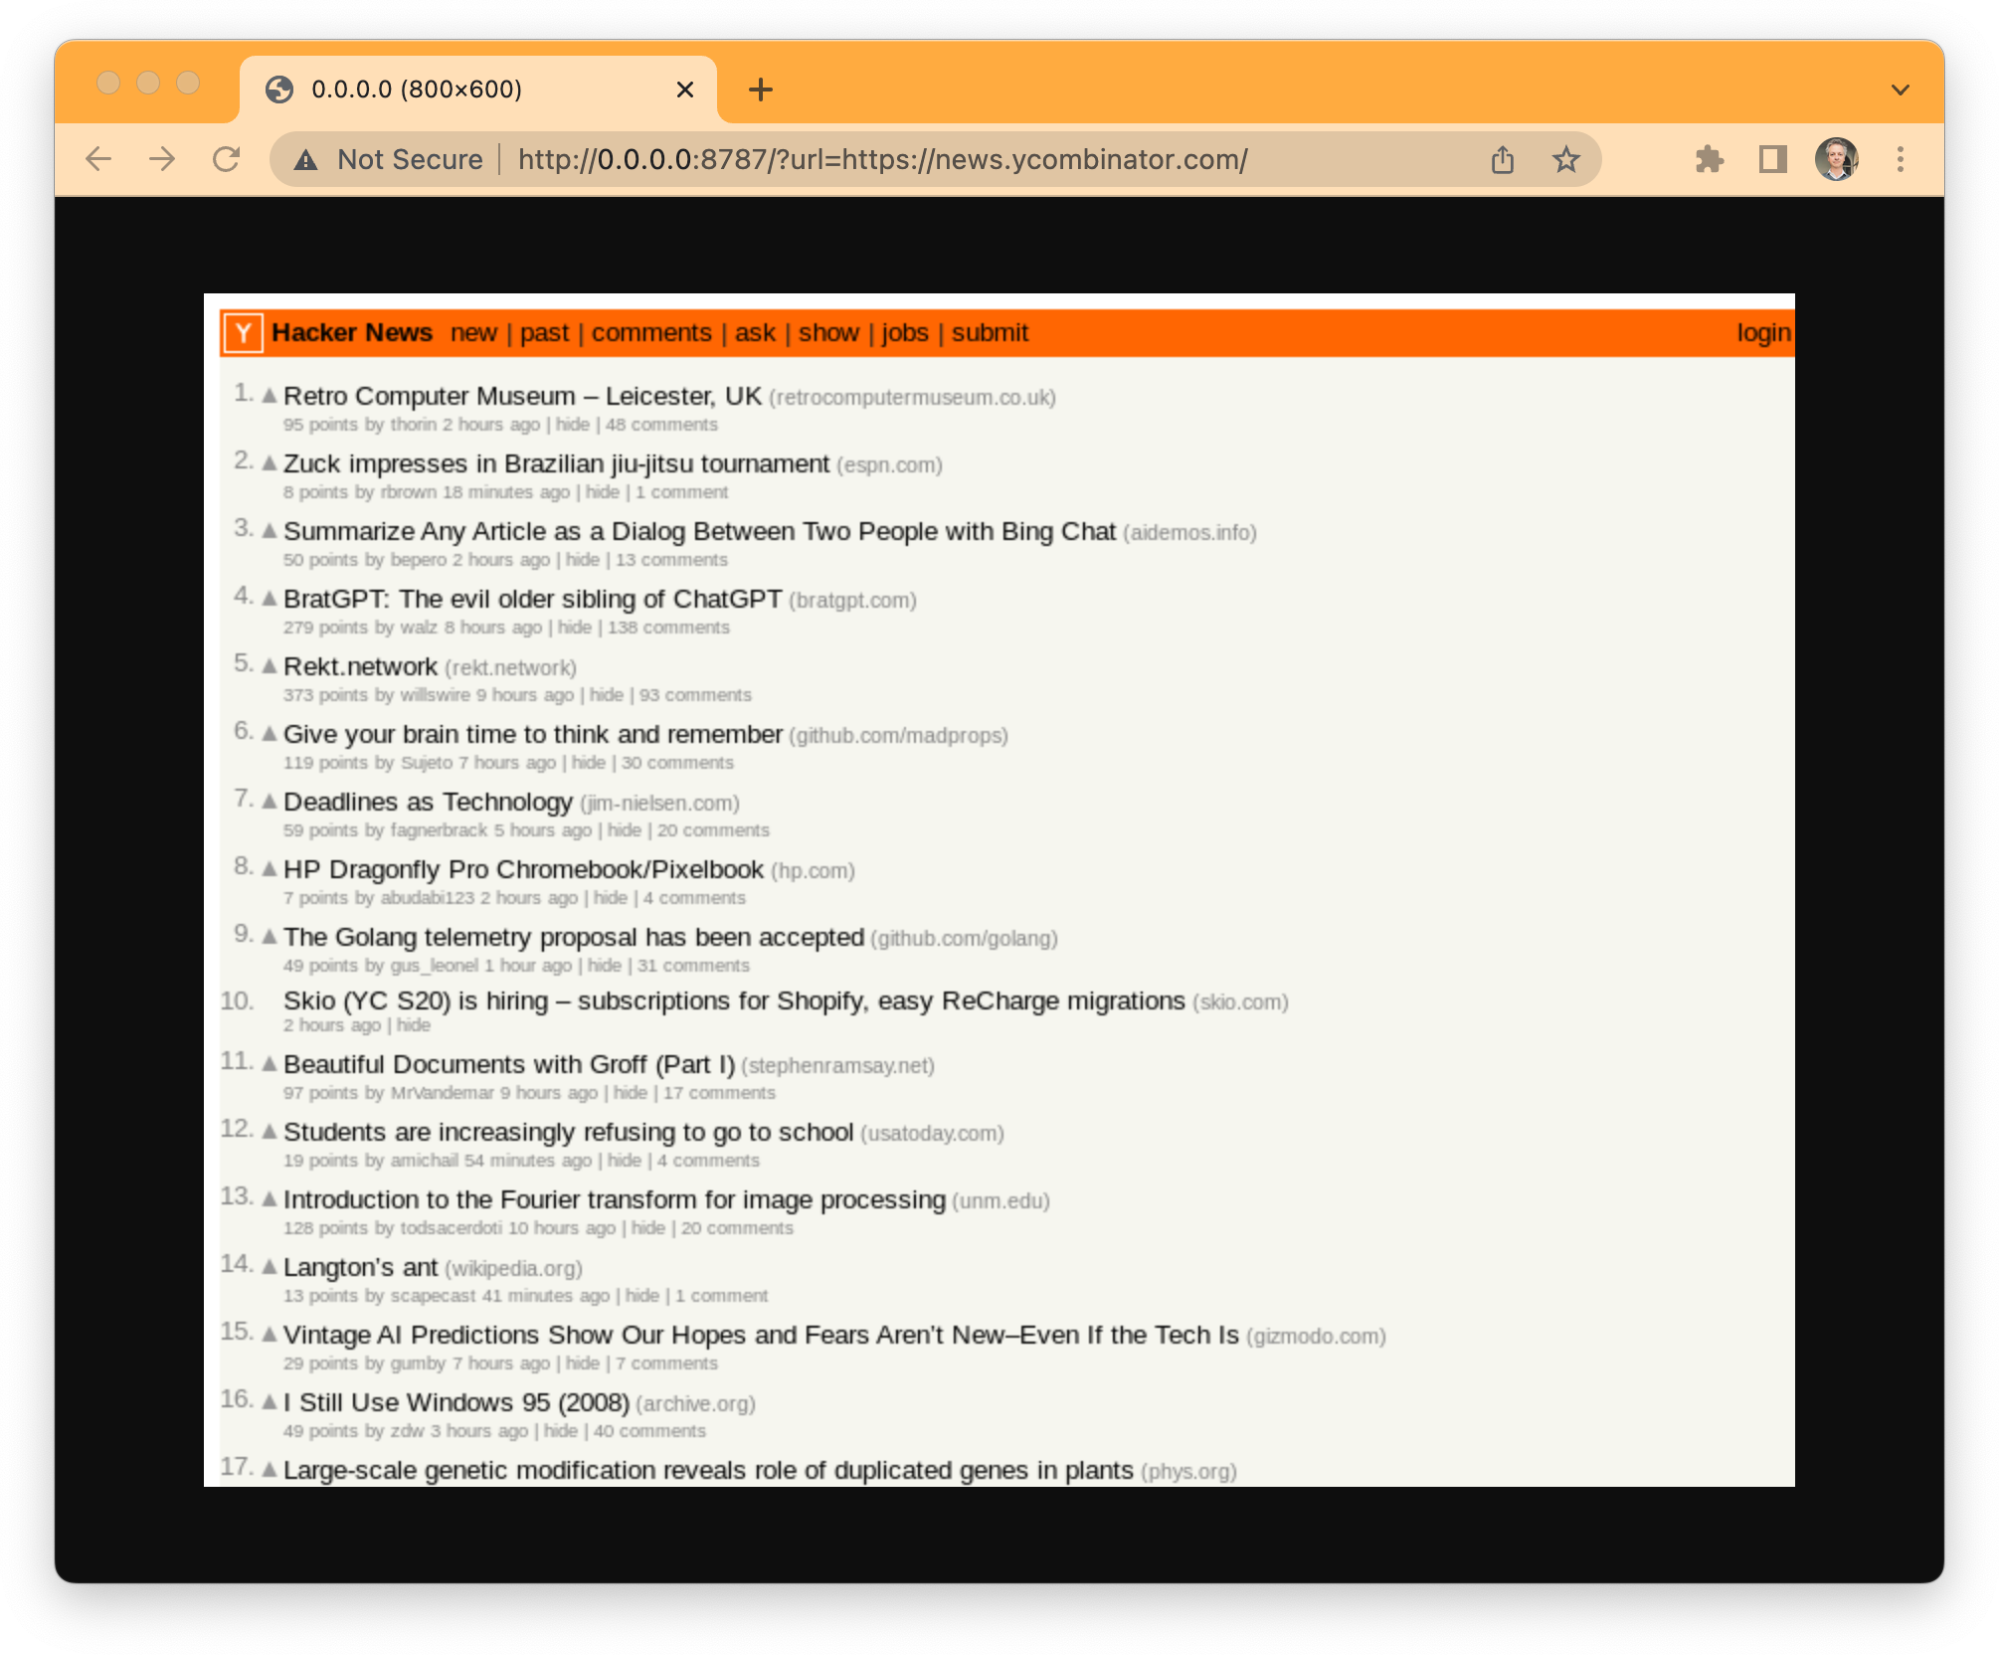
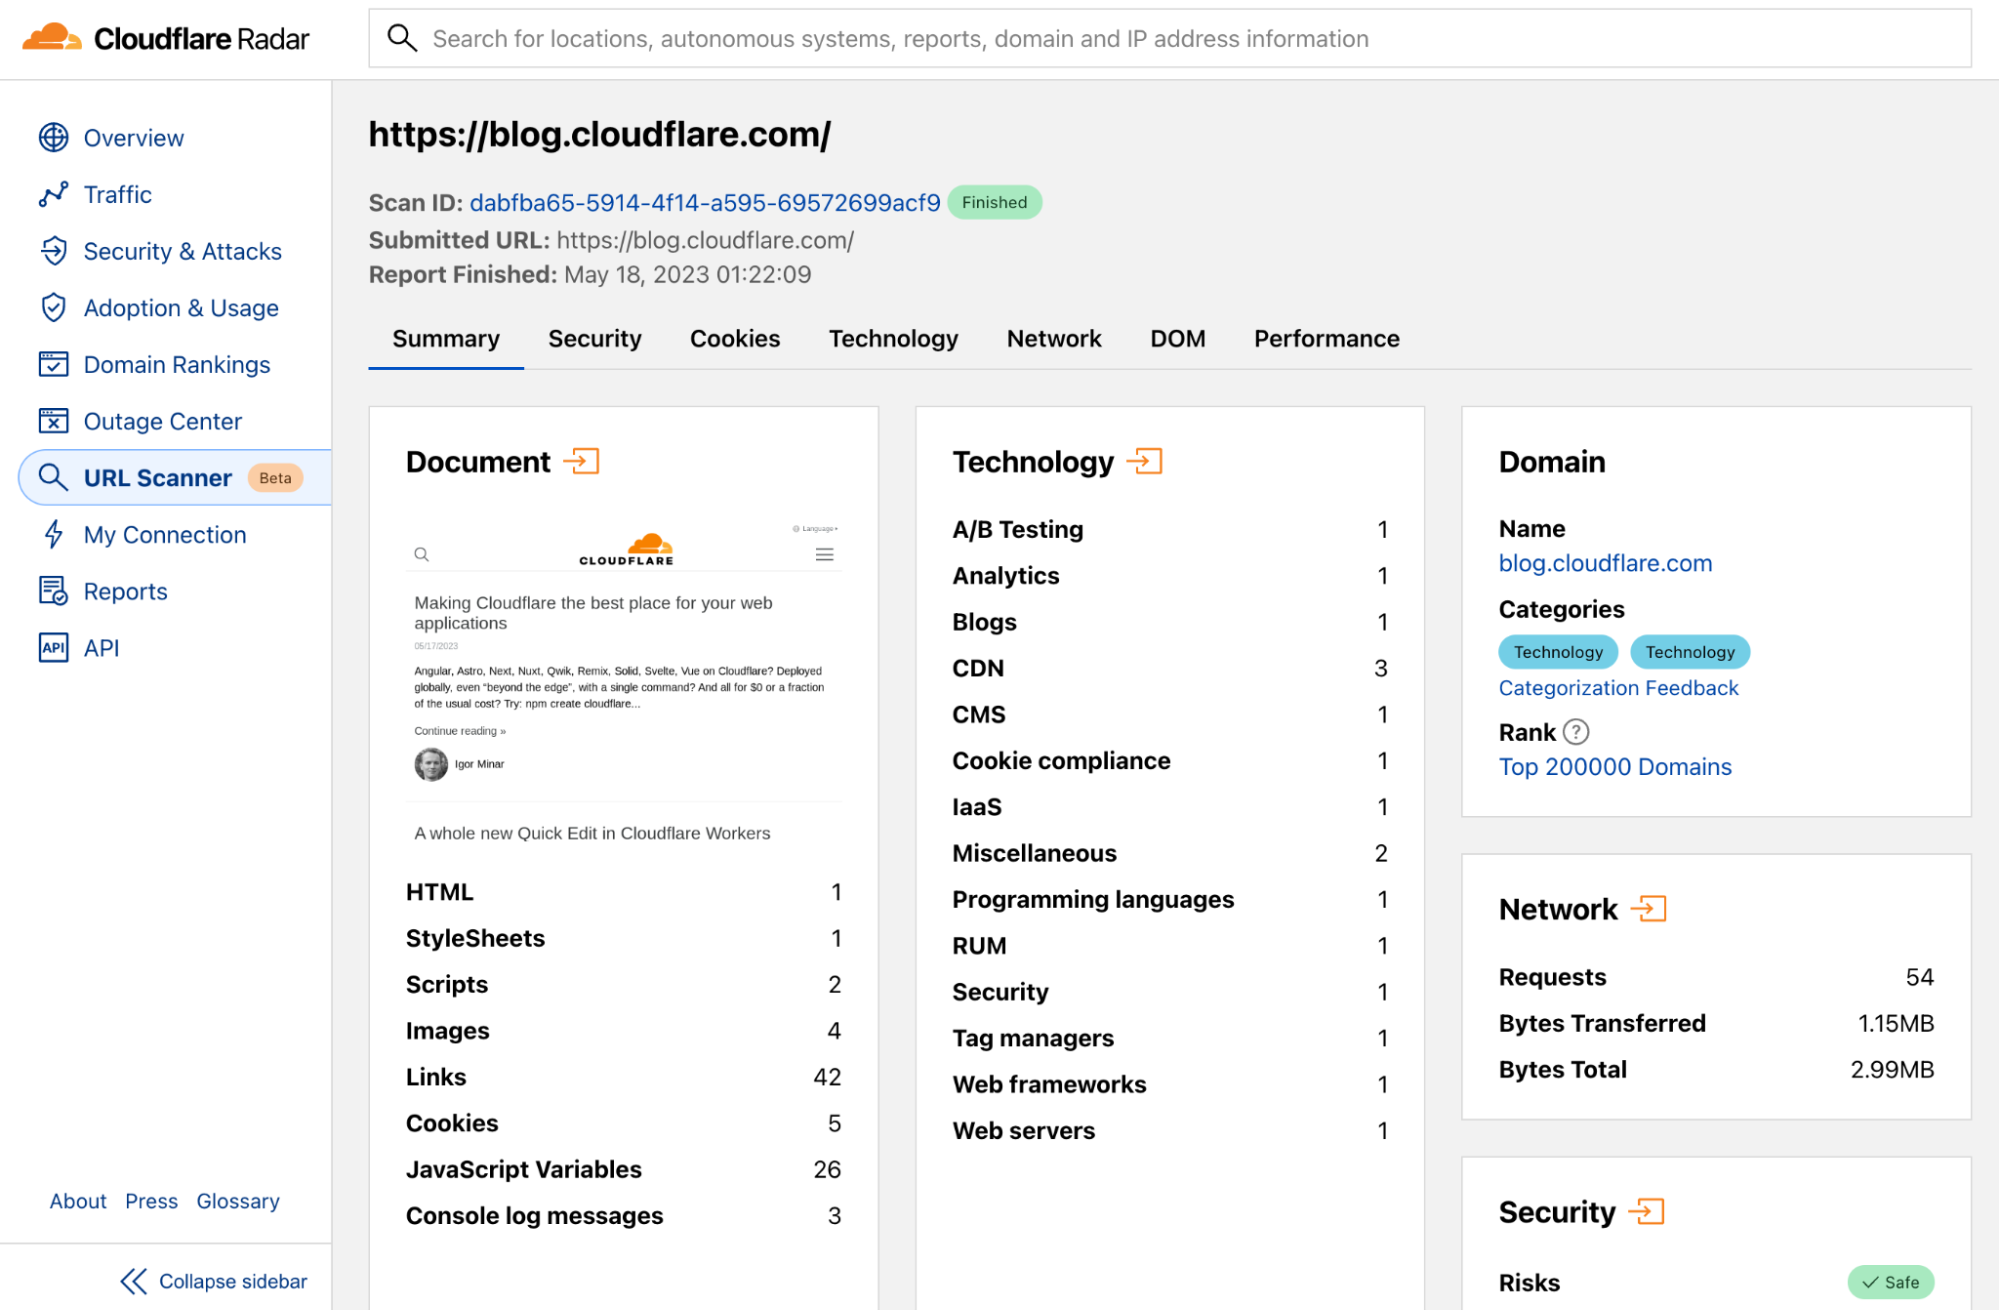
Analyze any URL safely using the Cloudflare Radar URL Scanner (✍️)
If you're invited to click on a link and if you're unsure about its safety, or if you simply want to verify technical details about a particular site, URL Scanner is here to assist. Provide us with a URL, and our scanner will compile a report containing a myriad of technical details: risk assessment, SSL certificate data, HTTP request and response data, page performance data, DNS records, associated cookies, what technologies and libraries the page uses, and more.
Introducing the Cloudflare Radar Internet Quality Page (✍️)
In June 2023, the new Internet Quality page was introduced to Cloudflare Radar, offering both country and network (autonomous system) level insight. This provides information on Internet connection performance (bandwidth) and quality (latency, jitter) over time based on benchmark test data as well as speed.cloudflare.com test results.
You can also see in a world map how the different countries compare with each other in different metrics from bandwidth to latency and jitter. Autonomous systems (AS) or networks are presented on individual pages, including Starlink’s AS14593. Latency is the metric that gives a better perspective on quality and improved Internet experience. Here’s the most recent global view on latency-based connection quality (lower is better):
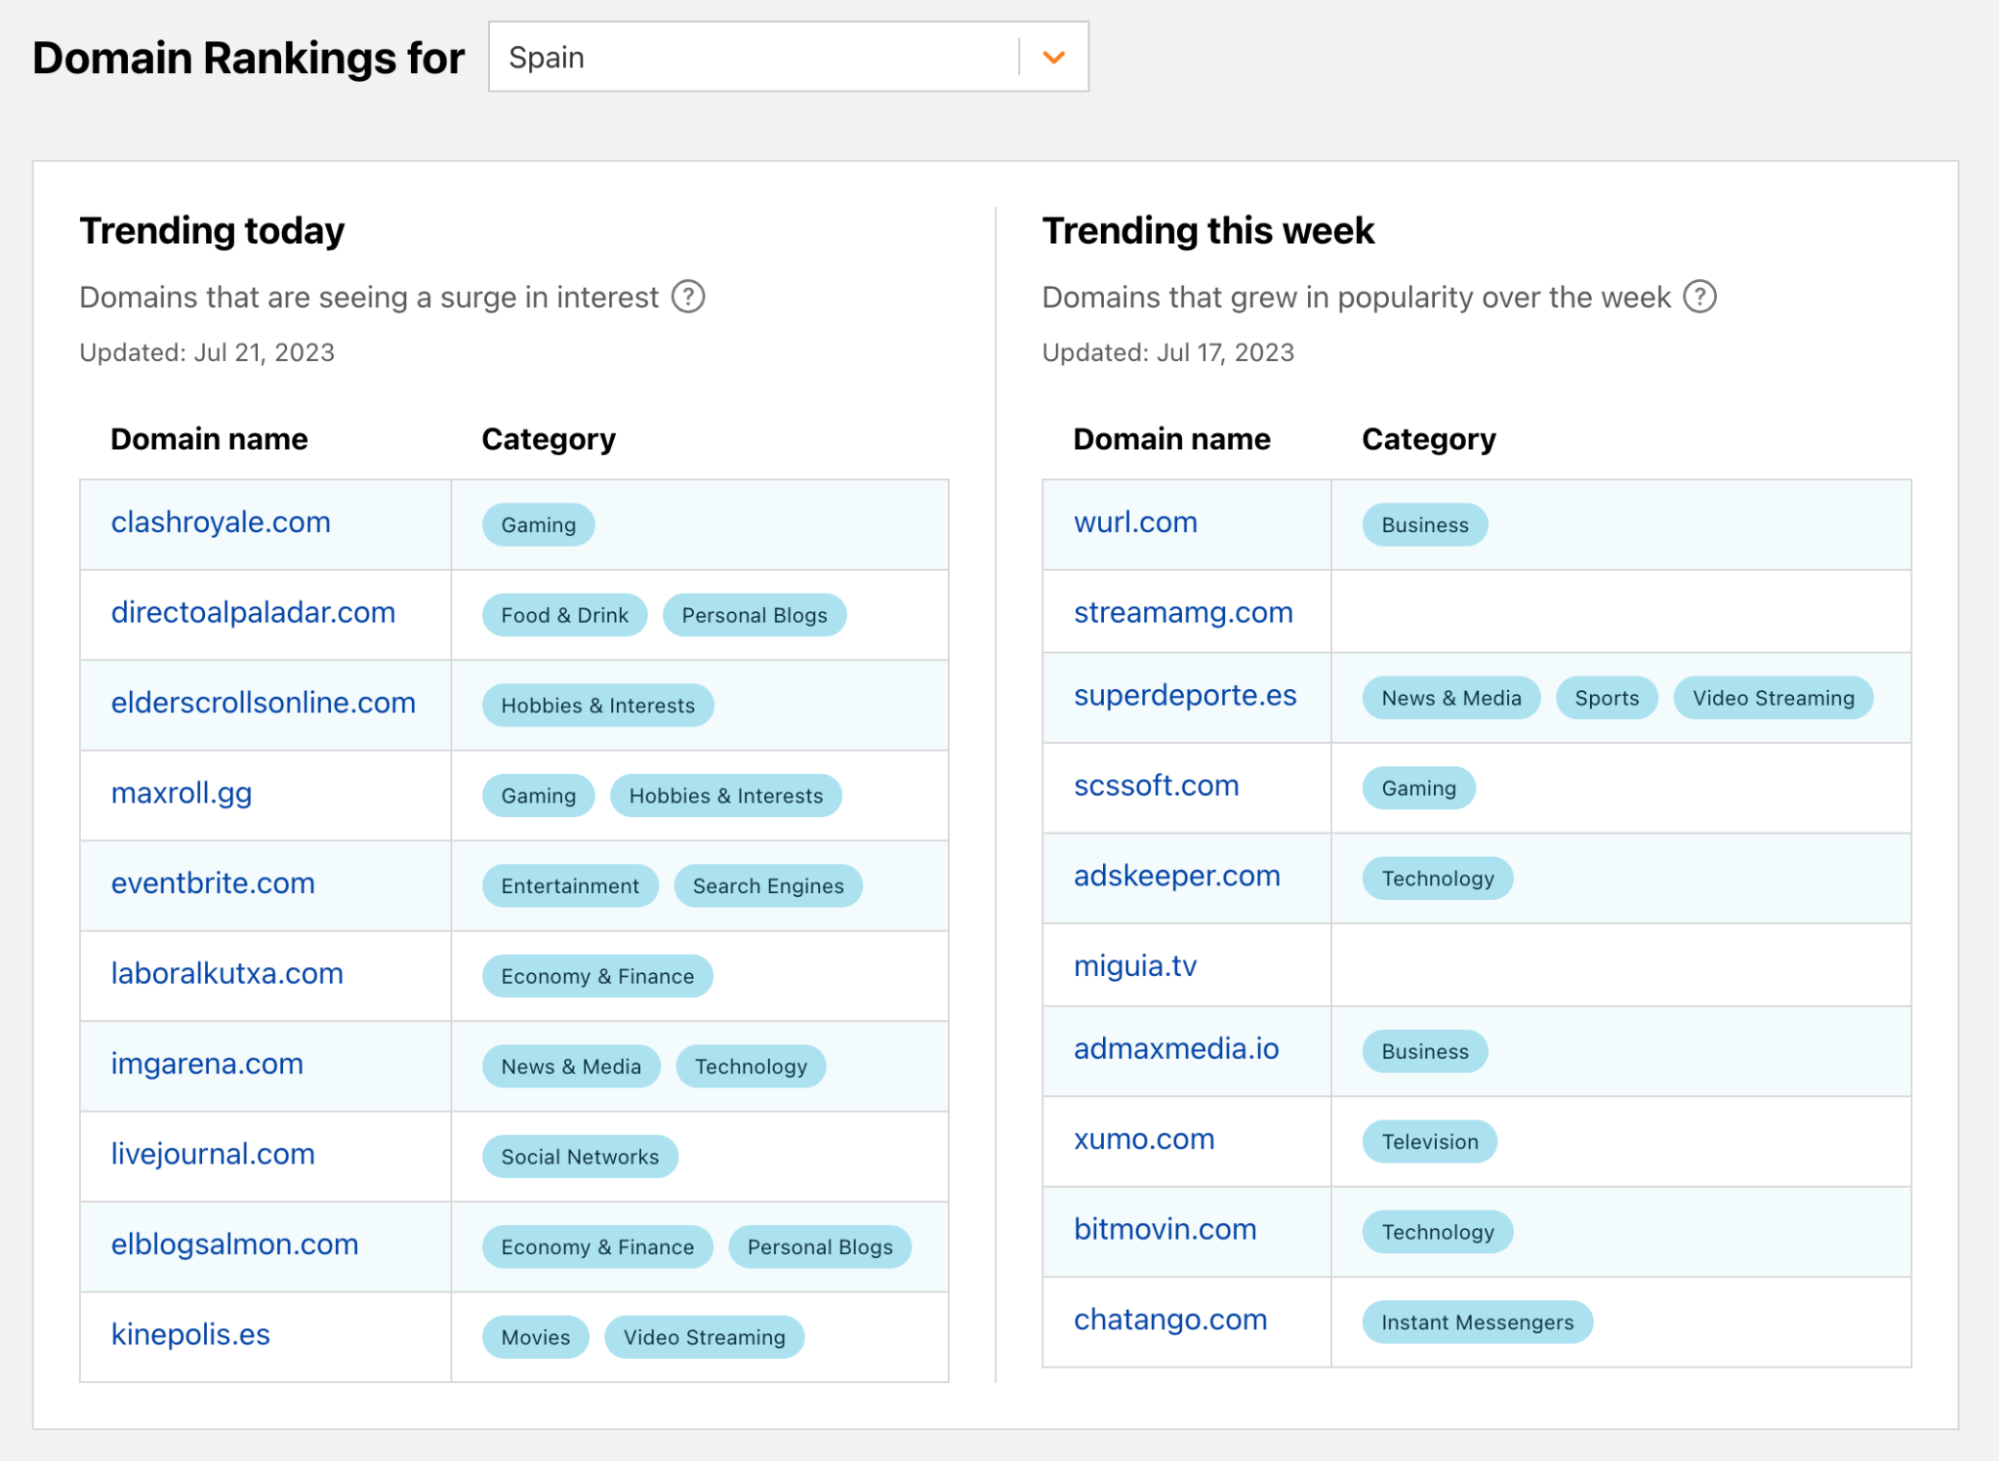
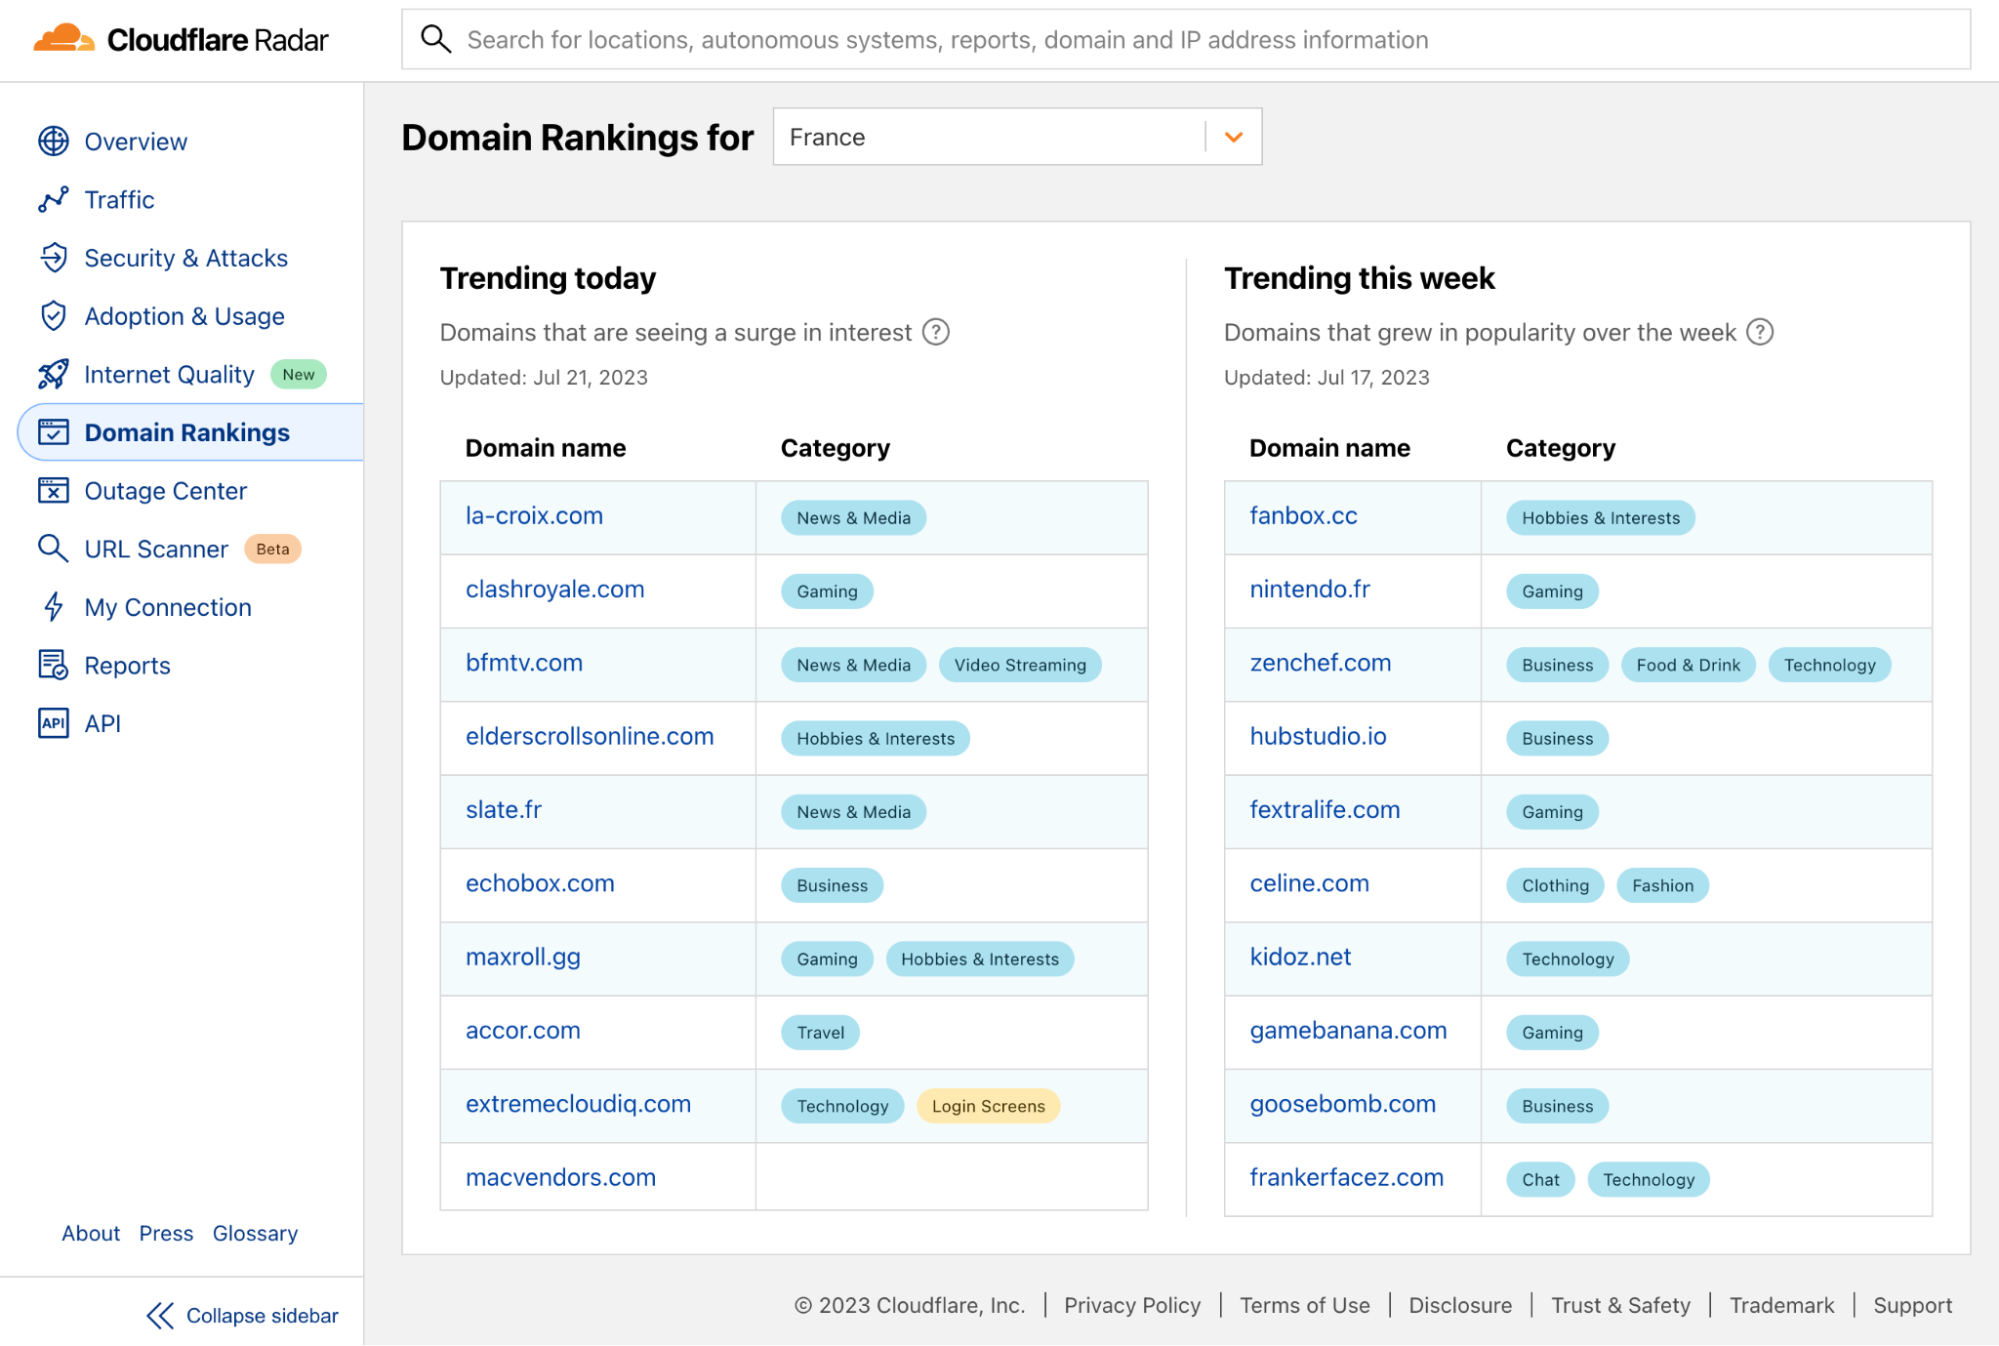
Measuring the Internet's pulse: trending domains now on Cloudflare Radar (✍️)
Starting July 2023, our Domain Rankings page received enhancements through the inclusion of specific Trending Domains lists. While the top 100 list is typically dominated by the big names such as Google, Facebook, and Apple, there are trending domains that also tell interesting and even more local stories.
The Trending Domains lists highlight surges in interest from the previous day and previous week. For instance, we captured how nba.com was trending in 28 locations during the NBA Draft 2023, and how rt.com (a Russian-based news site) gained attention in multiple countries during the Wagner group mutiny in Russia. More recently, on the same subject, after the death of Wagner’s leader, Yevgeny Prigozhin, in a plane crash, flightradar24.com was trending in our daily list both in Russia and Ukraine.
The Internet is a vast, sprawling collection of networks (autonomous systems) that connect to each other, and routing is one of the most critical operations of the Internet. Launched in late July 2023, the new Cloudflare Radar Routing page examines the routing status of the Internet, including secure routing protocol deployment for a country and routing changes and anomalies. Included are routing security statistics, and also announced prefixes and connectivity insights. Why is that important? Routing decides how and where the Internet traffic should flow from the source to the destination, and deviations or anomalies can indicate potential issues that lead to connectivity disruptions.
Border Gateway Protocol (BGP), is considered the postal service of the Internet, but as a routing protocol suffers from a number of security weaknesses. Within the Routing page, we also present BGP route leaks and BGP hijack detection results, highlighting relevant events detected for any given network or globally. Notably, BGP origin hijacks allow attackers to intercept, monitor, redirect, or drop traffic destined for the victim's networks. In this related blog post, we also explain how Cloudflare built its BGP hijack detection system (including notifications), from its design and implementation to its integration: Cloudflare Radar's new BGP origin hijack detection system.
General Internet insights from 2023
One year of war in Ukraine: Internet trends, attacks, and resilience (✍️)
This blog post details Internet insights during the war in Europe and discusses how Ukraine's Internet remained resilient in spite of dozens of attacks and disruptions in three different stages of the conflict.
Cloudflare observed multiple Internet disruptions in the first weeks of the war (Internet infrastructure was damaged, and Internet access was limited in besieged areas, like Mariupol), as well as airstrikes on Ukrainian energy infrastructure. We also emphasize how application-layer cyber attacks in Ukraine rose 1,300% in early March 2022 as compared to pre-war levels, the country’s Internet resilience during the war, and major growth in Starlink traffic from the country.
Cloudflare’s view of the Virgin Media outage in the UK (✍️)
At times, major Internet operators experience significant outages due to technical issues. In 2022, it was Canada’s Rogers that experienced a 17-hour disruption impacting millions of users, and in early April 2023, a similar incident occurred with the United Kingdom’s Virgin Media. In this case, there were two clear outages for a few hours during April 4, 2023.
The post examines the impact on Internet traffic, the availability of Virgin Media web properties, and how BGP activity offered insights into the root cause.
How Easter, Passover and Ramadan show up in Internet trends (✍️)
National holidays celebrated in various countries can influence local Internet traffic trends. That was the case during Easter, celebrated between April 7-10, 2023. In countries including Italy, Poland, Germany, France, Spain, Portugal, the United States, Mexico, and Australia, the Easter long weekend led to the lowest traffic levels of 2023 up to that point—over 100 days into the year. Traffic dipped most significantly on Easter Sunday, compared to the previous Sunday, in Poland (22% lower), Italy (18% lower), France (16% lower).
The post also illustrates Orthodox Easter trends, with Greece being most impacted. It examines Ramadan-related changes, where eating rituals impacted Internet patterns in several countries with significant Muslim populations, and Passover trends, showing how Israel’s Internet traffic dropped as much as 24%.
Effects of the conflict in Sudan on Internet patterns (✍️)
We’ve been monitoring changes and disruptions in Internet patterns linked to military interventions. In this Sudan-related blog post, we analyze the impact of the armed conflict between rival factions of the military government that began on April 15, 2023. Cloudflare observed varying disruptions in Internet traffic after that day, with a mix of clear outages and general decrease in traffic.
The most recent Internet pattern change linked to military intervention is the ongoing coup in Niger. This particular event caused a distinct traffic drop, likely tied to shifts in human Internet usage, given the absence of signs of consistent connectivity disruption.
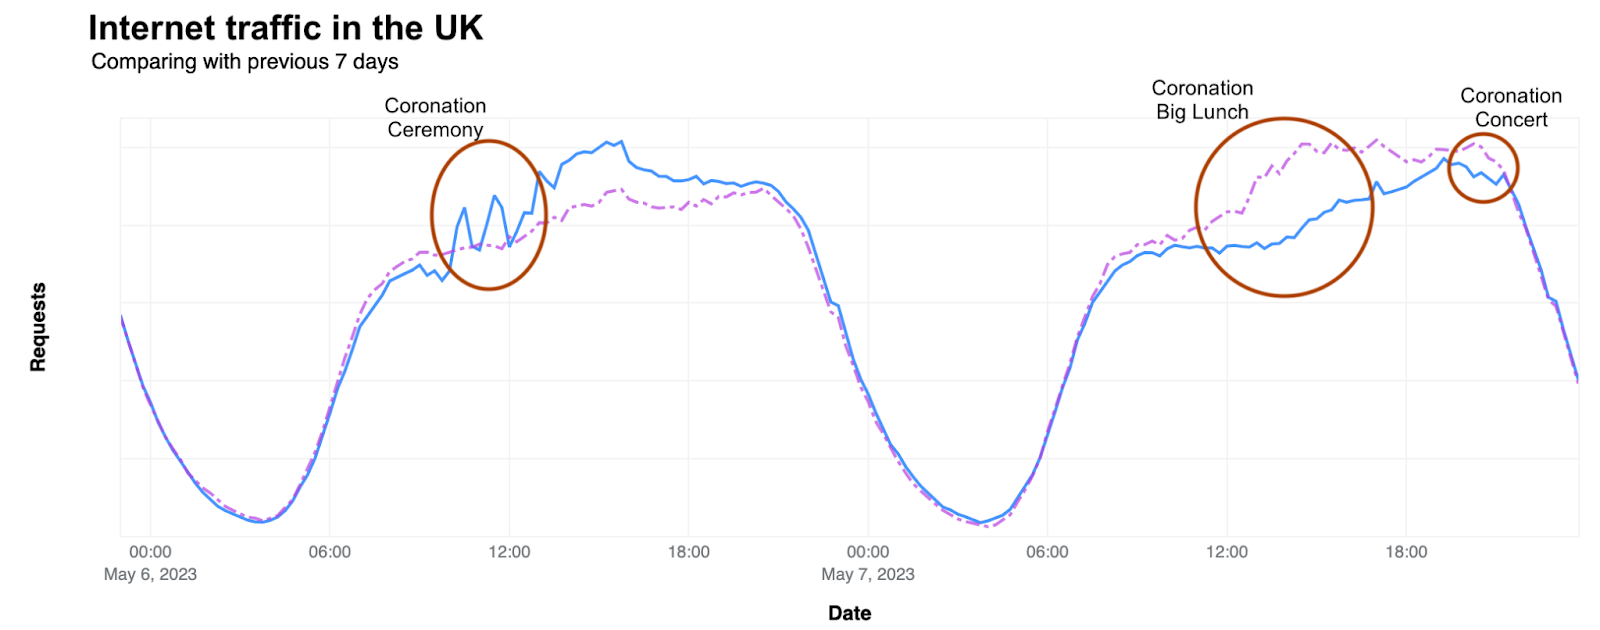
How the coronation of King Charles III affected Internet traffic (✍️)
As the coronation ceremony of King Charles III unfolded in London on May 6, 2023, distinct spikes and dips in Internet traffic were observed, each coinciding with key moments of the event. Also, on Sunday during the Coronation Big Lunch event, and Prince William’s speech at night, both instances led to a clear traffic drop of up to 18% compared with the previous Sunday. The accompanying chart displays this trend.
During the coronation weekend, Canada and Australia also exhibited shifts in Internet traffic patterns. And within this coronation post, there’s also analysis on Internet traffic pattern changes when Queen Elizabeth II passed away on September 8, 2022.
Cloudflare’s view of Internet disruptions in Pakistan (✍️)
Following the arrest of ex-PM Imran Khan, violent protests led the Pakistani government to order the shutdown of mobile Internet services and blocking of social media platforms. Mobile network shutdowns in the country lasted for several days.
We examined the impact of these shutdowns on Internet traffic in Pakistan and traffic to Cloudflare’s 1.1.1.1 DNS resolver and how Pakistanis appeared to be using it in an attempt to maintain access to the open Internet.
Nine years of Project Galileo and how the last year has changed it (✍️)
For the ninth anniversary of our Project Galileo in June 2023, the focus turned towards providing access to affordable cybersecurity tools and sharing our learnings from protecting the most vulnerable communities. We also published a ninth anniversary Project Galileo report.
One of the highlights of the report was a clear DDoS attack targeting an organization related to international law. This incident occurred on the same day an international arrest warrant was issued for Russian President Vladimir Putin and Russian official Maria Lvova-Belova, on March 17, 2023. Another standout observation involved the spikes in traffic experienced by Ukrainian emergency and humanitarian services, coinciding with bombings within the country.
Exam-related Internet shutdowns in Iraq and Algeria put connectivity to the test (✍️)
Since early June 2023, we’ve seen Iraq implementing a series of multi-hour shutdowns that continued through July and into August, as documented in our Outage Center. Algeria took similar actions, but using a content blocking-based approach, instead of the wide-scale Internet shutdowns, to prevent cheating on baccalaureate exams. This summer, these exam-related shutdowns were also implemented in Syria.
Cloudflare has previously observed and reported on similar occurrences in 2022 and also in 2021, in Syria and Sudan.
2023 has been a busy year for different types of Internet disruptions and outages, from government-directed shutdowns to natural incidents.
Reports: DDoS, Internet disruptions, and application security
Within Cloudflare Radar’s reports section, you will find a diverse array of perspectives on the Internet. From the Project Galileo 9th Anniversary — focused on aiding significant yet vulnerable online voices — to the more recent Q2 2023 Browsers and Search Engines reports. Some reports, such as the DDoS attack trends one, are also blog posts. Others are only available as blog posts, like the Internet disruptions summary, expanding on entries in the Outage Center, and the Application Security report.
This post delves into Internet disruptions observed by Cloudflare during the second quarter of 2023. Since 2022, we have been consistently offering these quarterly overviews of disruptions, and Q2 proved to be a busy quarter, with different types of disruptions:
There were several government directed shutdowns, including the ones related to “exam season” in several Middle Eastern and African countries, that continue through August.
Severe weather also played a role with a “Super Typhoon”-related disruption on the US territory of Guam.
Cable damage was behind disruptions in Bolivia, the Gambia and the Philippines.
Power outage-related Internet disruptions were observed in Curaçao, Portugal, and Botswana.
More generic technical problems impacted SpaceX Starlink’s satellite service, and Virgin Media in the United Kingdom.
Cyberattacks played a role in disruptions in both Russia and Ukraine.
Military action-related outages were observed in Chad and Sudan.
There were also maintenance related outages that affected Togo, Republic of Congo (Brazzaville), and Burkina Faso.
The Internet disruptions overview for Q1 2023 included another cause, a massive earthquake. The early February 7.8 magnitude earthquake in Turkey, which also affected Syria, caused widespread damage and tens of thousands of fatalities, and resulted in significant disruptions to Internet connectivity in multiple regions for several weeks.
Since 2020, our DDoS reports/blog posts have been focused on uncovering new attack trends, identifying the most affected countries, and showing targeted industries. Our Q2 2023 DDoS threats blog post highlights an unprecedented escalation in DDoS attack sophistication. Pro-Russian hacktivists REvil, Killnet, and Anonymous Sudan joined forces to attack Western sites. Exploits related to the zero-day vulnerability known as TP240PhoneHome surged by a whopping 532%, and attacks on crypto rocketed up by 600%.
An associated interactive version of this report is available on Cloudflare Radar. Furthermore, we’ve also added a new interactive component to Radar’s security section that allows you to dive deeper into attack activity in each country or region.
Our Application Security report has been around since 2022. The latest one highlights new attack trends and insights visible through Cloudflare’s global network. Some highlights include:
Daily mitigated HTTP requests decreased by 2 percentage points to 6% on average from 2021 to 2022, but days with larger than usual malicious activity were clearly seen across the network.
Application owners are increasingly relying on geo location blocks.
On average, more than 10% of non-verified bot traffic is mitigated. Compared to the last report, non-verified bot HTTP traffic mitigation is currently on a downward trend (down 6 percentage points).
65% of global API traffic is generated by browsers.
HTTP Anomalies are the most common attack vector on API endpoints, with 64%, followed by SQLi injection attacks (11%) and XSS attacks (9%).
The network of networks, also known as the Internet, is both complex and already seen as a human basic right—enabling work, leisure, communication, knowledge acquisition, and the pursuit of opportunities.
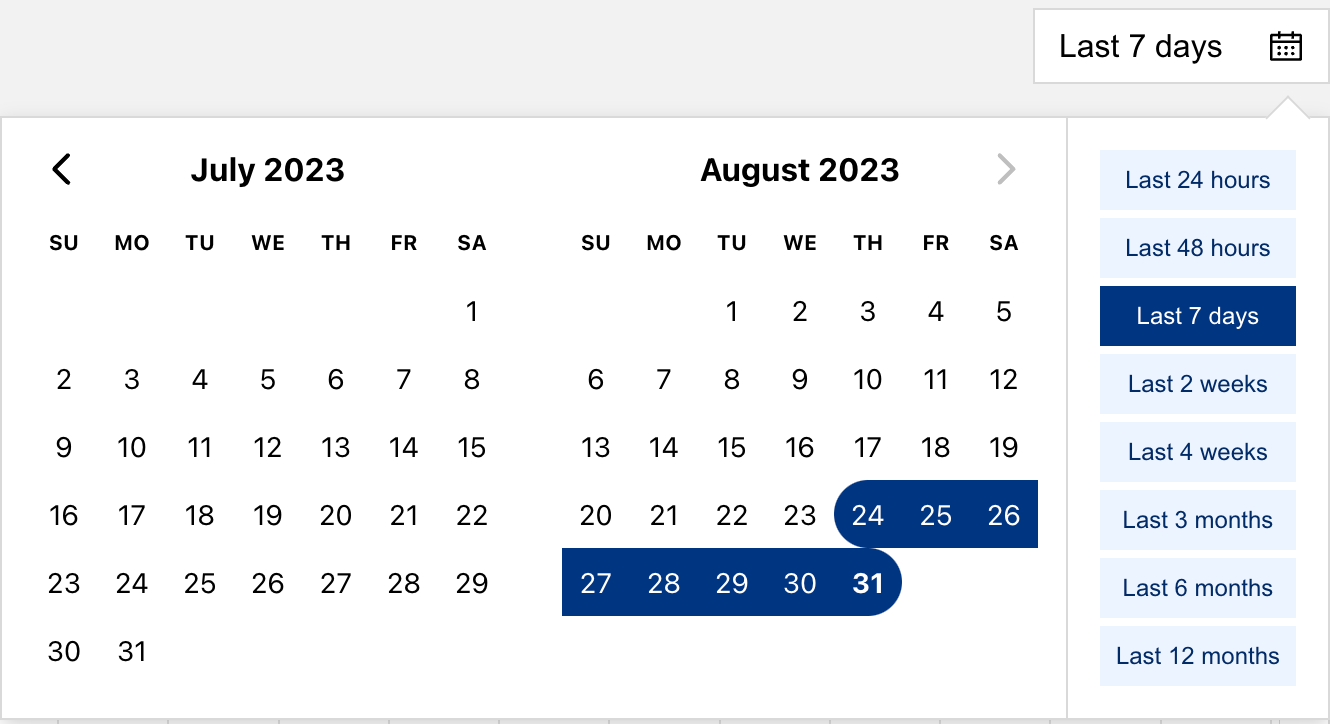
In 2023, Cloudflare Radar introduced new capabilities that facilitate the exploration of a broader array of insights and trends showing the Internet's various facets. These include Internet quality, insights into trending domains, and pertinent routing changes. There’s also no lack of general Internet insights and reports that try to offer different perspectives on 2023 events and occurrences and their impact. And already in August 2023, we’ve launched the “date picker” functionality, allowing any user to go back in time by selecting arbitrary date ranges. It looks like this:
We’re excited to introduce starring, a new dashboard feature built to speed up your workflow. You can now “star” up to 10 of the websites and applications you have on Cloudflare for quicker access.
Star your websites or applications for more efficiency
We have heard from many of our users, particularly ones with tens to hundreds of websites and applications running on Cloudflare, about the need to “favorite” the ones they monitor or configure most often. For example, domains or subdomains that our users designate for development or staging may be accessed in the Cloudflare dashboard daily during a build, migration or a first-time configuration, but then rarely touched for months at a time; yet every time logging in, these users have had to go through multiple steps—searching and paging through results—to navigate to where they need to go. These users seek a more efficient workflow to get to their destination faster. Now, by starring your websites or applications, you can have easier access.
How to get started
Star a website or application
Today, you can star up to 10 items per account. Simply star a website or application you have added to Cloudflare from its Overview page. Once you have starred at least one item, you will then see these marked as “starred” in most places across the dashboard. Just look for the yellow star icon. You can always remove from starred by toggling the button.
Filter by starred
By starring a website or application, you can then filter your lists down to display starred items only. To do so, simply select the “starred” filter from the Home page or the site switcher from the sidebar navigation.
We're very excited to offer this new functionality for better organization of your Cloudflare experience, and about the many possibilities to mature this feature. After trying it out, give us a shout in the Cloudflare Community to let us know what improvements you’d like to see come next.
Today, August 11, 2023, we are excited to announce a new debugging workflow for Cloudflare Queues. Customers using Cloudflare Queues can now send, list, and acknowledge messages directly from the Cloudflare dashboard, enabling a more user-friendly way to interact with Queues. Though it can be difficult to debug asynchronous systems, it’s now easy to examine a queue’s state and test the full flow of information through a queue.
With guaranteed delivery, message batching, consumer concurrency, and more, Cloudflare Queues is a powerful tool to connect services reliably and efficiently. Queues integrate deeply with the existing Cloudflare Workers ecosystem, so developers can also leverage our many other products and services. Queues can be bound to producer Workers, which allow Workers to send messages to a queue, and to consumer Workers, which pull messages from the queue.
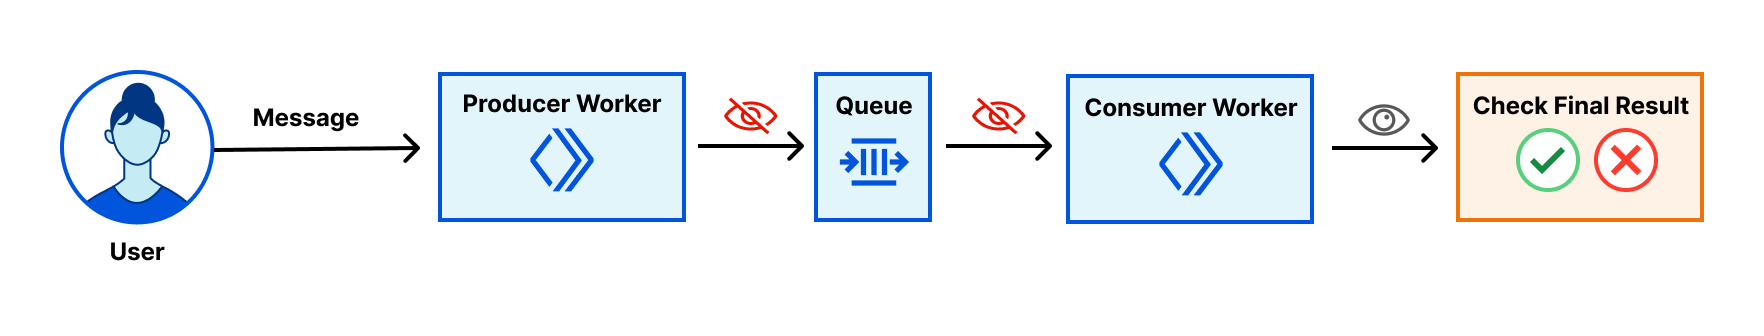
We’ve received feedback that while Queues are effective and performant, customers find it hard to debug them. After a message is sent to a queue from a producer worker, there’s no way to inspect the queue’s contents without a consumer worker. The limited transparency was frustrating, and the need to write a skeleton worker just to debug a queue was high-friction.
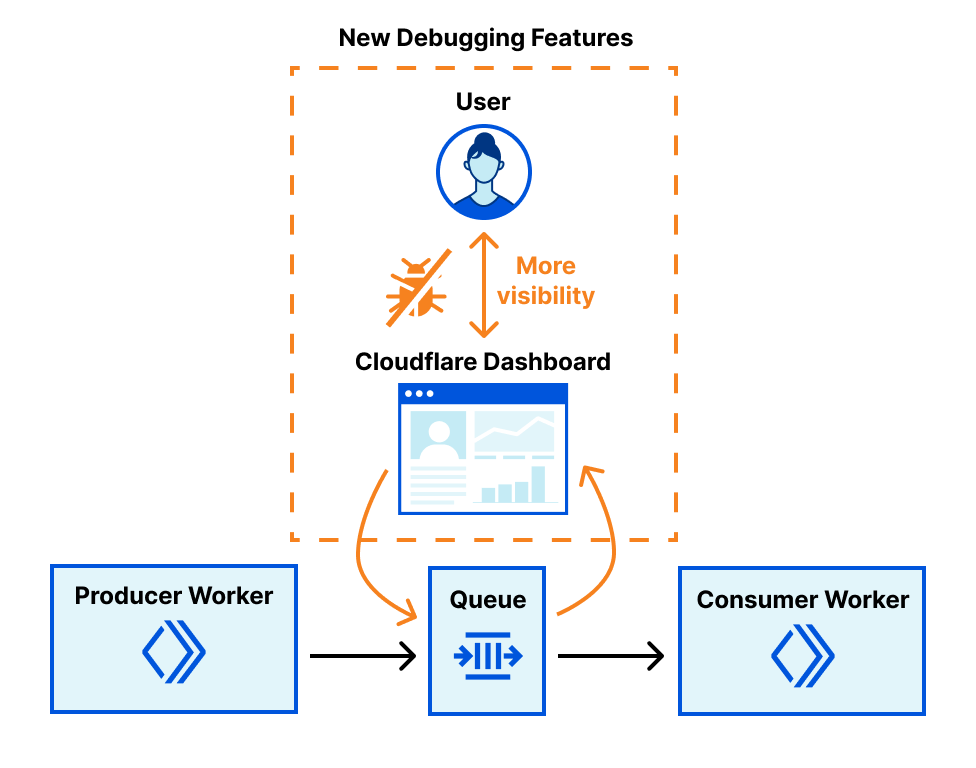
Now, with the addition of new features to send, list, and acknowledge messages in the Cloudflare dashboard, we’ve unlocked a much simpler debugging workflow. You can send messages from the Cloudflare dashboard to check if their consumer worker is processing messages as expected, and verify their producer worker’s output by previewing messages from the Cloudflare dashboard.
The pipeline of messages through a queue is now more open and easily examined. Users just getting started with Cloudflare Queues also no longer have to write code to send their first message: it’s as easy as clicking a button in the Cloudflare dashboard.
Sending messages
Both features are located in a new Messagestab on any queue’s page. Scroll to Send messageto open the message editor.
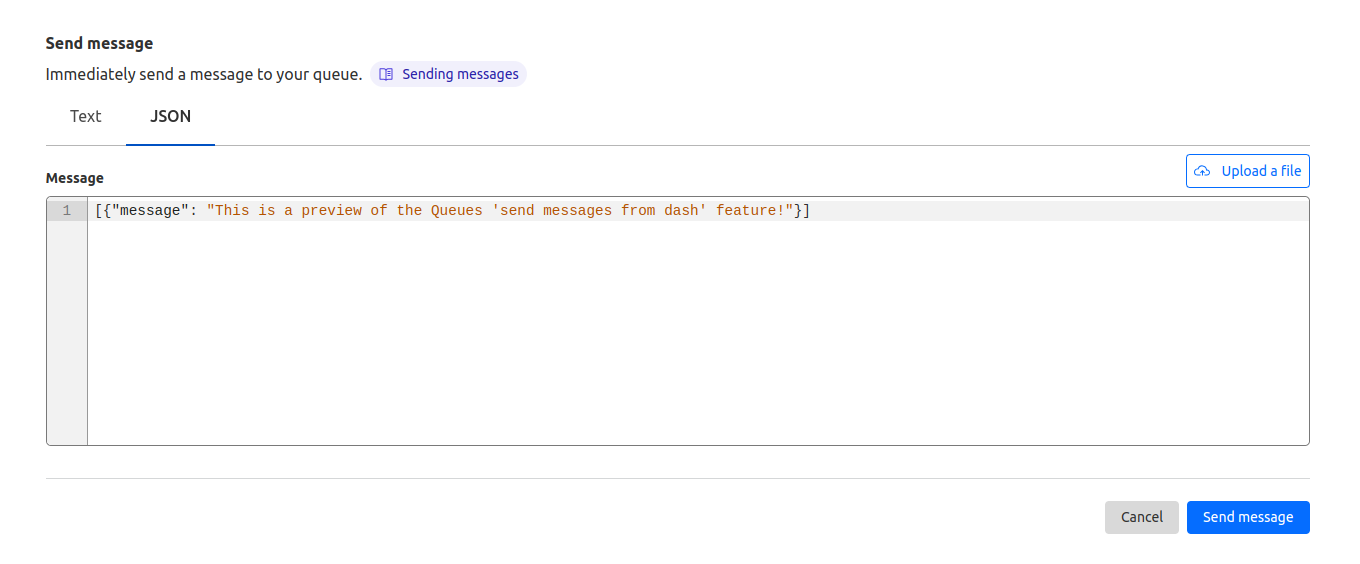
From here, you can write a message and click Send message to send it to your queue. You can also choose to send JSON, which opens a JSON editor with syntax highlighting and formatting. If you’ve saved your message as a file locally, you can drag-and-drop the file over the textbox or click Upload a file to send it as well.
This feature makes testing changes in a queue’s consumer worker much easier. Instead of modifying an existing producer worker or creating a new one, you can send one-off messages. You can also easily verify if your queue consumer settings are behaving as expected: send a few messages from the Cloudflare dashboard to check that messages are batched as desired.
Behind the scenes, this feature leverages the same pipeline that Cloudflare Workers uses to send messages, so you can be confident that your message will be processed as if sent via a Worker.
Listing messages
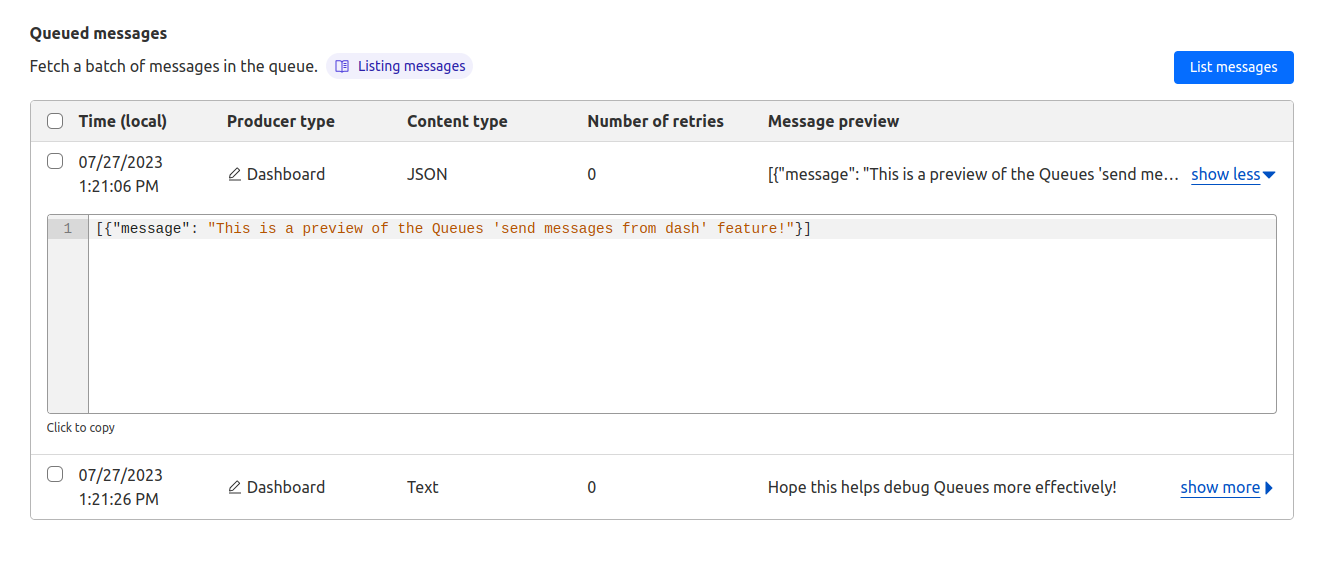
On the same page, you can also inspect the messages you just sent from the Cloudflare dashboard. On any queue’s page, open the Messages tab and scroll to Queued messages.
If you have a consumer attached to your queue, you’ll fetch a batch of messages of the same size as configured in your queue consumer settings by default, to provide a realistic view of what would be sent to your consumer worker. You can change this value to preview messages one-at-a-time or even in much larger batches than would be normally sent to your consumer.
After fetching a batch of messages, you can preview the message’s body, even if you’ve sent raw bytes or a JavaScript object supported by the structured clone algorithm. You can also check the message’s timestamp; number of retries; producer source, such as a Worker or the Cloudflare dashboard; and type, such as text or JSON. This information can help you debug the queue’s current state and inspect where and when messages originated from.
The batch of messages that’s returned is the same batch that would be sent to your consumer Worker on its next run. Messages are even guaranteed to be in the same order on the UI as sent to your consumer. This feature grants you a looking glass view into your queue, matching the exact behavior of a consumer worker. This works especially well for debugging messages sent by producer workers and verifying queue consumer settings.
Listing messages from the Cloudflare dashboard also doesn’t interfere with an existing connected consumer. Messages that are previewed from the Cloudflare dashboard stay in the queue and do not have their number of retries affected.
This ‘peek’ functionality is unique to Cloudflare Queues: Amazon SQS bumps the number of retries when a message is viewed, and RabbitMQ retries the message, forcing it to the back of the queue. Cloudflare Queues’ approach means that previewing messages does not have any unintended side effects on your queue and your consumer. If you ever need to debug queues used in production, don’t worry – listing messages is entirely safe.
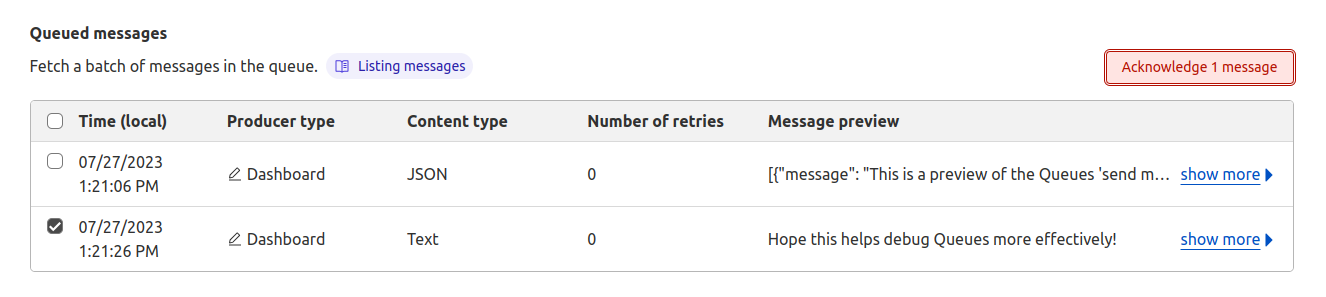
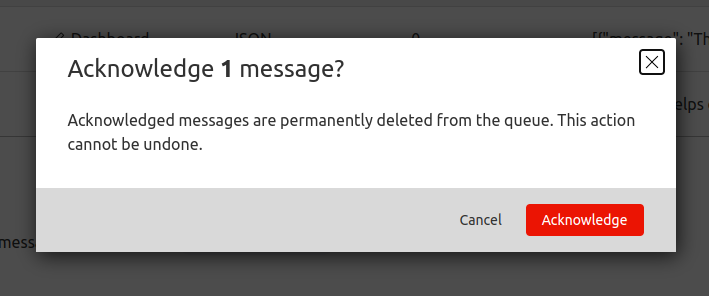
As well, you can now remove messages from your queue from the Cloudflare dashboard. If you’d like to remove a message or clear the full batch from the queue, you can select messages to acknowledge. This is useful for preventing buggy messages from being repeatedly retried without having to write a dummy consumer.
You might have noticed that this message preview feature operates similarly to another popular feature request for an HTTP API to pull batches of messages from a queue. Customers will be able to make a request to the API endpoint to receive a batch of messages, then acknowledge the batch to remove the messages from the queue. Under the hood, both listing messages from the Cloudflare dashboard and HTTP Pull/Ack use a common infrastructure, and HTTP Pull/Ack is coming very soon!
These debugging features have already been invaluable for testing example applications we’ve built on Cloudflare Queues. At an internal hack week event, we built a web crawler with Queues as an example use-case (check out the tutorial here!). During development, we took advantage of this user-friendly way to send messages to quickly iterate on a consumer worker before we built a producer worker. As well, when we encountered bugs in our consumer worker, the message previews were handy to realize we were sending malformed messages, and the message acknowledgement feature gave us an easy way to remove them from the queue.
New Queues debugging features — available today!
The Cloudflare dashboard features announced today provide more transparency into your application and enable more user-friendly debugging.
All Cloudflare Queues customers now have access to these new debugging tools. And if you’re not already using Queues, you can join the Queues Open Beta by enabling Cloudflare Queues here. Get started on Cloudflare Queues with our guide and create your next app with us today! Your first message is a single click away.
Designed with developers in mind, Cloudflare Stream provides a seamless, integrated workflow that simplifies video streaming for creators and platforms alike. With features like Stream Live and creator management, customers have been looking for ways to streamline storage management.
Today, August 11, 2023, Cloudflare Stream is introducing scheduled deletion to easily manage video lifecycles from the Stream dashboard or our API, saving time and reducing storage-related costs. Whether you need to retain recordings from a live stream for only a limited time, or preserve direct creator videos for a set duration, scheduled deletion will simplify storage management and reduce costs.
Stream scheduled deletion
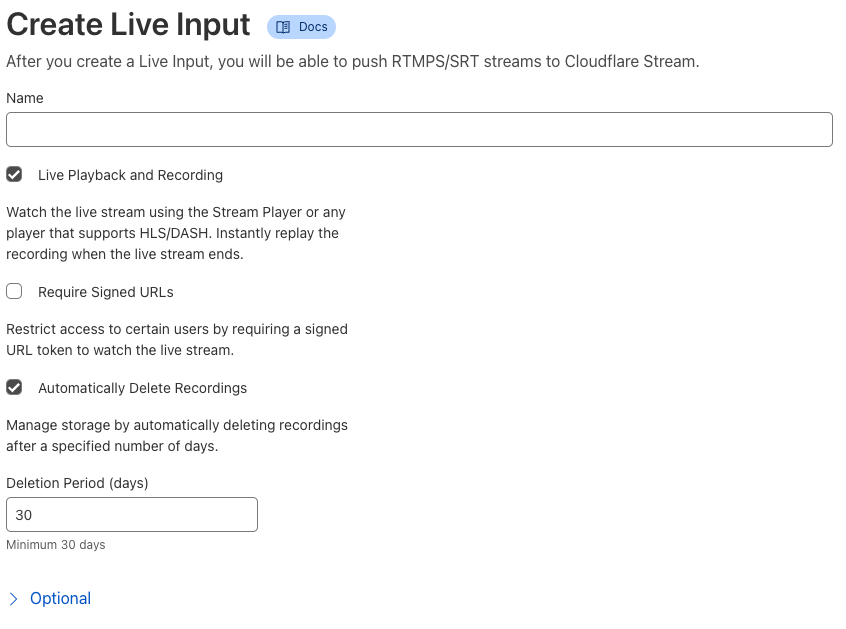
Scheduled deletion allows developers to automatically remove on-demand videos and live recordings from their library at a specified time. Live inputs can be set up with a deletion rule, ensuring that all recordings from the input will have a scheduled deletion date upon completion of the stream.
Let’s see how it works in those two configurations.
Getting started with scheduled deletion for on-demand videos
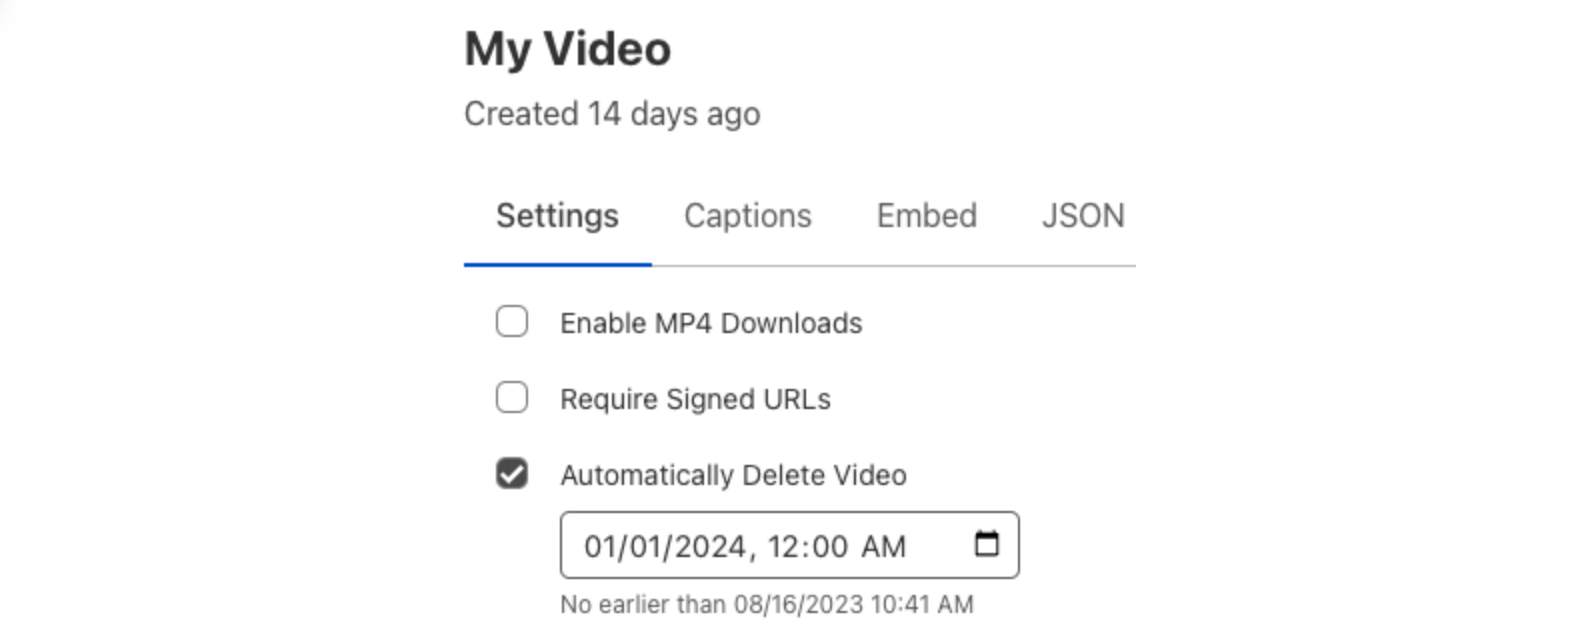
Whether you run a learning platform where students can upload videos for review, a platform that allows gamers to share clips of their gameplay, or anything in between, scheduled deletion can help manage storage and ensure you only keep the videos that you need. Scheduled deletion can be applied to both new and existing on-demand videos, as well as recordings from completed live streams. This feature lets you specify a specific date and time at which the video will be deleted. These dates can be applied in the Cloudflare dashboard or via the Cloudflare API.
Cloudflare dashboard
From the Cloudflare dashboard, select Videos under Stream
Select a video
Select Automatically Delete Video
Specify a desired date and time to delete the video
Click Submit to save the changes
Cloudflare API
The Stream API can also be used to set the scheduled deletion property on new or existing videos. In this example, we’ll create a direct creator upload that will be deleted on December 31, 2023:
For more information on live inputs and how to configure deletion policies in our API, refer to the documentation.
Getting started with automated deletion for Live Input recordings
We love how recordings from live streams allow those who may have missed the stream to catch up, but these recordings aren’t always needed forever. Scheduled recording deletion is a policy that can be configured for new or existing live inputs. Once configured, the recordings of all future streams on that input will have a scheduled deletion date calculated when the recording is available. Setting this retention policy can be done from the Cloudflare dashboard or via API operations to create or edit Live Inputs:
Cloudflare Dashboard
From the Cloudflare dashboard, select Live Inputs under Stream
Select Create Live Input or an existing live input
Select Automatically Delete Recordings
Specify a number of days after which new recordings should be deleted
Click Submit to save the rule or create the new live input
Cloudflare API
The Stream API makes it easy to add a deletion policy to new or existing inputs. Here is an example API request to create a live input with recordings that will expire after 30 days:
For more information on live inputs and how to configure deletion policies in our API, refer to the documentation.
Try out scheduled deletion today
Scheduled deletion is now available to all Cloudflare Stream customers. Try it out now and join our Discord community to let us know what you think! To learn more, check out our developer docs. Stay tuned for more exciting Cloudflare Stream updates in the future.
One of the goals of Cloudflare is to give our customers the necessary knobs to enable security in a way that fits their needs. In the realm of SSL/TLS, we offer two key controls: setting the minimum TLS version, and restricting the list of supported cipher suites. Previously, these settings applied to the entire domain, resulting in an “all or nothing” effect. While having uniform settings across the entire domain is ideal for some users, it sometimes lacks the necessary granularity for those with diverse requirements across their subdomains.
It is for that reason that we’re excited to announce that as of today, customers will be able to set their TLS settings on a per-hostname basis.
The trade-off with using modern protocols
In an ideal world, every domain could be updated to use the most secure and modern protocols without any setbacks. Unfortunately, that's not the case. New standards and protocols require adoption in order to be effective. TLS 1.3 was standardized by the IETF in April 2018. It removed the vulnerable cryptographic algorithms that TLS 1.2 supported and provided a performance boost by requiring only one roundtrip, as opposed to two. For a user to benefit from TLS 1.3, they need their browser or device to support the new TLS version. For modern browsers and devices, this isn’t a problem – these operating systems are built to dynamically update to support new protocols. But legacy clients and devices were, obviously, not built with the same mindset. Before 2015, new protocols and standards were developed over decades, not months or years, so the clients were shipped out with support for one standard — the one that was used at the time.
If we look at Cloudflare Radar, we can see that about 62.9% of traffic uses TLS 1.3. That’s quite significant for a protocol that was only standardized 5 years ago. But that also means that a significant portion of the Internet continues to use TLS 1.2 or lower.
The same trade-off applies for encryption algorithms. ECDSA was standardized in 2005, about 20 years after RSA. It offers a higher level of security than RSA and uses shorter key lengths, which adds a performance boost for every request. To use ECDSA, a domain owner needs to obtain and serve an ECDSA certificate and the connecting client needs to support cipher suites that use elliptical curve cryptography (ECC). While most publicly trusted certificate authorities now support ECDSA-based certificates, the slow rate of adoption has led many legacy systems to only support RSA, which means that restricting applications to only support ECC-based algorithms could prevent access from those that use older clients and devices.
Balancing the trade-offs
When it comes to security and accessibility, it’s important to find the right middle ground for your business.
To maintain brand, most companies deploy all of their assets under one domain. It’s common for the root domain (e.g. example.com) to be used as a marketing website to provide information about the company, its mission, and the products and services it offers. Then, under the same domain, you might have your company blog (e.g. blog.example.com), your management portal (e.g. dash.example.com), and your API gateway (e.g. api.example.com).
The marketing website and the blog are similar in that they’re static sites that don’t collect information from the accessing users. On the other hand, the management portal and API gateway collect and present sensitive data that needs to be protected.
When you’re thinking about which settings to deploy, you want to consider the data that’s exchanged and the user base. The marketing website and blog should be accessible to all users. You can set them up to support modern protocols for the clients that support them, but you don’t necessarily want to restrict access for users that are accessing these pages from old devices.
The management portal and API gateway should be set up in a manner that provides the best protection for the data exchanged. That means dropping support for less secure standards with known vulnerabilities and requiring new, secure protocols to be used.
To be able to achieve this setup, you need to be able to configure settings for every subdomain within your domain individually.
Per hostname TLS settings – now available!
Customers that use Cloudflare’s Advanced Certificate Manager can configure TLS settings on individual hostnames within a domain. Customers can use this to enable HTTP/2, or to configure the minimum TLS version and the supported ciphers suites on a particular hostname. Any settings that are applied on a specific hostname will supersede the zone level setting. The new capability also allows you to have different settings on a hostname and its wildcard record; which means you can configure example.com to use one setting, and *.example.com to use another.
Let’s say that you want the default min TLS version for your domain to be TLS 1.2, but for your dashboard and API subdomains, you want to set the minimum TLS version to be TLS 1.3. In the Cloudflare dashboard, you can set the zone level minimum TLS version to 1.2 as shown below. Then, to make the minimum TLS version for the dashboard and API subdomains TLS 1.3, make a call to the per-hostname TLS settings API endpoint with the specific hostname and setting.
This is all available, starting today, through the API endpoint! And if you’d like to learn more about how to use our per-hostname TLS settings, please jump on over to our developer documentation.
In 2022, we launched the Radar Domain Rankings, with top lists of the most popular domains based on how people use the Internet globally. The lists are calculated using a machine learning model that uses aggregated 1.1.1.1 resolver data that is anonymized in accordance with our privacy commitments. While the top 100 list is updated daily for each location, typically the first results of that list are stable over time, with the big names such as Google, Facebook, Apple, Microsoft and TikTok leading. Additionally, these global big names appear for the majority of locations.
Today, we are improving our Domain Rankings page and adding Trending Domains lists. The new data shows which domains are currently experiencing an increase in popularity. Hence, while with the top popular domains we aim to show domains of broad appeal and of interest to many Internet users, with the trending domains we want to show domains that are generating a surge in interest.
How we generate the Trending Domains
When we started looking at the best way to generate a list of trending domains, we needed to answer the following questions:
What type of popularity changes do we want to capture?
What should we use as a baseline to calculate the change?
And how do we quantify it?
We soon realized that we needed two lists. One reflecting sudden increased interest related to a particular event or a topic, showing spikes in popularity in domains that jump in the ranking from one day to the next, and another one reflecting steady growth in popularity, showing domains that are increasing their user base over a longer period.
For this reason, we are launching both the Trending Today and Trending This Week top 10 lists to capture the two different types of popularity increase.
To select the baseline for calculating the increase in popularity, we analyzed the volatility of the Radar Domain Ranking list for different top list sizes. The advantage of starting with the Radar Ranking lists is that they already incorporate a good popularity metric that quantifies the estimated relative size of the user population that accesses a domain over some period of time. You can read more about how we define popularity in our “Goodbye, Alexa. Hello, Cloudflare Radar Domain Rankings” blog.
As expected, smaller list sizes were more stable, meaning the percentage of domains in the top 100 that changed the ranking from one day to the next was much lower than the percentage of domains that changed in the top 10,000. Hence, to have a dynamic daily list of trending domains, we had to look beyond the top 100 most popular domains.
However, we did not want to go all the way to the long tail of the list, as we already know that the ranks there are based on “significantly smaller and hence less reliable numbers” (see the paper "A Long Way to the Top: Significance, Structure, and Stability of Internet Top Lists"). Hence, we selected an appropriate list size for each location, based on the distribution of the number of DNS queries per domain. For example, for the Worldwide trending list we analyzed the top 20,000 most popular domains, for Brazil we looked at the top 10,000, Angola 5,000 and for the Faroe Islands top 500.
Trending Today
We then evaluated how much the domains change rank from one day to the next.
We saw that on average, the biggest changes in the top lists, from one day to the next, happen from Fridays to Saturdays and from Sundays to Mondays, and hence on Saturdays and Mondays the lists have the least overlap with the lists of the previous day. We also compared the rank changes from one day to the next corresponding weekday, say from one Monday to the next and saw that on average, rankings on Mondays typically have more overlap with the rankings of the previous Mondays, than with the rankings of Sunday. From this we decided that in order to capture which domains are trending due to the weekend effect, we needed to compare the domain's daily rank to the rank of the previous day(s), and not of the corresponding weekday.
However, we also did not want to show as trending those domains that highly oscillate in the rankings, jumping up and down from one day to the next, showing up as trending every few days. Hence, we could not simply compare the daily rank with the rank from the day before. Instead, as a compromise between capturing the most recent trends, including the weekend trends, but still filtering out the domains whose ranking oscillates over a short period of time, we decided to compare the domain's daily rank with its best rank of the previous four days.
Then, to calculate the increase in popularity, we simply calculate the percentage change in the current rank compared to the best rank of the previous four days.
Trending This Week
For calculating the domains steadily growing over the week, we used a slightly different approach.
We want to highlight domains that keep improving their rank day by day and especially those that have been really trending in the most recent days. Therefore, we decided not to directly compare the current rank with the best rank during the previous week. Instead, we looked at the weighted average per day rank improvement and compared it with the best rank of the previous six days, with more recent days being given more weight.
Example trending domains
What do these lists look like at the end? We compiled the lists for the eventful days of June 21 to 24.
On June 22, nba.com was trending in 28 locations, shown in the table below, the United States, as expected, but also Austria, Australia and Japan, to name a few, reflecting the interest in the events of NBA Draft 2023.
Trending Today data from Friday, June 23, 2023:
Location
Trending rank
Domain
Albania
5
nba.com
Argentina
9
nba.com
Australia
1
nba.com
Austria
9
nba.com
Belgium
5
nba.com
Canada
5
nba.com
Chile
6
nba.com
Colombia
3
nba.com
Dominican Republic
5
nba.com
Greece
2
nba.com
Honduras
6
nba.com
Hong Kong
1
nba.com
India
7
nba.com
Indonesia
4
nba.com
Ireland
3
nba.com
Japan
9
nba.com
Mexico
2
nba.com
New Zealand
1
nba.com
Norway
1
nba.com
Philippines
1
nba.com
Poland
9
nba.com
Serbia
2
nba.com
South Korea
3
nba.com
Taiwan
1
nba.com
Thailand
1
nba.com
Ukraine
1
nba.com
United States
6
nba.com
Venezuela
4
nba.com
Two domains trending in multiple locations on Saturday, June 24, were: rt.com, a Russian news site in English, and liveuamap.com, a site with interactive map of Ukraine. These are probably the effects of the events related to the Wagner group on June 23 and 24. Related to the same events, domain jetphotos.com was trending on the same day in Russia, Norway and Albania.
Trending Today data from Saturday, June 24, 2023:
Location
Trending rank
Domain
Armenia
4
rt.com
Australia
5
rt.com
Belgium
2
rt.com
Bulgaria
9
rt.com
Canada
6
rt.com
Denmark
6
rt.com
Greece
6
rt.com
Italy
2
rt.com
Kazakhstan
8
rt.com
Lebanon
4
rt.com
Netherlands
8
rt.com
Papua New Guinea
9
rt.com
Singapore
2
rt.com
Spain
6
rt.com
Turkey
4
rt.com
United Kingdom
5
rt.com
United States
3
rt.com
Uzbekistan
2
rt.com
Other domains trending in various locations on Friday and Saturday were different Gaming and Video Streaming domains such as roblox.com, twitch.tv and callofduty.com, showing an increased interest in gaming activities as the weekend approaches.
Yet another interesting effect of the weekend was the presence of five weather forecast sites on the top 10 trending sites on Friday, in Croatia, showing preoccupation with the summer weekend plans.
Trending Today in Croatia (data from Friday, June 23, 2023)
Trending rank
Domain
Category
1
lightningmaps.org
Weather; Education
2
freemeteo.com.hr
Weather
3
Vrijeme.hr (Croatian Meteorological and Hydrological Service)
Politics, Advocacy, and Government-Related
4
arso.gov.si
5
rain-alarm.com
Weather; News & Media
6
sorbs.net
Information Security
7
neverin.hr
Information Technology
8
meteo.hr (Croatian Meteorological and Hydrological Service)
Business
9
gamespot.com
Gaming; Video Streaming
10
grad.hr
Business
These were all examples of daily trending domains, but what domains have steadily grown in popularity that week?
In multiple countries we had travel sites trending that week, sites such as booking.com, rentcars.com and amadeus.com, as many people were making their summer vacation plans. Weather forecast, specifically windy.com domain, was also trending the whole week in locations such as the Dominican Republic, Saint Lucia and Reunion, which was not surprising as the hurricane season began.
Trending This Week (Week June 17 -23, 2023)
Dominican Republic
Reunion
Saint Lucia
cecomsa.com
atera.com
adition.com
blur.io
sharethis.com
windy.com
pxfuel.com
windy.com
bbc.co.uk
windy.com
baidu.com
ampproject.org
mihoyo.com
inmobi.com
aniview.com
Final words
Both Trending Today and Trending This Week top 10 lists are now available on Radar starting today and on Radar API. Feel free to explore them and see what is trending on the Internet.
Visit Cloudflare Radar for additional insights around (Internet disruptions, routing issues, Internet traffic trends, attacks, Internet quality, etc.). Follow us on social media at @CloudflareRadar (Twitter), cloudflare.social/@radar (Mastodon), and radar.cloudflare.com (Bluesky), or contact us via e-mail.
Popular domains are domains of broad appeal based on how people use the Internet. Trending domains are domains that are generating a surge in interest.
On the week of July 10, 2023, we launched a new capability for Zone Versioning – Version Comparisons. With Version Comparisons, you can quickly get a side by side glance of what changes were made between two versions. This makes it easier to evaluate that a new version of your zone’s configuration is correct before deploying to production.
A quick recap about Zone Versioning
Zone Versioning was launched at the start of 2023 to all Cloudflare Enterprise customers and allows you to create and manage independent versions of your zone configuration. This enables you to safely configure a set of configuration changes and progressively roll out those changes together to predefined environments of traffic. Having the ability to carefully test changes in a test or staging environment before deploying them to production, can help catch configuration issues before they can have a large impact on your zone’s traffic. See the general availability announcement blog for a deeper dive on the overall capability.
Why we built Version Comparisons
Diff is a well known and often used tool by many software developers to quickly understand the difference between two files. While originally just a command line utility it is now ubiquitous across the software world. Most commonly used in code reviews, software developers use ‘diffs’ to ensure they can validate the set of changes they intend to make to a codebase and to allow others to easily review their code by focusing on what changed. One of the drawbacks of graphical user interfaces (GUIs) for managing configurations is since they aren’t ‘files’, tools like diff don’t work for them. This was true with Zone Versioning, as to try and understand what had changed between two versions you would need to manually inspect each version and the various sections of the dashboard across both versions. This is quite tedious and error-prone, so it can reduce the safety that versioning can provide.
With Version Comparisons, we are bringing the same capabilities of diff but without the need for using a command line to allow customers to compare two versions side by side. This makes the process of understanding which configurations of your zone changed between two versions easy, quick and painless. By pointing out which config has changed, you can have greater confidence that deploying a new version of your configuration will not create any surprises. Let’s now look at how to use Version Comparisons in the Cloudflare Dashboard.
Using Version Comparisons
After navigating to a zone that has Zone Versioning enabled, select ‘Version Management’ in the left-hand navigation. For help getting started with Zone Versioning, see our dev docs.
After selecting the ‘Version Management’ tab you will notice a third option – ‘Comparisons’. Selecting that will prompt you to select two versions to compare. Select the two version you want to compare and then select ‘Compare’
After a few seconds, the page will update automatically with a comparison on a per-product basis. The lower numbered version will always be presented on the left and the top will show you which environments the versions are assigned to so that you can ensure you are comparing the right versions. A common use case would be to compare the versions in staging and production to verify the changes before promoting the staging version to production.
Any products with changes will have ‘changes detected’ noted next to them. Selecting one will open up the diff of that product across both versions.
Changes will be highlighted for new additions and removals for that service. Based on the comparison, you can then decide if more changes are necessary or if that new version is ready to be rolled out.
Try out Version Comparisons today
Versions comparisons are available to all customers using Zone Versioning! If you are a Cloudflare Enterprise customer, to get started using Zone Versioning and Version Comparisons, check out our dev docs.
Organizations that replace their corporate network and security appliances with a cloud-based solution trust that provider with how their employees work each and every day. Cloudflare One, our comprehensive Secure Access Service Edge (SASE) offering, helps more than 10,000 organizations deploy a remote access and Internet security solution that is faster than industry competitors. Starting today, administrators can measure that experience on their own and hold us accountable to that standard.
Cloudflare’s Digital Experience Monitoring (DEX) product gives teams of any size the same toolkit that we use to measure our own global network that powers nearly one-fourth of the Internet each day. Customers of Cloudflare One can now measure the experience that their team members have connecting to the Internet – whether they need that data for troubleshooting, evaluating carrier and ISP performance, or just understanding how their employees work.
We are excited to share today that DEX is now in open beta for all Cloudflare One customers. Administrators can begin running tests and evaluating network performance with any device enrolled using the Cloudflare One agent. Today’s announcement opens up these tools to every customer, but we are just getting started – we want your feedback to help us continue to improve the experience as we build more observability into Cloudflare’s SASE solution.
Monitor performance & availability of public or private applications with Synthetic Application Monitoring
Picture this: you're at the helm of a diverse team, using Google Mail as their main communication hub. When everyone worked from the same office, spotting a slowdown with Google Mail or its provider was relatively straightforward. But in today's remote environment, ensuring the consistent performance of such a critical resource can become a labyrinthine task.
Synthetic Application Monitoring shines a light through this maze. With the ability to schedule HTTP GET tests that target Gmail at specified intervals, you're not merely monitoring performance — you're safeguarding your team's access to crucial communication lines, irrespective of their global locations.
What sets Synthetic Application Monitoring apart isn't just its user-friendly setup, but the powerful insights derived from Cloudflare's extensive network. With our network's global reach, you can track response time averages from various locations, painting a realistic picture of your application's performance as experienced by your users worldwide.
Test results visualize resource fetch times, exemplifying the unique strengths of Cloudflare's expansive network. The HTTP GET tests harness the speed and reliability of the nearest data center in our network, providing an accurate reflection of your users' experiences. This graph translates raw data into an easy-to-read timeline, helping you identify trends, spot anomalies, and optimize application performance using the insights garnered.
With DEX, you get a reliable and precise view of server and DNS response times from around the world. The time series format allows you to spot trends, identify peak periods, and pinpoint potential issues with ease. This isn't just data—it's actionable intelligence that helps you optimize server configurations, DNS settings, and ultimately, your users' digital experience. Essentially, these charts are more than visual aids; they are strategic tools, using Cloudflare's network to enhance your application's performance management.
The time series chart depicting HTTP status codes is another powerful tool in the DEX arsenal. Drawing from the wealth of data traversing our globally distributed network, it lets you quickly visualize the frequency of each status code over time. This granular perspective allows you to detect and investigate anomalies, such as a sudden surge of client or server errors. By making HTTP status codes more comprehensible, it equips you to swiftly identify and troubleshoot potential issues that can impact user experience.
Synthetic Application Monitoring is more than a product; it's a strategic ally that harnesses the might of Cloudflare's network, ensuring your applications deliver the reliable, high-quality experience your users expect and deserve.
Understand the state of WARP-enrolled devices with Fleet Status
Zero Trust solutions replace legacy private networks with a model that assumes all connection attempts are suspicious. A Zero Trust network denies access attempts by default and forces every connection or request to prove that access should be granted.
A large component of proof is the identity of the end user, but the device itself also provides a signal about access rights. Whether the device is managed by the enterprise, healthy and patched, or assigned to a given user can determine permissions within Cloudflare One. For customers who rely on Cloudflare One to give their users a secure path to the rest of the Internet, the device also becomes an on-ramp for those team members connecting through Cloudflare.
We kept hearing from customers who wanted to better understand their device fleet using the data that Cloudflare could gather.
As part of today’s launch, we are introducing Fleet Status. Fleet Status provides real-time insights into the status of all of your client devices’ connection, mode, and location on both a global and per-device basis. This is achieved via Cloudflare WARP. Cloudflare WARP is a client which allows companies to protect corporate devices by securely and privately sending traffic from those devices to Cloudflare’s global network, where Cloudflare Gateway can apply advanced web filtering. The WARP client also makes it possible to apply advanced Zero Trust policies that check for a device’s health before it connects to corporate applications.
Fleet Status, with its data visualizations, detailed per-device views, and time-series charts, transforms the way administrators understand their deployment. Picture a network administrator who oversees a fleet of WARP-enrolled devices scattered worldwide, each contributing to the organization's vital operations. Suddenly, an issue arises. A group of devices in a specific location is unexpectedly disconnecting or changing connection methods.
With traditional methods, identifying the issue itself would be a time-consuming endeavor. However, Fleet Status enables real-time insights to be at the administrator's fingertips, quickly providing a global snapshot of devices, highlighting the ones experiencing anomalies.
The per-device view allows further investigation into these specific devices, presenting granular details like device location, client platform, version, client connection state, and connection methods. Meanwhile, time-series charts plot data over time, helping to identify if the disconnects or changes are an anomaly or a part of a recurring pattern.
Armed with these insights, the administrator can work proactively to ensure connectivity issues are addressed, leading to minimal disruption and maximum productivity. Fleet Status isn't just about presenting data; it's about empowering administrators with actionable insights when they need them most.
What’s next
Our journey doesn't end here. As we continue to build DEX, we are committed to adding more visibility and refining test customization. These enhancements will equip you with the resources to proactively troubleshoot issues and understand your Zero Trust Deployment.
Getting started with DEX is a breeze. If you're an existing Cloudflare One user, simply log in to your dashboard and navigate to the DEX beta section – no activation needed. We can’t wait for you to build tests and start leveraging DEX’s insights immediately!
If you're new to Cloudflare One, we've got you covered. Sign up for our free plan, which provides DEX for up to 50 users at no cost. For our Enterprise Plan users, ten synthetic application tests are part of your package. If you're on any other plan, you can create up to five tests.
We also need your feedback. Want to tell us more about what you would like to see next? Let us know at this form or this community forum post.
During Cloudflare's 2023 Developer Week, we announced Constellation, a set of APIs that allow everyone to run fast, low-latency inference tasks using pre-trained machine learning/AI models, directly on Cloudflare’s network.
Constellation update
We now have a few thousand accounts onboarded in the Constellation private beta and have been listening to our customer's feedback to evolve and improve the platform. Today, one month after the announcement, we are upgrading Constellation with three new features:
Bigger models We are increasing the size limit of your models from 10 MB to 50 MB. While still somewhat conservative during the private beta, this new limit opens doors to more pre-trained and optimized models you can use with Constellation.
Tensor caching When you run a Constellation inference task, you pass multiple tensor objects as inputs, sometimes creating big data payloads. These inputs travel through the wire protocol back and forth when you repeat the same task, even when the input changes from multiple runs are minimal, creating unnecessary network and data parsing overhead.
The client API now supports caching input tensors resulting in even better network latency and faster inference times.
XGBoost runtime Constellation started with the ONNX runtime, but our vision is to support multiple runtimes under a common API. Today we're adding the XGBoost runtime to the list.
XGBoost is an optimized distributed gradient boosting library designed to be highly efficient, flexible, and portable, and it's known for its performance in structured and tabular data tasks.
You can start uploading and using XGBoost models today.
You can find the updated documentation with these new features and an example on how to use the XGBoost runtime with Constellation in our Developers Documentation.
An era of globally distributed AI
Since Cloudflare’s network is globally distributed, Constellation is our first public release of globally distributed machine learning.
But what does this mean? You may not think of a global network as the place to deploy your machine learning tasks, but machine learning has been a core part of what’s enabled much of Cloudflare’s core functionality for many years. And we run it across our global network in 300 cities.
Is this large spike in traffic an attack or a Black Friday sale? What’s going to be the best way to route this request based on current traffic patterns? Is this request coming from a human or a bot? Is this HTTP traffic a zero-day? Being able to answer these questions using automated machine learning and AI, rather than human intervention, is one of the things that’s enabled Cloudflare to scale.
But this is just a small sample of what globally distributed machine learning enables. The reason this was so helpful for us was because we were able to run this machine learning as an integrated part of our stack, which is why we’re now in the process of opening it up to more and more developers with Constellation.
As Michelle Zatlyn, our co-founder likes to say, we’re just getting started (in this space) — every day we’re adding hundreds of new users to our Constellation beta, testing out and globally deploying new models, and beyond that, deploying new hardware to support the new types of workloads that AI will bring to the our global network.
With that, we wanted to share a few announcements and some use cases that help illustrate why we’re so excited about globally distributed AI. And since it’s Speed Week, it should be no surprise that, well, speed is at the crux of it all.
Custom tailored web experiences, powered by AI
We’ve long known about the importance of performance when it comes to web experiences — in e-commerce, every second of page load time can have as much as a 7% drop off effect on conversion. But being fast is not enough. It’s necessary, but not sufficient. You also have to be accurate.
That is, rather than serving one-size-fits-all experiences, users have come to expect that you know what they want before they do.
So you have to serve personalized experiences, and you have to do it fast. That’s where Constellation can come into play. With Constellation, as a part of your e-commerce application that may already be served from Cloudflare’s network through Workers or Pages, or even store data in D1, you can now perform tasks such as categorization (what demographic is this customer most likely in?) and personalization (if you bought this, you may also like that).
Making devices smarter wherever they are
Another use case where performance is critical is in interacting with the real world. Imagine a face recognition system that detects whether you’re human or not every time you go into your house. Every second of latency makes a difference (especially if you’re holding heavy groceries).
Running inference on Cloudflare’s network, means that within 95% of the world’s population, compute, and thus a decision, is never going to be more than 50ms away. This is in huge contrast to centralized compute, where if you live in Europe, but bought a doorbell system from a US-based company, may be up to hundreds of milliseconds round trip away.
You may be thinking, why not just run the compute on the device then?
For starters, running inference on the device doesn’t guarantee fast performance. Most devices with built in intelligence are run on microcontrollers, often with limited computational abilities (not a high-end GPU or server-grade CPU). Milliseconds become seconds; depending on the volume of workloads you need to process, the local inference might not be suitable. The compute that can be fit on devices is simply not powerful enough for high-volume complex operations, certainly not for operating at low-latency.
But even user experience aside (some devices don’t interface with a user directly), there are other downsides to running compute directly on devices.
The first is battery life — the longer the compute, the shorter the battery life. There's always a power consumption hit, even if you have a custom ASIC chip or a Tensor Processing Unit (TPU), meaning shorter battery life if that's one of your constraints. For consumer products, this means having to switch out your doorbell battery (lest you get locked out). For operating fleets of devices at scale (imagine watering devices in a field) this means costs of keeping up with, and swapping out batteries.
Lastly, device hardware, and even software, is harder to update. As new technologies or more efficient chips become available, upgrading fleets of hundreds or thousands of devices is challenging. And while software updates may be easier to manage, they’ll never be as easy as updating on-cloud software, where you can effortlessly ship updates multiple times a day!
Speaking of shipping software…
AI applications, easier than ever with Constellation
Speed Week is not just about making your applications or devices faster, but also your team!
For the past six years, our developer platform has been making it easy for developers to ship new code with Cloudflare Workers. With Constellation, it’s now just as easy to add Machine Learning to your existing application, with just a few commands.
And if you don’t believe us, don’t just take our word for it. We’re now in the process of opening up the beta to more and more customers. To request access, head on over to the Cloudflare Dashboard where you’ll see a new tab for Constellation. We encourage you to check out our tutorial for getting started with Constellation — this AI thing may be even easier than you expected it to be!
We’re just getting started
This is just the beginning of our journey for helping developers build AI driven applications, and we’re already thinking about what’s next.
We look forward to seeing what you build, and hearing your feedback.
When we originally announced WARP, we knew we were launching a product that was different from other VPNs. Cloudflare has not only hundreds more data centers than your typical VPN provider, but also a unique purview into the adoption of open Internet standards. The confluence of these two factors have led us to today’s announcement: support for MASQUE, a cutting-edge new protocol for the beta version of our consumer WARP iOS app.
MASQUE is a set of mechanisms that extend HTTP/3 and leverage the unique properties of the QUIC transport protocol to efficiently proxy IP and UDP traffic. Most importantly, it will make your Internet browsing experience faster and more stable without sacrificing privacy.
Like many products at Cloudflare, we’re offering this first as a free, consumer offering. Once we’ve had an opportunity to learn from what it’s like to operate MASQUE on mobile devices, at scale, we plan to integrate it into our Zero Trust enterprise product suite.
We’re not saying goodbye to Wireguard
When we first built WARP we chose to go with Wireguard for many reasons – among them, simplicity. This is where Wireguard shines: ~4,000 lines of code that use public-key cryptography to create an encrypted tunnel between one computer and another. The cryptographic parts – encapsulation and decapsulation – are fast, simple, and secure. This simplicity has allowed us to implement it cross-platform without much effort; today, we support Wireguard clients on iOS, Android, macOS, Windows, and Linux.
That being said, the protocol is not without its issues. Like many tradeoffs in technology, Wireguard’s strengths are also its drawbacks. While simple, it is also rigid: it’s not possible to extend it easily, for example, for session management, congestion control, or to recover more quickly from error-state behaviors we’re familiar with. Finally, neither the protocol nor the cryptography it uses are standards-based, making it difficult to keep up with the strongest known cryptography (post-quantum crypto, for example).
We want to move QUIC-ly
We’re excited about MASQUE because it fits into the way the Internet is evolving. According to this year’s usage report from our Radar team, HTTP/2 is currently the standard in use by the majority of Internet traffic, but HTTP/3 occupies a growing share – 28% as of June 2023. Cloudflare has always been dedicated towards adopting the cutting edge when it comes to standards: when RFC 9000 (the QUIC transport protocol) was published, we enabled it for all Cloudflare customers the very next day.
So why do we think HTTP/3 is so promising? Well, a lot of it has to do with solving performance issues with HTTP/2. HTTP/3 promises a number of things.
Faster connection establishment: the TCP+TLS handshake of earlier HTTP versions typically takes two to three round trips. QUIC performs the transport and security handshake at the same time, cutting down on the total required round trips.
No more head of line blocking: when one packet of information does not make it to its destination, it will no longer block all streams of information.
Agility and evolution: QUIC has strong extension and version negotiation mechanisms. And because it encrypts all but a few bits of its wire image, deploying new transport features is easier and more practical. In contrast, TCP evolution was hampered by middleboxes that failed to keep up with the times.
Naturally, we’d want the proxying protocol we use for so many people’s everyday browsing to take advantage of these benefits. For example, the QUIC unreliable datagram extension doesn't help much for standard web traffic but it's ideal for tunneling UDP or IP packets that expect an unreliable substrate beneath them. Without the unreliable aspect, the protocols on top can get upset and start to perform badly. Datagrams help unlock QUIC's proxying potential.
MASQUE: A new era for VPN performance and flexibility
You may have heard of HTTP GET, POST, and PUT, but what about CONNECT? HTTP-CONNECT is a method that opens up a tunnel between servers and proxies traffic between them. For a deeper dive, check out our Primer on Proxies. Many Cloudflare services use this method like so:
Clients send a CONNECT request, and if the proxy sends back a 2xx (success) status code, tunnel secured! Simple. However, remember that QUIC is UDP-based. Luckily, the MASQUE working group has figured out how to run multiple concurrently stream and datagram-based connections. Establishing one looks like this:
Here’s what this MASQUE proxying looks like:
From a development perspective, MASQUE also allows us to improve our performance in other ways: we’re already running it for iCloud Private Relay and other Privacy Proxy partners. The services that power these partnerships, from our Rust-based proxy framework to our open source QUIC implementation, are already deployed globally in our network and have proven to be fast, resilient, and reliable. We've already learned a lot about how to operate proxies at scale, but there’s plenty of room for improvement. The good news is that every performance improvement we make to speed up MASQUE-based connections for our WARP clients will also improve performance for our customers that use HTTP-CONNECT, and vice-versa.
From a protocol perspective, we also think that MASQUE will prove to be resilient over time. As you can see above, connections are made through port 443, which for both TCP and UDP blends in well with general HTTP/3 traffic and is less susceptible than Wireguard to blocking.
Finally, because MASQUE is an IETF standard, innovations via extensions are already underway. One we’re particularly excited about is Multipath QUIC, an extension whose implementation would allow us to use multiple concurrent network interfaces for a single logical QUIC connection. For example, using both LTE and WiFi on a single mobile device could allow for seamless switching between the two, helping to avoid pesky disruptions when you’re coming to and from work or home.
The magic of supporting MASQUE is that it combines some pretty cool (and very Cloudflare-y!) elements: a standards-based proxying protocol that provides real user-facing performance benefits, built upon Cloudflare’s widely available Anycast network, and encryption of that last-mile between that network and your phone.
So how can I use it?
If you’d like to join the waitlist for our beta tester program for MASQUE, you can sign up here.
You’ll first need to download Testflight on a valid iOS device. We will be sending out invites to download the app via Testflight first come, first served, as early as next week. Once you’ve downloaded the app, MASQUE will be available as the default connection in our beta iOS version, only available in iOS 17 (and up).
To toggle between Wireguard and MASQUE, go to Settings > Personalization > Protocol:
Protocols come and go, but our privacy promise remains the same
While the protocols that dominate the Internet may change, our promise to consumers remains the same – a more private Internet, free of cost. When using WARP, we still route all DNS queries through 1.1.1.1, our privacy-respecting DNS resolver; we will never write user-identifiable log data to disk; we will never sell your browsing data or use it in any way to target you with advertising data; and you can still use WARP without providing any personal information like your name, phone number, or email address.
In January 2021, we gave you a behind-the-scenes look at how we built Waiting Room on Cloudflare’s Durable Objects. Today, we are thrilled to announce the launch of Waiting Room Analytics and tell you more about how we built this feature. Waiting Room Analytics offers insights into end-user experience and provides visualizations of your waiting room traffic. These new metrics enable you to make well-informed configuration decisions, ensuring an optimal end-user experience while protecting your site from overwhelming traffic spikes.
If you’ve ever bought tickets for a popular concert online you’ll likely have been put in a virtual queue. That’s what Waiting Room provides. It keeps your site up and running in the face of overwhelming traffic surges. Waiting Room sends excess visitors to a customizable virtual waiting room and admits them to your site as spots become available.
While customers have come to rely on the protection Waiting Room provides against traffic surges, they have faced challenges analyzing their waiting room’s performance and impact on end-user flow. Without feedback about waiting room traffic as it relates to waiting room settings, it was challenging to make Waiting Room configuration decisions.
Up until now, customers could only monitor their waiting room's status endpoint to get a general idea of waiting room traffic. This endpoint displays the current number of queued users, active users on the site, and the estimated wait time shown to the last user in line.
The status endpoint is still a great tool for at a glance understanding of the near real-time status of a waiting room. However, there were many questions customers had about their waiting room that were either difficult or impossible to answer using the status endpoint, such as:
How long did visitors wait in the queue?
What was my peak number of visitors?
How long was the pre-queue for my online event?
How did changing my waiting room's settings impact wait times?
Today, Waiting Room is ready to answer those questions and more with the launch of Waiting Room Analytics, available in the Waiting Room dashboard to all Business and Enterprise plans! We will show you the new waiting room metrics available and review how these metrics can help you make informed decisions about your waiting room's settings. We'll also walk you through the unique challenge of how we built Waiting Room Analytics on our distributed network.
How Waiting Room settings impact traffic
Before covering the newly available Waiting Room metrics, let's review some key settings you configure when creating a waiting room. Understanding these settings is essential as they directly impact your waiting room's analytics, traffic, and user experience.
When configuring a waiting room, you will first define traffic limits to your site by setting two values–Total active users and New users per minute. Total active users is a target threshold for how many simultaneous users you want to allow on the pages covered by your waiting room. Waiting Room will kick in as traffic ramps up to keep active users near this limit. The other value which will control the volume of traffic allowed past your waiting room is New users per minute. This setting defines the target threshold for the maximum rate of user influx to your application. Waiting Room will kick in when the influx accelerates to keep this rate near your limits. Queuing occurs when traffic is at or near your New users per minute or Total active users target values.
The two other settings which will impact your traffic flow and user wait times are Session duration and session renewal. The session duration setting determines how long it takes for end-user sessions to expire, thereby freeing up spots on your site. If you enable session renewal, users can stay on your site as long as they want, provided they make a request once every session_duration minutes. If you disable session renewal, users' sessions will expire after the duration you set for session_duration has run out. After the session expires, the user will be issued a new waiting room cookie upon their next request. If there is active queueing, this user will be placed in the back of the queue. Otherwise, they can continue browsing for another session_duration minutes.
Let's walk through the new analytics available in the Waiting Room dashboard, which allows you to see how these settings can impact waiting room throughput, how many users get queued, and how long users wait to enter your site from the queue.
Waiting Room Analytics in the dash
To access metrics for a waiting room, navigate to the Waiting Room dashboard, where you can find pre-built visualizations of your waiting room traffic. The dashboard offers at-a-glance metrics for the peak waiting room traffic over the last 24 hours.
To dig deeper and analyze up to 30 days of historical data, open your waiting room's analytics by selecting View more.
Alternatively, we've made it easy to hone in on analytics for a past waiting room event (within the last 30 days). You can automatically open the analytics dashboard to a past event's exact start and end time, including the pre-queueing period by selecting the blue link in the events table.
User insights
The first two metrics–Time in queue and Time on origin–provide insights into your end-users' experience and behavior. The time in queue values help you understand how long queued users waited before accessing your site over the time period selected. The time on origin values shed light on end-user behavior by displaying an estimate of the range of time users spend on your site before leaving. If session renewal is disabled, this time will max out at session_duration and reflect the time at which users are issued a new waiting room cookie. For both metrics, we provide time for both the typical user, represented by a range of the 50th and 75th percentile of users, as well as for the top 5% of users who spend the longest in the queue or on your site.
If session renewal is disabled, keeping an eye on Time on origin values is especially important. When sessions do not renew, once a user's session has expired, they are given a new waiting room cookie upon their next request. The user will be put at the back of the line if there is active queueing. Otherwise, they will continue browsing, but their session timer will start over and your analytics will never show a Time on origin greater than your configured session duration, even if individual users are on your site longer than the session duration. If session renewal is disabled and the typical time on origin is close to your configured session duration, this could be an indicator you may need to give your users more time to complete their journey before putting them back in line.
Analyze past waiting room traffic
Scrolling down the page, you will find visualizations of your user traffic compared to your waiting room's target thresholds for Total active users and New users per minute. These two settings determine when your waiting room will start queueing as traffic increases. The Total active users setting controls the number of concurrent users on your site, while the New users per minute threshold restricts the flow rate of users onto your site.
To zoom in on a time period, you can drag your cursor from the left to the right of the time period you are interested in and the other graphs, in addition to the insights will update to reflect this time period.
On the Active users graph, each bar represents the maximum number of queued users stacked on top of the maximum number of users on your site at that point in time. The example below shows how the waiting room kicked in at different times with respect to the active user threshold. The total length of the bar illustrates how many total users were either on the site or waiting to enter the site at that point in time, with a clear divide between those two values where the active user threshold kicked in. Hover over any bar to display a tooltip with the exact values for the period you are interested in.
Easily identify peak traffic and when waiting room started queuing to protect your site from a traffic surge.
Below the Active users chart is the New users per minute graph, which shows the rate of users entering your application per minute compared to your configured threshold. Make sure to review this graph to identify any surges in the rate of users to your application that may have caused queueing.
The New users per minute graph helps you identify peaks in the rate of users entering your site which triggered queueing.This graph shows queued user and active user data from the same time period as the spike seen in New users per minute graph above. When analyzing your waiting room’s metrics, be sure to review both graphs to understand which Waiting Room traffic setting triggered queueing and to what extent.
Adjusting settings with Waiting Room Analytics
By leveraging the insights provided by the analytics dashboard, you can fine-tune your waiting room settings while ensuring a safe and seamless user experience. A common concern for customers is longer than desired wait times during high traffic periods. We will walk through some guidelines for evaluating peak traffic and settings’ adjustments that could be made.
Identify peak traffic. The first step is to identify when peak traffic occurred. To do so, zoom out to 30 days or some time period inclusive of a known high traffic event. Reviewing the graph, locate a period of time where traffic peaked and use your cursor to highlight from the left to right of the peak. This will zoom in to that time period, updating all other values on the analytics page.
Evaluate wait times. Now that you have honed in on the time period of peak traffic, review the Time in queue metric to analyze if the wait times during peak traffic were acceptable. If you determine that wait times were significantly longer than you had anticipated, consider the following options to reduce wait times for your next traffic peak.
Decrease session duration when session renewal is enabled. This is a safe option as it does not increase the allowed load to your site. By decreasing this duration, you decrease the amount of time it takes for spots to open up as users go idle. This is a good option if your customer journey is typically request heavy, such as a checkout flow. For other situations, such as video streaming or long-form content viewing, this may not be a good option as users may not make frequent requests even though they are not actually idle.
Disable session renewal. This option also does not increase the allowed load to your site. Disabling session renewal means that users will have session_duration minutes to stay on the site before being put back in the queue. This option is popular for high demand events such as product drops, where customers want to give as many users as possible a fair chance to participate and avoid inventory hoarding. When disabling session renewal, review your waiting room’s analytics to determine an appropriate session duration to set.
The Time on origin values will give you an idea of how long users need before leaving your site. In the example below, the session duration is set to 10 minutes but even the users who spend the longest only spend around 5 minutes on the site. With the session renewal disabled, this customer could reduce wait times by decreasing the session duration to 5 minutes without disruption to most users, allowing for more users to get access.
Adjust Total active users or New users per minute settings. Lastly, you can decrease wait times by increasing your waiting room’s traffic limits–Total active users or New users per minute. This is the most sure-fire way to reduce wait times but it also requires more consideration. Before increasing either limit, you will need to evaluate if it is safe to do so and make small, iterative adjustments to these limits, monitoring certain signals to ensure your origin is still able to handle the load. A few things to consider monitoring as you adjust settings are origin CPU usage and memory utilization, and increases in 5xx errors which can be reviewed in Cloudflare’s Web Analytics tab. Analyze historical traffic patterns during similar events or periods of high demand. If you observe that previous traffic surges were successfully managed without site instability or crashes, it provides a strong signal that you can consider increasing waiting room limits.
Utilize the Active user chart as well as the New users per minute chart to determine which limit is primarily responsible for triggering queuing so that you know which limit to adjust. After considering these signals and making adjustments to your waiting room’s traffic limits, closely monitor the impact of these changes using the waiting room analytics dashboard. Continuously assess the performance and stability of your site, keeping an eye on server metrics and user feedback.
How we built Waiting Room Analytics
At Cloudflare, we love to build on top of our own products. Waiting Room is built on Workers and Durable Objects. Workers have the ability to auto-scale based on the request rate. They are built using isolates enabling them to spin up hundreds or thousands of isolates within 5 milliseconds without much overhead. Every request that goes to an application behind a waiting room, goes to a Worker.
We optimized the way in which we track end users visiting the application while maintaining their position in the queue. Tracking every user individually would incur more overhead in terms of maintaining state, consuming more CPU & memory. Instead, we decided to divide the users into buckets based on the timestamp of the first request made by the end user. For example, all the users who visited a waiting room between 00:00:00 and 00:00:59 for the first time are assigned to the bucket 00:00:00. Every end user gets a unique encrypted cookie on the first request to the waiting room. The contents of the cookie keep getting updated based on the status of the users in the queue. Once the end user is accepted to the origin, we set the cookie expiry to session_duration minutes, which can be set in the dashboard, from the last request timestamp. In the cookie we track the timestamp of when the end user joined the queue which is used in the calculation of time waited in queue.
Collection of metrics in a distributed environment
a
In a distributed environment, the challenge when building out analytics is to collect data from multiple nodes and aggregate them. Each worker running at every data center sees user requests and needs to report metrics based on those to another coordinating service at every data center. The data aggregation could have been done in two ways.
i) Writing data from every worker when a request is received In this design, every worker that receives a request is responsible for reporting the metrics. This would enable us to write the raw data to our analytics pipeline. We would not have the overhead of aggregating the data before writing. This would mean that we would write data for every request, but Waiting Room configurations are minute based and every user is put into a bucket based on the timestamp of the first request. All our configurations are minute and user based and the data written from workers is not related to time or user.
ii) Using the existing aggregation pipeline Waiting Room is designed in such a way that we do not track every request, instead we group users into buckets based on the first time we saw them. This is tracked in the cookie that is issued to the user when they make the first request. In the current system, the data reported by the workers is sent upstream to the data center coordinator which is responsible for aggregating the data seen from all the workers for that particular data center. This aggregated data is then further processed and sent upstream to the global Durable Object which aggregates the data from all the other data centers. This data is used for making decisions whether to queue the user or to send them to the origin.
We decided to use the existing pipeline that is used for Waiting Room routing for analytics. Data aggregated this way provides more value to customers as it matches the model we use for routing decisions. Therefore, customers can see directly how changing their settings affects waiting room behavior. Also, it is an optimization in terms of space. Instead of writing analytics data per request, we are writing a pre-processed and aggregated analytics log every minute. This way the data is much less noisy.
This diagram depicts that multiple workers from different locations receive requests and talk to the data center coordinators respectively which aggregate data and report the aggregated keys upstream to the Global Durable Object. The Global Durable Objects further aggregate all the keys received from the data center coordinators to compute a global aggregate key.
Histograms
The metrics available via Cloudflare’s GraphQL API are a combination of configured values set by the customer when creating a waiting room and values that are computed based on traffic seen by a waiting room. Waiting Room aggregates data every minute for each metric based on the requests it sees. While some metrics like new users per minute, total active users are counts and can be pre-processed and aggregated with a simple summation, metrics like time on origin and total time waited in queue cannot simply be added together into a single metric.
For example, there could be users who waited in the queue for four minutes and there could be a new user who joined the queue two minutes ago. However, if we simply sum these two data points, it would not make sense because six minutes would be an incorrect representation of the total time waited in the queue. Therefore, to capture this value more accurately, we store the data in a histogram. This enables us to represent the typical case (50th percentile) and the approximate worst case (in this case 95th percentile) for that metric.
Intuitively, we decided to store time on origin and total time waited in queue into a histogram distribution so that we would be able to represent the data and calculate quantiles precisely. We used Hdr Histogram – A High Dynamic Range Histogram for recording the data in histograms. Hdr Histograms are scalable and we were able to record dynamic numbers of values with auto-resizing without inflating CPU, memory or introducing latency. The time to record a value in the Hdr Histograms range from 3-6 nanoseconds. Querying and recording values can be done in constant time. Two histogram data structures can simply be added together into a bigger histogram. Also, the histograms can be compressed and encoded/decoded into base64 strings. This enabled us to scalably pass the data structure within our internal services for further aggregation.
The memory footprint of hdr histograms is constant and depends on the size of the bucket, precision and range of the histogram. The size of the bucket we use is the default 32 bits bucket size. The precision of the histogram is set to include up to three significant digits. The histogram has a dynamic range of values enabled through the use of the auto-resize functionality. However, to ensure efficient data storage, a limit of 5,000 recorded points per minute has been imposed. Although this limit was chosen arbitrarily, it has proven to be adequate for storing data points transmitted from the workers to the Durable Objects on a minute-by-minute basis.
The requests to the website behind a Waiting Room go to a Cloudflare data center that is close to their location. Our workers from around the world record values in the histogram which is compressed and sent to the data center Durable Object periodically. The histograms from multiple workers are uncompressed and aggregated into a single histogram per data center. The resulting histogram is compressed and sent upstream to the Global Durable objects where the histograms from all data centers receiving traffic are uncompressed and aggregated. The resulting histogram is the final data structure which is used for statistical analysis. We directly query the aggregated histogram for the quantile values. The histogram objects were instantiated once at the start of the service, they were reset after every successful sync with the upstream service.
Writing data to the pipeline
The global Durable Object aggregates all the metrics, computes quantiles and sends the data to a worker which is responsible for analytics reporting. This worker reads data from Workers KV in order to get the Waiting Room configurations. All the metrics are aggregated into a single analytics message. These messages are written every minute to Clickhouse. We leveraged an internal version of Workers Analytics Engine in order to write the data. This allowed us to quickly write our logs to Clickhouse with minimum interactions with all the systems involved in the pipeline.
We write analytics events from the runtime in the form of blobs and doubles with a specific schema and the event data gets written to a Clickhouse cluster. We extract the data into a Clickhouse view and apply ABR to facilitate fast queries at any timescale. You can expand the time range to vary from 30 minutes to 30 days without any lag. ABR adaptively chooses the resolution of data based on the query. For example, it would choose a lower resolution for a long time range and vice versa. As of now, the analytics data is available in the Clickhouse table for 30 days, implying that you can not query data older than 30 days in the dashboard as well.
Sampling
Waiting Room Analytics samples the data in order to effectively run large queries while providing consistent response times. Indexing the data on Waiting Room id has enabled us to run quicker and more efficient scans, however we still need to elegantly handle unbounded data. To tackle this we use Adaptive Bit Rate which enables us to write the data at multiple resolutions (100%, 10%, 1%…) and then read the best resolution of the data. The sample rate “adapts” based on how long the query takes to run. If the query takes too long to run in 100% resolution, the next resolution is picked and so on until the first successful result. However, since we pre-process and aggregate data before writing to the pipeline, we expect 100% resolution of data on reads for shorter periods of time (up to 7 days). For a longer time range, the data will be sampled.
Get Waiting Room Analytics via GraphQL API
Lastly, to make metrics available to customers and to the Waiting Room dashboard, we exposed the analytics data available in Clickhouse via GraphQL API.
If you prefer to build your own dashboards or systems based on waiting room traffic data, then Waiting Room Analytics via GraphQL API is for you. Build your own custom dashboards using the GraphQL framework and use a GraphQL client such as GraphiQL to run queries and explore the schema.
The Waiting Room Analytics dataset can be found under the Zones Viewer as waitingRoomAnalyticsAdaptive and waitingRoomAnalyticsAdaptiveGroups. You can filter the dataset per zone, waiting_room_id and the request time period, see the dataset schema under ZoneWaitingRoomAnalyticsAdaptive. You can order the data by ascending or descending order of the metric values.
You can explore the dimensions under waitingRoomAnalyticsAdaptiveGroups that can be used to group the data based on time, Waiting Room id and so on. The "max", “min”, “avg”, “sum” functions give the maximum, minimum, average and sum values of a metric aggregated over a time period. Additionally, there is a function called "avgWeighted" that calculates the weighted average of the metric. This approach is used for metrics stored in histograms, such as the time spent on the origin and total time waited. Instead of using a simple average, the weighted average is computed to provide a more accurate representation. This approach takes into account the distribution and significance of different data points, ensuring a more precise analysis and interpretation of the metric.
For example, to evaluate the weighted average for time spent on origin, the value of total active users is used as a weight. To better illustrate this concept, let’s consider an example. Imagine there is a website behind a Waiting Room and we want to evaluate the average time spent on the origin over a certain time period, let’s say an hour. During this hour, the number of active users on the website fluctuates. At some points, there may be more users actively browsing the site while at other times the number of active users might decrease. To calculate the weighted average for the time spent on the origin, we take into account the number of total active users at each instant in time. The rationale behind this is that the more users are actively using the website, the more representative their time spent on origin becomes in relation to the overall user activity.
By incorporating the total active users as weights in the calculation, we give more importance to the time spent on the origin during periods when there are more users actively engaging with the website. This provides a more accurate representation of the average time spent on the origin, accounting for variations in user activity throughout the designated time period.
The value of new users per minute is used as a weight to compute the weighted average for total time waited in queue. This is because when we talk about the total time weighted in the queue, the value of new users per minute for that instant in time takes importance as it signifies the number of users that joined the queue and certainly went into the origin.
You can apply these aggregation functions to the list of metrics exposed under each function. However, if you just want the logs per minute for a time period, rather than the breakdown of the time period (minute, fifteen minutes, hours), you can remove the datetime dimension from the query. For a list of sample queries to get you started, refer to our dev docs.
Below is a query to calculate the average, maximum and minimum of total active users, estimated wait time, total queued users and session duration every fifteen minutes. It also calculates the weighted average of time spent in queue and time spent on origin. The query is done on the zone level. The response is obtained in a JSON format.
Following is an example query to find the weighted averages of time on origin (50th percentile) and total time waited (90th percentile) for a certain period and aggregate this data over one hour.
You can find more examples in our developer documentation. Waiting Room Analytics is live and available to all Business and Enterprise customers and we are excited for you to explore it! Don’t have a waiting room set up? Make sure your site is always protected from unexpected traffic surges. Try out Waiting Room today!
Developer Week 2023 is officially a wrap. Last week, we shipped 34 posts highlighting what has been going on with our developer platform and where we’re headed in the future – including new products & features, in-depth tutorials to help you get started, and customer stories to inspire you.
We’ve loved already hearing feedback from you all about what we’ve shipped:
🤯 Serverless machine learning deployments – OMG! We used to need a team of devops to deploy a todo list MVP, it’s now 3 clicks with workers. They’re gonna do the same with ML workloads. Just like that. Boom. https://t.co/AcKUQ79fv0
Love this direction, for open source, for demos and running things on edge.
It's still in development, but as someone who've built an AI product on top of Cloudflare and has been asking for something like this, I'm really excited! https://t.co/AnywRDqecb
Yes! Loving this! I definitely this is the right direction and will help the general DevX and onboarding to the platform a lot ❤️! https://t.co/rEQWreeS96
We hope you’re able to spend the coming weeks slinging some code and experimenting with some of the new tools we shipped last week. As you’re building, join us in our developers discord and let us know what you think.
In case you missed any of our announcements here’s a handy recap:
The emergence of large language models (LLMs) is going to change the way developers write, debug, and modify code. Developer Platforms need to evolve to integrate AI capabilities to assist developers in their journeys.
Run pre-trained machine learning models and inference tasks on Cloudflare’s global network with Constellation AI. We’ll maintain a catalog of verified and ready-to-use models, or you can upload and train your own.
When getting started with a new technology comes a lot of questions on how to get started. Finding answers quickly is a time-saver. To help developers build in the fastest way possible we’ve introduced Cursor, an experimental AI assistant, to answer questions you may have about the Developer Platform. The assistant responds with both text and relevant links to our documentation to help you go further.
ChatGPT, recently allowed the ability for developers to create custom extensions to make ChatGPT even more powerful. It’s now possible to provide guidance to the conversational workflows within ChatGPT such as up-to-date statistics and product information. We’ve published plugins for Radar and our Developer Documentation and a tutorial showing how you can build your own plugin using Workers.
With any new technology comes concerns about risk and AI is no different. If you want to build with AI and maintain a Zero Trust security posture, Cloudflare One offers a collection of features to build with AI without increased risk. We’ve also compiled some best practices around securing your LLM.
Training large language models requires massive amount of compute which has led AI companies to look at multi-cloud architectures, with R2 and MosaicML companies can build these infrastructures at a fraction of the cost.
AI startups no longer need affiliation with an accelerator or an employee referral to gain access to the Startup Program. Bootstrapped AI startups can apply today to get free access to Cloudflare services including R2, Workers, Pages, and a host of other security and developer services.
A tutorial on building your first LangChainJS and Workers application to build more sophisticated applications by switching between LLMs or chaining prompts together.
We’ve partnered with other database providers, including Neon, PlanetScale, and Supabase, to make authenticating and connecting back to your databases there just work, without having to copy-paste credentials and connection strings back and forth.
Connect back to existing PostgreSQL and MySQL databases directly from Workers with outbound TCP sockets allowing you to connect to any database when building with Workers.
D1 is now not only significantly faster, but has a raft of new features, including the ability to time travel: restore your database to any minute within the last 30 days, without having to make a manual backup.
Bringing compute closer to the end user isn’t always the right answer to improve performance. Smart Placement for Workers and Pages Functions moves compute to the optimal location whether that is closer to the end user or closer to backend services and data.
Get valuable insights from your data when you use Snowflake to query data stored in your R2 data lake and load data from R2 into Snowflake’s Data Cloud.
Create Cloudflare CLI (C3) is a companion CLI to Wrangler giving you a single entry-point to configure Cloudflare via CLI. Pick your framework, all npm dependencies are installed, and you’ll receive a URL for where your application was deployed.
Manage all your Workers scripts and Pages projects from a single place in the Cloudflare dashboard. Over the next year we’ll be working to converge these two separate experiences into one eliminating friction when building.
Now in beta, the build system for Pages includes the latest versions of Node.js, Python, Hugo, and more. You can opt in to use this for existing projects or stay on the existing system, so your builds won’t break.
Having a local development environment that mimics production as closely as possible helps to ensure everything runs as expected in production. You can test every aspect prior to deployment. Wrangler 3 now leverages Miniflare3 based on workerd with local-by-default development.
Our terms of service were not clear about serving content hosted on the Developer Platform via our CDN. We’ve made it clearer that customers can use the CDN to serve video and other large files stored on the Developer Platform including Images, Pages, R2, and Stream.
A retrospective on the first year of Workers for Platform, what’s coming next, and featuring how customers like Shopify and Grafbase are building with it.
Deploy a Worker script that requires Browser Rendering capabilities through Wrangler.
Watch on Cloudflare TV
If you missed any of the announcements or want to also view the associated Cloudflare TV segments, where blog authors went through each announcement, you can now watch all the Developer Week videos on Cloudflare TV.
The Workers Browser Rendering API allows developers to programmatically control and interact with a headless browser instance and create automation flows for their applications and products.
Since the private beta announcement, based on the feedback we've been receiving and our own roadmap, the team has been working on the developer experience and improving the platform architecture for the best possible performance and reliability. Today we enter the open beta and will start onboarding the customers on the wait list.
Developer experience
Starting today, Wrangler, our command-line tool for configuring, building, and deploying applications with Cloudflare developer products, has support for the Browser Rendering API bindings.
Bindings allow your Workers to interact with resources on the Cloudflare developer platform. In this case, they will provide your Worker script with an authenticated endpoint to interact with a dedicated Chromium browser instance.
This is all you need in your wrangler.toml once this service is enabled for your account:
browser = { binding = "MYBROWSER", type = "browser" }
Now you can deploy any Worker script that requires Browser Rendering capabilities. You can spawn Chromium instances and interact with them programmatically in any way you typically do manually behind your browser.
Under the hood, the Browser Rendering API gives you access to a WebSocket endpoint that speaks the DevTools Protocol. DevTools is what allows us to instrument a Chromium instance running in our global network, and it's the same protocol that Chrome uses on your computer when you inspect a page.
With enough dedication, you can, in fact, implement your own DevTools client and talk the protocol directly. But that'd be crazy; almost no one does that.
So…
Puppeteer
Puppeteer is one of the most popular libraries that abstract the lower-level DevTools protocol from developers and provides a high-level API that you can use to easily instrument Chrome/Chromium and automate browsing sessions. It's widely used for things like creating screenshots, crawling pages, and testing web applications.
Puppeteer typically connects to a local Chrome or Chromium browser using the DevTools port.
We forked a version of Puppeteer and patched it to connect to the Workers Browser Rendering API instead. The changes are minimal; after connecting the developers can then use the full Puppeteer API as they would on a standard setup.
In the long term, we will update Puppeteer to keep matching the version of our Chromium instances infrastructure running in our network.
Developer documentation
Following the tradition with other Developer products, we created a dedicated section for the Browser Rendering APIs in our Developer's Documentation site.
You can access this page to learn more about how the service works, Wrangler support, APIs, and limits, and find examples of starter templates for common applications.
An example application: taking screenshots
Taking screenshots from web pages is one of the typical cases for browser automation.
Let's create a Worker that uses the Browser Rendering API to do just that. This is a perfect example of how to set up everything and get an application running in minutes, it will give you a good overview of the steps involved and the basics of the Puppeteer API, and then you can move from here to other more sophisticated use-cases.
Step one, start a project, install Wrangler and Cloudflare’s fork of Puppeteer:
Step two, let’s create the simplest possible wrangler.toml configuration file with the Browser Rendering API binding:
name = "browser-worker"
main = "src/index.ts"
compatibility_date = "2023-03-14"
node_compat = true
workers_dev = true

browser = { binding = "MYBROWSER", type = "browser" }
Step three, create src/index.ts with your Worker code:
import puppeteer from "@cloudflare/puppeteer";

export default {
    async fetch(request: Request, env: Env): Promise<Response> {
        const { searchParams } = new URL(request.url);
        let url = searchParams.get("url");
        let img: Buffer;
        if (url) {
            const browser = await puppeteer.launch(env.MYBROWSER);
            const page = await browser.newPage();
            await page.goto(url);
            img = (await page.screenshot()) as Buffer;
            await browser.close();
            return new Response(img, {
                headers: {
                    "content-type": "image/jpeg",
                },
            });
        } else {
            return new Response(
                "Please add the ?url=https://example.com/ parameter"
            );
        }
    },
};
That's it, no more steps. This Worker instantiates a browser using Puppeteer, opens a new page, navigates to whatever you put in the "url" parameter, takes a screenshot of the page, closes the browser, and responds with the JPEG image of the screenshot. It can't get any easier to get started with the Browser Rendering API.
Run npx wrangler dev –remote to test it and npx wrangler publish when you’re done.
You can explore the entire Puppeteer API and implement other functionality and logic from here. And, because it's Workers, you can add other developer products to your code. You might need a relational database, or a KV store to cache your screenshots, or an R2 bucket to archive your crawled pages and assets, or maybe use a Durable Object to keep your browser instance alive and share it with multiple requests, or queues to handle your jobs asynchronous, we have all of this and more.
You can also find this and other examples of how to use Browser Rendering in the Developer Documentation.
How do we use Browser Rendering
Dogfooding our products is one of the best ways to test and improve them, and in some cases, our internal needs dictate or influence our roadmap. Workers Browser Rendering is a good example of that; it was born out of our necessities before we realized it could be a product. We've been using it extensively for things like taking screenshots of pages for social sharing or dashboards, testing web software in CI, or gathering page load performance metrics of our applications.
But there's one product we've been using to stress test and push the limits of the Browser Rendering API and drive the engineering sprints that brought us to open the beta to our customers today: The Cloudflare Radar URL Scanner.
The URL Scanner scans any URL and compiles a full report containing technical, performance, privacy, and security details about that page. It's processing thousands of scans per day currently. It was built on top of Workers and uses a combination of the Browser Rendering APIs with Puppeteer to create enriched HAR archives and page screenshots, Durable Objects to reuse browser instances, Queues to handle customers' load and execute jobs asynchronously, and R2 to store the final reports.
This tool will soon have its own "how we built it" blog. Still, we wanted to let you know about it now because it is a good example of how you can build sophisticated applications using Browser Rendering APIs at scale starting today.
Future plans
The team will keep improving the Browser Rendering API, but a few things are worth mentioning today.
First, we are looking into upstreaming the changes in our Puppeteer fork to the main project so that using the official library with the Cloudflare Workers Browser Rendering API becomes as easy as a configuration option.
Second, one of the reasons why we decided to expose the DevTools protocol bare naked in the Worker binding is so that it can support other browser instrumentalization libraries in the future. Playwright is a good example of another popular library that developers want to use.
And last, we are also keeping an eye on and testing WebDriver BiDi, a "new standard browser automation protocol that bridges the gap between the WebDriver Classic and CDP (DevTools) protocols." Click here to know more about the status of WebDriver BiDi.
Final words
The Workers Browser Rendering API enters open beta today. We will gradually be enabling the customers in the wait list in batches and sending them emails. We look forward to seeing what you will be building with it and want to hear from you.
To provide the best experiences, we use technologies like cookies to store and/or access device information. Consenting to these technologies will allow us to process data such as browsing behavior or unique IDs on this site. Not consenting or withdrawing consent, may adversely affect certain features and functions.
Functional
Always active
The technical storage or access is strictly necessary for the legitimate purpose of enabling the use of a specific service explicitly requested by the subscriber or user, or for the sole purpose of carrying out the transmission of a communication over an electronic communications network.
Preferences
The technical storage or access is necessary for the legitimate purpose of storing preferences that are not requested by the subscriber or user.
Statistics
The technical storage or access that is used exclusively for statistical purposes.The technical storage or access that is used exclusively for anonymous statistical purposes. Without a subpoena, voluntary compliance on the part of your Internet Service Provider, or additional records from a third party, information stored or retrieved for this purpose alone cannot usually be used to identify you.
Marketing
The technical storage or access is required to create user profiles to send advertising, or to track the user on a website or across several websites for similar marketing purposes.