Post Syndicated from Ricky Robinett original http://blog.cloudflare.com/langchain-and-cloudflare/


We are incredibly stoked that our friends at LangChain have announced LangChainJS Support for Multiple JavaScript Environments (including Cloudflare Workers). During Developer Week 2023 we wanted to celebrate this launch and our future collaborations with LangChain.
“Our goal for LangChain is to empower developers around the world to build with AI. We want LangChain to work wherever developers are building, and to spark their creativity to build new and innovative applications. With this new launch, we can't wait to see what developers build with LangChainJS and Cloudflare Workers. And we're excited to put more of Cloudflare's developer tools in the hands of our community in the coming months.” – Harrison Chase, Co-Founder and CEO, LangChain
In this post, we’ll share why we’re so excited about LangChain and walk you through how to build your first LangChainJS + Cloudflare Workers application.
For the uninitiated, LangChain is a framework for building applications powered by large language models (LLMs). It not only lets you fairly seamlessly switch between different LLMs, but also gives you the ability to chain prompts together. This allows you to build more sophisticated applications across multiple LLMs, something that would be way more complicated without the help of LangChain.
Building your first LangChainJS + Cloudflare Workers application
There are a few prerequisites you have to set up in order to build this application:
- An OpenAI account: If you don’t already have one, you can sign up for free.
- A paid Cloudflare Workers account: If you don’t already have an account, you can sign up here and upgrade your Workers for $5 per month.
- Wrangler: Wrangler is a command line tool for building with Cloudflare Workers. You can find installation instructions for it here.
- Node & npm: If this is your first time working with node, you can get it here.
Next create a new folder called langchain-workers, navigate into that folder and then within that folder run wrangler init.
When you run wrangler init you’ll select the following options:
- ✔Would you like to use git to manage this Worker? … yes
- ✔ No package.json found. Would you like to create one? … yes
- ✔ Would you like to use TypeScript? … no
- ✔ Would you like to create a Worker at src/index.js? › Fetch handler
- ✔ Would you like us to write your first test? … no
With our Worker created, we’ll need to set up the environment variable for our OpenAI API Key. You can create an API key in your OpenAI dashboard. Save your new API key someplace safe, then open your wrangler.toml file and add the following lines at the bottom (making sure to insert you actual API key):
[vars]
OPENAI_API_KEY = "sk…"
Then we’ll install LangChainjs using npm:
npm install langchain
Before we start writing code we can make sure everything is working properly by running wrangler dev. With wrangler dev running you can press b to open a browser. When you do, you'll see “Hello World!” in your browser.
A sample application
One common way you may want to use a language model is to combine it with your own text. LangChain is a great tool to accomplish this goal and that’s what we’ll be doing today in our sample application. We’re going to build an application that lets us use the OpenAI language model to ask a question about an article on Wikipedia. Because I live in (and love) Brooklyn, we’ll be using the Wikipedia article about Brooklyn. But you can use this code for any Wikipedia article, or website, you’d like.
Because language models only know about the data that they were trained on, if we want to use a language model with new or specific information we need a way to pass a model that information. In LangChain we can accomplish this using a ”document”. If you’re like me, when you hear “document” you often think of a specific file format but in LangChain a document is an object that consists of some text and optionally some metadata. The text in a document object is what will be used when interacting with a language model and the metadata is a way that you can track information about your document.
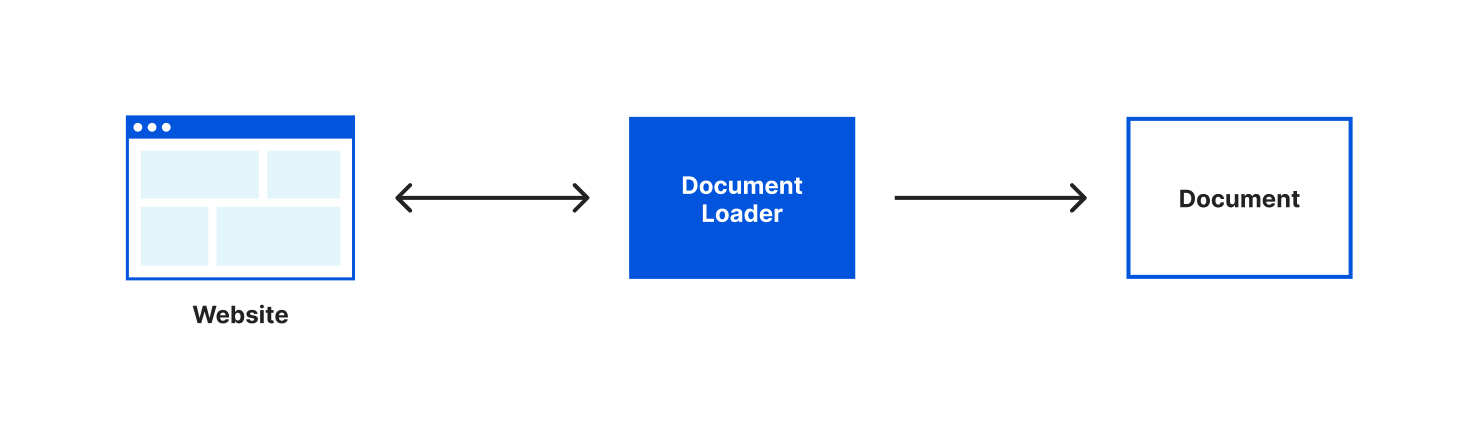
Most often you’ll want to create documents from a source of pre-existing text. LangChain helpfully provides us with different document loaders to make loading text from many different sources easy. There are document loaders for different types of text formats (for example: CSV, PDFs, HTML, unstructured text) and that content can be loaded locally or from the web. A document loader will both retrieve the text for you and load that text into a document object. For our application, we’ll be using the webpages with Cheerio document loader. Cheerio is a lightweight library that will let us read the content of a webpage. We can install it using npm install cheerio.
After we’ve installed cheerio we’ll import the CheerioWebBaseLoader at the top of our src/index.js file:
import { CheerioWebBaseLoader } from "langchain/document_loaders/web/cheerio";
With CheerioWebBaseLoader imported, we can start using it within our fetch function:.
    async fetch(request, env, ctx) {
        const loader = new CheerioWebBaseLoader(
          “https://en.wikipedia.org/wiki/Brooklyn"
        );
        const docs = await loader.load();
        console.log(docs);

        return new Response("Hello World!");
  },
In this code, we’re configuring our loader with the Wikipedia URL for the article about Brooklyn, run the load() function and log the result to the console. Like I mentioned earlier, if you want to try this with a different Wikipedia article or website, LangChain makes it very easy. All we have to do is change the URL we’re passing to our CheerioWebBaseLoader.
Let’s run wrangler dev, load up our page locally and watch the output in our console. You should see:
Loaded page
Array(1) [ Document ]
Our document loader retrieved the content of the webpage, put that content in a document object and loaded it into an array.
This is great, but there’s one more improvement we can make to this code before we move on – splitting our text into multiple documents.
Many language models have limits on the amount of text you can pass to them. As well, some LLM APIs charge based on the amount of text you send in your request. For both of these reasons, it’s helpful to only pass the text you need in a request to a language model.
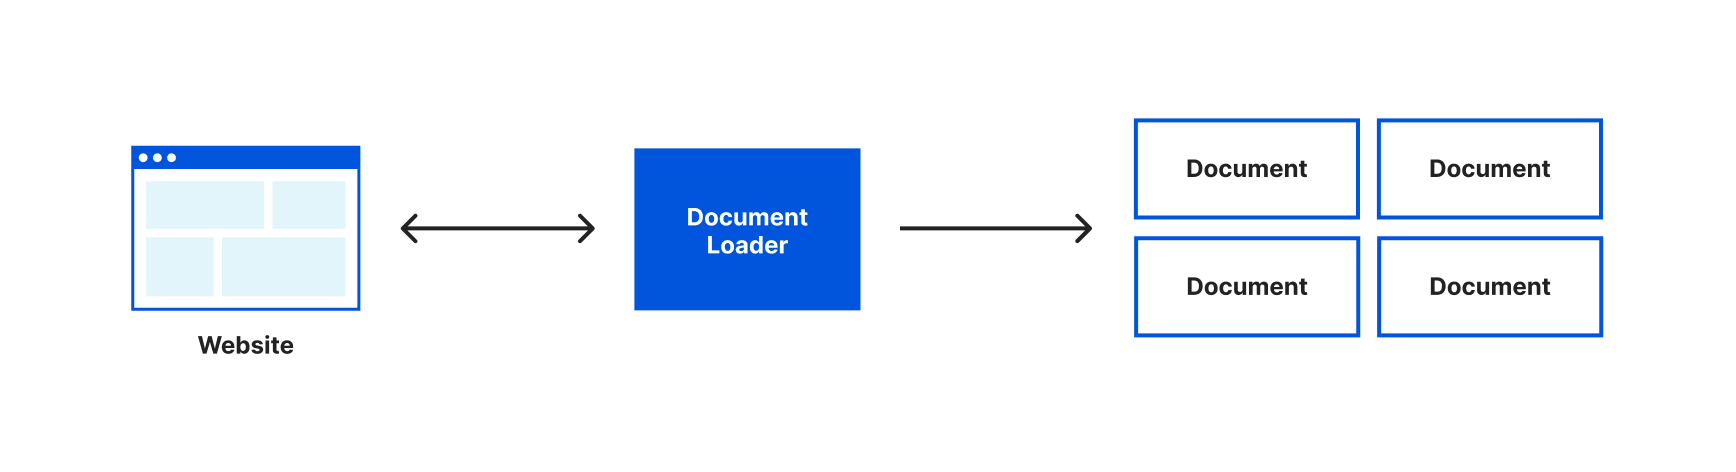
Currently, we’ve loaded the entire content of the Wikipedia page about Brooklyn into one document object and would send the entirety of that text with every request to our language model. It would be more efficient if we could only send the relevant text to our language model when we have a question. The first step in doing this is to split our text into smaller chunks that are stored in multiple document objects. To assist with this LangChain gives us the very aptly named Text Splitters.
We can use a text splitter by updating our loader to use the loadAndSplit() function instead of load(). Update the line where we assign docs to this:
const docs = await loader.loadAndSplit();
Now start the application again with wrangler dev and load our page. This time in our console you’ll see something like this:
Loaded page
Array(227) [ Document, Document, Document, Document, Document, Document, Document, Document, Document, Document, Document, Document, Document, Document, Document, Document, Document, Document, Document, Document, Document, Document, Document, Document, Document, Document, Document, Document, Document, Document, Document, Document, Document, Document, Document, Document, Document, Document, Document, Document, Document, Document, Document, Document, Document, Document, Document, Document, Document, Document, Document, Document, Document, Document, Document, Document, Document, Document, Document, Document, Document, Document, Document, Document, Document, Document, Document, Document, Document, Document, Document, Document, Document, Document, Document, Document, Document, Document, Document, Document, Document, Document, Document, Document, Document, Document, Document, Document, Document, Document, Document, Document, Document, Document, Document, Document, Document, Document, Document, Document... ]
Instead of an array with one document object, our document loader has now split the text it retrieved into multiple document objects. It’s still a single Wikipedia article, LangChain just split that text into chunks that would be more appropriately sized for working with a language model.
Even though our text is split into multiple documents, we still need to be able to understand what text is relevant to our question and should be sent to our language model. To do this, we’re going to introduce two new concepts – embeddings and vector stores.
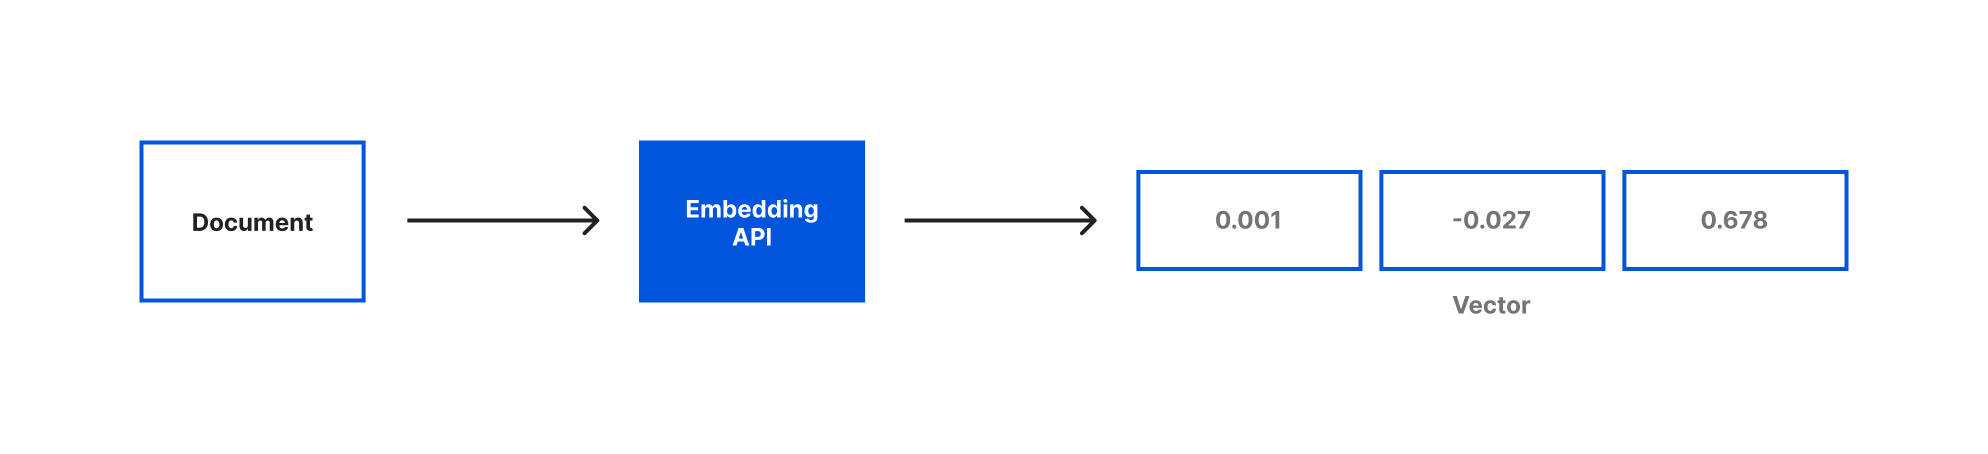
Embeddings are a way of representing text with numerical data. For our application we’ll be using OpenAI Embeddings to generate our embeddings based on the document objects we just created. When you generate embeddings the result is a vector of floating point numbers. This makes it easier for computers to understand the relatedness of the strings of text to each other. For each document object we pass the embedding API, a vector will be created.
When we compare vectors, the closer numbers are to each other the more related the strings are. Inversely, the further apart the numbers are then the less related the strings are. It can be helpful to visualize how these numbers would allow us to place each document in a virtual space:
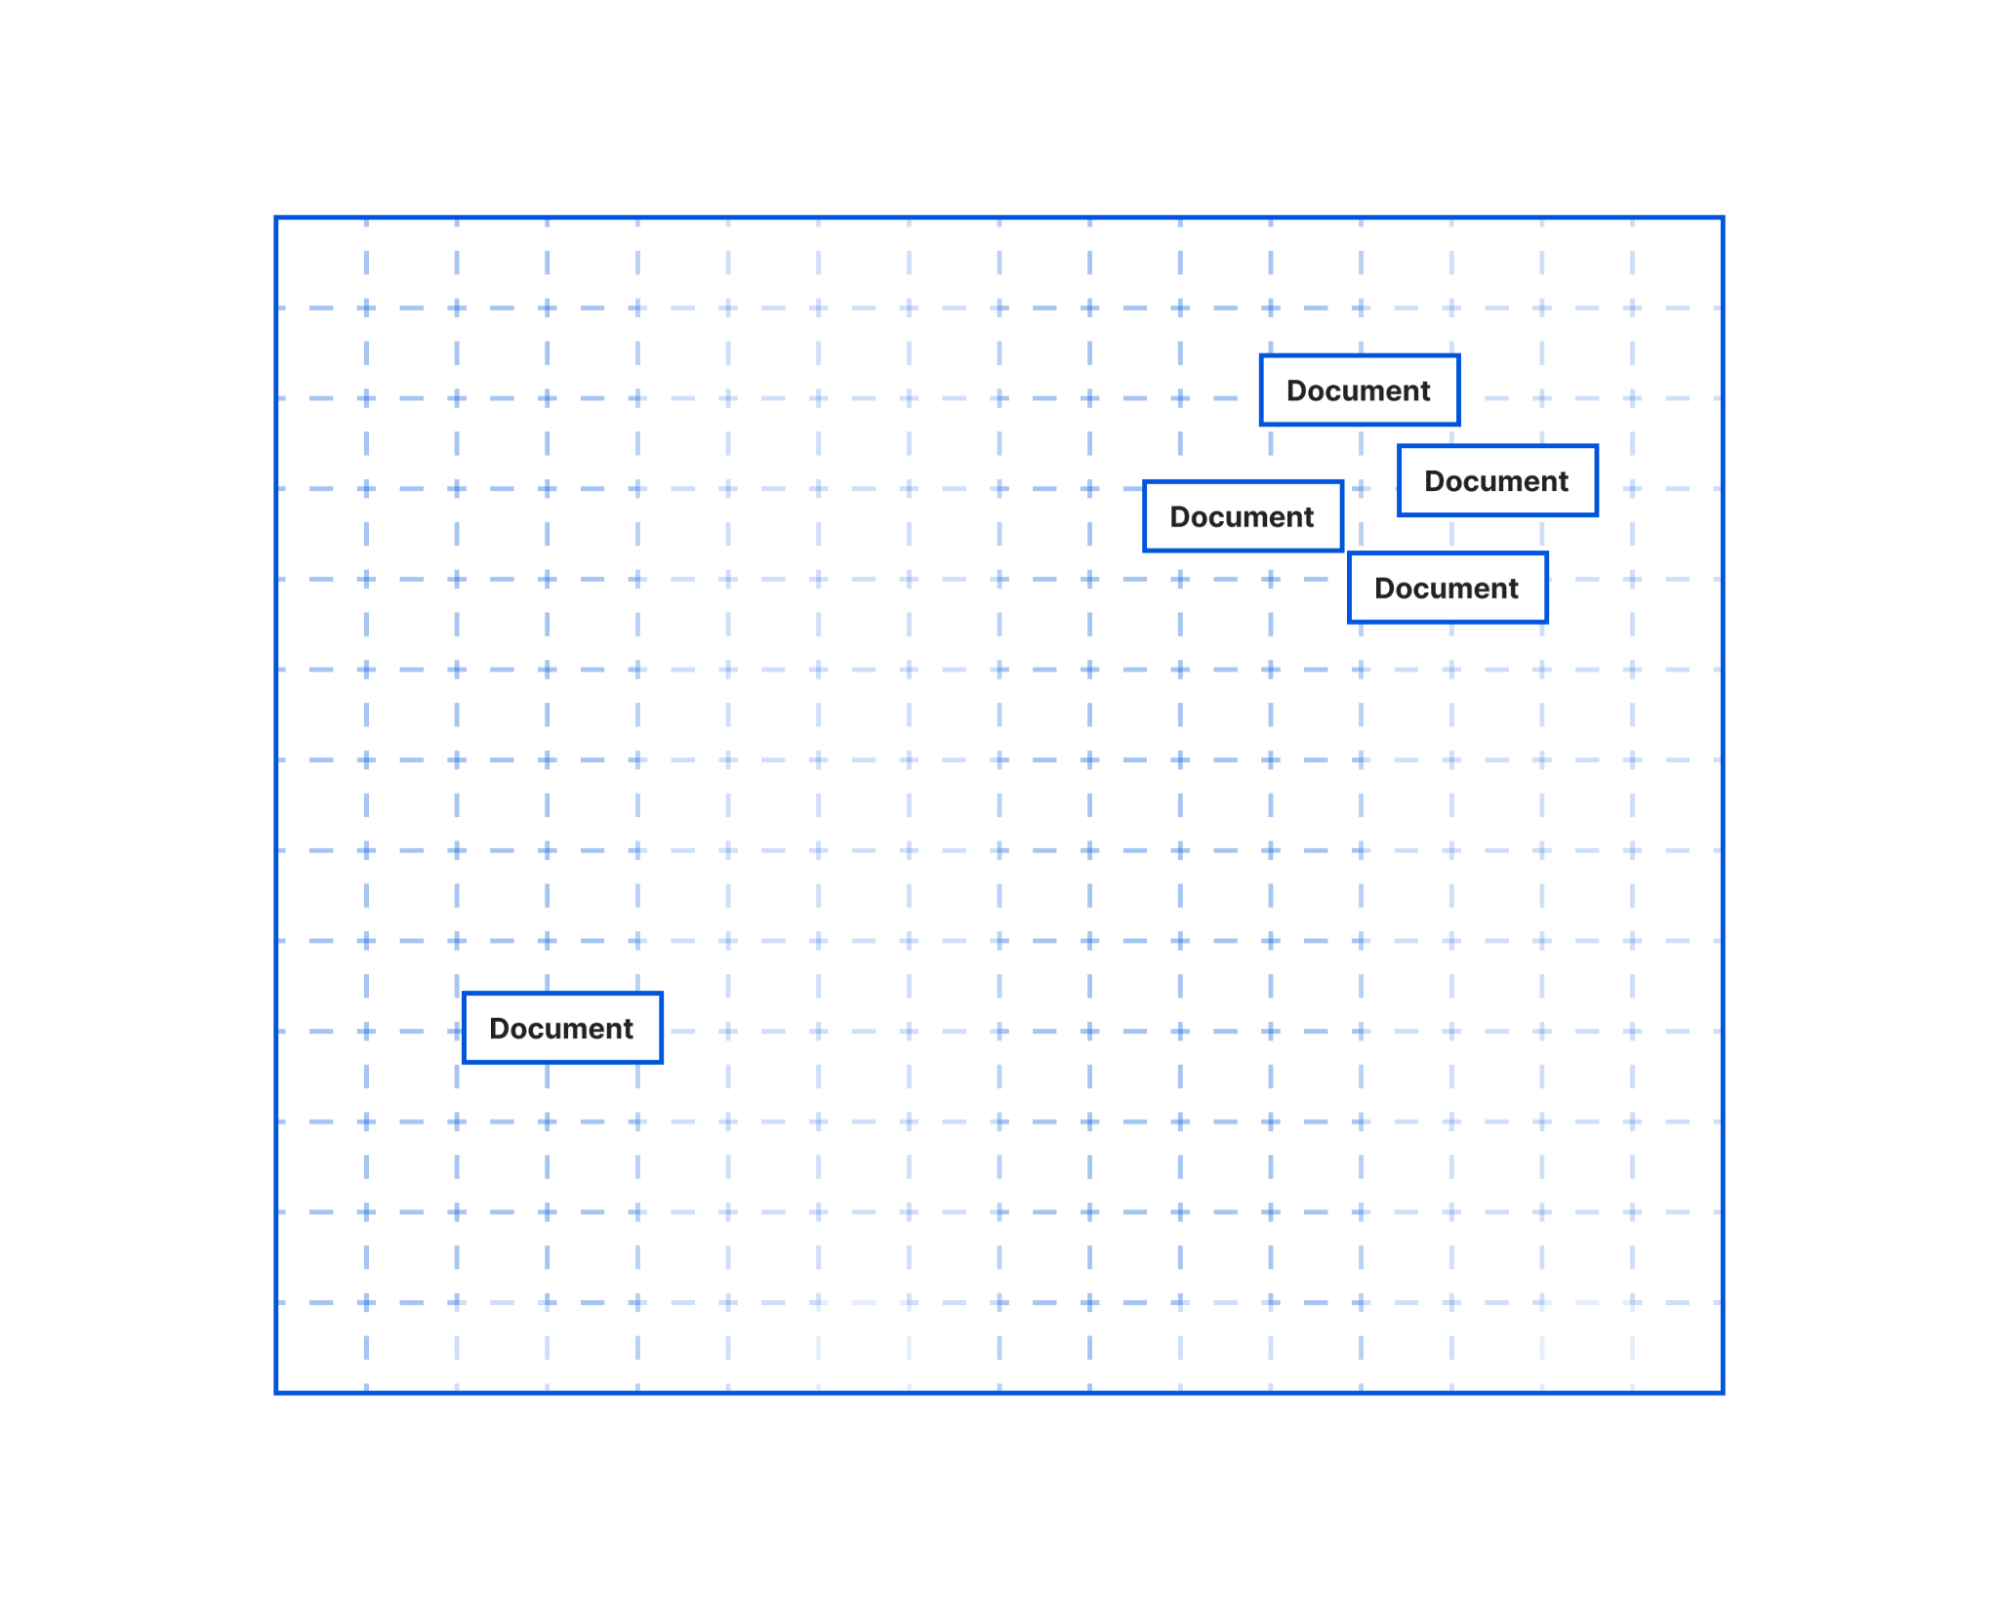
In this illustration, you could imagine how the text in the document objects that are bunched together would be more similar than the document object further off. The grouped documents could be text pulled from the article’s section on the history of Brooklyn. It’s a longer section that would have been split into multiple documents by our text splitter. But even though the text was split the embeddings would allow us to know this content is closely related to each other. Meanwhile, the document further away could be the text on the climate of Brooklyn. This section was smaller, not split into multiple documents, and the current climate is not as related to the history of Brooklyn, so it’s placed further away.
Embeddings are a pretty fascinating and complicated topic. If you’re interested in understanding more, here's a great explainer video that takes an in-depth look at the embeddings.
Once you’ve generated your documents and embeddings, you need to store them someplace for future querying. Vector stores are a kind of database optimized for storing & querying documents and their embeddings. For our vector store, we’ll be using MemoryVectorStore which is an ephemeral in-memory vector store. LangChain also has support for many of your favorite vector databases like Chroma and Pinecone.
We’ll start by adding imports for OpenAIEmbeddings and MemoryVectorStore at the top of our file:
import { OpenAIEmbeddings } from "langchain/embeddings/openai";
import { MemoryVectorStore } from "langchain/vectorstores/memory";
Then we can remove the console.log() function we had in place to show how our loader worked and replace them with the code to create our Embeddings and Vector store:
const store = await MemoryVectorStore.fromDocuments(docs, new OpenAIEmbeddings({ openAIApiKey: env.OPENAI_API_KEY}));
With our text loaded into documents, our embeddings created and both stored in a vector store we can now query our text with our language model. To do that we’re going to introduce the last two concepts that are core to building this application – models and chains.
When you see models in LangChain, it’s not about generating or creating models. Instead, LangChain provides a standard interface that lets you access many different language models. In this app, we’ll be using the OpenAI model.
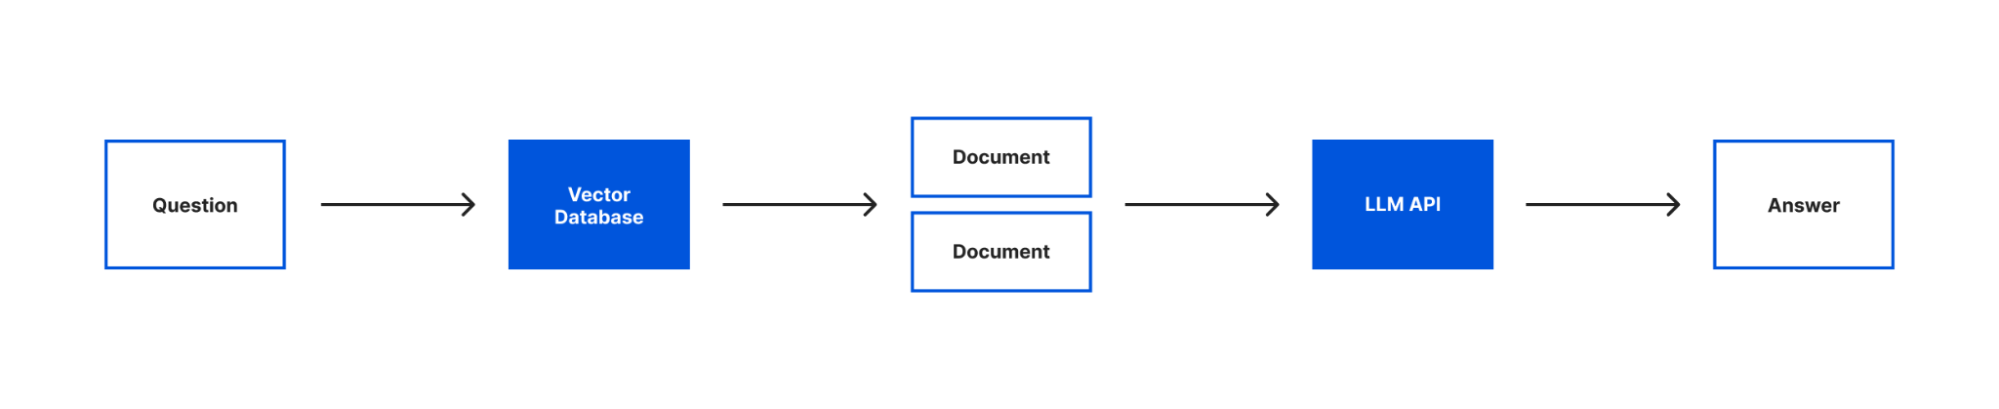
Chains enable you to combine a language model with other sources of information, APIs, or even other language models. In our case, we’ll be using the RetreivalQAChain. This chain retrieves the documents from our vector store related to a question and then uses our model to answer the question using that information.
To start, we’ll add these two imports to the top of our file:
import { OpenAI } from "langchain/llms/openai";
import { RetrievalQAChain } from "langchain/chains";
Then we can put this all into action by adding the following code after we create our vector store:
const model = new OpenAI({ openAIApiKey: env.OPENAI_API_KEY});
const chain = RetrievalQAChain.fromLLM(model, store.asRetriever());
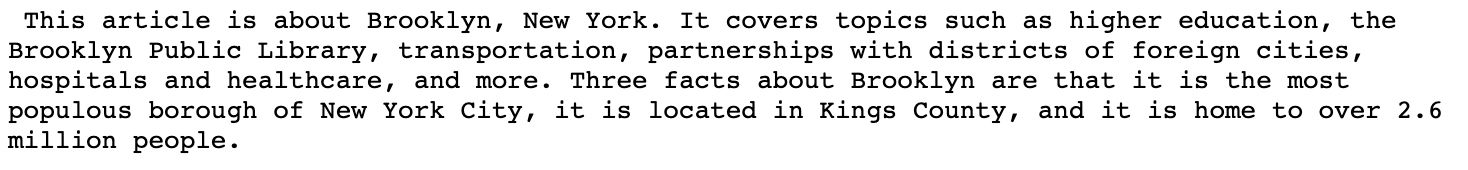
const question = "What is this article about? Can you give me 3 facts about it?";
const res = await chain.call({
query: question,
});
return new Response(res.text);
In this code the first line is where we instantiate our model interface and pass it our API key. Next we create a chain passing it our model and our vector store. As mentioned earlier, we’re using a RetrievalQAChain which will look in our vector store for documents related to our query and then use those documents to get an answer for our query from our model.
With our chain created, we can call the chain by passing in the query we want to ask. Finally, we send the response text we got from our chain as the response to the request our Worker received. This will allow us to see the response in our browser.
With all our code in place, let’s test it again by running wrangler dev. This time when you open your browser you will see a few facts about Brooklyn:
Right now, the question we’re asking is hard coded. Our goal was to be able to use LangChain to ask any question we want about this article. Let’s update our code to allow us to pass the question we want to ask in our request. In this case, we’ll pass a question as an argument in the query string (e.g. ?question=When was Brooklyn founded). To do this we’ll replace the line we’re currently assigning our question with the code needed to pull a question from our query string:
        const { searchParams } = new URL(request.url);
        const question = searchParams.get('question') ?? "What is this article about? Can you give me 3 facts about it?";
This code pulls all the query parameters from our URL using a JavaScript URL’s native searchParams property, and gets the value passed in for the “question” parameter. If a value isn’t present for the “question” parameter, we’ll use the default question text we were using previously thanks to JavaScripts’s nullish coalescing operator.
With this update, run wrangler dev and this time visit your local url with a question query string added. Now instead of giving us a few fun facts about Brooklyn, we get the answer of when Brooklyn was founded. You can try this with any question you may have about Brooklyn. Or you can switch out the URL in our document loader and try asking similar questions about different Wikipedia articles.
With our code working locally, we can deploy it with wrangler publish. After this command completes you’ll receive a Workers URL that runs your code.
You + LangChain + Cloudflare Workers
You can find our full LangChain example application on GitHub. We can’t wait to see what you all build with LangChain and Cloudflare Workers. Join us on Discord or tag us on Twitter as you’re building. And if you’re ever having any trouble or questions, you can ask on community.cloudflare.com.