Imagine you are in the middle of an attack on your most crucial production application, and you need to understand what’s going on. How happy would you be if you could simply log into the Dashboard and type a question such as: “Compare attack traffic between US and UK” or “Compare rate limiting blocks for automated traffic with rate limiting blocks from human traffic” and see a time series chart appear on your screen without needing to select a complex set of filters?
Today, we are introducing an AI assistant to help you query your security event data, enabling you to more quickly discover anomalies and potential security attacks. You can now use plain language to interrogate Cloudflare analytics and let us do the magic.
What did we build?
One of the big challenges when analyzing a spike in traffic or any anomaly in your traffic is to create filters that isolate the root cause of an issue. This means knowing your way around often complex dashboards and tools, knowing where to click and what to filter on.
On top of this, any traditional security dashboard is limited to what you can achieve by the way data is stored, how databases are indexed, and by what fields are allowed when creating filters. With our Security Analytics view, for example, it was difficult to compare time series with different characteristics. For example, you couldn’t compare the traffic from IP address x.x.x.x with automated traffic from Germany without opening multiple tabs to Security Analytics and filtering separately. From an engineering perspective, it would be extremely hard to build a system that allows these types of unconstrained comparisons.
With the AI Assistant, we are removing this complexity by leveraging our Workers AI platform to build a tool that can help you query your HTTP request and security event data and generate time series charts based on a request formulated with natural language. Now the AI Assistant does the hard work of figuring out the necessary filters and additionally can plot multiple series of data on a single graph to aid in comparisons. This new tool opens up a new way of interrogating data and logs, unconstrained by the restrictions introduced by traditional dashboards.
Now it is easier than ever to get powerful insights about your application security by using plain language to interrogate your data and better understand how Cloudflare is protecting your business. The new AI Assistant is located in the Security Analytics dashboard and works seamlessly with the existing filters. The answers you need are just a question away.
What can you ask?
To demonstrate the capabilities of AI Assistant, we started by considering the questions that we ask ourselves every day when helping customers to deploy the best security solutions for their applications.
We’ve included some clickable examples in the dashboard to get you started.
You can use the AI Assistant to
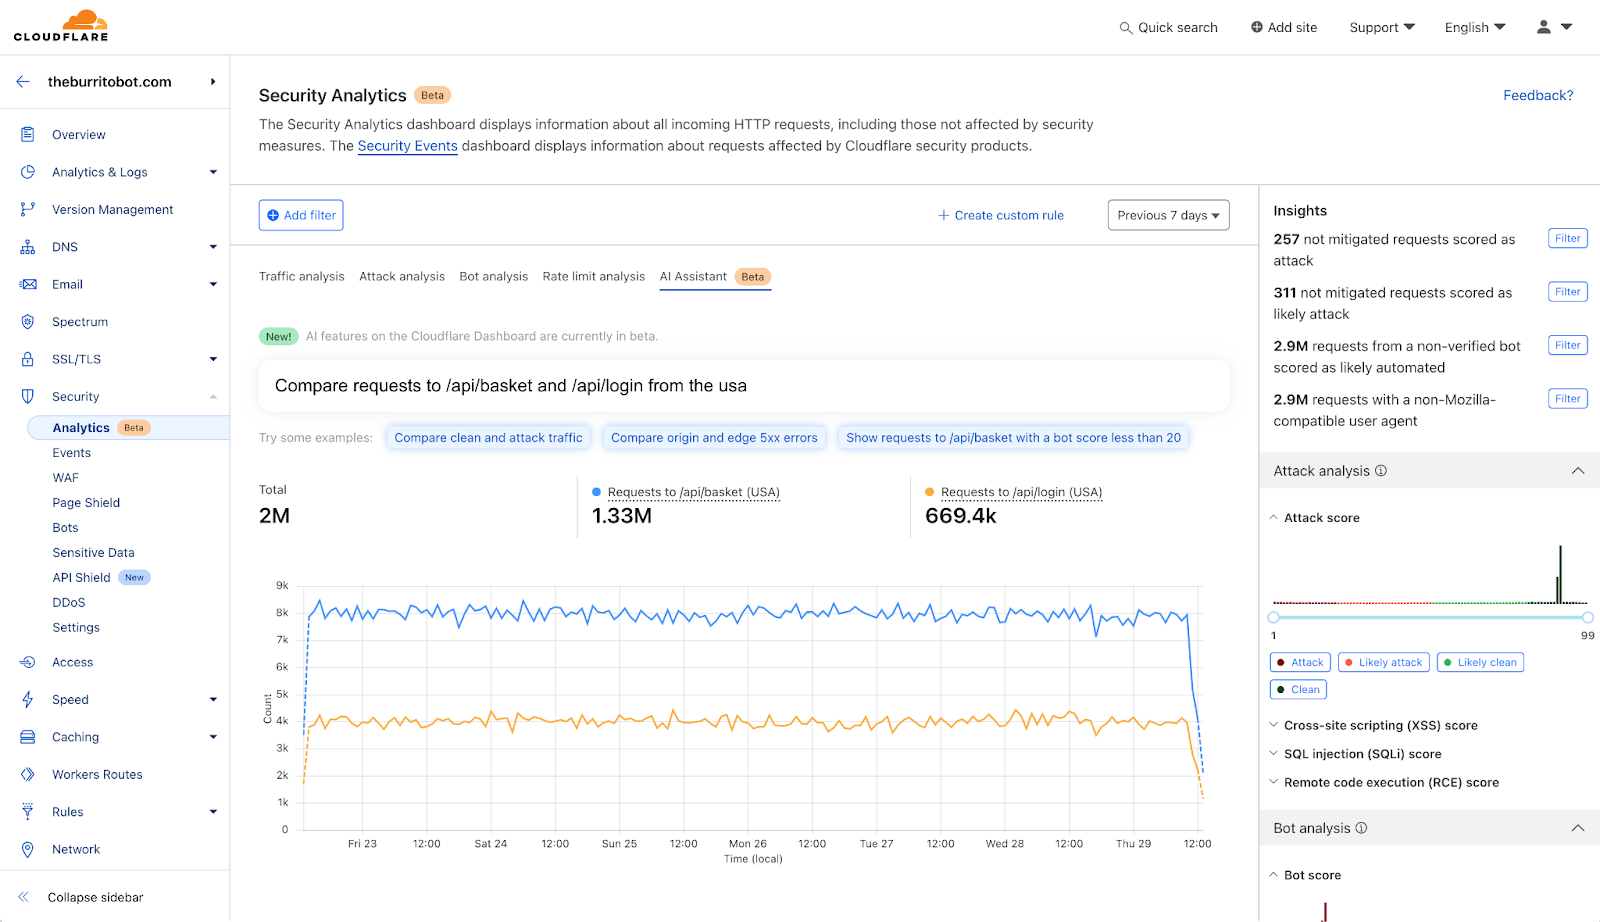
Identify the source of a spike in attack traffic by asking: “Compare attack traffic between US and UK”
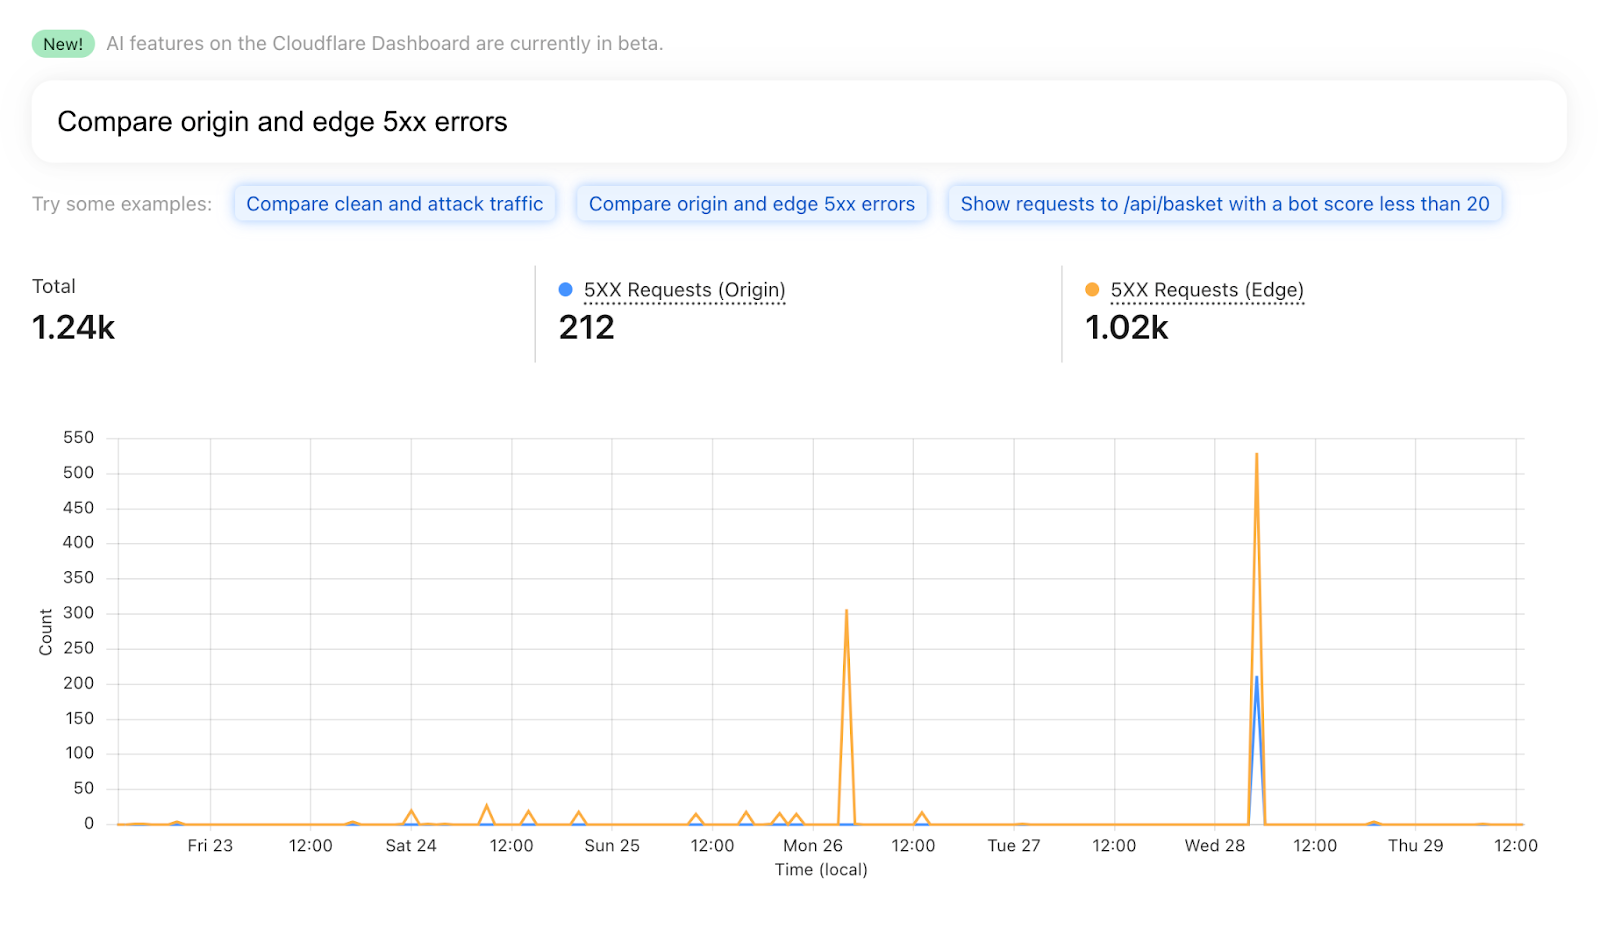
Identify root cause of 5xx errors by asking: “Compare origin and edge 5xx errors”
See which browsers are most commonly used by your users by asking:”Compare traffic across major web browsers”
For an ecommerce site, understand what percentage of users visit vs add items to their shopping cart by asking: “Compare traffic between /api/login and /api/basket”
Identify bot attacks against your ecommerce site by asking: “Show requests to /api/basket with a bot score less than 20”
Identify the HTTP versions used by clients by asking: “Compare traffic by each HTTP version”
Identify unwanted automated traffic to specific endpoints by asking: “Show POST requests to /admin with a Bot Score over 30”
You can start from these when exploring the AI Assistant.
How does it work?
Using Cloudflare’s powerful Workers AI global network inference platform, we were able to use one of the off-the-shelf large language models (LLMs) offered on the platform to convert customer queries into GraphQL filters. By teaching an AI model about the available filters we have on our Security Analytics GraphQL dataset, we can have the AI model turn a request such as “Compare attack traffic on /api and /admin endpoints” into a matching set of structured filters:
Then, using the filters provided by the AI model, we can make requests to our GraphQL APIs, gather the requisite data, and plot a data visualization to answer the customer query.
By using this method, we are able to keep customer information private and avoid exposing any security analytics data to the AI model itself, while still allowing humans to query their data with ease. This ensures that your queries will never be used to train the model. And because Workers AI hosts a local instance of the LLM on Cloudflare’s own network, your queries and resulting data never leave Cloudflare’s network.
Future Development
We are in the early stages of developing this capability and plan to rapidly extend the capabilities of the Security Analytics AI Assistant. Don’t be surprised if we cannot handle some of your requests at the beginning. At launch, we are able to support basic inquiries that can be plotted in a time series chart such as “show me” or “compare” for any currently filterable fields.
However, we realize there are a number of use cases that we haven’t even thought of, and we are excited to release the Beta version of AI Assistant to all Business and Enterprise customers to let you test the feature and see what you can do with it. We would love to hear your feedback and learn more about what you find useful and what you would like to see in it next. With future versions, you’ll be able to ask questions such as “Did I experience any attacks yesterday?” and use AI to automatically generate WAF rules for you to apply to mitigate them.
Beta availability
Starting today, AI Assistant is available for a select few users and rolling out to all Business and Enterprise customers throughout March. Look out for it and try for free and let us know what you think by using the Feedback link at the top of the Security Analytics page.
Final pricing will be determined prior to general availability.
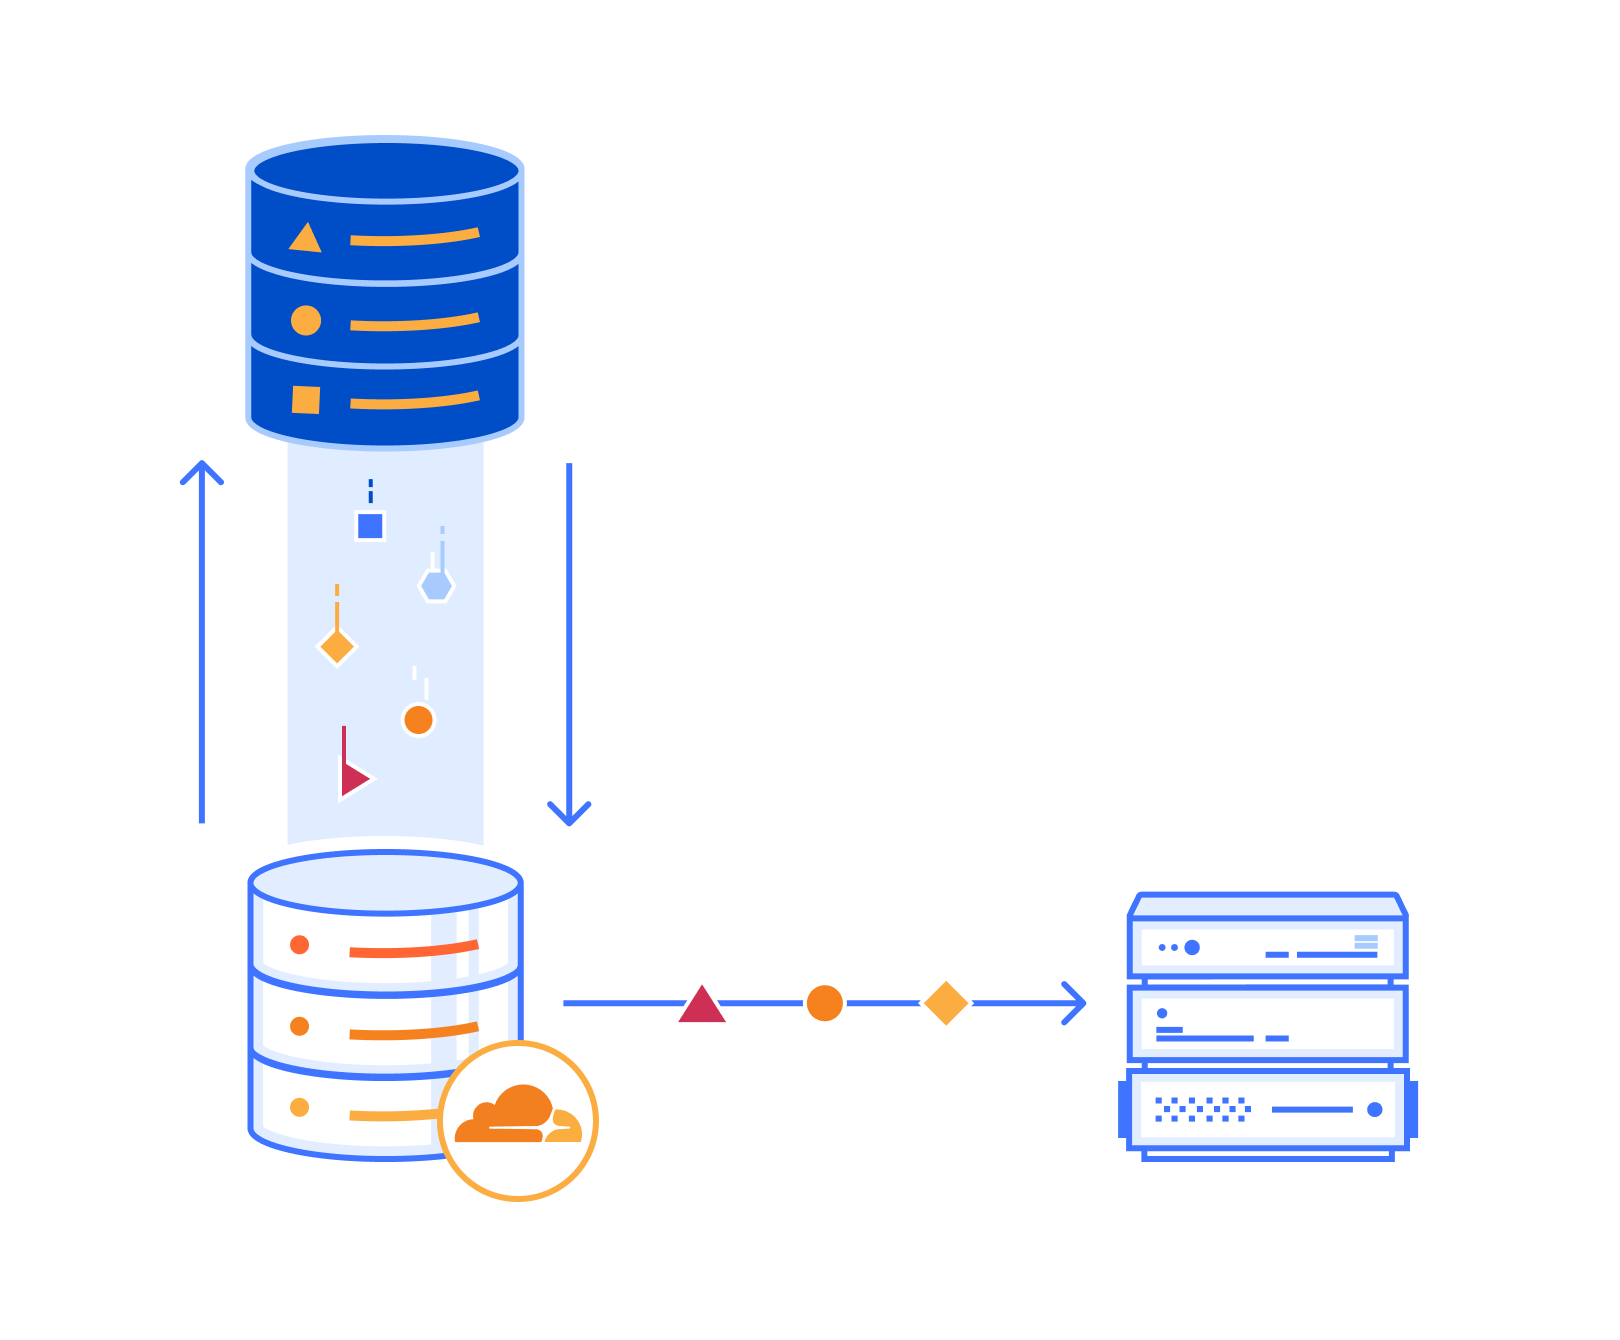
In July, 2023, we announced that Zaraz was transitioning out of beta and becoming available to all Cloudflare users. Zaraz helps users manage and optimize the ever-growing number of third-party tools on their websites — analytics, marketing pixels, chatbots, and more — without compromising on speed, privacy, or security. Soon after the announcement went online, we received feedback from users who were concerned about the new pricing system. We discovered that in some scenarios the proposed pricing could cause high charges, which was not the intention, and so we promised to look into it. Since then, we have iterated over different pricing options, talked with customers of different sizes, and finally reached a new pricing system that we believe is affordable, predictable, and simple. The new pricing for Zaraz will take effect on April 15, 2024, and is described below.
Introducing Zaraz Events
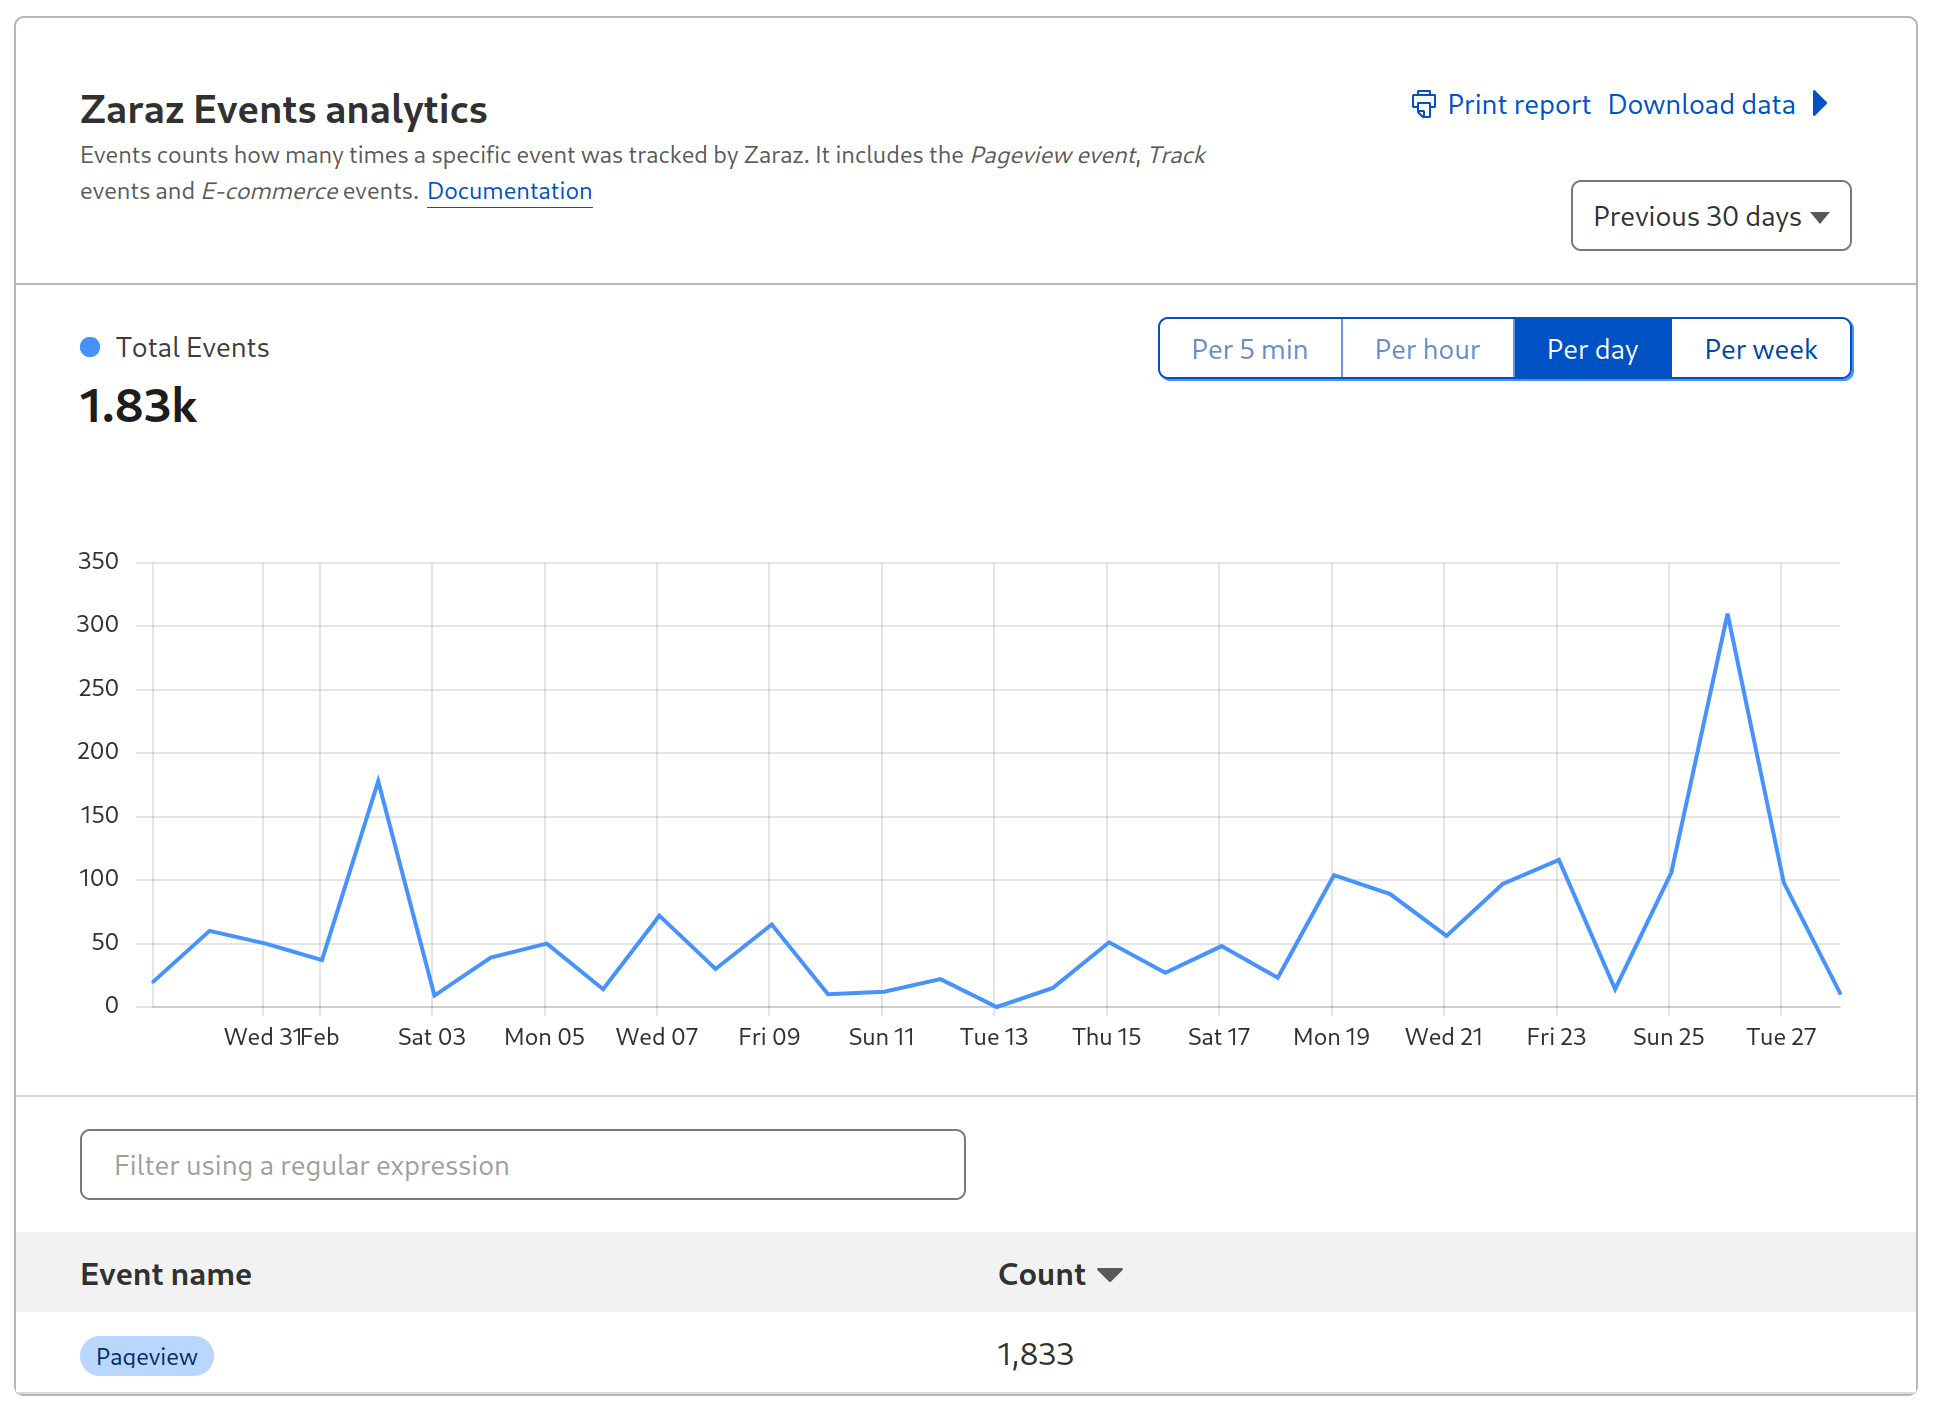
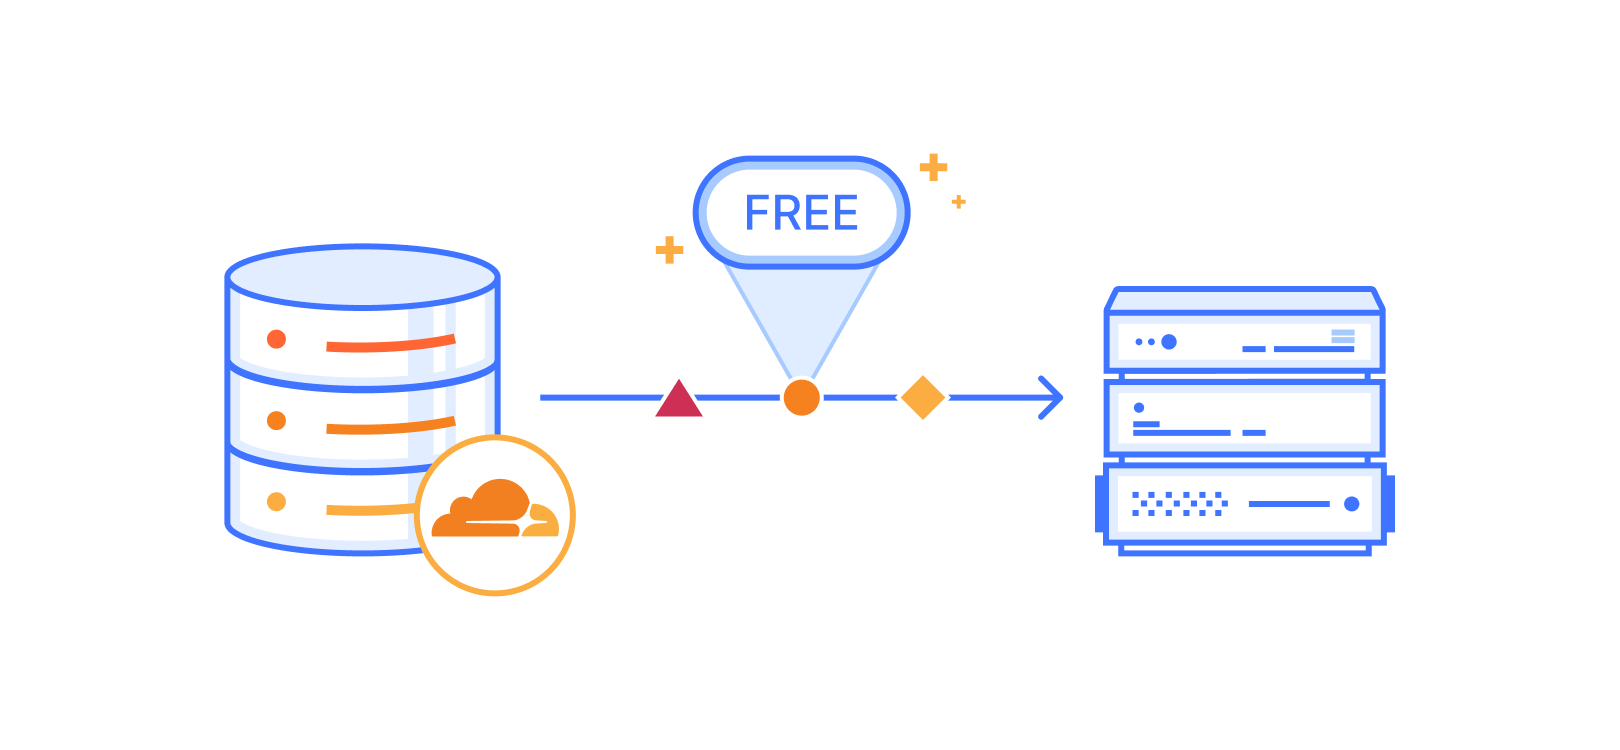
One of the biggest changes we made was changing the metric we used for pricing Zaraz. One Zaraz Event is an event you’re sending to Zaraz, whether that’s a pageview, a zaraz.track event, or similar. You can easily see the total number of Zaraz Events you’re currently using under the Monitoring section in the Cloudflare Zaraz Dashboard. Every Cloudflare account can use 1,000,000 Zaraz Events completely for free, every month.
The Zaraz Monitoring page shows exactly how many Zaraz Events your website is using
We believe that Zaraz Events are a better representation of the usage of Zaraz. As the web progresses and as Single-Page-Applications are becoming more and more popular, the definition of a “pageview”, which was used for the old pricing system, is becoming more and more vague. Zaraz Events are agnostic to different tech stacks, and work the same when using the Zaraz HTTP API. It’s a simpler metric that should better reflect the way Zaraz is used.
Predictable costs for high volume websites
With the new Zaraz pricing model, every Cloudflare account gets 1,000,000 Zaraz Events per month for free. If your account needs more than that, every additional 1,000,000 Zaraz Events are only $5 USD, with volume discounting available for Enterprise accounts. Compared with other third-party managers and tag management software, this new pricing model makes Zaraz an affordable and user-friendly solution for server-side loading of tools and tags.
Available for all
We also decided that all Zaraz features should be available for everyone. We want users to make the most of Zaraz, no matter how big or small their website is. This means that advanced features like making custom HTTP requests, using the Consent Management API, loading custom Managed Components, configuring custom endpoints, using the Preview & Publish Workflow, and even using the Zaraz Ecommerce features are now available on all plans, from Free to Enterprise.
Try it out
We’re announcing this new affordable price for Zaraz while retaining all the features that make it the perfect solution for managing third-party tools on your website. Zaraz is a one-click installation that requires no server, and it’s lightning fast thanks to Cloudflare’s network, which is within 50 milliseconds of approximately 95% of the Internet-connected population. Zaraz is extremely extensible using the Open Source format of Managed Components, allowing you to change tools and create your own, and it’s transparent about what information is shared with tools on your website, allowing you to control and improve the privacy of your website visitors.
Zaraz recently completed the migration of all tools to Managed Components. This makes tools on your website more like apps on your phone, allowing you to granularly decide what permissions to grant tools. For example, it allows you to prevent a tool from making client-side network requests or storing cookies. With the Zaraz Context Enricher you can create custom data manipulation processes in a Cloudflare Worker, and do things like attach extra information to payloads from your internal CRM, or automatically remove and mask personally-identifiable information (PII) like email addresses before it reaches your providers.
We would like to thank all the users that provided us with their feedback. We acknowledge that the previous pricing might have caused some to think twice about choosing Zaraz, and we hope that this will encourage them to reconsider. Cloudflare Zaraz is a tool that is meant first and foremost to serve the people building websites on the Internet, and we thank everyone for sharing their feedback to help us get to a better product in the end.
The new pricing for Zaraz will take effect starting April 15, 2024.
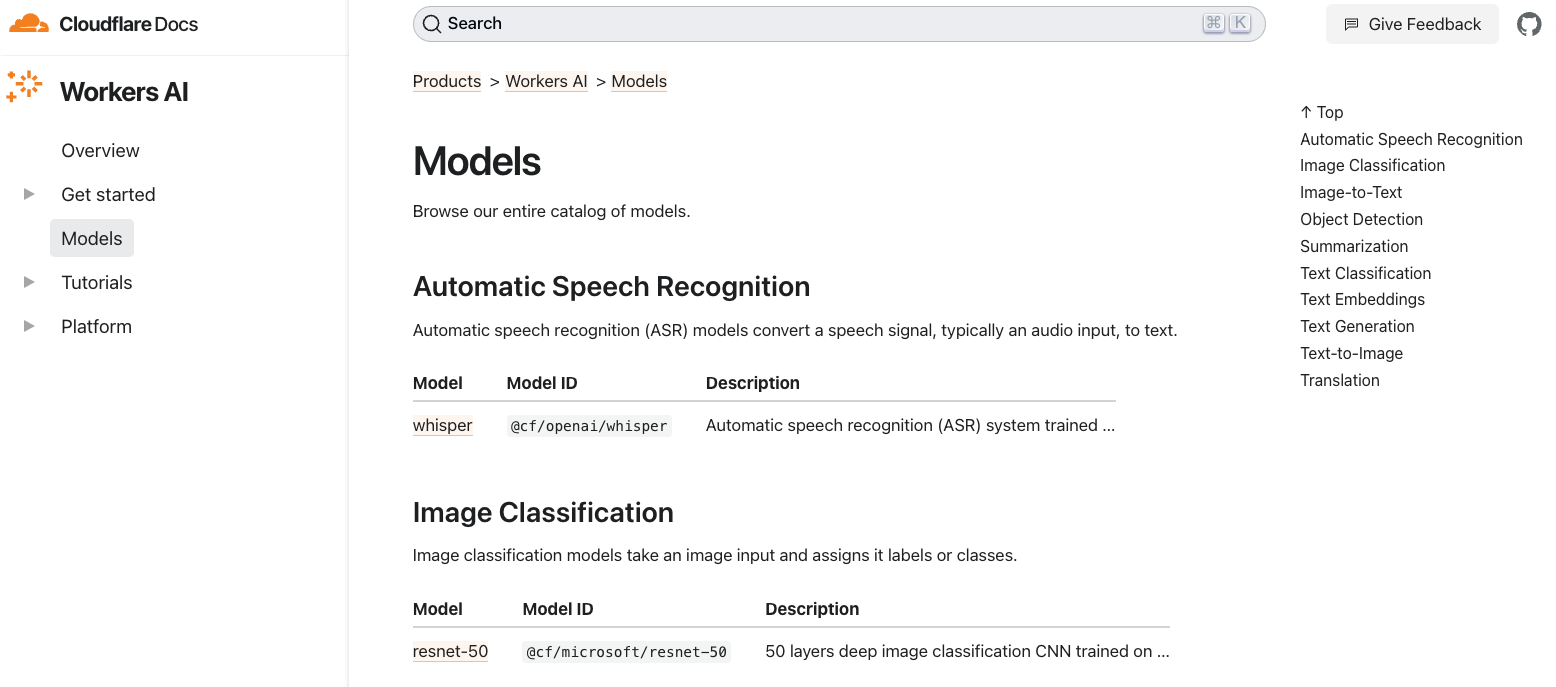
On February 6th, 2024 we announced eight new models that we added to our catalog for text generation, classification, and code generation use cases. Today, we’re back with seventeen (17!) more models, focused on enabling new types of tasks and use cases with Workers AI. Our catalog is now nearing almost 40 models, so we also decided to introduce a revamp of our developer documentation that enables users to easily search and discover new models.
The new models are listed below, and the full Workers AI catalog can be found on our new developer documentation.
Text generation
@cf/deepseek-ai/deepseek-math-7b-instruct
@cf/openchat/openchat-3.5-0106
@cf/microsoft/phi-2
@cf/tinyllama/tinyllama-1.1b-chat-v1.0
@cf/thebloke/discolm-german-7b-v1-awq
@cf/qwen/qwen1.5-0.5b-chat
@cf/qwen/qwen1.5-1.8b-chat
@cf/qwen/qwen1.5-7b-chat-awq
@cf/qwen/qwen1.5-14b-chat-awq
@cf/tiiuae/falcon-7b-instruct
@cf/defog/sqlcoder-7b-2
Summarization
@cf/facebook/bart-large-cnn
Text-to-image
@cf/lykon/dreamshaper-8-lcm
@cf/runwayml/stable-diffusion-v1-5-inpainting
@cf/runwayml/stable-diffusion-v1-5-img2img
@cf/bytedance/stable-diffusion-xl-lightning
Image-to-text
@cf/unum/uform-gen2-qwen-500m
New language models, fine-tunes, and quantizations
Today’s catalog update includes a number of new language models so that developers can pick and choose the best LLMs for their use cases. Although most LLMs can be generalized to work in any instance, there are many benefits to choosing models that are tailored for a specific use case. We are excited to bring you some new large language models (LLMs), small language models (SLMs), and multi-language support, as well as some fine-tuned and quantized models.
Our latest LLM additions include falcon-7b-instruct, which is particularly exciting because of its innovative use of multi-query attention to generate high-precision responses. There’s also better language support with discolm_german_7b and the qwen1.5 models, which are trained on multilingual data and boast impressive LLM outputs not only in English, but also in German (discolm) and Chinese (qwen1.5). The Qwen models range from 0.5B to 14B parameters and have shown particularly impressive accuracy in our testing. We’re also releasing a few new SLMs, which are growing in popularity because of their ability to do inference faster and cheaper without sacrificing accuracy. For SLMs, we’re introducing small but performant models like a 1.1B parameter version of Llama (tinyllama-1.1b-chat-v1.0) and a 1.3B parameter model from Microsoft (phi-2).
As the AI industry continues to accelerate, talented people have found ways to improve and optimize the performance and accuracy of models. We’ve added a fine-tuned model (openchat-3.5) which implements Conditioned Reinforcement Learning Fine-Tuning (C-RLFT), a technique that enables open-source language model development through the use of easily collectable mixed quality data.
We’re really excited to be bringing all these new text generation models onto our platform today. The open-source community has been incredible at developing new AI breakthroughs, and we’re grateful for everyone’s contributions to training, fine-tuning, and quantizing these models. We’re thrilled to be able to host these models and make them accessible to all so that developers can quickly and easily build new applications with AI. You can check out the new models and their API schemas on our developer docs.
New image generation models
We are adding new Stable Diffusion pipelines and optimizations to enable powerful new image editing and generation use cases. We’ve added support for Stable Diffusion XL Lightning which generates high quality images in just two inference steps. Text-to-image is a really popular task for folks who want to take a text prompt and have the model generate an image based on the input, but Stable Diffusion is actually capable of much more. With this new Workers AI release, we’ve unlocked new pipelines so that you can experiment with different modalities of input and tasks with Stable Diffusion.
You can now use Stable Diffusion on Workers AI for image-to-image and inpainting use cases. Image-to-image allows you to transform an input image into a different image – for example, you can ask Stable Diffusion to generate a cartoon version of a portrait. Inpainting allows users to upload an image and transform the same image into something new – examples of inpainting include “expanding” the background of photos or colorizing black-and-white photos.
To use inpainting, you’ll need to input an image, a mask, and a prompt. The image is the original picture that you want modified, the mask is a monochrome screen that highlights the area that you want to be painted over, and the prompt tells the model what to generate in that space. Below is an example of the inputs and the request template to perform inpainting.
import { Ai } from '@cloudflare/ai';

export default {
    async fetch(request, env) {
        const formData = await request.formData();
        const prompt = formData.get("prompt")
        const imageFile = formData.get("image")
        const maskFile = formData.get("mask")

        const imageArrayBuffer = await imageFile.arrayBuffer();
        const maskArrayBuffer = await maskFile.arrayBuffer();

        const ai = new Ai(env.AI);
        const inputs = {
            prompt,
            image: [...new Uint8Array(imageArrayBuffer)],
            mask: [...new Uint8Array(maskArrayBuffer)],
            strength: 0.8, // Adjust the strength of the transformation
            num_steps: 10, // Number of inference steps for the diffusion process
        };

        const response = await ai.run("@cf/runwayml/stable-diffusion-v1-5-inpainting", inputs);

        return new Response(response, {
            headers: {
                "content-type": "image/png",
            },
        });
    }
}
New use cases
We’ve also added new models to Workers AI that allow for various specialized tasks and use cases, such as LLMs specialized in solving math problems (deepseek-math-7b-instruct), generating SQL code (sqlcoder-7b-2), summarizing text (bart-large-cnn), and image captioning (uform-gen2-qwen-500m).
We wanted to release these to the public, so you can start building with them, but we’ll be releasing more demos and tutorial content over the next few weeks. Stay tuned to our X account and Developer Documentation for more information on how to use these new models.
Optimizing our model catalog
AI model innovation is advancing rapidly, and so are the tools and techniques for fast and efficient inference. We’re excited to be incorporating new tools that help us optimize our models so that we can offer the best inference platform for everyone. Typically, when optimizing AI inference it is useful to serialize the model into a format such as ONNX, one of the most generally applicable options for this use case with broad hardware and model architecture support. An ONNX model can be further optimized by being converted to a TensorRT engine. This format, designed specifically for Nvidia GPUs, can result in faster inference latency and higher total throughput from LLMs. Choosing the right format usually comes down to what is best supported by specific model architectures and the hardware available for inference. We decided to leverage both TensorRT and ONNX formats for our new Stable Diffusion pipelines, which represent a series of models applied for a specific task.
Explore more on our new developer docs
You can explore all these new models in our new developer docs, where you can learn more about individual models, their prompt templates, as well as properties like context token limits. We’ve redesigned the model page to be simpler for developers to explore new models and learn how to use them. You’ll now see all the models on one page for searchability, with the task type on the right-hand side. Then, you can click into individual model pages to see code examples on how to use those models.
We hope you try out these new models and build something new on Workers AI! We have more updates coming soon, including more demos, tutorials, and Workers AI pricing. Let us know what you’re working on and other models you’d like to see on our Discord.
Today, we are thrilled to announce new Cloudflare Zero Trust dashboards on Elastic. Shared customers using Elastic can now use these pre-built dashboards to store, search, and analyze their Zero Trust logs.
When organizations look to adopt a Zero Trust architecture, there are many components to get right. If products are configured incorrectly, used maliciously, or security is somehow breached during the process, it can open your organization to underlying security risks without the ability to get insight from your data quickly and efficiently.
As a Cloudflare technology partner, Elastic helps Cloudflare customers find what they need faster, while keeping applications running smoothly and protecting against cyber threats. “I’m pleased to share our collaboration with Cloudflare, making it even easier to deploy log and analytics dashboards. This partnership combines Elastic’s open approach with Cloudflare’s practical solutions, offering straightforward tools for enterprise search, observability, and security deployment,” explained Mark Dodds, Chief Revenue Officer at Elastic.
Value of Zero Trust logs in Elastic
With this joint solution, we’ve made it easy for customers to seamlessly forward their Zero Trust logs to Elastic via Logpush jobs. This can be achieved directly via a Restful API or through an intermediary storage solution like AWS S3 or Google Cloud. Additionally, Cloudflare’s integration with Elastic has undergone improvements to encompass all categories of Zero Trust logs generated by Cloudflare.
Here are detailed some highlights of what the integration offers:
Comprehensive Visibility: Integrating Cloudflare Logpush into Elastic provides organizations with a real-time, comprehensive view of events related to Zero Trust. This enables a detailed understanding of who is accessing resources and applications, from where, and at what times. Enhanced visibility helps detect anomalous behavior and potential security threats more effectively, allowing for early response and mitigation.
Field Normalization: By unifying data from Zero Trust logs in Elastic, it’s possible to apply consistent field normalization not only for Zero Trust logs but also for other sources. This simplifies the process of search and analysis, as data is presented in a uniform format. Normalization also facilitates the creation of alerts and the identification of patterns of malicious or unusual activity.
Efficient Search and Analysis: Elastic provides powerful data search and analysis capabilities. Having Zero Trust logs in Elastic enables quick and precise searching for specific information. This is crucial for investigating security incidents, understanding workflows, and making informed decisions.
Correlation and Threat Detection: By combining Zero Trust data with other security events and data, Elastic enables deeper and more effective correlation. This is essential for detecting threats that might go unnoticed when analyzing each data source separately. Correlation aids in pattern identification and the detection of sophisticated attacks.
Prebuilt Dashboards: The integration provides out-of-the-box dashboards offering a quick start to visualizing key metrics and patterns. These dashboards help security teams visualize the security landscape in a clear and concise manner. The integration not only provides the advantage of prebuilt dashboards designed for Zero Trust datasets but also empowers users to curate their own visualizations.
What’s new on the dashboards
One of the main assets of the integration is the out-of-the-box dashboards tailored specifically for each type of Zero Trust log. Let’s explore some of these dashboards in more detail to find out how they can help us in terms of visibility.
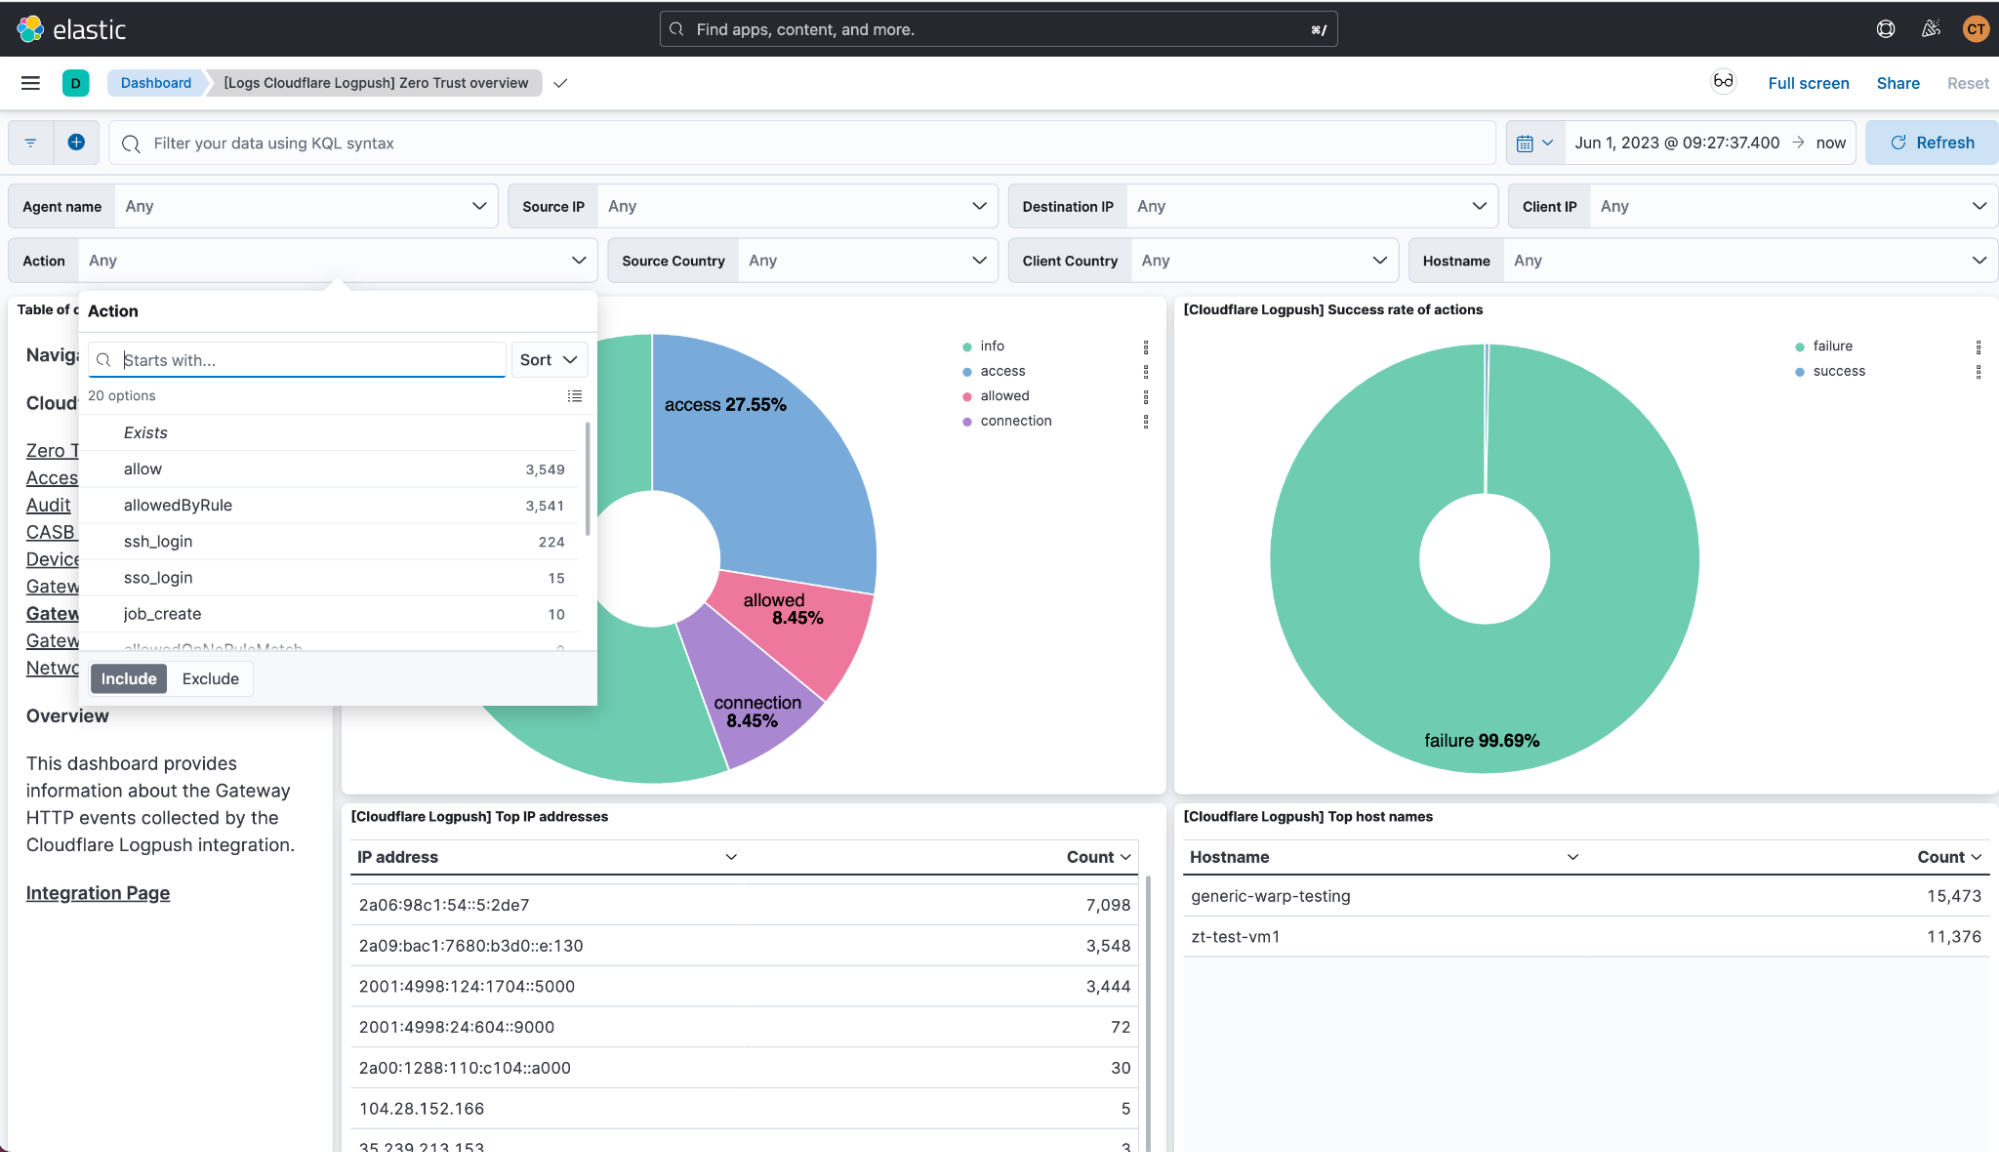
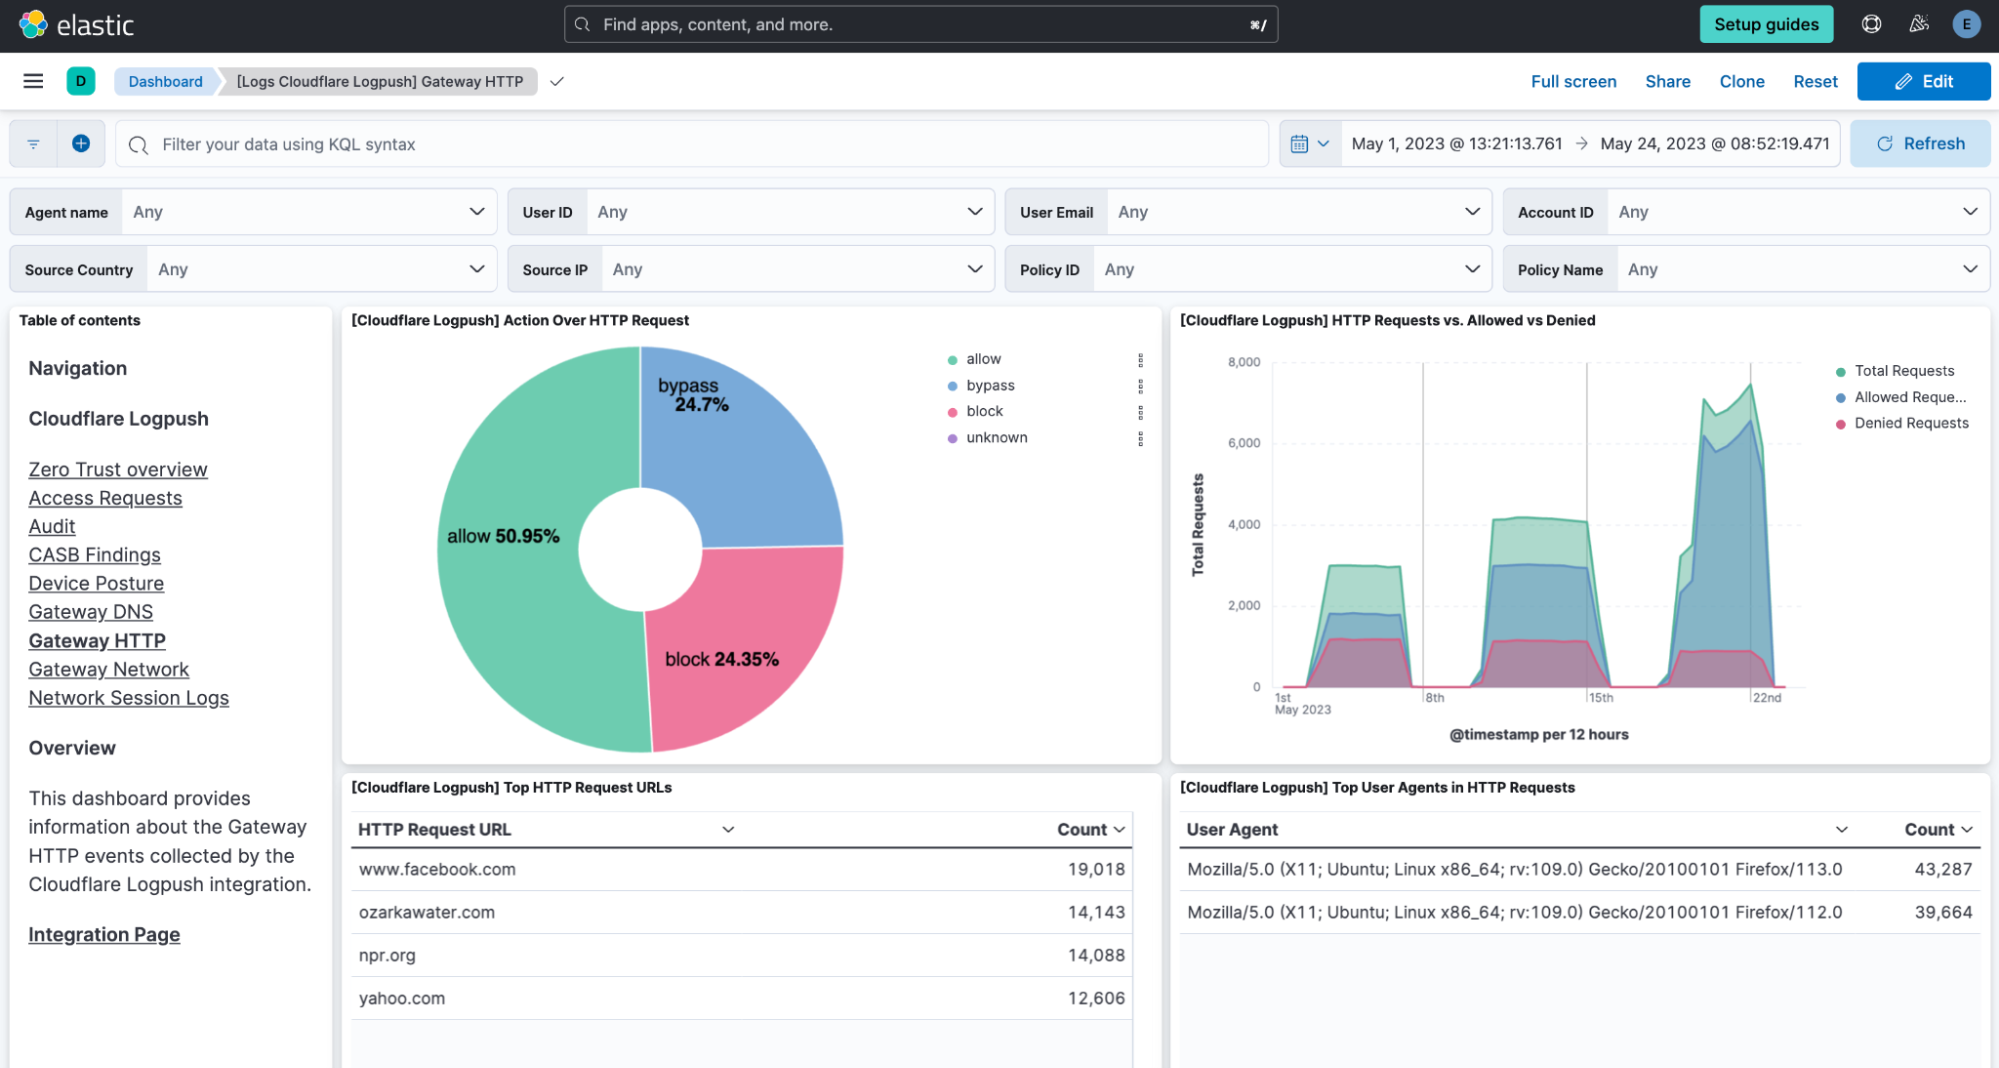
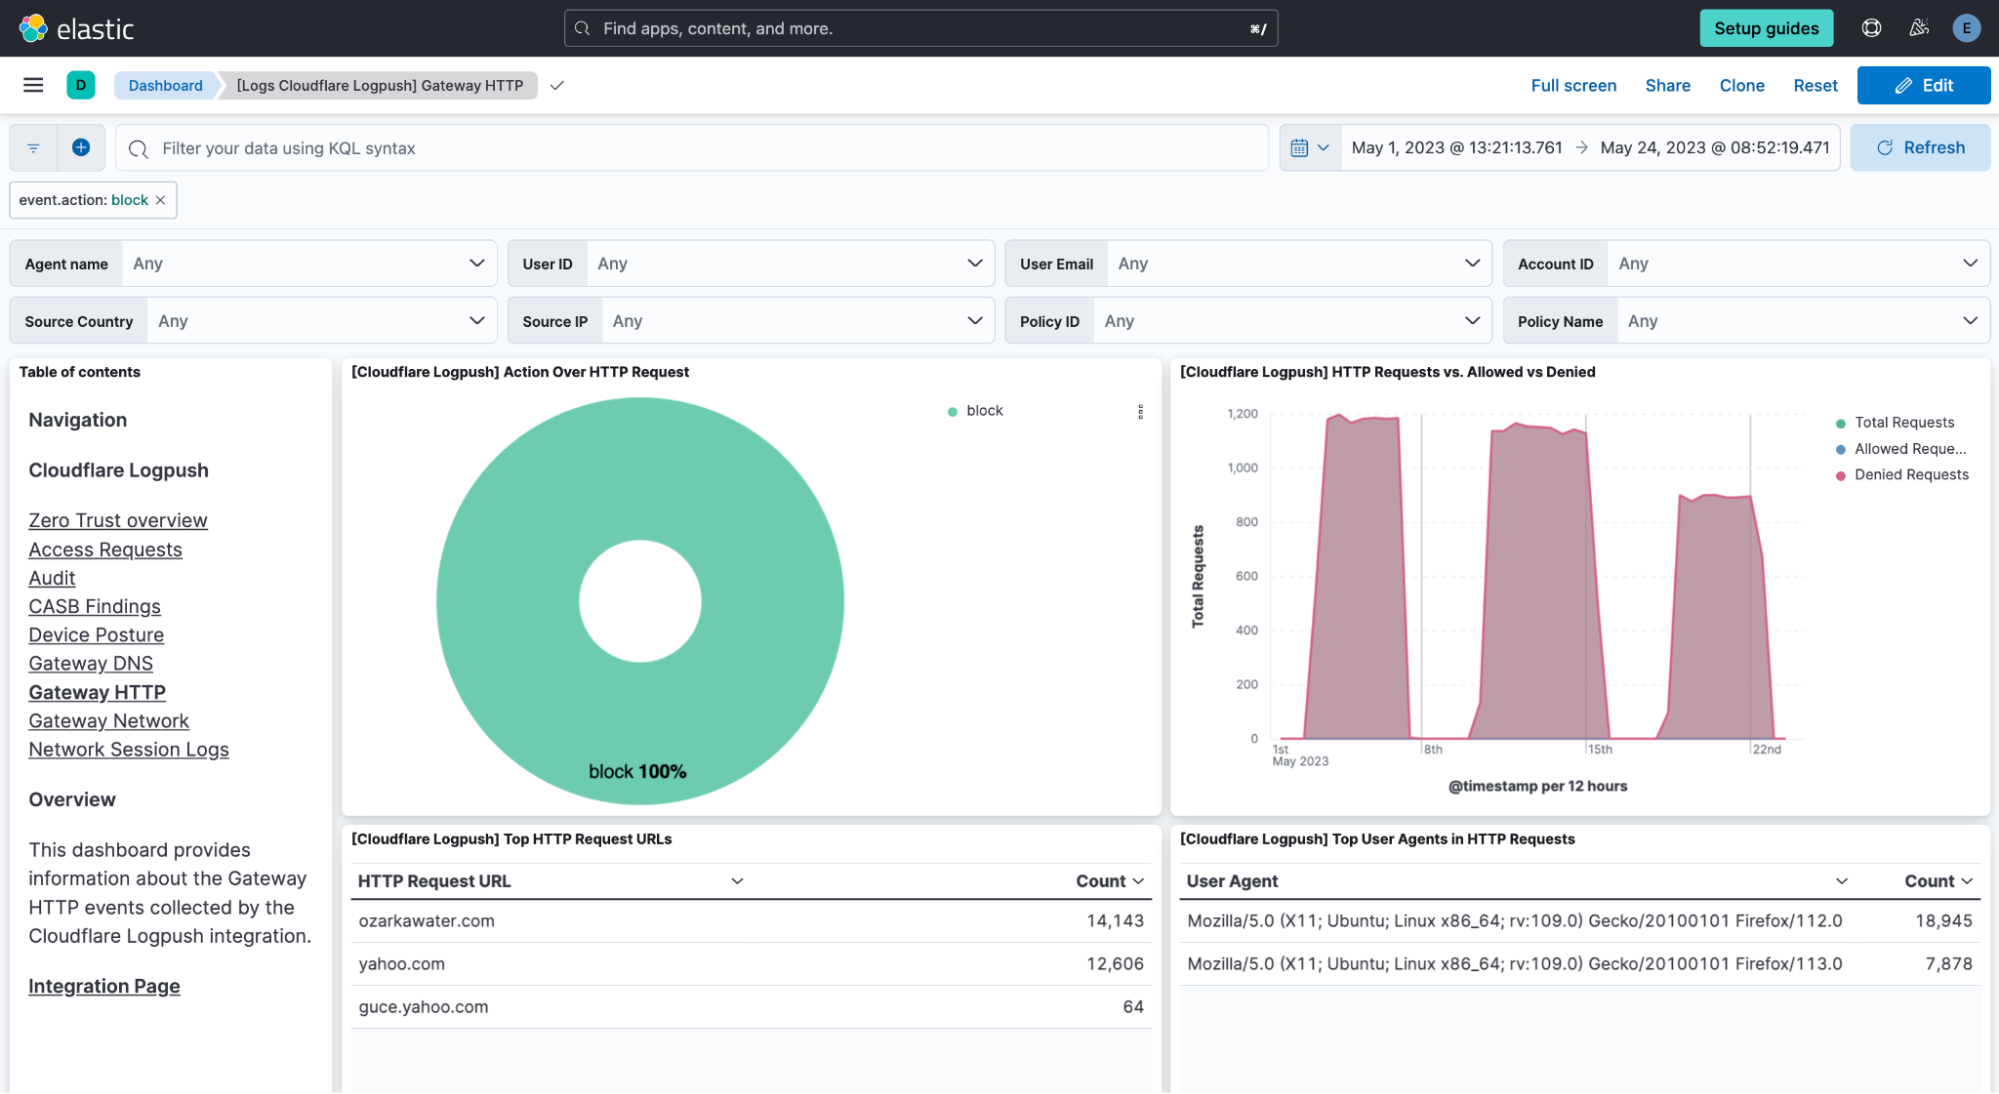
Gateway HTTP
This dashboard focuses on HTTP traffic and allows for monitoring and analyzing HTTP requests passing through Cloudflare’s Secure Web Gateway.
Here, patterns of traffic can be identified, potential threats detected, and a better understanding gained of how resources are being used within the network.
Every visualization in the stage is interactive. Therefore, the whole dashboard adapts to enabled filters, and they can be pinned across dashboards for pivoting. For instance, if clicking on one of the sections of the donut showing the different actions, a filter is automatically applied on that value and the whole dashboard is oriented around it.
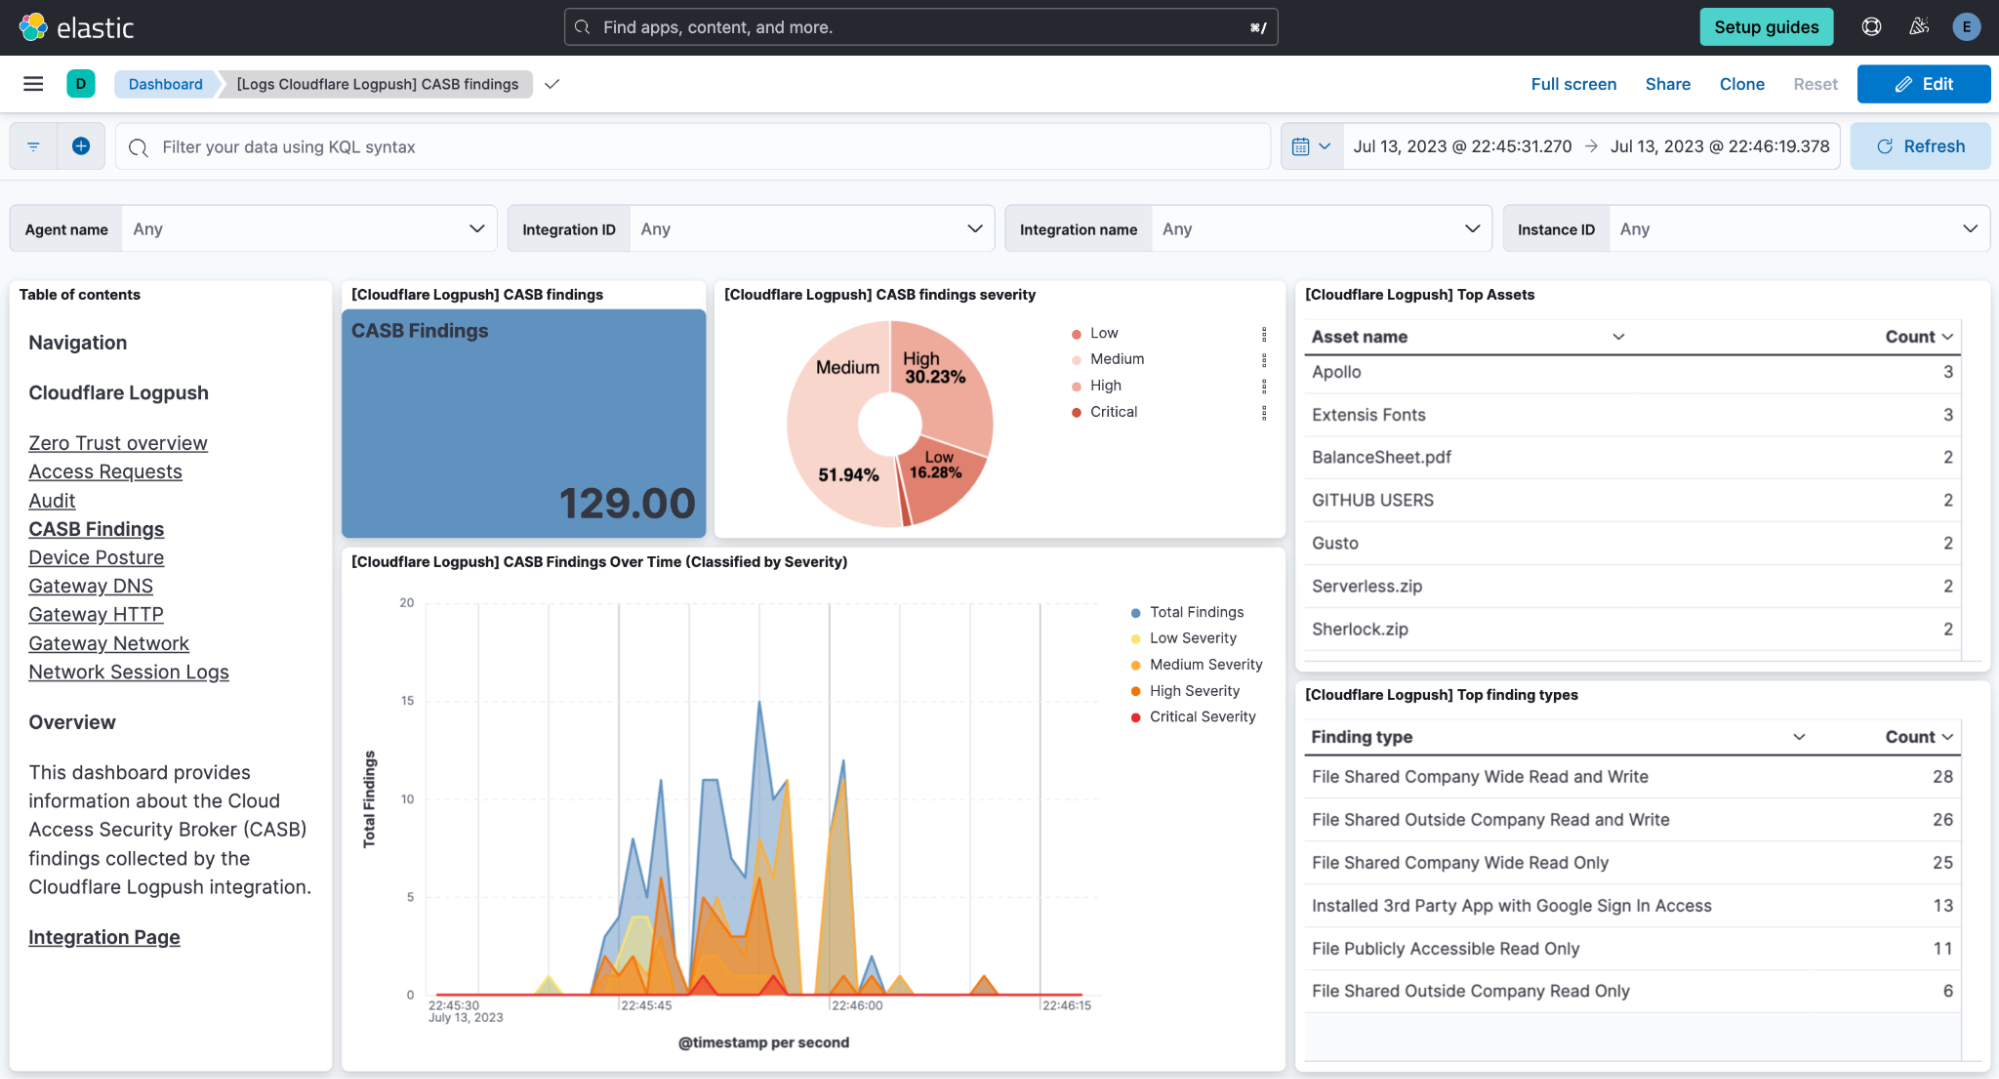
CASB
Following with a different perspective, the CASB (Cloud Access Security Broker) dashboard provides visibility over cloud applications used by users. Its visualizations are targeted to detect threats effectively, helping in the risk management and regulatory compliance.
These examples illustrate how dashboards in the integration between Cloudflare and Elastic offer practical and effective data visualization for Zero Trust. They enable us to make data-driven decisions, identify behavioral patterns, and proactively respond to threats. By providing relevant information in a visual and accessible manner, these dashboards strengthen security posture and allow for more efficient risk management in the Zero Trust environment.
How to get started
Setup and deployment is simple. Use the Cloudflare dashboard or API to create Logpush jobs with all fields enabled for each dataset you’d like to ingest on Elastic. There are eight account-scoped datasets available to use today (Access Requests, Audit logs, CASB findings, Gateway logs including DNS, Network, HTTP; Zero Trust Session Logs) that can be ingested into Elastic.
Setup Logpush jobs to your Elastic destination via one of the following methods:
HTTP Endpoint mode – Cloudflare pushes logs directly to an HTTP endpoint hosted by your Elastic Agent.
AWS S3 polling mode – Cloudflare writes data to S3 and Elastic Agent polls the S3 bucket by listing its contents and reading new files.
AWS S3 SQS mode – Cloudflare writes data to S3, S3 pushes a new object notification to SQS, Elastic Agent receives the notification from SQS, and then reads the S3 object. Multiple Agents can be used in this mode.
Enabling the integration in Elastic
In Kibana, go to Management > Integrations
In the integrations search bar type Cloudflare Logpush.
Click the Cloudflare Logpush integration from the search results.
Click the Add Cloudflare Logpush button to add Cloudflare Logpush integration.
Enable the Integration with the HTTP Endpoint, AWS S3 input or GCS input.
Under the AWS S3 input, there are two types of inputs: using AWS S3 Bucket or using SQS.
Configure Cloudflare to send logs to the Elastic Agent.
What’s next
As organizations increasingly adopt a Zero Trust architecture, understanding your organization’s security posture is paramount. The dashboards help with necessary tools to build a robust security strategy, centered around visibility, early detection, and effective threat response. By unifying data, normalizing fields, facilitating search, and enabling the creation of custom dashboards, this integration becomes a valuable asset for any cybersecurity team aiming to strengthen their security posture.
We’re looking forward to continuing to connect Cloudflare customers with our community of technology partners, to help in the adoption of a Zero Trust architecture.
In an era dominated by digital landscapes, protecting your brand’s identity has become more challenging than ever. Malicious actors regularly build lookalike websites, complete with official logos and spoofed domains, to try to dupe customers and employees. These kinds of phishing attacks can damage your reputation, erode customer trust, or even result in data breaches.
In March 2023 we introduced Cloudflare’s Brand and Phishing Protection suite, beginning with Brand Domain Name Alerts. This tool recognizes so-called “confusable” domains (which can be nearly indistinguishable from their authentic counterparts) by sifting through the trillions of DNS requests passing through Cloudflare’s DNS resolver, 1.1.1.1. This helps brands and organizations stay ahead of malicious actors by spotting suspicious domains as soon as they appear in the wild.
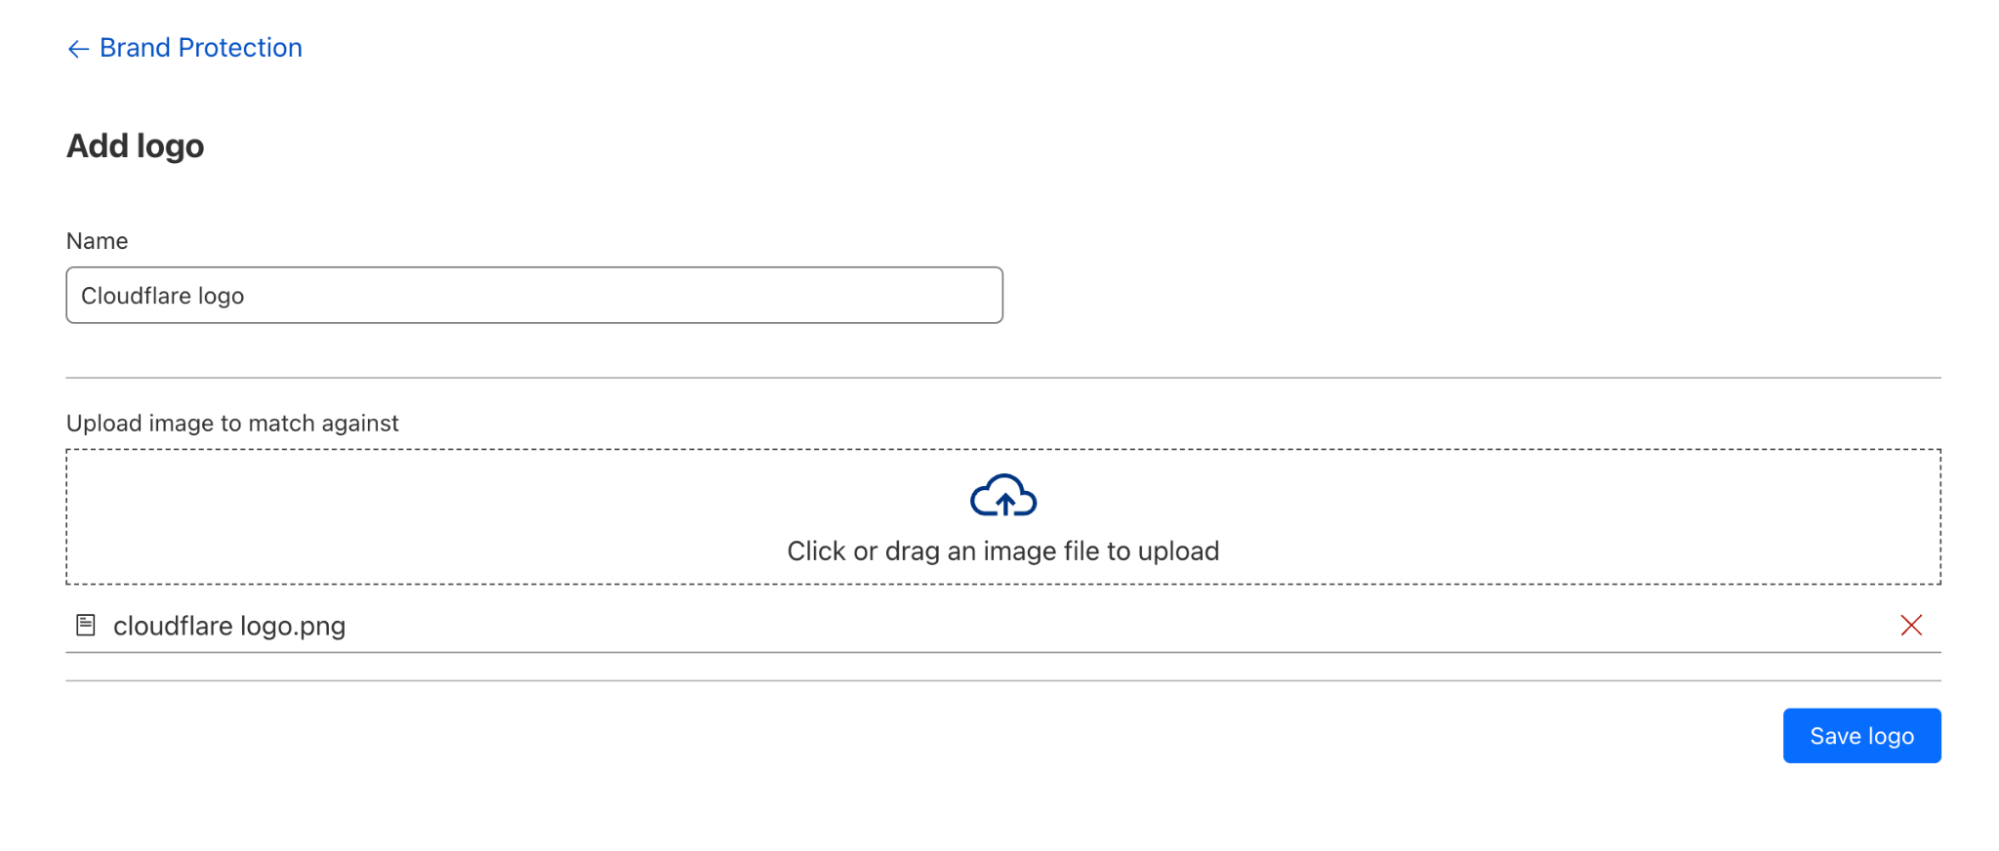
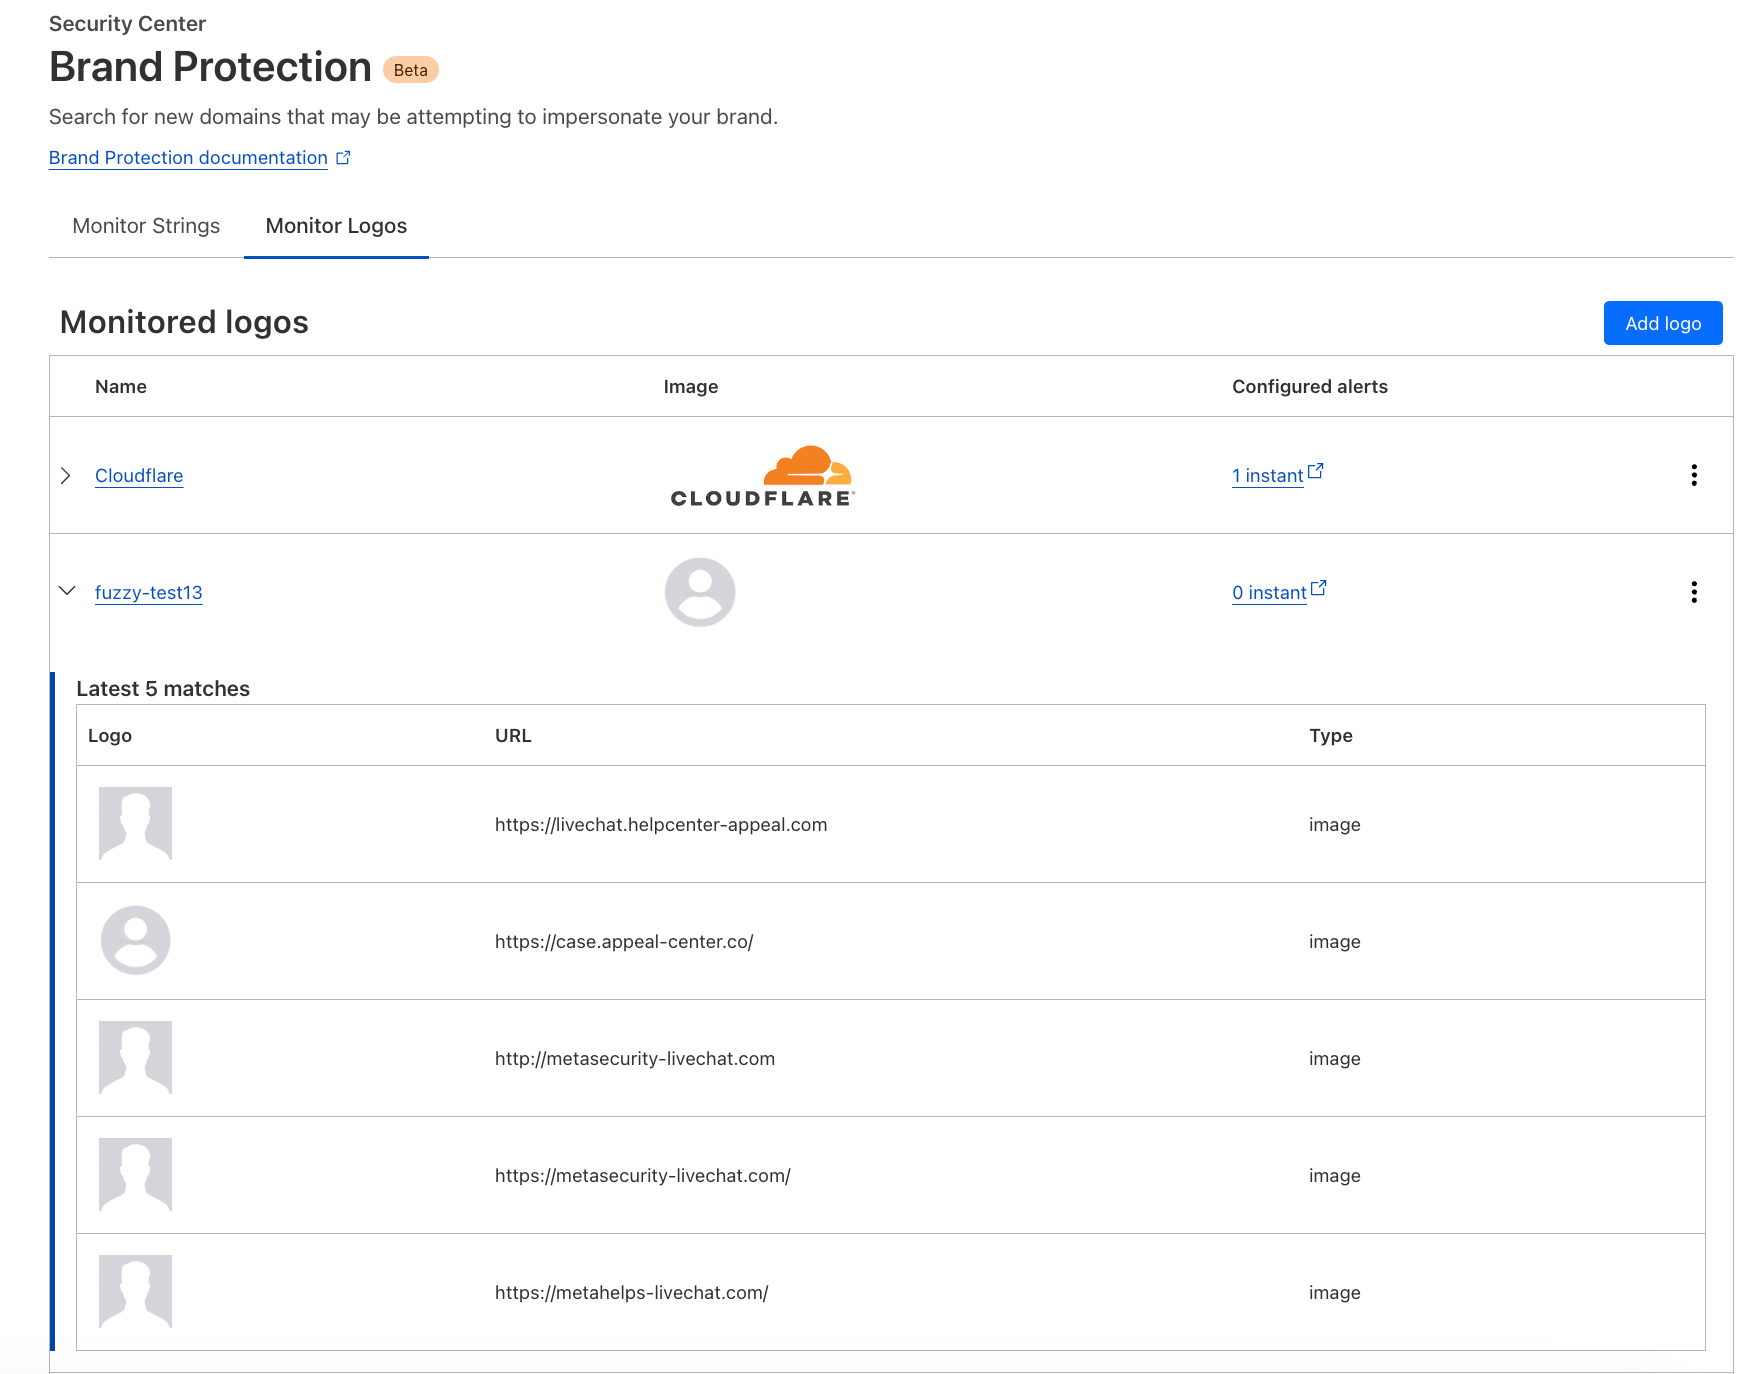
Today we are excited to expand our Brand Protection toolkit with the addition of Logo Matching. Logo Matching is a powerful tool that allows brands to detect unauthorized logo usage: if Cloudflare detects your logo on an unauthorized site, you receive an immediate notification.
The new Logo Matching feature is a direct result of a frequent request from our users. Phishing websites often use official brand logos as part of their facade. In fact, the appearance of unauthorized logos is a strong signal that a hitherto dormant suspicious domain is being weaponized. Being able to identify these sites before they are widely distributed is a powerful tool in defending against phishing attacks. Organizations can use Cloudflare Gateway to block employees from connecting to sites with a suspicious domain and unauthorized logo use.
Imagine having the power to fortify your brand’s presence and reputation. By detecting instances where your logo is being exploited, you gain the upper hand in protecting your brand from potential fraud and phishing attacks.
Getting started with Logo Matching
For most brands, the first step to leveraging Logo Matching will be to configure Domain Name Alerts. For example, we might decide to set up an alert for example.com, which will use fuzzy matching to detect lookalike, high-risk domain names. All sites that trigger an alert are automatically analyzed by Cloudflare’s phishing scanner, which gathers technical information about each site, including SSL certificate data, HTTP request and response data, page performance data, DNS records, and more — all of which inform a machine-learning based phishing risk analysis.
Logo Matching further extends this scan by looking for matching images. The system leverages image recognition algorithms to crawl through scanned domains, identifying matches even when images have undergone slight modifications or alterations.
Once configured, Domain Name Alerts and the scans they trigger will continue on an ongoing basis. In addition, Logo Matching monitors for images across all domains scanned by Cloudflare’s phishing scanner, including those scanned by other Brand Protection users, as well as scans initiated via the Cloudflare Radar URL scanner, and the Investigate Portal within Cloudflare’s Security Center dashboard.
How we built Logo Matching for Brand Protection
Under the hood of our API Insights
Now, let’s dive deeper into the engine powering this feature – our Brand Protection API. This API serves as the backbone of the entire process. Not only does it enable users to submit logos and brand images for scanning, but it also orchestrates the complex matching process.
When a logo is submitted through the API, the Logo Matching feature not only identifies potential matches but also allows customers to save a query, providing an easy way to refer back to their queries and see the most recent results. If a customer chooses to save a query, the logo is swiftly added to our data storage in R2, Cloudflare’s zero egress fee object storage. This foundational feature enables us to continuously provide updated results without the customer having to create a new query for the same logo.
The API ensures real-time responses for logo submissions, simultaneously kick-starting our internal scanning pipelines. An image look-back ID is generated to facilitate seamless tracking and processing of logo submissions. This identifier allows us to keep a record of the submitted images, ensuring that we can efficiently manage and process them through our system.
Scan result retrieval
As images undergo scanning, the API remains the conduit for result retrieval. Its role here is to constantly monitor and provide the results in real time. During scanning, the API ensures users receive timely updates. If scanning is still in progress, a “still scanning” status is communicated. Upon completion, the API is designed to relay crucial information — details on matches if found, or a simple “no matches” declaration.
Storing and maintaining logo data
In the background, we maintain a vectorized version of all user-uploaded logos when the user query is saved. This system, acting as a logo matching subscriber, is entrusted with the responsibility of ensuring accurate and up-to-date logo matching.
To accomplish this, two strategies come into play. Firstly, the subscriber stays attuned to revisions in the logo set. It saves vectorized logo sets with every revision and regular checks are conducted by the subscriber to ensure alignment between the vectorized logos and those saved in the database.
While monitoring the query, the subscriber employs a diff-based strategy. This recalibrates the vectorized logo set against the current logos stored in the database, ensuring a seamless transition into processing.
Shaping the future of brand protection: our roadmap ahead
With the introduction of the Logo Matching feature, Cloudflare’s Brand Protection suite advances to the next level of brand integrity management. By enabling you to detect and analyze, and act on unauthorized logo usage, we’re helping businesses to take better care of their brand identity.
At Cloudflare, we’re committed to shaping a comprehensive brand protection solution that anticipates and mitigates risks proactively. In the future, we plan to add enhancements to our brand protection solution with features like automated cease and desist letters for swift legal action against unauthorized logo use, proactive domain monitoring upon onboarding, simplified reporting of brand impersonations and more.
Getting started
If you’re an Enterprise customer, sign up for Beta Access for Brand protection now to gain access to private scanning for your domains, logo matching, save queries and set up alerts on matched domains. Learn more about Brand Protection here.
As more organizations collectively progress toward adopting a SASE architecture, it has become clear that the traditional SASE market definition (SSE + SD-WAN) is not enough. It forces some teams to work with multiple vendors to address their specific needs, introducing performance and security tradeoffs. More worrisome, it draws focus more to a checklist of services than a vendor’s underlying architecture. Even the most advanced individual security services or traffic on-ramps don’t matter if organizations ultimately send their traffic through a fragmented, flawed network.
Single-vendor SASE is a critical trend to converge disparate security and networking technologies, yet enterprise “any-to-any connectivity” needs true network modernization for SASE to work for all teams. Over the past few years, Cloudflare has launched capabilities to help organizations modernize their networks as they navigate their short- and long-term roadmaps of SASE use cases. We’ve helped simplify SASE implementation, regardless of the team leading the initiative.
Announcing (even more!) flexible on-ramps for single-vendor SASE
Today, we are announcing a series of updates to our SASE platform, Cloudflare One, that further the promise of a single-vendor SASE architecture. Through these new capabilities, Cloudflare makes SASE networking more flexible and accessible for security teams, more efficient for traditional networking teams, and uniquely extend its reach to an underserved technical team in the larger SASE connectivity conversation: DevOps.
These platform updates include:
Flexible on-ramps for site-to-site connectivity that enable both agent/proxy-based and appliance/routing-based implementations, simplifying SASE networking for both security and networking teams.
New WAN-as-a-service (WANaaS) capabilities like high availability, application awareness, a virtual machine deployment option, and enhanced visibility and analytics that boost operational efficiency while reducing network costs through a “light branch, heavy cloud” approach.
Zero Trust connectivity for DevOps: mesh and peer-to-peer (P2P) secure networking capabilities that extend ZTNA to support service-to-service workflows and bidirectional traffic.
Cloudflare offers a wide range of SASE on- and off-ramps — including connectors for your WAN, applications, services, systems, devices, or any other internal network resources — to more easily route traffic to and from Cloudflare services. This helps organizations align with their best fit connectivity paradigm, based on existing environment, technical familiarity, and job role.
We recently dove into the Magic WAN Connector in a separate blog post and have explained how all our on-ramps fit together in our SASE reference architecture, including our new WARP Connector. This blog focuses on the main impact those technologies have for customers approaching SASE networking from different angles.
More flexible and accessible for security teams
The process of implementing a SASE architecture can challenge an organization’s status quo for internal responsibilities and collaboration across IT, security, and networking. Different teams own various security or networking technologies whose replacement cycles are not necessarily aligned, which can reduce the organization’s willingness to support particular projects.
Security or IT practitioners need to be able to protect resources no matter where they reside. Sometimes a small connectivity change would help them more efficiently protect a given resource, but the task is outside their domain of control. Security teams don’t want to feel reliant on their networking teams in order to do their jobs, and yet they also don’t need to cause downstream trouble with existing network infrastructure. They need an easier way to connect subnets, for instance, without feeling held back by bureaucracy.
Agent/proxy-based site-to-site connectivity
To help push these security-led projects past the challenges associated with traditional siloes, Cloudflare offers both agent/proxy-based and appliance/routing-based implementations for site-to-site or subnet-to-subnet connectivity. This way, networking teams can pursue the traditional networking concepts with which they are familiar through our appliance/routing-based WANaaS — a modern architecture vs. legacy SD-WAN overlays. Simultaneously, security/IT teams can achieve connectivity through agent/proxy-based software connectors (like the WARP Connector) that may be more approachable to implement. This agent-based approach blurs the lines between industry norms for branch connectors and app connectors, bringing WAN and ZTNA technology closer together to help achieve least-privileged access everywhere.
Agent/proxy-based connectivity may be a complementary fit for a subset of an organization’s total network connectivity. These software-driven site-to-site use cases could include microsites with no router or firewall, or perhaps cases in which teams are unable to configure IPsec or GRE tunnels like in tightly regulated managed networks or cloud environments like Kubernetes. Organizations can mix and match traffic on-ramps to fit their needs; all options can be used composably and concurrently.
Our agent/proxy-based approach to site-to-site connectivity uses the same underlying technology that helps security teams fully replace VPNs, supporting ZTNA for apps with server-initiated or bidirectional traffic. These include services such as Voice over Internet Protocol (VoIP) and Session Initiation Protocol (SIP) traffic, Microsoft’s System Center Configuration Manager (SCCM), Active Directory (AD) domain replication, and as detailed later in this blog, DevOps workflows.
This new Cloudflare on-ramp enables site-to-site, bidirectional, and mesh networking connectivity without requiring changes to underlying network routing infrastructure, acting as a router for the subnet within the private network to on-ramp and off-ramp traffic through Cloudflare.
More efficient for networking teams
Meanwhile, for networking teams who prefer a network-layer appliance/routing-based implementation for site-to-site connectivity, the industry norms still force too many tradeoffs between security, performance, cost, and reliability. Many (if not most) large enterprises still rely on legacy forms of private connectivity such as MPLS. MPLS is generally considered expensive and inflexible, but it is highly reliable and has features such as quality of service (QoS) that are used for bandwidth management.
Commodity Internet connectivity is widely available in most parts of the inhabited world, but has a number of challenges which make it an imperfect replacement to MPLS. In many countries, high speed Internet is fast and cheap, but this is not universally true. Speed and costs depend on the local infrastructure and the market for regional service providers. In general, broadband Internet is also not as reliable as MPLS. Outages and slowdowns are not unusual, with customers having varying degrees of tolerance to the frequency and duration of disrupted service. For businesses, outages and slowdowns are not tolerable. Disruptions to network service means lost business, unhappy customers, lower productivity and frustrated employees. Thus, despite the fact that a significant amount of corporate traffic flows have shifted to the Internet anyway, many organizations face difficulty migrating away from MPLS.
SD-WAN introduced an alternative to MPLS that is transport neutral and improves networking stability over conventional broadband alone. However, it introduces new topology and security challenges. For example, many SD-WAN implementations can increase risk if they bypass inspection between branches. It also has implementation-specific challenges such as how to address scaling and the use/control (or more precisely, the lack of) a middle mile. Thus, the promise of making a full cutover to Internet connectivity and eliminating MPLS remains unfulfilled for many organizations. These issues are also not very apparent to some customers at the time of purchase and require continuing market education.
Evolution of the enterprise WAN
Cloudflare Magic WAN follows a different paradigm built from the ground up in Cloudflare’s connectivity cloud; it takes a “light branch, heavy cloud” approach to augment and eventually replace existing network architectures including MPLS circuits and SD-WAN overlays. While Magic WAN has similar cloud-native routing and configuration controls to what customers would expect from traditional SD-WAN, it is easier to deploy, manage, and consume. It scales with changing business requirements, with security built in. Customers like Solocal agree that the benefits of this architecture ultimately improve their total cost of ownership:
“Cloudflare’s Magic WAN Connector offers a centralized and automated management of network and security infrastructure, in an intuitive approach. As part of Cloudflare’s SASE platform, it provides a consistent and homogeneous single-vendor architecture, founded on market standards and best practices. Control over all data flows is ensured, and risks of breaches or security gaps are reduced. It is obvious to Solocal that it should provide us with significant savings, by reducing all costs related to acquiring, installing, maintaining, and upgrading our branch network appliances by up to 40%. A high-potential connectivity solution for our IT to modernize our network.” – Maxime Lacour, Network Operations Manager, Solocal
This is quite different from other single-vendor SASE vendor approaches which have been trying to reconcile acquisitions that were designed around fundamentally different design philosophies. These “stitched together” solutions lead to a non-converged experience due to their fragmented architectures, similar to what organizations might see if they were managing multiple separate vendors anyway. Consolidating the components of SASE with a vendor that has built a unified, integrated solution, versus piecing together different solutions for networking and security, significantly simplifies deployment and management by reducing complexity, bypassed security, and potential integration or connectivity challenges.
Magic WAN can automatically establish IPsec tunnels to Cloudflare via our Connector device, manually via Anycast IPsec or GRE Tunnels initiated on a customer’s edge router or firewall, or via Cloudflare Network Interconnect (CNI) at private peering locations or public cloud instances. It pushes beyond “integration” claims with SSE to truly converge security and networking functionality and help organizations more efficiently modernize their networks.
New Magic WAN Connector capabilities
In October 2023, we announced the general availability of the Magic WAN Connector, a lightweight device that customers can drop into existing network environments for zero-touch connectivity to Cloudflare One, and ultimately used to replace other networking hardware such as legacy SD-WAN devices, routers, and firewalls. Today, we’re excited to announce new capabilities of the Magic WAN Connector including:
High Availability (HA) configurations for critical environments: In enterprise deployments, organizations generally desire support for high availability to mitigate the risk of hardware failure. High availability uses a pair of Magic WAN Connectors (running as a VM or on a supported hardware device) that work in conjunction with one another to seamlessly resume operation if one device fails. Customers can manage HA configuration, like all other aspects of the Magic WAN Connector, from the unified Cloudflare One dashboard.
Application awareness: One of the central differentiating features of SD-WAN vs. more traditional networking devices has been the ability to create traffic policies based on well-known applications, in addition to network-layer attributes like IP and port ranges. Application-aware policies provide easier management and more granularity over traffic flows. Cloudflare’s implementation of application awareness leverages the intelligence of our global network, using the same categorization/classification already shared across security tools like our Secure Web Gateway, so IT and security teams can expect consistent behavior across routing and inspection decisions – a capability not available in dual-vendor or stitched-together SASE solutions.
Virtual machine deployment option: The Magic WAN Connector is now available as a virtual appliance software image, that can be downloaded for immediate deployment on any supported virtualization platform / hypervisor. The virtual Magic WAN Connector has the same ultra-low-touch deployment model and centralized fleet management experience as the hardware appliance, and is offered to all Magic WAN customers at no additional cost.
Enhanced visibility and analytics:The Magic WAN Connector features enhanced visibility into key metrics such as connectivity status, CPU utilization, memory consumption, and device temperature. These analytics are available via dashboard and API so operations teams can integrate the data into their NOCs.
Extending SASE’s reach to DevOps
Complex continuous integration and continuous delivery (CI/CD) pipeline interaction is famous for being agile, so the connectivity and security supporting these workflows should match. DevOps teams too often rely on traditional VPNs to accomplish remote access to various development and operational tools. VPNs are cumbersome to manage, susceptible to exploit with known or zero-day vulnerabilities, and use a legacy hub-and-spoke connectivity model that is too slow for modern workflows.
Of any employee group, developers are particularly capable of finding creative workarounds that decrease friction in their daily workflows, so all corporate security measures need to “just work,” without getting in their way. Ideally, all users and servers across build, staging, and production environments should be orchestrated through centralized, Zero Trust access controls, no matter what components and tools are used and no matter where they are located. Ad hoc policy changes should be accommodated, as well as temporary Zero Trust access for contractors or even emergency responders during a production server incident.
Zero Trust connectivity for DevOps
ZTNA works well as an industry paradigm for secure, least-privileged user-to-app access, but it should extend further to secure networking use cases that involve server-initiated or bidirectional traffic. This follows an emerging trend that imagines an overlay mesh connectivity model across clouds, VPCs, or network segments without a reliance on routers. For true any-to-any connectivity, customers need flexibility to cover all of their network connectivity and application access use cases. Not every SASE vendor’s network on-ramps can extend beyond client-initiated traffic without requiring network routing changes or making security tradeoffs, so generic “any-to-any connectivity” claims may not be what they initially seem.
Cloudflare extends the reach of ZTNA to ensure all user-to-app use cases are covered, plus mesh and P2P secure networking to make connectivity options as broad and flexible as possible. DevOps service-to-service workflows can run efficiently on the same platform that accomplishes ZTNA, VPN replacement, or enterprise-class SASE. Cloudflare acts as the connectivity “glue” across all DevOps users and resources, regardless of the flow of traffic at each step. This same technology, i.e., WARP Connector, enables admins to manage different private networks with overlapping IP ranges — VPC & RFC1918, support server-initiated traffic and P2P apps (e.g., SCCM, AD, VoIP & SIP traffic) connectivity over existing private networks, build P2P private networks (e.g., CI/CD resource flows), and deterministically route traffic. Organizations can also automate management of their SASE platform with Cloudflare’s Terraform provider.
The Cloudflare difference
Cloudflare’s single-vendor SASE platform, Cloudflare One, is built on our connectivity cloud — the next evolution of the public cloud, providing a unified, intelligent platform of programmable, composable services that enable connectivity between all networks (enterprise and Internet), clouds, apps, and users. Our connectivity cloud is flexible enough to make “any-to-any connectivity” a more approachable reality for organizations implementing a SASE architecture, accommodating deployment preferences alongside prescriptive guidance. Cloudflare is built to offer the breadth and depth needed to help organizations regain IT control through single-vendor SASE and beyond, while simplifying workflows for every team that contributes along the way.
Other SASE vendors designed their data centers for egress traffic to the Internet. They weren’t designed to handle or secure East-West traffic, providing neither middle mile nor security services for traffic passing from branch to HQ or branch to branch. Cloudflare’s middle mile global backbone supports security and networking for any-to-any connectivity, whether users are on-prem or remote, and whether apps are in the data center or in the cloud.
Two months ago, we made Cloudflare Turnstile generally available — giving website owners everywhere an easy way to fend off bots, without ever issuing a CAPTCHA. Turnstile allows any website owner to embed a frustration-free Cloudflare challenge on their website with a simple code snippet, making it easy to help ensure that only human traffic makes it through. In addition to protecting a website’s frontend, Turnstile also empowers web administrators to harden browser-initiated (AJAX) API calls running under the hood. These APIs are commonly used by dynamic single-page web apps, like those created with React, Angular, Vue.js.
Today, we’re excited to announce that we have integrated Turnstile with the Cloudflare Web Application Firewall (WAF). This means that web admins can add the Turnstile code snippet to their websites, and then configure the Cloudflare WAF to manage these requests. This is completely customizable using WAF Rules; for instance, you can allow a user authenticated by Turnstile to interact with all of an application’s API endpoints without facing any further challenges, or you can configure certain sensitive endpoints, like Login, to always issue a challenge.
Challenging fetch requests in the Cloudflare WAF
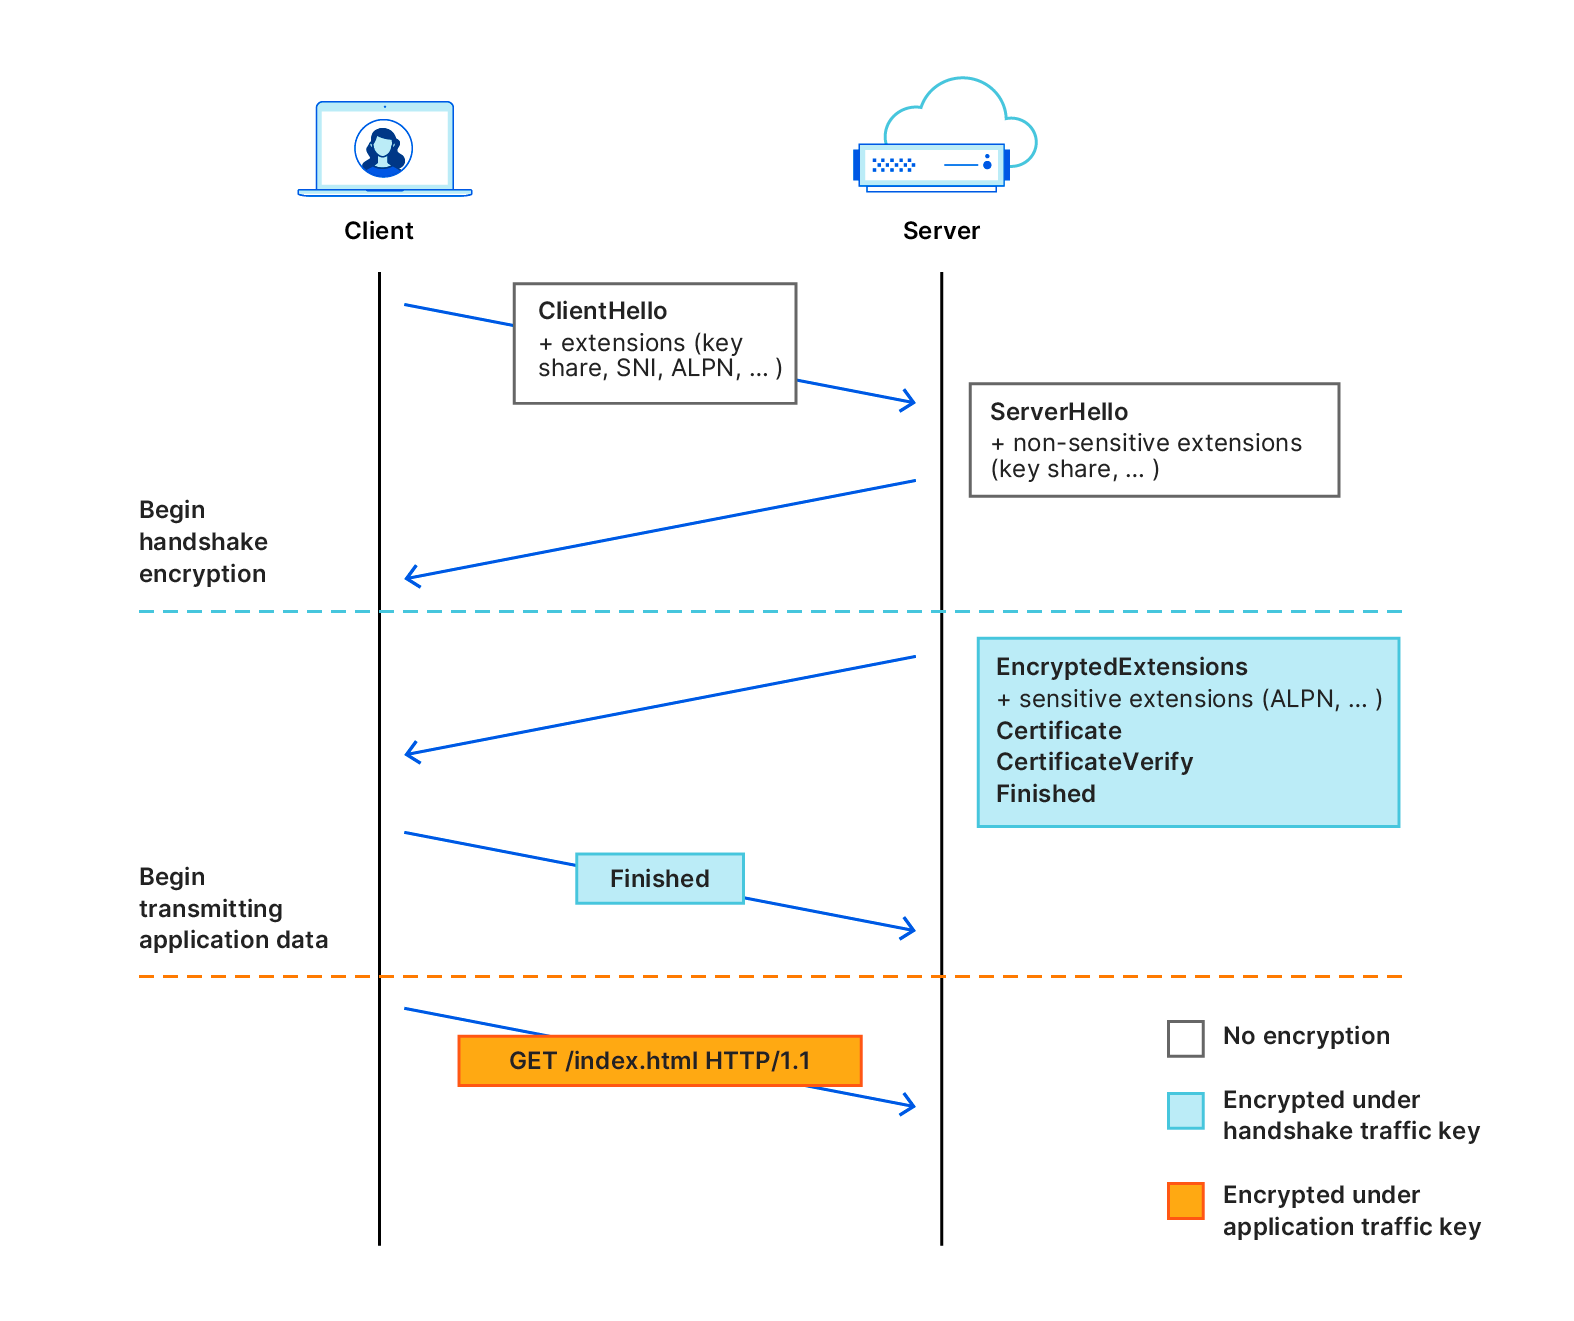
Millions of websites protected by Cloudflare’s WAF leverage our JS Challenge, Managed Challenge, and Interactive Challenge to stop bots while letting humans through. For each of these challenges, Cloudflare intercepts the matching request and responds with an HTML page rendered by the browser, where the user completes a basic task to demonstrate that they’re human. When a user successfully completes a challenge, they receive a cf_clearance cookie, which tells Cloudflare that a user has successfully passed a challenge, the type of challenge, and when it was completed. A clearance cookie can’t be shared between users, and is only valid for the time set by the Cloudflare customer in their Security Settings dashboard.
This process works well, except when a browser receives a challenge on a fetch request and the browser has not previously passed a challenge. On a fetch request, or an XML HTTP Request (XHR), the browser expects to get back simple text (in JSON or XML formats) and cannot render the HTML necessary to run a challenge.
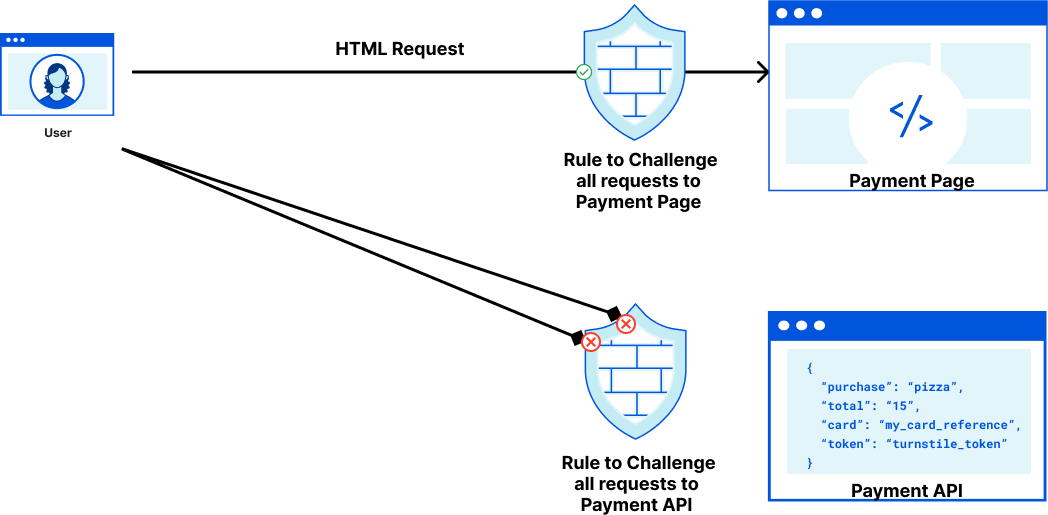
As an example, let’s imagine a pizzeria owner who built an online ordering form in React with a payment page that submits data to an API endpoint that processes payments. When a user views the web form to add their credit card details they can pass a Managed Challenge, but when the user submits their credit card details by making a fetch request, the browser won’t execute the code necessary for a challenge to run. The pizzeria owner’s only option for handling suspicious (but potentially legitimate) requests is to block them, which runs the risk of false positives that could cause the restaurant to lose a sale.
This is where Turnstile can help. Turnstile allows anyone on the Internet to embed a Cloudflare challenge anywhere on their website. Before today, the output of Turnstile was only a one-time use token. To enable customers to issue challenges for these fetch requests, Turnstile can now issue a clearance cookie for the domain that it’s embedded on. Customers can issue their challenge within the HTML page before a fetch request, pre-clearing thevisitor to interact with the Payment API.
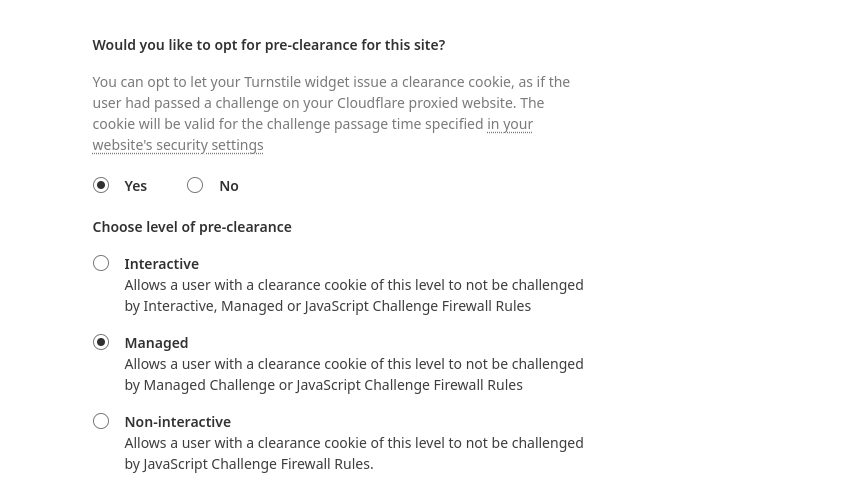
Turnstile Pre-Clearance mode
Returning to our pizzeria example, the three big advantages of using Pre-Clearance to integrate Turnstile with the Cloudflare WAF are:
Improved user experience: Turnstile’s embedded challenge can run in the background while the visitor is entering their payment details.
Blocking more requests at the edge: Because Turnstile now issues a clearance cookie for the domain that it’s embedded on, our pizzeria owner can use a Custom Rule to issue a Managed Challenge for every request to the payment API. This ensures that automated attacks attempting to target the payment API directly are stopped by Cloudflare before they can reach the API.
(Optional) Securing the action and the user: No backend code changes are necessary to get the benefit of Pre-Clearance. However, further Turnstile integration will increase security for the integrated API. The pizzeria owner can adjust their payment form to validate the received Turnstile token, ensuring that every payment attempt is individually validated by Turnstile to protect their payment endpoint from session hijacking.
A Turnstile widget with Pre-Clearance enabled will still issue turnstile tokens, which gives customers the flexibility to decide if an endpoint is critical enough to require a security check on every request to it, or just once a session. Clearance cookies issued by a Turnstile widget are automatically applied to the Cloudflare zone the Turnstile widget is embedded on, with no configuration necessary. The clearance time the token is valid for is still controlled by the zone specific “Challenge Passage” time.
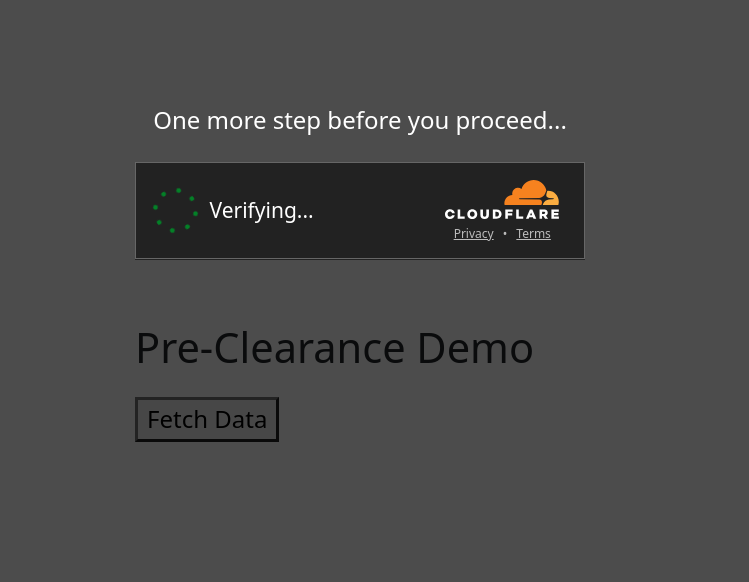
Implementing Turnstile with Pre-Clearance
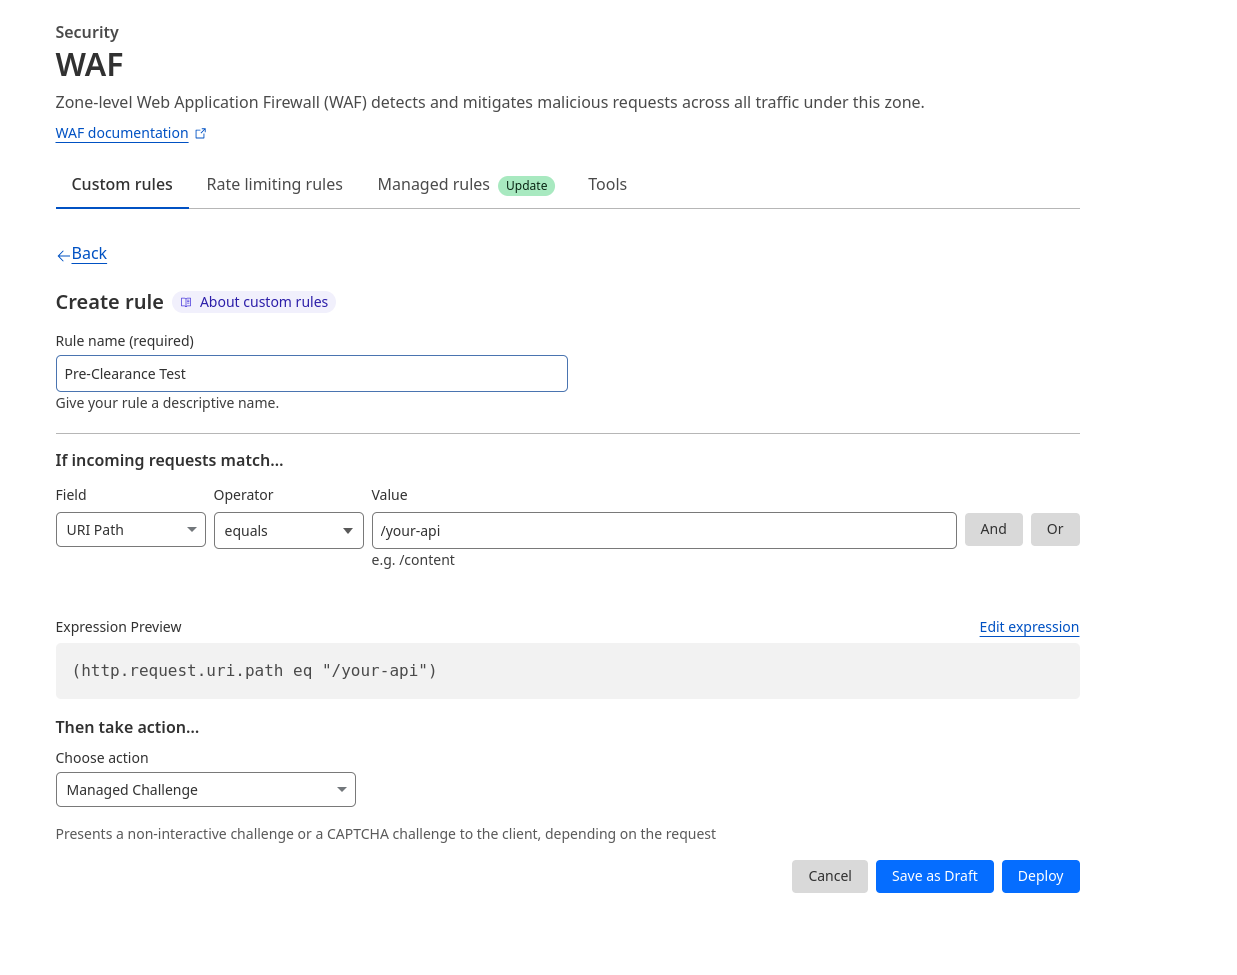
Let’s make this concrete by walking through a basic implementation. Before we start, we’ve set up a simple demo application where we emulate a frontend talking to a backend on a /your-api endpoint.
We’ve created a button. Upon clicking, Cloudflare makes a fetch() request to the /your-api endpoint, showing the result in the response container.
Now let’s consider that we have a Cloudflare WAF rule set up that protects the /your-api endpoint with a Managed Challenge.
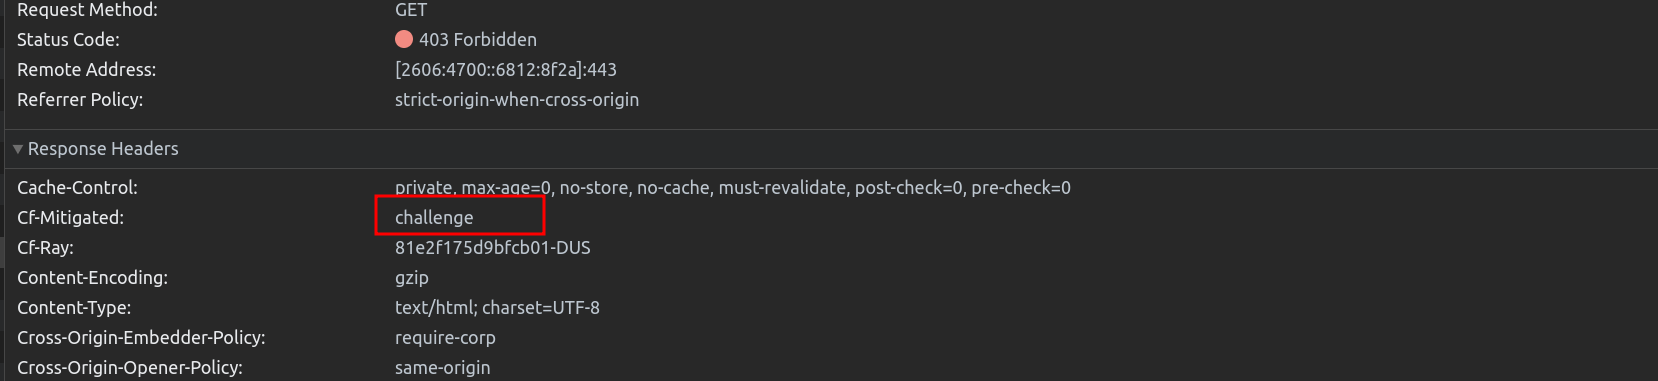
Due to this rule, the app that we just wrote is going to fail for the reason described earlier (the browser is expecting a JSON response, but instead receives the challenge page as HTML).
If we inspect the Network Tab, we can see that the request to /your-api has been given a 403 response.
Upon inspection, the Cf-Mitigated header shows that the response was challenged by Cloudflare’s firewall, as the visitor has not solved a challenge before.
To address this problem in our app, we set up a Turnstile Widget in Pre-Clearance mode for the Turnstile sitekey that we want to use.
In our application, we override the fetch() function to invoke Turnstile once a Cf-Mitigated response has been received.
<script>
turnstileLoad = function () {
  // Save a reference to the original fetch function
  const originalFetch = window.fetch;

  // A simple modal to contain Cloudflare Turnstile
  const overlay = document.createElement('div');
  overlay.style.position = 'fixed';
  overlay.style.top = '0';
  overlay.style.left = '0';
  overlay.style.right = '0';
  overlay.style.bottom = '0';
  overlay.style.backgroundColor = 'rgba(0, 0, 0, 0.7)';
  overlay.style.border = '1px solid grey';
  overlay.style.zIndex = '10000';
  overlay.style.display = 'none';
  overlay.innerHTML =       '<p style="color: white; text-align: center; margin-top: 50vh;">One more step before you proceed...</p><div style=”display: flex; flex-wrap: nowrap; align-items: center; justify-content: center;” id="turnstile_widget"></div>';
  document.body.appendChild(overlay);

  // Override the native fetch function
  window.fetch = async function (...args) {
      let response = await originalFetch(...args);

      //If the original request was challenged...
      if (response.headers.has('cf-mitigated') && response.headers.get('cf-mitigated') === 'challenge') {
          //The request has been challenged...
          overlay.style.display = 'block';

          await new Promise((resolve, reject) => {
              turnstile.render('#turnstile_widget', {
                  'sitekey': ‘YOUR_TURNSTILE_SITEKEY',
                  'error-callback': function (e) {
                      overlay.style.display = 'none';
                      reject(e);
                  },
                  'callback': function (token, preClearanceObtained) {
                      if (preClearanceObtained) {
                          //The visitor successfully solved the challenge on the page.
                          overlay.style.display = 'none';
                          resolve();
                      } else {
                          reject(e);
                      }
                  },
              });
          });

          // Replay the original fetch request, this time it will have the cf_clearance Cookie
          response = await originalFetch(...args);
      }
      return response;
  };
};
</script>
<script src="https://challenges.cloudflare.com/turnstile/v0/api.js?onload=turnstileLoad" async defer></script>
There is a lot going on in the snippet above: First, we create a hidden overlay element and override the browser’s fetch() function. The fetch() function is changed to introspect the Cf-Mitigated header for ‘challenge’. If a challenge is issued, the initial result will be unsuccessful; instead, a Turnstile overlay (with Pre-Clearance enabled) will appear in our web application. Once the Turnstile challenge has been completed we will retry the previous request after Turnstile has obtained the cf_clearance cookie to get through the Cloudflare WAF.
Upon solving the Turnstile widget, the overlay disappears, and the requested API result is shown successfully:
Pre-Clearance is available to all Cloudflare customers
Every Cloudflare user with a free plan or above can use Turnstile in managed mode free for an unlimited number of requests. If you’re a Cloudflare user looking to improve your security and user experience for your critical API endpoints, head over to our dashboard and create a Turnstile widget with Pre-Clearance today.
Today, we’re announcing the general availability of the Magic WAN Connector, a key component of our SASE platform, Cloudflare One. Magic WAN Connector is the glue between your existing network hardware and Cloudflare’s network — it provides a super simplified software solution that comes pre-installed on Cloudflare-certified hardware, and is entirely managed from the Cloudflare One dashboard.
It takes only a few minutes from unboxing to seeing your network traffic automatically routed to the closest Cloudflare location, where it flows through a full stack of Zero Trust security controls before taking an accelerated path to its destination, whether that’s another location on your private network, a SaaS app, or any application on the open Internet.
Since we announced our beta earlier this year, organizations around the world have deployed the Magic WAN Connector to connect and secure their network locations. We’re excited for the general availability of the Magic WAN Connector to accelerate SASE transformation at scale.
When customers tell us about their journey to embrace SASE, one of the most common stories we hear is:
We started with our remote workforce, deploying modern solutions to secure access to internal apps and Internet resources. But now, we’re looking at the broader landscape of our enterprise network connectivity and security, and it’s daunting. We want to shift to a cloud and Internet-centric model for all of our infrastructure, but we’re struggling to figure out how to start.
The Magic WAN Connector was created to address this problem.
Zero-touch connectivity to your new corporate WAN
Cloudflare One enables organizations of any size to connect and secure all of their users, devices, applications, networks, and data with a unified platform delivered by our global connectivity cloud. Magic WAN is the network connectivity “glue” of Cloudflare One, allowing our customers to migrate away from legacy private circuits and use our network as an extension of their own.
Previously, customers have connected their locations to Magic WAN with Anycast GRE or IPsec tunnels configured on their edge network equipment (usually existing routers or firewalls), or plugged into us directly with CNI. But for the past few years, we’ve heard requests from hundreds of customers asking for a zero-touch approach to connecting their branches: We just want something we can plug in and turn on, and it handles the rest.
The Magic WAN Connector is exactly this. Customers receive Cloudflare-certified hardware with our software pre-installed on it, and everything is controlled via the Cloudflare dashboard. What was once a time-consuming, complex process now takes a matter of minutes, enabling robust Zero-Trust protection for all of your traffic.
In addition to automatically configuring tunnels and routing policies to direct your network traffic to Cloudflare, the Magic WAN Connector will also handle traffic steering, shaping and failover to make sure your packets always take the best path available to the closest Cloudflare network location — which is likely only milliseconds away. You’ll also get enhanced visibility into all your traffic flows in analytics and logs, providing a unified observability experience across both your branches and the traffic through Cloudflare’s network.
Zero Trust security for all your traffic
Once the Magic WAN Connector is deployed at your network location, you have automatic access to enforce Zero Trust security policies across both public and private traffic.
A secure on-ramp to the Internet
An easy first step to improving your organization’s security posture after connecting network locations to Cloudflare is creating Secure Web Gateway policies to defend against ransomware, phishing, and other threats for faster, safer Internet browsing. By default, all Internet traffic from locations with the Magic WAN Connector will route through Cloudflare Gateway, providing a unified management plane for traffic from physical locations and remote employees.
A more secure private network
The Magic WAN Connector also enables routing private traffic between your network locations, with multiple layers of network and Zero Trust security controls in place. Unlike a traditional network architecture, which requires deploying and managing a stack of security hardware and backhauling branch traffic through a central location for filtering, a SASE architecture provides private traffic filtering and control built-in: enforced across a distributed network, but managed from a single dashboard interface or API.
A simpler approach for hybrid cloud
Cloudflare One enables connectivity for any physical or cloud network with easy on-ramps depending on location type. The Magic WAN Connector provides easy connectivity for branches, but also provides automatic connectivity to other networks including VPCs connected using cloud-native constructs (e.g., VPN Gateways) or direct cloud connectivity (via Cloud CNI). With a unified connectivity and control plane across physical and cloud infrastructure, IT and security teams can reduce overhead and cost of managing multi- and hybrid cloud networks.
Single-vendor SASE dramatically reduces cost and complexity
With the general availability of the Magic WAN Connector, we’ve put the final piece in place to deliver a unified SASE platform, developed and fully integrated from the ground up. Deploying and managing all the components of SASE with a single vendor, versus piecing together different solutions for networking and security, significantly simplifies deployment and management by reducing complexity and potential integration challenges. Many vendors that market a full SASE solution have actually stitched together separate products through acquisition, leading to an un-integrated experience similar to what you would see deploying and managing multiple separate vendors. In contrast, Cloudflare One (now with the Magic WAN Connector for simplified branch functions) enables organizations to achieve the true promise of SASE: a simplified, efficient, and highly secure network and security infrastructure that reduces your total cost of ownership and adapts to the evolving needs of the modern digital landscape.
Evolving beyond SD-WAN
Cloudflare One addresses many of the challenges that were left behind as organizations deployed SD-WAN to help simplify networking operations. SD-WAN provides orchestration capabilities to help manage devices and configuration in one place, as well as last mile traffic management to steer and shape traffic based on more sophisticated logic than is possible in traditional routers. But SD-WAN devices generally don't have embedded security controls, leaving teams to stitch together a patchwork of hardware, virtualized and cloud-based tools to keep their networks secure. They can make decisions about the best way to send traffic out from a customer’s branch, but they have no way to influence traffic hops between the last mile and the traffic's destination. And while some SD-WAN providers have surfaced virtualized versions of their appliances that can be deployed in cloud environments, they don't support native cloud connectivity and can complicate rather than ease the transition to cloud.
Cloudflare One represents the next evolution of enterprise networking, and has a fundamentally different architecture from either legacy networking or SD-WAN. It's based on a "light branch, heavy cloud" principle: deploy the minimum required hardware within physical locations (or virtual hardware within virtual networks, e.g., cloud VPCs) and use low-cost Internet connectivity to reach the nearest "service edge" location. At those locations, traffic can flow through security controls and be optimized on the way to its destination, whether that's another location within the customer's private network or an application on the public Internet. This architecture also enables remote user access to connected networks.
This shift — moving most of the "smarts" from the branch to a distributed global network edge, and leaving only the functions at the branch that absolutely require local presence, delivered by the Magic WAN Connector — solves our customers’ current problems and sets them up for easier management and a stronger security posture as the connectivity and attack landscape continues to evolve.
Aspect
Example
MPLS/VPN Service
SD-WAN
SASE with
Cloudflare One
Configuration
New site setup, configuration and management
By MSP through service request
Simplified orchestration and management via centralized controller
Automated orchestration via SaaS portal
Single Dashboard
Last mile
traffic control
Traffic balancing, QoS, and failover
Covered by MPLS SLAs
Best Path selection available in SD-WAN appliance
Minimal on-prem deployment to control local decision making
Middle mile
traffic control
Traffic steering around middle mile congestion
Covered by MPLS SLAs
“Tunnel Spaghetti” and still no control over the middle mile
Integrated traffic management & private backbone controls in a unified dashboard
Cloud integration
Connectivity for cloud migration
Centralized breakout
Decentralized breakout
Native connectivity with Cloud Network Interconnect
Security
Filter in & outbound Internet traffic for malware
Patchwork of hardware controls
Patchwork of hardware and/or software controls
Native integration with user, data, application & network security tools
Cost
Maximize ROI for network investments
High cost for hardware and connectivity
Optimized connectivity costs at the expense of increased
hardware and software costs
Decreased hardware and connectivity costs for maximized ROI
Summary of legacy, SD-WAN based, and SASE architecture considerations
Love and want to keep your current SD-WAN vendor? No problem – you can still use any appliance that supports IPsec or GRE as an on-ramp for Cloudflare One.
Ready to simplify your SASE journey?
You can learn more about the Magic WAN Connector, including device specs, specific feature info, onboarding process details, and more at our dev docs, or contact us to get started today.
This year, Cloudflare officially became a teenager, turning 13 years old. We celebrated this milestone with a series of announcements that benefit both our customers and the Internet community.
From developing applications in the age of AI to securing against the most advanced attacks that are yet to come, Cloudflare is proud to provide the tools that help our customers stay one step ahead.
We hope you’ve had a great time following along and for anyone looking for a recap of everything we launched this week, here it is:
Cloudflare Stream’s LL-HLS support is now in open beta. You can deliver video to your audience faster, reducing the latency a viewer may experience on their player to as little as 3 seconds.
Cloudflare account permissions are now available to all customers, not just Enterprise. In addition, we’ll show you how you can use them and best practices.
Now available: Workers AI, a serverless GPU cloud for AI, Vectorize so you can build your own vector databases, and AI Gateway to help manage costs and observability of your AI applications.
Cloudflare delivers the best infrastructure for next-gen AI applications, supported by partnerships with NVIDIA, Microsoft, Hugging Face, Databricks, and Meta.
Launching Workers AI — AI inference as a service platform, empowering developers to run AI models with just a few lines of code, all powered by our global network of GPUs.
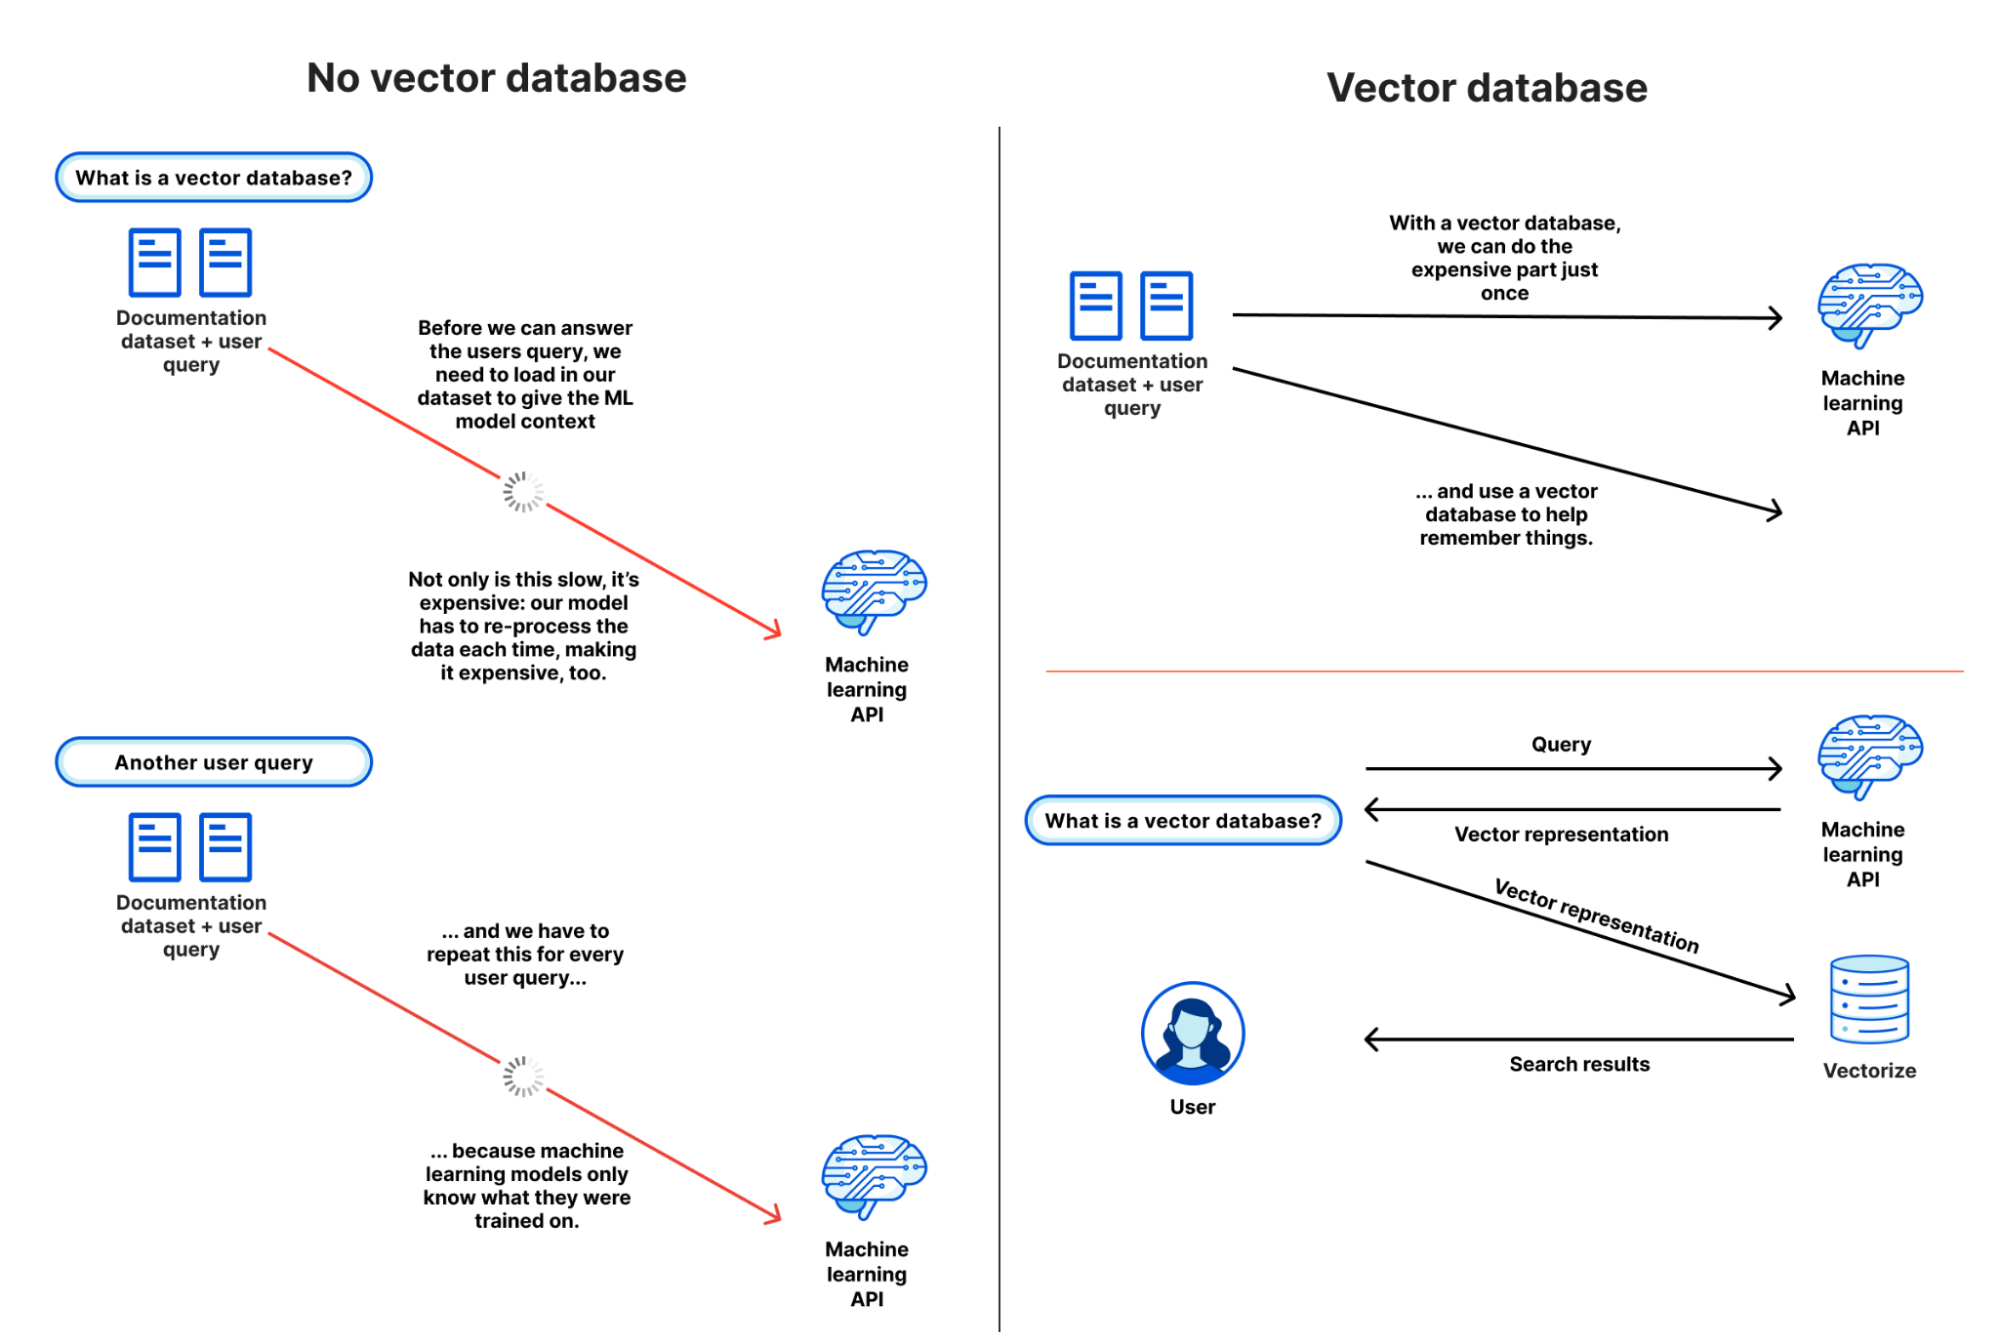
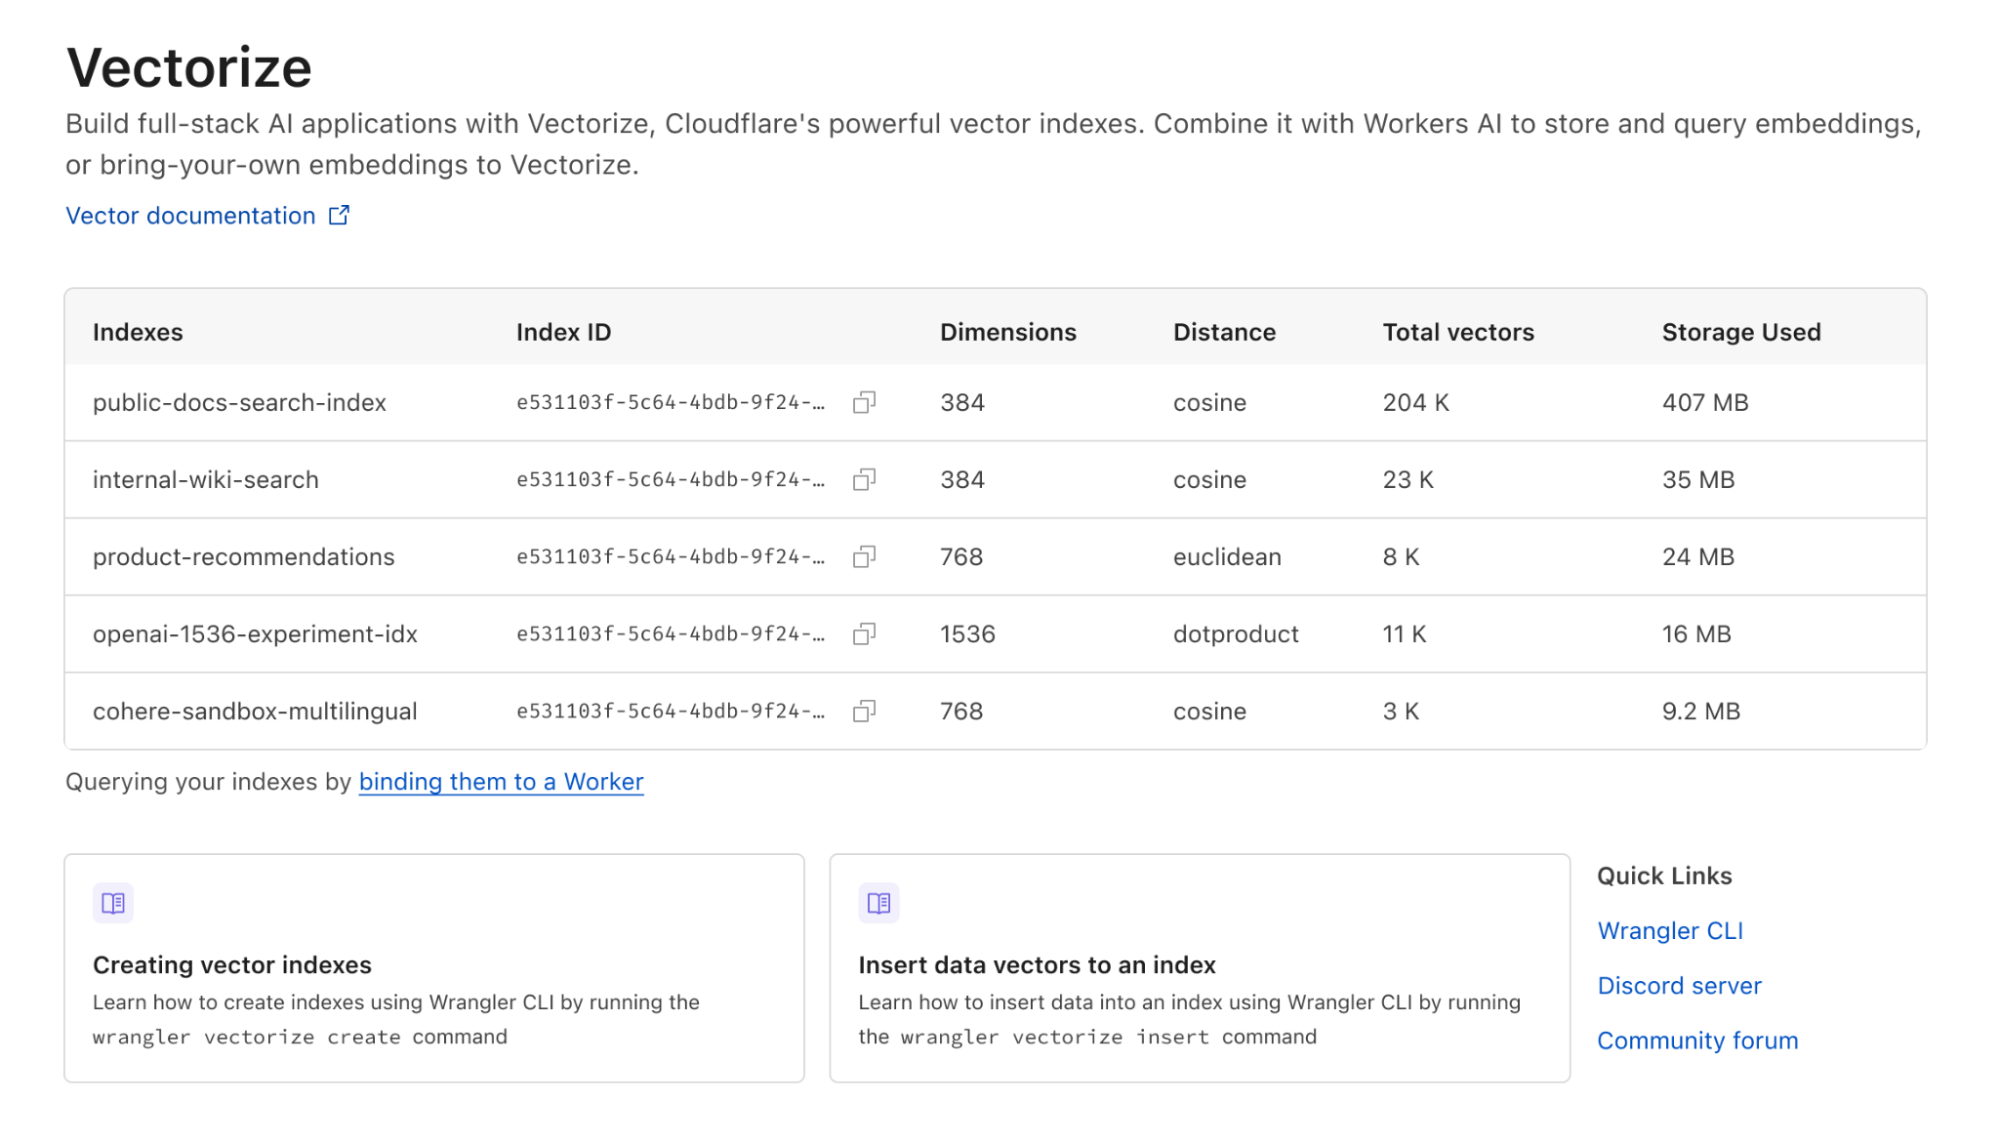
Cloudflare’s vector database, designed to allow engineers to build full-stack, AI-powered applications entirely on Cloudflare's global network — available in Beta.
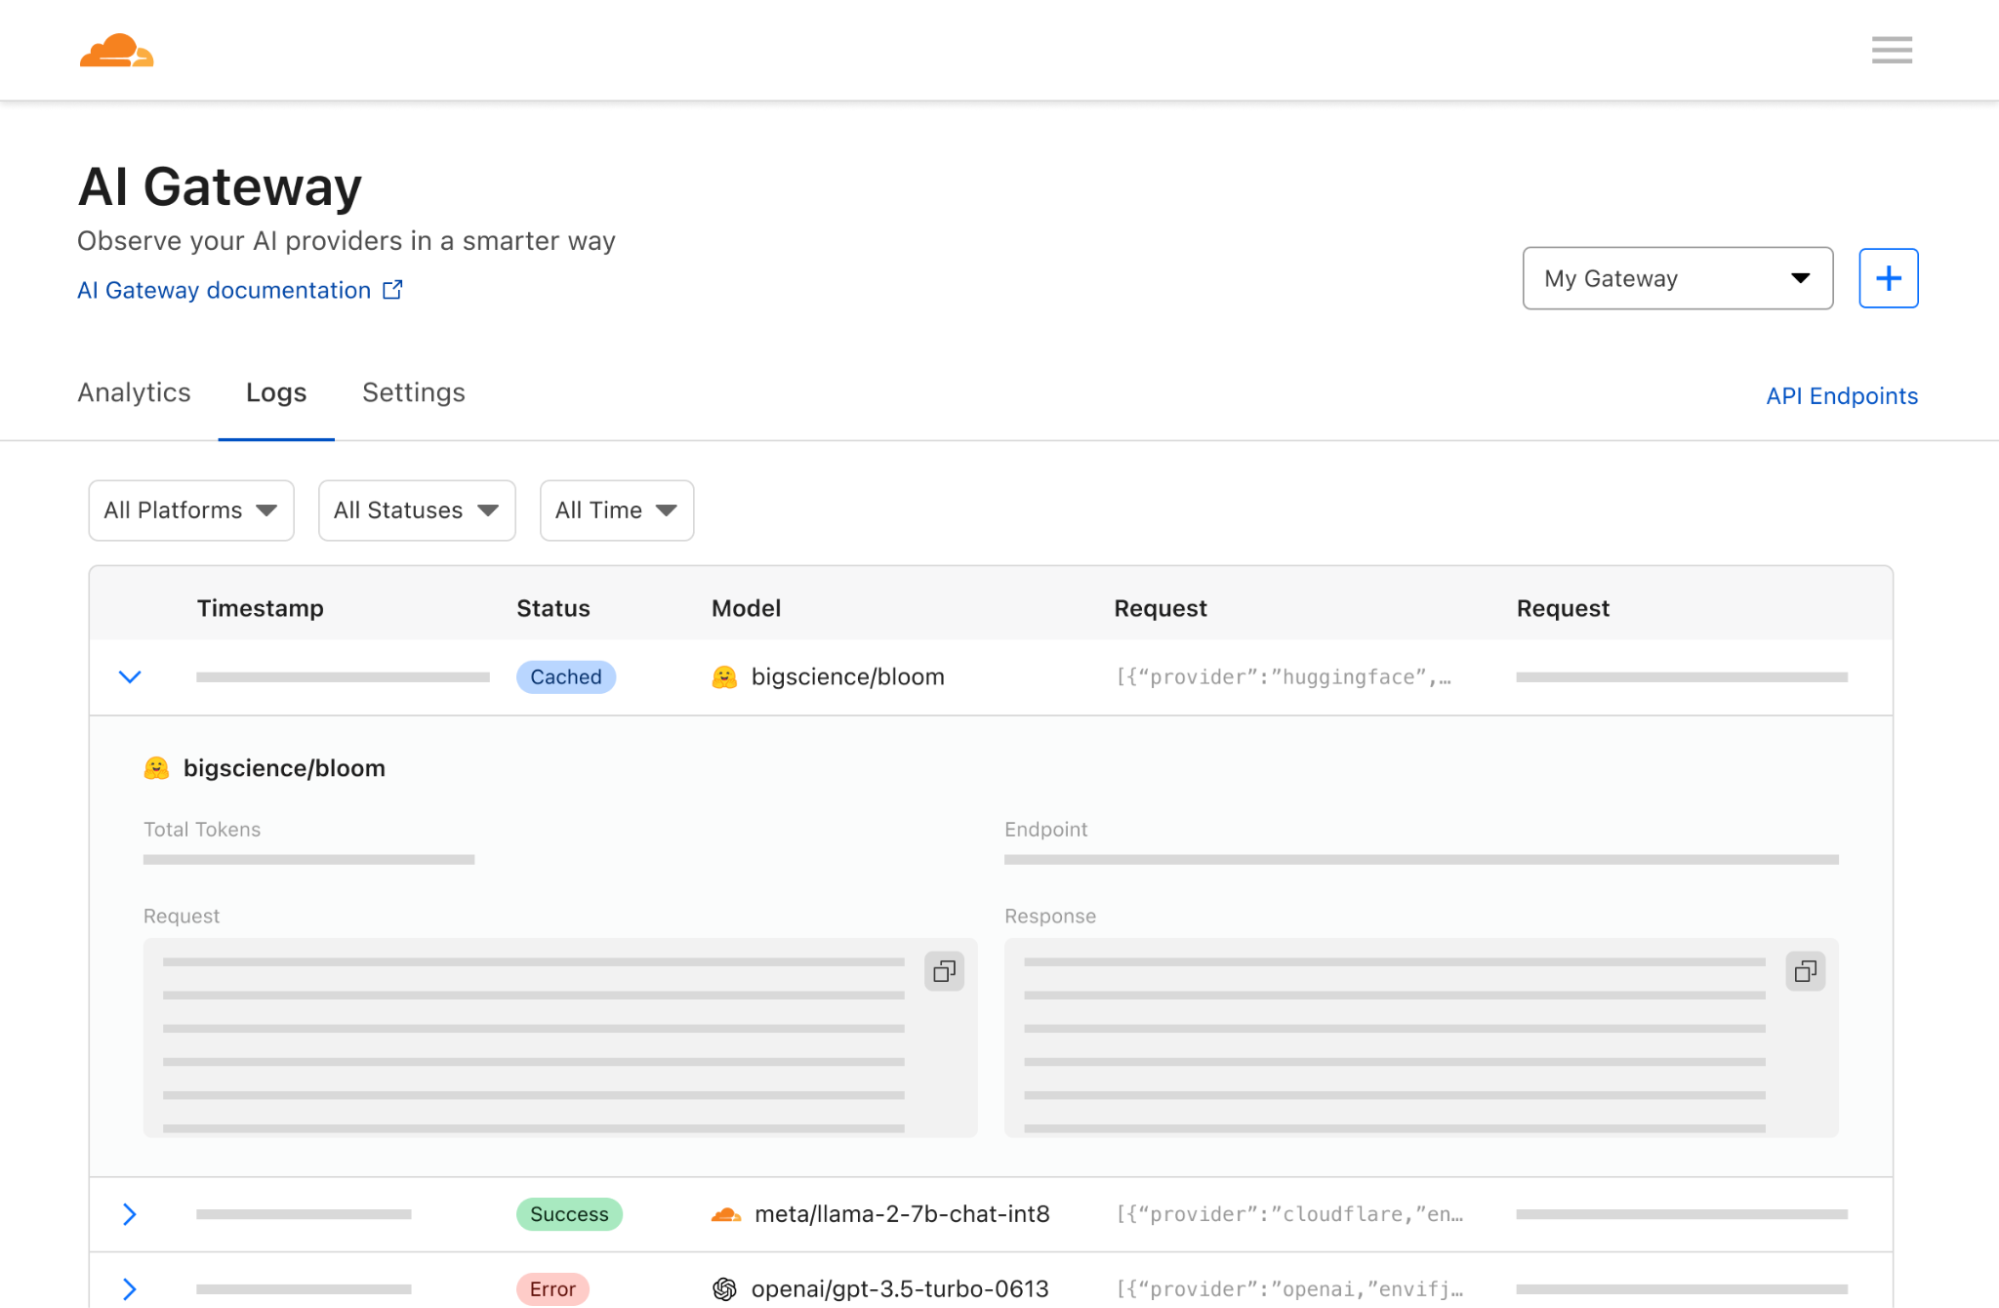
AI Gateway helps developers have greater control and visibility in their AI apps, so that you can focus on building without worrying about observability, reliability, and scaling. AI Gateway handles the things that nearly all AI applications need, saving you engineering time so you can focus on what you're building.
Developers can now use WebGPU in Cloudflare Workers. Learn more about why WebGPUs are important, why we’re offering them to customers, and what’s next.
Many AI companies are using Cloudflare to build next generation applications. Learn more about what they’re building and how Cloudflare is helping them on their journey.
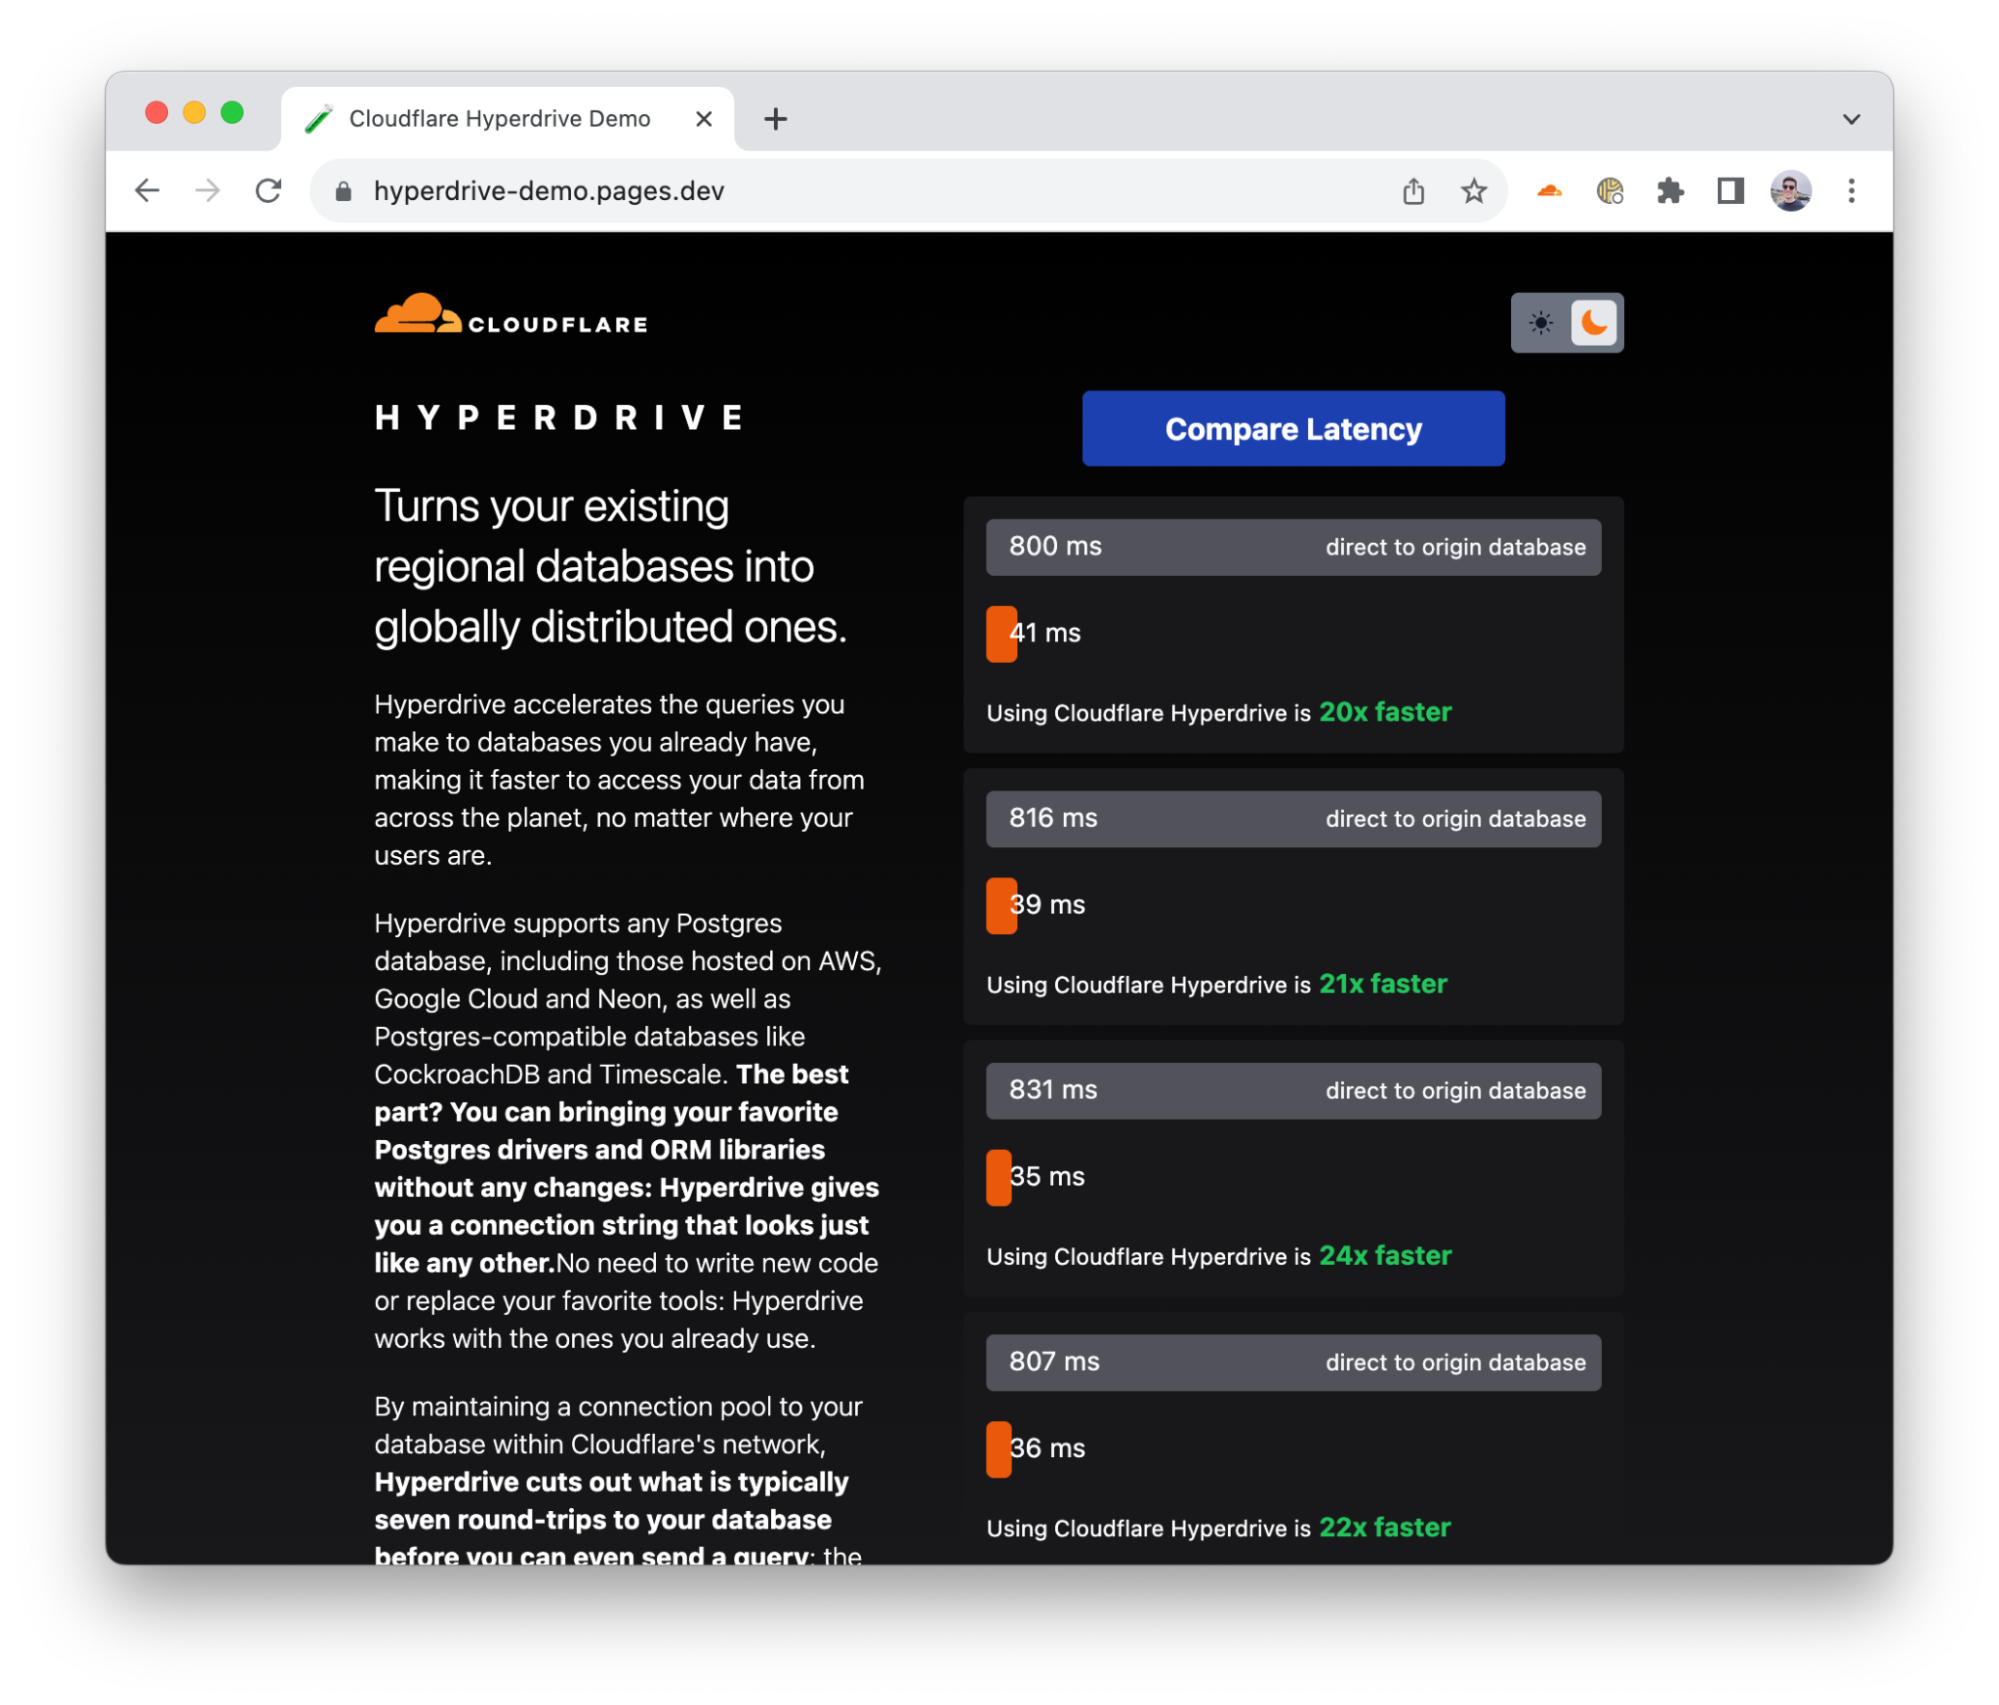
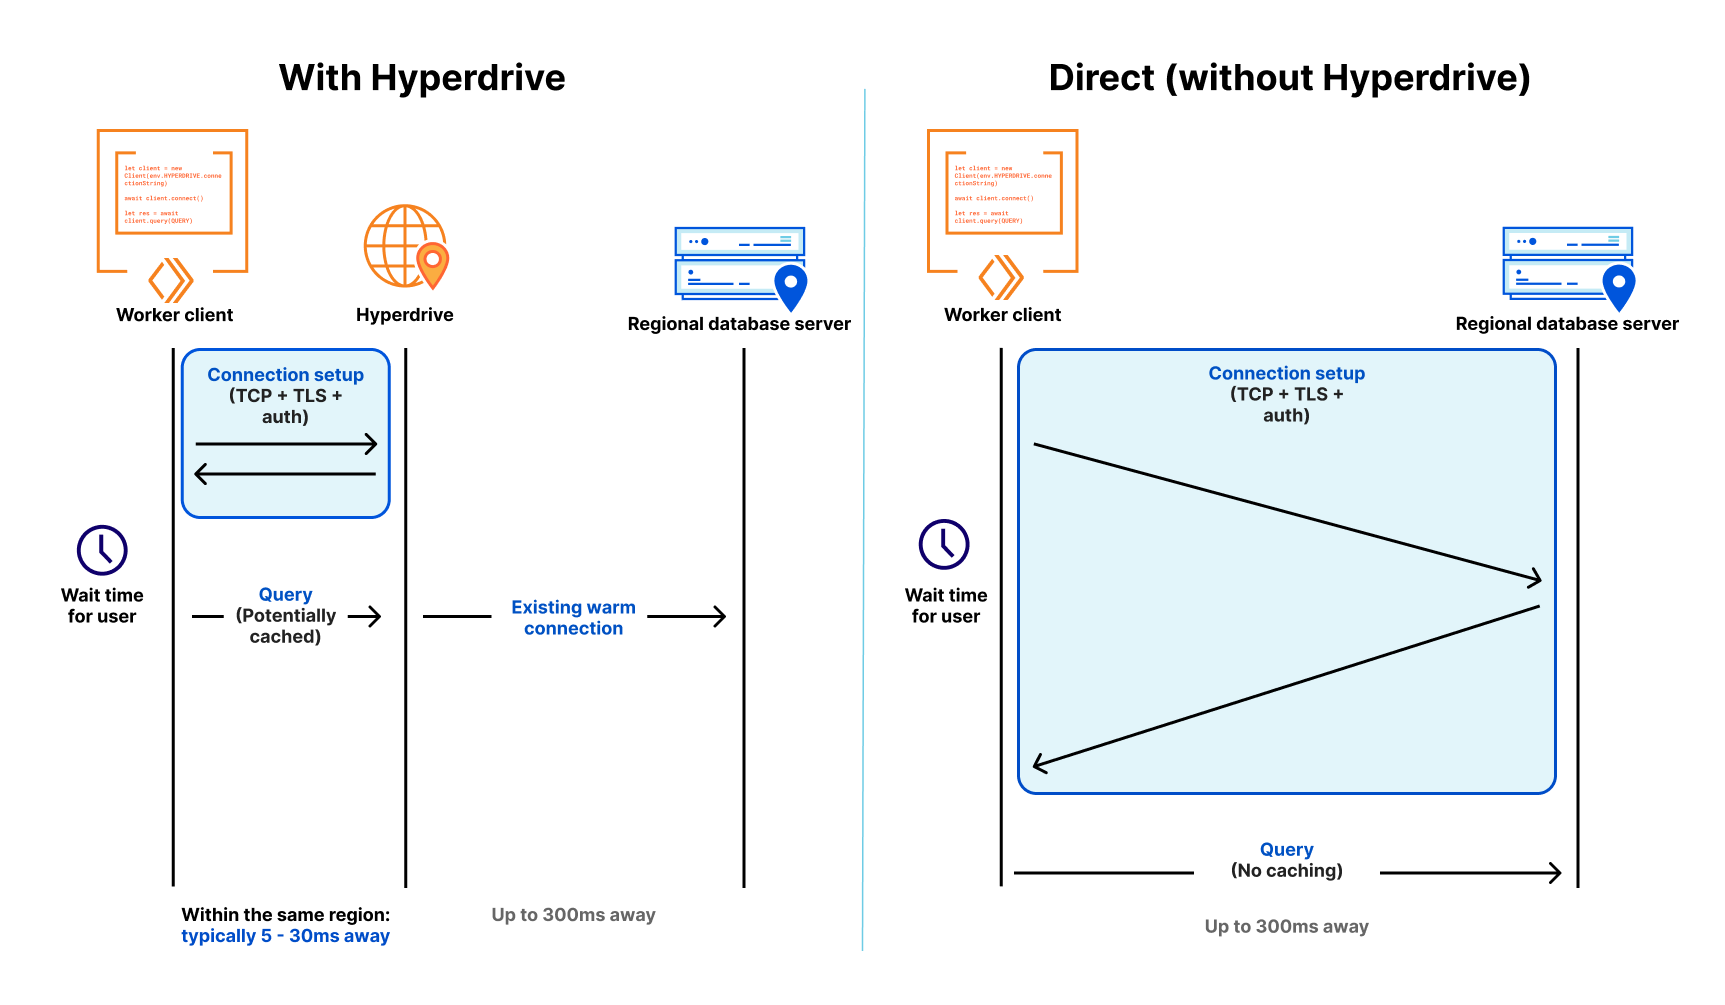
Cloudflare launches a new product, Hyperdrive, that makes existing regional databases much faster by dramatically speeding up queries that are made from Cloudflare Workers.
D1 is now in open beta, and the theme is “scale”: with higher per-database storage limits and the ability to create more databases, we’re unlocking the ability for developers to build production-scale applications on D1.
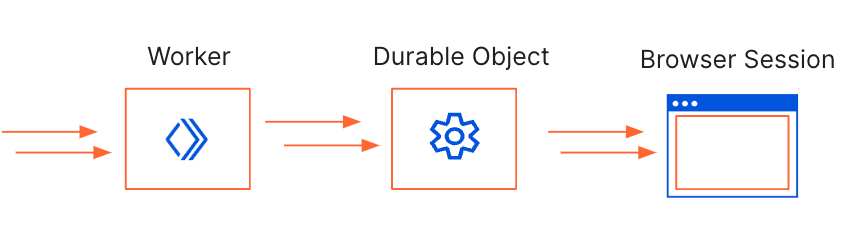
Introducing the Browser Rendering API, which enables developers to utilize the Puppeteer browser automation library within Workers, eliminating the need for serverless browser automation system setup and maintenance
We partnered with Microsoft Edge to provide a fast and secure VPN, right in the browser. Users don’t have to install anything new or understand complex concepts to get the latest in network-level privacy: Edge Secure Network VPN is available on the latest consumer version of Microsoft Edge in most markets, and automatically comes with 5GB of data.
We are revamping the playground that demonstrates the power of Workers, along with new development tooling, and the ability to share your playground code and deploy instantly to Cloudflare’s global network
Engineers from Cloudflare and Vercel have published a draft specification of the connect() sockets API for review by the community, along with a Node.js compatible polyfill for the connect() API that developers can start using.
Announcing new pricing for Cloudflare Workers, where you are billed based on CPU time, and never for the idle time that your Worker spends waiting on network requests and other I/O.
Cloudflare is rolling out post-quantum cryptography support to customers, services, and internal systems to proactively protect against advanced attacks.
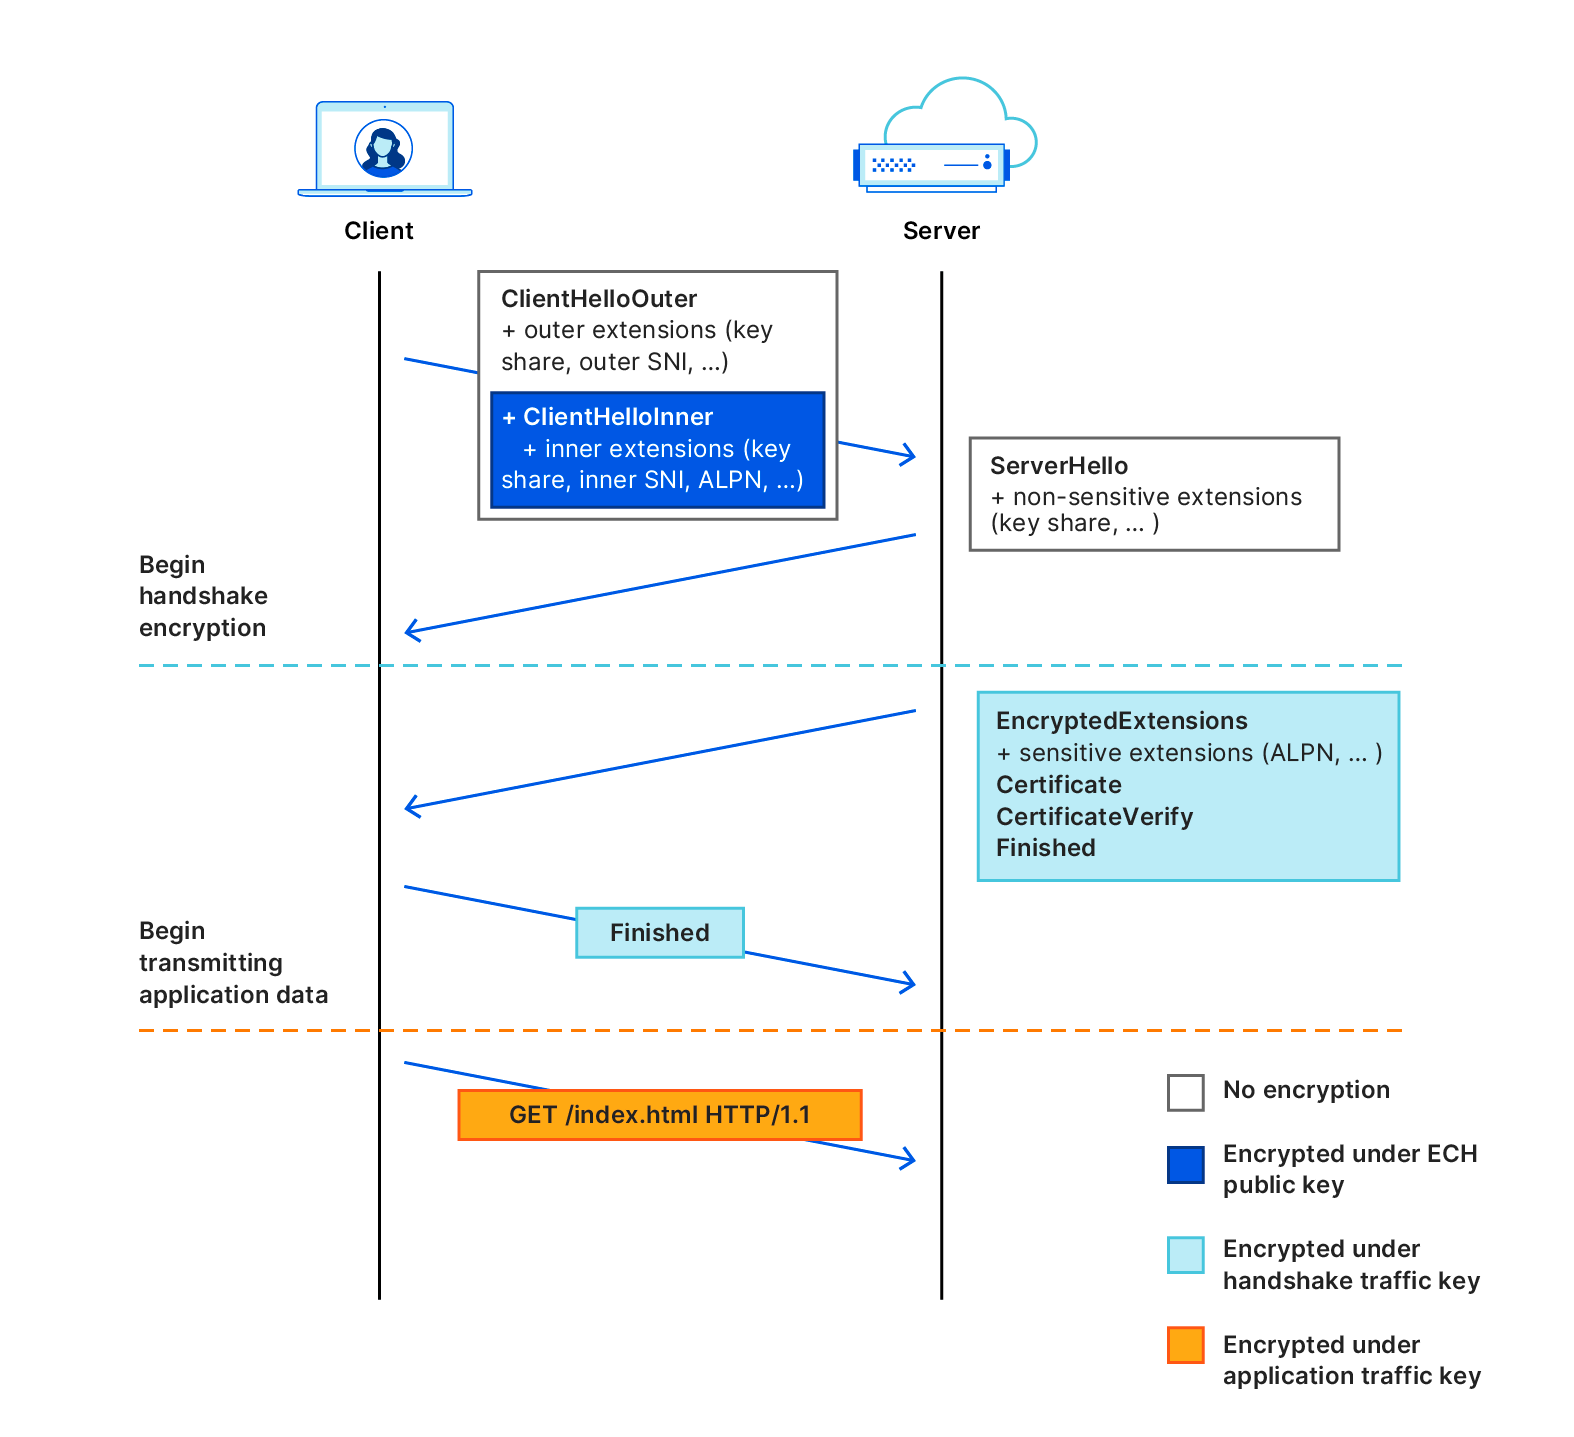
Announcing a contribution that helps improve privacy for everyone on the Internet. Encrypted Client Hello, a new standard that prevents networks from snooping on which websites a user is visiting, is now available on all Cloudflare plans.
Cloudflare customers can now scan messages within their Office 365 Inboxes for threats. The Retro Scan will let you look back seven days to see what threats your current email security tool has missed.
Any Cloudflare user, on any plan, can choose specific categories of bots that they want to allow or block, including AI crawlers. We are also recommending a new standard to robots.txt that will make it easier for websites to clearly direct how AI bots can and can’t crawl.
Deep dive into Cloudflare’s approach and ongoing research into detecting novel web attack vectors in our WAF before they are seen by a security researcher.
Deep dive into the fundamental concepts behind the Distributed Aggregation Protocol (DAP) protocol with examples on how we’ve implemented it into Daphne, our open source aggregator server.
We are rolling out post-quantum cryptography support for outbound connections to origins and Cloudflare Workers fetch() calls. Learn more about what we enabled, how we rolled it out in a safe manner, and how you can add support to your origin server today.
Cloudflare’s updated benchmark results regarding network performance plus a dive into the tools and processes that we use to monitor and improve our network performance.
One More Thing
When Cloudflare turned 12 last year, we announced the Workers Launchpad Funding Program – you can think of it like a startup accelerator program for companies building on Cloudlare’s Developer Platform, with no restrictions on your size, stage, or geography.
A refresher on how the Launchpad works: Each quarter, we admit a group of startups who then get access to a wide range of technical advice, mentorship, and fundraising opportunities. That includes our Founders Bootcamp, Open Office Hours with our Solution Architects, and Demo Day. Those who are ready to fundraise will also be connected to our community of 40+ leading global Venture Capital firms.
In exchange, we just ask for your honest feedback. We want to know what works, what doesn’t and what you need us to build for you. We don’t ask for a stake in your company, and we don’t ask you to pay to be a part of the program.
Targum (my startup) was one of the first AI companies (w/ @jamdotdev ) in the Cloudflare workers launchpad!
In return to tons of stuff we got from CF 🙏 they asked for feedback, and my main one was, let me do everything end to end on CF, I don't want to rent GPU servers… https://t.co/0j2ZymXpsL
Over the past year, we’ve received applications from nearly 60 different countries. We’ve had a chance to work closely with 50 amazing early and growth-stage startups admitted into the first two cohorts, and have grown our VC partner community to 40+ firms and more than $2 billion in potential investments in startups building on Cloudflare.
Next up: Cohort #3! Between recently wrapping up Cohort #2 (check out their Demo Day!), celebrating the Launchpad’s 1st birthday, and the heaps of announcements we made last week, we thought that everyone could use a little extra time to catch up on all the news – which is why we are extending the deadline for Cohort #3 a few weeks to October 13, 2023. AND we’re reserving 5 spots in the class for those who are already using any of last Wednesday’s AI announcements. Just be sure to mention what you’re using in your application.
So once you’ve had a chance to check out the announcements and pour yourself a cup of coffee, check out the Workers Launchpad. Applying is a breeze — you’ll be done long before your coffee gets cold.
Until next time
That’s all for Birthday Week 2023. We hope you enjoyed the ride, and we’ll see you at our next innovation week!
Today we are excited to announce a contribution to improving privacy for everyone on the Internet. Encrypted Client Hello, a new proposed standard that prevents networks from snooping on which websites a user is visiting, is now available on all Cloudflare plans.
Encrypted Client Hello (ECH) is a successor to ESNI and masks the Server Name Indication (SNI) that is used to negotiate a TLS handshake. This means that whenever a user visits a website on Cloudflare that has ECH enabled, no one except for the user and the website will be able to determine which website was visited. Cloudflare is a big proponent of privacy for everyone and is excited about the prospects of bringing this technology to life.
Browsing the Internet and your privacy
Whenever you visit a website, your browser sends a request to a web server. The web server responds with content and the website starts loading in your browser. Way back in the early days of the Internet this happened in 'plain text', meaning that your browser would just send bits across the network that everyone could read: the corporate network you may be browsing from, the Internet Service Provider that offers you Internet connectivity and any network that the request traverses before it reaches the web server that hosts the website. Privacy advocates have long been concerned about how much information could be seen in "plain text": If any network between you and the web server can see your traffic, that means they can also see exactly what you are doing. If you are initiating a bank transfer any intermediary can see the destination and the amount of the transfer.
So how to start making this data more private? To prevent eavesdropping, encryption was introduced in the form of SSL and later TLS. These are amazing protocols that safeguard not only your privacy but also ensure that no intermediary can tamper with any of the content you view or upload. But encryption only goes so far.
While the actual content (which particular page on a website you're visiting and any information you upload) is encrypted and shielded from intermediaries, there are still ways to determine what a user is doing. For example, the DNS request to determine the address (IP) of the website you're visiting and the SNI are both common ways for intermediaries to track usage.
Let's start with DNS. Whenever you visit a website, your operating system needs to know which IP address to connect to. This is done through a DNS request. DNS by default is unencrypted, meaning anyone can see which website you're asking about. To help users shield these requests from intermediaries, Cloudflare introduced DNS over HTTPS (DoH) in 2019. In 2020, we went one step further and introduced Oblivious DNS over HTTPS which prevents even Cloudflare from seeing which websites a user is asking about.
That leaves SNI as the last unencrypted bit that intermediaries can use to determine which website you're visiting. After performing a DNS query, one of the first things a browser will do is perform a TLS handshake. The handshake constitutes several steps, including which cipher to use, which TLS version and which certificate will be used to verify the web server's identity. As part of this handshake, the browser will indicate the name of the server (website) that it intends to visit: the Server Name Indication.
Due to the fact that the session is not encrypted yet, and the server doesn't know which certificate to use, the browser must transmit this information in plain text. Sending the SNI in plaintext means that any intermediary that can view which website you’re visiting simply by checking the first packet for a connection:
This means that despite the amazing efforts of TLS and DoH, which websites you’re visiting on the Internet still isn't truly private. Today, we are adding the final missing piece of the puzzle with ECH. With ECH, the browser performs a TLS handshake with Cloudflare, but not a customer-specific hostname. This means that although intermediaries will be able to see that you are visiting a website on Cloudflare, they will never be able to determine which one.
How does ECH work?
In order to explain how ECH works, it helps to first understand how TLS handshakes are performed. A TLS handshake starts with a ClientHello part, which allows a client to say which ciphers to use, which TLS version and most importantly, which server it's trying to visit (the SNI).
With ECH, the ClientHello message part is split into two separate messages: an inner part and an outer part. The outer part contains the non-sensitive information such as which ciphers to use and the TLS version. It also includes an "outer SNI". The inner part is encrypted and contains an "inner SNI".
The outer SNI is a common name that, in our case, represents that a user is trying to visit an encrypted website on Cloudflare. We chose cloudflare-ech.com as the SNI that all websites will share on Cloudflare. Because Cloudflare controls that domain we have the appropriate certificates to be able to negotiate a TLS handshake for that server name.
The inner SNI contains the actual server name that the user is trying to visit. This is encrypted using a public key and can only be read by Cloudflare. Once the handshake completes the web page is loaded as normal, just like any other website loaded over TLS.
In practice, this means that any intermediary that is trying to establish which website you’re visiting will simply see normal TLS handshakes with one caveat: any time you visit an ECH enabled website on Cloudflare the server name will look the same. Every TLS handshake will appear identical in that it looks like it's trying to load a website for cloudflare-ech.com, as opposed to the actual website. We've solved the last puzzle-piece in preserving privacy for users that don't like intermediaries seeing which websites they are visiting.
For full details on the nitty-gritty of ECH technology, visit our introductory blog.
The future of privacy
We're excited about what this means for privacy on the Internet. Browsers like Google Chrome and Firefox are starting to ramp up support for ECH already. If you're a website, and you care about users visiting your website in a fashion that doesn't allow any intermediary to see what users are doing, enable ECH today on Cloudflare. We've enabled ECH for all free zones already. If you're an existing paying customer, just head on over to the Cloudflare dashboard and apply for the feature. We’ll be enabling this for everyone that signs up over the coming few weeks.
Over time, we hope others will follow our footsteps, leading to a more private Internet for everyone. The more providers that offer ECH, the harder it becomes for anyone to listen in on what users are doing on the Internet. Heck, we might even solve privacy for good.
If you're looking for more information on ECH, how it works and how to enable it head on over to our developer documentation on ECH.
Over the last twelve months, we have been talking about the new baseline of encryption on the Internet: post-quantum cryptography. During Birthday Week last year we announced that our beta of Kyber was available for testing, and that Cloudflare Tunnel could be enabled with post-quantum cryptography. Earlier this year, we made our stance clear that this foundational technology should be available to everyone for free, forever.
Today, we have hit a milestone after six years and 31 blog posts in the making: we’re starting to roll out General Availability1 of post-quantum cryptography support to our customers, services, and internal systems as described more fully below. This includes products like Pingora for origin connectivity, 1.1.1.1, R2, Argo Smart Routing, Snippets, and so many more.
This is a milestone for the Internet. We don't yet know when quantum computers will have enough scale to break today's cryptography, but the benefits of upgrading to post-quantum cryptography now are clear. Fast connections and future-proofed security are all possible today because of the advances made by Cloudflare, Google, Mozilla, the National Institutes of Standards and Technology in the United States, the Internet Engineering Task Force, and numerous academic institutions
What does General Availability mean? In October 2022 we enabled X25519+Kyber as a beta for all websites and APIs served through Cloudflare. However, it takes two to tango: the connection is only secured if the browser also supports post-quantum cryptography. Starting August 2023, Chrome is slowly enabling X25519+Kyber by default.
The user’s request is routed through Cloudflare’s network (2). We have upgraded many of these internal connections to use post-quantum cryptography, and expect to be done upgrading all of our internal connections by the end of 2024. That leaves as the final link the connection (3) between us and the origin server.
We are happy to announce that we are rolling out support for X25519+Kyber for most inbound and outbound connectionsas Generally Available for use including origin servers and Cloudflare Workersfetch()es.
Plan
Support for post-quantum outbound connections
Free
Started roll-out. Aiming for 100% by the end of the October.
Pro and business
Aiming for 100% by the end of year.
Enterprise
Roll-out begins February 2024. 100% by March 2024.
For our Enterprise customers, we will be sending out additional information regularly over the course of the next six months to help prepare you for the roll-out. Pro, Business, and Enterprise customers can skip the roll-out and opt-in within your zone today, or opt-out ahead of time using an API described in our companion blog post. Before rolling out for Enterprise in February 2024, we will add a toggle on the dashboard to opt out.
With an upgrade of this magnitude, we wanted to focus on our most used products first and then expand outward to cover our edge cases. This process has led us to include the following products and systems in this roll out:
1.1.1.1
AMP
API Gateway
Argo Smart Routing
Auto Minify
Automatic Platform Optimization
Automatic Signed Exchange
Cloudflare Egress
Cloudflare Images
Cloudflare Rulesets
Cloudflare Snippets
Cloudflare Tunnel
Custom Error Pages
Flow Based Monitoring
Health checks
Hermes
Host Head Checker
Magic Firewall
Magic Network Monitoring
Network Error Logging
Project Flame
Quicksilver
R2 Storage
Request Tracer
Rocket Loader
Speed on Cloudflare Dash
SSL/TLS
Traffic Manager
WAF, Managed Rules
Waiting Room
Web Analytics
If a product or service you use is not listed here, we have not started rolling out post-quantum cryptography to it yet. We are actively working on rolling out post-quantum cryptography to all products and services including our Zero Trust products. Until we have achieved post-quantum cryptography support in all of our systems, we will publish an update blog in every Innovation Week that covers which products we have rolled out post-quantum cryptography to, the products that will be getting it next, and what is still on the horizon.
Products we are working on bringing post-quantum cryptography support to soon:
Cloudflare Gateway
Cloudflare DNS
Cloudflare Load Balancer
Cloudflare Access
Always Online
Zaraz
Logging
D1
Cloudflare Workers
Cloudflare WARP
Bot Management
Why now?
As we announced earlier this year, post-quantum cryptography will be included for free in all Cloudflare products and services that can support it. The best encryption technology should be accessible to everyone – free of charge – to help support privacy and human rights globally.
“What was once an experimental frontier has turned into the underlying fabric of modern society. It runs in our most critical infrastructure like power systems, hospitals, airports, and banks. We trust it with our most precious memories. We trust it with our secrets. That’s why the Internet needs to be private by default. It needs to be secure by default.”
Our work on post-quantum cryptography is driven by the thesis that quantum computers that can break conventional cryptography create a similar problem to the Year 2000 bug. We know there is going to be a problem in the future that could have catastrophic consequences for users, businesses, and even nation states. The difference this time is we don’t know how the date and time that this break in the computational paradigm will occur. Worse, any traffic captured today could be decrypted in the future. We need to prepare today to be ready for this threat.
We are excited for everyone to adopt post-quantum cryptography into their systems. To follow the latest developments of our deployment of post-quantum cryptography and third-party client/server support, check out pq.cloudflareresearch.com and keep an eye on this blog.
***
1We are using a preliminary version of Kyber, NIST’s pick for post-quantum key agreement. Kyber has not been finalized. We expect a final standard to be published in 2024 under the name ML-KEM, which we will then adopt promptly while deprecating support for X25519Kyber768Draft00.
For years, we’ve written that CAPTCHAs drive us crazy. Humans give up on CAPTCHA puzzles approximately 15% of the time and, maddeningly, CAPTCHAs are significantly easier for bots to solve than they are for humans. We’ve spent the past three and a half years working to build a better experience for humans that’s just as effective at stopping bots. As of this month, we’ve finished replacing every CAPTCHA issued by Cloudflare withTurnstile, our new CAPTCHA replacement (pictured below). Cloudflare will never issue another visual puzzle to anyone, for any reason.
Now that we’ve eliminated CAPTCHAs at Cloudflare, we want to make it easy for anyone to do the same, even if they don’t use other Cloudflare services. We’ve decoupled Turnstile from our platform so that any website operator on any platform can use it just by adding a few lines of code. We’re thrilled to announce that Turnstile is now generally available, and Turnstile’s ‘Managed’ mode is now completely free to everyone for unlimited use.
Easy on humans, hard on bots, private for everyone
There’s a lot that goes into Turnstile’s simple checkbox to ensure that it’s easy for everyone, preserves user privacy, and does its job stopping bots. Part of making challenges better for everyone means that everyone gets the same great experience, no matter what browser you’re using. Because we do not employ a visual puzzle, users with low vision or blindness get the same easy to use challenge flow as everyone else. It was particularly important for us to avoid falling back to audio CAPTCHAs to offer an experience accessible to everyone. Audio CAPTCHAs are often much worse than even visual CAPTCHAs for humans to solve, with only 31.2% of audio challenges resulting in a three-person agreement on what the correct solution actually is. The prevalence of free speech-to-text services has made it easy for bots to solve audio CAPTCHAs as well, with a recent study showing bots can accurately solve audio CAPTCHAs in over 85% of attempts.
We also created Turnstile to be privacy focused. Turnstile meets ePrivacy Directive, GDPR and CCPA compliance requirements, as well as the strict requirements of our own privacy commitments. In addition, Cloudflare's FedRAMP Moderate authorized package, "Cloudflare for Government" now includes Turnstile. We don’t rely on tracking user data, like what other websites someone has visited, to determine if a user is a human or robot. Our business is protecting websites, not selling ads, so operators can deploy Turnstile knowing that their users’ data is safe.
With all of our emphasis on how easy it is to pass a Turnstile challenge, you would be right to ask how it can stop a bot. If a bot can find all images with crosswalks in grainy photos faster than we can, surely it can check a box as well. Bots definitely can check a box, and they can even mimic the erratic path of human mouse movement while doing so. For Turnstile, the actual act of checking a box isn’t important, it’s the background data we’re analyzing while the box is checked that matters. We find and stop bots by running a series of in-browser tests, checking browser characteristics, native browser APIs, and asking the browser to pass lightweight tests (ex: proof-of-work tests, proof-of-space tests) to prove that it’s an actual browser. The current deployment of Turnstile checks billions of visitors every day, and we are able to identify browser abnormalities that bots exhibit while attempting to pass those tests.
For over one year, we used our Managed Challenge to rotate between CAPTCHAs and our own Turnstile challenge to compare our effectiveness. We found that even without asking users for any interactivity at all, Turnstile was just as effective as a CAPTCHA. Once we were sure that the results were effective at coping with the response from bot makers, we replaced the CAPTCHA challenge with our own checkbox solution. We present this extra test when we see potentially suspicious signals, and it helps us provide an even greater layer of security.
Turnstile is great for fighting fraud
Like all sites that offer services for free, Cloudflare sees our fair share of automated account signups, which can include “new account fraud,” where bad actors automate the creation of many different accounts to abuse our platform. To help combat this abuse, we’ve rolled out Turnstile’s invisible mode to protect our own signup page. This month, we’ve blocked over1 million automated signup attempts using Turnstile, without a reported false positive or any change in our self-service billings that rely on this signup flow.
Lessons from the Turnstile beta
Over the past twelve months, we’ve been grateful to see how many people are eager to try, then rely on, and integrate Turnstile into their web applications. It’s been rewarding to see the developer community embrace Turnstile as well. We list some of the community created Turnstile integrations here, including integrations with WordPress, Angular, Vue, and a Cloudflare recommended React library. We’ve listened to customer feedback, and added support for 17 new languages, new callbacks, and new error codes.
76,000+ users have signed up, but our biggest single test by far was the Eurovision final vote. Turnstile runs on challenge pages on over 25 million Cloudflare websites. Usually, that makes Cloudflare the far and away biggest Turnstile consumer, until the final Eurovision vote. During that one hour, challenge traffic from the Eurovision voting site outpaced the use of challenge pages on those 25 million sites combined! Turnstile handled the enormous spike in traffic without a hitch.
While a lot went well during the Turnstile beta, we also encountered some opportunities for us to learn. We were initially resistant to disclosing why a Turnstile challenge failed. After all, if bad actors know what we’re looking for, it becomes easier for bots to fool our challenges until we introduce new detections. However, during the Turnstile beta, we saw a few scenarios where legitimate users could not pass a challenge. These scenarios made it clear to us that we need to be transparent about why a challenge failed to help aid any individual who might modify their browser in a way that causes them to get caught by Turnstile. We now publish detailed client-side error codes to surface the reason why a challenge has failed. Two scenarios came up on several occasions that we didn’t expect:
First, we saw that desktop computers at least 10 years old frequently had expired motherboard batteries, and computers with bad motherboard batteries very often keep inaccurate time. This is because without the motherboard battery, a desktop computer’s clock will stop operating when the computer is off. Turnstile checks your computer’s system time to detect when a website operator has accidentally configured a challenge page to be cached, as caching a challenge page will cause it to become impassable. Unfortunately, this same check was unintentionally catching humans who just needed to update the time. When we see this issue, we now surface a clear error message to the end user to update their system time. We’d prefer to never have to surface an error in the first place, so we’re working to develop new ways to check for cached content that won’t impact real people.
Second, we find that a few privacy-focused users often ask their browsers to go beyond standard practices to preserve their anonymity. This includes changing their user-agent (something bots will do to evade detection as well), and preventing third-party scripts from executing entirely. Issues caused by this behavior can now be displayed clearly in a Turnstile widget, so those users can immediately understand the issue and make a conscientious choice about whether they want to allow their browser to pass a challenge.
Although we have some of the most sensitive, thoroughly built monitoring systems at Cloudflare, we did not catch either of these issues on our own. We needed to talk to users affected by the issue to help us understand what the problem was. Going forward, we want to make sure we always have that direct line of communication open. We’re rolling out a new feedback form in the Turnstile widget, to ensure any future corner cases are addressed quickly and with urgency.
Turnstile: GA and Free for Everyone
Announcing Turnstile’s General Availability means that Turnstile is now completely production ready, available for free for unlimited use via our visible widget in Managed mode. Turnstile Enterprise includes SaaS platform support and a visible mode without the Cloudflare logo. Self-serve customers can expect a pay-as-you-go option for advanced features to be available in early 2024. Users can continue to access Turnstile’s advanced features below our 1 million siteverify request limit, as has been the case during the beta. If you’ve been waiting to try Turnstile, head over to our signup page and create an account!
Hyperdrive makes accessing your existing databases from Cloudflare Workers, wherever they are running, hyper fast. You connect Hyperdrive to your database, change one line of code to connect through Hyperdrive, and voilà: connections and queries get faster (and spoiler: you can use it today).
In a nutshell, Hyperdrive uses our global network to speed up queries to your existing databases, whether they’re in a legacy cloud provider or with your favorite serverless database provider; dramatically reduces the latency incurred from repeatedly setting up new database connections; and caches the most popular read queries against your database, often avoiding the need to go back to your database at all.
Without Hyperdrive, that core database — the one with your user profiles, product inventory, or running your critical web app — sitting in the us-east1 region of a legacy cloud provider is going to be really slow to access for users in Paris, Singapore and Dubai and slower than it should be for users in Los Angeles or Vancouver. With each round trip taking up to 200ms, it’s easy to burn up to a second (or more!) on the multiple round-trips needed just to set up a connection, before you’ve even made the query for your data. Hyperdrive is designed to fix this.
To demonstrate Hyperdrive’s performance, we built a demo application that makes back-to-back queries against the same database: both with Hyperdrive and without Hyperdrive (directly). The app selects a database in a neighboring continent: if you’re in Europe, it selects a database in the US — an all-too-common experience for many European Internet users — and if you’re in Africa, it selects a database in Europe (and so on). It returns raw results from a straightforward SELECT query, with no carefully selected averages or cherry-picked metrics.
We built a demo app that makes real queries to a PostgreSQL database, with and without Hyperdrive
Throughout internal testing, initial user reports and the multiple runs in our benchmark, Hyperdrive delivers a 17 – 25x performance improvement vs. going direct to the database for cached queries, and a 6 – 8x improvement for uncached queries and writes. The cached latency might not surprise you, but we think that being 6 – 8x faster on uncached queries changes “I can’t query a centralized database from Cloudflare Workers” to “where has this been all my life?!”. We’re also continuing to work on performance improvements: we’ve already identified additional latency savings, and we’ll be pushing those out in the coming weeks.
We’ve been working on Hyperdrive in secret for a short while: but allowing developers to connect to databases they already have — with their existing data, queries and tooling — has been something on our minds for quite some time.
In a modern distributed cloud environment like Workers, where compute is globally distributed (so it’s close to users) and functions are short-lived (so you’re billed no more than is needed), connecting to traditional databases has been both slow and unscalable. Slow because it takes upwards of seven round-trips (TCP handshake; TLS negotiation; then auth) to establish the connection, and unscalable because databases like PostgreSQL have a high resource cost per connection. Even just a couple of hundred connections to a database can consume non-negligible memory, separate from any memory needed for queries.
Our friends over at Neon (a popular serverless Postgres provider) wrote about this, and even released a WebSocket proxy and driver to reduce the connection overhead, but are still fighting uphill in the snow: even with a custom driver, we’re down to 4 round-trips, each still potentially taking 50-200 milliseconds or more. When those connections are long-lived, that’s OK — it might happen once every few hours at best. But when they’re scoped to an individual function invocation, and are only useful for a few milliseconds to minutes at best — your code spends more time waiting. It’s effectively another kind of cold start: having to initiate a fresh connection to your database before making a query means that using a traditional database in a distributed or serverless environment is (to put it lightly) really slow.
To combat this, Hyperdrive does two things.
First, it maintains a set of regional database connection pools across Cloudflare’s network, so a Cloudflare Worker avoids making a fresh connection to a database on every request. Instead, the Worker can establish a connection to Hyperdrive (fast!), with Hyperdrive maintaining a pool of ready-to-go connections back to the database. Since a database can be anywhere from 30ms to (often) 300ms away over a single round-trip (let alone the seven or more you need for a new connection), having a pool of available connections dramatically reduces the latency issue that short-lived connections would otherwise suffer.
Second, it understands the difference between read (non-mutating) and write (mutating) queries and transactions, and can automatically cache your most popular read queries: which represent over 80% of most queries made to databases in typical web applications. That product listing page that tens of thousands of users visit every hour; open jobs on a major careers site; or even queries for config data that changes occasionally; a tremendous amount of what is queried does not change often, and caching it closer to where the user is querying it from can dramatically speed up access to that data for the next ten thousand users. Write queries, which can’t be safely cached, still get to benefit from both Hyperdrive’s connection pooling and Cloudflare’s global network: being able to take the fastest routes across the Internet across our backbone cuts down latency there, too.
Even if your database is on the other side of the country, 70ms x 6 round-trips is a lot of time for a user to be waiting for a query response.
Hyperdrive works not only with PostgreSQL databases — including Neon, Google Cloud SQL, AWS RDS, and Timescale, but also PostgreSQL-compatible databases like Materialize (a powerful stream-processing database), CockroachDB (a major distributed database), Google Cloud’s AlloyDB, and AWS Aurora Postgres.
We’re also working on bringing support for MySQL, including providers like PlanetScale, by the end of the year, with more database engines planned in the future.
The magic connection string
One of the major design goals for Hyperdrive was the need for developers to keep using their existing drivers, query builder and ORM (Object-Relational Mapper) libraries. It wouldn’t have mattered how fast Hyperdrive was if we required you to migrate away from your favorite ORM and/or rewrite hundreds (or more) lines of code & tests to benefit from Hyperdrive’s performance.
The magic behind Hyperdrive is that you can start using it in your existing Workers applications, with your existing queries, just by swapping out your connection string for the one Hyperdrive generates instead.
Creating a Hyperdrive
With an existing database ready to go — in this example, we’ll use a Postgres database from Neon — it takes less than a minute to get Hyperdrive running (yes, we timed it).
If you don’t have an existing Cloudflare Workers project, you can quickly create one:
$ npm create cloudflare@latest
# Call the application "hyperdrive-demo"
# Choose "Hello World Worker" as your template
From here, we just need the database connection string for our database and a quick wrangler command-line invocation to have Hyperdrive connect to it.
# Using wrangler v3.8.0 or above
wrangler hyperdrive databases create a-faster-database --connection-string="postgres://user:[email protected]/neondb"

# This will return an ID: we'll use this in the next step
[[hyperdrive]]
name = "HYPERDRIVE"
database_id = "cdb28782-0dfc-4aca-a445-a2c318fb26fd"
We can now write a Worker — or take an existing Worker script — and use Hyperdrive to speed up connections and queries to our existing database. We use node-postgres here, but we could just as easily use Drizzle ORM.
import { Client } from 'pg';

export interface Env {
	HYPERDRIVE: Hyperdrive;
}

export default {
	async fetch(request: Request, env: Env, ctx: ExecutionContext) {
		console.log(JSON.stringify(env));
		// Create a database client that connects to our database via Hyperdrive
		//
		// Hyperdrive generates a unique connection string you can pass to
		// supported drivers, including node-postgres, Postgres.js, and the many
		// ORMs and query builders that use these drivers.
		const client = new Client({ connectionString: env.HYPERDRIVE.connectionString });

		try {
			// Connect to our database
			await client.connect();

			// A very simple test query
			let result = await client.query({ text: 'SELECT * FROM pg_tables' });

			// Return our result rows as JSON
			return Response.json({ result: result });
		} catch (e) {
			console.log(e);
			return Response.json({ error: JSON.stringify(e) }, { status: 500 });
		}
	},
};
The code above is intentionally simple, but hopefully you can see the magic: our database driver gets a connection string from Hyperdrive, and is none-the-wiser. It doesn’t need to know anything about Hyperdrive, we don’t have to toss out our favorite query builder library, and we can immediately realize the speed benefits when making queries.
Connections are automatically pooled and kept warm, our most popular queries are cached, and our entire application gets faster.
We think Hyperdrive is critical to accessing your existing databases when building on Cloudflare Workers: traditional databases were just never designed for a world where clients are globally distributed.
Hyperdrive’s connection pooling will always be free, for both database protocols we support today and new database protocols we add in the future. Just like DDoS protection and our global CDN, we think access to Hyperdrive’s core feature is too useful to hold back.
During the open beta, Hyperdrive itself will not incur any charges for usage, regardless of how you use it. We’ll be announcing more details on how Hyperdrive will be priced closer to GA (early in 2024), with plenty of notice.
Time to query
So where to from here for Hyperdrive?
We’re planning on bringing Hyperdrive to GA in early 2024 — and we’re focused on landing more controls over how we cache & automatically invalidate based on writes, detailed query and performance analytics (soon!), support for more database engines (including MySQL) as well as continuing to work on making it even faster.
We’re also working to enable private network connectivity via Magic WAN and Cloudflare Tunnel, so that you can connect to databases that aren’t (or can’t be) exposed to the public Internet.
To connect Hyperdrive to your existing database, visit our developer docs — it takes less than a minute to create a Hyperdrive and update existing code to use it. Join the #hyperdrive-beta channel in our Developer Discord to ask questions, surface bugs, and talk to our Product & Engineering teams directly.
Last year, we announced the Browser Rendering API – letting users running Puppeteer, a browser automation library, directly in Workers. Puppeteer is one of the most popular libraries used to interact with a headless browser instance to accomplish tasks like taking screenshots, generating PDFs, crawling web pages, and testing web applications. We’ve heard from developers that configuring and maintaining their own serverless browser automation systems can be quite painful.
The Workers Browser Rendering API solves this. It makes the Puppeteer library available directly in your Worker, connected to a real web browser, without the need to configure and manage infrastructure or keep browser sessions warm yourself. You can use @cloudflare/puppeteer to run the full Puppeteer API directly on Workers!
We’ve seen so much interest from the developer community since launching last year. While the Browser Rendering API is still in beta (sign up to our waitlist to get access), we wanted to share a way to get more out of our current limits by using the Browser Rendering API with Durable Objects. We’ll also be sharing pricing for the Rendering API, so you can build knowing exactly what you’ll pay for.
Building a responsive web design testing tool with the Browser Rendering API
As a designer or frontend developer, you want to make sure that content is well-designed for visitors browsing on different screen sizes. With the number of possible devices that users are browsing on are growing, it becomes difficult to test all the possibilities manually. While there are many testing tools on the market, we want to show how easy it is to create your own Chromium based tool with the Workers Browser Rendering API and Durable Objects.
We’ll be using the Worker to handle any incoming requests, pass them to the Durable Object to take screenshots and store them in an R2 bucket. The Durable Object is used to create a browser session that’s persistent. By using Durable Object Alarms we can keep browsers open for longer and reuse browser sessions across requests.
Let’s dive into how we can build this application:
Create a Worker with a Durable Object, Browser Rendering API binding and R2 bucket. This is the resulting wrangler.toml:
name = "rendering-api-demo"
main = "src/index.js"
compatibility_date = "2023-09-04"
compatibility_flags = [ "nodejs_compat"]
account_id = "c05e6a39aa4ccdd53ad17032f8a4dc10"


# Browser Rendering API binding
browser = { binding = "MYBROWSER" }

# Bind an R2 Bucket
[[r2_buckets]]
binding = "BUCKET"
bucket_name = "screenshots"

# Binding to a Durable Object
[[durable_objects.bindings]]
name = "BROWSER"
class_name = "Browser"

[[migrations]]
tag = "v1" # Should be unique for each entry
new_classes = ["Browser"] # Array of new classes
2. Define the Worker
This Worker simply passes the request onto the Durable Object.
export default {
	async fetch(request, env) {

		let id = env.BROWSER.idFromName("browser");
		let obj = env.BROWSER.get(id);

		// Send a request to the Durable Object, then await its response.
		let resp = await obj.fetch(request.url);
		let count = await resp.text();

		return new Response("success");
	}
};
3. Define the Durable Object class
const KEEP_BROWSER_ALIVE_IN_SECONDS = 60;

export class Browser {
	constructor(state, env) {
		this.state = state;
		this.env = env;
		this.keptAliveInSeconds = 0;
		this.storage = this.state.storage;
	}

	async fetch(request) {
		// screen resolutions to test out
		const width = [1920, 1366, 1536, 360, 414]
		const height = [1080, 768, 864, 640, 896]

		// use the current date and time to create a folder structure for R2
		const nowDate = new Date()
		var coeff = 1000 * 60 * 5
		var roundedDate = (new Date(Math.round(nowDate.getTime() / coeff) * coeff)).toString();
		var folder = roundedDate.split(" GMT")[0]

		//if there's a browser session open, re-use it
		if (!this.browser) {
			console.log(`Browser DO: Starting new instance`);
			try {
			  this.browser = await puppeteer.launch(this.env.MYBROWSER);
			} catch (e) {
			  console.log(`Browser DO: Could not start browser instance. Error: ${e}`);
			}
		  }

		// Reset keptAlive after each call to the DO
		this.keptAliveInSeconds = 0;

		const page = await this.browser.newPage();

		// take screenshots of each screen size
		for (let i = 0; i < width.length; i++) {
			await page.setViewport({ width: width[i], height: height[i] });
			await page.goto("https://workers.cloudflare.com/");
			const fileName = "screenshot_" + width[i] + "x" + height[i]
			const sc = await page.screenshot({
				path: fileName + ".jpg"
			}
			);

			this.env.BUCKET.put(folder + "/"+ fileName + ".jpg", sc);
		  }

		// Reset keptAlive after performing tasks to the DO.
		this.keptAliveInSeconds = 0;

		// set the first alarm to keep DO alive
		let currentAlarm = await this.storage.getAlarm();
		if (currentAlarm == null) {
		console.log(`Browser DO: setting alarm`);
		const TEN_SECONDS = 10 * 1000;
		this.storage.setAlarm(Date.now() + TEN_SECONDS);
		}

		await this.browser.close();
		return new Response("success");
	}

	async alarm() {
		this.keptAliveInSeconds += 10;

		// Extend browser DO life
		if (this.keptAliveInSeconds < KEEP_BROWSER_ALIVE_IN_SECONDS) {
		  console.log(`Browser DO: has been kept alive for ${this.keptAliveInSeconds} seconds. Extending lifespan.`);
		  this.storage.setAlarm(Date.now() + 10 * 1000);
		} else console.log(`Browser DO: cxceeded life of ${KEEP_BROWSER_ALIVE_IN_SECONDS}. Browser DO will be shut down in 10 seconds.`);
	  }

  }
That’s it! With less than a hundred lines of code, you can fully customize a powerful tool to automate responsive web design testing. You can even incorporate it into your CI pipeline to automatically test different window sizes with each build and verify the result is as expected by using an automated library like pixelmatch.
How much will this cost?
We’ve spoken to many customers deploying a Puppeteer service on their own infrastructure, on public cloud containers or functions or using managed services. The common theme that we’ve heard is that these services are costly – costly to maintain and expensive to run.
While you won’t be billed for the Browser Rendering API yet, we want to be transparent with you about costs you start building. We know it’s important to understand the pricing structure so that you don’t get a surprise bill and so that you can design your application efficiently.
You pay based on two usage metrics:
Number of sessions: A Browser Session is a new instance of a browser being launched
Number of concurrent sessions: Concurrent Sessions is the number of browser instances open at once
Using Durable Objects to persist browser sessions improves performance by eliminating the time that it takes to spin up a new browser session. Since it re-uses sessions, it cuts down on the number of concurrent sessions needed. We highly encourage this model of session re-use if you expect to see consistent traffic for applications that you build on the Browser Rendering API.
If you have feedback about this pricing, we’re all ears. Feel free to reach out through Discord (channel name: browser-rendering-api-beta) and share your thoughts.
Get Started
Sign up to our waitlist to get access to the Workers Browser Rendering API. We’re so excited to see what you build! Share your creations with us on Twitter/X @CloudflareDev or on our Discord community.
Today, we’re sharing that we’ve reached a new milestone in the path to making this API available across runtimes — engineers from Cloudflare and Vercel have published a draft specification of the connect() sockets API for review by the community, along with a Node.js compatible implementation of the connect() API that developers can start using today.
This implementation helps both application developers and maintainers of libraries and frameworks:
Maintainers of existing libraries that use the node:net and node:tls APIs can use it to more easily add support for runtimes where node:net and node:tls are not available.
JavaScript frameworks can use it to make connect() available in local development, making it easier for application developers to target runtimes that provide connect().
Why create a new standard? Why connect()?
As we described when we first announced connect(), to-date there has not been a standard API across JavaScript runtimes for creating and working with TCP or UDP sockets. This makes it harder for maintainers of open-source libraries to ensure compatibility across runtimes, and ultimately creates friction for application developers who have to navigate which libraries work on which platforms.
While Node.js provides the node:net and node:tls APIs, these APIs were designed over 10 years ago in the very early days of the Node.js project and remain callback-based. As a result, they can be hard to work with, and expose configuration in ways that don’t fit serverless platforms or web browsers.
The connect() API fills this gap by incorporating the best parts of existing socket APIs and prior proposed standards, based on feedback from the JavaScript community — including contributors to Node.js. Libraries like pg (node-postgres on Github) are already using the connect() API.
The proposed API is Promise-based and reuses existing standards whenever possible. For example, ReadableStream and WritableStream are used for the read and write ends of the socket. This makes it easy to pipe data from a TCP socket to any other library or existing code that accepts a ReadableStream as input, or to write to a TCP socket via a WritableStream.
The entrypoint of the API is the connect() function, which takes a string containing both the hostname and port separated by a colon, or an object with discrete hostname and port fields. It returns a Socket object which represents a socket connection. An instance of this object exposes attributes and methods for working with the connection.
A connection can be established in plain-text or TLS mode, as well as a special “starttls” mode which allows the socket to be easily upgraded to TLS after some period of plain-text data transfer, by calling the startTls() method on the Socket object. No need to create a new socket or switch to using a separate set of APIs once the socket is upgraded to use TLS.
For example, to upgrade a socket using the startTLS pattern, you might do something like this:
import { connect } from "@arrowood.dev/socket"

const options = { secureTransport: "starttls" };
const socket = connect("address:port", options);
const secureSocket = socket.startTls();
// The socket is immediately writable
// Relies on web standard WritableStream
const writer = secureSocket.writable.getWriter();
const encoder = new TextEncoder();
const encoded = encoder.encode("hello");
await writer.write(encoded);
Equivalent code using the node:net and node:tls APIs:
import net from 'node:net'
import tls from 'node:tls'

const socket = new net.Socket(HOST, PORT);
socket.once('connect', () => {
  const options = { socket };
  const secureSocket = tls.connect(options, () => {
    // The socket can only be written to once the
    // connection is established.
    // Polymorphic API, uses Node.js streams
    secureSocket.write('hello');
  }
})
Use the Node.js implementation of connect() in your library
To make it easier for open-source library maintainers to adopt the connect() API, we’ve published an implementation of connect() in Node.js that allows you to publish your library such that it works across JavaScript runtimes, without having to maintain any runtime-specific code.
To get started, install it as a dependency:
npm install --save @arrowood.dev/socket
And import it in your library or application:
import { connect } from "@arrowood.dev/socket"
What’s next for connect()?
The wintercg/proposal-sockets-api is published as a draft, and the next step is to solicit and incorporate feedback. We’d love your feedback, particularly if you maintain an open-source library or make direct use of the node:net or node:tls APIs.
Once feedback has been incorporated, engineers from Cloudflare, Vercel and beyond will be continuing to work towards contributing an implementation of the API directly to Node.js as a built-in API.
Building modern full-stack applications requires connecting to many hosted third party services, from observability platforms to databases and more. All too often, this means spending time doing busywork, managing credentials and writing glue code just to get started. This is why we’re building out the Cloudflare Integrations Marketplace to allow developers to easily discover, configure and deploy products to use with Workers.
Earlier this year, we introduced integrations with Supabase, PlanetScale, Neon and Upstash. Today, we are thrilled to introduce our newest additions to Cloudflare’s Integrations Marketplace – Sentry, Turso and Momento.
Let's take a closer look at some of the exciting integration providers that are now part of the Workers Integration Marketplace.
Improve performance and reliability by connecting Workers to Sentry
When your Worker encounters an error you want to know what happened and exactly what line of code triggered it. Sentry is an application monitoring platform that helps developers identify and resolve issues in real-time.
The Workers and Sentry integration automatically sends errors, exceptions and console.log() messages from your Worker to Sentry with no code changes required. Here’s how it works:
You enable the integration from the Cloudflare Dashboard.
The credentials from the Sentry project of your choice are automatically added to your Worker.
You can configure sampling to control the volume of events you want sent to Sentry. This includes selecting the sample rate for different status codes and exceptions.
Cloudflare deploys a Tail Worker behind the scenes that contains all the logic needed to capture and send data to Sentry.
Like magic, errors, exceptions, and log messages are automatically sent to your Sentry project.
In the future, we’ll be improving this integration by adding support for uploading source maps and stack traces so that you can pinpoint exactly which line of your code caused the issue. We’ll also be tying in Workers deployments with Sentry releases to correlate new versions of your Worker with events in Sentry that help pinpoint problematic deployments. Check out our developer documentation for more information.
Develop at the Data Edge with Turso + Workers
Turso is an edge-hosted, distributed database based on libSQL, an open-source fork of SQLite. Turso focuses on providing a global service that minimizes query latency (and thus, application latency!). It’s perfect for use with Cloudflare Workers – both compute and data are served close to users.
Turso follows the model of having one primary database with replicas that are located globally, close to users. Turso automatically routes requests to a replica closest to where the Worker was invoked. This model works very efficiently for read heavy applications since read requests can be served globally. If you’re running an application that has heavy write workloads, or want to cut down on replication costs, you can run Turso with just the primary instance and use Smart Placement to speed up queries.
The Turso and Workers integration automatically pulls in Turso API credentials and adds them as secrets to your Worker, so that you can start using Turso by simply establishing a connection using the libsql SDK. Get started with the Turso and Workers Integration today by heading to our developer documentation.
Cache responses from data stores with Momento
Momento Cache is a low latency serverless caching solution that can be used on top of relational databases, key-value databases or object stores to get faster load times and better performance. Momento abstracts details like scaling, warming and replication so that users can deploy cache in a matter of minutes.
The Momento and Workers integration automatically pulls in your Momento API key using an OAuth2 flow. The Momento API key is added as a secret in Workers and, from there, you can start using the Momento SDK in Workers. Head to our developer documentation to learn more and use the Momento and Workers integration!
Try integrations out today
We want to give you back time, so that you can focus less on configuring and connecting third party tools to Workers and spend more time building. We’re excited to see what you build with integrations. Share your projects with us on Twitter (@CloudflareDev) and stay tuned for more exciting updates as we continue to grow our Integrations Marketplace!
If you would like to build an integration with Cloudflare Workers, fill out the integration request form and we’ll be in touch.
Today we are announcing new pricing for Cloudflare Workers and Pages Functions, where you are billed based on CPU time, and never for the idle time that your Worker spends waiting on network requests and other I/O. Unlike other platforms, when you build applications on Workers, you only pay for the compute resources you actually use.
Why is this exciting? To date, all large serverless compute platforms have billed based on how long your function runs — its duration or “wall time”. This is a reflection of a new paradigm built on a leaky abstraction — your code may be neatly packaged up into a “function”, but under the hood there’s a virtual machine (VM). A VM can’t be paused and resumed quickly enough to execute another piece of code while it waits on I/O. So while a typical function might take 100ms to run, it might typically spend only 10ms doing CPU work, like crunching numbers or parsing JSON, with the rest of time spent waiting on I/O.
This status quo has meant that you are billed for this idle time, while nothing is happening.
With this announcement, Cloudflare is the first and only global serverless platform to offer standard pricing based on CPU time, rather than duration. We think you should only pay for the compute time you actually use, and that’s how we’re going to bill you going forward.
Old pricing — two pricing models, each with tradeoffs
New pricing — one simple and predictable pricing model
With the same generous Free plan
Unlike wall time (duration, or GB-s), CPU time is more predictable and under your control. When you make a request to a third party API, you can’t control how long that API takes to return a response. This time can be quite long, and vary dramatically — particularly when building AI applications that make inference requests to LLMs. If a request takes twice as long to complete, duration-based billing means you pay double. By contrast, CPU time is consistent and unaffected by time spent waiting on I/O — purely a function of the logic and processing of inputs on outputs to your Worker. It is entirely under your control.
Starting October 31, 2023, you will have the option to opt in individual Workers and Pages Functions projects on your account to new pricing, and newly created projects will default to new pricing. You’ll be able to estimate how much new pricing will cost in the Cloudflare dashboard. For the majority of current applications, new pricing is the same or less expensive than the previous Bundled and Unbound pricing plans.
If you’re on our Workers Paid plan, you will have until March 1, 2024 to switch to the new pricing on your own, after which all of your projects will be automatically migrated to new pricing. If you’re an Enterprise customer, any contract renewals after March 1, 2024, will use the new pricing. You’ll receive plenty of advance notice via email and dashboard notifications before any changes go into effect. And since CPU time is fully in your control, the more you optimize your Worker’s compute time, the less you’ll pay. Your incentives are aligned with ours, to make efficient use of compute resources on Region: Earth.
The challenge of truly scaling to zero
The beauty of serverless is that it allows teams to focus on what matters most — delivering value to their customers, rather than managing infrastructure. It saves you money by effortlessly scaling up and down all over the world based on your traffic, whether you’re an early stage startup or Shopify during Black Friday.
One of the promises of serverless is the idea of scaling to zero — once those big days subside, you no longer have to pay for virtual machines to sit idle before your autoscaling kicks in, or be charged by the hour for instances that you barely ended up using. No compute = no bills for usage. Or so, at least, is the promise of serverless.
Yet, there’s one hidden cost, where even in the serverless world you will find yourself paying for idle resources — what happens when your function is sitting around waiting on I/O? With pricing based on the duration that a function runs, you’re still billed for time that your service is doing zero work, and just waiting on network requests.
Most applications spend far more time waiting on this I/O than they do using the CPU, often ten times more.
Imagine a similar scenario in your own life — you grab a cab to go to the airport. On the way, the driver decides to stop to refuel and grab a snack, but leaves the meter running. This is not time spent bringing you closer to your destination, but it’s time that you’re paying for. Now imagine for the time the driver was refueling the car, the meter was paused. That’s the difference between CPU time and duration, or wall clock time.
But rather than waiting on the driver to refuel or grab a Snickers bar, what is it that you’re actually paying for when it comes to serverless compute?
Time spent waiting on services you don’t control
Most applications depend on one or many external service providers. Providers of hosted large language models (LLMs) like GPT-4 or Stable Diffusion. Databases as a service. Payment processors. Or simply an API request to a system outside your control. This is where software development is headed — rather than reinventing the wheel and slowly building everything themselves, both fast-moving startups and the Fortune 500 increasingly build using other services to avoid undifferentiated heavy lifting.
Every time an application interacts with one of these external services, it has to send data over the network and wait until it receives a response. And while some services are lightning fast, others can take considerable time, like waiting for a payment processor or for a large media file to be uploaded or converted. Your own application sits idle for most of the request, waiting on services outside your control.
Until today, you’ve had to pay while your application waits. You’ve had to pay more when a service you depend on has an operational issue and slows down, or times out in responding to your request. This has been a disincentive to incrementally move parts of your application to serverless.
Cloudflare’s new pricing: the first serverless platform to truly scale down to zero
The idea of “scale to zero” is that you never have to keep instances of your application sitting idle, waiting for something to happen. Serverless is more than just not having to manage servers or virtual machines — you shouldn’t have to provision and manage the number of compute resources that are available or warm.
Our new pricing takes the “scale to zero” concept even further, and extends it to whether your application is actually performing work. If you’re still paying while nothing is happening, we don’t think that’s truly scale to zero. Your application is idle. The CPU can be used for other tasks. Whether your application is “running” is an old concept lifted from an era before multi-tenant cloud platforms. What matters is if you are actually using compute resources.
Pay less, deploy everywhere, without hidden costs
Let’s compare what you’d pay on new Workers pricing to AWS Lambda, for the following Worker:
One billion requests per month
Seven CPU milliseconds per request
200ms duration per request
The above table is for informational purposes only. Prices are limited to the public fees as of September 20, 2023, and do not include taxes and any other fees. AWS Lambda and Lambda @ Edge prices are based on publicly available pricing in US-East (Ohio) region as published on https://aws.amazon.com/lambda/pricing/
New Workers pricing makes building AI applications dramatically cheaper
Yesterday we announced a new suite of products to let you build AI applications on Cloudflare — Workers AI, AI Gateway, and our new vector database, Vectorize.
Nearly everyone is building new products and features using AI models right now. Large language models and generative AI models are incredibly powerful. But they aren’t always fast — asking a model to create an image, transcribe a segment of audio, or write a story often takes multiple seconds — far longer than a typical API response or database query that we expect to return in tens of milliseconds. There is significant compute work going on behind the scenes, and that means longer duration per request to a Worker.
New Workers pricing makes this much less expensive than it was previously on the Unbound usage model.
Let’s take the same example as above, but instead assume the duration of the request is two seconds (2000ms), because the Worker makes an inference request to a large AI model. With new Workers pricing, you pay the exact same amount, no matter how long this request takes.
No surprise bills — set a maximum limit on CPU time for each Worker
Surprise bills from cloud providers are an unfortunately common horror story. In the old way of provisioning compute resources, forgetting to shut down an instance of a database or virtual machine can cost hundreds of dollars. And accidentally autoscaling up too high can be even worse.
We’re building new safeguards to prevent these kinds of scenarios on Workers. As part of new pricing, you will be able to cap CPU usage on a per-Worker basis.
For example, if you have a Worker with a p99 CPU time of 15ms, you might use this to set a max CPU limit of 40ms — enough headroom to ensure that your worker will run successfully, while ensuring that even if you ship a bug that causes a CPU time to ratchet up dramatically, or have an edge case that causes infinite recursion, you can’t suddenly rack up a giant unexpected bill, or be vulnerable to a denial of wallet attack. This can be particularly helpful if your worker handles variable or user-generated input, to guard against edge cases that you haven’t accounted for.
Alternatively, if you’re running a production service, but want to make sure you stay on top of your costs, we will also be adding the option to configure notifications that can automatically email you, page you, or send a webhook if your worker exceeds a particular amount of CPU time per request. You will be able to choose at what threshold you want to be notified, and how.
New ways to “hibernate” Durable Objects while keeping connections alive
While Workers are stateless functions, Durable Objects are stateful and long-lived, commonly used to coordinate and persist real-time state in chat, multiplayer games, or collaborative apps. And unlike Workers, duration-based pricing fits Durable Objects well. As long as one or more clients are connected to a Durable Object, it keeps state available in memory. Durable Objects pricing will remain duration-based, and is not changing as part of this announcement.
What about when a client is connected to a Durable Object, but no work has happened for a long time? Consider a collaborative whiteboard app built using Durable Objects. A user of the app opens the app in a browser tab, but then forgets about it, and leaves it running for days, with an open WebSocket connection. Just like with Workers, we don’t think you should have to pay for this idle time. But until recently, there hasn’t been an API to signal to us that a Durable Object can be safely “hibernated”.
The recently introduced Hibernation API, currently in beta, allows you to set an automatic response to be used while hibernated and serialize state such that it survives hibernation. This gives Cloudflare the inputs we need in order to maintain open WebSocket connections from clients, while “hibernating” the Durable Object such that it is not actively running, and you are not billed for idle time. The result is that your state is always available in-memory when actually need it, but isn’t unnecessarily kept around when it’s not. As long as your Durable Object is hibernating, even if there are active clients still connected over a WebSocket, you won’t be billed for duration.
Snippets make Cloudflare’s CDN programmable — for free
What if you just want to modify a header, do a country code redirect, or cache a custom query? Developers have relied on Workers to program Cloudflare’s CDN like this for many years. With the announcement of Cloudflare Snippets last year, now in alpha, we’re making it free.
If you use Workers today for these smaller use cases, to customize any of Cloudflare’s application services, Snippets will be the optimal, zero cost option.
A serverless platform without limits
Developers are building ever larger and more complex full-stack applications on Workers each month. Our promise to you is to help you scale in any direction, without worrying about paying for idle time or having to manage and provision compute resources across regions.
This also means not having to worry about limits. Workers already serves many millions of requests per second, and scales and performs so well that we are rebuilding our own CDN on top of Workers. Individual Workers can now be up to 10MB, with a max startup time of 400ms, and can be easily composed together using Service Bindings. Entire platforms are built on top of Workers, with a growing number of companies allowing their own customers to write and deploy custom code and applications via Workers for Platforms. Some of the biggest platforms in the world rely on Cloudflare and the Workers platform during the most critical moments.
New pricing removes limits on the types of applications that could be built cost effectively with duration-based pricing. It removes the ceiling on CPU time from our original request-based pricing. We’re excited to see what you build, and are committed to being the development platform where you’re not constrained by limits on scale, regions, instances, concurrency or whatever else you need to handle to grow and operate globally.
When will new pricing be available?
Starting October 31, 2023, you will have the option to opt in individual Workers and Pages Functions projects on your account to new pricing, and newly created projects will default to new pricing. You will have until March 1, 2024, or the end of your Enterprise contract, whichever comes later, to switch to new pricing on your own, after which all of your projects will be automatically migrated to new pricing. You’ll receive plenty of advance notice via email and dashboard notifications before any changes go into effect.
Between now and then, we want to hear from you. We’ve based new pricing off feedback we’ve heard from developers building serverless applications, and companies estimating and projecting their costs. Tell us what you think of new pricing by sharing your feedback in this survey. We read every response.
Today, we’re excited to announce our beta of AI Gateway – the portal to making your AI applications more observable, reliable, and scalable.
AI Gateway sits between your application and the AI APIs that your application makes requests to (like OpenAI) – so that we can cache responses, limit and retry requests, and provide analytics to help you monitor and track usage. AI Gateway handles the things that nearly all AI applications need, saving you engineering time, so you can focus on what you're building.
Connecting your app to AI Gateway
It only takes one line of code for developers to get started with Cloudflare’s AI Gateway. All you need to do is replace the URL in your API calls with your unique AI Gateway endpoint. For example, with OpenAI you would define your baseURL as "https://gateway.ai.cloudflare.com/v1/ACCOUNT_TAG/GATEWAY/openai" instead of "https://api.openai.com/v1" – and that’s it. You can keep your tokens in your code environment, and we’ll log the request through AI Gateway before letting it pass through to the final API with your token.
// configuring AI gateway with the dedicated OpenAI endpoint

const openai = new OpenAI({
  apiKey: env.OPENAI_API_KEY,
  baseURL: "https://gateway.ai.cloudflare.com/v1/ACCOUNT_TAG/GATEWAY/openai",
});
We currently support model providers such as OpenAI, Hugging Face, and Replicate with plans to add more in the future. We support all the various endpoints within providers and also response streaming, so everything should work out-of-the-box once you have the gateway configured. The dedicated endpoint for these providers allows you to connect your apps to AI Gateway by changing one line of code, without touching your original payload structure.
We also have a universal endpoint that you can use if you’d like more flexibility with your requests. With the universal endpoint, you have the ability to define fallback models and handle request retries. For example, let’s say a request was made to OpenAI GPT-3, but the API was down – with the universal endpoint, you could define Hugging Face GPT-2 as your fallback model and the gateway can automatically resend that request to Hugging Face. This is really helpful in improving resiliency for your app in cases where you are noticing unusual errors, getting rate limited, or if one bill is getting costly, and you want to diversify to other models. With the universal endpoint, you’ll just need to tweak your payload to specify the provider and endpoint, so we can properly route requests for you. Check out the example request below and the docs for more details on the universal endpoint schema.
# Using the Universal Endpoint to first try OpenAI, then Hugging Face

curl https://gateway.ai.cloudflare.com/v1/ACCOUNT_TAG/GATEWAY  -X POST \
  --header 'Content-Type: application/json' \
  --data '[
  {
    "provider": "openai",
    "endpoint": "chat/completions",
    "headers": {
      "Authorization": "Bearer $OPENAI_TOKEN",
      "Content-Type": "application/json"
    },
    "query": {
      "model": "gpt-3.5-turbo",
      "stream": true,
      "messages": [
        {
          "role": "user",
          "content": "What is Cloudflare?"
        }
      ]
    }
  },
  {
    "provider": "huggingface",
    "endpoint": "gpt2",
    "headers": {
      "Authorization": "Bearer $HF_TOKEN",
      "Content-Type": "application/json"
    },
    "query": {
      "inputs": "What is Cloudflare?"
    }
  },
]'
Gaining visibility into your app’s usage
Now that your app is connected to Cloudflare, we can help you gather analytics and give insight and control on the traffic that is passing through your apps. Regardless of what model or infrastructure you use in the backend, we can help you log requests and analyze data like the number of requests, number of users, cost of running the app, duration of requests, etc. Although these seem like basic analytics that model providers should expose, it’s surprisingly difficult to get visibility into these metrics with the typical model providers. AI Gateway takes it one step further and lets you aggregate analytics across multiple providers too.
Controlling how your app scales
One of the pain points we often hear is how expensive it costs to build and run AI apps. Each API call can be unpredictably expensive and costs can rack up quickly, preventing developers from scaling their apps to their full potential. At the speed that the industry is moving, you don’t want to be limited by your scale and left behind – and that’s where caching and rate limiting can help. We allow developers to cache their API calls so that new requests can be served from our cache rather than the original API – making it cheaper and faster. Rate limiting can also help control costs by throttling the number of requests and preventing excessive or suspicious activity. Developers have full flexibility to define caching and rate limiting rules, so that apps can scale at a sustainable pace of your choosing.
The Workers AI Platform
AI Gateway pairs perfectly with our new Workers AI and Vectorize products, so you can build full-stack AI applications all within the Workers ecosystem. From deploying applications with Workers, running model inference on the edge with Workers AI, storing vector embeddings on Vectorize, to gaining visibility into your applications with AI Gateway – the Workers platform is your one-stop shop to bring your AI applications to life. To learn how to use AI Gateway with Workers AI or the different providers, check out the docs.
Next up: the enterprise use case
We are shipping v1 of AI Gateway with a few core features, but we have plans to expand the product to cover more advanced use cases as well – usage alerts, jailbreak protection, dynamic model routing with A/B testing, and advanced cache rules. But what we’re really excited about are the other ways you can apply AI Gateway…
In the future, we want to develop AI Gateway into a product that helps organizations monitor and observe how their users or employees are using AI. This way, you can flip a switch and have all requests within your network to providers (like OpenAI) pass through Cloudflare first – so that you can log user requests, apply access policies, enable rate limiting and data loss prevention (DLP) strategies. A powerful example: if an employee accidentally pastes an API key to ChatGPT, AI Gateway can be configured to see the outgoing request and redact the API key or block the request entirely, preventing it from ever reaching OpenAI or any end providers. We can also log and alert on suspicious requests, so that organizations can proactively investigate and control certain types of activity. AI Gateway then becomes a really powerful tool for organizations that might be excited about the efficiency that AI unlocks, but hesitant about trusting AI when data privacy and user error are really critical threats. We hope that AI Gateway can alleviate these concerns and make adopting AI tools a lot easier for organizations.
Whether you’re a developer building applications or a company who’s interested in how employees are using AI, our hope is that AI Gateway can help you demystify what’s going on inside your apps – because once you understand how your users are using AI, you can make decisions on how you actually want them to use it. Some of these features are still in development, but we hope this illustrates the power of AI Gateway and our vision for the future.
At Cloudflare, we live and breathe innovation (as you can tell by our Birthday Week announcements!) and the pace of innovation in AI is incredible to witness. We’re thrilled that we can not only help people build and use apps, but actually help accelerate the adoption and development of AI with greater control and visibility. We can’t wait to hear what you build – head to the Cloudflare dashboard to try out AI Gateway and let us know what you think!
Vectorize is our brand-new vector database offering, designed to let you build full-stack, AI-powered applications entirely on Cloudflare’s global network: and you can start building with it right away. Vectorize is in open beta, and is available to any developer using Cloudflare Workers.
You can use Vectorize with Workers AI to power semantic search, classification, recommendation and anomaly detection use-cases directly with Workers, improve the accuracy and context of answers from LLMs (Large Language Models), and/or bring-your-own embeddings from popular platforms, including OpenAI and Cohere.
Visit Vectorize’s developer documentation to get started, or read on if you want to better understand what vector databases do and how Vectorize is different.
Why do I need a vector database?
Machine learning models can’t remember anything: only what they were trained on.
Vector databases are designed to solve this, by capturing how an ML model represents data — including structured and unstructured text, images and audio — and storing it in a way that allows you to compare against future inputs. This allows us to leverage the power of existing machine-learning models and LLMs (Large Language Models) for content they haven’t been trained on: which, given the tremendous cost of training models, turns out to be extremely powerful.
To better illustrate why a vector database like Vectorize is useful, let’s pretend they don’t exist, and see how painful it is to give context to an ML model or LLM for a semantic search or recommendation task. Our goal is to understand what content is similar to our query and return it: based on our own dataset.
Our user query comes in: they’re searching for “how to write to R2 from Cloudflare Workers”
We load up our entire documentation dataset — a thankfully “small” dataset at about 65,000 sentences, or 2.1 GB — and provide it alongside the query from our user. This allows the model to have the context it needs, based on our data.
We wait.
(A long time)
We get our similarity scores back, with the sentences most similar to the user’s query, and then work to map those back to URLs before we return our search results.
… and then another query comes in, and we have to start this all over again.
In practice, this isn’t really possible: we can’t pass that much context in an API call (prompt) to most machine learning models, and even if we could, it’d take tremendous amounts of memory and time to process our dataset over-and-over again.
With a vector database, we don’t have to repeat step 2: we perform it once, or as our dataset updates, and use our vector database to provide a form of long-term memory for our machine learning model. Our workflow looks a little more like this:
We load up our entire documentation dataset, run it through our model, and store the resulting vector embeddings in our vector database (just once).
For each user query (and only the query) we ask the same model and retrieve a vector representation.
We query our vector database with that query vector, which returns the vectors closest to our query vector.
If we looked at these two flows side by side, we can quickly see how inefficient and impractical it is to use our own dataset with an existing model without a vector database:
Using a vector database to help machine learning models remember.
From this simple example, it’s probably starting to make some sense: but you might also be wondering why you need a vector database instead of just a regular database.
Vectors are the model’s representation of an input: how it maps that input to its internal structure, or “features”. Broadly, the more similar vectors are, the more similar the model believes those inputs to be based on how it extracts features from an input.
This is seemingly easy when we look at example vectors of only a handful of dimensions. But with real-world outputs, searching across 10,000 to 250,000 vectors, each potentially 1,536 dimensions wide, is non-trivial. This is where vector databases come in: to make search work at scale, vector databases use a specific class of algorithm, such as k-nearest neighbors (kNN) or other approximate nearest neighbor (ANN) algorithms to determine vector similarity.
And although vector databases are extremely useful when building AI and machine learning powered applications, they’re not only useful in those use-cases: they can be used for a multitude of classification and anomaly detection tasks. Knowing whether a query input is similar — or potentially dissimilar — from other inputs can power content moderation (does this match known-bad content?) and security alerting (have I seen this before?) tasks as well.
Building a recommendation engine with vector search
We built Vectorize to be a powerful partner to Workers AI: enabling you to run vector search tasks as close to users as possible, and without having to think about how to scale it for production.
We’re going to take a real world example — building a (product) recommendation engine for an e-commerce store — and simplify a few things.
Our goal is to show a list of “relevant products” on each product listing page: a perfect use-case for vector search. Our input vectors in the example are placeholders, but in a real world application we would generate them based on product descriptions and/or cart data by passing them through a sentence similarity model (such as Worker’s AI’s text embedding model)
Each vector represents a product across our store, and we associate the URL of the product with it. We could also set the ID of each vector to the product ID: both approaches are valid. Our query — vector search — represents the product description and content for the product user is currently viewing.
Let’s step through what this looks like in code: this example is pulled straight from our developer documentation:
export interface Env {
	// This makes our vector index methods available on env.MY_VECTOR_INDEX.*
	// e.g. env.MY_VECTOR_INDEX.insert() or .query()
	TUTORIAL_INDEX: VectorizeIndex;
}

// Sample vectors: 3 dimensions wide.
//
// Vectors from a machine-learning model are typically ~100 to 1536 dimensions
// wide (or wider still).
const sampleVectors: Array<VectorizeVector> = [
	{ id: '1', values: [32.4, 74.1, 3.2], metadata: { url: '/products/sku/13913913' } },
	{ id: '2', values: [15.1, 19.2, 15.8], metadata: { url: '/products/sku/10148191' } },
	{ id: '3', values: [0.16, 1.2, 3.8], metadata: { url: '/products/sku/97913813' } },
	{ id: '4', values: [75.1, 67.1, 29.9], metadata: { url: '/products/sku/418313' } },
	{ id: '5', values: [58.8, 6.7, 3.4], metadata: { url: '/products/sku/55519183' } },
];

export default {
	async fetch(request: Request, env: Env, ctx: ExecutionContext): Promise<Response> {
		if (new URL(request.url).pathname !== '/') {
			return new Response('', { status: 404 });
		}
		// Insert some sample vectors into our index
		// In a real application, these vectors would be the output of a machine learning (ML) model,
		// such as Workers AI, OpenAI, or Cohere.
		let inserted = await env.TUTORIAL_INDEX.insert(sampleVectors);

		// Log the number of IDs we successfully inserted
		console.info(`inserted ${inserted.count} vectors into the index`);

		// In a real application, we would take a user query - e.g. "durable
		// objects" - and transform it into a vector emebedding first.
		//
		// In our example, we're going to construct a simple vector that should
		// match vector id #5
		let queryVector: Array<number> = [54.8, 5.5, 3.1];

		// Query our index and return the three (topK = 3) most similar vector
		// IDs with their similarity score.
		//
		// By default, vector values are not returned, as in many cases the
		// vectorId and scores are sufficient to map the vector back to the
		// original content it represents.
		let matches = await env.TUTORIAL_INDEX.query(queryVector, { topK: 3, returnVectors: true });

		// We map over our results to find the most similar vector result.
		//
		// Since our index uses the 'cosine' distance metric, scores will range
		// from 1 to -1.  A value of '1' means the vector is the same; the
		// closer to 1, the more similar. Values of -1 (least similar) and 0 (no
		// match).
		// let closestScore = 0;
		// let mostSimilarId = '';
		// matches.matches.map((match) => {
		// 	if (match.score > closestScore) {
		// 		closestScore = match.score;
		// 		mostSimilarId = match.vectorId;
		// 	}
		// });

		return Response.json({
			// This will return the closest vectors: we'll see that the vector
			// with id = 5 has the highest score (closest to 1.0) as the
			// distance between it and our query vector is the smallest.
			// Return the full set of matches so we can see the possible scores.
			matches: matches,
		});
	},
};
The code above is intentionally simple, but illustrates vector search at its core: we insert vectors into our database, and query it for vectors with the smallest distance to our query vector.
Here are the results, with the values included, so we visually observe that our query vector [54.8, 5.5, 3.1] is similar to our highest scoring match: [58.799, 6.699, 3.400] returned from our search. This index uses cosine similarity to calculate the distance between vectors, which means that the closer the score to 1, the more similar a match is to our query vector.
In a real application, we could now quickly return product recommendation URLs based on the most similar products, sorting them by their score (highest to lowest), and increasing the topK value if we want to show more. The metadata stored alongside each vector could also embed a path to an R2 object, a UUID for a row in a D1 database, or a key-value pair from Workers KV.
Workers AI + Vectorize: full stack vector search on Cloudflare
In a real application, we need a machine learning model that can both generate vector embeddings from our original dataset (to seed our database) and quickly turn user queries into vector embeddings too. These need to be from the same model, as each model represents features differently.
Here’s a compact example building an entire end-to-end vector search pipeline on Cloudflare:
import { Ai } from '@cloudflare/ai';
export interface Env {
	TEXT_EMBEDDINGS: VectorizeIndex;
	AI: any;
}
interface EmbeddingResponse {
	shape: number[];
	data: number[][];
}

export default {
	async fetch(request: Request, env: Env, ctx: ExecutionContext): Promise<Response> {
		const ai = new Ai(env.AI);
		let path = new URL(request.url).pathname;
		if (path.startsWith('/favicon')) {
			return new Response('', { status: 404 });
		}

		// We only need to generate vector embeddings just the once (or as our
		// data changes), not on every request
		if (path === '/insert') {
			// In a real-world application, we could read in content from R2 or
			// a SQL database (like D1) and pass it to Workers AI
			const stories = ['This is a story about an orange cloud', 'This is a story about a llama', 'This is a story about a hugging emoji'];
			const modelResp: EmbeddingResponse = await ai.run('@cf/baai/bge-base-en-v1.5', {
				text: stories,
			});

			// We need to convert the vector embeddings into a format Vectorize can accept.
			// Each vector needs an id, a value (the vector) and optional metadata.
			// In a real app, our ID would typicaly be bound to the ID of the source
			// document.
			let vectors: VectorizeVector[] = [];
			let id = 1;
			modelResp.data.forEach((vector) => {
				vectors.push({ id: `${id}`, values: vector });
				id++;
			});

			await env.TEXT_EMBEDDINGS.upsert(vectors);
		}

		// Our query: we expect this to match vector id: 1 in this simple example
		let userQuery = 'orange cloud';
		const queryVector: EmbeddingResponse = await ai.run('@cf/baai/bge-base-en-v1.5', {
			text: [userQuery],
		});

		let matches = await env.TEXT_EMBEDDINGS.query(queryVector.data[0], { topK: 1 });
		return Response.json({
			// We expect vector id: 1 to be our top match with a score of
			// ~0.896888444
			// We are using a cosine distance metric, where the closer to one,
			// the more similar.
			matches: matches,
		});
	},
};
The code above does four things:
It passes the three sentences to Workers AI’s text embedding model (@cf/baai/bge-base-en-v1.5) and retrieves their vector embeddings.
It inserts those vectors into our Vectorize index.
Takes the user query and transforms it into a vector embedding via the same Workers AI model.
Queries our Vectorize index for matches.
This example might look “too” simple, but in a production application, we’d only have to change two things: just insert our vectors once (or periodically via Cron Triggers), and replace our three example sentences with real data stored in R2, a D1 database, or another storage provider.
In fact, this is incredibly similar to how we run Cursor, the AI assistant that can answer questions about Cloudflare Worker: we migrated Cursor to run on Workers AI and Vectorize. We generate text embeddings from our developer documentation using its built-in text embedding model, insert them into a Vectorize index, and transform user queries on the fly via that same model.
BYO embeddings from your favorite AI API
Vectorize isn’t just limited to Workers AI, though: it’s a fully-fledged, standalone vector database.
If you’re already using OpenAI’s Embedding API, Cohere’s multilingual model, or any other embedding API, then you can easily bring-your-own (BYO) vectors to Vectorize.
It works just the same: generate your embeddings, insert them into Vectorize, and pass your queries through the model before you query your index. Vectorize includes a few shortcuts for some of the most popular embedding models.
# Vectorize has ready-to-go presets that set the dimensions and distance metric for popular embeddings models
$ wrangler vectorize create openai-index-example --preset=openai-text-embedding-ada-002
This can be particularly useful if you already have an existing workflow around an existing embeddings API, and/or have validated a specific multimodal or multilingual embeddings model for your use-case.
Making the cost of AI predictable
There’s a tremendous amount of excitement around AI and ML, but there’s also one big concern: that it’s too expensive to experiment with, and hard to predict at scale.
With Vectorize, we wanted to bring a simpler pricing model to vector databases. Have an idea for a proof-of-concept at work? That should fit into our free-tier limits. Scaling up and optimizing your embedding dimensions for performance vs. accuracy? It shouldn’t break the bank.
Importantly, Vectorize aims to be predictable: you don’t need to estimate CPU and memory consumption, which can be hard when you’re just starting out, and made even harder when trying to plan for your peak vs. off-peak hours in production for a brand new use-case. Instead, you’re charged based on the total number of vector dimensions you store, and the number of queries against them each month. It’s our job to take care of scaling up to meet your query patterns.
Here’s the pricing for Vectorize — and if you have a Workers paid plan now, Vectorize is entirely free to use until 2024:
Workers Free (coming soon)
Workers Paid ($5/month)
Queried vector dimensions included
30M total queried dimensions / month
50M total queried dimensions / month
Stored vector dimensions included
5M stored dimensions / month
10M stored dimensions / month
Additional cost
$0.04 / 1M vector dimensions queried or stored
$0.04 / 1M vector dimensions queried or stored
Pricing is based entirely on what you store and query: (total vector dimensions queried + stored) * dimensions_per_vector * price. Query more? Easy to predict. Optimizing for smaller dimensions per vector to improve speed and reduce overall latency? Cost goes down. Have a few indexes for prototyping or experimenting with new use-cases? We don’t charge per-index.
Create as many as you need indexes to prototype new ideas and/or separate production from dev.
As an example: if you load 10,000 Workers AI vectors (384 dimensions each) and make 5,000 queries against your index each day, it’d result in 49 million total vector dimensions queried and still fit into what we include in the Workers Paid plan ($5/month). Better still: we don’t delete your indexes due to inactivity.
Note that while this pricing isn’t final, we expect few changes going forward. We want to avoid the element of surprise: there’s nothing worse than starting to build on a platform and realizing the pricing is untenable after you’ve invested the time writing code, tests and learning the nuances of a technology.
This is also just the beginning of the vector database story for us at Cloudflare. Over the next few weeks and months, we intend to land a new query engine that should further improve query performance, support even larger indexes, introduce sub-index filtering capabilities, increased metadata limits, and per-index analytics.
If you’re looking for inspiration on what to build, see the semantic search tutorial that combines Workers AI and Vectorize for document search, running entirely on Cloudflare. Or an example of how to combine OpenAI and Vectorize to give an LLM more context and dramatically improve the accuracy of its answers.
And if you have questions about how to use Vectorize for our product & engineering teams, or just want to bounce an idea off of other developers building on Workers AI, join the #vectorize and #workers-ai channels on our Developer Discord.
Earlier in 2023, we announced Super Slurper, a data migration tool that makes it easy to copy large amounts of data to R2 from other cloud object storage providers. Since the announcement, developers have used Super Slurper to run thousands of successful migrations to R2!
While Super Slurper is perfect for cases where you want to move all of your data to R2 at once, there are scenarios where you may want to migrate your data incrementally over time. Maybe you want to avoid the one time upfront AWS data transfer bill? Or perhaps you have legacy data that may never be accessed, and you only want to migrate what’s required?
Today, we’re announcing the open beta of Sippy, an incremental migration service that copies data from S3 (other cloud providers coming soon!) to R2 as it’s requested, without paying unnecessary cloud egress fees typically associated with moving large amounts of data. On top of addressing vendor lock-in, Sippy makes stressful, time-consuming migrations a thing of the past. All you need to do is replace the S3 endpoint in your application or attach your domain to your new R2 bucket and data will start getting copied over.
How does it work?
Sippy is an incremental migration service built directly into your R2 bucket. Migration-specific egress fees are reduced by leveraging requests within the flow of your application where you’d already be paying egress fees to simultaneously copy objects to R2. Here is how it works:
When an object is requested from Workers, S3 API, or public bucket, it is served from your R2 bucket if it is found.
If the object is not found in R2, it will simultaneously be returned from your S3 bucket and copied to R2.
Note: Some large objects may take multiple requests to copy.
That means after objects are copied, subsequent requests will be served from R2, and you’ll begin saving on egress fees immediately.
Start incrementally migrating data from S3 to R2
Create an R2 bucket
To get started with incremental migration, you’ll first need to create an R2 bucket if you don’t already have one. To create a new R2 bucket from the Cloudflare dashboard:
To learn more about other ways to create R2 buckets refer to the documentation on creating buckets.
Enable Sippy on your R2 bucket
Next, you’ll enable Sippy for the R2 bucket you created. During the beta, you can do this by using the API. Here’s an example of how to enable Sippy for an R2 bucket with cURL:
For more information on getting started, please refer to the documentation. Once enabled, requests to your bucket will now start copying data over from S3 if it’s not already present in your R2 bucket.
Finish your migration with Super Slurper
You can run your incremental migration for as long as you want, but eventually you may want to complete the migration to R2. To do this, you can pair Sippy with Super Slurper to easily migrate your remaining data that hasn’t been accessed to R2.
What’s next?
We’re excited about open beta, but it’s only the starting point. Next, we plan on making incremental migration configurable from the Cloudflare dashboard, complete with analytics that show you the progress of your migration and how much you are saving by not paying egress fees for objects that have been copied over so far.
If you are looking to start incrementally migrating your data to R2 and have any questions or feedback on what we should build next, we encourage you to join our Discord community to share!
The collective thoughts of the interwebz
Manage Consent
To provide the best experiences, we use technologies like cookies to store and/or access device information. Consenting to these technologies will allow us to process data such as browsing behavior or unique IDs on this site. Not consenting or withdrawing consent, may adversely affect certain features and functions.
Functional
Always active
The technical storage or access is strictly necessary for the legitimate purpose of enabling the use of a specific service explicitly requested by the subscriber or user, or for the sole purpose of carrying out the transmission of a communication over an electronic communications network.
Preferences
The technical storage or access is necessary for the legitimate purpose of storing preferences that are not requested by the subscriber or user.
Statistics
The technical storage or access that is used exclusively for statistical purposes.The technical storage or access that is used exclusively for anonymous statistical purposes. Without a subpoena, voluntary compliance on the part of your Internet Service Provider, or additional records from a third party, information stored or retrieved for this purpose alone cannot usually be used to identify you.
Marketing
The technical storage or access is required to create user profiles to send advertising, or to track the user on a website or across several websites for similar marketing purposes.