Tag Archives: serverless

Using generative infrastructure as code with Application Composer

Post Syndicated from Julian Wood original https://aws.amazon.com/blogs/compute/using-generative-infrastructure-as-code-with-application-composer/

This post is written by Anna Spysz, Frontend Engineer, AWS Application Composer

AWS Application Composer launched in the AWS Management Console one year ago, and has now expanded to the VS Code IDE as part of the AWS Toolkit. This includes access to a generative AI partner that helps you write infrastructure as code (IaC) for all 1100+ AWS CloudFormation resources that Application Composer now supports.

Overview

Application Composer lets you create IaC templates by dragging and dropping cards on a virtual canvas. These represent CloudFormation resources, which you can wire together to create permissions and references. With support for all 1100+ resources that CloudFormation allows, you can now build with everything from AWS Amplify to AWS X-Ray.

­­Previously, standard CloudFormation resources came only with a basic configuration. Adding an Amplify App resource resulted in the following configuration by default:

  MyAmplifyApp:
    Type: AWS::Amplify::App
    Properties:
      Name: <String>

And in the console:

AWS App Composer in the console

AWS App Composer in the console

Now, Application Composer in the IDE uses generative AI to generate resource-specific configurations with safeguards such as validation against the CloudFormation schema to ensure valid values.

When working on a CloudFormation or AWS Serverless Application Model (AWS SAM) template in VS Code, you can sign in with your Builder ID and generate multiple suggested configurations in Application Composer. Here is an example of an AI generated configuration for the AWS::Amplify::App type:

AI generated configuration for the Amplify App type

AI generated configuration for the Amplify App type

These suggestions are specific to the resource type, and are safeguarded by a check against the CloudFormation schema to ensure valid values or helpful placeholders. You can then select, use, and modify the suggestions to fit your needs.

You now know how to generate a basic example with one resource, but let’s look at building a full application with the help of AI-generated suggestions. This example recreates a serverless application from a Serverless Land tutorial, “Use GenAI capabilities to build a chatbot,” using Application Composer and generative AI-powered code suggestions.

Getting started with the AWS Toolkit in VS Code

If you don’t yet have the AWS Toolkit extension, you can find it under the Extensions tab in VS Code. Install or update it to at least version 2.1.0, so that the screen shows Amazon Q and Application Composer:

Amazon Q and Application Composer

Amazon Q and Application Composer

Next, to enable gen AI-powered code suggestions, you must enable Amazon CodeWhisperer using your Builder ID. The easiest way is to open Amazon Q chat, and select Authenticate. On the next screen, select the Builder ID option, then sign in with your Builder ID.

Enable Amazon CodeWhisperer using your Builder ID

Enable Amazon CodeWhisperer using your Builder ID

After sign-in, your connection appears in the VS Code toolkit panel:

Connection in VS Code toolkit panel

Connection in VS Code toolkit panel

Building with Application Composer

With the toolkit installed and connected with your Builder ID, you are ready to start building.

  1. In a new workspace, create a folder for the application and a blank template.yaml file.
  2. Open this file and initiate Application Composer by choosing the icon in the top right.
Initiate Application Composer

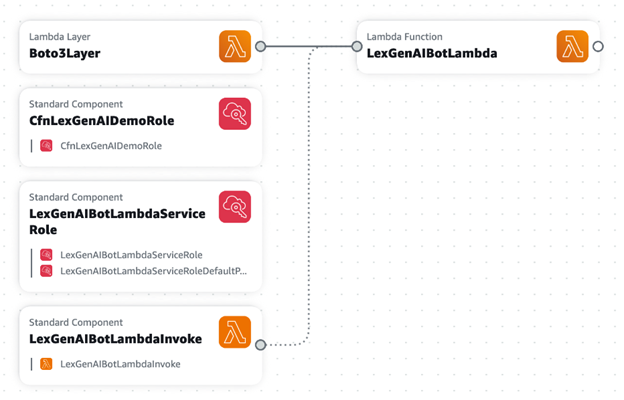
Original architecture diagram

The original tutorial includes this architecture diagram:

Original architecture diagram

Initiate Application Composer

First, add the services in the diagram to sketch out the application architecture, which simultaneously creates a deployable CloudFormation template:

  1. From the Enhanced components list, drag in a Lambda function and a Lambda layer.
  2. Double-click the Function resource to edit its properties. Rename the Lambda function’s Logical ID to LexGenAIBotLambda.
  3. Change the Source path to src/LexGenAIBotLambda, and the runtime to Python.
  4. Change the handler value to TextGeneration.lambda_handler, and choose Save.
  5. Double-click the Layer resource to edit its properties. Rename the layer Boto3Layer and change its build method to Python. Change its Source path to src/Boto3PillowPyshorteners.zip.
  6. Finally, connect the layer to the function to add a reference between them. Your canvas looks like this:
Your App Composer canvas

Your App Composer canvas

The template.yaml file is now updated to include those resources. In the source directory, you can see some generated function files. You will replace them with the tutorial function and layers later.

In the first step, you added some resources and Application Composer generated IaC that includes best practices defaults. Next, you will use standard CloudFormation components.

Using AI for standard components

Start by using the search bar to search for and add several of the Standard components needed for your application.

Search for and add Standard components

Search for and add Standard components

  1. In the Resources search bar, enter “lambda” and add the resource type AWS::Lambda::Permission to the canvas.
  2. Enter “iam” in the search bar, and add type AWS::IAM::Policy.
  3. Add two resources of the type AWS::IAM::Role.

Your application now look like this:

Updated canvas

Updated canvas

Some standard resources have all the defaults you need. For example, when you add the AWS::Lambda::Permission resource, replace the placeholder values with:

FunctionName: !Ref LexGenAIBotLambda
Action: lambda:InvokeFunction
Principal: lexv2.amazonaws.com

Other resources, such as the IAM roles and IAM policy, have a vanilla configuration. This is where you can use the AI assistant. Select an IAM Role resource and choose Generate suggestions to see what the generative AI suggests.

Generate suggestions

Generate suggestions

Because these suggestions are generated by a Large Language Model (LLM), they may differ between each generation. These are checked against the CloudFormation schema, ensuring validity and providing a range of configurations for your needs.

Generating different configurations gives you an idea of what a resource’s policy should look like, and often gives you keys that you can then fill in with the values you need. Use the following settings for each resource, replacing the generated values where applicable.

  1. Double-click the “Permission” resource to edit its settings. Change its Logical ID to LexGenAIBotLambdaInvoke and replace its Resource configuration with the following, then choose Save:
  2. Action: lambda:InvokeFunction
    FunctionName: !GetAtt LexGenAIBotLambda.Arn
    Principal: lexv2.amazonaws.com
  3. Double-click the “Role” resource to edit its settings. Change its Logical ID to CfnLexGenAIDemoRole and replace its Resource configuration with the following, then choose Save:
  4. AssumeRolePolicyDocument:
      Statement:
        - Action: sts:AssumeRole
          Effect: Allow
          Principal:
            Service: lexv2.amazonaws.com
      Version: '2012-10-17'
    ManagedPolicyArns:
      - !Join
        - ''
        - - 'arn:'
          - !Ref AWS::Partition
          - ':iam::aws:policy/AWSLambdaExecute'
  5. Double-click the “Role2” resource to edit its settings. Change its Logical ID to LexGenAIBotLambdaServiceRole and replace its Resource configuration with the following, then choose Save:
  6. AssumeRolePolicyDocument:
      Statement:
        - Action: sts:AssumeRole
          Effect: Allow
          Principal:
            Service: lambda.amazonaws.com
      Version: '2012-10-17'
    ManagedPolicyArns:
      - !Join
        - ''
        - - 'arn:'
          - !Ref AWS::Partition
          - ':iam::aws:policy/service-role/AWSLambdaBasicExecutionRole'
  7. Double-click the “Policy” resource to edit its settings. Change its Logical ID to LexGenAIBotLambdaServiceRoleDefaultPolicy and replace its Resource configuration with the following, then choose Save:
PolicyDocument:
  Statement:
    - Action:
        - lex:*
        - logs:*
        - s3:DeleteObject
        - s3:GetObject
        - s3:ListBucket
        - s3:PutObject
      Effect: Allow
      Resource: '*'
    - Action: bedrock:InvokeModel
      Effect: Allow
      Resource: !Join
        - ''
        - - 'arn:aws:bedrock:'
          - !Ref AWS::Region
          - '::foundation-model/anthropic.claude-v2'
  Version: '2012-10-17'
PolicyName: LexGenAIBotLambdaServiceRoleDefaultPolicy
Roles:
  - !Ref LexGenAIBotLambdaServiceRole

Once you have updated the properties of each resource, you see the connections and groupings automatically made between them:

Connections and automatic groupings

Connections and automatic groupings

To add the Amazon Lex bot:

  1. In the resource picker, search for and add the type AWS::Lex::Bot. Here’s another chance to see what configuration the AI suggests.
  2. Change the Amazon Lex bot’s logical ID to LexGenAIBot update its configuration to the following:
  3. DataPrivacy:
      ChildDirected: false
    IdleSessionTTLInSeconds: 300
    Name: LexGenAIBot
    RoleArn: !GetAtt CfnLexGenAIDemoRole.Arn
    AutoBuildBotLocales: true
    BotLocales:
      - Intents:
          - InitialResponseSetting:
              CodeHook:
                EnableCodeHookInvocation: true
                IsActive: true
                PostCodeHookSpecification: {}
            IntentClosingSetting:
              ClosingResponse:
                MessageGroupsList:
                  - Message:
                      PlainTextMessage:
                        Value: Hi there, I'm a GenAI Bot. How can I help you?
            Name: WelcomeIntent
            SampleUtterances:
              - Utterance: Hi
              - Utterance: Hey there
              - Utterance: Hello
              - Utterance: I need some help
              - Utterance: Help needed
              - Utterance: Can I get some help?
          - FulfillmentCodeHook:
              Enabled: true
              IsActive: true
              PostFulfillmentStatusSpecification: {}
            InitialResponseSetting:
              CodeHook:
                EnableCodeHookInvocation: true
                IsActive: true
                PostCodeHookSpecification: {}
            Name: GenerateTextIntent
            SampleUtterances:
              - Utterance: Generate content for
              - Utterance: 'Create text '
              - Utterance: 'Create a response for '
              - Utterance: Text to be generated for
          - FulfillmentCodeHook:
              Enabled: true
              IsActive: true
              PostFulfillmentStatusSpecification: {}
            InitialResponseSetting:
              CodeHook:
                EnableCodeHookInvocation: true
                IsActive: true
                PostCodeHookSpecification: {}
            Name: FallbackIntent
            ParentIntentSignature: AMAZON.FallbackIntent
        LocaleId: en_US
        NluConfidenceThreshold: 0.4
    Description: Bot created demonstration of GenAI capabilities.
    TestBotAliasSettings:
      BotAliasLocaleSettings:
        - BotAliasLocaleSetting:
            CodeHookSpecification:
              LambdaCodeHook:
                CodeHookInterfaceVersion: '1.0'
                LambdaArn: !GetAtt LexGenAIBotLambda.Arn
            Enabled: true
          LocaleId: en_US
  4. Choose Save on the resource.

Once all of your resources are configured, your application looks like this:

New AI generated canvas

New AI generated canvas

Adding function code and deployment

Once your architecture is defined, review and refine your template.yaml file. For a detailed reference and to ensure all your values are correct, visit the GitHub repository and check against the template.yaml file.

  1. Copy the Lambda layer directly from the repository, and add it to ./src/Boto3PillowPyshorteners.zip.
  2. In the .src/ directory, rename the generated handler.py to TextGeneration.py. You can also delete any unnecessary files.
  3. Open TextGeneration.py and replace the placeholder code with the following:
  4. import json
    import boto3
    import os
    import logging
    from botocore.exceptions import ClientError
    
    LOG = logging.getLogger()
    LOG.setLevel(logging.INFO)
    
    region_name = os.getenv("region", "us-east-1")
    s3_bucket = os.getenv("bucket")
    model_id = os.getenv("model_id", "anthropic.claude-v2")
    
    # Bedrock client used to interact with APIs around models
    bedrock = boto3.client(service_name="bedrock", region_name=region_name)
    
    # Bedrock Runtime client used to invoke and question the models
    bedrock_runtime = boto3.client(service_name="bedrock-runtime", region_name=region_name)
    
    
    def get_session_attributes(intent_request):
        session_state = intent_request["sessionState"]
        if "sessionAttributes" in session_state:
            return session_state["sessionAttributes"]
    
        return {}
    
    def close(intent_request, session_attributes, fulfillment_state, message):
        intent_request["sessionState"]["intent"]["state"] = fulfillment_state
        return {
            "sessionState": {
                "sessionAttributes": session_attributes,
                "dialogAction": {"type": "Close"},
                "intent": intent_request["sessionState"]["intent"],
            },
            "messages": [message],
            "sessionId": intent_request["sessionId"],
            "requestAttributes": intent_request["requestAttributes"]
            if "requestAttributes" in intent_request
            else None,
        }
    
    def lambda_handler(event, context):
        LOG.info(f"Event is {event}")
        accept = "application/json"
        content_type = "application/json"
        prompt = event["inputTranscript"]
    
        try:
            request = json.dumps(
                {
                    "prompt": "\n\nHuman:" + prompt + "\n\nAssistant:",
                    "max_tokens_to_sample": 4096,
                    "temperature": 0.5,
                    "top_k": 250,
                    "top_p": 1,
                    "stop_sequences": ["\\n\\nHuman:"],
                }
            )
    
            response = bedrock_runtime.invoke_model(
                body=request,
                modelId=model_id,
                accept=accept,
                contentType=content_type,
            )
    
            response_body = json.loads(response.get("body").read())
            LOG.info(f"Response body: {response_body}")
            response_message = {
                "contentType": "PlainText",
                "content": response_body["completion"],
            }
            session_attributes = get_session_attributes(event)
            fulfillment_state = "Fulfilled"
    
            return close(event, session_attributes, fulfillment_state, response_message)
    
        except ClientError as e:
            LOG.error(f"Exception raised while execution and the error is {e}")
  5. To deploy the infrastructure, go back to the App Composer extension, and choose the Sync icon. Follow the guided AWS SAM instructions to complete the deployment.
App Composer Sync

App Composer Sync

After the message SAM Sync succeeded, navigate to CloudFormation in the AWS Management Console to see the newly created resources. To continue building the chatbot, follow the rest of the original tutorial.

Conclusion

This guide demonstrates how AI-generated CloudFormation can streamline your workflow in Application Composer, enhance your understanding of resource configurations, and speed up the development process. As always, adhere to the AWS Responsible AI Policy when using these features.

Serverless ICYMI Q4 2023

Post Syndicated from Eric Johnson original https://aws.amazon.com/blogs/compute/serverless-icymi-q4-2023/

Welcome to the 24th edition of the AWS Serverless ICYMI (in case you missed it) quarterly recap. Every quarter, we share all the most recent product launches, feature enhancements, blog posts, webinars, live streams, and other interesting things that you might have missed!

In case you missed our last ICYMI, check out what happened last quarter here.

2023 Q4 Calendar

2023 Q4 Calendar

ServerlessVideo

ServerlessVideo at re:Invent 2024

ServerlessVideo at re:Invent 2024

ServerlessVideo is a demo application built by the AWS Serverless Developer Advocacy team to stream live videos and also perform advanced post-video processing. It uses several AWS services including AWS Step Functions, Amazon EventBridge, AWS Lambda, Amazon ECS, and Amazon Bedrock in a serverless architecture that makes it fast, flexible, and cost-effective. Key features include an event-driven core with loosely coupled microservices that respond to events routed by EventBridge. Step Functions orchestrates using both Lambda and ECS for video processing to balance speed, scale, and cost. There is a flexible plugin-based architecture using Step Functions and EventBridge to integrate and manage multiple video processing workflows, which include GenAI.

ServerlessVideo allows broadcasters to stream video to thousands of viewers using Amazon IVS. When a broadcast ends, a Step Functions workflow triggers a set of configured plugins to process the video, generating transcriptions, validating content, and more. The application incorporates various microservices to support live streaming, on-demand playback, transcoding, transcription, and events. Learn more about the project and watch videos from reinvent 2023 at video.serverlessland.com.

AWS Lambda

AWS Lambda enabled outbound IPv6 connections from VPC-connected Lambda functions, providing virtually unlimited scale by removing IPv4 address constraints.

The AWS Lambda and AWS SAM teams also added support for sharing test events across teams using AWS SAM CLI to improve collaboration when testing locally.

AWS Lambda introduced integration with AWS Application Composer, allowing users to view and export Lambda function configuration details for infrastructure as code (IaC) workflows.

AWS added advanced logging controls enabling adjustable JSON-formatted logs, custom log levels, and configurable CloudWatch log destinations for easier debugging. AWS enabled monitoring of errors and timeouts occurring during initialization and restore phases in CloudWatch Logs as well, making troubleshooting easier.

For Kafka event sources, AWS enabled failed event destinations to prevent functions stalling on failing batches by rerouting events to SQS, SNS, or S3. AWS also enhanced Lambda auto scaling for Kafka event sources in November to reach maximum throughput faster, reducing latency for workloads prone to large bursts of messages.

AWS launched support for Python 3.12 and Java 21 Lambda runtimes, providing updated libraries, smaller deployment sizes, and better AWS service integration. AWS also introduced a simplified console workflow to automate complex network configuration when connecting functions to Amazon RDS and RDS Proxy.

Additionally in December, AWS enabled faster individual Lambda function scaling allowing each function to rapidly absorb traffic spikes by scaling up to 1000 concurrent executions every 10 seconds.

Amazon ECS and AWS Fargate

In Q4 of 2023, AWS introduced several new capabilities across its serverless container services including Amazon ECS, AWS Fargate, AWS App Runner, and more. These features help improve application resilience, security, developer experience, and migration to modern containerized architectures.

In October, Amazon ECS enhanced its task scheduling to start healthy replacement tasks before terminating unhealthy ones during traffic spikes. This prevents going under capacity due to premature shutdowns. Additionally, App Runner launched support for IPv6 traffic via dual-stack endpoints to remove the need for address translation.

In November, AWS Fargate enabled ECS tasks to selectively use SOCI lazy loading for only large container images in a task instead of requiring it for all images. Amazon ECS also added idempotency support for task launches to prevent duplicate instances on retries. Amazon GuardDuty expanded threat detection to Amazon ECS and Fargate workloads which users can easily enable.

Also in November, the open source Finch container tool for macOS became generally available. Finch allows developers to build, run, and publish Linux containers locally. A new website provides tutorials and resources to help developers get started.

Finally in December, AWS Migration Hub Orchestrator added new capabilities for replatforming applications to Amazon ECS using guided workflows. App Runner also improved integration with Route 53 domains to automatically configure required records when associating custom domains.

AWS Step Functions

In Q4 2023, AWS Step Functions announced the redrive capability for Standard Workflows. This feature allows failed workflow executions to be redriven from the point of failure, skipping unnecessary steps and reducing costs. The redrive functionality provides an efficient way to handle errors that require longer investigation or external actions before resuming the workflow.

Step Functions also launched support for HTTPS endpoints in AWS Step Functions, enabling easier integration with external APIs and SaaS applications without needing custom code. Developers can now connect to third-party HTTP services directly within workflows. Additionally, AWS released a new test state capability that allows testing individual workflow states before full deployment. This feature helps accelerate development by making it faster and simpler to validate data mappings and permissions configurations.

AWS announced optimized integrations between AWS Step Functions and Amazon Bedrock for orchestrating generative AI workloads. Two new API actions were added specifically for invoking Bedrock models and training jobs from workflows. These integrations simplify building prompt chaining and other techniques to create complex AI applications with foundation models.

Finally, the Step Functions Workflow Studio is now integrated in the AWS Application Composer. This unified builder allows developers to design workflows and define application resources across the full project lifecycle within a single interface.

Amazon EventBridge

Amazon EventBridge announced support for new partner integrations with Adobe and Stripe. These integrations enable routing events from the Adobe and Stripe platforms to over 20 AWS services. This makes it easier to build event-driven architectures to handle common use cases.

Amazon SNS

In Q4, Amazon SNS added native in-place message archiving for FIFO topics to improve event stream durability by allowing retention policies and selective replay of messages without provisioning separate resources. Additional message filtering operators were also introduced including suffix matching, case-insensitive equality checks, and OR logic for matching across properties to simplify routing logic implementation for publishers and subscribers. Finally, delivery status logging was enabled through AWS CloudFormation.

Amazon SQS

Amazon SQS has introduced several major new capabilities and updates. These improve visibility, throughput, and message handling for users. Specifically, Amazon SQS enabled AWS CloudTrail logging of key SQS APIs. This gives customers greater visibility into SQS activity. Additionally, SQS increased the throughput quota for the high throughput mode of FIFO queues. This was significantly increased in certain Regions. It also boosted throughput in Asia Pacific Regions. Furthermore, Amazon SQS added dead letter queue redrive support. This allows you to redrive messages that failed and were sent to a dead letter queue (DLQ).

Serverless at AWS re:Invent

Serverless videos from re:Invent

Serverless videos from re:Invent

Visit the Serverless Land YouTube channel to find a list of serverless and serverless container sessions from reinvent 2023. Hear from experts like Chris Munns and Julian Wood in their popular session, Best practices for serverless developers, or Nathan Peck and Jessica Deen in Deploying multi-tenant SaaS applications on Amazon ECS and AWS Fargate.

EDA Day Nashville

EDA Day Nashville

EDA Day Nashville

The AWS Serverless Developer Advocacy team hosted an event-driven architecture (EDA) day conference on October 26, 2022 in Nashville, Tennessee. This inaugural GOTO EDA day convened over 200 attendees ranging from prominent EDA community members to AWS speakers and product managers. Attendees engaged in 13 sessions, two workshops, and panels covering EDA adoption best practices. The event built upon 2022 content by incorporating additional topics like messaging, containers, and machine learning. It also created opportunities for students and underrepresented groups in tech to participate. The full-day conference facilitated education, inspiration, and thoughtful discussion around event-driven architectural patterns and services on AWS.

Videos from EDA Day are now available on the Serverless Land YouTube channel.

Serverless blog posts

October

November

December

Serverless container blog posts

October

November

December

Serverless Office Hours

Serverless office hours: Q4 videos

October

November

December

Containers from the Couch

Containers from the Couch

October

November

December

FooBar

FooBar

October

November

December

Still looking for more?

The Serverless landing page has more information. The Lambda resources page contains case studies, webinars, whitepapers, customer stories, reference architectures, and even more Getting Started tutorials.

You can also follow the Serverless Developer Advocacy team on Twitter to see the latest news, follow conversations, and interact with the team.

And finally, visit the Serverless Land and Containers on AWS websites for all your serverless and serverless container needs.

Introducing Amazon MQ cross-Region data replication for ActiveMQ brokers

Post Syndicated from Pascal Vogel original https://aws.amazon.com/blogs/compute/introducing-amazon-mq-cross-region-data-replication-for-activemq-brokers/

This post is written by Dominic Gagné, Senior Software Development Engineer, and Vinodh Kannan Sadayamuthu, Senior Solutions Architect

Amazon MQ now supports cross-Region data replication for ActiveMQ brokers. This feature enables you to build regionally resilient messaging applications and makes it easier to set up cross-Region message replication between ActiveMQ brokers in Amazon MQ. This blog post explains how cross-Region data replication works in Amazon MQ, how to setup cross-Region replica brokers for ActiveMQ, and how to test promoting a replica broker.

Amazon MQ is a managed message broker service for Apache ActiveMQ and RabbitMQ that simplifies setting up and operating message brokers on AWS.

Cross-Region replication improves the resilience and disaster recovery capabilities of your systems. This new Amazon MQ feature makes it easier to increase resilience of your ActiveMQ messaging systems across AWS Regions.

How cross-Region data replication works in Amazon MQ for ActiveMQ

The Amazon MQ for ActiveMQ cross-Region data replication feature replicates broker state from the primary broker in one AWS Region to the replica broker in another Region. Broker state consists of messages that have been sent to a broker by a message producer. Additionally, message acknowledgments and transactions are replicated. Scheduled messages and broker XML configuration are not replicated from the primary to the replica broker.

State replication occurs asynchronously and runs in the background. When a message is sent to a cross-Region data replication enabled broker, the data is persisted both to the primary data store and also on a queue used to replicate data. The replica broker acts as a client of this queue and consumes data that represents broker state from the primary broker.

At any given moment, only the primary broker is available for client connections. The replica broker is a hot standby and passively replicates the primary broker’s state. However, it does not accept client connections. The following diagram shows a simplified version of a cross-Region data replication broker pair. All replication traffic is encrypted using TLS and remains within AWS’ private backbone.

Amazon MQ for ActiveMQ cross-region data replication architecture

Configuring cross-Region replica brokers for Amazon MQ for ActiveMQ

To set up a cross-Region replica broker, your Amazon MQ for ActiveMQ primary broker must meet the following eligibility criteria:

  • ActiveMQ version 5.17.6 or above
  • Instance size m5.large or higher
  • Active/standby broker deployment enabled
  • Be in the Running state

If you do not have an ActiveMQ broker that meets these criteria, see Creating and configuring an ActiveMQ broker for instructions on how to create a primary broker.

To configure cross-Region replication

  1. Navigate to the Amazon MQ console and choose Create replica broker.
    Amazon MQ console create replica broker
  2. Select a primary broker from the list of eligible primary brokers and choose Next.
    Amazon MQ console choose primary broker
  3. Under Replica broker details, select the Region for your replica broker and enter a Replica broker name.
    Amazon MQ console configure replica broker
  4. In the ActiveMQ console user for replica broker panel, enter a Username and Password for broker access.
    Amazon MQ console user for replica broker
  5. In the Data replication user to bridge access between brokers panel, enter a replication user Username and Password.
    Amazon MQ console user for replica broker
  6. In the Additional settings panel, keep the defaults and choose Next.
  7. Review the settings and choose Create replica broker.
    Note: The broker access type is automatically set based on the primary broker access type.
    Amazon MQ console create replica broker setting summary
  8. The creation process takes up to 25 minutes. Once the replica broker creation is complete, begin replication between the primary and the replica brokers by rebooting the primary broker.
  9. Once the primary broker is rebooted and its status is Running, you can see the replica details in the Data replication panel of the primary broker.
    Amazon MQ console broker replication details

Both brokers now synchronize with each other to establish an inter-Region network and connection through which broker state is replicated. Once both brokers are in the Running state, the primary broker accepts client connections and passes all broker state changes (messages, acknowledgments, transactions, etc.) to the replica broker.

The replica broker now asynchronously mirrors the state of the primary broker. However, it does not become available for client connections until it is promoted via a switchover or a failover. These operations are covered in the following section.

Testing data replication and promoting the replica broker

There are two ways to promote a replica broker: initiating a switchover or a failover.

Switchover Failover
  • Prioritizes consistency over availability.
  • Prioritizes availability over consistency.
  • Brokers are guaranteed to have identical states.
  • Brokers are not guaranteed to be in identical states.
  • Brokers may not be available immediately to serve client traffic.
  • Replica broker is immediately available to serve client traffic.

To initiate a failover or switchover

    1. Navigate to the Amazon MQ console, choose your primary broker, and log in to the ActiveMQ Web Console using the URLs located in the Connections panel.
    2. In the top menu, select Queues. You should be able to see four ActiveMQ.Plugin.Replication queues used by the replication feature.
      Active MQ console queues
    3. To test message replication from the primary to a replica broker, create a queue and send messages. To create the queue:
      • For Queue Name, enter TestQueue.
      • Choose Create.

      ActiveMQ console create queue

    4. Under Operations for the TestQueue, choose Send To and perform the following steps:
      • For Number of messages to send, enter 10 and keep the other defaults.
      • Under Message body, enter a test message.
      • Choose Send.

      ActiveMQ console send test message

    5. To promote the replica broker, navigate to the Amazon MQ console and change the Region to the AWS Region where the replica broker is located.
    6. Select the replica broker (in this example called Secondarybroker) and choose Promote replica.
      Amazon MQ console promote broker
    7. In the Promote replica broker pop-up window:
      • Select Failover or Switchover.
      • Enter confirm in text box.
      • Choose Confirm.

      Amazon MQ console confirm broker promotion

    8. While a replica broker is being promoted, its replication status changes to Promotion in progress. The corresponding primary broker’s replication status changes to Demotion in progress.

Replica Secondarybroker status – Promotion in progress:

Replica Secondarybroker status - Promotion in progress

Primary broker status – Demotion in progress:

Primary broker status - Demotion in progress

Secondarybroker status – Promoted to new primary broker:

Secondarybroker status – Promoted to new primary broker

  1. Once the Secondarybroker status is Running, log in to the ActiveMQ Web Console from the URLs located in the Connections panel. You can see the replicated messages sent from the former primary broker in Step 4 in the TestQueue:
    Replicated message from primary broker in TestQueue

Monitoring cross-Region data replication

To monitor cross-Region data replication progress, you can use the Amazon CloudWatch metrics TotalReplicationLag and ReplicationLag.

Amazon CloudWatch metrics TotalReplicationLag and ReplicationLag

You can use these two metrics to monitor the progress of a switchover. When their value reaches zero, the switchover will complete because the broker states have been synchronized and the replica broker begins accepting client connections. If the switchover does not progress fast enough, or if you need the replica broker to be immediately available to serve client traffic, you can request a failover at any time.

Note: A failover can interrupt an ongoing switchover. However, a switchover cannot interrupt an ongoing failover.

Issuing a failover request causes the replica broker to become immediately available, but does not provide any guarantees about what data has been replicated to the replica broker. This means that a failover can make data tracking and reconciliation more challenging for your client application than a switchover.

For this reason, we recommend that you always start with a switchover and interrupt it with a failover if necessary. To interrupt an ongoing switchover, follow the same steps as for promoting a replica broker, select the failover option, and confirm.

Note: If you fail back to the original primary broker, messages that are not replicated from the primary to the replica broker during the failover will still exist on the primary broker. Therefore, consumers must manage these messages. We recommend tracking the processed message IDs in a data store such as Amazon DynamoDB global tables and comparing the message to the processed message IDs.

If you no longer need to replicate broker data across Regions or if you need to delete a primary or replica broker, you must unpair the replica broker and reboot the primary broker. You can unpair the replica broker in the Amazon MQ console by following Delete a CRDR broker.

To unpair the broker using the AWS Command Line Interface (AWS CLI), run the following command, replacing the --broker-id with your primary broker ID:

aws mq update-broker --broker-id <primary broker ID> \
--data-replication-mode "NONE" \
--region us-east-1

Conclusion

Using the cross-Region data replication feature for Amazon MQ for ActiveMQ provides a straightforward way to implement cross-Region replication to improve the resilience of your architecture and meet your business continuity and disaster recovery requirements. This post explains how cross-Region data replication works in Amazon MQ, how to set up a cross-Region replica broker, and how to test and promote the replica broker.

For more details, see the Amazon MQ documentation.

For more serverless learning resources, visit Serverless Land.

Python 3.12 runtime now available in AWS Lambda

Post Syndicated from James Beswick original https://aws.amazon.com/blogs/compute/python-3-12-runtime-now-available-in-aws-lambda/

This post is written by Jeff Gebhart, Sr. Specialist TAM, Serverless.

AWS Lambda now supports Python 3.12 as both a managed runtime and container base image. Python 3.12 builds on the performance enhancements that were first released with Python 3.11, and adds a number of performance and language readability features in the interpreter. With this release, Python developers can now take advantage of these new features and enhancements when creating serverless applications on AWS Lambda.

You can use Python 3.12 with Powertools for AWS Lambda (Python), a developer toolkit to implement Serverless best practices such as observability, batch processing, Parameter Store integration, idempotency, feature flags, CloudWatch Metrics, and structured logging among other features.

You can also use Python 3.12 with Lambda@Edge, allowing you to customize low-latency content delivered through Amazon CloudFront.

Python is a popular language for building serverless applications. The Python 3.12 release has a number of interpreter and syntactic improvements.

At launch, new Lambda runtimes receive less usage than existing, established runtimes. This can result in longer cold start times due to reduced cache residency within internal Lambda sub-systems. Cold start times typically improve in the weeks following launch as usage increases. As a result, AWS recommends not drawing conclusions from side-by-side performance comparisons with other Lambda runtimes until the performance has stabilized. Since performance is highly dependent on workload, customers with performance-sensitive workloads should conduct their own testing, instead of relying on generic test benchmarks.

Lambda runtime changes

Amazon Linux 2023

The Python 3.12 runtime is based on the provided.al2023 runtime, which is based on the Amazon Linux 2023 minimal container image. This OS update brings several improvements over the Amazon Linux 2 (AL2)-based OS used for Lambda Python runtimes from Python 3.8 to Python 3.11.

provided.al2023 contains only the essential components necessary to install other packages and offers a smaller deployment footprint of less than 40MB compared to over 100MB for Lambda’s AL2-based images.

With glibc version 2.34, customers have access to a modern version of glibc, updated from version 2.26 in AL2-based images.

The Amazon Linux 2023 minimal image uses microdnf as a package manager, symlinked as dnf. This replaces the yum package manager used in earlier AL2-based images. If you deploy your Lambda functions as container images, you must update your Dockerfiles to use dnf instead of yum when upgrading to the Python 3.12 base image.

Additionally, curl and gnupg2 are also included as their minimal versions curl-minimal and gnupg2-minimal.

Learn more about the provided.al2023 runtime in the blog post Introducing the Amazon Linux 2023 runtime for AWS Lambda and the Amazon Linux 2023 launch blog post.

Response format change

Starting with the Python 3.12 runtime, functions return Unicode characters as part of their JSON response. Previous versions return escaped sequences for Unicode characters in responses.

For example, in Python 3.11, if you return a Unicode string such as “こんにちは”, it escapes the Unicode characters and returns “\u3053\u3093\u306b\u3061\u306f”. The Python 3.12 runtime returns the original “こんにちは”.

This change reduces the size of the payload returned by Lambda. In the previous example, the escaped version is 32 bytes compared to 17 bytes with the Unicode string. Using Unicode responses reduces the size of Lambda responses, making it easier to fit larger responses into the 6MB Lambda response (synchronous) limit.

When upgrading to Python 3.12, you may need to adjust your code in other modules to account for this new behavior. If the caller expects escaped Unicode based on the previous runtime behavior, you must either add code to the returning function to escape the Unicode manually, or adjust the caller to handle the Unicode return.

Extensions processing for graceful shutdown

Lambda functions with external extensions can now benefit from improved graceful shutdown capabilities. When the Lambda service is about to shut down the runtime, it sends a SIGTERM signal to the runtime and then a SHUTDOWN event to each registered external extension.

These events are sent each time an execution environment shuts down. This allows you to catch the SIGTERM signal in your Lambda function and clean up resources, such as database connections, which were created by the function.

To learn more about the Lambda execution environment lifecycle, see Lambda execution environment. More details and examples of how to use graceful shutdown with extensions is available in the AWS Samples GitHub repository.

New Python features

Comprehension inlining

With the implementation of PEP 709, dictionary, list, and set comprehensions are now inlined. Prior versions create a single-use function to execute such comprehensions. Removing this overhead results in faster comprehension execution by a factor of two.

There are some behavior changes to comprehensions because of this update. For example, a call to the ‘locals()’ function from within the comprehension now includes objects from the containing scope, not just within the comprehension itself as in prior versions. You should test functions you are migrating from an earlier version of Python to Python 3.12.

Typing changes

Python 3.12 continues the evolution of including type annotations to Python. PEP 695 includes a new, more compact syntax for generic classes and functions, and adds a new “type” statement to allow for type alias creation. Type aliases are evaluated on demand. This permits aliases to refer to other types defined later.

Type parameters are visible within the scope of the declaration and any nested scopes, but not in the outer scope.

Formalization of f-strings

One of the largest changes in Python 3.12, the formalization of f-strings syntax, is covered under PEP 701. Any valid expression can now be contained within an f-string, including other f-strings.

In prior versions of Python, reusing quotes within an f-string results in errors. With Python 3.12, quote reuse is fully supported in nested f-strings such as the following example:

>>>songs = ['Take me back to Eden', 'Alkaline', 'Ascensionism']

>>>f"This is the playlist: {", ".join(songs)}"

'This is the playlist: Take me back to Eden, Alkaline, Ascensionism'

Additionally, any valid Python expression can be contained within an f-string. This includes multi-line expressions and the ability to embed comments within an f-string.

Before Python 3.12, the “\” character is not permitted within an f-string. This prevented use of “\N” syntax for defining escaped Unicode characters within the body of an f-string.

Asyncio improvements

There are a number of improvements to the asyncio module. These include performance improvements to writing of sockets and a new implementation of asyncio.current_task() that can yield a 4–6 times performance improvement. Event loops now optimize their child watchers for their underlying environment.

Using Python 3.12 in Lambda

AWS Management Console

To use the Python 3.12 runtime to develop your Lambda functions, specify a runtime parameter value Python 3.12 when creating or updating a function. The Python 3.12 version is now available in the Runtime dropdown in the Create Function page:

To update an existing Lambda function to Python 3.12, navigate to the function in the Lambda console and choose Edit in the Runtime settings panel. The new version of Python is available in the Runtime dropdown:

AWS Lambda container image

Change the Python base image version by modifying the FROM statement in your Dockerfile:

FROM public.ecr.aws/lambda/python:3.12
# Copy function code
COPY lambda_handler.py ${LAMBDA_TASK_ROOT}

Customers running the Python 3.12 Docker images locally, including customers using AWS SAM, must upgrade their Docker install to version 20.10.10 or later.

AWS Serverless Application Model (AWS SAM)

In AWS SAM set the Runtime attribute to python3.12 to use this version.

AWSTemplateFormatVersion: '2010-09-09'
Transform: AWS::Serverless-2016-10-31
Description: Simple Lambda Function
  MyFunction:
    Type: AWS::Serverless::Function
    Properties:
      Description: My Python Lambda Function
      CodeUri: my_function/
      Handler: lambda_function.lambda_handler
      Runtime: python3.12

AWS SAM supports generating this template with Python 3.12 for new serverless applications using the `sam init` command. Refer to the AWS SAM documentation.

AWS Cloud Development Kit (AWS CDK)

In AWS CDK, set the runtime attribute to Runtime.PYTHON_3_12 to use this version. In Python CDK:

from constructs import Construct 
from aws_cdk import ( App, Stack, aws_lambda as _lambda )

class SampleLambdaStack(Stack):
    def __init__(self, scope: Construct, id: str, **kwargs) -> None:
        super().__init__(scope, id, **kwargs)
        
        base_lambda = _lambda.Function(self, 'SampleLambda', 
                                       handler='lambda_handler.handler', 
                                    runtime=_lambda.Runtime.PYTHON_3_12, 
                                 code=_lambda.Code.from_asset('lambda'))

In TypeScript CDK:

import * as cdk from 'aws-cdk-lib';
import * as lambda from 'aws-cdk-lib/aws-lambda'
import * as path from 'path';
import { Construct } from 'constructs';

export class CdkStack extends cdk.Stack {
  constructor(scope: Construct, id: string, props?: cdk.StackProps) {
    super(scope, id, props);

    // The code that defines your stack goes here

    // The python3.12 enabled Lambda Function
    const lambdaFunction = new lambda.Function(this, 'python311LambdaFunction', {
      runtime: lambda.Runtime.PYTHON_3_12,
      memorySize: 512,
      code: lambda.Code.fromAsset(path.join(__dirname, '/../lambda')),
      handler: 'lambda_handler.handler'
    })
  }
}

Conclusion

Lambda now supports Python 3.12. This release uses the Amazon Linux 2023 OS, supports Unicode responses, and graceful shutdown for functions with external extensions, and Python 3.12 language features.

You can build and deploy functions using Python 3.12 using the AWS Management Console, AWS CLI, AWS SDK, AWS SAM, AWS CDK, or your choice of Infrastructure as Code (IaC) tool. You can also use the Python 3.12 container base image if you prefer to build and deploy your functions using container images.

Python 3.12 runtime support helps developers to build more efficient, powerful, and scalable serverless applications. Try the Python 3.12 runtime in Lambda today and experience the benefits of this updated language version.

For more serverless learning resources, visit Serverless Land.

How FanDuel adopted a modern Amazon Redshift architecture to serve critical business workloads

Post Syndicated from Sreenivasa Munagala original https://aws.amazon.com/blogs/big-data/how-fanduel-adopted-a-modern-amazon-redshift-architecture-to-serve-critical-business-workloads/

This post is co-written with Sreenivasa Mungala and Matt Grimm from FanDuel.

In this post, we share how FanDuel moved from a DC2 nodes architecture to a modern Amazon Redshift architecture, which includes Redshift provisioned clusters using RA3 instances, Amazon Redshift data sharing, and Amazon Redshift Serverless.

About FanDuel

Part of Flutter Entertainment, FanDuel Group is a gaming company that offers sportsbooks, daily fantasy sports, horse racing, and online casinos. The company operates sportsbooks in a number of US and Canadian states. Fanduel first carved out a niche in the US through daily fantasy sports, such as their most popular fantasy sport: NFL football.

As FanDuel’s business footprint grew, so too did the complexity of their analytical needs. More and more of FanDuel’s community of analysts and business users looked for comprehensive data solutions that centralized the data across the various arms of their business. Their individual, product-specific, and often on-premises data warehouses soon became obsolete. FanDuel’s data team solved the problem of creating a new massive data store for centralizing the data in one place, with one version of the truth. At the heart of this new Global Data Platform was Amazon Redshift, which fast became the trusted data store from which all analysis was derived. Users could now assess risk, profitability, and cross-sell opportunities not only for piecemeal divisions or products, but also globally for the business as a whole.

FanDuel’s journey on Amazon Redshift

FanDuel’s first Redshift cluster was launched using Dense Compute (DC2) nodes. This was chosen over Dense Storage (DS2) nodes in order to take advantage of the greater compute power for the complex queries in their organization. As FanDuel grew, so did their data workloads. This meant that there was a constant challenge to scale and overcome contention while providing the performance their user community needed for day-to-day decision-making. FanDuel met this challenge initially by continuously adding nodes and experimenting with workload management (WLM), but it became abundantly obvious that they needed to take a more significant step to meet the needs of their users.

In 2021, FanDuel’s workloads almost tripled since they first started using Amazon Redshift in 2018, and they started evaluating Redshift RA3 nodes vs. DC2 nodes to take advantage of the storage and compute separation and deliver better performance at lower costs. FanDuel wanted to make the move primarily to separate storage and compute, and evaluate data sharing in the hopes of bringing different compute to the data to alleviate user contention on their primary cluster. FanDuel decided to launch a new RA3 cluster when they were satisfied that the performance matched that of their existing DC2 architecture, providing them the ability to scale storage and compute independently.

In 2022, FanDuel shifted their focus to using data sharing. Data sharing allows you to share live data securely across Redshift data warehouses for read and write (in preview) purposes. This means that workloads can be isolated to individual clusters, allowing for a more streamlined schema design, WLM configuration, and right-sizing for cost optimization. The following diagram illustrates this architecture.

To achieve a data sharing architecture, the plan was to first spin up consumer clusters for development and testing environments for their data engineers that were moving key legacy code to dbt. FanDuel wanted their engineers to have access to production datasets to test their new models and match the results from their legacy SQL-based code sets. They also wanted to ensure that they had adequate compute to run many jobs concurrently. After they saw the benefits of data sharing, they spun up their first production consumer cluster in the spring of 2022 to handle other analytics use cases. This was sharing most of the schemas and their tables from the main producer cluster.

Benefits of moving to a data sharing architecture

FanDuel saw a lot of benefits from the data sharing architecture, where data engineers had access to real production data to test their jobs without impacting the producer’s performance. Since splitting the workloads through a data sharing architecture, FanDuel has doubled their query concurrency and reduced the query queuing, resulting in a better end-to-end query time. FanDuel received positive feedback on the new environment and soon reaped the rewards of increased engineering velocity and reduced performance issues in production after deployments. Their initial venture into the world of data sharing was definitely considered a success.

Given the successful rollout of their first consumer in a data sharing architecture, they looked for opportunities to meet other users’ needs with new targeted consumers. With the assistance of AWS, FanDuel initiated the development of a comprehensive strategy aimed at safeguarding their extract, load, and transform (ELT) jobs. This approach involved implementing workload isolation and allocating dedicated clusters for these workloads, designated as the producer cluster within the data sharing architecture. Simultaneously, they planned to migrate all other activities onto one or more consumer clusters, apart from the existing cluster utilized by their data engineering team.

They spun up a second consumer in the summer of 2022 with the hopes of moving some of their more resource-intensive analytical processes off the main cluster. In order to empower their analysts over time, they had allowed a pattern in which users other than data engineers could create and share their own objects.

As the calendar flipped from 2022 to 2023, several developments changed the landscape of architecture at FanDuel. For one, FanDuel launched their initial event-based streaming work for their sportsbook data, which allowed them to micro-batch data into Amazon Redshift at a much lower latency than their previous legacy batch approach. This allowed them to generate C-Suite revenue reports at a much earlier SLA, which was a big win for the data team, because this was never achieved before the Super Bowl.

FanDuel introduced a new internal KPI called Query Efficiency, a measure to capture the amount of time users spent waiting for their queries to run. As the workload started increasing exponentially, FanDuel also noticed an increase in this KPI, specifically for risk and trading workloads.

Working with AWS Enterprise Support and the Amazon Redshift service team, FanDuel soon realized that the risk and trading use case was a perfect opportunity to move it to Amazon Redshift Serverless. Redshift Serverless offers scalability across dimensions such a data volume changes, concurrent users and query complexity, enabling you to automatically scale compute up or down to manage demanding and unpredictable workloads. Because billing is only accrued while queries are run, it also means that you no longer need to cover costs for compute you’re not utilizing. Redshift Serverless also manages workload management (WLM) entirely, allowing you to focus only on the query monitoring rules (QMRs) you want and usage limits, further limiting the need for you to manage your data warehouses. This adoption also complimented data sharing, where Redshift Serverless endpoints can read and write (in preview) from provisioned clusters during peak hours, offering flexible compute scalability and workload isolation and avoiding the impact on other mission-critical workloads. Seeing the benefits of what Redshift Serverless offers for their risk and trading workloads, they also moved some of their other workloads like business intelligence (BI) dashboards and risk and trading (RT) to a Redshift Serverless environment.

Benefits of introducing Redshift Serverless in a data sharing architecture

Through a combination of data sharing and a serverless architecture, FanDuel could elastically scale their most critical workloads on demand. Redshift Serverless Automatic WLM allowed users to get started without the need to configure WLM. With the intelligent and automated scaling capabilities of Redshift Serverless, FanDuel could focus on their business objectives without worrying about the data warehouse capacity. This architecture alleviated the constraints of a single predefined Redshift provisioned cluster and reduced the need for FanDuel to manage data warehouse capacity and any WLM configuration.

In terms of cost, Redshift Serverless enabled FanDuel to elegantly handle the most demanding workloads with a pay-as-you-go model, paying only when the data warehouse is in use, along with complete separation of compute and storage.

Having now introduced workload isolation and Redshift Serverless, FanDuel is able to achieve a more granular understanding of each team’s compute requirements without the noise of ELT and contending workloads all in the same environment. This allowed comprehensive analytics workloads to be conducted on consumers with vastly minimized contention while also being serviced with the most cost-efficient configuration possible.

The following diagram illustrates the updated architecture.

Results

FanDuel’s re-architecting efforts for workload isolation with risk and trading (RT) workloads using Redshift data sharing and Redshift Serverless resulted in the most critical business SLAs finishing three times faster, along with an increase in average query efficiency of 55% for overall workloads. These SLA improvements have resulted into an overall saving of tenfold in business cost, and they have been able to deliver business insights to other verticals such as product, commercial, and marketing much faster.

Conclusion

By harnessing the power of Redshift provisioned clusters and serverless endpoints with data sharing, FanDuel has been able to better scale and run analytical workloads without having to manage any data warehouse infrastructure. FanDuel is looking forward to future Amazon partnerships and is excited to embark on a journey of new innovation with Redshift Serverless and continued enhancements such as machine learning optimization and auto scaling.

If you’re new to Amazon Redshift, you can explore demos, other customer stories, and the latest features at Amazon Redshift. If you’re already using Amazon Redshift, reach out to your AWS account team for support, and learn more about what’s new with Amazon Redshift.


About the authors

Sreenivasa Munagala is a Principal Data Architect at FanDuel Group. He defines their Amazon Redshift optimization strategy and works with the data analytics team to provide solutions to their key business problems.

Matt Grimm is a Principal Data Architect at FanDuel Group, moving the company to an event-based, data-driven architecture using the integration of both streaming and batch data, while also supporting their Machine Learning Platform and development teams.

Luke Shearer is a Cloud Support Engineer at Amazon Web Services for the Data Insight Analytics profile, where he is engaged with AWS customers every day and is always working to identify the best solution for each customer.

Dhaval Shah is Senior Customer Success Engineer at AWS and specializes in bringing the most complex and demanding data analytics workloads to Amazon Redshift. He has more then 20 years of experiences in different databases and data warehousing technologies. He is passionate about efficient and scalable data analytics cloud solutions that drive business value for customers.

Ranjan Burman is an Sr. Analytics Specialist Solutions Architect at AWS. He specializes in Amazon Redshift and helps customers build scalable analytical solutions. He has more than 17 years of experience in different database and data warehousing technologies. He is passionate about automating and solving customer problems with cloud solutions.

Sidhanth Muralidhar is a Principal Technical Account Manager at AWS. He works with large enterprise customers who run their workloads on AWS. He is passionate about working with customers and helping them architect workloads for cost, reliability, performance, and operational excellence at scale in their cloud journey. He has a keen interest in data analytics as well.

IDE extension for AWS Application Composer enhances visual modern applications development with AI-generated IaC

Post Syndicated from Donnie Prakoso original https://aws.amazon.com/blogs/aws/ide-extension-for-aws-application-composer-enhances-visual-modern-applications-development-with-ai-generated-iac/

Today, I’m happy to share the integrated development environment (IDE) extension for AWS Application Composer. Now you can use AWS Application Composer directly in your IDE to visually build modern applications and iteratively develop your infrastructure as code templates with Amazon CodeWhisperer.

Announced as preview at AWS re:Invent 2022 and generally available in March 2023, Application Composer is a visual builder that makes it easier for developers to visualize, design, and iterate on an application architecture by dragging, grouping, and connecting AWS services on a visual canvas. Application Composer simplifies building modern applications by providing an easy-to-use visual drag-and-drop interface and generates IaC templates in real time.

AWS Application Composer also lets you work with AWS CloudFormation resources. In September, AWS Application Composer announced support for 1000+ AWS CloudFormation resources. This provides you the flexibility to define configuration for your AWS resources at a granular level.

Building modern applications with modern tools
The IDE extension for AWS Application Composer provides you with the same visual drag-and-drop experience and functionality as what it offers you in the console. Utilizing the visual canvas in your IDE means you can quickly prototype your ideas and focus on your application code.

With Application Composer running in your IDE, you can also use the various tools available in your IDE. For example, you can seamlessly integrate IaC templates generated real-time by Application Composer with AWS Serverless Application Model (AWS SAM) to manage and deploy your serverless applications.

In addition to making Application Composer available in your IDE, you can create generative AI powered code suggestions in the CloudFormation template in real time while visualizing the application architecture in split view. You can pair and synchronize Application Composer’s visualization and CloudFormation template editing side by side in the IDE without context switching between consoles to iterate on their designs. This minimizes hand coding and increase your productivity.

Using AWS Application Composer in Visual Studio Code
First, I need to install the latest AWS Toolkit for Visual Studio Code plugin. If you already have the AWS Toolkit plugin installed, you only need to update the plugin to start using Application Composer.

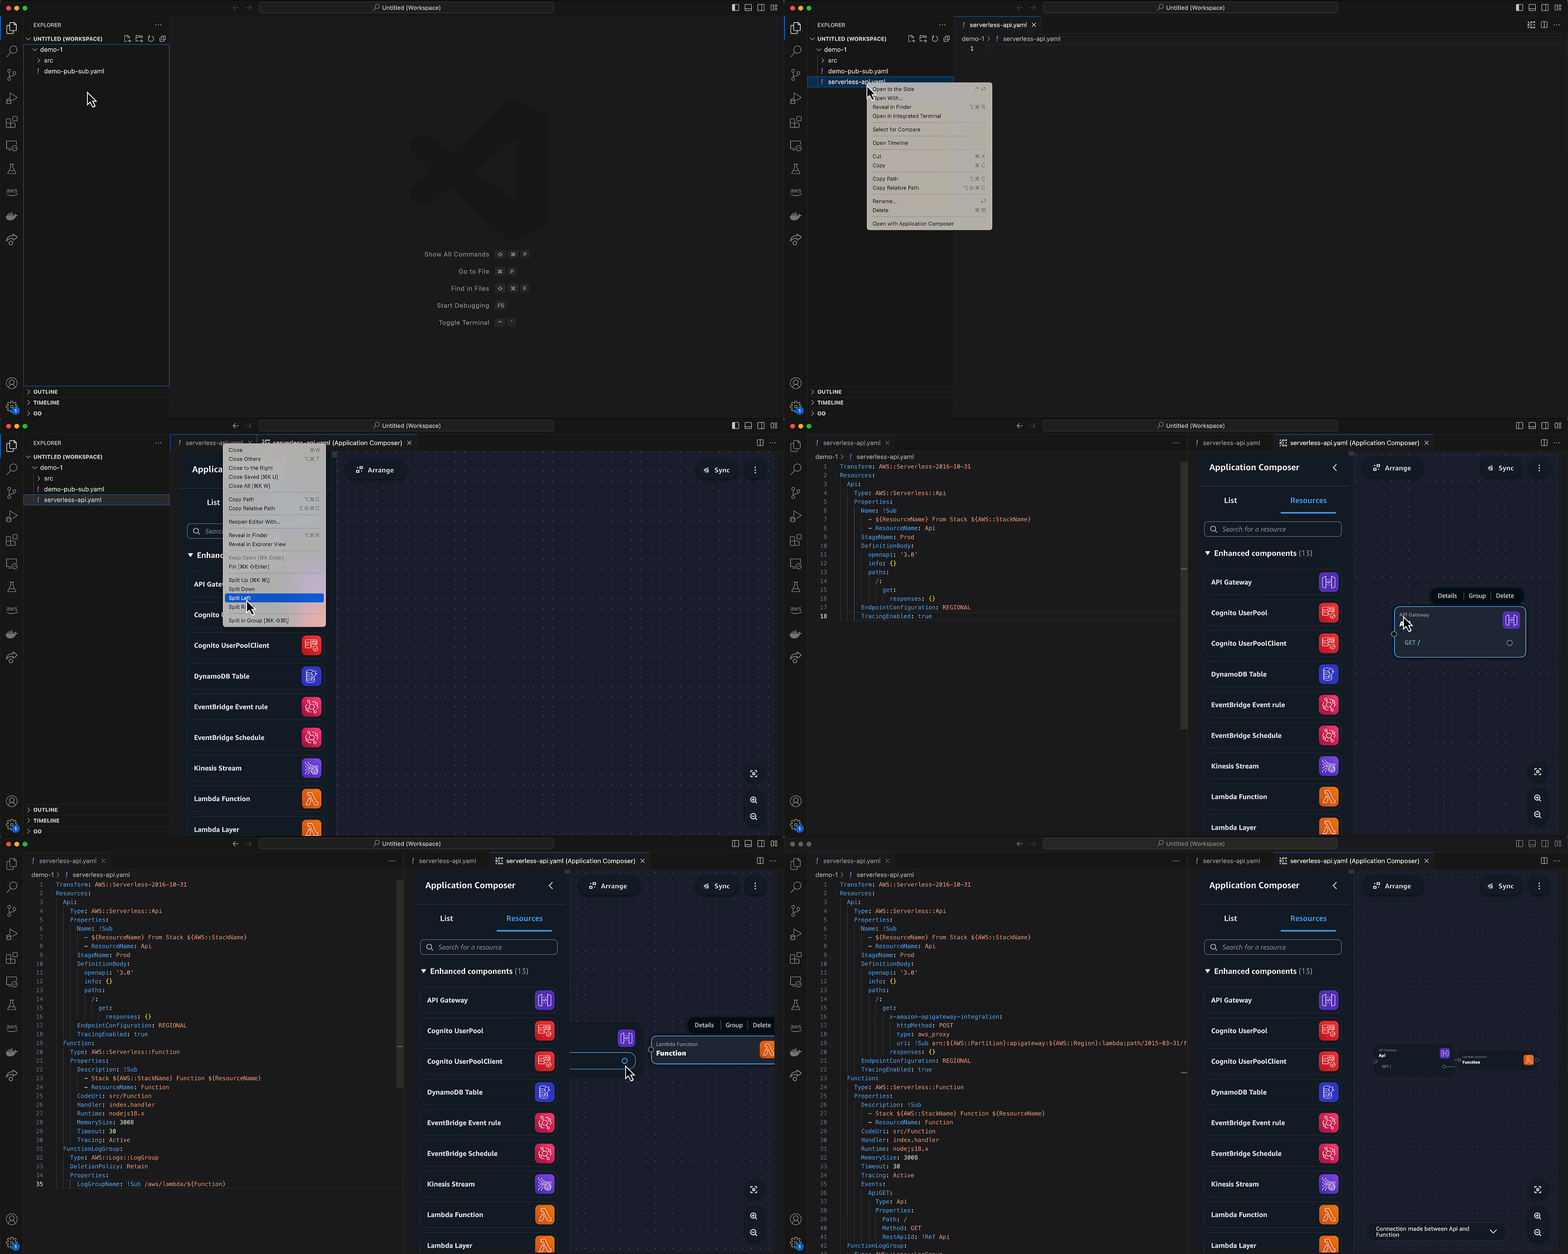
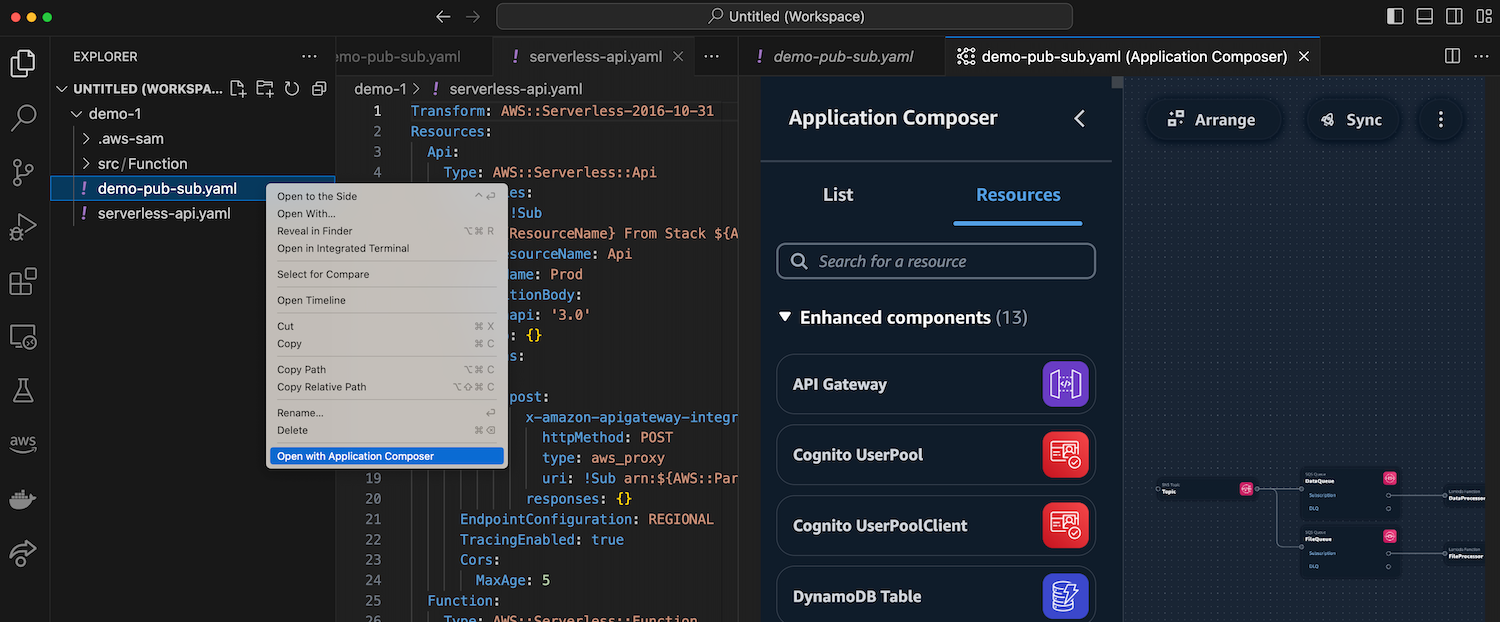
To start using Application Composer, I don’t need to authenticate into my AWS account. With Application Composer available on my IDE, I can open my existing AWS CloudFormation or AWS SAM templates.

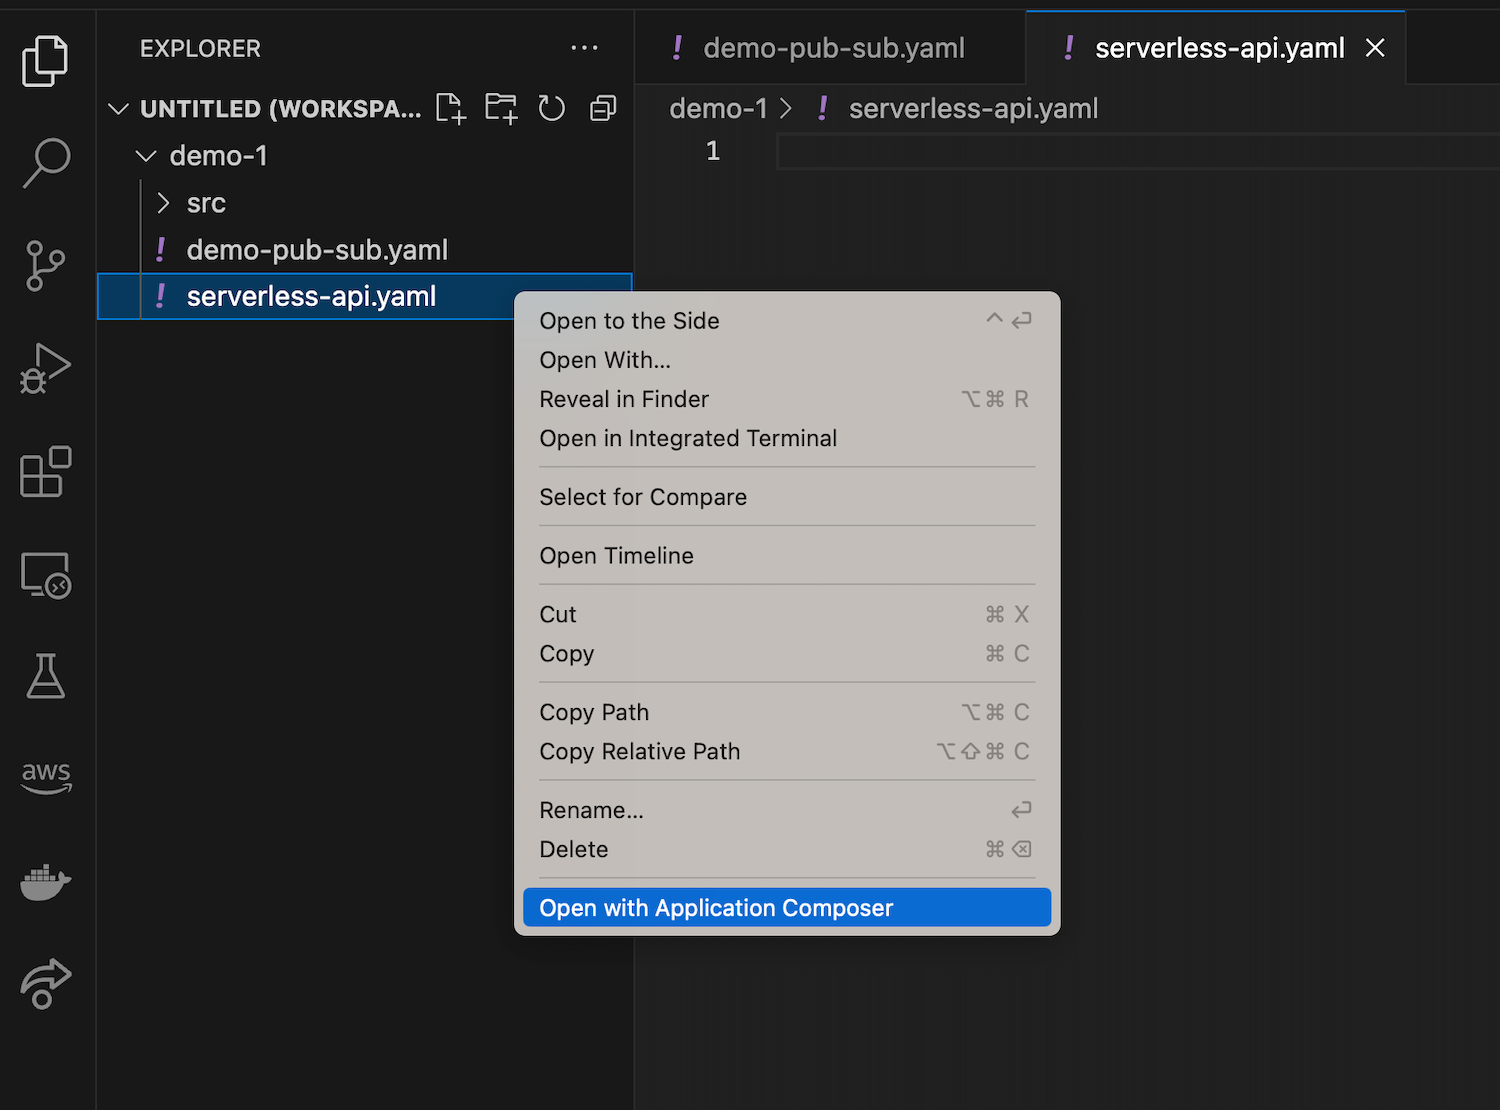
Another method is to create a new blank file, then right-click on the file and select Open with Application Composer to start designing my application visually.

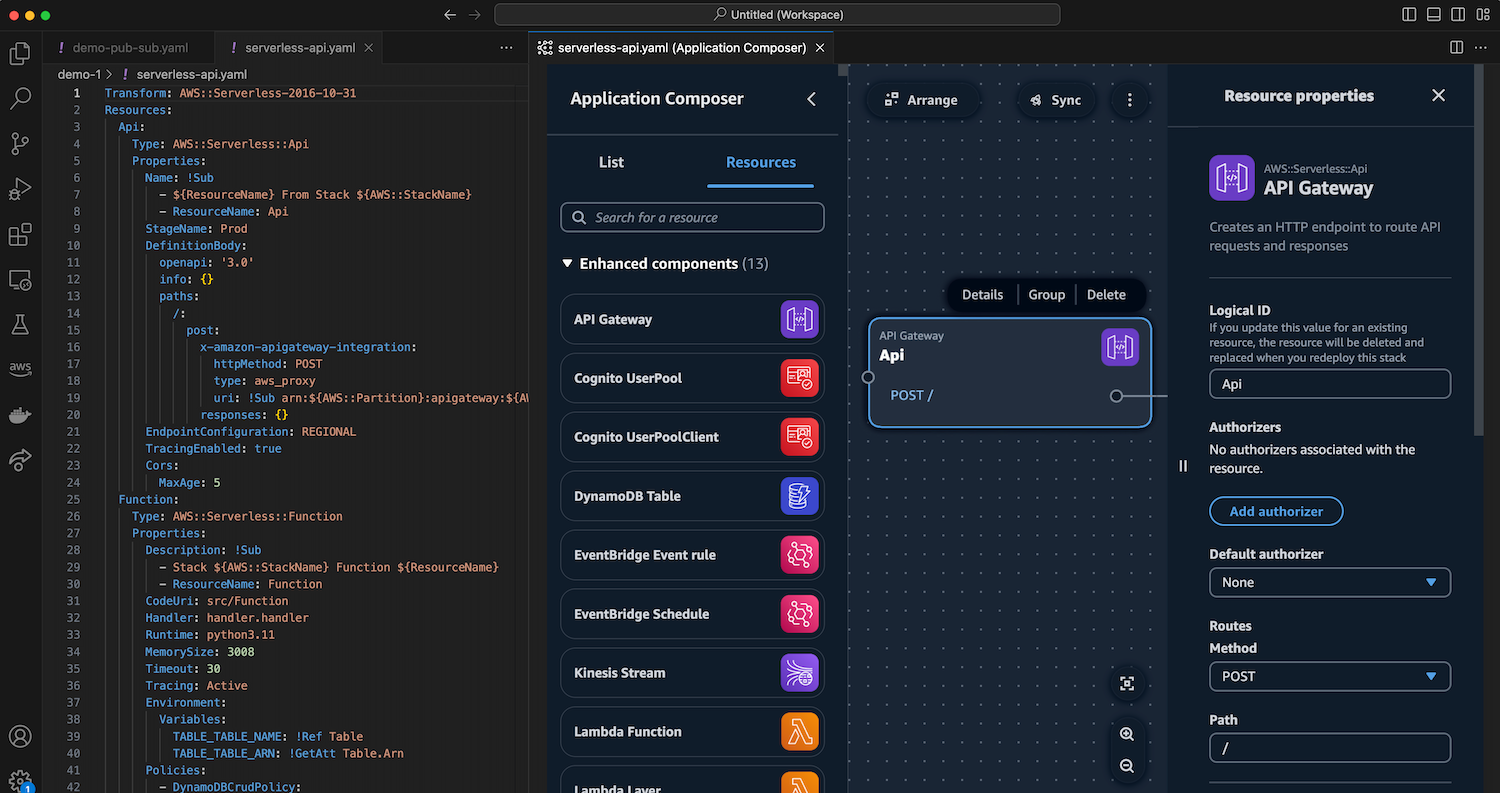
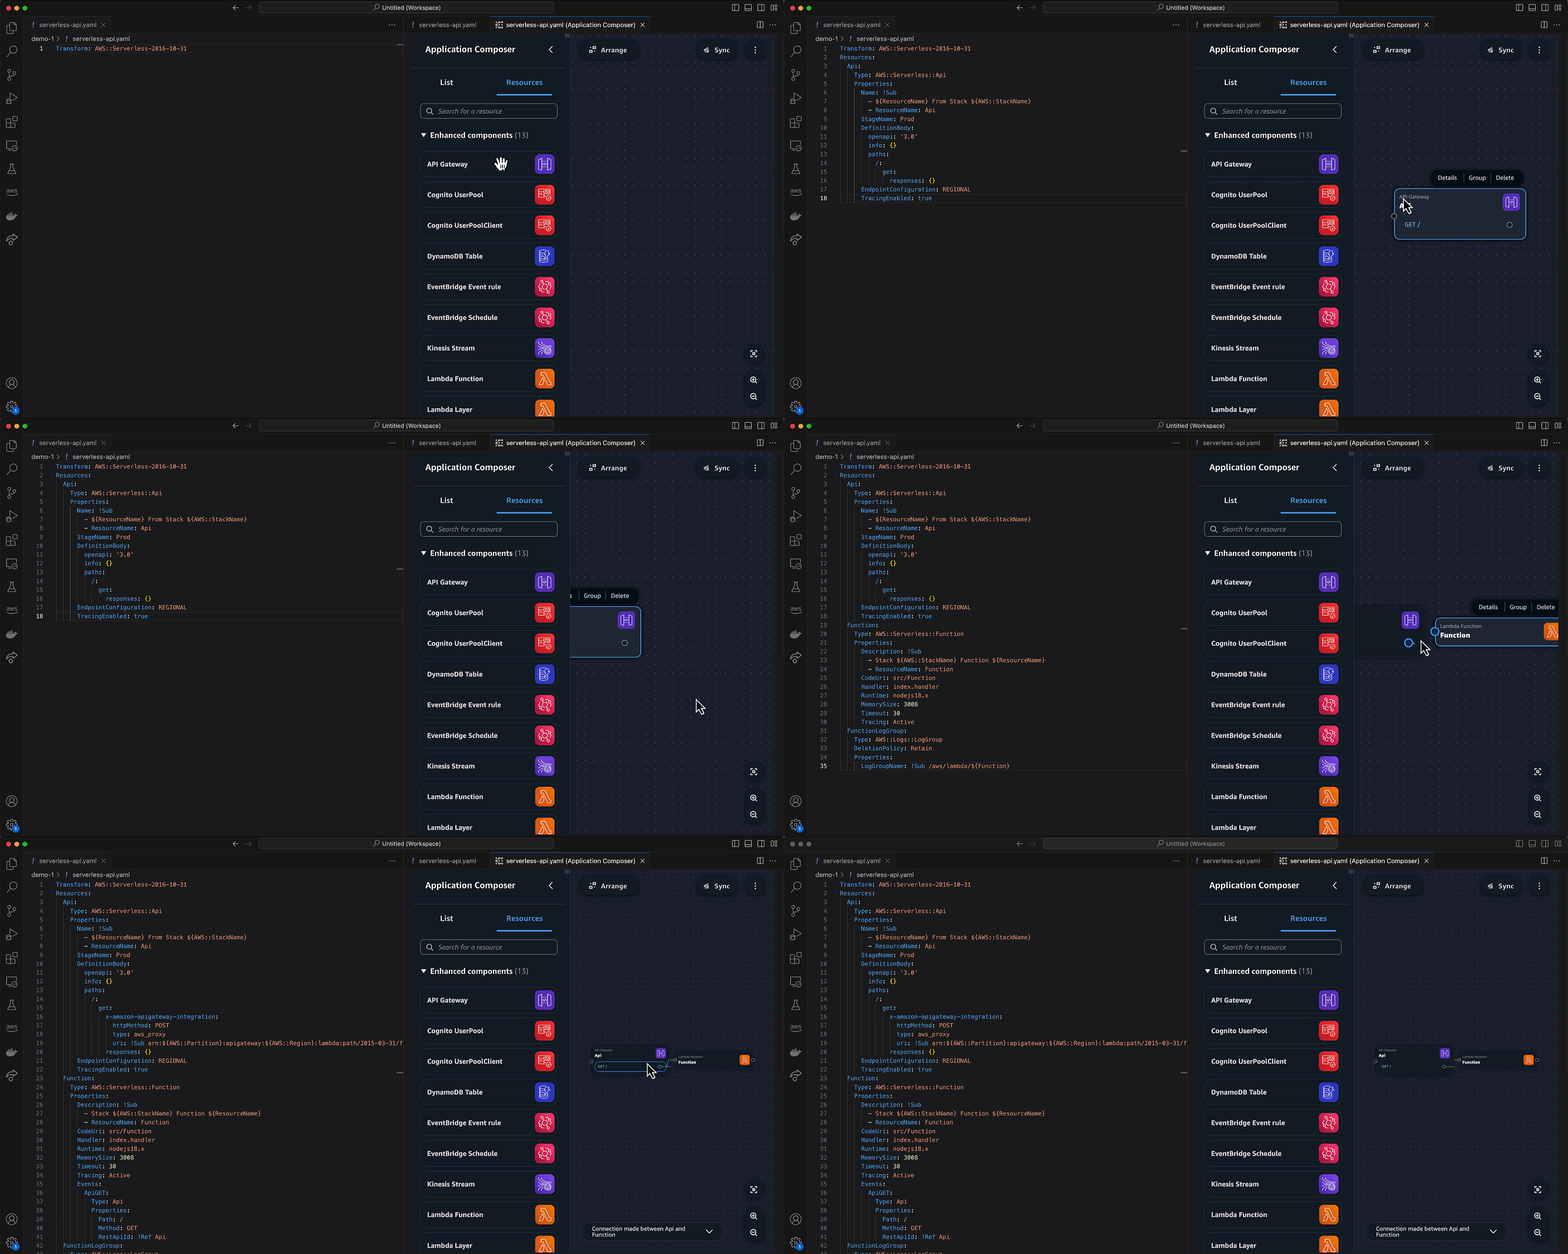
This will provide me with a blank canvas. Here I have both code and visual editors at the same time to build a simple serverless API using Amazon API Gateway, AWS Lambda, and Amazon DynamoDB. Any changes that I make on the canvas will also be reflected in real time on my IaC template.

I get consistent experiences, such as when I use the Application Composer console. For example, if I make some modifications to my AWS Lambda function, it will also create relevant files in my local folder.

With IaC templates available in my local folder, it’s easier for me to manage my applications with AWS SAM CLI. I can create continuous integration and continuous delivery (CI/CD) with sam pipeline or deploy my stack with sam deploy.

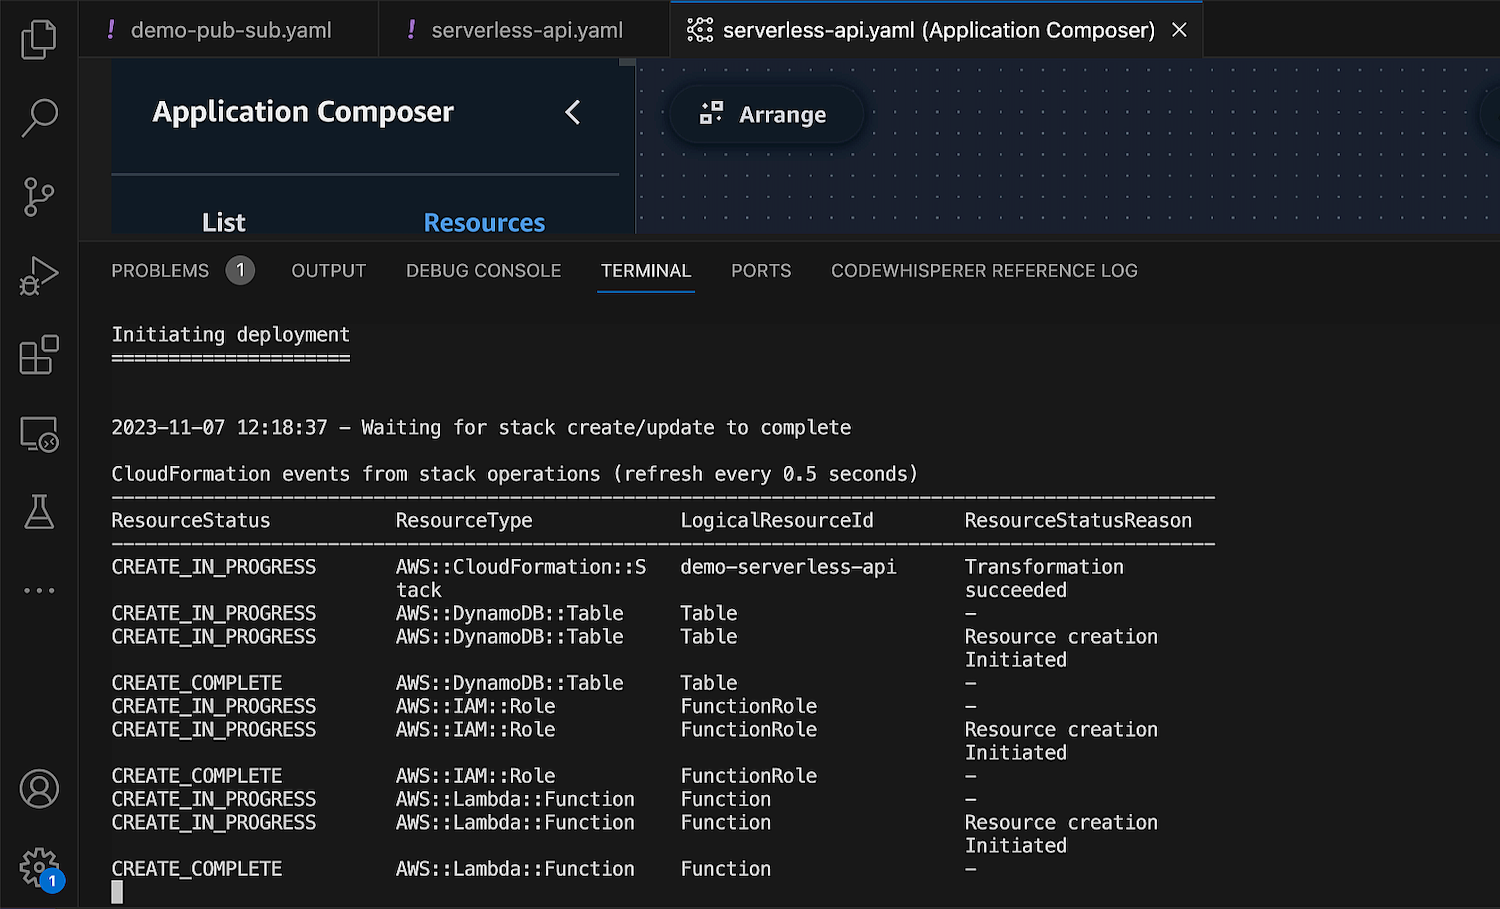
One of the features that accelerates my development workflow is the built-in Sync feature that seamlessly integrates with AWS SAM command sam sync. This feature syncs my local application changes to my AWS account, which is helpful for me to do testing and validation before I deploy my applications into a production environment.

Developing IaC templates with generative AI
With this new capability, I can use generative AI code suggestions to quickly get started with any of CloudFormation’s 1000+ resources. This also means that it’s now even easier to include standard IaC resources to extend my architecture.

For example, I need to use Amazon MQ, which is a standard IaC resource, and I need to modify some configurations for its AWS CloudFormation resource using Application Composer. In the Resource configuration section, change some values if needed, then choose Generate. Application Composer provides code suggestions that I can accept and incorporate into my IaC template.

This capability helps me to improve my development velocity by eliminating context switching. I can design my modern applications using AWS Application Composer canvas and use various tools such as Amazon CodeWhisperer and AWS SAM to accelerate my development workflow.

Things to know
Here are a couple of things to note:

Supported IDE – At launch, this new capability is available for Visual Studio Code.

Pricing – The IDE extension for AWS Application Composer is available at no charge.

Get started with IDE extension for AWS Application Composer by installing the latest AWS Toolkit for Visual Studio Code.

Happy coding!
Donnie

Vector engine for Amazon OpenSearch Serverless is now available

Post Syndicated from Channy Yun original https://aws.amazon.com/blogs/aws/vector-engine-for-amazon-opensearch-serverless-is-now-generally-available/

Today we are announcing the general availability of the vector engine for Amazon OpenSearch Serverless with new features. In July 2023, we introduced the preview release of the vector engine for Amazon OpenSearch Serverless, a simple, scalable, and high-performing similarity search capability. The vector engine makes it easy for you to build modern machine learning (ML) augmented search experiences and generative artificial intelligence (generative AI) applications without needing to manage the underlying vector database infrastructure.

You can now store, update, and search billions of vector embeddings with thousands of dimensions in milliseconds. The highly performant similarity search capability of vector engine enables generative AI-powered applications to deliver accurate and reliable results with consistent milliseconds-scale response times.

The vector engine also enables you to optimize and tune results with hybrid search by combining vector search and full-text search in the same query, removing the need to manage and maintain separate data stores or a complex application stack. The vector engine provides a secure, reliable, scalable, and enterprise-ready platform to cost effectively build a prototyping application and then seamlessly scale to production.

You can now get started in minutes with the vector engine by creating a specialized vector engine–based collection, which is a logical grouping of embeddings that works together to support a workload.

The vector engine uses OpenSearch Compute Units (OCUs), compute capacity unit, to ingest and run similarity search queries. One OCU can handle up to 2 million vectors for 128 dimensions or 500,000 for 768 dimensions at 99 percent recall rate.

The vector engine built on OpenSearch Serverless is a highly available service by default. It requires a minimum of four OCUs (2 OCUs for the ingest, including primary and standby, and 2 OCUs for the search with two active replicas across Availability Zones) for the first collection in an account. All subsequent collections using the same AWS Key Management Service (AWS KMS) key can share those OCUs.

What’s new at GA?
Since the preview, the vector engine for Amazon OpenSearch Serverless became one of the vector database options in the knowledge base of Amazon Bedrock to build generative AI applications using a Retrieval Augmented Generation (RAG) concept.

Here are some new or improved features for this GA release:

Disable redundant replica (development and test focused) option
As we announced in our preview blog post, this feature eliminates the need to have redundant OCUs in another Availability Zone solely for availability purposes. A collection can be deployed with two OCUs – one for indexing and one for search. This cuts the costs in half compared to default deployment with redundant replicas. The reduced cost makes this configuration suitable and economical for development and testing workloads.

With this option, we will still provide durability guarantees since the vector engine persists all the data in Amazon S3, but single-AZ failures would impact your availability.

If you want to disable a redundant replica, uncheck Enable redundancy when creating a new vector search
collection.

Fractional OCU for the development and test focused option
Support for fractional OCU billing for development and test focused workloads (that is, no redundant replica option) reduces the floor price for vector search collection. The vector engine will initially deploy smaller 0.5 OCUs while providing the same capabilities at lower scale and will scale up to a full OCU and beyond to meet your workload demand. This option will further reduce the monthly costs when experimenting with using the vector engine.

Automatic scaling for a billion scale
With vector engine’s seamless auto-scaling, you no longer have to reindex for scaling purposes. At preview, we were supporting about 20 million vector embeddings. With the general availability of vector engine, we have raised the limits to support a billion vector scale.

Now available
The vector engine for Amazon OpenSearch Serverless is now available in all AWS Regions where Amazon OpenSearch Serverless is available.

To get started, you can refer to the following resources:

Give it a try and send feedback to AWS re:Post for Amazon OpenSearch Service or through your usual AWS support contacts.

Channy

Amazon ElastiCache Serverless for Redis and Memcached is now available

Post Syndicated from Channy Yun original https://aws.amazon.com/blogs/aws/amazon-elasticache-serverless-for-redis-and-memcached-now-generally-available/

Today, we are announcing the availability of Amazon ElastiCache Serverless, a new serverless option that allows customers to create a cache in under a minute and instantly scale capacity based on application traffic patterns. ElastiCache Serverless is compatible with two popular open-source caching solutions, Redis and Memcached.

You can use ElastiCache Serverless to operate a cache for even the most demanding workloads without spending time in capacity planning or requiring caching expertise. ElastiCache Serverless constantly monitors your application’s memory, CPU, and network resource utilization and scales instantly to accommodate changes to the access patterns of workloads it serves. You can create a highly available cache with data automatically replicated across multiple Availability Zones and up to 99.99 percent availability Service Level Agreement (SLA) for all workloads, which saves you time and money.

Customers wanted to get radical simplicity to deploy and operate a cache. ElastiCache Serverless offers a simple endpoint experience abstracting the underlying cluster topology and cache infrastructure. You can reduce application complexity and have more operational excellence without handling reconnects and rediscovering nodes.

With ElastiCache Serverless, there are no upfront costs, and you pay for only the resources you use. You pay for the amount of cache data storage and ElastiCache Processing Units (ECPUs) resources consumed by your applications.

Getting started with Amazon ElastiCache Serverless
To get started, go to the ElastiCache console and choose Redis caches or Memcached caches in the left navigation pane. ElastiCache Serverless supports engine versions of Redis 7.1 or higher and Memcached 1.6 or higher.

For example, in the case of Redis caches, choose Create Redis cache.

You see two deployment options: either Serverless or Design your own cache to create a node-based cache cluster. Choose the Serverless option, the New cache method, and provide a name.

Use the default settings to create a cache in your default VPC, Availability Zones, service-owned encryption key, and security groups. We will automatically set recommended best practices. You don’t have to enter any additional settings.

If you want to customize default settings, you can set your own security groups, or enable automatic backups. You can also set maximum limits for your compute and memory usage to ensure your cache doesn’t grow beyond a certain size. When your cache reaches the memory limit, keys with a time to live (TTL) are evicted according to the least recently used (LRU) logic. When your compute limit is reached, ElastiCache will throttle requests, which will lead to elevated request latencies.

When you create a new serverless cache, you can see the details of settings for connectivity and data protection, including an endpoint and network environment.

Now, you can configure the ElastiCache Serverless endpoint in your application and connect using any Redis client that supports Redis in cluster mode, such as redis-cli.

$ redis-cli -h channy-redis-serverless.elasticache.amazonaws.com --tls -c -p 6379
set x Hello
OK
get x
"Hello"

You can manage the cache using AWS Command Line Interface (AWS CLI) or AWS SDKs. For more information, see Getting started with Amazon ElastiCache for Redis in the AWS documentation.

If you have an existing Redis cluster, you can migrate your data to ElastiCache Serverless by specifying the ElastiCache backups or Amazon S3 location of a backup file in a standard Redis rdb file format when creating your ElastiCache Serverless cache.

For a Memcached cache, you can create and use a new serverless cache in the same way as Redis.

If you use ElastiCache Serverless for Memcached, there are significant benefits of high availability and instant scaling because they are not natively available in the Memcached engine. You no longer have to write custom business logic, manage multiple caches, or use a third-party proxy layer to replicate data to get high availability with Memcached. Now you can get up to 99.99 percent availability SLA and data replication across multiple Availability Zones.

To connect to the Memcached endpoint, run the openssl client and Memcached commands as shown in the following example output:

$ /usr/bin/openssl s_client -connect channy-memcached-serverless.cache.amazonaws.com:11211 -crlf 
set a 0 0 5
hello
STORED
get a
VALUE a 0 5
hello
END

For more information, see Getting started with Amazon ElastiCache Serverless for Memcached in the AWS documentation.

Scaling and performance
ElastiCache Serverless scales without downtime or performance degradation to the application by allowing the cache to scale up and initiating a scale-out in parallel to meet capacity needs just in time.

To show ElastiCache Serverless’ performance we conducted a simple scaling test. We started with a typical Redis workload with an 80/20 ratio between reads and writes with a key size of 512 bytes. Our Redis client was configured to Read From Replica (RFR) using the READONLY Redis command, for optimal read performance. Our goal is to show how fast workloads can scale on ElastiCache Serverless without any impact on latency.

As you can see in the graph above, we were able to double the requests per second (RPS) every 10 minutes up until the test’s target request rate of 1M RPS. During this test, we observed that p50 GET latency remained around 751 microseconds and at all times below 860 microseconds. Similarly, we observed p50 SET latency remained around 1,050 microseconds, not crossing the 1,200 microseconds even during the rapid increase in throughput.

Things to know

  • Upgrading engine version – ElastiCache Serverless transparently applies new features, bug fixes, and security updates, including new minor and patch engine versions on your cache. When a new major version is available, ElastiCache Serverless will send you a notification in the console and an event in Amazon EventBridge. ElastiCache Serverless major version upgrades are designed for no disruption to your application.
  • Performance and monitoring – ElastiCache Serverless publishes a suite of metrics to Amazon CloudWatch, including memory usage (BytesUsedForCache), CPU usage (ElastiCacheProcessingUnits), and cache metrics, including CacheMissRate, CacheHitRate, CacheHits, CacheMisses, and ThrottledRequests. ElastiCache Serverless also publishes Amazon EventBridge events for significant events, including cache creation, deletion, and limit updates. For a full list of available metrics and events, see the documentation.
  • Security and compliance – ElastiCache Serverless caches are accessible from within a VPC. You can access the data plane using AWS Identity and Access Management (IAM). By default, only the AWS account creating the ElastiCache Serverless cache can access it. ElastiCache Serverless encrypts all data at rest and in-transit by transport layer security (TLS) encrypting each connection to ElastiCache Serverless. You can optionally choose to limit access to the cache within your VPCs, subnets, IAM access, and AWS Key Management Service (AWS KMS) key for encryption. ElastiCache Serverless is compliant with PCI-DSS, SOC, and ISO and is HIPAA eligible.

Now available
Amazon ElastiCache Serverless is now available in all commercial AWS Regions, including China. With ElastiCache Serverless, there are no upfront costs, and you pay for only the resources you use. You pay for cached data in GB-hours, ECPUs consumed, and Snapshot storage in GB-months.

To learn more, see the ElastiCache Serverless page and the pricing page. Give it a try, and please send feedback to AWS re:Post for Amazon ElastiCache or through your usual AWS support contacts.

Channy

Introducing persistent buffering for Amazon OpenSearch Ingestion

Post Syndicated from Muthu Pitchaimani original https://aws.amazon.com/blogs/big-data/introducing-persistent-buffering-for-amazon-opensearch-ingestion/

Amazon OpenSearch Ingestion is a fully managed, serverless pipeline that delivers real-time log, metric, and trace data to Amazon OpenSearch Service domains and OpenSearch Serverless collections.

Customers use Amazon OpenSearch Ingestion pipelines to ingest data from a variety of data sources, both pull-based and push-based. When ingesting data from pull-based sources, such as Amazon Simple Storage Service (Amazon S3) and Amazon MSK using Amazon OpenSearch Ingestion, the source handles the data durability and retention. Push-based sources, however, stream records directly to ingestion endpoints, and typically don’t have a means of persisting data once it is generated.

To address this need for such sources, a common architectural pattern is to add a persistent standalone buffer for enhanced durability and reliability of data ingestion. A durable, persistent buffer can mitigate the impact of ingestion spikes, buffer data during downtime, and reduce the need to expand capacity using in-memory buffers which can overflow. Customers use popular buffering technologies like Apache Kafka or RabbitMQ to add durability to their data flowing through their Amazon OpenSearch Ingestion pipelines. However, these tools add complexity to the data ingestion pipeline architecture and can be time consuming to setup, right-size, and maintain.

Solution overview

Today we’re introducing persistent buffering for Amazon OpenSearch Ingestion to enhance data durability and simplify data ingestion architectures for Amazon OpenSearch Service customers. You can use persistent buffering to ingest data for all push-based sources supported by Amazon OpenSearch Ingestion without the need to set up a standalone buffer. These include HTTP sources and OTEL sources for logs, traces and metrics. Persistent buffering in Amazon OpenSearch Ingestion is serverless and scales elastically to meet the throughput needs of even the most demanding workloads. You can now focus on your core business logic when ingesting data at scale in Amazon OpenSearch Service without worrying about the undifferentiated heavy lifting of provisioning and managing servers to add durability to your ingest pipeline.

Walkthrough

Enable persistent buffering

You can turn on the persistent buffering for existing or new pipelines using the AWS Management Console, AWS Command Line Interface (AWS CLI), or AWS SDK. If you choose not to enable persistent buffering, then the pipelines continue to use an in-memory buffer.

By default, persistent data is encrypted at rest with a key that AWS owns and manages for you. You can optionally choose your own customer managed key (KMS key) to encrypt data by selecting the checkbox labeled Customize encryption settings and selecting Choose a different AWS KMS key. Please note that if you choose a different KMS key, your pipeline needs additional permission to decrypt and generate data keys. The following snippet shows an example AWS Identity and Access Management (AWS IAM) permission policy that needs to be attached to a role used by the pipeline.

{
    "Version": "2012-10-17",
    "Statement": [
        {
            "Sid": "KeyAccess",
            "Effect": "Allow",
            "Action": [
              "kms:Decrypt",
              "kms:GenerateDataKeyWithoutPlaintext"
            ],
            "Resource": "arn:aws:kms:us-west-2:111122223333:key/1234abcd-12ab-34cd-56ef-1234567890ab"
        }
    ]
}

Provision for persistent buffering

Once persistent buffering is enabled, data is retained in the buffer for 72 hours. Amazon OpenSearch Ingestion keeps track of the data written into a sink and automatically resumes writing from the last successful check point should there be an outage in the sink or other issues that prevents data from being successfully written. There are no additional services or components needed for persistent buffers other than minimum and maximum OpenSearch compute Units (OCU) set for the pipeline. When persistent buffering is turned on, each Ingestion-OCU is now capable of providing persistent buffering along with its existing ability to ingest, transform, and route data. Amazon OpenSearch Ingestion dynamically allocates the buffer from the minimum and maximum allocation of OCUs that you define for the pipelines.

The number of Ingestion-OCUs used for persistent buffering is dynamically calculated based on the source, the transformations on the streaming data, and the sink that the data is written to. Because a portion of the Ingestion-OCUs now applies to persistent buffering, in order to maintain the same ingestion throughput for your pipeline, you need to increase the minimum and maximum Ingestion-OCUs when turning on persistent buffering. This amount of OCUs that you need with persistent buffering depends on the source that you are ingesting data from and also on the type of processing that you are performing on the data. The following table shows the number of OCUs that you need with persistent buffering with different sources and processors.

Sources and processors Ingestion-OCUs with buffering Compared to number of OCUs without persistent buffering needed to achieve similar data throughput
HTTP with no processors 3 times
HTTP wit Grok 2 times
OTel Trace 2 times
OTel Metrics 2 times

You have complete control over how you want to set up OCUs for your pipelines and decide between increasing OCUs for higher throughput or reducing OCUs for cost control at a lower throughput. Also, when you turn on persistent buffering, the minimum OCUs for a pipeline go up from one to two.

Availability and pricing

Persistent buffering is available in the all the AWS Regions where Amazon OpenSearch Ingestion is available as of November 17 2023. These includes US East (Ohio), US East (N. Virginia), US West (Oregon), US West (N. California), Europe (Ireland), Europe (London), Europe (Frankfurt), Asia Pacific (Tokyo), Asia Pacific (Sydney), Asia Pacific (Singapore), Asia Pacific (Mumbai), Asia Pacific (Seoul), and Canada (Central).

Ingestion-OCUs remains at the same price of $0.24 cents per hour. OCUs are billed on an hourly basis with per-minute granularity. You can control the costs OCUs incur by configuring maximum OCUs that a pipeline is allowed to scale.

Conclusion

In this post, we showed you how to configure persistent buffering for Amazon OpenSearch Ingestion to enhance data durability, and simplify data ingestion architecture for Amazon OpenSearch Service. Please refer to the documentation to learn other capabilities provided by Amazon OpenSearch Ingestion to a build sophisticated architecture for your ingestion needs.


About the Authors

Muthu Pitchaimani is a Search Specialist with Amazon OpenSearch Service. He builds large-scale search applications and solutions. Muthu is interested in the topics of networking and security, and is based out of Austin, Texas.

Arjun Nambiar is a Product Manager with Amazon OpenSearch Service. He focusses on ingestion technologies that enable ingesting data from a wide variety of sources into Amazon OpenSearch Service at scale. Arjun is interested in large scale distributed systems and cloud-native technologies and is based out of Seattle, Washington.

Jay is Customer Success Engineering leader for OpenSearch service. He focusses on overall customer experience with the OpenSearch. Jay is interested in large scale OpenSearch adoption, distributed data store and is based out of Northern Virginia.

Rich Giuli is a Principal Solutions Architect at Amazon Web Service (AWS). He works within a specialized group helping ISVs accelerate adoption of cloud services. Outside of work Rich enjoys running and playing guitar.

Introducing AWS Glue serverless Spark UI for better monitoring and troubleshooting

Post Syndicated from Noritaka Sekiyama original https://aws.amazon.com/blogs/big-data/introducing-aws-glue-studio-serverless-spark-ui-for-better-monitoring-and-troubleshooting/

In AWS, hundreds of thousands of customers use AWS Glue, a serverless data integration service, to discover, combine, and prepare data for analytics and machine learning. When you have complex datasets and demanding Apache Spark workloads, you may experience performance bottlenecks or errors during Spark job runs. Troubleshooting these issues can be difficult and delay getting jobs working in production. Customers often use Apache Spark Web UI, a popular debugging tool that is part of open source Apache Spark, to help fix problems and optimize job performance. AWS Glue supports Spark UI in two different ways, but you need to set it up yourself. This requires time and effort spent managing networking and EC2 instances, or through trial-and error with Docker containers.

Today, we are pleased to announce serverless Spark UI built into the AWS Glue console. You can now use Spark UI easily as it’s a built-in component of the AWS Glue console, enabling you to access it with a single click when examining the details of any given job run. There’s no infrastructure setup or teardown required. AWS Glue serverless Spark UI is a fully-managed serverless offering and generally starts up in a matter of seconds. Serverless Spark UI makes it significantly faster and easier to get jobs working in production because you have ready access to low level details for your job runs.

This post describes how the AWS Glue serverless Spark UI helps you to monitor and troubleshoot your AWS Glue job runs.

Getting started with serverless Spark UI

You can access the serverless Spark UI for a given AWS Glue job run by navigating from your Job’s page in AWS Glue console.

  1. On the AWS Glue console, choose ETL jobs.
  2. Choose your job.
  3. Choose the Runs tab.
  4. Select the job run you want to investigate, then choose Spark UI.

The Spark UI will display in the lower pane, as shown in the following screen capture:

Alternatively, you can get to the serverless Spark UI for a specific job run by navigating from Job run monitoring in AWS Glue.

  1. On the AWS Glue console, choose job run monitoring under ETL jobs.
  2. Select your job run, and choose View run details.

Scroll down to the bottom to view the Spark UI for the job run.

Prerequisites

Complete the following prerequisite steps:

  1. Enable Spark UI event logs for your job runs. It is enabled by default on Glue console and once enabled, Spark event log files will be created during the job run, and stored in your S3 bucket. The serverless Spark UI parses a Spark event log file generated in your S3 bucket to visualize detailed information for both running and completed job runs. A progress bar shows the percentage to completion, with a typical parsing time of less than a minute. Once logs are parsed, you can
  2. When logs are parsed, you can use the built-in Spark UI to debug, troubleshoot, and optimize your jobs.

For more information about Apache Spark UI, refer to Web UI in Apache Spark.

Monitor and Troubleshoot with Serverless Spark UI

A typical workload for AWS Glue for Apache Spark jobs is loading data from relational databases to S3-based data lakes. This section demonstrates how to monitor and troubleshoot an example job run for the above workload with serverless Spark UI. The sample job reads data from MySQL database and writes to S3 in Parquet format. The source table has approximately 70 million records.

The following screen capture shows a sample visual job authored in AWS Glue Studio visual editor. In this example, the source MySQL table has already been registered in the AWS Glue Data Catalog in advance. It can be registered through AWS Glue crawler or AWS Glue catalog API. For more information, refer to Data Catalog and crawlers in AWS Glue.

Now it’s time to run the job! The first job run finished in 30 minutes and 10 seconds as shown:

Let’s use Spark UI to optimize the performance of this job run. Open Spark UI tab in the Job runs page. When you drill down to Stages and view the Duration column, you will notice that Stage Id=0 spent 27.41 minutes to run the job, and the stage had only one Spark task in the Tasks:Succeeded/Total column. That means there was no parallelism to load data from the source MySQL database.

To optimize the data load, introduce parameters called hashfield and hashpartitions to the source table definition. For more information, refer to Reading from JDBC tables in parallel. Continuing to the Glue Catalog table, add two properties: hashfield=emp_no, and hashpartitions=18 in Table properties.

This means the new job runs reading parallelize data load from the source MySQL table.

Let’s try running the same job again! This time, the job run finished in 9 minutes and 9 seconds. It saved 21 minutes from the previous job run.

As a best practice, view the Spark UI and compare them before and after the optimization. Drilling down to Completed stages, you will notice that there was one stage and 18 tasks instead of one task.

In the first job run, AWS Glue automatically shuffled data across multiple executors before writing to destination because there were too few tasks. On the other hand, in the second job run, there was only one stage because there was no need to do extra shuffling, and there were 18 tasks for loading data in parallel from source MySQL database.

Considerations

Keep in mind the following considerations:

  • Serverless Spark UI is supported in AWS Glue 3.0 and later
  • Serverless Spark UI will be available for jobs that ran after November 20, 2023, due to a change in how AWS Glue emits and stores Spark logs
  • Serverless Spark UI can visualize Spark event logs which is up to 1 GB in size
  • There is no limit in retention because serverless Spark UI scans the Spark event log files on your S3 bucket
  • Serverless Spark UI is not available for Spark event logs stored in S3 bucket that can only be accessed by your VPC

Conclusion

This post described how the AWS Glue serverless Spark UI helps you monitor and troubleshoot your AWS Glue jobs. By providing instant access to the Spark UI directly within the AWS Management Console, you can now inspect the low-level details of job runs to identify and resolve issues. With the serverless Spark UI, there is no infrastructure to manage—the UI spins up automatically for each job run and tears down when no longer needed. This streamlined experience saves you time and effort compared to manually launching Spark UIs yourself.

Give the serverless Spark UI a try today. We think you’ll find it invaluable for optimizing performance and quickly troubleshooting errors. We look forward to hearing your feedback as we continue improving the AWS Glue console experience.


About the authors

Noritaka Sekiyama is a Principal Big Data Architect on the AWS Glue team. He works based in Tokyo, Japan. He is responsible for building software artifacts to help customers. In his spare time, he enjoys cycling on his road bike.

Alexandra Tello is a Senior Front End Engineer with the AWS Glue team in New York City. She is a passionate advocate for usability and accessibility. In her free time, she’s an espresso enthusiast and enjoys building mechanical keyboards.

Matt Sampson is a Software Development Manager on the AWS Glue team. He loves working with his other Glue team members to make services that our customers benefit from. Outside of work, he can be found fishing and maybe singing karaoke.

Matt Su is a Senior Product Manager on the AWS Glue team. He enjoys helping customers uncover insights and make better decisions using their data with AWS Analytic services. In his spare time, he enjoys skiing and gardening.

Introducing support for read-only management events in Amazon EventBridge

Post Syndicated from Eric Johnson original https://aws.amazon.com/blogs/compute/introducing-support-for-read-only-management-events-in-amazon-eventbridge/

This post is written by Pawan Puthran, Principal Specialist TAM, Serverless and Heeki Park, Principal Solutions Architect, Serverless

Today, AWS is announcing support for read-only management events in Amazon EventBridge. This feature enables customers to build rich event-driven responses from any action taken on AWS infrastructure to detect security vulnerabilities or identify suspicious activity in near real-time. You can now gain insight into all activity across all your AWS accounts and respond to those events as is appropriate.

Overview

EventBridge is a serverless event bus used to decouple event producers and consumers. Event producers publish events onto an event bus, which then uses rules to determine where to send those events. The rules determine the downstream targets that receive and process the events, and EventBridge routes the events accordingly.

EventBridge allows customers to monitor, audit, and react, in near real-time, to changes in their AWS environments through events generated by AWS CloudTrail for AWS API calls. CloudTrail records actions taken by a user, role, or an AWS service as events in a trail. Events include actions taken in the AWS Management Console, AWS Command Line Interface (CLI), and AWS SDKs and APIs.

Previously, only mutating API calls are published from CloudTrail to EventBridge for control plane changes. Events for mutating API calls include those that create, update, or delete resources. Control plane changes are also referred to as management events. EventBridge now supports non-mutating or read-only API calls for management events at no additional cost. These include those that list, get, or describe resources.

CloudTrail events in EventBridge enable you to build rich event-driven responses from any action taken on AWS infrastructure in real time. Previously, customers and partners often used a polling model to iterate over a batch of CloudTrail logs from Amazon S3 buckets to detect issues, making it slower to respond. The launch of read-only management events enables you to detect and remediate issues in near real-time and thus improve the overall security posture.

Enabling read-only management events

You can start receiving read-only management events if a CloudTrail is configured in your account and if the event selector for that CloudTrail is configured with ReadWriteType of either All or ReadOnly. This ensures that the read-only management events are logged in the CloudTrail and are then passed to EventBridge.

For example, you can receive an alert if a production account lists resources from an IP address outside of your VPC. Another example could be if an entity, such as a principal (AWS account root user, IAM role, or IAM user), calls the ListInstanceProfilesForRole or DescribeInstances APIs without any prior record of doing so. A malicious actor could use stolen credentials for conducting this reconnaissance to find more valuable credentials or determine the capabilities of the credentials they have.

To enable read-only management events with an EventBridge rule, in addition to the existing mutating events, use the new ENABLED_WITH_ALL_CLOUDTRAIL_MANAGEMENT_EVENTS state when creating the rule.

Resources:
  SampleMgmtRule:
    Type: 'AWS::Events::Rule'
    Properties:
      Description: 'Example for enabling read-only management events'
      State: ENABLED_WITH_ALL_CLOUDTRAIL_MANAGEMENT_EVENTS
      EventPattern:
        source:
          - aws.s3
        detail:
          - AWS API Call via CloudTrail
      Targets:
        - Arn: 'arn:aws:sns:us-east-1:123456789012:notificationTopic'
          Id: 'NotificationTarget'

You can also create a rule on an event bus to specify a particular API action by using the eventName attribute under the detail key:

aws events put-rule --name "SampleTestRule" \
--event-pattern '{"detail": {"eventName": ["ListBuckets"]}}' \
--state ENABLED_WITH_ALL_CLOUDTRAIL_MANAGEMENT_EVENTS --region us-east-1

Common scenarios and use-cases

The following section describes a couple of the scenarios where you can set up EventBridge rules and take actions on non-mutating or read-only management events.

Detecting anomalous Secrets Manager GetSecretValue API Calls

Consider the security team of your organization that wants a notification whenever GetSecretValue API calls for AWS Secrets Manager are made through the CLI. They can then investigate if these calls are made by entities outside their organization or by an unauthorized user and take corrective actions to deny such requests.

When the application calls the GetSecretValue API to retrieve the secrets via a CLI, it generates an event like this:

{
    "version": "0",
    "id": "d3368cc1-e6d6-e4bf-e58e-030f03b6eae3",
    "detail-type": "AWS API Call via CloudTrail",
    "source": "aws.secretsmanager",
    "account": "111111111111",
    "time": "2023-11-08T19:58:38Z",
    "region": "us-east-1",
    "resources": [],
    "detail": {
        "eventVersion": "1.08",
        "userIdentity": {
            "type": "IAMUser",
            "principalId": "AAAAAAAAAAAAA",
            "arn": "arn:aws:iam:: 111111111111:user/USERNAME"
            // ... additional detail fields
        },
        "eventTime": "2023-11-08T19:58:38Z",
        "eventSource": "secretsmanager.amazonaws.com",
        "eventName": "GetSecretValue",
        "awsRegion": "us-east-1",
        "userAgent": "aws-cli/2.13.15 Python/3.11.4 Darwin/22.6.0 exe/x86_64 prompt/off command/secretsmanager.get-secret-value"
        // ... additional detail fields
    }
}

You set the following event pattern on the rule to filter incoming events to specific consumers. This example also uses the recently launched wildcard filter for event matching.

{
    "source": [
        "aws.secretsmanager"
    ],
    "detail-type": [
        "AWS API Call via CloudTrail"
    ],
    "detail": {
        "eventName": [
            "GetSecretValue"
        ],
        "userAgent": [
            {
                "wildcard": "aws-cli/*"
            }
        ]
    }
}

You can create a rule matching a combination of these event properties. In this case, you are matching for aws.secretsmanager as source, AWS API Call via CloudTrail as detail-type, GetSecretValue as detail.eventName and wildcard pattern on detail.userAgent for aws-cli/*. You can filter detail.userAgent with a wildcard to catch events that come from a particular application or user.

You can then route these events to a target like an Amazon CloudWatch Logs stream to record the change. You can also route them to Amazon SNS to get notified via email subscription. You can alternatively route them to an AWS Lambda function in which you perform custom business logic.

Creating an EventBridge rule for read-only management events

  1. Create a rule on the default event bus using the new state ENABLED_WITH_ALL_CLOUDTRAIL_MANAGEMENT_EVENTS.
    aws events put-rule --name "monitor-secretsmanager" \
    --event-pattern '{"source": ["aws.secretsmanager"], "detail-type": ["AWS API Call via CloudTrail"], "detail": {"eventName": ["GetSecretValue"], "userAgent": [{ "wildcard": "aws-cli/*"} ]}}' \
    --state ENABLED_WITH_ALL_CLOUDTRAIL_MANAGEMENT_EVENTS --region us-east-1

    Rule details

    Rule details

  2. Configure a target. In this case, the target service is CloudWatch Logs but you can configure any of the supported targets.
    aws events put-targets --rule monitor-secretsmanager --targets Id=1,Arn=arn:aws:logs:us-east-1:ACCOUNT_ID:log-group:/aws/events/getsecretvaluelogs --region us-east-1

    Target details

    Target details

You can then use CloudWatch Log Insights to search and analyze log data using the CloudWatch Log Insights query syntax where you can retrieve the user who performed these calls.

Identifying suspicious data exfiltration behavior

Consider the security or data perimeter team who wants to secure data residing in Amazon S3 buckets. The team requires notifications whenever API calls to list S3 buckets or to list S3 objects are made.

When a user or application calls the ListBuckets API to discover the available buckets, it generates the following CloudTrail event:

{
    "version": "0",
    "id": "345ca690-6510-85b2-ff02-090493a33cf1",
    "detail-type": "AWS API Call via CloudTrail",
    "source": "aws.s3",
    "account": "111111111111",
    "time": "2023-11-14T17:25:30Z",
    "region": "us-east-1",
    "resources": [],
    "detail": {
        "eventVersion": "1.09",
        "userIdentity": {
            "type": "IAMUser",
            "principalId": "principal-identity-uuid",
            "arn": "arn:aws:iam::111111111111:user/exploited-user",
            "accountId": "111111111111",
            "accessKeyId": "AAAABBBBCCCCDDDDEEEE",
            "userName": "exploited-user"
        },
        "eventTime": "2023-11-14T17:25:30Z",
        "eventSource": "s3.amazonaws.com",
        "eventName": "ListBuckets",
        "awsRegion": "us-east-1",
        "sourceIPAddress": "11.22.33.44",
        "userAgent": "[aws-cli/2.13.29 Python/3.11.6 Darwin/22.6.0 exe/x86_64 prompt/off command/s3api.list-buckets]",
        "requestParameters": {
            "Host": "s3.us-east-1.amazonaws.com"
        },
        "readOnly": true,
        "eventType": "AwsApiCall",
        "managementEvent": true
        // additional detail fields
    }
}

In this scenario, you can create an EventBridge rule matching for aws.s3 for the source field, and ListBuckets for the eventName.

{
    "source": [
        "aws.s3"
    ],
    "detail-type": [
        "AWS API Call via CloudTrail"
    ],
    "detail": {
        "eventName": [
            "ListBuckets "
        ]
    }
}

However, listing objects alone might only be the beginning of a potential data exfiltration attempt. You may also want to check for ListObjects or ListObjectsV2 as the next action, followed by a large number of GetObject API calls. You can create the following rule to match those actions.

{
    "source": [
        "aws.s3"
    ],
    "detail-type": [
        "AWS API Call via CloudTrail"
    ],
    "detail": {
        "eventName": [
            "ListObjects",
            "ListObjectsV2",
            "GetObject"
        ]
    }
}

You could potentially forward this log information to your central security logging solution or use anomaly detection machine learning models to evaluate these events to determine the appropriate response to these events.

Configuring cross-account and cross-Region event routing

You can also create rules to receive the read-only events to cross account or cross-Region to centralize your AWS events into one Region or one AWS account for auditing and monitoring purposes. For example, capture all workload events from multiple Regions in eu-west-1 for compliance reporting.

Cross Account example for default event bus and custom event bus

Cross Account example for default event bus and custom event bus

To do this, create a rule using the new ENABLED_WITH_ALL_CLOUDTRAIL_MANAGEMENT_EVENTS state on the default bus of the source account or the Region, targeting either default event bus or a custom event bus of the target account or Region. You must also ensure you have a rule configured with ENABLED_WITH_ALL_CLOUDTRAIL_MANAGEMENT_EVENTS to be able to invoke the targets in the destination account or Region.

Cross-Region setup for CloudTrail read-only events

Cross-Region setup for CloudTrail read-only events

Conclusion

This blog shows how customers can build rich event-driven responses with the newly launched support for read-only events. You can now observe events as potential signals of reconnaissance and data exfiltration activities from any action taken on AWS infrastructure in near real time. You can also use the cross-Region and cross-account functionality to deliver the read-only events to a centralized AWS account or Region, enhancing the capability for auditing and monitoring across all your AWS environments.

For more serverless learning resources, visit Serverless Land.

Introducing advanced logging controls for AWS Lambda functions

Post Syndicated from David Boyne original https://aws.amazon.com/blogs/compute/introducing-advanced-logging-controls-for-aws-lambda-functions/

This post is written by Nati Goldberg, Senior Solutions Architect and Shridhar Pandey, Senior Product Manager, AWS Lambda

Today, AWS is launching advanced logging controls for AWS Lambda, giving developers and operators greater control over how function logs are captured, processed, and consumed.

This launch introduces three new capabilities to provide a simplified and enhanced default logging experience on Lambda.

First, you can capture Lambda function logs in JSON structured format without having to use your own logging libraries. JSON structured logs make it easier to search, filter, and analyze large volumes of log entries.

Second, you can control the log level granularity of Lambda function logs without making any code changes, enabling more effective debugging and troubleshooting.

Third, you can also set which Amazon CloudWatch log group Lambda sends logs to, making it easier to aggregate and manage logs at scale.

Overview

Being able to identify and filter relevant log messages is essential to troubleshoot and fix critical issues. To help developers and operators monitor and troubleshoot failures, the Lambda service automatically captures and sends logs to CloudWatch Logs.

Previously, Lambda emitted logs in plaintext format, also known as unstructured log format. This unstructured format could make the logs challenging to query or filter. For example, you had to search and correlate logs manually using well-known string identifiers such as “START”, “END”, “REPORT” or the request id of the function invocation. Without a native way to enrich application logs, you needed custom work to extract data from logs for automated analysis or to build analytics dashboards.

Previously, operators could not control the level of log detail generated by functions. They relied on application development teams to make code changes to emit logs with the required granularity level, such as INFO, DEBUG, or ERROR.

Lambda-based applications often comprise microservices, where a single microservice is composed of multiple single-purpose Lambda functions. Before this launch, Lambda sent logs to a default CloudWatch log group created with the Lambda function with no option to select a log group. Now you can aggregate logs from multiple functions in one place so you can uniformly apply security, governance, and retention policies to your logs.

Capturing Lambda logs in JSON structured format

Lambda now natively supports capturing structured logs in JSON format as a series of key-value pairs, making it easier to search and filter logs more easily.

JSON also enables you to add custom tags and contextual information to logs, enabling automated analysis of large volumes of logs to help understand the function performance. The format adheres to the OpenTelemetry (OTel) Logs Data Model, a popular open-source logging standard, enabling you to use open-source tools to monitor functions.

To set the log format in the Lambda console, select the Configuration tab, choose Monitoring and operations tools on the left pane, then change the log format property:

Currently, Lambda natively supports capturing application logs (logs generated by the function code) and system logs (logs generated by the Lambda service) in JSON structured format.

This is for functions that use non-deprecated versions of Python, Node.js, and Java Lambda managed runtimes, when using Lambda recommended logging methods such as using logging library for Python, console object for Node.js, and LambdaLogger or Log4j for Java.

For other managed runtimes, Lambda currently only supports capturing system logs in JSON structured format. However, you can still capture application logs in JSON structured format for these runtimes by manually configuring logging libraries. See configuring advanced logging controls section in the Lambda Developer Guide to learn more. You can also use Powertools for AWS Lambda to capture logs in JSON structured format.

Changing log format from text to JSON can be a breaking change if you parse logs in a telemetry pipeline. AWS recommends testing any existing telemetry pipelines after switching log format to JSON.

Working with JSON structured format for Node.js Lambda functions

You can use JSON structured format with CloudWatch Embedded Metric Format (EMF) to embed custom metrics alongside JSON structured log messages, and CloudWatch automatically extracts the custom metrics for visualization and alarming. However, to use JSON log format along with EMF libraries for Node.js Lambda functions, you must use the latest version of the EMF client library for Node.js or the latest version of Powertools for AWS Lambda (TypeScript) library.

Configuring log level granularity for Lambda function

You can now filter Lambda logs by log level, such as ERROR, DEBUG, or INFO, without code changes. Simplified log level filtering enables you to choose the required logging granularity level for Lambda functions, without sifting through large volumes of logs to debug errors.

You can specify separate log level filters for application logs (which are logs generated by the function code) and system logs (which are logs generated by the Lambda service, such as START and REPORT log messages). Note that log level controls are only available if the log format of the function is set to JSON.

The Lambda console allows setting both the Application log level and System log level properties:

You can define the granularity level of each log event in your function code. The following statement prints out the event input of the function, emitted as a DEBUG log message:

console.debug(event);

Once configured, log events emitted with a lower log level than the one selected are not published to the function’s CloudWatch log stream. For example, setting the function’s log level to INFO results in DEBUG log events being ignored.

This capability allows you to choose the appropriate amount of logs emitted by functions. For example, you can set a higher log level to improve the signal-to-noise ratio in production logs, or set a lower log level to capture detailed log events for testing or troubleshooting purposes.

Customizing Lambda function’s CloudWatch log group

Previously, you could not specify a custom CloudWatch log group for functions, so you could not stream logs from multiple functions into a shared log group. Also, to set custom retention policy for multiple log groups, you had to create each log group separately using a pre-defined name (for example, /aws/lambda/<function name>).

Now you can select a custom CloudWatch log group to aggregate logs from multiple functions automatically within an application in one place. You can apply security, governance, and retention policies at the application level instead of individually to every function.

To distinguish between logs from different functions in a shared log group, each log stream contains the Lambda function name and version.

You can share the same log group between multiple functions to aggregate logs together. The function’s IAM policy must include the logs:CreateLogStream and logs:PutLogEvents permissions for Lambda to create logs in the specified log group. The Lambda service can optionally create these permissions, when you configure functions in the Lambda console.

You can set the custom log group in the Lambda console by entering the destination log group name. If the entered log group does not exist, Lambda creates it automatically.

Advanced logging controls for Lambda can be configured using Lambda APIAWS Management ConsoleAWS Command Line Interface (CLI), and infrastructure as code (IaC) tools such as AWS Serverless Application Model (AWS SAM) and AWS CloudFormation.

Example of Lambda advanced logging controls

This section demonstrates how to use the new advanced logging controls for Lambda using AWS SAM to build and deploy the resources in your AWS account.

Overview

The following diagram shows Lambda functions processing newly created objects inside an Amazon S3 bucket, where both functions emit logs into the same CloudWatch log group:

The architecture includes the following steps:

  1. A new object is created inside an S3 bucket.
  2. S3 publishes an event using S3 Event Notifications to Amazon EventBridge.
  3. EventBridge triggers two Lambda functions asynchronously.
  4. Each function processes the object to extract labels and text, using Amazon Rekognition and Amazon Textract.
  5. Both functions then emit logs into the same CloudWatch log group.

This uses AWS SAM to define the Lambda functions and configure the required logging controls. The IAM policy allows the function to create a log stream and emit logs to the selected log group:

DetectLabelsFunction:
    Type: AWS::Serverless::Function 
    Properties:
      CodeUri: detect-labels/
      Handler: app.lambdaHandler
      Runtime: nodejs18.x
      Policies:
        ...
        - Version: 2012-10-17
          Statement:
            - Sid: CloudWatchLogGroup
              Action: 
                - logs:CreateLogStream
                - logs:PutLogEvents
              Resource: !GetAtt CloudWatchLogGroup.Arn
              Effect: Allow
      LoggingConfig:
        LogFormat: JSON 
        ApplicationLogLevel: DEBUG 
        SystemLogLevel: INFO 
        LogGroup: !Ref CloudWatchLogGroup 

Deploying the example

To deploy the example:

  1. Clone the GitHub repository and explore the application.
    git clone https://github.com/aws-samples/advanced-logging-controls-lambda/
    
    cd advanced-logging-controls-lambda
  2. Use AWS SAM to build and deploy the resources to your AWS account. This compiles and builds the application using npm, and then populate the template required to deploy the resources:
    sam build
  3. Deploy the solution to your AWS account with a guided deployment, using AWS SAM CLI interactive flow:
    sam deploy --guided
  4. Enter the following values:
    • Stack Name: advanced-logging-controls-lambda
    • Region: your preferred Region (for example, us-east-1)
    • Parameter UploadsBucketName: enter a unique bucket name.
    • Accept the rest of the initial defaults.
  5. To test the application, use the AWS CLI to copy the sample image into the S3 bucket you created.
    aws s3 cp samples/skateboard.jpg s3://example-s3-images-bucket

Explore CloudWatch Logs to view the logs emitted into the log group created, AggregatedLabelsLogGroup:

The DetectLabels Lambda function emits DEBUG log events in JSON format to the log stream. Log events with the same log level from the ExtractText Lambda function are omitted. This is a result of the different application log level settings for each function (DEBUG and INFO).

You can also use CloudWatch Logs Insights to search, filter, and analyze the logs in JSON format using this sample query:

You can see the results:

Conclusion

Advanced logging controls for Lambda give you greater control over logging. Use advanced logging controls to control your Lambda function’s log level and format, allowing you to search, query, and filter logs to troubleshoot issues more effectively.

You can also choose the CloudWatch log group where Lambda sends your logs. This enables you to aggregate logs from multiple functions into a single log group, apply retention, security, governance policies, and easily manage logs at scale.

To get started, specify the required settings in the Logging Configuration for any new or existing Lambda functions.

Advanced logging controls for Lambda are available in all AWS Regions where Lambda is available at no additional cost. Learn more about AWS Lambda Advanced Logging Controls.

For more serverless learning resources, visit Serverless Land.

Introducing the AWS Integrated Application Test Kit (IATK)

Post Syndicated from James Beswick original https://aws.amazon.com/blogs/compute/aws-integrated-application-test-kit/

This post is written by Dan Fox, Principal Specialist Solutions Architect, and Brian Krygsman, Senior Solutions Architect.

Today, AWS announced the public preview launch of the AWS Integrated Application Test Kit (IATK). AWS IATK is a software library that helps you write automated tests for cloud-based applications. This blog post presents several initial features of AWS IATK, and then shows working examples using an example video processing application. If you are getting started with serverless testing, learn more at serverlessland.com/testing.

Overview

When you create applications composed of serverless services like AWS Lambda, Amazon EventBridge, or AWS Step Functions, many of your architecture components cannot be deployed to your desktop, but instead only exist in the AWS Cloud. In contrast to working with applications deployed locally, these types of applications benefit from cloud-based strategies for performing automated tests. For its public preview launch, AWS IATK helps you implement some of these strategies for Python applications. AWS IATK will support other languages in future launches.

Locating resources for tests

When you write automated tests for cloud resources, you need the physical IDs of your resources. The physical ID is the name AWS assigns to a resource after creation. For example, to send requests to Amazon API Gateway you need the physical ID, which forms the API endpoint.

If you deploy cloud resources in separate infrastructure as code stacks, you might have difficulty locating physical IDs. In CloudFormation, you create the logical IDs of the resources in your template, as well as the stack name. With IATK, you can get the physical ID of a resource if you provide the logical ID and stack name. You can also get stack outputs by providing the stack name. These convenient methods simplify locating resources for the tests that you write.

Creating test harnesses for event driven architectures

To write integration tests for event driven architectures, establish logical boundaries by breaking your application into subsystems. Your subsystems should be simple enough to reason about, and contain understandable inputs and outputs. One useful technique for testing subsystems is to create test harnesses. Test harnesses are resources that you create specifically for testing subsystems.

For example, an integration test can begin a subsystem process by passing an input test event to it. IATK can create a test harness for you that listens to Amazon EventBridge for output events. (Under the hood, the harness is composed of an EventBridge Rule that forwards the output event to Amazon Simple Queue Service.) Your integration test then queries the test harness to examine the output and determine if the test passes or fails. These harnesses help you create integration tests in the cloud for event driven architectures.

Establishing service level agreements to test asynchronous features

If you write a synchronous service, your automated tests make requests and expect immediate responses. When your architecture is asynchronous, your service accepts a request and then performs a set of actions at a later time. How can you test for the success of an activity if it does not have a specified duration?

Consider creating reasonable timeouts for your asynchronous systems. Document timeouts as service level agreements (SLAs). You may decide to publish your SLAs externally or to document them as internal standards. IATK contains a polling feature that allows you to establish timeouts. This feature helps you to test that your asynchronous systems complete tasks in a timely manner.

Using AWS X-Ray for detailed testing

If you want to gain more visibility into the interior details of your application, instrument with AWS X-Ray. With AWS X-Ray, you trace the path of an event through multiple services. IATK provides conveniences that help you set the AWS X-Ray sampling rate, get trace trees, and assert for trace durations. These features help you observe and test your distributed systems in greater detail.

Learn more about testing asynchronous architectures at aws-samples/serverless-test-samples.

Overview of the example application

To demonstrate the features of IATK, this post uses a portion of a serverless video application designed with a plugin architecture. A core development team creates the primary application. Distributed development teams throughout the organization create the plugins. One AWS CloudFormation stack deploys the primary application. Separate stacks deploy each plugin.

Communications between the primary application and the plugins are managed by an EventBridge bus. Plugins pull application lifecycle events off the bus and must put completion notification events back on the bus within 20 seconds. For testing, the core team has created an AWS Step Functions workflow that mimics the production process by emitting properly formatted example lifecycle events. Developers run this test workflow in development and test environments to verify that their plugins are communicating properly with the event bus.

The following demonstration shows an integration test for the example application that validates plugin behavior. In the integration test, IATK locates the Step Functions workflow. It creates a test harness to listen for the event completion notification to be sent by the plugin. The test then runs the workflow to begin the lifecycle process and start plugin actions. Then IATK uses a polling mechanism with a timeout to verify that the plugin complies with the 20 second service level agreement. This is the sequence of processing:

Sequence of processing

  1. The integration test starts an execution of the test workflow.
  2. The workflow puts a lifecycle event onto the bus.
  3. The plugin pulls the lifecycle event from the bus.
  4. When the plugin is complete, it puts a completion event onto the bus.
  5. The integration test polls for the completion event to determine if the test passes within the SLA.

Deploying and testing the example application

Follow these steps to review this application, build it locally, deploy it in your AWS account, and test it.

Downloading the example application

  1. Open your terminal and clone the example application from GitHub with the following command or download the code. This repository also includes other example patterns for testing serverless applications.
    git clone https://github.com/aws-samples/serverless-test-samples
  2. The root of the IATK example application is in python-test-samples/integrated-application-test-kit. Change to this directory:
    cd serverless-test-samples/python-test-samples/integrated-application-test-kit

Reviewing the integration test

Before deploying the application, review how the integration test uses the IATK by opening plugins/2-postvalidate-plugins/python-minimal-plugin/tests/integration/test_by_polling.py in your text editor. The test class instantiates the IATK at the top of the file.

iatk_client = aws_iatk.AwsIatk(region=aws_region)

In the setUp() method, the test class uses IATK to fetch CloudFormation stack outputs. These outputs are references to deployed cloud components like the plugin tester AWS Step Functions workflow:

stack_outputs = self.iatk_client.get_stack_outputs(
    stack_name=self.plugin_tester_stack_name,
    output_names=[
        "PluginLifecycleWorkflow",
        "PluginSuccessEventRuleName"
    ],
)

The test class attaches a listener to the default event bus using an Event Rule provided in the stack outputs. The test uses this listener later to poll for events.

add_listener_output = self.iatk_client.add_listener(
    event_bus_name="default",
    rule_name=self.existing_rule_name
)

The test class cleans up the listener in the tearDown() method.

self.iatk_client.remove_listeners(
    ids=[self.listener_id]
)

Once the configurations are complete, the method test_minimal_plugin_event_published_polling() implements the actual test.

The test first initializes the trigger event.

trigger_event = {
    "eventHook": "postValidate",
    "pluginTitle": "PythonMinimalPlugin"
}

Next, the test starts an execution of the plugin tester Step Functions workflow. It uses the plugin_tester_arn that was fetched during setUp.

self.step_functions_client.start_execution(
    stateMachineArn=self.plugin_tester_arn,
    input=json.dumps(trigger_event)
)

The test polls the listener, waiting for the plugin to emit events. It stops polling once it hits the SLA timeout or receives the maximum number of messages.

poll_output = self.iatk_client.poll_events(
    listener_id=self.listener_id,
    wait_time_seconds=self.SLA_TIMEOUT_SECONDS,
    max_number_of_messages=1,
)

Finally, the test asserts that it receives the right number of events, and that they are well-formed.

self.assertEqual(len(poll_output.events), 1)
self.assertEqual(received_event["source"], "video.plugin.PythonMinimalPlugin")
self.assertEqual(received_event["detail-type"], "plugin-complete")

Installing prerequisites

You need the following prerequisites to build this example:

Build and deploy the example application components

  1. Use AWS SAM to build and deploy the plugin tester to your AWS account. The plugin tester is the Step Functions workflow shown in the preceding diagram. During the build process, you can add the --use-container flag to the build command to instruct AWS SAM to create the application in a provided container. You can accept or override the default values during the deploy process. You will use “Stack Name” and “AWS Region” later to run the integration test.
    cd plugins/plugin_tester # Move to the plugin tester directory
    
    sam build --use-container # Build the plugin tester
    

    sam build

  2. Deploy the tester:
    sam deploy --guided # Deploy the plugin tester

    Deploy the tester

  3. Once the plugin tester is deployed, use AWS SAM to deploy the plugin.
    cd ../2-postvalidate-plugins/python-minimal-plugin # Move to the plugin directory
    
    sam build --use-container # Build the plugin

    Deploy the plugin

  4. Deploy the plugin:
    sam deploy --guided # Deploy the plugin

Running the test

You can run tests written with IATK using standard Python test runners like unittest and pytest. The example application test uses unittest.

    1. Use a virtual environment to organize your dependencies. From the root of the example application, run:
      python3 -m venv .venv # Create the virtual environment
      source .venv/bin/activate # Activate the virtual environment
      
    2. Install the dependencies, including the IATK:
      cd tests 
      pip3 install -r requirements.txt
      
    3. Run the test, providing the required environment variables from the earlier deployments. You can find correct values in the samconfig.toml file of the plugin_tester directory.
      samconfig.toml

      cd integration
      
      PLUGIN_TESTER_STACK_NAME=video-plugin-tester \
      AWS_REGION=us-west-2 \
      python3 -m unittest ./test_by_polling.py

You should see output as unittest runs the test.

Open the Step Functions console in your AWS account, then choose the PluginLifecycleWorkflow-<random value> workflow to validate that the plugin tester successfully ran. A recent execution shows a Succeeded status:

Recent execution status

Review other IATK features

The example application includes examples of other IATK features like generating mock events and retrieving AWS X-Ray traces.

Cleaning up

Use AWS SAM to clean up both the plugin and the plugin tester resources from your AWS account.

  1. Delete the plugin resources:
    cd ../.. # Move to the plugin directory
    sam delete # Delete the plugin

    Deleting resources

  2. Delete the plugin tester resources:
    cd ../../plugin_tester # Move to the plugin tester directory
    sam delete # Delete the plugin tester

    Deleting the tester

The temporary test harness resources that IATK created during the test are cleaned up when the tearDown method runs. If there are problems during teardown, some resources may not be deleted. IATK adds tags to all resources that it creates. You can use these tags to locate the resources then manually remove them. You can also add your own tags.

Conclusion

The AWS Integrated Application Test Kit is a software library that provides conveniences to help you write automated tests for your cloud applications. This blog post shows some of the features of the initial Python version of the IATK.

To learn more about automated testing for serverless applications, visit serverlessland.com/testing. You can also view code examples at serverlessland.com/testing/patterns or at the AWS serverless-test-samples repository on GitHub.

For more serverless learning resources, visit Serverless Land.

Triggering AWS Lambda function from a cross-account Amazon Managed Streaming for Apache Kafka

Post Syndicated from Marcia Villalba original https://aws.amazon.com/blogs/compute/triggering-aws-lambda-function-from-a-cross-account-amazon-managed-streaming-for-apache-kafka/

This post is written by Subham Rakshit, Senior Specialist Solutions Architect, and Ismail Makhlouf, Senior Specialist Solutions Architect.

Many organizations use a multi-account strategy for stream processing applications. This involves decomposing the overall architecture into a single producer account and many consumer accounts. Within AWS, in the producer account, you can use Amazon Managed Streaming for Apache Kafka (Amazon MSK), and in their consumer accounts have AWS Lambda functions for event consumption. This blog post explains how you can trigger Lambda functions from a cross-account Amazon MSK cluster.

The Lambda event sourcing mapping (ESM) for Amazon MSK continuously polls for new events from the Amazon MSK cluster, aggregates them into batches, and then triggers the target Lambda function. The ESM for Amazon MSK functions as a serverless set of Kafka consumers that ensures that each event is processed at least once. Additionally, events are processed in the same order they are received within each Kafka partition. In addition, the ESM batches the stream of data and filters the events based on configured logic.

Overview

Amazon MSK supports two different deployment types: provisioned and serverless. Triggering a Lambda function from a cross-account Amazon MSK cluster is only supported with a provisioned cluster deployed within the same Region. To facilitate this functionality, Amazon MSK uses multi-VPC private connectivity, powered by AWS PrivateLink, which simplifies connecting Kafka consumers hosted in different AWS accounts to an Amazon MSK cluster.

The following diagram illustrates the architecture of this example:

Architecture Diagram

The architecture is divided in two parts: the producer and the consumer.

In the producer account, you have the Amazon MSK cluster with multi-VPC connectivity enabled. Multi-VPC connectivity is only available for authenticated Amazon MSK clusters. Cluster policies are required to grant permissions to other AWS accounts, allowing them to establish private connectivity to the Amazon MSK cluster. You can delegate permissions to relevant roles or users. When combined with AWS Identity and Access Management (IAM) client authentication, cluster policies offer fine-grained control over Kafka data plane permissions for connecting applications.

In the consumer account, you have the Lambda ESM for Amazon MSK and the managed VPC connection deployed within the same VPC. The managed VPC connection allows private connectivity from the consumer application VPC to the Amazon MSK cluster. The Lambda ESM for Amazon MSK connects to the cross-account Amazon MSK cluster via IAM authentication. It also supports SASL/SCRAM, and mutual TLS (mTLS) authenticated clusters. The ESM receives the event from the Kafka topic and invokes the Lambda function to process it.

Deploying the example application

To set up the Lambda function trigger from a cross-account Amazon MSK cluster as the event source, follow these steps. The AWS CloudFormation templates for deploying the example are accessible in the GitHub repository.

As a part of this example, some sample data is published using the Kafka console producer and Lambda processes these events and writes to Amazon S3.

Pre-requisites

For this example, you need two AWS accounts. This post uses the following naming conventions:

  • Producer (for example, account No: 1111 1111 1111): Account that hosts the Amazon MSK cluster and Kafka client instance.
  • Consumer (for example, account No: 2222 2222 2222): Account that hosts the Lambda function and consumes events from Amazon MSK.

To get started:

  1. Clone the repository locally:
    git clone https://github.com/aws-samples/lambda-cross-account-msk.git
  2. Set up the producer account: you must configure the VPC networking, deploy the Amazon MSK cluster, and a Kafka client instance to publish data. To do this, deploy the CloudFormation template producer-account.yaml from the AWS console and take note of the MSKClusterARN from the CloudFormation outputs tab.
  3. Set up the consumer account: To set up the consumer account, you need the Lambda function, IAM role used by the Lambda function, and S3 bucket receiving the data. For this, deploy the CloudFormation template consumer-account.yaml from the AWS console with the input parameter MSKAccountId, that is the producer AWS account ID (for example, account Id: 1111 1111 1111). Note the LambdaRoleArn from the CloudFormation outputs tab.

Setting up multi-VPC connectivity in the Amazon MSK cluster

Once the accounts are created, you must enable connectivity between them. By enabling multi-VPC private connectivity in the Amazon MSK cluster, you set up the network connection to allow the cross-account consumers to connect to the cluster.

  1. In the producer account, navigate to the Amazon MSK console.
  2. Choose producer-cluster, and go to the Properties tab.
  3. Scroll to Networking settings, choose Edit, and select Turn on multi-VPC connectivity. This takes some time, then appears as follows.Networking settings
  4. Add the necessary cluster policy to allow cross-account consumers to connect to Amazon MSK. In the producer account, deploy the CloudFormation template producer-msk-cluster-policy.yaml from the AWS console with the following input parameters:
    • MSKClusterArnAmazon Resource Name (ARN) of the Amazon MSK cluster in producer account. Find this information in the CloudFormation output of producer-account.yaml.
    • LambdaRoleArn – ARN of the IAM role attached to the Lambda function in the consumer account. Find this information in the CloudFormation output of consumer-account.yaml.
    • LambdaAccountId – Consumer AWS account ID (for example, account Id: 2222 2222 2222).

Creating a Kafka topic in Amazon MSK and publishing events

In the producer account, navigate to the Amazon MSK console. Choose the Amazon MSK cluster named producer-cluster. Choose View client information to show the bootstrap server.

Client information

The CloudFormation template also deploys a Kafka client instance to create topics and publish events.

To access the client, go to the Amazon EC2 console and choose the instance producer-KafkaClientInstance1. Connect to EC2 instance with Session Manager:

sudo su - ec2-user
#Set MSK Broker IAM endpoint
export BS=<<Provide IAM bootstrap address here>>

You must use the single-VPC Private endpoint for the Amazon MSK cluster and not the multi-VPC private endpoint, as you are going to publish events from a Kafka console producer from the producer account.

Run these scripts to create the customer topic and publish sample events in the topic:

./kafka_create_topic.sh
./kafka_produce_events.sh

Creating a managed VPC connection in the consumer account

To establish a connection to the Amazon MSK cluster in the producer account, you must create a managed VPC connection in the consumer account. Lambda communicates with cross-account Amazon MSK through this managed VPC connection.

For detailed setup steps, read the Amazon MSK managed VPC connection documentation.

Configuring the Lambda ESM for Amazon MSK

The final step is to set up the Lambda ESM for Amazon MSK. Setting up the ESM enables you to connect to the Amazon MSK cluster in the producer account via the managed VPC endpoint. This allows you to trigger the Lambda function to process the data produced from the Kafka topic:

  1. In the consumer account, go to the Lambda console.
  2. Open the Lambda function msk-lambda-cross-account-iam.
  3. Go to the Configuration tab, select Triggers, and choose Add Trigger.
  4. For Trigger configuration, select Amazon MSK.

Lambda trigger

To configure this trigger:

  1. Select the shared Amazon MSK cluster. This automatically defaults to the IAM authentication that is used to connect to the cluster.
    MSK Lambda trigger
  2. By default, the Active trigger check box is enabled. This ensures that the trigger is in the active state after creation. For the other values:
    1. Keep the Batch size default to 100.
    2. Change the Starting Position to Trim horizon.
    3. Set the Topic name as customer.
    4. Set the Consumer Group ID as msk-lambda-iam.

Trigger configuration

Scroll to the bottom and choose Add. This starts creating the Amazon MSK trigger, which takes several minutes. After creation, the state of the trigger shows as Enabled.

Verifying the output on the consumer side

The Lambda function receives the events and writes them in an S3 bucket.

To validate that the function is working, go to the consumer account and navigate to the S3 console. Search for the cross-account-lambda-consumer-data-<<REGION>>-<<AWS Account Id>> bucket. In the bucket, you see the customer-data-<<datetime>>.csv files.

S3 bucket objects

Cleaning up

You must empty and delete the S3 bucket, managed VPC connection, and the Lambda ESM for Amazon MSK manually from the consumer account. Next, delete the CloudFormation stacks from the AWS console from both the producer and consumer accounts to remove all other resources created as a part of the example.

Conclusion

With Lambda and Amazon MSK, you can now build a decentralized application distributed across multiple AWS accounts. This post shows how you can set up Amazon MSK as an event source for cross-account Lambda functions and also walks you through the configuration required in both producer and consumer accounts.

For further reading on AWS Lambda with Amazon MSK as an event source, visit the documentation.

For more serverless learning resources, visit Serverless Land.

Introducing AWS Step Functions redrive to recover from failures more easily

Post Syndicated from Benjamin Smith original https://aws.amazon.com/blogs/compute/introducing-aws-step-functions-redrive-a-new-way-to-restart-workflows/

Developers use AWS Step Functions, a visual workflow service to build distributed applications, automate IT and business processes, and orchestrate AWS services with minimal code.

Step Functions redrive for Standard Workflows allows you to redrive a failed workflow execution from its point of failure, rather than having to restart the entire workflow. This blog post explains how to use the new redrive feature to skip unnecessary workflow steps and reduce the cost of redriving failed workflows.

Handling workflow errors

Any workflow state can encounter runtime errors. Errors happen for various reasons, including state machine definition issues, task failures, incorrect permissions, and exceptions from downstream services. By default, when a state reports an error, Step Functions causes the workflow execution to fail. Step Functions allows you to handle errors by retrying, catching, and falling back to a defined state.

Now, you can also redrive the workflow from the failed state, skipping the successful prior workflow steps. This results in faster workflow completion and lower costs. You can only redrive a failed workflow execution from the step where it failed using the same input as the last non-successful state. You cannot redrive a failed workflow execution using a state machine definition that is different from the initial workflow execution.

Choosing between retry and redrive

Use the retry mechanism for transient issues such as network connectivity problems or momentary service unavailability You can configure the number of retries, along with intervals and back-off rates, providing the workflow with multiple attempts to complete a task successfully.

In scenarios where the underlying cause of an error requires longer investigation or resolution time, redrive becomes a valuable tool. Consider a situation where a downstream service experiences extended downtime or manual intervention is needed, such as updating a database or making code changes to a Lambda function. In these cases, being able to redrive the workflow can give you time to address the root cause before resuming the workflow execution.

Combining retry and redrive

Adopt a hybrid strategy that combines retry and redrive mechanisms:

  1. Retry mechanism: Configure an initial set of retries for automatically resolvable errors. This ensures that transient issues are promptly addressed, and the workflow proceeds without unnecessary delays.
  2. Error catching and redrive: If the retry mechanism exhausts without success, allow the state to fail and use the redrive feature to restart the workflow from the last non-successful state. This approach allows for intervention where errors persist or require external actions.

Reducing costs

AWS charges for Standard Workflows based on the number of state transitions required to run a workload. Step Functions counts a state transition each time a step of your workflow runs. Step Functions charges for the total number of state transitions across state machines, including retries. The cost is $0.025 per 1,000 state transitions. This means that reducing the number of state transitions reduces the cost of running your Standard Workflows.

If a workflow has many steps, includes parallel or map states, or is prone to errors that require frequent re-runs, this new feature reduces the costs incurred. You pay only for each state transition after the failed state and those costs for every downstream service invoked as part of the re-run.

The following example explains the cost implications of retrying a workflow that has failed, with and without redrive. In this example, a Step Functions workflow orchestrates Amazon Transcribe to generate a text transcription from an .mp4 file.

Since the failed state occurs towards the end of this workflow, the redrive execution does not run the successful states, reducing the overall successful completion time. If this workflow were to fail regularly, the reduction in transitions and execution duration becomes increasingly valuable.

The first time this workflow runs, the final state, which uses an AWS Lambda function to make an HTTP request fails with an IAM error. This is because the workflow does not have the required permissions to invoke the Lambda function. After granting the required permissions to the workflow’s execution role, redrive to continue the workflow from the failed state.

After the redrive, Step Functions workflow reports a different failure. This time it is related to the configuration of the Lambda function. This is an example of a downstream failure that does not require an update to my workflow definition.

After resolving the Lambda configuration issue and redriving the workflow, the execution completes successfully. The following image shows the execution details, including the number of redrives, the total state transitions, and the last redrive time:

Getting started with redrive

Redrive works for Standard Workflows only. You can redrive a workflow from its failed step programmatically, via the AWS CLI or AWS SDK, or using the Step Functions console, which provides a visual operator experience:

  1. From the Step Functions console, select the failed workflow you want to redrive, and choose Redrive.
  2. A modal appears with the execution details. Choose Redrive execution.

The state to redrive from, the workflow definition, and the previous input are immutable.

To redrive a workflow execution programmatically from its point of failure, call the new Redrive Execution API action. The same workflow execution starts from the last non-successful state and uses the same input as the last non-successful state from the initial failed workflow execution.

Programmatically catching failed workflow executions to redrive

Step Functions can process workloads autonomously, without the need for human interaction, or can include intervention from a user by implementing the .waitForTastToken pattern.

Redrive is for unhandled and unexpected errors only. Handling errors within a workflow using the built-in mechanisms for catch, retry, and routing to a Fail state, does not permit the workflow to redrive. However, it is possible to detect in near real-time when a workflow has failed, and programmatically redrive. When a workflow fails, it emits an event onto the Amazon EventBridge default event bus. The event looks like the following JSON object:

There are four new key/values pairs in this event:

"redriveCount": 0, 
"redriveDate": null, 
"redriveStatus": "REDRIVABLE", 
"redriveStatusReason": null,

The redrive count shows how many times the workflow has previously been redriven. The redrive status shows if the failed workflow is eligible for redrive execution.

To programmatically redrive the workflow from the failed state. Create a rule that pattern matches this event, and route the event onto a target service to handle the error. The target service uses the new States.RedriveExecution API to redrive the workflow.

Download and deploy the previous pattern from this example on serverlessland.com.

In the following example, the first state sends a post request to an API endpoint. If the request fails due to network connectivity or latency issues, the state retries. If the retry fails, then Step Functions emits a ` Step Functions Execution Status Change event onto the EventBridge default event bus. An EventBridge rule routes this event to a service where you can rectify this error and then redrive the task using the Step Functions API.

The new redrive feature also supports the distributed map state.

Redrive for express child workflow executions

For failed child workflow executions that are Express Workflows within a Distributed Map, the redrive capability ensures a seamless restart from the beginning of the child workflow. This allows you to resolve issues that are specific to individual iterations without restarting the entire map.

Redrive for standard child workflow executions

For failed child workflow executions within a Distributed Map that are Standard Workflows, the redrive feature functions in the same way in standalone Standard Workflows. You can restart the failed iteration from its point of failure, skipping unnecessary steps that have already successfully executed.

Conclusion

Step Functions redrive for Standard Workflows allows you to redrive a failed workflow execution from its point of failure rather than having to restart the entire workflow. This results in faster workflow completion and lower costs for processing failed executions. This is because it minimizes the number of state transitions and downstream service invocations.

Visit the Serverless Workflows Collection to browse the many deployable workflows to help build your serverless applications.

Clean up your Excel and CSV files without writing code using AWS Glue DataBrew

Post Syndicated from Ismail Makhlouf original https://aws.amazon.com/blogs/big-data/clean-up-your-excel-and-csv-files-without-writing-code-using-aws-glue-databrew/

Managing data within an organization is complex. Handling data from outside the organization adds even more complexity. As the organization receives data from multiple external vendors, it often arrives in different formats, typically Excel or CSV files, with each vendor using their own unique data layout and structure. In this blog post, we’ll explore a solution that streamlines this process by leveraging the capabilities of AWS Glue DataBrew.

DataBrew is an excellent tool for data quality and preprocessing. You can use its built-in transformations, recipes, as well as integrations with the AWS Glue Data Catalog and Amazon Simple Storage Service (Amazon S3) to preprocess the data in your landing zone, clean it up, and send it downstream for analytical processing.

In this post, we demonstrate the following:

  • Extracting non-transactional metadata from the top rows of a file and merging it with transactional data
  • Combining multi-line rows into single-line rows
  • Extracting unique identifiers from within strings or text

Solution overview

For this use case, imagine you’re a data analyst working at your organization. The sales leadership have requested a consolidated view of the net sales they are making from each of the organization’s suppliers. Unfortunately, this information is not available in a database. The sales data comes from each supplier in layouts like the following example.

However, with hundreds of resellers, manually extracting the information at the top is not feasible. Your goal is to clean up and flatten the data into the following output layout.

image2

To achieve this, you can use pre-built transformations in DataBrew to quickly get the data in the layout you want.

Prerequisites

For this walkthrough, you should have the following prerequisites:

Connect to the dataset

The first thing we need to do is upload the input dataset to Amazon S3. Create an S3 bucket for the project and create a folder to upload the raw input data. The output data will be stored in another folder in a later step.

Next, we need to connect DataBrew to our CSV file. We create what we call a dataset, which
is an artifact that points to whatever data source we will be using. Navigate to “Datasets” on
the left hand menu.

Ensure the Column header values field is set to Add default header. The input CSV has an irregular format, so the first row will not have the needed column values.

Create a project

To create a new project, complete the following steps:

  1. On the DataBrew console, choose Projects in the navigation pane.
  2. Choose Create project.
  3. For Project name, enter FoodMartSales-AllUpProject.
  4. For Attached recipe, choose Create new recipe.
  5. For Recipe name, enter FoodMartSales-AllUpProject-recipe.
  6. For Select a dataset, select My datasets.
  7. Select the FoodMartSales-AllUp dataset.
  8. Under Permissions, for Role name, choose the IAM role you created as a prerequisite or create a new role.
  9. Choose Create project.

After the project is opened, an interactive session is created where you can author transformations on a sample of the data.

Extract non-transactional metadata from within the contents of the file and merge it with transactional data

In this section, we consider data that has metadata on the first few rows of the file, followed by transactional data. We walk through how to extract data relevant to the whole file from the top of the document and combine it with the transactional data into one flat table.

Extract metadata from the header and remove invalid rows

Complete the following steps to extract metadata from the header:

  1. Choose Conditions and then choose IF.
  2. For Matching conditions, choose Match all conditions.
  3. For Source, choose Value of and Column_1.
  4. For Logical condition, choose Is exactly.
  5. For Enter a value, choose Enter custom value and enter RESELLER NAME.
  6. For Flag result value as, choose Custom value.
  7. For Value if true, choose Select source column and set Value of to Column_2.
  8. For Value if false, choose Enter custom value and enter INVALID.
  9. Choose Apply.

Your dataset should now look like the following screenshot, with the Reseller Name value extracted to a column by itself.

Next, you remove invalid rows and fill the rows with the Reseller Name value.

  1. Choose Clean and then choose Custom values.
  2. For Source column, choose ResellerName.
  3. For Specify values to remove, choose Custom value.
  4. For Values to remove, choose Invalid.
  5. For Apply transform to, choose All rows.
  6. Choose Apply.
  7. Choose Missing and then choose Fill with most frequent value.
  8. For Source column, choose FirstTransactionDate.
  9. For Missing value action, choose Fill with most frequent value.
  10. For Apply transform to, choose All rows.
  11. Choose Apply.

Your dataset should now look like the following screenshot, with the Reseller Name value extracted to a column by itself.

Repeat the same steps in this section for the rest of the metadata, including Reseller Email Address, Reseller ID, and First Transaction Date.

Promote column headers and clean up data

To promote column headers, complete the following steps:

  1. Reorder the columns to put the metadata columns to the left of the dataset by choosing Column, Move column, and Start of the table.
  2. Rename the columns with the appropriate names.

Now you can clean up some columns and rows.

  1. Delete unnecessary columns, such as Column_7.

You can also delete invalid rows by filtering out records that don’t have a transaction date value.

  1. Choose the ABC icon on the menu of the Transaction_Date column and choose date.

  2. For Handle invalid values, select Delete rows, then choose Apply.

The dataset should now have the metadata extracted and the column headers promoted.

Combine multi-line rows into single-line rows

The next issue to address is transactions pertaining to the same row that are split across multiple lines. In the following steps, we extract the needed data from the rows and merge it into single-line transactions. For this example specifically, the Reseller Margin data is split across two lines.


Complete the following steps to get the Reseller Margin value on the same line as the corresponding transaction. First, we identify the Reseller Margin rows and store them in a temporary column.

  1. Choose Conditions and then choose IF.
  2. For Matching conditions, choose Match all conditions.
  3. For Source, choose Value of and Transaction_ID.
  4. For Logical condition, choose Contains.
  5. For Enter a value, choose Enter custom value and enter Reseller Margin.
  6. For Flag result value as, choose Custom value.
  7. For Value if true, choose Select source column set Value of to TransactionAmount.
  8. For Value if false, choose Enter custom value and enter Invalid.
  9. For Destination column, choose ResellerMargin_Temp.
  10. Choose Apply.

Next, you shift the Reseller Margin value up one row.

  1. Choose Functions and then choose NEXT.
  2. For Source column, choose ResellerMargin_Temp.
  3. For Number of rows, enter 1.
  4. For Destination column, choose ResellerMargin.
  5. For Apply transform to, choose All rows.
  6. Choose Apply.

Next, delete the invalid rows.

  1. Choose Missing and then choose Remove missing rows.
  2. For Source column, choose TransactionDate.
  3. For Missing value action, choose Delete rows with missing values.
  4. For Apply transform to, choose All rows.
  5. Choose Apply.

Your dataset should now look like the following screenshot, with the Reseller Margin value extracted to a column by itself.

With the data structured properly, we can move on to mining the cleaned data.

Extract unique identifiers from within strings and text

Many types of data contain important information stored as unstructured text in a cell. In this section, we look at how to extract this data. Within the sample dataset, the BankTransferText column has valuable information around our resellers’ registered bank account numbers as well as the currency of the transaction, namely IBAN, SWIFT Code, and Currency.

Complete the following steps to extract IBAN, SWIFT code, and Currency into separate columns. First, you extract the IBAN number from the text using a regular expression (regex).

  1. Choose Extract and then choose Custom value or pattern.
  2. For Create column options, choose Extract values.
  3. For Source column, choose BankTransferText.
  4. For Extract options, choose Custom value or pattern.
  5. For Values to extract, enter [a-zA-Z][a-zA-Z][0-9]{2}[A-Z0-9]{1,30}.
  6. For Destination column, choose IBAN.
  7. For Apply transform to, choose All rows.
  8. Choose Apply.
  9. Extract the SWIFT code from the text using a regex following the same steps used to extract the IBAN number, but using the following regex instead: (?!^)(SWIFT Code: )([A-Z]{2}[A-Z0-9]+).

Next, remove the SWIFT Code: label from the extracted text.

  1. Choose Remove and then choose Custom values.
  2. For Source column, choose SWIFT Code.
  3. For Specify values to remove, choose Custom value.
  4. For Apply transform to, choose All rows.
  5. Extract the currency from the text using a regex following the same steps used to extract the IBAN number, but using the following regex instead: (?!^)(Currency: )([A-Z]{3}).
  6. Remove the Currency: label from the extracted text following the same steps used to remove the SWIFT Code: label.

You can clean up by deleting any unnecessary columns.

  1. Choose Column and then choose Delete.
  2. For Source columns, choose BankTransferText.
  3. Choose Apply.
  4. Repeat for any remaining columns.

Your dataset should now look like the following screenshot, with IBAN, SWIFT Code, and Currency extracted to separate columns.

Write the transformed data to Amazon S3

With all the steps captured in the recipe, the last step is to write the transformed data to Amazon S3.

  1. On the DataBrew console, choose Run job.
  1. For Job name, enter FoodMartSalesToDataLake.
  2. For Output to, choose Amazon S3.
  3. For File type, choose CSV.
  4. For Delimiter, choose Comma (,).
  5. For Compression, choose None.
  6. For S3 bucket owners’ account, select Current AWS account.
  7. For S3 location, enter s3://{name of S3 bucket}/clean/.
  8. For Role name, choose the IAM role created as a prerequisite or create a new role.
  9. Choose Create and run job.
  10. Go to the Jobs tab and wait for the job to complete.
  11. Navigate to the job output folder on the Amazon S3 console.
  12. Download the CSV file and view the transformed output.

Your dataset should look similar to the following screenshot.

Clean up

To optimize cost, make sure to clean up the resources deployed for this project by completing the following steps:

  1. Delete every DataBrew project along with their linked recipes.
  2. Delete all the DataBrew datasets.
  3. Delete the contents in your S3 bucket.
  4. Delete the S3 bucket.

Conclusion

The reality of exchanging data with suppliers is that we can’t always control the shape of the input data. With DataBrew, we can use a list of pre-built transformations and repeatable steps to transform incoming data into a desired layout and extract relevant data and insights from Excel or CSV files. Start using DataBrew today and transform 3 rd party files into structured datasets ready for consumption by your business.


About the Author

Ismail Makhlouf is a Senior Specialist Solutions Architect for Data Analytics at AWS. Ismail focuses on architecting solutions for organizations across their end-to-end data analytics estate, including batch and real-time streaming, big data, data warehousing, and data lake workloads. He primarily works with direct-to-consumer platform companies in the ecommerce, FinTech, PropTech, and HealthTech space to achieve their business objectives with well-architected data platforms.

Managing AWS Lambda runtime upgrades

Post Syndicated from Julian Wood original https://aws.amazon.com/blogs/compute/managing-aws-lambda-runtime-upgrades/

This post is written by Julian Wood, Principal Developer Advocate, and Dan Fox, Principal Specialist Serverless Solutions Architect.

AWS Lambda supports multiple programming languages through the use of runtimes. A Lambda runtime provides a language-specific execution environment, which provides the OS, language support, and additional settings, such as environment variables and certificates that you can access from your function code.

You can use managed runtimes that Lambda provides or build your own. Each major programming language release has a separate managed runtime, with a unique runtime identifier, such as python3.11 or nodejs20.x.

Lambda automatically applies patches and security updates to all managed runtimes and their corresponding container base images. Automatic runtime patching is one of the features customers love most about Lambda. When these patches are no longer available, Lambda ends support for the runtime. Over the next few months, Lambda is deprecating a number of popular runtimes, triggered by end of life of upstream language versions and of Amazon Linux 1.

Runtime Deprecation
Node.js 14 Nov 27, 2023
Node.js 16 Mar 11, 2024
Python 3.7 Nov 27, 2023
Java 8 (Amazon Linux 1) Dec 31, 2023
Go 1.x Dec 31, 2023
Ruby 2.7 Dec 07, 2023
Custom Runtime (provided) Dec 31, 2023

Runtime deprecation is not unique to Lambda. You must upgrade code using Python 3.7 or Node.js 14 when those language versions reach end of life, regardless of which compute service your code is running on. Lambda can help make this easier by tracking which runtimes you are using and providing deprecation notifications.

This post contains considerations and best practices for managing runtime deprecations and upgrades when using Lambda. Adopting these techniques makes managing runtime upgrades easier, especially when working with a large number of functions.

Specifying Lambda runtimes

When you deploy your function as a .zip file archive, you choose a runtime when you create the function. To change the runtime, you can update your function’s configuration.

Lambda keeps each managed runtime up to date by taking on the operational burden of patching the runtimes with security updates, bug fixes, new features, performance enhancements, and support for minor version releases. These runtime updates are published as runtime versions. Lambda applies runtime updates to functions by migrating the function from an earlier runtime version to a new runtime version.

You can control how your functions receive these updates using runtime management controls. Runtime versions and runtime updates apply to patch updates for a given Lambda runtime. Lambda does not automatically upgrade functions between major language runtime versions, for example, from nodejs14.x to nodejs18.x.

For a function defined as a container image, you choose a runtime and the Linux distribution when you create the container image. Most customers start with one of the Lambda base container images, although you can also build your own images from scratch. To change the runtime, you create a new container image from a different base container image.

Why does Lambda deprecate runtimes?

Lambda deprecates a runtime when upstream runtime language maintainers mark their language end-of-life or security updates are no longer available.

In almost all cases, the end-of-life date of a language version or operating system is published well in advance. The Lambda runtime deprecation policy gives end-of-life schedules for each language that Lambda supports. Lambda notifies you by email and via your Personal Health Dashboard if you are using a runtime that is scheduled for deprecation.

Lambda runtime deprecation happens in several stages. Lambda first blocks creating new functions that use a given runtime. Lambda later also blocks updating existing functions using the unsupported runtime, except to update to a supported runtime. Lambda does not block invocations of functions that use a deprecated runtime. Function invocations continue indefinitely after the runtime reaches end of support.

Lambda is extending the deprecation notification period from 60 days before deprecation to 180 days. Previously, blocking new function creation happened at deprecation and blocking updates to existing functions 30 days later. Blocking creation of new functions now happens 30 days after deprecation, and blocking updates to existing functions 60 days after.

Lambda occasionally delays deprecation of a Lambda runtime for a limited period beyond the end of support date of the language version that the runtime supports. During this period, Lambda only applies security patches to the runtime OS. Lambda doesn’t apply security patches to programming language runtimes after they reach their end of support date.

Can Lambda automatically upgrade my runtime?

Moving from one major version of the language runtime to another has a significant risk of being a breaking change. Some libraries and dependencies within a language have deprecation schedules and do not support versions of a language past a certain point. Moving functions to new runtimes could potentially impact large-scale production workloads that customers depend on.

Since Lambda cannot guarantee backward compatibility between major language versions, upgrading the Lambda runtime used by a function is a customer-driven operation.

Lambda function versions

You can use function versions to manage the deployment of your functions. In Lambda, you make code and configuration changes to the default function version, which is called $LATEST. When you publish a function version, Lambda takes a snapshot of the code, runtime, and function configuration to maintain a consistent experience for users of that function version. When you invoke a function, you can specify the version to use or invoke the $LATEST version. Lambda function versions are required when using Provisioned Concurrency or SnapStart.

Some developers use an auto-versioning process by creating a new function version each time they deploy a change. This results in many versions of a function, with only a single version actually in use.

While Lambda applies runtime updates to published function versions, you cannot update the runtime major version for a published function version, for example from Node.js 16 to Node.js 20. To update the runtime for a function, you must update the $LATEST version, then create a new published function version if necessary. This means that different versions of a function can use different runtimes. The following shows the same function with version 1 using Node.js 14.x and version 2 using Node.js 18.x.

Version 1 using Node.js 14.x

Version 1 using Node.js 14.x

Version 2 using Node.js 18.x

Version 2 using Node.js 18.x

Ensure you create a maintenance process for deleting unused function versions, which also impact your Lambda storage quota.

Managing function runtime upgrades

Managing function runtime upgrades should be part of your software delivery lifecycle, in a similar way to how you treat dependencies and security updates. You need to understand which functions are being actively used in your organization. Organizations can create prioritization based on security profiles and/or function usage. You can use the same communication mechanisms you may already be using for handling security vulnerabilities.

Implement preventative guardrails to ensure that developers can only create functions using supported runtimes. Using infrastructure as code, CI/CD pipelines, and robust testing practices makes updating runtimes easier.

Identifying impacted functions

There are tools available to check Lambda runtime configuration and to identify which functions and what published function versions are actually in use. Deleting a function or function version that is no longer in use is the simplest way to avoid runtime deprecations.

You can identify functions using deprecated or soon to be deprecated runtimes using AWS Trusted Advisor. Use the AWS Lambda Functions Using Deprecated Runtimes check, in the Security category that provides 120 days’ notice.

AWS Trusted Advisor Lambda functions using deprecated runtimes

AWS Trusted Advisor Lambda functions using deprecated runtimes

Trusted Advisor scans all versions of your functions, including $LATEST and published versions.

The AWS Command Line Interface (AWS CLI) can list all functions in a specific Region that are using a specific runtime. To find all functions in your account, repeat the following command for each AWS Region and account. Replace the <REGION> and <RUNTIME> parameters with your values. The --function-version ALL parameter causes all function versions to be returned; omit this parameter to return only the $LATEST version.

aws lambda list-functions --function-version ALL --region <REGION> --output text —query "Functions[?Runtime=='<RUNTIME>'].FunctionArn"

You can use AWS Config to create a view of the configuration of resources in your account and also store configuration snapshot data in Amazon S3. AWS Config queries do not support published function versions, they can only query the $LATEST version.

You can then use Amazon Athena and Amazon QuickSight to make dashboards to visualize AWS Config data. For more information, see the Implementing governance in depth for serverless applications learning guide.

Dashboard showing AWS Config data

Dashboard showing AWS Config data

There are a number of ways that you can track Lambda function usage.

You can use Amazon CloudWatch metrics explorer to view Lambda by runtime and track the Invocations metric within the default CloudWatch metrics retention period of 15 months.

Track invocations in Amazon CloudWatch metrics

Track invocations in Amazon CloudWatch metrics

You can turn on AWS CloudTrail data event logging to log an event every time Lambda functions are invoked. This helps you understand what identities are invoking functions and the frequency of their invocations.

AWS Cost and Usage Reports can show which functions are incurring cost and in use.

Limiting runtime usage

AWS CloudFormation Guard is an open-source evaluation tool to validate infrastructure as code templates. Create policy rules to ensure that developers only chose approved runtimes. For more information, see Preventative Controls with AWS CloudFormation Guard.

AWS Config rules allow you to check that Lambda function settings for the runtime match expected values. For more information on running these rules before deployment, see Preventative Controls with AWS Config. You can also reactively flag functions as non-compliant as your governance policies evolve. For more information, see Detective Controls with AWS Config.

Lambda does not currently have service control policies (SCP) to block function creation based on the runtime

Upgrade best practices

Use infrastructure as code tools to build and manage your Lambda functions, which can make it easier to manage upgrades.

Ensure you run tests against your functions when developing locally. Include automated tests as part of your CI/CD pipelines to provide confidence in your runtime upgrades. When rolling out function upgrades, you can use weighted aliases to shift traffic between two function versions as you monitor for errors and failures.

Using runtimes after deprecation

AWS strongly advises you to upgrade your functions to a supported runtime before deprecation to continue to benefit from security patches, bug-fixes, and the latest runtime features. While deprecation does not affect function invocations, you will be using an unsupported runtime, which may have unpatched security vulnerabilities. Your function may eventually stop working, for example, due to a certificate expiry.

Lambda blocks function creation and updates for functions using deprecated runtimes. To create or update functions after these operations are blocked, contact AWS Support.

Conclusion

Lambda is deprecating a number of popular runtimes over the next few months, reflecting the end-of-life of upstream language versions and Amazon Linux 1. This post covers considerations for managing Lambda function runtime upgrades.

For more serverless learning resources, visit Serverless Land.

Node.js 20.x runtime now available in AWS Lambda

Post Syndicated from Pascal Vogel original https://aws.amazon.com/blogs/compute/node-js-20-x-runtime-now-available-in-aws-lambda/

This post is written by Pascal Vogel, Solutions Architect, and Andrea Amorosi, Senior Solutions Architect.

You can now develop AWS Lambda functions using the Node.js 20 runtime. This Node.js version is in active LTS status and ready for general use. To use this new version, specify a runtime parameter value of nodejs20.x when creating or updating functions or by using the appropriate container base image.

You can use Node.js 20 with Powertools for AWS Lambda (TypeScript), a developer toolkit to implement serverless best practices and increase developer velocity. Powertools for AWS Lambda includes proven libraries to support common patterns such as observability, Parameter Store integration, idempotency, batch processing, and more.

You can also use Node.js 20 with Lambda@Edge, allowing you to customize low-latency content delivered through Amazon CloudFront.

This blog post highlights important changes to the Node.js runtime, notable Node.js language updates, and how you can use the new Node.js 20 runtime in your serverless applications.

Node.js 20 runtime updates

Changes to Root CA certificate loading

By default, Node.js includes root certificate authority (CA) certificates from well-known certificate providers. Earlier Lambda Node.js runtimes up to Node.js 18 augmented these certificates with Amazon-specific CA certificates, making it easier to create functions accessing other AWS services. For example, it included the Amazon RDS certificates necessary for validating the server identity certificate installed on your Amazon RDS database.

However, loading these additional certificates has a performance impact during cold start. Starting with Node.js 20, Lambda no longer loads these additional CA certificates by default. The Node.js 20 runtime contains a certificate file with all Amazon CA certificates located at /var/runtime/ca-cert.pem. By setting the NODE_EXTRA_CA_CERTS environment variable to /var/runtime/ca-cert.pem, you can restore the behavior from Node.js 18 and earlier runtimes.

This causes Node.js to validate and load all Amazon CA certificates during a cold start. It can take longer compared to loading only specific certificates. For the best performance, we recommend bundling only the certificates that you need with your deployment package and loading them via NODE_EXTRA_CA_CERTS. The certificates file should consist of one or more trusted root or intermediate CA certificates in PEM format.

For example, for RDS, include the required certificates alongside your code as certificates/rds.pem and then load it as follows:

NODE_EXTRA_CA_CERTS=/var/task/certificates/rds.pem

See Using Lambda environment variables in the AWS Lambda Developer Guide for detailed instructions for setting environment variables.

Amazon Linux 2023

The Node.js 20 runtime is based on the provided.al2023 runtime. The provided.al2023 runtime in turn is based on the Amazon Linux 2023 minimal container image release and brings several improvements over Amazon Linux 2 (AL2).

provided.al2023 contains only the essential components necessary to install other packages and offers a smaller deployment footprint with a compressed image size of less than 40MB compared to the over 100MB AL2-based base image.

With glibc version 2.34, customers have access to a more recent version of glibc, updated from version 2.26 in AL2-based images.

The Amazon Linux 2023 minimal image uses microdnf as package manager, symlinked as dnf, replacing yum in AL2-based images. Additionally, curl and gnupg2 are also included as their minimal versions curl-minimal and gnupg2-minimal.

Learn more about the provided.al2023 runtime in the blog post Introducing the Amazon Linux 2023 runtime for AWS Lambda and the Amazon Linux 2023 launch blog post.

Runtime Interface Client

The Node.js 20 runtime uses the open source AWS Lambda NodeJS Runtime Interface Client (RIC). You can now use the same RIC version in your Open Container Initiative (OCI) Lambda container images as the one used by the managed Node.js 20 runtime.

The Node.js 20 runtime supports Lambda response streaming which enables you to send response payload data to callers as it becomes available. Response streaming can improve application performance by reducing time-to-first-byte, can indicate progress during long-running tasks, and allows you to build functions that return payloads larger than 6MB, which is the Lambda limit for buffered responses.

Setting Node.js heap memory size

Node.js allows you to configure the heap size of the v8 engine via the --max-old-space-size and --max-semi-space-size options. By default, Lambda overrides the Node.js default values with values derived from the memory size configured for the function. If you need control over your runtime’s memory allocation, you can now set both of these options using the NODE_OPTIONS environment variable, without needing an exec wrapper script. See Using Lambda environment variables in the AWS Lambda Developer Guide for details.

Use the --max-old-space-size option to set the max memory size of V8’s old memory section, and the --max-semi-space-size option to set the maximum semispace size for V8’s garbage collector. See the Node.js documentation for more details on these options.

Node.js 20 language updates

Language features

With this release, Lambda customers can take advantage of new Node.js 20 language features, including:

  • HTTP(S)/1.1 default keepAlive: Node.js now sets keepAlive to true by default. Any outgoing HTTPs connections use HTTP 1.1 keep-alive with a default waiting window of 5 seconds. This can deliver improved throughput as connections are reused by default.
  • Fetch API is enabled by default: The global Node.js Fetch API is enabled by default. However, it is still an experimental module.
  • Faster URL parsing: Node.js 20 comes with the Ada 2.0 URL parser which brings performance improvements to URL parsing. This has also been back-ported to Node.js 18.7.0.
  • Web Crypto API now stable: The Node.js implementation of the standard Web Crypto API has been marked as stable. You can access the provided cryptographic primitives through globalThis.crypto.
  • Web assembly support: Node.js 20 enables the experimental WebAssembly System Interface (WASI) API by default without the need to set an experimental flag.

For a detailed overview of Node.js 20 language features, see the Node.js 20 release blog post and the Node.js 20 changelog.

Performance considerations

Node.js 19.3 introduced a change that impacts how non-essential modules are lazy-loaded during the Node.js process startup. In terms of the impact to your Lambda functions, this reduces the work during initialization of each execution environment, then if used, the modules will instead be loaded during the first function invoke. This change remains in Node.js 20.

Builders should continue to measure and test function performance and optimize function code and configuration for any impact. To learn more about how to optimize Node.js performance in Lambda, see Performance optimization in the Lambda Operator Guide, and our blog post Optimizing Node.js dependencies in AWS Lambda.

Migration from earlier Node.js runtimes

Migration from Node.js 16

Lambda occasionally delays deprecation of a Lambda runtime for a limited period beyond the end of support date of the language version that the runtime supports. During this period, Lambda only applies security patches to the runtime OS. Lambda doesn’t apply security patches to programming language runtimes after they reach their end of support date.

In the case of Node.js 16, we have delayed deprecation from the community end of support date on September 11, 2023, to June 12, 2024. This gives customers the opportunity to migrate directly from Node.js 16 to Node.js 20, skipping Node.js 18.

AWS SDK for JavaScript

Up until Node.js 16, Lambda’s Node.js runtimes included the AWS SDK for JavaScript version 2. This has since been superseded by the AWS SDK for JavaScript version 3, which was released in December 2020. Starting with Node.js 18, and continuing with Node.js 20, the Lambda Node.js runtimes have upgraded the version of the AWS SDK for JavaScript included in the runtime from v2 to v3. Customers upgrading from Node.js 16 or earlier runtimes who are using the included AWS SDK for JavaScript v2 should upgrade their code to use the v3 SDK.

For optimal performance, and to have full control over your code dependencies, we recommend bundling and minifying the AWS SDK in your deployment package, rather than using the SDK included in the runtime. For more information, see Optimizing Node.js dependencies in AWS Lambda.

Using the Node.js 20 runtime in AWS Lambda

AWS Management Console

To use the Node.js 20 runtime to develop your Lambda functions, specify a runtime parameter value Node.js 20.x when creating or updating a function. The Node.js 20 runtime version is now available in the Runtime dropdown on the Create function page in the AWS Lambda console:

Select Node.js 20.x when creating a new AWS Lambda function in the AWS Management Console

To update an existing Lambda function to Node.js 20, navigate to the function in the Lambda console, then choose Edit in the Runtime settings panel. The new version of Node.js is available in the Runtime dropdown:

Select Node.js 20.x when updating an existing AWS Lambda function in the AWS Management Console

AWS Lambda – Container Image

Change the Node.js base image version by modifying the FROM statement in your Dockerfile:


FROM public.ecr.aws/lambda/nodejs:20
# Copy function code
COPY lambda_handler.xx ${LAMBDA_TASK_ROOT}

Customers running Node.js 20 Docker images locally, including customers using AWS SAM, will need to upgrade their Docker install to version 20.10.10 or later.

AWS Serverless Application Model (AWS SAM)

In AWS SAM, set the Runtime attribute to node20.x to use this version:


AWSTemplateFormatVersion: "2010-09-09"
Transform: AWS::Serverless-2016-10-31

Resources:
  MyFunction:
    Type: AWS::Serverless::Function
    Properties:
      Handler: lambda_function.lambda_handler
      Runtime: nodejs20.x
      CodeUri: my_function/.
      Description: My Node.js Lambda Function

AWS Cloud Development Kit (AWS CDK)

In the AWS CDK, set the runtime attribute to Runtime.NODEJS_20_X to use this version:


import * as cdk from "aws-cdk-lib";
import * as lambda from "aws-cdk-lib/aws-lambda";
import * as path from "path";
import { Construct } from "constructs";

export class CdkStack extends cdk.Stack {
  constructor(scope: Construct, id: string, props?: cdk.StackProps) {
    super(scope, id, props);

    // The code that defines your stack goes here

    // The Node.js 20 enabled Lambda Function
    const lambdaFunction = new lambda.Function(this, "node20LambdaFunction", {
      runtime: lambda.Runtime.NODEJS_20_X,
      code: lambda.Code.fromAsset(path.join(__dirname, "/../lambda")),
      handler: "index.handler",
    });
  }
}

Conclusion

Lambda now supports Node.js 20. This release uses the Amazon Linux 2023 OS, supports configurable CA certificate loading for faster cold starts, as well as other improvements detailed in this blog post.

You can build and deploy functions using the Node.js 20 runtime using the AWS Management Console, AWS CLI, AWS SDK, AWS SAM, AWS CDK, or your choice of Infrastructure as Code (IaC). You can also use the Node.js 20 container base image if you prefer to build and deploy your functions using container images.

The Node.js 20 runtime empowers developers to build more efficient, powerful, and scalable serverless applications. Try the Node.js runtime in Lambda today and read about the Node.js programming model in the Lambda documentation to learn more about writing functions in Node.js 20.

For more serverless learning resources, visit Serverless Land.

Converting Apache Kafka events from Avro to JSON using EventBridge Pipes

Post Syndicated from Pascal Vogel original https://aws.amazon.com/blogs/compute/converting-apache-kafka-events-from-avro-to-json-using-eventbridge-pipes/

This post is written by Pascal Vogel, Solutions Architect, and Philipp Klose, Global Solutions Architect.

Event streaming with Apache Kafka has become an important element of modern data-oriented and event-driven architectures (EDAs), unlocking use cases such as real-time analytics of user behavior, anomaly and fraud detection, and Internet of Things event processing. Stream producers and consumers in Kafka often use schema registries to ensure that all components follow agreed-upon event structures when sending (serializing) and processing (deserializing) events to avoid application bugs and crashes.

A common schema format in Kafka is Apache Avro, which supports rich data structures in a compact binary format. To integrate Kafka with other AWS and third-party services more easily, AWS offers Amazon EventBridge Pipes, a serverless point-to-point integration service. However, many downstream services expect JSON-encoded events, requiring custom, and repetitive schema validation and conversion logic from Avro to JSON in each downstream service.

This blog post shows how to reliably consume, validate, convert, and send Avro events from Kafka to AWS and third-party services using EventBridge Pipes, allowing you to reduce custom deserialization logic in downstream services. You can also use EventBridge event buses as targets in Pipes to filter and distribute events from Pipes to multiple targets, including cross-account and cross-Region delivery.

This blog describes two scenarios:

  1. Using Amazon Managed Streaming for Apache Kafka (Amazon MSK) and AWS Glue Schema Registry.
  2. Using Confluent Cloud and the Confluent Schema Registry.

See the associated GitHub repositories for Glue Schema Registry or Confluent Schema Registry for full source code and detailed deployment instructions.

Kafka event streaming and schema validation on AWS

To build event streaming applications with Kafka on AWS, you can use Amazon MSK, offerings such as Confluent Cloud, or self-hosted Kafka on Amazon Elastic Compute Cloud (Amazon EC2) instances.

To avoid common issues in event streaming and event-driven architectures, such as data inconsistencies and incompatibilities, it is a recommended practice to define and share event schemas between event producers and consumers. In Kafka, schema registries are used to manage, evolve, and enforce schemas for event producers and consumers. The AWS Glue Schema Registry provides a central location to discover, manage, and evolve schemas. In the case of Confluent Cloud, the Confluent Schema Registry serves the same role. Both the Glue Schema Registry and the Confluent Schema Registry support common schema formats such as Avro, Protobuf, and JSON.

To integrate Kafka with AWS services, third-party services, and your own applications, you can use EventBridge Pipes. EventBridge Pipes helps you create point-to-point integrations between event sources and targets with optional filtering, transformation, and enrichment. EventBridge Pipes reduces the amount of integration code that you have to write and maintain when building EDAs.

Many AWS and third-party services expect JSON-encoded payloads (events) as input, meaning they cannot directly consume Avro or Protobuf payloads. To replace repetitive Avro-to-JSON validation and conversion logic in each consumer, you can use the EventBridge Pipes enrichment step. This solution uses an AWS Lambda function in the enrichment step to deserialize and validate Kafka events with a schema registry, including error handling with dead-letter queues, and convert events to JSON before passing them to downstream services.

Solution overview

Architecture overview of the solution

The solution presented in this blog post consists of the following key elements:

  1. The source of the pipe is a Kafka cluster deployed using MSK or Confluent Cloud. EventBridge Pipes reads events from the Kafka stream in batches and sends them to the enrichment function (see here for an example event).
  2. The enrichment step (Lambda function) deserializes and validates the events against the configured schema registry (Glue or Confluent), converts events from Avro to JSON with integrated error handling, and returns them to the pipe.
  3. The target of this example solution is an EventBridge custom event bus that is invoked by EventBridge Pipes with JSON-encoded events returned by the enrichment Lambda function. EventBridge Pipes supports a variety of other targets, including Lambda, AWS Step Functions, Amazon API Gateway, API destinations, and more, enabling you to build EDAs without writing integration code.
  4. In this sample solution, the event bus sends all events to Amazon CloudWatch Logs via an EventBridge rule. You can extend the example to invoke additional EventBridge targets.

Optionally, you can add OpenAPI 3 or JSONSchema Draft 4 schemas for your events in the EventBridge schema registry by either manually generating it from the Avro schema or using EventBridge schema discovery. This allows you to download code bindings for the JSON-converted events for various programming languages, such as JavaScript, Python, and Java, to correctly use them in your EventBridge targets.

The remainder of this blog post describes this solution for the Glue and Confluent schema registries with code examples.

EventBridge Pipes with the Glue Schema Registry

This section describes how to implement event schema validation and conversion from Avro to JSON using EventBridge Pipes and the Glue Schema Registry. You can find the source code and detailed deployment instructions on GitHub.

Prerequisites

You need an Amazon MSK serverless cluster running and the Glue Schema registry configured. This example includes a Avro schema and a Glue Schema Registry. See the following AWS blog post for an introduction to schema validation with the Glue Schema Registry: Validate, evolve, and control schemas in Amazon MSK and Amazon Kinesis Data Streams with AWS Glue Schema Registry.

EventBridge Pipes configuration

Use the AWS Cloud Development Kit (AWS CDK) template provided in the GitHub repository to deploy:

  1. An EventBridge pipe that connects to your existing Amazon MSK Serverless Kafka topic as the source via AWS Identity and Access Management (IAM) authentication.
  2. EventBridge Pipes reads events from your Kafka topic using the Amazon MSK source type.
  3. An enrichment Lambda function in Java to perform event deserialization, validation, and conversion from Avro to JSON.
  4. An Amazon Simple Queue Service (Amazon SQS) dead letter queue to hold events for which deserialization failed.
  5. An EventBridge custom event bus as the pipe target. An EventBridge rule sends all incoming events into a CloudWatch Logs log group.

For MSK-based sources, EventBridge supports configuration parameters, such as batch window, batch size, and starting position, which you can set using the parameters of the CfnPipe class in the example CDK stack.

The example EventBridge pipe consumes events from Kafka in batches of 10 because it is targeting an EventBridge event bus, which has a max batch size of 10. See batching and concurrency in the EventBridge Pipes User Guide to choose an optimal configuration for other targets.

EventBridge Pipes with the Confluent Schema Registry

This section describes how to implement event schema validation and conversion from Avro to JSON using EventBridge Pipes and the Confluent Schema Registry. You can find the source code and detailed deployment instructions on GitHub.

Prerequisites

To set up this solution, you need a Kafka stream running on Confluent Cloud as well as the Confluent Schema Registry set up. See the corresponding Schema Registry tutorial for Confluent Cloud to set up a schema registry for your Confluent Kafka stream.

To connect to your Confluent Cloud Kafka cluster, you need an API key for Confluent Cloud and Confluent Schema Registry. AWS Secrets Manager is used to securely store your Confluent secrets.

EventBridge Pipes configuration

Use the AWS CDK template provided in the GitHub repository to deploy:

  1. An EventBridge pipe that connects to your existing Confluent Kafka topic as the source via an API secret stored in Secrets Manager.
  2. EventBridge Pipes reads events from your Confluent Kafka topic using the self-managed Apache Kafka stream source type, which includes all non-MSK Kafka clusters.
  3. An enrichment Lambda function in Python to perform event deserialization, validation, and conversion from Avro to JSON.
  4. An SQS dead letter queue to hold events for which deserialization failed.
  5. An EventBridge custom event bus as the pipe target. An EventBridge rule writes all incoming events into a CloudWatch Logs log group.

For self-managed Kafka sources, EventBridge supports configuration parameters, such as batch window, batch size, and starting position, which you can set using the parameters of the CfnPipe class in the example CDK stack.

The example EventBridge pipe consumes events from Kafka in batches of 10 because it is targeting an EventBridge event bus, which has a max batch size of 10. See batching and concurrency in the EventBridge Pipes User Guide to choose an optimal configuration for other targets.

Enrichment Lambda functions

Both of the solutions described previously include an enrichment Lambda function for schema validation and conversion from Avro to JSON.

The Java Lambda function integrates with the Glue Schema Registry using the AWS Glue Schema Registry Library. The Python Lambda function integrates with the Confluent Schema Registry using the confluent-kafka library and uses Powertools for AWS Lambda (Python) to implement Serverless best practices such as logging and tracing.

The enrichment Lambda functions perform the following tasks:

  1. In the events polled from the Kafka stream by the EventBridge pipe, the key and value of the event are base64 encoded. Therefore, for each event in the batch passed to the function, the key and the value are decoded.
  2. The event key is assumed to be serialized by the producer as a string type.
  3. The event value is deserialized using the Glue Schema registry Serde (Java) or the confluent-kafka AvroDeserializer (Python).
  4. The function then returns the successfully converted JSON events to the EventBridge pipe, which then invokes the target for each of them.
  5. Events for which Avro deserialization failed are sent to the SQS dead letter queue.

Conclusion

This blog post shows how to implement event consumption, Avro schema validation, and conversion to JSON using Amazon EventBridge Pipes, Glue Schema Registry, and Confluent Schema Registry.

The source code for the presented example is available in the AWS Samples GitHub repository for Glue Schema Registry and Confluent Schema Registry. For more patterns, visit the Serverless Patterns Collection.

For more serverless learning resources, visit Serverless Land.

Introducing logging support for Amazon EventBridge Pipes

Post Syndicated from David Boyne original https://aws.amazon.com/blogs/compute/introducing-logging-support-for-amazon-eventbridge-pipes/

Today, AWS is announcing support for logging with EventBridge Pipes. Amazon EventBridge Pipes is a point to point integration solution that connects event producers and consumers with optional filter, transform, and enrichment steps. EventBridge Pipes reduces the amount of integration code builders must write and maintain when building event-driven applications. Popular integrations include connecting Amazon Kinesis streams together with filtering, Amazon DynamoDB direct integrations with Amazon EventBridge, and Amazon SQS integrations with AWS Step Functions.

Amazon EventBridge Pipes

EventBridge Pipes logging introduces insights into different stages of the pipe execution. It expands on the Amazon CloudWatch metrics support, and provides you with additional methods for troubleshooting and debugging.

You can now gain insights into various successful and failure scenarios within the pipe execution steps. When event transformation or enrichment succeeds or fails, you can use logs to delve deeper and initiate troubleshooting for any issues with their configured pipes.

EventBridge Pipes execution steps

Understanding pipes execution steps can assist you in selecting the appropriate log level, which determines how much information is logged.

A pipe execution is an event or batch of events received by a pipe that travel from the source to the target. As events travel through a pipe, they can be filtered, transformed, or enriched using AWS Step Functions, AWS Lambda, Amazon API Gateway, and EventBridge API Destinations.

A pipe execution consists of two main stages: the enrichment and target. Both of these stages encompass transformation and invocation steps.

You can use input transformers, enabling modification to the payload of the event before the events undergo enrichment or get dispatched to the downstream target. This gives you fine-grained control over the manipulation of event data during the execution of their configured pipes.

When the pipe execution starts, the execution enters the enrichment stage. If you don’t configure an enrichment stage, the execution proceeds to the target stage.

At the pipe execution, transformation, enrichment, and target phases EventBridge can log information to help debug or troubleshoot. Pipes logs can include payloads, errors, transformations, AWS requests, and AWS responses.

To learn more about pipe executions, read this documentation.

Configuring log levels with EventBridge Pipes

When logging is enabled for your pipe, EventBridge produces a log entry for every execution step and sends these logs to the specified log destinations.

EventBridge Pipes supports three log destinations: Amazon CloudWatch Logs, Amazon Kinesis Data Firehose stream, and Amazon S3. The records sent can be customized by configuring the log level of the pipe (OFF, ERROR, INFO, TRACE).

  • OFF – EventBridge does not send any records.
  • ERROR – EventBridge sends records related to errors generated during the pipe execution. Examples include Execution Failed, Execution Timeout and Enrichment Failures.
  • INFO – EventBridge sends records related to errors and selected information performed during pipe execution. Examples include Execution Started, Execution Succeeded and Enrichment Stage Succeeded.
  • TRACE – EventBridge sends any record generated during any step in the pipe execution.

The ERROR log level proves beneficial in gaining insights into the reasons behind a failed pipe execution. Pipe executions may encounter failure due to various reasons, such as timeouts, enrichment failure, transformation failure, or target invocation failure. Enabling ERROR logging allows you to learn more about the specific cause of the pipe error, facilitating the resolution of the issue.

The INFO log level supplements ERROR information with additional details. It not only informs about errors but also provides insights into the commencement of the pipe execution, entry into the enrichment phase, progression into the transformation phase, and the initiation and successful completion of the target stage.

For a more in-depth analysis, you can use the TRACE log level to obtain comprehensive insights into a pipe execution. This encompasses all supported pipe logs, offering a detailed view beyond the INFO and ERROR logs. The TRACE log level reveals crucial information, such as skipped pipe execution stages and the initiation of transformation and enrichment processes.

For more details on the log levels and what logs are sent, you can read the documentation.

Including execution data with EventBridge Pipes logging

To help with further debugging, you can choose to include execution data within the pipe logs. This data comprises event payloads, AWS requests, and responses sent to and received from configured enrichment and target components.

You can also use the execution data to gain further insights into the payloads, requests, and responses sent to AWS services during the execution of the pipe.

Incorporating execution data can enhance understanding of the pipe execution, providing deeper insights and aiding in the debugging of any encountered issues.

Execution data within a log contains three parts:

  • payload: The content of the event itself. The payload of the event may contain sensitive information and EventBridge makes no attempt to redact the contents. Including execution data is optional and can be turned off.
  • awsRequest: The request sent to the enrichment or target in serialized JSON format. For API destinations this includes the HTTP request sent to that endpoint.
  • awsResponse: The response returned by the enrichment or target in JSON format. For API Destinations, this is the response returned from the configured endpoint.

The payload of the event is populated when the event itself can be updated. These stages include the initial pipe execution, enrichment phase, and target phase. The awsRequest and awsResponse are both generated at the final steps of enrichment and targeting.

For more information on log levels and execution data, visit this documentation.

Getting started with EventBridge Pipes logs

This example creates a pipe with logging enabled and includes execution data. The pipe connects two Amazon SQS queues using an input transformer on the target with no enrichment step. The input transformer customizes the payload of the event before reaching the target.

  1. Creating the source and target queues
# Create a queue for the source
aws sqs create-queue --queue-name pipe-source

# Create a queue for the target
aws sqs create-queue --queue-name pipe-target

2. Navigate to EventBridge Pipes and choose Create pipe.

3. Select SQS as the Source and select pipe-source as the SQS Queue.

4. Skip the filter and enrichment phase and add a new Target. Select SQS as the Target service and pipe-target as the Queue.

5. Open Target Input Transformer section and enter the transformer code into the Transformer field.

{

  "body": "Favorite food is <$.body>"

}

6. Choose Pipe settings to configure the log group for the new pipe.

7. Verify that CloudWatch Logs is set as the log destination, and select Trace as the log level. Check the “Include execution data” check box. This logs all traces to the new CloudWatch log group and includes the SQS messages that are sent on the pipe.

8. Choose Create Pipe.

9. Send an SQS message to the source queue.

# Get the Queue URL

aws sqs get-queue-url --queue-name pipe-source

# Send a message to the queue using the URL

aws sqs send-message --queue-url {QUEUE_URL} --message-body "pizza"

10. All trace logs are shown in the monitoring tab, use CloudWatch Logs section for more information.

Conclusion

EventBridge Pipes enables point-to-point integration between event producers and consumers. With logging support for EventBridge Pipes, you can now gain insights into various stages of the pipe execution. Pipe log destinations can be configured to CloudWatch Logs, Kinesis Data Firehose, and Amazon S3.

EventBridge Pipes supports three log levels. The ERROR log level configures EventBridge to send records related to errors to the log destination. The INFO log level configures EventBridge to send records related to errors and selected information during the pipe execution. The TRACE log level sends any record generated to the log destination, useful for debugging and gaining further insights.

You can include execution data in the logs, which includes the event itself, and AWS requests and responses made to AWS services configured in the pipe. This can help you gain further insights into the pipe execution. Read the documentation to learn more about EventBridge Pipes Logs.

For more serverless learning resources, visit Serverless Land.