The Cloudflare API now uses OpenAPI schemas

Post Syndicated from Garrett Galow original https://blog.cloudflare.com/open-api-transition/

The Cloudflare API now uses OpenAPI schemas

The Cloudflare API now uses OpenAPI schemas

Today, we are announcing the general availability of OpenAPI Schemas for the Cloudflare API. These are published via GitHub and will be updated regularly as Cloudflare adds and updates APIs. OpenAPI is the widely adopted standard for defining APIs in a machine-readable format. OpenAPI Schemas allow for the ability to plug our API into a wide breadth of tooling to accelerate development for ourselves and customers. Internally, it will make it easier for us to maintain and update our APIs. Before getting into those benefits, let’s start with the basics.

What is OpenAPI?

Much of the Internet is built upon APIs (Application Programming Interfaces) or provides them as services to clients all around the world. This allows computers to talk to each other in a standardized fashion. OpenAPI is a widely adopted standard for how to define APIs. This allows other machines to reliably parse those definitions and use them in interesting ways. Cloudflare’s own API Shield product uses OpenAPI schemas to provide schema validation to ensure only well-formed API requests are sent to your origin.

Cloudflare itself has an API that customers can use to interface with our security and performance products from other places on the Internet. How do we define our own APIs? In the past we used a standard called JSON Hyper-Schema. That had served us well, but as time went on we wanted to adopt more tooling that could both benefit ourselves internally and make our customer’s lives easier. The OpenAPI community has flourished over the past few years providing many capabilities as we will discuss that were unavailable while we used JSON Hyper-Schema. As of today we now use OpenAPI.

You can learn more about OpenAPI itself here. Having an open, well-understood standard for defining our APIs allows for shared tooling and infrastructure to be used that can read these standard definitions. Let’s take a look at a few examples.

Uses of Cloudflare’s OpenAPI schemas

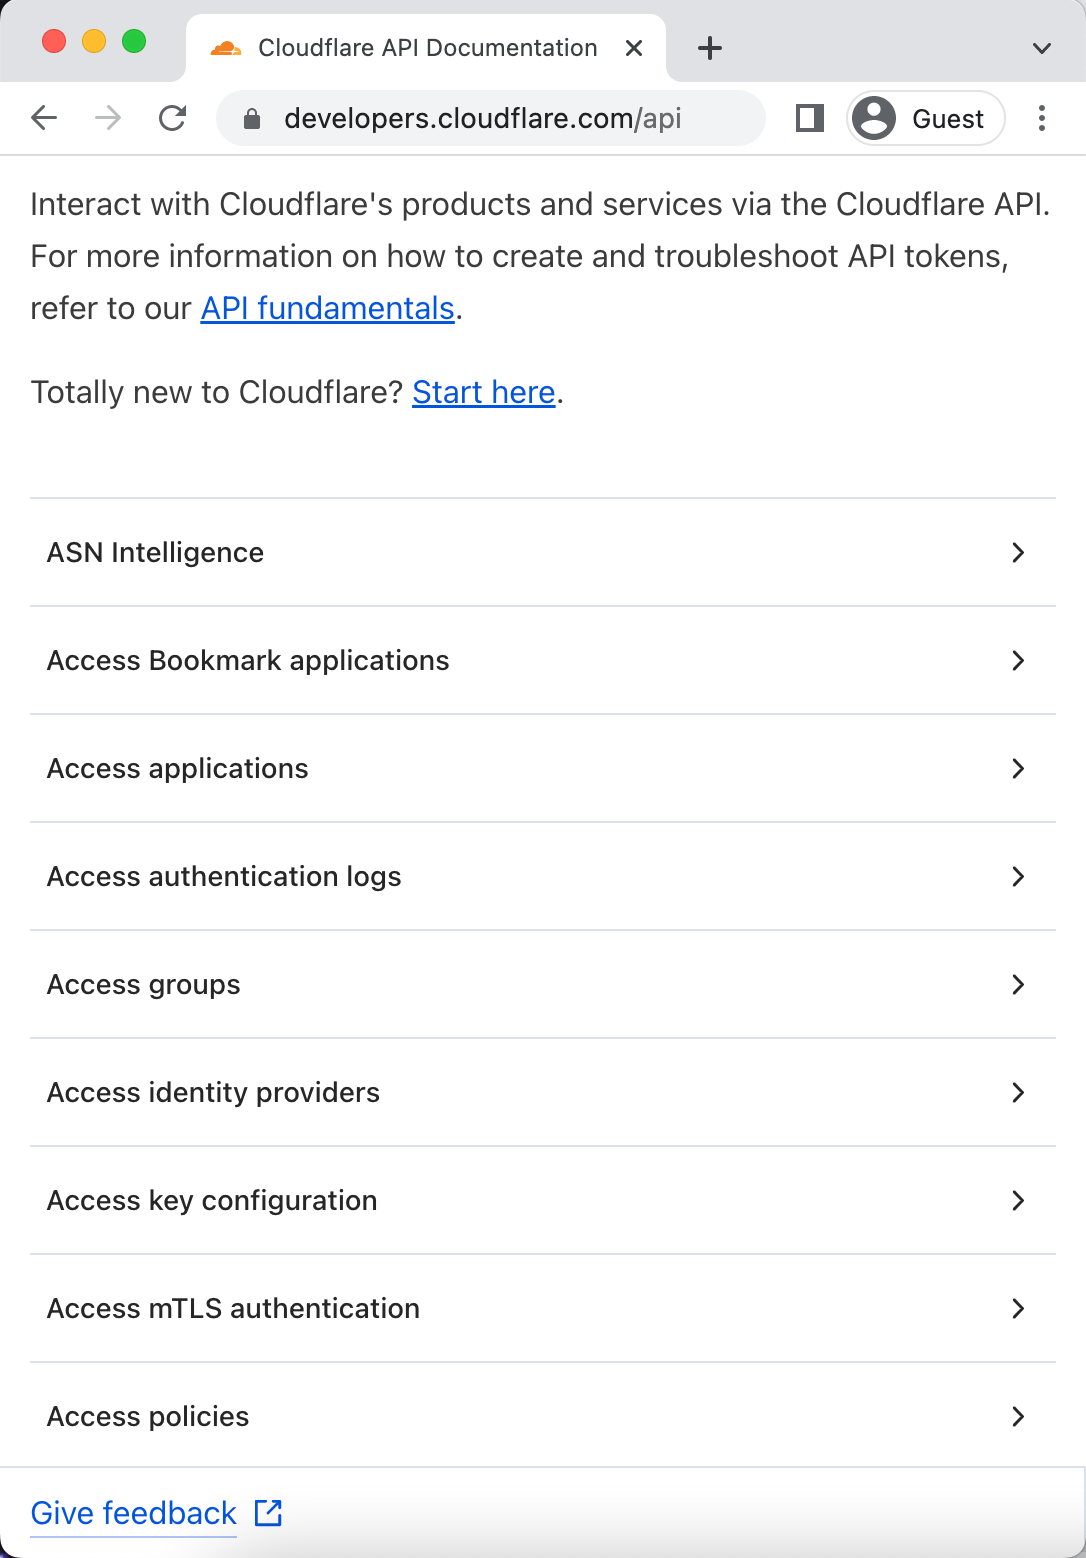
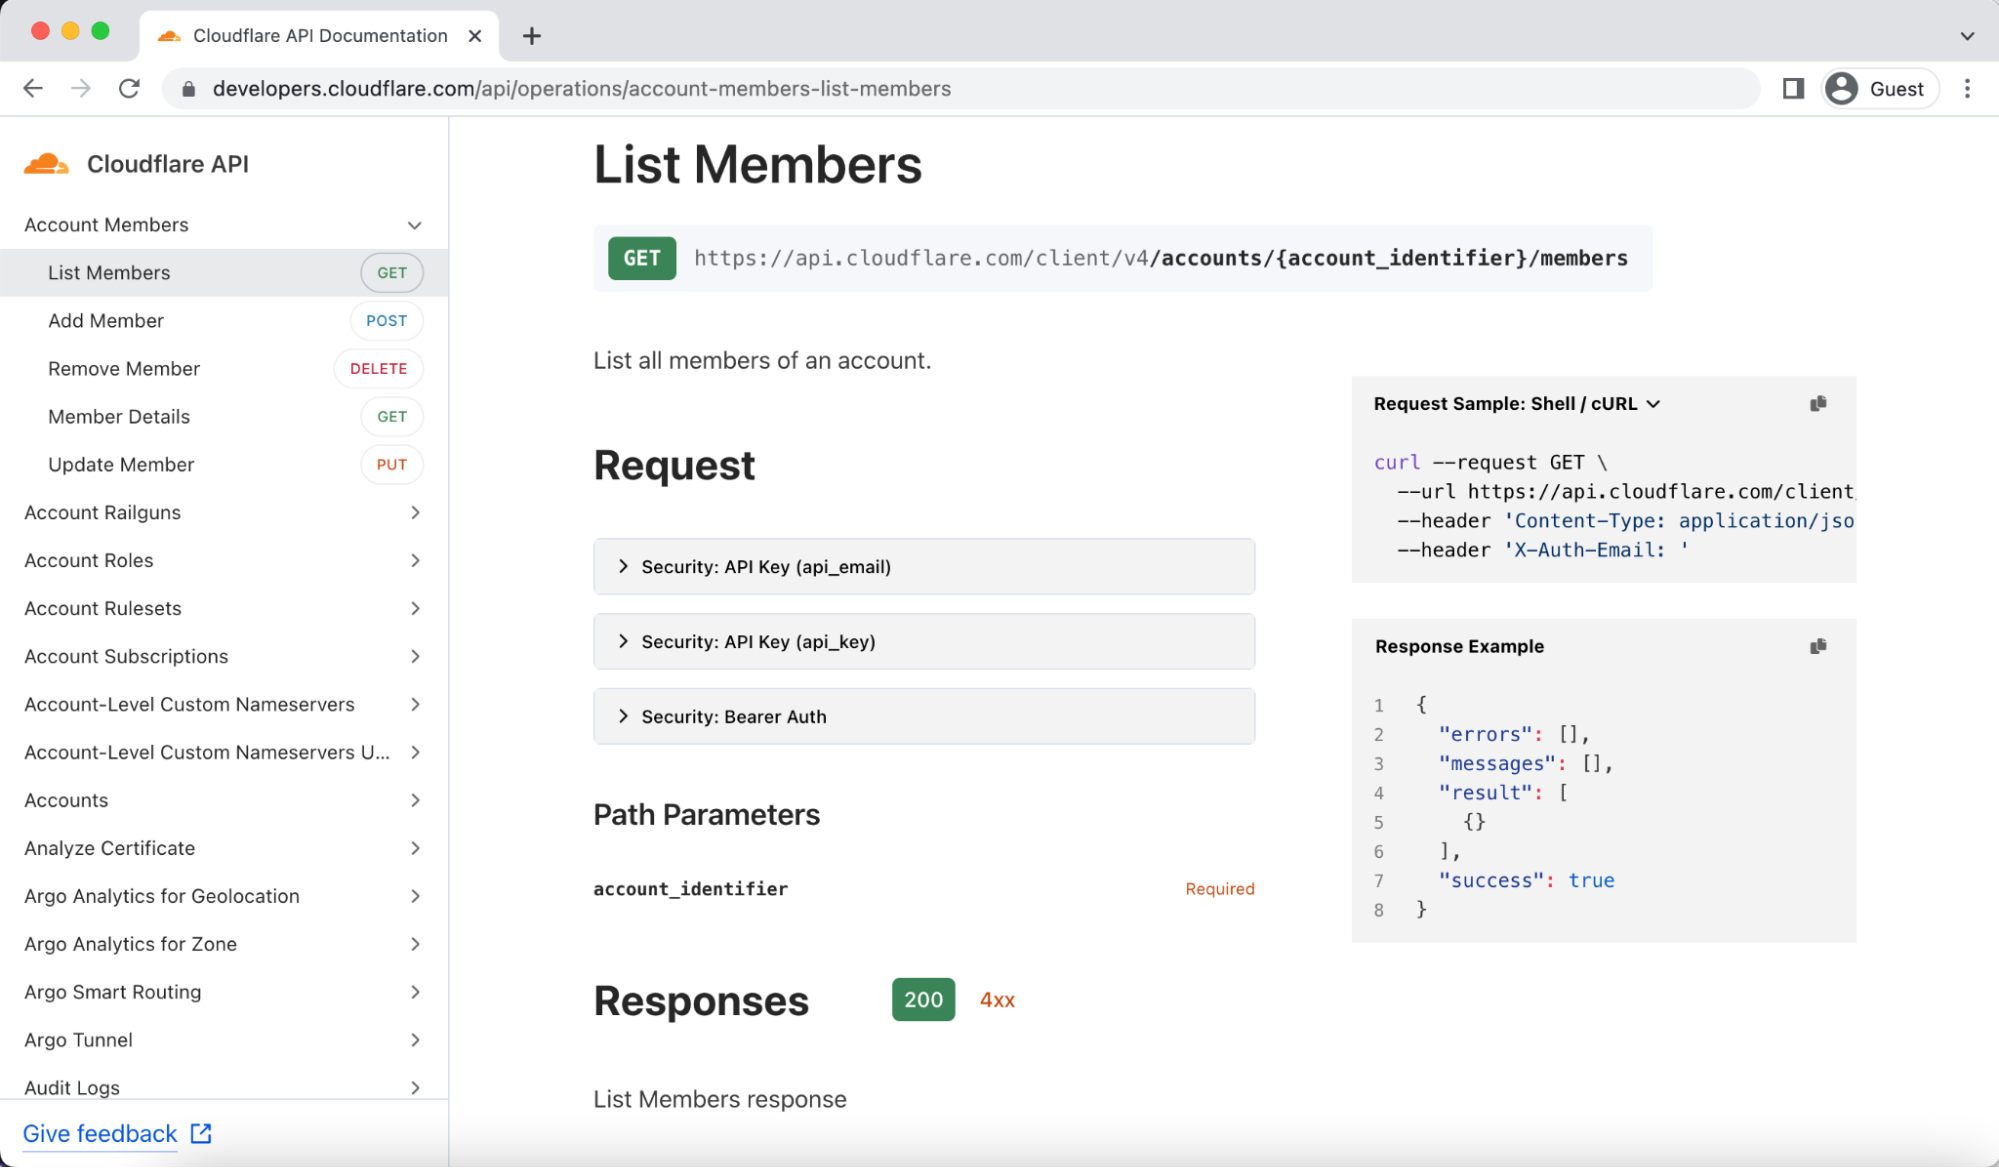
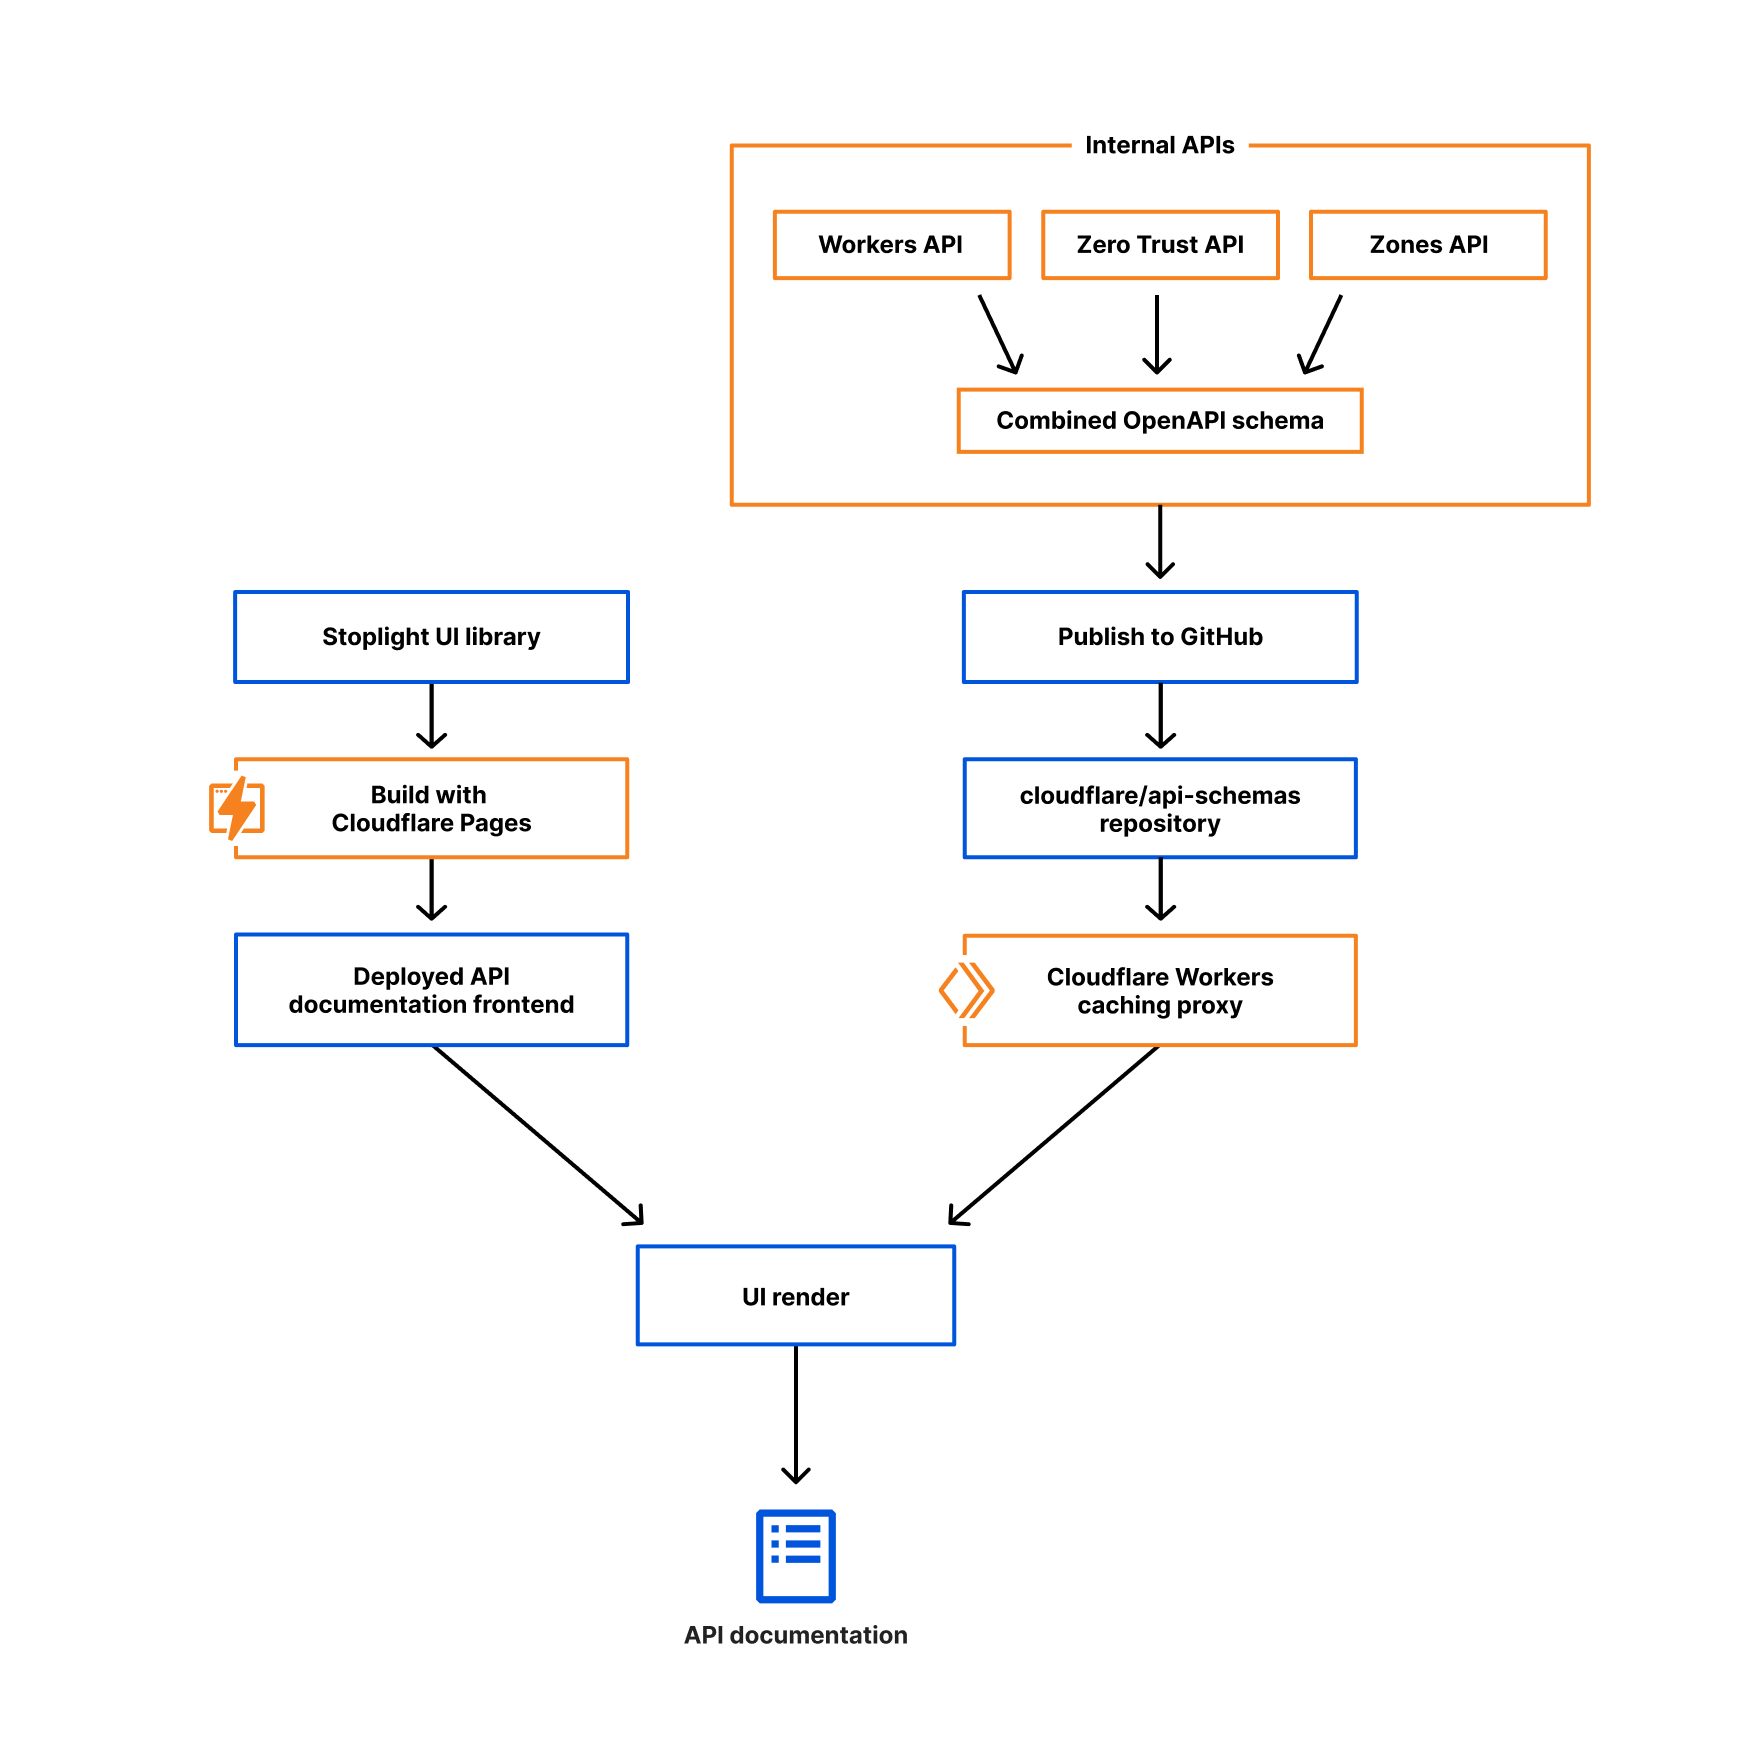
Most customers won’t need to use the schemas themselves to see value. The first system leveraging OpenAPI schemas is our new API Docs that were announced today. Because we now have OpenAPI schemas, we leverage the open source tool Stoplight Elements to aid in generating this new doc site. This allowed us to retire our previously custom-built site that was hard to maintain. Additionally, many engineers at Cloudflare are familiar with OpenAPI, so we gain teams can write new schemas more quickly and are less likely to make mistakes by using a standard that teams understand when defining new APIs.

There are ways to leverage the schemas directly, however. The OpenAPI community has a huge number of tools that only require a set of schemas to be able to use. Two such examples are mocking APIs and library generation.

Mocking Cloudflare’s API

Say you have code that calls Cloudflare’s API and you want to be able to easily run unit tests locally or integration tests in your CI/CD pipeline. While you could just call Cloudflare’s API in each run, you may not want to for a few reasons. First, you may want to run tests frequently enough that managing the creation and tear down of resources becomes a pain. Also, in many of these tests you aren’t trying to validate logic in Cloudflare necessarily, but your own system’s behavior. In this case, mocking Cloudflare’s API would be ideal since you can gain confidence that you aren’t violating Cloudflare’s API contract, but without needing to worry about specifics of managing real resources. Additionally, mocking allows you to simulate different scenarios, like being rate limited or receiving 500 errors. This allows you to test your code for typically rare circumstances that can end up having a serious impact.

As an example, Spotlight Prism could be used to mock Cloudflare’s API for testing purposes. With a local copy of Cloudflare’s API Schemas you can run the following command to spin up a local mock server:

$ docker run --init --rm \
  -v /home/user/git/api-schemas/openapi.yaml:/tmp/openapi.yaml \
  -p 4010:4010 stoplight/prism:4 \
  mock -h 0.0.0.0 /tmp/openapi.yaml

Then you can send requests to the mock server in order to validate that your use of Cloudflare’s API doesn’t violate the API contract locally:

$ curl -sX PUT localhost:4010/zones/f00/activation_check \
  -Hx-auth-email:[email protected] -Hx-auth-key:foobarbaz | jq
{
  "success": true,
  "errors": [],
  "messages": [],
  "result": {
    "id": "023e105f4ecef8ad9ca31a8372d0c353"
  }
}

This means faster development and shorter test runs while still catching API contract issues early before they get merged or deployed.

Library generation

Cloudflare has libraries in many programming languages like Terraform and Go, but we don’t support every possible programming language. Fortunately, using a tool like openapi generator, you can feed in Cloudflare’s API schemas and generate a library in a wide range of languages to then use in your code to talk to Cloudflare’s API. For example, you could generate a Java library using the following commands:

git clone https://github.com/openapitools/openapi-generator
cd openapi-generator
mvn clean package
java -jar modules/openapi-generator-cli/target/openapi-generator-cli.jar generate \
   -i https://raw.githubusercontent.com/cloudflare/api-schemas/main/openapi.yaml \
   -g java \
   -o /var/tmp/java_api_client

And then start using that client in your Java code to talk to Cloudflare’s API.

How Cloudflare transitioned to OpenAPI

As mentioned earlier, we previously used JSON Hyper-Schema to define our APIs. We have roughly 600 endpoints that were already defined in the schemas. Here is a snippet of what one endpoint looks like in JSON Hyper-Schema:

{
      "title": "List Zones",
      "description": "List, search, sort, and filter your zones.",
      "rel": "collection",
      "href": "zones",
      "method": "GET",
      "schema": {
        "$ref": "definitions/zone.json#/definitions/collection_query"
      },
      "targetSchema": {
        "$ref": "#/definitions/response_collection"
      },
      "cfOwnership": "www",
      "cfPlanAvailability": {
        "free": true,
        "pro": true,
        "business": true,
        "enterprise": true
      },
      "cfPermissionsRequired": {
        "enum": [
          "#zone:read"
        ]
      }
    }

Let’s look at the same endpoint in OpenAPI:

/zones:
    get:
      description: List, search, sort, and filter your zones.
      operationId: zone-list-zones
      responses:
        4xx:
          content:
            application/json:
              schema:
                allOf:
                - $ref: '#/components/schemas/components-schemas-response_collection'
                - $ref: '#/components/schemas/api-response-common-failure'
          description: List Zones response failure
        "200":
          content:
            application/json:
              schema:
                $ref: '#/components/schemas/components-schemas-response_collection'
          description: List Zones response
      security:
      - api_email: []
        api_key: []
      summary: List Zones
      tags:
      - Zone
      x-cfPermissionsRequired:
        enum:
        - '#zone:read'
      x-cfPlanAvailability:
        business: true
        enterprise: true
        free: true
        pro: true

You can see that the two look fairly similar and for the most part the same information is contained in each including method type, a description, and request and response definitions (although those are linked in $refs). The value of migrating from one to the other isn’t the change in how we define the schemas themselves, but in what we can do with these schemas. Numerous tools can parse the latter, the OpenAPI, while much fewer can parse the former, the JSON Hyper-Schema.

If this one API was all that made up the Cloudflare API, it would be easy to just convert the JSON Hyper-Schema into the OpenAPI Schema by hand and call it a day. Doing this 600 times, however, was going to be a huge undertaking. When considering that teams are constantly adding new endpoints, it would be impossible to keep up. It was also the case that our existing API docs used the existing JSON Hyper-Schema, so that meant that we would need to keep both schemas up to date during any transition period. There had to be a better way.

Auto conversion

Given both JSON Hyper-Schema and OpenAPI are standards, it reasons that it should be possible to take a file in one format and convert to the other, right? Luckily the answer is yes! We built a tool that took all existing JSON Hyper-Schema and output fully compliant OpenAPI schemas. This of course didn’t happen overnight, but because of existing OpenAPI tooling, we could iteratively improve the auto convertor and run OpenAPI validation tooling over the output schemas to see what issues the conversion tool still had.

After many iterations and improvements to the conversion tool, we finally had fully compliant OpenAPI Spec schemas being auto-generated from our existing JSON Hyper-Schema. While we were building this tool, teams kept adding and updating the existing schemas and our Product Content team was also updating text in the schemas to make our API docs easier to use. The benefit of this process is we didn’t have to slow any of that work down since anything that changed in the old schemas was automatically reflected in the new schemas!

Once the tool was ready, the remaining step was to decide when and how we would stop making updates to the JSON Hyper-Schemas and move all teams to the OpenAPI Schemas. The (now old) API docs were the biggest concern, given they only understood JSON Hyper-Schema. Thanks to the help of our Developer Experience and Product Content teams, we were able to launch the new API docs today and can officially cut over to OpenAPI today as well!

What’s next?

Now that we have fully moved over to OpenAPI, more opportunities become available. Internally, we will be investigating what tooling we can adopt in order to help reduce the effort of individual teams and speed up API development. One idea we are exploring is automatically creating openAPI schemas from code notations. Externally, we now have the foundational tools necessary to begin exploring how to auto generate and support more programming language libraries for customers to use. We are also excited to see what you may do with the schemas yourself, so if you do something cool or have ideas, don’t hesitate to share them with us!

Iteration isn’t just for code: here are our latest API docs

Post Syndicated from Claire Waters original https://blog.cloudflare.com/building-a-better-developer-experience-through-api-documentation/

Iteration isn't just for code: here are our latest API docs

Iteration isn't just for code: here are our latest API docs

We’re excited to share that the next iteration of Cloudflare’s API reference documentation is now available. The new docs standardize our API content and improve the overall developer experience for interacting with Cloudflare’s API.

Why does API documentation matter?

Everyone talks about how important APIs are, but not everyone acknowledges the critical role that API documentation plays in an API’s usability. Throwing docs together is easy. Getting them right is harder.

At Cloudflare, we try to meet our users where they are. For the majority of customers, that means providing clear, easy-to-use products in our dashboard. But developers don’t always want what our dashboard provides. Some developers prefer to use a CLI or Wrangler to have a higher level of control over what’s happening with their Cloudflare products. Others want more customization and deeper ties into their company’s internal applications. Some want all the above.

Iteration isn't just for code: here are our latest API docs

A developer’s job is to create, debug, and optimize code – whether that’s an application, interface, database, etc. – as efficiently as possible and ensure that code runs as efficiently as possible. APIs enable that efficiency through automation. Let’s say a developer wants to run a cache purge every time content is updated on their website. They could use Cloudflare’s dashboard to enable cache purge, but they might want it to happen automatically instead. Enter Cloudflare’s API.

In the same way that the Cloudflare dashboard is an interface for humans, an API is an interface for computers. For a computer to execute on instructions, there is no room for interpretation. The instructions, formatted as requests, have to follow a specific set of rules and include certain requirements. API documentation details what those rules and requirements are.

It’s a frustrating experience for developers when you’re in the details of a complex project and can’t troubleshoot an error because the docs aren’t comprehensive or don’t load. Unfortunately, that’s been the reality for developers using Cloudflare’s API. Figuring out how to use Cloudflare’s API was a “choose your own adventure” story for the Cloudflare users who made 126 million visits monthly to our API documentation. If the APIs you needed were fully documented, you encountered long page load times and a site that couldn’t render on mobile.

From a technical standpoint, we were using api.cloudflare.com for both the API documentation site and the Cloudflare API access point, which is awkward. We needed a more sustainable way for internal teams to create and document their APIs according to an accepted standard.

Building a better developer experience for our APIs

Like with all of our documentation projects at Cloudflare, we started by thinking about the user’s workflow – in this case, a developer’s workflow as they’re getting started with the Cloudflare API.

Providing docs on mobile
We know developers research products before diving into projects, usually exploring API documentation before writing any code. That means making docs available on mobile for working on the go. Check.

Improving the navigation
As a developer, at the point you’re looking at API docs, you generally have an idea of what you want to use the API for. Our goal with the new API docs is to make it as easy as possible for you to find the information you need. We recognize that endpoints are organized a bit haphazardly in the current API docs. To address that clunkiness, we’ve grouped endpoints by product or setting and alphabetized that list on the new site, making it easier to navigate and find what you’re looking for. And while this may seem like a small thing, you now can use a keyboard shortcut to search the page.

Iteration isn't just for code: here are our latest API docs

Clarifying authentication
Once developers start writing code, you first have to handle authentication to start using the API. Authentication information is now readily available for every endpoint, and we link to the full developer docs about authentication from the API overview page.

Adding examples
Good API docs have clear descriptions, but the best API docs share templates and examples to minimize a developer’s friction to deploying code. Every endpoint now includes an example and clearly indicates which parameters are required, removing yet another decision developers have to make when working with our API.

Iteration isn't just for code: here are our latest API docs

Gathering feedback and iterating
As we implemented all of these improvements, we kept some of our biggest users – our internal developers – informed along the way. We shared the test site early and often to get internal feedback, which caught bugs and helped us refine the site’s usability. The Discord and Community MVPs also volunteered to test the site, giving us valuable outside perspective on what we built. We incorporated all of that feedback to provide a vetted, deliberate UX at launch.

How we built this

Since this week is all about what you can build on our developer platform, we wanted to share the details about how this all works under the hood (hint: it’s mostly Workers).

We used a combination of open-source tools and Cloudflare products to revamp the API doc site. Previously the content on api.cloudflare.com was sourced from the JSON hyper-schema files that described our APIs, but over the years we repeatedly heard that published schemas would help you better integrate with Cloudflare. Several Cloudflare engineering teams started adopting the OpenAPI specification, and with a little research, planning, and testing, we pivoted from those JSON hyper-schemas to the OpenAPI framework. Check out the blog post about our Transition to OpenAPI for more details.

Because the OpenAPI specification defines how to describe APIs, our schema files now have consistency – not just among the various products, but also with an industry-accepted standard. Hundreds of documentation and code generation tools exist to pull from that standard, which means we have options that weren’t available for our homegrown JSON hyper-schemas.

Iteration isn't just for code: here are our latest API docs

We chose Stoplight Elements, an open-source React framework, for our site design because it has a clean layout and is easily customizable. While there are a number of both dynamic and static tools for parsing OpenAPI schemas and rendering documentation sites, we chose React because of its ubiquity, performance, and because it plays well with Cloudflare Pages, our deployment tool of choice. Within Stoplight you can generate code samples for a variety of  programming languages, like JavaScript, Java, and Python, as well as for tools like cURL, HTTPie, and wget.

We build and deploy the React application with Cloudflare Pages, and using Pages functions, we optimize the OpenAPI schema file for Stoplight’s UI and cache it on Cloudflare’s network, reducing the latency needed to request the schema. Whenever teams add new API endpoints or definitions to the schema, we just update the schema file in GitHub. Because our API documentation loads the schema dynamically, this means we don’t have to wait for Cloudflare Pages to deploy a new version of the documentation site. The automation helps us ensure that everything we expose in the API is documented without manual interaction. Deploying with Pages gives us yet another opportunity to test our own products out on ourselves, helping us find areas for improvement that we turn around and pass along to you.

Looking ahead

Moving our schemas to the OpenAPI specification allows us to use ready-to-go tools like Stoplight, but we’re just getting started. Soon we’ll be adding search functionality, letting you access all relevant information across developer, API, and support docs. The mobile experience will evolve, providing an even cleaner way to read API content when you’re on your phone. We’ll also add a “try it out” functionality to test out your requests right in the browser before writing your own code.

Over time, we want an even tighter integration between the API reference documentation, our how-to content in developer docs, and the Cloudflare dashboard. The standardized structure we get with the OpenAPI spec sets us up to reuse the schema files across our client libraries, Terraform, API gateway, and Trakal. The consistency across API descriptions makes it easier for us to do things like localize API content, customize out-of-the-box documentation generation tools, and continue innovating like we always do.

Iteration isn't just for code: here are our latest API docs

We want to hear from you!

As you’re using the new API doc site, send us your feedback and let us know if there are any feature improvements you’d like to see in the future. We want the site to be as useful as possible for your day-to-day interactions with Cloudflare’s API. We hope the improvements to our API doc experience will help you seamlessly use our API and efficiently deploy and maintain your Cloudflare products.

Thanks for your patience and perspective as we iterate on the API docs!

Making static sites dynamic with Cloudflare D1

Post Syndicated from Kristian Freeman original https://blog.cloudflare.com/making-static-sites-dynamic-with-cloudflare-d1/

Making static sites dynamic with Cloudflare D1

Introduction

Making static sites dynamic with Cloudflare D1

There are many ways to store data in your applications. For example, in Cloudflare Workers applications, we have Workers KV for key-value storage and Durable Objects for real-time, coordinated storage without compromising on consistency. Outside the Cloudflare ecosystem, you can also plug in other tools like NoSQL and graph databases.

But sometimes, you want SQL. Indexes allow us to retrieve data quickly. Joins enable us to describe complex relationships between different tables. SQL declaratively describes how our application’s data is validated, created, and performantly queried.

D1 was released today in open alpha, and to celebrate, I want to share my experience building apps with D1: specifically, how to get started, and why I’m excited about D1 joining the long list of tools you can use to build apps on Cloudflare.

Making static sites dynamic with Cloudflare D1

D1 is remarkable because it’s an instant value-add to applications without needing new tools or stepping out of the Cloudflare ecosystem. Using wrangler, we can do local development on our Workers applications, and with the addition of D1 in wrangler, we can now develop proper stateful applications locally as well. Then, when it’s time to deploy the application, wrangler allows us to both access and execute commands to your D1 database, as well as your API itself.

What we’re building

In this blog post, I’ll show you how to use D1 to add comments to a static blog site. To do this, we’ll construct a new D1 database and build a simple JSON API that allows the creation and retrieval of comments.

As I mentioned, separating D1 from the app itself – an API and database that remains separate from the static site – allows us to abstract the static and dynamic pieces of our website from each other. It also makes it easier to deploy our application: we will deploy the frontend to Cloudflare Pages, and the D1-powered API to Cloudflare Workers.

Building a new application

First, we’ll add a basic API in Workers. Create a new directory and in it a new wrangler project inside it:

$ mkdir d1-example && d1-example
$ wrangler init

In this example, we’ll use Hono, an Express.js-style framework, to rapidly build our API. To use Hono in this project, install it using NPM:

$ npm install hono

Then, in src/index.ts, we’ll initialize a new Hono app, and define a few endpoints – GET /API/posts/:slug/comments, and POST /get/api/:slug/comments.

import { Hono } from 'hono'
import { cors } from 'hono/cors'

const app = new Hono()

app.get('/api/posts/:slug/comments', async c => {
  // do something
})

app.post('/api/posts/:slug/comments', async c => {
  // do something
})

export default app

Now we’ll create a D1 database. In Wrangler 2, there is support for the wrangler d1 subcommand, which allows you to create and query your D1 databases directly from the command line. So, for example, we can create a new database with a single command:

$ wrangler d1 create d1-example

With our created database, we can take the database name ID and associate it with a binding inside of wrangler.toml, wrangler’s configuration file. Bindings allow us to access Cloudflare resources, like D1 databases, KV namespaces, and R2 buckets, using a simple variable name in our code. Below, we’ll create the binding DB and use it to represent our new database:

[[ d1_databases ]]
binding = "DB" # i.e. available in your Worker on env.DB
database_name = "d1-example"
database_id = "4e1c28a9-90e4-41da-8b4b-6cf36e5abb29"

Note that this directive, the [[d1_databases]] field, currently requires a beta version of wrangler. You can install this for your project using the command npm install -D wrangler/beta.

With the database configured in our wrangler.toml, we can start interacting with it from the command line and inside our Workers function.

First, you can issue direct SQL commands using wrangler d1 execute:

$ wrangler d1 execute d1-example --command "SELECT name FROM sqlite_schema WHERE type ='table'"
Executing on d1-example:
┌─────────────────┐
│ name │
├─────────────────┤
│ sqlite_sequence │
└─────────────────┘

You can also pass a SQL file – perfect for initial data seeding in a single command. Create src/schema.sql, which will create a new comments table for our project:

drop table if exists comments;
create table comments (
  id integer primary key autoincrement,
  author text not null,
  body text not null,
  post_slug text not null
);
create index idx_comments_post_id on comments (post_slug);

-- Optionally, uncomment the below query to create data

-- insert into comments (author, body, post_slug)
-- values ("Kristian", "Great post!", "hello-world");

With the file created, execute the schema file against the D1 database by passing it with the flag --file:

$ wrangler d1 execute d1-example --file src/schema.sql

We’ve created a SQL database with just a few commands and seeded it with initial data. Now we can add a route to our Workers function to retrieve data from that database. Based on our wrangler.toml config, the D1 database is now accessible via the DB binding. In our code, we can use the binding to prepare SQL statements and execute them, for instance, to retrieve comments:

app.get('/api/posts/:slug/comments', async c => {
  const { slug } = c.req.param()
  const { results } = await c.env.DB.prepare(`
    select * from comments where post_slug = ?
  `).bind(slug).all()
  return c.json(results)
})

In this function, we accept a slug URL query parameter and set up a new SQL statement where we select all comments with a matching post_slug value to our query parameter. We can then return it as a simple JSON response.

So far, we’ve built read-only access to our data. But “inserting” values to SQL is, of course, possible as well. So let’s define another function that allows POST-ing to an endpoint to create a new comment:

app.post('/API/posts/:slug/comments', async c => {
  const { slug } = c.req.param()
  const { author, body } = await c.req.json<Comment>()

  if (!author) return c.text("Missing author value for new comment")
  if (!body) return c.text("Missing body value for new comment")

  const { success } = await c.env.DB.prepare(`
    insert into comments (author, body, post_slug) values (?, ?, ?)
  `).bind(author, body, slug).run()

  if (success) {
    c.status(201)
    return c.text("Created")
  } else {
    c.status(500)
    return c.text("Something went wrong")
  }
})

In this example, we built a comments API for powering a blog. To see the source for this D1-powered comments API, you can visit cloudflare/templates/worker-d1-api.

Making static sites dynamic with Cloudflare D1

Conclusion

One of the things most exciting about D1 is the opportunity to augment existing applications or websites with dynamic, relational data. As a former Ruby on Rails developer, one of the things I miss most about that framework in the world of JavaScript and serverless development tools is the ability to rapidly spin up full data-driven applications without needing to be an expert in managing database infrastructure. With D1 and its easy onramp to SQL-based data, we can build true data-driven applications without compromising on performance or developer experience.

This shift corresponds nicely with the advent of static sites in the last few years, using tools like Hugo or Gatsby. A blog built with a static site generator like Hugo is incredibly performant – it will build in seconds with small asset sizes.

But by trading a tool like WordPress for a static site generator, you lose the opportunity to add dynamic information to your site. Many developers have patched over this problem by adding more complexity to their build processes: fetching and retrieving data and generating pages using that data as part of the build.

This addition of complexity in the build process attempts to fix the lack of dynamism in applications, but it still isn’t genuinely dynamic. Instead of being able to retrieve and display new data as it’s created, the application rebuilds and redeploys whenever data changes so that it appears to be a live, dynamic representation of data. Your application can remain static, and the dynamic data will live geographically close to the users of your site, accessible via a queryable and expressive API.

Automate an isolated browser instance with just a few lines of code

Post Syndicated from Tanushree Sharma original https://blog.cloudflare.com/introducing-workers-browser-rendering-api/

Automate an isolated browser instance with just a few lines of code

Automate an isolated browser instance with just a few lines of code

If you’ve ever created a website that shows any kind of analytics, you’ve probably also thought about adding a “Save Image” or “Save as PDF” button to store and share results. This isn’t as easy as it seems (I can attest to this firsthand) and it’s not long before you go down a rabbit hole of trying 10 different libraries, hoping one will work.

This is why we’re excited to announce a private beta of the Workers Browser Rendering API, improving the browser automation experience for developers. With browser automation, you can programmatically do anything that a user can do when interacting with a browser.

The Workers Browser Rendering API, or just Rendering API for short, is our out-of-the-box solution for simplifying developer workflows, including capturing images or screenshots, by running browser automation in Workers.

Browser automation, everywhere

As with many of the best Cloudflare products, Rendering API was born out of an internal need. Many of our teams were setting up or wanted to set up their own tools to perform what sounds like an incredibly simple task: taking automated screenshots.

When gathering use cases, we realized that much of what our internal teams wanted would also be useful for our customers. Some notable ones are:

  • Taking screenshots for social sharing thumbnails or preview images
  • Emailed daily screenshots of dashboards (requested specifically by our SVP of Engineering)
  • Reporting bugs on websites and sending them directly to frontend teams

Not to mention use cases for other browser automation functions like:

Testing UI/UX Flows
End-to-end (E2E) testing is used to minimic user behaviour and can identify bugs that unit tests or integration tests have missed. And let’s be honest – no developer wants to manually check the user flow each time they make changes to their application. E2E tests can be especially useful to verify logic on your customer’s critical path like account creation, authentication or checkout.

Performance Tests
Application performance metrics, such as page load time, directly impact your user’s experience and your SEO rankings. To avoid performance regressions, you want to test impact on latency in conditions that are as close as possible to your production environment before you merge. By automating performance testing you can measure if your proposed changes will result in a degraded experience for your uses and make improvements accordingly.  

Unlocking a new building block

One of the most common browser automation frameworks is Puppeteer. It’s common to run Puppeteer in a containerization tool like Docker or in a serverless environment. Taking automated screenshots should be as easy as writing some code, hitting deploy and having it run when a particular event is triggered or on a regular schedule.

It should be, but it’s not.

Even on a serverless solution like AWS Lambda, running Puppeteer means packaging it, making sure dependencies are covered, uploading packages to S3 and deploying using Layers. Whether using Docker or something like Lambda, it’s clear that this is not easy to set up.

One of the pillars of Cloudflare’s development platform is to provide our developers with tools that are incredibly simple, yet powerful to build on. Rendering API is our out-of-the-box solution for running Puppeteer in Workers.

Screenshotting made simple

To start, the Rendering API will have support for navigating to a webpage and taking a screenshot, with more functions to follow. To use it, all you need to do is add our new browser binding to your project’s wrangler.toml file

wrangler.toml

bindings = [
 { name = "my_browser” type = "browser" }
]

From there, taking a screenshot and saving it to R2 is as simple as:

script.ts

import puppeteer from '@cloudflare/puppeteer'

export default {
    async fetch(request: Request, env: Env): Promise<Response> {
        const browser = await puppeteer.launch({
            browserBinding: env.MY_BROWSER
        })
        const page = await browser.newPage()

        await page.goto("https://example.com/")
        const img = await page.screenshot() as Buffer
        await browser.close()

        //upload to R2
        try {
            await env.MY_BUCKET.put("screenshot.jpg", img);
            return new Response(`Success!`);
        } catch (e) {
            return new Response('', { status: 400 })
        }
    }
}

Down the line, we have plans to add full Puppeteer support, including functions like page.type, page.click, page.evaluate!

What’s happening under the hood?

Remote browser isolation technology is an integral part of our Zero Trust product offering. Remote browser isolation lets users interact with a web browser that instead of running on the client’s device, runs in a remote environment. The Rendering API repurposes this under the hood!

Automate an isolated browser instance with just a few lines of code

We’ve wrapped the Puppeteer library so that it can be run directly from your own Worker. You can think of your Worker as the client. Each of Cloudflare’s data centers has a pool of warm browsers ready to go and when a Worker requests a browser, the browser is instantly returned and is connected to via a WebSocket. Once the WebSocket connection is established, our internal browser API Worker handles all communication to the browser session via the Chrome Devtools Protocol.

To ensure the security of your Worker, individual remote browsers are run as disposable instances – one instance per request, and never shared. They are secured using gVisor to protect against kernel level exploits. On top of that, the browser is running sandboxed processes with the lowest privilege level using a Linux seccomp profile.

The Rendering API should be used when you’re building and testing your applications.  To prevent abuse, Cloudflare Bot Management has baked in signals to indicate that a request is coming from a Worker running Puppeteer. As a Cloudflare Bot Management customer, this will automatically be added to your blocklist, with the option to explicitly opt in and allow it.

How can you get started?

We’re introducing the Workers Browser Rendering API in closed beta. If you’re interested, please tell us a bit about your use case and join the waitlist. We would love to hear what else you want to build using the Workers Browser Rendering API, let us know in the Workers channel on the Cloudflare Developers Discord!

Xata Workers: client-side database access without client-side secrets

Post Syndicated from Alexis Rico (Guest Blogger) original https://blog.cloudflare.com/xata-customer-story/

Xata Workers: client-side database access without client-side secrets

Xata Workers: client-side database access without client-side secrets

We’re excited to have Xata building their serverless functions product – Xata Workers – on top of Workers for Platforms. Xata Workers act as middleware to simplify database access and allow their developers to deploy functions that sit in front of their databases. Workers for Platforms opens up a whole suite of use cases for Xata developers all while providing the security, scalability and performance of Cloudflare Workers.

Now, handing it over to Alexis, a Senior Software Engineer at Xata to tell us more.

Introduction

In the last few years, there’s been a rise of Jamstack, and new ways of thinking about the cloud that some people call serverless or edge computing. Instead of maintaining dedicated servers to run a single service, these architectures split applications in smaller services or functions.

By simplifying the state and context of our applications, we can benefit from external providers deploying these functions in dozens of servers across the globe. This architecture benefits the developer and user experience alike. Developers don’t have to manage servers, and users don’t have to experience latency. Your application simply scales, even if you receive hundreds of thousands of unexpected visitors.

When it comes to databases though, we still struggle with the complexity of orchestrating replication, failover and high availability. Traditional databases are difficult to scale horizontally and usually require a lot of infrastructure maintenance or learning complex database optimization concepts.

At Xata we are building a modern data platform designed for scalable applications. It allows you to focus on your application logic, instead of having to worry about how the data is stored.

Making databases accessible to everyone

We started Xata with the mission of helping developers build their applications and forget about maintaining the underlying infrastructure.

With that mission in mind, we asked ourselves: how can we make databases accessible to everyone? How can we provide a delightful experience for a frontend engineer or designer using a database?

To begin with, we built an appealing web dashboard, that any developer — no matter their experience — can be comfortable using to work with their data.

Whether they’re defining or refining their schema, viewing or adding records, fine-tuning search results with query boosters, or getting code snippets to speed up development with our SDK. We believe that only the best user experience can provide the best development experience.

We identified a major challenge amongst our user base early on. Many front-end developers want to access their database from client-side code.

Allowing access to a database from client-side code comes with several security risks if not done properly. For example, someone could inspect the code, find the credentials, and if they weren’t scoped to a single operation, potentially query or modify other parts of the database. Unfortunately, this is a common reason for data leaks and security breaches.

It was a hard problem to solve, and after plenty of brainstorming, we agreed on two potential ways forward: implementing row-level access rules or writing API routes that talked to the database from server code.

Row-level access rules are a good way to solve this, but they would have required us to define our own opinionated language. For our users, it would have been hard to migrate away when they outgrow this solution. Instead, we preferred to focus on making serverless functions easier for our users.

Typically, serverless functions require you to either choose a full stack framework or manually write, compile, deploy and use them. This generally adds a lot of cognitive overhead even to choose the right solution. We wanted to simplify accessing the database from the frontend without sacrificing flexibility for developers. This is why we decided to build Xata Workers.

Xata Workers

A Xata Worker is a function that a developer can write in JavaScript or TypeScript as client-side code. Rather than being executed client-side, it will actually be executed on Cloudflare’s global network.

You can think of a Xata Worker as a getServerSideProps function in Next.js or a loader function in Remix. You write your server logic in a function and our tooling takes care of deploying and running it server-side for you (yes, it’s that easy).

The main difference with other alternatives is that Xata Workers are, by design, agnostic to a framework or hosting provider. You can use them to build any kind of application or website, and even upload it as static HTML in a service like GitHub Pages or S3. You don’t need a full stack web framework to use Xata Workers.

With our command line tool, we handle the build and deployment process. When the function is invoked, the Xata Worker actually makes a request to a serverless function over the network.

import { useQuery } from '@tanstack/react-query';
import { xataWorker } from '~/xata';

const listProducts = xataWorker('listProducts', async ({ xata }) => {
  return await xata.db.products.sort('popularity', 'desc').getMany();
});

export const Home = () => {
  const { data = [] } = useQuery(['products'], listProducts);

  return (
    <Grid>
      {data.map((product) => (
        <ProductCard key={product.id} product={product} />
      ))}
    </Grid>
  );
};

In the code snippet above, you can see a React component that connects to an e-commerce database with products on sale. Inside the UI component, with a popular client-side data fetching library, data is retrieved from the serverless function and for each product it renders another component in a grid.

As you can see a Xata Worker is a function that wraps any user-defined code and receives an instance of our SDK as a parameter. This instance has access to the database and, given that the code doesn’t run on the browser anymore, your secrets are not exposed for malicious usage.

When using a Xata Worker in TypeScript, our command line tool also generates custom types based on your schema. These types offer type-safety for your queries or mutations, and improve your developer experience by adding extra intellisense to your IDE.

Xata Workers: client-side database access without client-side secrets

A Xata Worker, like any other function, can receive additional parameters that pass application state, context or user tokens. The code you write in the function can either return an object that will be serialized over the network with a superset of JSON to support dates and other non-primitive data types, or a full response with a custom status code and headers.

Developers can write all their logic, including their own authentication and authorization. Unlike complex row level access control rules, you can easily express your logic without constraints and even unit test it with the rest of your code.

How we use Cloudflare

We are happy to join the Supercloud movement, Cloudflare has an excellent track record, and we are using Cloudflare Workers for Platforms to host our serverless functions. By using the Workers isolated execution contexts we reduce security risks of running untrusted code on our own while being close to our users, resulting in super low latency.

All of it, without having to deploy extra infrastructure to handle our user’s application load or ask them to configure how the serverless functions should be deployed. It really feels like magic! Now, let’s dive into the internals of how we use Cloudflare to run our Xata Workers.

For every workspace in Xata we create a Worker Namespace, a Workers for Platform concept to organize Workers and restrict the routing between them. We used Namespaces to group and encapsulate the different functions coming from all the databases built by a client or team.

When a user deploys a Xata Worker, we create a new Worker Script, and we upload the compiled code to its Namespace. Each script has a unique name with a compilation identifier so that the user can have multiple versions of the same function running at the same time.

During the compilation, we inject the database connection details and the database name. This way, the function can connect to the database without leaking secrets and restricting the scope of access to the database, all of it transparently for the developer.

When the client-side application runs a Xata Worker, it calls a Dispatcher function that processes the request and calls the correct Worker Script. The dispatcher function is also responsible for configuring the CORS headers and the log drain that can be used by the developer to debug their functions.

Xata Workers: client-side database access without client-side secrets

By using Cloudflare, we are also able to benefit from other products in the Workers ecosystem. For example, we can provide an easy way to cache the results of a query in Cloudflare’s global network. That way, we can serve the results for read-only queries directly from locations closer to the end users, without having to call the database again and again for every Worker invocation. For the developer, it’s only a matter of adding a “cache” parameter to their query with the number of milliseconds they want to cache the results in a KV Namespace.

import { xataWorker } from '~/xata';

const listProducts = xataWorker('listProducts', async ({ xata }) => {
  return await xata.db.products.sort('popularity', 'desc').getMany({
    cache: 15 * 60 * 1000 // TTL
  });
});

In development mode, we provide a command to run the functions locally and test them before deploying them to production. This enables rapid development workflows with real-time filesystem change monitoring and hot reloading of the workers code. Internally, we use the latest version of miniflare to emulate the Cloudflare Workers runtime, mimicking the real production environment.

Conclusion

Xata is now out of beta and available for everyone. We offer a generous free tier that allows you to build and deploy your applications and only pay to scale them when you actually need it.

You can sign up for free, create a database in seconds and enjoy features such as branching with zero downtime migrations, search and analytics, transactions, and many others. Check out our website to learn more!

Xata Workers are currently in private beta. If you are interested in trying them out, you can sign up for the waitlist and talk us through your use case. We are looking for developers that are willing to provide feedback and shape this new feature for our serverless data platform.

We are very proud of our collaboration with Cloudflare for this new feature. Processing data closer to where it’s being requested is the future of computing and we are excited to be part of this movement. We look forward to seeing what you build with Xata Workers.

Russian Software Company Pretending to Be American

Post Syndicated from Bruce Schneier original https://www.schneier.com/blog/archives/2022/11/russian-software-company-pretending-to-be-american.html

Computer code developed by a company called Pushwoosh is in about 8,000 Apple and Google smartphone apps. The company pretends to be American when it is actually Russian.

According to company documents publicly filed in Russia and reviewed by Reuters, Pushwoosh is headquartered in the Siberian town of Novosibirsk, where it is registered as a software company that also carries out data processing. It employs around 40 people and reported revenue of 143,270,000 rubles ($2.4 mln) last year. Pushwoosh is registered with the Russian government to pay taxes in Russia.

On social media and in US regulatory filings, however, it presents itself as a US company, based at various times in California, Maryland, and Washington, DC, Reuters found.

What does the code do? Spy on people:

Pushwoosh provides code and data processing support for software developers, enabling them to profile the online activity of smartphone app users and send tailor-made push notifications from Pushwoosh servers.

On its website, Pushwoosh says it does not collect sensitive information, and Reuters found no evidence Pushwoosh mishandled user data. Russian authorities, however, have compelled local companies to hand over user data to domestic security agencies.

I have called supply chain security “an insurmountably hard problem,” and this is just another example of that.

Now Open–AWS Region in Spain

Post Syndicated from Marcia Villalba original https://aws.amazon.com/blogs/aws/now-open-aws-region-in-spain/

The AWS Region in Aragón, Spain, is now open. The official name is Europe (Spain), and the API name is eu-south-2. You can start using it today to deploy workloads and store your data in Spain.

The AWS Europe (Spain) Region has three Availability Zones (AZ) that you can use to reliably spread your applications across multiple data centers. Each Availability Zone is a fully isolated partition of AWS infrastructure that contains one or more data centers.

Availability Zones are separate and distinct geographic locations with enough distance to reduce the risk of a single event affecting the availability of the Region but near enough for business continuity for applications that require rapid failover and synchronous replication. This gives you the ability to operate production applications that are more highly available, fault-tolerant, and scalable than would be possible from a single data center.

Instances and Services
Applications running in this three-AZ Region can use C5C5dC6gM5M5dM6gR5R5dR6gI3I3enT3, and T4g instances, and can use a long list of AWS services including: Amazon API GatewayAmazon AuroraAWS AppConfigAmazon CloudWatchAmazon DynamoDBAmazon EC2 Auto ScalingAmazon ElastiCacheAmazon Elastic Block Store (Amazon EBS)Elastic Load BalancingAmazon Elastic Compute Cloud (Amazon EC2)Amazon Elastic Container Registry (Amazon ECR)Amazon Elastic Container Service (Amazon ECS), Elastic Load Balancing–Network (NLB)Amazon EMR, Amazon OpenSearch ServiceAmazon EventBridge, AWS Fargate, Amazon Kinesis Data StreamsAmazon RedshiftAmazon Relational Database Service (Amazon RDS)Amazon Route 53Amazon Simple Notification Service (Amazon SNS)Amazon Simple Queue Service (Amazon SQS)Amazon Simple Storage Service (Amazon S3), Amazon S3 GlacierAmazon Simple Workflow Service (Amazon SWF)Amazon Virtual Private Cloud (Amazon VPC)AWS Auto ScalingAWS Certificate ManagerAWS CloudFormationAWS CloudTrailAWS CodeDeployAWS ConfigAWS Database Migration Service (AWS DMS)AWS Direct ConnectAWS Identity and Access Management (IAM)AWS Key Management Service (AWS KMS)AWS LambdaAWS Marketplace, AWS Health DashboardAWS Secrets ManagerAWS Step FunctionsAWS Support APIAWS Systems Manager, AWS Trusted AdvisorAWS VPN, VM Import/Export, and AWS X-Ray.

AWS in Spain
The new AWS Europe (Spain) Region is a natural progression for AWS to support the tens of thousands of customers on the Iberian Peninsula. The Region will support our customers’ most mission-critical workloads by providing lower latency to end users across Iberia and meeting data residency needs (now customers can store their data in Spain).

In addition to the new Region in Spain, AWS currently has four Amazon CloudFront edge locations available in Madrid, Spain. And since 2016, customers can benefit from AWS Direct Connect locations to establish private connectivity between AWS and their data centers and offices. The Region in Spain also offers low-latency connections to other AWS Regions in the area, as shown in the following chart:

Latency from the Spain Region

AWS also has had offices in Madrid since 2014 and in Barcelona since 2018 and has a broad network of local partners. In addition to expanding infrastructure, AWS continues to make investments in education initiatives, training, and start-up enablement to support Spain’s digital transformation and economic development plans.

  • AWS Activate – Since 2013, this program has given Spanish start-ups access to guidance and one-on-one time with AWS experts, along with web-based training, self-paced labs, customer support, offers from third parties, and up to $100,000 in credits to use AWS services.
  • AWS Educate and AWS Academy – AWS has trained over one hundred thousand individuals in Spain in cloud skills since 2017. These programs provide higher-education institutions, educators, and students with cloud computing courses and certifications. AWS Academy has delivered courses for institutions such as ESADE, IE, UNIR, and others.
  • AWS re/Start – AWS re/Start is a skills development and job training program that aims to build local talent by providing AWS Cloud skills development and job opportunities at no cost to learners who are unemployed or are members of under-represented communities in Spain. In November 2020, AWS launched this program in Spain in collaboration with Cámara de Comercio de Madrid and in 2021 in collaboration with Universidad of Granada.
  • AWS GetIT – AWS knows that having a diverse workforce gives organizations a better understanding of customers’ needs and is key to unlocking ideas and speeding up innovation. AWS supports many programs focused on diversity and launched AWS GetIT in Spain across 11 schools to introduce young students (ESO—Educación Secundaria Obligatoria—students) to cloud computing and inspire them to consider a career in technology.

Sustainability is also very important for AWS. In 2019, Amazon and Global Optimism co-founded The Climate Pledge, a commitment to reach net-zero carbon emissions by 2040—10 years ahead of the Paris Agreement. That is why in Spain, Amazon and AWS currently have two operational renewable energy projects delivering clean energy into the Spanish grid to support the AWS Europe (Spain) Region and Amazon’s logistics network in the country.

Amazon and AWS have announced 14 more projects, currently in development, that will come online from 2022 to 2024. The 16 projects in Spain will add 1.5 gigawatts of renewable energy to the Spanish grid. This is enough to power over 850,000 average Spanish homes. Learn more about AWS sustainability in Spain.

AWS Customers in Spain
We have many amazing customers in Spain that are doing incredible things with AWS, for example:

LactApp is a Spanish start-up that was created out of the vision that every mother should have a breastfeeding and motherhood expert in their pocket. LactApp uses AWS services to build their video-on-demand capability that allows experts to upload their content and process the videos, and they make it available for their over 4,000 end users automatically.

Glovo is one of the biggest companies in the food delivery industry, born in Barcelona, Spain. The Glovo app is available in 25 countries with over 150,000 restaurants. Glovo receives over 2 TB of data daily from all the usage of their customers. Using AWS, Glovo built a data lake that allows them to store data securely and access it when they need it.

Madrid-based Savana helps healthcare providers unlock the value of their electronic medical records (EMRs) for research. They operate one of the largest artificial intelligence–enabled, multicentric research networks in the world, with over 180 hospitals across 15 countries. They use AWS to process billions of EMRs and data points to run machine learning algorithms to investigate disease prediction and treatment.

Available Now
The new Region in Spain is ready to support your business. You can find a detailed list of the services available in this Region on the AWS Regional Service List.

With this launch, AWS now spans 93 Availability Zones within 29 geographic Regions around the world. We have also announced plans for 18 more Availability Zones and six more AWS Regions in AustraliaCanadaIndiaIsraelNew Zealand, and Thailand.

For more information on our global infrastructure, upcoming Regions, and the custom hardware we use, visit the Global Infrastructure page.

— Marcia

Особености на руската пропаганда в България

Post Syndicated from Зорница Латева original https://toest.bg/osobenosti-na-ruskata-propaganda-v-bulgaria/

В тези времена на война думите са от значение. Свидетели сме на масова пропаганда и дезинформация относно тази скандална атака срещу една свободна и независима държава. Няма да позволим на апологетите на Кремъл да сипят токсичните си лъжи, оправдаващи войната на Путин, нито да сеят семената на разделение в нашия Съюз.

Думите са на председателката на Европейската комисия Урсула фон дер Лайен по повод решението на ЕС да забрани разпространението и предаването на няколко руски медии, посочени като източници на кремълската пропаганда. Така към момента на територията на ЕС не са достъпни „Русия днес“, „Спутник“, „Русия РТР“/„РТР Планета“, „Русия 24“ и „ТВ Център Интернешънъл“.

Това обаче далеч не ограничава, камо ли да спира руската пропаганда в Европа и в частност в България. Така например инструментът NewsGuard, който оценява дали даден сайт разпространява фалшиви новини, към момента следи 290 домейна, които са част от руската пропагандна машина. Става въпрос за сайтове, които публикуват информация, свързана с войната на Русия срещу Украйна. В списъка са включени официални руски медии като Агенция ТАСС, „Русия днес“ и „Спутник“, но и много страници, които не са забранени или ограничени. Нещо повече, голяма част от съдържанието се разпространява на езици, различни от руски – английски, немски, френски, италиански, а източниците са местни медии, анонимни сайтове, неправителствени организации и изследователски центрове с неясно финансиране.

Технологията на разпространение на руската пропаганда в България, както и в останалата част от Европа, следва доста прост модел. „Информацията“ тръгва от официални руски източници – представители на Кремъл, включително и самия Владимир Путин. Опорните точки, които те вербализират, се цитират от руски медии, след това се превеждат и „препечатват“ в новинарски сайтове в България. По-голямата част от тези сайтове са просто агрегатори, зад които не стоят журналисти. В тях „информацията“ се появява като копи-пейст от друг източник. След това разпространението продължава с публикуването в социалните мрежи, включително в нарочно създадени за тази цел групи.

Основната част от информацията представлява цитати от наратива на официалните власти в Кремъл. Авторски материали рядко се появяват. Фалшиви новини не липсват, но в никакъв случай не доминират в информационния поток. Това поне показва изследването на руската пропаганда у нас на Фондацията за хуманитарни и социални изследвания (ФХСИ).

А целта? Целта е оправдаване на агресията на Путин в Украйна, но и прокарване на разделителни линии в обществото и подкопаване на доверието в демокрацията, в Европейския съюз и в НАТО.

Информационна вълна

В началото на войната на Русия срещу Украйна руските пропагандни материали в българските онлайн медии бележат изключително рязък скок. От средно 39 текста на ден в първите дни на войната броят им скача 10 пъти, казва проф. Димитър Вацов, който е сред авторите на проучването на ФХСИ. В следващите месеци броят на текстовете намалява наполовина, но все пак остава 5 пъти по-висок от предвоенните месеци.

Основните теми са „опорките“ на Кремъл, построени върху геополитическа конспиративна логика. Колективният Запад, в който влизат САЩ, НАТО, а вече и ЕС, чрез своите „марионетки“ („брюкселските еврократи“ и „продажните либерални елити“ в отделните държави) убива суверенитета на народите. Този злодей обгражда и дори води война срещу Русия, която също е жертва – само че тя единствена справедливо се съпротивлява, изплува от пепелта и всъщност е спасителка на Европа и в частност на Украйна. „Целият този разказ тече през минисюжети, но се повтаря“, казва проф. Вацов.

В България същите тези опорни точки се въртят, без да се адаптират към българския културен контекст. Преплитане с местните особености има само покрай политически събития – като изпращането на оръжие на Украйна, спирането на газа, спасяването на българските моряци в Мариупол и др.

Фалшиви новини сред пропагандните материали има, но те са сравнително малък процент. Пример за подобен фейк е „новината“, разпространена дни преди нахлуването на Русия в Украйна, че полски наемници са влезли в Донбас с цел терористични атаки. Информацията е опровергана официално, но въпреки това се тиражира от руски медии, а през тях „влиза“ и в българските новинарски сайтове, които разпространяват руска пропаганда.

Верига на разпространение

Със започването на войната в Украйна изследователите забелязват съществена промяна на източника на информация в обслужващите Кремъл „новини“. Това вече не са медии или говорители извън официалната власт, а представители на Кремъл – Владимир Путин, Сергей Лавров, Дмитрий Песков, Галина Захарова, Елеонора Митрофанова и пр. „Това не бе така преди пет години: тогава руските официални лица говореха все още на дипломатически по-неутрален език, а оставяха провеждането на пропагандата на други медии и говорители. Сега вече цялата руска държава е рупор на пропагандните клишета“, пише в проучването на ФХСИ.

Пропагандните наративи се разпространяват от българските им рупори чрез цитиране или буквален превод на текстове от руски медии. „Има няколко сайта, които въртят руските наративи и влагат душа и сърце в това. Най-отчетливи са сайтовете pogled.info и news-front.info, който е базиран в Крим“, казва проф. Вацов.

Той допълва, че 65% от топ 25 на медиите, които разпространяват руска пропаганда, всъщност са сайтове агрегатори, които само копират текстове от други места и в тях не работят реални хора, още по-малко журналисти. Останалите 35% публикуват съдържание, което страниците ботове препечатват. Освен това въпросните издания се „препечатват“ едно друго.

Ботове и връзки

Част от тези сайтове са свързани. Пример за това е БЛИЦ, около който гравитират още 8 сайта агрегатори. Те са анонимни и са регистрирани на два IP адреса в САЩ, обяснява проф. Вацов. Един руски пропаганден текст се публикува в БЛИЦ и скоро след това се появява без никаква промяна в останалите 8 сайта. За пример: на 10 март БЛИЦ публикува статията на Александър Дугин „Войната в Украйна като сверяване с реалността!“, която е буквално преведена – макар и без позоваване – от izborsk-club.ru. Тя автоматично е препечатана от осемте анонимни сателита, към които, с лека модификация в заглавието, се присъединява и istinata.net.

Според инструмента за анализ на сайтове Similarweb сайтът БЛИЦ е на 4-то място в категорията на медийните сайтове в България, с около 10,7 млн. посещения на месец.

Моделът на разпространение може да се обясни и с това, че вероятно за обслужването на руска пропаганда се плаща на брой статии. А и колкото по-голям е трафикът към страниците, толкова по-голям е шансът за привличане на рекламодатели. „Няма как освен пропагандна информация по веригата да не текат и пари. Те вероятно не са и много, но това е високоефективна инвестиция. Ефектът от тази пропаганда нямаше да е голям, ако имаше противодействие – контрапропаганда, но по смислен и легален начин“, коментира проф. Вацов.

Говорителите намаляват

Според проучването на ФХСИ с увеличаването на броя на руските пропагандни материали в българските онлайн медии всъщност намалява броят на българските говорители и на авторските материали в пропагандния поток. „Вероятно е така, защото, веднъж, по-малко са парите, които руснаците директно могат да инвестират на българска сцена. И втори път, съвсем видимо, защото от повтарянето на тези опорки се оттеглят много хора, които не са съгласни с Путиновата война и искат да се разграничат от нея“, пише в изследването.

Според проучването на фондацията, сред малкото медийни и политически лица, които разпространяват тезите на Кремъл, са бившият дипломат Боян Чуков, журналистите Мартин Карбовски, Кеворк Кеворкян, Явор Дачков, лидерът на „Възраждане“ Костадин Костадинов и др. Те обаче отстъпват като източник пред официалната руска власт, както и пред световно(не)известни „чуждестранни експерти“ – с руски и англоезични имена – като Скот Ритер, Ник Паркър, Валерий Коровин и пр.

Тоест по-малко са авторските материали в българските сайтове, в които се рециклират руските пропагандни клишета, а много повече са статиите, които репортажно и най-често анонимно отразяват руски източници и/или директно превеждат пропагандни материали.

В доклада и президентът Румен Радев се откроява като публичен говорител и разпространител на руската пропаганда, макар да не използва точно думите на официалната руска власт. Авторите аргументират това твърдение с факта, че периодично Радев изразява мнения, които обслужват интересите на Кремъл – за спирането на газа от Русия, срещу изпращането на оръжия на Украйна, което ще вкара и България във войната, и др.

Публични пропагандатори във Facebook

От онлайн изданията пропагандата се прехвърля и в социалните мрежи, и по-специално във Facebook. Разпространението там се осъществява основно чрез препубликуване на съдържание, което вече е пуснато в определени медии. „Това става чрез разнообразни публични профили, страници и групи“, коментира Вероника Димитрова, която е сред авторите на изследването.

Сред най-активните профили, бълващи руска пропаганда, логично, е страницата на Руското посолство у нас. „Това не е прецедент. Подобно изследване показва, че в Германия положението е същото“, коментира Димитрова.

Най-активните публични разпространители на тезите на Кремъл във Facebook са лидерът на „Възраждане“ Костадин Костадинов и журналистът Мартин Карбовски. Влиянието им може да се определи като сериозно, тъй като и двамата имат много последователи в социалната мрежа – тези на Костадинов са 288 000, а на Карбовски – 528 000. В профила на журналиста се публикува много повече съдържание – средно около 11 поста на ден срещу около 4 на стената на политика.

Според анализ на публикациите, направен с инструмента Fanpage Karma, съдържанието в профила на Карбовски представлява основно линкове към страници от определени новинарски сайтове – lentata.com и vtorifront.bg. А сред най-често използваните думи в публикациите, които генерират и реакция от потребителите, са „Русия“, „САЩ“, „Украйна“, „България“.

И в профила на Костадинов сред ключовите думи са „България“, „Украйна“, „война“. Интеракциите, които постовете на лидера на „Възраждане“ предизвикват, са повече от тези на страницата на Карбовски – 2% средно интеракции на пост и на последовател за Костадинов срещу 0,8% за Карбовски. Костадинов разпространява основно „авторско“ съдържание – статуси, снимки и видеа, и много по-малко линкове към информация, създадена от друг.

Освен в тези два профила, много пропагандни материали се разпространяват и в страници на новинарски сайтове като pogled.info, informiran.net, epicenter.bg.

Ефектът на групите

Руската пропаганда таргетира Facebook потребители, недоволни от политически партии и от доскорошни управляващи, също така русофили, хора с носталгия към социализма и привърженици на БСП и на „Възраждане“. Това са изводите от анализа на публичните Facebook групи, които разпространяват пропагандно съдържание.

Най-активните места, в които се публикуват кремълски тези, може да се разделят условно на няколко вида. Първите са Facebook групи с политическа насоченост. „Заглавията им са свързани с протест, недоволство срещу дадени политически лица и формации“, коментира Вероника Димитрова. Според нея в тези „пространства“ се прави опит за манипулация и за канализиране на недоволството през руската пропаганда.

„Много от активните групи са свързани с имената на политици, като президента Румен Радев, лидерката на БСП Корнелия Нинова“, добави Димитрова.

Пропаганда се разпространява и във Facebook групи за хоби и интереси. Така например част от групите срещу ваксините и мерките за ограничаване на COVID-19 се преориентират с началото на войната в Украйна и в тях вече се публикува основно информация, разпространяваща опорните точки на Кремъл.

„Пропагандата се прикачва към недоволството и това води до негативно отношение, виктимизация, загубва се активната гражданска енергия. Има и подривно действие спрямо ангажиментите, които сме поели към ЕС и НАТО“, коментира Вероника Димитрова. Така проруските постове активизират хората във Facebook, карат ги да коментират, харесват и споделят, но същевременно ги правят апатични и граждански неактивни в реалния живот.

Огромният проблем е, че колкото повече реакции от потребителите има даден пост, толкова повече алгоритъмът на Facebook го показва и на други хора със сходни интереси. Така той става още по-популярен и достига до още повече хора. И веднъж харесали, коментирали или споделили такова съдържание, потребителите започват да получават повече от същото.

Заглавна илюстрация: © Пеню Кирацов
„Тоест“ е официален партньор за публикуването на материалите от поредицата „Хроники на инфодемията“, реализирана от АЕЖ-България съвместно с Фондация „Фридрих Науман“.

Източник

Особености на руската пропаганда в България

Post Syndicated from Зорница Латева original https://www.toest.bg/osobenosti-na-ruskata-propaganda-v-bulgaria/

В тези времена на война думите са от значение. Свидетели сме на масова пропаганда и дезинформация относно тази скандална атака срещу една свободна и независима държава. Няма да позволим на апологетите на Кремъл да сипят токсичните си лъжи, оправдаващи войната на Путин, нито да сеят семената на разделение в нашия Съюз.

Особености на руската пропаганда в България

Думите са на председателката на Европейската комисия Урсула фон дер Лайен по повод решението на ЕС да забрани разпространението и предаването на няколко руски медии, посочени като източници на кремълската пропаганда. Така към момента на територията на ЕС не са достъпни „Русия днес“, „Спутник“, „Русия РТР“/„РТР Планета“, „Русия 24“ и „ТВ Център Интернешънъл“.

Това обаче далеч не ограничава, камо ли да спира руската пропаганда в Европа и в частност в България. Така например инструментът NewsGuard, който оценява дали даден сайт разпространява фалшиви новини, към момента следи 290 домейна, които са част от руската пропагандна машина. Става въпрос за сайтове, които публикуват информация, свързана с войната на Русия срещу Украйна. В списъка са включени официални руски медии като Агенция ТАСС, „Русия днес“ и „Спутник“, но и много страници, които не са забранени или ограничени. Нещо повече, голяма част от съдържанието се разпространява на езици, различни от руски – английски, немски, френски, италиански, а източниците са местни медии, анонимни сайтове, неправителствени организации и изследователски центрове с неясно финансиране.

Технологията на разпространение на руската пропаганда в България, както и в останалата част от Европа, следва доста прост модел. „Информацията“ тръгва от официални руски източници – представители на Кремъл, включително и самия Владимир Путин. Опорните точки, които те вербализират, се цитират от руски медии, след това се превеждат и „препечатват“ в новинарски сайтове в България. По-голямата част от тези сайтове са просто агрегатори, зад които не стоят журналисти. В тях „информацията“ се появява като копи-пейст от друг източник. След това разпространението продължава с публикуването в социалните мрежи, включително в нарочно създадени за тази цел групи.

Основната част от информацията представлява цитати от наратива на официалните власти в Кремъл. Авторски материали рядко се появяват. Фалшиви новини не липсват, но в никакъв случай не доминират в информационния поток. Това поне показва изследването на руската пропаганда у нас на Фондацията за хуманитарни и социални изследвания (ФХСИ).

А целта? Целта е оправдаване на агресията на Путин в Украйна, но и прокарване на разделителни линии в обществото и подкопаване на доверието в демокрацията, в Европейския съюз и в НАТО.

Информационна вълна

В началото на войната на Русия срещу Украйна руските пропагандни материали в българските онлайн медии бележат изключително рязък скок. От средно 39 текста на ден в първите дни на войната броят им скача 10 пъти, казва проф. Димитър Вацов, който е сред авторите на проучването на ФХСИ. В следващите месеци броят на текстовете намалява наполовина, но все пак остава 5 пъти по-висок от предвоенните месеци.

Основните теми са „опорките“ на Кремъл, построени върху геополитическа конспиративна логика. Колективният Запад, в който влизат САЩ, НАТО, а вече и ЕС, чрез своите „марионетки“ („брюкселските еврократи“ и „продажните либерални елити“ в отделните държави) убива суверенитета на народите. Този злодей обгражда и дори води война срещу Русия, която също е жертва – само че тя единствена справедливо се съпротивлява, изплува от пепелта и всъщност е спасителка на Европа и в частност на Украйна. „Целият този разказ тече през минисюжети, но се повтаря“, казва проф. Вацов.

В България същите тези опорни точки се въртят, без да се адаптират към българския културен контекст. Преплитане с местните особености има само покрай политически събития – като изпращането на оръжие на Украйна, спирането на газа, спасяването на българските моряци в Мариупол и др.

Фалшиви новини сред пропагандните материали има, но те са сравнително малък процент. Пример за подобен фейк е „новината“, разпространена дни преди нахлуването на Русия в Украйна, че полски наемници са влезли в Донбас с цел терористични атаки. Информацията е опровергана официално, но въпреки това се тиражира от руски медии, а през тях „влиза“ и в българските новинарски сайтове, които разпространяват руска пропаганда.

Верига на разпространение

Със започването на войната в Украйна изследователите забелязват съществена промяна на източника на информация в обслужващите Кремъл „новини“. Това вече не са медии или говорители извън официалната власт, а представители на Кремъл – Владимир Путин, Сергей Лавров, Дмитрий Песков, Галина Захарова, Елеонора Митрофанова и пр. „Това не бе така преди пет години: тогава руските официални лица говореха все още на дипломатически по-неутрален език, а оставяха провеждането на пропагандата на други медии и говорители. Сега вече цялата руска държава е рупор на пропагандните клишета“, пише в проучването на ФХСИ.

Пропагандните наративи се разпространяват от българските им рупори чрез цитиране или буквален превод на текстове от руски медии. „Има няколко сайта, които въртят руските наративи и влагат душа и сърце в това. Най-отчетливи са сайтовете pogled.info и news-front.info, който е базиран в Крим“, казва проф. Вацов.

Той допълва, че 65% от топ 25 на медиите, които разпространяват руска пропаганда, всъщност са сайтове агрегатори, които само копират текстове от други места и в тях не работят реални хора, още по-малко журналисти. Останалите 35% публикуват съдържание, което страниците ботове препечатват. Освен това въпросните издания се „препечатват“ едно друго.

Ботове и връзки

Част от тези сайтове са свързани. Пример за това е БЛИЦ, около който гравитират още 8 сайта агрегатори. Те са анонимни и са регистрирани на два IP адреса в САЩ, обяснява проф. Вацов. Един руски пропаганден текст се публикува в БЛИЦ и скоро след това се появява без никаква промяна в останалите 8 сайта. За пример: на 10 март БЛИЦ публикува статията на Александър Дугин „Войната в Украйна като сверяване с реалността!“, която е буквално преведена – макар и без позоваване – от izborsk-club.ru. Тя автоматично е препечатана от осемте анонимни сателита, към които, с лека модификация в заглавието, се присъединява и istinata.net.

Според инструмента за анализ на сайтове Similarweb сайтът БЛИЦ е на 4-то място в категорията на медийните сайтове в България, с около 10,7 млн. посещения на месец.

Моделът на разпространение може да се обясни и с това, че вероятно за обслужването на руска пропаганда се плаща на брой статии. А и колкото по-голям е трафикът към страниците, толкова по-голям е шансът за привличане на рекламодатели. „Няма как освен пропагандна информация по веригата да не текат и пари. Те вероятно не са и много, но това е високоефективна инвестиция. Ефектът от тази пропаганда нямаше да е голям, ако имаше противодействие – контрапропаганда, но по смислен и легален начин“, коментира проф. Вацов.

Говорителите намаляват

Според проучването на ФХСИ с увеличаването на броя на руските пропагандни материали в българските онлайн медии всъщност намалява броят на българските говорители и на авторските материали в пропагандния поток. „Вероятно е така, защото, веднъж, по-малко са парите, които руснаците директно могат да инвестират на българска сцена. И втори път, съвсем видимо, защото от повтарянето на тези опорки се оттеглят много хора, които не са съгласни с Путиновата война и искат да се разграничат от нея“, пише в изследването.

Според проучването на фондацията, сред малкото медийни и политически лица, които разпространяват тезите на Кремъл, са бившият дипломат Боян Чуков, журналистите Мартин Карбовски, Кеворк Кеворкян, Явор Дачков, лидерът на „Възраждане“ Костадин Костадинов и др. Те обаче отстъпват като източник пред официалната руска власт, както и пред световно(не)известни „чуждестранни експерти“ – с руски и англоезични имена – като Скот Ритер, Ник Паркър, Валерий Коровин и пр.

Тоест по-малко са авторските материали в българските сайтове, в които се рециклират руските пропагандни клишета, а много повече са статиите, които репортажно и най-често анонимно отразяват руски източници и/или директно превеждат пропагандни материали.

В доклада и президентът Румен Радев се откроява като публичен говорител и разпространител на руската пропаганда, макар да не използва точно думите на официалната руска власт. Авторите аргументират това твърдение с факта, че периодично Радев изразява мнения, които обслужват интересите на Кремъл – за спирането на газа от Русия, срещу изпращането на оръжия на Украйна, което ще вкара и България във войната, и др.

Публични пропагандатори във Facebook

От онлайн изданията пропагандата се прехвърля и в социалните мрежи, и по-специално във Facebook. Разпространението там се осъществява основно чрез препубликуване на съдържание, което вече е пуснато в определени медии. „Това става чрез разнообразни публични профили, страници и групи“, коментира Вероника Димитрова, която е сред авторите на изследването.

Сред най-активните профили, бълващи руска пропаганда, логично, е страницата на Руското посолство у нас. „Това не е прецедент. Подобно изследване показва, че в Германия положението е същото“, коментира Димитрова.

Най-активните публични разпространители на тезите на Кремъл във Facebook са лидерът на „Възраждане“ Костадин Костадинов и журналистът Мартин Карбовски. Влиянието им може да се определи като сериозно, тъй като и двамата имат много последователи в социалната мрежа – тези на Костадинов са 288 000, а на Карбовски – 528 000. В профила на журналиста се публикува много повече съдържание – средно около 11 поста на ден срещу около 4 на стената на политика.

Според анализ на публикациите, направен с инструмента Fanpage Karma, съдържанието в профила на Карбовски представлява основно линкове към страници от определени новинарски сайтове – lentata.com и vtorifront.bg. А сред най-често използваните думи в публикациите, които генерират и реакция от потребителите, са „Русия“, „САЩ“, „Украйна“, „България“.

И в профила на Костадинов сред ключовите думи са „България“, „Украйна“, „война“. Интеракциите, които постовете на лидера на „Възраждане“ предизвикват, са повече от тези на страницата на Карбовски – 2% средно интеракции на пост и на последовател за Костадинов срещу 0,8% за Карбовски. Костадинов разпространява основно „авторско“ съдържание – статуси, снимки и видеа, и много по-малко линкове към информация, създадена от друг.

Освен в тези два профила, много пропагандни материали се разпространяват и в страници на новинарски сайтове като pogled.info, informiran.net, epicenter.bg.

Ефектът на групите

Руската пропаганда таргетира Facebook потребители, недоволни от политически партии и от доскорошни управляващи, също така русофили, хора с носталгия към социализма и привърженици на БСП и на „Възраждане“. Това са изводите от анализа на публичните Facebook групи, които разпространяват пропагандно съдържание.

Най-активните места, в които се публикуват кремълски тези, може да се разделят условно на няколко вида. Първите са Facebook групи с политическа насоченост. „Заглавията им са свързани с протест, недоволство срещу дадени политически лица и формации“, коментира Вероника Димитрова. Според нея в тези „пространства“ се прави опит за манипулация и за канализиране на недоволството през руската пропаганда.

„Много от активните групи са свързани с имената на политици, като президента Румен Радев, лидерката на БСП Корнелия Нинова“, добави Димитрова.

Пропаганда се разпространява и във Facebook групи за хоби и интереси. Така например част от групите срещу ваксините и мерките за ограничаване на COVID-19 се преориентират с началото на войната в Украйна и в тях вече се публикува основно информация, разпространяваща опорните точки на Кремъл.

„Пропагандата се прикачва към недоволството и това води до негативно отношение, виктимизация, загубва се активната гражданска енергия. Има и подривно действие спрямо ангажиментите, които сме поели към ЕС и НАТО“, коментира Вероника Димитрова. Така проруските постове активизират хората във Facebook, карат ги да коментират, харесват и споделят, но същевременно ги правят апатични и граждански неактивни в реалния живот.

Огромният проблем е, че колкото повече реакции от потребителите има даден пост, толкова повече алгоритъмът на Facebook го показва и на други хора със сходни интереси. Така той става още по-популярен и достига до още повече хора. И веднъж харесали, коментирали или споделили такова съдържание, потребителите започват да получават повече от същото.

Заглавна илюстрация: © Пеню Кирацов

„Тоест“ е официален партньор за публикуването на материалите от поредицата „Хроники на инфодемията“, реализирана от АЕЖ-България съвместно с Фондация „Фридрих Науман“.

Query expansion based on user behaviour

Post Syndicated from Grab Tech original https://engineering.grab.com/query-expansion-based-on-user-behaviour

Introduction

Our consumers used to face a few common pain points while searching for food with the Grab app. Sometimes, the results would include merchants that were not yet operational or locations that were out of the delivery radius. Other times, no alternatives were provided. The search system would also have difficulties handling typos, keywords in different languages, synonyms, and even word spacing issues, resulting in a suboptimal user experience.

Over the past few months, our search team has been building a query expansion framework that can solve these issues. When a user query comes in, it expands the query to a few related keywords based on semantic relevance and user intention. These expanded words are then searched with the original query to recall more results that are high-quality and diversified. Now let’s take a deeper look at how it works.

Query expansion framework

Building the query expansion corpus

We used two different approaches to produce query expansion candidates: manual annotation for top keywords and data mining based on user rewrites.

Manual annotation for top keywords

Search has a pronounced fat head phenomenon. The most frequent thousand of keywords account for more than 70% of the total search traffic. Therefore, handling these keywords well can improve the overall search quality a lot. We manually annotated the possible expansion candidates for these common keywords to cover the most popular merchants, items and alternatives. For instance, “McDonald’s” is annotated with {“burger”, “western”}.

Data mining based on user rewrites

We observed that sometimes users tend to rewrite their queries if they are not satisfied with the search result. As a pilot study, we checked the user rewrite records within some user search sessions and found several interesting samples:

{Ya Kun Kaya Toast,Starbucks}
{healthy,Subway}
{Muni,Muji}
{奶茶,koi}
{Roti,Indian}

We can see that besides spelling corrections, users’ rewrite behaviour also reveals deep semantic relations between these pairs that cannot be easily captured by lexical similarity, such as similar merchants, merchant attributes, language differences, cuisine types, and so on. We can leverage the user’s knowledge to build a query expansion corpus to improve the diversity of the search result and user experience. Furthermore, we can use the wisdom of the crowd to find some common patterns with higher confidence.

Based on this intuition, we leveraged the high volume of search click data available in Grab to generate high-quality expansion pairs at the user session level. To augment the original queries, we collected rewrite pairs that happened to multiple users and multiple times in a time period. Specifically, we used the heuristic rules below to collect the rewrite pairs:

  • Select the sessions where there are at least two distinct queries (rewrite session)
  • Collect adjacent query pairs in the search session where the second query leads to a click but the first does not (effective rewrite)
  • Filter out the sample pairs with time interval longer than 30 seconds in between, as users are more likely to change their mind on what to look for in these pairs (single intention)
  • Count the occurrences and filter out the low-frequency pairs (confidence management)

After we have the mining pairs, we categorised and annotated the rewrite types to gain a deeper understanding of the user’s rewrite behaviour. A few samples mined from the Singapore area data are shown in the table below.

Original query Rewrite query Frequency in a month Distinct user count Type
playmade by 丸作 playmade 697 666 Drop keywords
mcdonald’s burger 573 535 Merchant -> Food
Bubble tea koi 293 287 Food -> Merchant
Kfc McDonald’s 238 234 Merchant -> Merchant
cake birthday cake 206 205 Add words
麦当劳 mcdonald’s 205 199 Locale change
4 fingers 4fingers 165 162 Space correction
krc kfc 126 124 Spelling correction
5 guys five guys 120 120 Number synonym
koi the koi thé 45 44 Tone change

We further computed the percentages of some categories, as shown in the figure below.

Figure 1. The donut chart illustrates the percentages of the distinct user counts for different types of rewrites.

Apart from adding words, dropping words and spelling corrections, a significant portion of the rewrites are in the category of Other. It is more semantic driven, such as merchant to merchant, or merchant to cuisine. Those rewrites are useful for capturing deeper connections between queries and can be a powerful diversifier to query expansion.

Grouping

After all the rewrite pairs were discovered offline through data mining, we grouped the query pairs by the original query to get the expansion candidates of each query. For serving efficiency, we limited the max number of expansion candidates to three.

Query expansion serving

Expansion matching architecture

The expansion matching architecture benefits from the recent search architecture upgrade, where the system flow is changed to a query understanding, multi-recall and result fusion flow. In particular, a query goes through the query understanding module and gets augmented with additional information. In this case, the query understanding module takes in the keyword and expands it to multiple synonyms, for example, KFC will be expanded to fried chicken. The original query together with its expansions are sent together to the search engine under the multi-recall framework. After that, results from multiple recallers with different keywords are fused together.

Continuous monitoring and feedback loop

It’s important to make sure the expansion pairs are relevant and up-to-date. We run the data mining pipeline periodically to capture the new user rewrite behaviours. Meanwhile, we also monitor the expansion pairs’ contribution to the search result by measuring the net contribution of recall or user interaction that the particular query brings, and eliminate the obsolete pairs in an automatic way. This reflects our effort to build an adaptive system.

Results

We conducted online A/B experiments across 6 countries in Southeast Asia to evaluate the expanded queries generated by our system. We set up 3 groups:

  • Control group, where no query is expanded.
  • Treatment group 1, where we expanded the queries based on manual annotations only.
  • Treatment group 2, where we expanded the queries using the data mining approach.

We observed decent uplift in click-through rate and conversion rate from both treatment groups. Furthermore, in treatment group 2, the data mining approach produced even better results.

Future work

Data mining enhancement

Currently, the data mining approach can only identify the pairs from the same search session by one user. This limits the number of linked pairs. Some potential enhancements include:

  • Augment expansion pairs by associating queries from different users who click on the same merchant/item, for example, using a click graph. This can capture relevant queries across user sessions.
  • Build a probabilistic model on top of the current transition pairs. Currently, all the transition pairs are equally weighted but apparently, the transitions that happen more often should carry higher probability/weights.

Ads application

Query expansion can be applied to advertising and would increase ads fill rate. With “KFC” expanded to “fried chicken”, the sponsored merchants who buy the keyword “fried chicken” would be eligible to show up when the user searches “KFC”. This would enable Grab to provide more relevant sponsored content to our users, which helps not only the consumers but also the merchants.

Special thanks to Zhengmin Xu and Daniel Ng for proofreading this article.

Join us

Grab is the leading superapp platform in Southeast Asia, providing everyday services that matter to consumers. More than just a ride-hailing and food delivery app, Grab offers a wide range of on-demand services in the region, including mobility, food, package and grocery delivery services, mobile payments, and financial services across 428 cities in eight countries.

Powered by technology and driven by heart, our mission is to drive Southeast Asia forward by creating economic empowerment for everyone. If this mission speaks to you, join our team today!

Introducing our final AWS Heroes of the year – November 2022

Post Syndicated from Taylor Lacy original https://aws.amazon.com/blogs/aws/introducing-our-final-aws-heroes-of-the-year-november-2022/

The AWS Heroes program celebrates and recognizes builders who are making an impact within the global AWS community. As we come to the end of 2022, the program is recognizing seven individuals who are passionate about AWS, and focused on organizing and speaking at community events, mentoring, authoring content, and even preserving wildlife. Please meet the newest AWS Heroes!

Ed Miller – San Jose, USA

Machine Learning Hero Ed Miller is a Senior Principal Engineer at Arm where he leads technical engagements with strategic partners around machine learning and IoT. He also volunteers with the BearID Project, developing open source, machine learning solutions for non-invasive wildlife monitoring. Ed is working on a human-in-the-loop machine learning application for identifying the famous fat bears on Explore.org’s Brooks Falls Brown Bears webcam. The serverless application, Bearcam Companion, is built using AWS Amplify and various AWS AI services. You can read about it and other projects on Ed’s blogs at dev.to, Hashnode, and the BearID Project.

Jones Zachariah Noel N – Karnataka, India

Serverless Hero Jones Zachariah Noel N is a Senior Developer Advocate in the Developer Relations ecospace at Freshworks, and has previously worked as a Cloud Architect – Serverless where he was focused on designing and architecting solutions built with the AWS Serverless tech stack. Jones is a tech enthusiast who loves to interact with the community, which has helped him learn and share his knowledge, as he also co-organizes AWS User Group Bengaluru. He writes regularly about AWS Serverless and talks about new features and different Serverless services, which can help you level up your Serverless applications’ architecture on dev.to. Additionally, Jones co-runs a YouTube podcast called The Zacs’ Show Talking AWS about DevOps and Serverless practices along with another Zack whom he met through the AWS Community Builder program.

Luciano Mammino – Dublin, Ireland

Serverless Hero Luciano Mammino is a full-stack web developer and a senior cloud architect at fourTheorem. He is a co-author of the book Node.js Design Patterns and co-host of the podcast AWS Bites. Luciano is one of the creators of Middy, one of the most adopted middleware-based Node.js frameworks for AWS Lambda. Through fourTheorem, he also contributes to several other open-source projects in the serverless space, such as SLIC Watch for automated observability. Finally, he is also an eager tech speaker who has evangelized the adoption of serverless from the very early days.

Madhu Kumar – Budapest, Hungary

Container Hero Madhu Kumar is a Principal Cloud Architect and Product Owner (Container Services) working for T-Systems International with over 22 years of IT experience working across multiple regions, including Asia, the Middle East, the US, Europe, and the UK. He is an AWS User Group Leader, DevSecCon Chapter Leader for Hungary, DevOps Institute Brand Ambassador and Chapter Leader, HashiCorp User Group Leader for Hungary, and formally an AWS Community Builder. Madhu is passionate about organizing meetups, driving and assisting global and local communities to come together, and sharing knowledge. He is also a regular speaker at container conferences and AWS events.

Paweł Zubkiewicz – Wroclaw, Poland

Serverless Hero Paweł Zubkiewicz works as a Cloud Architect and Consultant who helps companies build products on AWS. In 2018, Paweł started Serverless Polska, an online community for serverless enthusiasts where he shares his technical knowledge and introduces serverless to a broader audience. Shortly after, he began publishing a newsletter about serverless and AWS cloud. He continuously shares his expertise and insights with the Polish-speaking community to this day, both online and as a conference speaker. Before becoming an AWS Hero, he was an AWS Community Builder since 2020, and shares serverless tutorials on dev.to. He lives in Wroclaw, Poland with his wife and his dog named Pixel. He’s an avid mountain biker and a traveler.

Rossana Suarez – Resistencia, Argentina

Container Hero Rossana Suarez is a DevOps consultant and trainer. She started the ‘295devops’ channel to share her expertise about various DevOps topics, and to help enthusiasts get into the field more easily and with more motivation. She consults with teams of developers and DevOps engineers to help them improve their existing processes for automations, CI/CD, containerization, and orchestration. Rossana presents at Women in Technology’s local meetups to encourage more women to pursue careers in DevOps, is a volunteer with AWS Girls Argentina, and is a frequent speaker about container technologies at AWS Community Days, ContainersDays, and more.

TaeSeong Park – Seoul, Korea

Community Hero TaeSeong Park is a front-end engineer and Unity mobile developer working at IDEASAM. He’s spoken at major AWSKRUG community events, and has led hands-on labs specific to a front-end and mobile app on AWS Amplify. For the past 5 years, TaeSeong has been an organizer of the AWSKRUG Group and was an AWS Community Builder for 2-years. Not only he did he organize the AWSKRUG Gudi meetup, but he’s been a speaker and supporter of other AWSKRUG meetups.

Learn More

If you’d like to learn more about the new Heroes or connect with a Hero near you, please visit the AWS Heroes website or browse the AWS Heroes Content Library.

Taylor

Your guide to streaming data & real-time analytics at re:Invent 2022

Post Syndicated from Anna Montalat original https://aws.amazon.com/blogs/big-data/your-guide-to-streaming-data-real-time-analytics-at-reinvent-2022/

Mark your calendars for November 28 through December 2, 2022 to attend AWS re:Invent in Las Vegas – a learning conference hosted by AWS for the global cloud computing community.

To maximize the value of your data, you need to act upon it in real time, instead of waiting for hours, days, or week. AWS streaming data services offer unmatched, end to end capabilities to build real-time streaming data pipelines and applications to maximize the value of your data and act upon it in real time. You can leverage Kinesis Data Streams, Kinesis Video Streams and Amazon Managed Streaming for Apache Kafka (MSK) to collect and store data streams at scale; Kinesis Data Firehose to load real-time streams into data lakes, warehouses, and analytics services; and Kinesis Data Analytics to analyze streaming data in real time using Apache Flink. With streaming data architectures, customers can analyze data as soon as it is produced, get timely insights and make real-time decisions to capitalize on opportunities, enhance customer experiences, prevent networking failures, or update critical business metrics in real-time, just to name a few. This post walks you through the key sessions on streaming data and analytics that you cannot miss this year at reInvent to help you plan your conference week accordingly.

To access the session catalog and reserve your seat for one of our streaming data and analytics sessions, you must be registered for re:Invent. Register now!

Keynotes and leadership sessions you cannot miss!

Speakers have always been a key piece of the re:Invent puzzle. This year is no different, and you’ll have the chance to hear from some of the leading voices at AWS.

Adam Selipsky, Chief Executive Officer of Amazon Web Services – Keynote

Tuesday November 29 | 8:30 AM – 10:30 AM PST | The Venetian

Join Adam Selipsky, CEO of Amazon Web Services, as he looks at the ways that forward-thinking builders are transforming industries and even our future, powered by AWS. He highlights innovations in data, infrastructure, security, and more that are helping customers achieve their goals faster, take advantage of untapped potential, and create a better future with AWS.

Reserve your seat now!

Swami Sivasubramanian, Vice President of AWS Data and Machine Learning – Keynote

Wednesday November 30 | 8:30 AM – 10:30 AM PST | The Venetian

Join Swami Sivasubramanian, Vice President of AWS Data and Machine Learning, as he unveils some of the latest AWS innovations, designed to help you transform data into meaningful insights. Hear from leading AWS customers who are using data to bring new experiences to life for their customers.

Reserve your seat now!

AWS storage innovations at exabyte scale – Leadership session

Tuesday November 29 | 11:00 – 12:00 PM PST | The Venetian

Data is the change agent driving digital transformation. In this session, Mai-Lan Tomsen Bukovec, AWS Tech VP, and Andy Warfield, AWS Distinguished Engineer, share the latest AWS storage innovations and an inside look at how customers drive modern business on data lakes and with high-performance data.

Reserve your seat now!

Unlock the value of your data with AWS analytics – Leadership session

Wednesday November 30 | 2:30 – 3:30 PM PST | The Venetian

Data fuels digital transformation and drives effective business decisions. In this session, G2 Krishnamoorthy, VP of AWS Analytics, addresses the current state of analytics on AWS, covers the latest service innovations around data, and highlights customer successes with AWS analytics.

Reserve your seat now!

Customer sessions

Join our customer sessions to learn first-hand how other organizations are maximizing the value of their data with real-time streaming data architectures, enabling them to untap new business opportunities, enhance processes, and deliver delightful customer experiences.

  • How Riot Games processes 20 TB of analytics data daily on AWS – Riot Games ingests about 20 TB of data every day on AWS. This data powers a wide range of services, including game matchmaking, in-game personalization, analytics, security, and player behavior management. Join this session to learn how Riot Games transformed their data ingestion pipeline to query data from 6 hours after it was produced down to just 5 minutes. Reserve your seat now!
  • How Samsung modernized architecture for real-time analytics – In this session, Samsung SmartThings shares how they modernized their streaming data analytics architecture for real-time analytics. Originally, Samsung developers spent most of their time managing infrastructure. After migrating to Amazon Kinesis Data Analytics, developers were able to focus on delivering business value without needing to worry about infrastructure management. Reserve your seat now!
  • Leveling up computer vision and artificial intelligence development – Seeing is believing, and Kami Vision is proof! In this session, Kami Vision speaks to how they utilized Amazon Kinesis Video Streams to do the undifferentiated video lifting so that they could develop KamiCare fall detection—an accurate way to monitor if a person has fallen to the floor and cannot get up. Reserve your seat now!
  • How Sony Orchard accelerated innovation with Amazon MSK – The Orchard, a subsidiary of Sony Music Entertainment, built a high-performing data synchronization solution using Amazon Managed Streaming for Apache Kafka (Amazon MSK). Learn how their data synchronization and search capabilities improved using this solution. Reserve your seat now!
  • How Poshmark accelerates growth via real-time analytics & personalization – Find out how Poshmark designed real-time personalization using real-time event capture to deliver tailored customer experiences, reduce security risks, and enable end-users to more confidently interact with the Poshmark app. Reserve your seat now!
  • Building and operating at scale with feature management (sponsored by LaunchDarkly) – LaunchDarkly customers deliver software applications that support millions of end-users at any given time. They rely on LaunchDarkly to launch, control, and measure those applications in real time without negative customer impact. In this session, we’ll discuss key architecture decisions and LaunchDarkly best practices. Reserve your seat now!

Breakout sessions

AWS re:Invent breakout sessions are lecture-style and one hour long. These sessions take place across the re:Invent campus and cover all topics at all levels.

  • What’s new in AWS streaming – Streaming data and analytics help your business make real-time contextual decisions, deliver personalized customer experiences, and untap new opportunities in real time. Join us to find out about the latest innovations in the AWS streaming portfolio. Reserve your seat now!
  • Build a managed analytics platform for your ecommerce business – With the increase in popularity of online shopping, building an analytics platform for ecommerce is important for any organization because it provides insights about the business, trends, and customer behavior. Join us to learn how to build a complete analytics platform in batch and real-time mode. Reserve your seat now!
  • Publishing real-time financial data feeds using Kafka – This session describes how to offer a real-time financial data feed as a service on AWS. With Amazon MSK, you can use Kafka to allow your customers to subscribe to message topics containing the financial data of interest. We will cover connectivity best practices for scalability, security options for a secure architecture, and lessons learned from customers that are using AWS to distribute financial data on AWS. Reserve your seat now!
  • Interact with streaming data using Amazon Kinesis Data Analytics Studio – Join us in this theater session to learn how analyzing streaming data provides the timely, actionable insights a business needs to grow. Reserve your seat now!

Chalk talks

Chalk talks are a highly interactive content format with a small audience. Each begins with a short lecture delivered by an AWS expert followed by a Q&A session with the audience.

  • Modern data exchange using AWS data streaming – We’ll explore how different systems sync low-latency data changes using Apache Hudi backed by Amazon Simple Storage Service (Amazon S3) in a data mesh architecture. This modern architecture allows developers to build streaming jobs that read, join, and aggregate data from multiple datasets and sync data changes to downstream data stores. Reserve your seat now!
  • Build a serverless streaming workload with Amazon Kinesis – Collecting, processing, and analyzing streaming data is easy with Amazon Kinesis services. Make plans for this chalk talk that will take your streaming capabilities to the next level. Reserve your seat now!

Workshops

Workshops are two-hour hands-on sessions where you work in teams to solve problems using AWS services. Workshops organize attendees into small groups and provide scenarios to encourage interaction, giving you the opportunity to learn from and teach each other. Don’t forget to bring your laptop!

  • Building a serverless Apache Kafka data pipeline – Serverless means “focus on what matters”! In this workshop, we’ll show how you can build a serverless data pipeline using Amazon MSK Serverless, deploy a Kafka client container-based AWS Lambda function, and much more! Reserve your seat now!
  • Event detection with Amazon MSK and Amazon Kinesis Data Analytics – When in Las Vegas, you do as Las Vegans do! In this workshop, you’ll see how casinos use Amazon MSK, Amazon Kinesis Data Analytics Studio, and AWS Lambda to enhance customer experiences. Reserve your seat now!
  • Build smart camera applications using Amazon Kinesis Video Streams WebRTC – Amazon Kinesis Video Streams WebRTC helps users to easily build low-latency video solutions such as smart doorbells, connected vehicles, surveillance cameras, and more. Join this workshop for hands-on experience building a complete real-world video solution, including setting up a device with a camera to transmit video. Reserve your seat now!

Fun, fun, and more fun!

All work and no play … not at re:Invent! Sure, we’ll work hard and learn a lot, but we also plan to have a great time while we’re together. Our gamified learning sessions will give you real-life learning opportunities through interactive events that promise to be fun and entertaining!

The fun continues with AWS Builder Labs, where you’ll have the opportunity to test your skills in sandbox settings while working alongside some of the leading minds from AWS!

And don’t forget to visit the Analytics kiosk within the AWS Village to meet with experts to dive deeper into AWS streaming data services such as Kinesis Data Streams, Kinesis Data Firehose, Kinesis Data Analytics and Amazon MSK. You will be able to ask our experts questions and experience live demos for our newly launched capabilities. Make sure to stop by the swag distribution table to grab free Analytics swag if you have attended either the Analytics kiosk or one of our breakout sessions, chalk talks, or workshops.

Register today

Keep your eyes on this post for more updates and exciting news. It’s going to be a simply amazing event and we can’t wait to see you at re:Invent 2022, the world’s premier tech event! Register now to secure your spot!


About the author

Anna Montalat is a Senior Product Marketing Manager for AWS streaming data services which includes Amazon Managed Streaming for Apache Kafka (MSK), Kinesis Data Streams, Kinesis Video Streams, Kinesis Data Firehose, and Kinesis Data Analytics. She is passionate about bringing new and emerging technologies to market, working closely with service teams and enterprise customers. Outside of work, Anna skis through winter time and sails through summer.

[$] Scaling the KVM community

Post Syndicated from original https://lwn.net/Articles/914638/

The scalability of Linus Torvalds was a
recurring theme during Linux’s early years; these days maintainer struggles
are a recognized problem within open-source
communities in general. It is thus not surprising that Sean Christopherson
gave a talk at Open Source Summit Europe (and KVM Forum) with the title
“Scaling KVM and its community”. The talk mostly focused on KVM for the
x86 architecture—the largest and most mature KVM architecture—which
Christopherson
co-maintains. But it was not a technical talk: most of the content can be
applied to other KVM architectures, or even other Linux subsystems, so that
they can avoid making the same kinds of mistakes.

Building serverless .NET applications on AWS Lambda using .NET 7

Post Syndicated from James Beswick original https://aws.amazon.com/blogs/compute/building-serverless-net-applications-on-aws-lambda-using-net-7/

This post is written by James Eastham, Senior Cloud Architect, Beau Gosse, Senior Software Engineer, and Samiullah Mohammed, Senior Software Engineer

Today, AWS is announcing tooling support to enable applications running .NET 7 to be built and deployed on AWS Lambda. This includes applications compiled using .NET 7 native AOT. .NET 7 is the latest version of .NET and brings many performance improvements and optimizations.

Native AOT enables .NET code to be ahead-of-time compiled to native binaries for up to 86% faster cold starts when compared to the .NET 6 managed runtime. The fast execution and lower memory consumption of native AOT can also result in reduced Lambda costs. This post walks through how to get started running .NET 7 applications on AWS Lambda with native AOT.

Overview

Customers can use .NET 7 with Lambda in two ways. First, Lambda has released a base container image for .NET 7, enabling customers to build and deploy .NET 7 functions as container images. Second, you can use Lambda’s custom runtime support to run functions compiled to native code using .NET 7 native AOT. Lambda has not released a managed runtime for .NET 7, since it is not a long-term support (LTS) release.

Native AOT allows .NET applications to be pre-compiled to a single binary, removing the need for JIT (Just In Time compilation) and the .NET runtime. To use this binary in a custom runtime, it needs to include the Lambda runtime client. The runtime client integrates your application code with the Lambda runtime API, which enables your application code to be invoked by Lambda.

The enhanced tooling announced today streamlines the tasks of building .NET applications using .NET 7 native AOT and deploying them to Lambda using a custom runtime. This tooling comprises three tools. The AWS Lambda extension to the ‘dotnet’ CLI (Amazon.Lambda.Tools) contains the commands to build and deploy Lambda functions using .NET. The dotnet CLI can be used directly, and is also used by the AWS Toolkit for Visual Studio, and the AWS Serverless Application Model (AWS SAM), an open-source framework for building serverless applications.

Native AOT compiles code for a specific OS version. If you run the dotnet publish command on your machine, the compiled code only runs on the OS version and processor architecture of your machine. For your application code to run in Lambda using native AOT, the code must be compiled on the Amazon Linux 2 (AL2) OS. The new tooling supports compiling your Lambda functions within an AL2-based Docker image, with the compiled application stored on your local hard drive.

Develop Lambda functions with .NET 7 native AOT

In this section, we’ll discuss how to develop your Lambda function code to be compatible with .NET 7 native AOT. This is the first GA version of native AOT Microsoft has released. It may not suit all workloads, since it does come with trade-offs. For example, dynamic assembly loading and the System.Reflection.Emit library are not available. Native AOT also trims your application code, resulting in a small binary that contains the essential components for your application to run.

Prerequisites

Getting Started

To get started, create a new Lambda function project using a custom runtime from the .NET CLI.

dotnet new lambda.NativeAOT -n LambdaNativeAot
cd ./LambdaNativeAot/src/LambdaNativeAot/
dotnet add package Amazon.Lambda.APIGatewayEvents
dotnet add package AWSSDK.Core

To review the project settings, open the LambdaNativeAot.csproj file. The target framework in this template is set to net7.0. To enable native AOT, add a new property named PublishAot, with value true. This PublishAot flag is an MSBuild property required by the .NET SDK so that the compiler performs native AOT compilation.

When using Lambda with a custom runtime, the Lambda service looks for an executable file named bootstrap within the packaged ZIP file. To enable this, the OutputType is set to exe and the AssemblyName to bootstrap.

The correctly configured LambdaNativeAot.csproj file looks like this:

<Project Sdk="Microsoft.NET.Sdk">
  <PropertyGroup>
    <OutputType>Exe</OutputType>
    <TargetFramework>net7.0</TargetFramework>
    <ImplicitUsings>enable</ImplicitUsings>
    <Nullable>enable</Nullable>
    <AWSProjectType>Lambda</AWSProjectType>
    <AssemblyName>bootstrap</AssemblyName>
    <PublishAot>true</PublishAot>
  </PropertyGroup> 
  …
</Project>

Function code

Running .NET with a custom runtime uses the executable assembly feature of .NET. To do this, your function code must define a static Main method. Within the Main method, you must initialize the Lambda runtime client, and configure the function handler and the JSON serializer to use when processing Lambda events.

The Amazon.Lambda.RuntimeSupport Nuget package is added to the project to enable this runtime initialization. The LambdaBootstrapBuilder.Create() method is used to configure the handler and the ILambdaSerializer implementation to use for (de)serialization.

private static async Task Main(string[] args)
{
    Func<string, ILambdaContext, string> handler = FunctionHandler;
    await LambdaBootstrapBuilder.Create(handler, new DefaultLambdaJsonSerializer())
        .Build()
        .RunAsync();
}

Assembly trimming

Native AOT trims application code to optimize the compiled binary, which can cause two issues. The first is with de/serialization. Common .NET libraries for working with JSON like Newtonsoft.Json and System.Text.Json rely on reflection. The second is with any third party libraries not yet updated to be trim-friendly. The compiler may trim out parts of the library that are required for the library to function. However, there are solutions for both issues.

Working with JSON

Source generated serialization is a language feature introduced in .NET 6. It allows the code required for de/serialization to be generated at compile time instead of relying on reflection at runtime. One drawback of native AOT is that the ability to use System.Relefection.Emit library is lost. Source generated serialization enables developers to work with JSON while also using native AOT.

To use the source generator, you must define a new empty partial class that inherits from System.Text.Json.JsonSerializerContext. On the empty partial class, add the JsonSerializable attribute for any .NET type that your application must de/serialize.

In this example, the Lambda function needs to receive events from API Gateway. Create a new class in the project named HttpApiJsonSerializerContext and copy the code below:

[JsonSerializable(typeof(APIGatewayHttpApiV2ProxyRequest))]
[JsonSerializable(typeof(APIGatewayHttpApiV2ProxyResponse))]
public partial class HttpApiJsonSerializerContext : JsonSerializerContext
{
}

When the application is compiled, static classes, properties, and methods are generated to perform the de/serialization.

This custom serializer must now also be passed in to the Lambda runtime to ensure that event inputs and outputs are serialized and deserialized correctly. To do this, pass a new instance of the serializer context into the runtime when bootstrapped. Here is an example of a Lambda function using API Gateway as a source:

using System.Text.Json.Serialization;
using Amazon.Lambda.APIGatewayEvents;
using Amazon.Lambda.Core;
using Amazon.Lambda.RuntimeSupport;
using Amazon.Lambda.Serialization.SystemTextJson;
namespace LambdaNativeAot;
public class Function
{
    /// <summary>
    /// The main entry point for the custom runtime.
    /// </summary>
    private static async Task Main()
    {
        Func<APIGatewayHttpApiV2ProxyRequest, ILambdaContext, Task<APIGatewayHttpApiV2ProxyResponse>> handler = FunctionHandler;
        await LambdaBootstrapBuilder.Create(handler, new SourceGeneratorLambdaJsonSerializer<HttpApiJsonSerializerContext>())
            .Build()
            .RunAsync();
    }

    public static async Task<APIGatewayHttpApiV2ProxyResponse> FunctionHandler(APIGatewayHttpApiV2ProxyRequest apigProxyEvent, ILambdaContext context)
    {
        // API Handling logic here
        return new APIGatewayHttpApiV2ProxyResponse()
        {
            StatusCode = 200,
            Body = "OK"
        };
    }
}

Third party libraries

The .NET compiler provides the capability to control how applications are trimmed. For native AOT compilation, this enables us to exclude specific assemblies from trimming. For any libraries used in your applications that may not yet be trim-friendly this is a powerful way to still use native AOT. This is important for any of the Lambda event source NuGet packages like Amazon.Lambda.ApiGatewayEvents. Without controlling this, the C# objects for the Amazon API Gateway event sources are trimmed, leading to serialization errors at runtime.

Currently, the AWSSDK.Core library used by all the .NET AWS SDKs must also be excluded from trimming.

To control the assembly trimming, create a new file in the project root named rd.xml. Full details on the rd.xml format are found in the Microsoft documentation. Adding assemblies to the rd.xml file excludes them from trimming.

The following example contains an example of how to exclude the AWSSDK.Core, API Gateway event and function library from trimming:

<Directives xmlns="http://schemas.microsoft.com/netfx/2013/01/metadata">
	<Application>
		<Assembly Name="AWSSDK.Core" Dynamic="Required All"></Assembly>
		<Assembly Name="Amazon.Lambda.APIGatewayEvents" Dynamic="Required All"></Assembly>
		<Assembly Name="bootstrap" Dynamic="Required All"></Assembly>
	</Application>
</Directives>

Once added, the csproj file must be updated to reference the rd.xml file. Edit the csproj file for the Lambda project and add this ItemGroup:

<ItemGroup>
  <RdXmlFile Include="rd.xml" />
</ItemGroup>

When the function is compiled, assembly trimming skips the three libraries specified. If you are using .NET 7 native AOT with Lambda, we recommend excluding both the AWSSDK.Core library and the specific libraries for any event sources your Lambda function uses. If you are using the AWS X-Ray SDK for .NET to trace your serverless application, this must also be excluded.

Deploying .NET 7 native AOT applications

We’ll now explain how to build and deploy .NET 7 native AOT functions on Lambda, using each of the three deployment tools.

Using the dotnet CLI

Prerequisites

  • Docker (if compiling on a non-Amazon Linux 2 based machine)

Build and deploy

To package and deploy your Native AOT compiled Lambda function, run:

dotnet lambda deploy-function

When compiling and packaging your Lambda function code using the Lambda tools CLI, the tooling checks for the PublishAot flag in your project. If set to true, the tooling pulls an AL2-based Docker image and compiles your code inside. It mounts your local file system to the running container, allowing the compiled binary to be stored back to your local file system ready for deployment. As a default, the generated ZIP file is output to the bin/Release directory.

Once the deployment completes, you can execute the below command to invoke the created function, replacing the FUNCTION_NAME option with the name of the function chosen during deployment.

dotnet lambda invoke-function FUNCTION_NAME

Using the Visual Studio Extension

AWS is also announcing support for compiling and deploying native AOT-based Lambda functions from within Visual Studio using the AWS Toolkit for Visual Studio.

Prerequisites

Getting Started

As part of this release, templates are available in Visual Studio 2022 to get started using native AOT with AWS Lambda. From within Visual Studio, select File -> New Project. Search for Lambda .NET 7 native AOT to start a new project pre-configured for native AOT.

Create a new project

Build and deploy

Once the project is created, right-click the project in Visual Studio and choose Publish to AWS Lambda.

Solution Explorer

Complete the steps in the publish wizard and press upload. The log messages created by Docker appear in the publish window as it compiles your function code for native AOT.

Uploading function

You can now invoke the deployed function from within Visual Studio by setting the Example request dropdown to API Gateway AWS Proxy and pressing the Invoke button.

Invoke example

Using the AWS SAM CLI

Prerequisites

  • Docker (If compiling on a non-AL2 based machine)
  • AWS SAM v1.6.4 or later

Getting started

Support for compiling and deploying .NET 7 native AOT is built into the AWS SAM CLI. To get started, initialize a new AWS SAM project:

sam init

In the new project wizard, choose:

  1. What template source would you like to use? 1 – AWS Quick Start Template
  2. Choose an AWS Quick start application template. 1 – Hello World example
  3. Use the most popular runtime and package type? – N
  4. Which runtime would you like to use? aot.dotnet7 (provided.al2)
  5. Enable X-Ray Tracing? N
  6. Choose a project name

The cloned project includes the configuration to deploy to Lambda.

One new AWS SAM metadata property called ‘BuildMethod’ is required in the AWS SAM template:

HelloWorldFunction:
  Type: AWS::Serverless::Function
  Properties:
    Runtime: 'provided.al2' # // Use provided to deploy to AWS Lambda for .NET 7 native AOT
    Architectures:
      - x86_64
  Metadata:
    BuildMethod: 'dotnet7' # // But build with new build method for .NET 7 that calls into Amazon.Lambda.Tools 

Build and deploy

Build and deploy your serverless application, completing the guided deployment steps:

sam build
sam deploy –-guided

The AWS SAM CLI uses the Amazon.Lambda.Tools CLI to pull an AL2-based Docker image and compile your application code inside a container. You can use AWS SAM accelerate to speed up the update of serverless applications during development. It uses direct API calls instead of deploying changes through AWS CloudFormation, automating updates whenever you change your local code base. Learn more in the AWS SAM development documentation.

Conclusion

AWS now supports .NET 7 native AOT on Lambda. Read the Lambda Developer Guide for more getting started information. For more details on the performance improvements from using .NET 7 native AOT on Lambda, see the serverless-dotnet-demo repository on GitHub.

To provide feedback for .NET on AWS Lambda, contact the AWS .NET team on the .NET Lambda GitHub repository.

For more serverless learning resources, visit Serverless Land.

Introducing the price-capacity-optimized allocation strategy for EC2 Spot Instances

Post Syndicated from Sheila Busser original https://aws.amazon.com/blogs/compute/introducing-price-capacity-optimized-allocation-strategy-for-ec2-spot-instances/

This blog post is written by Jagdeep Phoolkumar, Senior Specialist Solution Architect, Flexible Compute and Peter Manastyrny, Senior Product Manager Tech, EC2 Core.

Amazon EC2 Spot Instances are unused Amazon Elastic Compute Cloud (Amazon EC2) capacity in the AWS Cloud available at up to a 90% discount compared to On-Demand prices. One of the best practices for using EC2 Spot Instances is to be flexible across a wide range of instance types to increase the chances of getting the aggregate compute capacity. Amazon EC2 Auto Scaling and Amazon EC2 Fleet make it easy to configure a request with a flexible set of instance types, as well as use a Spot allocation strategy to determine how to fulfill Spot capacity from the Spot Instance pools that you provide in your request.

The existing allocation strategies available in Amazon EC2 Auto Scaling and Amazon EC2 Fleet are called “lowest-price” and “capacity-optimized”. The lowest-price allocation strategy allocates Spot Instance pools where the Spot price is currently the lowest. Customers told us that in some cases the lowest-price strategy picks the Spot Instance pools that are not optimized for capacity availability and results in more frequent Spot Instance interruptions. As an improvement over lowest-price allocation strategy, in August 2019 AWS launched the capacity-optimized allocation strategy for Spot Instances, which helps customers tap into the deepest Spot Instance pools by analyzing capacity metrics. Since then, customers have seen a significantly lower interruption rate with capacity-optimized strategy when compared to the lowest-price strategy. You can read more about these customer stories in the Capacity-Optimized Spot Instance Allocation in Action at Mobileye and Skyscanner blog post. The capacity-optimized allocation strategy strictly selects the deepest pools. Therefore, sometimes it can pick high-priced pools even when there are low-priced pools available with marginally less capacity. Customers have been telling us that, for an optimal experience, they would like an allocation strategy that balances the best trade-offs between lowest-price and capacity-optimized.

Today, we’re excited to share the new price-capacity-optimized allocation strategy that makes Spot Instance allocation decisions based on both the price and the capacity availability of Spot Instances. The price-capacity-optimized allocation strategy should be the first preference and the default allocation strategy for most Spot workloads.

This post illustrates how the price-capacity-optimized allocation strategy selects Spot Instances in comparison with lowest-price and capacity-optimized. Furthermore, it discusses some common use cases of the price-capacity-optimized allocation strategy.

Overview

The price-capacity-optimized allocation strategy makes Spot allocation decisions based on both capacity availability and Spot prices. In comparison to the lowest-price allocation strategy, the price-capacity-optimized strategy doesn’t always attempt to launch in the absolute lowest priced Spot Instance pool. Instead, price-capacity-optimized attempts to diversify as much as possible across the multiple low-priced pools with high capacity availability. As a result, the price-capacity-optimized strategy in most cases has a higher chance of getting Spot capacity and delivers lower interruption rates when compared to the lowest-price strategy. If you factor in the cost associated with retrying the interrupted requests, then the price-capacity-optimized strategy becomes even more attractive from a savings perspective over the lowest-price strategy.

We recommend the price-capacity-optimized allocation strategy for workloads that require optimization of cost savings, Spot capacity availability, and interruption rates. For existing workloads using lowest-price strategy, we recommend price-capacity-optimized strategy as a replacement. The capacity-optimized allocation strategy is still suitable for workloads that either use similarly priced instances, or ones where the cost of interruption is so significant that any cost saving is inadequate in comparison to a marginal increase in interruptions.

Walkthrough

In this section, we illustrate how the price-capacity-optimized allocation strategy deploys Spot capacity when compared to the other two allocation strategies. The following example configuration shows how Spot capacity could be allocated in an Auto Scaling group using the different allocation strategies:

{
    "AutoScalingGroupName": "myasg ",
    "MixedInstancesPolicy": {
        "LaunchTemplate": {
            "LaunchTemplateSpecification": {
                "LaunchTemplateId": "lt-abcde12345"
            },
            "Overrides": [
                {
                    "InstanceRequirements": {
                        "VCpuCount": {
                            "Min": 4,
                            "Max": 4
                        },
                        "MemoryMiB": {
                            "Min": 0,
                            "Max": 16384
                        },
                        "InstanceGenerations": [
                            "current"
                        ],
                        "BurstablePerformance": "excluded",
                        "AcceleratorCount": {
                            "Max": 0
                        }
                    }
                }
            ]
        },
        "InstancesDistribution": {
            "OnDemandPercentageAboveBaseCapacity": 0,
            "SpotAllocationStrategy": "spot-allocation-strategy"
        }
    },
    "MinSize": 10,
    "MaxSize": 100,
    "DesiredCapacity": 60,
    "VPCZoneIdentifier": "subnet-a12345a,subnet-b12345b,subnet-c12345c"
}

First, Amazon EC2 Auto Scaling attempts to balance capacity evenly across Availability Zones (AZ). Next, Amazon EC2 Auto Scaling applies the Spot allocation strategy using the 30+ instances selected by attribute-based instance type selection, in each Availability Zone. The results after testing different allocation strategies are as follows:

  • Price-capacity-optimized strategy diversifies over multiple low-priced Spot Instance pools that are optimized for capacity availability.
  • Capacity-optimize strategy identifies Spot Instance pools that are only optimized for capacity availability.
  • Lowest-price strategy by default allocates the two lowest priced Spot Instance pools that aren’t optimized for capacity availability

To find out how each allocation strategy fares regarding Spot savings and capacity, we compare ‘Cost of Auto Scaling group’ (number of instances x Spot price/hour for each type of instance) and ‘Spot interruptions rate’ (number of instances interrupted/number of instances launched) for each allocation strategy. We use fictional numbers for the purpose of this post. However, you can use the Cloud Intelligence Dashboards to find the actual Spot Saving, and the Amazon EC2 Spot interruption dashboard to log Spot Instance interruptions. The example results after a 30-day period are as follows:

Allocation strategy

Instance allocation

Cost of Auto Scaling group

Spot interruptions rate

price-capacity-optimized

40 c6i.xlarge

20 c5.xlarge

$4.80/hour 3%

capacity-optimized

60 c5.xlarge

$5.00/hour

2%

lowest-price

30 c5a.xlarge

30 m5n.xlarge

$4.75/hour

20%

As per the above table, with the price-capacity-optimized strategy, the cost of the Auto Scaling group is only 5 cents (1%) higher, whereas the rate of Spot interruptions is six times lower (3% vs 20%) than the lowest-price strategy. In summary, from this exercise you learn that the price-capacity-optimized strategy provides the optimal Spot experience that is the best of both the lowest-price and capacity-optimized allocation strategies.

Common use-cases of price-capacity-optimized allocation strategy

Earlier we mentioned that the price-capacity-optimized allocation strategy is recommended for most Spot workloads. To elaborate further, in this section we explore some of these common workloads.

Stateless and fault-tolerant workloads

Stateless workloads that can complete ongoing requests within two minutes of a Spot interruption notice, and the fault-tolerant workloads that have a low cost of retries, are the best fit for the price-capacity-optimized allocation strategy. This category has workloads such as stateless containerized applications, microservices, web applications, data and analytics jobs, and batch processing.

Workloads with a high cost of interruption

Workloads that have a high cost of interruption associated with an expensive cost of retries should implement checkpointing to lower the cost of interruptions. By using checkpointing, you make the price-capacity-optimized allocation strategy a good fit for these workloads, as it allocates capacity from the low-priced Spot Instance pools that offer a low Spot interruptions rate. This category has workloads such as long Continuous Integration (CI), image and media rendering, Deep Learning, and High Performance Compute (HPC) workloads.

Conclusion

We recommend that customers use the price-capacity-optimized allocation strategy as the default option. The price-capacity-optimized strategy helps Amazon EC2 Auto Scaling groups and Amazon EC2 Fleet provision target capacity with an optimal experience. Updating to the price-capacity-optimized allocation strategy is as simple as updating a single parameter in an Amazon EC2 Auto Scaling group and Amazon EC2 Fleet.

To learn more about allocation strategies for Spot Instances, visit the Spot allocation strategies documentation page.

Running AI-ML Object Detection Model to Process Confidential Data using Nitro Enclaves

Post Syndicated from Sheila Busser original https://aws.amazon.com/blogs/compute/running-ai-ml-object-detection-model-to-process-confidential-data-using-nitro-enclaves/

This blog post was written by, Antoine Awad, Solutions Architect, Kevin Taylor, Senior Solutions Architect and Joel Desaulniers, Senior Solutions Architect.

Machine Learning (ML) models are used for inferencing of highly sensitive data in many industries such as government, healthcare, financial, and pharmaceutical. These industries require tools and services that protect their data in transit, at rest, and isolate data while in use. During processing, threats may originate from the technology stack such as the operating system or programs installed on the host which we need to protect against. Having a process that enforces the separation of roles and responsibilities within an organization minimizes the ability of personnel to access sensitive data. In this post, we walk you through how to run ML inference inside AWS Nitro Enclaves to illustrate how your sensitive data is protected during processing.

We are using a Nitro Enclave to run ML inference on sensitive data which helps reduce the attack surface area when the data is decrypted for processing. Nitro Enclaves enable you to create isolated compute environments within Amazon EC2 instances to protect and securely process highly sensitive data. Enclaves have no persistent storage, no interactive access, and no external networking. Communication between your instance and your enclave is done using a secure local channel called a vsock. By default, even an admin or root user on the parent instance will not be able to access the enclave.

Overview

Our example use-case demonstrates how to deploy an AI/ML workload and run inferencing inside Nitro Enclaves to securely process sensitive data. We use an image to demonstrate the process of how data can be encrypted, stored, transferred, decrypted and processed when necessary, to minimize the risk to your sensitive data. The workload uses an open-source AI/ML model to detect objects in an image, representing the sensitive data, and returns a summary of the type of objects detected. The image below is used for illustration purposes to provide clarity on the inference that occurs inside the Nitro Enclave. It was generated by adding bounding boxes to the original image based on the coordinates returned by the AI/ML model.

Image of airplanes with bounding boxes

Figure 1 – Image of airplanes with bounding boxes

To encrypt this image, we are using a Python script (Encryptor app – see Figure 2) which runs on an EC2 instance, in a real-world scenario this step would be performed in a secure environment like a Nitro Enclave or a secured workstation before transferring the encrypted data. The Encryptor app uses AWS KMS envelope encryption with a symmetrical Customer Master Key (CMK) to encrypt the data.

Image Encryption with AWS KMS using Envelope Encryption

Figure 2 – Image Encryption with AWS KMS using Envelope Encryption

Note, it’s also possible to use asymmetrical keys to perform the encryption/decryption.

Now that the image is encrypted, let’s look at each component and its role in the solution architecture, see Figure 3 below for reference.

  1. The Client app reads the encrypted image file and sends it to the Server app over the vsock (secure local communication channel).
  2. The Server app, running inside a Nitro Enclave, extracts the encrypted data key and sends it to AWS KMS for decryption. Once the data key is decrypted, the Server app uses it to decrypt the image and run inference on it to detect the objects in the image. Once the inference is complete, the results are returned to the Client app without exposing the original image or sensitive data.
  3. To allow the Nitro Enclave to communicate with AWS KMS, we use the KMS Enclave Tool which uses the vsock to connect to AWS KMS and decrypt the encrypted key.
  4. The vsock-proxy (packaged with the Nitro CLI) routes incoming traffic from the KMS Tool to AWS KMS provided that the AWS KMS endpoint is included on the vsock-proxy allowlist. The response from AWS KMS is then sent back to the KMS Enclave Tool over the vsock.

As part of the request to AWS KMS, the KMS Enclave Tool extracts and sends a signed attestation document to AWS KMS containing the enclave’s measurements to prove its identity. AWS KMS will validate the attestation document before decrypting the data key. Once validated, the data key is decrypted and securely returned to the KMS Tool which securely transfers it to the Server app to decrypt the image.

Solution architecture diagram for this blog post

Figure 3 – Solution architecture diagram for this blog post

Environment Setup

Prerequisites

Before we get started, you will need the following prequisites to deploy the solution:

  1. AWS account
  2. AWS Identity and Access Management (IAM) role with appropriate access

AWS CloudFormation Template

We are going to use AWS CloudFormation to provision our infrastructure.

  1. Download the CloudFormation (CFN) template nitro-enclave-demo.yaml. This template orchestrates an EC2 instance with the required networking components such as a VPC, Subnet and NAT Gateway.
  2. Log in to the AWS Management Console and select the AWS Region where you’d like to deploy this stack. In the example, we select Canada (Central).
  3. Open the AWS CloudFormation console at: https://console.aws.amazon.com/cloudformation/
  4. Choose Create Stack, Template is ready, Upload a template file. Choose File to select nitro-enclave-demo.yaml that you saved locally.
  5. Choose Next, enter a stack name such as NitroEnclaveStack, choose Next.
  6. On the subsequent screens, leave the defaults, and continue to select Next until you arrive at the Review step
  7. At the Review step, scroll to the bottom and place a checkmark in “I acknowledge that AWS CloudFormation might create IAM resources with custom names.” and click “Create stack”
  8. The stack status is initially CREATE_IN_PROGRESS. It will take around 5 minutes to complete. Click the Refresh button periodically to refresh the status. Upon completion, the status changes to CREATE_COMPLETE.
  9. Once completed, click on “Resources” tab and search for “NitroEnclaveInstance”, click on its “Physical ID” to navigate to the EC2 instance
  10. On the Amazon EC2 page, select the instance and click “Connect”
  11. Choose “Session Manager” and click “Connect”

EC2 Instance Configuration

Now that the EC2 instance has been provisioned and you are connected to it, follow these steps to configure it:

  1. Install the Nitro Enclaves CLI which will allow you to build and run a Nitro Enclave application:
    sudo amazon-linux-extras install aws-nitro-enclaves-cli -y
    sudo yum install aws-nitro-enclaves-cli-devel -y
    
  2. Verify that the Nitro Enclaves CLI was installed successfully by running the following command:
    nitro-cli --version

    Nitro Enclaves CLI

  3. To download the application from GitHub and build a docker image, you need to first install Docker and Git by executing the following commands:
    sudo yum install git -y
    sudo usermod -aG ne ssm-user
    sudo usermod -aG docker ssm-user
    sudo systemctl start docker && sudo systemctl enable docker
    

Nitro Enclave Configuration

A Nitro Enclave is an isolated environment which runs within the EC2 instance, hence we need to specify the resources (CPU & Memory) that the Nitro Enclaves allocator service dedicates to the enclave.

  1. Enter the following commands to set the CPU and Memory available for the Nitro Enclave allocator service to allocate to your enclave container:
    ALLOCATOR_YAML=/etc/nitro_enclaves/allocator.yaml
    MEM_KEY=memory_mib
    DEFAULT_MEM=20480
    sudo sed -r "s/^(\s*${MEM_KEY}\s*:\s*).*/\1${DEFAULT_MEM}/" -i "${ALLOCATOR_YAML}"
    sudo systemctl start nitro-enclaves-allocator.service && sudo systemctl enable nitro-enclaves-allocator.service
    
  2. To verify the configuration has been applied, run the following command and note the values for memory_mib and cpu_count:
    cat /etc/nitro_enclaves/allocator.yaml

    Enclave Configuration File

Creating a Nitro Enclave Image

Download the Project and Build the Enclave Base Image

Now that the EC2 instance is configured, download the workload code and build the enclave base Docker image. This image contains the Nitro Enclaves Software Development Kit (SDK) which allows an enclave to request a cryptographically signed attestation document from the Nitro Hypervisor. The attestation document includes unique measurements (SHA384 hashes) that are used to prove the enclave’s identity to services such as AWS KMS.

  1. Clone the Github Project
    cd ~/ && git clone https://github.com/aws-samples/aws-nitro-enclaves-ai-ml-object-detection.git
  2. Navigate to the cloned project’s folder and build the “enclave_base” image:
    cd ~/aws-nitro-enclaves-ai-ml-object-detection/enclave-base-image
    sudo docker build ./ -t enclave_base

    Note: The above step will take approximately 8-10 minutes to complete.

Build and Run The Nitro Enclave Image

To build the Nitro Enclave image of the workload, build a docker image of your application and then use the Nitro CLI to build the Nitro Enclave image:

  1. Download TensorFlow pre-trained model:
    cd ~/aws-nitro-enclaves-ai-ml-object-detection/src
    mkdir -p models/faster_rcnn_openimages_v4_inception_resnet_v2_1 && cd models/
    wget -O tensorflow-model.tar.gz https://tfhub.dev/google/faster_rcnn/openimages_v4/inception_resnet_v2/1?tf-hub-format=compressed
    tar -xvf tensorflow-model.tar.gz -C faster_rcnn_openimages_v4_inception_resnet_v2_1
  2. Navigate to the use-case folder and build the docker image for the application:
    cd ~/aws-nitro-enclaves-ai-ml-object-detection/src
    sudo docker build ./ -t nitro-enclave-container-ai-ml:latest
  3. Use the Nitro CLI to build an Enclave Image File (.eif) using the docker image you built in the previous step:
    sudo nitro-cli build-enclave --docker-uri nitro-enclave-container-ai-ml:latest --output-file nitro-enclave-container-ai-ml.eif
  4. The output of the previous step produces the Platform configuration registers or PCR hashes and a nitro enclave image file (.eif). Take note of the PCR0 value, which is a hash of the enclave image file.Example PCR0:
    {
        "Measurements": {
            "PCR0": "7968aee86dc343ace7d35fa1a504f955ee4e53f0d7ad23310e7df535a187364a0e6218b135a8c2f8fe205d39d9321923"
            ...
        }
    }
  5. Launch the Nitro Enclave container using the Enclave Image File (.eif) generated in the previous step and allocate resources to it. You should allocate at least 4 times the EIF file size for enclave memory. This is necessary because the tmpfs filesystem uses half of the memory and the remainder of the memory is used to uncompress the initial initramfs where the application executable resides. For CPU allocation, you should allocate CPU in full cores i.e. 2x vCPU for x86 hyper-threaded instances.
    In our case, we are going to allocate 14GB or 14,366 MB for the enclave:

    sudo nitro-cli run-enclave --cpu-count 2 --memory 14336 --eif-path nitro-enclave-container-ai-ml.eif

    Note: Allow a few seconds for the server to boot up prior to running the Client app in the below section “Object Detection using Nitro Enclaves”.

Update the KMS Key Policy to Include the PCR0 Hash

Now that you have the PCR0 value for your enclave image, update the KMS key policy to only allow your Nitro Enclave container access to the KMS key.

  1. Navigate to AWS KMS in your AWS Console and make sure you are in the same region where your CloudFormation template was deployed
  2. Select “Customer managed keys”
  3. Search for a key with alias “EnclaveKMSKey” and click on it
  4. Click “Edit” on the “Key Policy”
  5. Scroll to the bottom of the key policy and replace the value of “EXAMPLETOBEUPDATED” for the “kms:RecipientAttestation:PCR0” key with the PCR0 hash you noted in the previous section and click “Save changes”

AI/ML Object Detection using a Nitro Enclave

Now that you have an enclave image file, run the components of the solution.

Requirements Installation for Client App

  1. Install the python requirements using the following command:
    cd ~/aws-nitro-enclaves-ai-ml-object-detection/src
    pip3 install -r requirements.txt
  2. Set the region that your CloudFormation stack is deployed in. In our case we selected Canada (Centra)
    CFN_REGION=ca-central-1
  3. Run the following command to encrypt the image using the AWS KMS key “EnclaveKMSKey”, make sure to replace “ca-central-1” with the region where you deployed your CloudFormation template:
    python3 ./envelope-encryption/encryptor.py --filePath ./images/air-show.jpg --cmkId alias/EnclaveKMSkey --region $CFN_REGION
  4. Verify that the output contains: file encrypted? True
    Note: The previous command generates two files: an encrypted image file and an encrypted data key file. The data key file is generated so we can demonstrate an attempt from the parent instance at decrypting the data key.

Launching VSock Proxy

Launch the VSock Proxy which proxies requests from the Nitro Enclave to an external endpoint, in this case, to AWS KMS. Note the file vsock-proxy-config.yaml contains a list of endpoints which allow-lists the endpoints that an enclave can communicate with.

cd ~/aws-nitro-enclaves-ai-ml-object-detection/src
vsock-proxy 8001 "kms.$CFN_REGION.amazonaws.com" 443 --config vsock-proxy-config.yaml &

Object Detection using Nitro Enclaves

Send the encrypted image to the enclave to decrypt the image and use the AI/ML model to detect objects and return a summary of the objects detected:

cd ~/aws-nitro-enclaves-ai-ml-object-detection/src
python3 client.py --filePath ./images/air-show.jpg.encrypted | jq -C '.'

The previous step takes around a minute to complete when first called. Inside the enclave, the server application decrypts the image, runs it through the AI/ML model to generate a list of objects detected and returns that list to the client application.

Parent Instance Credentials

Attempt to Decrypt Data Key using Parent Instance Credentials

To prove that the parent instance is not able to decrypt the content, attempt to decrypt the image using the parent’s credentials:

cd ~/aws-nitro-enclaves-ai-ml-object-detection/src
aws kms decrypt --ciphertext-blob fileb://images/air-show.jpg.data_key.encrypted --region $CFN_REGION

Note: The command is expected to fail with AccessDeniedException, since the parent instance is not allowed to decrypt the data key.

Cleaning up

  1. Open the AWS CloudFormation console at: https://console.aws.amazon.com/cloudformation/.
  2. Select the stack you created earlier, such as NitroEnclaveStack.
  3. Choose Delete, then choose Delete Stack.
  4. The stack status is initially DELETE_IN_PROGRESS. Click the Refresh button periodically to refresh its status. The status changes to DELETE_COMPLETE after it’s finished and the stack name no longer appears in your list of active stacks.

Conclusion

In this post, we showcase how to process sensitive data with Nitro Enclaves using an AI/ML model deployed on Amazon EC2, as well as how to integrate an enclave with AWS KMS to restrict access to an AWS KMS CMK so that only the Nitro Enclave is allowed to use the key and decrypt the image.

We encrypt the sample data with envelope encryption to illustrate how to protect, transfer and securely process highly sensitive data. This process would be similar for any kind of sensitive information such as personally identifiable information (PII), healthcare or intellectual property (IP) which could also be the AI/ML model.

Dig deeper by exploring how to further restrict your AWS KMS CMK using additional PCR hashes such as PCR1 (hash of the Linux kernel and bootstrap), PCR2 (Hash of the application), and other hashes available to you.

Also, try our comprehensive Nitro Enclave workshop which includes use-cases at different complexity levels.

Reducing Your Organization’s Carbon Footprint with Amazon CodeGuru Profiler

Post Syndicated from Isha Dua original https://aws.amazon.com/blogs/devops/reducing-your-organizations-carbon-footprint-with-codeguru-profiler/

It is crucial to examine every functional area when firms reorient their operations toward sustainable practices. Making informed decisions is necessary to reduce the environmental effect of an IT stack when creating, deploying, and maintaining it. To build a sustainable business for our customers and for the world we all share, we have deployed data centers that provide the efficient, resilient service our customers expect while minimizing our environmental footprint—and theirs. While we work to improve the energy efficiency of our datacenters, we also work to help our customers improve their operations on the AWS cloud. This two-pronged approach is based on the concept of the shared responsibility between AWS and AWS’ customers. As shown in the diagram below, AWS focuses on optimizing the sustainability of the cloud, while customers are responsible for sustainability in the cloud, meaning that AWS customers must optimize the workloads they have on the AWS cloud.

Figure 1. Shared responsibility model for sustainability

Figure 1. Shared responsibility model for sustainability

Just by migrating to the cloud, AWS customers become significantly more sustainable in their technology operations. On average, AWS customers use 77% fewer servers, 84% less power, and a 28% cleaner power mix, ultimately reducing their carbon emissions by 88% compared to when they ran workloads in their own data centers. These improvements are attributable to the technological advancements and economies of scale that AWS datacenters bring. However, there are still significant opportunities for AWS customers to make their cloud operations more sustainable. To uncover this, we must first understand how emissions are categorized.

The Greenhouse Gas Protocol organizes carbon emissions into the following scopes, along with relevant emission examples within each scope for a cloud provider such as AWS:

  • Scope 1: All direct emissions from the activities of an organization or under its control. For example, fuel combustion by data center backup generators.
  • Scope 2: Indirect emissions from electricity purchased and used to power data centers and other facilities. For example, emissions from commercial power generation.
  • Scope 3: All other indirect emissions from activities of an organization from sources it doesn’t control. AWS examples include emissions related to data center construction, and the manufacture and transportation of IT hardware deployed in data centers.

From an AWS customer perspective, emissions from customer workloads running on AWS are accounted for as indirect emissions, and part of the customer’s Scope 3 emissions. Each workload deployed generates a fraction of the total AWS emissions from each of the previous scopes. The actual amount varies per workload and depends on several factors including the AWS services used, the energy consumed by those services, the carbon intensity of the electric grids serving the AWS data centers where they run, and the AWS procurement of renewable energy.

At a high level, AWS customers approach optimization initiatives at three levels:

  • Application (Architecture and Design): Using efficient software designs and architectures to minimize the average resources required per unit of work.
  • Resource (Provisioning and Utilization): Monitoring workload activity and modifying the capacity of individual resources to prevent idling due to over-provisioning or under-utilization.
  • Code (Code Optimization): Using code profilers and other tools to identify the areas of code that use up the most time or resources as targets for optimization.

In this blogpost, we will concentrate on code-level sustainability improvements and how they can be realized using Amazon CodeGuru Profiler.

How CodeGuru Profiler improves code sustainability

Amazon CodeGuru Profiler collects runtime performance data from your live applications and provides recommendations that can help you fine-tune your application performance. Using machine learning algorithms, CodeGuru Profiler can help you find your most CPU-intensive lines of code, which contribute the most to your scope 3 emissions. CodeGuru Profiler then suggests ways to improve the code to make it less CPU demanding. CodeGuru Profiler provides different visualizations of profiling data to help you identify what code is running on the CPU, see how much time is consumed, and suggest ways to reduce CPU utilization. Optimizing your code with CodeGuru profiler leads to the following:

  • Improvements in application performance
  • Reduction in cloud cost, and
  • Reduction in the carbon emissions attributable to your cloud workload.

When your code performs the same task with less CPU, your applications run faster, customer experience improves, and your cost reduces alongside your cloud emission. CodeGuru Profiler generates the recommendations that help you make your code faster by using an agent that continuously samples stack traces from your application. The stack traces indicate how much time the CPU spends on each function or method in your code—information that is then transformed into CPU and latency data that is used to detect anomalies. When anomalies are detected, CodeGuru Profiler generates recommendations that clearly outline you should do to remediate the situation. Although CodeGuru Profiler has several visualizations that help you visualize your code, in many cases, customers can implement these recommendations without reviewing the visualizations. Let’s demonstrate this with a simple example.

Demonstration: Using CodeGuru Profiler to optimize a Lambda function

In this demonstration, the inefficiencies in a AWS Lambda function will be identified by CodeGuru Profiler.

Building our Lambda Function (10mins)

To keep this demonstration quick and simple, let’s create a simple lambda function that display’s ‘Hello World’. Before writing the code for this function, let’s review two important concepts. First, when writing Python code that runs on AWS and calls AWS services, two critical steps are required:

The Python code lines (that will be part of our function) that execute these steps listed above are shown below:

import boto3 #this will import AWS SDK library for Python
VariableName = boto3.client('dynamodb’) #this will create the AWS SDK service client

Secondly, functionally, AWS Lambda functions comprise of two sections:

  • Initialization code
  • Handler code

The first time a function is invoked (i.e., a cold start), Lambda downloads the function code, creates the required runtime environment, runs the initialization code, and then runs the handler code. During subsequent invocations (warm starts), to keep execution time low, Lambda bypasses the initialization code and goes straight to the handler code. AWS Lambda is designed such that the SDK service client created during initialization persists into the handler code execution. For this reason, AWS SDK service clients should be created in the initialization code. If the code lines for creating the AWS SDK service client are placed in the handler code, the AWS SDK service client will be recreated every time the Lambda function is invoked, needlessly increasing the duration of the Lambda function during cold and warm starts. This inadvertently increases CPU demand (and cost), which in turn increases the carbon emissions attributable to the customer’s code. Below, you can see the green and brown versions of the same Lambda function.

Now that we understand the importance of structuring our Lambda function code for efficient execution, let’s create a Lambda function that recreates the SDK service client. We will then watch CodeGuru Profiler flag this issue and generate a recommendation.

  1. Open AWS Lambda from the AWS Console and click on Create function.
  2. Select Author from scratch, name the function ‘demo-function’, select Python 3.9 under runtime, select x86_64 under Architecture.
  3. Expand Permissions, then choose whether to create a new execution role or use an existing one.
  4. Expand Advanced settings, and then select Function URL.
  5. For Auth type, choose AWS_IAM or NONE.
  6. Select Configure cross-origin resource sharing (CORS). By selecting this option during function creation, your function URL allows requests from all origins by default. You can edit the CORS settings for your function URL after creating the function.
  7. Choose Create function.
  8. In the code editor tab of the code source window, copy and paste the code below:
#invocation code
import json
import boto3

#handler code
def lambda_handler(event, context):
  client = boto3.client('dynamodb') #create AWS SDK Service client’
  #simple codeblock for demonstration purposes  
  output = ‘Hello World’
  print(output)
  #handler function return

  return output

Ensure that the handler code is properly indented.

  1. Save the code, Deploy, and then Test.
  2. For the first execution of this Lambda function, a test event configuration dialog will appear. On the Configure test event dialog window, leave the selection as the default (Create new event), enter ‘demo-event’ as the Event name, and leave the hello-world template as the Event template.
  3. When you run the code by clicking on Test, the console should return ‘Hello World’.
  4. To simulate actual traffic, let’s run a curl script that will invoke the Lambda function every 0.2 seconds. On a bash terminal, run the following command:
while true; do curl {Lambda Function URL]; sleep 0.06; done

If you do not have git bash installed, you can use AWS Cloud 9 which supports curl commands.

Enabling CodeGuru Profiler for our Lambda function

We will now set up CodeGuru Profiler to monitor our Lambda function. For Lambda functions running on Java 8 (Amazon Corretto), Java 11, and Python 3.8 or 3.9 runtimes, CodeGuru Profiler can be enabled through a single click in the configuration tab in the AWS Lambda console.  Other runtimes can be enabled following a series of steps that can be found in the CodeGuru Profiler documentation for Java and the Python.

Our demo code is written in Python 3.9, so we will enable Profiler from the configuration tab in the AWS Lambda console.

  1. On the AWS Lambda console, select the demo-function that we created.
  2. Navigate to Configuration > Monitoring and operations tools, and click Edit on the right side of the page.

  1.  Scroll down to Amazon CodeGuru Profiler and click the button next to Code profiling to turn it on. After enabling Code profiling, click Save.

Note: CodeGuru Profiler requires 5 minutes of Lambda runtime data to generate results. After your Lambda function provides this runtime data, which may need multiple runs if your lambda has a short runtime, it will display within the Profiling group page in the CodeGuru Profiler console. The profiling group will be given a default name (i.e., aws-lambda-<lambda-function-name>), and it will take approximately 15 minutes after CodeGuru Profiler receives the runtime data for this profiling group to appear. Be patient. Although our function duration is ~33ms, our curl script invokes the application once every 0.06 seconds. This should give profiler sufficient information to profile our function in a couple of hours. After 5 minutes, our profiling group should appear in the list of active profiling groups as shown below.

Depending on how frequently your Lambda function is invoked, it can take up to 15 minutes to aggregate profiles, after which you can see your first visualization in the CodeGuru Profiler console. The granularity of the first visualization depends on how active your function was during those first 5 minutes of profiling—an application that is idle most of the time doesn’t have many data points to plot in the default visualization. However, you can remedy this by looking at a wider time period of profiled data, for example, a day or even up to a week, if your application has very low CPU utilization. For our demo function, a recommendation should appear after about an hour. By this time, the profiling groups list should show that our profiling group now has one recommendation.

Profiler has now flagged the repeated creation of the SDK service client with every invocation.

From the information provided, we can see that our CPU is spending 5x more computing time than expected on the recreation of the SDK service client. The estimated cost impact of this inefficiency is also provided. In production environments, the cost impact of seemingly minor inefficiencies can scale very quickly to several kilograms of CO2 and hundreds of dollars as invocation frequency, and the number of Lambda functions increase.

CodeGuru Profiler integrates with Amazon DevOps Guru, a fully managed service that makes it easy for developers and operators to improve the performance and availability of their applications. Amazon DevOps Guru analyzes operational data and application metrics to identify behaviors that deviate from normal operating patterns. Once these operational anomalies are detected, DevOps Guru presents intelligent recommendations that address current and predicted future operational issues. By integrating with CodeGuru Profiler, customers can now view operational anomalies and code optimization recommendations on the DevOps Guru console. The integration, which is enabled by default, is only applicable to Lambda resources that are supported by CodeGuru Profiler and monitored by both DevOps Guru and CodeGuru.

We can now stop the curl loop (Control+C) so that the Lambda function stops running. Next, we delete the profiling group that was created when we enabled profiling in Lambda, and then delete the Lambda function or repurpose as needed.

Conclusion

Cloud sustainability is a shared responsibility between AWS and our customers. While we work to make our datacenter more sustainable, customers also have to work to make their code, resources, and applications more sustainable, and CodeGuru Profiler can help you improve code sustainability, as demonstrated above. To start Profiling your code today, visit the CodeGuru Profiler documentation page. To start monitoring your applications, head over to the Amazon DevOps Guru documentation page.

About the authors:

Isha Dua

Isha Dua is a Senior Solutions Architect based in San Francisco Bay Area. She helps AWS Enterprise customers grow by understanding their goals and challenges, and guiding them on how they can architect their applications in a cloud native manner while making sure they are resilient and scalable. She’s passionate about machine learning technologies and Environmental Sustainability.

Christian Tomeldan

Christian Tomeldan is a DevOps Engineer turned Solutions Architect. Operating out of San Francisco, he is passionate about technology and conveys that passion to customers ensuring they grow with the right support and best practices. He focuses his technical depth mostly around Containers, Security, and Environmental Sustainability.

Ifeanyi Okafor

Ifeanyi Okafor is a Product Manager with AWS. He enjoys building products that solve customer problems at scale.

The collective thoughts of the interwebz