Tag Archives: announcements

Accelerate Apache Hive read and write on Amazon EMR using enhanced S3A

Post Syndicated from Ramesh Kandasamy original https://aws.amazon.com/blogs/big-data/accelerate-apache-hive-read-and-write-on-amazon-emr-using-enhanced-s3a/

Improving Apache Hive read and write performance on Amazon EMR is crucial for organizations dealing with large-scale data analytics and processing. When queries execute faster, businesses can make data-driven decisions more quickly, reduce time-to-insight, and optimize their operational costs. In today’s competitive landscape, where real-time analytics and interactive querying are becoming standard requirements, every millisecond of latency reduction can significantly impact business outcomes.

The Amazon EMR runtime for Apache Hive is a performance-optimized runtime that is 100% API compatible with open source Apache Hive. It offers faster out-of-the-box performance than Apache Hive through improved query plans, faster queries, and tuned defaults. Amazon EMR on Amazon EC2 and Amazon EMR Serverless use this optimized runtime, which is 1.5 times faster for read queries than EMR 7.0 based on an industry standard benchmark derived from TPC-DS at 3 TB scale and 3 times faster for write queries.

Apache Hive on Amazon EMR added over 10 features from Amazon EMR 7.0 to Amazon EMR 7.10 releases and continuing. These improvements are turned on by default and are 100% API compatible with Apache Hive. Some of the improvements include:

  • Default EMR enhanced S3A file system implementation for Apache Hive on Amazon EMR
  • Amazon EMR enhanced S3A zero-rename feature with 3-times improved write performance
  • Read query performance parity with EMR File System (EMRFS)
  • AWS Lake Formation support with Amazon EMR enhanced S3A
  • Fine-tuned file listing process for file formats including Parquet, Text, CSV, and so on
  • Async record reader initialization
  • Improvements to Tez task preemption
  • Fine-tuned locality during container reuse
  • Improved Tez relaxed locality
  • Improvements with split computation for ORC file formats

Transitioning from EMRFS to Amazon EMR enhanced S3A

The storage interface of Amazon EMR has evolved through two implementations: EMRFS and S3A. EMRFS, a proprietary Amazon Simple Storage Service (Amazon S3) connector developed by Amazon, has been the default filesystem for Amazon EMR since its early days, offering AWS-specific optimizations such as Consistent View for handling eventual consistency in Amazon S3, specialized performance tuning for the AWS environment, and seamless integration with AWS services through AWS Identity and Access Management (IAM) roles. On the other hand, S3A emerged from the Apache Hadoop open source community as a standard S3 connector and has evolved significantly through continuous improvements, performance optimizations, and enhanced S3 feature support. While EMRFS was designed specifically for optimal S3 access within Amazon EMR, S3A’s community-driven development has closed the performance gap with proprietary implementations.

Advantages of using enhanced S3A in Apache Hive on Amazon EMR

The transition from EMRFS to Amazon EMR enhanced S3A as the default filesystem in Amazon EMR 7.10 marks a strategic shift toward open source standardization while maintaining performance parity and adding benefits like improved portability and community support.

Based on the Amazon EMR HBase on Amazon S3 transitioning to EMR S3A with comparable EMRFS performance blog post, S3A in Amazon EMR Hive offers significant advantages over EMRFS, using modern AWS technologies and advanced storage capabilities.

  • The integration of AWS SDK v2 brings improved performance through non-blocking I/O, async clients, and better credential management.
  • S3A provides comprehensive support for Amazon S3 Glacier (Amazon S3 Glacier)and Amazon S3 Glacier Deep Archive, enabling cost-effective data lifecycle management and efficient handling of archival data for analytics.
  • It offers enhanced infrastructure flexibility with AWS Outposts support for on-premises deployments and custom endpoint support for Amazon S3-compatible storage systems, facilitating hybrid and multi-cloud architectures.
  • Performance is significantly boosted with Amazon S3 Express One Zone support, providing single-digit millisecond access for latency-sensitive analytics and interactive data exploration.
  • S3A introduces vector reads, allowing efficient access to columnar data formats by batching multiple non-contiguous byte ranges into a single S3 GET request, reducing I/O overhead and improving query performance.
  • The prefetching feature in S3A optimizes sequential read performance by proactively fetching data, enhancing throughput and reducing latency for large-scale data processing tasks.
  • S3A’s enhanced delegation token support, a result of AWS SDK v2 integration, provides flexible authentication mechanisms including support for web identity tokens and federated identity systems.

These advanced features make S3A a more versatile, efficient, and performance-oriented choice for organizations using Hive on Amazon EMR, particularly those requiring sophisticated data management and analytics capabilities across diverse infrastructure environments.

Read queries performance comparison

To evaluate the Amazon EMR Hive engine performance, we ran benchmark tests with the 3 TB TPC-DS datasets. We used Amazon EMR Hive clusters for benchmark tests on Amazon EMR and installed Apache Hive 3.1.3 on Amazon Elastic Compute Cloud (Amazon EC2) clusters designated for open source software (OSS) benchmark runs. We ran tests on separate EC2 clusters comprised of 16 m5.8xlarge instances for each of Apache Hive 3.1.3, Amazon EMR 7.0.0, Amazon EMR 7.5.0 and Amazon EMR 7.10.0. The primary node has 32 vCPU and 128 GB memory, and 16 worker nodes have a total of 512 vCPU and 2048 GB memory. We tested with Amazon EMR defaults to highlight the out-of-the-box experience and tuned Apache Hive with the minimal settings needed to provide a fair comparison.

For the source data, we chose the 3 TB scale factor, which contains 17.7 billion records, approximately 924 GB of compressed data in Parquet file format and ORC file format. The fact tables are partitioned by the date column, which consists of partitions ranging from 200–2,100. No statistics were pre-calculated for these tables. A total of 104 Hive SQL queries were run in five iterations sequentially and an average of each query’s runtime in these five iterations was used for comparison. The average of the five iterations’ runtime on Amazon EMR 7.10 was approximately 1.5 times faster than Amazon EMR 7.0. The following figure illustrates the total runtimes in seconds.

HiveReadPerformance1

The per-query speedup on Amazon EMR 7.10 when compared to Amazon EMR 7.0 is illustrated in the following chart. The horizontal axis represents queries in the TPC-DS 3 TB benchmark ordered by the Amazon EMR speedup descending and the vertical axis shows the speedup of queries due to the Amazon EMR runtime.

HivePerfQueries1

The below image illustrates the per-query speedup on Amazon EMR 7.10 when compared to Amazon EMR 7.0 for Parquet files.

HivePerfQueries2

Read cost comparison

Our benchmark outputs the total runtime and geometric mean figures to measure the Hive runtime performance by simulating a real-world complex decision support use case. The cost metric can provide us with additional insights. Cost estimates are computed using the following formulas. They factor in Amazon EC2, Amazon Elastic Block Store (Amazon EBS), and Amazon EMR costs, but don’t include Amazon S3 GET and PUT costs.

  • Amazon EC2 cost (including SSD cost) = number of instances * m5.8xlarge hourly rate * job runtime in hours
    • 8xlarge hourly rate = $1.536 per hour
  • Root Amazon EBS cost = number of instances * Amazon EBS per GB-hourly rate * root EBS volume size * job runtime in hours
  • Amazon EMR cost = number of instances * m5.8xlarge Amazon EMR cost * job runtime in hours
    • 8xlarge Amazon EMR cost = $0.27 per hour
  • Total cost = Amazon EC2 cost + root Amazon EBS cost + Amazon EMR cost

Based on the calculation, the Amazon EMR 7.10 benchmark result demonstrates a 33% improvement in job cost compared to Amazon EMR 7.0.

Metric Amazon EMR 7.0.0 Amazon EMR 7.10.0
Runtime in hours 2.86 < 2.00
Number of EC2 instances 17 17
Amazon EBS Size 20gb 20gb
Amazon EC2 cost $78.34 $52.22
Amazon EBS cost $0.01 $0.01
Amazon EMR cost $14.58 $9.72
Total cost $92.93 $61.96
Cost Savings Baseline Amazon EMR 7.10.0 is 33% better than Amazon EMR 7.0.0

Hive write committers performance comparison

Amazon EMR introduced a new committer to enhance Hive write performance on Amazon S3 up to 2.91 times faster. The existing Hive EMRFS S3-optimized committer, eliminates rename operations by writing data directly to the output location and only commits files at job completion to help enforce failure resilience. It implements a modified file naming convention that includes a query ID suffix. The new, Hive S3A-optimized committer, was developed to bring similar zero-rename capabilities to Hive on S3A, which previously lacked this feature. Built on OSS Hadoop’s Magic Committer, it eliminates unnecessary file movements during commit phases using S3 multipart upload (MPU) operations. This newer committer not only matches but exceeds EMRFS performance, delivering faster Hive write query execution while reducing S3 API calls, resulting in improved efficiency and cost savings for customers. Both committers effectively address the performance bottleneck caused by rename operations in Hive, with the S3A-optimized committer emerging as the superior solution.

Building on our previous blog post about the Amazon EMR Hive Zero Rename feature gains 15-fold write performance with EMRFS-optimized committer, we’ve achieved additional performance improvements in Hive write operations using the S3A optimized committer. We ran the comparison tests with and without the new committer and evaluated the write performance improvement. The benchmark used an insert overwrite query that joins two tables from a 3 TB TPC-DS ORC and Parquet dataset.

The following graph compares Hive write query total runtime speedup against ORC and Parquet formats. The y-axis denotes the speedup (total time taken with rename / total time taken by query with committer), and the x-axis denotes file formats and EMR deployment models. With the new S3A committer, the runtime speedup is better.

HiveWritePerf1

Understanding performance impact with different data sizes and number of files

To benchmark the performance impact with variable data sizes and number of files, we also evaluated the solution with various types, such as size of data (10 files –unpartitioned, 10 partitions, 100 partitions, 1000 partitions), number of files, and number of partitions: The results show that the number of files written is the critical factor for performance improvement when using this new committer in comparison to the default Hive commit logic and EMRFS committer.

In the following graph, the y-axis denotes the runtime speedup (total time taken with rename / total time taken by query with committer), and the x-axis denotes the number of partitions. We observed that as the number of partitions increases, the committer performs better because of avoiding multiple expensive rename operations in Amazon S3.

HiveWritePerf2

Write cost comparison

The following graph compares the number of overall Amazon S3 API calls for Hive write workflow against ORC and Parquet formats. The benchmark used an insert overwrite query that joins two tables from a 3 TB TPC-DS ORC, Parquet datasets on both Amazon EMR EC2 and Amazon EMR Serverless. With the new committer, the S3 usage cost is better(lower).

HiveWriteCost

Limitations with Hive S3A zero-rename feature

This committer will not be used, and default Hive commit logic will be applied in the following scenarios:

  • When merge small files (hive.merge.tezfiles) is enabled.
  • When using Hive ACID tables.
  • When partitions are distributed across file systems such as HDFS and Amazon S3.

Summary

Amazon EMR continues to improve the Amazon EMR runtime for Apache Hive, leading to a performance improvement year-over-year and additional features for big data customers to run their analytics workload in cost effective manner. More importantly, the transition to S3A brings additional benefits such as improved standardization, better portability, and stronger community support, while maintaining the robust performance levels established by EMRFS. We recommend that you stay up to date with the latest Amazon EMR release to take advantage of the latest performance and feature benefits.

To keep up to date, subscribe to the Big Data Blog RSS feed to learn more about Amazon EMR runtime for Apache Hive, configuration best practices, and tuning advice.


About the authors

Himanshu Mishra

Himanshu Mishra

Himanshu is a Senior software development engineer for Amazon EMR at Amazon Web Services. His expertise is in Amazon EMR and Hive Query engine. He is passionate about distributed systems and helping people to bring their ideas to life.

Anmol Sundaram

Anmol Sundaram

Anmol is a Software development engineer for Amazon EMR at Amazon Web Services. His expertise is in Amazon EMR and Hive Query engine. His dedication to solving distributed problems is helping Amazon EMR to achieve higher performance improvements.

Paramvir Singh

Paramvir Singh

Paramvir is a Software development engineer for Amazon EMR at Amazon Web Services. His expertise in Amazon EMR and Hive Query engine helped the team achieve performance improvements.

Ramesh Kandasamy

Ramesh Kandasamy

Ramesh is an Engineering Manager for Amazon EMR at Amazon Web Services. He is a long tenured Amazonian dedicated to solving distributed systems problems.

author name

Giovanni Matteo Fumarola

Giovanni is the Senior Manager for the Amazon EMR Spark and Iceberg group. He is an Apache Hadoop Committer and PMC member. He has been focusing on the big data analytics space since 2013.

Amazon EMR HBase on Amazon S3 transitioning to EMR S3A with comparable EMRFS performance

Post Syndicated from Dong Li original https://aws.amazon.com/blogs/big-data/amazon-emr-hbase-on-amazon-s3-transitioning-to-emr-s3a-with-comparable-emrfs-performance/

Starting with version 7.10, Amazon EMR is transitioning from EMR File System (EMRFS) to EMR S3A as the default file system connector for Amazon Simple Storage Service (Amazon S3) access. This transition brings HBase on Amazon S3 to a new level, offering performance parity with EMRFS while delivering substantial improvements, including better standardization, improved portability, stronger community support, improved performance through non-blocking I/O, asynchronous clients, and better credential management with AWS SDK V2 integration.

In this post, we discuss this transition and its benefits.

Understanding file system usage in HBase with Amazon EMR

HBase on Amazon S3 uses Amazon S3 as the primary storage layer instead of HDFS. When the memstore gets flushed, HBase writes HFiles directly to Amazon S3 using the file system connector. The Write Ahead Logs (WALs) and other operational files are still maintained in HDFS on the local cluster for performance and durability reasons. Amazon EMR also provides durable off-cluster EMR WAL implementation to improve the durability of the data.

With the HBase on Amazon S3 architecture, you can take advantage of the virtually unlimited storage capacity and cost-effectiveness of Amazon S3 while maintaining acceptable read/write performance. When data is read, HBase retrieves the HFiles directly from Amazon S3, and the block cache in memory helps optimize frequent read operations. This design alleviates the need for a large HDFS cluster for data storage, reducing operational costs and management overhead. The Amazon S3 file system connector handles the communication between HBase and Amazon S3, managing aspects like authentication, retry logic, and consistency. However, this setup might have slightly higher latency compared to traditional HBase on HDFS due to the network calls to Amazon S3, but the trade-off is justified by the benefits of scalability, caching layer, and cost-effectiveness that Amazon S3 provides.

Performance comparison of EMR S3A with EMRFS and OSS S3A from 7.3 release

Amazon EMR is transitioning how it connects to Amazon S3 storage. Through Amazon EMR 7.9, Amazon EMR has used EMRFS as its primary connector to interact with Amazon S3 for HBase storage. HBase on Amazon S3 significantly improved its performance with EMR S3A starting from the 7.3 release comparing to OSS S3A and matching the performance levels of EMRFS. This enhancement was thoroughly tested using Yahoo! Cloud Serving Benchmark (YCSB) workloads with 100 million rows in Amazon EMR 7.3 (using Hadoop 3.3 with AWS SDK V1) and Amazon EMR 7.10 (using Hadoop 3.4 with AWS SDK V2).

YCSB includes various workloads with different read and write proportions and data distribution patterns, such as:

  • Workload A (50% reads, 50% writes) – Simulates a scenario with equal read and write operations (50% each). This is ideal for applications requiring frequent updates and reads, such as session stores.
  • Workload B (95% reads, 5% writes) – Models a read-heavy application with 95% reads and 5% writes. This is well-suited for scenarios where retrieval operations dominate, like content delivery networks.
  • Workload C (100% reads) – Simulates user profile cache patterns and serves as a content delivery system.
  • Workload D (read latest data) – Simulates user status updates where users want to read the latest status.
  • Workload E (scan heavy) – Simulates threaded conversations where users scan through message threads.
  • Workload F (read/modify/write operations) – Simulates user record update patterns such as online gaming platforms where player scores are frequently read and updated based on game outcomes.

The performance comparison between EMRFS, EMR S3A, and OSS S3A for Amazon EMR 7.3 (AWS SDK V1) and 7.10 (AWS SDK V2) are illustrated in the following graphs, showing substantial improvements across different workload types. The graphs demonstrate how Amazon EMR 7.3 and 7.10 with EMR S3A achieve performance metrics comparable with EMRFS and up to 65% faster than OSS S3A, especially in read-heavy and mixed read/write workloads.


EMR S3A as the default file system from Amazon EMR 7.10

These performance improvements demonstrate a significant evolution in the capabilities of Amazon EMR. Well before EMR S3A became the default file system in version 7.10, EMR HBase users were already experiencing enhanced Amazon S3 access performance through EMR S3A. The critical enhancements implemented in Amazon EMR 7.3 successfully minimized the performance differential between EMRFS and EMR S3A for HBase operations. This achievement delivered optimal performance to users while preserving EMR S3A’s distinct benefits within the analytics ecosystem, including improved standardization, better community integration, and enhanced portability.

Amazon EMR 7.10 marks a significant change for HBase on Amazon S3 users. EMR S3A becomes the default file system connector automatically, independent of how your root directory’s file system is configured. This seamless transition enables EMR HBase customers to use EMR S3A’s expanding feature set and improvements without manual intervention.

Conclusion

The evolution of file system connectors in EMR HBase demonstrates AWS’s commitment to delivering high-performance, scalable solutions for big data workloads. Starting with EMR S3A, which achieved performance parity with EMRFS in Amazon EMR 7.3 (as validated through extensive YCSB benchmark tests with 100 million rows) and improvement over OSS S3A, to the upcoming transition to S3A as the default connector in Amazon EMR 7.10, AWS continues to enhance its storage interface capabilities.

The transition represents more than just a technical upgrade; it delivers a trifecta of benefits: enhanced standardization across Hadoop ecosystems, improved workload portability, and robust community support. Most importantly, this advancement maintains the high-performance standards established by EMRFS while positioning EMR HBase for future innovations in storage interface capabilities. AWS’s strategic evolution of file system connectors demonstrates its commitment to providing enterprise-grade solutions that combine performance, scalability, and architectural excellence.

As big data workloads continue to grow and evolve, this foundation of reliable, high-performance storage access will become increasingly crucial for organizations using EMR HBase for their data processing needs. We recommend that you stay up to date with the latest Amazon EMR release to take advantage of the latest performance and feature benefits.


About the Authors

Dong Li

Dong Li

Dong is a Senior Software development engineer for Amazon EMR at Amazon Web Services. His expertise is in big data systems, including Hadoop, HBase, and Hive. His customer obsession and dedication towards solving big data system problems helps Amazon EMR achieve more performance improvements.

Ramesh Kandasamy

Ramesh Kandasamy

Ramesh is an Engineering Manager for Amazon EMR at Amazon Web Services. He is a long tenured Amazonian dedicated to solving distributed system problems.

Giovanni Matteo Fumarola

Giovanni Matteo Fumarola

Giovanni is the Senior Manager for the Amazon EMR Spark and Iceberg group. He is an Apache Hadoop Committer and PMC member. He has been focusing on the big data analytics space since 2013.

Meet digital sovereignty needs with AWS Dedicated Local Zones expanded services

Post Syndicated from Max Peterson original https://aws.amazon.com/blogs/security/meet-digital-sovereignty-needs-with-aws-dedicated-local-zones-expanded-services/

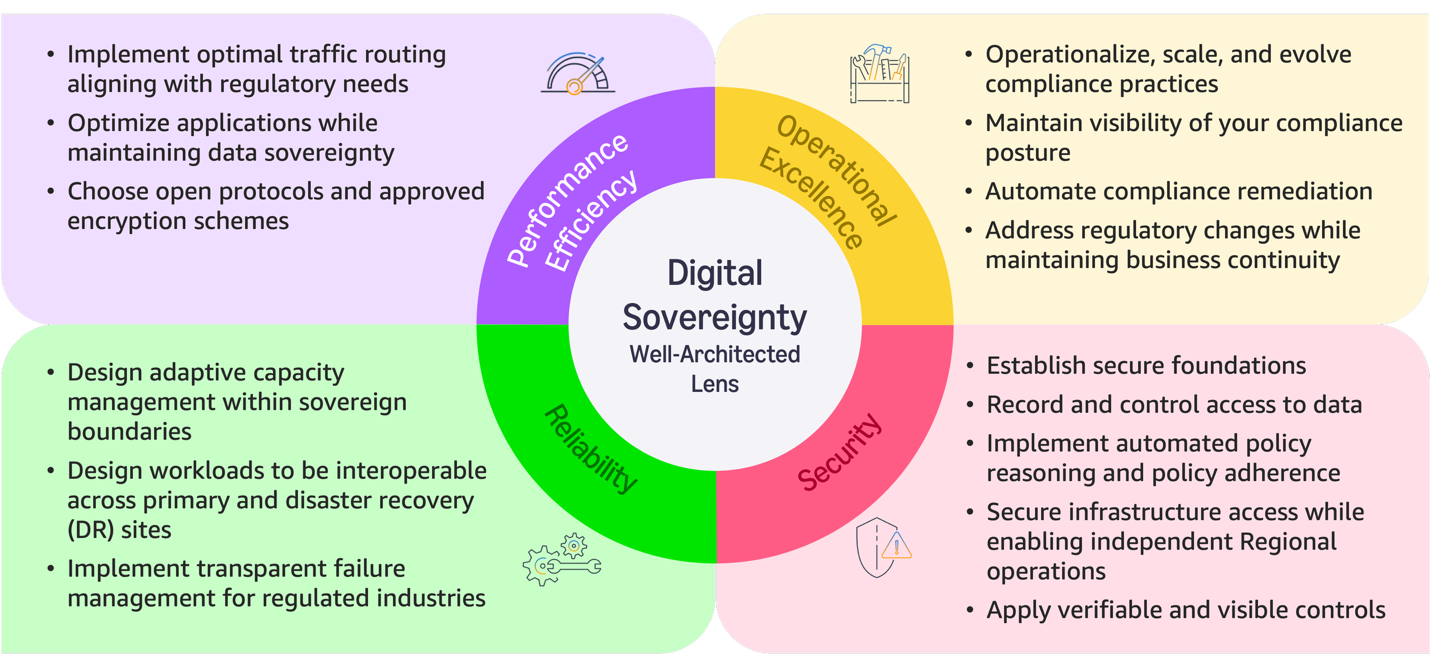
At Amazon Web Services (AWS), we continue to invest in and deliver digital sovereignty solutions to help customers meet their most sensitive workload requirements. To address the regulatory and digital sovereignty needs of public sector and regulated industry customers, we launched AWS Dedicated Local Zones in 2023, with the Government Technology Agency of Singapore (GovTech Singapore) as our first customer.

Today, we’re excited to announce expanded service availability for Dedicated Local Zones, giving customers more choice and control without compromise. In addition to the data residency, sovereignty, and data isolation benefits they already enjoy, the expanded service list gives customers additional options for compute, storage, backup, and recovery.

Dedicated Local Zones are AWS infrastructure fully managed by AWS, built for exclusive use by a customer or community, and placed in a customer-specified location or data center. They help customers across the public sector and regulated industries meet security and compliance requirements for sensitive data and applications through a private infrastructure solution configured to meet their needs. Dedicated Local Zones can be operated by local AWS personnel and offer the same benefits of AWS Local Zones, such as elasticity, scalability, and pay-as-you-go pricing, with added security and governance features.

Since being launched, Dedicated Local Zones have supported a core set of compute, storage, database, containers, and other services and features for local processing. We continue to innovate and expand our offerings based on what we hear from customers to help meet their unique needs.

More choice and control without compromise

The following new services and capabilities deliver greater flexibility for customers to run their most critical workloads while maintaining strict data residency and sovereignty requirements.

New generation instance types

To support complex workloads in AI and high-performance computing, customers can now use newer generation instance types, including Amazon Elastic Compute Cloud (Amazon EC2) generation 7 with accelerated computing capabilities.

AWS storage options

AWS storage options provide two storage classes including Amazon Simple Storage Service (Amazon S3) Express One Zone, which offers high-performance storage for customers’ most frequently accessed data, and Amazon S3 One Zone-Infrequent Access, which is designed for data that is accessed less frequently and is ideal for backups.

Advanced block storage capabilities are delivered through Amazon Elastic Block Store (Amazon EBS) gp3 and io1 volumes, which customers can use to store data within a specific perimeter to support critical data isolation and residency requirements. By using the latest AWS general purpose SSD volumes (gp3), customers can provision performance independently of storage capacity with an up to 20% lower price per gigabyte than existing gp2 volumes. For intensive, latency-sensitive transactional workloads, such as enterprise databases, provisioned IOPS SSD (io1) volumes provide the necessary performance and reliability.

Backup and recovery capabilities

We have added backup and recovery capabilities through Amazon EBS Local Snapshots, which provides robust support for disaster recovery, data migration, and compliance. Customers can create backups within the same geographical boundary as EBS volumes, helping meet data isolation requirements. Customers can also create AWS Identity and Access Management (IAM) policies for their accounts to enable storing snapshots within the Dedicated Local Zone. To automate the creation and retention of local snapshots, customers can use Amazon Data Lifecycle Manager (DLM).

Customers can use local Amazon Machine Images (AMIs) to create and register AMIs while maintaining underlying local EBS snapshots within Dedicated Local Zones, helping achieve adherence to data residency requirements. By creating AMIs from EC2 instances or registering AMIs using locally stored snapshots, customers maintain complete control over their data’s geographical location.

Dedicated Local Zones meet the same high AWS security standards and sovereign-by-design principles that apply to AWS Regions and Local Zones. For instance, the AWS Nitro System provides the foundation with hardware- and software-level security. This is complemented by AWS Key Management Service (AWS KMS) and AWS Certificate Manager (ACM) for encryption management, Amazon Inspector, Amazon GuardDuty, and AWS Shield to help protect workloads, and AWS CloudTrail for audit logging of user and API activity across AWS accounts.

Continued innovation with GovTech Singapore

One of GovTech Singapore’s key focuses is on the nation’s digital government transformation and enhancing the public sector’s engineering capabilities. Our collaboration with GovTech Singapore involved configuring their Dedicated Local Zones with specific services and capabilities to support their workloads and meet stringent regulatory requirements. This architecture addresses data isolation and security requirements and ensures consistency and efficiency across Singapore Government cloud environments.

With the availability of the new AWS services with Dedicated Local Zones, government agencies can simplify operations and meet their digital sovereignty requirements more effectively. For instance, agencies can use Amazon Relational Database Service (Amazon RDS) to create new databases rapidly. Amazon RDS in Dedicated Local Zones helps simplify database management by automating tasks such as provisioning, configuring, backing up, and patching. This collaboration is just one example of how AWS innovates to meet customer needs and configures Dedicated Local Zones based on specific requirements.

Chua Khi Ann, Director of GovTech Singapore’s Government Digital Products division, who oversees the Cloud Programme, shared:
“The deployment of Dedicated Local Zones by our Government on Commercial Cloud (GCC) team, in collaboration with AWS, now enables Singapore government agencies to host systems with confidential data in the cloud. By leveraging cloud-native services like advanced storage and compute, we can achieve better availability, resilience, and security of our systems, while reducing operational costs compared to on-premises infrastructure.”

Get started with Dedicated Local Zones

AWS understands that every customer has unique digital sovereignty needs, and we remain committed to offering customers the most advanced set of sovereignty controls and security features available in the cloud. Dedicated Local Zones are designed to be customizable, resilient, and scalable across different regulatory environments, so that customers can drive ongoing innovation while meeting their specific requirements.

Ready to explore how Dedicated Local Zones can support your organization’s digital sovereignty journey? Visit AWS Dedicated Local Zones to learn more.

TAGS: AWS Digital Sovereignty Pledge, Digital Sovereignty, Security Blog, Sovereign-by-design, Public Sector, Singapore, AWS Dedicated Local Zones

Max Peterson
Max Peterson

Max is the Vice President of AWS Sovereign Cloud. He leads efforts to help public sector organizations modernize their missions with the cloud while meeting necessary digital sovereignty requirements. Max previously oversaw broader digital sovereignty efforts at AWS and served as the VP of AWS Worldwide Public Sector with a focus on empowering government, education, healthcare, and nonprofit organizations to drive rapid innovation.
Stéphane Israël
Stéphane Israël

Stéphane is the Managing Director of the AWS European Sovereign Cloud and Digital Sovereignty. He is responsible for the management and operations of the AWS European Sovereign Cloud GmbH, including infrastructure, technology, and services, and leads broader worldwide digital sovereignty efforts at AWS. Prior to AWS, he was the CEO of Arianespace, where he oversaw numerous successful space missions, including the launch of the James Webb Space Telescope.

Resolve and prevent operational incidents with AWS DevOps Agent and New Relic

Post Syndicated from Nava Ajay Kanth Kota original https://aws.amazon.com/blogs/devops/resolve-and-prevent-operational-incidents-with-aws-devops-agent-and-new-relic/

This post was co-written with Muthuvelan Swaminathan (Principal Partner Engineer) and Ruchika Bakolia (Software Engineer) from New Relic.

Modern distributed systems that generate massive volumes of metrics, traces, and logs are inherently complex. The process of correlating logs, comparing configurations and switching between tools during incident management makes manual root cause analysis a bottleneck that dramatically increases the mean time to detect and resolve. Instead of manually sifting through mountains of data, Site Reliability Engineers (SREs) and DevOps teams can leverage Agentic AI to automate and enhance the incident resolution process.

To address these challenges, New Relic partnered with AWS to integrate the New Relic Model Context Protocol (MCP) server with AWS DevOps Agent to access telemetry data providing automated root cause analysis and recommendations with cutting-edge artificial intelligence. AWS DevOps Agent is a frontier agent that resolves and proactively prevents incidents, continuously improving reliability and performance of applications in AWS, multi-cloud, and hybrid environments.

In this blog, we’ll explore the key features of both services, how to configure them and an example that shows how operation teams can correlate telemetry data, predict system anomalies and initiate remediation actions to significantly accelerate MTTR (Mean Time to Resolution).

New Relic AI MCP Server

The New Relic MCP Server is a standardized gateway that connects external AI agents such as AWS DevOps Agent to New Relic’s observability data and functions. It enables autonomous agents to query live data and execute actions without requiring custom API integrations.

As customers and partners build their own AI tools, there is no longer a need to maintain a bespoke API integration. MCP enables AI agents to seamlessly interact with their telemetry data on New Relic platform through an MCP client to leverage its capabilities and enhance their workflows.

AWS DevOps Agent

AWS DevOps Agent is a frontier agent that resolves and proactively prevents incidents, continuously improving reliability and performance. AWS DevOps Agent investigates incidents and identifies operational improvements as an experienced DevOps engineer would: by learning your resources and their relationships, working with your observability tools, runbooks, code repositories, and CI/CD pipelines, and correlating telemetry, code, and deployment data across all of them to understand the relationships between your application resources.

Key benefits for organizations 

The integration of in-depth observability with AWS DevOps Agent capabilities is designed to quickly resolve issues when they arise and prevent incidents for SRE and DevOps engineers. Here are few benefits:

  • Automated investigations: AWS DevOps Agent integrates with ticketing and alarming systems like ServiceNow to automatically launch investigations from incident tickets, accelerating incident response within your existing workflows to reduce meant time to resolution (MTTR).
  • Incident coordination: You can also initiate and guide investigations using interactive chat. AWS DevOps Agent acts as a member of your operations team, working directly within your collaboration tools like ServiceNow and Slack to share findings and coordinate responses. 
  • Root cause analysis: AWS DevOps Agent integrates with observability tools, code repositories, and CI/CD pipelines to correlate and analyze telemetry, code, and deployment data, sharing its explored hypotheses, observations, Through systematic investigations, AWS DevOps Agent identifies root cause of issues stemming from system changes, input anomalies, resource limits, component failures, and dependency issues across your entire environment.
  • Detailed mitigation plans: Once AWS DevOps Agent has identified the root cause, it provides detailed mitigations plans, which include actions to resolve the incident, validate success, and revert a change if needed. AWS DevOps Agent also provides agent-ready instructions that can be implemented by another frontier agent, for example, code improvements that can be implemented by Kiro autonomous agent.
  • Proactively future incidents: AWS DevOps Agent analyzes patterns across historical incidents to provide actionable recommendations that strengthen four key areas: observability, infrastructure optimization, deployment pipeline enhancement, and application resilience.

Onboarding

The onboarding process involves setting up an Agent Space and registering your existing New Relic servers. Onboarding does not require any new implementation.

Here are the high-level steps to create an AWS DevOps Agent Space and connect it to the New Relic MCP Server using an API-Key.

Setup Agent Space in AWS DevOps Agent

To create Agent Spaces, navigate to the AWS DevOps Agent page within the AWS Management Console. An Agent Space establishes the boundaries for the AWS DevOps Agent when accessing resources within a specific AWS account. To get started, click the create Agent Space button at the top right of the screen and enter the name, description and IAM roles.

Screen shot displaying orange Create Agent Space button in the AWS Console

AWS DevOps Agent creating agent space

Creating a New Relic association

 Navigate to the capabilities tab in the Agent Space

Screen shot with a red square around the tab for Capabilities in the AWS DevOps Agent -> AgentSpaces view in the AWS Console” width=”1430″ height=”849″></p>
<p style=Navigating to the capabilities tab in the Agent space

Go to the Telemetry section, select Add, then choose New Relic and click Next.

Screen shot with Add a new source radio button selected and Select source to add has radio button New Relic selected

Associating New Relic as the Telemetry provider in the Agent space

Upon successful registration of New Relic as a source, AWS DevOps Agent automatically generates a webhook URL. This URL is then used to receive alert notifications and trigger automated investigations.

Screen shot for Configure Webhook Connection displaying the Webhook URL and Webhook Secret, both are redacted by a black bar.

AWS DevOps Agent Webhook URL and Bearer secret key

The AWS DevOps Agent webhook requires a Bearer token to be included in the HTTP header for authentication purposes. This ensures that only authorized requests are processed. In New Relic, set up Amazon EventBridge as the alert destination. This configuration will trigger an AWS Lambda function that adds the Bearer token to the HTTP header and posts the alert payload to the AWS DevOps Agent webhook URL.

Use Case Walkthrough: Retail Chain – High Latency in shopping cart service resolution

This use case demonstrates how the integration of AWS DevOps Agent and New Relic MCP server empowers SRE and DevOps teams to access the untapped insights in your data to reduce MTTR and drive operational excellence.

Consider the following scenario: AWS DevOps Agent gets paged when the online boutique retail store application cart is experiencing P95 latency > 500ms for more than 2 minutes. This latency spike is critical and far exceeds the normal 5ms threshold, impacting the ability for customers to make purchases. In a typical scenario, the operations team would spend the first 15-30 minutes manually checking dependent services, alerts dashboard, and logs. This manual effort can be significantly reduced by configuring the New Relic observability platform with AWS DevOps Agent to automatically correlate telemetry data and surface the root cause faster.

To automatically remediate this issue, the online boutique application’s microservices are configured with New Relic’s APM agents that collect relevant metrics and send them to New Relic. When the latency exceeds a predefined threshold, an alert condition is triggered within New Relic. The triggered alert sends a notification to EventBridge, which in turn executes the Lambda function. The Lambda transforms the incoming payload into the required AWS DevOps Agent payload template. It then generates an HMAC signature to verify the message’s integrity and authenticity before dispatching it to the AWS DevOps Agent webhook endpoint.

Screen shot displaying new relic logo in the top left corner. The screen is divided into a navigation bar on the left, with Alerts selected. In the pane to the right, Alerts / Alerts Policies is displayed at the top, and below that a title Online Boutique High Latency appears. The notifications tab below that is selected.

Alert policy notifications in New Relic

The AWS DevOps Agent webhook triggers the agent to begin an automated investigation.

Screen shot displaying AWS DevOps Agent / GoldenPath_App in the title bar with Incident Response tab selected. Below that a heading is displayed for Online Boutique All Alerts followed by a timeline displaying User Request then Assistant Response

AWS DevOps Agent Incident response page

The New Relic MCP is first queried by the AWS DevOps Agent to retrieve telemetry data for the cart service GUID. Following this, the AWS DevOps Agent makes a second request to the New Relic MCP to formulate an investigation plan, which includes a list of related entities, their key metrics, and any associated change events for those dependencies.

Zoomed in screen shot of the previous screen with red boxes highlighting two areas in the timeline which say NewRelic MCP list related entities and NewRelic MCP list change events. Each shots the detail for the tool call.

AWS DevOps Agent and New Relic MCP interaction to list entities and related change events

Next, data gathering tasks are executed using New Relic MCP, following the investigation plan.

Time line screen similar to the previous screen shot with a red box around the timeline entry for Explore traces.

AWS DevOps Agent and New Relic MCP interaction to explore and analyze traces

Time line screen similar to the previous screen shot with a red box around the timeline entries for NewRelic MCP analyze entity logs and NewRelic MCP analyze golden metrics

AWS DevOps Agent and New Relic MCP interaction to explore and analyze logs and metrics

Continuing its analysis, the agent leverages New Relic’s MCP to examine entity logs, golden metrics, and traces, ultimately identifying the root cause for the latency spike.

Screen shot displaying AWS DevOps Agent / GoldenPath_App in the title bar with Incident Response tab selected. Below that a heading is displayed for Online Boutique All Alerts followed by a timeline displaying Update, Finding, and then Root cause. Root cause has a red box outlining it to draw attention.

AWS DevOps Agent Root Cause Analysis

You can review AWS DevOps Agent’s findings and the suggested root cause. The Site Reliability Engineer (SRE) can interact with the AWS DevOps Agent (side panel) in the chat panel to gain clarification on the steps of the ongoing investigation, enabling more effective monitoring and troubleshooting.

creen shot displaying AWS DevOps Agent / GoldenPath_App in the title bar with Incident Response tab selected. A timeline is visible on the lift and a chat window has been expanded on the right. The chat window contains a question and response.

AWS DevOps Agent Chat interface

You can review AWS DevOps Agent’s findings and the suggested root cause. If necessary, the SRE then executes the appropriate mitigation plan.

Conclusion

By integrating the New Relic MCP server with AWS DevOps Agent, organizations can quickly resolve issues when they arise and proactively prevent future incidents. This collaboration reduces Mean Time to Resolution (MTTR) and accelerates SREs and DevOps teams beyond manual, time-consuming investigations. It ensures rapid remediation of technical disruptions to minimize impact to the business. Ultimately, AWS DevOps Agent, the new frontier agent drives operational excellence, working in conjunction with the New Relic One Observability platform.

About New Relic
The New Relic Intelligent Observability Platform helps businesses eliminate interruptions in digital experiences. New Relic is an AI-strengthened platform that unifies and pairs telemetry data to provide clarity over your entire digital estate for proactive and predictive problem solving. That’s why businesses around the world run on New Relic to drive innovation, improve reliability, and deliver exceptional customer experiences to fuel growth.

Authors

Muthuvelan Swaminathan

Muthuvelan Swaminathan is a Principal Partner Architect at New Relic partnership organization building technical integrations with leading cloud providers and strategic partners. Through partner enablement, solution engineering and ecosystem alignment Muthuvelan helps drive product innovation at New Relic to ensure enterprises eliminate disruptions in their digital experiences for their customers.

Ruchika Bakolia

Ruchika Bakolia is a Software Engineer at New Relic. She is passionate about the intersection of AI and Cloud technologies, with extensive experience building and integrating solutions primarily on AWS. Ruchika enjoys traveling, reading, and exploring creative pursuits like pottery, always seeking out new experiences and challenges.

Nava Ajay Kanth Kota

Ajay Kota is a Senior Partner Solutions Architect at AWS, currently serving on the Amazon Partner Organization (APO) team collaborating closely with ISV Partners. With over 23 years of experience in enterprise computing infrastructure, Ajay brings deep expertise in cloud architecture, storage, backup, and cloud solutions. Before joining AWS, he led Storage, Backup, and Cloud teams, where he was responsible for developing Managed Services offerings across these domains.

Introducing Apache Iceberg materialized views in AWS Glue Data Catalog

Post Syndicated from Tomohiro Tanaka original https://aws.amazon.com/blogs/big-data/introducing-apache-iceberg-materialized-views-in-aws-glue-data-catalog/

Hundreds of thousands of customers build artificial intelligence and machine learning (AI/ML) and analytics applications on AWS, frequently transforming data through multiple stages for improved query performance—from raw data to processed datasets to final analytical tables. Data engineers must solve complex problems, including detecting what data has changed in base tables, writing and maintaining transformation logic, scheduling and orchestrating workflows across dependencies, provisioning and managing compute infrastructure, and troubleshooting failures while monitoring pipeline health. Consider an ecommerce company where data engineers need to continuously merge clickstream logs with orders data for analytics. Each transformation requires building robust change detection mechanisms, writing complex joins and aggregations, coordinating multiple workflow steps, scaling compute resources appropriately, and maintaining operational oversight—all while supporting data quality and pipeline reliability. This complexity demands months of dedicated engineering effort and ongoing maintenance, making data transformation costly and time-intensive for organizations seeking to unlock insights from their data.

To address those challenges, AWS announced a new materialized view capability for Apache Iceberg tables in the AWS Glue Data Catalog. The new materialized view capability simplifies data pipelines and accelerates data lake query performance. A materialized view is a managed table in the AWS Glue Data Catalog that stores pre-computed results of a query in Iceberg format that is incrementally updated to reflect changes to the underlying datasets. This alleviates the need to build and maintain complex data pipelines to generate transformed datasets and accelerate query performance. Apache Spark engines across Amazon Athena, Amazon EMR, and AWS Glue support the new materialized views and intelligently rewrite queries to use materialized views that speed up performance while reducing compute costs.

In this post, we show you how Iceberg materialized view works and how to get started.

How Iceberg materialized views work

Iceberg materialized views offer a simple, managed solution built on familiar SQL syntax. Instead of building complex pipelines, you can create materialized views using standard SQL queries from Spark, transforming data with aggregates, filters, and joins without writing custom data pipelines. Change detection, incremental updates, and monitoring source tables are automatically handled in the AWS Glue Data Catalog and refreshing materialized views as new data arrive, alleviating the need for manual pipeline orchestration. Data transformations run on fully managed compute infrastructure, removing the burden of provisioning, scaling, or maintaining servers.

The resulting pre-computed data is stored as Iceberg tables in an Amazon Simple Storage Service (Amazon S3) general purpose bucket, or Amazon S3 Tables buckets within the your account, making transformed data immediately accessible to multiple query engines, including Athena, Amazon Redshift, and AWS optimized Spark runtime. Spark engines across Athena, Amazon EMR, and AWS Glue support an automatic query rewrite functionality that intelligently uses materialized views, delivering automatic performance improvement for data processing jobs or interactive notebook queries.

In the following sections, we walk through the steps to create, query, and refresh materialized views.

Pre-requisite

To follow along with this post, you must have an AWS account.

To run the instruction on Amazon EMR, complete the following steps to configure the cluster:

  1. Launch an Amazon EMR cluster 7.12.0 or higher.
  2. SSH login to the primary node of your Amazon EMR cluster, and run the following command to start a Spark application with required configurations:
    spark-sql \
      --conf spark.sql.extensions=org.apache.iceberg.spark.extensions.IcebergSparkSessionExtensions \
      --conf spark.sql.catalog.glue_catalog=org.apache.iceberg.spark.SparkCatalog \
      --conf spark.sql.catalog.glue_catalog.type=glue \
      --conf spark.sql.catalog.glue_catalog.warehouse=s3://amzn-s3-demo-bucket/warehouse \
      --conf spark.sql.catalog.glue_catalog.glue.region=us-east-1 \
      --conf spark.sql.catalog.glue_catalog.glue.id=123456789012 \
      --conf spark.sql.catalog.glue_catalog.glue.account-id=123456789012 \
      --conf spark.sql.catalog.glue_catalog.client.region=us-east-1 \
      --conf spark.sql.catalog.glue_catalog.glue.lakeformation-enabled=true \
      --conf spark.sql.optimizer.answerQueriesWithMVs.enabled=true \
      --conf spark.sql.defaultCatalog=glue_catalog
      

To run the instruction on AWS Glue for Spark, complete the following steps to configure the job:

  1. Create an AWS Glue version 5.1 job or higher.
  2. Configure a job parameter
    1. Key: --conf
    2. Value: spark.sql.extensions=org.apache.iceberg.spark.extensions.IcebergSparkSessionExtensions
  3. Configure your job with the following script:
    from pyspark.sql import SparkSession
    
    
    spark = (
        SparkSession.builder \
            .config("spark.sql.extensions", "org.apache.iceberg.spark.extensions.IcebergSparkSessionExtensions")
            .config("spark.sql.catalog.glue_catalog", "org.apache.iceberg.spark.SparkCatalog")
            .config("spark.sql.catalog.glue_catalog.type", "glue")
            .config("spark.sql.catalog.glue_catalog.warehouse", "s3://amzn- -demo-bucket/warehouse")
            .config("spark.sql.catalog.glue_catalog.glue.region", "us-east-1")
            .config("spark.sql.catalog.glue_catalog.glue.id", "123456789012")
            .config("spark.sql.catalog.glue_catalog.glue.account-id", "123456789012")
    		.config("spark.sql.catalog.glue_catalog.client.region", "us-east-1")
            .config("spark.sql.catalog.glue_catalog.glue.lakeformation-enabled", "true")
            .config("spark.sql.optimizer.answerQueriesWithMVs.enabled", "true")
            .config("spark.sql.defaultCatalog", "glue_catalog")
            .getOrCreate()
    )

  4. Run the following queries using Spark SQL to set up a base table. In AWS Glue, you can run them through spark.sql("QUERY STATEMENT").
    CREATE DATABASE IF NOT EXIST iceberg_mv;
    
    USE iceberg_mv;
    
    CREATE TABLE IF NOT EXISTS base_tbl (
        id INT,
        customer_name STRING,
        amount INT,
        order_date DATE);
        
    INSERT INTO base_tbl VALUES (1, 'John Doe', 150, DATE('2025-12-01')), (2, 'Jane Smith', 200, DATE('2025-12-02')), (3, 'Bob Johnson', 75, DATE('2025-12-03'));
    
    SELECT * FROM base_tbl;

In the subsequent sections, we create a materialized view with this base table.

If you want to store your materialized views in Amazon S3 Tables instead of a general Amazon S3 bucket, refer to Appendix 1 at the end of this post for the configuration details.

Create a materialized view

To create a materialized view, run the following command:

CREATE MATERIALIZED VIEW mv
AS SELECT
    customer_name, 
    COUNT(*) as mv_order_count, 
    SUM(amount) as mv_total_amount 
FROM glue_catalog.iceberg_mv.base_tbl
GROUP BY customer_name;

After you create a materialized view, AWS Spark’s in-memory metadata cache needs time to populate with information about the new materialized view. During this cache population period, queries against the base table will run normally without using the materialized view. After the cache is fully populated (typically within tens of seconds), Spark automatically detects that the materialized view can satisfy the query and rewrites it to use the pre-computed materialized view instead, improving performance.

To see this behavior, run the following EXPLAIN command immediately after creating the materialized view:

EXPLAIN EXTENDED
SELECT customer_name, COUNT(*) as mv_order_count, SUM(amount) as mv_total_amount 
FROM base_tbl
GROUP BY customer_name;

The following output shows the initial result before cache population:

== Parsed Logical Plan ==
'Aggregate ['customer_name], ['customer_name, 'COUNT(1) AS mv_order_count#0, 'SUM('amount) AS mv_total_amount#1]
+- 'UnresolvedRelation [base_tbl] , [], false

== Analyzed Logical Plan ==
customer_name: string, mv_order_count: bigint, mv_total_amount: bigint
Aggregate [customer_name#8], [customer_name#8, count(1) AS mv_order_count#0L, sum(amount#9) AS mv_total_amount#1L]
+- SubqueryAlias glue_catalog.iceberg_mv.base_tbl
   +- RelationV2[id#7, customer_name#8, amount#9, order_date#10] glue_catalog.iceberg_mv.base_tbl glue_catalog.iceberg_mv.base_tbl

== Optimized Logical Plan ==
Aggregate [customer_name#8], [customer_name#8, count(1) AS mv_order_count#0L, sum(amount#9) AS mv_total_amount#1L]
+- RelationV2[customer_name#8, amount#9] glue_catalog.iceberg_mv.base_tbl

== Physical Plan ==
AdaptiveSparkPlan isFinalPlan=false
+- HashAggregate(keys=[customer_name#8], functions=[count(1), sum(amount#9)], output=[customer_name#8, mv_order_count#0L, mv_total_amount#1L], schema specialized)
   +- Exchange hashpartitioning(customer_name#8, 1000), ENSURE_REQUIREMENTS, [plan_id=19]
      +- HashAggregate(keys=[customer_name#8], functions=[partial_count(1), partial_sum(amount#9)], output=[customer_name#8, count#27L, sum#29L], schema specialized)
         +- BatchScan glue_catalog.iceberg_mv.base_tbl[customer_name#8, amount#9] glue_catalog.iceberg_mv.base_tbl (branch=null) [filters=, groupedBy=, pushedLimit=None] RuntimeFilters: []

In this initial execution plan, Spark scans the base_tbl directly (BatchScan glue_catalog.iceberg_mv.base_tbl) and runs aggregations (COUNT and SUM) on the raw data. This is the behavior before the materialized view metadata cache is populated.

After waiting approximately tens of seconds for the metadata cache population, run the same EXPLAIN command again. The following output shows the primary differences in the query optimization plan after cache population:

== Optimized Logical Plan ==
Aggregate [customer_name#97], [customer_name#97, coalesce(sum(mv_order_count#98L), 0) AS mv_order_count#72L, sum(mv_total_amount#99L) AS mv_total_amount#73L]
+- RelationV2[customer_name#97, mv_order_count#98L, mv_total_amount#99L] glue_catalog.iceberg_mv.mv

== Physical  Plan ==
AdaptiveSparkPlan isFinalPlan=false
+- HashAggregate(keys=[customer_name#97], functions=[sum(mv_order_count#98L), sum(mv_total_amount#99L)], output=[customer_name#97, mv_order_count#72L, mv_total_amount#73L], schema specialized)
   +- Exchange hashpartitioning(customer_name#97, 1000), ENSURE_REQUIREMENTS, [plan_id=51]
      +- HashAggregate(keys=[customer_name#97], functions=[partial_sum(mv_order_count#98L), partial_sum(mv_total_amount#99L)], output=[customer_name#97, sum#113L, sum#115L], schema specialized)
         +- BatchScan glue_catalog.iceberg_mv.mv[customer_name#97, mv_order_count#98L, mv_total_amount#99L] glue_catalog.iceberg_mv.mv (branch=null) [filters=, groupedBy=, pushedLimit=None] RuntimeFilters: []

After the cache is populated, Spark now scans the materialized view (BatchScan glue_catalog.iceberg_mv.mv) instead of the base table. The query has been automatically rewritten to read from the pre-computed aggregated data in the materialized view. The output specifically shows the aggregation functions now simply sum the pre-computed values (sum(mv_order_count) and sum(mv_total_amount)) rather than recalculating COUNT and SUM from raw data.

Create a materialized view with scheduling automatic refresh

By default, a newly created materialized view contains the initial query results. It’s not automatically updated when the underlying base table data changes. To keep your materialized view synchronized with the base table data, you can configure automatic refresh schedules. To enable automatic refresh, use the REFRESH EVERY clause when creating the materialized view. This clause accepts a time interval and unit, so you can specify how frequently the materialized view is updated.

The following example creates a materialized view that automatically refreshes every 24 hours:

CREATE MATERIALIZED VIEW mv
REFRESH EVERY 24 HOURS
AS SELECT
    customer_name, 
    COUNT(*) as mv_order_count, 
    SUM(amount) as mv_total_amount 
FROM glue_catalog.iceberg_mv.base_tbl
GROUP BY customer_name;

You can configure the refresh interval using any of the following time units: SECONDS, MINUTES, HOURS, or DAYS. Choose an appropriate interval based on your data freshness requirements and query patterns.

If you prefer more control over when your materialized view updates, or need to refresh it outside of the scheduled intervals, you can trigger manual refreshes at any time. We provide detailed instructions on manual refresh options, including full and incremental refresh, later in this post.

Query a materialized view

To query a materialized view on your Amazon EMR cluster and retrieve its aggregated data, you can use a standard SELECT statement:

SELECT * FROM mv;

This query retrieves all rows from the materialized view. The output shows the aggregated customer order counts and total amounts. The result displays three customers with their respective metrics:

-- Result
Jane Smith    1    200
Bob Johnson    1    75
John Doe    1    150

Additionally, you can query the same materialized view from Athena SQL. The following screenshot shows the same query run on Athena and the resulting output.

Refresh a materialized view

You can refresh materialized views using two refresh types: full refresh or incremental refresh. Full refresh re-computes the entire materialized view from all base table data. Incremental refresh processes only the changes since the last refresh. Full refresh is ideal when you need consistency or after significant data changes. Incremental refresh is preferred when you need immediate updates. The following examples show both refresh types.

To use full refresh, complete the following steps:

  1. Insert three new records into the base table to simulate new data arriving:
    INSERT INTO base_tbl VALUES 
    (4, 'Jane Smith', 350, DATE('2025-11-29')), 
    (5, 'Bob Johnson', 100, DATE('2025-11-30')), 
    (6, 'Kwaku Mensah', 40, DATE('2025-12-01'));

  2. Query the materialized view to verify it still shows the old aggregated values:
    SELECT * FROM mv;
    
    -- Result
    Jane Smith    1    200
    Bob Johnson    1    75
    John Doe    1    150

  3. Run a full refresh of the materialized view using the following command:
    REFRESH MATERIALIZED VIEW mv FULL;

  4. Query the materialized view again to verify the aggregated values now include the new records:
    SELECT * FROM mv;
    
    -- Result
    Jane Smith    2    550 // Updated
    Bob Johnson    2    175  // Updated
    John Doe    1    150
    Kwaku Mensah    1    40 // Added

To use incremental refresh, complete the following steps:

  1. Enable incremental refresh by setting the Spark configuration properties:
    SET spark.sql.optimizer.incrementalMVRefresh.enabled=true;

  2. Insert two additional records into the base table:
    INSERT INTO base_tbl VALUES 
    (7, 'Jane Smith', 120, DATE('2025-11-28')), 
    (8, 'Kwaku Mensah', 90, DATE('2025-12-02'));

  3. Run an incremental refresh using the REFRESH command without the FULL clause. To verify if incremental refresh is enabled, refer to Appendix 2 at the end of this post.
    REFRESH MATERIALIZED VIEW mv;

  4. Query the materialized view to confirm the incremental changes are reflected in the aggregated results:
    SELECT * FROM mv;
    
    --Result
    Jane Smith    3    670    3    3 // Updated
    Bob Johnson    2    175    2    2 
    John Doe    1    150    1    1
    Kwaku Mensah    2    130    2    2 // Updated

In addition to using Spark SQL, you can also trigger manual refreshes through AWS Glue APIs when you need updates outside your scheduled intervals. Run the following AWS CLI command:

$ aws glue start-materialized-view-refresh-task-run \
    --catalog-id <ACCOUNT_ID> \
    --database-name <DATABASE_NAME> \
    --table-name <MV_TABLE_NAME>

The AWS Lake Formation console displays refresh history for API-triggered updates. Open your materialized view to see the refresh type (INCREMENTAL or FULL), start and end time, status and so on:

You have learned how to use Iceberg materialized views to make your efficient data processing and queries. You created a materialized view using Spark on Amazon EMR, queried it from both Amazon EMR and Athena, and used two refresh mechanisms: full refresh and incremental refresh. Iceberg materialized views help you transform and optimize your data pipelines effortlessly.

Considerations

There are important aspects to consider for optimal usage of the capability:

  • We introduced new SQL syntax to manage materialized views in the AWS optimized Spark runtime engine only. These new SQL commands are available in Spark version 3.5.6 and above across Athena, Amazon EMR, and AWS Glue. Open source Spark is not supported.
  • Materialized views are eventually consistent with base tables. When source tables change, the materialized views are updated through background refresh processes as defined by users in the refresh schedule at creation. During the refresh window, queries directly accessing materialized views might see outdated data. However, customers who need immediate access to the most up-to-date datasets can run a manual refresh with a simple REFRESH MATERIALIZED VIEW SQL command.

Clean up

To avoid incurring future charges, clean up the resources you created during this walkthrough:

  1. Run the following commands to delete a materialized view and tables:
    DROP TABLE mv PURGE;
    -- Or, DROP MATERIALIZED VIEW mv;
    
    DROP TABLE base_tbl PURGE;
    -- If necessary, delete the database by DROP DATABASE iceberg_mv;

  2. For Amazon EMR, terminate the Amazon EMR cluster.
  3. For AWS Glue, delete the AWS Glue job.

Conclusion

This post demonstrated how Iceberg materialized views facilitate efficient data lake operations on AWS. The new materialized view capability simplifies data pipelines and improves query performance by storing pre-computed results that are automatically updated as base tables change. You can create materialized views using familiar SQL syntax, using both full and incremental refresh mechanisms to maintain data consistency. This solution alleviates the need for complex pipeline maintenance while providing seamless integration with AWS services like Athena, Amazon EMR, and AWS Glue. The automatic query rewrite functionality further optimizes performance by intelligently utilizing materialized views when applicable, making it a powerful tool for organizations looking to streamline their data transformation workflows and accelerate query performance.

Appendix 1: Spark configuration to use Amazon S3 Tables storing Apache Iceberg materialized views

As mentioned earlier in this post, materialized views are stored as Iceberg tables in Amazon S3 Tables buckets within your account. When you want to use Amazon S3 Tables as the storage location for your materialized views instead of a general Amazon S3 bucket, you must configure Spark with the Amazon S3 Tables catalog.

The difference from the standard AWS Glue Data Catalog configuration shown in the prerequisites section is the glue.id parameter format. For Amazon S3 Tables, use the format <account-id>:s3tablescatalog/<s3-tables-bucket-name> instead of just the account ID:

spark-sql \
  --conf spark.sql.extensions=org.apache.iceberg.spark.extensions.IcebergSparkSessionExtensions \
  --conf spark.sql.catalog.s3t_catalog=org.apache.iceberg.spark.SparkCatalog \
  --conf spark.sql.catalog.s3t_catalog.type=glue \
  --conf spark.sql.catalog.s3t_catalog.warehouse="s3://amzn-s3-demo-bucket/warehouse" \
  --conf spark.sql.catalog.s3t_catalog.glue.region="us-east-1" \
  --conf spark.sql.catalog.s3t_catalog.glue.id="123456789012:s3tablescatalog/amzn-s3-demo-table-bucket" \
  --conf spark.sql.catalog.s3t_catalog.glue.account-id=123456789012 \
  --conf spark.sql.catalog.s3t_catalog.client.region="us-east-1" \
  --conf spark.sql.catalog.s3t_catalog.glue.lakeformation-enabled=true \
  --conf spark.sql.optimizer.answerQueriesWithMVs.enabled=true \
  --conf spark.sql.defaultCatalog=s3t_catalog

After you configure Spark with these settings, you can create and manage materialized views using the same SQL commands shown in this post, and the materialized views are stored in your Amazon S3 Tables bucket.

Appendix 2: Verify refreshing a materialized view with Spark SQL

Run SHOW TBLPROPERTIES in Spark SQL to check which refresh method was used:

+-------------------------------+----------------------------------------------------------------------------------------------------------------------------------+
|key                            |value                                                                                                                             |
+-------------------------------+----------------------------------------------------------------------------------------------------------------------------------+
|IMV_ansiEnabled                |false                                                                                                                             |
|IMV_catalogInfo                |[{"catalogId":"123456789012","catalogName":"glue_catalog"}]                                                                       |
|IMV_mvCatalogID                |123456789012                                                                                                                      |
|IMV_mvNamespace                |iceberg_mv                                                                                                                        |
|IMV_region                     |us-east-1                                                                                                                         |
|IMV_sparkVersion               |3.5.6-amzn-1                                                                                                                      |
|current-snapshot-id            |5750703934418352571                                                                                                               |
|format                         |iceberg/parquet                                                                                                                   |
|format-version                 |2                                                                                                                                 |
|isMaterializedView             |true                                                                                                                              |
|lastRefreshType                |INCREMENTAL                                                                                                                       |
|subObjects                     |[{"Version":"4887707562550190856","DatabaseName":"iceberg_mv","Region":"us-east-1","CatalogId":"123456789012","Name":"base_tbl"}] |
|tableVersionToken              |*********(redacted)                                                                                                               |
|viewOriginalText               |SELECT\ncustomer_name, \nCOUNT(*) as mv_order_count, \nSUM(amount) as mv_total_amount \nFROM base_tbl\nGROUP BY customer_name     |
|viewVersionId                  |5750703934418352571                                                                                                               |
|viewVersionToken               |*********(redacted)                                                                                                               |
|write.parquet.compression-codec|zstd                                                                                                                              |
+-------------------------------+----------------------------------------------------------------------------------------------------------------------------------+

About the authors

Tomohiro Tanaka

Tomohiro Tanaka

Tomohiro is a Senior Cloud Support Engineer at AWS. He’s passionate about helping customers use Apache Iceberg for their data lakes on AWS. In his free time, he enjoys a coffee break with his colleagues and making coffee at home.

Leon Lin

Leon Lin

Leon is a Software Development Engineer at AWS, where he focuses on Apache Iceberg and Apache Spark development within the Open Data Analytics Engines team. He is also an active contributor to the open source Apache Iceberg project.

Noritaka Sekiyama

Noritaka Sekiyama

Noritaka is a Principal Big Data Architect with AWS Analytics services. He’s responsible for building software artifacts to help customers. In his spare time, he enjoys cycling on his road bike.

Mahesh Mishra

Mahesh Mishra

Mahesh is a Principal Product Manager with the AWS Analytics team. He works with many of AWS largest customers on emerging technology needs, and leads several data and analytics initiatives within AWS, including strong support for transactional data lakes.

Layth Yassin

Layth Yassin

Layth is a Software Development Engineer on the AWS Glue team. He’s passionate about tackling challenging problems at a large scale, and building products that push the limits of the field. Outside of work, he enjoys playing/watching basketball, and spending time with friends and family.

Introducing AWS Glue 5.1 for Apache Spark

Post Syndicated from Chiho Sugimoto original https://aws.amazon.com/blogs/big-data/introducing-aws-glue-5-1-for-apache-spark/

AWS Glue is a serverless, scalable data integration service that makes it simple to discover, prepare, move, and integrate data from multiple sources. AWS recently announced Glue 5.1, a new version of AWS Glue that accelerates data integration workloads in AWS. AWS Glue 5.1 upgrades the Spark engines to Apache Spark 3.5.6, giving you newer Spark release along with the newer dependent libraries so you can develop, run, and scale your data integration workloads and get insights faster.

In this post, we describe what’s new in AWS Glue 5.1, key highlights on Spark and related libraries, and how to get started on AWS Glue 5.1.

What’s new in AWS Glue 5.1

The following updates are in AWS Glue 5.1:

Runtime and library upgrades

AWS Glue 5.1 upgrades the runtime to Spark 3.5.6, Python 3.11, and Scala 2.12.18 with new improvements from the open source version. AWS Glue 5.1 also updates support for open table format libraries to Apache Hudi 1.0.2, Apache Iceberg 1.10.0, and Delta Lake 3.3.2 so you can solve advanced use cases around performance, cost, governance, and privacy in your data lakes.

Support for new Apache Iceberg features

AWS Glue 5.1 adds support for Apache Iceberg Materialized View, and Apache Iceberg format version 3.0. AWS Glue 5.1 also adds support for data writes into Iceberg and Hive tables with Spark-native fine-grained access control with AWS Lake Formation.

Apache Iceberg Materialized View is especially useful in cases where you need to accelerate frequently run queries on large data sets by pre-computing expensive aggregations. If you would like to learn more about Apache Iceberg materialized views, refer to Introducing Apache Iceberg materialized views in AWS Glue Data Catalog.

Apache Iceberg format version 3.0 is the latest Iceberg format version defined in Iceberg Table Spec. Following features are supported:

Create an Iceberg V3 format table

To create an Iceberg V3 format table, specify the format-version to 3 when creating the table. The following is a sample PySpark script: (replace amzn-s3-demo-bucket with your S3 bucket name):

from pyspark.sql import SparkSession

s3bucket = "amzn-s3-demo-bucket" 
database = "glue51_blog_demo" 
table_name = "iceberg_v3_table_demo"

spark = (
    SparkSession.builder
    .config("spark.sql.extensions", "org.apache.iceberg.spark.extensions.IcebergSparkSessionExtensions")
    .config("spark.sql.defaultCatalog", "glue_catalog")
    .config("spark.sql.catalog.glue_catalog", "org.apache.iceberg.spark.SparkCatalog")
    .config("spark.sql.catalog.glue_catalog.type", "glue")
    .config("spark.sql.catalog.glue_catalog.warehouse", f"s3://{s3bucket}/{database}/{table_name}/")
    .getOrCreate()
)

spark.sql(f"CREATE DATABASE IF NOT EXISTS {database}")

# Create Iceberg table with V3 format-version
spark.sql(f"""
    CREATE TABLE IF NOT EXISTS {database}.{table_name} (
        id int,
        name string,
        age int,
        created_at timestamp
    ) USING iceberg
    TBLPROPERTIES (
        'format-version'='3',
        'write.delete.mode'='merge-on-read'
    )
""")

To migrate from V2 format to V3, use ALTER TABLE ... SET TBLPROPERTIES to update the format-version. The following is a sample PySpark script:

spark.sql(f"ALTER TABLE {database}.{table_name} SET TBLPROPERTIES ('format-version'='3')")

You cannot rollback from V3 to V2, so you need to be careful to verify that all your Iceberg clients support Iceberg V3 format version. Once upgraded, older versions cannot correctly read newer format versions, as Iceberg table format versions are not forward-compatible.

Create a table with Row Lineage tracking enabled

To create a table with Row Lineage tracking enabled, set the table property row-lineage to true. The following is a sample PySpark script:

# Create Iceberg table with row-lineage-tracking
spark.sql(f"""
    CREATE TABLE IF NOT EXISTS {database}.{table_name} (
        id int,
        name string,
        age int,
        created_at timestamp
    ) USING iceberg
    TBLPROPERTIES (
        'format-version'='3',
        'row-lineage'='true',
        'write.delete.mode'='merge-on-read'
    )
""")

In tables with Row Lineage tracking enabled, row IDs are managed at the metadata level for tracking row modifications over time and auditing.

Extended support for AWS Lake Formation permissions

Fine-grained access control with Lake Formation has been supported through native Spark DataFrames and Spark SQL in Glue 5.0 for read operations. Glue 5.1 extends fine-grained access control for write operations.

Full-Table Access (FTA) control in Apache Spark were introduced for Apache Hive and Iceberg tables in Glue 5.0. Glue 5.1 extends FTA support for Apache Hudi tables and Delta Lake tables.

S3A by default

AWS Glue 5.1 uses S3A as the default S3 connector. This change aligns with the recent Amazon EMR adoption of S3A as the default connector and brings enhanced performance and advanced features to Glue workloads. For more details about the S3A connector’s capabilities and optimizations, see Optimize Amazon EMR runtime for Apache Spark with EMR S3A.

Note when migrating from Glue 5.0 to Glue 5.1, If both spark.hadoop.fs.s3a.endpoint and spark.hadoop.fs.s3a.endpoint.region are not set, the default region used by S3A is us-east-2. This may cause issues. To mitigate the issues caused by this change, set the spark.hadoop.fs.s3a.endpoint.region Spark configuration when using the S3A file system in AWS Glue 5.1.

Dependent library upgrades

AWS Glue 5.1 upgrades the runtime to Spark 3.5.6, Python 3.11, and Scala 2.12.18 with upgraded dependent libraries.

The following table lists dependency upgrades:

Dependency Version in AWS Glue 5.0 Version in AWS Glue 5.1
Spark 3.5.4 3.5.6
Hadoop 3.4.1 3.4.1
Scala 2.12.18 2.12.18
Hive 2.3.9 2.3.9
EMRFS 2.69.0 2.73.0
Arrow 12.0.1 12.0.1
Iceberg 1.7.1 1.10.0
Hudi 0.15.0 1.0.2
Delta Lake 3.3.0 3.3.2
Java 17 17
Python 3.11 3.11.14
boto3 1.34.131 1.40.61
AWS SDK for Java 2.29.52 2.35.5
AWS Glue Data Catalog Client 4.5.0 4.9.0
EMR DynamoDB Connector 5.6.0 5.7.0

The following are database connector (JDBC driver) upgrades:

Driver Connector version in AWS Glue 5.0 Connector version in AWS Glue 5.1
MySQL 8.0.33 8.0.33
Microsoft SQL Server 10.2.0 10.2.0
Oracle Databases 23.3.0.23.09 23.3.0.23.09
PostgreSQL 42.7.3 42.7.3
Amazon Redshift redshift-jdbc42-2.1.0.29 redshift-jdbc42-2.1.0.29

The following are Spark connector upgrades:

Driver Connector version in AWS Glue 5.0 Connector version in AWS Glue 5.1
Amazon Redshift 6.4.0 6.4.2
OpenSearch 1.2.0 1.2.0
MongoDB 10.3.0 10.3.0
Snowflake 3.0.0 3.1.1
BigQuery 0.32.2 0.32.2
AzureCosmos 4.33.0 4.33.0
AzureSQL 1.3.0 1.3.0
Vertica 3.3.5 3.3.5

Get started with AWS Glue 5.1

You can start using AWS Glue 5.1 through AWS Glue Studio, the AWS Glue console, the latest AWS SDK, and the AWS Command Line Interface (AWS CLI).

To start using AWS Glue 5.1 jobs in AWS Glue Studio, open the AWS Glue job and on the Job Details tab, choose the version Glue 5.1 – Supports Spark 3.5, Scala 2, Python 3.

To start using AWS Glue 5.1 on an AWS Glue Studio notebook or an interactive session through a Jupyter notebook, set 5.1 in the %glue_version magic:

%%glue_version 5.1

The following output shows that the session is set to use AWS Glue 5.1:

Setting Glue version to: 5.1

Spark Troubleshooting with Glue 5.1

To accelerate Apache Spark troubleshooting and job performance optimization for your Glue 5.1 ETL jobs, you can use the newly introduced Apache Spark troubleshooting agent. Traditional Spark troubleshooting requires extensive manual analysis of logs, performance metrics, and error patterns to identify root causes and optimization opportunities. The agent simplifies this process through natural language prompts, automated workload analysis, and intelligent code recommendations. The agent has three main components: an MCP-compatible AI assistant in your development environment for interaction, the MCP proxy for AWS that handles secure communication between your client and the MCP server, and an Amazon SageMaker Unified Studio managed MCP Server (preview) that provides specialized Spark troubleshooting and upgrade tools for Glue 5.1 jobs.

To set up the agent, follow the instructions to set up the resources and MCP configuration: Setup for Apache Spark Troubleshooting agent. Then, you can launch your preferred MCP client and use conversation to interact with the tools for troubleshooting.

The following is a demonstration on how you can use the Apache Spark troubleshooting agent with Kiro CLI to debug a Glue 5.1 job run.

For more information and video walkthroughs for how to use the Apache Spark troubleshooting agent, please refer to Apache Spark Troubleshooting agent for Amazon EMR.

Conclusion

In this post, we discussed the key features and benefits of AWS Glue 5.1. You can create new AWS Glue jobs on AWS Glue 5.1 or migrate your existing AWS Glue jobs to benefit from the improvements.

We would like to thank the support of numerous engineers and leaders who helped build Glue 5.1 to support customers with a performance optimized Spark runtime and deliver new capabilities.


About the authors

Chiho Sugimoto

Chiho is a Cloud Support Engineer on the AWS Big Data Support team. She is passionate about helping customers build data lakes using ETL workloads. She loves planetary science and enjoys studying the asteroid Ryugu on weekends.

Noritaka Sekiyama

Noritaka is a Principal Big Data Architect at the AWS Analytics product team. He’s responsible for designing new features in AWS products, building software artifacts, and providing architecture guidance to customers. In his spare time, he enjoys cycling on his road bike.

Peter Tsai

Peter is a Software Development Engineer at AWS, where he enjoys solving challenges in the design and performance of the AWS Glue runtime. In his leisure time, he enjoys hiking and cycling.

Bo Li

Bo Li is a Senior Software Development Engineer on the AWS Glue team. He is devoted to designing and building end-to-end solutions to address customers’ data analytic and processing needs with cloud-based, data-intensive and GenAI technologies.

Kartik Panjabi

Kartik is a Software Development Manager on the AWS Glue team. His team builds generative AI features for the Data Integration and distributed system for data integration.

Peter Manastyrny

Peter is a Product Manager focusing on data processing and data integration workloads at AWS. He is working on making AWS Glue the best tool for building and operating complex integrated data pipelines.

Auto-optimize your Amazon OpenSearch Service vector database

Post Syndicated from Dylan Tong original https://aws.amazon.com/blogs/big-data/auto-optimize-your-amazon-opensearch-service-vector-database/

AWS recently announced the general availability of auto-optimize for the Amazon OpenSearch Service vector engine. This feature streamlines vector index optimization by automatically evaluating configuration trade-offs across search quality, speed, and cost savings. You can then run a vector ingestion pipeline to build an optimized index on your desired collection or domain. Previously, optimizing index configurations—including algorithm, compression, and engine settings—required experts and weeks of testing. This process must be repeated because optimizations are unique to specific data characteristics and requirements. You can now auto-optimize vector databases in under an hour without managing infrastructure and acquiring expertise in index tuning.

In this post, we discuss how the auto-optimize feature works, its benefits, and share examples of auto-optimized results.

Overview of vector search and vector indexes

Vector search is a technique that improves search quality and is a cornerstone of generative AI applications. It involves using a type of AI model to convert content into numerical encodings (vectors), enabling content matching by semantic similarity instead of just keywords. You build vector databases by ingesting vectors into OpenSearch to build indexes that enable searches across billions of vectors in milliseconds.

Benefits of optimizing vector indexes and how it works

The OpenSearch vector engine provides a variety of index configurations that help you make favorable trade-offs between search quality (recall), speed (latency), and cost (RAM requirements). There isn’t a universally optimal configuration. Experts must evaluate combinations of index settings such as Hierarchal Navigable Small Worlds (HNSW) algorithm parameters (such as m or ef_construction), quantization techniques (such as scalar, binary, or product), and engine parameters (such as memory-optimized, disk-optimized, or warm-cold storage). The difference between configurations could be a 10% or more difference in search quality, hundreds of milliseconds in search latency, or up to three times in cost savings. For large-scale deployments, cost-optimizations can make or break your budget.

The following figure is a conceptual illustration of trade-offs between index configurations.

Optimizing vector indexes is time-consuming. Experts must build an index; evaluate its speed, quality, and cost; and make appropriate configuration adjustments before repeating this process. Running these experiments at scale can take weeks because building and evaluating large-scale index requires substantial compute power, resulting in hours to days of processing for just one index. Optimizations are unique to specific business requirements and each dataset, and trade-off decisions are subjective. The best trade-offs depend on the use case, such as search for an internal wiki or an e-commerce site. Therefore, this process must be repeated for each index. Lastly, if your application data changes continuously, your vector search quality might degrade, requiring you to rebuild and re-optimize your vector indexes regularly.

Solution overview

With auto-optimize, you can run jobs to produce optimization recommendations, consisting of reports that detail performance measurements and explanations of the recommended configurations. You can configure auto-optimize jobs by simply providing your application’s acceptable search latency and quality requirements. Expertise in k-NN algorithms, quantization techniques, and engine settings aren’t required. It avoids the one-size-fits-all limitations of solutions based on a few pre-configured deployment types, offering a tailored fit for your workloads. It automates the manual labor previously described. You simply run serverless, auto-optimize jobs at a flat rate per job. These jobs don’t consume your collection or domain resources. OpenSearch Service manages a separate multi-tenant warm pool of servers, and parallelizes index evaluations across secure, single-tenant workers to deliver results quickly. Auto-optimize is also integrated with vector ingestion pipelines, so you can quickly build an optimized vector index on a collection or domain from an Amazon Simple Storage Service (Amazon S3) data source.

The following screenshot illustrates how to configure an auto-optimize job on the OpenSearch Service console.

When the job is complete (typically, within 30–60 minutes for million-plus-size datasets), you can review the recommendations and reports, as shown in the following screenshot.

The screenshot illustrates an example where you need to choose the best trade-offs. Do you select the first option, which delivers the highest cost savings (through lower memory requirements)? Or do you select the third option, which delivers a 1.76% search quality improvement, but at higher cost? If you want to understand the details of the configurations used to deliver these results, you can view the sub-tabs on the Details pane, such as the Algorithm parameters tab shown in the preceding screenshot.

After you’ve made your choice, you can build your optimized index on your target OpenSearch Service domain or collection, as shown in the following screenshot. If you’re building the index on a collection or a domain running OpenSearch 3.1+, you can enable GPU-acceleration to increase the build speed up to 10 times faster at a quarter of the indexing cost.

Auto-optimize results

The following table presents a few examples of auto-optimize results. To quantify the value of running auto-optimize, we present gains compared to default settings. The estimated RAM requirements are based on standard domain sizing estimates:

Required RAM = 1.1 x (bytes per dimension x dimensions + hnsw.parameters.m x 8) x vector count

We estimate cost savings by comparing the minimal infrastructure (has just enough RAM) to host an index with the default compared to optimized settings.

Dataset Auto-Optimize Job Configurations Recommended Changes to Defaults

Required RAM)

(% reduced)

Estimated Cost Savings

(Required data nodes for default configuration vs. optimized)

Recall

(% gain)

msmarco-distilbert-base-tas-b: 10M 384D vectors generated from MSMARCO v1 Acceptable recall >= 0.95 Modest latency (Approximately 200-300 ms) More supporting indexing and search memory (ef_search=256, ef_constructon=128)Use Lucene engineDisk optimized mode with 5X oversampling4X compression (4-bit binary quantization)

5.6 GB

(-69.4%)

Less 75%

(3 x r8g.mediumsearch vs. 3 x r8g.xlarge.search)

0.995(+2.6%)
all-mpnet-base-v2: 1M 768D vectors generated from MSMARCO v2.1 Acceptable recall >= 0.95 Modest latency (Approximately 200–300 ms) Denser HNSW Graph (m=32)More supporting indexing and search memory (ef_search=256, ef_constructon=128)Disk optimized mode with 3X oversampling8X compression (4-bit binary quantization)

0.7GB

(-80.9%)

Less 50.7%

(t3.small.search vs. t3.medium.search)

0.999 (+0.9%)
Cohere Embed V3: 113M 1024D vectors generated from MSMARCO v2.1 Acceptable recall >= 0.95 Fast latency (Approximately <= 50 ms) Denser HNSW Graph (m=32)More supporting indexing and search memory (ef_search=256, ef_constructon=128)Use Lucene engine4X compression (uint8-scalar quantization)

159GB

(-69.7%)

Less 50.7%

(6 x r8g.4xlarge.search vs. 6 x r8g.8xlarge.search)

0.997 (+8.4%)

Conclusion

You can start building auto-optimized vector databases on the Vector ingestion page of the OpenSearch Service console. Use this feature with GPU-accelerated vector indexes to build optimized, billion-scale vector databases within hours.

Auto-optimize is available for OpenSearch Service vector collections and OpenSearch 2.17+ domains in the US East (N. Virginia, Ohio), US West (Oregon), Asia Pacific (Mumbai, Singapore, Sydney, Tokyo), and Europe (Frankfurt, Ireland, Stockholm) AWS Regions.


About the authors

Dylan Tong

Dylan Tong

Dylan is a Senior Product Manager at Amazon Web Services. He leads the product initiatives for AI and machine learning (ML) on OpenSearch including OpenSearch’s vector database capabilities. Dylan has decades of experience working directly with customers and creating products and solutions in the database, analytics and AI/ML domain. Dylan holds a BSc and MEng degree in Computer Science from Cornell University.

Vamshi Vijay Nakkirtha

Vamshi Vijay Nakkirtha

Vamshi is a software engineering manager working on the OpenSearch Project and Amazon OpenSearch Service. His primary interests include distributed systems.

Vikash Tiwari

Vikash Tiwari

Vikash is a Senior Software Development Engineer at AWS, specializing in OpenSearch vector search. He is passionate about distributed systems, large-scale machine learning, scalable search architectures, and database internals. His expertise spans vector search, indexing optimizations, and efficient data retrieval, and he is deeply interested in learning and enhancing modern database systems.

Janelle Arita

Janelle Arita

Janelle is a UX Designer at AWS working on OpenSearch. She is focused on creating intuitive user experiences for observability, security analytics, and search workflows. She’s passionate about solving complex operational challenges through user-centered design and data-driven insights.

Huibin Shen

Huibin Shen

Huibin is a scientist at AWS interested in machine learning and its applications.

Build billion-scale vector databases in under an hour with GPU acceleration on Amazon OpenSearch Service

Post Syndicated from Dylan Tong original https://aws.amazon.com/blogs/big-data/build-billion-scale-vector-databases-in-under-an-hour-with-gpu-acceleration-on-amazon-opensearch-service/

AWS recently announced the general availability of GPU-accelerated vector (k-NN) indexing on Amazon OpenSearch Service. You can now build billion-scale vector databases in under an hour and index vectors up to 10 times faster at a quarter of the cost. This feature dynamically attaches serverless GPUs to boost domains and collections running CPU-based instances. With this feature, you can scale AI apps quickly, innovate faster, and run vector workloads leaner.

In this post, we discuss the benefits of GPU-accelerated vector indexing, explore key use cases, and share performance benchmarks.

Overview of vector search and vector indexes

Vector search is a technique that improves search relevance, and is a cornerstone of generative AI applications. It involves using an embeddings model to convert content into numerical encodings (vectors), enabling content matching by semantic similarity instead of just keywords. You can build vector databases by ingesting vectors into OpenSearch Service to build indexes that enable searches across billions of vectors in milliseconds.

Challenges with scaling vector databases

Customers are increasingly scaling vector databases to multi-billion-scale on OpenSearch Service to power generative AI applications, product catalogs, knowledge bases, and more. Applications are becoming increasingly agentic, integrating AI agents that rely on vector databases for high-quality search results across enterprise data sources to enable chat-based interactions and automation.

However, there are challenges on the way to billion-scale. First, multi-million to billion-scale vector indexes take hours to days to build. These indexes use algorithms like Hierarchal Navigable Small Worlds (HNSW) to enable high-quality, millisecond searches at scale. However, they require more compute power than traditional indexes to build. Furthermore, you have to rebuild your indexes whenever your model changes, such as switching between vendors, versions, or after fine-tuning. Some use cases such as personalized search require models to be fine-tuned daily and adapt to evolving user behaviors. All vectors must be regenerated when the model changes, so the index must be rebuilt. HNSW can also degrade following significant updates and deletes, so indexes must be rebuilt to regain accuracy.

Lastly, as your agentic applications become more dynamic, your vector database must scale for heavy streaming ingestion, updates, and deletes while maintaining low search latency. If search and indexing use the same infrastructure, these intensive processes will compete for limited compute and RAM, so search latency can degrade.

Solution overview

You can overcome these challenges by enabling GPU-accelerated indexing on OpenSearch Service 3.1+ domains or collections. GPU acceleration will dynamically activate, for instance, in response to a reindex command on a million-plus-size index. During activation, index tasks are offloaded to GPU servers that run NVIDIA cuVS to build HNSW graphs. Superior speed and efficiency are achieved through parallelization of vector operations. Inverted indexes will continue using your cluster’s CPU for indexing and search on non-vector data. These indexes operate alongside HNSW to support keyword, hybrid, and filtered vector search. The resources required to build inverted indexes is low compared to HNSW.

GPU acceleration is enabled as a cluster-level configuration, but it can be disabled on individual indexes. This feature is serverless, so you don’t need to manage GPU instances. You simply pay-per-use through OpenSearch Compute Units (OCUs).

The following diagram illustrates how this feature works.

The workflow consists of the following steps:

  1. You write vectors into your domain or collection, using the existing APIs: bulk, reindex, index, update, delete, and force merge.
  2. GPU acceleration is activated when the indexed vector data surpasses a configured threshold within a refresh interval.
  3. This leads to a secure, single-tenant assignment of GPU servers to your cluster from a multi-tenant warm pool of GPUs managed by OpenSearch Service.
  4. Within milliseconds, OpenSearch Service initiates and offloads HNSW operations.
  5. When the write volume falls below the threshold, GPU servers are scaled down and returned to the warm pool.

This automation is fully managed. You only pay for acceleration time, which you can monitor from Amazon CloudWatch.

This feature isn’t just designed for ease of use. It enables GPU acceleration benefits without economic challenges. For example, a domain sized to host 1 billion (1,024 dimension) vectors compressed 32 times (using binary quantization) takes three r8g.12xlarge.search instances to provide the required 1.15 TBs of RAM. A design that requires running a domain on GPU instances, would need six g6.12xlarge instances to do the same, resulting in 2.4 times higher cost and excessive GPUs. This solution delivers efficiency by providing the right amount of GPUs only when you need them, so you gain speed with cost savings.

Use cases and benefits

This feature has three primary uses and benefits:

  • Build large-scale indexes faster, increasing productivity and innovation velocity
  • Reduce cost by lowering Amazon OpenSearch Serverless indexing OCU usage, or downsizing domains with write-heavy vector workloads
  • Accelerate writes, lower search latency, and improve user experience on your dynamic AI applications

In the following sections, we discuss these use cases in more detail.

Build large-scale indexes faster

We benchmarked index builds for 1M, 10M, 113M, and 1B vector test cases to demonstrate speed gains on both domains and collections. Speed gains ranged from 6.4 to 13.8 times faster. These tests were performed with production configurations (Multi-AZ with replication) and default GPU service limits. All tests were run on right-sized search clusters, and the CPU-only tests had CPU utilization maxed exclusively for indexing. The following chart illustrates the relative speed gains from GPU acceleration on managed domains.

The total index build time on domains includes a force merge to optimize the underlying storage engine for search performance. During normal operation, merges are automatic. However, when benchmarking domains, we perform a manual merge after indexing to make sure merging impact is consistent across tests. The following table summarizes the index build benchmarks and dataset references for domains.

Dataset CPU-Only With GPU Improvements
Index (min) Force Merge (min) Index (min) Force Merge (min) Index Force Merge Total
Cohere Embed V2: 1M 768D Vectors generated from Wikipedia 32.0 50.0 7.9 2.0 4.1X 25.0X 8.3X
Cohere Embed V2: 10M 768D Vectors generated from Wikipedia 64.1 444.5 21.9 14.9 2.9X 29.8X 13.8X
Cohere Embed V3: 113M 1024D Vectors generated from MSMARCO v2.1 262.2 1460.4 68.9 198.6 3.8X 7.4X 6.4X
BigANN Benchmark (SIFT: 1B 128D Vectors generated from Flickr dataset) 251.6 1665.0 35.5 133.0 7.1 X 12.5X 11.4X

We ran the same performance tests on collections. The performance is different on OpenSearch Serverless because its serverless architecture involves performance trade-offs such as automatic scaling, which introduces a ramp-up to reach peak performance. The following table summarizes these results.

Dataset Changes to Default Settings Index Time (min) Improvements
CPU-Only With GPU
Cohere Embed V2: 1M 768D Vectors generated from Wikipedia – 60 17.25 3.48X
Cohere Embed V2: 10M 768D Vectors generated from Wikipedia Minimum OCUs: 32 146 38 3.84X
Cohere Embed V3: 113M 1024D Vectors generated from MSMARCO v2.1 Minimum OCUs: 48 1092 294 3.71X
BigANN Benchmark (SIFT: 1B 128D Vectors generated from Flickr dataset) Minimum OCUs: 48 732 203 3.61X

OpenSearch Serverless doesn’t support force merge, so the full benefit from GPU acceleration might be delayed until the automatic background merges complete. The default minimum OCUs had to be increased for tests beyond 1 million vectors to handle higher indexing throughput.

Reduce cost

Our serverless GPU design uniquely delivers speed gains and cost savings. With OpenSearch Serverless, your net indexing costs will be reduced if you have indexing workloads that are significant enough to activate GPU acceleration. The following table presents the OCU usage and cost consumption usage from the previous index build tests.

Data Set Changes to Defaults CPU-only With GPU Less Cost
Total OCU/hrs. Cost
(OCU at $0.24/hr.)
Total OCU/hrs. Cost
(OCU at $0.24/hr.)
Cohere Embed V2: 1M 768D Vectors generated from Wikipedia – 8 $1.92 1.5 $0.36 5.3X
Cohere Embed V2: 10M 768D Vectors generated from Wikipedia Minimum OCUs: 32 78 $18.72 20.3 $4.87 3.8X
Cohere Embed V3: 113M 1024D Vectors generated from MSMARCO v2.1 Minimum OCUs: 48 2721 $653.04 304.5 $73.08 8.9X
BigANN Benchmark (SIFT: 1B 128D Vectors generated from Flickr dataset) Minimum OCUs: 48 1562 $374.88 201 $48.24 7.8X

The vector acceleration OCUs offload and reduce indexing OCUs. The total OCU usage is less with GPU because the index is built more efficiently, resulting in cost savings.

With managed domains, cost savings are situational because search and indexing infrastructure isn’t decoupled like on OpenSearch Serverless. However, if you have a write-heavy, compute-bound vector search application (that is, your domain is sized for vCPUs to sustain write throughput), you could downsize your domain.

The following benchmarks demonstrate the efficiency gains from GPU acceleration. We measure the infrastructure costs during the indexing tasks. GPU acceleration has the additional cost of GPUs at $0.24 per OCU/hour. However, because indexes are built faster and more efficiently, it’s more economical to use GPU to reduce CPU utilization on your domain and downsize it.

Data Set CPU-only With GPU (OCU at $0.24/hr.) Less Cost
Index and Merge *Domain Cost during Index Build Index and Merge Total Costs during Index Build
Cohere Embed V2: 1M 768D Vectors generated from Wikipedia 1.4hr. $1.00 9.9 min $0.13 12.0X
Cohere Embed V2: 10M 768D Vectors generated from Wikipedia 8.5 hr. $37.82 36.8 min $3.10 12.2X
Cohere Embed V3: 113M 1024D Vectors generated from MSMARCO v2.1 28.7hr $712.47 4.5 hr. $121.70 5.9X
BigANN Benchmark (SIFT: 1B 128D Vectors generated from Flickr dataset) 31.9hr $1118.09 2.8 hr. $109.86 10.2X

*Domains are running a high-availability configuration without any cost-optimizations

Accelerate writes, lower search latency

In experienced hands, domains offer operational control and the ability to achieve great scalability, performance, and cost optimizations. However, operational responsibilities include managing indexing and search workloads on shared infrastructure. If your vector deployment involves heavy, sustained streaming ingestion, updates, and deletes, you might observe higher search times on your domain. As illustrated in the following chart, as you increase vector writes, the CPU utilization increases to support HNSW graph building. Concurrent search latency also increases because of competition for compute and RAM resources.

You could solve the problem by adding data nodes to increase your domain’s compute capacity. However, enabling GPU acceleration is simpler and cheaper. As illustrated in the chart, GPU frees up CPU and RAM on your domain, helping you sustain low and stable search latency under high write throughput.

Get started

Ready to get started? If you already have an OpenSearch Service vector deployment, use the AWS Management Console, AWS Command Line Interface (AWS CLI), or API to enable GPU acceleration on your OpenSearch 3.1+ domain or vector collection. Test it with your existing indexing workloads. If you’re planning to build a new vector database, try out our new vector ingestion feature, which simplifies vector ingestion, indexing, and automates optimizations. Check out this demonstration on YouTube.


Acknowledgments

The authors would like to thank Manas Singh, Nathan Stephens, Jiahong Liu, Ben Gardner, and Zack Meeks from NVIDIA, and Yigit Kiran and Jay Deng from AWS for their contributions to this post.

About the authors

Authors would like to add special thanks to Manas Singh, Nathan Stephens, Jiahong Liu, Ben Gardner, Zack Meeks NVIDIA and Yigit Kiran and Jay Deng from AWS.

Dylan Tong

Dylan Tong

Dylan is a Senior Product Manager at Amazon Web Services. He leads the product initiatives for AI and machine learning (ML) on OpenSearch including OpenSearch’s vector database capabilities. Dylan has decades of experience working directly with customers and creating products and solutions in the database, analytics and AI/ML domain. Dylan holds a BSc and MEng degree in Computer Science from Cornell University.

Vamshi Vijay Nakkirtha

Vamshi Vijay Nakkirtha

Vamshi is a software engineering manager working on the OpenSearch Project and Amazon OpenSearch Service. His primary interests include distributed systems.

Navneet Verma

Navneet Verma

Navneet is a senior software engineer at AWS OpenSearch . His primary interests include machine learning, search engines and improving search relevancy. Outside of work, he enjoys playing badminton.

Aruna Govindaraju

Aruna Govindaraju

Aruna is an Amazon OpenSearch Specialist Solutions Architect and has worked with many commercial and open-source search engines. She is passionate about search, relevancy, and user experience. Her expertise with correlating end-user signals with search engine behavior has helped many customers improve their search experience.

Corey Nolet

Corey Nolet

Corey is a principal architect for vector search, data mining, and classical ML libraries at NVIDIA, where he focuses on building and scaling algorithms to support extreme data loads at light speed. Prior to joining NVIDIA in 2018, Corey spent many years building massive-scale exploratory data science & real-time analytics platforms for big data and HPC environments in the defense industry. Corey holds BS. & MS degrees in Computer Science. He is also completing his Ph.D. in the same discipline, focusing on accelerating algorithms at the intersection of graph and machine learning. Corey has a passion for using data to make better sense of the world.

Kshitiz Gupta

Kshitiz Gupta

Kshitiz is a Solutions Architect at NVIDIA. He enjoys educating cloud customers about the GPU AI technologies NVIDIA has to offer and assisting them with accelerating their machine learning and deep learning applications. Outside of work, he enjoys running, hiking, and wildlife watching.

Accelerate autonomous incident resolutions using the Datadog MCP server and AWS DevOps agent (in preview)

Post Syndicated from Nina Chen original https://aws.amazon.com/blogs/devops/accelerate-autonomous-incident-resolutions-using-the-datadog-mcp-server-and-aws-devops-agent-in-preview/

This post was co-written with Omri Sass (Director of Product Management), Cansu Berkem (Director of Product Management), and Mohammad Jama (Product Marketing Manager) from Datadog.

On-call engineers spend hours manually investigating incidents across multiple observability tools, logs, and monitoring systems. This process delays incident resolution and impacts business operations, especially when teams need to correlate data across different monitoring platforms. AWS DevOps Agent (in preview) is a frontier agent that resolves and proactively prevents incidents, continuously improving reliability and performance of applications in AWS, multicloud, and hybrid environments. Frontier agents represent a new class of AI agents that are autonomous, massively scalable, and work for hours or days without constant intervention. AWS DevOps Agent offers built-in integration with Datadog Model Context Protocol (MCP) Server, enabling you to access the untapped insights in your data by connecting directly to Datadog’s monitoring solutions. DevOps Agent maps your application resources and correlates telemetry, code, and deployment data to reduce MTTR (Mean Time To Resolution) and drive operational excellence.

You can use this integration to collect and analyze Datadog logs, metrics, and traces, correlating this data across AWS services. When incidents occur, AWS DevOps Agent identifies issues and provides mitigation plans which engineers can then implement. Engineers can monitor automated investigations through a central dashboard and engage with the agent through interactive chat at any time. Using this integration, engineers are able to reduce mean time to resolution (MTTR) from hours to minutes, while maintaining full visibility into automated actions.

How Datadog MCP and AWS DevOps Agent work together

The integration between Datadog MCP Server and AWS DevOps Agent connects your monitoring data with automated incident response. Datadog MCP Server acts as a central access point for your monitoring data. It securely connects to Datadog through a standardized protocol, allowing AWS DevOps Agent to query logs, metrics, and traces during investigations. The service uses OAuth 2.0 authentication and supports multiple regions to help maintain data sovereignty requirements.

AWS DevOps Agent learns your resources and relationships while correlating data from both AWS services and Datadog. It analyzes Amazon CloudWatch logs and metrics, deployment data, and code alongside Datadog telemetry to build a complete picture of the incident. This combined view helps identify root causes faster than examining each data source separately. Security considerations are built into every interaction. All interactions between AWS DevOps Agent and Datadog MCP Server uses authentication, authorization, encryption, and logging for audit purposes. While the service currently only runs in us-east-1, it can monitor and analyze applications deployed across any AWS Region in customer accounts globally.

Setting up and using AWS DevOps Agent with Datadog

In this section, we will guide you through the steps required to enable Datadog MCP Server in your AWS DevOps Agent account and configure it for incident resolution.

Pre-requisites

For this walkthrough, you should have access to and understanding of the following:

  • An AWS account with permissions to create AWS IAM (Identity and Access Management) roles:
    • Agent Space role – for basic service operations
    • Agent Space web app role – for using the Agent Space web app functionality
    •  (Optional) Secondary source account roles if monitoring multiple AWS accounts. Refer to the DevOps Agent user guide for the details on setting up these roles.
  • A Datadog account
  • Access to Datadog MCP Server (in preview)

Setting up Datadog in the AWS DevOps Agent console

Start the setup in the AWS DevOps Agent console by connecting your Datadog MCP Server. Navigate to Settings, select the Datadog integration panel, and choose “Register.” Enter your Datadog MCP Server details when prompted (you can learn more about requesting access to this server in their documentation). AWS DevOps Agent validates the connection and displays a confirmation message.

This is the configuration in AWS DevOps Agent for Datadog MCP Server Details with three input fields: Server Name (with example 'my-datadog-server'), Endpoint URL (showing 'https://mcp.datadog.com/api/unstable/mcp-server/mcp'), and an optional Description field. The form includes navigation steps at the top and Cancel/Next buttons at the bottom. The interface has a dark theme with blue accents.Figure 1: Setting up Datadog MCP Server in AWS DevOps Agent Console

Create an AWS DevOps Agent Agent Space

Next, create an Agent Space in your primary AWS account. This requires an AWS IAM role that grants AWS DevOps Agent access to your AWS resources. After creating your Agent Space, add Datadog MCP Server as a telemetry source to enable comprehensive incident investigation.

To create your Agent Space, start by accessing the AWS DevOps Agent console in us-east-1. Choose the “Create Agent Space” button and provide a meaningful name and description for your space. After submitting the form, you’ll need to configure the required IAM roles, which can be done through either the automated creation process or manual setup.

This is the configuration for creating an AWS DevOps Agent AgentSpace. The screen shows the option to create a DevOps Agents, with areas to give agent details, resource access, and more. The interface is dark blue theme. Figure 2: Creating a AWS DevOps Agent in Agent Space

Your Agent Space topology can be initialized using either AWS CloudFormation stacks or AWS Tags as starting points to identify your application components. Once the basic setup is complete, you can enhance your Agent Space configuration by adding Secondary source accounts for multi-account monitoring and configuring integrations with services like SIM ticketing system, Pipelines (where GitFarm packages and CloudFormation Stacks are located), Slack, and most importantly for our use case, Telemetry with the Datadog MCP Server.

This is a page that has options for adding telemetry source (datadog) in agent space. Here, there is a pop-up to add source association. The selected source here to add is Datadog. Figure 3: Add additional telemetry sources for AWS DevOps Agent to investigate

From here, we can launch the Agent Space web app to begin the investigation.

Real-World example: Resolving API Gateway errors

Let’s walk through how AWS DevOps Agent and Datadog work together to resolve a production incident. In this scenario, Datadog detects a spike in Amazon API Gateway 5XX errors affecting downstream services.

This is a sample monitor view of sample 5XX errors in Datadog. There is a monitor of Amazon API Gateway pulled up. On the right, there is a monitor showing "Your 5XX Errors" with over 220 errors. Figure 4: Sample API Gateway errors in Datadog

Investigating 5XX errors from API Gateway Incident with the Datadog MCP Server and AWS DevOps Agent

When the alert triggers, AWS DevOps Agent automatically analyzes both Datadog metrics and API Gateway logs. Through the investigation chat interface, an engineer guides AWS DevOps Agent to examine the API Gateway configuration. The agent correlates API Gateway and AWS Lambda execution logs, quickly identifying error patterns.

This is a view in AWS DevOps Agent to allow for investigating an incident with AWS DevOps Agent and Datadog MCPFigure 4: Investigating an incident with AWS DevOps Agent and Datadog MCP

Resolving and prevention

AWS DevOps Agent helps identify potential misconfigurations in the Lambda and Amazon DynamoDB integration and implements immediate fixes. The agent documents all findings and actions in an incident record, backed by telemetry from both Datadog and AWS services. After resolution, AWS DevOps Agent generates a detailed analysis report with specific recommendations to prevent similar incidents. Teams can review and implement these suggestions through the Prevention feature in the AWS DevOps Agent web app.

This view show the investigation summary produced by AWS DevOps Agent. Here, we see the root cause for this sample incident. The root cause head line states that "1. DynamoDB table name misconfiguration - typo in environment variable". There is a longer description explaining this under it. The background for this view is plain white. Figure 5: Investigation summary produced by AWS DevOps Agent

Clean up

When you’re done using the integration, you can clean up your resources by following these steps:

  1. Delete your Agent Space from the AWS DevOps Agent console
  2. Remove the Datadog MCP Server connection from your settings
  3. Delete the IAM roles created for the Agent Space
  4. (Optional) If you created additional source account roles, remove those as well

Conclusion

The integration between Datadog MCP Server and AWS DevOps Agent reduces incident resolution time by automatically correlating data across your monitoring tools. Instead of manually switching between Datadog and AWS dashboards during incidents, teams can now get an AI-powered investigation that identifies root causes and suggests fixes. Early adopters report significant improvements in their incident response. Resolution times drop from hours to minutes, while on-call teams spend less time gathering data. Teams also see more consistent incident responses and improved root cause analysis through comprehensive data correlation. To learn more, check out the AWS DevOps Agent product page.

Datadog is an AWS Specialization Partner and AWS Marketplace Seller that has been building integrations with AWS services for over a decade, amassing a growing catalog of 100+ AWS and 1000+ built-in integrations. This new AWS DevOps Agent and Datadog MCP Server integration builds upon Datadog’s strong track record of AWS partnership success. If you’re not already using Datadog, you can get started with a 14-day free trial via the AWS Marketplace.

Sujatha Kuppuraju

Sujatha Kuppuraju is a Principal Solutions Architect at AWS, specializing in Cloud and, Generative AI Security. She collaborates with software companies’ leadership teams to architect secure, scalable solutions on AWS and guide strategic product development. Leveraging her expertise in cloud architecture and emerging technologies, Sujatha helps organizations optimize offerings, maintain robust security, and bring innovative products to market in an evolving tech landscape.

DhilipVenkatesh Uvarajan

DhilipVenkatesh Uvarajan is as an Enterprise Support Lead TAM within AWS Enterprise Support, specializing in Independent Software Vendors (ISVs) across the United States. In this role, Dhilip provides strategic technical guidance to help customers innovate, optimize their AWS architecture, and ensure the seamless operation of their business-critical applications on the AWS cloud. Beyond his professional endeavors, Dhilip is passionate about AI and Robotics, often exploring innovative projects in his spare time.

Nina Chen

Nina Chen is a Customer Solutions Manager at AWS specializing in leading software companies to leverage the power of the AWS cloud to accelerate their product innovation and growth. With over 4 years of experience working in the strategic Independent Software Vendor (ISV) vertical, Nina enjoys guiding ISV partners through their cloud transformation journeys, helping them optimize their cloud infrastructure, driving product innovation, and delivering exceptional customer experiences.

Omri Sass

Omri Sass is a Director of Product Management at Datadog, where he’s overseen the development and launch of a multitude of products and capabilities including Bits AI SRE and updog.ai. He is a keen advocate for good user experience and doing what’s right by users.

Cansu Berkem

Cansu Berkem is a Director of Product Management at Datadog, overseeing the company’s end-to-end incident response experience, including Incident Management, On-Call, Automations, and Bits AI SRE. Her products help engineers resolve incidents faster through AI-driven workflows, powered by Bits AI SRE as an autonomous incident investigator and supported by integration-rich incident management and paging flows.

Mohammad Jama

Mohammad Jama is a Product Marketing Manager at Datadog. He leads go-to-market for Datadog’s AWS integrations, working closely with product, marketing, and sales to help companies observe and secure their hybrid and AWS environments.

Amazon Bedrock adds reinforcement fine-tuning simplifying how developers build smarter, more accurate AI models

Post Syndicated from Donnie Prakoso original https://aws.amazon.com/blogs/aws/improve-model-accuracy-with-reinforcement-fine-tuning-in-amazon-bedrock/

Organizations face a challenging trade-off when adapting AI models to their specific business needs: settle for generic models that produce average results, or tackle the complexity and expense of advanced model customization. Traditional approaches force a choice between poor performance with smaller models or the high costs of deploying larger model variants and managing complex infrastructure. Reinforcement fine-tuning is an advanced technique that trains models using feedback instead of massive labeled datasets, but implementing it typically requires specialized ML expertise, complicated infrastructure, and significant investment—with no guarantee of achieving the accuracy needed for specific use cases.

Today, we’re announcing reinforcement fine-tuning in Amazon Bedrock, a new model customization capability that creates smarter, more cost-effective models that learn from feedback and deliver higher-quality outputs for specific business needs. Reinforcement fine-tuning uses a feedback-driven approach where models improve iteratively based on reward signals, delivering 66% accuracy gains on average over base models.

Amazon Bedrock automates the reinforcement fine-tuning workflow, making this advanced model customization technique accessible to everyday developers without requiring deep machine learning (ML) expertise or large labeled datasets.

How reinforcement fine-tuning works
Reinforcement fine-tuning is built on top of reinforcement learning principles to address a common challenge: getting models to consistently produce outputs that align with business requirements and user preferences.

While traditional fine-tuning requires large, labeled datasets and expensive human annotation, reinforcement fine-tuning takes a different approach. Instead of learning from fixed examples, it uses reward functions to evaluate and judge which responses are considered good for particular business use cases. This teaches models to understand what makes a quality response without requiring massive amounts of pre-labeled training data, making advanced model customization in Amazon Bedrock more accessible and cost-effective.

Here are the benefits of using reinforcement fine-tuning in Amazon Bedrock:

  • Ease of use – Amazon Bedrock automates much of the complexity, making reinforcement fine-tuning more accessible to developers building AI applications. Models can be trained using existing API logs in Amazon Bedrock or by uploading datasets as training data, eliminating the need for labeled datasets or infrastructure setup.
  • Better model performance – Reinforcement fine-tuning improves model accuracy by 66% on average over base models, enabling optimization for price and performance by training smaller, faster, and more efficient model variants. This works with Amazon Nova 2 Lite model, improving quality and price performance for specific business needs, with support for additional models coming soon.
  • Security – Data remains within the secure AWS environment throughout the entire customization process, mitigating security and compliance concerns.

The capability supports two complementary approaches to provide flexibility for optimizing models:

  • Reinforcement Learning with Verifiable Rewards (RLVR) uses rule-based graders for objective tasks like code generation or math reasoning.
  • Reinforcement Learning from AI Feedback (RLAIF) employs AI-based judges for subjective tasks like instruction following or content moderation.

Getting started with reinforcement fine-tuning in Amazon Bedrock
Let’s walk through creating a reinforcement fine-tuning job.

First, I access the Amazon Bedrock console. Then, I navigate to the Custom models page. I choose Create and then choose Reinforcement fine-tuning job.

I start by entering the name of this customization job and then select my base model. At launch, reinforcement fine-tuning supports Amazon Nova 2 Lite, with support for additional models coming soon.

Next, I need to provide training data. I can use my stored invocation logs directly, eliminating the need to upload separate datasets. I can also upload new JSONL files or select existing datasets from Amazon Simple Storage Service (Amazon S3). Reinforcement fine-tuning automatically validates my training dataset and supports the OpenAI Chat Completions data format. If I provide invocation logs in the Amazon Bedrock invoke or converse format, Amazon Bedrock automatically converts them to the Chat Completions format.

The reward function setup is where I define what constitutes a good response. I have two options here. For objective tasks, I can select Custom code and write custom Python code that gets executed through AWS Lambda functions. For more subjective evaluations, I can select Model as judge to use foundation models (FMs) as judges by providing evaluation instructions.

Here, I select Custom code, and I create a new Lambda function or use an existing one as a reward function. I can start with one of the provided templates and customize it for my specific needs.

I can optionally modify default hyperparameters like learning rate, batch size, and epochs.

For enhanced security, I can configure virtual private cloud (VPC) settings and AWS Key Management Service (AWS KMS) encryption to meet my organization’s compliance requirements. Then, I choose Create to start the model customization job.

During the training process, I can monitor real-time metrics to understand how the model is learning. The training metrics dashboard shows key performance indicators including reward scores, loss curves, and accuracy improvements over time. These metrics help me understand whether the model is converging properly and if the reward function is effectively guiding the learning process.

When the reinforcement fine-tuning job is completed, I can see the final job status on the Model details page.

Once the job is completed, I can deploy the model with a single click. I select Set up inference, then choose Deploy for on-demand.

Here, I provide a few details for my model.

After deployment, I can quickly evaluate the model’s performance using the Amazon Bedrock playground. This helps me to test the fine-tuned model with sample prompts and compare its responses against the base model to validate the improvements. I select Test in playground.

The playground provides an intuitive interface for rapid testing and iteration, helping me confirm that the model meets my quality requirements before integrating it into production applications.

Interactive demo
Learn more by navigating an interactive demo of Amazon Bedrock reinforcement fine-tuning in action.

Additional things to know
Here are key points to note:

  • Templates — There are seven ready-to-use reward function templates covering common use cases for both objective and subjective tasks.
  • Pricing — To learn more about pricing, refer to the Amazon Bedrock pricing page.
  • Security — Training data and custom models remain private and aren’t used to improve FMs for public use. It supports VPC and AWS KMS encryption for enhanced security.

Get started with reinforcement fine-tuning by visiting the reinforcement fine-tuning documentation and by accessing the Amazon Bedrock console.

Happy building!
— Donnie

Announcing replication support and Intelligent-Tiering for Amazon S3 Tables

Post Syndicated from Sébastien Stormacq original https://aws.amazon.com/blogs/aws/announcing-replication-support-and-intelligent-tiering-for-amazon-s3-tables/

Today, we’re announcing two new capabilities for Amazon S3 Tables: support for the new Intelligent-Tiering storage class that automatically optimizes costs based on access patterns, and replication support to automatically maintain consistent Apache Iceberg table replicas across AWS Regions and accounts without manual sync.

Organizations working with tabular data face two common challenges. First, they need to manually manage storage costs as their datasets grow and access patterns change over time. Second, when maintaining replicas of Iceberg tables across Regions or accounts, they must build and maintain complex architectures to track updates, manage object replication, and handle metadata transformations.

S3 Tables Intelligent-Tiering storage class
With the S3 Tables Intelligent-Tiering storage class, data is automatically tiered to the most cost-effective access tier based on access patterns. Data is stored in three low-latency tiers: Frequent Access, Infrequent Access (40% lower cost than Frequent Access), and Archive Instant Access (68% lower cost compared to Infrequent Access). After 30 days without access, data moves to Infrequent Access, and after 90 days, it moves to Archive Instant Access. This happens without changes to your applications or impact on performance.

Table maintenance activities, including compaction, snapshot expiration, and unreferenced file removal, operate without affecting the data’s access tiers. Compaction automatically processes only data in the Frequent Access tier, optimizing performance for actively queried data while reducing maintenance costs by skipping colder files in lower-cost tiers.

By default, all existing tables use the Standard storage class. When creating new tables, you can specify Intelligent-Tiering as the storage class, or you can rely on the default storage class configured at the table bucket level. You can set Intelligent-Tiering as the default storage class for your table bucket to automatically store tables in Intelligent-Tiering when no storage class is specified during creation.

Let me show you how it works
You can use the AWS Command Line Interface (AWS CLI) and the put-table-bucket-storage-class and get-table-bucket-storage-class commands to change or verify the storage tier of your S3 table bucket.

# Change the storage class
aws s3tables put-table-bucket-storage-class \
   --table-bucket-arn $TABLE_BUCKET_ARN  \
   --storage-class-configuration storageClass=INTELLIGENT_TIERING

# Verify the storage class
aws s3tables get-table-bucket-storage-class \
   --table-bucket-arn $TABLE_BUCKET_ARN  \

{ "storageClassConfiguration":
   { 
      "storageClass": "INTELLIGENT_TIERING"
   }
}

S3 Tables replication support
The new S3 Tables replication support helps you maintain consistent read replicas of your tables across AWS Regions and accounts. You specify the destination table bucket and the service creates read-only replica tables. It replicates all updates chronologically while preserving parent-child snapshot relationships. Table replication helps you build global datasets to minimize query latency for geographically distributed teams, meet compliance requirements, and provide data protection.

You can now easily create replica tables that deliver similar query performance as their source tables. Replica tables are updated within minutes of source table updates and support independent encryption and retention policies from their source tables. Replica tables can be queried using Amazon SageMaker Unified Studio or any Iceberg-compatible engine including DuckDB, PyIceberg, Apache Spark, and Trino.

You can create and maintain replicas of your tables through the AWS Management Console or APIs and AWS SDKs. You specify one or more destination table buckets to replicate your source tables. When you turn on replication, S3 Tables automatically creates read-only replica tables in your destination table buckets, backfills them with the latest state of the source table, and continually monitors for new updates to keep replicas in sync. This helps you meet time-travel and audit requirements while maintaining multiple replicas of your data.

Let me show you how it works
To show you how it works, I proceed in three steps. First, I create an S3 table bucket, create an Iceberg table, and populate it with data. Second, I configure the replication. Third, I connect to the replicated table and query the data to show you that changes are replicated.

For this demo, the S3 team kindly gave me access to an Amazon EMR cluster already provisioned. You can follow the Amazon EMR documentation to create your own cluster. They also created two S3 table buckets, a source and a destination for the replication. Again, the S3 Tables documentation will help you to get started.

I take a note of the two S3 Tables bucket Amazon Resource Names (ARNs). In this demo, I refer to these as the environment variables SOURCE_TABLE_ARN and DEST_TABLE_ARN.

First step: Prepare the source database

I start a terminal, connect to the EMR cluster, start a Spark session, create a table, and insert a row of data. The commands I use in this demo are documented in Accessing tables using the Amazon S3 Tables Iceberg REST endpoint.

sudo spark-shell \
--packages "org.apache.iceberg:iceberg-spark-runtime-3.5_2.12:1.4.1,software.amazon.awssdk:bundle:2.20.160,software.amazon.awssdk:url-connection-client:2.20.160" \
--master "local[*]" \
--conf "spark.sql.extensions=org.apache.iceberg.spark.extensions.IcebergSparkSessionExtensions" \
--conf "spark.sql.defaultCatalog=spark_catalog" \
--conf "spark.sql.catalog.spark_catalog=org.apache.iceberg.spark.SparkCatalog" \
--conf "spark.sql.catalog.spark_catalog.type=rest" \
--conf "spark.sql.catalog.spark_catalog.uri=https://s3tables.us-east-1.amazonaws.com/iceberg" \
--conf "spark.sql.catalog.spark_catalog.warehouse=arn:aws:s3tables:us-east-1:012345678901:bucket/aws-news-blog-test" \
--conf "spark.sql.catalog.spark_catalog.rest.sigv4-enabled=true" \
--conf "spark.sql.catalog.spark_catalog.rest.signing-name=s3tables" \
--conf "spark.sql.catalog.spark_catalog.rest.signing-region=us-east-1" \
--conf "spark.sql.catalog.spark_catalog.io-impl=org.apache.iceberg.aws.s3.S3FileIO" \
--conf "spark.hadoop.fs.s3a.aws.credentials.provider=org.apache.hadoop.fs.s3a.SimpleAWSCredentialProvider" \
--conf "spark.sql.catalog.spark_catalog.rest-metrics-reporting-enabled=false"

spark.sql("""
CREATE TABLE s3tablesbucket.test.aws_news_blog (
customer_id STRING,
address STRING
) USING iceberg
""")

spark.sql("INSERT INTO s3tablesbucket.test.aws_news_blog VALUES ('cust1', 'val1')")

spark.sql("SELECT * FROM s3tablesbucket.test.aws_news_blog LIMIT 10").show()
+-----------+-------+
|customer_id|address|
+-----------+-------+
|      cust1|   val1|
+-----------+-------+

So far, so good.

Second step: Configure the replication for S3 Tables

Now, I use the CLI on my laptop to configure the S3 table bucket replication.

Before doing so, I create an AWS Identity and Access Management (IAM) policy to authorize the replication service to access my S3 table bucket and encryption keys. Refer to the S3 Tables replication documentation for the details. The permissions I used for this demo are:

{
    "Version": "2012-10-17",
    "Statement": [
        {
            "Effect": "Allow",
            "Action": [
                "s3:*",
                "s3tables:*",
                "kms:DescribeKey",
                "kms:GenerateDataKey",
                "kms:Decrypt"
            ],
            "Resource": "*"
        }
    ]
}

After having created this IAM policy, I can now proceed and configure the replication:

aws s3tables-replication put-table-replication \
--table-arn ${SOURCE_TABLE_ARN} \
--configuration  '{
    "role": "arn:aws:iam::<MY_ACCOUNT_NUMBER>:role/S3TableReplicationManualTestingRole", 
    "rules":[
        {
            "destinations": [
                {
                    "destinationTableBucketARN": "${DST_TABLE_ARN}"
                }]
        }
    ]

The replication starts automatically. Updates are typically replicated within minutes. The time it takes to complete depends on the volume of data in the source table.

Third step: Connect to the replicated table and query the data

Now, I connect to the EMR cluster again, and I start a second Spark session. This time, I use the destination table.

S3 Tables replication - destination table

To verify the replication works, I insert a second row of data on the source table.

spark.sql("INSERT INTO s3tablesbucket.test.aws_news_blog VALUES ('cust2', 'val2')")

I wait a few minutes for the replication to trigger. I follow the status of the replication with the get-table-replication-status command.

aws s3tables-replication get-table-replication-status \
--table-arn ${SOURCE_TABLE_ARN} \
{
    "sourceTableArn": "arn:aws:s3tables:us-east-1:012345678901:bucket/manual-test/table/e0fce724-b758-4ee6-85f7-ca8bce556b41",
    "destinations": [
        {
            "replicationStatus": "pending",
            "destinationTableBucketArn": "arn:aws:s3tables:us-east-1:012345678901:bucket/manual-test-dst",
            "destinationTableArn": "arn:aws:s3tables:us-east-1:012345678901:bucket/manual-test-dst/table/5e3fb799-10dc-470d-a380-1a16d6716db0",
            "lastSuccessfulReplicatedUpdate": {
                "metadataLocation": "s3://e0fce724-b758-4ee6-8-i9tkzok34kum8fy6jpex5jn68cwf4use1b-s3alias/e0fce724-b758-4ee6-85f7-ca8bce556b41/metadata/00001-40a15eb3-d72d-43fe-a1cf-84b4b3934e4c.metadata.json",
                "timestamp": "2025-11-14T12:58:18.140281+00:00"
            }
        }
    ]
}

When replication status shows ready, I connect to the EMR cluster and I query the destination table. Without surprise, I see the new row of data.

S3 Tables replication - target table is up to date

Additional things to know
Here are a couple of additional points to pay attention to:

  • Replication for S3 Tables supports both Apache Iceberg V2 and V3 table formats, giving you flexibility in your table format choice.
  • You can configure replication at the table bucket level, making it straightforward to replicate all tables under that bucket without individual table configurations.
  • Your replica tables maintain the storage class you choose for your destination tables, which means you can optimize for your specific cost and performance needs.
  • Any Iceberg-compatible catalog can directly query your replica tables without additional coordination—they only need to point to the replica table location. This gives you flexibility in choosing query engines and tools.

Pricing and availability
You can track your storage usage by access tier through AWS Cost and Usage Reports and Amazon CloudWatch metrics. For replication monitoring, AWS CloudTrail logs provide events for each replicated object.

There are no additional charges to configure Intelligent-Tiering. You only pay for storage costs in each tier. Your tables continue to work as before, with automatic cost optimization based on your access patterns.

For S3 Tables replication, you pay the S3 Tables charges for storage in the destination table, for replication PUT requests, for table updates (commits), and for object monitoring on the replicated data. For cross-Region table replication, you also pay for inter-Region data transfer out from Amazon S3 to the destination Region based on the Region pair.

As usual, refer to the Amazon S3 pricing page for the details.

Both capabilities are available today in all AWS Regions where S3 Tables are supported.

To learn more about these new capabilities, visit the Amazon S3 Tables documentation or try them in the Amazon S3 console today. Share your feedback through AWS re:Post for Amazon S3 or through your AWS Support contacts.

— seb

Amazon Bedrock AgentCore adds quality evaluations and policy controls for deploying trusted AI agents

Post Syndicated from Danilo Poccia original https://aws.amazon.com/blogs/aws/amazon-bedrock-agentcore-adds-quality-evaluations-and-policy-controls-for-deploying-trusted-ai-agents/

Today, we’re announcing new capabilities in Amazon Bedrock AgentCore to further remove barriers holding AI agents back from production. Organizations across industries are already building on AgentCore, the most advanced agentic platform to build, deploy, and operate highly capable agents securely at any scale. In just 5 months since preview, the AgentCore SDK has been downloaded over 2 million times. For example:

  • PGA TOUR, a pioneer and innovation leader in sports has built a multi-agent content generation system to create articles for their digital platforms. The new solution, built on AgentCore, enables the PGA TOUR to provide comprehensive coverage for every player in the field, by increasing content writing speed by 1,000 percent while achieving a 95 percent reduction in costs.
  • Independent software vendors (ISVs) like Workday are building the software of the future on AgentCore. AgentCore Code Interpreter provides Workday Planning Agent with secure data protection and essential features for financial data exploration. Users can analyze financial and operational data through natural language queries, making financial planning intuitive and self-driven. This capability reduces time spent on routine planning analysis by 30 percent, saving approximately 100 hours per month.
  • Grupo Elfa, a Brazilian distributor and retailer, relies on AgentCore Observability for complete audit traceability and real-time metrics of their agents, transforming their reactive processes into proactive operations. Using this unified platform, their sales team can handle thousands of daily price quotes while the organization maintains full visibility of agent decisions, helping achieve 100 percent traceability of agent decisions and interactions, and reduced problem resolution time by 50 percent.

As organizations scale their agent deployments, they face challenges around implementing the right boundaries and quality checks to confidently deploy agents. The autonomy that makes agents powerful also makes them hard to confidently deploy at scale, as they might access sensitive data inappropriately, make unauthorized decisions, or take unexpected actions. Development teams must balance enabling agent autonomy while ensuring they operate within acceptable boundaries and with the quality you require to put them in front of customers and employees.

The new capabilities available today take the guesswork out of this process and help you build and deploy trusted AI agents with confidence:

  • Policy in AgentCore (Preview) – Defines clear boundaries for agent actions by intercepting AgentCore Gateway tool calls before they run using policies with fine-grained permissions.
  • AgentCore Evaluations (Preview) – Monitors the quality of your agents based on real-world behavior using built-in evaluators for dimensions such as correctness and helpfulness, plus custom evaluators for business-specific requirements.

We’re also introducing features that expand what agents can do:

  • Episodic functionality in AgentCore Memory – A new long-term strategy that helps agents learn from experiences and adapt solutions across similar situations for improved consistency and performance in similar future tasks.
  • Bidirectional streaming in AgentCore Runtime – Deploys voice agents where both users and agents can speak simultaneously following a natural conversation flow.

Policy in AgentCore for precise agent control
Policy gives you control over the actions agents can take and are applied outside of the agent’s reasoning loop, treating agents as autonomous actors whose decisions require verification before reaching tools, systems, or data. It integrates with AgentCore Gateway to intercept tool calls as they happen, processing requests while maintaining operational speed, so workflows remain fast and responsive.

You can create policies using natural language or directly use Cedar—an open source policy language for fine-grained permissions—simplifying the process to set up, understand, and audit rules without writing custom code. This approach makes policy creation accessible to development, security, and compliance teams who can create, understand, and audit rules without specialized coding knowledge.

The policies operate independently of how the agent was built or which model it uses. You can define which tools and data agents can access—whether they are APIs, AWS Lambda functions, Model Context Protocol (MCP) servers, or third-party services—what actions they can perform, and under what conditions.

Teams can define clear policies once and apply them consistently across their organization. With policies in place, developers gain the freedom to create innovative agentic experiences, and organizations can deploy their agents to act autonomously while knowing they’ll stay within defined boundaries and compliance requirements.

Using Policy in AgentCore
You can start by creating a policy engine in the new Policy section of the AgentCore console and associate it with one or more AgentCore gateways.

A policy engine is a collection of policies that are evaluated at the gateway endpoint. When associating a gateway with a policy engine, you can choose whether to enforce the result of the policy—effectively permitting or denying access to a tool call—or to only emit logs. Using logs helps you test and validate a policy before enabling it in production.

Then, you can define the policies to apply to have granular control over access to the tools offered by the associated AgentCore gateways.

Amazon Bedrock AgentCore Policy console

To create a policy, you can start with a natural language description (that should include information of the authentication claims to use) or directly edit Cedar code.

Amazon Bedrock AgentCore Policy add

Natural language-based policy authoring provides a more accessible way for you to create fine-grained policies. Instead of writing formal policy code, you can describe rules in plain English. The system interprets your intent, generates candidate policies, validates them against the tool schema, and uses automated reasoning to check safety conditions—identifying prompts that are overly permissive, overly restrictive, or contain conditions that can never be satisfied.

Unlike generic large language model (LLM) translations, this feature understands the structure of your tools and generates policies that are both syntactically correct and semantically aligned with your intent, while flagging rules that cannot be enforced. It is also available as a Model Context Protocol (MCP) server, so you can author and validate policies directly in your preferred AI-assisted coding environment as part of your normal development workflow. This approach reduces onboarding time and helps you write high-quality authorization rules without needing Cedar expertise.

The following sample policy uses information from the OAuth claims in the JWT token used to authenticate to an AgentCore gateway (for the role) and the arguments passed to the tool call (context.input) to validate access to the tool processing a refund. Only an authenticated user with the refund-agent role can access the tool but for amounts (context.input.amount) lower than $200 USD.

permit(
  principal is AgentCore::OAuthUser,
  action == AgentCore::Action::"RefundTool__process_refund",
  resource == AgentCore::Gateway::"<GATEWAY_ARN>"
)
when {
  principal.hasTag("role") &&
  principal.getTag("role") == "refund-agent" &&
  context.input.amount < 200
};

AgentCore Evaluations for continuous, real-time quality intelligence
AgentCore Evaluations is a fully managed service that helps you continuously monitor and analyze agent performance based on real-world behavior. With AgentCore Evaluations, you can use built-in evaluators for common quality dimensions such as correctness, helpfulness, tool selection accuracy, safety, goal success rate, and context relevance. You can also create custom model-based scoring systems configured with your choice of prompt and model for business-tailored scoring while the service samples live agent interactions and scores them continuously.

All results from AgentCore Evaluations are visualized in Amazon CloudWatch alongside AgentCore Observability insights, providing one place for unified monitoring. You can also set up alerts and alarms on the evaluation scores to proactively monitor agent quality and respond when metrics fall outside acceptable thresholds.

You can use AgentCore Evaluations during the testing phase where you can check an agent against the baseline before deployment to stop faulty versions from reaching users, and in production for continuous improvement of your agents. When quality metrics drop below defined thresholds—such as a customer service agent satisfaction declining or politeness scores dropping by more than 10 percent over an 8-hour period—the system triggers immediate alerts, helping to detect and address quality issues faster.

Using AgentCore Evaluations
You can create an online evaluation in the new Evaluations section of the AgentCore console. You can use as data source an AgentCore agent endpoint or a CloudWatch log group used by an external agent. For example, I use here the same sample customer support agent I shared when we introduced AgentCore in preview.

Amazon Bedrock AgentCore Evaluations source

Then, you can select the evaluators to use, including custom evaluators that you can define starting from the existing templates or build from scratch.

Amazon Bedrock AgentCore Evaluations source

For example, for a customer support agent, you can select metrics such as:

  • Correctness – Evaluates whether the information in the agent’s response is factually accurate
  • Faithfulness – Evaluates whether information in the response is supported by provided context/sources
  • Helpfulness – Evaluates from user’s perspective how useful and valuable the agent’s response is
  • Harmfulness – Evaluates whether the response contains harmful content
  • Stereotyping – Detects content that makes generalizations about individuals or groups

The evaluators for tool selection and tool parameter accuracy can help you understand if an agent is choosing the right tool for a task and extracting the correct parameters from the user queries.

To complete the creation of the evaluation, you can choose the sampling rate and optional filters. For permissions, you can create a new AWS Identity and Access Management (IAM) service role or pass an existing one.

Amazon Bedrock AgentCore Evaluations create

The results are published, as they are evaluated, on Amazon CloudWatch in the AgentCore Observability dashboard. You can choose any of the bar chart sections to see the corresponding traces and gain deeper insight into the requests and responses behind that specific evaluation.

Amazon AgentCore Evaluations results

Because the results are in CloudWatch, you can use all of its feature to create, for example, alarms and automations.

Creating custom evaluators in AgentCore Evaluations
Custom evaluators allow you to define business-specific quality metrics tailored to your agent’s unique requirements. To create a custom evaluator, you provide the model to use as a judge, including inference parameters such as temperature and max output tokens, and a tailored prompt with the judging instructions. You can start from the prompt used by one of the built-in evaluators or enter a new one.

AgentCore Evaluations create custom evaluator

Then, you define the scale to produce in output. It can be either numeric values or custom text labels that you define. Finally, you configure whether the evaluation is computed by the model on single traces, full sessions, or for each tool call.

AgentCore Evaluations custom evaluator scale

AgentCore Memory episodic functionality for experience-based learning
AgentCore Memory, a fully managed service that gives AI agents the ability to remember past interactions, now includes a new long-term memory strategy that gives agents the ability to learn from past experiences and apply those lessons to provide more helpful assistance in future interactions.

Consider booking travel with an agent: over time, the agent learns from your booking patterns—such as the fact that you often need to move flights to later times when traveling for work due to client meetings. When you start your next booking involving client meetings, the agent proactively suggests flexible return options based on these learned patterns. Just like an experienced assistant who learns your specific travel habits, agents with episodic memory can now recognize and adapt to your individual needs.

When you enable the new episodic functionality, AgentCore Memory captures structured episodes that record the context, reasoning process, actions taken, and outcomes of agent interactions, while a reflection agent analyzes these episodes to extract broader insights and patterns. When facing similar tasks, agents can retrieve these learnings to improve decision-making consistency and reduce processing time. This reduces the need for custom instructions by including in the agent context only the specific learnings an agent needs to complete a task instead of a long list of all possible suggestions.

AgentCore Runtime bidirectional streaming for more natural conversations
With AgentCore Runtime, you can deploy agentic applications with few lines of code. To simplify deploying conversational experiences that feel natural and responsive, AgentCore Runtime now supports bidirectional streaming. This capability enables voice agents to listen and adapt while users speak, so that people can interrupt agents mid-response and have the agent immediately adjust to the new context—without waiting for the agent to finish its current output. Rather than traditional turn-based interaction where users must wait for complete responses, bidirectional streaming creates flowing, natural conversations where agents dynamically change their response based on what the user is saying.

Building these conversational experiences from the ground up requires significant engineering effort to handle the complex flow of simultaneous communication. Bidirectional streaming simplifies this by managing the infrastructure needed for agents to process input while generating output, handling interruptions gracefully, and maintaining context throughout dynamic conversation shifts. You can now deploy agents that naturally adapt to the fluid nature of human conversation—supporting mid-thought interruptions, context switches, and clarifications without losing the thread of the interaction.

Things to know
Amazon Bedrock AgentCore, including the preview of Policy, is available in the US East (Ohio, N. Virginia), US West (Oregon), Asia Pacific (Mumbai, Singapore, Sydney, Tokyo), and Europe (Frankfurt, Ireland) AWS Regions . The preview of AgentCore Evaluations is available in the US East (Ohio, N. Virginia), US West (Oregon), Asia Pacific (Sydney), and Europe (Frankfurt) Regions. For Regional availability and future roadmap, visit AWS Capabilities by Region.

With AgentCore, you pay for what you use with no upfront commitments. For detailed pricing information, visit the Amazon Bedrock pricing page. AgentCore is also a part of the AWS Free Tier that new AWS customers can use to get started at no cost and explore key AWS services.

These new features work with any open source framework such as CrewAI, LangGraph, LlamaIndex, and Strands Agents, and with any foundation model. AgentCore services can be used together or independently, and you can get started using your favorite AI-assisted development environment with the AgentCore open source MCP server.

To learn more and get started quickly, visit the AgentCore Developer Guide.

— Danilo

Introducing Database Savings Plans for AWS Databases

Post Syndicated from Betty Zheng (郑予彬) original https://aws.amazon.com/blogs/aws/introducing-database-savings-plans-for-aws-databases/

Since Amazon Web Services (AWS) introduced Savings Plans, customers have been able to lower the cost of running sustained workloads while maintaining the flexibility to manage usage across accounts, resource types, and AWS Regions. Today, we’re extending this flexible pricing model to AWS managed database services with the launch of Database Savings Plans, which help customers reduce database costs by up to 35% when they commit to a consistent amount of usage ($/hour) over a 1-year term. Savings automatically apply each hour to eligible usage across supported database services, and any additional usage beyond the commitment is billed at on-demand rates.

As organizations build and manage data-driven and AI applications, they often use different database services, engines and deployment types, including instance-based and serverless options, to meet evolving business needs. Database Savings Plans provide the flexibility to choose how workloads run while maintaining cost efficiency. If customers are in the middle of a migration or modernization effort, they can switch database engines and adjust deployment types, such as from provisioned to serverless as part of ongoing cost optimization, while continuing to receive discounted rates. If a customer’s business expands globally, they can also shift usage across AWS Regions and continue to benefit from the same commitment. By applying a consistent hourly commitment, customers can maintain predictable spend even as usage patterns evolve and analyze coverage and utilization using familiar cost management tools.

New Savings Plans
Each plan defines where pricing applies, the range of available discounts, and the level of flexibility provided across supported database engines, instance families, sizes, deployment options, or AWS Regions.

The hourly commitment automatically applies to all eligible usage regardless of Region, with support for Amazon Aurora, Amazon Relational Database Service (Amazon RDS), Amazon DynamoDB, Amazon ElastiCache, Amazon DocumentDB (with MongoDB compatibility), Amazon Neptune, Amazon Keyspaces (for Apache Cassandra), Amazon Timestream, and AWS Database Migration Service (AWS DMS). As new eligible database offerings, instance types, or Regions become available, Savings Plans will automatically apply to that usage.

Discounts vary by deployment model and service type. Serverless deployments provide up to 35% savings compared to on-demand rates. Provisioned instances across supported database services deliver up to 20% savings. For Amazon DynamoDB and Amazon Keyspaces, on-demand throughput workloads receive up to 18% savings, and provisioned capacity offers up to 12%. Together, these savings help customers optimize costs while maintaining consistent coverage for database usage. To learn more about the pricing and eligible usage, visit the Database Savings Plans pricing page.

Purchasing Database Savings Plans
AWS Billing and Cost Management Console helps you choose Savings Plans and guides you through the purchase process. You can get started from the AWS Management Console or use the AWS Command Line Interface (AWS CLI) and the API. There are two ways to evaluate Database Savings Plans purchases, in the Recommendations view and in the Purchase Analyzer.

Recommendations – are automatically generated from your recent on-demand usage. To reach the Recommendations view in the Billing and Cost Management console, choose Savings and Commitments, Savings Plans, and Recommendations in the navigation pane. In the Recommendations view, select Database Savings Plans and configure the Recommendation options. AWS Savings Plans recommendations analyze your historical on-demand usage to identify the hourly commitment that delivers the highest overall savings.

The Purchase Analyzer – is designed for modeling custom commitment levels. If you want to purchase a different amount than the recommended commitment on the Purchase Analyzer page, select Database Savings Plans and configure Lookback period and Hourly commitment to simulate alternative commitment levels and see the projected impact on Cost, Coverage, and Utilization.

This way is preferred if your purchasing strategy includes smaller, incremental commitments over time or if you expect future usage changes that could affect your ideal purchase amount.

After reviewing the recommendations or running simulations in Savings Plans Recommendations or Savings Plans Purchase Analyzer, choose Add to cart to proceed with your chosen commitment. If you prefer to purchase directly, you can also navigate to the Purchase Savings Plans page. The console updates estimated discounts and coverage in real time as you adjust each setting, so you can evaluate the impact before completing your order.

You can learn more about how to choose and purchase Database Saving Plans by visiting the Savings Plans User Guide documents.

Now available
Database Savings Plans are available in all AWS Regions outside of China. Give them a try and start shaping your database strategy with more flexibility and predictable costs.

– Betty

Amazon S3 Vectors now generally available with increased scale and performance

Post Syndicated from Sébastien Stormacq original https://aws.amazon.com/blogs/aws/amazon-s3-vectors-now-generally-available-with-increased-scale-and-performance/

Today, I’m excited to announce that Amazon S3 Vectors is now generally available with significantly increased scale and production-grade performance capabilities. S3 Vectors is the first cloud object storage with native support to store and query vector data. You can use it to help you reduce the total cost of storing and querying vectors by up to 90% when compared to specialized vector database solutions.

Since we announced the preview of S3 Vectors in July, I’ve been impressed by how quickly you adopted this new capability to store and query vector data. In just over four months, you created over 250,000 vector indexes and ingested more than 40 billion vectors, performing over 1 billion queries (as of November 28th).

You can now store and search across up to 2 billion vectors in a single index, that’s up to 20 trillion vectors in a vector bucket and a 40x increase from 50 million per index during preview. This means that you can consolidate your entire vector dataset into one index, removing the need to shard across multiple smaller indexes or implement complex query federation logic.

Query performance has been optimized. Infrequent queries continue to return results in under one second, with more frequent queries now resulting in latencies around 100ms or less, making it well-suited for interactive applications such as conversational AI and multi-agent workflows. You can also retrieve up to 100 search results per query, up from 30 previously, providing more comprehensive context for retrieval augmented generation (RAG) applications.

The write performance has also improved substantially, with support for up to 1,000 PUT transactions per second when streaming single-vector updates into your indexes, delivering significantly higher write throughput for small batch sizes. This higher throughput supports workloads where new data must be immediately searchable, helping you ingest small data corpora quickly or handle many concurrent sources writing simultaneously to the same index.

The fully serverless architecture removes infrastructure overhead—there’s no infrastructure to set up or resources to provision. You pay for what you use as you store and query vectors. This AI-ready storage provides you with quick access to any amount of vector data to support your complete AI development lifecycle, from initial experimentation and prototyping through to large-scale production deployments. S3 Vectors now provides the scale and performance needed for production workloads across AI agents, inference, semantic search, and RAG applications.

Two key integrations that were launched in preview are now generally available. You can use S3 Vectors as a vector storage engine for Amazon Bedrock Knowledge Base. In particular, you can use it to build RAG applications with production-grade scale and performance. Moreover, S3 Vectors integration with Amazon OpenSearch is now generally available, so that you can use S3 Vectors as your vector storage layer while using OpenSearch for search and analytics capabilities.

You can now use S3 Vectors in 14 AWS Regions, expanding from five AWS Regions during the preview.

Let’s see how it works
In this post, I demonstrate how to use S3 Vectors through the AWS Console and CLI.

First, I create an S3 Vector bucket and an index.

echo "Creating S3 Vector bucket..."
aws s3vectors create-vector-bucket \
    --vector-bucket-name "$BUCKET_NAME"

echo "Creating vector index..."
aws s3vectors create-index \
    --vector-bucket-name "$BUCKET_NAME" \
    --index-name "$INDEX_NAME" \
    --data-type "float32" \
    --dimension "$DIMENSIONS" \
    --distance-metric "$DISTANCE_METRIC" \
    --metadata-configuration "nonFilterableMetadataKeys=AMAZON_BEDROCK_TEXT,AMAZON_BEDROCK_METADATA"

The dimension metric must match the dimension of the model used to compute the vectors. The distance metric indicates to the algorithm to compute the distance between vectors. S3 Vectors supports cosine and euclidian distances.

I can also use the console to create the bucket. We’ve added the capability to configure encryption parameters at creation time. By default, indexes use the bucket-level encryption, but I can override bucket-level encryption at the index level with a custom AWS Key Management Service (AWS KMS) key.

I also can add tags for the vector bucket and vector index. Tags at the vector index help with access control and cost allocation.

S3 Vector console - create

And I can now manage Properties and Permissions directly in the console.

S3 Vector console - properties

S3 Vector console - create

Similarly, I define Non-filterable metadata and I configure Encryption parameters for the vector index.

S3 Vector console - create index

Next, I create and store the embeddings (vectors). For this demo, I ingest my constant companion: the AWS Style Guide. This is an 800-page document that describes how to write posts, technical documentation, and articles at AWS.

I use Amazon Bedrock Knowledge Bases to ingest the PDF document stored on a general purpose S3 bucket. Amazon Bedrock Knowledge Bases reads the document and splits it in pieces called chunks. Then, it computes the embeddings for each chunk with the Amazon Titan Text Embeddings model and it stores the vectors and their metadata on my newly created vector bucket. The detailed steps for that process are out of the scope of this post, but you can read the instructions in the documentation.

When querying vectors, you can store up to 50 metadata keys per vector, with up to 10 marked as non-filterable. You can use the filterable metadata keys to filter query results based on specific attributes. Therefore, you can combine vector similarity search with metadata conditions to narrow down results. You can also store more non-filterable metadata for larger contextual information. Amazon Bedrock Knowledge Bases computes and stores the vectors. It also adds large metadata (the chunk of the original text). I exclude this metadata from the searchable index.

There are other methods to ingest your vectors. You can try the S3 Vectors Embed CLI, a command line tool that helps you generate embeddings using Amazon Bedrock and store them in S3 Vectors through direct commands. You can also use S3 Vectors as a vector storage engine for OpenSearch.

Now I’m ready to query my vector index. Let’s imagine I wonder how to write “open source”. Is it “open-source”, with a hyphen, or “open source” without a hyphen? Should I use uppercase or not? I want to search the relevant sections of the AWS Style Guide relative to “open source.”

# 1. Create embedding request
echo '{"inputText":"Should I write open source or open-source"}' | base64 | tr -d '\n' > body_encoded.txt

# 2. Compute the embeddings with Amazon Titan Embed model
aws bedrock-runtime invoke-model \
  --model-id amazon.titan-embed-text-v2:0 \
  --body "$(cat body_encoded.txt)" \
  embedding.json

# Search the S3 Vectors index for similar chunks
vector_array=$(cat embedding.json | jq '.embedding') && \
aws s3vectors query-vectors \
  --index-arn "$S3_VECTOR_INDEX_ARN" \
  --query-vector "{\"float32\": $vector_array}" \
  --top-k 3 \
  --return-metadata \
  --return-distance | jq -r '.vectors[] | "Distance: \(.distance) | Source: \(.metadata."x-amz-bedrock-kb-source-uri" | split("/")[-1]) | Text: \(.metadata.AMAZON_BEDROCK_TEXT[0:100])..."'

The first result shows this JSON:

        {
            "key": "348e0113-4521-4982-aecd-0ee786fa4d1d",
            "metadata": {
                "x-amz-bedrock-kb-data-source-id": "0SZY6GYPVS",
                "x-amz-bedrock-kb-source-uri": "s3://sst-aws-docs/awsstyleguide.pdf",
                "AMAZON_BEDROCK_METADATA": "{\"createDate\":\"2025-10-21T07:49:38Z\",\"modifiedDate\":\"2025-10-23T17:41:58Z\",\"source\":{\"sourceLocation\":\"s3://sst-aws-docs/awsstyleguide.pdf\"",
                "AMAZON_BEDROCK_TEXT": "[redacted] open source (adj., n.) Two words. Use open source as an adjective (for example, open source software), or as a noun (for example, the code throughout this tutorial is open source). Don't use open-source, opensource, or OpenSource. [redacted]",
                "x-amz-bedrock-kb-document-page-number": 98.0
            },
            "distance": 0.63120436668396
        }

It finds the relevant section in the AWS Style Guide. I must write “open source” without a hyphen. It even retrieved the page number in the original document to help me cross-check the suggestion with the relevant paragraph in the source document.

One more thing
S3 Vectors has also expanded its integration capabilities. You can now use AWS CloudFormation to deploy and manage your vector resources, AWS PrivateLink for private network connectivity, and resource tagging for cost allocation and access control.

Pricing and availability
S3 Vectors is now available in 14 AWS Regions, adding Asia Pacific (Mumbai, Seoul, Singapore, Tokyo), Canada (Central), and Europe (Ireland, London, Paris, Stockholm) to the existing five Regions from preview (US East (Ohio, N. Virginia), US West (Oregon), Asia Pacific (Sydney), and Europe (Frankfurt))

Amazon S3 Vectors pricing is based on three dimensions. PUT pricing is calculated based on the logical GB of vectors you upload, where each vector includes its logical vector data, metadata, and key. Storage costs are determined by the total logical storage across your indexes. Query charges include a per-API charge plus a $/TB charge based on your index size (excluding non-filterable metadata). As your index scales beyond 100,000 vectors, you benefit from lower $/TB pricing. As usual, the Amazon S3 pricing page has the details.

To get started with S3 Vectors, visit the Amazon S3 console. You can create vector indexes, start storing your embeddings, and begin building scalable AI applications. For more information, check out the Amazon S3 User Guide or the AWS CLI Command Reference.

I look forward to seeing what you build with these new capabilities. Please share your feedback through AWS re:Post or your usual AWS Support contacts.

— seb

AWS DevOps Agent helps you accelerate incident response and improve system reliability (preview)

Post Syndicated from Sébastien Stormacq original https://aws.amazon.com/blogs/aws/aws-devops-agent-helps-you-accelerate-incident-response-and-improve-system-reliability-preview/

Today, we’re announcing the public preview of AWS DevOps Agent, a frontier agent that helps you respond to incidents, identify root causes, and prevent future issues through systematic analysis of past incidents and operational patterns.

Frontier agents represent a new class of AI agents that are autonomous, massively scalable, and work for hours or days without constant intervention.

When production incidents occur, on-call engineers face significant pressure to quickly identify root causes while managing stakeholder communications. They must analyze data across multiple monitoring tools, review recent deployments, and coordinate response teams. After service restoration, teams often lack bandwidth to transform incident learnings into systematic improvements.

AWS DevOps Agent is your always-on, autonomous on-call engineer. When issues arise, it automatically correlates data across your operational toolchain, from metrics and logs to recent code deployments in GitHub or GitLab. It identifies probable root causes and recommends targeted mitigations, helping reduce mean time to resolution. The agent also manages incident coordination, using Slack channels for stakeholder updates and maintaining detailed investigation timelines.

To get started, you connect AWS DevOps Agent to your existing tools through the AWS Management Console. The agent works with popular services such as Amazon CloudWatch, Datadog, Dynatrace, New Relic, and Splunk for observability data, while integrating with GitHub Actions and GitLab CI/CD to track deployments and their impact on your cloud resources. Through the bring your own (BYO) Model Context Protocol (MCP) server capability, you can also integrate additional tools such as your organization’s custom tools, specialized platforms or open source observability solutions, such as Grafana and Prometheus into your investigations.

The agent acts as a virtual team member and can be configured to automatically respond to incidents from your ticketing systems. It includes built-in support for ServiceNow, and through configurable webhooks, can respond to events from other incident management tools like PagerDuty. As investigations progress, the agent updates tickets and relevant Slack channels with its findings. All of this is powered by an intelligent application topology the agent builds—a comprehensive map of your system components and their interactions, including deployment history that helps identify potential deployment-related causes during investigations.

Let me show you how it works
To show you how it works, I deployed a straigthforward AWS Lambda function that intentionally generates errors when invoked. I deployed it in an AWS CloudFormation stack.

Step 1: Create an Agent Space

An Agent Space defines the scope of what AWS DevOps Agent can access as it performs tasks.

You can organize Agent Spaces based on your operational model. Some teams align an Agent Space with a single application, others create one per on-call team managing multiple services, and some organizations use a centralized approach. For this demonstration, I’ll show you how to create an Agent Space for a single application. This setup helps isolate investigations and resources for that specific application, making it easier to track and analyze incidents within its context.

In the AWS DevOps Agent section of the AWS Management Console, I select Create Agent Space, enter a name for this space and create the AWS Identity and Access Management (IAM) roles it uses to introspect AWS resources in my or others’ AWS accounts.

AWS DevOps Agent - Create an Agent SpaceFor this demo, I choose to enable the AWS DevOps Agent web app; more about this later. This can be done at a later stage.

When ready, I choose Create.

AWS DevOps Agent - Enable Web AppAfter it has been created, I choose the Topology tab.

This view shows the key resources, entities, and relationships AWS DevOps Agent has selected as a foundation for performing its tasks efficiently. It doesn’t represent everything AWS DevOps Agent can access or see, only what the Agent considers most relevant right now. By default, the Topology includes the AWS resources that are contained in my account. As your agent completes more tasks, it will discover and add new resources to this list.

AWS DevOps Agent - Topology

Step 2: Configure the AWS DevOps web app for the operators

The AWS DevOps Agent web app provides a web interface for on-call engineers to manually trigger investigations, view investigation details including relevant topology elements, steer investigations, and ask questions about an investigation.

I can access the web app directly from my Agent Space in the AWS console by choosing the Operator access link. Alternatively, I can use AWS IAM Identity Center to configure user access for my team. IAM Identity Center lets me manage users and groups directly or connect to an identity provider (IdP), providing a centralized way to control who can access the AWS DevOps Agent web app.

AWS DevOps Agent - web app access

At this stage, I have an Agent Space all set up to focus investigations and resources for this specific application, and I’ve enabled the DevOps team to initiate investigations using the web app.

Now that the one-time setup for this application is done, I start invoking the faulty Lambda function. It generates errors at each invocation. The CloudWatch alarm associated with the Lambda errors count turns on to ALARM state. In real life, you might receive an alert from external services, such as ServiceNow. You can configure AWS DevOps Agent to automatically start investigations when receiving such alerts.

For this demo, I manually start the investigation by selecting Start Investigation.

You can also choose from several preconfigured starting points to quickly begin your investigation: Latest alarm to investigate your most recent triggered alarm and analyze the underlying metrics and logs to determine the root cause, High CPU usage to investigate high CPU utilization metrics across your compute resources and identify which processes or services are consuming excessive resources, or Error rate spike to investigate the recent increase in application error rates by analyzing metrics, application logs, and identifying the source of failures.

AWS DevOps Agent - web app

I enter some information, such as Investigation details, Investigation starting point, the Date and time of the incident, the AWS Account ID for the incident.

- web app - start investigation

In the AWS DevOps Agent web app, you can watch the investigation unfold in real time. The agent identifies the application stack. It correlates metrics from CloudWatch, examines logs from CloudWatch Logs or external sources, such as Splunk, reviews recent code changes from GitHub, and analyzes traces from AWS X-Ray.

- web app - application stack

It identifies the error patterns and provides a detailed investigation summary. In the context of this demo, the investigation reveals that these are intentional test exceptions, shows the timeline of function invocations leading to the alarm, and even suggests monitoring improvements for error handling.

The agent uses a dedicated incident channel in Slack, notifies on-call teams if needed, and provides real-time status updates to stakeholders. Through the investigation chat interface, you can interact directly with the agent by asking clarifying questions such as “which logs did you analyze?” or steering the investigation by providing additional context, such as “focus on these specific log groups and rerun your analysis.” If you need expert assistance, you can create an AWS Support case with a single click, automatically populating it with the agent’s findings, and engage with AWS Support experts directly through the investigation chat window.

For this demo, the AWS DevOps Agent correctly identified manual activities in the Lambda console to invoke a function that intentionally triggers errors 😇.

- web app - root cause

Beyond incident response, AWS DevOps Agent analyzes my recent incidents to identify high-impact improvements that prevent future issues.

During active incidents, the agent offers immediate mitigation plans through its incident mitigations tab to help restore service quickly. Mitigation plans consist of specs that provide detailed implementation guidance for developers and agentic development tools like Kiro.

For longer-term resilience, it identifies potential enhancements by examining gaps in observability, infrastructure configurations, and deployment pipeline. My straightforward demo that triggered intentional errors was not enough to generate relevant recommendations though.

AWS DevOps Agent - web app - recommendations

For example, it might detect that a critical service lacks multi-AZ deployment and comprehensive monitoring. The agent then creates detailed recommendations with implementation guidance, considering factors like operational impact and implementation complexity. In an upcoming quick follow-up release, the agent will expand its analysis to include code bugs and testing coverage improvements.

Availability
You can try AWS DevOps Agent today in the US East (N. Virginia) Region. Although the agent itself runs in US East (N. Virginia) (us-east-1), it can monitor applications deployed in any Region, across multiple AWS accounts.

During the preview period, you can use AWS DevOps Agent at no charge, but there will be a limit on the number of agent task hours per month.

As someone who has spent countless nights debugging production issues, I’m particularly excited about how AWS DevOps Agent combines deep operational insights with practical, actionable recommendations. The service helps teams move from reactive firefighting to proactive system improvement.

To learn more and sign up for the preview, visit AWS DevOps Agent. I look forward to hearing how AWS DevOps Agent helps improve your operational efficiency.

— seb

Accelerate AI development using Amazon SageMaker AI with serverless MLflow

Post Syndicated from Donnie Prakoso original https://aws.amazon.com/blogs/aws/accelerate-ai-development-using-amazon-sagemaker-ai-with-serverless-mlflow/

Since we announced Amazon SageMaker AI with MLflow in June 2024, our customers have been using MLflow tracking servers to manage their machine learning (ML) and AI experimentation workflows. Building on this foundation, we’re continuing to evolve the MLflow experience to make experimentation even more accessible.

Today, I’m excited to announce that Amazon SageMaker AI with MLflow now includes a serverless capability that eliminates infrastructure management. This new MLflow capability transforms experiment tracking into an immediate, on-demand experience with automatic scaling that removes the need for capacity planning.

The shift to zero-infrastructure management fundamentally changes how teams approach AI experimentation—ideas can be tested immediately without infrastructure planning, enabling more iterative and exploratory development workflows.

Getting started with Amazon SageMaker AI and MLflow
Let me walk you through creating your first serverless MLflow instance.

I navigate to Amazon SageMaker AI Studio console and select the MLflow application. The term MLflow Apps replaces the previous MLflow tracking servers terminology, reflecting the simplified, application-focused approach.

Here, I can see there’s already a default MLflow App created. This simplified MLflow experience makes it more straightforward for me to start doing experiments.

I choose Create MLflow App, and enter a name. Here, I have both an AWS Identity and Access Management (IAM) role and Amazon Simple Service (Amazon S3) bucket are already been configured. I only need to modify them in Advanced settings if needed.

Here’s where the first major improvement becomes apparent—the creation process completes in approximately 2 minutes. This immediate availability enables rapid experimentation without infrastructure planning delays, eliminating the wait time that previously interrupted experimentation workflows.

After it’s created, I receive an MLflow Amazon Resource Name (ARN) for connecting from notebooks. The simplified management means no server sizing decisions or capacity planning required. I no longer need to choose between different configurations or manage infrastructure capacity, which means I can focus entirely on experimentation. You can learn how to use MLflow SDK at Integrate MLflow with your environment in the Amazon SageMaker Developer Guide.

With MLflow 3.4 support, I can now access new capabilities for generative AI development. MLflow Tracing captures detailed execution paths, inputs, outputs, and metadata throughout the development lifecycle, enabling efficient debugging across distributed AI systems.

This new capability also introduces cross-domain access and cross-account access through AWS Resource Access Manager (AWS RAM) share. This enhanced collaboration means that teams across different AWS domains and accounts can share MLflow instances securely, breaking down organizational silos.

Better together: Pipelines integration
Amazon SageMaker Pipelines is integrated with MLflow. SageMaker Pipelines is a serverless workflow orchestration service purpose-built for machine learning operations (MLOps) and large language model operations (LLMOps) automation—the practices of deploying, monitoring, and managing ML and LLM models in production. You can easily build, execute, and monitor repeatable end-to-end AI workflows with an intuitive drag-and-drop UI or the Python SDK.

From a pipeline, a default MLflow App will be created if one doesn’t already exist. The experiment name can be defined and metrics, parameters, and artifacts are logged to the MLflow App as defined in your code. SageMaker AI with MLflow is also integrated with familiar SageMaker AI model development capabilities like SageMaker AI JumpStart and Model Registry, enabling end-to-end workflow automation from data preparation through model fine-tuning.

Things to know
Here are key points to note:

  • Pricing – The new serverless MLflow capability is offered at no additional cost. Note there are service limits that apply.
  • Availability – This capability is available in the following AWS Regions: US East (N. Virginia, Ohio), US West (N.California, Oregon), Asia Pacific (Mumbai, Seoul, Singapore, Sydney, Tokyo), Canada (Central), Europe (Frankfurt, Ireland, London, Paris, Stockholm), South America (São Paulo).
  • Automatic upgrades: MLflow in-place version upgrades happen automatically, providing access to the latest features without manual migration work or compatibility concerns. The service currently supports MLflow 3.4, providing access to the latest capabilities including enhanced tracing features.
  • Migration support – You can use the open source MLflow export-import tool available at mlflow-export-import to help migrate from existing Tracking Servers, whether they’re from SageMaker AI, self-hosted, or otherwise to serverless MLflow (MLflow Apps).

Get started with serverless MLflow by visiting Amazon SageMaker AI Studio and creating your first MLflow App. Serverless MLflow is also supported in SageMaker Unified Studio for additional workflow flexibility.

Happy experimenting!
— Donnie

Introducing Amazon Nova 2 Lite, a fast, cost-effective reasoning model

Post Syndicated from Danilo Poccia original https://aws.amazon.com/blogs/aws/introducing-amazon-nova-2-lite-a-fast-cost-effective-reasoning-model/

Today, we’re releasing Amazon Nova 2 Lite, a fast, cost-effective reasoning model for everyday workloads. Available in Amazon Bedrock, the model offers industry-leading price performance and helps enterprises and developers build capable, reliable, and efficient agentic-AI applications. For organizations who need AI that truly understands their domain, Nova 2 Lite is the best model to use with Nova Forge to build their own frontier intelligence.

Nova 2 Lite supports extended thinking, including step-by-step reasoning and task decomposition, before providing a response or taking action. Extended thinking is off by default to deliver fast, cost-optimized responses, but when deeper analysis is needed, you can turn it on and choose from three thinking budget levels: low, medium, or high, giving you control over the speed, intelligence, and cost tradeoff.

Nova 2 Lite supports text, image, video, document as input and offers a one million-token context window, enabling expanded reasoning and richer in-context learning. In addition, Nova 2 Lite can be customized for your specific business needs. The model also includes access to two built-in tools: web grounding and a code interpreter. Web grounding retrieves publicly available information with citations, while the code interpreter allows the model to run and evaluate code within the same workflow.

Amazon Nova 2 Lite demonstrates strong performance across diverse evaluation benchmarks. The model excels in core intelligence across multiple domains including instruction following, math, and video understanding with temporal reasoning. For agentic workflows, Nova 2 Lite shows reliable function calling for task automation and precise UI interaction capabilities. The model also demonstrates strong code generation and practical software engineering problem-solving abilities.

Amazon Nova 2 Lite benchmarks

Nova 2 Lite is built to meet your company’s needs
Nova 2 Lite can be used for a broad range of your everyday AI tasks. It offers the best combination of price, performance, and speed. Early customers are using Nova 2 Lite for customer service chatbots, document processing, and business process automation.

Nova 2 Lite can help support workloads across many different use cases:

  • Business applications – Automate business process workflow, intelligent document processing (IDP), customer support, and web search to improve productivity and outcomes
  • Software engineering – Generate code, debugging, refactoring, and migrating systems to accelerate development and increase efficiency
  • Business intelligence and research – Use long-horizon reasoning and web grounding to analyze internal and external sources to uncover insights, and make informed decisions

For specific requirements, Nova 2 Lite is also available for customization on both Amazon Bedrock and Amazon SageMaker AI.

Using Amazon Nova 2 Lite
In the Amazon Bedrock console, you can use the Chat/Text playground to quickly test the new model with your prompts. To integrate the model into your applications, you can use any AWS SDKs with the Amazon Bedrock InvokeModel and Converse API. Here’s a sample invocation using the AWS SDK for Python (Boto3).

import boto3

AWS_REGION="us-east-1"
MODEL_ID="global.amazon.nova-2-lite-v1:0"
MAX_REASONING_EFFORT="low" # low, medium, high

bedrock_runtime = boto3.client("bedrock-runtime", region_name=AWS_REGION)

# Enable extended thinking for complex problem-solving
response = bedrock_runtime.converse(
    modelId=MODEL_ID,
    messages=[{
        "role": "user",
        "content": [{"text": "I need to optimize a logistics network with 5 warehouses, 12 distribution centers, and 200 retail locations. The goal is to minimize total transportation costs while ensuring no location is more than 50 miles from a distribution center. What approach should I take?"}]
    }],
    additionalModelRequestFields={
        "reasoningConfig": {
            "type": "enabled", # enabled, disabled (default)
            "maxReasoningEffort": MAX_REASONING_EFFORT
        }
    }
)

# The response will contain reasoning blocks followed by the final answer
for block in response["output"]["message"]["content"]:
    if "reasoningContent" in block:
        reasoning_text = block["reasoningContent"]["reasoningText"]["text"]
        print(f"Nova's thinking process:\n{reasoning_text}\n")
    elif "text" in block:
        print(f"Final recommendation:\n{block['text']}")

You can also use the new model with agentic frameworks that supports Amazon Bedrock and deploy the agents using Amazon Bedrock AgentCore. In this way, you can build agents for a broad range of tasks. Here’s the sample code for an interactive multi-agent system using the Strands Agents SDK. The agents have access to multiple tools, including read and write file access and the possibility to run shell commands.

from strands import Agent
from strands.models import BedrockModel
from strands_tools import calculator, editor, file_read, file_write, shell, http_request, graph, swarm, use_agent, think

AWS_REGION="us-east-1"
MODEL_ID="global.amazon.nova-2-lite-v1:0"
MAX_REASONING_EFFORT="low" # low, medium, high

SYSTEM_PROMPT = (
    "You are a helpful assistant. "
    "Follow the instructions from the user. "
    "To help you with your tasks, you can dynamically create specialized agents and orchestrate complex workflows."
)

bedrock_model = BedrockModel(
    region_name=AWS_REGION,
    model_id=MODEL_ID,
    additional_request_fields={
        "reasoningConfig": {
            "type": "enabled", # enabled, disabled (default)
            "maxReasoningEffort": MAX_REASONING_EFFORT
        }
    }
)

agent = Agent(
    model=bedrock_model,
    system_prompt=SYSTEM_PROMPT,
    tools=[calculator, editor, file_read, file_write, shell, http_request, graph, swarm, use_agent, think]
)

while True:
    try:
        prompt = input("\nEnter your question (or 'quit' to exit): ").strip()
        if prompt.lower() in ['quit', 'exit', 'q']:
            break
        if len(prompt) > 0:
            agent(prompt)
    except KeyboardInterrupt:
        break
    except EOFError:
        break

print("\nGoodbye!")

Things to know
Amazon Nova 2 Lite is now available in Amazon Bedrock via global cross-Region inference in multiple locations. For Regional availability and future roadmap, visit AWS Capabilities by Region.

Nova 2 Lite includes built-in safety controls to promote responsible AI use, with content moderation capabilities that help maintain appropriate outputs across a wide range of applications.

To understand the costs, see Amazon Bedrock pricing. To learn more, visit the Amazon Nova User Guide.

Start building with Nova 2 Lite today. To experiment with the new model, visit the Amazon Nova interactive website. Try the model in the Amazon Bedrock console, and share your feedback on AWS re:Post.

— Danilo

New AWS Security Agent secures applications proactively from design to deployment (preview)

Post Syndicated from Esra Kayabali original https://aws.amazon.com/blogs/aws/new-aws-security-agent-secures-applications-proactively-from-design-to-deployment-preview/

Today, we’re announcing AWS Security Agent in preview, a frontier agent that proactively secures your applications throughout the development lifecycle. It conducts automated application security reviews tailored to your organizational requirements and delivers context-aware penetration testing on demand. By continuously validating application security from design to deployment, it helps prevent vulnerabilities early in development.

Static application security testing (SAST) tools examine code without runtime context, whereas dynamic application security testing (DAST) tools assess running applications without application-level context. Both types of tools are one-dimensional because they don’t understand your application context. They don’t understand how your application is designed, what security threats it faces, and where and how it runs. This forces security teams to manually review everything, creating delays. Penetration testing is even slower—you either wait weeks for an external vendor or your internal security team to find time. When every application requires a manual security review and penetration test, the backlog grows quickly. Applications wait weeks or months for security validation before they can launch. This creates a gap between the frequency of software releases and the frequency of security evaluations. Security is not applied to the entire portfolio of applications, leaving customers exposed and knowingly shipping vulnerable code to meet deadlines. Over 60 percent of organizations update web applications weekly or more often, while nearly 75 percent test web applications monthly or less often. A 2025 report from Checkmarx found that 81 percent of organizations knowingly deploy vulnerable code to meet delivery deadlines.

AWS Security Agent is context-aware—it understands your entire application. It understands your application design, your code, and your specific security requirements. It continuously scans for security violations automatically and runs penetration tests on-demand instantly without scheduling. The penetration testing agent creates a customized attack plan informed by the context it has learned from your security requirements, design documents, and source code, and dynamically adapts as it runs based on what it discovers, such as endpoints, status and error codes, and credentials. This helps surface deeper, more sophisticated vulnerabilities before production, ensuring your application is secure before it launches without delays or surprises.

“SmugMug is excited to add AWS Security Agent to our automated security portfolio. AWS Security Agent transforms our security ROI by enabling pen test assessments that complete in hours rather than days, at a fraction of manual testing costs. We can now assess our services more frequently, dramatically decreasing the time to identify and address issues earlier in the software development lifecycle.” says Erik Giberti, Sr. Director of Product Engineering at SmugMug.

Get started with AWS Security Agent
AWS Security Agent provides design security review, code security review, and on-demand penetration testing capabilities. Design and code review check organizational security requirements that you define, and penetration testing learns application context from source code and specifications to identify vulnerabilities. To get started, navigate to the AWS Security Agent console. The console landing page provides an overview of how AWS Security Agent delivers continuous security assessment across your development lifecycle.

The Get started with AWS Security Agent panel on the right side of the landing page guides you through initial configuration. Choose Set up AWS Security Agent to create your first agent space and begin performing security reviews on your applications.

Provide an Agent space name to identify which agent you’re interacting with across different security assessments. An agent space is an organizational container that represents a distinct application or project you want to secure. Each agent space has its own testing scope, security configuration, and dedicated web application domain. We recommend creating one agent space per application or project to maintain clear boundaries and organized security assessments. You can optionally add a Description to provide context about the agent space’s purpose for other administrators.

When you create the first agent space in the AWS Management Console, AWS creates the Security Agent Web Application. The Security Agent Web Application is where users conduct design reviews and execute penetration tests within the boundaries established by administrators in the console. Users select which agent space to work in when conducting design reviews or executing penetration tests.

During the setup process, AWS Security Agent offers two options for managing user access to the Security Agent Web Application: Single Sign-On (SSO) with IAM Identity Center, which enables team-wide SSO access by integrating with AWS IAM Identity Center, or IAM users, which allows only AWS Identity and Access Management (IAM) users of this AWS account to access the Security Agent Web Application directly through the console and is best for quick setup or access without SSO configuration. When you choose the SSO option, AWS Security Agent creates an IAM Identity Center instance to provide centralized authentication and user management for AppSec team members who will access design reviews, code reviews, and penetration testing capabilities through the Security Agent Web Application.

The permissions configuration section helps you control how AWS Security Agent accesses other AWS services, APIs, and accounts. You can create a default IAM role that AWS Security Agent will use to access resources, or choose an existing role with appropriate permissions.

After completing the initial configuration, choose Set up AWS Security Agent to create the agent.

After creating an agent space, the agent configuration page displays three capability cards: Design review, Code review, and Penetration testing. While not required to operate the penetration testing, if you plan to use design review or code review capabilities, you can configure which security requirements will guide those assessments. AWS Security Agent includes AWS managed requirements, and you can optionally define custom requirements tailored to your organization. You can also manage which team members have access to the agent.

Security requirements
AWS Security Agent enforces organizational security requirements that you define so that applications comply with your team’s policies and standards. Security requirements specify the controls and policies that your applications must follow during both design and code review phases.

To manage security requirements, navigate to Security requirements in the navigation pane. These requirements are shared across all agent spaces and apply to both design and code reviews.

Managed security requirements are based on industry standards and best practices. These requirements are ready to use, maintained by AWS, and you can enable them instantly without configuration.

When creating a custom security requirement, you specify the control name and description that defines the policy. For example, you might create a requirement called Network Segmentation Strategy Defined that requires designs to define clear network segmentation separating workload components into logical layers based on data sensitivity. Or you might define Short Session Timeouts for Privileged and PII Access to mandate specific timeout durations for administrative and personally identifiable information (PII) access. Another example is Customer-Managed Encryption Keys Required, which requires designs to specify customer managed AWS Key Management Service (AWS KMS) keys rather than AWS managed keys for encrypting sensitive data at rest. AWS Security Agent evaluates designs and code against these enabled requirements, identifying policy violations.

Design security review
The design review capability analyzes architectural documents and product specifications to identify security risks before code is written. AppSec teams upload design documents through the AWS Security Agent console or ingest them from S3 and other connected services. AWS Security Agent assesses compliance with organizational security requirements and provides remediation guidance.

Before conducting design reviews, confirm you’ve configured the security requirements that AWS Security Agent will check. You can get started with AWS managed security requirements or define custom requirements tailored to your organization, as described in the Security requirements section.

To get started with the Design review, choose Admin access under Web app access to access the web app interface. When logged in, choose Create design review. Enter a Design review name to identify the assessment—for example, when assessing a new feature design that extends your application—and upload up to five design files. Choose Start design review to begin the assessment against your enabled security requirements.

After completing a design review, the design review detail page displays the review status, completion date, and files reviewed in the Details section. The Findings summary shows the count of findings across four compliance status categories:

  • Non-compliant – The design violates or inadequately addresses the security requirement.
  • Insufficient data – The uploaded files don’t contain enough information to determine compliance.
  • Compliant – The design meets the security requirement based on the uploaded documentation.
  • Not applicable – The security requirement’s relevance criteria indicate it doesn’t apply to this system design.

The Findings summary section helps you quickly assess which security requirements need attention. Non-compliant findings require updates to your design documents, while Insufficient data findings indicate gaps in the documentation where security teams should work with application teams to gather additional clarity before AWS Security Agent can complete the assessment.

The Files reviewed section displays all uploaded documents with options to search and download the original files.

The Review findings section lists each security requirement evaluated during the review along with its compliance status. In this example, the findings include Network Segmentation Strategy Defined, Customer-Managed Encryption Keys Required, and Short Session Timeouts for Privileged and PII Access. These are the custom security requirements defined earlier in the Security requirements section. You can search for specific security requirements or filter findings by compliance status to focus on items that require action.

When you choose a specific finding, AWS Security Agent displays detailed justification explaining the compliance status and provides recommended remediation steps. This context-aware analysis helps you understand security concerns specific to your design rather than generic security guidance. For designs with noncompliant findings, you can update your documentation to address the security requirements and create a new design review to validate the improvements. You can also choose Clone this design review to create a new assessment based on the current configuration or choose Download report to export the complete findings for sharing with your team.

After validating that your application design meets organizational security requirements, the next step is enforcing those same requirements as developers write code.

Code security review
The code review capability analyzes pull requests in GitHub to identify security vulnerabilities and organizational policy violations. AWS Security Agent detects OWASP Top Ten common vulnerabilities such as SQL injection, cross-site scripting, and inadequate input validation. It also enforces the same organizational security requirements used in design review, implementing code compliance with your team’s policies beyond common vulnerabilities.

When your application checks in new code, AWS Security Agent verifies compliance with organizational security requirements that go beyond common vulnerabilities. For example, if your organization requires audit logs to be retained for only 90 days, AWS Security Agent identifies when code configures a 365-day retention period and comments on the pull request with the specific violation. This catches policy violations that traditional security tools miss because the code is technically functional and secure.

To enable code review, choose Enable code review on the agent configuration page and connect your GitHub repositories. You can enable code review for specific repositories or connect repositories without enabling code review if you want to use them for penetration testing context instead.

For detailed setup instructions, visit the AWS Security Agent documentation.

On-demand penetration testing
The on-demand penetration testing capability executes comprehensive security testing to discover and validate vulnerabilities through multistep attack scenarios. AWS Security Agent systematically discovers the application’s attack surface through reconnaissance and endpoint enumeration, then deploys specialized agents to execute security testing across 13 risk categories, including authentication, authorization, and injection attacks. When provided source code, API specifications, and business documentation, AWS Security Agent builds deeper context about the application’s architecture and business rules to generate more targeted test cases. It adapts testing based on application responses and adjusts attack strategies as it discovers new information during the assessment.

AWS Security Agent tests web applications and APIs against OWASP Top Ten vulnerability types, identifying exploitable issues that static analysis tools miss. For example, while dynamic application security testing (DAST) tools look for direct server-side template injection (SSTI) payloads, AWS Security Agent can combine SSTI attacks with error forcing and debug output analysis to execute more complex exploits. AppSec teams define their testing scope—target URLs, authentication details, threat models, and documentation—the same as they would brief a human penetration tester. Using this understanding, AWS Security Agent develops application context and autonomously executes sophisticated attack chains to discover and validate vulnerabilities. This transforms penetration testing from a periodic bottleneck into a continuous security practice, reducing risk exposure.

To enable penetration testing, choose Enable penetration test on the agent configuration page. You can configure target domains, VPC settings for private endpoints, authentication credentials, and additional context sources such as GitHub repositories or S3 buckets. You must verify ownership of each domain before AWS Security Agent can run penetration testing.

After enabling the capability, create and run penetration tests through the AWS Security Agent Web Application. For detailed setup and configuration instructions, visit the AWS Security Agent documentation.

After creating and running a penetration test, the detail page provides an overview of test execution and results. You can run new tests or modify the configuration from this page. The page displays information about the most recent execution, including start time, status, duration, and a summary of discovered vulnerabilities categorized by severity. You can also view a history of all previous test runs with their findings summaries.

For each run, the detail page provides three tabs. The Penetration test run overview tab displays high-level information about the execution, including duration and overall status. The Penetration test logs tab lists all tasks executed during the penetration test, providing visibility into how AWS Security Agent discovered vulnerabilities, including the security testing actions performed, application responses, and the reasoning behind each test. The Findings tab displays all discovered vulnerabilities with complete details, including descriptions, attack reasoning, steps to reproduce, impact, and remediation guidance.

Join the preview
To get started with AWS Security Agent, visit the AWS Security Agent console and create your first agent to begin automating design reviews, code reviews, and penetration testing across your development lifecycle. During the preview period, AWS Security Agent is free of charge.

AWS Security Agent is available in the US East (N. Virginia) Region.

To learn more, visit the AWS Security Agent product page and technical documentation.

— Esra

AWS Security Hub now generally available with near real-time analytics and risk prioritization

Post Syndicated from Esra Kayabali original https://aws.amazon.com/blogs/aws/aws-security-hub-now-generally-available-with-near-real-time-analytics-and-risk-prioritization/

Today, AWS Security Hub is generally available, transforming how security teams identify and respond to critical security risks across their AWS environments. These new capabilities were first announced in preview at AWS re:Inforce 2025. Security Hub prioritizes your critical security issues and unifies your security operations to help you respond at scale by correlating and enriching signals across multiple AWS security services. Security Hub provides near real-time risk analytics, trends, unified enablement, streamlined pricing, and automated correlation that transforms security signals into actionable insights.

Organizations deploying multiple security tools need to manually correlate signals across different consoles, creating operational overhead that can delay detection and response times. Security teams use various tools for threat detection, vulnerability management, security posture monitoring, and sensitive data discovery, but extracting value from the findings these tools generate requires significant manual effort to understand relationships and determine priority.

Security Hub addresses these challenges through built-in integration that unifies your cloud security operations. Available for individual accounts or entire AWS Organizations accounts, Security Hub automatically aggregates and correlates signals from Amazon GuardDuty, Amazon Inspector, AWS Security Hub Cloud Security Posture Management (AWS Security Hub CSPM), and Amazon Macie, organizing them by threats, exposures, resources, and security coverage. This unified approach reduces manual correlation work, helping you quickly identify critical issues, understand coverage gaps, and prioritize remediation based on severity and impact.

What’s new in general availability
Since the preview announcement, Security Hub has added several new features.

Historical trends
Security Hub includes a Trends feature through the Summary dashboard that provides up to 1 year of historical data for findings and resources across your organization. The Summary dashboard displays an overview of your exposures, threats, resources, and security coverage through customizable widgets that you can add, remove, and arrange based on your operational needs.

The dashboard includes a Trends overview widget that displays period-over-period analysis for day-over-day, week-over-week, and month-over-month comparisons, helping you track whether your security posture is improving or degrading. Trend widgets for Active threat findings, Active exposure findings, and Resource trends provide visualizations of average counts over selectable time periods including 5 days, 30 days, 90 days, 6 months, and 1 year. You can filter these visualizations by severity levels such as critical, high, medium, and low, and hover over specific points in time to review detailed counts.

The Summary dashboard also includes widgets that display current exposure summaries prioritized by severity, threat summaries showing malicious or suspicious activity, and resource inventories organized by type and associated findings.

The Security coverage widget helps you identify gaps in your security service deployment across your organization. This widget tracks which AWS accounts and Regions have security services enabled, helping you understand where you might lack visibility into threats, vulnerabilities, misconfigurations, or sensitive data. The widget displays account coverage across security capabilities including vulnerability management by Amazon Inspector, threat detection by GuardDuty, sensitive data discovery by Amazon Macie, and posture management by AWS Security Hub CSPM. Coverage percentages show which security checks passed or failed across your AWS accounts and Regions where Security Hub is enabled.

You can apply filters to widgets using shared filters that apply across all widgets, finding filters for exposure and threat data, or resource filters for inventory data. You can create and save filter sets using and/or operators to define specific criteria for your security analysis. Dashboard customizations, including saved filter sets and widget layouts, are saved automatically and persist across sessions.

If you configure cross-Region aggregation, the Summary dashboard includes findings from all linked Regions when viewing from your home Region. For delegated administrator accounts in AWS Organizations, data includes findings for both the administrator account and member accounts. Security Hub retains trends data for 1 year from the date findings are generated. After 1 year, trends data is automatically deleted.

Near real-time risk analytics
Security Hub now calculates exposures in near real-time and includes threat correlation from GuardDuty alongside existing vulnerability and misconfiguration analysis. When GuardDuty detects threats, Amazon Inspector identifies vulnerabilities, or AWS Security Hub CSPM discovers misconfigurations, Security Hub automatically correlates these findings and updates associated exposures. This advancement provides immediate feedback on your security posture, helping you quickly identify new exposures and verify that remediation actions have reduced risk as expected.

Security Hub correlates findings across AWS Security Hub CSPM, Amazon Inspector, Amazon Macie, Amazon GuardDuty, and other security services to identify exposures that could lead to security incidents. This correlation helps you understand when multiple security issues combine to create critical risk. Security Hub enriches security signals with context by analyzing resource associations, potential impact, and relationships between signals. For example, if Security Hub identifies an Amazon Simple Storage Service (Amazon S3) bucket containing sensitive data with versioning disabled, Object Lock disabled, and MFA delete disabled, remediating any component triggers automatic calculation, helping you verify remediation effectiveness without waiting for scheduled assessments.

The Exposure page organizes findings by title and severity, helping you focus on critical issues first. The page includes an Overview section with a trends graph that displays the average count of exposure findings over the last 90 days, segmented by severity level. This visualization helps you track changes in your exposure posture over time and identify patterns in security risk.

Exposure findings are grouped by title with expandable rows showing the count of affected resources and overall severity. Each exposure title describes the potential security impact, such as “Potential Data Destruction: S3 bucket with versioning, Object Lock, and MFA delete disabled” or “Potential Remote Execution: EC2 instance is reachable from VPC and has software vulnerabilities.” You can filter exposures using saved filter sets or quick filters based on severity levels including critical, high, medium, and low. The interface also provides filtering by account ID, resource type, and accounts, helping you quickly narrow down exposures relevant to specific parts of your infrastructure.

Security Hub generates exposures as soon as findings are available. For example, when you deploy an Amazon Elastic Compute Cloud (Amazon EC2) instance that is publicly accessible and Amazon Inspector detects a highly exploitable vulnerability while AWS Security Hub CSPM identifies the public accessibility configuration, Security Hub automatically correlates these findings to generate an exposure without waiting for a scheduled assessment. This near-real time correlation helps you identify critical risks in newly deployed resources and take action before they can be exploited.

When you select an exposure finding, the details page displays the exposure type, primary resource, Region, account, age, and creation time. The Overview section shows contributing traits that represent the security issues directly contributing to the exposure scenario. These traits are organized by categories such as Reachability, Vulnerability, Sensitive data, Misconfiguration, and Assumability.

The details page includes a Potential attack path tab that provides a visual graph showing how potential attackers could access and take control of your resources. This visualization displays the relationships between the primary resource (such as an EC2 instance), involved resources (such as VPC, subnet, network interface, security group, AWS Identity and Access Management (IAM) instance profile, IAM role, IAM policy, and volumes), and contributing traits. The graph helps you understand the complete attack surface and identify which security controls need adjustment.

The Traits tab lists all security issues contributing to the exposure, and the Resources tab shows all affected resources. The Remediation section provides prioritized guidance with links to documentation, recommending which traits to address first to reduce risk most effectively. By using this comprehensive view, you can investigate specific exposures, understand the full context of security risks, and track remediation progress as your team addresses vulnerabilities, misconfigurations, and other security gaps across your environment.

Expanded partner integrations
Security Hub supports integration with Jira and ServiceNow for incident management workflows. When viewing a finding, you can create a ticket in your preferred system directly from the AWS Security Hub console with finding details, severity, and recommended remediation steps automatically populated. You can also define automation rules in Security Hub that automatically create tickets in Atlassian’s Jira Service Management and ServiceNow based on criteria you specify, such as severity level, resource type, or finding type. This helps you route critical security issues to your incident response teams without manual intervention.

Security Hub findings are formatted in the Open Cybersecurity Schema Framework (OCSF) schema, an open-source standard that enables security tools to share data seamlessly. Partners who have built integrations with the OCSF format with Security Hub include Cribl, CrowdStrike, Databee, DataDog, Dynatrace, Expel, Graylog, Netskope, Securonix, SentinelOne, Splunk a Cisco company, Sumo Logic, Tines, Upwind Security, Varonis, DTEX, and Zscaler. Additionally, service partners such as Accenture, Caylent, Deloitte, Optiv, PwC, and Wipro can help you adopt Security Hub and the OCSF schema.

Security Hub also supports automated response workflows through Amazon EventBridge. You can create EventBridge rules that identify findings based on criteria you specify and route them to targets such as AWS Lambda functions or AWS Systems Manager Automation runbooks for processing and remediation. This helps you act on findings programmatically without manual intervention.

Now available
If you currently use AWS Security Hub CSPM, Amazon GuardDuty, Amazon Inspector, or Amazon Macie, you can access these capabilities by navigating to the AWS Security Hub console. If you’re a new customer, you can enable Security Hub through the AWS Management Console and configure the security services appropriate for your workloads. Security Hub automatically consumes findings from enabled services, making the findings available in the unified console and creating correlated exposure findings based on the ingested security data.

For Regional availability, visit our AWS Services by Region page. Near real-time exposure calculation and the Trends feature are included at no additional charge. Security Hub uses a streamlined, resource-based pricing model that consolidates charges across integrated AWS security services. The console includes a cost estimator to help you plan and forecast security investments across your AWS accounts and Regions before deployment. For detailed information about capabilities, supported integrations, and pricing, visit the AWS Security Hub product page and technical documentation.

— Esra

Amazon GuardDuty adds Extended Threat Detection for Amazon EC2 and Amazon ECS

Post Syndicated from Betty Zheng (郑予彬) original https://aws.amazon.com/blogs/aws/amazon-guardduty-adds-extended-threat-detection-for-amazon-ec2-and-amazon-ecs/

Today, we’re announcing new enhancements to Amazon GuardDuty Extended Threat Detection with the addition of two attack sequence findings for Amazon Elastic Compute Cloud (Amazon EC2) instances and Amazon Elastic Container Service (Amazon ECS) tasks. These new findings build on the existing Extended Threat Detection capabilities, which already combine sequences involving AWS Identity and Access Management (IAM) credential misuse, unusual Amazon Simple Storage service (Amazon S3) bucket activity, and Amazon Elastic Kubernetes Service (Amazon EKS) cluster compromise. By adding coverage for EC2 instance groups and ECS clusters, this launch expands sequence-level visibility to virtual machine and container environments that support the same application. Together, these capabilities provide a more consistent and unified way to detect multistage activity across diverse Amazon Web Services (AWS) workloads.

Modern cloud environments are dynamic and distributed, often running virtual machines, containers, and serverless workloads at scale. Security teams strive to maintain visibility across these environments and connect related activities that might indicate complex, multistage attack sequences. These sequences can involve multiple steps, such as establishing initial access and persistence, providing missing credentials or performing unexpected data access, that unfold over time and across different sources. GuardDuty Extended Threat Detection automatically links these signals using AI and machine learning (ML) models trained at AWS scale to build a complete picture of the activity and surface high-confidence insights to help customers prioritize response actions. By combining evidence from diverse sources, this analysis produces high-fidelity, unified findings that would otherwise be difficult to infer from individual events.

How it works
Extended Threat Detection analyzes multiple types of security signals, including runtime activity, malware detections, VPC Flow Logs, DNS queries, and AWS CloudTrail events to identify patterns that represent a multistage attack across Amazon EC2 and Amazon ECS workloads. Detection works with the GuardDuty foundational plan, and turning on Runtime Monitoring for EC2 or ECS adds deeper process and network-level telemetry that strengthens signal analysis and increases the completeness of each attack sequence.

The new attack sequence findings combine runtime and other observed behaviors across the environment into a single critical-severity sequence. Each sequence includes an incident summary, a timeline of observed events, mapped MITRE ATT&CK® tactics and techniques, and remediation guidance to help you understand how the activity unfolded and which resources were affected.

EC2 instances and ECS tasks are often created and replaced automatically through Auto Scaling groups, shared launch templates, Amazon Machine Images (AMIs), IAM instance profiles, or cluster-level deployments. Because these resources commonly operate as part of the same application, activity observed across them might originate from a single underlying compromise. The new EC2 and ECS findings analyze these shared attributes and consolidate related signals into one sequence when GuardDuty detects a pattern affecting the group.

When a sequence is detected, the GuardDuty console highlights any critical-severity sequence findings on the Summary page, with the affected EC2 instance group or ECS cluster already identified. Selecting a finding opens a consolidated view that shows how the resources are connected, which signals contributed to the sequence, and how the activity progressed over time, helping you quickly understand the scope of impact across virtual machine and container workloads.

In addition to viewing sequences in the console, you can also see these findings in AWS Security Hub, where they appear on the new exposure dashboards alongside other GuardDuty findings to help you understand your overall security risk in one place. This detailed view establishes the context for interpreting how the analysis brings related signals together into a broader attack sequence.

Together, the analysis model and grouping logic give you a clearer, consolidated view of activity across virtual machine and container workloads, helping you focus on the events that matter instead of investigating numerous individual findings. By unifying related behaviors into a single sequence, Extended Threat Detection helps you assess the full context of an attack path and prioritize the most urgent remediation actions.

Now available
Amazon GuardDuty Extended Threat Detection with expanded coverage for EC2 instances and ECS tasks is now available in all AWS Regions where GuardDuty is offered. You can start using this capability today to detect coordinated, multistage activity across virtual machine and container workloads by combining signals from runtime activity, malware execution, and AWS API activity.

This expansion complements the existing Extended Threat Detection capabilities for Amazon EKS, providing unified visibility into coordinated, multistage activity across your AWS compute environment. To learn more, visit the Amazon GuardDuty product page.

–Betty