Tag Archives: Customer Solutions

Building a serverless image catalog with AWS Step Functions Workflow Studio

Post Syndicated from James Beswick original https://aws.amazon.com/blogs/compute/building-a-serverless-image-catalog-with-aws-step-functions-workflow-studio/

This post is written by Pascal Vogel, Associate Solutions Architect, and Benjamin Meyer, Sr. Solutions Architect.

Workflow Studio is a low-code visual workflow designer for AWS Step Functions that enables the orchestration of serverless workflows through a guided interactive interface. With the integration of Step Functions and the AWS SDK, you can now access more than 200 AWS services and over 9,000 API actions in your state machines.

This walkthrough uses Workflow Studio to implement a serverless image cataloging pipeline. It includes content moderation, automated tagging, and parallel image processing. Workflow Studio allows you to set up API integrations to other AWS services quickly with drag and drop actions, without writing custom application code.

Solution overview

Photo sharing websites often allow users to publish user-generated content such as text, images, or videos. Manual content review and categorization can be challenging. This solution enables the automation of these tasks.

Workflow overview

In this workflow:

  1. An image stored in Amazon S3 is checked for inappropriate content using the Amazon Rekognition DetectModerationLabels API.
  2. Based on the result of (1), appropriate images are forwarded to image processing while inappropriate ones trigger an email notification.
  3. Appropriate images undergo two processing steps in parallel: the detection of objects and text in the image via Amazon Rekognition’s DetectLabels and DetectText APIs. The results of both processing steps are saved in an Amazon DynamoDB table.
  4. An inappropriate image triggers an email notification for manual content moderation via the Amazon Simple Notification Service (SNS).

Prerequisites

To follow this walkthrough, you need:

  1. An AWS account.
  2. An AWS user with AdministratorAccess (see the instructions on the AWS Identity and Access Management (IAM) console).
  3. AWS CLI using the instructions here.
  4. AWS Serverless Application Model (AWS SAM) CLI using the instructions here.

Initial project setup

Get started by cloning the project repository from GitHub:

git clone https://github.com/aws-samples/aws-step-functions-image-catalog-blog.git

The cloned repository contains two AWS SAM templates.

  1. The starter directory contains a template. It deploys AWS resources and permissions that you use later for building the image cataloging workflow.
  2. The solution directory contains a template that deploys the finished image cataloging pipeline. Use this template if you want to skip ahead to the finished solution.

Both templates deploy the following resources to your AWS account:

  • An Amazon S3 bucket that holds the image files for the catalog.
  • A DynamoDB table as the data store of the image catalog.
  • An SNS topic and subscription that allow you to send an email notification.
  • A Step Functions state machine that defines the processing steps in the cataloging pipeline.

To follow the walkthrough, deploy the AWS SAM template in the starter directory using the AWS SAM CLI:

cd aws-step-functions-image-catalog-blog/starter
sam build
sam deploy --guided

Configure the AWS SAM deployment as follows. Input your email address for the parameter ModeratorEmailAddress:

Configuring SAM deploy

During deployment, you receive an email asking you to confirm the subscription to notifications generated by the Step Functions workflow. In the email, choose Confirm subscription to receive these notifications.

Subscription message

Confirm successful resource creation by going to the AWS CloudFormation console. Open the serverless-image-catalog-starter stack and choose the Stack info tab:

CloudFormation stack

View the Outputs tab of the CloudFormation stack. You reference these items later in the walkthrough:

Outputs tab

Implementing the image cataloging pipeline

Accessing Step Functions Workflow Studio

To access Step Functions in Workflow Studio:

  1. Access the Step Functions console.
  2. In the list of State machines, select image-catalog-workflow-starter.
  3. Choose the Edit button.
  4. Choose Workflow Studio.

Workflow Studio

Workflow Studio consists of three main areas:

  1. The Canvas lets you modify the state machine graph via drag and drop.
  2. The States Browser lets you browse and search more than 9,000 API Actions from over 200 AWS services.
  3. The Inspector panel lets you configure the properties of state machine states and displays the Step Functions definition in the Amazon States Language (ASL).

For the purpose of this walkthrough, you can delete the Pass state present in the state machine graph. Right click on it and choose Delete state.

Auto-moderating content with Amazon Rekognition and the Choice State

Use Amazon Rekognition’s DetectModerationLabels API to detect inappropriate content in the images processed by the workflow:

  1. In the States browser, search for the DetectModerationLabels API action.
  2. Drag and drop the API action on the state machine graph on the canvas.

Drag and drop

In the Inspector panel, select the Configuration tab and add the following API Parameters:

{
  "Image": {
    "S3Object": {
      "Bucket.$": "$.bucket",
      "Name.$": "$.key"
    }
  }
}

Switch to the Output tab and check the box next to Add original input to output using ResultPath. This allows you to pass both the original input and the task’s output on to the next state on the state machine graph.

Input the following ResultPath:

$.moderationResult

Step Functions enables you to make decisions based on the output of previous task states via the choice state. Use the result of the DetectModerationLabels API action to decide how to proceed with the image:

  1. Access the Flow tab in the States browser. Drag and drop a Choice state to the state machine graph below the DetectModerationLabels API action.
  2. In the States browser, choose Flow.
  3. Select a Choice state and place it after the DetectModerationLabels state on the graph.
  4. Select the added Choice state.
  5. In the Inspector panel, choose Rule #1 and select Edit.
  6. Choose Add conditions.
  7. For Variable, enter $.moderationResult.ModerationLabels[0].
  8. For Operator, choose is present.
  9. Choose Save conditions.
    Conditions for rule #1

If Amazon Rekognition detects inappropriate content, the workflow notifies content moderators to inspect the image manually:

  1. In the States browser, find the SNS Publish API Action.
  2. Drag the Action into the Rule #1 branch of the Choice state.
  3. For API Parameters, select the SNS topic that is visible in the Outputs of the serverless-image-catalog-starter stack in the CloudFormation console.

SNS topic in Workflow Studio

Speeding up image cataloging with the Parallel state

Appropriate images should be processed and included in the image catalog. In this example, processing includes the automated generation of tags based on objects and text identified in the image.

To accelerate this, instruct Step Functions to perform these tasks concurrently via a Parallel state:

  1. In the States browser, select the Flow tab.
  2. Drag and drop a Parallel state onto the Default branch of the previously added Choice state.
  3. Search the Amazon Rekognition DetectLabels API action in the States browser
  4. Drag and drop it inside the parallel state.
  5. Configure the following API parameters:
    {
      "Image": {
        "S3Object": {
          "Bucket.$": "$.bucket",
          "Name.$": "$.key"
        }
      }
    }
    
  6. Switch to the Output tab and check the box next to Add original input to output using ResultPath. Set the ResultPath to $.output.

Record the results of the Amazon Rekognition DetectLabels API Action to the DynamoDB database:

  1. Place a DynamoDB UpdateItem API Action inside the Parallel state below the Amazon Rekognition DetectLabels API action.
  2. Configure the following API Parameters to save the tags to the DynamoDB table. Input the name of the DynamoDB table visible in the Outputs of the serverless-image-catalog-starter stack in the CloudFormation console:
{
  "TableName": "<DynamoDB table name>",
  "Key": {
    "Id": {
      "S.$": "$.key"
    }
  },
  "UpdateExpression": "set detectedObjects=:o",
  "ExpressionAttributeValues": {
    ":o": {
      "S.$": "States.JsonToString($.output.Labels)"
    }
  }
}

This API parameter definition makes use of an intrinsic function to convert the list of objects identified by Amazon Rekognition from JSON to String.

Intrinsic functions

In addition to objects, you also want to identify text in images and store it in the database. To do so:

  1. Drag and drop an Amazon Rekognition DetectText API action into the Parallel state next to the DetectLabels Action.
  2. Configure the API Parameters and ResultPath identical to the DetectLabels API Action.
  3. Place another DynamoDB UpdateItem API Action inside the Parallel state below the Amazon Rekognition DetectText API Action. Set the following API Parameters and input the same DynamoDB table name as before.
{
  "TableName": "<DynamoDB table name>",
  "Key": {
    "Id": {
      "S.$": "$.key"
    }
  },
  "UpdateExpression": "set detectedText=:t",
  "ExpressionAttributeValues": {
    ":t": {
      "S.$": "States.JsonToString($.output.TextDetections)"
    }
  }
}

To save the state machine:

  1. Choose Apply and exit.
  2. Choose Save.
  3. Choose Save anyway.

Finishing up and testing the image cataloging workflow

To test the image cataloging workflow, upload an image to the S3 bucket created as part of the initial project setup. Find the name of the bucket in the Outputs of the serverless-image-catalog-starter stack in the CloudFormation console.

  1. Select the image-catalog-workflow-starter state machine in the Step Functions console.
  2. Choose Start execution.
  3. Paste the following test event (use your S3 bucket name):
    {
        "bucket": "<S3-bucket-name>",
        "key": "<Image-name>.jpeg"
    }
    
  4. Choose Start execution.

Once the execution has started, you can follow the state of the state machine live in the Graph inspector. For an appropriate image, the result will look as follows:

Graph inspector

Next, repeat the test process with an image that Amazon Rekognition classifies as inappropriate. Find out more about inappropriate content categories here. This produces the following result:

Graph inspector

You receive an email notifying you regarding the inappropriate image and its properties.

Cleaning up

To clean up the resources provisioned as part of the solution run the following command in the aws-step-functions-image-catalog-blog/starter directory:

sam delete

Conclusion

This blog post demonstrates how to implement a serverless image cataloging pipeline using Step Functions Workflow Studio. By orchestrating AWS API actions and flow states via drag and drop, you can process user-generated images. This example checks images for appropriateness and generates tags based on their content without custom application code.

You can now expand and improve this workflow by triggering it automatically each time an image is uploaded to the Amazon S3 bucket or by adding a manual approval step for submitted content. To find out more about Workflow Studio, visit the AWS Step Functions Developer Guide.

For more serverless learning resources, visit Serverless Land.

Building Blue/Green application deployment to Micro Focus Enterprise Server

Post Syndicated from Kevin Yung original https://aws.amazon.com/blogs/devops/building-blue-green-application-deployment-to-micro-focus-enterprise-server/

Organizations running mainframe production workloads often follow the traditional approach of application deployment. To release new features of existing applications into production, the application is redeployed using the new version of software on the existing infrastructure. This poses the following challenges:

  • The cutover of the application deployment from testing to production usually takes place during a planned outage window with associated downtime.
  • Rollback is difficult, since the earlier version of the software must be redeployed from scratch on the existing infrastructure. This may result in applications being unavailable for longer durations owing to the rollback.
  • Due to differences in testing and production environments, some defects may leak into production, affecting the application code quality and thus increasing the number of production outages

Automated, robust application deployment is recognized as a prime driver for moving from a Mainframe to AWS, as service stability, security, and quality can be better managed. In this post, you will learn how to build Blue/Green (zero-downtime) deployments for mainframe applications rehosted to Micro Focus Enterprise Server with AWS Developer Tools (AWS CodeBuild, CodePipeline, and CodeDeploy).

This is a continuation of our previous post “Automate thousands of mainframe tests on AWS with the Micro Focus Enterprise Suite”. In our last post, we explained how you can implement a pattern for continuous integration and testing of mainframe applications with AWS Developer tools and Micro Focus Enterprise Suite. If you haven’t already checked it out, then we strongly recommend that you read through it before proceeding to the rest of this post.

Overview of solution

In this section, we explain the three important design “ingredients” to be implemented in the overall solution:

  1. Implementation of Enterprise Server Performance and Availability Cluster (PAC)
  2. End-to-end design of CI/CD pipeline for multiple teams development
  3. Blue/green deployment process for a rehosted mainframe application

First, let’s look at the solution design for the Micro Focus Enterprise Server PAC cluster.

Overview of Micro Focus Enterprise Server Performance and Availability Cluster (PAC)

In the Blue/Green deployment solution, Micro Focus Enterprise Server is the hosting environment for mainframe applications with the software installed into Amazon EC2 instances. Application deployment in Amazon EC2 Auto Scaling is one of the critical requirements to build a Blue/Green deployment. Micro Focus Enterprise Server PAC technology is the feature that allows for the Auto Scaling of Enterprise Server instances. For details on how to build Micro Focus Enterprise PAC Cluster with Amazon EC2 Auto Scaling and Systems Manager, see our AWS Prescriptive Guidance document. An overview of the infrastructure architecture is shown in the following figure, and the following table explains the components in the architecture.

Infrastructure architecture overview for blue/green application deployment to Micro Focus Enterprise Server

Components Description
Micro Focus Enterprise Servers Deploy applications to Micro Focus Enterprise Servers PAC in Amazon EC2 Auto Scaling Group.
Micro Focus Enterprise Server Common Web Administration (ESCWA) Manage Micro Focus Enterprise Server PAC with ESCWA server, e.g., Adding or Removing Enterprise Server to/from a PAC.
Relational Database for both user and system data files Setup Amazon Aurora RDS Instance in Multi-AZ to host both user and system data files to be shared across the Enterprise server instances.
Micro Focus Enterprise Server Scale-Out Repository (SOR) Setup an Amazon ElastiCache Redis Instance and replicas in Multi-AZ to host user data.
Application endpoint and load balancer Setup a Network Load Balancer to provide a hostname for end users to connect the application, e.g., accessing the application through a 3270 emulator.

CI/CD Pipelines design supporting multi-streams of mainframe development

In a previous DevOps post, Automate thousands of mainframe tests on AWS with the Micro Focus Enterprise Suite, we introduced two levels of pipelines. The first level of pipeline is used by mainframe project teams to test project scope changes. The second level of the pipeline is used for system integration tests, where the pipeline will perform tests for all of the promoted changes from the project pipelines and perform extensive systems tests.

In this post, we are extending the two levels pipeline to add a production deployment pipeline. When system testing is complete and successful, the tested application artefacts are promoted to the production pipeline in preparation for live production release. The following figure depicts each stage of the three levels of CI/CD pipeline and the purpose of each stage.

Different levels of CI/CD pipeline - Project Team Pipeline, Systems Test Pipeline and Production Deployment Pipeline

Let’s look at the artifact promotion to production pipeline in greater detail. The Systems Test Pipeline promotes the tested artifacts in binary format into an Amazon S3 bucket and the S3 event triggers production pipeline to kick-off. This artifact promotion process can be gated using a manual approval action in CodePipeline. For customers who want to have a fully automated continuous deployment, the manual promotion approval step can be removed.

The following diagram shows the AWS Stages in AWS CodePipeline of the production deployment pipeline:

Stages in production deployment pipeline using AWS CodePipeline

After the production pipeline is kicked off, it downloads the new version artifact from the S3 bucket. See the details of how to setup the S3 bucket as a Source of CodePipeline in the document AWS CodePipeline Document S3 as Source

In the following section, we explain each of these pipeline stages in detail:

  1. It prepares and packages a new version of production configuration artifacts, for example, the Micro Focus Enterprise Server config file, blue/green deployment scripts etc.
  2. Use in the CodeBuild Project to kick off an application blue/green deployment with AWS CodeDeploy.
  3. Use a manual approval gate to wait for an operator to validate the new version of the application and approve to continue the production traffic switch
  4. Continue the blue/green deployment by allowing traffic to the new version of the application and block the traffic to the old version.
  5. After a successful Blue/Green switch and deployment, tag the production version in the code repository.

Now that you’ve seen the pipeline design, we will dive deep into the details of the blue/green deployment with AWS CodeDeploy.

Blue/green deployment with AWS CodeDeploy

In the blue/green deployment, we used the technique of swapping Auto Scaling Group behind an Elastic Load Balancer. Refer to the AWS Blue/Green deployment whitepaper for the details of the technique. As AWS CodeDeploy is a fully-managed service that automates software deployment, it is used to automate the entire Blue/Green process.

Firstly, the following best practices are applied to setup the Enterprise Server’s infrastructure:

  1. AWS Image Builder is used to install Micro Focus Enterprise Server software and AWS CodeDeploy Agent into Amazon Machine Image (AMI). Create an EC2 Launch Template with the Enterprise Server AMI ID.
  2. A Network Load Balancer is used to setup a TCP connection health check to validate that Micro Focus Enterprise Server is listening on the required ports, e.g., port 9270, so that connectivity is available for 3270 emulators.
  3. A script was created to confirm application deployment validity in each EC2 instance. This is achieved by using a PowerShell script that triggers a CICS transaction from the Micro Focus Enterprise Server command line interface.

In the CodePipeline, we created a CodeBuild project to create a new deployment with CodeDeploy. We will go into the details of the CodeBuild buildspec.yaml configuration.

In the CodeBuild buildspec.yaml’s pre_build section, we used the following steps:

In the pre-build stage, the CodeBuild will perform two steps:

  1. Create an initial Amazon EC2 Auto Scaling using Micro Focus Enterprise Server AMI and a Launch Template for the first-time deployment of the application.
  2. Use AWS CLI to update the initial Auto Scaling Group name into a Systems Manager Parameter Store, and it will later be used by CodeDeploy to create a copy during the blue/green deployment.

In the build stage, the buildspec will perform the following steps:

  1. Retrieve the Auto Scaling Group name of the Enterprise Servers from the Systems Manager Parameter Store.
  2. Then, a blue/green deployment configuration is created for the deployment group of the application. In the AWS CLI command, we use the WITH_TRAFFIC_CONTROL option to let us manually verify and approve before switching the traffic to the new version of the application. The command snippet is shown here.
BlueGreenConf=\
        "terminateBlueInstancesOnDeploymentSuccess={action=TERMINATE}"\
        ",deploymentReadyOption={actionOnTimeout=STOP_DEPLOYMENT,waitTimeInMinutes=600}" \
        ",greenFleetProvisioningOption={action=COPY_AUTO_SCALING_GROUP}"

DeployType="BLUE_GREEN,deploymentOption=WITH_TRAFFIC_CONTROL"

/usr/local/bin/aws deploy update-deployment-group \
      --application-name "${APPLICATION_NAME}" \
     --current-deployment-group-name "${DEPLOYMENT_GROUP_NAME}" \
     --auto-scaling-groups "${AsgName}" \
      --load-balancer-info targetGroupInfoList=[{name="${TARGET_GROUP_NAME}"}] \
      --deployment-style "deploymentType=$DeployType" \
      --Blue/Green-deployment-configuration "$BlueGreenConf"
  1. Next, the new version of application binary is released from the CodeBuild source DemoBinto the production S3 bucket.
release="bankdemo-$(date '+%Y-%m-%d-%H-%M').tar.gz"
RELEASE_FILE="s3://${PRODUCTION_BUCKET}/${release}"

/usr/local/bin/aws deploy push \
    --application-name ${APPLICATION_NAME} \
    --description "version - $(date '+%Y-%m-%d %H:%M')" \
    --s3-location ${RELEASE_FILE} \
    --source ${CODEBUILD_SRC_DIR_DemoBin}/
  1. Create a new deployment for the application to initiate the Blue/Green switch.
/usr/local/bin/aws deploy create-deployment \
    --application-name ${APPLICATION_NAME} \
    --s3-location bucket=${PRODUCTION_BUCKET},key=${release},bundleType=zip \
    --deployment-group-name "${DEPLOYMENT_GROUP_NAME}" \
    --description "Bankdemo Production Deployment ${release}"\
    --query deploymentId \
    --output text

After setting up the deployment options, the following is a snapshot of a deployment configuration from the AWS Management Console.

Snapshot of deployment configuration from AWS Management Console

In the AWS Post “Under the Hood: AWS CodeDeploy and Auto Scaling Integration”, we explain how AWS CodeDeploy sets up Auto Scaling lifecycle hooks to listen for Auto Scaling events. In the event of an EC2 instance launch and termination, AWS CodeDeploy can instruct its agent in the instance to run the prepared scripts.

In the following table, we list each stage in a blue/green deployment and the tasks that ran.

Hooks Tasks
BeforeInstall Create application folder structures in the newly launched Amazon EC2 and prepare for installation
  AfterInstall Enable Windows Firewall Rule for application traffic
Activate Micro Focus License using License Server
Prepare Production Database Connections
Import config to create Region in Micro Focus Enterprise Server
Deploy the latest application binaries into each of the Micro Focus Enterprise Servers
ApplicationStart Use AWS CLI to start a Systems Manager Automation “Scale-Out” runbook with the target of ESCWA server
The Automation runbook will add the newly launched Micro Focus Enterprise Server instance into a PAC
The Automation runbook will start the imported region in the newly launched Micro Focus Enterprise Server
Validate that the application is listening on a service port, for example, port 9270
Use the Micro Focus command “castran” to run an online transaction in Micro Focus Enterprise Server to validate the service status
AfterBlockTraffic Use AWS CLI to start a Systems Manager Automation “Scale-In” runbook with the target ESCWA server
The Automation runbook will try stopping the Region in the terminating EC2 instance
The Automation runbook will remove the Enterprise Server instance from the PAC

The tasks in the table are automated using PowerShell, and the scripts are used in appspec.yml config for CodeDeploy to orchestrate the deployment.

In the following appspec.yml, the locations of the binary files to be installed are defined in addition to the Micro Focus Enterprise Server Region XML config file. During the AfrerInstall stage, the XML config is imported into the Enterprise Server.

version: 0.0
os: windows
files:
  - source: scripts
    destination: C:\scripts\
  - source: online
    destination: C:\BANKDEMO\online\
  - source: common
    destination: C:\BANKDEMO\common\
  - source: batch
    destination: C:\BANKDEMO\batch\
  - source: scripts\BANKDEMO.xml
    destination: C:\BANKDEMO\
hooks:
  BeforeInstall: 
    - location: scripts\BeforeInstall.ps1
      timeout: 300
  AfterInstall: 
    - location: scripts\AfterInstall.ps1    
  ApplicationStart:
    - location: scripts\ApplicationStart.ps1
      timeout: 300
  ValidateService:
    - location: scripts\ValidateServer.cmd
      timeout: 300
  AfterBlockTraffic:
    - location: scripts\AfterBlockTraffic.ps1

Using the sample Micro Focus Bankdemo application, and the steps outlined above, we have setup a blue/green deployment process in Micro Focus Enterprise Server.

There are four important considerations when setting up blue/green deployment:

  1. For batch applications, the blue/green deployment should be invoked only outside of the scheduled “batch window”.
  2. For online applications, AWS CodeDeploy will deregister the Auto Scaling group from the target group of the Network Load Balancer. The deregistration may take a while as the server has to finish processing the ongoing requests before it can continue deployment of the new application instance. In this case, enabling Elastic Load Balancing connection draining feature with appropriate timeout value can minimize the risk of closing unfinished transactions. In addition, consider doing deployment in low-traffic windows to improve the deployment speeds.
  3. For application changes that require updates to the database schema, the version roll-forward and rollback can be managed via DB migrations tools, e.g., Flyway and Fluent Migrator.
  4. For testing in production environments, adherence to any regulatory compliance, such as full audit trail of events, must be considered.

Conclusion

In this post, we introduced the solution to use Micro Focus Enterprise Server PAC, Amazon EC2 Auto Scaling, AWS Systems Manager, and AWS CodeDeploy to automate the blue/green deployment of rehosted mainframe applications in AWS.

Through the blue/green deployment methodology, we can shift traffic between two identical clusters running different application versions in parallel. This mitigates the risks commonly associated with mainframe application deployment, namely downtime and rollback capacity, while ensure higher code quality in production through “Shift Right” testing.

A demo of the solution is available on the AWS Partner Micro Focus website [Solution-Demo]. If you’re interested in modernizing your mainframe applications, then please contact Micro Focus and AWS mainframe business development at [email protected].

Additional Information

About the authors

Kevin Yung

Kevin Yung

Kevin is a Senior Modernization Architect in AWS Professional Services Global Mainframe and Midrange Modernization (GM3) team. Kevin currently is focusing on leading and delivering mainframe and midrange applications modernization for large enterprise customers.

Krithika Palani Selvam

Krithika is a Senior Modernization Architect in AWS Professional Services Global Mainframe and Midrange Modernization (GM3) team. She is currently working with enterprise customers for migrating and modernizing mainframe and midrange applications to cloud.

Peter Woods

Peter Woods has been with Micro Focus for over 30 years <within the Application Modernisation & Connectivity portfolio>. His diverse range of roles has included Technical Support, Channel Sales, Product Management, Strategic Alliances Management and Pre-Sales and was primarily based in the UK. In 2017 Peter re-located to Melbourne, Australia and in his current role of AM2C APJ Regional Technical Leader and ANZ Pre-Sales Manager, he is charged with driving and supporting Application Modernisation sales activity across the APJ region.

Abraham Mercado Rondon

Abraham Rondon is a Solutions Architect working on Micro Focus Enterprise Solutions for the Application Modernization team based in Melbourne. After completing a degree in Statistics and before joining Micro Focus, Abraham had a long career in supporting Mainframe Applications in different countries doing progressive roles from Developer to Production Support, Business and Technical Analyst, and Project Team Lead.  Now, a vital part of the Micro Focus Application Modernization team, one of his main focus is Cloud implementations of mainframe DevOps and production workload rehost.

How the Georgia Data Analytics Center built a cloud analytics solution from scratch with the AWS Data Lab

Post Syndicated from Kanti Chalasani original https://aws.amazon.com/blogs/big-data/how-the-georgia-data-analytics-center-built-a-cloud-analytics-solution-from-scratch-with-the-aws-data-lab/

This is a guest post by Kanti Chalasani, Division Director at Georgia Data Analytics Center (GDAC). GDAC is housed within the Georgia Office of Planning and Budget to facilitate governed data sharing between various state agencies and departments.

The Office of Planning and Budget (OPB) established the Georgia Data Analytics Center (GDAC) with the intent to provide data accountability and transparency in Georgia. GDAC strives to support the state’s government agencies, academic institutions, researchers, and taxpayers with their data needs. Georgia’s modern data analytics center will help to securely harvest, integrate, anonymize, and aggregate data.

In this post, we share how GDAC created an analytics platform from scratch using AWS services and how GDAC collaborated with the AWS Data Lab to accelerate this project from design to build in record time. The pre-planning sessions, technical immersions, pre-build sessions, and post-build sessions helped us focus on our objectives and tangible deliverables. We built a prototype with a modern data architecture and quickly ingested additional data into the data lake and the data warehouse. The purpose-built data and analytics services allowed us to quickly ingest additional data and deliver data analytics dashboards. It was extremely rewarding to officially release the GDAC public website within only 4 months.

A combination of clear direction from OPB executive stakeholders, input from the knowledgeable and driven AWS team, and the GDAC team’s drive and commitment to learning played a huge role in this success story. GDAC’s partner agencies helped tremendously through timely data delivery, data validation, and review.

We had a two-tiered engagement with the AWS Data Lab. In the first tier, we participated in a Design Lab to discuss our near-to-long-term requirements and create a best-fit architecture. We discussed the pros and cons of various services that can help us meet those requirements. We also had meaningful engagement with AWS subject matter experts from various AWS services to dive deeper into the best practices.

The Design Lab was followed by a Build Lab, where we took a smaller cross section of the bigger architecture and implemented a prototype in 4 days. During the Build Lab, we worked in GDAC AWS accounts, using GDAC data and GDAC resources. This not only helped us build the prototype, but also helped us gain hands-on experience in building it. This experience also helped us better maintain the product after we went live. We were able to continually build on this hands-on experience and share the knowledge with other agencies in Georgia.

Our Design and Build Lab experiences are detailed below.

Step 1: Design Lab

We wanted to stand up a platform that can meet the data and analytics needs for the Georgia Data Analytics Center (GDAC) and potentially serve as a gold standard for other government agencies in Georgia. Our objective with the AWS Data Design Lab was to come up with an architecture that meets initial data needs and provides ample scope for future expansion, as our user base and data volume increased. We wanted each component of the architecture to scale independently, with tighter controls on data access. Our objective was to enable easy exploration of data with faster response times using Tableau data analytics as well as build data capital for Georgia. This would allow us to empower our policymakers to make data-driven decisions in a timely manner and allow State agencies to share data and definitions within and across agencies through data governance. We also stressed on data security, classification, obfuscation, auditing, monitoring, logging, and compliance needs. We wanted to use purpose-built tools meant for specialized objectives.

Over the course of the 2-day Design Lab, we defined our overall architecture and picked a scaled-down version to explore. The following diagram illustrates the architecture of our prototype.

The architecture contains the following key components:

  • Amazon Simple Storage Service (Amazon S3) for raw data landing and curated data staging.
  • AWS Glue for extract, transform, and load (ETL) jobs to move data from the Amazon S3 landing zone to Amazon S3 curated zone in optimal format and layout. We used an AWS Glue crawler to update the AWS Glue Data Catalog.
  • AWS Step Functions for AWS Glue job orchestration.
  • Amazon Athena as a powerful tool for a quick and extensive SQL data analysis and to build a logical layer on the landing zone.
  • Amazon Redshift to create a federated data warehouse with conformed dimensions and star schemas for consumption by Tableau data analytics.

Step 2: Pre-Build Lab

We started with planning sessions to build foundational components of our infrastructure: AWS accounts, Amazon Elastic Compute Cloud (Amazon EC2) instances, an Amazon Redshift cluster, a virtual private cloud (VPC), route tables, security groups, encryption keys, access rules, internet gateways, a bastion host, and more. Additionally, we set up AWS Identity and Access Management (IAM) roles and policies, AWS Glue connections, dev endpoints, and notebooks. Files were ingested via secure FTP, or from a database to Amazon S3 using AWS Command Line Interface (AWS CLI). We crawled Amazon S3 via AWS Glue crawlers to build Data Catalog schemas and tables for quick SQL access in Athena.

The GDAC team participated in Immersion Days for training in AWS Glue, AWS Lake Formation, and Amazon Redshift in preparation for the Build Lab.

We defined the following as the success criteria for the Build Lab:

  • Create ETL pipelines from source (Amazon S3 raw) to target (Amazon Redshift). These ETL pipelines should create and load dimensions and facts in Amazon Redshift.
  • Have a mechanism to test the accuracy of the data loaded through our pipelines.
  • Set up Amazon Redshift in a private subnet of a VPC, with appropriate users and roles identified.
  • Connect from AWS Glue to Amazon S3 to Amazon Redshift without going over the internet.
  • Set up row-level filtering in Amazon Redshift based on user login.
  • Data pipelines orchestration using Step Functions.
  • Build and publish Tableau analytics with connections to our star schema in Amazon Redshift.
  • Automate the deployment using AWS CloudFormation.
  • Set up column-level security for the data in Amazon S3 using Lake Formation. This allows for differential access to data based on user roles to users using both Athena and Amazon Redshift Spectrum.

Step 3: Four-day Build Lab

Following a series of implementation sessions with our architect, we formed the GDAC data lake and organized downstream data pulls for the data warehouse with governed data access. Data was ingested in the raw data landing lake and then curated into a staging lake, where data was compressed and partitioned in Parquet format.

It was empowering for us to build PySpark Extract Transform Loads (ETL) AWS Glue jobs with our meticulous AWS Data Lab architect. We built reusable glue jobs for the data ingestion and curation using the code snippets provided. The days were rigorous and long, but we were thrilled to see our centralized data repository come into fruition so rapidly. Cataloging data and using Athena queries proved to be a fast and cost-effective way for data exploration and data wrangling.

The serverless orchestration with Step Functions allowed us to put AWS Glue jobs into a simple readable data workflow. We spent time designing for performance and partitioning data to minimize cost and increase efficiency.

Database access from Tableau and SQL Workbench/J were set up for my team. Our excitement only grew as we began building data analytics and dashboards using our dimensional data models.

Step 4: Post-Build Lab

During our post-Build Lab session, we closed several loose ends and built additional AWS Glue jobs for initial and historic loads and append vs. overwrite strategies. These strategies were picked based on the nature of the data in various tables. We returned for a second Build Lab to work on building data migration tasks from Oracle Database via VPC peering, file processing using AWS Glue DataBrew, and AWS CloudFormation for automated AWS Glue job generation. If you have a team of 4–8 builders looking for a fast and easy foundation for a complete data analytics system, I would highly recommend the AWS Data Lab.

Conclusion

All in all, with a very small team we were able to set up a sustainable framework on AWS infrastructure with elastic scaling to handle future capacity without compromising quality. With this framework in place, we are moving rapidly with new data feeds. This would not have been possible without the assistance of the AWS Data Lab team throughout the project lifecycle. With this quick win, we decided to move forward and build AWS Control Tower with multiple accounts in our landing zone. We brought in professionals to help set up infrastructure and data compliance guardrails and security policies. We are thrilled to continually improve our cloud infrastructure, services and data engineering processes. This strong initial foundation has paved the pathway to endless data projects in Georgia.


About the Author

Kanti Chalasani serves as the Division Director for the Georgia Data Analytics Center (GDAC) at the Office of Planning and Budget (OPB). Kanti is responsible for GDAC’s data management, analytics, security, compliance, and governance activities. She strives to work with state agencies to improve data sharing, data literacy, and data quality through this modern data engineering platform. With over 26 years of experience in IT management, hands-on data warehousing, and analytics experience, she thrives for excellence.

Vishal Pathak is an AWS Data Lab Solutions Architect. Vishal works with customers on their use cases, architects solutions to solve their business problems, and helps them build scalable prototypes. Prior to his journey with AWS, Vishal helped customers implement BI, data warehousing, and data lake projects in the US and Australia.

Introducing AWS Virtual Waiting Room

Post Syndicated from James Beswick original https://aws.amazon.com/blogs/compute/introducing-aws-virtual-waiting-room/

This post is written by Justin Pirtle, Principal Solutions Architect, Joan Morgan, Software Developer Engineer, and Jim Thario, Software Developer Engineer.

Today, AWS is introducing an official AWS Virtual Waiting Room solution. You can integrate this new, open-source solution with existing web and mobile applications. It can help buffer users during times of peak demand and sudden bursts of traffic, preventing systems from resource exhaustion.

Events commonly use virtual waiting rooms where there is either unknown demand or expected large bursts of traffic. Examples of such events include concert ticket sales, Black Friday promotions, COVID-19 vaccine registrations, and more. Virtual waiting rooms allow a quota of users to view, select, and complete their transactions directly. They shield the application’s backend environment from traffic by buffering users in a waiting room until it is their turn in line.

Like any real-life queuing system, a user enters the AWS Virtual Waiting Room and requests a number in line. After receiving a number corresponding to the unique device ID, the browser then polls regularly for updates. The update provides the current number being served and anticipated time until they are front of line.

After reaching the front of the line, the user can exchange the number and device ID for a secure session token. This is included with their downstream requests to authenticate users securely.

If a user discovers the backend endpoint and tries to send requests, they are redirected into the waiting room. The API requests are denied access until they have a valid token. This prevents the backend from needing to scale to accommodate all users at a single time.

Integrating the AWS Virtual Waiting Room into your application

Integration steps depend on the integration pattern for your application. You can decide if all users are routed through the waiting room or only during periods of excessive traffic. You can also choose to protect only the web host serving the backend webpages or one or more APIs powering backend commerce services.

There are four common patterns supported for integrating the waiting room into your application:

  1. Upstream redirection of all traffic from the main target site to flow through AWS Virtual Waiting Room. This option sends all user traffic through the waiting room with the initial capacity of users permitted to the protected system. The traffic passes through transparently, then it buffers the remaining users. It admits new users as capacity becomes available. The target system is only accessible by users who pass through the waiting room.
  2. Downstream redirection to the virtual waiting room from the target site. This option sends all traffic to the target site. The target site conditionally redirects requests that need to enter the waiting room. No DNS or upstream modifications are needed. The target site must be able to handle the initial user requests and redirection responses.
  3. Direct target site API integration for buffering users from an existing website without any redirection. Your web or mobile application integrates the virtual waiting room at the API-level. This does not need any redirection to a different waiting room endpoint or site. This can offer a seamless user experience but may require more development for the integration.
  4. OpenID Connect (OIDC) adapter. This option offers no-code native integration of the waiting room with OpenID Connect-enabled system components, such as the AWS Application Load Balancer (ALB). Users are redirected by the load balancer or similar component to the waiting room. They are buffered until issued a signed, time-limited JSON Web Token (JWT). Once the user’s JWT token is issued, the load balancer then forwards user requests to the target backend systems.

Overview of the AWS Virtual Waiting Room solution

The AWS Virtual Waiting Room solution implementation includes three main components:

  • Core APIs. The main resources deployed include two Amazon API Gateway deployments, a VPC, several AWS Lambda functions, an Amazon DynamoDB table, and an Amazon ElastiCache cluster. This API provides the basic mechanisms for tracking clients entering the waiting room. It requests status of the line progression and an authentication token to enter the target protected site.
  • Waiting room front-end website. The waiting room static site is shown to users awaiting their turn. This site dynamically updates the position being served and their place in line on a configurable interval. You customize this site’s HTML, CSS, and JavaScript to match your frontend styling and theme.
  • Lambda authorizer for protected target system. The Lambda authorizer wraps and protects the downstream protected target system’s APIs. This ensures that all user invocations have a validated time-limited token issued by the waiting room core API. It helps to prevent users from bypassing the waiting room.

Reference architecture

The Virtual Waiting Room CloudFormation template deploys the following infrastructure:

  1. An Amazon CloudFront distribution to deliver public API calls for the client.
  2. Amazon API Gateway public API resources to process queue requests from the virtual waiting room, track the queue position, and support validation of tokens that allow access to the target website.
  3. An Amazon Simple Queue Service (Amazon SQS) queue to regulate traffic to the AWS Lambda function that processes the queue messages. Instead of invoking the Lambda function for each request, the SQS queue batches the incoming bursts of requests.
  4. API Gateway private API resources to support administrative functions.
  5. Lambda functions to validate and process public and private API requests, and return the appropriate responses.
  6. Amazon Virtual Private Cloud (VPC) to host the Lambda functions that interact directly with the Amazon ElastiCache for Redis cluster. VPC endpoints allow Lambda functions in the VPC to communicate with services within the solution.
  7. An Amazon CloudWatch rule to invoke a Lambda function that works with a custom Amazon EventBridge bus to periodically broadcast status updates.
  8. An Amazon DynamoDB table to store token data.
  9. AWS Secrets Manager to store keys for token operations and other sensitive data.
  10. (Optional) Authorizer component consisting of an AWS Identity and Access Management (IAM) role and a Lambda function to validate signatures for your API calls. The only requirement for the authorizer to protect your API is to use API Gateway.
  11. (Optional) Amazon Simple Notification Service (Amazon SNS), CloudWatch, and Lambda functions to support two inlet strategies.
  12. (Optional) OpenID adaptor component with API Gateway and Lambda functions to allow an OpenID provider to authenticate users to your website. CloudFront distribution with an Amazon Simple Storage Service (Amazon S3) bucket for the waiting room page for this component.
  13. (Optional) A CloudFront distribution with Amazon S3 origin bucket for the optional sample waiting room web application.

Deploying the AWS Virtual Waiting Room

To get started with the AWS Virtual Waiting Room, deploy the Getting Started stack. This deploys the Core APIs stack, the Authorizers stack, and a sample application CloudFormation stack:

  1. Launch the Getting Started CloudFormation stack. The template launches in the US East (N. Virginia) Region by default. To launch the solution in a different AWS Region, use the Region selector in the console navigation bar.
  2. On the Create stack page, verify that the correct template URL is in the Amazon S3 URL text box and choose Next.
    Create stack page
  3. On the Specify stack details page, assign a name to your solution stack, and accept all default parameter values. For information about naming character limitations, refer to IAM and STS Limits in the AWS Identity and Access Management User Guide. Choose Next.
    Specify stack details page
  4. On the Configure stack options page, choose Next.
  5. On the Review page, review and confirm the settings. Check the box acknowledging that the template creates AWS Identity and Access Management (IAM) resources.
  6. Choose Create stack to deploy the stack.
  7. You can view the status of the stack in the AWS CloudFormation Console in the Status column. You should receive a CREATE_COMPLETE status in approximately 30 minutes.
  8. Once successfully deployed, browse to the Outputs tab.
  9. Copy the ControlPanelURL and WaitingRoomURL to a scratch pad file for later use.

Configuring the AWS Virtual Waiting Room

After deploying the three stacks, test the waiting room using the sample application:

  1. Navigate to the IAM console. Create a new IAM user or select an existing IAM user in the same account where you deployed the waiting room stack.
  2. Grant the selected IAM user programmatic access. Download the key file or copy the access key ID and secret access key values to your scratch pad for later use.
  3. Add the IAM user to the ProtectedAPIGroup IAM user group created by the getting started template:
    Add user to groups
  4. Open the control panel in a new tab or browser window using the ControlPanelURL output you saved earlier.
  5. In the control panel, expand the Configuration section.
  6. Enter the access key ID and secret access key that you retrieved in Generate AWS keys to call the IAM secured APIs. The endpoints and event ID are filled in from the URL parameters.
    Control panel
  7. Choose Use. The button activates after you have supplied the credentials.
  8. You now see the status “Connected” shown following the various metrics reported:
    Metrics page

Test the sample waiting room

  1. Browse to the sample waiting room in a new browser tab. Use the WaitingRoomURL you captured previously from the CloudFormation stack output values.
  2. Select Reserve to enter the waiting room. If you are unable to proceed with your transaction, your assigned number is not yet reached.
    Waiting room status page
  3. Navigate back to the browser tab with the control panel.
  4. Under Increment Serving Counter, select Change. This manually increments the serving counter and allows 100 users to move on from the waiting room to the target site.
    Increment serving counter
  5. Navigate back to the waiting room and choose Check out now! You are redirected to the target site since your serving number is eligible to proceed beyond the waiting room.
    Waiting room config page
  6. Select Purchase now to finish your transaction at the target site. This page represents the protected system beyond the waiting room. Replace this with the actual system users you are protecting.
    Purchase now page
  7. After the simulated purchase is complete, you can see that the transaction is successful. This transaction is authorized using the time-limited authorization token, which came from the waiting room previously. If a user bypasses the waiting room, they would not be successful in completing a transaction.
    Purchase receipt

Customizing the AWS Virtual Waiting Room for your application

The sample browser client demonstrates an entire user flow frontend with the AWS Virtual Waiting Room flow for an ecommerce purchase. You can use this code as a starting point for your waiting room or reference the API communication code for integrating the waiting room into your existing website.

This sample code is built with Vue.js and Bootstrap to render the user interface. It uses the Axios and Axios-Retry packages to make API calls to the virtual waiting room stack. The sample code uses the Axios-Retry package to show how to handle throttling conditions and exponential backoff in high-traffic situations.

The control panel client is used to make requests to the private waiting room API that requires IAM-based authorization. The control panel client demonstrates how to construct and sign requests to the private API. It can be used in production or customized further. All of the sample source code room source is available in GitHub including the sample user client and control panel client.

Conclusion

The AWS Virtual Waiting Room solution is available today at no additional cost, provided as open source under the Apache 2 license. It supports customized integration with any front-end application via a variety of integration techniques. You can also customize how and when the waiting room allows users to progress into the protected target system using a variety of strategies.

To learn more about the AWS Virtual Waiting Room solution, visit the solution implementation and implementation guide.

For more serverless learning resources, visit Serverless Land.

How UnitedHealth Group Improved Disaster Recovery for Machine-to-Machine Authentication

Post Syndicated from Vinodh Kumar Rathnasabapathy original https://aws.amazon.com/blogs/architecture/how-unitedhealth-group-improved-disaster-recovery-for-machine-to-machine-authentication/

This blog post was co-authored by Vinodh Kumar Rathnasabapathy, Senior Manager of Software Engineering, UnitedHealth Group. 

Engineers who use Amazon Cognito for machine-to-machine authentication select a primary Region where they deploy their application infrastructure and the Amazon Cognito authorization endpoint. Amazon Cognito is a highly available service in single Region deployments with a published service-level agreement (SLA) target of 99.9%. The UnitedHealth Group (UHG) team needed a solution that would enable them to build and deploy their applications in multiple Regions to achieve higher availability targets. A multi-Region application architecture would also allow UHG engineers to failover to a secondary Region in the event that their application experienced issues in the primary Region.

At UHG, Federated Data Services (FDS) is a business-critical customer-facing application, which requires 99.95% availability and disaster recovery features. The FDS engineering team needed their Amazon Cognito infrastructure to be highly available in case of any service events in AWS Regions, along with having greater flexibility of switching between Regions.

The FDS engineering team worked on a custom solution using existing AWS services to fulfill their availability and recovery requirements. This solution not only serves the purpose of their current business needs but also provides recovery in case of any future disaster.

Overview of the solution

In this solution, we select two AWS Regions which will include the primary Region and the failover Region. Amazon Cognito app clients (including client ID and client secret pair) are created in both Regions and stored in an Amazon DynamoDB table. Client applications are given the client ID and client secret of the primary Region. Optionally, an application-generated ID and secret can be provided to the client to conceal the actual Amazon Cognito client ID and client secret. The process is as follows:

  • The client application (machine) initiates an authentication request by sending the Amazon Cognito app client ID and client secret to an Amazon Route 53 domain record.
  • Route 53 routes authentication requests to the in-Region Amazon API Gateway utilizing a Simple routing policy. From there, API Gateway shuts down the TLS connection using AWS Certificate Manager (ACM), and serves as a proxy for the authentication request to AWS Lambda.
  • AWS Lambda verifies the client ID and client secret, and uses them to look up the in-Region client ID and client secret.
  • Lambda uses preconfigured environment variables to request the appropriate Region from DynamoDB.
  • AWS Lambda then passes the returned app client credentials to the in-Region Amazon Cognito deployment. Amazon Cognito verifies the client ID and client secret, and returns an access token to the Lambda function.
  • The client application (machine) can now use this token to access downstream applications.
  • The client authentication process in the secondary (failover) Region is the same, with one exception. In the secondary Region, the Lambda environment variables retrieve app client credentials from the DynamoDB database for the secondary Region Amazon Cognito instance.

To initiate a failover between Regions, the Route 53 domain record needs to be pointed to the secondary Region API Gateway Regional endpoint. The downstream application’s Amazon Cognito configuration files must also be updated to point to the secondary Region Amazon Cognito instance. Alerts can be enabled using Amazon CloudWatch alarms to notify system operators of issues that may warrant a failover (a manual process to help system operators decide when to failover). The entire failover process takes just a couple of seconds for DNS to switch over and for the application to start accepting tokens from the secondary Region. This failover process could be automated based on generated alerts.

This architecture is suitable for a hot standby, active-passive type of application deployment. It is important to note that independent Amazon Cognito environments are being used in each Region, so you will need to set up your application to failover to the secondary Region for authentication. For example, your backend should be able to accept and validate access tokens from both primary and secondary Amazon Cognito user pools. To learn more about disaster recovery options in AWS, visit Disaster recovery options in the cloud.

Architecture overview

Figure 1 shows you how to build a multi-Region machine-to-machine architecture using Amazon Cognito, which uses DynamoDB global tables to perform the data replication. A Lambda function is utilized to retrieve the credentials for the active Region that the application is operating in, and a Regional Amazon Cognito endpoint returns the required token.

Figure 1. Multi-Region Amazon Cognito machine-to-machine architecture

Figure 1. Multi-Region Amazon Cognito machine-to-machine architecture

Process flow

  1. The Route53 domain record for the authentication proxy service is given to the client application and pointed at the API Gateway Regional endpoint. The client passes primary Region app client credentials to the API Gateway.
  2. API Gateway passes Lambda the client ID and client secret pair.
  3. Lambda does a lookup in DynamoDB to verify the client ID and client secret. After the identity is confirmed, Lambda uses Region-based environment variables to identify if the client should be using the primary Region or secondary Region for authenticating to Amazon Cognito. Lambda retrieves the Region-based client ID and client secret from DynamoDB.
  4. Lambda passes the Region-based app ID and secret to Amazon Cognito, which verifies the client ID and client secret, and returns an access token to the Lambda function.
  5. Lambda passes the access token from the Regional Amazon Cognito environment back to the client to be used against Region-based backend applications.

Prerequisites

For this walkthrough, you should have the following prerequisites:

Note: Ensure that you are following your organization’s security best practices while deploying this architecture.

Implementation

This implementation will focus on the Lambda logic that is used to retrieve user credentials based on Lambda environment variables. We will share snippets of the Lambda function code so you can create the logic necessary to enable multi-Region application architecture using Amazon Cognito app clients. In addition to the Lambda function, you will also need to create and configure the following resources using security implementation designated by your organization:

  1. DynamoDB table with fields primaryClientID, primaryClientSecret, secondaryClientID, and secondaryClientSecret.
    1. Because this table is used to store secrets, make sure encryption is enabled and you follow Security Best Practices for Amazon DynamoDB and your organization’s security best practices.
    2. Enable DynamoDB global tables.
  1. API Gateway Regional endpoint with TLS encryption using ACM.
  2. Route53 domain record routing traffic to Regional API Gateway.
  3. Downstream application configuration pointing at the Regional Amazon Cognito endpoint.
  4. IAM role that grants access from Lambda to DynamoDB.

Now let’s configure our Lambda function using Node.js language. Within the Lambda console create a new Lambda function that you will author from scratch. Select the Node.js runtime and change the runtime Lambda execution role to the IAM role that you have created for Lambda. Next, we will walk through the Lambda function code and configuration.

  1. Attach your new IAM role as a Lambda runtime role that will grant your Lambda function access to the DynamoDB table.
  2. Within the Lambda configuration environment variables, create several key-value variables in the Lambda function. The following are the environmental variables we will add.
    1. key: OAUTH_HOST_PRIMARY, value: https://${cognito-primary-region-domain-name}/oauth2/token
    2. key: OAUTH_HOST_SECONDARY, value: https://${cognito-secondary-region-domain-name}/oauth2/token
  1. Import the Node.js libraries using the following code.
"dependencies": {
    "aws-sdk": "^2.723.0",
    "aws-serverless-express": "^3.3.8",
    "axios": "^0.21.1",
    "base-64": "^1.0.0",
    "cors": "^2.8.5",
    "dotenv": "^8.2.0",
    "express": "^4.17.1",
    "jsonwebtoken": "^8.5.1",
    "jwt-decode": "^2.2.0",
    }
  1. Parse data from the incoming client application authentication request.
router.post("/", async (request, response) => {
  const client_id = request.body["client_id"];
  const client_secret = request.body["client_secret"]
      
  const client = await dynamoDB.getClientCredentialById(client_id, client_secret);
    
  if (client === undefined) {
    return response.status(400).json({
       message:
          "Client not configured for in Cognito. Please check with support team",
        });
      }
    
   const client_credentials = getClientCredentials(client);
   let access_token = await authService.getJwtToken(client_credentials);
          
   response.send(access_token);
});
  1. Reference the environment variables to determine the Region that the Lambda function is operating in and set the Region as primary or secondary.
getClientCredentials = client => {
   return region === "us-east-1" ? { clientId: client.primaryClientId, clientSecret: client.primaryClientSecret, oAuthHost: config.OAUTH_HOST }
   : region === "us-east-2" ? { clientId: client.secondaryClientId, clientSecret: client.secondaryClientSecret, oAuthHost: config.OAUTH_HOST_EAST_2 }
   : {};
}
  1. Verify the client ID and client secret against the DynamoDB table and get the Region-based client ID and client secret.
const getClientCredentialById = async (client_id, client_secret) => {

  let params = {
    TableName: clientCredentialTable,
    Key: {
      primaryClientId: client_id,
      primaryClientSecret: client_secret,
    },
  };

  const clientCredential = await ddb.get(params).promise();
  return clientCredential.Item;
};
  1. Pass the Regional client ID and client secret to Amazon Cognito. You will receive an access token from Amazon Cognito.
   const base64ClientCredentials = base64.encode(
     client_credentials.clientId.concat(":").concat(client_credentials.clientSecret)
   );
   const headers = {
     "content-type": "application/x-www-form-urlencoded",
     authorization: "Basic " + base64ClientCredentials,
    };
    const data = "grant_type=client_credentials";
    
    // Post request to Cognito OAuth URL
    const token = await Axios.post(client_credentials.oAuthHost, data, { headers });
    return token.data;
 };
  1. Pass the access token from the Regional Amazon Cognito environment back to the client to be used against Region-based backend applications.
let access_token = await authService.getJwtToken(client_credentials);
 
  response.send(access_token);

New app client creation

You need to implement this Lambda function in both the primary and secondary Regions. Modify the environmental variables in the secondary Region with the secondary Region’s information.

To enroll a new client in this multi-Region architecture using Amazon Cognito we will go through the process as shown in the following illustration.

Figure 2. Creating a new app client

Figure 2. Creating a new app client

You need to create a new:

  1. App ID and secret in Amazon Cognito in the primary Region.
  2. App ID and secret in Amazon Cognito in the secondary Region.
  3. Item in DynamoDB table consisting of the Amazon Cognito credentials created: primaryClientID, primaryClientSecret, secondaryClientID, and secondaryClientSecret.

Failover process

In this blog post we are creating a hot standby, active-passive type of application deployment. You will need to ensure your application is configured to be able to use either the primary Region Amazon Cognito or the secondary Region Amazon Cognito environment. The process to failover between Regions consists of the following:

  1. Start application backend in the secondary Region.
  2. Reconfigure the application backend Amazon Cognito identity provider YAML file to point at the secondary Region Amazon Cognito identity provider.
  3. Modify the Route 53 domain record to point client applications at the secondary Region API Gateway Regional endpoint.

Cleaning up

In order to avoid unnecessary charges, please be sure to clean up any resources that were built as part of this architecture that are no longer in use.

Conclusion

In this blog post, we presented a solution that allows you to failover Amazon Cognito app clients from one AWS Region to another Region. The benefits of this architecture will allow you to have greater flexibility for running your Amazon Cognito app clients in the Region that is best suited for your use case. With this solution you now have the capability to failover Amazon Cognito app clients to a different AWS Region in the event of application or system errors.

Several variants of this solution can be implemented using the provided Lambda failover logic. You can store App ID and secret in AWS Secrets Manager. To learn more, see How to replicate secrets in AWS Secrets Manager to multiple Regions. You can also automate the failover process between primary and secondary Regions. To accomplish this, you will need to evaluate events which should cause a failover in your environment. Later, build the appropriate automation to failover your downstream application to the secondary Region Amazon Cognito deployment.

Amazon Cognito can be used for machine authentication as per the limits posted in Quotas in Amazon Cognito. Review the limits of number of app clients per user pool and the other applicable rate limits (for example, client credentials rate limits) and verify that these limits meet the needs of your application.

Optum’s Story

UnitedHealth Group (UHG) is the health and well-being company responsible for over 150 million lives globally. Optum, a part of UnitedHealth Group, is a health services business serving the healthcare marketplace, including payers, care providers, employers, governments, life sciences companies and consumers, through its OptumHealth, OptumInsight, OptumRx, and OptumServe businesses.

Federated Data Services (FDS) is the power behind the scenes that enables interoperability and secure transmission of personally identifiable information. It protects health information between lines of businesses, technology systems, applications, members and providers. With FDS, data is centralized, making it easier to share and retrieve by other systems. This assures businesses get a flexible and scalable solution that adapts to changes in technology and business needs.

Expanding Your EC2 Possibilities By Utilizing the CPU Launch Options

Post Syndicated from limillan original https://aws.amazon.com/blogs/compute/expanding-your-ec2-possibilities-by-utilizing-the-cpu-launch-options/

This post is written by: Matthew Brunton, Senior Solutions Architect – WWPS

To ensure our customers have the appropriate machines available for their workloads, AWS offers a wide range of hardware options that include hundreds of types of instances that help customers achieve the best price performance for their workloads.  In some specialized circumstances, our customers need an even wider range of options, or more flexibility. This could be driven by a desire to optimize licensing costs, or the customer wanting more hardware configuration options. Some high performance workloads can improve by turning off simultaneous multithreading. In our AWS Well Architected Framework – High Performance Computing Lens we have the following recommendation “Unless an application has been tested with hyperthreading enabled, it is recommended that hyperthreading be disabled”. With these factors in mind, AWS offers the ability to configure some options regarding the CPU configuration in launched instances.

Our larger instance types that have a higher number of cores, and offer multithreaded cores will translate to a larger combination of potential options. The valid combinations of cores and threads per core can be found here. To consider utilizing the CPU options for both cores and threads per core, you will need to consider instance types that have multiple CPU’s and/or cores.

You can specify numerous CPU options for some of our larger instances via the console, command line interface, or the API. Moreover, you can remove CPUs from the launch configuration, or deactivate threading within CPUs that have multiple threads per core. Amazon Elastic Compute Cloud (Amazon EC2) FAQ’s for the Optimize CPU’s feature can be found here. You should be aware that this feature is only available during instance launch and cannot be modified after launch. The launch options persist after you reboot, stop, or start an instance.

You can easily determine how many CPUs and threads a machine has. There are numerous ways to see this via the AWS Management Console and the AWS Command Line Interface (CLI).

Within the AWS Management Console, under the ‘Instance Details’ section, opening up the ‘Host and placement group’ item reveals the number of vCPUs that your machine has.

Instance Details showing the number of vCPU's a particular EC2 machine has

Figure 1: Console details showing number of vCPU’s

This information is also available using the AWS CLI as follows:

aws ec2 describe-instances --region us-east-1 --filters "Name=instance-type,Values='c6i.*large'"

...
    "Instances": [
        {
            "Monitoring": {
                "State": "disabled"
            }, 
            "PrivateDnsName": "ip-172-31-44-121.ec2.internal",
 "PrivateIpAddress": "172.31.44.121",                              
 "State": {
                "Code": 16, 
                "Name": "running"
            }, 
            "EbsOptimized": false, 
            "LaunchTime": "2021-11-22T01:46:58+00:00",
            "ProductCodes": [], 
            "VpcId": " vpc-7f7f1502", 
            "CpuOptions": { "CoreCount": 32, "ThreadsPerCore": 1 }, 
            "StateTransitionReason": "", 
            ...
        }
    ]
...

Figure 2: ec2 describe-instances cli output

A handy AWS CLI command ‘describe-instance-types’ will show the list of valid cores, the possible threads-per-core, and the default values for the vCPUs and cores. These are listed in the ‘DefaultVCpus’ and ‘DefaultCores’ items in the returned JSON listed as follows.

aws ec2 describe-instance-types --region us-east-1 --filters "Name=instance-type,Values='c6i.*'"
{
    "InstanceTypes": [
        {
            "InstanceType": "c6i.4xlarge",
            "CurrentGeneration": true,
            "FreeTierEligible": false,
            "SupportedUsageClasses": [
                "on-demand",
                "spot"
            ],
            "SupportedRootDeviceTypes": [
                "ebs"
            ],
            "SupportedVirtualizationTypes": [
                "hvm"
            ],
            "BareMetal": false,
            "Hypervisor": "nitro",
            "ProcessorInfo": {
                "SupportedArchitectures": [
                    "x86_64"
                ],
                "SustainedClockSpeedInGhz": 3.5
            },
            "VCpuInfo": { "DefaultVCpus": 16, "DefaultCores": 8, "DefaultThreadsPerCore": 2, "ValidCores": [ 2, 4, 6, 8 ], "ValidThreadsPerCore": [ 1, 2 ] },
            "MemoryInfo": {
                "SizeInMiB": 32768
            },


Figure 3: ec2 describe-instance-types cli output

To utilize the AWS CLI to launch one or multiple instances, you should use the run instances CLI command.

The following is the shorthand syntax:

aws ec2 run-instances --image-id xxx --instance-type xxx --cpu-options “CoreCount=xx,ThreadsPerCore=xx” --key-name xxx --region xxx

For example, the following command launches a 32-core machine with only 1 thread per core instead of the standard 2 threads per core:

aws ec2 run-instances --image-id ami-0c2b8ca1dad447f8a --instance-type c6i.16xlarge
--cpu-options " CoreCount =32, ThreadsPerCore =1" --key-name MyKeyPair --region xxx

If you are using the CPU options parameters in CloudFormation templates, then the following applies:

https://docs.aws.amazon.com/AWSCloudFormation/latest/UserGuide/aws-properties-ec2-instance-cpuoptions.html

The following is an example of the YAML syntax for specifying the CPU configuration.

Resources:
  CustomEC2Instance:
    Type: "AWS::EC2::Instance"
    Properties:
      InstanceType: xxx
      ImageId: xxx
      CpuOptions:
CoreCount: xx
ThreadsPerCore: x

As can be seen in the following table, there are a number of valid CPU core options, as well as the option to set one or two threads per core for each CPU for certain instance types. This significantly opens up the number of combinations and permutations to meet your specific workload need. In the case of the c6i instance listed in the following table, there are an additional 32 CPU core and threading combinations available to customers.

Instance type Default vCPUs Default CPU cores Default threads per core Valid CPU cores Valid threads per core
c6i.16xlarge 64 32 2 2, 4, 6, 8, 10, 12, 14, 16, 18, 20, 22, 24, 26, 28, 30, 32 1, 2

Figure 4: Valid Core and Thread Launch Options

Note that you still pay the same amount for the EC2 instance, even if you deactivate some of the cores or threads.

Conclusion

This approach can let customers customize the EC2 hardware options even further to ensure a wider range of CPU/memory combinations over and above the already extensive AWS instance options. This lets customers finely tune hardware for their exact application requirements, whether that is running High Performance workloads or trying to save money where license restrictions mean you can benefit from a specific CPU configuration.

We have run through various scenarios in this post, which detailed how to launch instances with alternate CPU configurations, easily check the current configuration of your running instances via our API and console, and how to configure the options in CloudFormation templates.

We love to see our customers maximizing the flexibility of the AWS platform to deliver outstanding results. Have a look at some of your High Performance workloads and give the threading options a try, or take a deep dive into any of your more expensive licenses to see if you could benefit from an alternate CPU configuration. In order to get started, check out our detailed developer documentation for the optimize CPU options.

How GE Aviation automated engine wash analytics with AWS Glue using a serverless architecture

Post Syndicated from Giridhar G Jorapur original https://aws.amazon.com/blogs/big-data/how-ge-aviation-automated-engine-wash-analytics-with-aws-glue-using-a-serverless-architecture/

This post is authored by Giridhar G Jorapur, GE Aviation Digital Technology.

Maintenance and overhauling of aircraft engines are essential for GE Aviation to increase time on wing gains and reduce shop visit costs. Engine wash analytics provide visibility into the significant time on wing gains that can be achieved through effective water wash, foam wash, and other tools. This empowers GE Aviation with digital insights that help optimize water and foam wash procedures and maximize fuel savings.

This post demonstrates how we automated our engine wash analytics process to handle the complexity of ingesting data from multiple data sources and how we selected the right programming paradigm to reduce the overall time of the analytics job. Prior to automation, analytics jobs took approximately 2 days to complete and ran only on an as-needed basis. In this post, we learn how to process large-scale data using AWS Glue and by integrating with other AWS services such as AWS Lambda and Amazon EventBridge. We also discuss how to achieve optimal AWS Glue job performance by applying various techniques.

Challenges

When we considered automating and developing the engine wash analytics process, we observed the following challenges:

  • Multiple data sources – The analytics process requires data from different sources such as foam wash events from IoT systems, flight parameters, and engine utilization data from a data lake hosted in an AWS account.
  • Large dataset processing and complex calculations – We needed to run analytics for seven commercial product lines. One of the product lines has approximately 280 million records, which is growing at a rate of 30% year over year. We needed analytics to run against 1 million wash events and perform over 2,000 calculations, while processing approximately 430 million flight records.
  • Scalable framework to accommodate new product lines and calculations – Due to the dynamics of the use case, we needed an extensible framework to add or remove new or existing product lines without affecting the existing process.
  • High performance and availability – We needed to run analytics daily to reflect the latest updates in engine wash events and changes in flight parameter data.
  • Security and compliance – Because the analytics processes involve flight and engine-related data, the data distribution and access need to adhere to the stringent security and compliance regulations of the aviation industry.

Solution overview

The following diagram illustrates the architecture of our wash analytics solution using AWS services.

The solution includes the following components:

  • EventBridge (1) – We use an EventBridge (time-based) to schedule the daily process to capture the delta changes between the runs.
  • Lambda (2a) – Lambda orchestrates the AWS Glue jobs initiation, backup, and recovery on failure for each stage, utilizing EventBridge (event-based) for the alerting of these events.
  • Lambda (2b) – Foam cart events from IoT devices are loaded into staging buckets in Amazon Simple Storage Service (Amazon S3) daily.
  • AWS Glue (3) – The wash analytics need to handle a small subset of data daily, but the initial historical load and transformation is huge. Because AWS Glue is serverless, it’s easy to set up and run with no maintenance.
    • Copy job (3a) – We use an AWS Glue copy job to copy only the required subset of data from across AWS accounts by connecting to AWS Glue Data Catalog tables using a cross-account AWS Identity and Access Management (IAM) role.
    • Business transformation jobs (3b, 3c) – When the copy job is complete, Lambda triggers subsequent AWS Glue jobs. Because our jobs are both compute and memory intensive, we use G2.x worker nodes. We can use Amazon CloudWatch metrics to fine-tune our jobs to use the right worker nodes. To handle complex calculations, we split large jobs up into multiple jobs by pipelining the output of one job as input to another job.
  • Source S3 buckets (4a) – Flights, wash events, and other engine parameter data is available in source buckets in a different AWS account exposed via Data Catalog tables.
  • Stage S3 bucket (4b) – Data from another AWS account is required for calculations, and all the intermediate outputs from the AWS Glue jobs are written to the staging bucket.
  • Backup S3 bucket (4c) – Every day before starting the AWS Glue job, the previous day’s output from the output bucket is backed up in the backup bucket. In case of any job failure, the data is recovered from this bucket.
  • Output S3 bucket (4d) – The final output from the AWS Glue jobs is written to the output bucket.

Continuing our analysis of the architecture components, we also use the following:

  • AWS Glue Data Catalog tables (5) – We catalog flights, wash events, and other engine parameter data using Data Catalog tables, which are accessed by AWS Glue copy jobs from another AWS account.
  • EventBridge (6) – We use EventBridge (event-based) to monitor for AWS Glue job state changes (SUCEEDED, FAILED, TIMEOUT, and STOPPED) and orchestrate the workflow, including backup, recovery, and job status notifications.
  • IAM role (7) – We set up cross-account IAM roles to copy the data from one account to another from the AWS Glue Data Catalog tables.
  • CloudWatch metrics (8) – You can monitor many different CloudWatch metrics. The following metrics can help you decide on horizontal or vertical scaling when fine-tuning the AWS Glue jobs:
    • CPU load of the driver and executors
    • Memory profile of the driver
    • ETL data movement
    • Data shuffle across executors
    • Job run metrics, including active executors, completed stages, and maximum needed executors
  • Amazon SNS (9) Amazon Simple Notification Service (Amazon SNS) automatically sends notifications to the support group on the error status of jobs, so they can take corrective action upon failure.
  • Amazon RDS (10) – The final transformed data is stored in Amazon Relational Database Service (Amazon RDS) for PostgreSQL (in addition to Amazon S3) to support legacy reporting tools.
  • Web application (11) – A web application is hosted on AWS Elastic Beanstalk, and is enabled with Auto Scaling exposed for clients to access the analytics data.

Implementation strategy

Implementing our solution included the following considerations:

  • Security – The data required for running analytics is present in different data sources and different AWS accounts. We needed to craft well-thought-out role-based access policies for accessing the data.
  • Selecting the right programming paradigm – PySpark does lazy evaluation while working with data frames. For PySpark to work efficiently with AWS Glue, we created data frames with required columns upfront and performed column-wise operations.
  • Choosing the right persistence storage – Writing to Amazon S3 enables multiple consumption patterns, and writes are much faster due to parallelism.

If we’re writing to Amazon RDS (for supporting legacy systems), we need to watch out for database connectivity and buffer lock issues while writing from AWS Glue jobs.

  • Data partitioning – Identifying the right key combination is important for partitioning the data for Spark to perform optimally. Our initial runs (without data partition) with 30 workers of type G2.x took 2 hours and 4 minutes to complete.

The following screenshot shows our CloudWatch metrics.

After a few dry runs, we were able to arrive at partitioning by a specific column (df.repartition(columnKey)) and with 24 workers of type G2.x, the job completed in 2 hours and 7 minutes. The following screenshot shows our new metrics.

We can observe a difference in CPU and memory utilization—running with even fewer nodes shows a smaller CPU utilization and memory footprint.

The following table shows how we achieved the final transformation with the strategies we discussed.

Iteration Run Time AWS Glue Job Status Strategy
1 ~12 hours Unsuccessful/Stopped Initial iteration
2 ~9 hours Unsuccessful/Stopped Changing code to PySpark methodology
3 5 hours, 11 minutes Partial success Splitting a complex large job into multiple jobs
4 3 hours, 33 minutes Success Partitioning by column key
5 2 hours, 39 minutes Success Changing CSV to Parquet file format while storing the copied data from another AWS account and intermediate results in the stage S3 bucket
6 2 hours, 9 minutes Success Infra scaling: horizontal and vertical scaling

Conclusion

In this post, we saw how to build a cost-effective, maintenance-free solution using serverless AWS services to process large-scale data. We also learned how to gain optimal AWS Glue job performance with key partitioning, using the Parquet data format while persisting in Amazon S3, splitting complex jobs into multiple jobs, and using the right programming paradigm.

As we continue to solidify our data lake solution for data from various sources, we can use Amazon Redshift Spectrum to serve various future analytical use cases.


About the Authors

Giridhar G Jorapur is a Staff Infrastructure Architect at GE Aviation. In this role, he is responsible for designing enterprise applications, migration and modernization of applications to the cloud. Apart from work, Giri enjoys investing himself in spiritual wellness. Connect him on LinkedIn.

How ENGIE scales their data ingestion pipelines using Amazon MWAA

Post Syndicated from Anouar Zaaber original https://aws.amazon.com/blogs/big-data/how-engie-scales-their-data-ingestion-pipelines-using-amazon-mwaa/

ENGIE—one of the largest utility providers in France and a global player in the zero-carbon energy transition—produces, transports, and deals electricity, gas, and energy services. With 160,000 employees worldwide, ENGIE is a decentralized organization and operates 25 business units with a high level of delegation and empowerment. ENGIE’s decentralized global customer base had accumulated lots of data, and it required a smarter, unique approach and solution to align its initiatives and provide data that is ingestible, organizable, governable, sharable, and actionable across its global business units.

In 2018, the company’s business leadership decided to accelerate its digital transformation through data and innovation by becoming a data-driven company. Yves Le Gélard, chief digital officer at ENGIE, explains the company’s purpose: “Sustainability for ENGIE is the alpha and the omega of everything. This is our raison d’être. We help large corporations and the biggest cities on earth in their attempts to transition to zero carbon as quickly as possible because it is actually the number one question for humanity today.”

ENGIE, as with any other big enterprise, is using multiple extract, transform, and load (ETL) tools to ingest data into their data lake on AWS. Nevertheless, they usually have expensive licensing plans. “The company needed a uniform method of collecting and analyzing data to help customers manage their value chains,” says Gregory Wolowiec, the Chief Technology Officer who leads ENGIE’s data program. ENGIE wanted a free-license application, well integrated with multiple technologies and with a continuous integration, continuous delivery (CI/CD) pipeline to more easily scale all their ingestion process.

ENGIE started using Amazon Managed Workflows for Apache Airflow (Amazon MWAA) to solve this issue and started moving various data sources from on-premise applications and ERPs, AWS services like Amazon Redshift, Amazon Relational Database Service (Amazon RDS), Amazon DynamoDB, external services like Salesforce, and other cloud providers to a centralized data lake on top of Amazon Simple Storage Service (Amazon S3).

Amazon MWAA is used in particular to collect and store harmonized operational and corporate data from different on-premises and software as a service (SaaS) data sources into a centralized data lake. The purpose of this data lake is to create a “group performance cockpit” that enables an efficient, data-driven analysis and thoughtful decision-making by the Engie Management board.

In this post, we share how ENGIE created a CI/CD pipeline for an Amazon MWAA project template using an AWS CodeCommit repository and plugged it into AWS CodePipeline to build, test, and package the code and custom plugins. In this use case, we developed a custom plugin to ingest data from Salesforce based on the Airflow Salesforce open-source plugin.

Solution overview

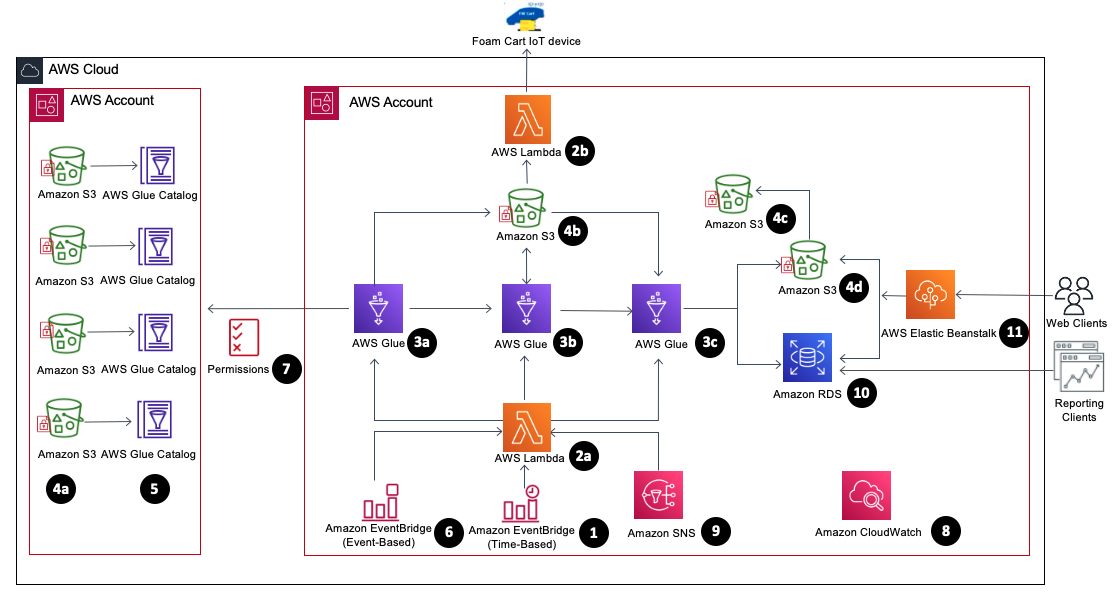
The following diagrams illustrate the solution architecture defining the implemented Amazon MWAA environment and its associated pipelines. It also describes the customer use case for Salesforce data ingestion into Amazon S3.

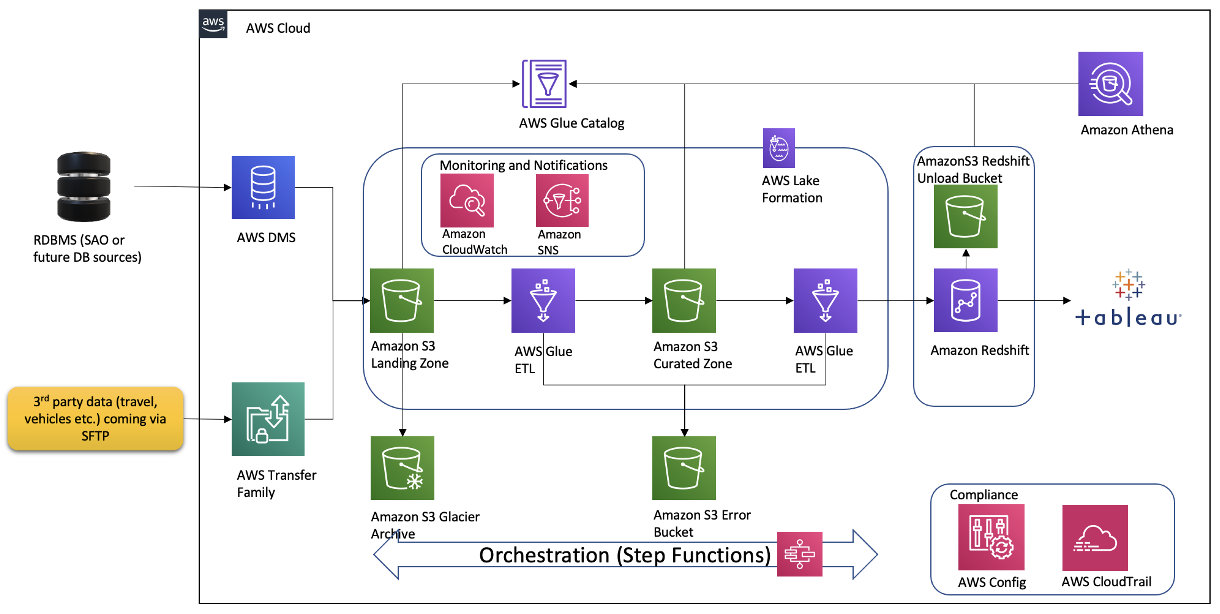
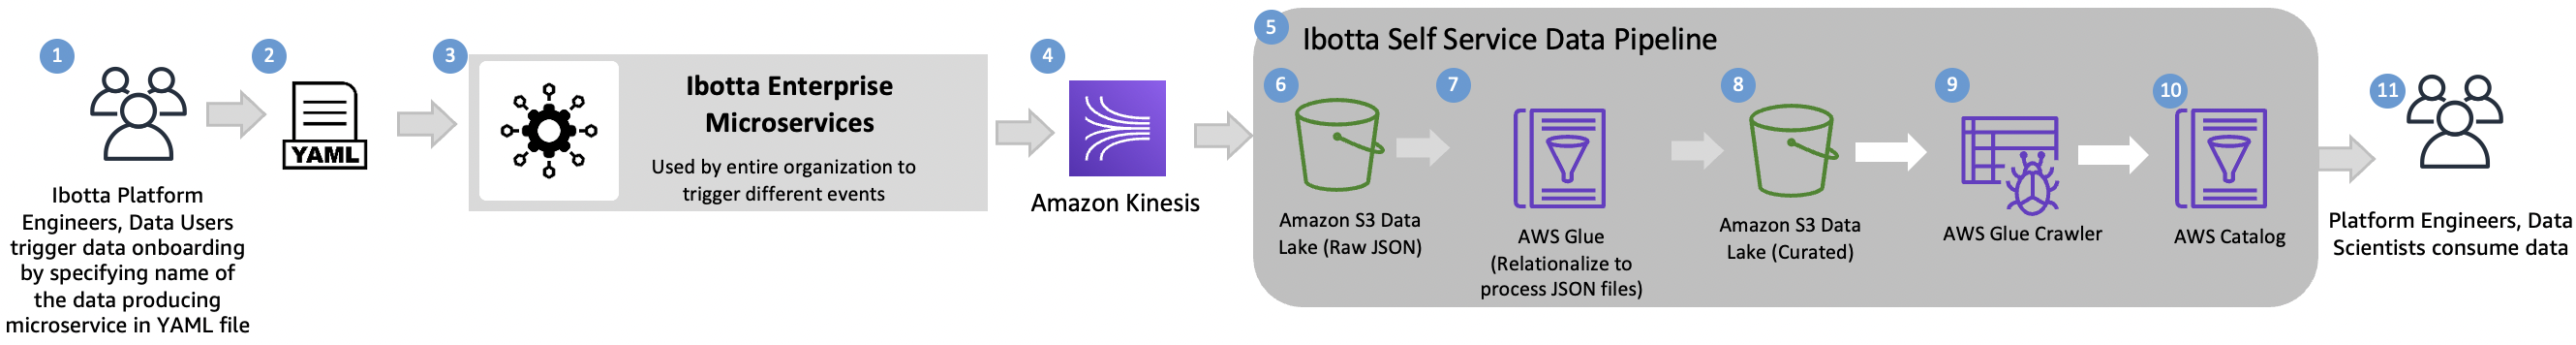
The following diagram shows the architecture of the deployed Amazon MWAA environment and the implemented pipelines.

The preceding architecture is fully deployed via infrastructure as code (IaC). The implementation includes the following:

  • Amazon MWAA environment – A customizable Amazon MWAA environment packaged with plugins and requirements and configured in a secure manner.
  • Provisioning pipeline – The admin team can manage the Amazon MWAA environment using the included CI/CD provisioning pipeline. This pipeline includes a CodeCommit repository plugged into CodePipeline to continuously update the environment and its plugins and requirements.
  • Project pipeline – This CI/CD pipeline comes with a CodeCommit repository that triggers CodePipeline to continuously build, test and deploy DAGs developed by users. Once deployed, these DAGs are made available in the Amazon MWAA environment.

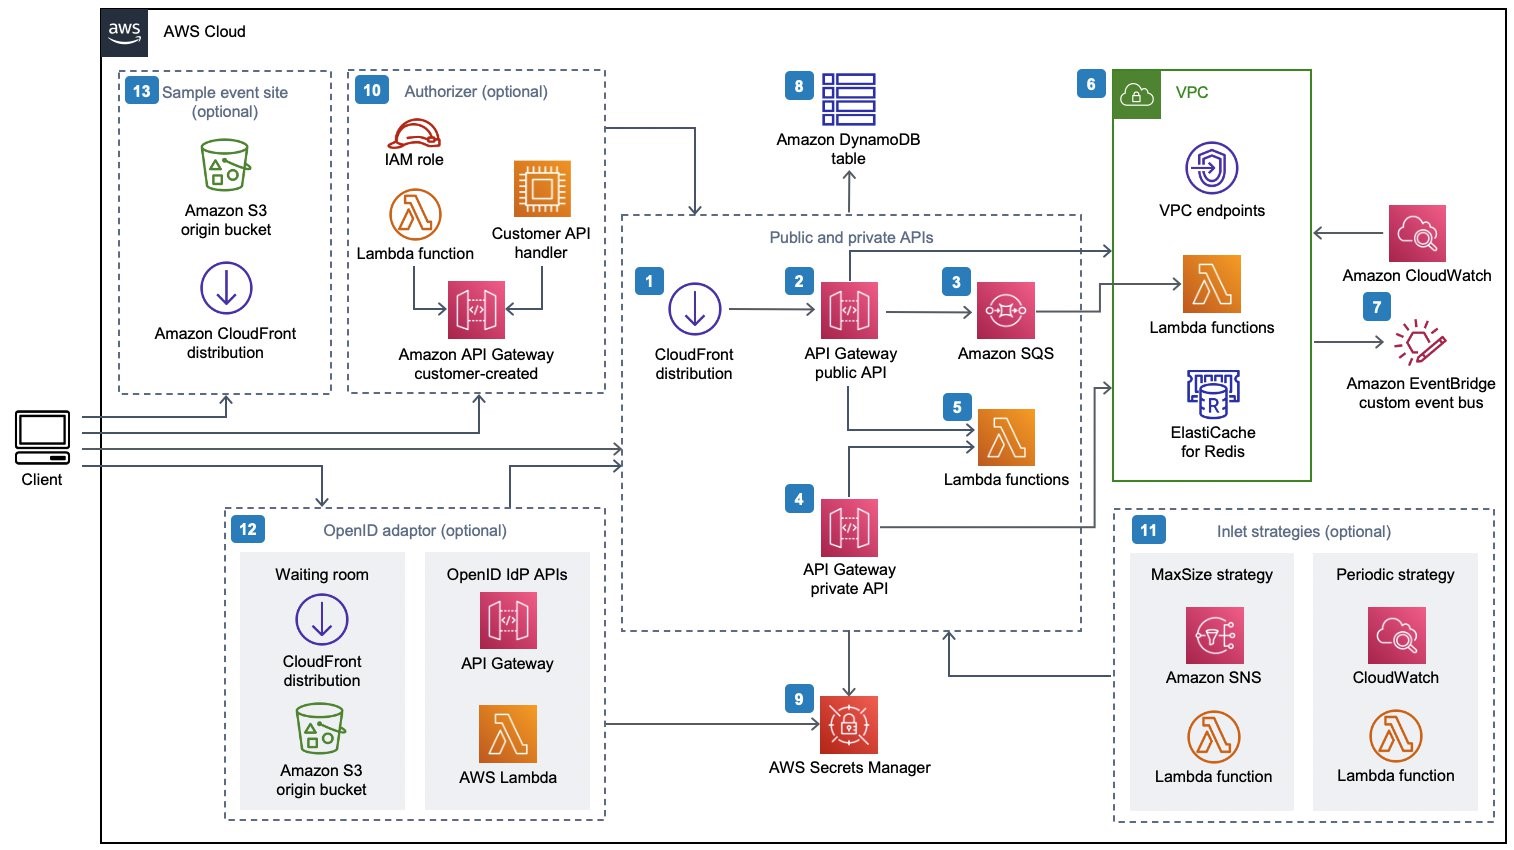
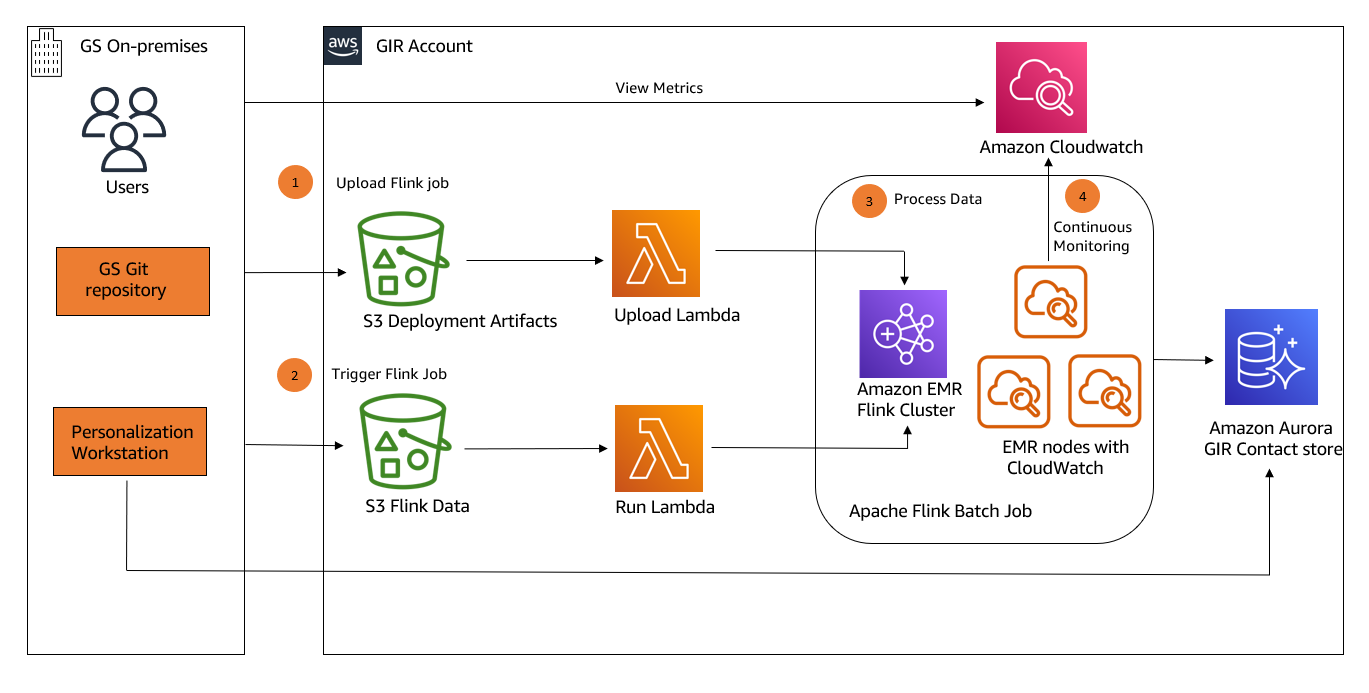
The following diagram shows the data ingestion workflow, which includes the following steps:

  1. The DAG is triggered by Amazon MWAA manually or based on a schedule.
  2. Amazon MWAA initiates data collection parameters and calculates batches.
  3. Amazon MWAA distributes processing tasks among its workers.
  4. Data is retrieved from Salesforce in batches.
  5. Amazon MWAA assumes an AWS Identity and Access Management (IAM) role with the necessary permissions to store the collected data into the target S3 bucket.

This AWS Cloud Development Kit (AWS CDK) construct is implemented with the following security best practices:

  • With the principle of least privilege, you grant permissions to only the resources or actions that users need to perform tasks.
  • S3 buckets are deployed with security compliance rules: encryption, versioning, and blocking public access.
  • Authentication and authorization management is handled with AWS Single Sign-On (AWS SSO).
  • Airflow stores connections to external sources in a secure manner either in Airflow’s default secrets backend or an alternative secrets backend such as AWS Secrets Manager or AWS Systems Manager Parameter Store.

For this post, we step through a use case using the data from Salesforce to ingest it into an ENGIE data lake in order to transform it and build business reports.

Prerequisites for deployment

For this walkthrough, the following are prerequisites:

  • Basic knowledge of the Linux operating system
  • Access to an AWS account with administrator or power user (or equivalent) IAM role policies attached
  • Access to a shell environment or optionally with AWS CloudShell

Deploy the solution

To deploy and run the solution, complete the following steps:

  1. Install AWS CDK.
  2. Bootstrap your AWS account.
  3. Define your AWS CDK environment variables.
  4. Deploy the stack.

Install AWS CDK

The described solution is fully deployed with AWS CDK.

AWS CDK is an open-source software development framework to model and provision your cloud application resources using familiar programming languages. If you want to familiarize yourself with AWS CDK, the AWS CDK Workshop is a great place to start.

Install AWS CDK using the following commands:

npm install -g aws-cdk
# To check the installation
cdk --version

Bootstrap your AWS account

First, you need to make sure the environment where you’re planning to deploy the solution to has been bootstrapped. You only need to do this one time per environment where you want to deploy AWS CDK applications. If you’re unsure whether your environment has been bootstrapped already, you can always run the command again:

cdk bootstrap aws://YOUR_ACCOUNT_ID/YOUR_REGION

Define your AWS CDK environment variables

On Linux or MacOS, define your environment variables with the following code:

export CDK_DEFAULT_ACCOUNT=YOUR_ACCOUNT_ID
export CDK_DEFAULT_REGION=YOUR_REGION

On Windows, use the following code:

setx CDK_DEFAULT_ACCOUNT YOUR_ACCOUNT_ID
setx CDK_DEFAULT_REGION YOUR_REGION

Deploy the stack

By default, the stack deploys a basic Amazon MWAA environment with the associated pipelines described previously. It creates a new VPC in order to host the Amazon MWAA resources.

The stack can be customized using the parameters listed in the following table.

To pass a parameter to the construct, you can use the AWS CDK runtime context. If you intend to customize your environment with multiple parameters, we recommend using the cdk.json context file with version control to avoid unexpected changes to your deployments. Throughout our example, we pass only one parameter to the construct. Therefore, for the simplicity of the tutorial, we use the the --context or -c option to the cdk command, as in the following example:

cdk deploy -c paramName=paramValue -c paramName=paramValue ...
Parameter Description Default Valid values
vpcId VPC ID where the cluster is deployed. If none, creates a new one and needs the parameter cidr in that case. None VPC ID
cidr The CIDR for the VPC that is created to host Amazon MWAA resources. Used only if the vpcId is not defined. 172.31.0.0/16 IP CIDR
subnetIds Comma-separated list of subnets IDs where the cluster is deployed. If none, looks for private subnets in the same Availability Zone. None Subnet IDs list (coma separated)
envName Amazon MWAA environment name MwaaEnvironment String
envTags Amazon MWAA environment tags None See the following JSON example: '{"Environment":"MyEnv", "Application":"MyApp", "Reason":"Airflow"}'
environmentClass Amazon MWAA environment class mw1.small mw1.small, mw1.medium, mw1.large
maxWorkers Amazon MWAA maximum workers 1 int
webserverAccessMode Amazon MWAA environment access mode (private or public) PUBLIC_ONLY PUBLIC_ONLY, PRIVATE_ONLY
secretsBackend Amazon MWAA environment secrets backend Airflow SecretsManager

Clone the GitHub repository:

git clone https://github.com/aws-samples/cdk-amazon-mwaa-cicd

Deploy the stack using the following command:

cd mwaairflow && \
pip install . && \
cdk synth && \
cdk deploy -c vpcId=YOUR_VPC_ID

The following screenshot shows the stack deployment:

The following screenshot shows the deployed stack:

Create solution resources

For this walkthrough, you should have the following prerequisites:

If you don’t have a Salesforce account, you can create a SalesForce developer account:

  1. Sign up for a developer account.
  2. Copy the host from the email that you receive.
  3. Log in into your new Salesforce account
  4. Choose the profile icon, then Settings.
  5. Choose Reset my Security Token.
  6. Check your email and copy the security token that you receive.

After you complete these prerequisites, you’re ready to create the following resources:

  • An S3 bucket for Salesforce output data
  • An IAM role and IAM policy to write the Salesforce output data on Amazon S3
  • A Salesforce connection on the Airflow UI to be able to read from Salesforce
  • An AWS connection on the Airflow UI to be able to write on Amazon S3
  • An Airflow variable on the Airflow UI to store the name of the target S3 bucket

Create an S3 bucket for Salesforce output data

To create an output S3 bucket, complete the following steps:

  1. On the Amazon S3 console, choose Create bucket.

The Create bucket wizard opens.

  1. For Bucket name, enter a DNS-compliant name for your bucket, such as airflow-blog-post.
  2. For Region, choose the Region where you deployed your Amazon MWAA environment, for example, US East (N. Virginia) us-east-1.
  3. Choose Create bucket.

For more information, see Creating a bucket.

Create an IAM role and IAM policy to write the Salesforce output data on Amazon S3

In this step, we create an IAM policy that allows Amazon MWAA to write on your S3 bucket.

  1. On the IAM console, in the navigation pane, choose Policies.
  2. Choose Create policy.
  3. Choose the JSON tab.
  4. Enter the following JSON policy document, and replace airflow-blog-post with your bucket name:
    {
      "Version": "2012-10-17",
      "Statement": [
        {
          "Effect": "Allow",
          "Action": ["s3:ListBucket"],
          "Resource": ["arn:aws:s3:::airflow-blog-post"]
        },
        {
          "Effect": "Allow",
          "Action": [
            "s3:PutObject",
            "s3:GetObject",
            "s3:DeleteObject"
          ],
          "Resource": ["arn:aws:s3:::airflow-blog-post/*"]
        }
      ]
    }

  5. Choose Next: Tags.
  6. Choose Next: Review.
  7. For Name, choose a name for your policy (for example, airflow_data_output_policy).
  8. Choose Create policy.

Let’s attach the IAM policy to a new IAM role that we use in our Airflow connections.

  1. On the IAM console, choose Roles in the navigation pane and then choose Create role.
  2. In the Or select a service to view its use cases section, choose S3.
  3. For Select your use case, choose S3.
  4. Search for the name of the IAM policy that we created in the previous step (airflow_data_output_role) and select the policy.
  5. Choose Next: Tags.
  6. Choose Next: Review.
  7. For Role name, choose a name for your role (airflow_data_output_role).
  8. Review the role and then choose Create role.

You’re redirected to the Roles section.

  1. In the search box, enter the name of the role that you created and choose it.
  2. Copy the role ARN to use later to create the AWS connection on Airflow.

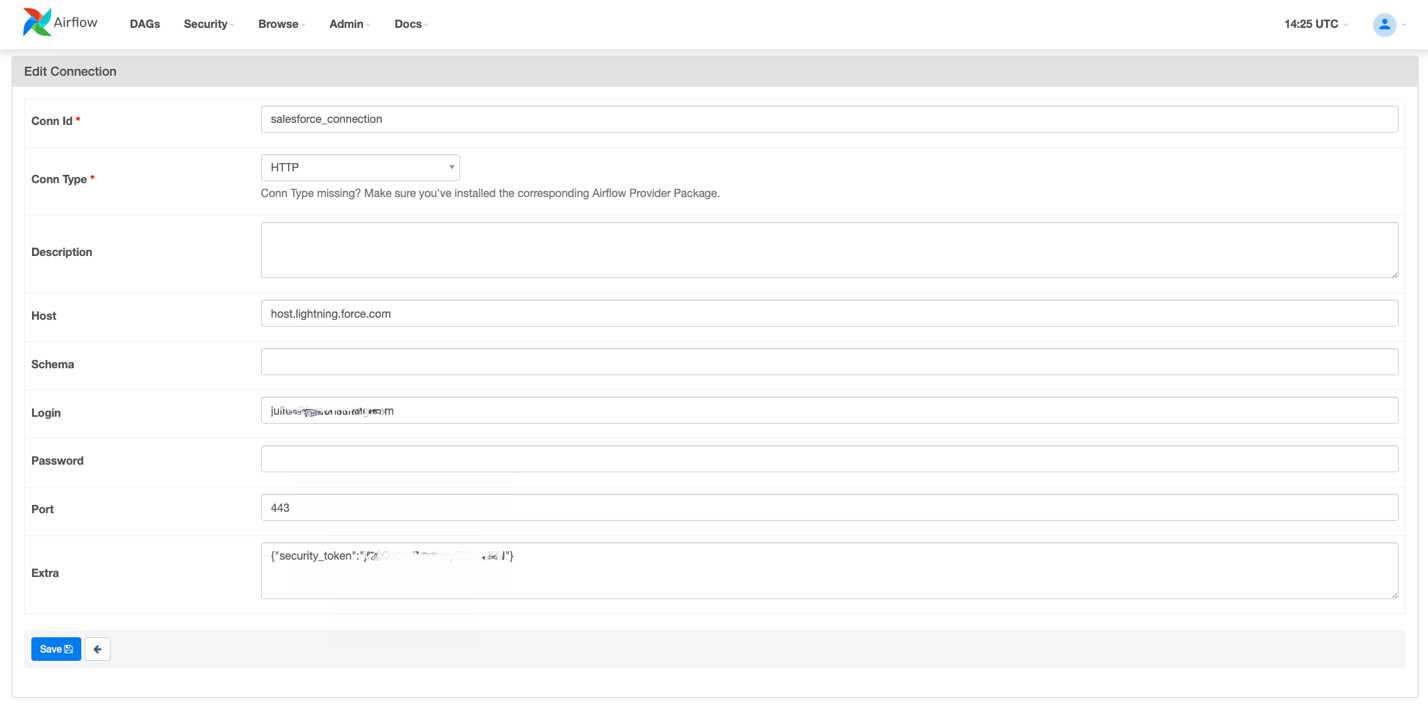
Create a Salesforce connection on the Airflow UI to be able to read from Salesforce

To read data from Salesforce, we need to create a connection using the Airflow user interface.

  1. On the Airflow UI, choose Admin.
  2. Choose Connections, and then the plus sign to create a new connection.
  3. Fill in the fields with the required information.

The following table provides more information about each value.

Field Mandatory Description Values
Conn Id Yes Connection ID to define and to be used later in the DAG For example, salesforce_connection
Conn Type Yes Connection type HTTP
Host Yes Salesforce host name host-dev-ed.my.salesforce.com or host.lightning.force.com. Replace the host with your Salesforce host and don’t add the http:// as prefix.
Login Yes The Salesforce user name. The user must have read access to the salesforce objects. [email protected]
Password Yes The corresponding password for the defined user. MyPassword123
Port No Salesforce instance port. By default, 443. 443
Extra Yes Specify the extra parameters (as a JSON dictionary) that can be used in the Salesforce connection. security_token is the Salesforce security token for authentication. To get the Salesforce security token in your email, you must reset your security token. {"security_token":"AbCdE..."}

Create an AWS connection in the Airflow UI to be able to write on Amazon S3

An AWS connection is required to upload data into Amazon S3, so we need to create a connection using the Airflow user interface.

  1. On the Airflow UI, choose Admin.
  2. Choose Connections, and then choose the plus sign to create a new connection.
  3. Fill in the fields with the required information.

The following table provides more information about the fields.

Field Mandatory Description Value
Conn Id Yes Connection ID to define and to be used later in the DAG For example, aws_connection
Conn Type Yes Connection type Amazon Web Services
Extra Yes It is required to specify the Region. You also need to provide the role ARN that we created earlier.
{
"region":"eu-west-1",
"role_arn":"arn:aws:iam::123456789101:role/airflow_data_output_role "
}

Create an Airflow variable on the Airflow UI to store the name of the target S3 bucket

We create a variable to set the name of the target S3 bucket. This variable is used by the DAG. So, we need to create a variable using the Airflow user interface.

  1. On the Airflow UI, choose Admin.
  2. Choose Variables, then choose the plus sign to create a new variable.
  3. For Key, enter bucket_name.
  4. For Val, enter the name of the S3 bucket that you created in a previous step (airflow-blog-post).

Create and deploy a DAG in Amazon MWAA

To be able to ingest data from Salesforce into Amazon S3, we need to create a DAG (Directed Acyclic Graph). To create and deploy the DAG, complete the following steps:

  1. Create a local Python DAG.
  2. Deploy your DAG using the project CI/CD pipeline.
  3. Run your DAG on the Airflow UI.
  4. Display your data in Amazon S3 (with S3 Select).

Create a local Python DAG

The provided SalesForceToS3Operator allows you to ingest data from Salesforce objects to an S3 bucket. Refer to standard Salesforce objects for the full list of objects you can ingest data from with this Airflow operator.

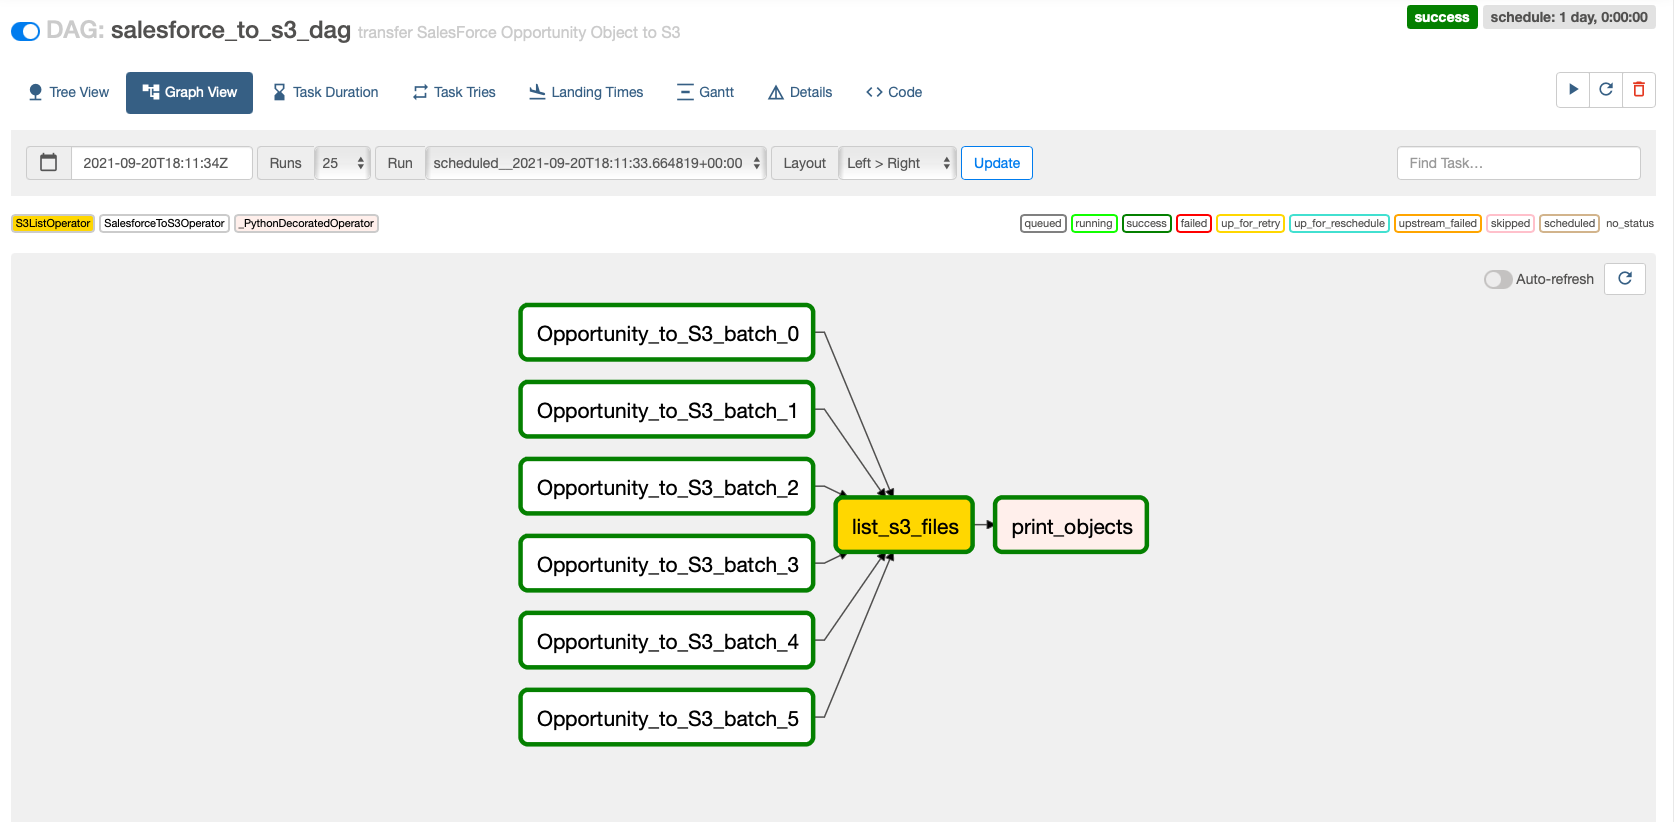
In this use case, we ingest data from the Opportunity Salesforce object. We retrieve the last 6 months’ data in monthly batches and we filter on a specific list of fields.

The DAG provided in the sample in GitHub repository imports the last 6 months of the Opportunity object (one file by month) by filtering the list of retrieved fields.

This operator takes two connections as parameters:

  • An AWS connection that is used to upload ingested data into Amazon S3.
  • A Salesforce connection to read data from Salesforce.

The following table provides more information about the parameters.

Parameter Type Mandatory Description
sf_conn_id string Yes Name of the Airflow connection that has the following information:

  • user name
  • password
  • security token
sf_obj string Yes Name of the relevant Salesforce object (Account, Lead, Opportunity)
s3_conn_id string Yes The destination S3 connection ID
s3_bucket string Yes The destination S3 bucket
s3_key string Yes The destination S3 key
sf_fields string No The (optional) list of fields that you want to get from the object (Id, Name, and so on).
If none (the default), then this gets all fields for the object.
fmt string No The (optional) format that the S3 key of the data should be in.
Possible values include CSV (default), JSON, and NDJSON.
from_date date format No A specific date-time (optional) formatted input to run queries from for incremental ingestion.
Evaluated against the SystemModStamp attribute.
Not compatible with the query parameter and should be in date-time format (for example, 2021-01-01T00:00:00Z).
Default: None
to_date date format No A specific date-time (optional) formatted input to run queries to for incremental ingestion.
Evaluated against the SystemModStamp attribute.
Not compatible with the query parameter and should be in date-time format (for example, 2021-01-01T00:00:00Z).
Default: None
query string No A specific query (optional) to run for the given object.
This overrides default query creation.
Default: None
relationship_object string No Some queries require relationship objects to work, and these are not the same names as the Salesforce object.
Specify that relationship object here (optional).
Default: None
record_time_added boolean No Set this optional value to true if you want to add a Unix timestamp field to the resulting data that marks when the data was fetched from Salesforce.
Default: False
coerce_to_timestamp boolean No Set this optional value to true if you want to convert all fields with dates and datetimes into Unix timestamp (UTC).
Default: False

The first step is to import the operator in your DAG:

from operators.salesforce_to_s3_operator import SalesforceToS3Operator

Then define your DAG default ARGs, which you can use for your common task parameters:

# These args will get passed on to each operator
# You can override them on a per-task basis during operator initialization
default_args = {
    'owner': '[email protected]',
    'depends_on_past': False,
    'start_date': days_ago(2),
    'retries': 0,
    'retry_delay': timedelta(minutes=1),
    'sf_conn_id': 'salesforce_connection',
    's3_conn_id': 'aws_connection',
    's3_bucket': 'salesforce-to-s3',
}
...

Finally, you define the tasks to use the operator.

The following examples illustrate some use cases.

Salesforce object full ingestion

This task ingests all the content of the Salesforce object defined in sf_obj. This selects all the object’s available fields and writes them into the defined format in fmt. See the following code:

...
salesforce_to_s3 = SalesforceToS3Operator(
    task_id="Opportunity_to_S3",
    sf_conn_id=default_args["sf_conn_id"],
    sf_obj="Opportunity",
    fmt="ndjson",
    s3_conn_id=default_args["s3_conn_id"],
    s3_bucket=default_args["s3_bucket"],
    s3_key=f"salesforce/raw/dt={s3_prefix}/{table.lower()}.json",
    dag=salesforce_to_s3_dag,
)
...

Salesforce object partial ingestion based on fields

This task ingests specific fields of the Salesforce object defined in sf_obj. The selected fields are defined in the optional sf_fields parameter. See the following code:

...
salesforce_to_s3 = SalesforceToS3Operator(
    task_id="Opportunity_to_S3",
    sf_conn_id=default_args["sf_conn_id"],
    sf_obj="Opportunity",
    sf_fields=["Id","Name","Amount"],
    fmt="ndjson",
    s3_conn_id=default_args["s3_conn_id"],
    s3_bucket=default_args["s3_bucket"],
    s3_key=f"salesforce/raw/dt={s3_prefix}/{table.lower()}.json",
    dag=salesforce_to_s3_dag,
)
...

Salesforce object partial ingestion based on time period

This task ingests all the fields of the Salesforce object defined in sf_obj. The time period can be relative using from_date or to_date parameters or absolute by using both parameters.

The following example illustrates relative ingestion from the defined date:

...
salesforce_to_s3 = SalesforceToS3Operator(
    task_id="Opportunity_to_S3",
    sf_conn_id=default_args["sf_conn_id"],
    sf_obj="Opportunity",
    from_date="YESTERDAY",
    fmt="ndjson",
    s3_conn_id=default_args["s3_conn_id"],
    s3_bucket=default_args["s3_bucket"],
    s3_key=f"salesforce/raw/dt={s3_prefix}/{table.lower()}.json",
    dag=salesforce_to_s3_dag,
)
...

The from_date and to_date parameters support Salesforce date-time format. It can be either a specific date or literal (for example TODAY, LAST_WEEK, LAST_N_DAYS:5). For more information about date formats, see Date Formats and Date Literals.

For the full DAG, refer to the sample in GitHub repository.

This code dynamically generates tasks that run queries to retrieve the data of the Opportunity object in the form of 1-month batches.

The sf_fields parameter allows us to extract only the selected fields from the object.

Save the DAG locally as salesforce_to_s3.py.

Deploy your DAG using the project CI/CD pipeline

As part of the CDK deployment, a CodeCommit repository and CodePipeline pipeline were created in order to continuously build, test, and deploy DAGs into your Amazon MWAA environment.

To deploy the new DAG, the source code should be committed to the CodeCommit repository. This triggers a CodePipeline run that builds, tests, and deploys your new DAG and makes it available in your Amazon MWAA environment.

  1. Sign in to the CodeCommit console in your deployment Region.
  2. Under Source, choose Repositories.

You should see a new repository mwaaproject.

  1. Push your new DAG in the mwaaproject repository under dags. You can either use the CodeCommit console or the Git command line to do so:
    1. CodeCommit console:
      1. Choose the project CodeCommit repository name mwaaproject and navigate under dags.
      2. Choose Add file and then Upload file and upload your new DAG.
    2. Git command line:
      1. To be able to clone and access your CodeCommit project with the Git command line, make sure Git client is properly configured. Refer to Setting up for AWS CodeCommit.
      2. Clone the repository with the following command after replacing <region> with your project Region:
        git clone https://git-codecommit.<region>.amazonaws.com/v1/repos/mwaaproject

      3. Copy the DAG file under dags and add it with the command:
        git add dags/salesforce_to_s3.py

      4. Commit your new file with a message:
        git commit -m "add salesforce DAG"

      5. Push the local file to the CodeCommit repository:
        git push

The new commit triggers a new pipeline that builds, tests, and deploys the new DAG. You can monitor the pipeline on the CodePipeline console.

  1. On the CodePipeline console, choose Pipeline in the navigation pane.
  2. On the Pipelines page, you should see mwaaproject-pipeline.
  3. Choose the pipeline to display its details.

After checking that the pipeline run is successful, you can verify that the DAG is deployed to the S3 bucket and therefore available on the Amazon MWAA console.

  1. On the Amazon S3 console, look for a bucket starting with mwaairflowstack-mwaaenvstackne and go under dags.

You should see the new DAG.

  1. On the Amazon MWAA console, choose DAGs.

You should be able to see the new DAG.

Run your DAG on the Airflow UI

Go to the Airflow UI and toggle on the DAG.

This triggers your DAG automatically.

Later, you can continue manually triggering it by choosing the run icon.

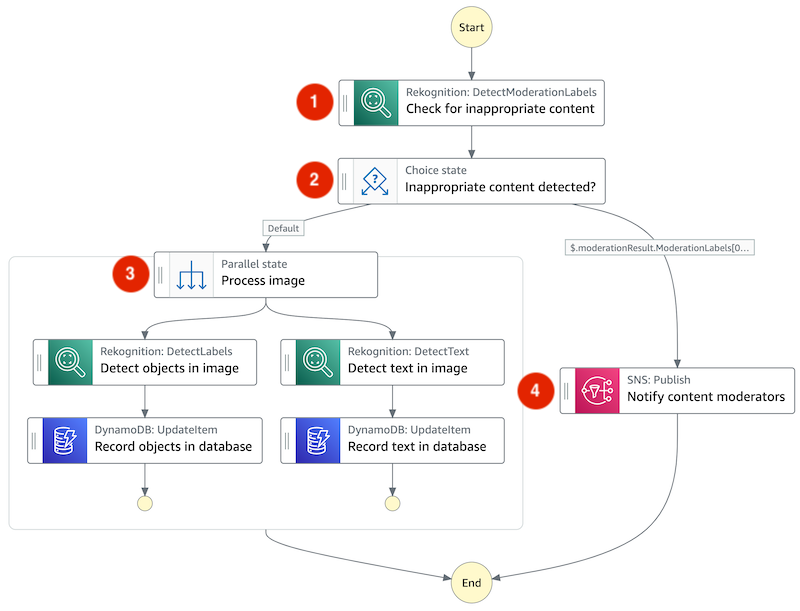
Choose the DAG and Graph View to see the run of your DAG.

If you have any issue, you can check the logs of the failed tasks from the task instance context menu.

Display your data in Amazon S3 (with S3 Select)

To display your data, complete the following steps:

  1. On the Amazon S3 console, in the Buckets list, choose the name of the bucket that contains the output of the Salesforce data (airflow-blog-post).
  2. In the Objects list, choose the name of the folder that has the object that you copied from Salesforce (opportunity).
  3. Choose the raw folder and the dt folder with the latest timestamp.
  4. Select any file.
  5. On the Actions menu, choose Query with S3 Select.
  6. Choose Run SQL query to preview the data.

Clean up

To avoid incurring future charges, delete the AWS CloudFormation stack and the resources that you deployed as part of this post.

  1. On the AWS CloudFormation console, delete the stack MWAAirflowStack.

To clean up the deployed resources using the AWS Command Line Interface (AWS CLI), you can simply run the following command:

cdk destroy MWAAirflowStack

Make sure you are in the root path of the project when you run the command.

After confirming that you want to destroy the CloudFormation stack, the solution’s resources are deleted from your AWS account.

The following screenshot shows the process of deploying the stack:

The following screenshot confirms the stack is undeployed.

  1. Navigate to the Amazon S3 console and locate the two buckets containing mwaairflowstack-mwaaenvstack and mwaairflowstack-mwaaproj that were created during the deployment.
  2. Select each bucket delete its contents, then delete the bucket.
  3. Delete the IAM role created to write on the S3 buckets.

Conclusion

ENGIE discovered significant value by using Amazon MWAA, enabling its global business units to ingest data in more productive ways. This post presented how ENGIE scaled their data ingestion pipelines using Amazon MWAA. The first part of the post described the architecture components and how to successfully deploy a CI/CD pipeline for an Amazon MWAA project template using a CodeCommit repository and plug it into CodePipeline to build, test, and package the code and custom plugins. The second part walked you through the steps to automate the ingestion process from Salesforce using Airflow with an example. For the Airflow configuration, you used Airflow variables, but you can also use Secrets Manager with Amazon MWAA using the secretsBackend parameter when deploying the stack.

The use case discussed in this post is just one example of how you can use Amazon MWAA to make it easier to set up and operate end-to-end data pipelines in the cloud at scale. For more information about Amazon MWAA, check out the User Guide.


About the Authors

Anouar Zaaber is a Senior Engagement Manager in AWS Professional Services. He leads internal AWS, external partner, and customer teams to deliver AWS cloud services that enable the customers to realize their business outcomes.

Amine El Mallem is a Data/ML Ops Engineer in AWS Professional Services. He works with customers to design, automate, and build solutions on AWS for their business needs.

Armando Segnini is a Data Architect with AWS Professional Services. He spends his time building scalable big data and analytics solutions for AWS Enterprise and Strategic customers. Armando also loves to travel with his family all around the world and take pictures of the places he visits.

Mohamed-Ali Elouaer is a DevOps Consultant with AWS Professional Services. He is part of the AWS ProServe team, helping enterprise customers solve complex problems related to automation, security, and monitoring using AWS services. In his free time, he likes to travel and watch movies.

Julien Grinsztajn is an Architect at ENGIE. He is part of the Digital & IT Consulting ENGIE IT team working on the definition of the architecture for complex projects related to data integration and network security. In his free time, he likes to travel the oceans to meet sharks and other marine creatures.

Enhance Your Contact Center Solution with Automated Voice Authentication and Visual IVR

Post Syndicated from Soonam Jose original https://aws.amazon.com/blogs/architecture/enhance-your-contact-center-solution-with-automated-voice-authentication-and-visual-ivr/

Recently, the Accenture AWS Business Group (AABG) assisted a customer in developing a secure and personalized Interactive Voice Response (IVR) contact center experience that receives and processes payments and responds to customer inquiries.

Our solution uses Amazon Connect at its core to help customers efficiently engage with customer service agents. To ensure transactions are completed securely and to prevent fraud, the architecture provides voice authentication using Amazon Connect Voice ID and a visual portal to submit payments. The visual IVR feature allows customers to easily provide the required information online while the IVR is on standby. The solution also provides agents the information they need to effectively and efficiently understand and resolve callers’ inquiries, which helps improve the quality of their service.

Overview of solution

Our IVR is designed using Contact Flows on Amazon Connect and uses the following services:

  • Amazon Lex provides the voice-based intent analysis. Intent analysis is the process of determining the underlying intention behind customer interactions.
  • Amazon Connect integrates with other AWS services using AWS Lambda.
  • Amazon DynamoDB stores customer data.
  • Amazon Pinpoint notifies customers via text and email.
  • AWS Amplify provides the customized agent dashboard and generates the visual IVR portal.

Figure 1 shows how this architecture routes customer calls:

  1. Callers dial the main line to interact with the IVR in Amazon Connect.
  2. Amazon Connect Voice ID sets up a voiceprint for first time callers or performs voice authentication for repeat callers for added security.
  3. Upon successful voice authentication, callers can proceed to IVR self-service functions, such as checking their account balance or making a payment. Amazon Lex handles the voice intent analysis.
  4. When callers make a payment request, they are given the option to be handed off securely to a visual IVR portal to process their payment.
  5. If a caller requests to be connected to an agent, the agent will be presented with the customer’s information and IVR interaction details on their agent dashboard.
Architecture diagram

Figure 1. Architecture diagram

Customer IVR experience

Figure 2 describes how callers navigate through the IVR:

  1. The IVR asks the caller the purpose of the call.
  2. The caller’s answer is sent for voice intent analysis. The IVR also attempts to authenticate the caller’s voice using Amazon Connect Voice ID. If authenticated, the caller is automatically routed to the correct flow based on the analyzed intent.
    • For the “Account Balance” flow, the caller is provided the account balance information.
    • For the “Make a Payment” flow, the caller can use the IVR or a visual IVR portal to process the payment. Upon payment completion, the caller is immediately notified their transaction has completed via SMS or email. Both flows allow the caller to be transferred to an agent. The caller also has the option to be called back when an agent becomes available or choose a specific date and time for the callback.
Customer IVR experience diagram

Figure 2. Customer IVR experience diagram

The intelligent self-service IVR solution includes the following features:

  • The IVR can redirect callers to a payment portal for scenarios like making a payment while the IVR remains on standby.
  • IVR transaction tracking helps agents understand the current status of the caller’s transaction and quickly determines the caller’s situation.
  • Callers have the option to receive a call as soon as the next agent becomes available or they can schedule a time that works for them to receive a callback.
  • IVR activity logging gives agents a detailed summary of the caller’s actions within the IVR.
  • Transaction confirmation which notifies callers of successful transactions via SMS or email.

Solution walkthrough

Amazon Connect Voice ID authenticates a caller’s voice as an added level of security. It requires 30 seconds to create the initial enrollment voiceprint and 10 seconds of a caller’s voice to authenticate. If there is not enough net speech to perform the voice authentication, the IVR asks the caller more questions, such as their first name and last name, until it has collected enough net speech.

The IVR falls back to dual tone multi-frequency (DTMF) input for the caller’s credentials in case the system cannot successfully authenticate. This can include information like the last four digits of their national identification number or postal code.

In contact flows, you will enable voice authentication by adding the “Set security behavior” contact block and specifying the authentication threshold, as shown in Figure 3.

Set security behavior contact block

Figure 3. Set security behavior contact block

Figure 4 shows the “Check security status” contact block, which determines if the user has been successfully authenticated or not. It also shows results that it may return if the caller is not successfully authenticated, including, “Not authenticated,” “Inconclusive,” “Not enrolled,” “Opted out,” and “Error.”

Check security status contact block

Figure 4. Check security status contact block

Providing a personalized experience for callers

To provide a personalized experience for callers, sample customer data is stored in a DynamoDB table. A Lambda function queries this table when callers call the contact center. The query returns information about the caller, such as their name, so the IVR can offer a customized greeting.

Transaction tracking

The table can also query if a customer previously called and attempted to make a payment but didn’t complete it successfully. This feature is called “transaction tracking.” Here’s how it works:

  • When the caller progresses through the “make a payment” flow, a field in the table is updated to reflect their transaction’s status.
  • If the payment is abandoned, the status in the table remains open, and the IVR prompts the caller to pick up where they left off the next time they call.
  • Once they have successfully completed their payment, we update the status in the table to “complete.”
  • When the IVR confirms that the caller’s payment has gone through, they will receive a confirmation via SMS and email. A Lambda function in the contact flow receives the caller’s phone number and email address. Then it distributes the confirmation messages via Amazon Pinpoint.

If a call is escalated to an agent, the “Check contact attributes” contact block in Figure 5 helps to check the caller’s intent and provide the agent with a customized whisper.

Agent whisper sample contact flow

Figure 5. Agent whisper sample contact flow

Making payments via the payment portal

To make a payment, an Amazon Lex bot presents the caller with the option to provide payment details over the phone or through a visual IVR portal.

If they choose to use the visual IVR portal (Figure 6), they can enter their payment details while maintaining an open phone connection with the contact center, in case they need additional assistance. Here’s how it works:

  • When callers select to use the payment portal, it prompts a Lambda function that generates a universally unique identifier (UUID) and provides the caller a unique PIN.
  • The UUID and PIN are stored in the DynamoDB table along with the caller’s information.
  • Another Lambda function generates a secure link using the UUID. It then uses Amazon Pinpoint to send the link to the caller over text message to their phone number on record. When they open the link, they are prompted to enter their unique PIN.
  • Then, the webpage makes an API call that validates the payment request by comparing the entered PIN to the PIN stored in the DynamoDB table.
  • Once validated, the caller can enter their payment information.
Visual IVR portal

Figure 6. Visual IVR portal

Figure 7 illustrates visual IVR portal contact flow:

  • Every 10 seconds, a Lambda function checks the caller’s payment status. It provides the caller the option to escalate to an agent if they have questions.
  • If the caller does not fill out all the information when they hit “Submit Payment,” an IVR prompt will ask them to provide all payment details before proceeding.
  • The IVR phone call stays active until the user’s payment status is updated to “complete” in the DynamoDB table. This generates an IVR prompt stating that their payment was successful.
Visual IVR portal sample contact flow

Figure 7. Visual IVR portal sample contact flow

Generating a chat transcript for agents

When the customer’s call is escalated to an agent, the agent receives a chat transcript. Here’s how it works:

  • After the caller’s intent is captured at the start of the call, the IVR logs activity using a “Set contact attribute” contact block, which prompts the $.Lex.SessionAttributes.transcript.
  • This transcript is used in a Lambda function to build a chat interface.
  • This transcript is shown on the agent’s dashboard, along with the Contact Control Panel (CCP) and a few key pieces of caller information.
IVR transcript

Figure 8. IVR transcript

The agent’s customized dashboard and the visual IVR portal are deployed and hosted on Amplify. This allows us to seamlessly connect to our code repository and automate deployments after changes are committed. It removed the need to configure Amazon Simple Storage Service (Amazon S3) buckets, an Amazon CloudFront distribution, and Amazon Route 53 DNS to host our front-end components.

This solution also offers callers the ability to opt-in for a callback or to schedule a callback. A “Check queue status” contact block checks the current time in queue, and if it reaches a certain threshold, the IVR will offer a callback. The caller has the option to receive a call as soon as the next agent becomes available or to schedule a time to receive a callback. A Lex bot gathers the date and time slots, which are then passed to a Lambda function that will validate the proposed callback option.

Once confirmed, the scheduled callback is placed into a DynamoDB table along with the caller’s phone number. Another Lambda function scans the table every 5 minutes to see if there are any callbacks scheduled within that 5-minute time period. You’ll add an Amazon EventBridge prompt to the Lambda function that specifies a schedule expression like cron(0/5 8-17 ? * MON-FRI *), which means the Lambda function will execute every 5 minutes, Monday through Friday from 8:00 AM to 4:55 PM.

Conclusion

This solution helps you increase customer satisfaction by making it easier for callers to complete transactions over the phone. The visual IVR provides added web-based support experience to submit payments. It also improves the quality of service of your customer service agents by making relevant information available to agents during the call.

This solution also allows you to scale out the resources to handle increasing demand. Custom features can easily be added using serverless technology, such as Lambda functions or other cloud-native services on AWS.

Ready to get started? The AABG helps customers accelerate their pace of digital innovation and realize incremental business value from cloud adoption and transformation. Connect with our team at [email protected] to learn how to use machine learning in your products and services.

Looking for more architecture content? AWS Architecture Center provides reference architecture diagrams, vetted architecture solutions, Well-Architected best practices, patterns, icons, and more!

Connecting an Industrial Universal Namespace to AWS IoT SiteWise using HighByte Intelligence Hub

Post Syndicated from Michael Brown original https://aws.amazon.com/blogs/architecture/connecting-an-industrial-universal-namespace-to-aws-iot-sitewise-using-highbyte-intelligence-hub/

This post was co-authored with Michael Brown, Sr. Manufacturing Specialist Architect, AWS; Dr. Rajesh Gomatam, Sr. Partner Solutions Architect, Industrial Software Specialist, AWS; Scott Robertson, Sr. Partner Solutions Architect, Manufacturing, AWS; John Harrington, Chief Business Officer, HighByte; and Aron Semie, Chief Technology Officer, HighByte

Merging industrial and enterprise data across multiple on-premises deployments and industrial verticals can be challenging. This data comes from a complex ecosystem of industrial-focused products, hardware, and networks from various companies and service providers. This drives the creation of data silos and isolated systems that propagate one-to-one integration strategy.

To avoid these issues and scale industrial IoT implementations, you must have a universal namespace. This software solution acts as a centralized repository for data, information, and context, where any application or device can consume and publish data needed for a specific action.

HighByte Intelligence Hub does just that. It is a middleware solution for universal namespace that helps you build scalable, modern industrial data pipelines in AWS. It also allows users to collect data from various sources, add context to the data being collected, and transform it to a format that other systems can understand.

Overview of solution

HighByte Intelligence Hub, illustrated in Figure 1, lets you configure a single dedicated abstraction layer (HighByte refers to this as the DataOps layer). This allows you to connect with various vendor schema standards, protocols, and databases. From there, you can model data and apply context for data sustainability.

HighByte Intelligence Hub

Figure 1. HighByte Intelligence Hub

HighByte Intelligence Hub uses a unique modeling engine. This allows you to act on real-time data to transform, normalize, and combine it with other sources into an asset model. This model can be deployed and reused as necessary. It represents the real world, and it is available to multiple connections and configurable flow paths simultaneously.

For example, Figure 2 shows a model of a hydronic heating system that was created with HighByte Intelligence Hub.

Creating a model of a hydronic heating system in HighByte Intelligence Hub

Figure 2. Creating a model of a hydronic heating system in HighByte Intelligence Hub

With this model, you can define a connection to AWS IoT SiteWise and publish the model directly. This way, the general model and the instance of the model will immediately be available in AWS.

This model can also:

  • Send the temperature and current information from this system to a database for reporting. You can do this without changing anything from the original configuration.
  • Add another connection in HighByte Intelligence Hub for AWS IoT Core (MQTT) and publish the existing model information to the fully managed AWS IoT Core service.
  • Stream the hydronic data into an industrial data lake on AWS, as shown in Figure 3, by adding an Amazon Kinesis Data Firehose connection in HighByte Intelligence Hub and attaching the existing flows to it.
AWS reference architecture for HighByte Intelligence Hub

Figure 3. AWS reference architecture for HighByte Intelligence Hub

The next sections will take a closer look at how to configure HighByte Intelligence Hub to work with AWS.

Prerequisites

For this walkthrough, you must have the following prerequisites:

Note that this post shows the major steps to connect HighByte Intelligence Hub to AWS IoT SiteWise; we will not dive too deeply into all areas of configuration. Please refer to the HighByte Intelligence Hub documentation for specific questions and the AWS service documentation for a full explanation.

Let’s get started!

  1. After logging into HighByte Intelligence Hub, create connections to AWS by selecting the “Connections” tab on the menu on the top right corner of the screen.

Figure 4 shows the following four connections to AWS resources:

  • AWS IoT Core – US East 1 Region
  • AWS IoT SiteWise – US East 1 Region
  • Kinesis Data Firehose – US East 1 Region
  • AWS IoT Greengrass edge device – located on-premises
HighByte Intelligence Hub AWS connections

Figure 4. HighByte Intelligence Hub AWS connections

For each connection, HighByte Intelligence Hub uses native AWS security and connectivity patterns. Figure 5 shows the AWS IoT SiteWise connection settings as an example.

AWS IoT SiteWise connection settings

Figure 5. AWS IoT SiteWise connection settings

Figure 5 shows where to provide an AWS access key and secret key that’s attached to an appropriate AWS Identity and Access Management (IAM) role. This role must have the required AWS IoT SiteWise permissions.

  1. Now that you have your connections created, let’s build a model. Select “Modeling” on the menu on the top right corner of the screen. Define all the attribute names and the data types that you want to include in the model. When you are finished, you should have something that looks like Figure 6, which shows the attribute names, attribute types, if it is an array or not, and if it a required attribute for the model.
HighByte Intelligence Hub hydronic heating model

Figure 6. HighByte Intelligence Hub hydronic heating model

  1. Next, create an instance of the asset model. To do this, use the “Actions” dropdown menu on the upper right corner and select “create instance,” because it will preserve your model name.
Hydronic model instance

Figure 7. Hydronic model instance

As shown in Figure 7, you can produce a standardized model and attach normalized labels that map multiple protocols such as OPC, MQTT, and SQL data sources. In our example, our data sources are all MQTT.

  1. Now, take your new model instance and assign a flow (Figure 8) that details the source and destination.
HighByte Intelligence Hub flow

Figure 8. HighByte Intelligence Hub flow

In this step, as shown in Figure 8, drag and drop the instance of the hydronic model from the right side of the screen to the “Sources” box in the middle of the screen. Then, change the reference type to “Output” from the dropdown menu, select AWS IoT SiteWise as the connection, and drag and drop the AWS IoT SiteWise instance to the “Target” box.

From here, you’ll select the following flow settings, as shown on Figure 9:

  • Interval – How often you send data
  • Mode – Always send, On-Change, On-True, or While True
  • Publish Mode – All Data, Only Changes, Only Changes Compressed
  • Enabled – On or Off

Once you turn the Enabled switch to On and submit, your data will show up in AWS IoT SiteWise.

HighByte Intelligence Hub flow settings

Figure 9. HighByte Intelligence Hub flow settings

Now you’ve configured your MQTT data sources, created a HighByte Intelligence Hub model and instance, and defined a flow to send the data to AWS IoT SiteWise!

Next, let’s see how your model and data are represented.

When HighByte Intelligence Hub first connects to AWS IoT SiteWise, the hub creates an AWS IoT SiteWise model. The model is configured through the AWS IoT SiteWise API. As shown in Figure 10, the name and type from the HighByte Intelligence Hub model are copied to the measurement name and data type in the AWS IoT SiteWise model. Likewise, the AWS IoT SiteWise model name will inherit from the HighByte Intelligence Hub model name.

AWS IoT SiteWise model

Figure 10. AWS IoT SiteWise model

After the model has been created, HighByte Intelligence Hub will create an AWS IoT SiteWise asset using the model it just created. The asset name will be inherited from the hub instance name. As Figure 11 shows, data will flow from the HighByte Intelligence Hub input data source and through the flow definition, using the attributes defined in the model.

AWS IoT SiteWise asset

Figure 11. AWS IoT SiteWise asset

The final step in this process is to set up a visualization of the data in the AWS IoT SiteWise portal by creating a dashboard and adding visualization to it. After you do this, the display shown in Figure 12 will update as new data comes into AWS IoT SiteWise.

AWS IoT SiteWise portal dashboard

Figure 12. AWS IoT SiteWise portal dashboard

Conclusion

HighByte Intelligence Hub is the first industrial DataOps solution designed specifically for operational technology and information technology teams. It allows you to securely connect, merge, model, and flow industrial data to enterprise systems in AWS Cloud without writing or maintaining code.

This post showed you how to integrate HighByte Intelligence Hub with AWS to quickly model and extract data so that multiple teams can simultaneously analyze, interpret, and use the data without constraint and generate rich data models in minutes.

Ready to get started? Try out HighByte Intelligence Hub today.

Developing a Platform for Software-defined Vehicles with Continental Automotive Edge (CAEdge)

Post Syndicated from Martin Stamm original https://aws.amazon.com/blogs/architecture/developing-a-platform-for-software-defined-vehicles-with-continental-automotive-edge-caedge/

This post was co-written by Martin Stamm, Principal Expert SW Architecture at Continental Automotive, Andreas Falkenberg, Senior Consultant at AWS Professional Services, Daniel Krumpholz, Engagement Manager at AWS Professional Services, David Crescence, Sr. Engagement Manager at AWS, and Junjie Tang, Principal Consultant at AWS Professional Services.

Automakers are embarking on a digital transformation journey to become more agile, efficient, and innovative. As part of this transformation, Continental created Continental Automotive Edge (CAEdge) – a modular multi-tenant hardware and software framework that connects the vehicle to the cloud. Continental collaborated with Amazon Web Services (AWS) to develop and scale this framework.

At this AWS re:Invent session, Continental and AWS demonstrated the new and transformative vehicle architectures and software built with CAEdge. These will provide future vehicle manufacturers, Original equipment manufacturers (OEMs) and partners with a multi-tenant development environment for software-intensive vehicle architectures. These can be used to implement software, sensor and big data solutions in a fraction of the development time needed before. As a result, vehicle software can be developed and tested more efficiently, then securely and rolled out directly to vehicles. The framework is already being tested in an automotive manufacturer’s series development.

Addressing core automotive industry pain points

Continental, OEMs and other major Tier 1 companies are required to quickly adapt to new technology requirements without knowing capacity or scaling needs, while at the same time staying ahead of the market. Developers are facing several challenges, in particular the processing of huge amounts of data. For example, a single test vehicle for AV/ADAS generates 20 – 100 TB of data per day. The handling of these data sets and the time to availability in distributed sites can cause major delays in development cycles. Delays are also experienced by developers due to the high numbers of test cases in simulation and validation. In an on-premises environment, this poses significant costs and scaling challenges to provide the required capacity.

The pace of the required transformation to becoming a software-centric organization is creating new challenges and opportunities like:

  • Current electronic architectures are decentralized, expensive, and complex to develop therefore difficult to maintain and extend.
  • Vehicle and cloud converge require new software (SW)-defined architectures, integration and operations competencies.
  • Digital Lifecycle Management enables new business models, go- to-market strategies and partnerships.

In addition to the distribution of huge datasets and distributed work setups is a need for cutting edge security technologies. Encryption at transfer/rest, data residency laws, and secure developer access are common security challenges and are addressed using CAEdge technology.

In this blog post, we describe how to build a secure multi-tenant AWS environment that forms the foundation for CAEdge. We discuss how AWS is helping Continental build the base infrastructure that allows for fast onboarding of OEMs, partners and suppliers through a highly automated process. Development activities can start within hours, instead of days or weeks; with a bootstrapped development environment for software-intensive vehicle architectures. This is all while meeting the strictest security and compliance requirements.

Overview of the CAEdge Framework

The following diagram gives an overview of the CAEdge Framework:

Architecture Diagram showing the CAEdge Platform

Figure 1 – Architecture Diagram showing the CAEdge Framework

The framework is based on the following modular building blocks:

  • Scalable Compute Platform – High Performance, embedded computer with automotive software stack and connection to the AWS cloud.
  • Cloud – Cloud services for developers and end-users.
  • DevOps Workbench – Toolchain for software development and maintenance covering the entire software lifecycle.

The building blocks of the framework are defined by clear API operations and can be integrated easily for various use cases, such as different middleware or CI / CD pipelines.

Overview of the CAEdge Multi-Tenant Framework

Continentals’ core architecture and terminology for a vehicle software development framework include:

  • CAEdge Framework as an Isolated AWS Organization – Continental’s CAEdge framework runs in a dedicated AWS Organization. Only CAEdge-related workloads are hosted in this AWS Organization. This ensures separation from any other workloads outside of the CAEdge context. The CAEdge framework provides multiple central security, access management, and orchestration services to its users.
  • Isolated Tenants – The framework is fully tenant-aware. A tenant is an isolated entity that represents an OEM, OEM sub-division, partner, or supplier. A key feature of this system is to ensure complete isolation from one tenant to another. We use a defense-in-depth security approach to ensure tenant separation.
  • Tenant-Owned Resources and Services – Each tenant has a dedicated set of resources and services that can be consumed and used by all tenant users and services. Tenant-owned resources and services include, but are not limited to:
    • Dedicated, tenant-specific data lake,
    • Tenant specific logging, monitoring, and operations,
    • Tenant-specific UI.
  • Projects – Each tenant can host an arbitrary number of projects with 1-N users assigned to them. A project is a high-level construct with the goal to create a unique product or service, such as a new “Door Lock” system software. The term project is used in a broad scope. Anything can be classified as a project.
  • Workbenches – A project consists of 1-N well-defined workbenches. A workbench represents a fully configured development environment of a specific “Workbench Type”. For example, a workbench of type “Simulation” allows for configuration and execution of Simulation Jobs based on drive data. Each workbench is implemented via a well-defined number of AWS Accounts, which is called an AWS Account Set.
    • An AWS Account Set always includes at least a Toolchain Account, Dev Account, QA Account and Prod Account. All AWS Accounts are baselined with IAM resources, security services and potentially workbench specific blueprints so development can start quickly for the end-user.

The following diagram illustrates the high-level architecture:

Figure 2 – High-level architecture diagram

Figure 2 – High-level architecture diagram

The CAEdge framework uses a data mesh architecture using AWS Lake Formation and Glue to create the tenant-level data lake. The Reference Architecture for Autonomous Driving Data Lake is used to design the Simulation workbench.

Implementation Details

With the core architecture and terminology defined, let’s look at the implementation details of the architecture that was described in the preceding image.

Isolated Tenants – Achieving a High Degree of Separation

To achieve a multi-tenant environment, we followed a multi-layered security hardening approach:

  • Tenant Separation on AWS Account Level: Starting at the AWS Account level, we used individual AWS Accounts where possible. An AWS account can never be assigned to more than one tenant. The functional scope of an AWS Account is kept as small as possible. This increases the number of total AWS Accounts, but significantly reduces the blast radius in case of any breach or incident. Just to give an example:
    • Each Dev, QA, and Prod Stage of a Workbench is its own AWS Account. No AWS Account ever combines multiple stages at once.
    • Each CAEdge tenant-owned data lake consists of multiple AWS Accounts. A data lake also requires updates as time passes. To allow for side-effect free and well tested updates of the data lake-infrastructure, each tenant comes with a Dev, QA, and Prod data lake.
  • Tenant Separation via a well-defined Organizational Unit (OU) structure and Service Control Policies (SCP): Each Tenant gets assigned a dedicated OU structure with multiple sub-OUs. This allows for tenant-specific security hardening on SCP-level and potential custom security hardening, in case dedicated tenants have specific security requirements. The SCPs are designed in such a way to allow for a maximum degree of freedom for the individual AWS Account user; while at the same time protecting the integrity of CAEdge and while staying compliant and secure according to specific requirements.
  • Tenant Separation through an AWS Account Metadata-Layer and automated IAM assignments: The CAedge framework uses a central Amazon DynamoDB database that maps AWS Accounts to Tenants and stores any other Metadata in the Context of an AWS Account. This includes including the Account Owner, Account Type, and Cost-related information. With this database, we can query AWS Accounts based on specific Tenants, Projects, and Workbenches. Furthermore, this forms the foundation of a fully automated permission and AWS Account access-management capability that enforces any Tenant, Project and Workbench boundary.
  • Tenant Separation Security Controls via AWS Security Services: On top of the standard AWS security services, such as AWS GuardDuty, AWS Config, AWS Inspector and AWS SecurityHub, we use IAM Access Analyzer in combination with our DynamoDB Account Metadata Store to detect the creation of any cross-account permissions that span outside of the AWS Organization, or that may have Cross-Tenant implications.

Automated creation and management of Tenant-Owned Resources and Services, Projects and Workbenches

CAEdge follows the “Everything-as-an-API Approach” and is designed as a fully open platform on the internet. All key features are exposed via a secured, public API. This includes the creation of Projects, Workbenches, and AWS Accounts including the management of access rights in a self-service manner for authorized users, as well as any updates affecting subsequent long-term management. This can only be achieved through a very high degree of automation.

We architect the following services to achieve this high degree of automation:

  • AWS Control Tower – An AWS managed service for account creation and OU assignment.
  • AWS Deployment Framework (AWS ADF) – an extensive and flexible framework to manage and deploy resources across multiple AWS Accounts and Regions within an AWS Organization. We use ADF to baseline all accounts with the resources required. This includes all security services, default IAM Roles, network related resources, such as VPCs and DNS and any other resources specific to the AWS Account type.
  • AWS Single Sign-On (AWS SSO) – A central IAM solution to control access to AWS Accounts. AWS SSO assignments are fully automated based on our defined access patterns using our custom Dispatch application and an extended version of the AWS SSO Enterprise solution.
  • AWS DynamoDB – A fully managed NoSQL database service for storing tenant, project and AWS Account data. Including information related to ownership, cost management, access management.
  • Dispatch CAEdge Web Application – A fully serverless web application that exposes functionality to end-users via API calls. It handles authentication, authorization, and provides business logic in the form of AWS Lambda functions to orchestrate all of the aforementioned services.

The following diagram provides a high-level overview of the automation mechanism at the platform level:

Figure 3 – High-level overview of the automation mechanism

Figure 3 – High-level overview of the automation mechanism

With this solution in place, Continental enables OEMs, suppliers, and other partners to spin up developer workbenches in a tenant context within minutes; thereby reducing the setup time from weeks to minutes using a self-service approach.

Conclusion

In this post, we showed how Continental built a secure multi-tenant platform that serves as the scalable foundation for software-intensive, vehicle-related workloads. For other organizations experiencing challenges when transforming into a software-centric organization, this solution eases the onboarding process so developers can start building within hours instead of months.

How fEMR Delivers Cryptographically Secure and Verifiable Medical Data with Amazon QLDB

Post Syndicated from Patrick Gryczka original https://aws.amazon.com/blogs/architecture/how-femr-delivers-cryptographically-secure-and-verifiable-emr-medical-data-with-amazon-qldb/

This post was co-written by Team fEMR’s President & Co-founder, Sarah Draugelis; CTO, Andy Mastie; Core Team Engineer & Fennel Labs Co-founder, Sean Batzel; Patrick Gryczka, AWS Solutions Architect; Mithil Prasad, AWS Senior Customer Solutions Manager.

Team fEMR is a non-profit organization that created a free, open-source Electronic Medical Records system for transient medical teams.  Their system has helped bring aid and drive data driven communication in disaster relief scenarios and low resource settings around the world since 2014.  In the past year, Team fEMR integrated Amazon Quantum Ledger Database (QLDB) as their HIPAA compliant database solution to address their need for data integrity and verifiability.

When delivering aid to at risk communities and within challenging social and political environments, data veracity is a critical issue.  Patients need to trust that their data is confidential and following an appropriate chain of ownership.  Aid organizations meanwhile need to trust the demographic data provided to them to appropriately understand the scope of disasters and verify the usage of funds. Amazon QLDB is backed by an immutable append-only journal.  This journal is verifiable, making it easier for Team fEMR to engage in external audits and deliver a trusted and verifiable EMR solution. The teams that use the new fEMR system are typically working or volunteering in post-disaster environments, refugee camps, or in other mobile clinics that offer pre-hospital care.

In this blog post, we explore how Team fEMR leveraged Amazon QLDB and other AWS Managed Services to enable their relief efforts.

Background

Before the use of an electronic record keeping system, these teams often had to use paper records, which would easily be lost or destroyed. The new fEMR system allows the clinician to look up the patient’s history of illness, in order to provide the patient with a seamless continuity of care between clinic visits. Additionally, the collection of health data on a more macroscopic level allows researchers and data scientists to monitor for disease. This is- an especially important aspect of mobile medicine in a pandemic world.

The fEMR system has been deployed worldwide since 2014. In the original design, the system functioned solely in an on-premises environment. Clinicians were able to attach their own devices to the system, and have access to the EMR functionality and medical records. While the need for a standalone solution continues to exist for environments without data coverage and connectivity, demand for fEMR has increased rapidly and outpaced deployment capabilities as well as hardware availability. To solve for real-time deployment and scalability needs, Team fEMR migrated fEMR to the cloud and developed a HIPAA-compliant and secure architecture using Amazon QLDB.

As part of their cloud adoption strategy, Team fEMR decided to procure more managed services, to automate operational tasks and to optimize their resources.

Architecture showing how How fEMR Delivers Cryptographically Secure and Verifiable EMR Medical Data with Amazon QLDB

Figure 1 – Architecture showing How fEMR Delivers Cryptographically Secure and Verifiable EMR Medical Data with Amazon QLDB

The team built the preceding architecture using a combination of the following AWS managed services:

1. Amazon Quantum Ledger Database (QLDB) – By using QLDB, Team fEMR were able to build an unfalsifiable, HIPAA compliant, and cryptographically verifiable record of medical histories, as well as for clinic pharmacy usage and stocking.

2. AWS Elastic Beanstalk – Team fEMR uses Elastic Beanstalk to deploy and run their Django front end and application logic.  It allows their agile development team to focus on development and feature delivery, by offloading the operational work of deployment, patching, and scaling.

3. Amazon Relational Database Service (RDS) – Team fEMR uses RDS for ad-hoc search, reporting, and analytics, whereas QLDB is not optimized for the specific requirement.

4. Amazon ElastiCache – Team fEMR uses Amazon ElastiCache to cache user session data to provide near real-time response times.

Data Security considerations

Data Security was a key consideration when building the fEMR EHR solution. End users of the solution are often working in environments with at-risk populations. That is, patients who may be fleeing persecution from their home country, or may be at risk due to discriminatory treatment. It is therefore imperative to secure their data. QLDB as a data storage mechanism provides a cryptographically secure history of all changes to data. This has the benefit of improved visibility and auditability and is invaluable in situations where medical data needs to be as tamper-evident as possible.

Using Auto Scaling to minimize operational effort

When Team fEMR engages with disaster relief, they deal with ambiguity around both when events may occur and at what scale their effects may be felt.  By leveraging managed services like QLDB, RDS, and Elastic Beanstalk, Team fEMR was able to minimize the time their technical team spent on systems operations.  Instead, they can focus optimizing and improving their technology architectures.

Use of Infrastructure as Code to enable fast global deployment

With Infrastructure as Code, Team fEMR was able to create repeatable deployments. They utilized AWS CloudFormation to deploy their Elasticache, RDS, QLDB, and Elastic Beanstalk environment.  Elastic Beanstalk was used to further automate the deployment of infrastructure for their Django stack. Repeatability of deployment enables the team to have the flexibility they need to deploy in certain regions due to geographic and data sovereignty requirements.

Optimizing the architecture

The team found that simultaneous writing into two databases could cause inconsistencies if a write succeeds in one database and fails in the other. In addition, it puts the burden of identifying errors and rolling back updates on the application. Therefore, an improvement planned for this architecture is to stream successful transactions from Amazon QLDB to Amazon RDS using Amazon Kinesis Data Streams. This service provides them a way to replicate data from Amazon QLDB to Amazon RDS, and any other databases or dashboards. QLDB remains as as their System of Record.

Figure 2 - Optimized Architecture using Amazon Kinesis Data Streams

Figure 2 – Optimized Architecture using Amazon Kinesis Data Streams

Conclusion

As a result of migrating their system to the cloud, Team fEMR was able to deliver their EMR system with less operational overhead and instead focus on bringing their solution to the communities that need it.  By using Amazon QLDB, Team fEMR was able to make their solution easier to audit and enabled more trust in their work with at-risk populations.

To learn more about Team fEMR, you can read about their efforts on their organization’s website, and explore their Open Source contributions on GitHub.

For hands on experience with Amazon QLDB you can reference our QLDB Workshops and explore our QLDB Developer Guide.

Deep dive into NitroTPM and UEFI Secure Boot support in Amazon EC2

Post Syndicated from Neelay Thaker original https://aws.amazon.com/blogs/compute/deep-dive-into-nitrotpm-and-uefi-secure-boot-support-in-amazon-ec2/

Contributed by Samartha Chandrashekar, Principal Product Manager Amazon EC2

At re:Invent 2021, we announced NitroTPM, a Trusted Platform Module (TPM) 2.0 and Unified Extensible Firmware Interface (UEFI) Secure Boot support in Amazon EC2. In this blog post, we’ll share additional details on how these capabilities can help further raise the security bar of EC2 deployments.

A TPM is a security device to gather and attest system state, store and generate cryptographic data, and prove platform identity. Although TPMs are traditionally discrete chips or firmware modules, their adaptation on AWS as NitroTPM preserves their security properties without affecting the agility and scalability of EC2. NitroTPM makes it possible to use TPM-dependent applications and Operating System (OS) capabilities in EC2 instances. It conforms to the TPM 2.0 specification, which makes it easy to migrate existing on-premises workloads that use TPM functionalities to EC2.

Unified Extensible Firmware Interface (UEFI) Secure Boot is a feature of UEFI that builds on EC2’s long-standing secure boot process and provides additional defense-in-depth that helps you secure software from threats that persist across reboots. It ensures that EC2 instances run authentic software by verifying the digital signature of all boot components, and halts the boot process if signature verification fails. When used with UEFI Secure Boot, NitroTPM can verify the integrity of software that boots and runs in the EC2 instance. It can measure instance properties and components as evidence that unaltered software in the correct order was used during boot. Features such as “Measured Boot” in Windows, Linux Unified Key Setup (LUKS) and dm-verity in popular Linux distributions can use NitroTPM to further secure OS launches from malware with administrative that attempt to persist across reboots.

NitroTPM derives its root-of-trust from the Nitro Security Chip and performs the same functions as a physical/discrete TPM. Similar to discrete TPMs, an immutable private and public Endorsement Key (EK) is set up inside the NitroTPM by AWS during instance creation. NitroTPM can serve as a “root-of-trust” to verify the provenance of software in the instance (e.g., NitroTPM’s EKCert as the basis for SSL certificates). Sensitive information protected by NitroTPM is made available only if the OS has booted correctly (i.e., boot measurements match expected values). If the system is tampered, keys are not released since the TPM state is different, thereby ensuring protection from malware attempting to hijack the boot process. NitroTPM can protect volume encryption keys used by full-disk encryption utilities (such as dm-crypt and BitLocker) or private keys for certificates.

NitroTPM can be used for attestation, a process to demonstrate that an EC2 instance meets pre-defined criteria, thereby allowing you to gain confidence in its integrity. It can be used to authenticate an instance requesting access to a resource (such as a service or a database) to be contingent on its health state (e.g., patching level, presence of mandated agents, etc.). For example, a private key can be “sealed” to a list of measurements of specific programs allowed to “unseal”. This makes it suited for use cases such as digital rights management to gate LDAP login, and database access on attestation. Access to AWS Key Management Service (KMS) keys to encrypt/decrypt data accessed by the instance can be made to require affirmative attestation of instance health. Anti-malware software (e.g., Windows Defender) can initiate remediation actions if attestation fails.

NitroTPM uses Platform Configuration Registers (PCR) to store system measurements. These do not change until the next boot of the instance. PCR measurements are computed during the boot process before malware can modify system state or tamper with the measuring process. These values are compared with pre-calculated known-good values, and secrets protected by NitroTPM are released only if the sequences match. PCRs are recalculated after each reboot, which ensures protection against malware aiming to hijack the boot process or persist across reboots. For example, if malware overwrites part of the kernel, measurements change, and disk decryption keys sealed to NitroTPM are not unsealed. Trust decisions can also be made based on additional criteria such as boot integrity, patching level, etc.

The workflow below shows how UEFI Secure Boot and NitroTPM work to ensure system integrity during OS startup.

workflow

To get started, you’ll need to register an Amazon Machine Image (AMI) of an Operating System that supports TPM 2.0 and UEFI Secure Boot using the register-image primitive via the CLI, API, or console. Alternatively, you can use pre-configured AMIs from AWS for both Windows and Linux to launch EC2 instances with TPM and Secure Boot. The screenshot below shows a Windows Server 2019 instance on EC2 launched with NitroTPM using its inbox TPM 2.0 drivers to recognize a TPM device.

NitroTPM and UEFI Secure Boot enables you to further raise the bar in running their workloads in a secure and trustworthy manner. We’re excited for you to try out NitroTPM when it becomes publicly available in 2022. Contact [email protected] for additional information.

Increasing McGraw-Hill’s Application Throughput with Amazon SQS

Post Syndicated from Vikas Panghal original https://aws.amazon.com/blogs/architecture/increasing-mcgraw-hills-application-throughput-with-amazon-sqs/

This post was co-authored by Vikas Panghal, Principal Product Mgr – Tech, AWS and Nick Afshartous, Principal Data Engineer at McGraw-Hill

McGraw-Hill’s Open Learning Solutions (OL) allow instructors to create online courses using content from various sources, including digital textbooks, instructor material, open educational resources (OER), national media, YouTube videos, and interactive simulations. The integrated assessment component provides instructors and school administrators with insights into student understanding and performance.

McGraw-Hill measures OL’s performance by observing throughput, which is the amount of work done by an application in a given period. McGraw-Hill worked with AWS to ensure OL continues to run smoothly and to allow it to scale with the organization’s growth. This blog post shows how we reviewed and refined their original architecture by incorporating Amazon Simple Queue Service (Amazon SQS). to achieve better throughput and stability.

Reviewing the original Open Learning Solutions architecture

Figure 1 shows the OL original architecture, which works as follows:

  1. The application makes a REST call to DMAPI. DMAPI is an API layer over the Datamart. The call results in a row being inserted in a job requests table in Postgres.
  2. A monitoring process called Watchdog periodically checks the database for pending requests.
  3. Watchdog spins up an Apache Spark on Databricks (Spark) cluster and passes up to 10 requests.
  4. The report is processed and output to Amazon Simple Storage Service (Amazon S3).
  5. Report status is set to completed.
  6. User can view report.
  7. The Databricks clusters shut down.
Original OL architecture

Figure 1. Original OL architecture

To help isolate longer running reports, we separated requests that have up to five schools (P1) from those having more than five (P2) by allocating a different pool of clusters. Each of the two groups can have up to 70 clusters running concurrently.

Challenges with original architecture

There are several challenges inherent in this original architecture, and we concluded that this architecture will fail under heavy load.

It takes 5 minutes to spin up a Spark cluster. After processing up to 10 requests, each cluster shuts down. Pending requests are processed by new clusters. This results in many clusters continuously being cycled.

We also identified a database resource contention problem. In testing, we couldn’t process 142 reports out of 2,030 simulated reports within the allotted 4 hours. Furthermore, the architecture cannot be scaled out beyond 70 clusters for the P1 and P2 pools. This is because adding more clusters will increase the number of database connections. Other production workloads on Postgres would also be affected.

Refining the architecture with Amazon SQS

To address the challenges with the existing architecture, we rearchitected the pipeline using Amazon SQS. Figure 2 shows the revised architecture. In addition to inserting a row to the requests table, the API call now inserts the job request Id into one of the SQS queues. The corresponding SQS consumers are embedded in the Spark clusters.

New OL architecture with Amazon SQS

Figure 2. New OL architecture with Amazon SQS

The revised flow is as follows:

  1. An API request results in a job request Id being inserted into one of the queues and a row being inserted into the requests table.
  2. Watchdog monitors SQS queues.
  3. Pending requests prompt Watchdog to spin up a Spark cluster.
  4. SQS consumer consumes the messages.
  5. Report data is processed.
  6. Report files output to Amazon S3
  7. Job status is updated in the requests table.
  8. Report can be viewed in the application.

After deploying the Amazon SQS architecture, we reran the previous load of 2,030 reports with a configuration ceiling of up to five Spark clusters. This time all reports were completed within the 4-hour time limit, including the 142 reports that timed out previously. Not only did we achieve better throughput and stability, but we did so by running far fewer clusters.

Reducing the number of clusters reduced the number of concurrent database connections that access Postgres. Unlike the original architecture, we also now have room to scale by adding more clusters and consumers. Another benefit of using Amazon SQS is a more loosely coupled architecture. The Watchdog process now only prompts Spark clusters to spin up, whereas previously it had to extract and pass job requests Ids to the Spark job.

Consumer code and multi-threading

The following code snippet shows how we consumed the messages via Amazon SQS and performed concurrent processing. Messages are consumed and submitted to a thread pool that utilizes Java’s ThreadPoolExecutor for concurrent processing. The full source is located on GitHub.

/**
  * Main Consumer run loop performs the following steps:
  *   1. Consume messages
  *   2. Convert message to Task objects
  *   3. Submit tasks to the ThreadPool
  *   4. Sleep based on the configured poll interval.
  */
 def run(): Unit = {
   while (!this.shutdownFlag) {
     val receiveMessageResult = sqsClient.receiveMessage(new  
                                           ReceiveMessageRequest(queueURL)
       .withMaxNumberOfMessages(threadPoolSize))
     val messages = receiveMessageResult.getMessages
     val tasks = getTasks(messages.asScala.toList)

     threadPool.submitTasks(tasks, sqsConfig.requestTimeoutMinutes)
     Thread.sleep(sqsConfig.pollIntervalSeconds * 1000)
   }

   threadPool.shutdown()
 }

Kafka versus Amazon SQS

We also considered routing the report requests via Kafka, because Kafka is part of our analytics platform. However, Kafka is not a queue, it is a publish-subscribe streaming system with different operational semantics. Unlike queues, Kafka messages are not removed by the consumer. Publish-subscribe semantics can be useful for data processing scenarios. In other words, it can be used in cases where it’s required to reprocess data or to transform data in different ways using multiple independent consumers.

In contrast, for performing tasks, the intent is to process a message exactly once. There can be multiple consumers, and with queue semantics, the consumers work together to pull messages off the queue. Because report processing is a type of task execution, we decided that SQS queue semantics better fit the use case.

Conclusion and future work

In this blog post, we described how we reviewed and revised a report processing pipeline by incorporating Amazon SQS as a messaging layer. Embedding SQS consumers in the Spark clusters resulted in fewer clusters and more efficient cluster utilization. This, in turn, reduced the number of concurrent database connections accessing Postgres.

There are still some improvements that can be made. The DMAPI call currently inserts the report request into a queue and the database. In case of an error, it’s possible for the two to become out of sync. In the next iteration, we can have the consumer insert the request into the database. Hence, the DMAPI call would only insert the SQS message.

Also, the Java ThreadPoolExecutor API being used in the source code exhibits the slow poke problem. Because the call to submit the tasks is synchronous, it will not return until all tasks have completed. Here, any idle threads will not be utilized until the slowest task has completed. There’s an opportunity for improved throughput by using a thread pool that allows idle threads to pick up new tasks.

Ready to get started? Explore the source code illustrating how to build a multi-threaded AWS SQS consumer.

Looking for more architecture content? AWS Architecture Center provides reference architecture diagrams, vetted architecture solutions, Well-Architected best practices, patterns, icons, and more!

Ibotta builds a self-service data lake with AWS Glue

Post Syndicated from Erik Franco original https://aws.amazon.com/blogs/big-data/ibotta-builds-a-self-service-data-lake-with-aws-glue/

This is a guest post co-written by Erik Franco at Ibotta.

Ibotta is a free cash back rewards and payments app that gives consumers real cash for everyday purchases when they shop and pay through the app. Ibotta provides thousands of ways for consumers to earn cash on their purchases by partnering with more than 1,500 brands and retailers.

At Ibotta, we process terabytes of data every day. Our vision is to allow for these datasets to be easily used by data scientists, decision-makers, machine learning engineers, and business intelligence analysts to provide business insights and continually improve the consumer and saver experience. This strategy of data democratization has proven to be a key pillar in the explosive growth Ibotta has experienced in recent years.

This growth has also led us to rethink and rebuild our internal technology stacks. For example, as our datasets began to double in size every year combined with complex, nested JSON data structures, it became apparent that our data warehouse was no longer meeting the needs of our analytics teams. To solve this, Ibotta adopted a data lake solution. The data lake proved to be a huge success because it was a scalable, cost-effective solution that continued to fulfill the mission of data democratization.

The rapid growth that was the impetus for the transition to a data lake has now also forced upstream engineers to transition away from the monolith architecture to a microservice architecture. We now use event-driven microservices to build fault-tolerant and scalable systems that can react to events as they occur. For example, we have a microservice in charge of payments. Whenever a payment occurs, the service emits a PaymentCompleted event. Other services may listen to these PaymentCompleted events to trigger other actions, such as sending a thank you email.

In this post, we share how Ibotta built a self-service data lake using AWS Glue. AWS Glue is a serverless data integration service that makes it easy to discover, prepare, and combine data for analytics, machine learning, and application development.

Challenge: Fitting flexible, semi-structured schemas into relational schemas

The move to an event-driven architecture, while highly valuable, presented several challenges. Our analytics teams use these events for use cases where low-latency access to real-time data is expected, such as fraud detection. These real-time systems have fostered a new area of growth for Ibotta and complement well with our existing batch-based data lake architecture. However, this change presented two challenges:

  • Our events are semi-structured and deeply nested JSON objects that don’t translate well to relational schemas. Events are also flexible in nature. This flexibility allows our upstream engineering teams to make changes as needed and thereby allows Ibotta to move quickly in order to capitalize on market opportunities. Unfortunately, this flexibility makes it very difficult to keep schemas up to date.
  • Adding to these challenges, in the last 3 years, our analytics and platform engineering teams have doubled in size. Our data processing team, however, has stayed the same size largely due to difficulty in hiring qualified data engineers who possess specialized skills in developing scalable pipelines and industry demand. This meant that our data processing team couldn’t keep up with the requests from our analytics teams to onboard new data sources.

Solution: A self-service data lake

To solve these issues, we decided that it wasn’t enough for the data lake to provide self-service data consumption features. We also needed self-service data pipelines. These would provide both the platform engineering and analytics teams with a path to make their data available within the data lake and with minimal to no data engineering intervention necessary. The following diagram illustrates our self-service data ingestion pipeline.

The pipeline includes the following components:

  1. Ibotta data stakeholders – Our internal data stakeholders wanted the capability to automatically onboard datasets. This user base includes platform engineers, data scientists, and business analysts.
  2. Configuration file – Our data stakeholders update a YAML file with specific details on what dataset they need to onboard. Sources for these datasets include our enterprise microservices.
  3. Ibotta enterprise microservices – Microservices make up the bulk of our Ibotta platform. Many of these microservices utilize events to asynchronously communicate important information. These events are also valuable for deriving analytics insights.
  4. Amazon Kinesis – After the configuration file is updated, data is immediately streamed to Amazon Kinesis. Amazon Kinesis makes it easy to collect, process, and analyze real-time, streaming data so you can get timely insights and react quickly to new information. Streaming the data through Kinesis Data Streams and Kinesis Data Firehose gives us the flexibility to analyze the data in real time while also allowing us to store the data in Amazon Simple Storage Service (Amazon S3).
  5. Ibotta self-service data pipeline – This is the starting point of our data processing. We use Apache Airflow to orchestrate our pipelines once every hour.
  6. Amazon S3 raw data – Our data lands in Amazon S3 without any transformation. The complex nature of the JSON is retained for future processing or validation.
  7. AWS Glue – Our goal now is to take the complex nested JSON and create a simpler structure. AWS Glue provides a set of built-in transforms that we use to process this data. One of the transforms is Relationalize—an AWS Glue transform that takes semi-structured data and transforms it into a format that can be more easily analyzed by engines like Presto. This feature means that our analytics teams can continue to use the analytics engines they’re comfortable with and thereby lessen the impact of transitioning from relational data sources to semi-structured event data sources. The Relationalize function can flatten nested structures and create multiple dynamic frames. We use 80 lines of code to convert any JSON-based microservice message to a consumable table. We have provided this code base here as a reference and not for reuse.
    // Convert to a DynamicFrame and relationalize
       // Convert it back to DataFrame
       val dynamicFrame: DynamicFrame = DynamicFrame(df, glueContext)
       val dynamicFrameCollection: Seq[DynamicFrame] = dynamicFrame.relationalize(rootTableName = glueSourceTable,
         stagingPath = glueTempStorage,
         options = JsonOptions.empty)
       val relationalizedDF: Dataset[Row] = removeColumnDotNotationRelationalize(dynamicFrameCollection(0).toDF())
       // Get rid of dot-notation and repartition it
       val repartitionedDF: Dataset[Row] = relationalizedDF.repartition(finalRepartitionValue.toInt)
       // Write it out
       repartitionedDF
         .write
         .mode("overwrite")
         .option("compression", "snappy")
         .parquet(glueRelationalizeOutputS3Path)

  8. Amazon S3 curated – We then store the relationalized structures as Parquet format in Amazon S3.
  9. AWS Glue crawler AWS Glue crawlers allow us to automatically discover schema and catalogs in the AWS Glue Data Catalog. This feature is a core component of our self-service data pipelines because it removes the requirement of having a data engineer manually create or update the schemas. Previously, if a change needed to occur, it flowed through a communication path that included platform engineers, data engineers, and analytics. AWS Glue crawlers effectively remove the data engineers from this communication path. This means new datasets or changes to datasets are made available quickly within the data lake. It also frees up our data engineers to continue working on improvements to our self-service data pipelines and other data paved roadmap features.
  10. AWS Glue Data Catalog – A common problem in growing data lakes is that the datasets can become harder and harder to work with. A common reason for this is a lack of discoverability of data within the data lake as well as a lack of clear understanding of what the datasets are conveying. The AWS Glue Catalog is a feature that works in conjunction with AWS Glue crawlers to provide data lake users with searchable metadata for different data lake datasets. As AWS Glue crawlers discover new datasets or updates, they’re recorded into the Data Catalog. You can then add descriptions at the table or fields levels for these datasets. This cuts down on the level of tribal knowledge that exists between various data lake consumers and makes it easy for these users to self-serve from the data lake.
  11. End-user data consumption – The end-users are the same as our internal stakeholders called out in Step 1.

Benefits

The AWS Glue capabilities we described make it a core component of building our self-service data pipelines. When we initially adopted AWS Glue, we saw a three-fold decrease in our OPEX costs as compared to our previous data pipelines. This was further enhanced when AWS Glue moved to per-second billing. To date, AWS Glue has allowed us to realize a five-fold decrease in OPEX costs. Also, AWS Glue requires little to no manual intervention to ingest and process our over 200 complex JSON objects. This allows Ibotta to utilize AWS Glue each day as a key component in providing actionable data to the organization’s growing analytics and platform engineering teams.

We took away the following learnings in building self-service data platforms:

Conclusion and next steps

With the self-service data lake we have established, our business teams are realizing the benefits of speed and agility. As next steps, we’re going to improve our self-service pipeline with the following features:

  • AWS Glue streaming – Use AWS Glue streaming for real-time relationalization. With AWS Glue streaming, we can simplify our self-service pipelines by potentially getting rid of our orchestration layer while also getting data into the data lake sooner.
  • Support for ACID transactions – Implement data formats in the data lake that allow for ACID transactions. A benefit of this ACID layer is the ability to merge streaming data into data lake datasets.
  • Simplify data transport layers – Unify the data transport layers between the upstream platform engineering domains and the data domain. From the time we first implemented an event-driven architecture at Ibotta to today, AWS has offered new services such as Amazon EventBridge and Amazon Managed Streaming for Apache Kafka (Amazon MSK) that have the potential to simplify certain facets of our self-service and data pipelines.

We hope that this blog post will inspire your organization to build a self-service data lake using serverless technologies to accelerate your business goals.


About the Authors

Erik Franco is a Data Architect at Ibotta and is leading Ibotta’s implementation of its next-generation data platform. Erik enjoys fishing and is an avid hiker. You can often find him hiking one of the many trails in Colorado with his lovely wife Marlene and wonderful dog Sammy.

Shiv Narayanan is Global Business Development Manager for Data Lakes and Analytics solutions at AWS. He works with AWS customers across the globe to strategize, build, develop and deploy modern data platforms. Shiv loves music, travel, food and trying out new tech.

Matt Williams is a Senior Technical Account Manager for AWS Enterprise Support. He is passionate about guiding customers on their cloud journey and building innovative solutions for complex problems. In his spare time, Matt enjoys experimenting with technology, all things outdoors, and visiting new places.

Using AWS security services to protect against, detect, and respond to the Log4j vulnerability

Post Syndicated from Marshall Jones original https://aws.amazon.com/blogs/security/using-aws-security-services-to-protect-against-detect-and-respond-to-the-log4j-vulnerability/

January 7, 2022: The blog post has been updated to include using Network ACL rules to block potential log4j-related outbound traffic.

January 4, 2022: The blog post has been updated to suggest using WAF rules when correct HTTP Host Header FQDN value is not provided in the request.

December 31, 2021: We made a minor update to the second paragraph in the Amazon Route 53 Resolver DNS Firewall section.

December 29, 2021: A paragraph under the Detect section has been added to provide guidance on validating if log4j exists in an environment.

December 23, 2021: The GuardDuty section has been updated to describe new threat labels added to specific finding to give log4j context.

December 21, 2021: The post includes more info about Route 53 Resolver DNS query logging.

December 20, 2021: The post has been updated to include Amazon Route 53 Resolver DNS Firewall info.

December 17, 2021: The post has been updated to include using Athena to query VPC flow logs.

December 16, 2021: The Respond section of the post has been updated to include IMDSv2 and container mitigation info.

This blog post was first published on December 15, 2021.


Overview

In this post we will provide guidance to help customers who are responding to the recently disclosed log4j vulnerability. This covers what you can do to limit the risk of the vulnerability, how you can try to identify if you are susceptible to the issue, and then what you can do to update your infrastructure with the appropriate patches.

The log4j vulnerability (CVE-2021-44228, CVE-2021-45046) is a critical vulnerability (CVSS 3.1 base score of 10.0) in the ubiquitous logging platform Apache Log4j. This vulnerability allows an attacker to perform a remote code execution on the vulnerable platform. Version 2 of log4j, between versions 2.0-beta-9 and 2.15.0, is affected.

The vulnerability uses the Java Naming and Directory Interface (JNDI) which is used by a Java program to find data, typically through a directory, commonly a LDAP directory in the case of this vulnerability.

Figure 1, below, highlights the log4j JNDI attack flow.

Figure 1. Log4j attack progression

Figure 1. Log4j attack progression. Source: GovCERT.ch, the Computer Emergency Response Team (GovCERT) of the Swiss government

As an immediate response, follow this blog and use the tool designed to hotpatch a running JVM using any log4j 2.0+. Steve Schmidt, Chief Information Security Officer for AWS, also discussed this hotpatch.

Protect

You can use multiple AWS services to help limit your risk/exposure from the log4j vulnerability. You can build a layered control approach, and/or pick and choose the controls identified below to help limit your exposure.

AWS WAF

Use AWS Web Application Firewall, following AWS Managed Rules for AWS WAF, to help protect your Amazon CloudFront distribution, Amazon API Gateway REST API, Application Load Balancer, or AWS AppSync GraphQL API resources.

  • AWSManagedRulesKnownBadInputsRuleSet esp. the Log4JRCE rule which helps inspects the request for the presence of the Log4j vulnerability. Example patterns include ${jndi:ldap://example.com/}.
  • AWSManagedRulesAnonymousIpList esp. the AnonymousIPList rule which helps inspect IP addresses of sources known to anonymize client information.
  • AWSManagedRulesCommonRuleSet, esp. the SizeRestrictions_BODY rule to verify that the request body size is at most 8 KB (8,192 bytes).

You should also consider implementing WAF rules that deny access, if the correct HTTP Host Header FQDN value is not provided in the request. This can help reduce the likelihood of scanners that are scanning the internet IP address space from reaching your resources protected by WAF via a request with an incorrect Host Header, like an IP address instead of an FQDN. It’s also possible to use custom Application Load Balancer listener rules to achieve this.

If you’re using AWS WAF Classic, you will need to migrate to AWS WAF or create custom regex match conditions.

Have multiple accounts? Follow these instructions to use AWS Firewall Manager to deploy AWS WAF rules centrally across your AWS organization.

Amazon Route 53 Resolver DNS Firewall

You can use Route 53 Resolver DNS Firewall, following AWS Managed Domain Lists, to help proactively protect resources with outbound public DNS resolution. We recommend associating Route 53 Resolver DNS Firewall with a rule configured to block domains on the AWSManagedDomainsMalwareDomainList, which has been updated in all supported AWS regions with domains identified as hosting malware used in conjunction with the log4j vulnerability. AWS will continue to deliver domain updates for Route 53 Resolver DNS Firewall through this list.

Also, you should consider blocking outbound port 53 to prevent the use of external untrusted DNS servers. This helps force all DNS queries through DNS Firewall and ensures DNS traffic is visible for GuardDuty inspection. Using DNS Firewall to block DNS resolution of certain country code top-level domains (ccTLD) that your VPC resources have no legitimate reason to connect out to, may also help. Examples of ccTLDs you may want to block may be included in the known log4j callback domains IOCs.

We also recommend that you enable DNS query logging, which allows you to identify and audit potentially impacted resources within your VPC, by inspecting the DNS logs for the presence of blocked outbound queries due to the log4j vulnerability, or to other known malicious destinations. DNS query logging is also useful in helping identify EC2 instances vulnerable to log4j that are responding to active log4j scans, which may be originating from malicious actors or from legitimate security researchers. In either case, instances responding to these scans potentially have the log4j vulnerability and should be addressed. GreyNoise is monitoring for log4j scans and sharing the callback domains here. Some notable domains customers may want to examine log activity for, but not necessarily block, are: *interact.sh, *leakix.net, *canarytokens.com, *dnslog.cn, *.dnsbin.net, and *cyberwar.nl. It is very likely that instances resolving these domains are vulnerable to log4j.

AWS Network Firewall

Customers can use Suricata-compatible IDS/IPS rules in AWS Network Firewall to deploy network-based detection and protection. While Suricata doesn’t have a protocol detector for LDAP, it is possible to detect these LDAP calls with Suricata. Open-source Suricata rules addressing Log4j are available from corelight, NCC Group, from ET Labs, and from CrowdStrike. These rules can help identify scanning, as well as post exploitation of the log4j vulnerability. Because there is a large amount of benign scanning happening now, we recommend customers focus their time first on potential post-exploitation activities, such as outbound LDAP traffic from their VPC to untrusted internet destinations.

We also recommend customers consider implementing outbound port/protocol enforcement rules that monitor or prevent instances of protocols like LDAP from using non-standard LDAP ports such as 53, 80, 123, and 443. Monitoring or preventing usage of port 1389 outbound may be particularly helpful in identifying systems that have been triggered by internet scanners to make command and control calls outbound. We also recommend that systems without a legitimate business need to initiate network calls out to the internet not be given that ability by default. Outbound network traffic filtering and monitoring is not only very helpful with log4j, but with identifying other classes of vulnerabilities too.

Network Access Control Lists

Customers may be able to use Network Access Control List rules (NACLs) to block some of the known log4j-related outbound ports to help limit further compromise of successfully exploited systems. We recommend customers consider blocking ports 1389, 1388, 1234, 12344, 9999, 8085, 1343 outbound. As NACLs block traffic at the subnet level, careful consideration should be given to ensure any new rules do not block legitimate communications using these outbound ports across internal subnets. Blocking ports 389 and 88 outbound can also be helpful in mitigating log4j, but those ports are commonly used for legitimate applications, especially in a Windows Active Directory environment. See the VPC flow logs section below to get details on how you can validate any ports being considered.

Use IMDSv2

Through the early days of the log4j vulnerability researchers have noted that, once a host has been compromised with the initial JDNI vulnerability, attackers sometimes try to harvest credentials from the host and send those out via some mechanism such as LDAP, HTTP, or DNS lookups. We recommend customers use IAM roles instead of long-term access keys, and not store sensitive information such as credentials in environment variables. Customers can also leverage AWS Secrets Manager to store and automatically rotate database credentials instead of storing long-term database credentials in a host’s environment variables. See prescriptive guidance here and here on how to implement Secrets Manager in your environment.

To help guard against such attacks in AWS when EC2 Roles may be in use — and to help keep all IMDS data private for that matter — customers should consider requiring the use of Instance MetaData Service version 2 (IMDSv2). Since IMDSv2 is enabled by default, you can require its use by disabling IMDSv1 (which is also enabled by default). With IMDSv2, requests are protected by an initial interaction in which the calling process must first obtain a session token with an HTTP PUT, and subsequent requests must contain the token in an HTTP header. This makes it much more difficult for attackers to harvest credentials or any other data from the IMDS. For more information about using IMDSv2, please refer to this blog and documentation. While all recent AWS SDKs and tools support IMDSv2, as with any potentially non-backwards compatible change, test this change on representative systems before deploying it broadly.

Detect

This post has covered how to potentially limit the ability to exploit this vulnerability. Next, we’ll shift our focus to which AWS services can help to detect whether this vulnerability exists in your environment.

Figure 2. Log4j finding in the Inspector console

Figure 2. Log4j finding in the Inspector console

Amazon Inspector

As shown in Figure 2, the Amazon Inspector team has created coverage for identifying the existence of this vulnerability in your Amazon EC2 instances and Amazon Elastic Container Registry Images (Amazon ECR). With the new Amazon Inspector, scanning is automated and continual. Continual scanning is driven by events such as new software packages, new instances, and new common vulnerability and exposure (CVEs) being published.

For example, once the Inspector team added support for the log4j vulnerability (CVE-2021-44228 & CVE-2021-45046), Inspector immediately began looking for this vulnerability for all supported AWS Systems Manager managed instances where Log4j was installed via OS package managers and where this package was present in Maven-compatible Amazon ECR container images. If this vulnerability is present, findings will begin appearing without any manual action. If you are using Inspector Classic, you will need to ensure you are running an assessment against all of your Amazon EC2 instances. You can follow this documentation to ensure you are creating an assessment target for all of your Amazon EC2 instances. Here are further details on container scanning updates in Amazon ECR private registries.

GuardDuty

In addition to finding the presence of this vulnerability through Inspector, the Amazon GuardDuty team has also begun adding indicators of compromise associated with exploiting the Log4j vulnerability, and will continue to do so. GuardDuty will monitor for attempts to reach known-bad IP addresses or DNS entries, and can also find post-exploit activity through anomaly-based behavioral findings. For example, if an Amazon EC2 instance starts communicating on unusual ports, GuardDuty would detect this activity and create the finding Behavior:EC2/NetworkPortUnusual. This activity is not limited to the NetworkPortUnusual finding, though. GuardDuty has a number of different findings associated with post exploit activity, such as credential compromise, that might be seen in response to a compromised AWS resource. For a list of GuardDuty findings, please refer to this GuardDuty documentation.

To further help you identify and prioritize issues related to CVE-2021-44228 and CVE-2021-45046, the GuardDuty team has added threat labels to the finding detail for the following finding types:

Backdoor:EC2/C&CActivity.B
If the IP queried is Log4j-related, then fields of the associated finding will include the following values:

  • service.additionalInfo.threatListName = Amazon
  • service.additionalInfo.threatName = Log4j Related

Backdoor:EC2/C&CActivity.B!DNS
If the domain name queried is Log4j-related, then the fields of the associated finding will include the following values:

  • service.additionalInfo.threatListName = Amazon
  • service.additionalInfo.threatName = Log4j Related

Behavior:EC2/NetworkPortUnusual
If the EC2 instance communicated on port 389 or port 1389, then the associated finding severity will be modified to High, and the finding fields will include the following value:

  • service.additionalInfo.context = Possible Log4j callback
Figure 3. GuardDuty finding with log4j threat labels

Figure 3. GuardDuty finding with log4j threat labels

Security Hub

Many customers today also use AWS Security Hub with Inspector and GuardDuty to aggregate alerts and enable automatic remediation and response. In the short term, we recommend that you use Security Hub to set up alerting through AWS Chatbot, Amazon Simple Notification Service, or a ticketing system for visibility when Inspector finds this vulnerability in your environment. In the long term, we recommend you use Security Hub to enable automatic remediation and response for security alerts when appropriate. Here are ideas on how to setup automatic remediation and response with Security Hub.

VPC flow logs

Customers can use Athena or CloudWatch Logs Insights queries against their VPC flow logs to help identify VPC resources associated with log4j post exploitation outbound network activity. Version 5 of VPC flow logs is particularly useful, because it includes the “flow-direction” field. We recommend customers start by paying special attention to outbound network calls using destination port 1389 since outbound usage of that port is less common in legitimate applications. Customers should also investigate outbound network calls using destination ports 1388, 1234, 12344, 9999, 8085, 1343, 389, and 88 to untrusted internet destination IP addresses. Free-tier IP reputation services, such as VirusTotal, GreyNoise, NOC.org, and ipinfo.io, can provide helpful insights related to public IP addresses found in the logged activity.

Note: If you have a Microsoft Active Directory environment in the captured VPC flow logs being queried, you might see false positives due to its use of port 389.

Validation with open-source tools

With the evolving nature of the different log4j vulnerabilities, it’s important to validate that upgrades, patches, and mitigations in your environment are indeed working to mitigate potential exploitation of the log4j vulnerability. You can use open-source tools, such as aws_public_ips, to get a list of all your current public IP addresses for an AWS Account, and then actively scan those IPs with log4j-scan using a DNS Canary Token to get notification of which systems still have the log4j vulnerability and can be exploited. We recommend that you run this scan periodically over the next few weeks to validate that any mitigations are still in place, and no new systems are vulnerable to the log4j issue.

Respond

The first two sections have discussed ways to help prevent potential exploitation attempts, and how to detect the presence of the vulnerability and potential exploitation attempts. In this section, we will focus on steps that you can take to mitigate this vulnerability. As we noted in the overview, the immediate response recommended is to follow this blog and use the tool designed to hotpatch a running JVM using any log4j 2.0+. Steve Schmidt, Chief Information Security Officer for AWS, also discussed this hotpatch.

Figure 4. Systems Manager Patch Manager patch baseline approving critical patches immediately

Figure 4. Systems Manager Patch Manager patch baseline approving critical patches immediately

AWS Patch Manager

If you use AWS Systems Manager Patch Manager, and you have critical patches set to install immediately in your patch baseline, your EC2 instances will already have the patch. It is important to note that you’re not done at this point. Next, you will need to update the class path wherever the library is used in your application code, to ensure you are using the most up-to-date version. You can use AWS Patch Manager to patch managed nodes in a hybrid environment. See here for further implementation details.

Container mitigation

To install the hotpatch noted in the overview onto EKS cluster worker nodes AWS has developed an RPM that performs a JVM-level hotpatch which disables JNDI lookups from the log4j2 library. The Apache Log4j2 node agent is an open-source project built by the Kubernetes team at AWS. To learn more about how to install this node agent, please visit the this Github page.

Once identified, ECR container images will need to be updated to use the patched log4j version. Downstream, you will need to ensure that any containers built with a vulnerable ECR container image are updated to use the new image as soon as possible. This can vary depending on the service you are using to deploy these images. For example, if you are using Amazon Elastic Container Service (Amazon ECS), you might want to update the service to force a new deployment, which will pull down the image using the new log4j version. Check the documentation that supports the method you use to deploy containers.

If you’re running Java-based applications on Windows containers, follow Microsoft’s guidance here.

We recommend you vend new application credentials and revoke existing credentials immediately after patching.

Mitigation strategies if you can’t upgrade

In case you either can’t upgrade to a patched version, which disables access to JDNI by default, or if you are still determining your strategy for how you are going to patch your environment, you can mitigate this vulnerability by changing your log4j configuration. To implement this mitigation in releases >=2.10, you will need to remove the JndiLookup class from the classpath: zip -q -d log4j-core-*.jar org/apache/logging/log4j/core/lookup/JndiLookup.class.

For a more comprehensive list about mitigation steps for specific versions, refer to the Apache website.

Conclusion

In this blog post, we outlined key AWS security services that enable you to adopt a layered approach to help protect against, detect, and respond to your risk from the log4j vulnerability. We urge you to continue to monitor our security bulletins; we will continue updating our bulletins with our remediation efforts for our side of the shared-responsibility model.

Given the criticality of this vulnerability, we urge you to pay close attention to the vulnerability, and appropriately prioritize implementing the controls highlighted in this blog.

If you have feedback about this post, submit comments in the Comments section below.

Want more AWS Security news? Follow us on Twitter.

Marshall Jones

Marshall is a Worldwide Security Specialist Solutions Architect at AWS. His background is in AWS consulting and security architecture, focused on a variety of security domains including edge, threat detection, and compliance. Today, he is focused on helping enterprise AWS customers adopt and operationalize AWS security services to increase security effectiveness and reduce risk.

Syed Shareef

Syed is a Senior Security Solutions Architect at AWS. He works with large financial institutions to help them achieve their business goals with AWS, whilst being compliant with regulatory and security requirements.

How Goldman Sachs built persona tagging using Apache Flink on Amazon EMR

Post Syndicated from Balasubramanian Sakthivel original https://aws.amazon.com/blogs/big-data/how-goldman-sachs-built-persona-tagging-using-apache-flink-on-amazon-emr/

The Global Investment Research (GIR) division at Goldman Sachs is responsible for providing research and insights to the firm’s clients in the equity, fixed income, currency, and commodities markets. One of the long-standing goals of the GIR team is to deliver a personalized experience and relevant research content to their research users. Previously, in order to customize the user experience for their various types of clients, GIR offered a few distinct editions of their research site that were provided to users based on broad criteria. However, GIR did not have any way to create a personally curated content flow at the individual user level. To provide this functionality, GIR wanted to implement a system to actively filter the content that is recommended to their users on a per-user basis, keyed on characteristics such as the user’s job title or working region. Having this kind of system in place would both improve the user experience and simplify the workflows of GIR’s research users, by reducing the amount of time and effort required to find the research content that they need.

The first step towards achieving this is to directly classify GIR’s research users based on their profiles and readership. To that end, GIR created a system to tag users with personas. Each persona represents a type or classification that individual users can be tagged with, based on certain criteria. For example, GIR has a series of personas for classifying a user’s job title, and a user tagged with the “Chief Investment Officer” persona will have different research content highlighted and have a different site experience compared to one that is tagged with the “Corporate Treasurer” persona. This persona-tagging system can both efficiently carry out the data operations required for tagging users, as well as have new personas created as needed to fit use cases as they emerge.

In this post, we look at how GIR implemented this system using Amazon EMR.

Challenge

Given the number of contacts (i.e., millions) and the growing number of publications maintained in GIR’s research data store, creating a system for classifying users and recommending content is a scalability challenge. A newly created persona could potentially apply to almost every contact, in which case a tagging operation would need to be performed on several million data entries. In general, the number of contacts, the complexity of the data stored per contact, and the amount of criteria for personalization can only increase. To future-proof their workflow, GIR needed to ensure that their solution could handle the processing of large amounts of data as an expected and frequent case.

GIR’s business goal is to support two kinds of workflows for classification criteria: ad hoc and ongoing. An ad hoc criteria causes users that currently fit the defining criteria condition to immediately get tagged with the required persona, and is meant to facilitate the one-time tagging of specific contacts. On the other hand, an ongoing criteria is a continuous process that automatically tags users with a persona if a change to their attributes causes them to fit the criteria condition. The following diagram illustrates the desired personalization flow:

In the rest of this post, we focus on the design and implementation of GIR’s ad hoc workflow.

Apache Flink on Amazon EMR

To meet GIR’s scalability demands, they determined that Amazon EMR was the best fit for their use case, being a managed big data platform meant for processing large amounts of data using open source technologies such as Apache Flink. Although GIR evaluated a few other options that addressed their scalability concerns (such as AWS Glue), GIR chose Amazon EMR for its ease of integration into their existing systems and possibility to be adapted for both batch and streaming workflows.

Apache Flink is an open source big data distributed stream and batch processing engine that efficiently processes data from continuous events. Flink offers exactly-once guarantees, high throughput and low latency, and is suited for handling massive data streams. Also, Flink provides many easy-to-use APIs and mitigates the need for the programmer to worry about failures. However, building and maintaining a pipeline based on Flink comes with operational overhead and requires considerable expertise, in addition to provisioning physical resources.

Amazon EMR empowers users to create, operate, and scale big data environments such as Apache Flink quickly and cost-effectively. We can optimize costs by using Amazon EMR managed scaling to automatically increase or decrease the cluster nodes based on workload. In GIR’s use case, their users need to be able to trigger persona-tagging operations at any time, and require a predictable completion time for their jobs. For this, GIR decided to launch a long-running cluster, which allows multiple Flink jobs to be submitted simultaneously to the same cluster.

Ad hoc persona-tagging infrastructure and workflow

The following diagram illustrates the architecture of GIR’s ad hoc persona-tagging workflow on the AWS Cloud.

This is a broad overview, and the specifics of networking and security between components are out of scope for this post.

At a high level, we can discuss GIR’s workflow in four parts:

  1. Upload the Flink job artifacts to the EMR cluster.
  2. Trigger the Flink job.
  3. Within the Flink job, transform and then store user data.
  4. Continuous monitoring.

You can interact with Flink on Amazon EMR via the Amazon EMR console or the AWS Command Line Interface (AWS CLI). After launching the cluster, GIR used the Flink API to interact with and submit work to the Flink application. The Flink API provided a bit more functionality and was much easier to invoke from an AWS Lambda application.

The end goal of the setup is to have a pipeline where GIR’s internal users can freely make requests to update contact data (which in this use case is tagging or untagging contacts with various personas), and then have the updated contact data uploaded back to the GIR contact store.

Upload the Flink job artifacts to Amazon EMR

GIR has a GitLab project on-premises for managing the contents of their Flink job. To trigger the first part of their workflow and deploy a new version of the Flink job onto the cluster, a GitLab pipeline is run that first creates a .zip file containing the Flink job JAR file, properties, and config files.

The preceding diagram depicts the sequence of events that occurs in the job upload:

  1. The GitLab pipeline is manually triggered when a new Flink job should be uploaded. This transfers the .zip file containing the Flink job to an Amazon Simple Storage Service (Amazon S3) bucket on the GIR AWS account, labeled as “S3 Deployment artifacts”.
  2. A Lambda function (“Upload Lambda”) is triggered in response to the create event from Amazon S3.
  3. The function first uploads the Flink job JAR to the Amazon EMR Flink cluster, and retrieves the application ID for the Flink session.
  4. Finally, the function uploads the application properties file to a specific S3 bucket (“S3 Flink Job Properties”).

Trigger the Flink job

The second part of the workflow handles the submission of the actual Flink job to the cluster when job requests are generated. GIR has a user-facing web app called Personalization Workbench that provides the UI for carrying out persona-tagging operations. Admins and internal Goldman Sachs users can construct requests to tag or untag contacts with personas via this web app. When a request is submitted, a data file is generated that contains the details of the request.

The steps of this workflow are as follows:

  1. Personalization Workstation submits the details of the job request to the Flink Data S3 bucket, labeled as “S3 Flink data”.
  2. A Lambda function (“Run Lambda”) is triggered in response to the create event from Amazon S3.
  3. The function first reads the job properties file uploaded in the previous step to get the Flink job ID.
  4. Finally, the function makes an API call to run the required Flink job.

Process data

Contact data is processed according to the persona-tagging requests, and the transformed data is then uploaded back to the GIR contact store.

The steps of this workflow are as follows:

  1. The Flink job first reads the application properties file that was uploaded as part of the first step.
  2. Next, it reads the data file from the second workflow that contains the contact and persona data to be updated. The job then carries out the processing for the tagging or untagging operation.
  3. The results are uploaded back to the GIR contact store.
  4. Finally, both successful and failed requests are written back to Amazon S3.

Continuous monitoring

The final part of the overall workflow involves continuous monitoring of the EMR cluster in order to ensure that GIR’s tagging workflow is stable and that the cluster is in a healthy state. To ensure that the highest level of security is maintained with their client data, GIR wanted to avoid unconstrained SSH access to their AWS resources. Being constrained from accessing the EMR cluster’s primary node directly via SSH meant that GIR initially had no visibility into the EMR primary node logs or the Flink web interface.

By default, Amazon EMR archives the log files stored on the primary node to Amazon S3 at 5-minute intervals. Because this pipeline serves as a central platform for processing many ad hoc persona-tagging requests at a time, it was crucial for GIR to build a proper continuous monitoring system that would allow them to promptly diagnose any issues with the cluster.

To accomplish this, GIR implemented two monitoring solutions:

  • GIR installed an Amazon CloudWatch agent onto every node of their EMR cluster via bootstrap actions. The CloudWatch agent collects and publishes Flink metrics to CloudWatch under a custom metric namespace, where they can be viewed on the CloudWatch console. GIR configured the CloudWatch agent configuration file to capture relevant metrics, such as CPU utilization and total running EMR instances. The result is an EMR cluster where metrics are emitted to CloudWatch at a much faster rate than waiting for periodic S3 log flushes.
  • They also enabled the Flink UI in read-only mode by fronting the cluster’s primary node with a network load balancer and establishing connectivity from the Goldman Sachs on-premises network. This change allowed GIR to gain direct visibility into the state of their running EMR cluster and in-progress jobs.

Observations, challenges faced, and lessons learned

The personalization effort marked the first-time adoption of Amazon EMR within GIR. To date, hundreds of personalization criteria have been created in GIR’s production environment. In terms of web visits and clickthrough rate, site engagement with GIR personalized content has gradually increased since the implementation of the persona-tagging system.

GIR faced a few noteworthy challenges during development, as follows:

Restrictive security group rules

By default, Amazon EMR creates its security groups with rules that are less restrictive, because Amazon EMR can’t anticipate the specific custom settings for ingress and egress rules required by individual use cases. However, proper management of the security group rules is critical to protect the pipeline and data on the cluster. GIR used custom-managed security groups for their EMR cluster nodes and included only the needed security group rules for connectivity, in order to fulfill this stricter security posture.

Custom AMI

There were challenges in ensuring that the required packages were available when using custom Amazon Linux AMIs for Amazon EMR. As part of Goldman Sachs development SDLC controls, any Amazon Elastic Compute Cloud (Amazon EC2) instances on Goldman Sachs-owned AWS accounts are required to use internal Goldman Sachs-created AMIs. When GIR began development, the only compliant AMI that was available under this control was a minimal AMI based on the publicly available Amazon Linux 2 minimal AMI (amzn2-ami-minimal*-x86_64-ebs). However, Amazon EMR recommends using the full default Amazon 2 Linux AMI because it has all the necessary packages pre-installed. This resulted in various start up errors with no clear indication of the missing libraries.

GIR worked with AWS support to identify and resolve the issue by comparing the minimal and full AMIs, and installing the 177 missing packages individually (see the appendix for the full list of packages). In addition, various AMI-related files had been set to read-only permissions by the Goldman Sachs internal AMI creation process. Restoring these permissions to full read/write access allowed GIR to successfully start up their cluster.

Stalled Flink jobs

During GIR’s initial production rollout, GIR experienced an issue where their EMR cluster failed silently and caused their Lambda functions to time out. On further debugging, GIR found this issue to be related to an Akka quarantine-after-silence timeout setting. By default, it was set to 48 hours, causing the clusters to refuse more jobs after that time. GIR found a workaround by setting the value of akka.jvm-exit-on-fatal-error to false in the Flink config file.

Conclusion

In this post, we discussed how the GIR team at Goldman Sachs set up a system using Apache Flink on Amazon EMR to carry out the tagging of users with various personas, in order to better curate content offerings for those users. We also covered some of the challenges that GIR faced with the setup of their EMR cluster. This represents an important first step in providing GIR’s users with complete personalized content curation based on their individual profiles and readership.

Acknowledgments

The authors would like to thank the following members of the AWS and GIR teams for their close collaboration and guidance on this post:

  • Elizabeth Byrnes, Managing Director, GIR
  • Moon Wang, Managing Director, GIR
  • Ankur Gurha, Vice President, GIR
  • Jeremiah O’Connor, Solutions Architect, AWS
  • Ley Nezifort, Associate, GIR
  • Shruthi Venkatraman, Analyst, GIR

About the Authors

Balasubramanian Sakthivel is a Vice President at Goldman Sachs in New York. He has more than 16 years of technology leadership experience and worked on many firmwide entitlement, authentication and personalization projects. Bala drives the Global Investment Research division’s client access and data engineering strategy, including architecture, design and practices to enable the lines of business to make informed decisions and drive value. He is an innovator as well as an expert in developing and delivering large scale distributed software that solves real world problems, with demonstrated success envisioning and implementing a broad range of highly scalable platforms, products and architecture.

Victor Gan is an Analyst at Goldman Sachs in New York. Victor joined the Global Investment Research division in 2020 after graduating from Cornell University, and has been responsible for developing and provisioning cloud infrastructure for GIR’s user entitlement systems. He is focused on learning new technologies and streamlining cloud systems deployments.

Manjula Nagineni is a Solutions Architect with AWS based in New York. She works with major Financial service institutions, architecting, and modernizing their large-scale applications while adopting AWS cloud services. She is passionate about designing big data workloads cloud-natively. She has over 20 years of IT experience in Software Development, Analytics and Architecture across multiple domains such as finance, manufacturing and telecom.


Appendix

GIR ran the following command to install the missing AMI packages:

yum install -y libevent.x86_64 python2-botocore.noarch \

device-mapper-event-libs.x86_64 bind-license.noarch libwebp.x86_64 \

sgpio.x86_64 rsync.x86_64 perl-podlators.noarch libbasicobjects.x86_64 \

langtable.noarch sssd-client.x86_64 perl-Time-Local.noarch dosfstools.x86_64 \

attr.x86_64 perl-macros.x86_64 hwdata.x86_64 gpm-libs.x86_64 libtirpc.x86_64 \

device-mapper-persistent-data.x86_64 libconfig.x86_64 setserial.x86_64 \

rdate.x86_64 bc.x86_64 amazon-ssm-agent.x86_64 virt-what.x86_64 zip.x86_64 \

lvm2-libs.x86_64 python2-futures.noarch perl-threads.x86_64 \

dmraid-events.x86_64 bridge-utils.x86_64 mdadm.x86_64 ec2-net-utils.noarch \

kbd.x86_64 libtiff.x86_64 perl-File-Path.noarch quota-nls.noarch \

libstoragemgmt-python.noarch man-pages-overrides.x86_64 python2-rsa.noarch \

perl-Pod-Usage.noarch psacct.x86_64 libnl3-cli.x86_64 \

libstoragemgmt-python-clibs.x86_64 tcp_wrappers.x86_64 yum-utils.noarch \

libaio.x86_64 mtr.x86_64 teamd.x86_64 hibagent.noarch perl-PathTools.x86_64 \

libxml2-python.x86_64 dmraid.x86_64 pm-utils.x86_64 \

amazon-linux-extras-yum-plugin.noarch strace.x86_64 bzip2.x86_64 \

perl-libs.x86_64 kbd-legacy.noarch perl-Storable.x86_64 perl-parent.noarch \

bind-utils.x86_64 libverto-libevent.x86_64 ntsysv.x86_64 yum-langpacks.noarch \

libjpeg-turbo.x86_64 plymouth-core-libs.x86_64 perl-threads-shared.x86_64 \

kernel-tools.x86_64 bind-libs-lite.x86_64 screen.x86_64 \

perl-Text-ParseWords.noarch perl-Encode.x86_64 libcollection.x86_64 \

xfsdump.x86_64 perl-Getopt-Long.noarch man-pages.noarch pciutils.x86_64 \

python2-s3transfer.noarch plymouth-scripts.x86_64 device-mapper-event.x86_64 \

json-c.x86_64 pciutils-libs.x86_64 perl-Exporter.noarch libdwarf.x86_64 \

libpath_utils.x86_64 perl.x86_64 libpciaccess.x86_64 hunspell-en-US.noarch \

nfs-utils.x86_64 tcsh.x86_64 libdrm.x86_64 awscli.noarch cryptsetup.x86_64 \

python-colorama.noarch ec2-hibinit-agent.noarch usermode.x86_64 rpcbind.x86_64 \

perl-File-Temp.noarch libnl3.x86_64 generic-logos.noarch python-kitchen.noarch \

words.noarch kbd-misc.noarch python-docutils.noarch hunspell-en.noarch \

dyninst.x86_64 perl-Filter.x86_64 libnfsidmap.x86_64 kpatch-runtime.noarch \

python-simplejson.x86_64 time.x86_64 perl-Pod-Escapes.noarch \

perl-Pod-Perldoc.noarch langtable-data.noarch vim-enhanced.x86_64 \

bind-libs.x86_64 boost-system.x86_64 jbigkit-libs.x86_64 binutils.x86_64 \

wget.x86_64 libdaemon.x86_64 ed.x86_64 at.x86_64 libref_array.x86_64 \

libstoragemgmt.x86_64 libteam.x86_64 hunspell.x86_64 python-daemon.noarch \

dmidecode.x86_64 perl-Time-HiRes.x86_64 blktrace.x86_64 bash-completion.noarch \

lvm2.x86_64 mlocate.x86_64 aws-cfn-bootstrap.noarch plymouth.x86_64 \

parted.x86_64 tcpdump.x86_64 sysstat.x86_64 vim-filesystem.noarch \

lm_sensors-libs.x86_64 hunspell-en-GB.noarch cyrus-sasl-plain.x86_64 \

perl-constant.noarch libini_config.x86_64 python-lockfile.noarch \

perl-Socket.x86_64 nano.x86_64 setuptool.x86_64 traceroute.x86_64 \

unzip.x86_64 perl-Pod-Simple.noarch langtable-python.noarch jansson.x86_64 \

pystache.noarch keyutils.x86_64 acpid.x86_64 perl-Carp.noarch GeoIP.x86_64 \

python2-dateutil.noarch systemtap-runtime.x86_64 scl-utils.x86_64 \

python2-jmespath.noarch quota.x86_64 perl-HTTP-Tiny.noarch ec2-instance-connect.noarch \

vim-common.x86_64 libsss_idmap.x86_64 libsss_nss_idmap.x86_64 \

perl-Scalar-List-Utils.x86_64 gssproxy.x86_64 lsof.x86_64 ethtool.x86_64 \

boost-date-time.x86_64 python-pillow.x86_64 boost-thread.x86_64 yajl.x86_64

ConexED uses Amazon QuickSight to empower its institutional partners by unifying and curating powerful insights using engagement data

Post Syndicated from Michael Gorham original https://aws.amazon.com/blogs/big-data/conexed-uses-amazon-quicksight-to-empower-its-institutional-partners-by-unifying-and-curating-powerful-insights-using-engagement-data/

This post was co-written with Michael Gorham, Co-Founder and CTO of ConexED.

ConexED is one of the country’s fastest-growing EdTech companies designed specifically for education to enhance the student experience and elevate student success. Founded as a startup in 2008 to remove obstacles that hinder student persistence and access to student services, ConexED provides advisors, counselors, faculty, and staff in all departments across campus the tools necessary to meet students where they are.

ConexED offers a student success and case management platform, HUB Kiosk – Queuing System, and now a business intelligence (BI) dashboard powered by Amazon QuickSight to empower its institutional partners.

ConexED strives to make education more accessible by providing tools that make it easy and convenient for all students to connect with the academic support services that are vital to their success in today’s challenging and ever-evolving educational environment. ConexED’s student- and user-friendly interface makes online academic communications intuitive and as personalized as face-to-face encounters, while also making on-campus meetings as streamlined, and well reported as online meetings.

One of the biggest obstacles facing school administrators is getting meaningful data quickly so that informed, data-driven decisions can be made. Reporting can be time-consuming, so they are often generated infrequently, which leads to outdated data. In addition, reporting often lacks customization and data is typically captured in spreadsheets, which doesn’t provide a visual representation of the information that is easy to interpret. ConnexED has always offered robust reporting features, but the problem was that in providing this kind of data for our partners, our development team was spending more than half its time creating custom reporting for the constantly increasing breadth of data the ConexED system generates.

Every new feature we built requires at least two or three new reports – and therefore more of our development team’s time. After we implemented QuickSight, not only can ConexED’s development team focus all its energies on creating competitive features to accelerate the rollout of new product features, but also the reporting and data visualization are now features our customers can control and customize. QuickSight features such as drill-down filtering, predictive forecasting, and aggregation insights have given us the competitive edge that our customers expect from a modern, cloud-based solution.

New technology enables strategic planning

With QuickSight, we’re able to focus on building customer-facing solutions that capture data rather than spending a large portion of our development time solving data visualization and custom report problems. Our development team no longer has to spend its time creating reports for all the data generated, and our customers don’t need to wait. Partnering with QuickSight has enabled ConexED to develop its business intelligence dashboard, which is designed to create operational efficiencies, identify opportunities, and empower institutions by uniting critical data insights to cross-campus student support services. The QuickSight data used in ConexED’s BI dashboard analyzes collected information in real time, allowing our partners to properly project trends in the coming school year using predictive analytics to improve staff efficiency, enhance the student experience, and increase rates of retention and graduation.

The following image demonstrates heat mapping, which displays the recurring days and times when student requests for support services are most frequent, with the busiest hour segments appearing more saturated in color. This enables leadership to utilize staff efficiently so that students have the support services they need when they need it on their pathway to graduation. ConexED’s BI dashboard powered by QuickSight makes this kind of information possible so that our partners can plan strategically.

QuickSight dashboards allow our customers to drill down on the data to glean even more insights of what is happening on their campus. In the following example, the pie chart depicts a whole-campus view of meetings by department, but leadership can choose one of the colored segments to drill down further for more information about a specific department. Whatever the starting point, leadership now has the ability to access more specific, real-time data to understand what’s happening on their campus or any part of it.

Dashboards provide data visualization

Our customers have been extremely impressed with our QuickSight dashboards because they provide data visualizations that make the information easier to comprehend and parse. The dynamic, interactive nature of the dashboards allows ConexED’s partners to go deeper into the data with just a click of the mouse, which immediately generates new data based on what was clicked and therefore new visuals.

With QuickSight, not only can we programmatically display boiler-plate dashboards based on role type, but we can also allow our clients to branch off these dashboards and customize the reporting to their liking. The development team is now able to move quickly to build interesting features that ingest data and provide insightful visualizations and reports on the gathered data easily. ConexED’s BI dashboard powered by QuickSight enables leadership at our partner institutions to understand how users engage with support services on their campus – when they meet, why they meet, how they meet – so that they can make informed decisions to improve student engagement and services.

The right people with the right information

In education, giving the right level of data access to the right people is essential. With intuitive row- and column-level security and anonymous tagging in QuickSight, the ConexED development team was able to quickly build visualizations that correctly display partitioned data to thousands of different users with varying levels of access across our client base.

At ConexED, student success is paramount, and with QuickSight powering our BI dashboard, the right people get the right data, and our institutional customers can now easily analyze vast amounts of data to identify trends in student acquisition, retention, and completion rates. They can also solve student support staffing allocation problems and improve the student experience at their institutions.

QuickSight does the heavy lifting

The ability to securely pull and aggregate data from disparate sources with very little setup work has given ConexED a head start on the predictive analytics space in the EdTech market. Now building visualizations is intuitive, insightful, and fun. In fact, the development team even built in only 1 day an internal QuickSight dashboard to view our own customers’ QuickSight usage. The data visualization combinations are seemingly endless and infinitely valuable to our customers.

ConexED’s partnership with AWS has enabled us to use QuickSight to drive our BI dashboard and provide our customers with the power and information needed for today’s dynamic modern student support services teams.


About the Author

Michael Gorham is Co-Founder and CTO of ConexED. Michael is a multidisciplinary software architect with over 20 years’ experience

Open source hotpatch for Apache Log4j vulnerability

Post Syndicated from Steve Schmidt original https://aws.amazon.com/blogs/security/open-source-hotpatch-for-apache-log4j-vulnerability/

At Amazon Web Services (AWS), security remains our top priority. As we addressed the Apache Log4j vulnerability this weekend, I’m pleased to note that our team created and released a hotpatch as an interim mitigation step. This tool may help you mitigate the risk when updating is not immediately possible.

It’s important that you review, patch, or mitigate this vulnerability as soon as possible. We still recommend that you update Log4j to version 2.15 as a mitigation, but we know that can take some time, depending on your resources. To take immediate action, we recommend that you implement this newly created tool to hotpatch your Log4j deployments. A huge thanks to the Amazon Corretto team for spending days, nights, and the weekend to write, harden, and ship this code. This tool is available now at GitHub.

Caveats

As with all open source software, you’re using this at your own risk. Note that the hotpatch has been tested with JDK8 and JDK11 on Linux. On JDK17, only the static agent mode works. A full list of caveats can be found in the README.

Want more AWS Security how-to content, news, and feature announcements? Follow us on Twitter.

Steve Schmidt

Steve is Vice President and Chief Information Security Officer for AWS. His duties include leading product design, management, and engineering development efforts focused on bringing the competitive, economic, and security benefits of cloud computing to business and government customers. Prior to AWS, he had an extensive career at the Federal Bureau of Investigation, where he served as a senior executive and section chief. He currently holds 11 patents in the field of cloud security architecture. Follow Steve on Twitter.

SEEK Asia modernizes search with CI/CD and Amazon OpenSearch Service

Post Syndicated from Fabian Tan original https://aws.amazon.com/blogs/big-data/seek-asia-modernizes-search-with-ci-cd-and-amazon-opensearch-service/

This post was written in collaboration with Abdulsalam Alshallah (Salam), Software Architect, and Hans Roessler, Principal Software Engineer at SEEK Asia.

SEEK is a market leader in online employment marketplaces with deep and rich insights into the future of work. As a global business, SEEK has a presence in Australia, New Zealand, Hong Kong, Southeast Asia, Brazil and Mexico and its websites attract over 400 million visits per year. SEEK Asia’s business operates across seven countries and includes leading portal brands such as jobsdb.com and jobstreet.com and leverages data and technology to create innovative solutions for candidates and hirers.

In this post, we share how SEEK Asia modernized their search-based system with a continuous integration and continuous delivery (CI/CD) pipeline and Amazon OpenSearch Service (successor to Amazon Elasticsearch Service).

Challenges associated with a self-managed search system

SEEK Asia provides a search-based system that enables employers to manage interactions between hirers and candidates. Although the system was already on AWS, it was a self-managed system running on Amazon Elastic Compute Cloud (Amazon EC2) with limited automation.

The self-managed system posed several challenges:

  • Slower release cycles – Deploying new configurations or new field mappings into the Elasticsearch cluster was a high-risk activity because changes affected the stability of the system. The little automation on both the self-managed cluster and workflows led to slower release cycles.
  • Higher operational overhead – Sizing the cluster to deliver greater performance, while managing cost effectively, was the other challenge. As with every other distributed system, even with sizing guidance, identifying the appropriate number of shards per node and the number of nodes to meet performance requirements still required some amount of trial and error, turning the exercise into a tedious and time-consuming activity. This consequently also led to slower release cycles. To overcome this challenge, in many occasions, oversizing the cluster became the quickest way to achieve the desired time to market, at the expense of cost.

Further challenges the team faced with self-managing their own Elasticsearch cluster included keeping up with new security patches, and minor and major platform upgrades.

Automating search delivery with Amazon OpenSearch Service

SEEK Asia knew that automation would the key to solving the challenges of their existing search service. Automating the undifferentiated heavy lifting would enable them to deliver more value to their customers quickly and improve staff productivity.

With the problems defined, the team set out to solve the challenges by automating the following:

  • Search infrastructure deployment
  • Search A/B testing infrastructure deployment
  • Redeployment of search infrastructure for any new infrastructure configuration (such as security patches or platform upgrades) and index mapping updates

The key services enabling the automation would be Amazon OpenSearch Service and establishing a search infrastructure CI/CD pipeline.

Architecture overview

The following diagram illustrates the architecture of the SEEK infrastructure and CI/CD pipeline with Amazon OpenSearch Service.

The workflow includes the following steps:

  1. Before the workflow kicks off, an existing Amazon OpenSearch Service cluster with a live feeder hydrates it. The live feeder is a serverless application built on Amazon Simple Queue Service (Amazon SQS) via Amazon Simple Notification Service (Amazon SNS) and AWS Lambda. Amazon SQS queues documents for processing, Amazon SNS enables data fanout (if required), and a Lambda function is invoked to process messages in the SQS queue to import data into Amazon OpenSearch Service. The feeder receives live updates for changes that need to be reflected on the cluster. Write concurrency to Amazon OpenSearch Service is managed by limiting the number of concurrent Lambda function invocations.
  2. The Amazon OpenSearch Service index mapping is version controlled in SEEK’s Git repository. Whenever an update to the index mapping is committed, the CI/CD pipeline kicks off a new Amazon OpenSearch Service cluster provisioning workflow.
  3. As part of the workflow, a new data hydration initialization feeder is deployed. The initialization feeder construct is similar to the live feeder, with one additional component: a script that runs within the CI/CD pipeline to calculate the number of batches required to hydrate the newly provisioned Amazon OpenSearch Service cluster up to a specific timestamp. The feeder systems were designed to achieve idempotency processing. This meant unique identifiers (UIDs) from the source data stores are reused for each document, and duplicated documents update an existing document with the exact same values.
  4. At the same time as Step 3, an Amazon OpenSearch Service cluster is deployed. To accelerate the initial data hydration process temporarily, the new cluster may be sized two or three times larger against sizing guidance with shard replicas and index refresh interval disabled until the hydration process is complete. The existing Amazon OpenSearch Service cluster remains as is, which means that two clusters are running concurrently.
  5. The script inspects the number of documents the source data store has and groups the documents by batch sizes. SEEK identified that 1,000 documents per batch provided the optimal ingestion import time, after running numerous experiments.
  6. Each batch is represented as one message and is queued into Amazon SQS via Amazon SNS. Every message that lands in Amazon SQS invokes a Lambda function. The Lambda function queries a separate data store, builds the document, and loads it into Amazon OpenSearch Service. The more messages that go into the queue, the more functions are invoked. To create baselines that allowed for further indexing optimization, the team took the following configurations into consideration and reiterated to achieve higher ingestion performance:
    1. Memory of the Lambda function
    2. Size of batch
    3. Size of each document in the batch
    4. Size of cluster (memory, vCPU, and number of primary shards)
  7. With the initialization feeder running, new documents are streamed to the cluster until it is synced with the data source. Eventually, the newly provisioned Amazon OpenSearch Service cluster catches up and is in the same state as the existing cluster. The hydration is complete when there are no remaining messages in the SQS queue.
  8. The initialization feeder is deleted and the Amazon OpenSearch Service cluster is downsized automatically to complete the deployment workflow, with replica shards created and the index refresh interval configured.
  9. Live search traffic is routed to the newly provisioned cluster when A/B testing is enabled via the API layer built on Application Load Balancer, Amazon Elastic Container Service (Amazon ECS), and Amazon CloudFront. The API layer decouples the client interface from the backend implementation that runs on Amazon OpenSearch Service.

Improved time to market and other outcomes

With Amazon OpenSearch Service, SEEK was able to automate an entire cluster, complete with Kibana, in a secure, managed environment. If testing didn’t produce the desired results, the team could change the dimensions of the cluster horizontally or vertically using different instance offerings within minutes. This enabled them to perform stress tests quickly to identify the sweet spot between performance and cost of the workload.

“By integrating Amazon OpenSearch Service with our existing CI/CD tools, we’re able to fully automate our search function deployments, which accelerated software delivery time,” says Abdulsalam Alshallah, APAC Software Architect. “The newly found confidence in the modern stack, alongside improved engineering practices, allowed us to mitigate the risk of changes—improving our time to market by 89% with zero impact to uptime.”

With the adoption of Amazon OpenSearch Service, other teams also saw improvements, including the following:

  • Common Vulnerability and Exposure (CVE) has dropped to zero with Amazon OpenSearch Service handling the underlying hardware security updates on SEEK’s behalf, improving their security posture
  • Improved availability with the Amazon OpenSearch Service Availability Zone awareness feature

Conclusion

Amazon OpenSearch Service managed capabilities has helped SEEK Asia to improve customer experience with speed and automation. By removing the undifferentiated heavy lifting, teams can deploy changes quickly to their search engines, allowing customers to get the latest search features faster and ultimately contributing to the SEEK purpose of helping people live more productive working lives and organisations succeed.

To learn more about Amazon OpenSearch Service, see Amazon OpenSearch Service features, the Developer Guide, or Introducing OpenSearch.


About the Authors

Fabian Tan is a Principal Solutions Architect at Amazon Web Services. He has a strong passion for software development, databases, data analytics and machine learning. He works closely with the Malaysian developer community to help them bring their ideas to life.

Hans Roessler is a Principal Software Architect at SEEKAsia. He is excited about new technologies and upgrading legacy to newer stacks. Always staying in touch with the latest technologies is one of his passions.

Abdulsalam Alshallah (Salam) is a Software architect at SEEK, Previously a Lead Cloud Architect for SEEKAsia, Salam has always been excited about new technologies, Cloud, Serverless & DevOps, in addition to his passion of eliminating wasted time/effort & resources; He is also one of the leaders of AWS User Group Malaysia.