Tag Archives: Customer Solutions

Lucerna Health uses Amazon QuickSight embedded analytics to help healthcare customers uncover new insights

Post Syndicated from David Atkins original https://aws.amazon.com/blogs/big-data/lucerna-health-uses-amazon-quicksight-embedded-analytics-to-help-healthcare-customers-uncover-new-insights/

This is a guest post by Lucerna Health. Founded in 2018, Lucerna Health is a data technology company that connects people and data to deliver value-based care (VBC) results and operational transformation.

At Lucerna Health, data is at the heart of our business. Every day, we use clinical, sales, and operational data to help healthcare providers and payers grow and succeed in the value-based care (VBC) environment. Through our HITRUST CSF® certified Healthcare Data Platform, we support payer-provider integration, health engagement, database marketing, and VBC operations.

As our business grew, we found that faster real-time analysis and reporting capabilities through our platform were critical to success. However, that was a challenge for our data analytics team, which was busier than ever developing our proprietary data engine and data model. No matter how many dashboards we built, we knew we could never keep up with user demand with our previous BI solutions. We needed a more scalable technology that could grow as our customer base continued to expand.

In this post, we will outline how Amazon QuickSight helped us overcome these challenges.

Embedding analytics with QuickSight

We had a rising demand for business intelligence (BI) from our customers, and we needed a better tool to help us keep pace that met our security requirements and was part of a comprehensive business associate contract (BAA) and met HIPAA and other privacy standards. We were using several other BI solutions internally for impromptu analysis and reporting, but we realized we needed a fully embedded solution to provide more automation and an integrated experience within our Healthcare Data Platform. After trying out a different solution, we discovered it wasn’t cost-effective for us. That’s when we turned our attention to AWS.

Three years ago, we decided to go all-in on AWS, implementing a range of AWS services for compute, storage, and networking. Today, each of the building blocks we have in our IT infrastructure run on AWS. For example, we use Amazon Redshift, AWS Glue, and Amazon EMR for our Spark data pipelines, data lake, and data analytics. Because of our all-in approach, we were pleased to find that AWS had a BI platform called QuickSight. QuickSight is a powerful and cost-effective BI service that offers a strong feature set including self-service BI capabilities and interactive dashboards, and we liked the idea of continuing to be all-in on AWS by implementing this service.

One of the QuickSight’s features we were most excited about was its ability to embed analytics deep within our Healthcare Data Platform. With this solution’s embedded analytics software, we were able to integrate QuickSight dashboards directly into our own platform. For example, we offer our customers a portal where they can register a new analytical dashboard through our user interface. That interface connects to the QuickSight application programming interface (API) to enable embedding in a highly configurable and secure way.

With this functionality, our customers can ingest and visualize complex healthcare data, such as clinical data from electronic medical record (EMR) systems, eligibility and claims, CRM and digital interactions data. Our Insights data model is projected into Quicksight’s high performance in memory calculation engine enabling high performance analysis on massive datasets.

Creating a developer experience for customers

We have also embedded the QuickSight console into our platform. Through this approach, our healthcare data customers can build their own datasets and quickly share that data with a wider group of users through our platform. This gives our customers a developer experience that enables them to customize and share analytical reports with their colleagues. With only a few clicks, users can aggregate and compare data from their sales and EMR solutions.

QuickSight has also improved collaboration for our own teams when it comes to custom reports. In the past, teams could only do monthly or specialized reports, spending a lot of time building them, downloading them as PDFs, and sending them out to clients as slides. It was a time-consuming and inefficient way to share data. Now, our users can get easy access to data from previously siloed sources, and then simply publish reports and share access to that data immediately.

Helping healthcare providers uncover new insights

Because healthcare providers now have centralized data at their fingertips, they can make faster and more strategic decisions. For instance, management teams can look at dashboards on our platform to see updated demand data to plan more accurate staffing models. We’ve also created patient and provider data models that provide a 360-degree view of patient and payer data, increasing visibility. Additionally, care coordinators can reprioritize tasks and take action if necessary because they can view gaps in care through the dashboards. Armed with this data, care coordinators can work to improve the patient experience at the point of care.

Building and publishing reports twice as fast

QuickSight is a faster BI solution than anything we’ve used before. We can now craft a new dataset, apply permissions to it, build out an analysis, and publish and share it in a report twice as fast as we could before. The solution also gives our developers a better overall experience. For rapid development and deployment at scale, QuickSight performs extremely well at a very competitive price.

Because QuickSight is a serverless solution, we no longer need to worry about our BI overhead. With our previous solution, we had a lot of infrastructure, maintenance, and licensing costs. We have eliminated those challenges by implementing QuickSight. This is a key benefit because we’re an early stage company and our lean product development team can now focus on innovation instead of spinning up servers.

As our platform has become more sophisticated over the past few years, QuickSight has introduced vast number of great features for data catalog management, security, ML integrations, and look/feel that has really improved on our original solution’s BI capabilities. We look forward to continuing to use this powerful tool to help our customers get more out of their data.


About the Authors

David Atkins is the Co-Founder & Chief Operating Officer at Lucerna Health. Before co-founding Lucnera Health in 2018, David held multiple leadership roles in healthcare organizations, including spending six years at Centen Corporation as the Corporate Vice President of Enterprise Data and Analytic Solutions. Additionally, he served as the Provider Network Management Director at Anthem. When he isn’t spending time with his family, he can be found on the ski slopes or admiring his motorcycle, which he never rides.

Adriana Murillo is the Co-Founder & Chief Marketing Officer at Lucerna Health. Adriana has been involved in the healthcare industry for nearly 20 years. Before co-founding Lucerna Health, she founded Andes Unite, a marketing firm primarily serving healthcare provider organizations and health insurance plans. In addition, Adriana held leadership roles across market segment leadership, product development, and multicultural marketing at not-for-profit health solutions company Florida Blue. Adriana is a passionate cook who loves creating recipes and cooking for her family.

How to automate AWS Managed Microsoft AD scaling based on utilization metrics

Post Syndicated from Dennis Rothmel original https://aws.amazon.com/blogs/security/how-to-automate-aws-managed-microsoft-ad-scaling-based-on-utilization-metrics/

AWS Directory Service for Microsoft Active Directory (AWS Managed Microsoft AD), provides a fully managed service for Microsoft Active Directory (AD) in the AWS cloud. When you create your directory, AWS deploys two domain controllers in separate Availability Zones that are exclusively yours for high availability. For use cases requiring even higher resilience and performance, in a specific Region or during specific hours, AWS Managed Microsoft AD allows you to scale by deploying additional domain controllers to meet your needs. These domain controllers can help load-balance, increase overall performance, or simply provide additional nodes to protect against temporary availability issues. AWS Managed Microsoft AD allows you to define the correct number of domain controllers for your directory based on your individual use case.

This post will walk you through how to automate scaling in AWS Managed Microsoft AD using utilization metrics from your directory. You’ll do this using Amazon CloudWatch Alarms, SNS notifications, and a Lambda function to increase the number of domain controllers in your directory based on utilization peaks.

Simplified directory scaling

AWS Managed Microsoft AD has now simplified this directory scaling process by integrating with Amazon CloudWatch metrics. This new integration enables you to:

  1. Analyze your directory to identify expected average and peak directory utilization
  2. Scale your directory based on utilization data to adequately address the expected load
  3. Automate the addition of domain controllers to handle unexpected load.

Integration is available for both domain controller utilization metrics such as CPU, Memory, Disk and Network, and for AD-specific metrics, such as LDAP searches, binds, DNS queries, and Directory reads/writes. Analyzing this data over time to identify expected average and peak utilization on your directory can help you deploy additional domain controllers in Regions that need them. Once you’ve established this utilization baseline, you can deploy additional domain controllers to service this load, and configure alarms for anything exceeding this baseline.

Solution overview

In this example, our AWS Managed Microsoft AD has the default two domain controllers; once your utilization threshold is reached, you’ll add one additional domain controller (domain controller 3 in the diagram) to cover this additional load. 

Figure 1: Solution overview

Figure 1: Solution overview

To create a CloudWatch Alarm with SNS topic notifications

  1. In the AWS Console, navigate to CloudWatch
  2. Choose Metrics to see the Browse Metrics panel
  3. Choose the Directory Service namespace, then choose AWS Managed Microsoft AD.
  4. In the Directory ID column, select your directory and check search for this only.
  5. From the Metric Category column, select Processor from Metric Category and check add to search. This view will show the processor utilization for your directory.
  6.  

    Figure 2. Processor utilization metrics

    Figure 2. Processor utilization metrics

  7. To see the average utilization across all domain controllers, choose Add Math, then All Functions, then AVG to create a metric math expression for average CPU utilization across all domain controllers.
  8.  

    Figure 3. Adding a math function to compute average

    Figure 3. Adding a math function to compute average

  9. Next, choose the Graphed Metrics tab in the CloudWatch metrics console, select the newly created expression, then select the bell icon from the Actions column to create a CloudWatch alarm based on this metric.
  10. Figure 4. Create a CloudWatch Alarm using Metric Math Expression

    Figure 4. Create a CloudWatch Alarm using Metric Math Expression

  11. Configure the threshold alarm to trigger when CPU utilization exceeds 70%.
  12.  In the Metrics section, under Period, choose 1 Hour.
     In the Conditions section, under Threshold Type, choose Static. Under Define the alarm condition, choose Greater than threshold. Under Define the threshold value, enter 70. See Figure 5 for an image of how alarm parameters should look on your screen. Choose Next to Configure actions

    Figure 5. Configure the alarm parameters

    Figure 5. Configure the alarm parameters

  13. On the Configure actions screen, configure the actions using the parameters listed below to send an email notification when the alarm state is triggered. See Figure 6 for an image of how email notifications are configured.
  14.   In the Notification section, set Alarm state trigger to In alarm.   Set Select an SNS topic to Create topic.  Fill in the name of the alarm in the Create a new topic field, and add the email where notifications should be sent to the Email endpoints that will receive notification field. An email address is required to create the SNS topic and you should use an email address that’s accessible by your operations team. This SNS topic will be used to trigger the Lambda automation described in a later section. Note: make a note of the SNS topic name you chose; you will use it later when creating the Lambda function in the To create an AWS Lambda function to automate scale out procedure below. 

    Figure 6. Create SNS topic and email notification

    Figure 6. Create SNS topic and email notification

  15. In the Alarm name field, provide a name for the alarm. You can optionally also add an Alarm description. Choose Next.
  16. Review your configuration, and choose Create alarm to create the alarm.

Once you’ve completed these steps, you will now have an alarm implemented for when domain controller CPU utilization exceeds an average of 70% across both domain controllers. This will trigger an SNS topic when your directory is experiencing a heavy load, which will be used to start the Lambda automation and will send an informational email notification. In the next section, we’ll configure an AWS Lambda function to automate the addition of a domain controller based on this SNS topic.

For additional details on CloudWatch Alarms, please see the Amazon CloudWatch documentation.

To create an AWS Lambda function to automate scale out

The sample Lambda function shown below checks the number of domain controllers in this Region, and increases that by adding one additional domain controller. This procedure describes how to configure the IAM role required for this Lambda function, then how to deploy the Lambda function to execute when the alarm is triggered to automatically add a domain controller when your load exceeds your typical usage baseline.

Note: For additional details on Lambda creation, please see the AWS Lambda documentation.

To automate scale-out using AWS Lambda

  1. In the AWS Console, navigate to IAM and choose Policies, then choose Create Policy.
  2. Choose the JSON tab, and create a new IAM role using the policy provided in JSON below.
  3. For more details on this configuration, see the AWS Directory Service documentation.

    Sample policy


    {
    	"Version":"2012-10-17",
    	"Statement":[
    	{
    		"Effect":"Allow",
    		"Action":[
    			"ds:DescribeDomainControllers",
    			"ds:UpdateNumberOfDomainControllers",
    			"ec2:DescribeSubnets",
    			"ec2:DescribeVpcs",
    			"ec2:CreateNetworkInterface",
    			"ec2:DescribeNetworkInterfaces",
    			"ec2:DeleteNetworkInterface"
    		],
    		"Resource":"*"
    	}
    	]
    }
    

  4. Choose Next:Tags to add tags (optional) before choosing Next:Review.
  5. On the Create Policy screen, provide a name in the Name field. You can optionally also add a description. Choose Create policy to complete creating the new policy.
  6.  
    Note: make a note of the policy name you chose; you will use it later when updating the execution role for the Lambda function.  

    Figure 7. Provide a name to create the IAM policy

    Figure 7. Provide a name to create the IAM policy

  7. In the AWS Console, navigate to Lambda and choose Create Function
  8. On the Create Function screen, select Author from Scratch and provide a Name, then choose Create Function.
  9. Figure 8. Create a Lambda function

    Figure 8. Create a Lambda function

  10. Once created, on the Lambda function’s page, choose the Configuration tab, then choose Permissions from the sidebar and choose the execution role name linked under Role name. This will open the IAM console in another tab, preloaded to your Lambda execution role.
  11.  

    Figure 9: Select the Execution Role

    Figure 9: Select the Execution Role

  12. On the execution role screen, choose Attach policies and select the IAM policy you’ve just created (e.g. DirectoryService-DCNumber Update). On the Attach Permissions screen, choose Attach policy to complete updating the execution role. Once completed this step, you may close this tab and return the previous browser tab.
  13.  

    Figure 10. Select and attach the IAM policy

    Figure 10. Select and attach the IAM policy

  14. On the Lambda function screen, choose the Configuration tab, then choose Triggers from the sidebar.
  15. On the Add Trigger screen, choose the pulldown under Trigger configuration and select SNS. On the SNS topic box, select the SNS topic you created in Step 9 of the To create a CloudWatch Alarm with SNS topic notifications procedure above. Then choose Add to complete the trigger configuration.
  16. On the Lambda function screen, choose the Configuration tab, then choose Environment variables from the sidebar.
  17. On the Environment variables card, click Edit.
  18. On the Edit environment variables screen, choose Add environment variables and use the Key “DIRECTORY_ID” and the Value will be the directory ID for you AWS Managed Microsoft AD.
  19.  

    Figure 11. The "Edit environment variables" screen

    Figure 11. The “Edit environment variables” screen

  20. On the Lambda function screen, choose the Code tab to open the in-browser code editor experience inside the Code source card. Paste in the sample Lambda function code given below to complete the implementation.
  21.  

    Figure 12. Paste sample code to complete the Lambda function setup

    Figure 12. Paste sample code to complete the Lambda function setup

Sample Lambda function code

The sample Lambda function given below automates adding another domain controller to your directory. When your CloudWatch alarm triggers, you will receive a notification email, and an additional domain controller will be deployed to provide the added capacity to support the increase in directory usage.

Note: The example code contains a variable for the maximum number of domain controllers (maxDcNum), to prevent you from over provisioning in the event of a missed configuration. This value is set to 3 for this blog post’s example and can be increased to suit your use case. 

import json
import boto3

maxDcNum = 10
minDcNum = 2
region   = "us-east-1"
dsId = "d-906752246f"

ds = boto3.client('ds', region_name=region)

def lambda_handler(event, context):
    
    ## get the current number of domain controllers
    dcs = ds.describe_domain_controllers(DirectoryId = dsId)

    DomainControllers = dcs["DomainControllers"]
    
    DCcount = len(DomainControllers)
    print(">>> Current number of DCs:" + str(DCcount))

    #increase the number of DCs
    if DCcount < maxDcNum:
        NewDCnumber = DCcount + 1 
        response = ds.update_number_of_domain_controllers(DirectoryId = dsId, DesiredNumber =  NewDCnumber);    

        return {
            'statusCode': 200,
            'body': json.dumps("New DC number will be " + str(NewDCnumber))
        }
    else:
        return {
            'statusCode': 200,
            'body': json.dumps("Max number of DCs reached. The number of DCs is" + str(DCcount))
        }

Note: When testing this Lambda function, remember that this will increase the number of domain controllers for your directory in that Region. If the additional domain controller is not needed, please reduce the count after the test to avoid costs for an additional domain controller. The same principles used in this article to automate the addition of domain controllers can be applied to automate the reduction of domain controllers and you should consider automating the reduction to optimize for resilience, performance and cost.

Conclusion

In this post, you’ve implemented alarms based on thresholds in Domain Controller utilization using AWS CloudWatch and automation to increase the number of domain controllers using AWS Lambda functions. This solution helps to cost-effectively improve resilience and performance of your directory, by scaling your directory based on historical load patterns.

To learn more about using AWS Managed Microsoft AD, visit the AWS Directory Service documentation. For general information and pricing, see the AWS Directory Service home page. If you have comments about this blog post, submit a comment in the Comments section below. If you have implementation or troubleshooting questions, start a new thread on the Directory Service forum or contact AWS Support.

Want more AWS Security news? Follow us on Twitter.

Author

Dennis Rothmel

Dennis is a Sr. Product Manager from AWS Identity with a passion for modernization and automation. He has worked globally across Asia Pacific, Europe, and America, and enjoys the travel, languages, cultures and foods that come with global working.

Author

Vladimir Provorov

Vladimir is a Product Solutions Architect from AWS Identity focused on Workforce Identity and Directory Service. He works on developing new features to make Enterprise Identity simpler and more scalable. He is excited to travel and explore the world with his family.

Accelo uses Amazon QuickSight to accelerate time to value in delivering embedded analytics to professional services businesses

Post Syndicated from Mahlon Duke original https://aws.amazon.com/blogs/big-data/accelo-uses-amazon-quicksight-to-accelerate-time-to-value-in-delivering-embedded-analytics-to-professional-services-businesses/

This is a guest post by Accelo. In their own words, “Accelo is the leading cloud-based platform for managing client work, from prospect to payment, for professional services companies. Each month, tens of thousands of Accelo users across 43 countries create more than 3 million activities, log 1.2 million hours of work, and generate over $140 million in invoices.”

Imagine driving a car with a blacked-out windshield. It sounds terrifying, but it’s the way things are for most small businesses. While they look into the rear-view mirror to see where they’ve been, they lack visibility into what’s ahead of them. The lack of real-time data and reliable forecasts leaves critical decisions like investment, hiring, and resourcing to “gut feel.” An industry survey conducted by Accelo shows 67% of senior leaders don’t have visibility into team utilization, and 54% of them can’t track client project budgets, much less profitability.

Professional services businesses generate most of their revenue directly from billable work they do for clients every day. Because no two clients, projects, or team members are the same, real-time and actionable insight is paramount to ensure happy clients and a successful, profitable business. A big part of the problem is that many businesses are trying to manage their client work with a cocktail of different, disconnected systems. No wonder KPMG found that 56% of CEOs have little confidence in the integrity of the data they’re using for decision-making.

Accelo’s mission is to solve this problem by giving businesses an integrated system to manage all their client work, from prospect to payment. By combining what have historically been disparate parts of the business—CRM, sales, project management, time tracking, client support, and billing—Accelo becomes the single source of truth for your business’s most important data.

Even with a trustworthy, automated and integrated system, decision makers still need to harness the data so they see what’s in front of them and can anticipate for the future. Accelo devoted all our resources and expertise to building a complete client work management platform, made up of essential products to achieve the greatest profitability. We recognized that in order to make the platform most effective, users needed to be empowered with the strongest analytics and actionable insights for strategic decision making. This drove us to seek out a leading BI solution that could seamlessly integrate with our platform and create the greatest user experience. Our objective was to ensure that Accelo users had access to the best BI tool without requiring them to spend more of their valuable time learning yet another tool – not to mention another login. We needed a powerful embedded analytics solution.

We evaluated dozens of leading BI and embedded reporting solutions, and Amazon QuickSight was the clear winner. In this post, we discuss why, and how QuickSight accelerated our time to value in delivering embedded analytics to our users.

Data drives insights

Even today, many organizations track their work manually. They extract data from different systems that don’t talk to each other, and manually manipulate it in spreadsheets, which wastes time and introduces the kinds of data integrity problems that cause CEOs to lose their confidence. As companies grow, these manual and error-prone approaches don’t scale with them, and the sheer level of effort required to keep data up to date can easily result in leaders just giving up.

With this in mind, Accelo’s embedded analytics solution was built from the ground up to grow with us and with our users. As a part of the AWS family, QuickSight eliminated one of the biggest hurdles for embedded analytics through its SPICE storage system. SPICE enables us to create unlimited, purpose-built datasets that are hosted in Amazon’s dynamic storage infrastructure. These smaller datasets load more quickly than your typical monolithic database, and can be updated as often as we need, all at an affordable per-gigabyte rate. This allows us to provide real-time analytics to our users swiftly, accurately, and economically.

“Being able to rely on Accelo to tell us everything about our projects saves us a lot of time, instead of having to go in and download a lot of information to create a spreadsheet to do any kind of analysis,” says Katherine Jonelis, Director of Operations, MHA Consulting. “My boss loves the dashboards. He loves just being able to look at that and instantly know, ‘Here’s where we are.’”

In addition to powering analytics for our users, QuickSight also helps our internal teams identify and track vital KPIs, which historically has been done via third-party apps. These metrics can cover anything, from calculating the effective billable rate across hundreds of projects and thousands of time entries, to determining how much time is left for the team to finish their tasks profitably and on budget. Because the reports are embedded directly in Accelo, which already houses all the data, it was easy for our team to adapt to the new reports and require minimal training.

Integrated vs. embedded

One of the most important factors in our evaluation of BI platforms was the time to value. We asked ourselves two questions: How long would it take to have the solution up and running, and how long would it take for our users to see value from it?

While there are plenty of powerful third-party, integrated BI products out there, they often require a complete integration, adding authentication and configuration on top of basic data extraction and transformations. This makes them an unattractive option, especially in an increasingly security-focused landscape. Meanwhile, most of the embedded products we evaluated required a time to launch that numbered in the months—spending time on infrastructure, data sources, and more. And that’s without considering the infrastructure and engineering costs of ongoing maintenance. One key benefit that propels QuickSight above other products is that it allowed us to reduce that setup time from months to weeks, and completely eliminated any configuration work for the end-user. This is possible thanks to built-in tools like native connections for AWS data sources, row-level security for datasets, and a simple user provisioning process.

Developer hours can be expensive, and are always in high demand. Even in a responsive and agile development environment like Accelo’s, development work still requires lead time before it can be scheduled and completed. Engineering resources are also finite—if they’re working on one thing today, something else is probably going into the backlog. QuickSight enables us to eliminate this bottleneck by shifting the task of managing these analytics from developers to data analysts. We used QuickSight to easily create datasets and reports, and placed a simple API call to embed them for our clients so they can start using them instantly. Now we’re able to quickly respond to our users’ ever-changing needs without requiring developers. That further improves the speed and quality of our data by using both the analysts’ general expertise with data visualization and their unique knowledge of Accelo’s schema. Today, all of Accelo’s reports are created and deployed through QuickSight. We’re able to accommodate dozens of custom requests each month for improvements—major and minor—without ever needing to involve a developer.

Implementation and training were also key considerations during our evaluation. Our customers are busy running their businesses. The last thing they want is to get trained on a new tool, not to mention the typically high cost associated with implementation. As a turnkey solution that requires no configuration and minimal education, QuickSight was the clear winner.

Delivering value in an agile environment

It’s no secret that employees dislike timesheets and would rather spend time working with their clients. For many services companies, logged time is how they bill their clients and get paid. Therefore, it’s vital that employees log all their hours. To make that process as painless as possible, Accelo offers several tools that minimize the amount of work it takes an employee to log their time. For example, the Auto Scheduling tool automatically builds out employees’ schedules based on the work they’re assigned, and logs their time with a single click. Inevitably, however, someone always forgets to log their time, leading to lost revenue.

To address this issue, Accelo built the Missing Time report, which pulls hundreds of thousands of time entries, complex work schedules, and even holiday and PTO time together to offer answers to these questions: Who hasn’t logged their time? How much time is missing? And from what time period?

Every business needs to know whether they’re profitable. Professional services businesses are unique in that profitability is tied directly to their individual clients and the relationships with them. Some clients may generate high revenues but require so much extra maintenance that they become unprofitable. On the other hand, low-profile clients that don’t require a lot of attention can significantly contribute to the business’s bottom line. By having all the client data under one roof, these centralized and embedded reports can provide visibility into your budgets, time entries, work status, and team utilization. This makes it possible to make real-time, data-driven actions without having to spend all day to get the data.

Summary

Clean and holistic data fosters deep insights that can lead to higher margins and profits. We’re excited to partner with AWS and QuickSight to provide professional services businesses with real-time insights into their operations so they can become truly data driven, effortlessly. Learn more about Accelo, and Amazon QuickSight Embedded Analytics!


About the Authors

Mahlon Duke, Accelo Product Manager of BI and Data.

Geoff McQueen, Accelo Founder and CEO.

How GE Aviation built cloud-native data pipelines at enterprise scale using the AWS platform

Post Syndicated from Alcuin Weidus original https://aws.amazon.com/blogs/big-data/how-ge-aviation-built-cloud-native-data-pipelines-at-enterprise-scale-using-the-aws-platform/

This post was co-written with Alcuin Weidus, Principal Architect from GE Aviation.

GE Aviation, an operating unit of GE, is a world-leading provider of jet and turboprop engines, as well as integrated systems for commercial, military, business, and general aviation aircraft. GE Aviation has a global service network to support these offerings.

From the turbosupercharger to the world’s most powerful commercial jet engine, GE’s history of powering the world’s aircraft features more than 90 years of innovation.

In this post, we share how GE Aviation built cloud-native data pipelines at enterprise scale using the AWS platform.

A focus on the foundation

At GE Aviation, we’ve been invested in the data space for many years. Witnessing the customer value and business insights that could be extracted from data at scale has propelled us forward. We’re always looking for new ways to evolve, grow, and modernize our data and analytics stack. In 2019, this meant moving from a traditional on-premises data footprint (with some specialized AWS use cases) to a fully AWS Cloud-native design. We understood the task was challenging, but we were committed to its success. We saw the tremendous potential in AWS, and were eager to partner closely with a company that has over a decade of cloud experience.

Our goal from the outset was clear: build an enterprise-scale data platform to accelerate and connect the business. Using the best of cloud technology would set us up to deliver on our goal and prioritize performance and reliability in the process. From an early point in the build, we knew that if we wanted to achieve true scale, we had to start with solid foundations. This meant first focusing on our data pipelines and storage layer, which serve as the ingest point for hundreds of source systems. Our team chose Amazon Simple Storage Service (Amazon S3) as our foundational data lake storage platform.

Amazon S3 was the first choice as it provides an optimal foundation for a data lake store delivering virtually unlimited scalability and 11 9s of durability. In addition to its scalable performance, it has ease-of-use features, native encryption, and access control capabilities. Equally important, Amazon S3 integrates with a broad portfolio of AWS services, such as Amazon Athena, the AWS Glue Data Catalog, AWS Glue ETL (extract, transform, and load) Amazon Redshift, Amazon Redshift Spectrum, and many third-party tools, providing a growing ecosystem of data management tools.

How we started

The journey started with an internal hackathon that brought cross-functional team members together. We organized around an initial design and established an architecture to start the build using serverless patterns. A combination of Amazon S3, AWS Glue ETL, and the Data Catalog were central to our solution. These three services in particular aligned to our broader strategy to be serverless wherever possible and build on top of AWS services that were experiencing heavy innovation in the way of new features.

We felt good about our approach and promptly got to work.

Solution overview

Our cloud data platform built on Amazon S3 is fed from a combination of enterprise ELT systems. We have an on-premises system that handles change data capture (CDC) workloads and another that works more in a traditional batch manner.

Our design has the on-premises ELT systems dropping files into an S3 bucket set up to receive raw data for both situations. We made the decision to standardize our processed data layer into Apache Parquet format for our cataloged S3 data lake in preparation for more efficient serverless consumption.

Our enterprise CDC system can already land files natively in Parquet; however, our batch files are limited to CSV, so the landing of CSV files triggers another serverless process to convert these files to Parquet using AWS Glue ETL.

The following diagram illustrates this workflow.

When raw data is present and ready in Apache Parquet format, we have an event-triggered solution that processes the data and loads it to another mirror S3 bucket (this is where our users access and consume the data).

Pipelines are developed to support loading at a table level. We have specific AWS Lambda functions to identify schema errors by comparing each file’s schema against the last successful run. Another function validates that a necessary primary key file is present for any CDC tables.

Data partitioning and CDC updates

When our preprocessing Lambda functions are complete, the files are processed in one of two distinct paths based on the table type. Batch table loads are by far the simpler of the two and are handled via a single Lambda function.

For CDC tables, we use AWS Glue ETL to load and perform the updates against our tables stored in the mirror S3 bucket. The AWS Glue job uses Apache Spark data frames to combine historical data, filter out deleted records, and union with any records inserted. For our process, updates are treated as delete-then-insert. After performing the union, the entire dataset is written out to the mirror S3 bucket in a newly created bucket partition.

The following diagram illustrates this workflow.

We write data into a new partition for each table load, so we can provide read consistency in a way that makes sense to our consuming business partners.

Building the Data Catalog

When each Amazon S3 mirror data load is complete, another separate serverless branch is triggered to handle catalog management.

The branch updates the location property within the catalog for pre-existing tables, indicating each newly added partition. When loading a table for the first time, we trigger a series of purpose-built Lambda functions to create the AWS Glue Data Catalog database (only required when it’s an entirely new source schema), create an AWS Glue crawler, start the crawler, and delete the crawler when it’s complete.

The following diagram illustrates this workflow.

These event-driven design patterns allow us to fully automate the catalog management piece of our architecture, which became a big win for our team because it lowered the operational overhead associated with onboarding new source tables. Every achievement like this mattered because it realized the potential the cloud had to transform how we build and support products across our technology organization.

Final implementation architecture and best practices

The solution evolved several times throughout the development cycle, typically due to learning something new in terms of serverless and cloud-native development, and further working with AWS Solutions Architect and AWS Professional Services teams. Along the way, we’ve discovered many cloud-native best practices and accelerated our serverless data journey to AWS.

The following diagram illustrates our final architecture.

We strategically added Amazon Simple Queue Service (Amazon SQS) between purpose-built Lambda functions to decouple the architecture. Amazon SQS gave our system a level of resiliency and operational observability that otherwise would have been a challenge.

Another best practice arose from using Amazon DynamoDB as a state table to help ensure our entire serverless integration pattern was writing to our mirror bucket with ACID guarantees.

On the topic of operational observability, we use Amazon EventBridge to capture and report on operational metadata like table load status, time of the last load, and row counts.

Bringing it all together

At the time of writing, we’ve had production workloads running through our solution for the better part of 14 months.

Production data is integrated from more than 30 source systems at present and totals several hundred tables. This solution has given us a great starting point for building our cloud data ecosystem. The flexibility and extensibility of AWS’s many services have been key to our success.

Appreciation for the AWS Glue Data Catalog has been an essential element. Without knowing it at the time we started building a data lake, we’ve been embracing a modern data architecture pattern and organizing around our transactionally consistent and cataloged mirror storage layer.

The introduction of a more seamless Apache Hudi experience within AWS has been a big win for our team. We’ve been busy incorporating Hudi into our CDC transaction pipeline and are thrilled with the results. We’re able to spend less time writing code managing the storage of our data, and more time focusing on the reliability of our system. This has been critical in our ability to scale. Our development pipeline has grown beyond 10,000 tables and more than 150 source systems as we approach another major production cutover.

Looking ahead, we’re intrigued by the potential for AWS Lake Formation goverened tables to further accelerate our momentum and management of CDC table loads.

Conclusion

Building our cloud-native integration pipeline has been a journey. What started as an idea and has turned into much more in a brief time. It’s hard to appreciate how far we’ve come when there’s always more to be done. That being said, the entire process has been extraordinary. We built deep and trusted partnerships with AWS, learned more about our internal value statement, and aligned more of our organization to a cloud-centric way of operating.

The ability to build solutions in a serverless manner opens up many doors for our data function and, most importantly, our customers. Speed to delivery and the pace of innovation is directly related to our ability to focus our engineering teams on business-specific problems while trusting a partner like AWS to do the heavy lifting of data center operations like racking, stacking, and powering servers. It also removes the operational burden of managing operating systems and applications with managed services. Finally, it allows us to focus on our customers and business process enablement rather than on IT infrastructure.

The breadth and depth of data and analytics services on AWS make it possible to solve our business problems by using the right resources to run whatever analysis is most appropriate for a specific need. AWS Data and Analytics has deep integrations across all layers of the AWS ecosystem, giving us the tools to analyze data using any approach quickly. We appreciate AWS’s continual innovation on behalf of its customers.


About the Authors

Alcuin Weidus is a Principal Data Architect for GE Aviation. Serverless advocate, perpetual data management student, and cloud native strategist, Alcuin is a data technology leader on a team responsible for accelerating technical outcomes across GE Aviation. Connect him on Linkedin.

Suresh Patnam is a Sr Solutions Architect at AWS; He works with customers to build IT strategy, making digital transformation through the cloud more accessible, focusing on big data, data lakes, and AI/ML. In his spare time, Suresh enjoys playing tennis and spending time with his family. Connect him on LinkedIn.

IBM Hackathon Produces Innovative Sustainability Solutions on AWS

Post Syndicated from Dhana Vadivelan original https://aws.amazon.com/blogs/architecture/ibm-hackathon-produces-innovative-sustainability-solutions-on-aws/

This post was co-authored by Dhana Vadivelan, Senior Manager, Solutions Architecture, AWS; Markus Graulich, Chief Architect AI EMEA, IBM Consulting; and Vlad Zamfirescu, Senior Solutions Architect, IBM Consulting

Our consulting partner, IBM, organized the “Sustainability Applied 2021” hackathon in September 2021. This three-day event aimed to generate new ideas, create reference architecture patterns using AWS Cloud services, and produce sustainable solutions.

This post highlights four reference architectures that were developed during the hackathon. These architectures show you how IBM hack teams used AWS services to resolve real-world sustainability challenges. We hope these architectures inspire you to help address other sustainability challenges with your own solutions.

IBM sustainability hackathon

Any sustainability research requires acquiring and analyzing large sustainability datasets, such as weather, climate, water, agriculture, and satellite imagery. This requires large storage capacity and often takes a considerable amount of time to complete.

The Amazon Sustainability Data Initiative (ASDI) provides innovators and researchers with sustainability datasets and tools to develop solutions. These datasets are publicly available to anyone on the Registry of Open Data on AWS.

In the hackathon, IBM hack teams used these sample datasets and open APIs from The Weather Company (an IBM business) to develop solutions for sustainability challenges.

Architecture 1: Biocapacity digital twin solution

The hack team “Biohackers” addressed biocapacity, which refers to a biologically productive area’s (cropland, forest, and fishing grounds) ability to generate renewable resources and to absorb its spillover waste. Countries consume 1.7 global hectares per person of Earth’s total biocapacity; this means we consume more resources than are available on this planet.

To help solve this problem, the team created a digital twin architecture (Figure 1) to virtually represent biocapacity information in various conditions:

Biocapacity digital twin solution on AWS

Figure 1. Biocapacity digital twin solution on AWS

This solution provides precise information on current biocapacity and predicts the future biocapacity status at country, region, and city levels. The Biohackers aim to help governments, businesses, and individuals identify options to improve the supply of available renewable resources and increase awareness of the supply and demand.

Architecture 2: Local emergency communication system

Team “Sustainable Force 99,” worked to better understand natural disasters, which have tripled over recent years. Their solution aims to predict natural disasters by analyzing the geographical spread of contributing factors like extreme weather due to climate change, wildfires, and deforestation. Then it communicates clear instructions to people who are potentially in danger.

Their solution (Figure 2) uses the Amazon SageMaker AI prediction model and combines The Weather Company data with Amazon S3, Amazon DynamoDB, and Serverless on AWS technologies and communicates with the public by:

  • Providing voice and chat communication channels using Amazon Connect, Amazon Lex, and Amazon Pinpoint.
  • Broadcasting alerts across smartphones and speakers in towns to provide information to people about upcoming natural disasters.
  • Allowing individuals to notify emergency services of their circumstances.
Local emergency communication system

Figure 2. Local emergency communication system

This communication helps governments and local authorities identify and communicate safe relocation options during disasters and connect with nearby relocation assistance teams.

Architecture 3: Intelligent satellite image processing

Team “Green Fire” examined how to reduce environmental problems caused by wildfires.

Many forest service organizations already use predictive tools to provide intelligence to fire services authorities using satellite imaging. The satellites can detect and capture images of wildfires. However, it can take hours to process these images and transmit and analyze the information, which can mean the subsequent coordination and mobilization of emergency services can be challenging.

To help improve fire rescue and other emergency services coordination and real-time situational awareness, Green Fire created a serverless application architecture (Figure 3):

  • The drone images, external data feeds from AWS Open Data Registry, and the datasets from The Weather Company are stored in Amazon S3 for processing.
  • AWS Lambda processes the images and resizes the data, and the outputs are stored in DynamoDB.
  • Rekognition labels the drone images that identify geographical risks and fire hazards. This allows emergency services to identify potential risks, and they can further model the potential spread of the wildfire and identify options to suppress it.
  • Lambda integrates the API layer between the web user interface and DynamoDB so users can access the application from a web browser/mobile device (mobile application developed using AWS Amplify). Amazon Cognito authenticates users and controls user access.
Intelligent image processing

Figure 3. Intelligent image processing

The team expects this solution to help prevent loss of human lives, save approximately 10% of yearly spend, and reduce CO2 emissions globally between 1.75 to 13.5 billion metric tons of carbon.

Architecture 4: Machine-learning-based solution to predict bee colonies at risk

Variations in vegetation, rising temperatures, and use of pesticide are significantly destroying habitats and creating inhospitable conditions for many species of bees. Over the last decade, beehives in the US and Europe have suffered hive losses of at least 30%.

To encourage the adoption of sustainable agriculture, it is important to safeguard bee colonies. The “I BEE GREEN” team developed a device that contains sensors that monitor beehive health, such as temperature, humidity, air pollutants, beehive acoustic signals, and the number of bees:

  • AWS IoT Core for LoRaWAN connects wireless sensor devices that use the LoRaWAN protocol for low-power, long-range comprehensive area network connectivity.
  • The sensor and weather data (from AWS Open Data Registry/The Weather Company) are loaded in Amazon S3 and transformed using AWS Glue.
  • Once the data is processed and ready to be consumed, it is stored on the AWS S3 bucket.
  • SageMaker consumes this data and generates forecasts such as estimated bee population and mortality rates, probability of infectious diseases and their spread, and the effect of the environment on beehive health.
  • The forecasts are presented in a dashboard using AWS QuickSight and are based on historical data, current data, and trends.

The information this solution generates can be used for several use cases, including:

  • Offering agricultural organizations information on how climate change impacts bee colonies and influences their business performance
  • Contributing to beekeepers’ understanding of the best environment to safeguard bee biodiversity and when to pollinate crops
  • Educating farmers on sustainable methods of agriculture that reduces threat to bees

The I BEE GREEN device automatically counts when bees are entering or exiting the hive. Using this, farmers can assess a hive’s acoustic signal, temperature, humidity, the presence of pollutants, classify them as normal or abnormal, and forecast the potential risk of abnormal mortality. The I BEE GREEN team aims for their device to deploy quickly, with minimal instructions anyone can implement.

Machine-learning-based architecture to predict bee colonies at risk

Figure 4. Machine-learning-based architecture to predict bee colonies at risk

Conclusion

In this blog post, we showed you how IBM hackathon teams used AWS technologies to solve sustainability-related challenges.

Ready to make your own? Visit our sustainability page to learn more about AWS services and features that encourage innovation to solve real-world sustainability challenges. Read more sustainability use cases on the AWS Public Sector Blog.

Create a serverless event-driven workflow to ingest and process Microsoft data with AWS Glue and Amazon EventBridge

Post Syndicated from Venkata Sistla original https://aws.amazon.com/blogs/big-data/create-a-serverless-event-driven-workflow-to-ingest-and-process-microsoft-data-with-aws-glue-and-amazon-eventbridge/

Microsoft SharePoint is a document management system for storing files, organizing documents, and sharing and editing documents in collaboration with others. Your organization may want to ingest SharePoint data into your data lake, combine the SharePoint data with other data that’s available in the data lake, and use it for reporting and analytics purposes. AWS Glue is a serverless data integration service that makes it easy to discover, prepare, and combine data for analytics, machine learning, and application development. AWS Glue provides all the capabilities needed for data integration so that you can start analyzing your data and putting it to use in minutes instead of months.

Organizations often manage their data on SharePoint in the form of files and lists, and you can use this data for easier discovery, better auditing, and compliance. SharePoint as a data source is not a typical relational database and the data is mostly semi structured, which is why it’s often difficult to join the SharePoint data with other relational data sources. This post shows how to ingest and process SharePoint lists and files with AWS Glue and Amazon EventBridge, which enables you to join other data that is available in your data lake. We use SharePoint REST APIs with a standard open data protocol (OData) syntax. OData advocates a standard way of implementing REST APIs that allows for SQL-like querying capabilities. OData helps you focus on your business logic while building RESTful APIs without having to worry about the various approaches to define request and response headers, query options, and so on.

AWS Glue event-driven workflows

Unlike a traditional relational database, SharePoint data may or may not change frequently, and it’s difficult to predict the frequency at which your SharePoint server generates new data, which makes it difficult to plan and schedule data processing pipelines efficiently. Running data processing frequently can be expensive, whereas scheduling pipelines to run infrequently can deliver cold data. Similarly, triggering pipelines from an external process can increase complexity, cost, and job startup time.

AWS Glue supports event-driven workflows, a capability that lets developers start AWS Glue workflows based on events delivered by EventBridge. The main reason to choose EventBridge in this architecture is because it allows you to process events, update the target tables, and make information available to consume in near-real time. Because frequency of data change in SharePoint is unpredictable, using EventBridge to capture events as they arrive enables you to run the data processing pipeline only when new data is available.

To get started, you simply create a new AWS Glue trigger of type EVENT and place it as the first trigger in your workflow. You can optionally specify a batching condition. Without event batching, the AWS Glue workflow is triggered every time an EventBridge rule matches, which may result in multiple concurrent workflows running. AWS Glue protects you by setting default limits that restrict the number of concurrent runs of a workflow. You can increase the required limits by opening a support case. Event batching allows you to configure the number of events to buffer or the maximum elapsed time before firing the particular trigger. When the batching condition is met, a workflow run is started. For example, you can trigger your workflow when 100 files are uploaded in Amazon Simple Storage Service (Amazon S3) or 5 minutes after the first upload. We recommend configuring event batching to avoid too many concurrent workflows, and optimize resource usage and cost.

To illustrate this solution better, consider the following use case for a wine manufacturing and distribution company that operates across multiple countries. They currently host all their transactional system’s data on a data lake in Amazon S3. They also use SharePoint lists to capture feedback and comments on wine quality and composition from their suppliers and other stakeholders. The supply chain team wants to join their transactional data with the wine quality comments in SharePoint data to improve their wine quality and manage their production issues better. They want to capture those comments from the SharePoint server within an hour and publish that data to a wine quality dashboard in Amazon QuickSight. With an event-driven approach to ingest and process their SharePoint data, the supply chain team can consume the data in less than an hour.

Overview of solution

In this post, we walk through a solution to set up an AWS Glue job to ingest SharePoint lists and files into an S3 bucket and an AWS Glue workflow that listens to S3 PutObject data events captured by AWS CloudTrail. This workflow is configured with an event-based trigger to run when an AWS Glue ingest job adds new files into the S3 bucket. The following diagram illustrates the architecture.

To make it simple to deploy, we captured the entire solution in an AWS CloudFormation template that enables you to automatically ingest SharePoint data into Amazon S3. SharePoint uses ClientID and TenantID credentials for authentication and uses Oauth2 for authorization.

The template helps you perform the following steps:

  1. Create an AWS Glue Python shell job to make the REST API call to the SharePoint server and ingest files or lists into Amazon S3.
  2. Create an AWS Glue workflow with a starting trigger of EVENT type.
  3. Configure CloudTrail to log data events, such as PutObject API calls to CloudTrail.
  4. Create a rule in EventBridge to forward the PutObject API events to AWS Glue when they’re emitted by CloudTrail.
  5. Add an AWS Glue event-driven workflow as a target to the EventBridge rule. The workflow gets triggered when the SharePoint ingest AWS Glue job adds new files to the S3 bucket.

Prerequisites

For this walkthrough, you should have the following prerequisites:

Configure SharePoint server authentication details

Before launching the CloudFormation stack, you need to set up your SharePoint server authentication details, namely, TenantID, Tenant, ClientID, ClientSecret, and the SharePoint URL in AWS Systems Manager Parameter Store of the account you’re deploying in. This makes sure that no authentication details are stored in the code and they’re fetched in real time from Parameter Store when the solution is running.

To create your AWS Systems Manager parameters, complete the following steps:

  1. On the Systems Manager console, under Application Management in the navigation pane, choose Parameter Store.
    systems manager
  2. Choose Create Parameter.
  3. For Name, enter the parameter name /DATALAKE/GlueIngest/SharePoint/tenant.
  4. Leave the type as string.
  5. Enter your SharePoint tenant detail into the value field.
  6. Choose Create parameter.
  7. Repeat these steps to create the following parameters:
    1. /DataLake/GlueIngest/SharePoint/tenant
    2. /DataLake/GlueIngest/SharePoint/tenant_id
    3. /DataLake/GlueIngest/SharePoint/client_id/list
    4. /DataLake/GlueIngest/SharePoint/client_secret/list
    5. /DataLake/GlueIngest/SharePoint/client_id/file
    6. /DataLake/GlueIngest/SharePoint/client_secret/file
    7. /DataLake/GlueIngest/SharePoint/url/list
    8. /DataLake/GlueIngest/SharePoint/url/file

Deploy the solution with AWS CloudFormation

For a quick start of this solution, you can deploy the provided CloudFormation stack. This creates all the required resources in your account.

The CloudFormation template generates the following resources:

  • S3 bucket – Stores data, CloudTrail logs, job scripts, and any temporary files generated during the AWS Glue extract, transform, and load (ETL) job run.
  • CloudTrail trail with S3 data events enabled – Enables EventBridge to receive PutObject API call data in a specific bucket.
  • AWS Glue Job – A Python shell job that fetches the data from the SharePoint server.
  • AWS Glue workflow – A data processing pipeline that is comprised of a crawler, jobs, and triggers. This workflow converts uploaded data files into Apache Parquet format.
  • AWS Glue database – The AWS Glue Data Catalog database that holds the tables created in this walkthrough.
  • AWS Glue table – The Data Catalog table representing the Parquet files being converted by the workflow.
  • AWS Lambda function – The AWS Lambda function is used as an AWS CloudFormation custom resource to copy job scripts from an AWS Glue-managed GitHub repository and an AWS Big Data blog S3 bucket to your S3 bucket.
  • IAM roles and policies – We use the following AWS Identity and Access Management (IAM) roles:
    • LambdaExecutionRole – Runs the Lambda function that has permission to upload the job scripts to the S3 bucket.
    • GlueServiceRole – Runs the AWS Glue job that has permission to download the script, read data from the source, and write data to the destination after conversion.
    • EventBridgeGlueExecutionRole – Has permissions to invoke the NotifyEvent API for an AWS Glue workflow.
    • IngestGlueRole – Runs the AWS Glue job that has permission to ingest data into the S3 bucket.

To launch the CloudFormation stack, complete the following steps:

  1. Sign in to the AWS CloudFormation console.
  2. Choose Launch Stack:
  3. Choose Next.
  4. For pS3BucketName, enter the unique name of your new S3 bucket.
  5. Leave pWorkflowName and pDatabaseName as the default.

cloud formation 1

  1. For pDatasetName, enter the SharePoint list name or file name you want to ingest.
  2. Choose Next.

cloud formation 2

  1. On the next page, choose Next.
  2. Review the details on the final page and select I acknowledge that AWS CloudFormation might create IAM resources.
  3. Choose Create.

It takes a few minutes for the stack creation to complete; you can follow the progress on the Events tab.

You can run the ingest AWS Glue job either on a schedule or on demand. As the job successfully finishes and ingests data into the raw prefix of the S3 bucket, the AWS Glue workflow runs and transforms the ingested raw CSV files into Parquet files and loads them into the transformed prefix.

Review the EventBridge rule

The CloudFormation template created an EventBridge rule to forward S3 PutObject API events to AWS Glue. Let’s review the configuration of the EventBridge rule:

  1. On the EventBridge console, under Events, choose Rules.
  2. Choose the rule s3_file_upload_trigger_rule-<CloudFormation-stack-name>.
  3. Review the information in the Event pattern section.

event bridge

The event pattern shows that this rule is triggered when an S3 object is uploaded to s3://<bucket_name>/data/SharePoint/tablename_raw/. CloudTrail captures the PutObject API calls made and relays them as events to EventBridge.

  1. In the Targets section, you can verify that this EventBridge rule is configured with an AWS Glue workflow as a target.

event bridge target section

Run the ingest AWS Glue job and verify the AWS Glue workflow is triggered successfully

To test the workflow, we run the ingest-glue-job-SharePoint-file job using the following steps:

  1. On the AWS Glue console, select the ingest-glue-job-SharePoint-file job.

glue job

  1. On the Action menu, choose Run job.

glue job action menu

  1. Choose the History tab and wait until the job succeeds.

glue job history tab

You can now see the CSV files in the raw prefix of your S3 bucket.

csv file s3 location

Now the workflow should be triggered.

  1. On the AWS Glue console, validate that your workflow is in the RUNNING state.

glue workflow running status

  1. Choose the workflow to view the run details.
  2. On the History tab of the workflow, choose the current or most recent workflow run.
  3. Choose View run details.

glue workflow visual

When the workflow run status changes to Completed, let’s check the converted files in your S3 bucket.

  1. Switch to the Amazon S3 console, and navigate to your bucket.

You can see the Parquet files under s3://<bucket_name>/data/SharePoint/tablename_transformed/.

parquet file s3 location

Congratulations! Your workflow ran successfully based on S3 events triggered by uploading files to your bucket. You can verify everything works as expected by running a query against the generated table using Amazon Athena.

Sample wine dataset

Let’s analyze a sample red wine dataset. The following screenshot shows a SharePoint list that contains various readings that relate to the characteristics of the wine and an associated wine category. This is populated by various wine tasters from multiple countries.

redwine dataset

The following screenshot shows a supplier dataset from the data lake with wine categories ordered per supplier.

supplier dataset

We process the red wine dataset using this solution and use Athena to query the red wine data and supplier data where wine quality is greater than or equal to 7.

athena query and results

We can visualize the processed dataset using QuickSight.

Clean up

To avoid incurring unnecessary charges, you can use the AWS CloudFormation console to delete the stack that you deployed. This removes all the resources you created when deploying the solution.

Conclusion

Event-driven architectures provide access to near-real-time information and help you make business decisions on fresh data. In this post, we demonstrated how to ingest and process SharePoint data using AWS serverless services like AWS Glue and EventBridge. We saw how to configure a rule in EventBridge to forward events to AWS Glue. You can use this pattern for your analytical use cases, such as joining SharePoint data with other data in your lake to generate insights, or auditing SharePoint data and compliance requirements.


About the Author

Venkata Sistla is a Big Data & Analytics Consultant on the AWS Professional Services team. He specializes in building data processing capabilities and helping customers remove constraints that prevent them from leveraging their data to develop business insights.

How Roche democratized access to data with Google Sheets and Amazon Redshift Data API

Post Syndicated from Dr. Yannick Misteli original https://aws.amazon.com/blogs/big-data/how-roche-democratized-access-to-data-with-google-sheets-and-amazon-redshift-data-api/

This post was co-written with Dr. Yannick Misteli, João Antunes, and Krzysztof Wisniewski from the Roche global Platform and ML engineering team as the lead authors.

Roche is a Swiss multinational healthcare company that operates worldwide. Roche is the largest pharmaceutical company in the world and the leading provider of cancer treatments globally.

In this post, Roche’s global Platform and machine learning (ML) engineering team discuss how they used Amazon Redshift data API to democratize access to the data in their Amazon Redshift data warehouse with Google Sheets (gSheets).

Business needs

Go-To-Market (GTM) is the domain that lets Roche understand customers and create and deliver valuable services that meet their needs. This lets them get a better understanding of the health ecosystem and provide better services for patients, doctors, and hospitals. It extends beyond health care professionals (HCPs) to a larger Healthcare ecosystem consisting of patients, communities, health authorities, payers, providers, academia, competitors, etc. Data and analytics are essential to supporting our internal and external stakeholders in their decision-making processes through actionable insights.

For this mission, Roche embraced the modern data stack and built a scalable solution in the cloud.

Driving true data democratization requires not only providing business leaders with polished dashboards or data scientists with SQL access, but also addressing the requirements of business users that need the data. For this purpose, most business users (such as Analysts) leverage Excel—or gSheet in the case of Roche—for data analysis.

Providing access to data in Amazon Redshift to these gSheets users is a non-trivial problem. Without a powerful and flexible tool that lets data consumers use self-service analytics, most organizations will not realize the promise of the modern data stack. To solve this problem, we want to empower every data analyst who doesn’t have an SQL skillset with a means by which they can easily access and manipulate data in the applications that they are most familiar with.

The Roche GTM organization uses the Redshift Data API to simplify the integration between gSheets and Amazon Redshift, and thus facilitate the data needs of their business users for analytical processing and querying. The Amazon Redshift Data API lets you painlessly access data from Amazon Redshift with all types of traditional, cloud-native, and containerized, serverless web service-based applications and event-driven applications. Data API simplifies data access, ingest, and egress from languages supported with AWS SDK, such as Python, Go, Java, Node.js, PHP, Ruby, and C++ so that you can focus on building applications as opposed to managing infrastructure. The process they developed using Amazon Redshift Data API has significantly lowered the barrier for entry for new users without needing any data warehousing experience.

Use-Case

In this post, you will learn how to integrate Amazon Redshift with gSheets to pull data sets directly back into gSheets. These mechanisms are facilitated through the use of the Amazon Redshift Data API and Google Apps Script. Google Apps Script is a programmatic way of manipulating and extending gSheets and the data that they contain.

Architecture

It is possible to include publicly available JS libraries such as JQuery-builder provided that Apps Script is natively a cloud-based Javascript platform.

The JQuery builder library facilitates the creation of standard SQL queries via a simple-to-use graphical user interface. The Redshift Data API can be used to retrieve the data directly to gSheets with a query in place. The following diagram illustrates the overall process from a technical standpoint:

Even though AppsScript is, in fact, Javascript, the AWS-provided SDKs for the browser (NodeJS and React) cannot be used on the Google platform, as they require specific properties that are native to the underlying infrastructure. It is possible to authenticate and access AWS resources through the available API calls. Here is an example of how to achieve that.

You can use an access key ID and a secret access key to authenticate the requests to AWS by using the code in the link example above. We recommend following the least privilege principle when granting access to this programmatic user, or assuming a role with temporary credentials. Since each user will require a different set of permissions on the Redshift objects—database, schema, and table—each user will have their own user access credentials. These credentials are safely stored under the AWS Secrets Manager service. Therefore, the programmatic user needs a set of permissions that enable them to retrieve secrets from the AWS Secrets Manager and execute queries against the Redshift Data API.

Code example for AppScript to use Data API

In this section, you will learn how to pull existing data back into a new gSheets Document. This section will not cover how to parse the data from the JQuery-builder library, as it is not within the main scope of the article.

<script src="https://cdn.jsdelivr.net/npm/jQuery-QueryBuilder/dist/js/query-builder.standalone.min.js"></script>    
  1. In the AWS console, go to Secrets Manager and create a new secret to store the database credentials to access the Redshift Cluster: username and password. These will be used to grant Redshift access to the gSheets user.
  2. In the AWS console, create a new IAM user with programmatic access, and generate the corresponding Access Key credentials. The only set of policies required for this user is to be able to read the secret created in the previous step from the AWS Secrets Manager service and to query the Redshift Data API.

    Below is the policy document:

    {
      "Version": "2012-10-17",
      "Statement": [
        {
          "Sid": "VisualEditor0",
          "Effect": "Allow",
          "Action": [
            "secretsmanager:GetSecretValue",
            "secretsmanager:DescribeSecret"
          ],
          "Resource": "arn:aws:secretsmanager:*::secret:*"
        },
        {
          "Sid": "VisualEditor1",
          "Effect": "Allow",
          "Action": "secretsmanager:ListSecrets",
          "Resource": "*"
        },
        {
          "Sid": "VisualEditor2",
          "Effect": "Allow",
          "Action": "redshift-data:*",
          "Resource": "arn:aws:redshift:*::cluster:*"
        }
      ]
    }

  3. Access the Google Apps Script console. Create an aws.gs file with the code available here. This will let you perform authenticated requests to the AWS services by providing an access key and a secret access key.
  4. Initiate the AWS variable providing the access key and secret access key created in step 3.
    AWS.init("<ACCESS_KEY>", "<SECRET_KEY>");

  5. Request the Redshift username and password from the AWS Secrets Manager:
    function runGetSecretValue_(secretId) {
     
      var resultJson = AWS.request(
        	getSecretsManagerTypeAWS_(),
        	getLocationAWS_(),
        	'secretsmanager.GetSecretValue',
        	{"Version": getVersionAWS_()},
        	method='POST',
        	payload={          
          	"SecretId" : secretId
        	},
        	headers={
          	"X-Amz-Target": "secretsmanager.GetSecretValue",
          	"Content-Type": "application/x-amz-json-1.1"
        	}
      );
     
      Logger.log("Execute Statement result: " + resultJson);
      return JSON.parse(resultJson);
     
    }

  6. Query a table using the Amazon Redshift Data API:
    function runExecuteStatement_(sql) {
     
      var resultJson = AWS.request(
        	getTypeAWS_(),
        	getLocationAWS_(),
        	'RedshiftData.ExecuteStatement',
        	{"Version": getVersionAWS_()},
        	method='POST',
        	payload={
          	"ClusterIdentifier": getClusterIdentifierReshift_(),
          	"Database": getDataBaseRedshift_(),
          	"DbUser": getDbUserRedshift_(),
          	"Sql": sql
        	},
        	headers={
          	"X-Amz-Target": "RedshiftData.ExecuteStatement",
          	"Content-Type": "application/x-amz-json-1.1"
        	}
      ); 
     
      Logger.log("Execute Statement result: " + resultJson); 

  7. The result can then be displayed as a table in gSheets:
    function fillGsheet_(recordArray) { 
     
      adjustRowsCount_(recordArray);
     
      var rowIndex = 1;
      for (var i = 0; i < recordArray.length; i++) {  
           
    	var rows = recordArray[i];
    	for (var j = 0; j < rows.length; j++) {
      	var columns = rows[j];
      	rowIndex++;
      	var columnIndex = 'A';
         
      	for (var k = 0; k < columns.length; k++) {
           
        	var field = columns[k];       
        	var value = getFieldValue_(field);
        	var range = columnIndex + rowIndex;
        	addToCell_(range, value);
     
        	columnIndex = nextChar_(columnIndex);
     
      	}
     
    	}
     
      }
     
    }

  8. Once finished, the Apps Script can be deployed as an Addon that enables end-users from an entire organization to leverage the capabilities of retrieving data from Amazon Redshift directly into their spreadsheets. Details on how Apps Script code can be deployed as an Addon can be found here.

How users access Google Sheets

  1. Open a gSheet, and go to manage addons -> Install addon:
  2. Once the Addon is successfully installed, select the Addon menu and select Redshift Synchronization. A dialog will appear prompting the user to select the combination of database, schema, and table from which to load the data.
  3. After choosing the intended table, a new panel will appear on the right side of the screen. Then, the user is prompted to select which columns to retrieve from the table, apply any filtering operation, and/or apply any aggregations to the data.
  4. Upon submitting the query, app scripts will translate the user selection into a query that is sent to the Amazon Redshift Data API. Then, the returned data is transformed and displayed as a regular gSheet table:

Security and Access Management

In the scripts above, there is a direct integration between AWS Secrets Manager and Google Apps Script. The scripts above can extract the currently-authenticated user’s Google email address. Using this value and a set of annotated tags, the script can appropriately pull the user’s credentials securely to authenticate the requests made to the Amazon Redshift cluster. Follow these steps to set up a new user in an existing Amazon Redshift cluster. Once the user has been created, follow these steps for creating a new AWS Secrets Manager secret for your cluster. Make sure that the appropriate tag is applied with the key of “email” along with the corresponding user’s Google email address. Here is a sample configuration that is used for creating Redshift groups, users, and data shares via the Redshift Data API:

connection:
 redshift_super_user_database: dev
 redshift_secret_name: dev_
 redshift_cluster_identifier: dev-cluster
 redshift_secrets_stack_name: dev-cluster-secrets
 environment: dev
 aws_region: eu-west-1
 tags:
   - key: "Environment"
 	value: "dev"
users:
 - name: user1
   email: [email protected]
 data_shares:
 - name: test_data_share
   schemas:
 	- schema1
   redshift_namespaces:
 	- USDFJIL234234WE
group:
 - name: readonly
   users:
 	- user1
   databases:
 	- database: database1
   	exclude-schemas:
     	- public
     	- pg_toast
     	- catalog_history
   	include-schemas:
     	- schema1
   	grant:
     	- select

Operational Metrics and Improvement

Providing access to live data that is hosted in Redshift directly to the business users and enabling true self-service decrease the burden on platform teams to provide data extracts or other mechanisms to deliver up-to-date information. Additionally, by not having different files and versions of data circulating, the business risk of reporting different key figures or KPI can be reduced, and an overall process efficiency can be achieved.

The initial success of this add-on in GTM led to the extension of this to a broader audience, where we are hoping to serve hundreds of users with all of the internal and public data in the future.

Conclusion

In this post, you learned how to create new Amazon Redshift tables and pull existing Redshift tables into a Google Sheet for business users to easily integrate with and manipulate data. This integration was seamless and demonstrated how easy the Amazon Redshift Data API makes integration with external applications, such as Google Sheets with Amazon Redshift. The outlined use-cases above are just a few examples of how the Amazon Redshift Data API can be applied and used to simplify interactions between users and Amazon Redshift clusters.


About the Authors

Dr. Yannick Misteli is leading cloud platform and ML engineering teams in global product strategy (GPS) at Roche. He is passionate about infrastructure and operationalizing data-driven solutions, and he has broad experience in driving business value creation through data analytics.

João Antunes is a Data Engineer in the Global Product Strategy (GPS) team at Roche. He has a track record of deploying Big Data batch and streaming solutions for the telco, finance, and pharma industries.

Krzysztof Wisniewski is a back-end JavaScript developer in the Global Product Strategy (GPS) team at Roche. He is passionate about full-stack development from the front-end through the back-end to databases.

Matt Noyce is a Senior Cloud Application Architect at AWS. He works together primarily with Life Sciences and Healthcare customers to architect and build solutions on AWS for their business needs.

Debu Panda, a Principal Product Manager at AWS, is an industry leader in analytics, application platform, and database technologies, and has more than 25 years of experience in the IT world. Debu has published numerous articles on analytics, enterprise Java, and databases and has presented at multiple conferences such as re:Invent, Oracle Open World, and Java One. He is lead author of the EJB 3 in Action (Manning Publications 2007, 2014) and Middleware Management (Packt).

How Viasat scaled their big data applications by migrating to Amazon EMR

Post Syndicated from Manoj Gundawar original https://aws.amazon.com/blogs/big-data/how-viasat-scaled-their-big-data-applications-by-migrating-to-amazon-emr/

This post is co-written with Manoj Gundawar from Viasat.

Viasat is a satellite internet service provider based in Carlsbad, CA, with operations across the United States and worldwide. Viasat’s ambition is to be the first truly global, scalable, broadband service provider with a mission to deliver connections that can change the world. Viasat operates across three main business segments: satellite services, commercial networks, and government systems, providing high-speed satellite broadband services and secure networking systems.

In this post, we discuss how migrating our on-premises big data workloads to Amazon EMR helped us achieve a fully managed cloud-native solution and freed us from the constraints of our legacy on-premises solution, so we can focus on business innovation with a lower TCO.

Challenge with the legacy big data environment

Viasat’s big data application, Usage Data Mart, is a high-volume, low-latency Hadoop-based solution that ingests internet usage data from a multitude of source systems. It curates and aggregates with data from other sources, and provides the data in an optimized system to support high-volume access to reporting and web interfaces. This critical application processes over 1.3 billion internet usage records per day, sourced from various upstream systems. Viasat customer support representatives use this data through APIs and reports to assist end-users on any queries regarding their internet usage. Various internal teams and customers also use data for usage accounting, tracking, compliance, and billing purposes.

The Usage Data Mart was previously implemented in an on-premises footprint of over 40 nodes with three independent clusters all running a commercial distribution of Hadoop to process our big data work load. The legacy Hadoop environment required three times the data replication to achieve high availability, which resulted in a large infrastructure footprint. In this architecture, we had a data ingestion cluster to ingest data from a Kafka streaming service, MySQL, and Oracle databases. We had extract, transform, and load (ETL) jobs for each data source and data domains or models, and most of the ETL jobs filter, curate, canonicalize, and aggregate data (by specific keys) using MapReduce framework and load in HBase as well as in HDFS or Amazon Simple Storage Service (Amazon S3) in Apache Parquet format. We used HBase to provide on-demand query and aggregation of data via REST APIs that used HBase coprocessors to apply aggregation and other business logic. Our independent reporting cluster queried Parquet files on HDFS and Amazon S3 with Apache Drill to generate a few dozen periodic reports. We had separated HBase and ETL clusters from reporting clusters to avoid any resource contention.

Our legacy environment had challenges at various levels:

  • Hardware – As the hardware aged, we encountered hardware failures on a regular basis. Expiring warranties on hardware and faulty component replacement increased operational risk. The burden of managing the hardware replacement and servers failing to restart after maintenance imposed a serious risk to the business, which made maintenance unpredictable and time-consuming.
  • Software – Yearly software license renewal costs and engineering efforts involved with software version upgrades to keep it on a supported version added operational complexity. Moreover, the commercial Hadoop distribution that we were running reached end of life in 2020.
  • Scaling – We needed to scale on-premises hardware to meet growing business needs during additional satellite launches that required forecasting and capacity planning. Delays in procurement and shipment of hardware affected project timelines. Finally, increasing data usage and customer adoption of this portal presented serious scaling challenges for Viasat.

How migration to Amazon EMR helped solve this challenge

Viasat evaluated a few alternatives to modernize big data applications and determined that Amazon EMR would be the right platform for our requirements. The separate compute and storage architecture of Amazon EMR helped us address our challenges. The following are some of the key benefits we realized with migration to AWS:

  • Storage – Amazon EMR supports HBase on Amazon S3, where Amazon S3 is used as persistent storage for the HBase cluster and allows us to scale our compute needs independently of storage. It also allows us to easily decommission HBase clusters, test upgrades, and optimizes our total cost of ownership. For guidelines and best practices, see Migrating to Apache HBase on Amazon S3 on Amazon EMR.
  • DNS records – Because it’s so easy for us to provision new HBase clusters, we needed a way to maintain DNS records to make the cluster easily accessible. We use a simple AWS Lambda function to update DNS records during EMR cluster boot up. The DNS records are stored in our custom DNS service and we use a custom API to update the records.
  • Customization – Amazon EMR allows you to customize existing software on the cluster as well as install additional software. We use Apache Drill for reporting and, with EMR bootstrap actions, we were able to install Apache Drill on all the nodes of the reporting cluster to provide us with distributed reporting using Parquet files generated with a MapReduce job. Because our reporting uses different query patterns than the data in the HBase cluster, the Parquet files are written with a different partition optimized for reporting. We increased the default bucket size from approximately 8 MB to 16 MB and pointed Amazon EMR to private Amazon S3 endpoints to avoid traffic going through an external firewall, which increased performance.

The following diagram depicts the process we followed for migration to Amazon EMR.

Viasat successfully migrated our on-premises big data applications to Amazon EMR in May 2021, following a lift-and-shift approach to move the big data workload to the cloud with minimal changes. Although we have an experienced big data team, we used AWS Infrastructure Event Management (IEM) to support queries on fine-tuning the Amazon EMR infrastructure within the migration timeline.

The following diagram outlines our new architecture. With this new architecture, we can process the same workloads with 50% of the compute footprint and approximately 50% of the costs compared to our on-premises clusters and still meet our SLAs.

Conclusion

With the new data platform, we can ingest additional data sources so that our analysts and customer service teams can gain insights and improve customer experience. As Viasat is launching new satellites and growing business in multiple new countries, we’re looking to stand up this solution in new AWS Regions (closest to the host country) and scale it as needed.

Questions or feedback? Send an email to [email protected].


About the Authors

Manoj Gundawar is a product owner at Viasat. He builds product roadmap, provides architecture guidance and manages full software development life cycle to build high quality product/software with minimal TCO. He is passionate about delighting the customers by providing innovating solutions, leveraging technology, agile methodology and continues improvement mindset.

Archana Srinivasan is a Technical Account Manager within Enterprise Support at Amazon Web Services. Archana helps AWS customers leverage Enterprise Support entitlements to solve complex operational challenges and accelerate their cloud adoption.

Kiran Guduguntla is a WW Go-to-Market Specialist for Amazon EMR at AWS. He works with AWS customers across the globe to strategize, build, develop and deploy modern Big Data solutions. He is passionate about working with customers and helping them in their cloud journey. Kiran loves music, travel, food and watching football.

Automated security and compliance remediation at HDI

Post Syndicated from Uladzimir Palkhouski original https://aws.amazon.com/blogs/devops/automated-security-and-compliance-remediation-at-hdi/

with Dr. Malte Polley (HDI Systeme AG – Cloud Solutions Architect)

At HDI, one of the biggest European insurance group companies, we use AWS to build new services and capabilities and delight our customers. Working in the financial services industry, the company has to comply with numerous regulatory requirements in the areas of data protection and FSI regulations such as GDPR, German Supervisory Requirements for IT (VAIT) and Supervision of Insurance Undertakings (VAG). The same security and compliance assessment process in the cloud supports development productivity and organizational agility, and helps our teams innovate at a high pace and meet the growing demands of our internal and external customers.

In this post, we explore how HDI adopted AWS security and compliance best practices. We describe implementation of automated security and compliance monitoring of AWS resources using a combination of AWS and open-source solutions. We also go through the steps to implement automated security findings remediation and address continuous deployment of new security controls.

Background

Data analytics is the key capability for understanding our customers’ needs, driving business operations improvement, and developing new services, products, and capabilities for our customers. We needed a cloud-native data platform of virtually unlimited scale that offers descriptive and prescriptive analytics capabilities to internal teams with a high innovation pace and short experimentation cycles. One of the success metrics in our mission is time to market, therefore it’s important to provide flexibility to internal teams to quickly experiment with new use cases. At the same time, we’re vigilant about data privacy. Having a secure and compliant cloud environment is a prerequisite for every new experiment and use case on our data platform.

Cloud security and compliance implementation in the cloud is a shared effort between the Cloud Center of Competence team (C3), the Network Operation Center (NoC), and the product and platform teams. The C3 team is responsible for new AWS account provisioning, account security, and compliance baseline setup. Cross-account networking configuration is established and managed by the NoC team. Product teams are responsible for AWS services configuration to meet their requirements in the most efficient way. Typically, they deploy and configure infrastructure and application stacks, including the following:

We were looking for security controls model that would allow us to continuously monitor infrastructure and application components set up by all the teams. The model also needed to support guardrails that allowed product teams to focus on new use case implementation, but also inherited the security and compliance best practices promoted and ensured within our company.

Security and compliance baseline definition

We started with the AWS Well-Architected Framework Security Pillar whitepaper, which provides implementation guidance on the essential areas of security and compliance in the cloud, including identity and access management, infrastructure security, data protection, detection, and incident response. Although all five elements are equally important for implementing enterprise-grade security and compliance in the cloud, we saw an opportunity to improve controls of on-premises environments by automating detection and incident response elements. The continuous monitoring of AWS infrastructure and application changes complemented by the automated incident response of the security baseline helps us foster security best practices and allows for a high innovation pace. Manual security reviews are no longer required to asses security posture.

Our security and compliance controls framework is based on GDPR and several standards and programs, including ISO 27001, C5. Translation of the controls framework into the security and compliance baseline definition in the cloud isn’t always straightforward, so we use a number of guidelines. As a starting point, we use CIS Amazon Web Services benchmarks, because it’s a prescriptive recommendation and its controls cover multiple AWS security areas, including identity and access management, logging and monitoring configuration, and network configuration. CIS benchmarks are industry-recognized cyber security best practices and recommendations that cover a wide range of technology families, and are used by enterprise organizations around the world. We also apply GDPR compliance on AWS recommendations and AWS Foundational Security Best Practices, extending controls recommended by CIS AWS Foundations Benchmarks in multiple control areas: inventory, logging, data protection, access management, and more.

Security controls implementation

AWS provides multiple services that help implement security and compliance controls:

  • AWS CloudTrail provides a history of events in an AWS account, including those originating from command line tools, AWS SDKs, AWS APIs, or the AWS Management Console. In addition, it allows exporting event history for further analysis and subscribing to specific events to implement automated remediation.
  • AWS Config allows you to monitor AWS resource configuration, and automatically evaluate and remediate incidents related to unexpected resources configuration. AWS Config comes with pre-built conformance pack sample templates designed to help you meet operational best practices and compliance standards.
  • Amazon GuardDuty provides threat detection capabilities that continuously monitor network activity, data access patterns, and account behavior.

With multiple AWS services to use as building blocks for continuous monitoring and automation, there is a strong need for a consolidated findings overview and unified remediation framework. This is where AWS Security Hub comes into play. Security Hub provides built-in security standards and controls that make it easy to enable foundational security controls. Then, Security Hub integrates with CloudTrail, AWS Config, GuardDuty, and other AWS services out of the box, which eliminates the need to develop and maintain integration code. Security Hub also accepts findings from third-party partner products and provides APIs for custom product integration. Security Hub significantly reduces the effort to consolidate audit information coming from multiple AWS-native and third-party channels. Its API and supported partner products ecosystem gave us confidence that we can adhere to changes in security and compliance standards with low effort.

While AWS provides a rich set of services to manage risk at the Three Lines Model, we were looking for wider community support in maintaining and extending security controls beyond those defined by CIS benchmarks and compliance and best practices recommendations on AWS. We came across Prowler, an open-source tool focusing on AWS security assessment and auditing and infrastructure hardening. Prowler implements CIS AWS benchmark controls and has over 100 additional checks. We appreciated Prowler providing checks that helped us meet GDPR and ISO 27001 requirements, specifically. Prowler delivers assessment reports in multiple formats, which makes it easy to implement reporting archival for future auditing needs. In addition, Prowler integrates well with Security Hub, which allows us to use a single service for consolidating security and compliance incidents across a number of channels.

We came up with the solution architecture depicted in the following diagram.

Automated remediation solution architecture HDI

Automated remediation solution architecture HDI

Let’s look closely into the most critical components of this solution.

Prowler is a command line tool that uses the AWS Command Line Interface (AWS CLI) and a bash script. Individual Prowler checks are bash scripts organized into groups by compliance standard or AWS service. By supplying corresponding command line arguments, we can run Prowler against a specific AWS Region or multiple Regions at the same time. We can run Prowler in multiple ways; we chose to run it as an AWS Fargate task for Amazon Elastic Container Service (Amazon ECS). Fargate is a serverless compute engine that runs Docker-compatible containers. ECS Fargate tasks are scheduled tasks that make it easy to perform periodic assessments of an AWS account and export findings. We configured Prowler to run every 7 days in every account and Region it’s deployed into.

Security Hub acts as a single place for consolidating security findings from multiple sources. When Security Hub is enabled in a given Region, CIS AWS Foundations Benchmark and Foundational Security Best Practices standards are enabled as well. Enabling these standards also configures integration with AWS Config and Guard Duty. Integration with Prowler requires enabling product integration on the Security Hub side by calling the EnableImportFindingsForProduct API action for a given product. Because Prowler supports integration with Security Hub out of the box, posting security findings is a matter of passing the right command line arguments: -M json-asff to format reports as AWS Security Findings Format and -S to ship findings to Security Hub.

Automated security findings remediation is implemented using AWS Lambda functions and the AWS SDK for Python (Boto3). The remediation function can be triggered in two ways: automatically in response to a new security finding, or by a security engineer from the Security Hub findings page. In both cases, the same Lambda function is used. Remediation functions implement security standards in accordance with recommendations, whether they’re CIS AWS Foundations Benchmark and Foundational Security Best Practices standards, or others.

The exact activities performed depend on the security findings type and its severity. Examples of activities performed include deleting non-rotated AWS Identity and Access Management (IAM) access keys, enabling server-side encryption for S3 buckets, and deleting unencrypted Amazon Elastic Block Store (Amazon EBS) volumes.

To trigger the Lambda function, we use Amazon EventBridge, which makes it easy to build an event-driven remediation engine and allows us to define Lambda functions as targets for Security Hub findings and custom actions. EventBridge allows us to define filters for security findings and therefore map finding types to specific remediation functions. Upon successfully performing security remediation, each function updates one or more Security Hub findings by calling the BatchUpdateFindings API and passing the corresponding finding ID.

The following example code shows a function enforcing an IAM password policy:

import boto3
import os
import logging
from botocore.exceptions import ClientError

iam = boto3.client("iam")
securityhub = boto3.client("securityhub")

log_level = os.environ.get("LOG_LEVEL", "INFO")
logging.root.setLevel(logging.getLevelName(log_level))
logger = logging.getLogger(__name__)


def lambda_handler(event, context, iam=iam, securityhub=securityhub):
    """Remediate findings related to cis15 and cis11.

    Params:
        event: Lambda event object
        context: Lambda context object
        iam: iam boto3 client
        securityhub: securityhub boto3 client
    Returns:
        No returns
    """
    finding_id = event["detail"]["findings"][0]["Id"]
    product_arn = event["detail"]["findings"][0]["ProductArn"]
    lambda_name = os.environ["AWS_LAMBDA_FUNCTION_NAME"]
    try:
        iam.update_account_password_policy(
            MinimumPasswordLength=14,
            RequireSymbols=True,
            RequireNumbers=True,
            RequireUppercaseCharacters=True,
            RequireLowercaseCharacters=True,
            AllowUsersToChangePassword=True,
            MaxPasswordAge=90,
            PasswordReusePrevention=24,
            HardExpiry=True,
        )
        logger.info("IAM Password Policy Updated")
    except ClientError as e:
        logger.exception(e)
        raise e
    try:
        securityhub.batch_update_findings(
            FindingIdentifiers=[{"Id": finding_id, "ProductArn": product_arn},],
            Note={
                "Text": "Changed non compliant password policy",
                "UpdatedBy": lambda_name,
            },
            Workflow={"Status": "RESOLVED"},
        )
    except ClientError as e:
        logger.exception(e)
        raise e

A key aspect in developing remediation Lambda functions is testability. To quickly iterate through testing cycles, we cover each remediation function with unit tests, in which necessary dependencies are mocked and replaced with stub objects. Because no Lambda deployment is required to check remediation logic, we can test newly developed functions and ensure reliability of existing ones in seconds.

Each Lambda function developed is accompanied with an event.json document containing an example of an EventBridge event for a given security finding. A security finding event allows us to verify remediation logic precisely, including deletion or suspension of non-compliant resources or a finding status update in Security Hub and the response returned. Unit tests cover both successful and erroneous remediation logic. We use pytest to develop unit tests, and botocore.stub and moto to replace runtime dependencies with mocks and stubs.

Automated security findings remediation

The following diagram illustrates our security assessment and automated remediation process.

Automated remediation flow HDI

The workflow includes the following steps:

  1. An existing Security Hub integration performs periodic resource audits. The integration posts new security findings to Security Hub.
  2. Security Hub reports the security incident to the company’s centralized Service Now instance by using the Service Now ITSM Security Hub integration.
  3. Security Hub triggers automated remediation:
    1. Security Hub triggers the remediation function by sending an event to EventBridge. The event has a source field equal to aws.securityhub, with the filter ID corresponding to the specific finding type and compliance status as FAILED. The combination of these fields allows us to map the event to a particular remediation function.
    2. The remediation function starts processing the security finding event.
    3. The function calls the UpdateFindings Security Hub API to update the security finding status upon completing remediation.
    4. Security Hub updates the corresponding security incident status in Service Now (Step 2)
  4. Alternatively, the security operations engineer resolves the security incident in Service Now:
    1. The engineer reviews the current security incident in Service Now.
    2. The engineer manually resolves the security incident in Service Now.
    3. Service Now updates the finding status by calling the UpdateFindings Security Hub API. Service Now uses the AWS Service Management Connector.
  5. Alternatively, the platform security engineer triggers remediation:
    1. The engineer reviews the currently active security findings on the Security Hub findings page.
    2. The engineer triggers remediation from the security findings page by selecting the appropriate action.
    3. Security Hub triggers the remediation function by sending an event with the source aws.securityhub to EventBridge. The automated remediation flow continues as described in the Step 3.

Deployment automation

Due to legal requirements, HDI uses the infrastructure as code (IaC) principle while defining and deploying AWS infrastructure. We started with AWS CloudFormation templates defined as YAML or JSON format. The templates are static by nature and define resources in a declarative way. We figured out that as our solution complexity grows, the CloudFormation templates also grow in size and complexity, because all the resources deployed have to be explicitly defined. We wanted a solution to increase our development productivity and simplify infrastructure definition.

The AWS Cloud Development Kit (AWS CDK) helped us in two ways:

  • The AWS CDK provides ready-to-use building blocks called constructs. These constructs include pre-configured AWS services following best practices. For example, a Lambda function always gets an IAM role with an IAM policy to be able to write logs to CloudWatch Logs.
  • The AWS CDK allows us to use high-level programming languages to define configuration of all AWS services. Imperative definition allows us to build our own abstractions and reuse them to achieve concise resource definition.

We found that implementing IaC with the AWS CDK is faster and less error-prone. At HDI, we use Python to build application logic and define AWS infrastructure. The imperative nature of the AWS CDK is truly a turning point in fulfilling legal requirements and achieving high developer productivity at the same time.

One of the AWS CDK constructs we use is AWS CDK pipeline. This construct creates a customizable continuous integration and continuous delivery (CI/CD) pipeline implemented with AWS CodePipeline. The source action is based on AWS CodeCommit. The synth action is responsible for creating a CloudFormation template from the AWS CDK project. The synth action also runs unit tests on remediations functions. The pipeline actions are connected via artifacts. Lastly, the AWS CDK pipeline constructs offer a self-mutating feature, which allows us to maintain the AWS CDK project as well as the pipeline in a single code repository. Changes of the pipeline definition as well as automated remediation solutions are deployed seamlessly. The actual solution deployment is also implemented as a CI/CD stage. Stages can be eventually deployed in cross-Region and cross-account patterns. To use cross-account deployments, the AWS CDK provides a bootstrap functionality to create a trust relationship between AWS accounts.

The AWS CDK project is broken down to multiple stacks. To deploy the CI/CD pipeline, we run the cdk deploy cicd-4-securityhub command. To add a new Lambda remediation function, we must add remediation code, optional unit tests, and finally the Lambda remediation configuration object. This configuration object defines the Lambda function’s environment variables, necessary IAM policies, and external dependencies. See the following example code of this configuration:

prowler_729_lambda = {
    "name": "Prowler 7.29",
    "id": "prowler729",
    "description": "Remediates Prowler 7.29 by deleting/terminating unencrypted EC2 instances/EBS volumes",
    "policies": [
        _iam.PolicyStatement(
            effect=_iam.Effect.ALLOW,
            actions=["ec2:TerminateInstances", "ec2:DeleteVolume"],
            resources=["*"])
        ],
    "path": "delete_unencrypted_ebs_volumes",
    "environment_variables": [
        {"key": "ACCOUNT_ID", "value": core.Aws.ACCOUNT_ID}
    ],
    "filter_id": ["prowler-extra729"],
 }

Remediation functions are organized in accordance with the security and compliance frameworks they belong to. The AWS CDK code iterates over remediation definition lists and synthesizes corresponding policies and Lambda functions to be deployed later. Committing Git changes and pushing them triggers the CI/CD pipeline, which deploys the newly defined remediation function and adjusts the configuration of Prowler.

We are working on publishing the source code discussed in this blog post.

Looking forward

As we keep introducing new use cases in the cloud, we plan to improve our solution in the following ways:

  • Continuously add new controls based on our own experience and improving industry standards
  • Introduce cross-account security and compliance assessment by consolidating findings in a central security account
  • Improve automated remediation resiliency by introducing remediation failure notifications and retry queues
  • Run a Well-Architected review to identify and address possible areas of improvement

Conclusion

Working on the solution described in this post helped us improve our security posture and meet compliancy requirements in the cloud. Specifically, we were able to achieve the following:

  • Gain a shared understanding of security and compliance controls implementation as well as shared responsibilities in the cloud between multiple teams
  • Speed up security reviews of cloud environments by implementing continuous assessment and minimizing manual reviews
  • Provide product and platform teams with secure and compliant environments
  • Lay a foundation for future requirements and improvement of security posture in the cloud

The content and opinions in this post are those of the third-party author and AWS is not responsible for the content or accuracy of this post.

About the Authors

Malte Polley - Cloud Solutions Architect

Malte Polley – Cloud Solutions Architect

Dr. Malte Polley

Dr. Malte Polley is a Cloud Solutions Architect of Modern Data Platform (MDP) at HDI Germany. MDP focuses on DevSecOps practices applied to data analytics and provides secure and compliant environment for every data product at HDI Germany. As a cloud enthusiast Malte runs AWS Hannover user group. When not working, Malte enjoys hiking with his family and improving his backyard vegetable garden.

Uladzimir Palkhouski - Sr. Solutions Architect

Uladzimir Palkhouski – Sr. Solutions Architect

Uladzimir Palkhouski

Uladzimir Palkhouski is a Sr. Solutions Architect at Amazon Web Services. Uladzimir supports German financial services industry customers on their cloud journey. He helps finding practical forward looking solutions to complex technical and business challenges.

How NortonLifelock built a serverless architecture for real-time analysis of their VPN usage metrics

Post Syndicated from Madhu Nunna original https://aws.amazon.com/blogs/big-data/how-nortonlifelock-built-a-serverless-architecture-for-real-time-analysis-of-their-vpn-usage-metrics/

This post presents a reference architecture and optimization strategies for building serverless data analytics solutions on AWS using Amazon Kinesis Data Analytics. In addition, this post shows the design approach that the engineering team at NortonLifeLock took to build out an operational analytics platform that processes usage data for their VPN services, consuming petabytes of data across the globe on a daily basis.

NortonLifeLock is a global cybersecurity and internet privacy company that offers services to millions of customers for device security, and identity and online privacy for home and family. NortonLifeLock believes the digital world is only truly empowering when people are confident in their online security. NortonLifeLock has been an AWS customer since 2014.

For any organization, the value of operational data and metrics decreases with time. This lost value can equate to lost revenue and wasted resources. Real-time streaming analytics helps capture this value and provide new insights that can create new business opportunities.

AWS offers a rich set of services that you can use to provide real-time insights and historical trends. These services include managed Hadoop infrastructure services on Amazon EMR as well as serverless options such as Kinesis Data Analytics and AWS Glue.

Amazon EMR also supports multiple programming options for capturing business logic, such as Spark Streaming, Apache Flink, and SQL.

As a customer, it’s important to understand organizational capabilities, project timelines, business requirements, and AWS service best practices in order to define an optimal architecture from performance, cost, security, reliability, and operational excellence perspectives (the five pillars of the AWS Well-Architected Framework).

NortonLifeLock is taking a methodical approach to real-time analytics on AWS while using serverless technology to deliver on key business drivers such as time to market and total cost of ownership. In addition to NortonLifeLock’s implementation, this post provides key lessons learned and best practices for rapid development of real-time analytics workloads.

Business problem

NortonLifeLock offers a VPN product as a freemium service to users. Therefore, they need to enforce usage limits in real time to stop freemium users from using the service when their usage is over the limit. The challenge for NortonLifeLock is to do this in a reliable and affordable fashion.

NortonLifeLock runs its VPN infrastructure in almost all AWS Regions. Migrating to AWS from smaller hosting vendors has greatly improved user experience and VPN edge server performance, including a reduction in connection latency, time to connect and connection errors, faster upload and download speed, and more stability and uptime for VPN edge servers.

VPN usage data is collected by VPN edge servers and uploaded to backend stats servers every minute and persisted in backend databases. The usage information serves multiple purposes:

  • Displaying how much data a device has consumed for the past 30 days.
  • Enforcing usage limits on freemium accounts. When a user exhausts their free quota, that user is unable to connect through VPN until the next free cycle.
  • Analyzing usage data by the internal business intelligence (BI) team based on time, marketing campaigns, and account types, and using this data to predict future growth, ability to retain users, and more.

Design challenge

NortonLifeLock had the following design challenges:

  • The solution must be able to simultaneously satisfy both real-time and batch analysis.
  • The solution must be economical. NortonLifeLock VPN has hundreds of thousands of concurrent users, and if a user’s usage information is persisted as it comes in, it results in tens of thousands of reads and writes per second and tens of thousands of dollars a month in database costs.

Solution overview

NortonLifeLock decided to split storage into two parts by storing usage data in Amazon DynamoDB for real-time access and in Amazon Simple Storage Service (Amazon S3) for analysis, which addresses real-time enforcement and BI needs. Kinesis Data Analytics aggregates and loads data to Amazon S3 and DynamoDB. With Amazon Kinesis Data Streams and AWS Lambda as consumers of Kinesis Data Analytics, the implementation of user and device-level aggregations was simplified.

To keep costs down, user usage data was aggregated by the hour and persisted in DynamoDB. This spread hundreds of thousands of writes over an hour and reduced DynamoDB cost by 30 times.

Although increasing aggregation might not be an option for other problem domains, it’s acceptable in this case because it’s not necessary to be precise to the minute for user usage, and it’s acceptable to calculate and enforce the usage limit every hour.

The following diagram illustrates the high-level architecture. The solution is broken into three logical parts:

  • End-users – Real-time queries from devices to display current usage information (how much data is used daily)
  • Business analysts – Query historical usage information through Amazon Athena to extract business insights
  • Usage limit enforcement – Usage data ingestion and aggregation in real time

The solution has the following workflow:

  1. Usage data is collected by a VPN edge server and sends it to the backend service through Application Load Balancer.
  2. A single usage data record sent by the VPN edge server contains usage data for many users. A stats splitter splits the message into individual usage stats per user and forwards the message to Kinesis Data Streams.
  3. Usage data is consumed by both the legacy stats processor and the new Apache Flink application developed and deployed on Kinesis Data Analytics.
  4. The Apache Flink application carries out the following tasks:
    1. Aggregate device usage data hourly and send the aggregated result to Amazon S3 and the outgoing Kinesis data stream, which is picked up by a Lambda function that persists the usage data in DynamoDB.
    2. Aggregate device usage data daily and send the aggregated result to Amazon S3.
    3. Aggregate account usage data hourly and forward the aggregated results to the outgoing data stream, which is picked up by a Lambda function that checks if account usage is over the limit for that account. If account usage is over the limit, the function forwards the account information to another Lambda function, via Amazon Simple Queue Service (Amazon SQS), to cut off access on that account.

Design journey

NortonLifeLock needed a solution that was capable of real-time streaming and batch analytics. Kinesis Data Analysis fits this requirement because of the following key features:

  • Real-time streaming and batch analytics for data aggregation
  • Fully managed with a pay-as-you-go model
  • Auto scaling

NortonLifeLock needed Kinesis Data Analytics to do the following:

  • Aggregate customer usage data per device hourly and send results to Kinesis Data Streams (ultimately to DynamoDB) and the data lake (Amazon S3)
  • Aggregate customer usage data per account hourly and send results to Kinesis Data Streams (ultimately to DynamoDB and Lambda, which enforces usage limit)
  • Aggregate customer usage data per device daily and send results to the data lake (Amazon S3)

The legacy system processes usage data from an incoming Kinesis data stream, and they plan to use Kinesis Data Analytics to consume and process production data from the same stream. As such, NortonLifeLock started with SQL applications on Kinesis Data Analytics.

First attempt: Kinesis Data Analytics for SQL

Kinesis Data Analytics with SQL provides a high-level SQL-based abstraction for real-time stream processing and analytics. It’s configuration driven and very simple to get started. NortonLifeLock was able to create a prototype from scratch, get to production, and process the production load in less than 2 weeks. The solution met 90% of the requirements, and there were alternates for the remaining 10%.

However, they started to receive “read limit exceeded” alerts from the source data stream, and the legacy application was read throttled. With Amazon Support’s help, they traced the issues to the drastic reversal of the Kinesis Data Analytics MillisBehindLatest metric in Kinesis record processing. This was correlated to the Kinesis Data Analytics auto scaling events and application restarts, as illustrated by the following diagram. The highlighted areas show the correlation between spikes due to autoscaling and reversal of MillisBehindLatest metrics.

Here’s what happened:

  • Kinesis Data Analytics for SQL scaled up KPU due to load automatically, and the Kinesis Data Analytics application was restarted (part of scaling up).
  • Kinesis Data Analytics for SQL supports the at least once delivery model and uses checkpoints to ensure no data loss. But it doesn’t support taking a snapshot and restoring from the snapshot after a restart. For more details, see Delivery Model for Persisting Application Output to an External Destination.
  • When the Kinesis Data Analytics for SQL application was restarted, it needed to reprocess data from the beginning of the aggregation window, resulting in a very large number of duplicate records, which led to a dramatic increase in the Kinesis Data Analytics MillisBehindLatest metric.
  • To catch up with incoming data, Kinesis Data Analytics started re-reading from the Kinesis data stream, which led to over-consumption of read throughput and the legacy application being throttled.

In summary, Kinesis Data Analytics for SQL’s duplicates record processing on restarts, no other means to eliminate duplicates, and limited ability to control auto scaling led to this issue.

Although they found Kinesis Data Analytics for SQL easy to get started, these limitations demanded other alternatives. NortonLifeLock reached out to the Kinesis Data Analytics team and discussed the following options:

  • Option 1 – AWS was planning to release a new service, Kinesis Data Analytics Studio for SQL, Python, and Scala, which addresses these limitations. But this service was still a few months away (this service is now available, launched May 27, 2021).
  • Option 2 – The alternative was to switch to Kinesis Data Analytics for Apache Flink, which also provides the necessary tools to address all their requirements.

Second attempt: Kinesis Data Analytics for Apache Flink

Apache Flink has a comparatively steep learning curve (we used Java for streaming analytics instead of SQL), and it took about 4 weeks to build the same prototype, deploy it to Kinesis Data Analytics, and test the application in production. NortonLifeLock had to overcome a few hurdles, which we document in this section along with the lessons learned.

Challenge 1: Too many writes to outgoing Kinesis data stream

The first thing they noticed was that the write threshold on the outgoing Kinesis data stream was greatly exceeded. Kinesis Data Analytics was attempting to write 10 times the amount of expected data to the data stream, with 95% of data throttled.

After a lengthy investigation, it turned out that having too much parallelism in the Kinesis Data Analytics application led to this issue. They had followed default recommendations and set parallelism to 12 and it scaled up to 16. This means that every hour, 16 separate threads were attempting to write to the destination data stream simultaneously, leading to massive contention and writes throttled. These threads attempted to retry continuously, until all records were written to the data stream. This resulted in 10 times the amount of data processing attempted, even though only one tenth of the writes eventually succeeded.

The solution was to reduce parallelism to 4 and disable auto scaling. In the preceding diagram, the percentage of throttled records dropped to 0 from 95% after they reduced parallelism to 4 in the Kinesis Data Analytics application. This also greatly improved KPU utilization and reduced Kinesis Data Analytics cost from $50 a day to $8 a day.

Challenge 2: Use Kinesis Data Analytics sink aggregation

After tuning parallelism, they still noticed occasional throttling by Kinesis Data Streams because of the number of records being written, not record size. To overcome this, they turned on Kinesis Data Analytics sink aggregation to reduce the number of records being written to the data stream, and the result was dramatic. They were able to reduce the number of writes by 1,000 times.

Challenge 3: Handle Kinesis Data Analytics Flink restarts and the resulting duplicate records

Kinesis Data Analytics applications restart because of auto scaling or recovery from application or task manager crashes. When this happens, Kinesis Data Analytics saves a snapshot before shutdown and automatically reloads the latest snapshot and picks up where the work was left off. Kinesis Data Analytics also saves a checkpoint every minute so no data is lost, guaranteeing exactly-once processing.

However, when the Kinesis Data Analytics application shut down in the middle of sending results to Kinesis Data Streams, it doesn’t guarantee exactly-once data delivery. In fact, Flink only guarantees at least once delivery to Kinesis Data Analytics sink, meaning that Kinesis Data Analytics guarantees to send a record at least once, which leads to duplicate records sent when Kinesis Data Analytics is restarted.

How were duplicate records handled in the outgoing data stream?

Because duplicate records aren’t handled by Kinesis Data Analytics when sinks do not have exactly-once semantics, the downstream application must deal with the duplicate records. The first question you should ask is whether it’s necessary to deal with the duplicate records. Maybe it’s acceptable to tolerate duplicate records in your application? This, however, is not an option for NortonLifeLock, because no user wants to have their available usage taken twice within the same hour. So, logic had to be built in the application to handle duplicate usage records.

To deal with duplicate records, you can employ a strategy in which the application saves an update timestamp along with the user’s latest usage. When a record comes in, the application reads existing daily usage and compares the update timestamp against the current time. If the difference is less than a configured window (50 minutes if the aggregation window is 60 minutes), the application ignores the new record because it’s a duplicate. It’s acceptable for the application to potentially undercount vs. overcount user usage.

How were duplicate records handled in the outgoing S3 bucket?

Kinesis Data Analytics writes temporary files in Amazon S3 before finalizing and removing them. When Kinesis Data Analytics restarts, it attempts to write new S3 files, and potentially leaves behind temporary S3 files because of restart. Because Athena ignores all temporary S3 files, no further is action needed. If your BI tools take temporary S3 files into consideration, you have to configure the Amazon S3 lifecycle policy to clean up temporary S3 files after a certain time.

Conclusion

NortonLifelock has been successfully running a Kinesis Data Analytics application in production since May 2021. It provides several key benefits. VPN users can now keep track of their usage in near-real time. BI analysts can get timely insights that are used for targeted sales and marketing campaigns, and upselling features and services. VPN usage limits are enforced in near-real time, thereby optimizing the network resources. NortonLifelock is saving tens of thousands of dollars each month with this real-time streaming analytics solution. And this telemetry solution is able to keep up with petabytes of data flowing through their global VPN service, which is seeing double-digit monthly growth.

To learn more about Kinesis Data Analytics and getting started with serverless streaming solutions on AWS, please see Developer Guide for Studio, the easiest way to build Apache Flink applications in SQL, Python, Scala in a notebook interface.


About the Authors

Lei Gu has 25 years of software development experience and the architect for three key Norton products, Norton Secure Backup, VPN and Norton Family. He is passionate about cloud transformation and most recently spoke about moving from Cassandra to Amazon DynamoDB at AWS re:Invent 2019. Check out his Linkedin profile at https://www.linkedin.com/in/leigu/.

Madhu Nunna is a Sr. Solutions Architect at AWS, with over 20 years of experience in networks and cloud, with the last two years focused on AWS Cloud. He is passionate about Analytics and AI/ML. Outside of work, he enjoys hiking and reading books on philosophy, economics, history, astronomy and biology.

Integral Ad Science secures self-service data lake using AWS Lake Formation

Post Syndicated from Mat Sharpe original https://aws.amazon.com/blogs/big-data/integral-ad-science-secures-self-service-data-lake-using-aws-lake-formation/

This post is co-written with Mat Sharpe, Technical Lead, AWS & Systems Engineering from Integral Ad Science.

Integral Ad Science (IAS) is a global leader in digital media quality. The company’s mission is to be the global benchmark for trust and transparency in digital media quality for the world’s leading brands, publishers, and platforms. IAS does this through data-driven technologies with actionable real-time signals and insight.

In this post, we discuss how IAS uses AWS Lake Formation and Amazon Athena to efficiently manage governance and security of data.

The challenge

IAS processes over 100 billion web transactions per day. With strong growth and changing seasonality, IAS needed a solution to reduce cost, eliminate idle capacity during low utilization periods, and maximize data processing speeds during peaks to ensure timely insights for customers.

In 2020, IAS deployed a data lake in AWS, storing data in Amazon Simple Storage Service (Amazon S3), cataloging its metadata in the AWS Glue Data Catalog, ingesting and processing using Amazon EMR, and using Athena to query and analyze the data. IAS wanted to create a unified data platform to meet its business requirements. Additionally, IAS wanted to enable self-service analytics for customers and users across multiple business units, while maintaining critical controls over data privacy and compliance with regulations such as GDPR and CCPA. To accomplish this, IAS needed to securely ingest and organize real-time and batch datasets, as well as secure and govern sensitive customer data.

To meet the dynamic nature of IAS’s data and use cases, the team needed a solution that could define access controls by attribute, such as classification of data and job function. IAS processes significant volumes of data and this continues to grow. To support the volume of data, IAS needed the governance solution to scale in order to create and secure many new daily datasets. This meant IAS could enable self-service access to data from different tools, such as development notebooks, the AWS Management Console, and business intelligence and query tools.

To address these needs, IAS evaluated several approaches, including a manual ticket-based onboarding process to define permissions on new datasets, many different AWS Identity and Access Management (IAM) policies, and an AWS Lambda based approach to automate defining Lake Formation table and column permissions triggered by changes in security requirements and the arrival of new datasets.

Although these approaches worked, they were complex and didn’t support the self-service experience that IAS data analysts required.

Solution overview

IAS selected Lake Formation, Athena, and Okta to solve this challenge. The following architectural diagram shows how the company chose to secure its data lake.

The solution needed to support data producers and consumers in multiple AWS accounts. For brevity, this diagram shows a central data lake producer that includes a set of S3 buckets for raw and processed data. Amazon EMR is used to ingest and process the data, and all metadata is cataloged in the data catalog. The data lake consumer account uses Lake Formation to define fine-grained permissions on datasets shared by the producer account; users logging in through Okta can run queries using Athena and be authorized by Lake Formation.

Lake Formation enables column-level control, and all Amazon S3 access is provisioned via a Lake Formation data access role in the query account, ensuring only that service can access the data. Each business unit with access to the data lake is provisioned with an IAM role that only allows limited access to:

  • That business unit’s Athena workgroup
  • That workgroup’s query output bucket
  • The lakeformation:GetDataAccess API

Because Lake Formation manages all the data access and permissions, the configuration of the user’s role policy in IAM becomes very straightforward. By defining an Athena workgroup per business unit, IAS also takes advantage of assigning per-department billing tags and query limits to help with cost management.

Define a tag strategy

IAS commonly deals with two types of data: data generated by the company and data from third parties. The latter usually includes contractual stipulations on privacy and use.

Some data sets require even tighter controls, and defining a tag strategy is one key way that IAS ensures compliance with data privacy standards. With the tag-based access controls in Lake Formation IAS can define a set of tags within an ontology that is assigned to tables and columns. This ensures users understand available data and whether or not they have access. It also helps IAS manage privacy permissions across numerous tables with new ones added every day.

At a simplistic level, we can define policy tags for class with private and non-private, and for owner with internal and partner.

As we progressed, our tagging ontology evolved to include individual data owners and data sources within our product portfolio.

Apply tags to data assets

After IAS defined the tag ontology, the team applied tags at the database, table, and column level to manage permissions. Tags are inherited, so they only need to be applied at the highest level. For example, IAS applied the owner and class tags at the database level and relied on inheritance to propagate the tags to all the underlying tables and columns. The following diagram shows how IAS activated a tagging strategy to distinguish between internal and partner datasets , while classifying sensitive information within these datasets.

Only a small number of columns contain sensitive information; IAS relied on inheritance to apply a non-private tag to the majority of the database objects and then overrode it with a private tag on a per-column basis.

The following screenshot shows the tags applied to a database on the Lake Formation console.

With its global scale, IAS needed a way to automate how tags are applied to datasets. The team experimented with various options including string matching on column names, but the results were unpredictable in situations where unexpected column names are used (ipaddress vs. ip_address, for example). Ultimately, IAS incorporated metadata tagging into its existing infrastructure as code (IaC) process, which gets applied as part of infrastructure updates.

Define fine-grained permissions

The final piece of the puzzle was to define permission rules to associate with tagged resources. The initial data lake deployment involved creating permission rules for every database and table, with column exclusions as necessary. Although these were generated programmatically, it added significant complexity when the team needed to troubleshoot access issues. With Lake Formation tag-based access controls, IAS reduced hundreds of permission rules down to precisely two rules, as shown in the following screenshot.

When using multiple tags, the expressions are logically ANDed together. The preceding statements permit access only to data tagged non-private and owned by internal.

Tags allowed IAS to simplify permission rules, making it easy to understand, troubleshoot, and audit access. The ability to easily audit which datasets include sensitive information and who within the organization has access to them made it easy to comply with data privacy regulations.

Benefits

This solution provides self-service analytics to IAS data engineers, analysts, and data scientists. Internal users can query the data lake with their choice of tools, such as Athena, while maintaining strong governance and auditing. The new approach using Lake Formation tag-based access controls reduces the integration code and manual controls required. The solution provides the following additional benefits:

  • Meets security requirements by providing column-level controls for data
  • Significantly reduces permission complexity
  • Reduces time to audit data security and troubleshoot permissions
  • Deploys data classification using existing IaC processes
  • Reduces the time it takes to onboard data users including engineers, analysts, and scientists

Conclusion

When IAS started this journey, the company was looking for a fully managed solution that would enable self-service analytics while meeting stringent data access policies. Lake Formation provided IAS with the capabilities needed to deliver on this promise for its employees. With tag-based access controls, IAS optimized the solution by reducing the number of permission rules from hundreds down to a few, making it even easier to manage and audit. IAS continues to analyze data using more tools governed by Lake Formation.


About the Authors

Mat Sharpe is the Technical Lead, AWS & Systems Engineering at IAS where he is responsible for the company’s AWS infrastructure and guiding the technical teams in their cloud journey. He is based in New York.

Brian Maguire is a Solution Architect at Amazon Web Services, where he is focused on helping customers build their ideas in the cloud. He is a technologist, writer, teacher, and student who loves learning. Brian is the co-author of the book Scalable Data Streaming with Amazon Kinesis.

Danny Gagne is a Solutions Architect at Amazon Web Services. He has extensive experience in the design and implementation of large-scale high-performance analysis systems, and is the co-author of the book Scalable Data Streaming with Amazon Kinesis. He lives in New York City.

Detect Adversary Behavior in Milliseconds with CrowdStrike and Amazon EventBridge

Post Syndicated from Joby Bett original https://aws.amazon.com/blogs/architecture/detect-adversary-behavior-in-seconds-with-crowdstrike-and-amazon-eventbridge/

By integrating Amazon EventBridge with Falcon Horizon, CrowdStrike has developed a real-time, cloud-based solution that allows you to detect threats in less than a second. This solution uses AWS CloudTrail and EventBridge. CloudTrail allows governance, compliance, operational auditing, and risk auditing of your AWS account. EventBridge is a serverless event bus that makes it easier to build event-driven applications at scale.

In this blog post, we’ll cover the challenges presented by using traditional log file-based security monitoring. We will also discuss how CrowdStrike used EventBridge to create an innovative, real-time cloud security solution that enables high-speed, event-driven alerts that detect malicious actors in milliseconds.

Challenges of log file-based security monitoring

Being able to detect malicious actors in your environment is necessary to stay secure in the cloud. With the growing volume, velocity, and variety of cloud logs, log file-based monitoring makes it difficult to reveal adverse behaviors in time to stop breaches.

When an attack is in progress, a security operations center (SOC) analyst has an average of one minute to detect the threat, ten minutes to understand it, and one hour to contain it. If you cannot meet this 1/10/60 minute rule, you may have a costly breach that may move laterally and explode exponentially across the cloud estate.

Let’s look at a real-life scenario. When a malicious actor attempts a ransom attack that targets high-value data in an Amazon Simple Storage Service (Amazon S3) bucket, it can involve activities in various parts of the cloud services in a brief time window.

These example activities can involve:

  • AWS Identity and Access Management (IAM): account enumeration, disabling multi-factor authentication (MFA), account hijacking, privilege escalation, etc.
  • Amazon Elastic Compute Cloud (Amazon EC2): instance profile privilege escalation, file exchange tool installs, etc.
  • Amazon S3: bucket and object enumeration; impair bucket encryption and versioning; bucket policy manipulation; getObject, putObject, and deleteObject APIs, etc.

With siloed log file-based monitoring, detecting, understanding, and containing a ransom attack while still meeting the 1/10/60 rule is difficult. This is because log files are written in batches, and files are typically only created every 5 minutes. Once the log file is written, it still needs to be fetched and processed. This means that you lose the ability to dynamically correlate disparate activities.

To summarize, top-level challenges of log file-based monitoring are:

  1. Lag time between the breach and the detection
  2. Inability to correlate disparate activities to reveal sophisticated attack patterns
  3. Frequent false positive alarms that obscure true positives
  4. High operational cost of log file synchronizations and reprocessing
  5. Log analysis tool maintenance for fast growing log volume

Security and compliance is a shared responsibility between AWS and the customer. We protect the infrastructure that runs all of the services offered in the AWS Cloud. For abstracted services, such as  Amazon S3, we operate the infrastructure layer, the operating system, and platforms, and customers access the endpoints to store and retrieve data.

You are responsible for managing your data (including encryption options), classifying assets, and using IAM tools to apply the appropriate permissions.

Indicators of attack by CrowdStrike with Amazon EventBridge

In real-world cloud breach scenarios, timeliness of observation, detection, and remediation is critical. CrowdStrike Falcon Horizon IOA is built on an event-driven architecture based on EventBridge and operates at a velocity that can outpace attackers.

CrowdStrike Falcon Horizon IOA performs the following core actions:

  • Observe: EventBridge streams CloudTrail log files across accounts to the CrowdStrike platform as activity occurs. Parallelism is enabled via event bus rules, which enables CrowdStrike to avoid the five-minute lag in fetching the log files and dynamically correlate disparate activities. The CrowdStrike platform observes end-to-end activities from AWS services and infrastructure hosted in the accounts protected by CrowdStrike.
  • Detect: Falcon Horizon invokes indicators of attack (IOA) detection algorithms that reveal adversarial or anomalous activities from the log file streams. It correlates new and historical events in real time while enriching the events with CrowdStrike threat intelligence data. Each IOA is prioritized with the likelihood of activity being malicious via scoring and mapped to the MITRE ATT&CK framework.
  • Remediate: The detected IOA is presented with remediation steps. Depending on the score, applying the remediations quickly can be critical before the attack spreads.
  • Prevent: Unremediated insecure configurations are revealed via indicators of misconfiguration (IOM) in Falcon Horizon. Applying the remediation steps from IOM can prevent future breaches.

Key differentiators of IOA from Falcon Horizon are:

  • Observability of wider attack surfaces with heterogeneous event sources
  • Detection of sophisticated tactics, techniques, and procedures (TTPs) with dynamic event correlation
  • Event enrichment with threat intelligence that aids prioritization and reduces alert fatigue
  • Low latency between malicious activity occurrence and corresponding detection
  • Insight into attacks for each adversarial event from MITRE ATT&CK framework

High-level architecture

Event-driven architectures provide advantages for integrating varied systems over legacy log file-based approaches. For securing cloud attack surfaces against the ever-evolving TTPs, a robust event-driven architecture at scale is a key differentiator.

CrowdStrike maximizes the advantages of event-driven architecture by integrating with EventBridge, as shown in Figure 1. EventBridge allows observing CloudTrail logs in event streams. It also simplifies log centralization from a number of accounts with its direct source-to-target integration across accounts, as follows:

  1. CrowdStrike hosts an EventBridge with central event buses that consume the stream of CloudTrail log events from a multitude of customer AWS accounts.
  2. Within customer accounts, EventBridge rules listen to the local CloudTrail and stream each activity as an event to the centralized EventBridge hosted by CrowdStrike.
  3. CrowdStrike’s event-driven platform detects adversarial behaviors from the event streams in real time. The detection is performed against incoming events in conjunction with historical events. The context that comes from connecting new and historical events minimizes false positives and improves alert efficacy.
  4. Events are enriched with CrowdStrike threat intelligence data that provides additional insight of the attack to SOC analysts and incident responders.
CrowdStrike Falcon Horizon IOA architecture

Figure 1. CrowdStrike Falcon Horizon IOA architecture

As data is received by the centralized EventBridge, CrowdStrike relies on unique customer ID and AWS Region in each event to provide integrity and isolation.

EventBridge allows relatively hassle-free customer onboarding by using cross account rules to transfer customer CloudTrail data into one common event bus that can then be used to filter and selectively forward the data into the Falcon Horizon platform for analysis and mitigation.

Conclusion

As your organization’s cloud footprint grows, visibility into end-to-end activities in a timely manner is critical for maintaining a safe environment for your business to operate. EventBridge allows event-driven monitoring of CloudTrail logs at scale.

CrowdStrike Falcon Horizon IOA, powered by EventBridge, observes end-to-end cloud activities at high speeds at scale. Paired with targeted detection algorithms from in-house threat detection experts and threat intelligence data, Falcon Horizon IOA combats emerging threats against the cloud control plane with its cutting-edge event-driven architecture.

Related information

Optimizing Cloud Infrastructure Cost and Performance with Starburst on AWS

Post Syndicated from Kinnar Kumar Sen original https://aws.amazon.com/blogs/architecture/optimizing-cloud-infrastructure-cost-and-performance-with-starburst-on-aws/

Amazon Web Services (AWS) Cloud is elastic, convenient to use, easy to consume, and makes it simple to onboard workloads. Because of this simplicity, the cost associated with onboarding workloads is sometimes overlooked.

There is a notion that when an organization moves its workload to the cloud, agility, scalability, performance, and cost issues will disappear. While this may be true for agility and scalability, you must optimize your workload. You can do this with services like Amazon EC2 Auto Scaling via Amazon Elastic Compute Cloud (Amazon EC2) and Amazon EC2 Spot Instances to realize the performance and cost benefits the cloud offers.

In this blog post, we show you how Starburst Enterprise (Starburst) addressed a sudden increase in cost for their data analytics platform as they grew their internal teams and scaled out their infrastructure. After reviewing their architecture and deployments with AWS specialist architects, Starburst and AWS concluded that they could take the following steps to greatly reduce costs:

  1. Use Spot Instances to run workloads.
  2. Add Amazon EC2 Auto Scaling into their training and demonstration environments, because the Starburst platform is designed to elastically scale up and down.

For analytics workloads, when you rein in costs, you typically rein in performance. Starburst and AWS worked together to balance the cost and performance of Starburst’s data analytics platform while also harnessing the flexibility, scalability, security, and performance of the cloud.

What is Starburst Enterprise?

Starburst provides a Massively Parallel Processing SQL (MPPSQL) engine based on open source Trino. It is an analytics platform that provides the cornerstone in customers’ intelligent data mesh and offers the following benefits and services:

  • The platform gives you a single point to access, monitor, and secure your data mesh.
  • The platform gives you options for your data compute. You no longer have to wait on data migrations or extract, transform, and load (ETL), there is no vendor lock-in, and there is no need to swap out your existing analytics tools.
  • Starburst Stargate (Stargate) ensures that large jobs are completed within each data domain of your data mesh. Only the result set is retrieved from the domain.
    • Stargate reduces data output, which reduces costs and increases performance.
    • Data governance policies can also be applied uniquely in each data domain, ensuring security compliance and federation.

As shown in Figure 1, there are many connectors for input and output that ensure you experience improved performance and security.

Starburst platform

Figure 1. Starburst platform

Integrating Starburst Enterprise with AWS

As shown in Figure 2, Starburst Enterprise uses AWS services to deliver elastic scaling and optimize cost. The platform is architected with decoupled storage and compute. This allows the platform to scale as needed to analyze petabytes of data.

The platform can be deployed via AWS CloudFormation or Amazon Elastic Kubernetes Service (Amazon EKS). Starburst on AWS allows you to run analytic queries across AWS data sources and on-premises systems such as Teradata and Oracle.

Deployment architecture of Starburst platform on AWS

Figure 2. Deployment architecture of Starburst platform on AWS

Amazon EC2 Auto Scaling

Enterprises have diverse analytic workloads; their compute and memory requirements vary with time. Starburst uses Amazon EKS and Amazon EC2 Auto Scaling to elastically scale compute resources to meet the demands of their analytics workloads.

  • Amazon EC2 Auto Scaling ensures that you have the compute capacity for your workloads to handle the load elastically. It is used to architect sophisticated, elastic, and resilient applications on the AWS Cloud.
    • Starburst uses the scheduled scaling feature of Amazon EC2 Auto Scaling to scale the cluster up/down based on time. Thus, they incur no costs when the cluster is not in use.
  • Amazon EKS is a fully managed Kubernetes service that allows you to run Kubernetes on AWS without needing to install, operate, and maintain your own Kubernetes control plane.

Scaling cloud resource consumption on demand has a major impact on controlling cloud costs. Starburst supports scaling down elastically, which means removing compute resources doesn’t impact the underlying processes.

Amazon EC2 Spot Instances

Spot Instances let you take advantage of unused EC2 capacity in the AWS Cloud. They are available at up to a 90% discount compared to On-Demand Instance prices. If EC2 needs capacity for On-Demand Instance usage, Spot Instances can be interrupted by Amazon EC2 with a two-minute notification. There are many ways to handle the interruption to ensure that the application is well architected for resilience and fault tolerance.

Starburst has integrated Spot Instances as a part of the Amazon EKS managed node groups to cost optimize the analytics workloads. This best practice of instance diversification is implemented by using the integration eksctl and instance selector with dry-run flag. This creates a list of instances of same size (vCPU/Mem ratio) and uses them in the underlying node groups.

Same size instances are required to make best use of Kubernetes Cluster Autoscaler, which is used to manage the size of the cluster.

Scaling down, handling interruptions, and provisioning compute

“Scaling in” an active application is tricky, but Starburst was built with resiliency in mind, and it can effectively manage shut downs.

Spot Instances are an ideal compute option because Starburst can handle potential interruptions natively. Starburst also uses Amazon EKS managed node groups to provision nodes in the cluster. This requires significantly less operational effort compared to using self-managed node groups. It allows Starburst to enforce best practices like capacity optimized allocation strategy, capacity rebalancing, and instance diversification.

When you need to “scale out” the deployment, Amazon EKS and Amazon EC2 Auto Scaling help to provision capacity, as depicted in Figure 3.

Depicting “scale out” in a Starburst deployment

Figure 3. Depicting “scale out” in a Starburst deployment

Benefits realized from using AWS services

In a short period, Starburst was able to increase the number of people working on AWS. They added five times the number of Solutions Architects, they have previously. Additionally, in their initial tests of their new deployment architecture, their Solutions Architects were able to complete up to three times the amount of work than they had been able to previously. Even after the workload increased more than 15 times, with two simple changes they only had a slight increase in total cost.

This cost and performance optimization allows Starburst to be more productive internally and realize value for each dollar spent. This further justified investing more into building out infrastructure footprint.

Conclusion

In building their architecture with AWS, Starburst realized the importance of having a robust and comprehensive cloud administration plan that they can implement and manage going forward. They are now able to balance the cloud costs with performance and stability, even after considering the SLA requirements. Starburst is planning to teach their customers about the Spot Instance and Amazon EC2 Auto Scaling best practices to ensure they maintain a cost and performance optimized cloud architecture.

If you want to see the Starburst data analytics platform in action, you can get a free trial in the AWS Marketplace: Starburst Data Free Trial.

How Rapid7 built multi-tenant analytics with Amazon Redshift using near-real-time datasets

Post Syndicated from Rahul Monga original https://aws.amazon.com/blogs/big-data/how-rapid7-built-multi-tenant-analytics-with-amazon-redshift-using-near-real-time-datasets/

This is a guest post co-written by Rahul Monga, Principal Software Engineer at Rapid7.

Rapid7 InsightVM is a vulnerability assessment and management product that provides visibility into the risks present across an organization. It equips you with the reporting, automation, and integrations needed to prioritize and fix those vulnerabilities in a fast and efficient manner. InsightVM has more than 5,000 customers across the globe, runs exclusively on AWS, and is available for purchase on AWS Marketplace.

To provide near-real-time insights to InsightVM customers, Rapid7 has recently undertaken a project to enhance the dashboards in their multi-tenant software as a service (SaaS) portal with metrics, trends, and aggregated statistics on vulnerability information identified in their customer assets. They chose Amazon Redshift as the data warehouse to power these dashboards due to its ability to deliver fast query performance on gigabytes to petabytes of data.

In this post, we discuss the design options that Rapid7 evaluated to build a multi-tenant data warehouse and analytics platform for InsightVM. We will deep dive into the challenges and solutions related to ingesting near-real-time datasets and how to create a scalable reporting solution that can efficiently run queries across more than 3 trillion rows. This post also discusses an option to address the scenario where a particular customer outgrows the average data access needs.

This post uses the terms customers, tenants, and organizations interchangeably to represent Rapid7 InsightVM customers.

Background

To collect data for InsightVM, customers can use scan engines or Rapid7’s Insight Agent. Scan engines allow you to collect vulnerability data on every asset connected to a network. This data is only collected when a scan is run. Alternatively, you can install the Insight Agent on individual assets to collect and send asset change information to InsightVM numerous times each day. The agent also ensures that asset data is sent to InsightVM regardless of whether or not the asset is connected to your network.

Data from scans and agents is sent in the form of packed documents, in micro-batches of hundreds of events. Around 500 documents per second are received across customers, and each document is around 2 MB in size. On a typical day, InsightVM processes 2–3 trillion rows of vulnerability data, which translates to around 56 GB of compressed data for a large customer. This data is normalized and processed by InsightVM’s vulnerability management engine and streamed to the data warehouse system for near-real-time availability of data for analytical insights to customers.

Architecture overview

In this section, we discuss the overall architectural setup for the InsightVM system.

Scan engines and agents collect and send asset information to the InsightVM cloud. Asset data is pooled, normalized, and processed to identify vulnerabilities. This is stored in an Amazon ElastiCache for Redis cluster and also pushed to Amazon Kinesis Data Firehouse for use in near-real time by InsightVM’s analytics dashboards. Kinesis Data Firehose delivers raw asset data to an Amazon Simple Storage Service (Amazon S3) bucket. The data is transformed using a custom developed ingestor service and stored in a new S3 bucket. The transformed data is then loaded into the Redshift data warehouse. Amazon Simple Notification Service (Amazon SNS), Amazon Simple Queue Service (Amazon SQS), and AWS Lambda are used to orchestrate this data flow.  In addition, to identify the latest timestamp of vulnerability data for assets, an auxiliary table is maintained and updated periodically with the update logic in the Lambda function, which is triggered through an Amazon CloudWatch event rule. Custom-built middleware components interface between the web user interface (UI) and the Amazon Redshift cluster to fetch asset information for display in dashboards.

The following diagram shows the implementation architecture of InsightVM, including the data warehouse system:

Rapid-7 Multi-tenant Architecture

The architecture has built-in tenant isolation because data access is abstracted through the API. The application uses a dimensional model to support low-latency queries and extensibility for future enhancements.

Amazon Redshift data warehouse design: Options evaluated and selection

Considering Rapid7’s need for near-real-time analytics at any scale, the InsightVM data warehouse system is designed to meet the following requirements:

  • Ability to view asset vulnerability data at near-real time, within 5–10 minutes of ingest
  • Less than 5 seconds’ latency when measured at 95 percentiles (p95) for reporting queries
  • Ability to support 15 concurrent queries per second, with the option to support more in the future
  • Simple and easy-to-manage data warehouse infrastructure
  • Data isolation for each customer or tenant

Rapid7 evaluated Amazon Redshift RA3 instances to support these requirements. When designing the Amazon Redshift schema to support these goals, they evaluated the following strategies:

  • Bridge model – Storage and access to data for each tenant is controlled at the individual schema level in the same database. In this approach, multiple schemas are set up, where each schema is associated with a tenant, with the same exact structure of the dimensional model.
  • Pool model – Data is stored in a single database schema for all tenants, and a new column (tenant_id) is used to scope and control access to individual tenant data. Access to the multi-tenant data is controlled using API-level access to the tables. Tenants aren’t aware of the underlying implementation of the analytical system and can’t query them directly.

For more information about multi-tenant models, see Implementing multi-tenant patterns in Amazon Redshift using data sharing.

Initially when evaluating the bridge model, it provided an advantage for tenant-only data for queries, plus the ability to decouple a tenant to an independent cluster if they outgrow the resources that are available in the single cluster. Also, when the p95 metrics were evaluated in this setup, the query response times were less than 5 seconds, because each tenant data is isolated into smaller tables. However, the major concern with this approach was with the near-real-time data ingestion into over 50,000 tables (5,000 customer schemas x approximately 10 tables per schema) every 5 minutes. Having thousands of commits every minute into an online analytical processing (OLAP) system like Amazon Redshift can lead to most resources being exhausted in the ingestion process. As a result, the application suffers query latencies as data grows.

The pool model provides a simpler setup, but the concern was with query latencies when multiple tenants access the application from the same tables. Rapid7 hoped that these concerns would be addressed by using Amazon Redshift’s support for massively parallel processing (MPP) to enable fast execution of most complex queries operating on large amounts of data. With the right table design using the right sort and distribution keys, it’s possible to optimize the setup. Furthermore, with automatic table optimization, the Amazon Redshift cluster can automatically make these determinations without any manual input.

Rapid7 evaluated both the pool and bridge model designs, and decided to implement the pool model. This model provides simplified data ingestion and can support query latencies of under 5 seconds at p95 with the right table design. The following table summarizes the results of p95 tests conducted with the pool model setup.

Query P95
Large customer: Query with multiple joins, which list assets, their vulnerabilities, and all their related attributes, with aggregated metrics for each asset, and filters to scope assets by attributes like location, names, and addresses Less than 4 seconds
Large customer: Query to return vulnerability content information given a list of vulnerability identifiers Less than 4 seconds

Tenet isolation and security

Tenant isolation is fundamental to the design and development of SaaS systems. It enables SaaS providers to reassure customers that, even in a multi-tenant environment, their resources can’t be accessed by other tenants.

With the Amazon Redshift table design using the pool model, Rapid7 built a separate data access layer in the middleware that templatized queries, augmented with runtime parameter substitution to uniquely filter specific tenant and organization data.

The following is a sample of templatized query:

<#if useDefaultVersion()>
currentAssetInstances AS (
SELECT tablename.*
FROM tablename
<#if (applyTags())>
JOIN dim_asset_tag USING (organization_id, attribute2, attribute3)
</#if>
WHERE organization_id ${getOrgIdFilter()}
<#if (applyTags())>
AND tag_id IN ($(tagIds))
</#if>
),
</#if>

The following is a Java interface snippet to populate the template:

public interface TemplateParameters {

boolean useDefaultVersion(); boolean useVersion(); default Set<String> getVersions() {
return null;
} default String getVersionJoin(String var1) {
return "";
}

String getTemplateName();

String getOrgIdString();

default String getOrgIdFilter() {
return "";
}

Every query uses organization_id and additional parameters to uniquely access tenant data. During runtime, organization_id and other metadata are extracted from the secured JWT token that is passed to middleware components after the user is authenticated in the Rapid7 cloud platform.

Best practices and lessons learned

To fully realize the benefits of the Amazon Redshift architecture and design for the multiple tenants & near real-time ingestion, considerations on the table design allow you to take full advantage of the massively parallel processing and columnar data storage. In this section, we discuss the best practices and lessons learned from building this solution.

Sort key for effective data pruning

Sorting a table on an appropriate sort key can accelerate query performance, especially queries with range-restricted predicates, by requiring fewer table blocks to be read from disk. To have Amazon Redshift choose the appropriate sort order, the AUTO option was utilized. Automatic table optimization continuously observes how queries interact with tables and discovers the right sort key for the table. To effectively prune the data by the tenant, organization_id is identified as the sort key to perform the restricted scans. Furthermore, because all queries are routed through the data access layer, organization_id is automatically added in the predicate conditions to ensure effective use of the sort keys.

Micro-batches for data ingestion

Amazon Redshift is designed for large data ingestion, rather than transaction processing. The cost of commits is relatively high, and excessive use of commits can result in queries waiting for access to the commit queue. Data is micro-batched during ingestion as it arrives for multiple organizations. This results in fewer transactions and commits when ingesting the data.

Load data in bulk

If you use multiple concurrent COPY commands to load one table from multiple files, Amazon Redshift is forced to perform a serialized load, and this type of load is much slower.

The Amazon Redshift manifest file is used to ingest the datasets that span multiple files in a single COPY command, which allows fast ingestion of data in each micro-batch.

RA3 instances for data sharing

Rapid 7 uses Amazon Redshift RA3 instances, which enable data sharing to allow you to securely and easily share live data across Amazon Redshift clusters for reads. In this multi-tenant architecture when a tenant outgrows the average data access needs, it can be isolated to a separate cluster easily and independently scaled using the data sharing. This is accomplished by monitoring the STL_SCAN table to identify different tenants and isolate them to allow for independent scalability as needed.

Concurrency scaling for consistently fast query performance

When concurrency scaling is enabled, Amazon Redshift automatically adds additional cluster capacity when you need it to process an increase in concurrent read queries. To meet the uptick in user requests, the concurrency scaling feature is enabled to dynamically bring up additional capacity to provide consistent p95 values that meet Rapid7’s defined requirements for the InsightVM application.

Results and benefits

Rapid7 saw the following results from this architecture:

  • The new architecture has reduced the time required to make data accessible to customers to less than 5 minutes on average. The previous architecture had higher level of processing time variance, and could sometimes exceed 45 minutes
  • Dashboards load faster and have enhanced drill-down functionality, improving the end-user experience
  • With all data in a single warehouse, InsightVM has a single source of truth, compared to the previous solution where InsightVM had copies of data maintained in different databases and domains, which could occasionally get out of sync
  • The new architecture lowers InsightVM’s reporting infrastructure cost by almost three times, as compared to the previous architecture

Conclusion

With Amazon Redshift, the Rapid7 team has been able to centralize asset and vulnerability information for InsightVM customers. The team has simultaneously met its performance and management objectives with the use of a multi-tenant pool model and optimized table design. In addition, data ingestion via Kinesis Data Firehose and custom-built microservices to load data into Amazon Redshift in near-real time enabled Rapid7 to deliver asset vulnerability information to customers more than nine times faster than before, improving the InsightVM customer experience.


About the Authors

Rahul Monga is a Principal Software Engineer at Rapid7, currently working on the next iteration of InsightVM. Rahul’s focus areas are highly distributed cloud architectures and big data processing. Originally from the Washington DC area, Rahul now resides in Austin, TX with his wife, daughter, and adopted pup.

Sujatha Kuppuraju is a Senior Solutions Architect at Amazon Web Services (AWS). She works with ISV customers to help design secured, scalable and well-architected solutions on the AWS Cloud. She is passionate about solving complex business problems with the ever-growing capabilities of technology.

Thiyagarajan Arumugam is a Principal Solutions Architect at Amazon Web Services and designs customer architectures to process data at scale. Prior to AWS, he built data warehouse solutions at Amazon.com. In his free time, he enjoys all outdoor sports and practices the Indian classical drum mridangam.

How Amazon CodeGuru Reviewer helps Gridium maintain a high quality codebase

Post Syndicated from Aaqib Bickiya original https://aws.amazon.com/blogs/devops/codeguru-gridium-maintain-codebase/

Gridium creates software that lets people run commercial buildings at a lower cost and with less energy. Currently, half of the world lives in cities. Soon, nearly 70% will, while buildings utilize 40% of the world’s electricity. In the U.S. alone, commercial real estate value tops one trillion dollars. Furthermore, much of this asset class is still run with spreadsheets, clipboards, and outdated software. Gridium’s software platform collects large amounts of operational data from commercial buildings like offices, medical providers, and corporate campuses. Then, our analytics identifies energy savings opportunities that we work with customers to actualize.

Gridium’s Challenge

Data streams from utility companies across the U.S. are an essential input for Gridium’s analytics. This data is processed and visualized so that our customers can garner new insights and drive smarter decisions. In order to integrate a new data source into our platform, we often utilize third-party contractors to write tools that ingest data feeds and prepare them for analysis.

Our team firmly emphasizes our codebase quality. We strive for our code to be stylistically consistent, easily testable, swiftly understood, and well-documented. We write code internally by using agreed-upon standards. This makes it easy for us to review and edit internal code using standard collaboration tools.

We work to ensure that code arriving from contractors meets similar standards, but enforcing external code quality can be difficult. Contractor-developed code will be written in the style of each contractor. Furthermore, reviewing and editing code written by contractors introduces new challenges beyond those of working with internal code. We have used tools like PyLint to help stylistically align code, but we wanted a method for uncovering more complex issues without burdening the team and undermining the benefits of outside contractors.

Adopting Amazon CodeGuru Reviewer

We began evaluating Amazon CodeGuru Reviewer in order to provide an additional review layer for code developed by contractors, and to find complex corrections within code that traditional tools might not catch.

Initially, we enabled the service only on external repositories and generated reviews on pull requests. CodeGuru immediately provided us with actionable recommendations for maintaining Gridium’s codebase quality.

CodeGuru exception handling correction

The example above demonstrates a useful recurring recommendation related to exception-handling. Strictly speaking, there is nothing wrong with utilizing a general Exception class whenever needed. However, utilizing general Exception classes in production can complicate error-handling functions and generate ambiguity when trying to debug or understand code.

After a few weeks of utilizing CodeGuru Reviewer and witnessing its benefits, we determined that we wanted to use it for our entire codebase. Moreover, CodeGuru provided us with meaningful recommendations on our internal repositories.

CodeGuru highly depend functions suggestions

This example once again showcases CodeGuru’s ability to highlight subtle issues that aren’t necessarily bugs. Without diving through related libraries and functions, it would be difficult to find any optimizable areas, but CodeGuru found that this function could become problematic due to its dependency on twenty other functions. If any of the dependencies is updated, then it could break the entire function, thereby making debugging the root cause difficult.

The explanations following each code recommendation were essential in our quick adoption of CodeGuru. Simply showing what code to change would make it tough to follow through with a code correction. CodeGuru provided ample context, reasoning, and even metrics in some cases to explain and justify a correction.

Conclusion

Our development team thoroughly appreciates the extra review layer that CodeGuru provides. CodeGuru indicates areas that internal review might otherwise miss, especially in code written by external contractors.

In some cases, CodeGuru highlighted issues never before considered by the team. Examples of these issues include highly coupled functions, ambiguous exceptions, and outdated API calls. Each suggestion is accompanied with its context and reasoning so that our developers can independently judge if an edit should be made. Furthermore, CodeGuru was easily set up with our GitHub repositories. We enabled it within minutes through the console.

After familiarizing ourselves with the CodeGuru workflow, Gridium treats CodeGuru recommendations like suggestions that an internal reviewer would make. Both internal developers and third parties act on recommendations in order to improve code health and quality. Any CodeGuru suggestions not accepted by contractors are verified and implemented by an internal reviewer if necessary.

Over the twelve weeks that we have been utilizing Amazon CodeGuru, we have had 281 automated pull request reviews. These provided 104 recommendations resulting in fifty code corrections that we may not have made otherwise. Our monthly bill for CodeGuru usage is about $10.00. If we make only a single correction to our code over a whole month that we would have missed otherwise, then we can safely say that it was well worth the price!

About the Authors

Kimberly Nicholls is an Engineering Technical Lead at Gridium who loves to make data useful. She also enjoys reading books and spending time outside.

Adnan Bilwani is a Sr. Specialist-Builder Experience providing fully managed ML-based solutions to enhance your DevOps workflows.

Aaqib Bickiya is a Solutions Architect at Amazon Web Services. He helps customers in the Midwest build and grow their AWS environments.

How The Mill Adventure Implemented Event Sourcing at Scale Using DynamoDB

Post Syndicated from Uri Segev original https://aws.amazon.com/blogs/architecture/how-the-mill-adventure-implemented-event-sourcing-at-scale-using-dynamodb/

This post was co-written by Joao Dias, Chief Architect at The Mill Adventure and Uri Segev, Principal Serverless Solutions Architect at AWS

The Mill Adventure provides a complete gaming platform, including licenses and operations, for rapid deployment and success in online gaming. It underpins every aspect of the process so that you can focus on telling your story to your audience while the team makes everything else work perfectly.

In this blog post, we demonstrate how The Mill Adventure implemented event sourcing at scale using Amazon DynamoDB and Serverless on AWS technologies. By partnering with AWS, The Mill Adventure reduced their costs, and they are able to maintain operations and scale their solution to suit their needs without their intervention.

What is event sourcing?

Event sourcing captures an entity’s state (such as a transaction or a user) as a sequence of state-changing events. Whenever the state changes, a new event is appended to the sequence of events using an atomic operation.

The system persists these events in an event store, which is a database of events. The store supports adding and retrieving the state events. The system reconstructs the entity’s state by reading the events from the event store and replaying them. Because the store is immutable (meaning these events are saved in the event store forever) the entity’s state can be recreated up to a particular version or date and have accurate historical values.

Why use event sourcing?

Event sourcing provides many advantages, that include (but are not limited to) the following:

  • Audit trail: Events are immutable and provide a history of what has taken place in the system. This means it’s not only providing the current state, but how it got there.
  • Time travel: By persisting a sequence of events, it is relatively easy to determine the state of the system at any point in time by aggregating the events within that time period. This provides you the ability to answer historical questions about the state of the system.
  • Performance: Events are simple and immutable and only require an append operation. The event store should be optimized to handle high-performance writes.
  • Scalability: Storing events avoids the complications associated with saving complex domain aggregates to relational databases, which allows more flexibility for scaling.

Event-driven architectures

Event sourcing is also related to event-driven architectures. Every event that changes an entity’s state can also be used to notify other components about the change. In event-driven architectures, we use event routers to distribute the events to interested components.

The event router has three main functions:

  1. Decouple the event producers from the event consumers: The producers don’t know who the consumers are, and they do not need to change when new consumers are added or removed.
  2. Fan out: Event routers are capable of distributing events to multiple subscribers.
  3. Filtering: Event routers send each subscriber only the events they are interested in. This saves on the number of events that consumers need to process; therefore, it reduces the cost of the consumers.

How did The Mill Adventure implement event sourcing?

The Mill Adventure uses DynamoDB tables as their object store. Each event is a new item in the table. The DynamoDB table model for an event sourced system is quite simple, as follows:

Field Type Description
id PK The object identifier
version SK The event sequence number
eventdata The event data itself, in other words, the change to the object’s state

All events for the same object have the same id. Thus, you can retrieve them using a single read request.

When a component modifies the state of an object, it first determines the sequence number for the new event by reading the current state from the table (in other words, the sequence of events for that object). It then attempts to write a new item to the table that represents the change to the object’s state. The item is written using DynamoDB’s conditional write. This ensures that there are no other changes to the same object happening at the same time. If the write failed due to a condition not met error, it will start over.

An additional benefit of using DynamoDB as the event store is DynamoDB Streams, which is used to deliver events about changes in tables. These events can be used by event-driven applications so they will know about the different objects’ change of state.

How does it work?

Let’s use an example of a business entity, such as a user. When a user is created, the system creates a UserCreated event with the initial user data (like user name, address, etc.). The system then persists this event to the DynamoDB event store using a conditional write. This makes sure that the event is only written once and that the version numbers are sequential.

Then the user address gets updated, so again, the system creates a UserUpdated event with the new address and persists it.

When the system needs the user’s current state, for example, to show it in back-office application, the system loads all the events for the given user identifier from the store. For each one of them, it invokes a mutation function that recreates the latest state. Given the following items in the database:

  • Event 1: UserCreated(name: The Mill, address: Malta)
  • Event 2: UserUpdated(address: World)

You can imagine how each mutator function for those events would look like, which then produce the latest state:

{ 
"name": "The Mill", 
"address": "World" 
}

A business state like a bank statement can have a large number of events. To optimize loading, the system periodically saves a snapshot of the current state. To reconstruct the current state, the application finds the most recent snapshot and the events that have occurred since that snapshot. As a result, there are fewer events to replay.

Architecture

The Mill Adventure architecture for an event source system using AWS components is straightforward. The architecture is fully serverless, as such, it only uses AWS Lambda functions for compute. Lambda functions produce the state-changing events that are written to the database.

Other Lambda functions, when they retrieve an object’s state, will read the events from the database and calculate the current state by replaying the events.

Finally, interested functions will be notified about the changes by subscribing to the event bus. Then they perform their business logic, like updating state projections or publishing to WebSocket APIs. These functions use DynamoDB streams as the event bus to handle messages as shows in Figure 1.

Event sourcing architecture

Figure 1. Event sourcing architecture

Figure 1 is not completely accurate due to a limitation of DynamoDB Streams, which can only support up to two subscribers.

Because The Mill Adventure has many microservices that are interested in these events, they have a single function that gets invoked from the stream and sends the events to other event routers. These fan out to a large number of subscribers such as Amazon EventBridge, Amazon Simple Notification Service (Amazon SNS), or maybe even Amazon Kinesis Data Streams for some use cases.

Any service in the system could be listening to these events being created via the DynamoDB stream and distributed via the event router and act on them. For example, publishing a WebSocket API notification or prompting a contact update in a third-party service.

Conclusion

In this blog post, we showed how The Mill Adventure uses serverless technologies like DynamoDB and Lambda functions to implement an event-driven event sourcing system.

An event sourced system can be difficult to scale, but using DynamoDB as the event store resolved this issue. It can also be difficult to produce consistent snapshots and Command Query Responsibility Segregation (CQRS) views, but using DynamoDB streams for distributing the events made it relatively easy.

By partnering with AWS, The Mill Adventure created a sports/casino platform to be proud of. It provides high quality data and performance without having servers, they only pay for what they use, and their workload can scale up and down as needed.

How MOIA built a fully automated GDPR compliant data lake using AWS Lake Formation, AWS Glue, and AWS CodePipeline

Post Syndicated from Leonardo Pêpe original https://aws.amazon.com/blogs/big-data/how-moia-built-a-fully-automated-gdpr-compliant-data-lake-using-aws-lake-formation-aws-glue-and-aws-codepipeline/

This is a guest blog post co-written by Leonardo Pêpe, a Data Engineer at MOIA.

MOIA is an independent company of the Volkswagen Group with locations in Berlin and Hamburg, and operates its own ride pooling services in Hamburg and Hanover. The company was founded in 2016 and develops mobility services independently or in partnership with cities and existing transport systems. MOIA’s focus is on ride pooling and the holistic development of the software and hardware for it. In October 2017, MOIA started a pilot project in Hanover to test a ride pooling service, which was brought into public operation in July 2018. MOIA covers the entire value chain in the area of ​​ride pooling. MOIA has developed a ridesharing system to avoid individual car traffic and use the road infrastructure more efficiently.

In this post, we discuss how MOIA uses AWS Lake Formation, AWS Glue, and AWS CodePipeline to store and process gigabytes of data on a daily basis to serve 20 different teams with individual user data access and implement fine-grained control of the data lake to comply with General Data Protection Regulation (GDPR) guidelines. This involves controlling access to data at a granular level. The solution enables MOIA’s fast pace of innovation to automatically adapt user permissions to new tables and datasets as they become available.

Background

Each MOIA vehicle can carry six passengers. Customers interact with the MOIA app to book a trip, cancel a trip, and give feedback. The highly distributed system prepares multiple offers to reach their destination with different pickup points and prices. Customers select an option and are picked up from their chosen location. All interactions between the customers and the app, as well as all the interactions between internal components and systems (the backend’s and vehicle’s IoT components), are sent to MOIA’s data lake.

Data from the vehicle, app, and backend must be centralized to have the synchronization between trips planned and implemented, and then to collect passenger feedback. To provide different pricing and routing options, MOIA needed centralized data. MOIA decided to build and secure its Amazon Simple Storage Service (Amazon S3) based Data Lake using AWS Lake Formation.

Different MOIA teams that includes Data Analysts, Data Scientists and Data Engineers need to access centralized data from different sources for the development and operations of the application workloads. It’s a legal requirement to control the access and format of the data to these different teams. The app development team needs to understand customer feedback in an anonymized way, pricing-related data must be accessed only by the business analytics team, vehicle data is meant to be used only by the vehicle maintenance team, and the routing team needs access to customer location and destination.

Architecture overview

The following diagram illustrates MOIA solution architecture.

The solution has the following components:

  1. Data input – The apps, backend, and IoT devices are continuously streaming event messages via Amazon Kinesis Data Streams in a nested information in a JSON format.
  2. Data transformation – When the raw data is received, the data pipeline orchestrator (Apache Airflow) starts the data transformation jobs to meet requirements for respective data formats. Amazon EMR, AWS Lambda, or AWS Fargate cleans, transforms, and loads the events in the S3 data lake.
  3. Persistence layer – After the data is transformed and normalized, AWS Glue crawlers classify the data to determine the format, schema, and associated properties. They group data into tables or partitions and write metadata to the AWS Glue Data Catalog based on the structured partitions created in Amazon S3. The data is written on Amazon S3 partitioned by its event type and timestamp so it can be easily accessed via Amazon Athena and the correct permissions can be applied using Lake Formation. The crawlers are run at a fixed interval in accordance with the batch jobs, so no manual runs are required.
  4. Governance layer – Access on the data lake is managed using the Lake Formation governance layer. MOIA uses Lake Formation to centrally define security, governance, and auditing policies in one place. These policies are consistently implemented, which eliminates the need to manually configure them across security services like AWS Identity and Access Management (IAM), AWS Key Management Service (AWS KMS), storage services like Amazon S3, or analytics and machine learning (ML) services like Amazon Redshift, Athena, Amazon EMR for Apache Spark. Lake Formation reduces the effort in configuring policies across services and provides consistent assistance for GDPR requirements and compliance. When a user makes a request to access Data Catalog resources or underlying data from the data lake, for the request to succeed, it must pass permission checks by both IAM and Lake Formation. Lake Formation permissions control access to Data Catalog resources, Amazon S3 locations, and the underlying data at those locations. User permissions to the data on the table, row, or column level are defined in Lake Formation, so that users only access the data if they’re authorized.
  5. Data access layer – After the flattened and structured data is available to be accessed by the data analysts, scientists, and engineers they can use Amazon Redshift or Athena to perform SQL analysis, or AWS Data Wrangler and Apache Spark to perform programmatic analysis and build ML use cases.
  6. Infrastructure orchestration and data pipeline – After the data is ingested and transformed, the infrastructure orchestration layer (CodePipeline and Lake Formation) creates or updates the governance layer with the proper and predefined permissions periodically every hour (see more about the automation in the governance layer later in this post).

Governance challenge

MOIA wants to evolve their ML models for routing, demand prediction, and business models continuously. This requires MOIA to constantly review models and update them, therefore power users such as data administrators and engineers frequently redesign the table schemas in the AWS Glue Data Catalog as part of the data engineering workflow. This highly dynamic metadata transformation requires an equally dynamic governance layer pipeline that can assign the right user permissions to all tables and adapt to these changes transparently without disruptions to end-users. Due to GDPR requirements, there is no room for error, and manual work is required to assign the right permissions according to GDPR compliance on the tables in the data lake with many terabytes of data. Without automation, many developers are needed for administration; this adds human error into the workflows, which is not acceptable. Manual administration and access management isn’t a scalable solution. MOIA needed to innovate faster with GDPR compliance with a small team of developers.

Data schema and data structure often changes at MOIA, resulting in new tables being created in the data lake. To guarantee that new tables inherit the permissions granted to the same group of users who already have access to the entire database, MOIA uses an automated process that grants Lake Formation permission to newly created tables, columns, and databases, as described in the next section.

Solution overview

The following diagram illustrates the continuous deployment loop using AWS CloudFormation.

The workflow contains the following steps:

  1. MOIA data scientists and engineers create or modify new tables to evolve the business and ML models. This results in new tables or changes in the existing schema of the table.
  2. The data pipeline is orchestrated via Apache Airflow, which controls the whole cycle of ingestion, cleansing, and data transformation using Spark jobs (as shown in Step 1). When the data is in its desired format and state, Apache Airflow triggers the AWS Glue crawler job to discover the data schema in the S3 bucket and add the new partitions to the Data Catalog. Apache Airflow also triggers CodePipeline to assign the right permissions on all the tables.
  3. Apache Airflow triggers CodePipeline every hour, which uses MOIA’s libraries to discover the new tables, columns, and databases, and grants Lake Formation permissions in the AWS CloudFormation template for all tables, including new and modified. This orchestration layer ensures Lake Formation permissions are granted. Without this step, nobody can access new tables, and new data isn’t visible to data scientists, business analysts, and others who need it.
  4. MOIA uses Stacker and Troposphere to identify all the tables, assign the tables the right permissions, and deploy the CloudFormation stack. Troposphere is the infrastructure as code (IaC) framework that renders the CloudFormation templates, and stacker helps with the parameterization and deployment of the templates on AWS. Stacker also helps produce reusable templates in the form of blueprints as pure Python code, which can be easily parameterized using YAML files. The Python code uses Boto3 clients to lookup the Data Catalog and search for databases and tables.
  5. The stacker blueprint libraries developed by MOIA (which internally use Boto3 and troposphere) are used to discover newly created databases or tables in the Data Catalog.
  6. A Permissions configuration file allows MOIA to predefine data lake tables (Can be a wildcard indicating all tables available in one database) and specific personas who have access to these tables. These roles are split into different categories called lake personas, and have specific access levels. Example lake personas include data domain engineers, data domain technical users, data administrators, and data analysts. Users and their permissions are defined in the file. In case access to personally identifiable information (PII) data is granted, the GDPR officer ensures that a record of processing activities is in place and the usage of personal data is documented according to the law.
  7. MOIA uses stacker to read the predefined permissions file, and uses the customized stacker blueprints library containing the logic to assign permissions to lake personas for each of the tables discovered in Step 5.
  8. The discovered and modified tables are matched with predefined permissions in Step 6 and Step 7. Stacker uses YAML format as the input for the CloudFormation template parameters to define users and data access permissions. These parameters are related to the user’s roles and define access to the tables. Based on this, MOIA creates a customized stacker that creates AWS CloudFormation resources dynamically. The following are the example stacks in AWS CloudFormation:
    1. data-lake-domain-database – Holds all resources that are relevant during the creation of the database, which includes lake permissions at the database level that allow the domain database admin personas to perform operations in the database.
    2. data-lake-domain-crawler – Scans Amazon S3 constantly to discover and create new tables and updates.
    3. data-lake-lake-table-permissions – Uses Boto3 combined with troposphere to list the available tables and grant lake permissions to the domain roles that access it.

This way, new CloudFormation templates are created, containing permissions for new or modified tables. This process guarantees a fully automated governance layer for the data lake. The generated CloudFormation template contains Lake Formation permission resources for each table, database, or column. The process of managing Lake Formation permissions on Data Catalog databases, tables, and columns is simplified by granting Data Catalog permissions using the Lake Formation tag-based access control method. The advantage of generating a CloudFormation template is audibility. When the new version of the CloudFormation stack is prepared with an access control set on new or modified tables, administrators can compare that stack with the older version to discover newly prepared and modified tables. MOIA can view the differences via the AWS CloudFormation console before new stack deployment.

  1. Either the CloudFormation stack is deployed in the account with the right permissions for all users, or a stack deployment failure notice is sent to the developers via a Slack channel (Step 10). This ensures the visibility in the deployment process and failed pipelines in permission assignment.
  2. Whenever the pipeline fails, MOIA receives the notification via Slack so the engineers can promptly fix the errors. This loop is very important to guarantee that whenever the schema changes, those changes are reflected in the data lake without manual intervention.
  3. Following this automated pipeline, all the tables are assigned right permissions.

Benefits

This solution delivers the following benefits:

  • Automated enforcement of data access permissions allows people to access the data without manual interventions in a scalable way. With automation, 1,000 hours of manual work are saved every year.
  • The GDPR team does the assessment internally every month. The GDPR team constantly provides guidance and approves each change in permissions. This audit trail for records of processing activities is automated with the help of Lake Formation (otherwise it needs a dedicated human resource).
  • The automated workflow of permission assignment is integrated into existing CI/CD processes, resulting in faster onboarding of new teams, features, and dataset releases. An average of 48 releases are done each month (including major and minor version releases and new event types). Onboarding new teams and forming internal new teams is very easy now.
  • This solution enables you to create a data lake using IaC processes that are easy and GDPR-compliant.

Conclusion

MOIA has created scalable, automated, and versioned permissions with a GDPR-supported, governed data lake using Lake Formation. This solution helps them bring new features and models to market faster, and reduces administrative and repetitive tasks. MOIA can focus on 48 average releases every month, contributing to a great customer experience and new data insights.


About the Authors

Leonardo Pêpe is a Data Engineer at MOIA. With a strong background in infrastructure and application support and operations, he is immersed in the DevOps philosophy. He’s helping MOIA build automated solutions for its data platform and enabling the teams to be more data-driven and agile. Outside of MOIA, Leonardo enjoys nature, Jiu-Jitsu and martial arts, and explores the good of life with his family.


Sushant Dhamnekar is a Solutions Architect at AWS. As a trusted advisor, Sushant helps automotive customers to build highly scalable, flexible, and resilient cloud architectures, and helps them follow the best practices around advanced cloud-based solutions. Outside of work, Sushant enjoys hiking, food, travel, and CrossFit workouts.


Shiv Narayanan is Global Business Development Manager for Data Lakes and Analytics solutions at AWS. He works with AWS customers across the globe to strategize, build, develop and deploy modern data platforms. Shiv loves music, travel, food and trying out new tech.

Toyota Connected and AWS Design and Deliver Collision Assistance Application

Post Syndicated from Srikanth Kodali original https://aws.amazon.com/blogs/architecture/toyota-connected-and-aws-design-and-deliver-collision-assistance-application/

This post was cowritten by Srikanth Kodali, Sr. IoT Data Architect at AWS, and Will Dombrowski, Sr. Data Engineer at Toyota Connected

Toyota Connected North America (TC) is a technology/big data company that partners with Toyota Motor Corporation and Toyota Motor North America to develop products that aim to improve the driving experience for Toyota and Lexus owners.

TC’s Mobility group provides backend cloud services that are built and hosted in AWS. Together, TC and AWS engineers designed, built, and delivered their new Collision Assistance product, which debuted in early August 2021.

In the aftermath of an accident, Collision Assistance offers Toyota and Lexus drivers instructions to help them navigate a post-collision situation. This includes documenting the accident, filing an insurance claim, and transitioning to the repair process.

In this blog post, we’ll talk about how our team designed, built, refined, and deployed the Collision Assistance product with Serverless on AWS services. We’ll discuss our goals in developing this product and the architecture we developed based on those goals. We’ll also present issues we encountered when testing our initial architecture and how we resolved them to create the final product.

Building a scalable, affordable, secure, and high performing product

We used a serverless architecture because it is often less complex than other architecture types. Our goals in developing this initial architecture were to achieve scalability, affordability, security, and high performance, as described in the following sections.

Scalability and affordability

In our initial architecture, Amazon Simple Queue Service (Amazon SQS) queues, Amazon Kinesis streams, and AWS Lambda functions allow data pipelines to run servers only when they’re needed, which introduces cost savings. They also process data in smaller units and run them in parallel, which allows data pipelines to scale up efficiently to handle peak traffic loads. These services allow for an architecture that can handle non-uniform traffic without needing additional application logic.

Security

Collision Assistance can deliver information to customers via push notifications. This data must be encrypted because many data points the application collects are sensitive, like geolocation.

To secure this data outside our private network, we use Amazon Simple Notification Service (Amazon SNS) as our delivery mechanism. Amazon SNS provides HTTPS endpoint delivery of messages coming to topics and subscriptions. AWS allows us to enable at-rest and/or in-transit encryption for all of our other architectural components as well.

Performance

To quantify our product’s performance, we review the “notification delay.” This metric evaluates the time between the initial collision and when the customer receives a push notification from Collision Assistance. Our ultimate goal is to have the push notification sent within minutes of a crash, so drivers have this information in near real time.

Initial architecture

Figure 1 presents our initial architecture implementation that aims to predict whether a crash has occurred and reduce false positives through the following data pipeline:

  1. The Kinesis stream receives vehicle data from an upstream ingestion service, as discussed in the Enhancing customer safety by leveraging the scalable, secure, and cost-optimized Toyota Connected Data Lake blog.
  2. A Lambda function writes lookup data to Amazon DynamoDB for every Kinesis record.
  3. This Lambda function decreases obvious non-crash data. It sends the current record (X) to Amazon SQS. If X exceeds a certain threshold, it will remain a crash candidate.
  4. Amazon SQS sets a delivery delay so that there will be more Kinesis/DynamoDB records available when X is processed later in the pipeline.
  5. A second Lambda function reads the data from the SQS message. It queries DynamoDB to find the Kinesis lookup data for the message before (X-1) and after (X+1) the crash candidate.
  6. Kinesis GetRecords retrieves X-1 and X+1, because X+1 will exist after the SQS delivery delay times out.
  7. The X-1, X, and X+1 messages are sent to the data science (DS) engine.
  8. When a crash is accurately predicted, these results are stored in a DynamoDB table.
  9. The push notification is sent to the vehicle owner. (Note: the push notification is still in ‘select testing phase’)
Diagram and description of our initial architecture implementation

Figure 1. Diagram and description of our initial architecture implementation

To be consistent with privacy best practices and reduce server uptime, this architecture uses the minimum amount of data the DS engine needs.

We filter out records that are lower than extremely low thresholds. Once these records are filtered out, around 40% of the data fits the criteria to be evaluated further. This reduces the server capacity needed by the DS engine by 60%.

To reduce false positives, we gather data before and after the timestamps where the extremely low thresholds are exceeded. We then evaluate the sensor data across this timespan and discard any sets with patterns of abnormal sensor readings or other false positive conditions. Figure 2 shows the time window we initially used.

Longitudinal acceleration versus time

Figure 2. Longitudinal acceleration versus time

Adjusting our initial architecture for better performance

Our initial design worked well for processing a few sample messages and achieved the desired near real-time delivery of the push notification. However, when the pipeline was enabled for over 1 million vehicles, certain limits were exceeded, particularly for Kinesis and Lambda integrations:

  • Our Kinesis GetRecords API exceeded the allowed five requests per shard per second. With each crash candidate retrieving an X-1 and X+1 message, we could only evaluate two per shard per second, which isn’t cost effective.
  • Additionally, the downstream SQS-reading Lambda function was limited to 10 records per second per invocation. This meant any slowdown that occurs downstream, such as during DS engine processing, could cause the queue to back up significantly.

To improve cost and performance for the Kinesis-related functionality, we abandoned the DynamoDB lookup table and the GetRecord calls in favor of using a Redis cache cluster on Amazon ElastiCache. This allows us to avoid all throughput exceptions from Kinesis and focus on scaling the stream based on the incoming throughput alone. The ElastiCache cluster scales capacity by adding or removing shards, which improves performance and cost efficiency.

To solve the Amazon SQS/Lambda integration issue, we funneled messages directly to an additional Kinesis stream. This allows the final Lambda function to use some of the better scaling options provided to Kinesis-Lambda event source integrations, like larger batch sizes and max-parallelism.

After making these adjustments, our tests proved we could scale to millions of vehicles as needed. Figure 3 shows a diagram of this final architecture.

Final architecture

Figure 3. Final architecture

Conclusion

Engineers across many functions worked closely to deliver the Collision Assistance product.

Our team of backend Java developers, infrastructure experts, and data scientists from TC and AWS built and deployed a near real-time product that helps Toyota and Lexus drivers document crash damage, file an insurance claim, and get updates on the actual repair process.

The managed services and serverless components available on AWS provided TC with many options to test and refine our team’s architecture. This helped us find the best fit for our use case. Having this flexibility in design was a key factor in designing and delivering the best architecture for our product.


How Magellan Rx Management used Amazon Redshift ML to predict drug therapeutic conditions

Post Syndicated from Karim Prasla original https://aws.amazon.com/blogs/big-data/how-magellan-rx-management-used-amazon-redshift-ml-to-predict-drug-therapeutic-conditions/

This post is co-written with Karim Prasla and Deepti Bhanti from Magellan Rx Management as the lead authors.

Amazon Redshift ML makes it easy for data scientists, data analysts, and database developers to create, train, and use machine learning (ML) models using familiar SQL commands in Amazon Redshift data warehouses. The ML feature can be used by various personas; in this post we discuss how data analysts at Magellan Rx Management used Redshift ML to predict and classify drugs into various therapeutic conditions.

About Magellan Rx Management

Magellan Rx Management, a division of Magellan Health, Inc., is shaping the future of pharmacy. As a next-generation pharmacy organization, we deliver meaningful solutions to the people we serve. As pioneers in specialty drug management, industry leaders in Medicaid pharmacy programs, and disruptors in pharmacy benefit management, we partner with our customers and members to deliver a best-in-class healthcare experience.

Use case

Magellan Rx Management uses data and analytics to deliver clinical solutions that improve patient care, contain costs, and improve outcomes. We utilize predictive analytics to forecast future drugs costs, identify drugs that will drive future trends, including pipeline medications, and proactively identify patients at risk for becoming non-adherent to their medications.

We develop and deliver these analytics via our MRx Predict solution. This solution utilizes a variety of data, including pharmacy and medical claims, compendia information, census data, and many other sources to optimize the predictive model development, deployment, and most importantly maximize predictive accuracy.

Part of the process involves stratification of drugs and patient population based on therapeutic conditions. These conditions are derived by utilizing compendia drug attributes to come up with a classification system focused on disease categories, such as diabetes, hypertension, spinal muscular atrophy, and many others, and ensuring drugs are appropriately categorized as opposed to being included in the “miscellaneous” bucket, which is the case for many specialty medications. Also, this broader approach to classifying drugs, beyond just mechanism of action, has allowed us to effectively develop downstream reporting solutions, patient segmentation, and outcomes analytics.

Although we use different technologies for predictive analytics, we wanted to use Redshift ML to predict appropriate drug therapeutic conditions, because it would allow us to use this functionality within our Amazon Redshift data warehouse by making the predictions using standard SQL programming. Prior to Redshift ML, we had data analysts and clinicians manually categorize any new drugs into the appropriate therapeutic conditions. The end goal of using Redshift ML was to assess how well we could improve our operational efficiency while maintaining a high level of clinical accuracy.

Redshift ML allowed us to create models using standard SQL without having to use external systems, technologies, or APIs. With data already in Amazon Redshift, our data scientists and analysts, who are skilled in SQL, seamlessly created ML models to effectively predict therapeutic conditions for individual drugs.

“At Magellan Rx Management, we leverage data, analytics, and proactive insights, to help solve complex pharmacy challenges, while focusing on improving clinical and economic outcomes for customers and members,” said Karim Prasla, Vice President of Clinical Outcomes Advanced Analytics and Research at Magellan Rx Management.“We use predictive analytics and machine learning to improve operational and clinical efficiencies and effectiveness. With Redshift ML, we were able to enable our data and outcomes analysts to classify new drugs to market into appropriate therapeutic conditions by creating and utilizing ML models with minimal effort. The efficiency gained through leveraging Redshift ML to support this process improved our productivity and optimized our resources while generating a high degree of predictive accuracy.”

Magellan Rx Management continues to focus on using data analytics to identify opportunities to improve patient care and outcomes, to deliver proactive insights to our customers so sound data-driven decisions can be made, and end-user tools to allow customers and support staff to have readily available insights. By incorporating predictive analytics along with providing descriptive and diagnostic insights, we at Magellan Rx Management are able to partner with our customers to ensure we evaluate the “what,” the “why,” and the “what will” to more effectively manage the pharmacy programs.

Key benefits of using Redshift ML

Redshift ML enables you to train models with a single SQL CREATE MODEL command. The CREATE MODEL command creates a model that Amazon Redshift uses to generate model-based predictions with familiar SQL constructs.

Redshift ML provides simple, optimized, and secure integration between Amazon Redshift and Amazon SageMaker, and enables inference within the Amazon Redshift cluster, making it easy to use predictions generated by ML-based models in queries and applications. An analyst with SQL skills can easily create and train models with no expertise in ML programming languages, algorithms, and APIs.

With Redshift ML, you don’t have to perform any of the undifferentiated heavy lifting required for integrating with an external ML service. Redshift ML saves you the time to format and move data, manage permission controls, or build custom integrations, workflows, and scripts. You can easily use popular ML algorithms and simplify training needs that require frequent iteration from training to prediction. Amazon Redshift automatically discovers the best algorithm and tunes the best model for your problem. You can simply make predictions and predictive analytics from within your Amazon Redshift cluster without the need to move data out of Amazon Redshift.

Simplifying integration between Amazon Redshift and SageMaker

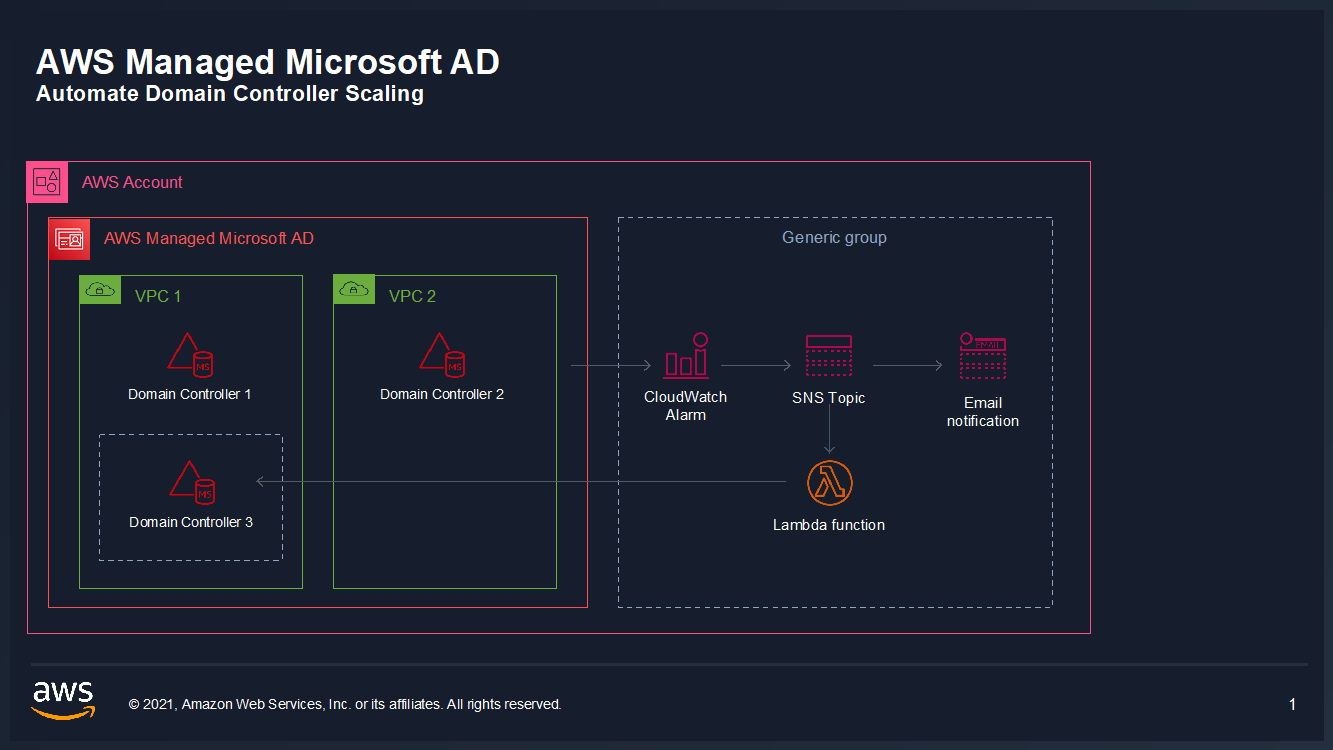
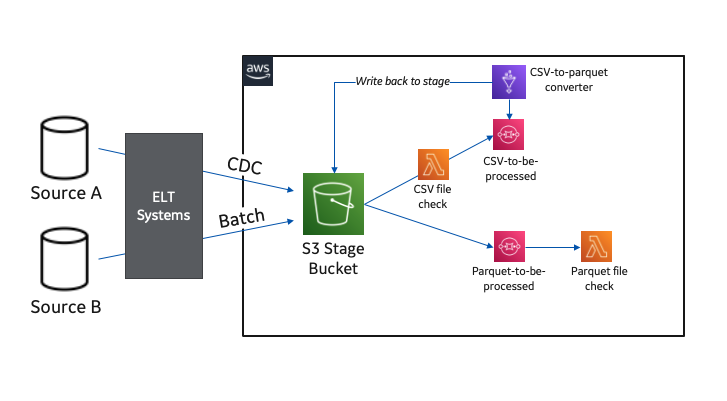
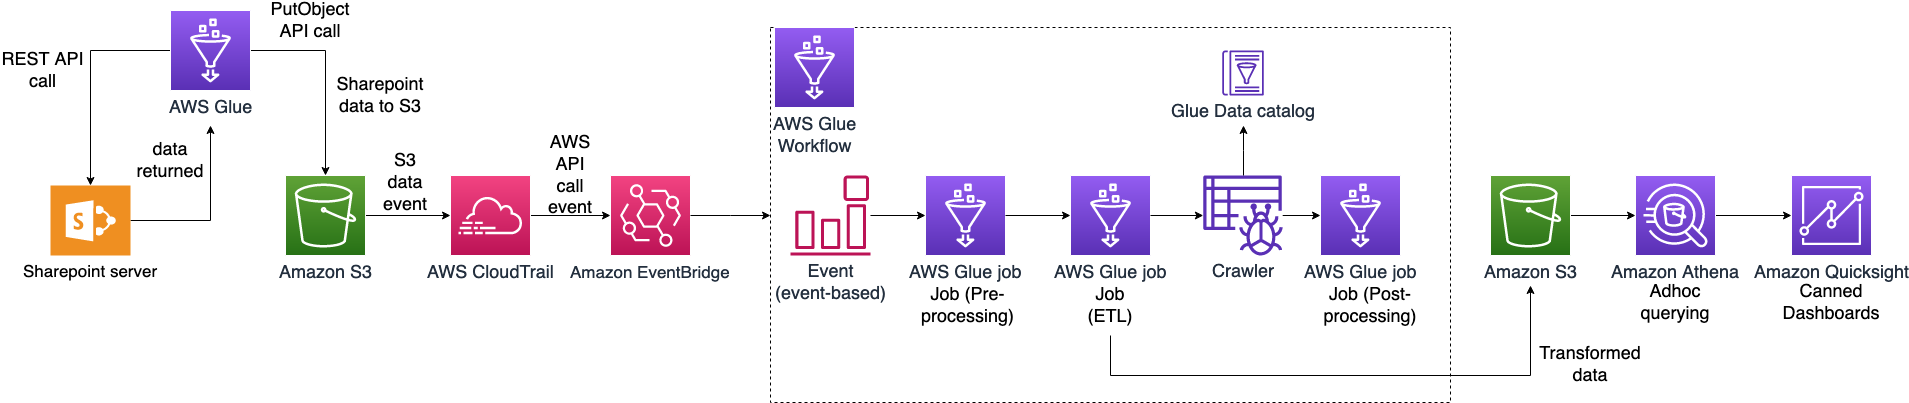
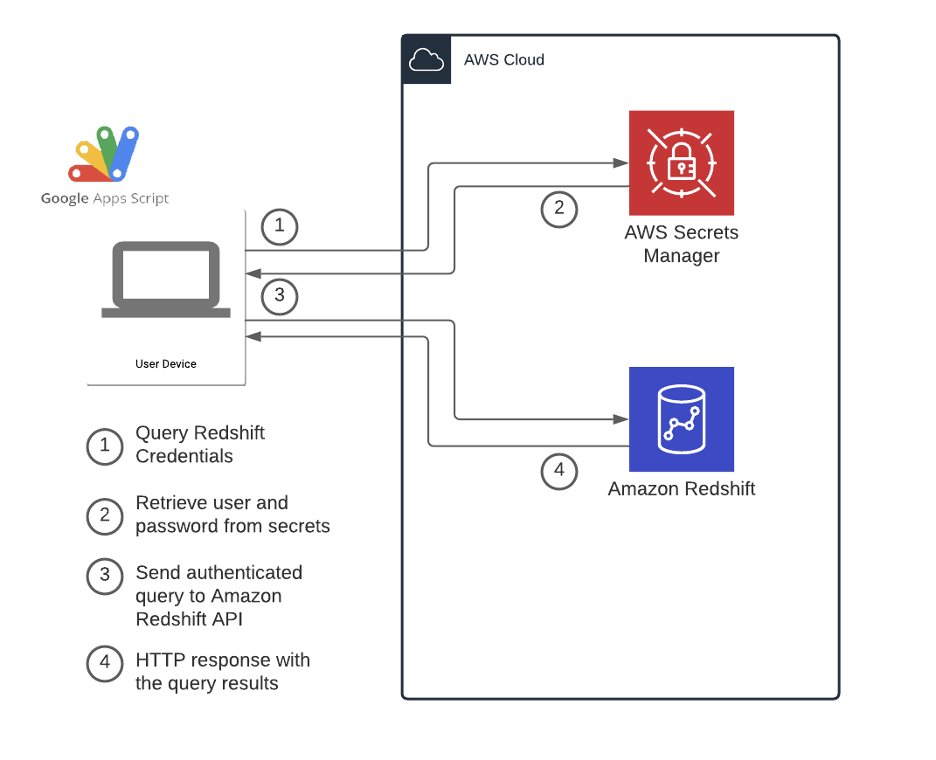
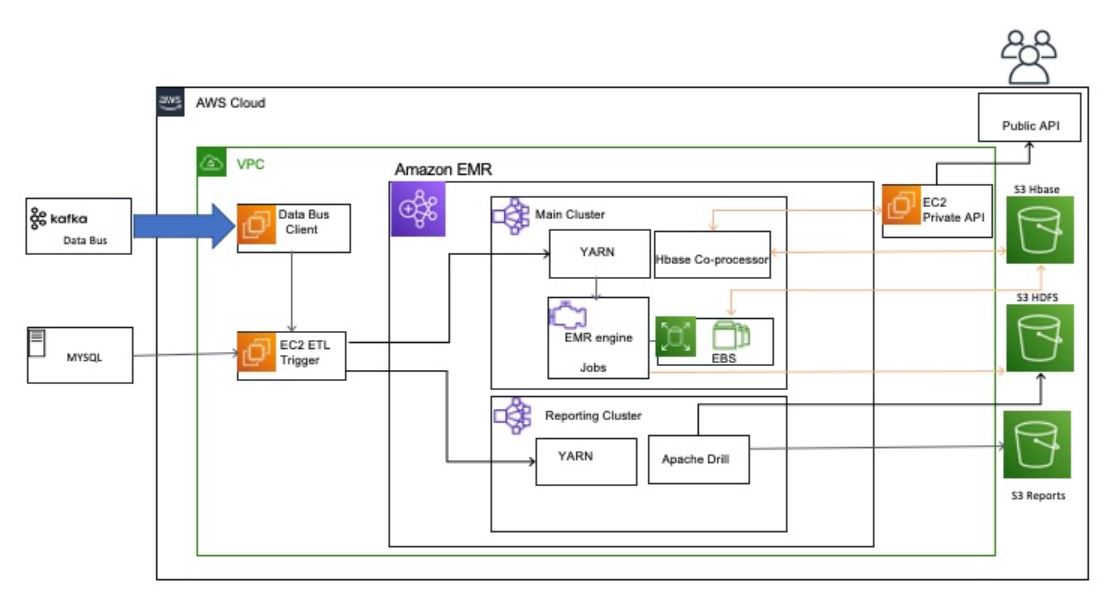
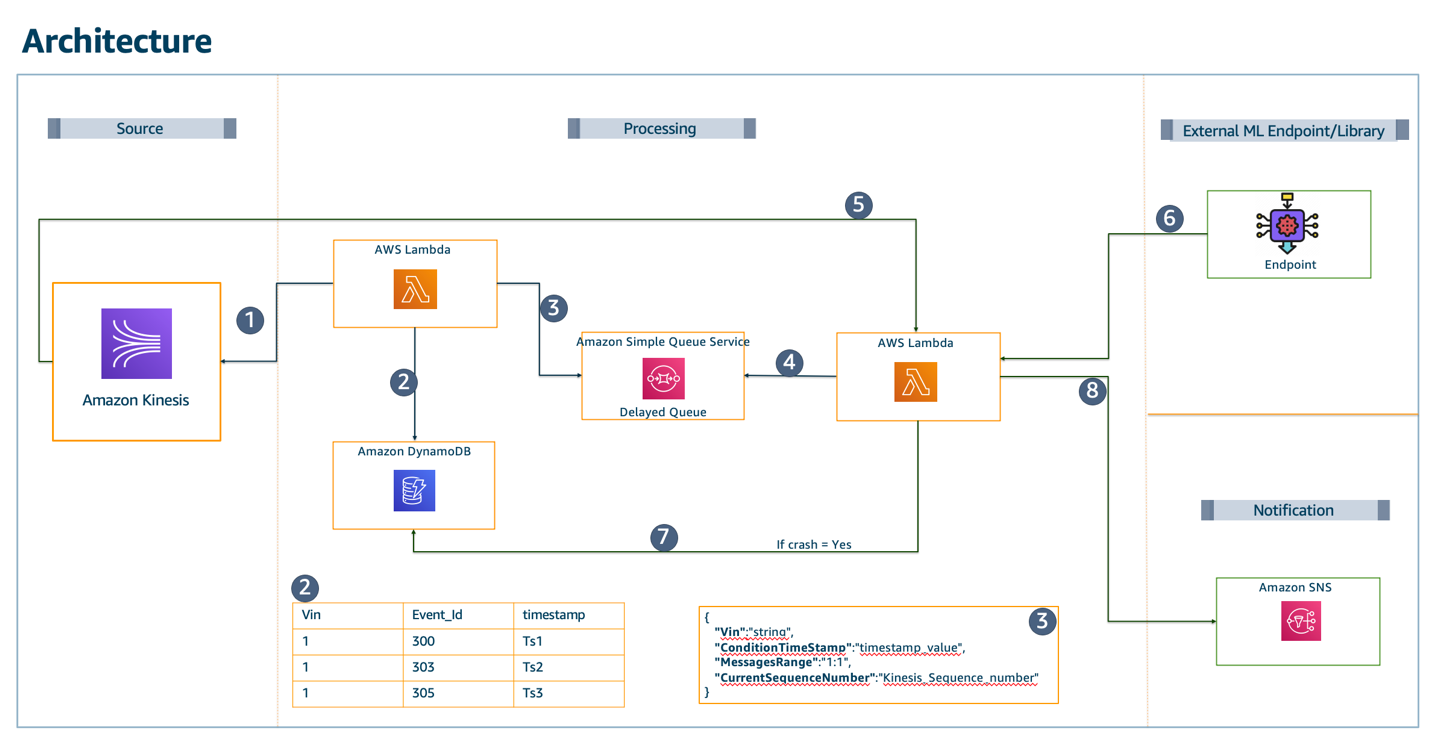
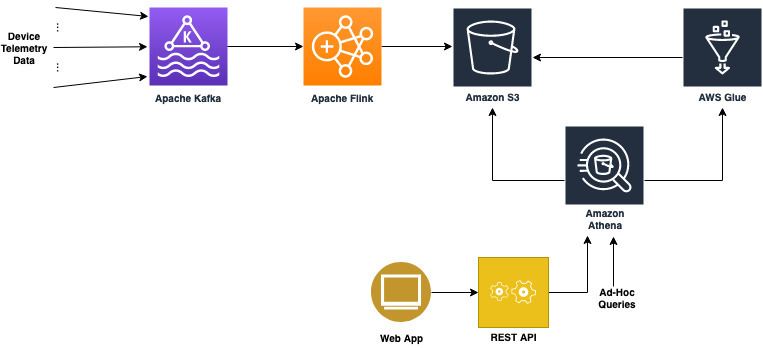
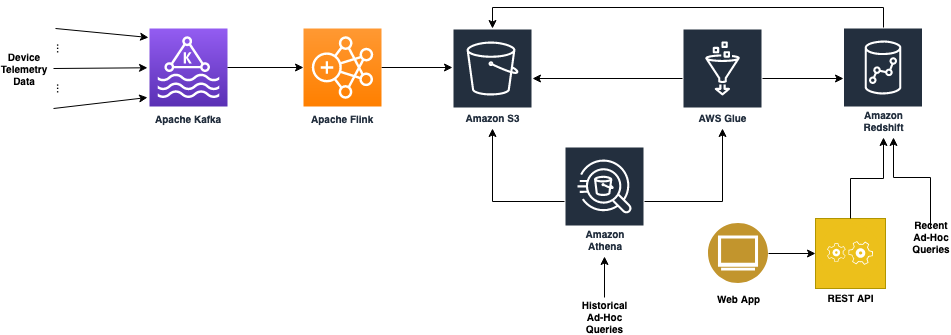
Before Redshift ML, a data scientist had to go through a series of steps with various tools to arrive at a prediction—identify the appropriate ML algorithms in SageMaker or use Amazon SageMaker Autopilot, export the data from the data warehouse, and prepare the training data to work with these models. When the model is deployed, the scientist goes through various iterations with new data for making predictions (also known as inference). This involves moving data back and forth between Amazon Redshift and SageMaker through a series of manual steps:

  1. Export training data to Amazon Simple Storage Service (Amazon S3).
  2. Train the model in SageMaker.
  3. Export prediction input data to Amazon S3.
  4. Generate predictions in SageMaker.
  5. Import targets back into the database.

The following diagram depicts these steps.
Amazon Redshift ML Architecture
This iterative process is time-consuming and prone to errors, and automating the data movement can take weeks or months of custom coding that then needs to be maintained.

Redshift ML enables you to use ML with your data in Amazon Redshift without this complexity. Without movement of data, you don’t have any overhead of additional security and governance of data that you export from your data warehouse.

Prerequisites

To take advantage of Redshift ML, you need an Amazon Redshift cluster with the ML feature enabled.

The cluster needs to have an AWS Identity and Access Management (IAM) role attached with sufficient privileges on Amazon S3 and SageMaker. For more information on setup and an introduction to Redshift ML, see Create, train, and deploy machine learning models in Amazon Redshift using SQL with Amazon Redshift ML. The IAM role is required for Amazon Redshift to interact with SageMaker and Amazon S3. An S3 bucket is also required to export the training dataset and store other ML-related intermediate artifacts.

Setup and data preparation

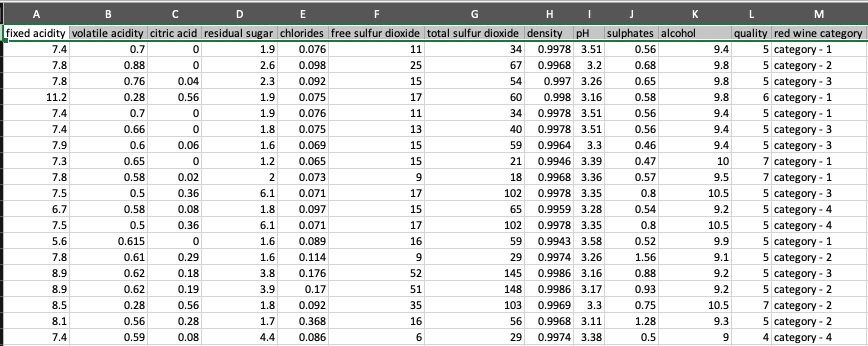
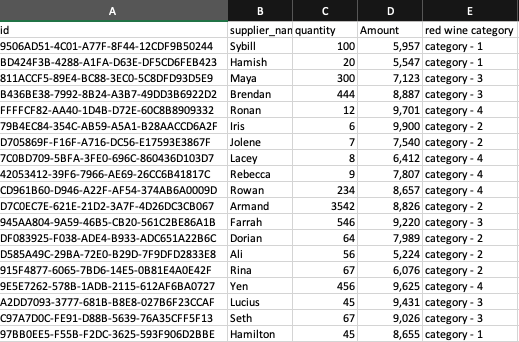
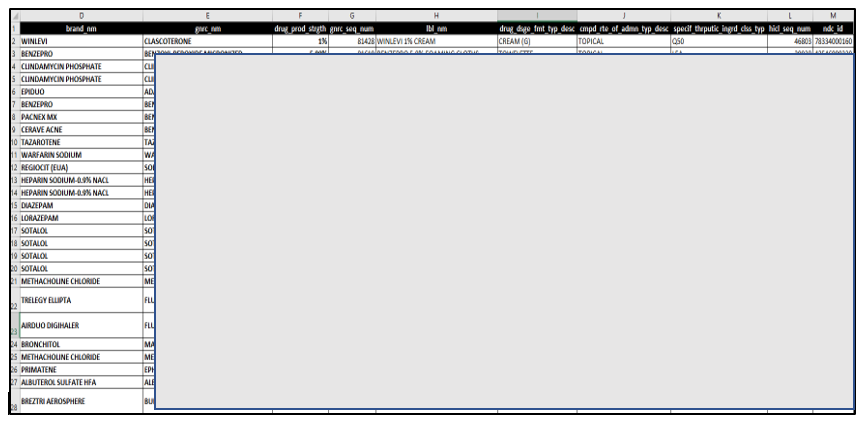
We use a sample dataset for this use case; the last column mrx_therapeutic_condition is the one we’re going to predict using the multi-classification model. We ingest this health care drug dataset into the Amazon Redshift cluster, and use it to train and test the model.

To get randomness in the training dataset, we used a random record number column (record_nbr), which can be used to separate the training dataset from testing. If your dataset already has a unique or primary key column, you can use it as a predicate to separate the training from testing dataset. The random factor (record_nbr) column was added to this dataset to serve as a WHERE clause predicate to the SELECT statement in the CREATE MODEL command (discussed later in this post). A classic example is if your prediction column is True or False, then you want to make sure that the training dataset has balanced values of both and not just True or False alone. You can achieve this by using a neutral column as a predicate, which in our case is record_nbr. After loading the data, we validated to ensure all column values are uniformly distributed for training the model. A very important factor for getting better accuracy in predictions is to use a balanced dataset for training in which the distribution of all the values is balanced and covers all characteristics.

In this example, we have kept the entire data in single table but used the WHERE predicate on the record_nbr column to differentiate the training and testing datasets.

The following is the DDL and COPY commands for this use case.

  1. Sign in to Amazon Redshift using the query editor or your preferred SQL client (DBeaver, DBVisualizer, SQL WorkbenchJ) to run the SQL statements to create the database tables.
  2. Create the schema and tables using the following DDL statements:
    --create schema
    CREATE SCHEMA drug_ml;
    
    --train table
    CREATE TABLE drug_ml.ml_drug_data
    (
    record_nbr int,
    col2 datatype,
    col3 datatype,
    etc..,
    mrx_therapeutic_condition character varying(47) 
    ) 
    DISTSTYLE EVEN;

  3. Use the COPY commands to prepare and load data for model training:
    --Load 
    COPY drug_ml.ml_drug_rs_raw
    FROM 's3://<s3bucket>/poc/drug_data_000.gz'
    IAM_ROLE 'arn:aws:iam::<AWSAccount>:role/RedshiftMLRole' 
    gzip;

Create model

Now that the data setup part is done, let’s create the model in Redshift ML. Then CREATE MODEL runs in the background and you can track progress using SHOW MODEL model_name;.

For a data analyst who is not quite conversant with machine learning, the CREATE MODEL statement is a powerhouse that offers flexibility in the number of options used to create the model. In our current use case, we haven’t passed the model type as a multi-classification model or any other options but based on the input data. The Redshift ML CREATE MODEL statement can select the correct problem type and other associated parameters using Autopilot. Multi-class classification is a problem type that predicts one of many outcomes, such as predicting a rating a customer might give for a product. In our example, we predict therapeutic conditions such as acne, anti-clotting therapy, asthma, or COPD for different patients. Data scientists and ML experts can use it to perform supervised learning to tackle problems ranging from forecasting, personalization, or customer churn prediction. See the following code:

--Create model using 130 K records (80% Training Data)
CREATE MODEL drug_ml.predict_model_drug_therapeutic_condition
FROM (
	SELECT *
	FROM drug_ml.ml_drug_data
	WHERE mrx_therapeutic_condition IS NOT NULL
		AND record_nbr < 130001
	) TARGET mrx_therapeutic_condition FUNCTION predict_drug_therapeutic_condition IAM_ROLE 'Replace with your IAM Role ARN' SETTINGS (S3_BUCKET 'Replace with your bucket name');

The target (label) in the preceding code is the mrx_therapeutic_condition column, which is used for prediction, and the function that is created out of this CREATE MODEL command is named predict_drug_therapeutic_condition.

The training data comes from the table ml_drug_data, and Autopilot automatically detects the multi-classification value model type based on input data.
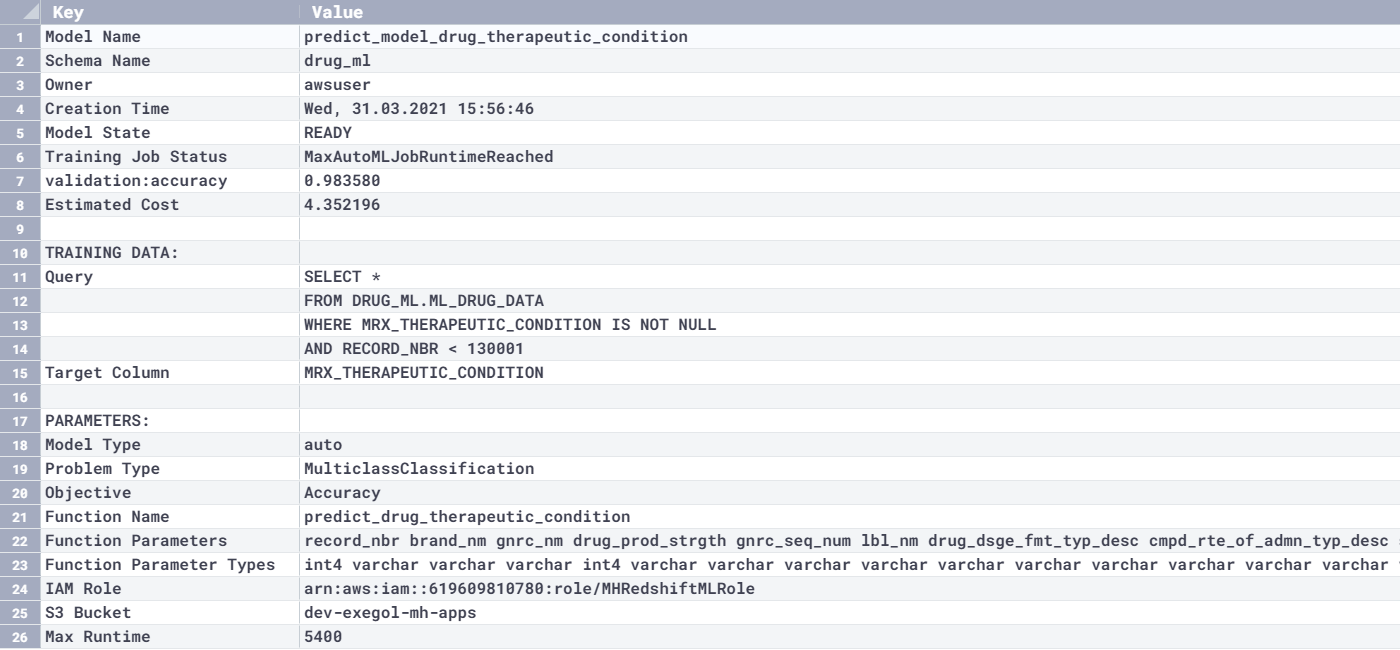
Show model

The command show model model_name; is used to track the progress and also to get more details about a model (see the following example code). This section contains a representative output from SHOW MODEL after CREATE MODEL is complete. It has the inputs used in the CREATE MODEL statement with more information like model state (TRAINING, READY, FAILED) and the maximum estimated runtime it will take to finish. For better accuracy for predictions, we recommend letting the model finish to completion by increasing the default timeout value (the default is actually short for better accuracy). There is also an option to use CREATE MODEL, which lets the user limit the maximum runtime to a lower number, but the more runtime you have for CREATE MODEL, more it gets to train and iterate using multiple options before settling in on the best model.

--to show the model

SHOW MODEL drug_ml.predict_model_drug_therapeutic_condition;

The following table shows our results.

Inference

For binary and multi-class classification problems, we compute the accuracy as the model metric. We use the following formula to determine the accuracy:

accuracy = (sum (actual == predicted)/total) *100

We use the newly created function predict_drug_therapeutic_condition for the prediction and use the columns other than the target (label) as the input:

-- check accuracy
WITH infer_data AS (
SELECT mrx_therapeutic_condition AS label
,drug_ml.predict_drug_therapeutic_condition(record_nbr , brand_nm, gnrc_nm, drug_prod_strgth , gnrc_seq_num, lbl_nm , drug_dsge_fmt_typ_desc , cmpd_rte_of_admn_typ_desc , specif_thrputic_ingrd_clss_typ , hicl_seq_num, ndc_id , mfc_obsolete_dt , hcfa_termnatn_dt , specif_thrputic_ingrd_clss_desc, gpi14code, druggroup  , drugclass , drugsubclass, brandname) AS predicted,
CASE
WHEN label IS NULL
THEN 'N/A'
ELSE label
END AS actual,
CASE
WHEN actual = predicted
THEN 1::INT
ELSE 0::INT
END AS correct
FROM DRUG_ML.ML_DRUG_DATA),
aggr_data AS (
SELECT SUM(correct) AS num_correct,
COUNT(*) AS total
FROM infer_data)
SELECT (num_correct::FLOAT / total::FLOAT) AS accuracy FROM aggr_data;

--output of above query
accuracy
-------------------
0.975466558808845
(1 row)

The inference query output (0.9923 *100 = 99.23 %) matches the output from the show model command.

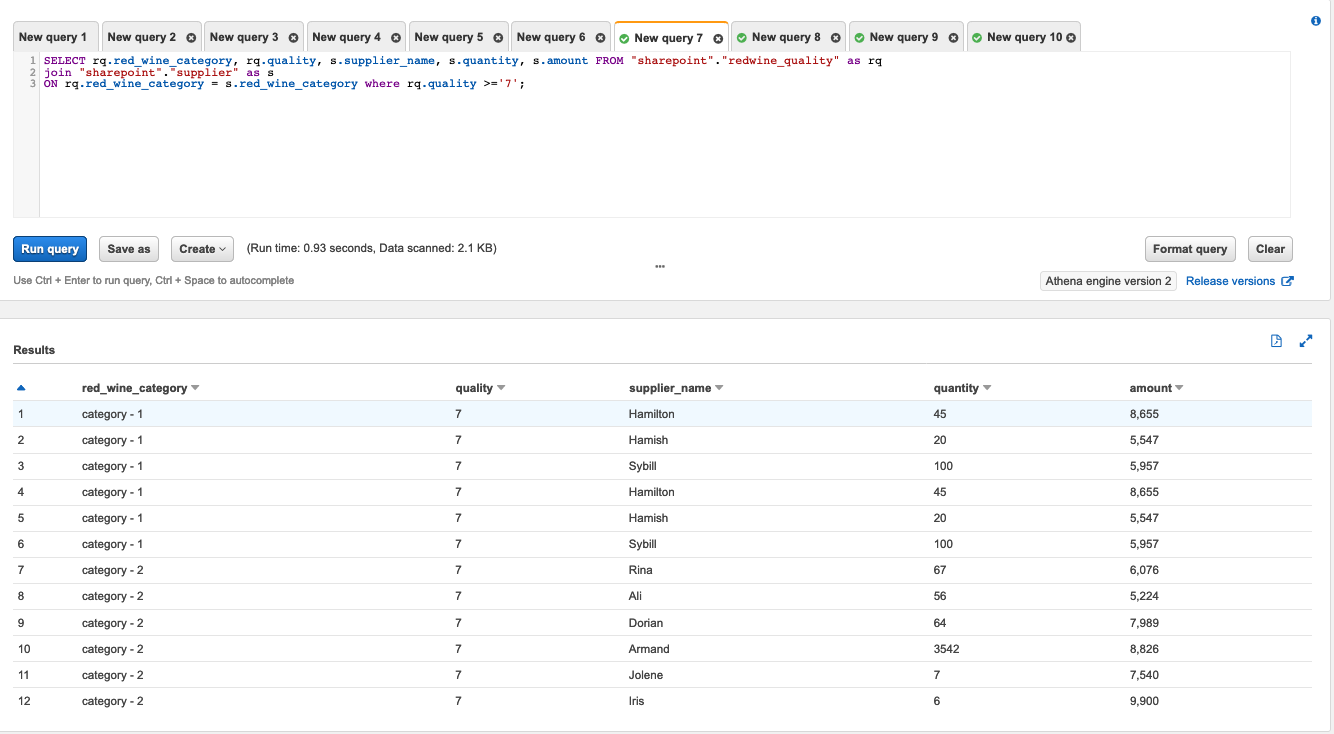
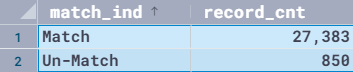
Let’s run the prediction query on therapeutic condition to get the count of original vs. ML-predicted values for accuracy comparison:

--check prediction 
WITH infer_data
AS (
	SELECT mrx_therapeutic_condition
		,drug_ml.predict_drug_therapeutic_condition(m.record_nbr, m.brand_nm, m.gnrc_nm, m.drug_prod_strgth, m.gnrc_seq_num, Other Params) AS predicted
	FROM "DRUG_ML"."ML_DRUG_DATA" m
	WHERE mrx_therapeutic_condition IS NOT NULL
		AND record_nbr >= 130001
	)
SELECT CASE 
		WHEN mrx_therapeutic_condition = predicted
			THEN 'Match'
		ELSE 'Un-Match'
		END AS match_ind
	,count(1) AS record_cnt
FROM infer_data
GROUP BY 1;

The following table shows our output.

Conclusion

Redshift ML allows us to develop greater efficiency and enhanced ability to generate MRx therapeutic conditions, especially when new drugs come to market. Redshift ML provides an easy and seamless platform for database users to create, train, and tune models using a SQL interface. ML capabilities empower Amazon Redshift users to create models and deploy them locally on large datasets, which was an arduous task before. Different user personas, from data analysts to advanced data science and ML experts, can take advantage of Redshift ML for machine learning based predictions and gain valuable business insights.


About the Authors

Karim Prasla, Pharm D, MS, BCPS, is a clinician and a health economist focused on optimizing use of data, analytics, and insights to improve patient care and drive positive clinical and economic outcomes. Karim leads a talented team of clinicians, economists, health outcomes scientists, and data analysts at Magellan Rx Management who are passionate about leveraging data analytics to develop products and solutions that provide proactive insights to deliver value to clinicians, customers, and members.


Deepti Bhanti, PhD, is an IT leader at Magellan Rx Management with a focus on delivering big data solutions to meet the data and analytics needs for our customers. Deepti leads a full stack team of IT engineers who are passionate about architecting and building scalable solutions while driving business value and market differentiation through technological innovations.


Rajesh Francis is a Sr. Analytics Specialist Solutions Architect at AWS. He specializes in Amazon Redshift and works with customers to build scalable analytic solutions. Rajesh worked with Magellan Rx Management to help implement a lake house architecture and leverage Redshift ML for various use cases.


Satish Sathiya is a Senior Product Engineer at Amazon Redshift. He is an avid big data enthusiast who collaborates with customers around the globe to achieve success and meet their data warehousing and data lake architecture needs. Satish worked with Magellan Rx Management to help jump start ML adoption.


Debu Panda, a principal product manager at AWS, is an industry leader in analytics, application platform, and database technologies and has more than 25 years of experience in the IT world. He was responsible for driving the Amazon Redshift ML feature and working closely with Magellan Rx Management and other customers to incorporate their feedback into the service.

How Comcast uses AWS to rapidly store and analyze large-scale telemetry data

Post Syndicated from Asser Moustafa original https://aws.amazon.com/blogs/big-data/how-comcast-uses-aws-to-rapidly-store-and-analyze-large-scale-telemetry-data/

This blog post is co-written by Russell Harlin from Comcast Corporation.

Comcast Corporation creates incredible technology and entertainment that connects millions of people to the moments and experiences that matter most. At the core of this is Comcast’s high-speed data network, providing tens of millions of customers across the country with reliable internet connectivity. This mission has become more important now than ever.

This post walks through how Comcast used AWS to rapidly store and analyze large-scale telemetry data.

Background

At Comcast, we’re constantly looking for ways to gain new insights into our network and improve the overall quality of service. Doing this effectively can involve scaling solutions to support analytics across our entire network footprint. For this particular project, we wanted an extensible and scalable solution that could process, store, and analyze telemetry reports, one per network device every 5 minutes. This data would then be used to help measure quality of experience and determine where network improvements could be made.

Scaling big data solutions is always challenging, but perhaps the biggest challenge of this project was the accelerated timeline. With 2 weeks to deliver a prototype and an additional month to scale it, we knew we couldn’t go through the traditional bake-off of different technologies, so we had to either go with technologies we were comfortable with or proven managed solutions.

For the data streaming pipeline, we already had the telemetry data coming in on an Apache Kafka topic, and had significant prior experience using Kafka combined with Apache Flink to implement and scale streaming pipelines, so we decided to go with what we knew. For the data storage and analytics, we needed a suite of solutions that could scale quickly, had plenty of support, and had an ecosystem of well-integrated tools to solve any problem that might arise. This is where AWS was able to meet our needs with technologies like Amazon Simple Storage Service (Amazon S3), AWS Glue, Amazon Athena, and Amazon Redshift.

Initial architecture

Our initial prototype architecture for the data store needed to be fast and simple so that we could unblock the development of the other elements of the budding telemetry solution. We needed three key things out of it:

  • The ability to easily fetch raw telemetry records and run more complex analytical queries
  • The capacity to integrate seamlessly with the other pieces of the pipeline
  • The possibility that it could serve as a springboard to a more scalable long-term solution

The first instinct was to explore solutions we used in the past. We had positive experiences with using nosql databases, like Cassandra, to store and serve raw data records, but it was clear these wouldn’t meet our need for running ad hoc analytical queries. Likewise, we had experience with more flexible RDBMs, like Postgres, for handling more complicated queries, but we knew that those wouldn’t scale to meet our requirement to store tens to hundreds of billions of rows. Therefore, any prototyping with one of these approaches would be considered throwaway work.

After moving on from these solutions, we quickly settled on using Amazon S3 with Athena. Amazon S3 provides low-cost storage with near-limitless scaling, so we knew we could store as much historical data as required and Athena would provide serverless, on-demand querying of our data. Additionally, Amazon S3 is known to be a launching pad to many other data store solutions both inside and outside the AWS ecosystem. This was perfect for the exploratory prototyping phase.

Integrating it into the rest of our pipeline would also prove simple. Writing the data to Amazon S3 from our Flink job was straightforward and could be done using the readily available Flink streaming file sink with an Amazon S3 bucket as the destination. When the data was available in Amazon S3, we ran AWS Glue to index our Parquet-formatted data and generate schemas in the AWS Glue metastore for searching using Athena with standard SQL.

The following diagram illustrates this architecture.

Using Amazon S3 and Athena allowed us to quickly unblock development of our Flink pipeline and ensure that the data being passed through was correct. Additionally, we used the AWS SDK to connect to Athena from our northbound Golang microservice and provide REST API access to our data for our custom web application. This allowed us to prove out an end-to-end solution with almost no upfront cost and very minimal infrastructure.

Updated architecture

As application and service development proceeded, it became apparent that Amazon Athena performed for developers running ad hoc queries, but wasn’t going to work as a long-term responsive backend for our microservices and user interface requirements.

One of the primary use cases of this solution was to look at device-level telemetry reports for a period of time and plot and track different aspects of their quality of experience. Because this most often involves solving problems happening in the now, we needed an improved data store for the most recent hot data.

This led us to Amazon Redshift. Amazon Redshift requires loading the data into a dedicated cluster and formulating a schema tuned for your use cases.

The following diagram illustrates this updated architecture.

Data loading and storage requirements

For loading and storing the data in Amazon Redshift, we had a few fundamental requirements:

  • Because our Amazon Redshift solution would be for querying data to troubleshoot problems happening as recent as the current hour, we needed to minimize the latency of the data load and keep up with our scale while doing it. We couldn’t live with nightly loads.
  • The pipeline had to be robust and recover from failures automatically.

There’s a lot of nuance that goes into making this happen, and we didn’t want to worry about handling these basic things ourselves, because this wasn’t where we were going to add value. Luckily, because we were already loading the data into Amazon S3, AWS Glue ETL satisfied these requirements and provided a fast, reliable, and scalable solution to do periodic loads from our Amazon S3 data store to our Amazon Redshift cluster.

A huge benefit of AWS Glue ETL is that it provides many opportunities to tune your ETL pipeline to meet your scaling needs. One of our biggest challenges was that we write multiple files to Amazon S3 from different regions every 5 minutes, which results in many small files. If you’re doing infrequent nightly loads, this may not pose a problem, but for our specific use case, we wanted to load data at least every hour and multiple times an hour if possible. This required some specific tuning of the default ETL job:

  • Amazon S3 list implementation – This allows the Spark job to handle files in batches and optimizes reads for a large number of files, preventing out of memory issues.
  • Pushdown predicates – This tells the load to skip listing any partitions in Amazon S3 that you know won’t be a part of the current run. For frequent loads, this can mean skipping a lot of unnecessary file listing during each job run.
  • File grouping – This allows the read from Amazon S3 to group files together in batches when reading from Amazon S3. This greatly improves performance when reading from a large number of small files.
  • AWS Glue 2.0 – When we were starting our development, only AWS Glue 1.0 was available, and we’d frequently see Spark cluster start times of over 10 minutes. This becomes problematic if you want to run the ETL job more frequently because you have to account for the cluster startup time in your trigger timings. When AWS Glue 2.0 came out, those start times consistently dropped to under 1 minute and they became a afterthought.

With these tunings, as well as increasing the parallelism of the job, we could meet our requirement of loading data multiple times an hour. This made relevant data available for analysis sooner.

Modeling, distributing, and sorting the data

Aside from getting the data into the Amazon Redshift cluster in a timely manner, the next consideration was how to model, distribute, and sort the data when it was in the cluster. For our data, we didn’t have a complex setup with tens of tables requiring extensive joins. We simply had two tables: one for the device-level telemetry records and one for records aggregated at a logical grouping.

The bulk of the initial query load would be centered around serving raw records from these tables to our web application. These types of raw record queries aren’t difficult to handle from a query standpoint, but do present challenges when dealing with tens of millions of unique devices and a report granularity of 5 minutes. So we knew we had to tune the database to handle these efficiently. Additionally, we also needed to be able to run more complex ad hoc queries, like getting daily summaries of each table so that higher-level problem areas could be more easily tracked and spotted in the network. These queries, however, were less time sensitive and could be run on an ad hoc, batch-like basis where responsiveness wasn’t as important.

The schema fields themselves were more or less one-to-one mappings from the respective Parquet schemas. The challenge came, however, in picking partition keys and sorting columns. For partition keys, we identified a logical device grouping column present in both our tables as the one column we were likely to join on. This seemed like a natural fit to partition on and had good enough cardinality that our distribution would be adequate.

For the sorting keys, we knew we’d be searching by the device identifier and the logical grouping; for the respective tables, and we knew we’d be searching temporally. So the primary identifier column of each table and the timestamp made sense to sort on. The documented sort key order suggestion was to use the timestamp column as the first value in the sort key, because it could provide dataset filtering on a specific time period. This initially worked well enough and we were able to get a performance improvement over Athena, but as we scaled and added more data, our raw record retrieval queries were rapidly slowing down. To help with this, we made two adjustments.

The first adjustment came with a change to the sort key. The first part of this involved swapping the order of the timestamp and the primary identifier column. This allowed us to filter down to the device and then search through the range of timestamps on just that device, skipping over all irrelevant devices. This provided significant performance gains and cut our raw record query times by several multiples. The second part of the sort key adjustment involved adding another column (a node-level identifier) to the beginning of the sort key. This allowed us to have one more level of data filtering, which further improved raw record query times.

One trade-off made while making these sort key adjustments was that our more complex aggregation queries had a noticeable decline in performance. This was because they were typically run across the entire footprint of devices and could no longer filter as easily based on time being the first column in the sort key. Fortunately, because these were less frequent and could be run offline if necessary, this performance trade-off was considered acceptable.

If the frequency of these workloads increases, we can use materialized views in Amazon Redshift, which can help avoid unnecessary reruns of the complex aggregations if minimal-to-no data changes in the underlying base tables have occurred since the last run.

The final adjustment was cluster scaling. We chose to use the Amazon Redshift next-generation RA3 nodes for a number of benefits, but three especially key benefits:

  • RA3 clusters allow for practically unlimited storage in our cluster.
  • The RA3 ability to scale storage and compute independently paired really well with our expectations and use cases. We fully expected our Amazon Redshift storage footprint to continue to grow, as well as the number, shape, and sizes of our use cases and users, but data and workloads wouldn’t necessarily grow in lockstep. Being able to scale the cluster’s compute power independent of storage (or vice versa) was a key technical requirement and cost-optimization for us.
  • RA3 clusters come with Amazon Redshift managed storage, which places the burden on Amazon Redshift to automatically situate data based on its temperature for consistently peak performance. With managed storage, hot data was cached on a large local SSD cache in each node, and cold data was kept in the Amazon Redshift persistent store on Amazon S3.

After conducting performance benchmarks, we determined that our cluster was under-powered for the amount of data and workloads it was serving, and we would benefit from greater distribution and parallelism (compute power). We easily resized our Amazon Redshift cluster to double the number of nodes within minutes, and immediately saw a significant performance boost. With this, we were able to recognize that as our data and workloads scaled, so too should our cluster.

Looking forward, we expect that there will be a relatively small population of ad hoc and experimental workloads that will require access to additional datasets sitting in our data lake, outside of Amazon Redshift in our data lake—workloads similar to the Athena workloads we previously observed. To serve that small customer base, we can leverage Amazon Redshift Spectrum, which empowers users to run SQL queries on external tables in our data lake, similar to SQL queries on any other table within Amazon Redshift, while allowing us to keep costs as lean as possible.

This final architecture provided us with the solid foundation of price, performance, and flexibility for our current set of analytical use cases—and, just as important, the future use cases that haven’t shown themselves yet.

Summary

This post details how Comcast leveraged AWS data store technologies to prototype and scale the serving and analysis of large-scale telemetry data. We hope to continue to scale the solution as our customer base grows. We’re currently working on identifying more telemetry-related metrics to give us increased insight into our network and deliver the best quality of experience possible to our customers.


About the Authors

Russell Harlin is a Senior Software Engineer at Comcast based out of the San Francisco Bay Area. He works in the Network and Communications Engineering group designing and implementing data streaming and analytics solutions.


Asser Moustafa is an Analytics Specialist Solutions Architect at AWS based out of Dallas, Texas. He advises customers in the Americas on their Amazon Redshift and data lake architectures and migrations, starting from the POC stage to actual production deployment and maintenance


Amit Kalawat is a Senior Solutions Architect at Amazon Web Services based out of New York. He works with enterprise customers as they transform their business and journey to the cloud.