There’s a new open-source plugin that snapshots your OpenClaw config, memory, and sessions to B2. It’s designed to be as simple as possible: Three fields to configure. Rollback from chat. Migrate to a new machine in one restart.
Let’s get into how and why you might want to use it.
OpenClaw keeps everything local. That’s great until it isn’t.
Your config, sessions, memory databases, hooks, cron jobs—everything that makes your OpenClaw instance yours lives on one machine with no built-in redundancy. Compaction can rewrite session transcripts and cause memory loss. A bad config edit or an accidental deletion means rebuilding from scratch: re-onboarding channels, re-pairing devices, re-teaching your agent who you are.
openclaw-b2-backup adds automatic encrypted backups to Backblaze B2 without changing how you use OpenClaw.
Three fields and you’re done
Setup is intentionally minimal:
openclaw plugins install openclaw-b2-backup
Then open ~/.openclaw/openclaw.json and add your B2 credentials to the entry the installer created:
Restart the gateway, and you’re done. Region is auto-detected from your application key. Encryption is on by default. The first backup runs at midnight, and then daily after that. You can change the schedule to weekly or any cron expression you like.
Free tier friendly: Backblaze B2 includes 10GB of free storage. A typical OpenClaw state directory is 50–500 MB, so even with 10 encrypted snapshots retained, you’ll comfortably stay within the free tier.
Backups that actually happen
The hardest part of any backup system is remembering to run it. This plugin takes care of that with multiple automatic triggers:
A daily cron job (configurable) runs a full incremental push at midnight.
Every time you shut down the gateway, a final push runs before exit—so you always have a snapshot of your latest state.
And, before compaction fires (the thing that rewrites your session transcripts and can cause memory loss), the plugin automatically pushes a snapshot. That last one is the one you’ll be most grateful for.
There’s a 5-minute debounce on the compaction trigger, so rapid-fire compactions don’t queue up a dozen pushes.
Rolling back from chat
The plugin registers a b2_rollback tool with your agent, which means you can manage backups conversationally. Just tell your agent:
“Show me my B2 backup snapshots”
And it’ll list all available snapshots with timestamps. To restore one:
“Roll back to the snapshot from before compaction”Before any restore, the plugin automatically creates a safety snapshot of your current state. Safety snapshots are stored separately and never auto-pruned, so you can always recover from a bad rollback. It’s an undo for your undo.
Moving to a new machine
This was one of the most requested use cases: Getting your entire OpenClaw setup onto a new machine without manually copying files and hoping you got everything.
Install the plugin on your new machine, add the same B2 credentials, and restart. The plugin detects the empty state directory, finds your existing snapshots in B2, and automatically restores the latest one. Same memory, same sessions, same config, same personality. No manual file copying.
openclaw plugins install openclaw-b2-backup # Add your B2 config to openclaw.json openclaw gateway restart # Plugin detects empty state + existing snapshots → auto-restores latest
Security by default
Everything is AES-256-GCM encrypted before it leaves your machine. Each file gets a random salt and IV, so identical files produce different ciphertext. The encryption key is derived from your B2 application key via scrypt—no separate key to manage or lose.
Manifests (which contain only file paths and SHA-256 hashes) stay unencrypted so incremental diffing works regardless of encryption. Credentials and auth profiles are excluded from sync by design—secrets stay per-machine, and you re-auth on new machines.
Best practice: Use a B2 application key scoped to a single bucket for least-privilege access. The plugin works perfectly with bucket-scoped keys—region is auto-detected from the authorize response.
Zero external dependencies
The plugin has no external runtime dependencies beyond croner for scheduling. The B2 client is a hand-rolled AWS Signature V4 implementation using only node:crypto. No AWS SDK, no S3 library, no heavyweight dependencies to audit or keep updated.
It runs entirely inside the gateway process—no external scripts, no separate cron daemon, no stopping the gateway to take backups.
Get started
The plugin is open source (under the MIT license) and available now:
Backblaze Computer Backup is designed to be simple: install it, and it runs in the background protecting data. For many businesses, that’s enough.
But, IT teams managing large deployments asked for more control over how backup is configured across their environments. We are now introducing two new tools built specifically for that need: Advanced Installer and the Backblaze Command Line Interface, bzcli.
What it does
The Advanced Installer gives IT teams a way to preconfigure and lock down certain client settings during rollout. That means when Backblaze is installed on an employee’s machine, it already has the company’s preferred settings in place—no need for end users to make adjustments.
Admins can:
Lock schedules so backups always run at the right time.
Manage exclusions centrally, avoiding the risk of someone skipping important folders.
Control security preferences to keep things consistent across the organization.
Suppress non-essential desktop notifications.
Instead of configuring machines individually or correcting settings after deployment, IT teams can define standards once and apply them consistently.
For organizations that frequently onboard employees, manage distributed teams, or provide backup as part of a managed service, this reduces variability and support overhead.
Bzcli: Remote configuration and reporting for RMM environments
In addition to the Advanced Installer, Backblaze Computer Backup will have access to bzcli, a new command-line interface designed for enterprise IT teams using RMM and MDM platforms.
Until now, Backblaze’s command-line support focused primarily on installation. Once deployed, there wasn’t a structured way for administrators to modify configuration settings or retrieve information remotely through automation tools. Bzcli addresses that gap.
Configure after installation
With bzcli, administrators can update client configuration settings after deployment using a structured JSON input file.
It supports the same settings available through the Advanced Installer and Preferences interface, including:
Backup schedules
Exclusions
Network controls
Security-related preferences
Notification behavior
This allows IT teams to adjust policies centrally without requiring user interaction.
Designed for automation
Bzcli uses a command-based structure (for example, bzcli configure and bzcli report) with clear flags and predictable output. It’s designed to work cleanly within scripts and automation workflows. The tool is cross-platform and included as part of the standard client installation on both Mac and Windows. It is intended to support environments using tools such as Jamf, Kandji, Addigy, and Microsoft Intune.
Why it matters
As organizations grow, consistency becomes more important. Backup policies need to be enforced reliably. Configuration drift creates risk. Unnecessary notifications create noise.
Advanced Installer and bzcli are designed to reduce that friction.
IT teams can define standards once, apply them consistently, and adjust them when needed, without manual intervention on individual machines.
For teams responsible for protecting company data across large environments, that added control makes deployment more predictable and ongoing management simpler.
Get started with a free 14-day trial of Backblaze Computer Backup today. Or, contact our Sales team to talk about your enterprise deployment today.
Every neocloud in the market right now is winning or losing on the same battlefield: GPUs. Availability, performance, price per hour. That’s the game, and it’s the right game to play.
But there’s a problem compounding underneath it, one that doesn’t show up in benchmark reports or investor decks, and one that customers will eventually force platforms to confront—neoclouds need highly available, performant storage so that GPUs are never waiting on data.
Neocloud customers need more than compute
Cloud storage isn’t adjacent to what neoclouds sell—for buyers, it’s the difference between a complete platform and a partial one. Neocloud customers need:
Somewhere to put a 10PB training dataset before it touches WEKA, VAST, or DDN boxes
Persistent storage for model checkpoints between training runs
A place for production inference pipelines to pull weights from at scale, fast enough that GPU nodes aren’t sitting idle waiting on data
Most platforms know this. The ones that are honest about it will also tell what happened when they tried to solve it: Engineering sprints planned around storage tooling that competed directly with GPU roadmap work. Ops overhead for infrastructure that customers take for granted when it’s working and blame the platform for when it’s not. Capital allocated to storage hardware and the teams to manage it.
The platforms that figured this out first didn’t hire their way through the problem. They stopped building storage and started shipping it.
Introducing B2 Neo
That’s the insight behind Backblaze B2 Neo. We built it in direct collaboration with the neocloud operators already utilizing Backlaze in production. The result is a white label cloud storage backbone that neoclouds can launch as a native extension of their platform. Here’s what that means in practice:
Up to 1Tbps throughput: Storage that keeps GPU clusters fed and AI workflows moving without becoming the bottleneck.
Launch under your own brand: Branded endpoints, partner-controlled pricing, and a native customer experience that keeps the platform front and center.
API-driven provisioning: Provision accounts, manage permissions, and handle billing through existing platform tools without a separate console or manual setup.
17 years of operational maturity and exabyte scale expertise: Enterprise durability and reliability that customers expect, operated by Backblaze so internal teams don’t have to.
It doesn’t require a storage team. It doesn’t compete with the GPU roadmap. And it doesn’t route customers away from neocloud platforms where their workflows slowly migrate away.
Already in production with leading platforms
Multiple neoclouds are already using B2 Neo. It’s infrastructure that’s already handling AI training workloads, high performance compute (HPC) pipelines, and media delivery at scale and the platforms already running it are direct about why they made the call.
One global edge services platform, after a rigorous technical and business evaluation, put it this way: Their customers were demanding cost-effective yet performant storage as their AI business scaled and Backblaze gave them the ability to deliver cloud object storage as a native extension of their own platform without taking focus away from their roadmap.
Rob Strechay, Principal Analyst at Smuget & theCUBE Research, framed it simply:
With B2 Neo as a first-party service offering to neoclouds, I see the advantage for those organizations of being able to turn on cloud storage without the toil and expense of building it themselves. It is a near-instant value-add offering, helping their customers control costs and achieve the ROI of AI faster.
The question for the rest of the market is how many more quarters of DIY storage ops—or hyperscaler dependency—they can absorb while competitors ship that outcome instead.
B2 Neo is available now. If you’re building a neocloud and storage is either a distraction or a gap, I’d encourage you to talk to us.
The Backblaze Flameflower Startup Program is here, and it’s built by people who’ve been burned before (and that’s a good thing for you).
Startups don’t fail because they pick the wrong cloud storage provider.
They fail because everything else is already hard enough, and infrastructure quietly becomes the thing that slows them down, surprises them, or blows up their budget at exactly the wrong moment.
That’s why we’re launching Flamethrower, the new startup program from Backblaze.
It’s not a gimmick. It’s not a lead trap. And it definitely doesn’t bring the “here’s some credits, good luck” energy.
Flamethrower exists for one simple reason: Founders deserve storage infrastructure that helps them move faster, not learn expensive lessons the hard way.
Why Flamethrower exists
Why Flamethrower?
Startups don’t need more friction, they need a way through it. Metaphor-wise, flames have always been a part of Backblaze’s DNA, and we want this program to speak to the strongest parts of that fire: speed when you need it, reliability when it counts, and power to scale without drama.
Flamethrower takes these ideas and applies it directly to startups, burning away the biggest blockers between you and your next milestone.
I’ve spent most of my career in and around startups, as a founder, an operator, a partner, a mentor, and occasionally as the person explaining to a CFO why last month’s cloud bill looked like a typo.
I’ve seen the pattern repeat over and over:
Early teams optimize for speed (correct)
Infrastructure decisions get made quickly (also correct)
Those decisions quietly become very sticky
And later… someone realizes storage costs are now a board-level discussion
Flamethrower is designed to meet teams before that moment, making your architecture deliberate, not accidental.
Not with abstract promises, but with:
Real infrastructure used in real production environments
Credits that actually help you get to product-market fit
And access to real, live humans who understand what it’s like to build under pressure
Documentation should be written by people who actually use the product
And success shouldn’t be punished with surprise bills
That mindset is exactly why Flamethrower fits here.
This isn’t a side project. It’s an extension of how Backblaze already works with developers and builders, just with a little more gas on the fire (if you will).
I’ve spent years building and running startup programs, developer ecosystems, partnerships, and learning, sometimes painfully, what not to do. I’ve been on the receiving end of “exciting programs” that turned out to be mostly slide decks.
Flamethrower is my attempt (with a very smart team) to build the kind of program I wish existed when I was earlier in my career: practical, honest, and actually useful.
No heroics. No silver bullets. Just support where it counts.
Today, we’re announcing the general availability of Amazon Elastic Compute Cloud (Amazon EC2) Hpc8a instances, a new high performance computing (HPC) optimized instance type powered by latest 5th Generation AMD EPYC processors with a maximum frequency of up to 4.5 GHz. These instances are ideal for compute-intensive tightly coupled HPC workloads, including computational fluid dynamics, simulations for faster design iterations, high-resolution weather modeling within tight operational windows, and complex crash simulations that require rapid time-to-results.
The new Hpc8a instances deliver up to 40% higher performance, 42% greater memory bandwidth, and up to 25% better price-performance compared to previous generation Hpc7a instances. Customers benefit from the high core density, memory bandwidth, and low-latency networking that helped them scale efficiently and reduce job completion times for their compute-intensive simulation workloads.
Hpc8a instances Hpc8a instances are available with 192 cores, 768 GiB memory, and 300 Gbps Elastic Fabric Adapter (EFA) networking to run applications requiring high levels of inter node communications at scale.
Instance Name
Physical Cores
Memory (Gib)
EFA Network Bandwidth (Gbps)
Network Bandwidth (Gbps)
Attached Storage
Hpc8a.96xlarge
192
768
Up to 300
75
EBS Only
Hpc8a instances are available in a single 96xlarge size with a 1:4 core-to-memory ratio. You will have the capability to right size based on HPC workload requirements by customizing the number of cores needed at launch instances. These instances also use sixth-generation AWS Nitro cards, which offload CPU virtualization, storage, and networking functions to dedicated hardware and software, enhancing performance and security for your workloads.
You can use Hpc8a instances with AWS ParallelCluster and AWS Parallel Computing Service (AWS PCS) to simplify workload submission and cluster creation and Amazon FSx for Lustre for sub-millisecond latencies and up to hundreds of gigabytes per second of throughput for storage. To achieve the best performance for HPC workloads, these instances have Simultaneous Multithreading (SMT) disabled.
Now available Amazon EC2 Hpc8a instances are now available in US East (Ohio) and Europe (Stockholm) AWS Regions. For Regional availability and a future roadmap, search the instance type in the CloudFormation resources tab of AWS Capabilities by Region.
This year marks 13 years of collecting Drive Stats data. Thirteen is an unlucky number (to some), but we count our lucky stars (or perhaps our lucky stats?) that we’ve had 13 years of this experiment.
The traditional 13-year anniversary gift is lace—intricate, impressive, and vulnerable to a snag if you don’t plan ahead to protect the pattern. Systems, like lace, don’t survive by pretending there are no points of vulnerability. When it comes to our infrastructure, we want to build with the snags in mind to create something durable, and the Drive Stats series is always seeking to publish and provide data so that you, too, can go the distance with your drives.
This year-end Drive Stats report looks at Q4 2025, the full year, and the lifetime view with that in mind. I think you’ll find the same things we do: over time, the patterns matter more than any single strand (or drive, to run this lace metaphor into the ground once and for all). Let’s look at the stats.
Drive Stats is here for you
Drive Stats is not a situationship. We’re a conversation and a relationship—to the data. Join the Drive Stats team for our regularly scheduled webinar to walk through the 2025 annualized failure rates, break down the data for interesting trends, and get the latest from the Backblaze drive fleet happenings.
Drive Stats: The digest version
Q4 2025 hard drive failure rates
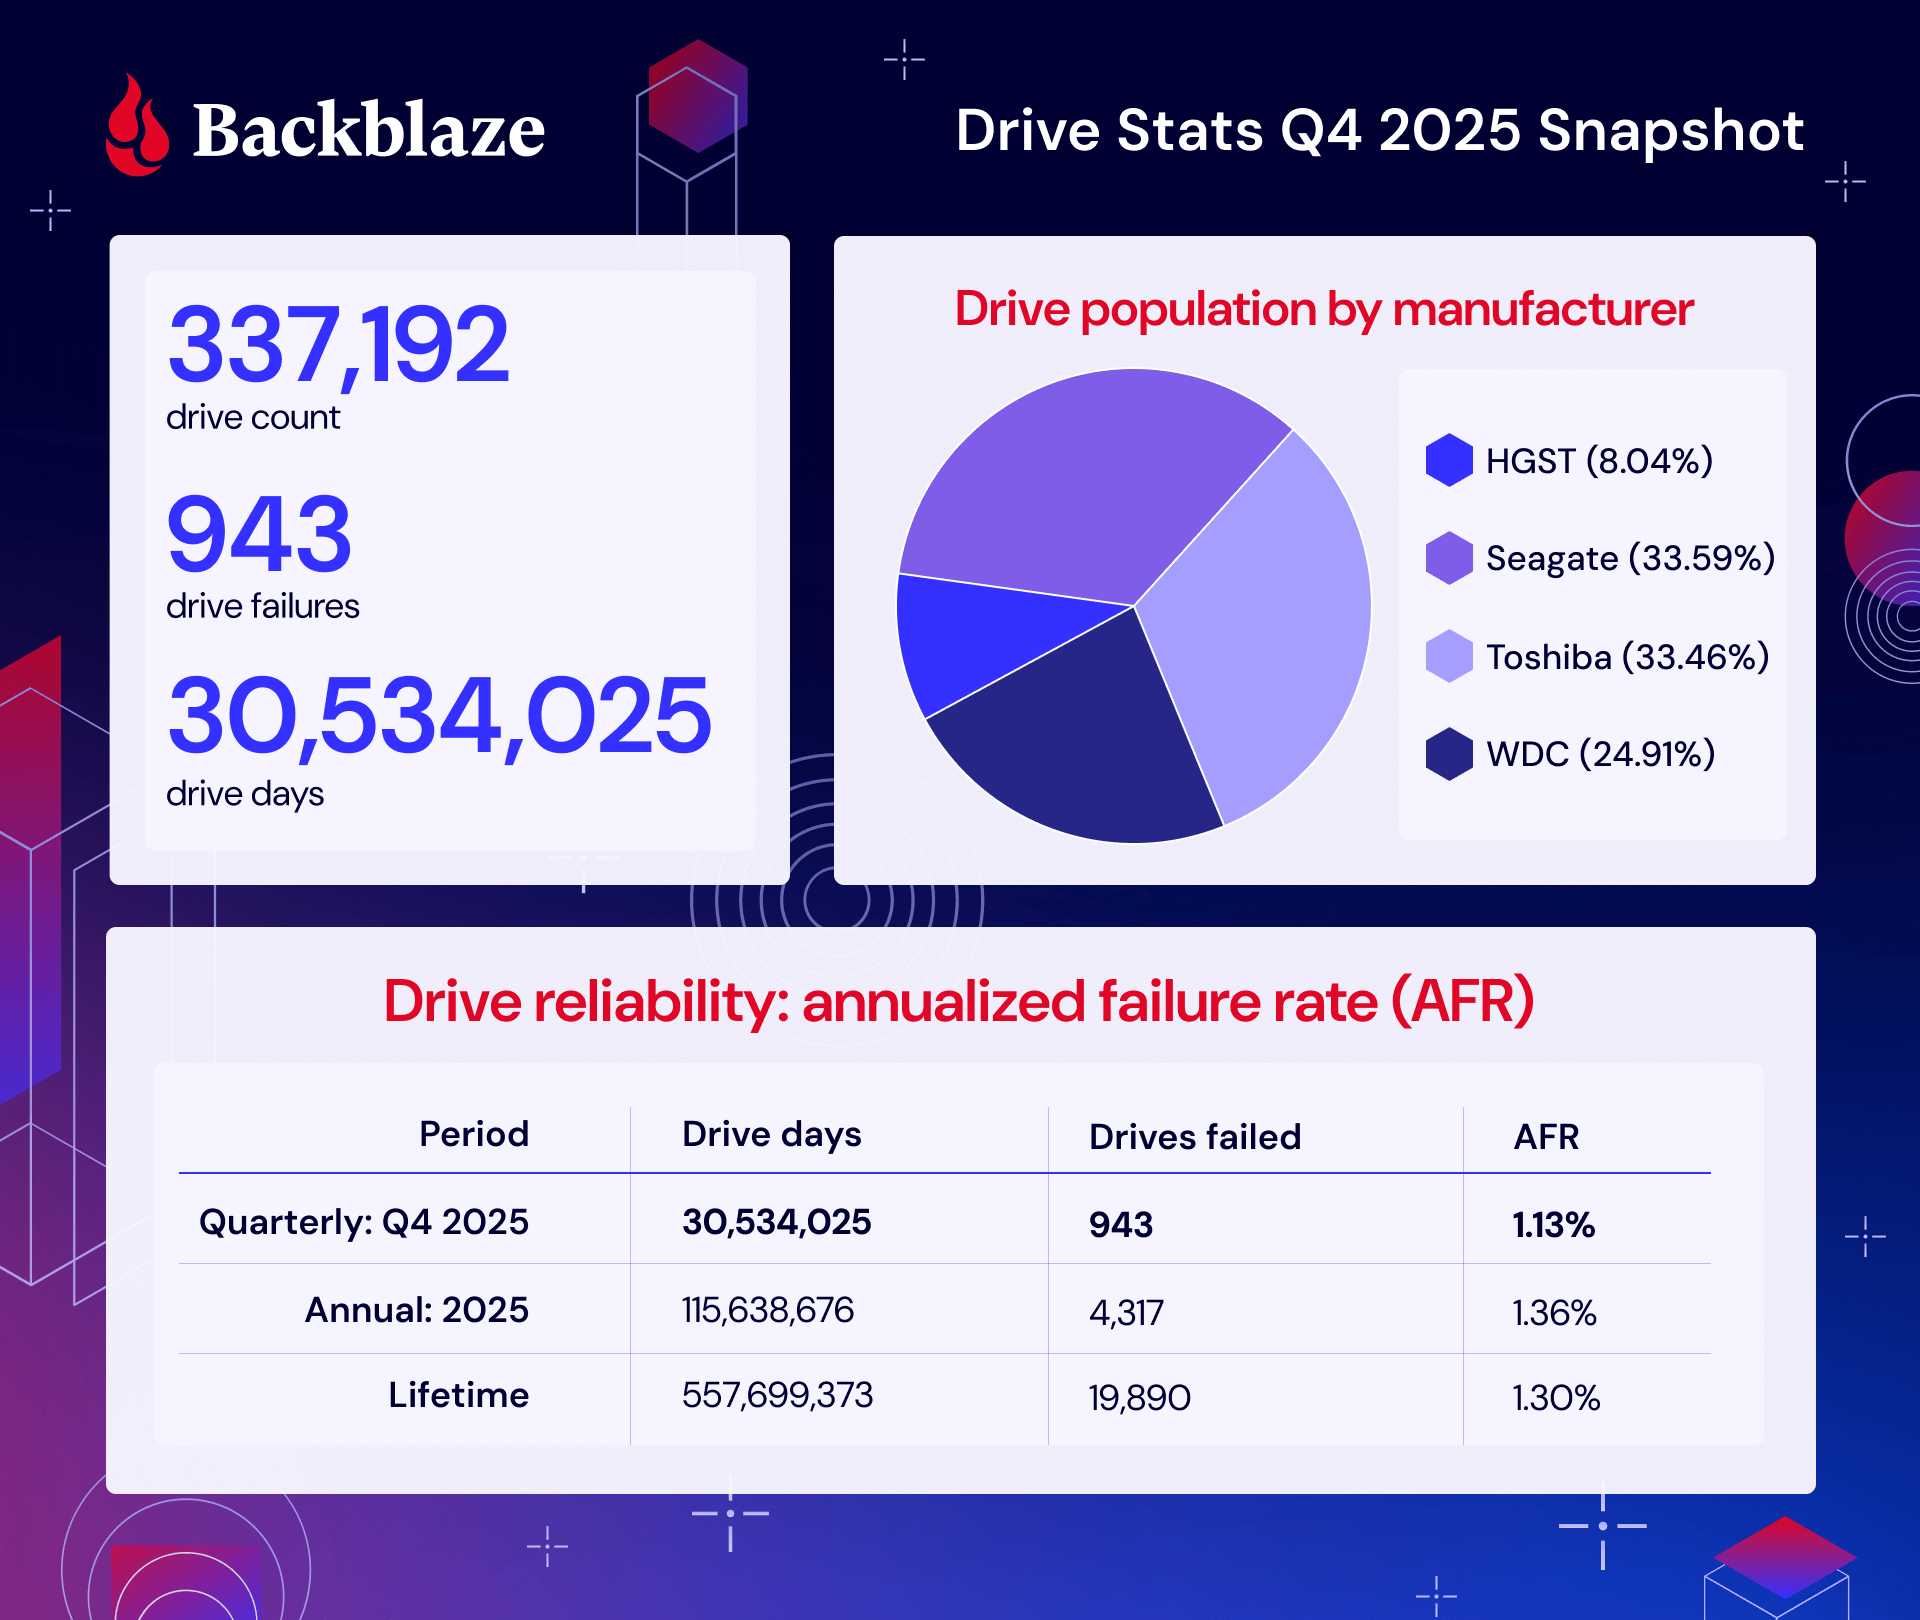
As of the end of 2025, Backblaze was monitoring 341,664 drives used to store data. For our evaluation, we removed from consideration 4,013 boot drives and 459 hard drives, as they did not meet the criteria to be included. We’ll discuss the criteria we used in the next section of this report. Removing these drives leaves us with 337,192 hard drives to analyze. The table below shows the annualized failure rates for Q4 2025 for this collection of drives.
Backblaze Hard Drive Failure Rates for Q4 2025
Reporting period October 1, 2025–December 31, 2025 inclusive Drive models with drive count > 100 as of December 31, 2025 and drive days > 10,000 in Q4 2025.
Note and observations
New drives!
Seagate ST16000NM000J 16TB, with 112 drives
WDC WUH722626ALE6L4 26TB with 1,201 drives. Our first 26TB drive!
The honor roll:
HGST HMS5C4040BLE640 4TB: 1 failure
Seagate ST8000NM000A 8TB: 0 failure
Seagate ST12000NM000J 12TB: 1 failure
Seagate ST16000NM000J 16TB: 1 failure
Seagate ST16000NM002J 16TB: 0 failure
WDC WUH722626ALE6L4 26TB: 1 failure. Shoutout to the new kid—starting off strong!
Red flags:
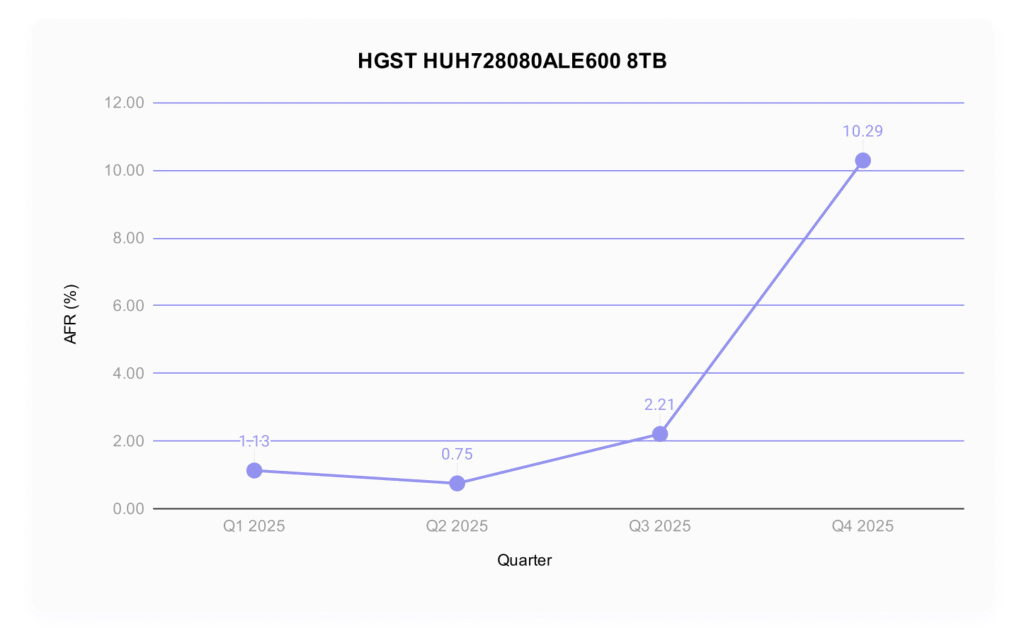
HGST HUH728080ALE600 8TB: 10.29%
Seagate ST10000NM0086 10TB: 5.23%
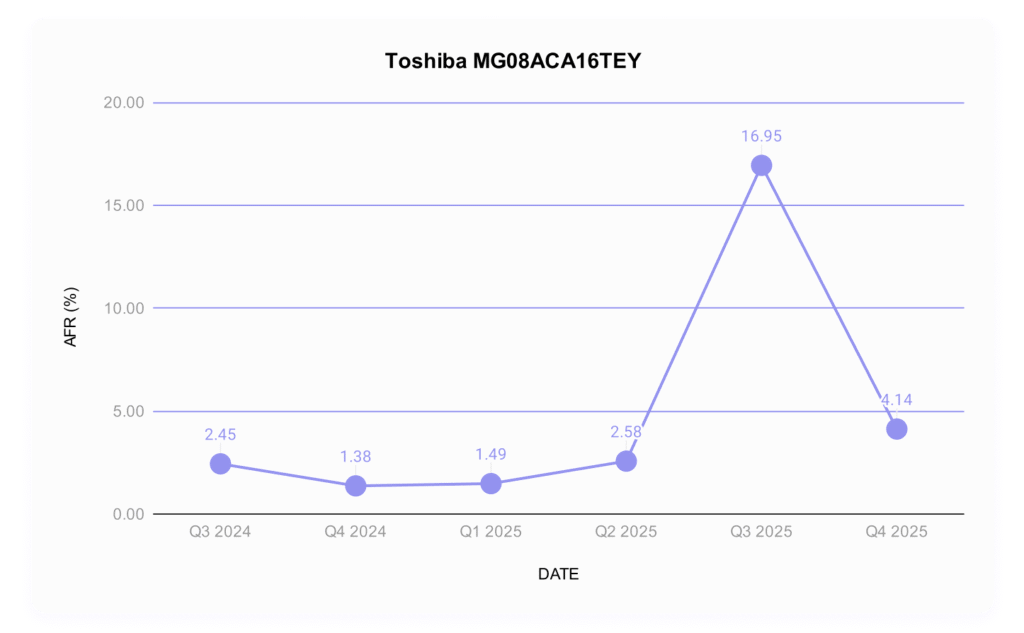
Toshiba MG08ACA16TEY 16TB: 4.14%
We talked about two of these drives last quarter, and what we said about the Seagate still holds true—we’re seeing end of life activity with this drive. But, let’s dig in on the 8TB HGST and 16TB Toshiba and see what’s going on.
HGST HUH728080ALE600 8TB
There’s always some digging to be done when we see a double digit failure rate, especially on a drive that, in the past year, hasn’t had terrible failure rates (despite the fact that it’s about 7.5 years old).
It’s worth contextualizing, first, that the total drive count of this model is 1,073, which equates to less than one Vault. (A standard Vault has 1,200 drives.) While Vaults aren’t always the same drive model, especially with older drives, in an ideal world, those Vaults would be uniform. So, in this case, we’re dealing with drives that are all hanging out in the same location in a data center, which means we could be working with environmental factors like a change in temperature or airflow.
By the time Drive Stats data gets to me, of course, lots of smart people have already seen the disturbances in the force, so to speak. When I dug into the data center work tickets, it turned turned out that folks had already ruled out temperature as a factor—the working theory at the moment is that the drive could be sensitive to vibration, but given the age of these drives, we decided to just flag them for our normal CVT migration process.
Toshiba MG08ACA16TEY 16TB
We talked about this model last quarter because it clocked in at a 16.95% AFR (!!). Our investigation turned up some collaborative (and routine) firmware work with Toshiba, and at that time, we predicted that these failure rates would normalize once again. We’re still a little high, but that’s likely a function of rolling out the work. As predicted, this is a healthy normalization.
Defining the relationship, aka setting some boundaries
We’ve covered the reasons that we’ve designed these exclusions in past reports, but here’s the quick and dirty:
Period
Drive Count
Drive Days
Quarterly
> 100
> 10,000
Annual
> 250
> 50,000
Lifetime
> 500
>100,000
Regardless of whether or not a given drive model is included in this article’s charts and tables, all of the line item data is included in our Drive Stats dataset which you can download by visiting our Drive Stats page.
2025 Annual hard drive failure rates
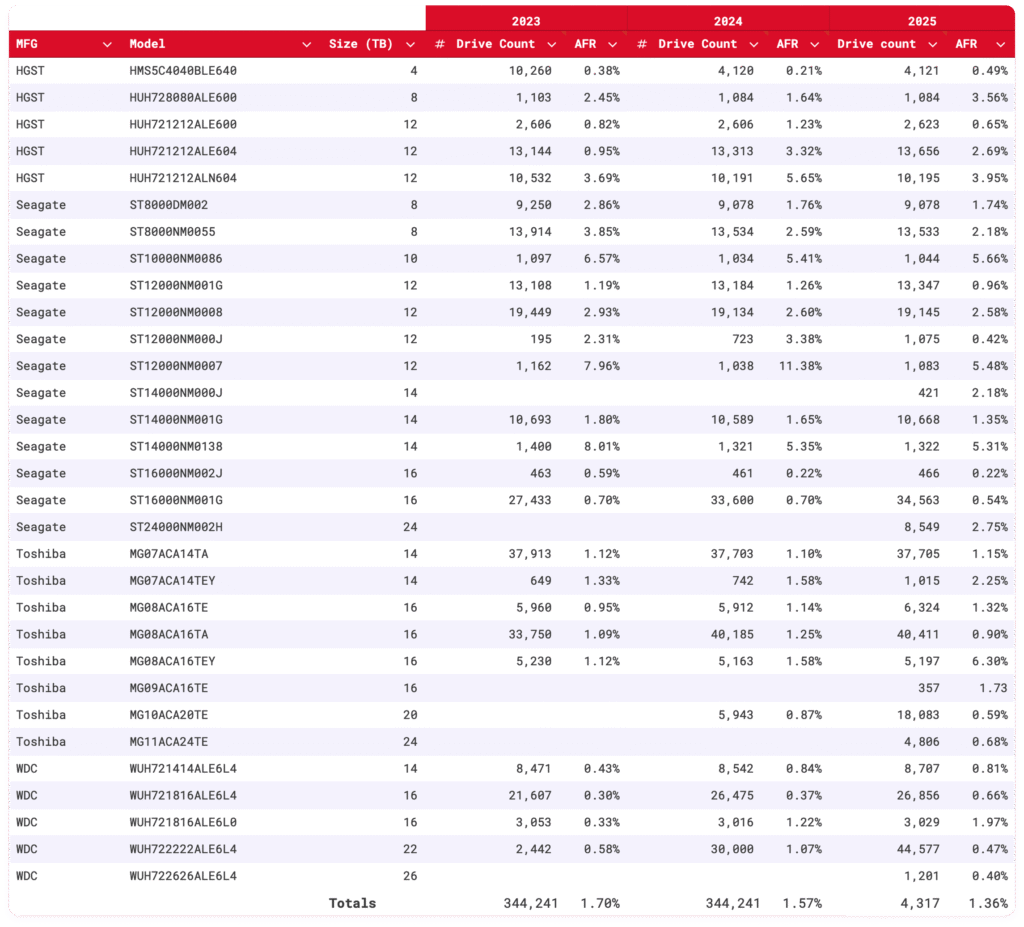
As of the end of 2025, Backblaze was monitoring 349,462 hard drives used to store data. We removed 4,176 boot drives and 1,090 hard drives from consideration as they did not meet the annual criteria we have defined. This leaves us with 344,196 drives divided across 30 different drive models. The table below shows the AFRs for 2025 for this collection of drives.
Backblaze Hard Drive Failure Rates for 2025
Reporting period January 1, 2025–December 31, 2025 inclusive Drive models with drive count > 250 and drive days > 50,000 in 2025
Notes and observations
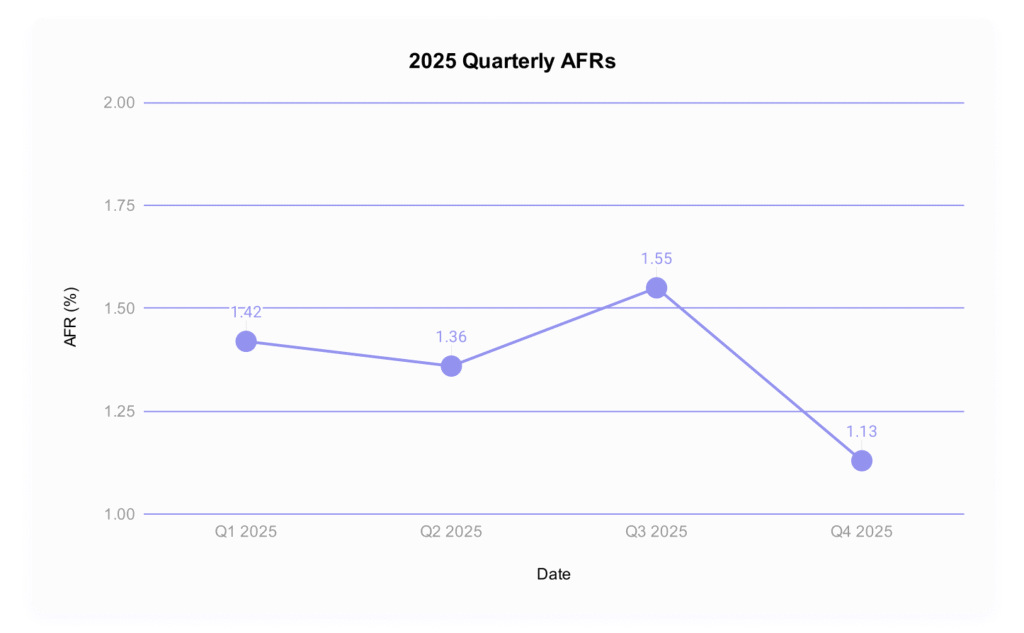
The annual AFR is down: This year finishes strong at 1.36%, down from 1.55% in 2024. Still those paying attention to the quarterly AFR have seen some volatility in that number.
Nobody made it out unscathed: There are zero 0 failures.
But, let’s talk about it: These are the drives that averaged less than two failures per quarter (though, not necessarily evenly distributed when you look at the data).
HGST HMS5C4040BLE640 4TB: 5 failures
Seagate ST12000NM000J 12TB: 4 failures
Seagate ST14000NM000J 14TB: 7 failures
Seagate ST16000NM002J 16TB: 1 failure
Toshiba MG09ACA16TE 16TB: 3 failures
WDC WUH722626ALE6L4 26TB: 1 failures.
Note that this drive is in its first quarter of life, so it’s hard to call this significant yet.
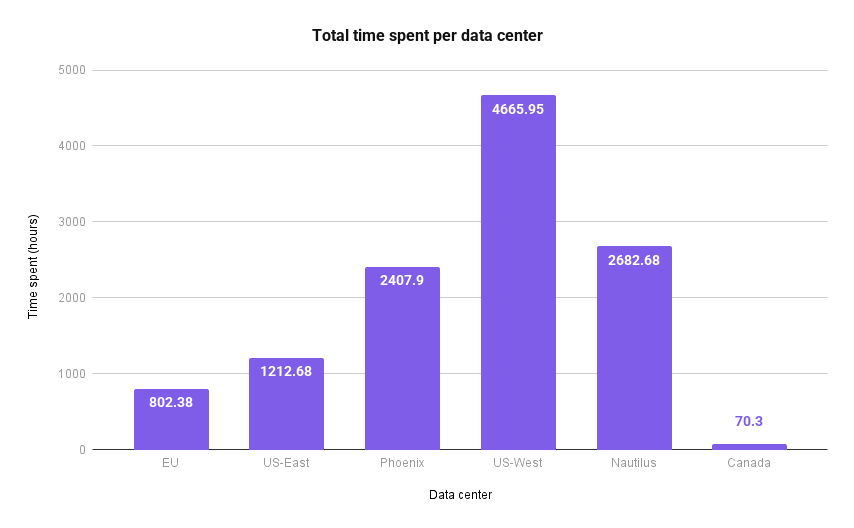
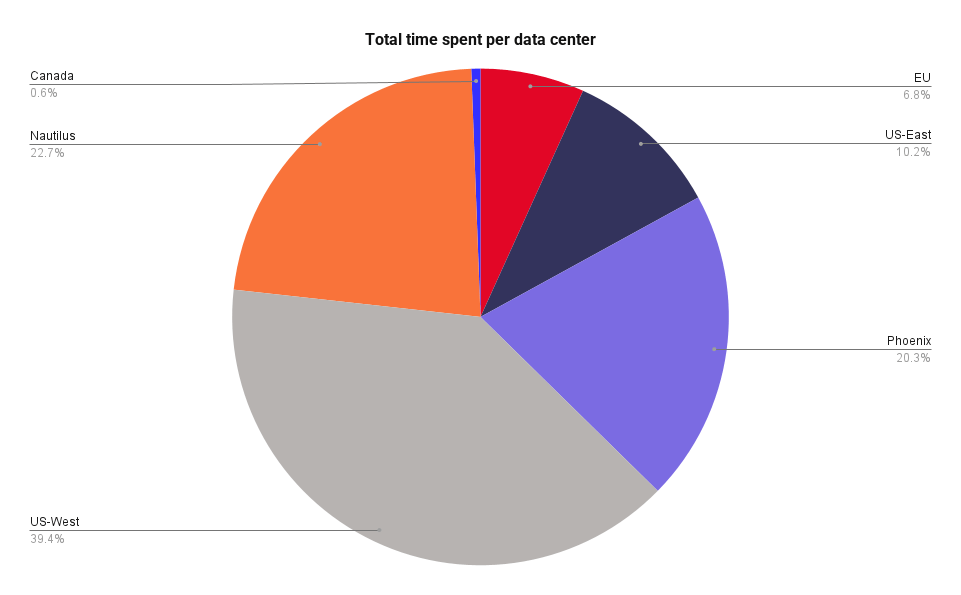
And, all those drive tickets and models mean lots and lots of work—we wrote a whole article on that front, but here’s a breakdown of hours spent in each data center.
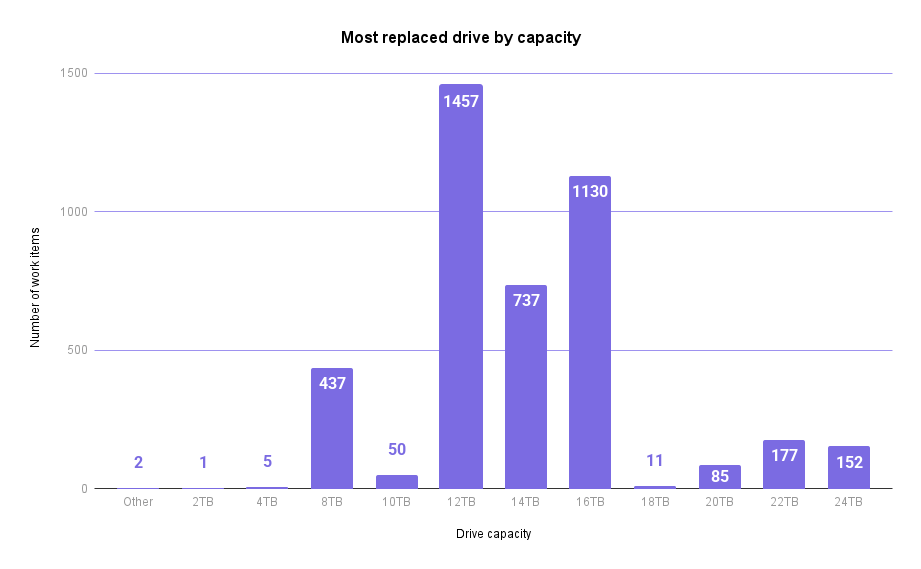
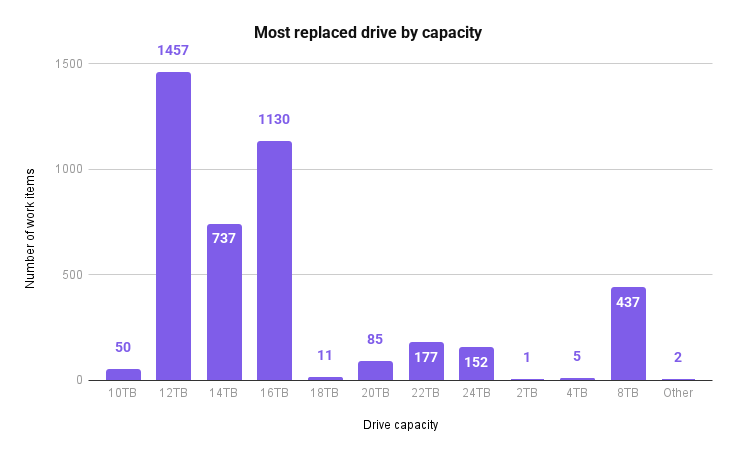
And here’s an even more interesting slice, from a drive perspective:
Yes, you’ll see some funky drive sizes on that list; it’s inclusive of all of our drives, not just the hard drives we include in this report.
Comparing Drive Stats for 2023, 2024, and 2025
Let’s take a look back at the previous years’ annual AFRs to get a sense of how 2025 compares:
Three Year Comparison of Annual Backblaze Hard Drive Failure Rates
For drive models with > 250 drives as of 12/31/25 and drive models with > 50,000 drive days in 2025 Data for each year is inclusive of that year.
Notes and observations
The annual AFR is down to 1.36%. We haven’t seen those numbers since 2022 (1.37%). Cool!
Slicing our data by drive size shows how impactful the shift to high capacity drives really is: based on the current quarterly data, our drive size breakdown looks like this:
0–12TB: 25.13%
14–16TB: 52.06%
20TB+: 22.81%
This is an already long report, so in the interest of time, we’ll just say this: There are multiple factors that go into how and why things are changing, including the average age of drives within our cohort, how much drive technology has improved over the years, how drives on the market have gotten bigger over time while the cost per GB has also dropped, and how the current demand for drives has been changing some of those things.
If that sentence sounds confusing, welcome to the world of enterprise drive buying. But, as always, we have to contextualize the real data we see with the way we source and use drives.
Lifetime hard drive failure rates
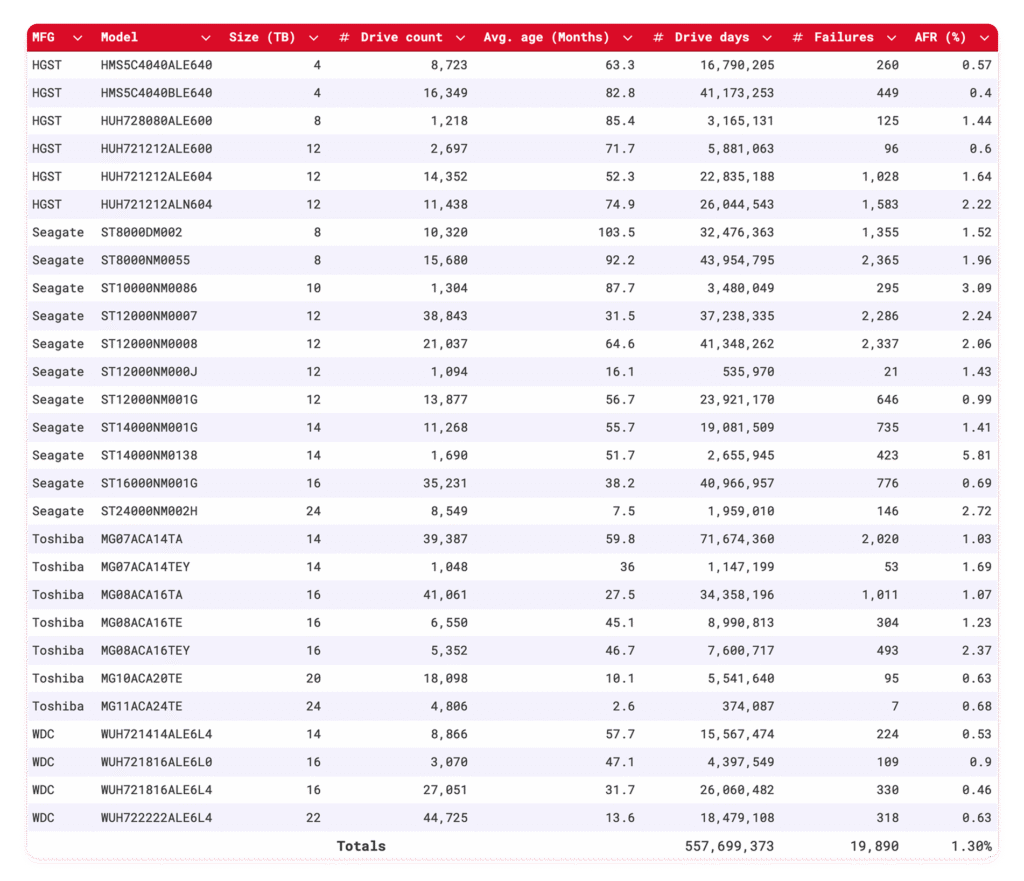
Backblaze Lifetime Hard Drive Failure Rates
Reporting period ending December 31, 2025 inclusive Drive models with > 500 drives and > 100,000 lifetime drive days
Notes and observations
Ol’ faithful: Lifetime AFR is 1.30% this quarter, and there’s been no significant change in that number for quite some time.
Say hi to the new guy: The Toshiba MG11ACA24TE 24TB made the cut for the lifetime table. Last quarter, we deployed another 2,400 of these, bringing us to 4,806 drives total.
The Hard Drive dataset (and beyond)
Thank you, as always, for making it through ~2,500 or so words to examine the fun side of data. Here’s our standard fine print:
The complete dataset used to create the tables and charts in this report is available on our Hard Drive Test Data page. You can download and use this data for free for your own purpose. All we ask are three things:
You cite Backblaze as the source if you use the data;
You accept that you are solely responsible for how you use the data, and;
You do not sell this data itself to anyone; it is free.
If you’re a new Drive Stats fan, consider signing up for the newsletter. If you’re not ready for that kind of commitment, sound off in the comments section below or reach out directly to us to let us know what you’re working on. Happy investigating!
As data footprints swell and multi-cloud strategies become the norm, the complexity of managing object lifecycles—from initial creation to eventual archival or deletion—can introduce significant risk and operational overhead. To help our customers solve for this, we recently announced support for lifecycle rules through S3-compatible APIs.
While the previous post focused on what the feature enables and why it matters, this follow-up will look at how lifecycle rules work at a deeper level and what to keep in mind when using them in production.
Why S3 compatible lifecycle rules matter
Let’s quickly refresh your memory about why this feature matters. Many customers already rely on lifecycle rules in Backblaze B2 to manage storage costs and data retention. These rules automate actions like deleting old objects, hiding previous versions, or cleaning up incomplete multipart uploads.
By adding S3 compatible support for lifecycle rules in Backblaze B2, it allows you:
Lift and shift migrations from AWS S3 to Backblaze B2
Reuse of existing tools, xml configurations, scripts, applications & infrastructure as code
Predictable behavior across environments as part of multi-cloud strategy
API surface area and XML structure
Lifecycle rules are managed using three APIs:
PutBucketLifecycleConfiguration
GetBucketLifecycleConfiguration
DeleteBucketLifecycleConfiguration
These APIs accept and return XML documents that follow the AWS S3 lifecycle configuration format. From a client perspective, this behaves the same way it does on S3, including rule IDs, status flags, filters, and actions.
Example put lifecycle request
Below is a simple example that hides objects under the logs/ prefix after 30 days.
PUT /?lifecycle HTTP/1.1 Host: my-bucket.s3.us-west-004.backblazeb2.com Content-Type: application/xml
At evaluation time, B2 walks object versions in order and applies rules like this:
Pseudo code:
for each object in bucket: for each version of object with data prefix: if version is non current: if age_in_days >= NoncurrentDays: delete version
For current versions, expiration works differently.
Expiring the current version
When a lifecycle rule expires the current version, B2 creates a hide marker instead of deleting data immediately.
This matches S3 semantics and preserves version history.
current version expired | v hide marker created | v current version becomes non current
Overlapping and nested prefix rules
Backblaze B2 supports multiple lifecycle rules on the same bucket, including overlapping and nested prefixes.
For example, you might configure:
A general rule for logs/ that deletes objects after 365 days
A more specific rule for logs/audit/ that deletes objects after 90 days
When rules overlap, the configuration with lowest value is applied to save cost to you. This mirrors S3 behavior and allows fine grained control without duplicating buckets.
Matching logic:
object path: logs/audit/2024/01/file.json
matching rules: - logs/ - logs/audit/
selected rule: - logs/audit/ because it has lowest value, 90 days
Multipart upload cleanup
Lifecycle rules can also be used to abort incomplete multipart uploads if not completed in a certain number of days. This is implemented by tracking the initiation time of multipart uploads and periodically removing uploads that exceed the configured threshold. This helps prevent abandoned uploads from consuming storage indefinitely.
Below is an example rule to delete multipart uploads that are not completed after seven days after starting the upload process.
Multipart uploads are tracked with their initiation timestamp.
Pseudo code:
for each multipart_upload: if now - initiation_time >= DaysAfterInitiation: abort upload delete uploaded parts
Lifecycle execution model
Lifecycle rules are not executed in real time. Instead, they are evaluated by background processes that scan eligible objects and apply actions asynchronously.
Important characteristics:
Rules are not evaluated in real time
Execution is eventually consistent
Large buckets may take multiple passes to fully apply changes
This design allows lifecycle processing to scale across billions of objects efficiently without impacting foreground operations.
High level execution flow:
scan bucket periodically | v identify eligible objects | v apply lifecycle actions (hide and/or delete) | v record progress and continue
Error handling and validation
Lifecycle XML is validated using S3 compatible rules:
Invalid combinations of actions are rejected
Missing required fields return errors
Unsupported actions return descriptive failures
While error messages may differ slightly from AWS, the validation logic follows the same constraints.
Compatibility considerations
While the goal is strong S3 compatibility, there are still some things to keep in mind:
Not all S3 lifecycle actions are supported yet
XML validation follows S3 rules, but error messages may differ slightly
The underlying storage model of B2 can affect timing and visibility
We recommend testing lifecycle rules in a non production bucket before rolling them out broadly.
Final thoughts
Adding S3 compatible support for lifecycle rules on Backblaze B2 was all about making migrations simpler and letting customers reuse existing automation with confidence. It behaves the way you expect while benefiting from B2’s internal scalability.
If you already manage lifecycle rules using S3 APIs, those same configurations can now run on Backblaze B2 with minimal or no changes.
Welcome to our second quarterly Network Stats report covering Q4 of 2025. Along with Drive Stats and Performance Stats, Network Stats pulls back the curtain on real-world infrastructure data, particularly how network-level analytics reflect emerging AI industry trends and usage patterns.
Get more Network Stats (and the details of the dataset)
If you are curious about what metrics we’re recording and how we classify data in this series, check out the details outlined in our Q3 2025 Network Stats report.
One of the roles of the Network Engineering (NetEng) team at Backblaze is to monitor how traffic moves into, out of, and across our platform—not just day-to-day, but over time as customer behavior and industry dynamics evolve. Right now, few forces are reshaping networks faster than AI.
With the launch of B2 Overdrive in April 2025, we built a direct, high-performance path between our storage layers and neoclouds where processing, inference, and modeling take place. It has given us a front-row seat to the impact of AI and how network behavior is changing with it. This quarter, in addition to our regular data analysis, I’ll walk through where AI-driven traffic is concentrated, how ingress and egress patterns showed up, and what the findings say about where AI infrastructure might be headed next.
Continue the conversation
Join us live for the Q4 2025 Network Stats webinar Wednesday, February 4, 2025 at 10:00 a.m. PT / 1:00 p.m. ET. We’ll explore where AI traffic concentrates, how high-magnitude data flows behave, and what early indicators suggest about the future of AI-native infrastructure design.
Can’t make it live, or reading this article after-the-fact? Sign up anyway and catch the recording on demand.
Brave new market
AI workflows don’t just need a place to store data, they need to be able to move it quickly, easily, and nearly constantly for short bursts. Large, multi-petabyte datasets are ingested, transformed, exported for training, pulled back for evaluation, and periodically refreshed as models evolve.
Backblaze plays a key role at both ends of that lifecycle. We serve as a durable storage layer for the initial data ingestion, and as the high-throughput source feeding model training, evaluation, and validation to whatever best neocloud is suitable at the moment. Once that model has been trained, it needs to be stored, served, and periodically retrained, where we serve as the storage medium.
This quarter, we saw a large amount of traffic between Backblaze, neoclouds, and traditional hyperscalers for processing concentrated across the months of June to November. This reflects large-scale ingestion events followed by intensive data manipulation and model-related egress.
From a network perspective, this represents a meaningful shift from diffuse, internet-style traffic patterns to large, high-bandwidth flows between a smaller set of endpoints typical of AI-centric infrastructure.
The neocloud slice
The defining theme of the quarter is “new:” new AI-oriented workflows, new traffic patterns, and leading indicators of new infrastructure trends.
The stacked area graph below shows total traffic by network type over time. While content delivery network (CDN), hosting, and internet service provider (ISP) traffic stayed largely within historical norms reflecting steady-state usage patterns like content delivery, web hosting, and traditional backup workflows, two slices stand out:
Migration traffic: We saw a notable increase in migration traffic from August through October. This classification reflects an influx of data into our network over fiber connections we have in the data centers to cost effectively migrate large amounts of data over private links, not using the public Internet.
Neocloud traffic: We saw a sharp increase in July through November, peaking in October.
Monthly view of all bits transferred to each network type
What do we think is happening? Taken together, these patterns suggest a familiar AI lifecycle: large datasets consisting of assets like images, videos, and metadata are ingested and consolidated then exported for training and experimentation. Now, those assets can be periodically updated as new assets are added and generated models and stored. We see that heading into the new year, the overall baseline has increased indicating a new normal.
Quick terminology refresher
Regions
US-West: Our largest and longest-running region
US-East: Region with the most observed proximity to neocloud infrastructure
CA-East: Our newest region in Canada.
Network Types
CDN: Networks that use Backblaze as an origin store for content delivery
Hosting: Traditional hosting providers that runs workloads like physical or virtual servers for web, database, or application tasks
Hyperscaler: Large, traditional cloud providers
ISP Regional: Local or regional ISPs, think of these as the “last mile” paths as these networks are very close to customer equipment and efficient
ISP Tier1: National or international ISPs that carry our traffic long distances
Neocloud: AI -focused compute networks
Migration: Network links that we use for large-scale data onboarding
Heatmaps: Where AI traffic concentrates
To better understand where AI activity is happening, we thought it would be interesting to isolate the different Backblaze regions and to view concentrations of metrics visualized through heatmaps. We’re going to look at the following three dimensions:
Total traffic volume: Where did we send and receive the most traffic?
Magnitude: Where were the data transfers with the most bits per unique IP address?
Uniqueness: What does the number of distinct IP addresses look like?
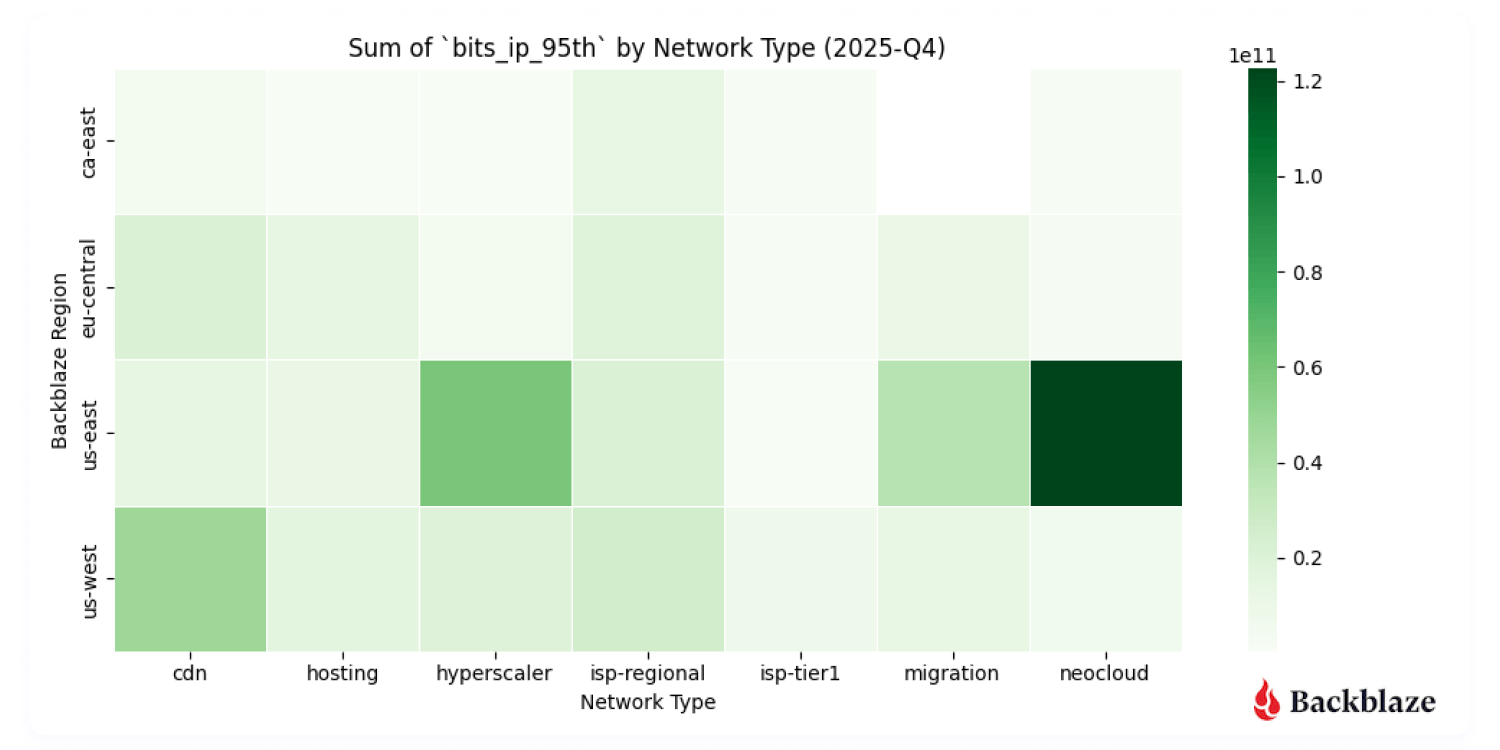
Heatmap #1: Where did we send and receive the most traffic?
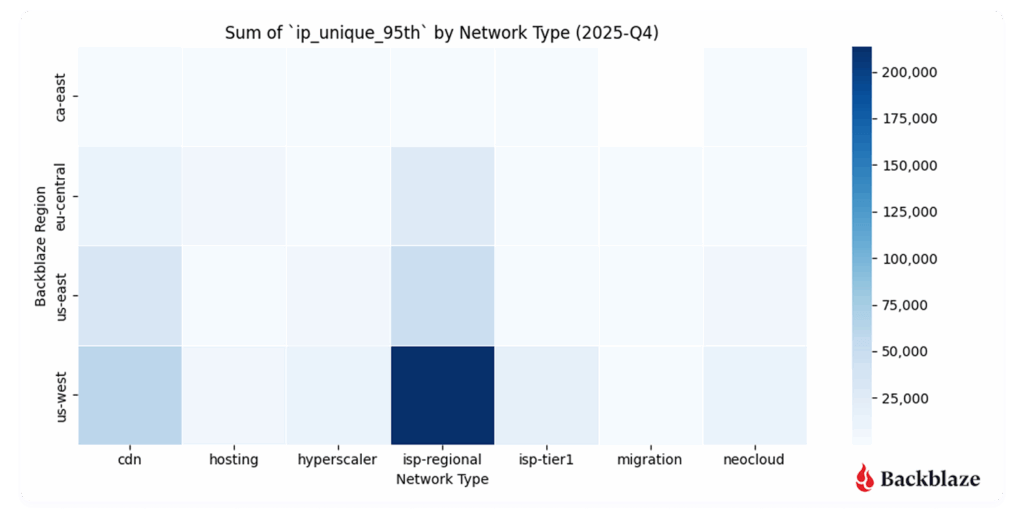
Unsurprisingly, US-West ISP-Regional traffic dominates in total traffic volume. This region has the largest data center footprint behind it, with connectivity to internet exchanges (IX) such as Equinix-IX that were brought online in 2023. Internet exchanges bring us closer to consumer networks, where we can deliver traffic with lower latency.
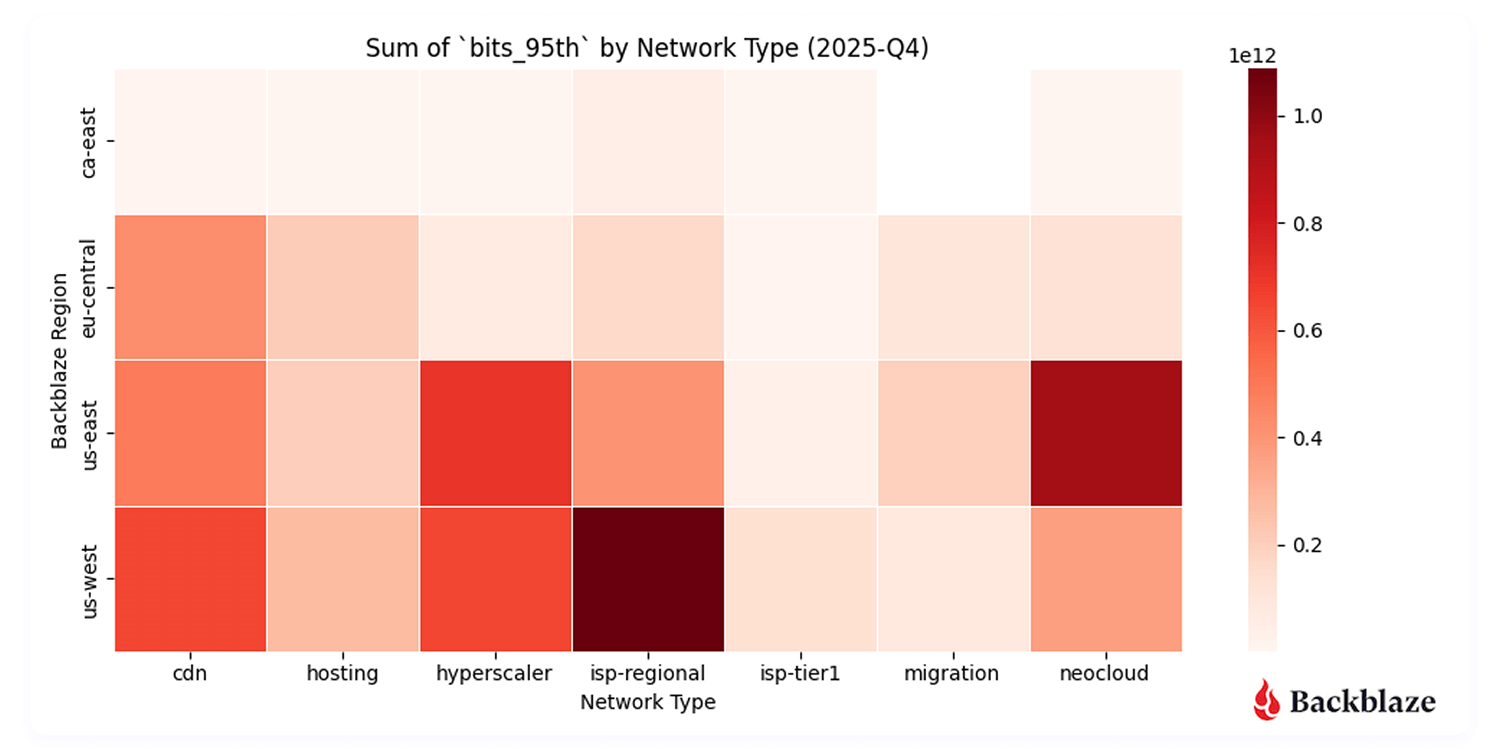
More interesting, however, is the US-East neocloud concentration. Our flow data shows neocloud activity clustering in regions including Chicago, Dallas-Houston, Denver, New York, Northern Virginia (Reston/Ashburn corridor), and Atlanta—skewed more towards the East Coast where there’s dense AI compute availability.
From a performance standpoint, this makes sense. It’s important to keep latency (the time between the source and destination) lower to achieve consistent high bandwidth rates for AI data transfers. For now, that gravity is pulling activity towards the East coast.
Total number of bits transferred across our regions to each network type
Will neocloud traffic concentrations shift over time? Since this is our first quarter with a full dataset, it’s a bit early to draw long-term conclusions. But this is exactly the kind of trend we’ll be tracking. Stay tuned for future Network Stats reports.
Heatmap #2: Where were the data transfers with the most magnitude (bits per IP address)?
Another metric we record is bits per IP or what we termed in our last report “magnitude.” This combination of the amount of traffic transferred with how many actors are involved per network is a good proxy to measure how heavy or impactful individual data flows are. In short:
High volume, many IPs: Easier to distribute and load-balance across infrastructure. And many source and destination pairs means that we can traffic engineer at the WAN layer, sending some traffic over one provider and some over another.
High volume, few IPs: More difficult, but more interesting, from a NetEng perspective.
Magnitude transferred across our regions to each network type
With B2 Overdrive, we routinely support client transfers starting at 100Gbps up to 1Tbps of throughput.These high-magnitude flows show up clearly in the data, especially in regions serving AI-heavy neocloud endpoints. Seeing these patterns emerge in the data validates that customers are actively using the platform the way it was designed.
Heatmap #3: How many unique addresses do we interact with?
Uniqueness—measured by the number of distinct IP addresses per network type—adds another dimension to the story.
US-West shows the highest overall uniqueness, driven by its larger number of data centers and mix of workloads.
Neocloud traffic, by contrast, tends to involve fewer, more persistent endpoints, consistent with AI pipelines that rely on stable, long-standing connections between storage and compute.
This contrast reveals a broader trend: AI networking is less about many-to-many communication and more about sustained high-throughput relationships between specialized systems.
Communication uniqueness across our regions to each network type
Summary: Early indicators of an AI-native network era
This quarter represents an early but important snapshot of how AI is reshaping network behavior:
AI-driven traffic is concentrated and heavy (not groundbreaking news by any means, but interesting to see it played out on a network).
Neocloud connectivity is a defining feature of data movement today.
Data gravity is pulling storage, compute, and network design into tighter alignment.
This is our first look at these patterns specifically. As we gather more quarters of data, we’ll be watching closely to see how cyclical neocloud activity becomes, how regional concentrations shift, and how the growing ecosystem of AI-focused ISVs continues to change the shape of the network.
Quarter over quarter data
Last quarter we started capturing data and metrics that we were interested in tracking over time. This represents our first full quarter of data as we only started tracking in August of 2025, so it’s still early to start to see trends, but we’re including the visualizations for fidelity.
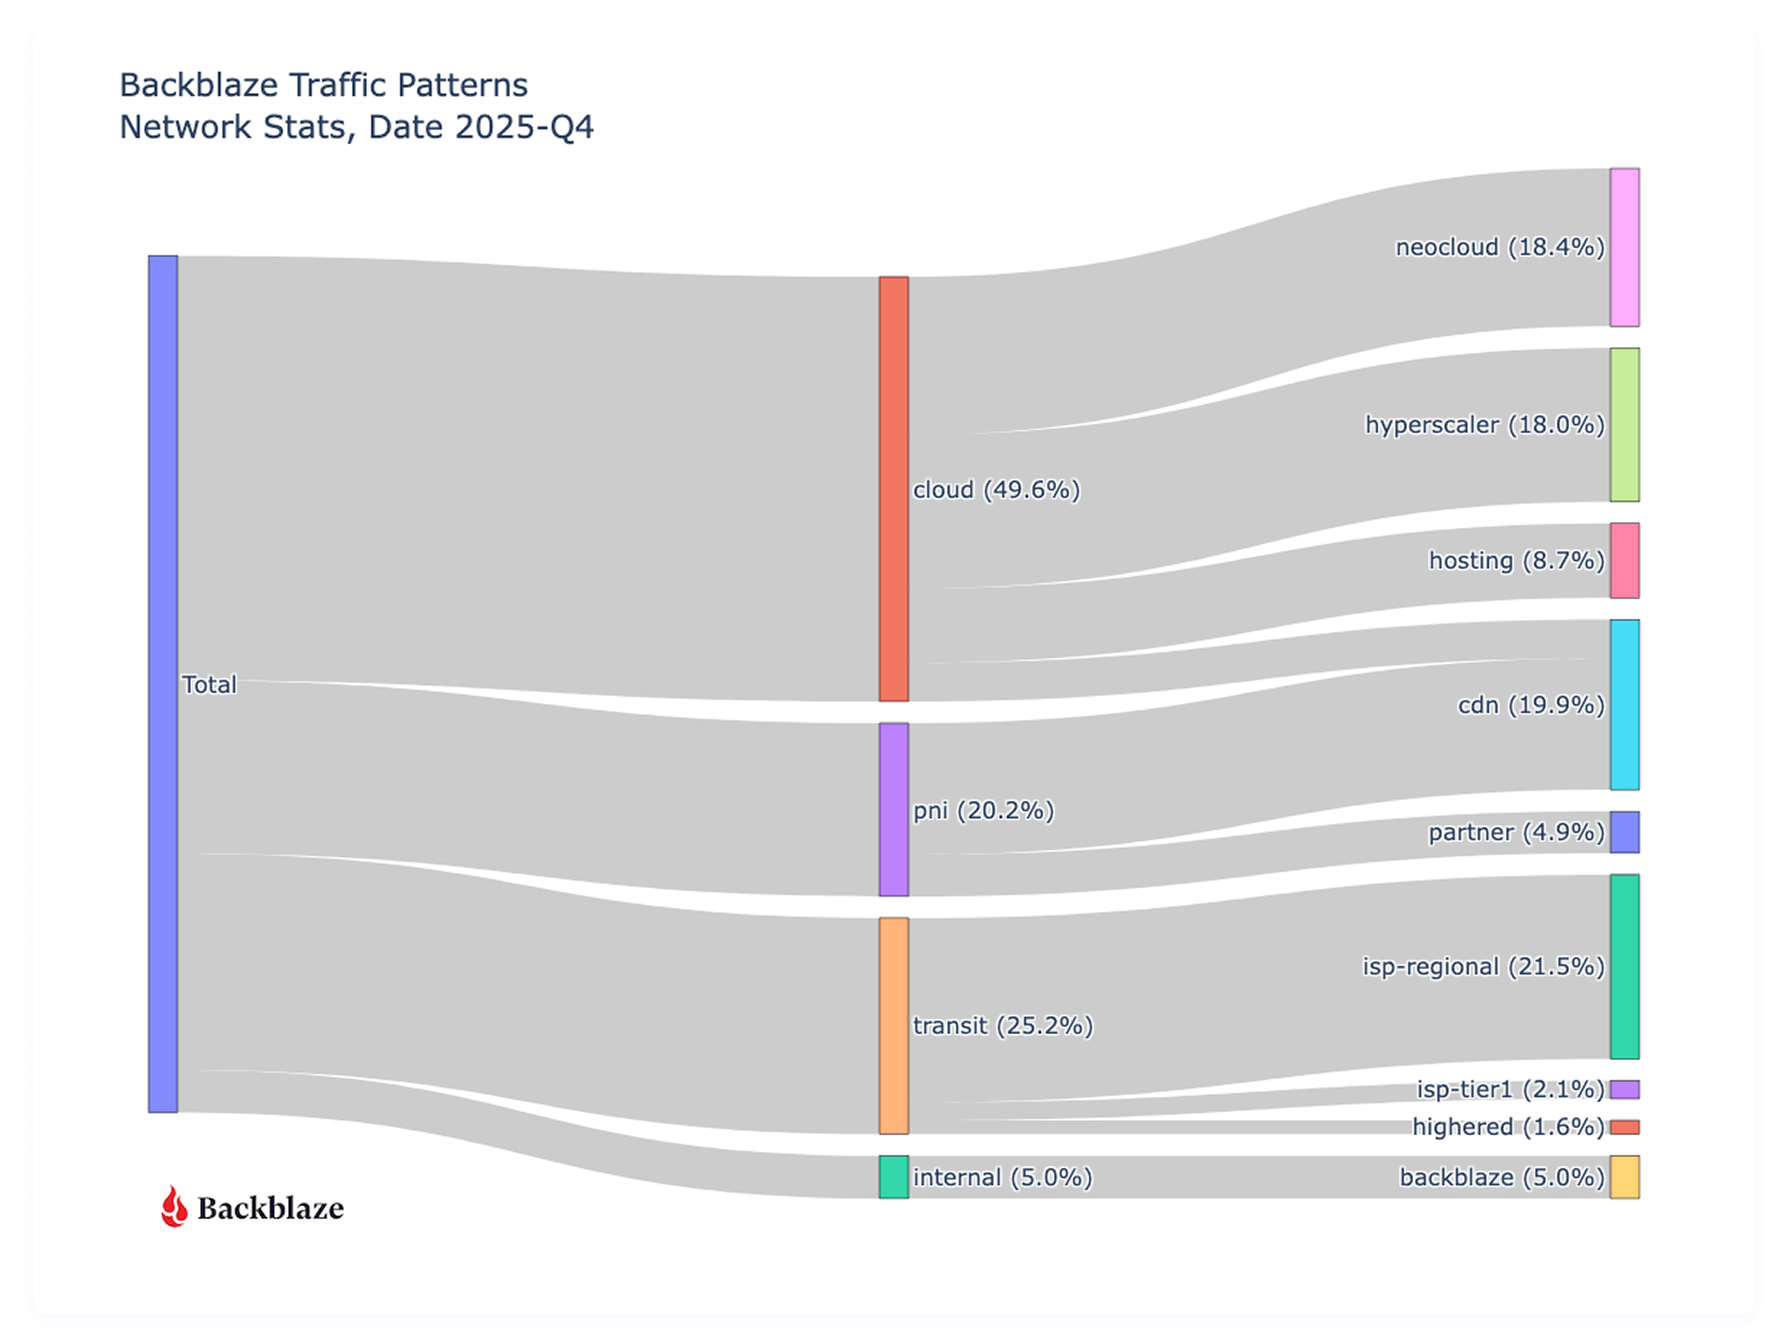
First let’s take a look at where all our traffic goes from a global perspective with an updated view of last quarter.
Sankey diagram of all August ingress and egress traffic grouped by type of network
Traffic to other clouds has increased (36.2% to 49.6%) since we last reported in August of 2025, with a slight decrease (19.8% to 18.4%) in Neocloud destinations, but a large increase (3.5% to 18%) to hyperscalers. It’s too early to call these things statistically significant trends or patterns that impact the cloud storage industry broadly, because they’re reflective of what types of customers Backblaze specifically has and our sampling range is only a quarter. That said, we do see an overall increase in cloud to cloud traffic, but the higher percentage to the type of clouds rotated from last quarter.
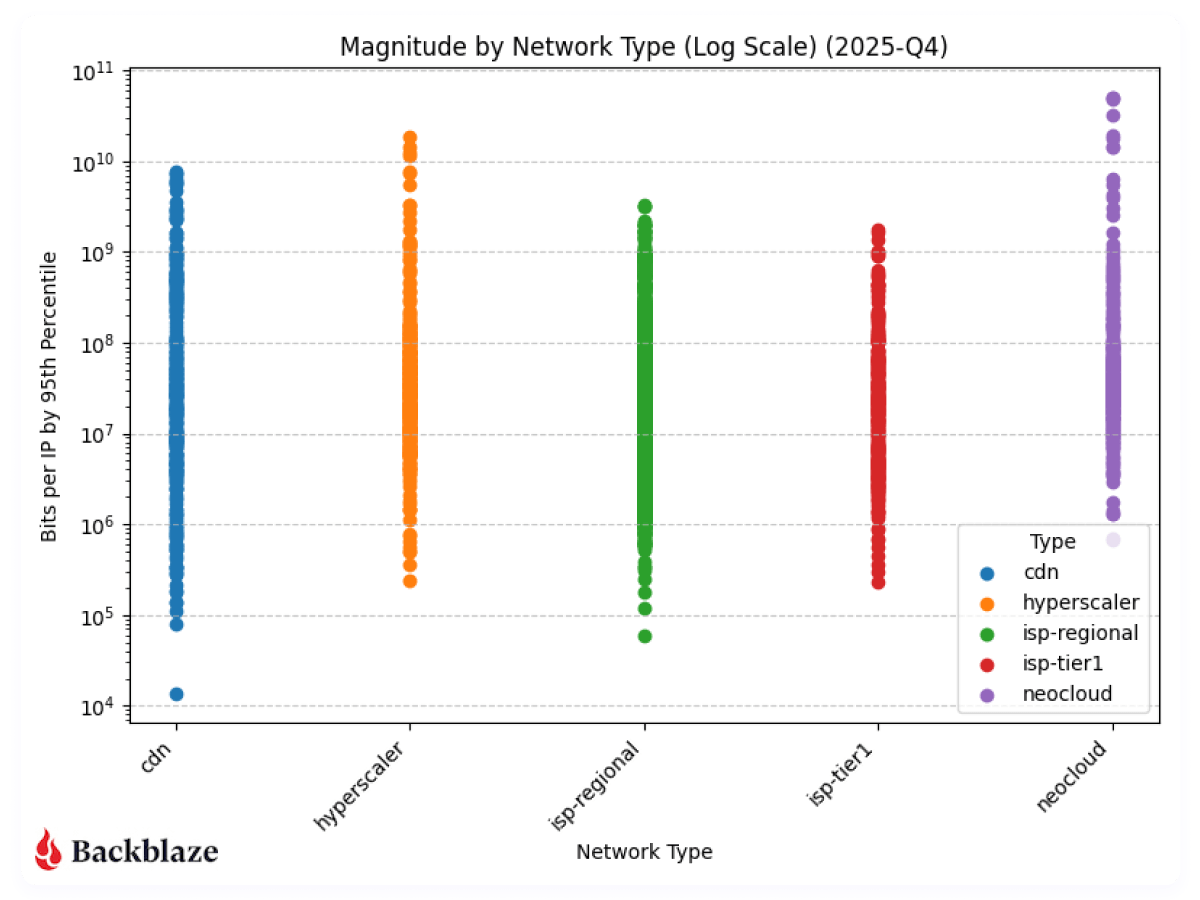
Next, let’s look at the magnitude of our network traffic based on the category of the traffic destination. As a reminder, magnitude represents the amount of traffic transferred with how many actors are involved per network.
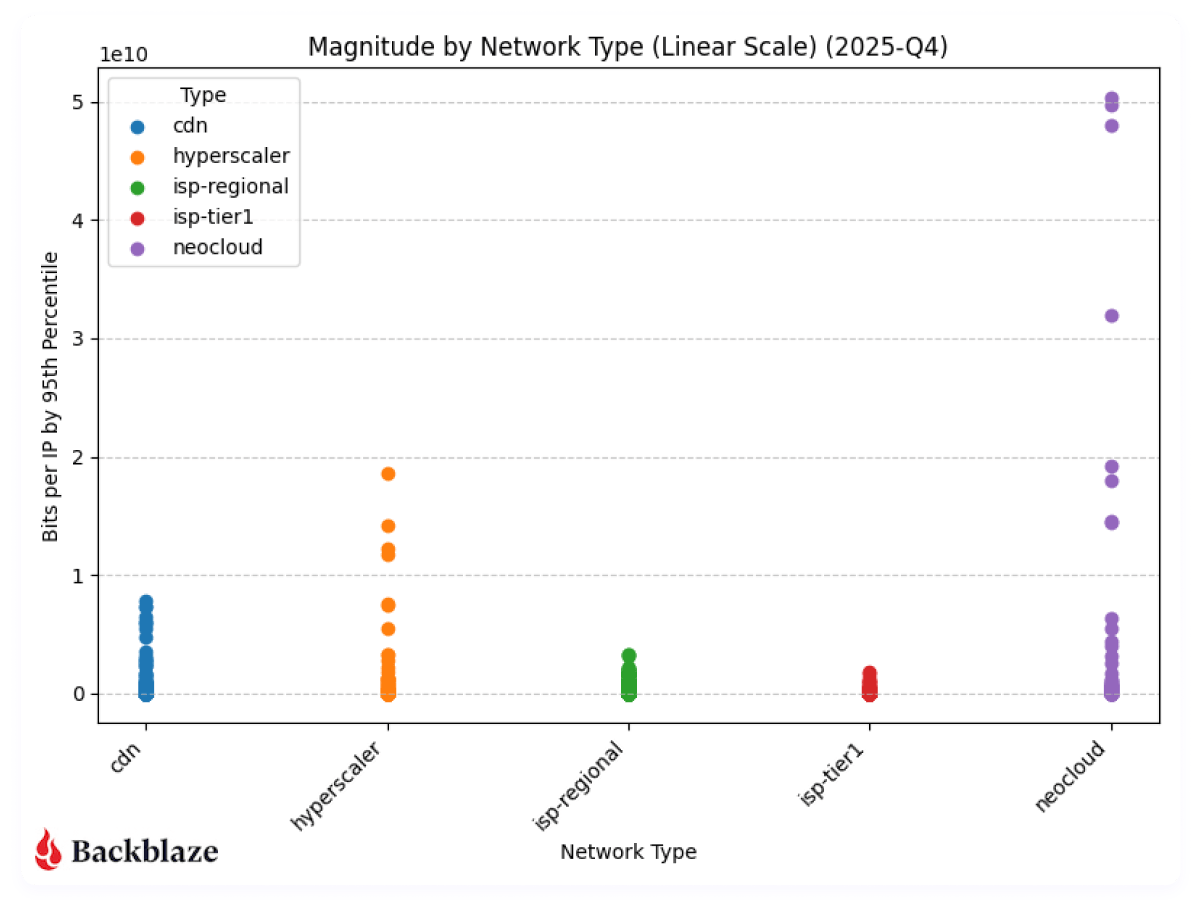
Next, to be consistent with our previous report, we’ll look at magnitude on a linear scale.
With more datapoints, we can clearly see the magnitude of the neocloud and hyperscaler transfers when compared to other network types. As above, it’s a bit early to claim concrete quarter over quarter patterns, but we’ll keep monitoring and updating the dataset.
What’s next?
Next quarter will be the first where we have true quarter over quarter data to analyze, and we’ll be back with more on how AI-driven flows change quarter over quarter. And as we get more data, we’re interested in looking at other trends like IPv4 vs. IPv6 traffic, cross-cloud connectivity trends, and revisiting the concentration analysis we did this quarter.
Anything specific you want to see? Let us know in the comments or reach out to our Evangelism team. Or, keep up-to-date with the latest technical content with our Developer Newsletter.
As generative AI has shifted from selective experimentation to broad operational use, large language models (LLMs) now sit inside developer environments, support workflows, internal knowledge systems, and security tooling itself. Adoption has widened for both enterprises and consumers alike, and, unsurprisingly, have a whole new set of security patterns.
Though oftentimes single catastrophic failures are the types of stories that make the news (like an AI agent pushing code to production against its explicit instructions), the truth is that there’s a bigger narrative here. Generative AI has introduced a whole new way to work, and we’re seeing a set of recurring behaviors—ways that AI systems interact with data, instructions, and people—that either introduce new risks or enhance some tried-and-true bad actor tactics (like more convincing phishing attacks, for example).
This article focuses on seven patterns that have emerged in real deployments and documented incidents. Let’s get into it.
1. Prompt injection and instruction hijacking
Prompt injection has matured from a research concept into a practical exploit vector. The issue is structural: LLMs interpret text holistically using tokenization, which makes it difficult to maintain a strict separation between instructions and data. When untrusted content is introduced into an AI system with elevated permissions, that ambiguity becomes exploitable.
Recent incidents show how this plays out in production tools. Researchers analyzing Microsoft Copilot demonstrated that carefully crafted inputs could override intended behavior, expose system prompts, or trigger unintended actions within the model’s sandbox.
The common thread is authority. When models are allowed to act on retrieved content or invoke downstream tools, text becomes a control surface.
2. Prompt poaching and peripheral exfiltration
Not all AI-related data loss requires access to the model itself. A recent malware campaign demonstrated how attackers can siphon AI conversations by compromising the surrounding ecosystem.
These attacks target trust boundaries adjacent to AI systems rather than the models directly. Browser extensions, plugins, and integrations become collection points for high-value contextual data that did not previously exist in a single place. And, they’re often less controlled by enterprise IT teams compared with other types of software.
3. AI-powered malware and ransomware
AI-assisted malware is no longer hypothetical. Security researchers have now documented ransomware that uses generative models as part of its operational logic.
One example: PromptLock, a ransomware strain that leverages LLMs to dynamically generate portions of its code and behavior during execution.
At the ecosystem level, threat intelligence reports show ransomware groups using AI to accelerate development, customize payloads, and craft tailored extortion communications. Akamai’s 2025 ransomware trends report documents LLM usage by active groups for both technical and social components of attacks.
It’s less about how it’s done and more about how fast it’s done: Iteration cycles are shorter, and adaptation happens more quickly.
4. Acceleration and competitive pressure in the ransomware economy
Even when AI is not embedded directly into malware, it influences the broader threat environment. Ransomware activity increased throughout 2025 despite arrests and takedowns; new groups emerged quickly to replace disrupted ones.
As we said above, speed matters here. Defensive models that assume time for analysis, tuning, and response are increasingly stressed by attackers who can prototype and redeploy faster than those cycles allow.
And it’s not just speed—the volume of (credible, real) attacks matters too. The truth of the game has always been that bad actors only have to succeed once whereas defenders have to succeed every time. If better ransomware is being produced more quickly, defenders are having to adapt just as (or more) quickly to a higher volume of attacks (which makes the demand for employees in the security industry that much more understandable).
5. Semantic noise and operational fatigue
Generative AI produces a large volume of plausible output: summaries, recommendations, alerts, explanations. In isolation, that capability is helpful; in aggregate, it introduces a new operational burden.
Security teams report growing difficulty distinguishing signal from well-formed noise. In reality, this means that over-taxed employees are getting pinged while on-call far more.
AI-generated conclusions often require human validation, but their tone and confidence can reduce scrutiny over time. That creates opportunities for malicious activity to hide inside outputs that appear reasonable and routine; or, on the flip side, for things like process and architecture misconfigurations to masquerade as security events by creating too many requests.
This pattern does not map cleanly to a single exploit; it shows up as delayed detection, slower response, and missed anomalies.
6. Code supply chain risk from generated code
AI-generated code compounds familiar supply-chain issues. Generated snippets often compile cleanly, pass tests, and follow common patterns; they also tend to replicate insecure defaults or omit contextual safeguards.
As these patterns are reused across services, small mistakes scale quickly. Not only that, but basic parameters like privileging recency (e.g., new security patches) vs. commonality (e.g., the most often used code) can have major implications and be weighted differently in different tools. While there is demonstrated risk of malicious insertion, it’s also the normalization of fragile or incomplete logic through automation.
7. Potential human skill erosion as a force multiplier
One of the quietest risks is also the hardest to measure. As AI tools handle more analysis, summarization, and decision support, human operators spend less time interrogating raw data. That’s both a good and a bad thing—really, it begs the question of how we go about creating and applying expertise in a new and developing epistemological framework. (Wait, you thought engineering wasn’t philosophical?)
Over time, that shifts how teams validate outcomes and how comfortable they are challenging AI-generated conclusions. This erosion does not cause incidents by itself, but it can amplify the impact of every other failure mode.
Where this leaves us
Across these examples, a consistent theme emerges. Generative AI changes how authority, context, and action flow through systems. Many of the resulting failures are subtle and blend into normal usage patterns.
The next phase of response is already taking shape. Government agencies and standards bodies are beginning to formalize guidance on securing AI systems, managing AI-related risk, and adapting existing security practices to these new patterns.
That guidance belongs in its own discussion. For now, the takeaway is simpler: AI adoption has altered the shape of risk.
Today’s AI models consume much more than text—everything from product images to video from surveillance feeds to audio from customer calls to metadata spread across an ever-expanding set of systems. These multimodal datasets drive everything from computer vision pipelines to customer service automation. But as they scale, the underlying infrastructure starts to creak.
Costs can become unpredictable. Data fragments across S3 buckets, HDFS clusters, and local drives. Maintaining cross-modal alignment, i.e. ensuring that media files stay linked to their labels, embeddings, and annotations, becomes a bottleneck that slows development to a crawl.This article outlines a practical path forward: how to migrate multimodal training data using proven open-source tools, and how Pixeltable helps unify and index that data for training once it lands in Backblaze B2.
Moving multimodal training data: Practical open source software (OSS) tools that do the heavy lifting
Before you can train on consolidated data, you need to get it all into one place. These three open-source tools handle the migration work, each addressing a different piece of the puzzle.
Apache NiFi for moving large media reliably
When your dataset includes terabytes of video files, thousands of high-resolution images, or large binary assets like LIDAR scans, you need something more robust than a shell script. Apache NiFi is purpose-built for moving large media files at scale.
NiFi provides:
Flow control and retry logic that handle network interruptions gracefully, which is essential when transferring terabytes of data over hours or days.
Data provenance tracking that records exactly which files moved where and when, making it possible to debug issues without guessing.
A visual workflow designer that lets you build and monitor data flows without writing custom code.
For multimodal datasets where media volume dominates, NiFi ensures files arrive intact and trackable. Check the Apache NiFi User Guide to get started with building your first data flow.
Airbyte for syncing structured and semi-structured metadata
Media files are only half the story. Annotations, labels, captions, transcripts, and database records provide the context that makes raw media useful for training. Airbyte excels at moving this structured and semi-structured metadata.
Airbyte handles:
Schema consistency when pulling metadata from multiple sources, ensuring annotation formats don’t drift between your labeling platform, your CRM, and your feature store.
Incremental syncs that only transfer changed records, avoiding unnecessary data movement as your datasets grow.
Multiple data systems via a broad catalog of connectors for databases, SaaS platforms, file formats, and cloud storage services.
Unlike NiFi, which focuses on raw file movement, Airbyte understands data schemas and transformations. Use it to keep your metadata in sync across systems. The Airbyte documentation provides setup guides for most common data sources.
lakeFS for versioning for reproducible training
After moving media via NiFi and metadata via Airbyte, you need a way to snapshot the entire dataset so you can reproduce training runs six months later. lakeFS brings Git-like version control to object storage.
lakeFS enables:
Branching and snapshots of entire datasets without copying data. You can create a branch, run an experiment, and merge or discard the results.
Atomic commits that ensure media, metadata, and derived features stay aligned as your corpus evolves.
Zero-copy clones that let multiple teams work on isolated versions of production data without storage overhead.
lakeFS acts as a version control layer on top of storage like Backblaze B2, tracking changes without duplicating objects. When a training run produces a new model, you can tag the exact dataset version that went into it. The lakeFS quickstart guide walks through creating your first repository and branch.
After migration, the hard part begins: Making the dataset usable
Moving data into object storage solves logistics, not usability. Even in B2, your media files, labels, and derived features remain scattered—images in one prefix, annotations in another, embeddings in a third. Training code becomes a tangle of custom loaders that stitch everything together, break when datasets change, and consume more engineering time than model tuning.
Where Pixeltable fits
Pixeltable provides the missing layer between migrated storage and training-ready data. It’s a declarative data infrastructure specifically designed for multimodal AI applications.
Here’s what Pixeltable does:
Unifies media and metadata into a single table interface: images, video frames, audio clips, and their associated labels, embeddings, and annotations live in one queryable structure.
Stores computed results automatically. Run OCR on documents, generate CLIP embeddings for images, or extract audio transcripts once, and Pixeltable caches the results for reuse.
References Backblaze B2 objects directly without copying data. Files stay in Backblaze B2, and Pixeltable maintains pointers and metadata in a local Postgres instance. Pixeltable automatically caches the files locally on access, and can write media files back to B2 (see our project for examples: https://github.com/backblaze-b2-samples/b2-pixeltable-multimodal-data).
Supports built-in transforms like embedding generation, image captioning, and OCR with lazy evaluation. Define transformations once, and they run incrementally as new data arrives.
Instead of maintaining custom loaders and indexing scripts, you define a schema once. Pixeltable handles orchestration, caching, and queries. The result is a training dataset you can slice, filter, and feed directly into PyTorch DataLoaders or Hugging Face Datasets.
Check the Pixeltable documentation to see how tables, computed columns, and queries work in practice.
A practical end-to-end workflow
Here’s how these tools fit together in a real-world pipeline:
1. Move media via NiFi → Backblaze B2
Set up an Apache NiFi flow to transfer images, video files, or other large binaries from your current storage (on-premise NAS, another cloud provider, or local drives) to a Backblaze B2 bucket. Configure retry logic and provenance tracking so you can verify every file arrived.
Use NiFi processors like GetFile, PutS3Object, and RouteOnAttribute to handle file movement and error routing. The Backblaze B2 Cloud Storage S3-compatible API works seamlessly with NiFi’s S3 processors.
2. Sync metadata via Airbyte
Configure Airbyte to pull annotations, labels, captions, and database records from your labeling tool, feature store, or other sources. Set up connections to sync metadata incrementally as it changes. If annotations live in Postgres and captions come from a cloud-based labeling platform, Airbyte normalizes both into a consistent schema in Backblaze B2 or a dedicated metadata store.
3. Create a lakeFS branch to snapshot the dataset
Initialize a lakeFS repository pointing to your Backblaze B2 bucket. Create a branch to isolate this version of the dataset. If something goes wrong during training, you can roll back or compare versions. Use the lakeFS CLI or Python client to create branches and commits programmatically.
In Pixeltable, create a table with columns for image paths (pointing to Backblaze B2), labels, captions, and any other metadata fields. Import your data so each row represents one training example: one image, its label, its caption, and any associated metadata.Pixeltable doesn’t copy image files—it stores references and metadata, automatically caching the files locally on access. The images stay in Backblaze. The Pixeltable Tables guide explains how to create tables with multimodal column types and import data from external sources.
5. Run transforms (embeddings, captions, OCR) inside Pixeltable
Define computed columns for embeddings, captions, or OCR results. Pixeltable’s computed columns run transformations lazily as data is queried or when you explicitly trigger computation.
For example, you can add CLIP embeddings using Pixeltable’s built-in Hugging Face integration, or generate AI captions using OpenAI’s vision API. Once defined, these columns compute incrementally—new images trigger automatic processing without reprocessing the entire dataset.
The Pixeltable API reference documents all available functions for common operations like embedding generation, image processing, and text analysis.
6. Query or filter the unified dataset
Use Pixeltable’s query interface to filter, sort, and slice your data. For example, find all images labeled “cat” with embeddings similar to a reference image. Or extract rows where captions mention “outdoor” and timestamps fall within a specific range.
7. Feed batches directly into PyTorch/Hugging Face
Export data from Pixeltable into PyTorch DataLoaders or Hugging Face Datasets format for training. Pixeltable handles batching, shuffling, and data access so your training loop stays clean.
The Pixeltable documentation covers various export formats and integrations with popular ML frameworks, allowing you to avoid intermediate export steps and maintain a streamlined workflow from data preparation to model training.
From fragmented storage to production-ready training data
Multimodal AI datasets don’t have to be a maintenance nightmare. By chaining together proven open-source tools—NiFi and Airbyte for migration, lakeFS for versioning, and Pixeltable for unified access—you can turn scattered files and metadata into queryable training assets.
Once data lands in Backblaze B2, this stack eliminates the custom glue code, brittle loaders, and alignment issues that typically slow down training workflows. Your team gets reproducible datasets, clean interfaces, and more time for model development instead of infrastructure firefighting.
When most people think about year-end work, they think in terms of deadlines, retrospectives, and a well-earned break. Data centers have other ideas because, well, the internet still needs to work on holidays in order to power those digital fireplaces and Spotify playlists.
Backblaze runs year-round, around the clock, which means that even the holidays are business as usual in a data center. And many customers who use Backblaze to store their AI models, applications, media, and critical business data need that data storage to be more reliable than ever, especially around the holidays. Every drive swap, rack adjustment, alert investigation, and routine fix leaves a trace in our work tickets, and we’ve discussed in our Drive Stats reports how we use those work tickets to do things like define a failure. They’re also evidence of what it takes to keep an always-on service humming, even when the rest of the company is offline.
So, as the year comes to a close, we wanted to shout out to our awesome data center, cloud ops, and on-call team members—we couldn’t do it without you. And here’s a little retrospective on what this past year looked like.
In total across data centers, we spent 3,112.43 hours replacing hard drives. (If those hours don’t square up with the charts above, it’s because the total view includes other types of work, like upgrading our systems.) On average, it took about 0.74 hours per hard drive.
Here’s a breakdown of the drives replaced by capacity:
If you’re a Drive Stats fan, you may notice there are some funky drive sizes on there based on our other reporting data. (A 2TB drive? Where does that one even come from?) The drives above are inclusive of our whole fleet, including boot drives and non-production drives, and some of those are sized differently than based for whatever reason—history, job in the data center, etc.
Vault deployments
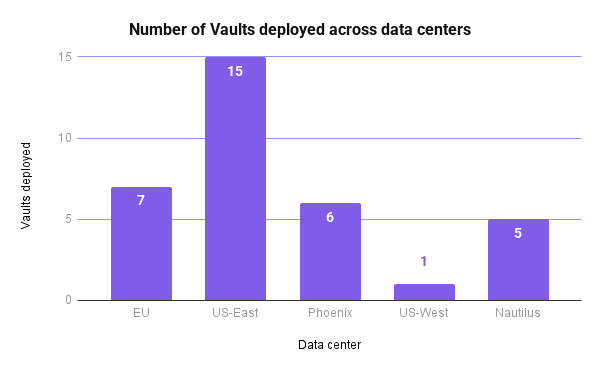
We also deploy new Vaults fairly regularly. This year, we added the following Vaults (per data center):
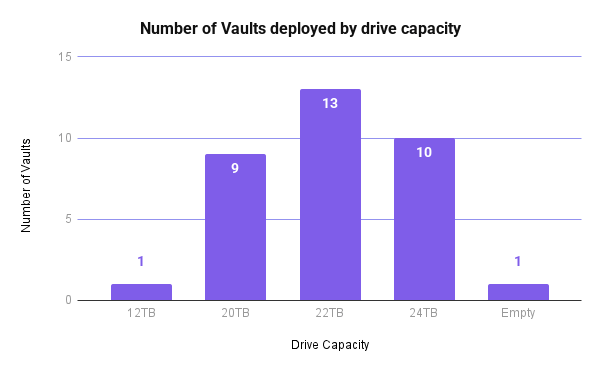
And, here’s a breakdown of the number of Vaults broken down by drive size:
In total, we spent 1043.23 hours on Vault deployment which is about 31.61 hours on average per Vault.
Numbers, as always, tell the story
Taken together, the data shows every hour logged, every drive replaced, every Vault added, and every ticket closed. It adds up to a year’s worth of hands-on infrastructure care; in short, it’s the steady investment required to operate storage at scale.
Whether you’re on call monitoring your own systems, planning for growth in the year ahead, or fully offline over the holidays, your data is here for you. Cheers to another great year!
Sure, we may be a global tech company who spends our days on the front lines of helping our customers solve their toughest data storage challenges, but that doesn’t mean we don’t ever power down the devices and curl up with a good book. Welcome to the third annual Bookblaze, Backblaze’s much-anticipated book guide where our team shares the stories, insights, and adventures that shaped their reading year.
From thought-provoking nonfiction to immersive fiction and unexpected gems, these recommendations are curated by the people who read, think, and create here at Backblaze—offering you a cozy companion for winter nights, inspiration for your 2026 reading list, and maybe even the perfect gift idea along the way. Whether you’re reconnecting with old favorites or discovering your next great read, we hope this year’s picks spark joy, curiosity, and conversation.
Chris McGranahan, Director, Information Security Architecture
It’s an exhaustive but entertaining explanation of how our world came to be the way it is, why CO2 is so important to it and how the path we’re currently on is likely to create a world that hasn’t existed in millions of years and never supported humans. And, if you want a fun fiction read, check out any of the Murderbot Diaries series by Martha Wells.
I love deeply flawed female protagonists. I also love the fact that myth retellings have been so popular for the last few years, and this year, I decided to tackle my hyper-specific TBR I was neglecting. (Editor’s note: For those of you not afflicted with chronic book collecting, TBR = to be read.)
Clytemnestra tells the story of one of the most reviled women in Greek mythology. She’s cunning, ruthless, and quite possibly the original champion of playing the long game to seek revenge, as a key player in the Trojan War you’ve probably never heard of. And yet, you can’t help but root for her. It’s shocking that this is a debut novel because, though it can be a slow burn in parts, the characterization and completely immersive writing provides a different perspective of how the Trojan War unfolded for those left at home.
I appreciate how Positive Intelligence translates mindset and emotional intelligence into practical exercises for building mental fitness. The Saboteur framework makes it easy to spot negative thinking and shift toward a more productive mindset. It’s a great balance of psychology, neuroscience, and real-world application that supports personal and professional growth.
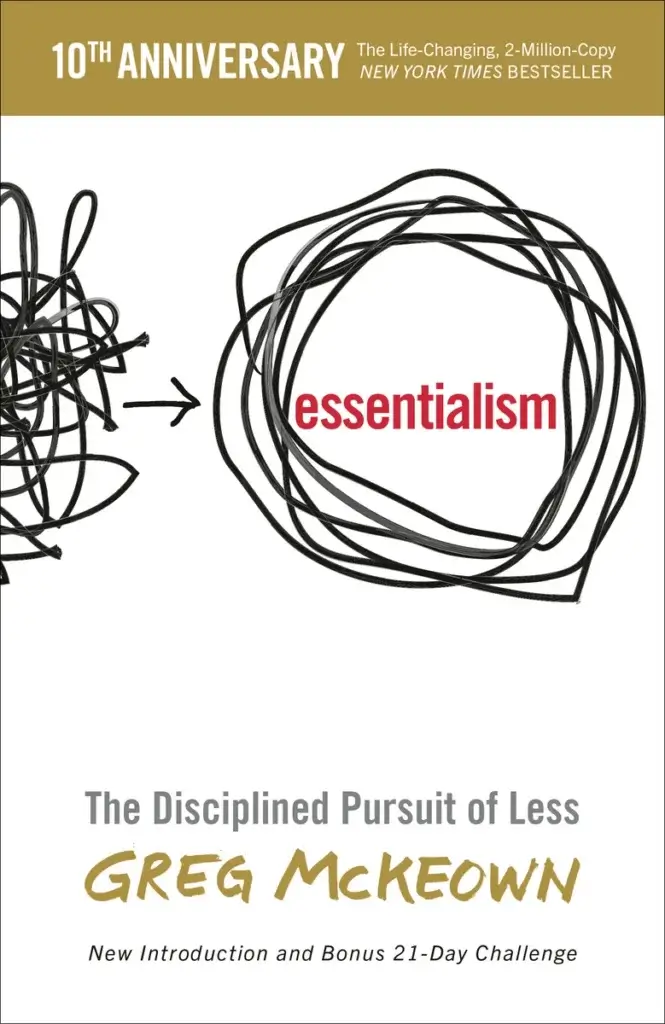
In work and in life, we often struggle with saying “no”, even to ourselves. We take on more than we can effectively manage and execute. As a result, we’re burned out—frustrated by our ever-growing to-do lists and disappointed in the quality of what we do get done. This book helped me understand why doing less actually results in accomplishing more and better things. In addition, it gave me a sense of how to make this case to others—whether it’s about prioritization of work projects or helping a loved one who’s feeling overwhelmed.
Although there were some dark moments in the book, in general it was a feel good book of a boy coming of age through adulthood, paying his dues and then paying it forward. The setting is right in the Backblaze neighborhood so it’s always interesting to picture the local intersections, and schools referenced in the novel.
Elisa Miller, Sr. Organizational Development Partner
Octavia Butler is a masterful sci fi writer who has woven a tale in the 1990s set to present time about a dystopian reality oddly similar to the one we are living/heading towards currently of lawlessness, greed, and the quest for survival. Focusing on the power of community, togetherness, and nature, this book was an epic (and scary) adventure into what happens when people gather together to fight the status quo while lifting one another up. It’s not for the faint of heart, but it really was a game changer for me to read, offering solutions beyond capitalism and towards empowerment of humanity, spirituality, and purpose.
It’s a buddy comedy, but also the fate of the human race is at stake. There’s lots of science to nerd out on if that’s your thing. And Andy Weir is a former software engineer, so you could kinda sorta say it’s “for work.”
Sleep training my child without having to resort to too much crying seemed daunting, but this book helped inform our process with evidence based guidance. I am happy to report that I have a great little sleeper because of it. This book will help any parent gain the skills and confidence to effectively sleep train their child.
This book series is absolute insanity, and if you are able to get the audiobook, you will not regret it. I even got my sister’s mother-in-law to listen to it on audio and she loved it. The premise is that it’s the end of the world, and Carl is sucked into a dungeon to fight for the entertainment of the universe at large—plus there’s a talking cat! What’s not to like? It’s a genre known as LitRPG (editor’s note: Literary role-playing game) which follows Carl and his friends’ progression as they work through the dungeon and try to topple the powers that be.
The new “Hunger Games” book is the first prequel I’ve read in years that genuinely adds something meaningful to its original series. It pulled me right back into Panem, had me rewatching all the movies, and had me loving characters that I didn’t expect to get attached to. A fantastic return to a world I thought I already knew.
This series reminds me of old-school science fiction in all the best ways. Without giving too much away, a terraforming project is sabotaged, leading to unexpected outcomes for the targeted planet. Meanwhile, back on Earth, the world ends, and a race begins for the remainder of humanity to find a new home. Tchaikovsky’s brilliance thrives in the details of understanding systems, people, biology, engineering, and science, and each new revelation about what’s happening—in this new world with a new sentient species, and with the humans on their ever-devolving arc ship—stems from each of those details showing up in ways that feel both expected and unexpected at the same time.
The AI and cloud infrastructure industry talks endlessly about GPUs, model size, and compute capacity, but there’s an invisible Achilles heel that can quietly undermine even the most promising AI projects: data egress.
According to a new Dimensional Research survey, 95% of organizations experience unexpected cloud storage fees, often from retrieval, egress, or API transactions. These hidden costs are rarely visible in early budgets, but they can torpedo innovation as workloads scale, especially when video enters the mix. Raw footage, frame-level training data, model checkpoints, and final renders can add up to hundreds of terabytes every week, straining both budgets and infrastructure.
Read the full report
We surveyed over 400 IT decision makers and one thing stood out. Surprise charges affect almost everyone. Learn what’s driving them—and how to avoid them.
Most generative AI video outputs today max out at 480p or 720p resolution. As demand grows for 1080p and 4K, storage and bandwidth requirements will multiply. Without a deliberate egress strategy, that growth becomes a silent tax on innovation. Over time, it restricts experimentation, reduces iteration speed, and undermines cost predictability.
The future of AI video belongs to teams that treat egress strategy as part of their innovation architecture and choose partners that let them move data freely between storage and compute, without penalty.
Inside the generative AI data pipeline
Modern AI systems no longer operate inside a single environment. Data is stored in one place, trained in another, and increasingly delivered at the edge. As workloads scale, the ability to move data efficiently becomes as important as compute capacity.
According to IDC, 88% of cloud buyers now deploy hybrid cloud environments, and 79% already use multiple providers. The Dimensional Research survey found that 99% of organizations struggle with limited flexibility and interoperability, highlighting how closed ecosystems are slowing progress just as multimodal AI demands more open, composable infrastructure.
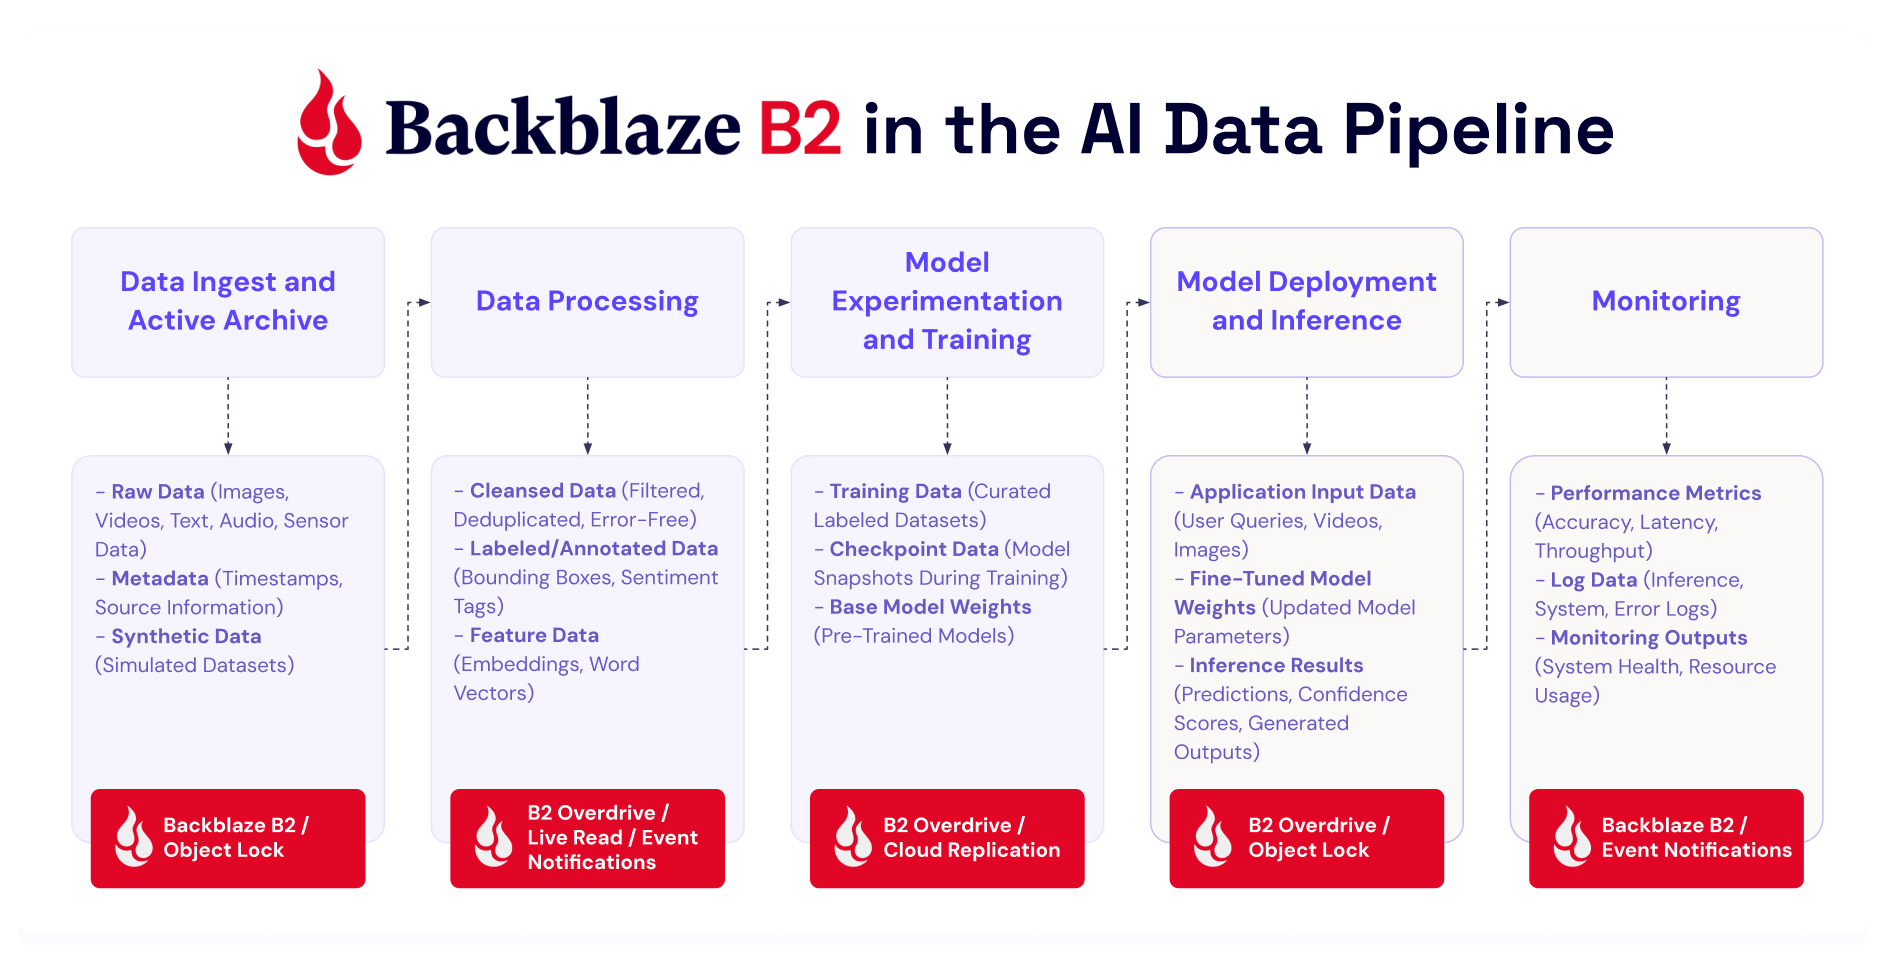
To understand why egress matters so much for generative AI video, it helps to look at the AI data pipeline, which follows five continuous stages:
Data ingest and active archive: Collect and store raw images, video, audio, and metadata for future processing.
Data processing: Clean, label, and transform data into usable training sets.
Model experimentation and training: Run GPU-intensive model development and fine-tuning, save checkpoints and weights.
Model deployment and inference: Apply trained models to new video, user queries, or edge devices to generate results.
Monitoring: Track accuracy, latency, and system health to retrain and optimize continuously.
Each stage has distinct storage and compute requirements, but data moves between them constantly. For AI video, those transfers can span regions and providers. When egress is slow or expensive, the entire pipeline backs up, delaying iteration and driving up cost.
When data can’t move, innovation can’t either
Keeping everything under one cloud provider once simplified management. At first glance, it still seems convenient to keep storage, compute, and archive all in one place. Within a single AWS region, egress is free. But as soon as data crosses regions or providers, the model breaks down.
Tiered pricing makes costs hard to forecast. Egress fees penalize movement. Resource contention slows performance, and interoperability gaps lock teams into static configurations. AI video workloads amplify the problem: training, inference, and storage often require different environments optimized for each stage.
Dimensional Research’s data shows that 55% of organizations note egress costs as the single biggest barrier to switching cloud providers. Many stay with less efficient or more expensive infrastructure simply because the economics of mobility make innovation too costly. Moving just 1 PB of data out of AWS storage in the US East region costs about $53,800 per month—often enough to halt multi-cloud testing entirely.
The true cost, however, is in the experiments that are never run and the innovations that don’t get discovered because of a pricing structure that discourages exploration.
Freedom of data movement is the new competitive edge
In generative AI, the pace of progress is set by how quickly teams can test, retrain, and redeploy new models. That agility requires data mobility.
As organizations adopt composable AI stacks that mix specialized compute, regional storage, and orchestration tools, success depends on how openly data flows between them. Teams that design for movement can scale faster, adapt to new technologies, and stay resilient as infrastructure changes.
For teams building generative AI video applications, the impact is especially pronounced. A studio fine-tuning a diffusion model might burst to GPU providers with available capacity, render high-resolution outputs, and archive them for reuse, all without rewriting code or paying to move the data each time.
Data mobility has become a measure of competitiveness. The faster teams can move information across environments, the faster they can innovate.
How to build an egress strategy that fuels innovation
A good egress strategy ensures that storage and compute stay aligned as workloads scale. It helps teams anticipate cost, performance, and interoperability issues before they turn into blockers.
Here are a few practical steps to get there:
Map your data flows. Identify where data originates, how it moves between services, and which transfers happen most frequently.
Quantify transfer and API transaction costs. Include both in your total cost of ownership models. Even small fees add up quickly at petabyte scale.
Test portability. Run controlled migrations or bursts to secondary compute providers to expose hidden bottlenecks.
Select for openness. Favor vendors with flat, transparent pricing, free or low-cost egress, and broad S3 compatibility.
Plan for growth. Multimodal models and higher-resolution video outputs will multiply data transfer volumes. Design bandwidth and budget models accordingly.
Beyond controlling costs, the goal is to keep flexibility built into your architecture so your team can use the best tools for each stage of the AI pipeline, without being trapped by pricing friction or closed ecosystems.
The Backblaze difference: Open by design
Storage that supports innovation shouldn’t penalize movement. That’s why we created Backblaze B2 Overdrive to give teams with high-throughput, data-intensive workloads the flexibility they need to innovate.
Overdrive is the right fit for AI video because of its:
Predictable economics: $15/TB/month with unlimited free egress (no penalties for moving data to the compute you need).
Zero transaction fees: API calls don’t become a hidden tax as pipelines scale.
S3 compatibility and high throughput: Drop into existing pipelines without rewrites and keep large media workflows moving quickly across training, rendering, inference, and archive.
AI startup Decart put Backblaze B2 through its paces as it developed a real-time generative AI open world model, with millions of hours of training video data and multi-petabyte workloads daily.
What we really needed was a place where we could store an insane amount of data and, at the same time, download it to a few different GPU clusters around the world, and for all that to not cost an insane amount of money. That’s why we chose Backblaze.
—Dean Leitersdorf, Co-Founder and CEO, Decart
With Backblaze’s free egress model, they reduced AI operation costs by 75% while maintaining flexibility across compute environments.
If you’re scaling generative AI video, Backblaze B2 Overdrive gives you the freedom to put data where it performs best, without egress penalties, transaction surprises, or architectural do-overs.
We’re approaching a fascinating inflection point in AI development. Research from Epoch AI indicates that high-quality text data will be fully exhausted by 2026 to 2028. As recently as January, OpenAI co-founder Ilya Sutskever said at a conference that all the useful data online had already been used to train models. Over 35% of top websites now block AI scrapers. OpenAI is cutting deals with publishers like The Financial Times because freely available training data is running out.
So what comes next? Multimodal data: video, images, audio, sensor readings. Data that captures how the physical world actually operates, not just how we describe it in text.
Nvidia CEO Jensen Huang highlighted this shift when discussing Tesla’s AI advantage. He noted that the company has a “phenomenal position” because Tesla is collecting massive amounts of real-world data through its AI-enabled factories and autonomous vehicles.”
This real-world data, what some call “world data,” is multimodal at its core. It includes video from cameras capturing spatial relationships and motion, sensor telemetry recording physical interactions, images showing object states, and audio capturing environmental context. Video is particularly valuable because it captures temporal dynamics, depth perception, and how objects interact over time, insights that static text or images alone cannot provide.
Here’s the insight most organizations miss: you’re already generating this data.
Your organization is already producing multimodal data
Every single day, your organization produces massive amounts of multimodal data, including:
Zoom calls with video, audio, and screen shares
Security camera footage
Customer service interactions combining chat logs, voice recordings, website screen recordings and product images
Marketing teams creating videos, graphics, and campaign documents
Sales demos mixing presentations, product screenshots, and recorded conversations
And that’s just the short list.
The problem isn’t scarcity. It’s how multimodal data gets siloed, deleted, or stored in ways that make it unusable for AI applications. Video sits in one system and transcripts in another, with metadata scattered across databases. Most organizations treat this as operational exhaust rather than the strategic asset it represents.
Organizations that start systematically leveraging their multimodal data today will have capabilities tomorrow that generic models can never match.
The challenge: Multimodal infrastructure complexity
Building AI systems that work across images, video, audio, and text traditionally requires stitching together a fragmented technology stack. Videos live in object storage. Structured data sits in relational databases. Vector embeddings need specialized vector databases. Custom ETL pipelines handle transformations. Orchestration code coordinates everything. You need separate systems for caching, versioning, and lineage tracking.
This “data plumbing” consumes more engineering time than actual AI development. A straightforward workflow like building a searchable video archive with object detection and similarity search requires coordinating five or more systems and writing hundreds of lines of orchestration code.
The complexity creates a barrier that prevents most organizations from leveraging their multimodal data effectively, even when the underlying AI models are accessible through APIs. That’s the gap that Pixeltable solves.
How Pixeltable simplifies multimodal data workloads
Pixeltable replaces the fragmented multi-system architecture typically required for AI applications with a single declarative table interface. Instead of coordinating databases, file storage, vector databases, APIs, and orchestration tools separately, you work with tables where multimodal data lives alongside your transformations and AI operations.
The approach is straightforward. Store multimodal data in tables, define transformations as computed columns, and query everything together. Pixeltable handles the orchestration, caching, and model execution automatically.
Connect to data in-place
Point Pixeltable at your existing object stores like AWS S3 or Backblaze B2 Cloud Storage without moving or duplicating data. Your files stay where they are, organized into queryable, versioned tables. No separate databases or vector stores needed.
Define workflows declaratively
Transformations, model inference, and custom logic become Python computed columns. Extract frames from video, run object detection, generate embeddings, define it once and Pixeltable auto-orchestrates execution, manages dependencies, and handles incremental updates when new data arrives.
Query across everything
Leverage semantic search co-located with metadata. Raw data and AI-generated results in one interface. Build RAG systems with auto-synced embedding indexes that eliminate separate vector database management.
Focus on logic, not infrastructure
Full versioning for reproducibility. Automatic incremental processing means only necessary computations run when data changes. The same code works in development and production without rewrites.
For a practical example, explore our companion Github notebook Multimodal Data Processing with Pixeltable and Backblaze B2. It demonstrates how to extract and transform video frames using Pixeltable, then store the processed results in Backblaze B2 Cloud Storage with automatic URL generation.
Powering multimodal AI with Pixeltable and Backblaze B2
At Backblaze, we understand how essential multimodal data has become for AI development. Our collaboration with Pixeltable integrates B2 Cloud Storage directly into their open-source framework, giving organizations a simple and scalable foundation for managing complex AI workloads.
Pixeltable’s declarative design works seamlessly with Backblaze B2 across the entire AI data lifecycle. Whether you are processing video for model training, running inference on image streams, or building retrieval-augmented generation systems with multimodal embeddings, Backblaze B2 provides reliable S3 compatible storage that Pixeltable can reference directly without data duplication.
We are working closely with the Pixeltable team on a handful of initiatives to make multimodal workflows easier to deploy and scale. For those exploring this integration, we provide an example that demonstrates how Pixeltable and Backblaze B2 work together across the multimodal AI pipeline.
The data that fuels multimodal AI already exists across most organizations, from meeting recordings to customer interactions, video archives, and sensor logs. With Pixeltable and Backblaze B2, the infrastructure to harness that data effectively is now within reach.
It’s that time of year again where the holidays are barreling towards us at an incredible rate. With so many cyber sales and new things hitting the market, it’s the most wonderful time of year to read gift guides. To help, I’ve asked my fine companions at Backblaze to list out some of their favorite gift ideas for this year, and I’ve compiled them for you here. Enjoy the suggestions, and my rambling commentary!
The couch outside of my office and the recliner are where I spend the majority of my at-home time. What better way to keep your drinks, snacks, and second screens handy than this caddy?
Have you ever put cereal and milk into a yeti mug and drank it after everything’s turned into a sugary mush? Me neither, but now you don’t have to—this cup allows you to maintain two great tastes that taste great together, but without them having to touch until you’re ready!
For the chef in your life—or for the aspiring chef that never quite understood what the word “seasoning” meant—this is a great seasoning blend. Let’s face it, if you’re eating their food, it’s a gift for you too!
Another one for the chef’s in your life. This knife block bundle looks good, by all accounts feels good, and also cuts good—which is great. By the way, does anyone in your life use pairing knives? It’s something I’m just now getting the hang of…fun!
I have this, I use this, and I love this. It’s likely been in gift-guides of yesteryear but it’s just that good. Whether you’re a single human like me who doesn’t want to open a whole bottle and just wants a glass from time to time, or you’re an aficionado wanting to taste his bottles before opening them for a fancy dinner, this pumps inert argon gas into your wine bottles without having to open the cork. Great stuff.
Popularized by Tiktok videos, this olive oil stands up to the hype and adds a good amount of actual flavor to your dishes. Whether you’re drizzling or frying, it’s a good recommendation!
And speaking of frying, Butcherbox allows you to order sustainability sourced meats and have them delivered right to your door. It might be too late if you’re looking for a Thanksgiving bird, but you might need a few steaks eventually!
Espresso. Some pronounce it with an “x.” And while it does give you a caffeine boost in a hurry, there’s nothing express about it…except for getting a machine like this that can really speed up and boost your home coffee consumption.
Soft, cuddly, and rapidly drying—these towels are a treat. I got to use one a few months ago while visiting a friend of mine and I still think about them, seriously! It might actually be time to rotate my towels and these are at the top of the list.
Cleaning yourself with onsen towels is great, but what about cleaning the actual shower or bath? These allow you to get all the nooks and crannies between the tiles, and because they’re cordless you can also use them on your car rims. Do you ever wash those? You should!
What’s one of my top-10 favorite things? Assembling Ikea furniture while listening to music. But I also enjoy biking! This combines both as the adult and children bikes are shipped to you and you get to assemble them at home before taking them on the road! It keeps costs low, and satisfaction high!
I have been wearing fitness trackers for a very long time, from smartwatches to fitbits to step-counters, and this is my favorite one so far! I love that I can quickly charge it every 4-5 days and it gives me great insights into activity and sleep, without having to wear something bulky to bed.
I am often envious of people who travel with duffel bags because of all the stuff you can fit into them. I still use my old-timey rollaboard, but I do have one of these that I throw in the car with me when I hit the ski slopes. These are great, come with backpack straps, and also have a lot of clips where you can hook carabineers up to (which is a great way to bring shoes you don’t want to pack).
Airplanes have come a long way but unless you’re sitting in your own personal pod up front (must be nice), there never seems to be enough room for all your stuff! This ledge fits neatly onto your window sill and allows for you to get a little more utility out of your surroundings! Just…don’t get an aisle seat.
As the Wu-Tang Clan once sang, “protect ya neck.” This travel pillow helps do just that when you’re on the go. No one likes falling asleep on a plane and waking up to a stiff neck—this helps!
These are great for monitoring the outside of your home, but the real killer app comes from using the indoor ones as baby monitors. Seriously, my family has been using them for years in the kiddos’ rooms, and not only is the quality much better than a standard baby monitor, but the recording features make for some really cute videos, and there’s no range restrictions. It’s a win-win-win.
3D printing has become very mainstream over the last few years, and this at-home unit with space for multiple filaments makes it incredibly easy to create your favorite designs.
Books. You know them, you love them, you should probably read one of my favorites from the last 10 years (The 7 ½ Deaths of Evelyn Hardcastle) and any of the Kindles should help you do just that! I’m a book on tape guy now because I tend to walk a lot (and if you have Audible I highly recommend the Dungeon Crawler Carl series), but if you enjoy holding something in your hands, the paper white Kindles are fantastic.
Classic games are classic for a reason! The recommendation from our org was for Diablo on Good Old Games, but there are a ton of classics there to choose from. One of my favorite series: Quest for Glory. Version 4 my favorite as it dives into Eastern European folktale lore!
Transformers have always been popular, and these voice-activated robots are what I dreamed of when I was a kiddo. Now that I’m no longer a kiddo, I still kind of want one, because watching toys “build themselves” gives me real Toy Story vibes.
K-Pop Demon Hunters took the world by storm, and now you can turn it into a crafting activity for you or your kiddos! Wobbles are little crochet kits, and come with everything you need to make something cute and squishy, right at home!
This little gaming handheld allows you to emulate the games of your youth. Whether you liked playing the Sega Game Gear or the Game Boy, you can get all your favorites in one place with these on-the-go systems.
On the go or on the couch, good headphones are paramount. These are relatively shallow and offer noise cancelling technology to keep the outside world out while you’re listening to tunes, audiobooks, or podcasts!
Give the gift of Backblaze
Of course you can always give the gift of Computer Backup. It makes a great gift and helps keep the data of your family and friends safe and sound. Peace of mind is a great gift.
Something you’ve had on your mind didn’t make our list? Tell us in the comments—we love hearing what people are excited about!
Today, we’re announcing the general availability of provisioned mode for AWS Lambda with Amazon Simple Queue Service (Amazon SQS)Event Source Mapping (ESM), a new feature that customers can use to optimize the throughput of their event-driven applications by configuring dedicated polling resources. Using this new capability, which provides 3x faster scaling, and 16x higher concurrency, you can process events with lower latency, handle sudden traffic spikes more effectively, and maintain precise control over your event processing resources.
Modern applications increasingly rely on event-driven architectures where services communicate through events and messages. Amazon SQS is commonly used as an event source for Lambda functions, so developers can build loosely coupled, scalable applications. Although the SQS ESM automatically handles queue polling and function invocation, customers with stringent performance requirements have asked for more control over the polling behavior to handle spiky traffic patterns and maintain low processing latency.
Provisioned mode for SQS ESM addresses these needs by introducing event pollers, which are dedicated resources that remain ready to handle expected traffic patterns. These event pollers can auto scale up to 1000 per concurrent executions per minute, more than three times faster than before to handle sudden spikes in event traffic and provide up to 20,000 concurrency–16 times higher capacity to process millions of events with Lambda functions. This enhanced scaling behavior helps customers maintain predictable low latency even during traffic surges.
Enterprises across various industries, from financial services to gaming companies, are using AWS Lambda with Amazon SQS to process real-time events for their mission-critical applications. These organizations, which include some of the largest online gaming platforms and financial institutions, require consistent subsecond processing times for their event-driven workloads, particularly during periods of peak usage. Provisioned mode for SQS ESM is a capability you can use to meet your stringent performance requirements while maintaining cost controls.
Enhanced control and performance
With provisioned mode, you can configure both minimum and maximum numbers of event pollers for your SQS ESM. Each event poller represents a unit of compute that handles queue polling, event batching, and filtering before invoking Lambda functions. Each event poller can handle up to 1 MB/sec of throughput, up to 10 concurrent invokes, or up to 10 SQS polling API calls per second. By setting a minimum number of event pollers, you enable your application to maintain a baseline processing capacity that can immediately handle sudden traffic increases. We recommend that you set the minimum event pollers required to handle your known peak workload requirements. The optional maximum setting helps prevent overloading downstream systems by limiting the total processing throughput.
The new mode delivers significant improvements in how your event-driven applications handle varying workloads. When traffic increases, your ESM detects the growing backlog within seconds and dynamically scales event pollers between your configured minimum and maximum values three times faster than before. This enhanced scaling capability is complemented by a substantial increase in processing capacity, with support for up to 2 GBps of aggregate traffic, and up to 20K concurrent requests—16x higher than previously possible. By maintaining a minimum number of ready-to-use event pollers, your application achieves predictable performance, handling sudden traffic spikes without the delay typically associated with scaling up resources. During low traffic periods, your ESM automatically scales down to your configured minimum number of event pollers, which means you can optimize costs while maintaining responsiveness.
Let’s try it out
Enabling provisioned mode is straightforward in the AWS Management Console. You need to already have an SQS queue configured and a Lambda function. To get started, in the Configuration tab for your Lambda function, choose Triggers, then Add trigger. This will bring up a user interface where you can configure your trigger. Choose SQS from the dropdown menu for source and then select the SQS queue you want to use.
Under Event poller configuration, you will now see a new option called Provisioned mode. Select Configure to reveal settings for Minimum event pollers and Maximum event pollers, each with defaults and minimum and maximum values displayed.
After you have configured Provisioned mode, you can save your trigger. If you need to make changes later, you can find the current configuration under the Triggers tab in the AWS Lambda configuration section, and you can modify your current settings there.
Monitoring and observability
You can monitor your provisioned mode usage through Amazon CloudWatch metrics. The ProvisionedPollers metric shows the number of active event pollers processing events in one-minute windows.
Now available
Provisioned mode for Lambda SQS ESM is available today in all commercial AWS Regions. You can start using this feature through the AWS Management Console, AWS Command Line Interface (AWS CLI), or AWS SDKs. Pricing is based on the number of event pollers provisioned and the duration they’re provisioned for, measured in Event Poller Units (EPUs). Each EPU supports up to 1 MB per second throughput capacity per event poller, with minimum 2 event pollers per ESM. See the AWS pricing page for more information on EPU charges.
To learn more about provisioned mode for SQS ESM, visit the AWS Lambda documentation. Start building more responsive event-driven applications today with enhanced control over your event processing resources.
In cloud storage and compute, “less is more” no longer applies. As data grows and expectations rise, businesses need performance, reliability, and real value—not just lower costs. It can be tempting to rely solely on hyperscalers like AWS, but the challenge is understanding where cloud performance truly meets value.
That’s why Backblaze is launching Performance Stats, our newest stats content built on the transparency of Drive Stats and Network Stats. This ongoing, quarterly report will share performance testing results—for both Backblaze and competitors—as well as the testing methodology so that anyone can recreate, compare results, and contribute to building better tests if necessary. (So, feel free to argue with us in the comments.)
By publishing everything—strengths, weaknesses, and all—we’re hoping to give AI leaders, app developers, and decision-makers a clear, honest view of how Backblaze and other cloud storage providers perform in the wild.
Get the full Stats picture live
Drive Stats was the beginning. Want to see the evolution? Check out the Backblaze Stats webinar, bringing together content from all of our Stats series. We’re going to chat about all things Backblaze and beyond—by the numbers.
Cutting through the noise on cloud performance
Frankly, it’s super frustrating how opaque performance metrics can be, and how many misleading storage reports are out there. Building accurate tests is complicated for a lot of reasons—so many factors are contingent on things that product builders and even end users control, like where and how data is stored, where it’s being served to end users, and so on. And, most published content on this topic has been tested from inside the cloud storage company’s architecture, which means that they’d give themselves preferential results.
While our report may not be perfect, our transparent approach—particularly publishing the testing methodology—will allow us to mitigate some of those concerns.
We want to take a hard look at performance on a level playing field for two reasons:
Buyers should know what they’re getting and have the tools to sniff out the hype and misleading messaging many providers peddle about their performance.
If we don’t measure ourselves, we won’t get better. We want you to understand where we’re doing well today, and we want to take you along for the ride as we work to improve where we’re not.
Without further ado, here are the results
We ran performance testing for Backblaze B2, AWS S3, Cloudflare R2, and Wasabi Object Storage. These tests were conducted using Warp, an open-source S3 benchmarking tool for cloud object storage performance. We’ll expand on the methodology after we get into the numbers.
Key findings:
While AWS S3 demonstrates the lowest average download speeds across the board, the hyperscaler didn’t win on sustained download throughput measurements. Five minute single- and multi-threaded benchmarking tests showed AWS winning on only one out of eight sustained throughput tests, indicating that there’s much more to the story than average download speeds. Meanwhile, Backblaze won in six out of eight categories, with Wasabi coming in first on the remaining test. (That being said, it’s wise to take this with a grain of salt given the small cohort in this initial dataset—more robust testing may show different results.)
Sustained throughput testing shows the most differentiation at small file sizes for both single and multi-threaded testing. For example, in multi-threaded upload benchmarking for the 256KiB file size, our highest value was 580% higher than the lowest. In single threaded upload benchmarking for the same file size, the highest value is 700% higher. Download throughput showed 247% and 304% in multi- and single-threaded tests, respectively. Small file size testing can have interesting impacts on overall performance—these files have the most overhead, and are typically more likely to show latency.
Backblaze B2 demonstrates the fastest average upload speeds for small file sizes, with AWS S3 leading for larger file sizes. And, similar to downloads, the story becomes more nuanced when we look at sustained upload throughput, where Backblaze leads for both the smallest (256KiB) and largest (100MiB) file sizes on multi-threaded tests with Wasabi taking the lead in the mid-range.
And, here’s a jump-to if you want to quickly reach each test:
This test shows the average time in milliseconds it takes to upload a file. Averages were taken across a month of data and for three different file sizes.
In these tests, a lower result is better (i.e., it represents a faster result). Note that we do not have data for Wasabi: Wasabi does not allow users to run HTTP requests for the first 30 days of a new account period, and when we ran this report, our testing account was still within that time period.
In each of the charts, we’ve outlined the “winner” in green for each category for easy readability.
Backblaze B2 wins for small files, coming in at 12.11ms, and AWS S3 leads for 2MiB and 5MiB files, coming in at 76.79ms and 201.40ms, respectively. Whether or not these numbers are inherently “good” or tolerable depends on quite a few factors—we’ll run through some examples comparing use cases to where we see Backblaze succeeding later in the report.
Five minute multi-threaded upload benchmark
In these tests, a higher result is better, as the result represents more average data being pushed in the five minute time period. This gives us quite a bit more information than just average upload time for a single file—rather, it tells us the sustained amount of data you can push to a cloud storage provider in five minutes.
Interestingly, we have a pretty large spread between our highest and lowest values, most stark amongst the smallest files where Backblaze B2 demonstrates the highest sustained throughput at 163.80MiB/s and Cloudflare R2 demonstrates the lowest at 24.10MiB/s.
This is important because the strength of object storage is that it lets you run concurrent operations to read many ranges of bytes in the same file. Moreover, thread operations are a configurable element of most cloud storage accounts (though too many concurrent operations can trip rate limits that are dependent on the provider).
So, when we think about contextualizing with the average time to a file upload completion, the task includes making the request, the handshake between requester and server, routing the request through the cloud storage provider, then time it takes to read all data, and then notification that your upload is complete.
Threading lets you run the actual process of the return of information concurrently—so while file overhead (handshake) should be relatively consistent, you can get quite a bit faster on large file uploads. And, even when you have consistent results on file overhead, networking paths can make a difference on delivery times. While we can consider networking routes mostly stable (especially for synthetic performance testing), it’s certainly not a guarantee. Peering policy changes, network maintenance and/or outages, and CDN usage can all affect your routing day to day or month to month.
Changing the view a bit, we see some interesting shapes when we plot each providers’ improvement as file sizes get larger:
It’s intuitive that you’d automatically push more data as file sizes get larger, but the shape of each’s improvement is a stark contrast. The rate of increase (which you can see in our trendlines as the slope) isn’t constant, and we see Backblaze and AWS showing consistently better performance at the higher file sizes. Wasabi tracks with that growth in the smaller file sizes, but falls off at the 50MiB and 100MiB. Meanwhile, we see Cloudflare returning the lowest net values, while flattening out at smaller file sizes as well.
In most performance data, you expect a logarithmic relationship between data points—and so comparing their different shapes—when the trendline flattens out and/or when it deviates from an ideal logarithmic scale—can be telling. You can define an expected logarithmic curve using an average of all providers, then compare each provider’s residuals (how far above or below that curve it sits). We’ll save that analysis for another day, and a more mature dataset.
It’s also interesting to look at data point clustering by file size. As our dataset matures over time and as we add providers, clustering in these charts start to tell a story. If you want a quick idea of good, better, best and you don’t have a large enough cohort for a true tiered definitional schema, it’s a good visual shortcut—you can easily see if different providers’ results are spread out or if they cluster together at a specific level of performance. The winners for each test are labeled in green.
And, as we said above, in all cases (and one of the most frustrating parts about collecting performance stats) is that your mileage may vary—you always want to compare the needs of your customers and product to the performance you need and how much it costs you.
Five minute single threaded upload
Once again, higher is better in this result, and it measures the sustained amount of data you can push to a server based on file size. As a reminder, multi-threading allows you to concurrently read a single file; while single threading is one, sustained process from start to finish.
Backblaze B2 again leads in small file sizes, with AWS S3 leading for 5MiB files and Wasabi for 50MiB and 100MiB files.
As above, here’s the trendline:
And, like in the multi-threading results, we can look at the clustering in each file type size:
Download comparisons
This test shows the average time in milliseconds it takes to download a file. Averages were taken across a month of data and for three different file sizes.
A reminder that lower is better in this test as it represents a faster result, and there’s no data for Wasabi in this series due to limitations on HTTP requests within the first 30 days of opening a new account.
AWS S3 leads across the board on this test, with Backblaze B2 taking second and Cloudflare R2 taking third consistently.
And, it’s worth separately tracking TTFB because TTFB is a good, but not sufficient statistic when we’re interpreting results.
Why isn’t this datapoint sufficient to fastest speeds? Not only does TTFB conflate many parts of your networking layer (so it can be affected by things like connection reuse policies), but it’s also such a small part of the overall transfer time and highly variable based on environment. So, its use is really in conversation with the sustained throughput numbers.
Cached vs. uncached downloads (Backblaze only)
We were also curious to see if caching within our own network would show up, and, if so, we’d want to make sure we weren’t unintentionally giving ourselves a favorable stance. So, we ran a series of tests for cached and uncached downloads by including the header X-Bz-Flush-Cache-First=true.
We do see slightly slower speeds in uncached downloads, but they’re likely a result of the same factors anyone externally hitting our system would see. Additionally, during the course of our testing, Backblaze made cacheless downloads the default behavior for our architecture—so, it will be interesting to monitor this statistic going forward.
Five minute multi-threaded download benchmark
In these tests, a higher result is better, as the result represents more average data being downloaded in the five minute time period.
Backblaze B2 leads for 256KiB, 50MiB, and 100MiB file sizes. AWS S3 has a slight advantage for 5MiB files.
And, let’s give ourselves the same charts as our above upload tests for consistency’s sake. Here’s the trendline:
While AWS and Backblaze track closely for the 256KiB and 5MiB file sizes, Backblaze wins out at 50MiB and 100MiB. Meanwhile, Cloudflare lags at the smallest file sizes, but shows rapid improvement, peaking at the 50MiB file sizes. Interestingly, this is arguably Wasabi’s weakest showing compared to all other sustained throughput testing, though they have strong results at the 256KiB file size and a respectable showing at the 5MiB file size.
And here’s the per-file size clustering:
Five minute single-threaded download throughput
Again, in these tests, a higher result is better, as the result represents more average data being downloaded in the five minute time period.
Here, Wasabi wins for 256KiB files, and Backblaze wins for 5MiB, 50MiB and 100MiB files. Note that this is a solid trend for Wasabi in the 256KiB file sizes—they came in second in the multi-threading download testing, as well as both single and multi-threaded upload testing.
And here’s our clustering:
Test methodology
Our goal with these benchmarks is simple: to understand how our cloud performs under real-world conditions and to share that information as clearly as possible. To do that, our Cloud Operations team runs repeatable, synthetic tests that measure upload (PUT) and download (GET) performance.
We ran both upload and download tests across all four vendors. Upload tests measured the following file sizes:
256KiB
5MiB
50MiB
100MiB
Download tests measured:
Time-to-first-byte (TTFB)
Total time to download the following file sizes:
256KiB
5MiB
50MiB
100MiB
Why do performance tests use mebibytes (MiB) instead of megabytes (MB)?
We’ve written articles in the past about how all computers are fundamentally a collection of logic circuits (transistors) in either an on or an off state, which means that they communicate in binary, or a base two language. Humans, however, tend to prefer base 10 languages. There are lots of reasons for this, but that’s a story for another time.
MiB is a base two unit of measurement, whereas MB is a base 10. Here’s a comparison:
Unit
Definition
Bytes
1MB (megabyte)
Base-10 (decimal)
1,000,000 bytes
1MiB (mebibyte)
Base-2
1,048,576 bytes (1024×1024)
The difference between those two measurements may seem small, but it has a significant impact when you’re talking about performance sensitive systems. Oftentimes you’ll see marketing language shift to talking about MB because it’s more understandable to a wider audience, but to get accurate results, MiB is what you need.
Tests run in five-minute profiles to observe consistency over time, and we ran both single and multi-threaded download and upload tests. From a practical perspective, what’s happening is that we’re pushing repeated requests to a cloud storage provider as many times as we can for five minutes.
All tests originate from a Vultr-hosted Ubuntu virtual machine (VM) located in the New York/New Jersey area, routing through Catchpoint’s network into object storage regions located generally in US-East. By keeping the source environment stable and the test target consistent, we isolate performance variables within each provider’s infrastructure rather than the test environment itself.
Consistency measures
To ensure each test result represents genuine performance rather than environmental noise, we built repeatability into the process:
Identical test instances: All runs used the same VM type, operating system (OS) image, and configuration.
Fixed regions: Tests originated from the same location (NY/NJ) targeting the same US-East region across providers.
Controlled routing: Network paths were held constant through Catchpoint’s monitoring network to minimize geographic or peering variation.
Repeated runs: Each test profile (5 min) was executed multiple times, and averages were used to reduce the impact of transient spikes.
Standardized payloads: All uploads and downloads used identical objects to ensure a consistent file-size baseline.
Unchanged test intervals: Tests were scheduled at regular intervals over multiple days to capture both typical and outlier performance.
About synthetic testing
Synthetic monitoring provides a controlled, apples-to-apples comparison, but it doesn’t replicate every production workload. These tests are run outside our own infrastructure—from neutral vantage points—to simulate a customer’s experience at the “last mile.” This distinguishes our approach from competitors who benchmark internally under optimized conditions.
It’s important to note that synthetic results won’t mirror every customer’s experience. Different architectures, connection paths, and file patterns will produce different performance profiles. Our intent is to offer transparency into the methodology and relative behaviors, not to suggest that all workloads will perform identically.
Limitations and future work
Every benchmark is an approximation. These results provide a controlled look at how cloud storage performs under repeatable conditions, but they don’t capture every variable in production environments. Below, we outline what our current tests don’t measure and where we’re headed next to deepen the picture.
Synthetic, not real-world workloads: These benchmarks simulate real activity but don’t reproduce the full variability of customer workloads, concurrency levels, or data locality patterns. They are best understood as directional insights rather than absolute truths.
The internet is the internet: Once traffic leaves the test node, we can’t control the routing, peering, or transient network conditions between endpoints. Each provider’s own network policies and routing optimizations—for example, Wasabi’s inbound connection rules—can influence the results.
Static test conditions: All tests were conducted from a single region (NY/NJ to US-East cloud providers). Real-world customers operate globally, where peering arrangements, congestion, and latency differ widely.
Potential caching effects: Although we designed the tests to avoid cached reads, Catchpoint does not allow full data randomization. It’s possible some repeated reads benefited from intermediate caching at any network layer.
Traffic shaping and rate limiting: Providers may apply rate limits or throttling when detecting high-frequency test traffic. For example, Wasabi temporarily blacklisted our IPs due to testing volume—a reminder that these results represent observed behavior, not formal service guarantees.
Each of these limitations points toward future testing opportunities. Here’s what’s next on our testing roadmap:
Regional expansion: Extend current US-East tests to US-West and EU regions using equivalent test setups.
Vendor expansion: Extend testing to more vendors, including Google Cloud Platform and Azure.
File size sensitivity testing: Investigate performance across a wider range of file sizes, including 100MiB+ objects. This will help clarify where different architectures favor small-object throughput versus sustained large transfers.
Traffic rate & throttling analysis: Incorporate monitoring for request-per-minute and total-bytes-transferred metrics to detect possible provider-level rate limiting. We’d love to invite vendors to validate thresholds and eliminate false negatives.
Concurrency patterns: Test multiple thread and connection strategies to model real-world transfer concurrency, especially for use cases involving parallel uploads or downloads.
Benchmark visualization: Transition from CSV data collection to Grafana dashboards, enabling continuous visualization of test results and performance drift over time.
Performance is an evolving target, and so is our testing methodology. Each round of analysis helps us not only understand how Backblaze performs in context, but also refine how we measure, compare, and communicate that performance. Our goal remains the same: make the data real, repeatable, and useful.
What this means for real-world use cases
Based on the results we’ve shared here, there’s plenty of room for argument around the value of different performance profiles. But, continuing our theme of transparency: Since we’re transparent about our performance, warts and all, we’re going to be transparently candid in the areas where think the Backblaze platform is showing some nice results:
AI/ML inference: Our strong read latency and throughput make Backblaze ideal for inference workloads that need to pull model artifacts, inputs, and outputs quickly. For example, when a service like Hugging Face or Runway ML feeds an image into a convolutional neural network, lower read latency directly translates to faster inference delivery.
Feature stores & embedding lookups (AI/ML): Optimized small-object reads and efficient small writes support rapid lookups and occasional updates common in vector databases and feature stores like Feast, Qdrant, Pinecone, or Weaviate.
LLM-based retrieval-augmented generation (RAG) systems: RAG systems store many small document chunks that are written once and read repeatedly, so our read-optimized performance accelerates retrieval of document chunks or embeddings, improving response times for large language model applications. Vectorized databases are also a hot topic right now for good reason—they’re changing patterns around file sizes and retrieval patterns in RAG applications and LLM training.
Log & event analytics (SIEM, IoT, etc.): Competitive small-write performance and fast reads make Backblaze well suited for log aggregation and analytical querying with tools like Loki, Fluentd, Vector.dev, and OpenObserve once data is ingested.
Interactive data lake querying: Consistent throughput and fast download speeds deliver responsive querying and exploration for business intelligence (BI) and ad hoc analytics workloads.
CDN origin: Excellent read throughput, stable performance, and free egress make Backblaze a high-value choice for powering content delivery at scale.
As discussed, one of the reasons it’s so hard to get directly comparable performance benchmarks is because there are so many configurable elements on the user’s side that can affect the results. For example, if you know that your provider is faster on smaller files, you might choose to store your unstructured data in smaller parts so that you achieve faster performance.
That means that when we share results like this, it enables you to interpret which provider is a better fit for your different types of workflows.
For a cloud storage provider, tracking these metrics over time and comparing to other aspects of our internal architecture enables us to support ongoing and continual performance improvement, and to understand how much of an impact single changes might make. This means that what seems like a simple project to change the way we read header requests can produce asymmetrically favorable results.
And, there’s a layer of this that’s always going to come down to design decisions. For example, we’ve talked about some of the logic behind where our architecture knows which server to store data on. Basically, our system chooses to store a new file based on the available space of each server. So, if we have a server that has 40% space available, it would receive 40% of the incoming storage writes. (That’s a bit of an oversimplification, but you get the idea.)
Other cloud storage providers might prioritize, say, randomness in their write architecture. When a request would enter their system, the routing protocol would say, “Hey, we haven’t written to this server over here in a while,” and write it in that sector. It’s a different choice that can have a subtle ripple effect across different aspects of storage architecture.
What’s next?
Our performance story is one of steady, measurable progress. We’re not optimizing for a single headline number; we’re building toward consistent reliability across diverse workloads. That’s why we test openly, publish what we find, and continuously refine how we measure.
Looking ahead, our next Performance Stats report will continue to share these findings quarterly, which will give us all a more mature dataset to work with, and will expand testing. This isn’t just a transparency exercise for us, it’s a commitment to the developers and teams building on Backblaze: you deserve data you can trust—and we intend to keep earning it.
We’d love it if others—third parties and our competitors—also got involved, but we’ll see how things evolve. For now, feel free to let us know if these tests work for you.
Disclaimer: The performance data and comparisons presented here are based on tests conducted by Backblaze under the specific environments, configurations, and conditions described in this post. Actual results may vary depending on network conditions, workloads, geographic location, and other factors.
Backblaze has published its testing methodology so others can replicate or challenge the results; however, Backblaze makes no representation or warranty that its tests capture all possible variables or configurations. The information is provided for general informational purposes only and does not constitute a guarantee of future performance. In addition, the information in this post is based on data available at the time of publication, and Backblaze reserves the right to update or revise this information as new data, testing methodologies, or performance results become available.
All product names, trademarks, and registered trademarks are property of their respective owners. References to third-party products or services are for identification purposes only and do not imply endorsement or affiliation.
Every quarter, Drive Stats gives us the numbers. This quarter, it gave us a crisis of meaning. What does it really mean for a hard drive to fail? Is it the moment the lights go out, or the moment we decide they have? Philosophers might call that an ontological gray area. We just call it Q3.
As of June 30, 2025, we had 332,915 drives under management. Of that total, there were 3,970 boot drives and 328,348 data drives. Let’s dig into our stats, then talk about the meaning of failure.
This quarter, we have more to talk about (Stats-wise)
Drive Stats was the beginning. Want to see more of the full picture? Check out the Stats Lab webinar, bringing together content from all of our Stats articles. We’re going to chat about all things Backblaze (and beyond)—by the numbers.
Drive Stats: The digest version
Q3 2025 hard drive failure rates
During Q3 2025, we were tracking 328,348 storage drives. Here are the numbers:
Backblaze Hard Drive Failure Rates for Q3 2025
Reporting period July 1, 2025–September 30, 2025 inclusive Drive models with drive count > 100 as of July 1, 2025 and drive days > 10,000 in Q3 2025
Notes and observations
The failure rate has increased: The failure rate has changed, and by quite a bit. As a reminder, last quarter’s AFR was 1.36% compared with this quarter’s 1.55%. (Interestingly, the 2024 yearly AFR was 1.57%.)
That new drive energy: Say hello to the 24TB Toshiba MG11ACA24TE, joining the drive pool with 2,400 drives and 24,148 drive days. That means that we’ve hit the thresholds for the quarterly stats, but not the lifetime.
The zero failure club: It was a big month for the zero failure club, with four drives making the cut:
Seagate HMS5C4040BLE640 (4TB)
Seagate ST8000NM000A (8TB)
Toshiba MG09ACA16TE (16TB)
Toshiba MG11ACA24TE (24TB)—and yes, that’s the new drive.
For those of you tracking the stats closely, you’ll notice that the Seagate ST8000NM000A (8TB) is a frequent flier on this list. The last time it had a failure was in Q3 2024—and it was just a single failure for the whole quarter!
The highest AFRs were really high: The high end was so high that this month, it inspired us to run an outlier analysis using the standard quartile analysis (Tukey method). Based on that information, any drive with a quarterly AFR higher than 5.88% is an outlier, and there are three:
Seagate ST10000NM0086 (10TB): 7.97%
Seagate ST14000NM0138 (14TB): 6.86%
Toshiba MG08ACA16TEY (16TB): 16.95%
What’s going on there? Great question, and we’ll get into that after the lifetime failure rates.
Lifetime hard drive failure rates
To be considered for the lifetime review, a drive model was required to have 500 or more drives as of the end of Q2 2025 and have over 100,000 accumulated drive days during their lifetime. When we removed those drive models which did not meet the lifetime criteria, we had drives grouped into 27 models remaining for analysis as shown in the table below.
Backblaze Hard Drive Failure Rates for Q2 2025
Reporting period ending September 30, 2025 Drive models > 500 drives and > 100,000 lifetime drive days
Notes and observations
That lifetime AFR is pretty consistent, isn’t it? The lifetime AFR is 1.31%. Last quarter we reported that it was 1.30%, and the quarter before that, it was 1.31%.
The 4TB average age hasn’t shifted: As we’ve reported on previously, the 4TB drives are being decommissioned over time. Now, we’re down to just a handful left—just 11 of the ALE models and 187 of the BLE models. But, because their lifetime populations are so comparatively large, the additional drive days aren’t enough to move the needle on the average age in months. So, no ghosts in the machine here, and decommissioning is proceeding as planned.
Steady uptick in higher capacity drives: Of the 20TB+ drives that meet our lifetime data parameters, we’ve added 7,936 since last quarter. And, don’t forget that our newest entrée to the cohort, the Toshiba MG11ACA24TE (24TB), hasn’t made its way to this table yet—that adds an additional 2,400 drive models. All together, the 20TB+ club represents 67,939 drives, or about 21% of the drive pool.
Defining a failure—from a technical perspective
A question that’s come up a few times when we’re hosting a webinar or chatting in the comments section is how we define a failure. While it may seem intuitive, it’s actually something of a meaty conundrum, and something we haven’t addressed since the early days of this series. Tracking down the answer to this question touches internal drive fleet monitoring tools (via SMART stats), the actual Drive Stats collection program, and our data engineering layer. I’ll dig into each of these in detail, then we’ll take a look at the outliers for this quarter.
SMART stats reporting
We use Smartmontools to collect the SMART attributes of drives, and another monitoring tool called drive sentinel to flag read/write errors that exceed a certain threshold as well as some other anomalies.
The main indicator we use for determining if a drive should be replaced is when it responds to reads with uncorrectable medium errors. When a drive reads the data from the disk, but the data fails its integrity check, the drive will try to reconstruct the data using internal error correction codes. If it is unable to reconstruct the data, it notifies the host by reporting it as an uncorrectable error and marks that part of the disk as pending reallocation, which shows up in SMART under an attribute like Current_Pending_Sector.
On Storage Pods that control drives through SATA links, the drive sentinel will count the number of these uncorrectable errors a drive reports and if it exceeds a threshold, access to the drive will be removed. This is important in the classic Backblaze Storage Pods where five drives share a single SATA link and errors by one drive will affect all drives on the link.
On Dell and SMCI pods that use a SAS topology to connect drives, drive sentinel doesn’t remove access to drives because the errors are reported differently; but, that’s also not as critical since SAS minimizes the impact that a problem disk can have on others.
The Drive Stats program
We’ve talked about the custom program we use to collect Drive Stats in the past, and here’s a quick recap:
The podstats generator runs on every Storage Pod, what we call any host that holds customer data, every few minutes. It’s a C++ program that collects SMART stats and a few other attributes, then converts them into an .xml file (“podstats”). Those are then pushed to a central host in each datacenter and bundled. Once the data leaves these central hosts, it has entered the domain of what we will call Drive Stats.
For this program, the logic is relatively simple: A failure in Drive Stats occurs when a drive vanishes out of the reporting population. It is considered “failed” until it shows up again. Drives are tracked by serial number and we report daily logs on a per-drive basis, so truly, we can get pretty granular here.
The data engineering layer
To recap, we’ve collected our SMART stats and compiled them with the podstats program. Now we’ve got all the information, and data intelligence needs to add the context. A drive may go offline for a day or so (not return a response to those tools that collect daily logs of SMART stats), but it could be something as simple as a loose cable. So, time-wise, if a drive reappears after one day or 30, at what point in that period of time do we classify it as an official failure?
Previously, we manually cross-referenced data center work tickets, but these days, we’ve automated that process. On the backend, it’s a SQL query, but in human speak, this is what it comes down to:
If a drive logs data on the last day of the selection period (which in this case is a quarter) then it has not failed.
There are three human-curated tables that the query cross references. If a drive serial number appears on one of them, it tells us whether there’s a failure or not (depending on the table’s function).
If the drive serial number is the primary serial number in a drive replacement Jira ticket then it has failed. (Jira is where we track our data center work tickets.)
If the drive serial number is the target serial number in a clone Jira ticket or a (temp) replacement ticket, then it has not failed.
Basically, when we go to write the Drive Stats reports at the end of the quarter, if a drive has either appeared in one of our various work trackers or hasn’t re-entered the population, then it’s considered failed.
In rare instances, that can mean that we have so-called “cosmetic” failures when we have some work we’re doing on a drive model that lasts more than that quarterly collection period. And, spoiler, we have one of those instances that showed up in the data this month—our outlier Toshiba drive with the 16.9% failure rate. We’ll dig in in just a minute; but first, some context.
Connecting drive failure to overall picture of the drive pool
As we mentioned above, certain drives in the pool had such high swings in AFR that we ended up running an outlier analysis using the quartile method. (It’s also worth mentioning that a cluster analysis could potentially be a better fit, but we can save that for another day.) Based on that analysis, anything that has above a 5.88% failure rate is an outlier.
The primary motivation was inspired by an attempt to visualize the relationship between the age in months of a drive versus this quarter’s AFRs.
And yes, we’re fully aware that that’s a… super unreadable scatter plot. Removing the labels, this is a bit better:
We’re interested, really, in the shape of the relationship. If we posit that the older drives get, the higher their failure rates, you’d expect a larger concentration in the top right quadrant. But, our data follows a much more interesting pattern than that, with most of our data points concentrated in the lowest regions of the graph regardless of age—something you’d expect from a set of data that reflects a bunch of smart folks actively working towards the goal of a healthy drive population. And yet, we have some data points that break the mold.
As is pretty intuitive to my business intelligence folks in the audience, the process of identifying outliers is actionable data as well. Just like all press is good press; in our world, more data is more better. So, let’s take a closer look at those outliers. As a reminder, that’s these three drive models:
Seagate ST10000NM0086 (10TB): 7.97%
Seagate ST14000NM0138 (14TB): 6.86%
Toshiba MG08ACA16TEY (16TB): 16.95%
Seagate ST10000NM0086 (10TB)
This drive has some pretty explainable factors for the high failure rate. It’s well over seven years old (92.35 months). And, since it only has 1,018 drive models in operation, single failures hold a lot of weight compared with the average drive count per model—which comes in at 10,952 if you use the mean of this quarterly data and 6,177 if you use the median.
And, you can see that borne out in the trend in the last year of data:
Seagate ST14000NM0138 (14TB)
This drive is nearing five years in age (56.57 months) and, again, has a lower drive count at 1,286. More importantly, this particular drive model has had historically high failure rates. In parallel with above, here’s the last year of quarterly failure rates:
Toshiba MG08ACA16TEY (16TB)
Finally, our Toshiba model is the most interesting of all. It’s less than four years old (44.61 months), and has 5,145 drives in the pool. And, this quarter is clearly a change from its normal, decent, AFRs.
When we see deviations like this one, it’s usually an indication that there’s something afoot.
Never fear, Drive Stats fans; this was a known quantity before we went on this journey. This past quarter, working with Toshiba, we deployed some firmware updates they provided to optimize performance on these drives. Because we needed to pull drives to achieve this in some cases, we had an abnormal number of “failed” drives in this population.
What that means for this drive is that it’s actually not a bad drive model; and, given the ways we and Toshiba have worked together on a fix, we should see failure rates normalizing in the near future. And, this also goes back to our conversation of defining a failure—in this case, while the drives “failed,” the failure wasn’t mechanical and was based on something that we’ll be able to fix without replacing the drives. In short, don’t sweat the spike and pay attention to the long arc of performance on this population. We expect to see those drives happy and spinning for years to come (and with better performance, too).
The Hard Drive dataset (and beyond)
Thank you, as always, for making it through ~2,500 or so words to examine the fun side of data. Here’s our standard fine print:
The complete dataset used to create the tables and charts in this report is available on our Hard Drive Test Data page. You can download and use this data for free for your own purpose. All we ask are three things:
You cite Backblaze as the source if you use the data;
You accept that you are solely responsible for how you use the data, and;
You do not sell this data itself to anyone; it is free.
If you’re a new Drive Stats fan, consider signing up for the newsletter. If you’re not ready for that kind of commitment, sound off in the comments section below or reach out directly to us to let us know what you’re working on. Happy investigating!
The way data moves is changing in the age of AI. As AI training, model tuning, and inferencing accelerate massive, unpredictable flows of data across clouds, our network telemetry here at Backblaze offers a real-world view into the AI data gravity shift: where data lives, how it moves, and what it takes to keep it accessible and affordable.
Over the past couple of years, we’ve shared Network Stats snapshots that shed light on how data moves across Backblaze’s storage cloud. This quarter, we’re taking that foundation further, and evolving this series into a full-fledged transparency report that stands alongside Drive Stats with regular quarterly reporting and stats you can analyze for yourself.
This report isn’t just about traffic patterns. It’s a look at how data movement is changing in the age of AI and what those shifts reveal about performance, cost, and resilience at scale.
Tune in live for The Stats Lab webinar
Drive Stats was the beginning. Want to see the evolution? Check out the Backblaze Stats Lab webinar, bringing together content from all of our Stats articles. We’re going to chat about all things Backblaze and beyond—by the numbers.
In this first report, we’re going to outline the fundamentals of our dataset, highlight standout examples for AI related traffic, and lay the foundation to start sharing our quarter-over-quarter metrics.
Dataset details
Our internal tools allow us to capture network flow data, meaning transmission control protocol (TCP) conversations between parties on our network. Along with basic information such as who is talking and how many bits are being exchanged, we have the ability to record additional pieces of anonymized information like what country, what ISP, or if we’ve seen a particular IP address before. And for each of these metrics, we have numbers for the average, 95th percentile, and maximum values.

Let’s talk about the three elements that make up our dataset: time, values, and metadata.
1. Monthly time slices
For every month, for every region, and for each direction (egress and ingress), we are data warehousing the following metrics. We plan on either using month-by-month numbers, or rolling up into a quarterly value for Network Stats reports going forward.
Item
Detail
Date range
Every month
Location scope
Every region (eg US-West, EU-Central)
Network traffic direction
Ingress, egress
2. Metric values
For each monthly snapshot, we’re recording the following details in our data warehouse. Capturing the average, 95th weighted value, and the maximum allows us enough information to profile our traffic.
The 95th value (discarding the highest 5% bursts) gives us a good profile for daily operations and the maximum helps profile bust traffic.
The most interesting metrics that I’m excited to explore are the “bits per IP” values. This combination of “amount of traffic” transferred with “how many actors are involved” per network is a good proxy for what I’m calling the “magnitude” of the network flow. We’re exploring the first insight into this metric below in our chart section.
Defining the Network Stats Quarterly Data
Item
Field(s)
Detail
Name
name
asn
Common name and BGP ASN of the network
Bits
bits_avg
bits_95th
bits_max
Number of bits/second
Packets
packets_avg
packets_95th
packets_max
Number of packets/second
Flows
flow_avg
flow_95th
flow_max
Number of TCP flows
IPs
ip_unique_avg
ip_unique_95th
ip_unique_max
Number of unique IP addresses
Bits per IP
bits_ip_avg
bits_ip_95th
bits_ip_max
Number of bits per IP address
Protocol
v4
v6
Amount of traffic using IPv4 vs IPv6
3. Additional metadata
One of the first custom additions to our dataset is a category field. This helps us define the BGP ASNs (Autonomous System Number), basically the organizations common name associated with a range of IP addresses, that we talk to and group them into categories such as neocloud, hyperscaler, CDN, or general ISP.
Additional Network Stats Metadata
Item
Field
Detail
category
group
The class of network carrying the traffic (Cloud, PNI, traditional Internet Transit, or Internal Backblaze-Backblaze)
category
type
The type of network receiving the traffic (Neocloud, Hosting/Compute provider, Hyperscaler, CDN, Regional ISP, more localised ISP, etc)
The global picture
We started capturing this dataset in August of 2025, so we don’t yet have a good amount of data to pull out quarter over quarter trends. But what we can do for now is take a look into some standout metrics for the month of August that we’re interested in tracking over time.
First let’s take a look at where all our traffic goes from a global perspective.
Sankey diagram of all August ingress and egress traffic grouped by type of network
When we look at the data, one pattern stands out immediately: traffic associated with neocloud networks—cloud providers offering compute, GPU, or other AI-related services—already represents nearly a quarter of total ingress and egress across Backblaze’s network. That’s a meaningful signal. Historically CDN traffic has been the majority of our traffic as our B2 Object Storage has been growing. Now, we’re seeing clear evidence of a new class of workload emerging, and it’s AI-shaped.
Neocloud network behavior
Let’s look at the magnitude of our network traffic based on the category of the traffic destination. To help quantify our data set, we interact with around 123,000 unique IP addresses every month.
“Magnitude” bits per IP address on a log scale
CDN, hyperscaler, isp-regional, and isp-tier one traffic cluster in the same general range of bits per IP, but neoclouds have a couple outliers—the two purple data points in the upper right corner of the log scale graph.
If we change the scale to linear (chart below), now we can see how much of an outlier the AI related traffic is in our sample range.
“Magnitude” bits per IP address on a linear scale
The “magnitude” (as we’re calling it) of the transfers we’re servicing for AI related flows to neoclouds is an order of magnitude greater than all our traffic patterns. This means that there are only a few unique IP addresses that we’re interacting with transferring large amounts of data in their flows.
The rise of AI-driven data movement
Over the past year, AI training and inference have transformed global data flows. Where traditional workloads move steadily, AI workloads move in bursts—rapid retrievals of massive datasets, short high-volume transfers for model training or tuning, and sustained outbound throughput for inferencing pipelines. The magnitude metric we’re introducing (bits per IP address) captures this shift.
As shown in the charts above, AI-related traffic to neoclouds isn’t just heavier, it’s denser. Those purple data points represent a small number of IPs exchanging a disproportionate amount of data. That concentration of flow is a hallmark of AI compute pipelines, where a few high-bandwidth endpoints (often GPU clusters) interact with object storage to repeatedly feed and retrieve training data.
In other words:
Fewer talkers, bigger flows. AI systems operate in fewer, more intense network sessions than traditional applications.
Shorter duration, higher peaks. Transfer patterns spike sharply, often corresponding to dataset replication or model checkpointing cycles.
Cross-cloud mobility. Much of this traffic routes between Backblaze and external compute platforms (classified as neoclouds) showing the rise of multi-cloud AI architectures.
The macro trend: The AI data gravity shift
This pattern reflects a broader macro trend in the cloud ecosystem: AI data gravity is pulling more storage and compute closer together. As AI models grow larger and datasets become more complex, organizations are rethinking where data “lives.” Instead of centralizing everything in one hyperscaler like AWS or Google Cloud Platform, they’re increasingly using cost-efficient, high-throughput storage clouds like Backblaze connected to specialized GPU clouds for compute (case in point: Why CoreWeave’s Object Storage Launch is Good for AI—and Everyone Building It).
This architectural shift explains the outlier traffic patterns we’re seeing on our network. Data isn’t just moving more—it’s moving smarter, following cost, performance, and regional availability cues.
Why it matters
Tracking this kind of data movement and magnitude helps us, and more importantly our customers, understand a few key things:
Operational readiness for AI workloads: How our network scales under bursty, compute-linked demands. (For more on this check out Making the Backblaze Network AI Ready)
Cost predictability: Where and when ingress or egress volume spikes may occur.
Industry evolution: How AI is reshaping the underlying patterns of internet traffic.
What’s next?
This is just the first glimpse of that industry evolution. As our dataset matures, we’ll be able to watch these AI-linked flows change quarter over quarter, offering not just transparency, but a longitudinal view of how the data backbone of the AI economy takes shape.
We’re planning to look at quarter over quarter number tracking for network types, IPv4 traffic vs IPv6 traffic, AI related workflows, cross-cloud connectivity trends, and more. We’re also planning to release the raw data quarterly going forward.
Anything specific you want to see? Let us know in the comments or reach out to our Evangelism team.
We’re excited to share these insights from our network telemetry, the patterns we’re seeing, and what they mean for the broader data economy. This is the stuff we stay up at night studying, and sharing it publicly means we can all better understand the forces shaping digital infrastructure and build with greater confidence and foresight.
It’s no secret that Kubernetes is the de facto container orchestrator for scaling containerized applications. As the Backblaze team gets ready to head to KubeCon North America, we’ve been exploring the ecosystem of tools and integrations that make it easier to store application data in S3 compatible object storage.
From workarounds that make an object storage bucket behave like a persistent volume to cluster backups and early Cloud Native Computing Foundation (CNCF) storage projects we’re excited to watch, here’s a quick guide to making object storage services like Backblaze B2 Cloud Storage work (as close to) seamlessly with your Kubernetes clusters.
Mountpoint for Amazon S3 CSI Driver
AWS Labs released the mountpoint for Amazon S3 container storage interface (CSI) driver to allow Kubernetes clusters to access files in object storage through a file system interface. Essentially, this mountpoint disguises S3 compatible object storage as a persistent storage volume so the Kubernetes cluster can access your object storage without the need for another tool or integration. This also works with other S3 compatible storage services, including Backblaze B2. Check out our GitHub repo for step by step instructions on how to deploy a sample application to test with B2, or see this in action during our upcoming webinar, The State of K8s + S3 Compatible Storage.
MinIO
MinIO is a popular tool for running object storage natively inside Kubernetes clusters, by exposing data through standard APIs to enable containerized application to store, retrieve, and manage unstructured data. MinIO designed to run natively in Kubernetes, and allows you to bring-your-own S3 compatible storage or use your device’s local storage for a self-hosted solution. MinIO is flexible enough for individual developers to experiment with, but its power comes from its scalability, with 77% of Fortune 500 companies using MinIO in their cloud native workloads.
Velero
Rapidly creating and deleting infrastructure, and being able to quickly rebuild and recover are core tenets of Kubernetes. Velero makes it incredibly easy to back up Kubernetes clusters to your preferred object storage service. Run one-off backups as needed with one simple command, or set up a schedule to make sure your clusters are backed up consistently.
Read more about Kubernetes cluster security and backup strategy.
Rook
Rook is a storage orchestrator for Kubernetes that manages distributed storage systems (including Ceph and Cassandra) as native Kubernetes resources. Though Rook’s functionality doesn’t directly extend to S3 compatible object storage like Backblaze B2, you can mirror the data to B2 or set up your preferred object storage service as a backup destination.
Container Object Storage Interface (COSI) (Currently available in Alpha)
The COSI project is a set of abstractions currently available in Alpha that aims to provide Kubernetes with the ability to request and provision object storage buckets from multiple cloud vendors, similar to how file/block storage is abstracted with the CSI driver. Since each cloud provider builds out object storage differently, COSI intends to provide a unified set of protocols so Kubernetes can be inclusive to all object storage vendors, and adhere to the Kubernetes portability tenet.
Learn more about these tools, see a demo of how to attach a Backblaze B2 bucket via the mountpoint for Amazon S3 CSI driver, and get some initial key takeaways from KubeCon North America during our upcoming webinar, The State of K8s + S3 Compatible Storage. Register to watch live on November 20, 2025 and get access to an on-demand recording.
To provide the best experiences, we use technologies like cookies to store and/or access device information. Consenting to these technologies will allow us to process data such as browsing behavior or unique IDs on this site. Not consenting or withdrawing consent, may adversely affect certain features and functions.
Functional
Always active
The technical storage or access is strictly necessary for the legitimate purpose of enabling the use of a specific service explicitly requested by the subscriber or user, or for the sole purpose of carrying out the transmission of a communication over an electronic communications network.
Preferences
The technical storage or access is necessary for the legitimate purpose of storing preferences that are not requested by the subscriber or user.
Statistics
The technical storage or access that is used exclusively for statistical purposes.The technical storage or access that is used exclusively for anonymous statistical purposes. Without a subpoena, voluntary compliance on the part of your Internet Service Provider, or additional records from a third party, information stored or retrieved for this purpose alone cannot usually be used to identify you.
Marketing
The technical storage or access is required to create user profiles to send advertising, or to track the user on a website or across several websites for similar marketing purposes.