Post Syndicated from Sumit Bhati original https://aws.amazon.com/blogs/security/how-to-securely-transfer-files-with-presigned-urls/
July 28, 2025: This post has been updated and expanded into a comprehensive two-part series covering multiple AWS file sharing solutions. This new series provides in-depth analysis of security and cost considerations to help you make informed decisions based on your requirements.
Note: This is Part 1 of a two-part post. You can read Part 2 here.
Sharing files with an outside entity—to share data between business partners or facilitate customer access to files—is a common use case for Amazon Web Services (AWS) customers. Organizations must balance security, cost, and usability. In a business-to-business data sharing scenario, these challenges become even more complex because human interaction is often minimal or absent, requiring robust automated solutions. Many AWS services offer multiple options for granting access. The one that’s best for your use case depends on multiple factors.
This post helps you decide which AWS services to use to implement a file sharing approach that suits your business needs. We focus on security controls and cost implications, describe some of the trade-offs, and highlight key differences to help you make an informed decision based on your specific requirements. We go through each option, highlighting their strengths and limitations, and provide guidance on choosing the right solution for your use case.
Understand your needs first
The first step in designing an AWS file sharing solution is to develop a clear understanding of your requirements and constraints. Because there are several possible design patterns and a number of different AWS services to consider, you need to start by identifying and prioritizing the features that you need. Gather the following information to guide your approach:
Access patterns and scale
When planning for access patterns and scale, there are a few key factors to keep in mind. First, consider how files are shared—machine-to-machine, human-to-machine, or human-to-human—because that impacts security and performance. Then, think about transfer frequency—are files exchanged only once a day, or are thousands moving every hour? If download control matters, setting limits on how often a file can be accessed might be necessary. File sizes also play a role, from typical everyday transfers to the largest files you need to support. Finally, total data volume shapes how much information you’ll be transferring on a regular basis.
Technical requirements
Your choice of solution will be influenced by technical constraints and capabilities. Protocol requirements often drive initial decisions, such as whether you need SFTP, FTPS, or HTTPS access. Consider existing systems that must interface with your solution and how they’ll connect. Performance considerations span several dimensions: acceptable latency for file transfers, geographic distribution of your users, bandwidth requirements, and whether you need built-in retry mechanisms for failed transfers. Additionally, think about how many simultaneous transfers your solution needs to support.
Security and compliance
Security and compliance requirements will definitely influence your file sharing strategy. Consider who controls encryption keys—whether managed by AWS or your organization—and what key rotation policies are needed. Authentication needs often vary—you might be authenticating individual users, specific systems, or entire business entities, using methods ranging from passwords to API keys, multi-factor authentication, or certificates. Your audit requirements will influence your choices in logging and monitoring capabilities. You might have geographic considerations like data sovereignty requirements, storage location restrictions, and access controls that consider the recipient’s location. If your data is subject to a law, like GDPR in Europe or HIPAA in the United States, or if your data is regulated by a standard like the Payment Card Industry’s Data Security Standard (PCI-DSS), you will need to consult with your own legal and compliance advisors to see what is required. When assessing risk tolerance, consider the security triad of confidentiality, integrity, and availability—some use cases might tolerate brief periods of unavailability but cannot risk data exposure, while others prioritize continuous availability.
Operational requirements
Day-to-day operations bring their own set of considerations. File retention policies determine how long data needs to be kept, while auto-deletion capabilities might be necessary for managing storage and compliance. Consider what kind of reporting and monitoring of file transfer activities you need. Do you need monthly reports, daily reports or perhaps detailed real-time tracking of transfer activities. By adding handling and notification systems, you can help make sure that problems are caught and addressed promptly. Disaster recovery requirements, expressed through recovery point objectives (RPO) and recovery time objectives (RTO), help determine the resilience needed in your solution.
Business constraints
Your solution must operate within your business constraints, such as budget limitations, technical limitations, timelines, available expertise, and service level agreements (SLAs). Budget limitations include initial implementation costs and ongoing operational expenses. Consider other parties’ technical limitations—they might use specific protocols such as SFTP, require mobile device compatibility, or operate older systems that have limited cryptographic capabilities. Implementation timelines influence choices between managed services that can be deployed quickly and custom solutions that require more time and expertise. The expertise available for solution maintenance is also a consideration. SLAs for file transfers might specify availability and performance requirements that you’re obligated to meet. To meet these constraints, you must estimate how much your file sharing needs will grow over time and determine if you need a regional or a global solution.
By carefully considering these aspects, you’ll be better prepared to evaluate different AWS file sharing solutions and select the one that best fits your use case. Understanding your requirements for uploads and downloads will help determine if your use case can be supported through a single AWS service or needs a combination of services.
Solutions
Let’s start by looking at the various file sharing mechanisms that AWS supports. The following table identifies the key AWS services needed for each solution, describes the security and cost implications of the solutions, and describes their complexity and protocol support capabilities. The following table shows the solutions described in this post.
| Solution |
AWS services |
Security features |
Cost* |
Region control |
| AWS Transfer Family |
Transfer Family, Amazon S3, API Gateway, and Lambda |
Managed security, encryption in transit and at rest, IAM integration, and custom authentication |
$0.30 per hour per protocol, data transfer fees, and storage costs |
Can deploy to specific AWS Regions, can only transfer files to and from S3 buckets in the same Region |
| Transfer Family web apps |
Transfer Family, S3, and CloudFront |
Browser-based access, IAM Identity Center integration, and S3 Access Grants |
Pay-per-file operation, CloudFront costs, and storage costs |
Uses CloudFront (global) for web access, but backend components can be Region-specific |
| Amazon S3 pre-signed URLs |
S3 |
Time-limited URLs, IAM controls for URL generation, and HTTPS |
S3 request and data transfer fees |
Can be restricted to specific Regions |
| Serverless application with Amazon S3 presigned URLs |
S3, AWS Lambda, and API Gateway |
Time-limited URLs, HTTPS, IAM controls, customizable authentication |
Pay per request and minimal infrastructure cost |
Components can be Region-specific |
The following table shows the solutions described in Part 2.
| Solution |
AWS services |
Security features |
Cost* |
Region control |
| CloudFront signed URLs |
CloudFront, Amazon S3, and Lambda |
Optional edge security using AWS Lambda@Edge, AWS WAF integration, SSL/TLS, geo restrictions, and AWS Shield Standard (included automatically) |
Content delivery network (CDN) costs, request pricing, and data transfer fees |
Global service by design; origin can be AWS Region-specific |
| Amazon VPC endpoint service |
PrivateLink, VPC, and NLB |
Complete network isolation, private connectivity, and multi-layer security |
Endpoint hourly charges, NLB costs, and data processing fees |
Service endpoints are strictly Region-specific; must create endpoints in each Region where access is needed |
| S3 Access Points |
S3, IAM, VPC (for VPC-specific access points) |
- Dedicated IAM policies per access point
- VPC-only access restrictions available
- Works with bucket policies for layered security
- Supports AWS PrivateLink for private network access
- Compatible with S3 Block Public Access settings
|
- No additional charge for S3 Access Points
- Standard S3 request pricing applies
- Data transfer fees apply based on standard S3 rates
- VPC endpoint charges apply when using VPC endpoints with access points
|
- Access points are Region-specific
- Each access point is created in the same Region as its S3 bucket
- Cross-Region access requires separate access points in each Region
- VPC-specific access points are limited to the VPC’s Region
|
* Pricing information provided is based on AWS service rates at the time of publication and is intended as an estimation only. Additional costs may be incurred depending on your specific implementation and usage patterns. For the most current and accurate pricing details, please consult the official AWS pricing pages for each service mentioned.
Let’s examine the solutions in detail.
AWS Transfer Family
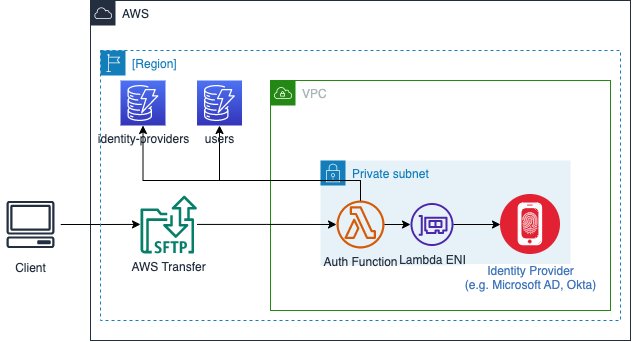
AWS Transfer Family is a managed file transfer service for SFTP, FTPS, and AS2 protocols. It integrates directly with Amazon Simple Storage Service (Amazon S3) for storage and supports custom identity providers for authentication through Amazon API Gateway and AWS Lambda.
As shown in Figure 1, when a user initiates a file transfer, Transfer Family authenticates them through the configured identity provider using API Gateway and Lambda. After authentication succeeds, the service maps the user to an AWS Identity and Access Management (IAM) role that defines their S3 bucket access permissions. The service encrypts data in transit using TLS 1.2 and data at rest using S3 server-side encryption.

Figure 1: AWS Transfer Family architecture
Transfer Family automatically handles scaling from zero to thousands of concurrent users, manages high availability across Availability Zones, and minimizes infrastructure management. It records detailed metrics and logs in Amazon CloudWatch for monitoring and auditing, supporting compliance requirements with activity tracking.
It’s important to note that Transfer Family also offers service-managed authentication. This simpler setup stores user credentials (passwords or SSH keys) directly in Transfer Family, minimizing the need for external identity providers. Service-managed authentication is best suited if you have a small number of users or no existing identity management system, or when you want to have a disconnected identity system and don’t want to give external partners an account in your identity provider system.
Pros
One of the biggest advantages of Transfer Family is how it provides the reliability and scalability of Amazon S3 for storing your data, while keeping that data available to existing client applications and workflows. The service integrates with existing authentication systems through custom identity providers, while maintaining security through IAM policies. Its auto-scaling capabilities handle variable workloads, from occasional transfers to high-volume scenarios.
Transfer Family also offers detailed CloudWatch logging and audit trails for file transfer activities, which should be sufficient for most logging and audit needs. It encrypts data in transit using TLS 1.2 and at rest using Amazon S3 server-side encryption. You can implement fine-grained access controls through IAM roles and integrate with AWS Organizations for multi-account management. The service supports VPC endpoints for secure internal access and custom domain names for branded endpoints.
Because data is stored in S3, some of your requirements will be fulfilled by configuring S3, not the Transfer Family services. Data retention (for example, avoiding deletion and scheduling deletion) is achieved through S3 Object Lock and S3 Lifecycle Events.
Cons
The pricing structure of Transfer Family includes $0.30 per hour for each protocol you enable and data transfer fees based on data volume. There can be additional charges for custom domain names. If you use VPC endpoints for secure internal access to Amazon S3, there will also be VPC data charges. If you have high-volume transfers or multiple endpoints across AWS Regions, you will face increased costs. Because the data ultimately lives in S3; S3 storage and request pricing applies as well.
Custom identity provider implementations (such as SAML or OAuth) add latency to authentication processes, affecting transfer initiation times. This authentication process requires additional configuration and introduces extra steps and latency during transfer initiation compared to service-managed authentication.
The Regional nature of Transfer Family means you must choose between deploying in a single Region (simpler management but potential latency for global users) or multiple Regions (better performance but higher costs at $0.30 per protocol per hour per Region). Multi-Region can serve as a disaster recovery strategy or when Regional data isolation is needed.
Transfer Family web apps
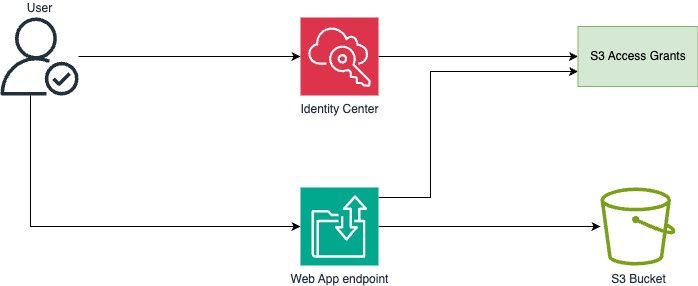
Transfer Family web apps provide browser-based access to Amazon S3, enabling users to upload and download files through a web interface. With the web apps, you can create a branded, secure, and highly available portal for your users to browse, upload, and download data in S3. Web apps are built using Storage Browser for S3 and offer the same user functionalities in a fully managed offering without having to write code or host your own application.
When a user accesses the web application, authentication occurs through AWS IAM Identity Center, and S3 Access Grants determine their permissions to specific S3 buckets or prefixes. The access grant permissions can be either read-only or read and write. After authentication succeeds, users can upload or download files directly through the web interface. The service uses Amazon CloudFront for content delivery and implements SSL/TLS encryption for data transfers, while S3 provides server-side encryption for data at rest. Figure 2 shows a simplified Transfer Family web app architecture.

Figure 2: Simplified Transfer Family web app architecture
The web application automatically scales to accommodate varying numbers of users and provides high availability through the CloudFront global edge network. It minimizes the need for custom web application development and provides logging through AWS CloudTrail and CloudWatch. You can customize the user experience by implementing custom domains through CloudFront distributions.
Transfer Family web apps support multiple authentication methods, with IAM Identity Center being one of the primary options. While Identity Center provides simplified user management and integration with existing identity providers. It also provides useful mechanisms such as multi-factor authentication (MFA), strong password policies, and resetting lost passwords. It’s not the only authentication method available; you can also use custom identity providers for authentication, providing flexibility in how you manage user access to the web application.
Pros
Transfer Family web apps minimize the need to build and maintain custom web interfaces for Amazon S3 file sharing. It provides seamless integration with IAM Identity Center for user management and authentication, enabling you to use existing identity providers. The service offers fine-grained access control through S3 Access Grants, allowing precise permission management at the bucket and prefix level. Its integration with CloudFront provides global availability and enhanced performance, while CloudTrail logging offers audit capabilities.
The service provides robust security features including SSL/TLS encryption, CORS policy management, and optional integration with AWS WAF for protection against bots, web scrapers, DDoS events, and more. You can implement custom domains for branded experiences and use CloudFront security features including DDoS protection using AWS Shield. The web interface offers intuitive file management capabilities without requiring client software or that users have technical expertise.
Cons
Transfer Family web apps require using IAM Identity Center, which might require additional setup and configuration if you’re not currently using this service. The web interface currently requires the Identity Center identities to live in the same AWS account as the S3 buckets. That might create design challenges if you want to keep identities in one AWS account and data storage in another. Implementation requires careful cross-origin resource sharing (CORS) configuration for each S3 bucket.
The service incurs costs for both Transfer Family and associated services, including CloudFront distribution and data transfer fees. Custom domain implementation requires additional configuration and SSL certificate management through AWS Certificate Manager (ACM). The web interface is well suited for humans to upload or download, but it’s not as good for automated workflows that transfer files from machine to machine. You must carefully manage user assignments and access grants to maintain security, adding administrative overhead.
S3 pre-signed URLs
Amazon S3 pre-signed URLs enable secure, time-limited access to objects in S3 without requiring the file recipient to have an identity in your identity systems. The URLs are generated using the AWS SDK or AWS Command Line Interface (AWS CLI), granting specific permissions (GET, PUT) that are valid for up to seven days. When accessing files, S3 validates the cryptographically signed parameters in these URLs before permitting access to objects. This provides a direct method for secure file sharing through HTTPS endpoints.
The solution requires only an S3 bucket and appropriate IAM permissions for URL generation. S3 handles the authentication of the pre-signed URL parameters and manages access to objects. File transfers occur directly between users and S3 through HTTPS endpoints, with the pre-signed URL controlling the access patterns.
Amazon S3 provides security features including server-side encryption, access logging, and CloudTrail integration. The security of pre-signed URLs is primarily managed through expiration times and specific operation permissions defined during URL generation.
Pros
Amazon S3 pre-signed URLs follow a straightforward pay-per-use pricing model, charging only for S3 storage, requests, and data transfers. For example, if you create pre-signed URLs but the object isn’t actually downloaded, you pay storage costs as usual, but you don’t pay transfer costs. The solution uses the native scalability of S3 to handle varying numbers of concurrent users without additional infrastructure. you can implement granular access controls through URL expiration times and specific operation permissions (GET, PUT, DELETE).
Access is controlled through URL expiration enforcement. Amazon S3 server access logging and CloudTrail integration enable audit capabilities. The solution’s simplicity makes it ideal for basic file sharing needs while maintaining security and scalability.
Cons
A pre-signed URL can be used by anyone who has access to the URL. That’s the goal of this design: You don’t need to have an identity for the user. Pre-signed URLs can be reused an unlimited number of times until they expire. To improve security, short expiration times can limit the potential for URL re-use. Shorter expiration times, however, require the recipient to download the file soon after the URL is created.
When implementing this solution, you should establish processes for secure URL generation and distribution. Set your URL expiration times based on realistic expectations about how quickly your recipients will download the files. A web or mobile app where the user selects a link to download something (such as a document, an image, a data file) and they expect the download to start immediately is a good candidate for this design.
The solution works with files up to 5 GB for single operations. To share a file larger than 5 GB, you must split the file into multiple parts, issue multiple pre-signed URLs, and then the recipient must download all the parts and join the parts together correctly. This isn’t a good solution for sharing large files. Also, distributing large files as a single download can be difficult if the recipient doesn’t have good connectivity. Amazon S3 can start an object download from the middle of the object, but selecting a pre-signed URL cannot. So, if the recipient transfers 1 GB out of a 2 GB download, and then their connection is disrupted, they cannot pick up where they left off. They will restart from the beginning, which is undesirable. Overall, this design is unsuitable for transmitting large files over unreliable internet connections.
You should enable appropriate monitoring through Amazon S3 access logs and CloudTrail to track usage patterns and meet security compliance.
This solution is particularly effective if you’re seeking straightforward, secure file sharing capabilities where the files are small enough to download in one request, and where you have a secure mechanism to share the download URLs.
Serverless web application with S3 presigned URLs
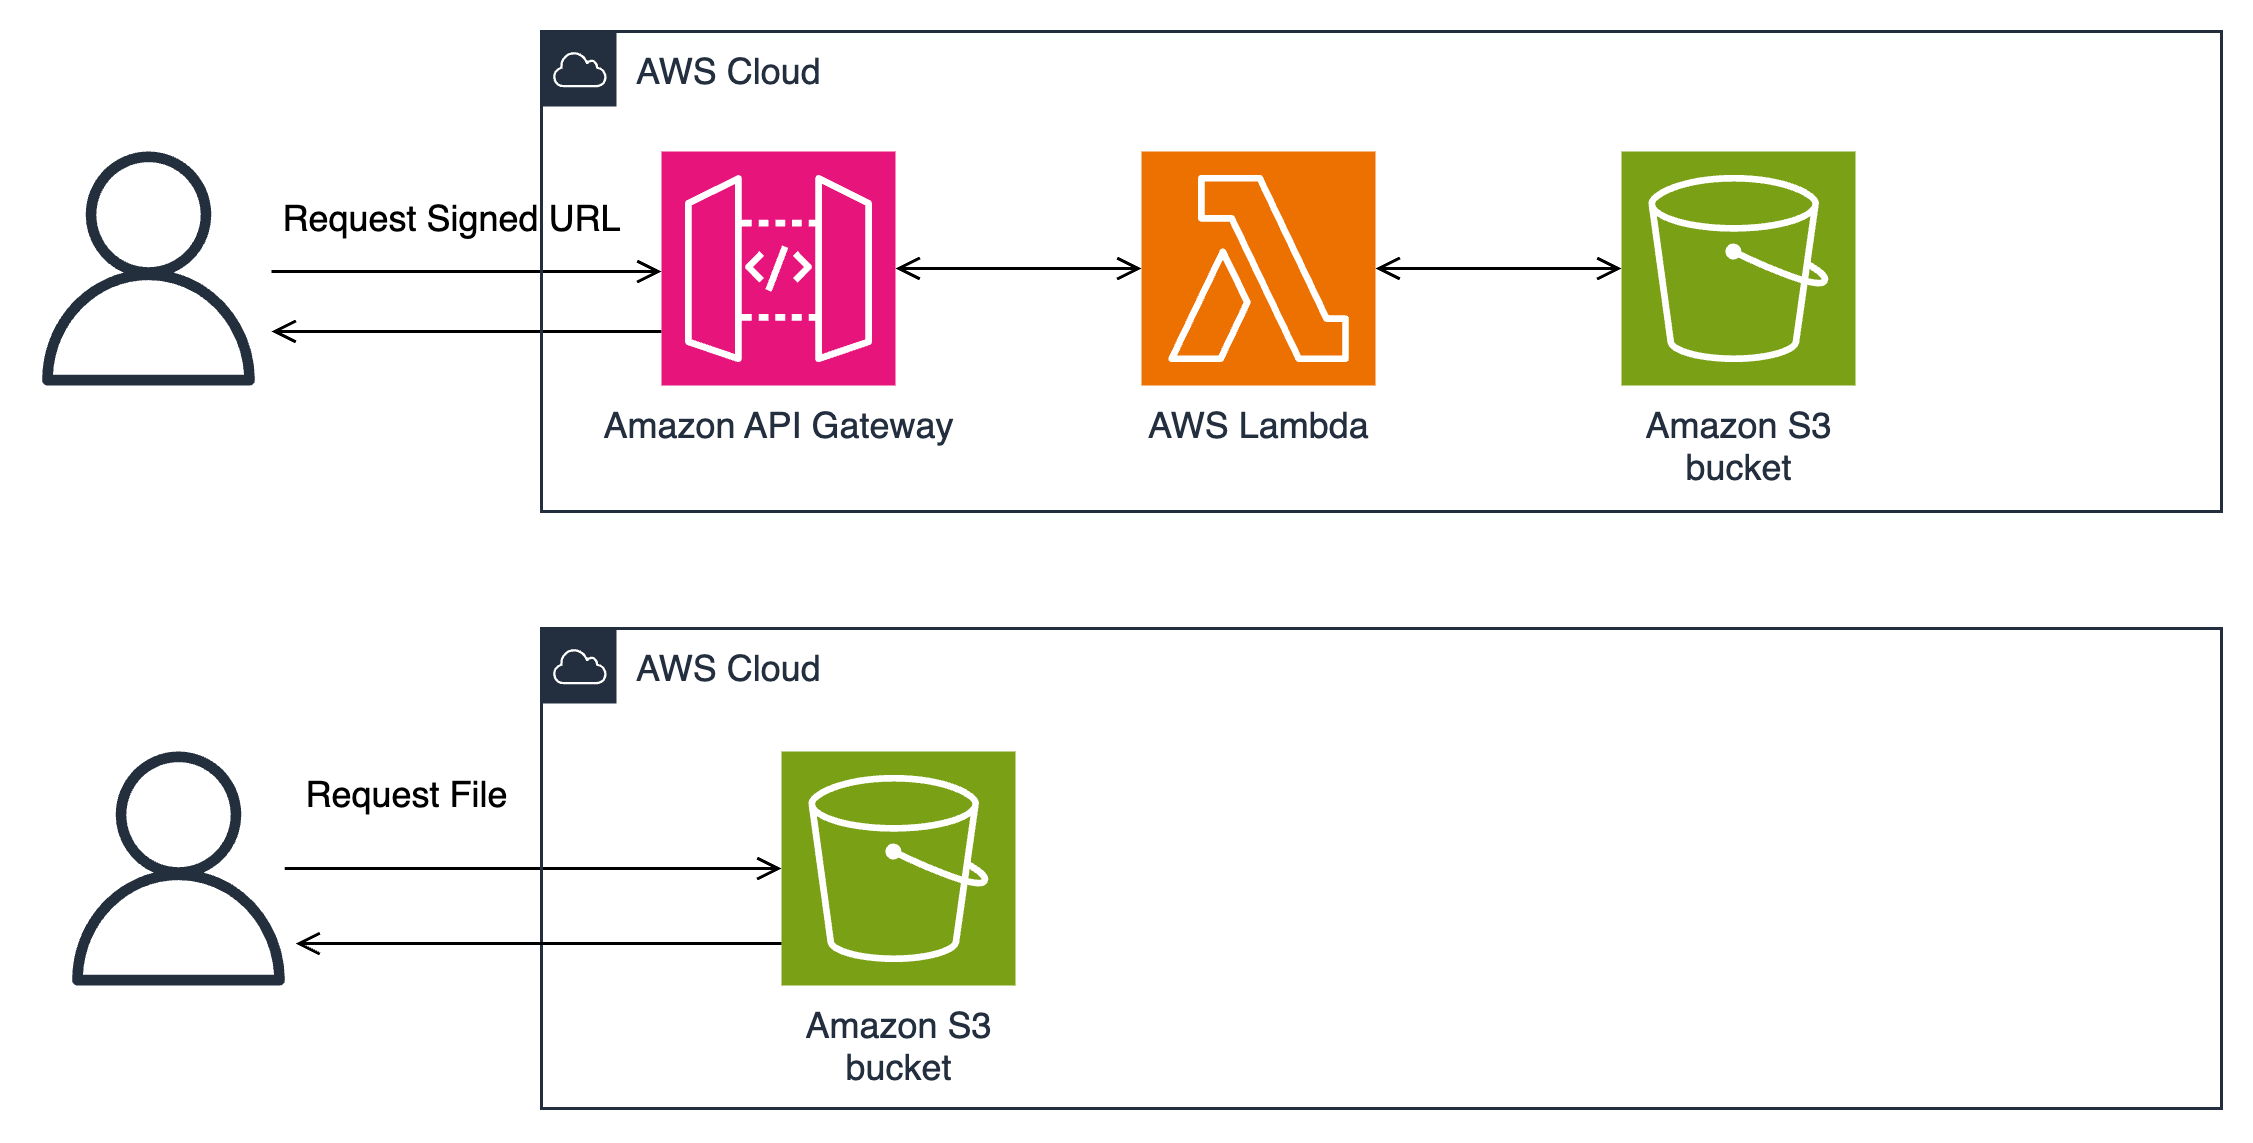
Amazon S3 presigned URLs combined with a custom web application enable secure, time-limited access to S3 objects. The application generates URLs that grant specific S3 permissions (GET, PUT) for between one minute and seven days. When requesting file access, the application authenticates users and generates presigned URLs using the AWS SDK with defined permissions and expiration times.
The web application uses API Gateway and Lambda functions for authentication and URL generation. Amazon S3 validates the cryptographically signed parameters in these URLs before permitting access to objects. File transfers occur directly between users and S3 through HTTPS endpoints, with the application controlling the access patterns. The architecture is shown in Figure 3.

Figure 3: Amazon S3 pre-signed URLs architecture
The web application can implement security controls including request logging, rate limiting (requests per second), and authentication workflows. CloudWatch logs record API access patterns and Lambda execution metrics, while Amazon S3 access logging records object-level operations.
Pros
Amazon S3 presigned URLs follow a pay-per-use pricing model. This solution charges only for API Gateway requests, Lambda executions, and S3 operations performed. The serverless architecture scales automatically from zero to thousands of concurrent users without infrastructure management. You can implement custom security controls and business logic for specific access requirements through API Gateway authorizers (using custom identity solutions or Amazon Cognito) and Lambda functions.
The solution enforces security through URL expiration (maximum seven days), IAM policies restricting URL generation permissions, and HTTPS encryption for data transfers. Custom authentication workflows integrate with existing identity providers (SAML, OIDC). Additional security features include IP-based restrictions, required request headers, and request validation through AWS WAF. This solution would be good, for example, if you have a variety of files or a variety of buckets and you’re trying to build a unified front-end where people can download various files without knowing which bucket the files are stored in or what URL expiration time is appropriate. You can configure the frontend to look at tags on objects, tags on buckets, object names, or another attribute that fits your use case, and then choose a URL expiration time based on that attribute. For example, objects from buckets tagged Data Classification: Restricted might expire after 1 minute, whereas objects from buckets tagged Data Classification: Public might be valid for 7 days.
Cons
Building a custom web application requires developing and maintaining the code for URL generation, authentication, and error handling logic. The application must track URL expiration times and implement mechanisms that permit retries for failed transfers. Monitoring systems must track URL usage, detect abuse patterns, and send alerts for security violations through CloudWatch metrics and logs.
One limitation of this solution is the 10 MB size limit imposed by API Gateway. This affects how your application handles file uploads and downloads. For uploads, files under 10 MB can be uploaded directly through API Gateway. Larger files require implementing multipart uploads, where the client splits the file into chunks and sends each chunk separately. For downloads, files under 10 MB can be downloaded directly through API Gateway but for larger files, your application should generate a pre-signed URL for direct Amazon S3 access, bypassing API Gateway.
URL generation errors or misconfigured IAM permissions can expose objects to unauthorized access. The HTTPS-only protocol limits integration with SFTP and FTPS clients. Files larger than 5 GB require multipart upload implementation, and network interruptions need custom resume logic. This design will incur some extra charges if the number of file transfers are the millions. Lambda functions cost $0.20 per million requests, and API Gateway costs $1.00 per million requests. Analyze your expected access patterns to determine whether these extra costs will be significant and if they’re worth the additional flexibility of custom transfer logic.
Decision matrix: When to use each solution
The following table summarizes the characteristics of the solutions presented in the two parts of this post. See Part 2 for full descriptions of the solutions not covered in Part 1.
| Characteristics |
Transfer Family |
Transfer Family web app |
S3 pre-signed URLs (Direct) |
Serverless web application with S3 pre-signed URL |
CloudFront signed URLs (Part 2) |
VPC endpoint service (Part 2) |
S3 Object Lambda (Part 2) |
| Protocol support |
SFTP, FTPS, and AS2 |
HTTPS (web-based) |
HTTPS |
HTTPS |
HTTPS with CDN |
A TCP-based protocol |
HTTPS |
| Global distribution |
Global endpoint support |
CloudFront integration |
Global S3 access |
Global S3 access |
Global edge network acceleration |
Direct AWS backbone access |
Global S3 access with Regional endpoints |
| Pricing model |
Hourly service rate and usage |
Pay per file operation |
Pay-per-request |
Pay-per-request and application costs |
Pay-per-request with caching savings |
Hourly endpoint rate and usage |
No additional charge for access points; standard S3 request pricing applies |
| Content processing |
Direct S3 integration |
Built-in web interface |
Direct S3 access |
Custom app processing |
Edge-based file processing |
Access files through private network |
Direct S3 access with customized permissions per access point |
| Authentication options |
Custom IdP and service-managed |
IAM Identity Center |
IAM |
Custom authentication possible |
IAM, custom authentication, and edge validation |
VPC security controls and custom authentication |
IAM policies, VPC endpoint policies, resource-based policies |
| Upload capabilities |
Unlimited file size |
Web interface upload |
Up to 5 GB direct and multipart for larger |
Up to 10 MB using API Gateway |
Optimized for global ingestion |
Unlimited file size over private connection |
Same as standard S3 |
| Download capabilities |
Unlimited file size |
Browser-based downloads |
Up to 5 GB using a single URL |
Up to 10 MB using API Gateway |
Accelerated downloads using global edge locations |
Unlimited file size over private connection |
Same as standard S3 with customized access controls |
| Example use cases |
- Enterprise file transfer systems
- B2B data exchange
- Compliance-focused transfers
|
- Browser-based file sharing
- Internal document management
- Client portals
|
- Simple direct S3 access
- Temporary file sharing
- Mobile app backend
|
- Custom file sharing systems
- Integrated web applications
- Enhanced S3 access control
|
- Global content delivery
- Media distribution
- Web application assets
|
- Private network transfers
- Custom protocol support
- Secure enterprise data exchange
|
- Simplified data access management at scale
- Multi-application access to shared datasets
- VPC-restricted data access
|
The following list gives you a quick overview of the strengths of each solution presented in the two parts of this post.
- Transfer Family is the optimal choice for organizations that require legacy file transfer protocols such as SFTP, FTPS, or AS2 protocols, and you must integrate with existing authentication systems. It’s ideal for scenarios with strict compliance and audit requirements, where operational overhead needs to be minimized. While the solution comes with higher costs because of its managed service nature, it’s often the lowest-friction option to support existing enterprise use cases that depend on these protocols.
- Transfer Family web apps suit organizations that need browser-based file sharing without custom development. They integrate with IAM Identity Center for user authentication and uses Amazon S3 Access Grants for permission management. The solution works well for internal document sharing, client portals, and scenarios requiring a branded web interface. While limited to web browser access, they provide built-in features like MFA and password management without infrastructure maintenance.
- Amazon S3 pre-signed URLs excel in scenarios where simplicity, cost-effectiveness, and temporary access are key requirements. This solution is ideal if you’re seeking a straightforward file sharing mechanism without the need for custom application development or additional infrastructure. This approach shines in environments that require a quick implementation of secure file sharing and cost-effective solutions with minimal overhead.
- Serverless web application with S3 presigned URLs best serves scenarios where cost optimization is paramount and the HTTPS protocol meets your requirements. This solution shines in environments that need simple, direct file sharing capabilities with quick implementation timelines. It’s particularly effective for moderate usage patterns where serverless architecture can provide cost benefits. The solution’s simplicity makes it ideal for web applications and scenarios where complex file transfer protocols aren’t necessary, though careful consideration must be given to its 10 MB file size limitation for single operations using API Gateway.
In Part 2:
- CloudFront signed URLs excel in situations that demand global content distribution with high performance requirements. This solution is the clear choice when your architecture needs built-in DDoS protection and performance optimization through caching. It’s particularly valuable when content delivery speed is crucial and you require security at edge locations. The solution’s global reach and caching capabilities make it cost-effective for large-scale content distribution, though it’s primarily optimized for download scenarios rather than uploads.
- Amazon VPC endpoint service is the preferred choice if you require complete network isolation and maximum security. This solution is ideal when you need support for custom protocols while maintaining private network connectivity. It’s particularly suitable for scenarios with extremely high security requirements and when you have the necessary resources to managed networking configurations. While this solution requires significant expertise and investment, it provides the highest level of security and control for sensitive data transfers.
- S3 Access Points are best suited for scenarios that require simplified data access management at scale. This solution excels when you need to provide different access patterns to the same underlying data for multiple applications or user groups. It’s ideal if you prefer a structured approach to permissions and need network-level access controls. While primarily focused on simplifying complex access scenarios without modifying bucket policies, it offers unique capabilities for VPC-restricted access and granular permissions management, though subject to certain service limits and configuration requirements.
Conclusion
In this first part of a two-part post, you’ve learned about multiple solutions for secure file sharing using AWS services and the pros and cons of each. You can find additional options in Part 2. The optimal solution depends on your specific organizational requirements, technical capabilities, and budget constraints. You don’t have to choose just one option, you can implement multiple solutions to address different use cases, creating a file sharing strategy that balances security, cost, and operational efficiency.
Additional resources:
If you have feedback about this post, submit comments in the Comments section below.


 You can set up GuardDuty Malware Protection for your S3 buckets even without GuardDuty enabled for your AWS account. However, if you enable GuardDuty in your account, you can use the full monitoring of