Authors: erruquill and n00bhaxor
Type: Auxiliary
Pull request: #18821 contributed by n00bhaxor
Path: gather/gitlab_tags_rss_feed_email_disclosure
AttackerKB reference: CVE-2023-5612
Description: This adds an auxiliary module that leverages an information disclosure vulnerability (CVE-2023-5612) in Gitlab versions before 16.6.6, 16.7 prior to 16.7.4, and 16.8 prior to 16.8.1 to retrieve user email addresses via tags feed.
BoidCMS Command Injection
Authors: 1337kid and bwatters-r7
Type: Exploit
Pull request: #18827 contributed by bwatters-r7
Path: multi/http/cve_2023_38836_boidcms
AttackerKB reference: CVE-2023-38836
Description: This PR adds an authenticated RCE against BoidCMS versions 2.0.0 and earlier. The underlying issue in the vulnerability CVE-2023-38836 is that the file upload check allows a php file to be uploaded and executes as a media file if the GIF header is present in the PHP file.
Enhancements and features (11)
#18686 from h00die – This updates the existing auxiliary/scanner/ssh/ssh_version module with new checks for supported cryptographic algorithms and version detection capabilities.
#18715 from errorxyz – This adds a Splunk library for use by future modules. It also updates the existing exploit/multi/http/splunk_privilege_escalation_cve_2023_32707 module to use it.
#18796 from errorxyz – This updates the ManageEngine Endpoint Central and ServiceDesk Plus RCE modules for CVE-2022-47966. Particularly, it adds a Java target to be able to use Java-based payloads.
#18862 from sjanusz-r7 – This PR aligns the client’s peerhost and peerport API for the recently added SQL-based sessions (postgres, mssql, mysql).
#18875 from dwelch-r7 – This PR adds conditional validation of options depending on the chosen connection type, so for example if you want to connect via RHOST we also check (where applicable) that RPORT or the USERNAME is set. When a connection is made over an existing SESSION we can still allow the user to only set SESSION and not worry about the missing values only required for a new RHOST connection.
#18887 from cgranleese-r7 – Updates the search command to now search modules that are compatible with a specified session type, for instance: search session_type:meterpreter or search session_type:smb.
#18903 from sjanusz-r7 – This PR improves the UX by correctly handling databases changes by updating the prompt to now get the appropriate database value in the context of a MySQL or MSSQL session.
#18905 from cgranleese-r7 – Improves the pwd command output for SMB sessions.
#18908 from adfoster-r7 – Update SAMR computer and ICPR cert to support SMB sessions.
#18921 from dwelch-r7 – This adds the IP address to the SMB session prompt when there is no selected share.
#18926 from cgranleese-r7 – Update sessions to have a consistent set of local file system commands.
Bugs fixed (5)
#18844 from sfewer-r7 – This fixes a bug in the file dropper mixin that would prevent files from being deleted with a Windows shell session.
#18897 from adfoster-r7 – Updates the smb_login module to support configuring the negotiated SMB protocol versions and whether encryption is negotiated.
#18904 from double16 – Fixes the windows/gather/bloodhound module to no longer incorrectly validate the OutputDirectory option.
#18920 from dwelch-r7 – This PR fixes an issue with the autorunscript module option within an SMB session.
#18928 from dwelch-r7 – This PR fixes an issue when running the auxiliary/gather/windows_secrets_dump module while using the SESSION module option to connect, that caused the client to be disconnected and unable to be reused for subsequent runs/other modules.
Documentation (1)
#18929 from adfoster-r7 – Updates the Metasploit API documentation library to the latest available version to avoid CVE-2024-27285 – an XSS in the default YARD template. Thanks to Aviv Keller for reporting.
You can always find more documentation on our docsite at docs.metasploit.com.
Get it
As always, you can update to the latest Metasploit Framework with msfupdate
and you can get more details on the changes since the last blog post from
GitHub:
It’s easy to open a data center, right? All you have to do is connect a bunch of hard drives to power and the internet, find a building, and you’re off to the races.
Well, not exactly. Building and using one Storage Pod is quite a bit different than managing exabytes of data. As the world has grown more connected, the demand for data centers has grown—and then along comes artificial intelligence (AI), with processing and storage demands that amp up the need even more.
That, of course, has real-world impacts, and we’re here to chat about why. Today we’re going to talk about power, one of the single biggest costs to running a data center, how it has impacts far beyond a simple utility bill, and what role temperature plays in things.
How Much Power Does a Data Center Use?
There’s no “normal” when it comes to the total amount of power a data center will need, as data centers vary in size. Here are a few figures that can help us get us on the same page about scale:
The largest data center market in the world is in Northern Virginia in the United States and it has a 2,552 megawatt capacity. (By the way: 1MW = 1 million watts. For context, one megawatt is enough energy to power about 200 American homes for a year.)
The goal of a data center is to be always online. That means that there are redundant systems of power—so, what comes in from the grid as well as generators and high-tech battery systems like uninterruptible power supplies (UPS)—running 24 hours a day to keep servers storing and processing data and connected to networks. In order to keep all that equipment running well, they need to stay in a healthy temperature (and humidity) range, which sounds much, much simpler than it is.
Measuring Power Usage
One of the most popular metrics for tracking power efficiency in data centers is power usage effectiveness (PUE), which is the ratio of the total amount of energy used by a data center to the energy delivered to computing equipment.
Note that this metric divides power usage into two main categories: what you spend keeping devices online (which we’ll call “IT load” for shorthand purposes), and “overhead”, which is largely comprised of the power dedicated to cooling your data center down.
There are valid criticisms of the metric, including that improvements to IT load will actually make your metric worse: You’re being more efficient about IT power, but your overhead stays the same—so less efficiency even though you’re using less power overall. Still, it gives companies a repeatable way to measure against themselves and others over time, including directly comparing seasons year to year, so it’s a widely adopted metric.
Calculating your IT load is a relatively predictable number. Manufacturers tell you the wattage of your device (or you can calculate it based on your device’s specs), then you take that number and plan for it being always online. The sum of all your devices running 24 hours a day is your IT power spend.
Any time you’re using power, you’re creating heat. So the first thing you consider is always your IT load. You don’t want your servers overtaxed—most folks agree that you want to run at about 80% of capacity to keep things kosher—but you also don’t want to have a bunch of servers sitting around idle when you return to off-peak usage. Even at rest, they’re still consuming power.
So, the methodology around temperature mitigation always starts at power reduction—which means that growth, IT efficiencies, right-sizing for your capacity, and even device provisioning are an inextricable part of the conversation. And, you create more heat when you’re asking an electrical component to work harder—so, more processing for things like AI tasks means more power and more heat.
And, there are a number of other things that can compound or create heat: the types of drives or processors in the servers, the layout of the servers within the data center, people, lights, and the ambient temperature just on the other side of the data center walls.
Brief reminder that servers look like this:
Only most of them aren’t as beautifully red as ours.
When you’re building a server, fundamentally what you’re doing is shoving a bunch of electrical components in a box. Yes, there are design choices about those boxes that help mitigate temperature, but just like a smaller room heating up more quickly than a warehouse, you are containing and concentrating a heat source.
We humans generate heat and need lights to see, so the folks who work in data centers have to be taken into account when considering the overall temperature of the data center. Check out these formulas or this nifty calculator for rough numbers (with the caveat that you should always consult an expert and monitor your systems when you’re talking about real data centers):
Heat produced by people = maximum number of people in the facility at one time x 100
Heat output of lighting = 2.0 x floor area in square feet or 21.53 x floor area in square meters
Also, your data center exists in the real world, and we haven’t (yet) learned to control the weather—so you also have to factor in fighting the external temperature when you’re bringing things back to ideal conditions. That’s led to a movement towards building data centers in new locations. It’s important to note that there are other reasons you might not want to move, however, including network infrastructure.
Accounting for people and the real world also means that there will be peak usage times, which is to say that even in a global economy, there are times when more people are asking to use their data (and their dryers, so if you’re reliant on a consumer power grid, you’ll also see the price of power spike). Aside from the cost, more people using their data = more processing = more power.
How Is Temperature Mitigated in Data Centers?
Cooling down your data center with fans, air conditioners, and water also uses power (and generates heat). Different methods of cooling use different amounts of power—water cooling in server doors vs. traditional high-capacity air conditioners, for example.
Talking about real numbers here gets a bit tricky. Data centers aren’t a standard size. As data centers get larger, the environment gets more complex, expanding the potential types of problems, while also increasing the net benefit of changes that might not have a visible impact in smaller data centers. It’s like any economy of scale: The field of “what is possible” is wider; rewards are bigger, and the relationship between change vs. impact is not linear. Studies have shown that creating larger data centers creates all sorts of benefits (which is an article in and of itself), and one of those specific benefits is greater power efficiency.
Most folks talk about the impact of different cooling technologies in a comparative way, i.e., we saw a 30% reduction in heat. And, many of the methods of mitigating temperature are about preventing the need to use power in the first place. For that reason, it’s arguably more useful to think about the total power usage of the system. In that context, it’s useful to know that a single fan takes x amount of power and produces x amount of heat, but it’s more useful to think of them in relation to the net change on the overall temperature bottom line. With that in mind, let’s talk about some tactics data centers use to reduce temperature.
Customizing and Monitoring the Facility
One of the best ways to keep temperature regulated in your data center is to never let it get hotter than it needs to be in the first place, and every choice you make contributes to that overall total. For example, when you’re talking about adding or removing servers from your pool, that reduces your IT power consumption and affects temperature.
There are a whole host of things that come down to data centers being a purpose-built space, and most of them have to do with ensuring healthy airflow based on the system you’ve designed to move hot air out and cold air in.
No matter what tactics you’re using, monitoring your data center environment is essential to keeping your system healthy. Some devices in your environment will come with internal indicators, like SMART stats on drives, and, of course, folks also set up sensors that connect to a central monitoring system. Even if you’ve designed a “perfect” system in theory, things change over time, whether you’re accounting for adding new capacity or just dealing with good old entropy.
Here’s a non-inclusive list of some of ways data centers customize their environments:
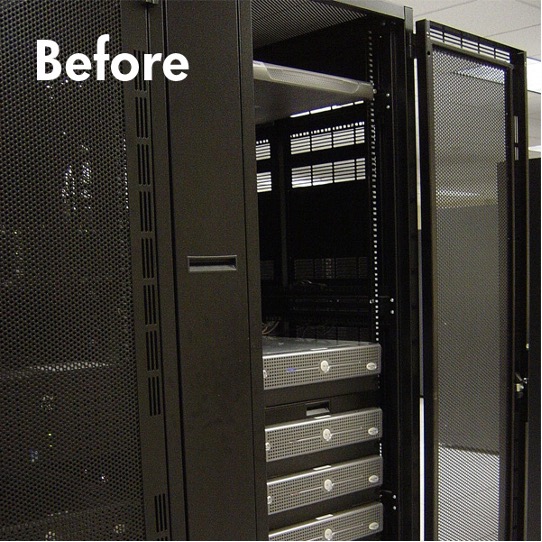
Raised Floors: This allows airflow or liquid cooling under the server rack in addition to the top, bottom, and sides.
Containment, or Hot and Cold Rows: The strategy here is to keep the hot side of your servers facing each other and the cold parts facing outward. That means that you can create a cyclical air flow with the exhaust strategically pulling hot air out of hot space, cooling it, then pushing the cold air over the servers.
Calibrated Vector Cooling: Basically, concentrated active cooling measures in areas you know are going to be hotter. This allows you to use fewer resources by cooling at the source of the heat instead of generally cooling the room.
Cable Management: Keeping cords organized isn’t just pretty, it also makes sure you’re not restricting airflow.
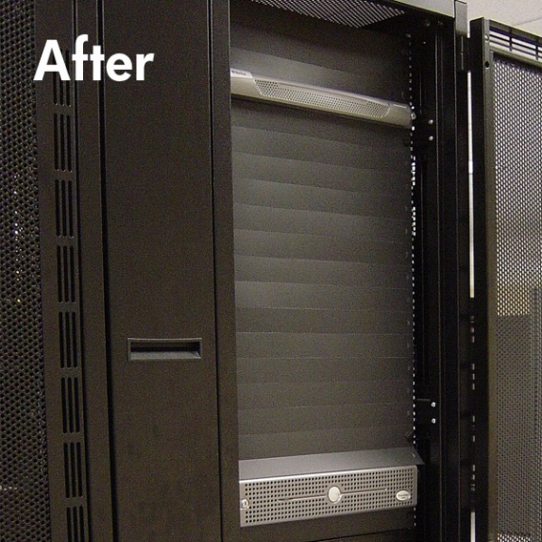
Blanking Panels: This is a fancy way of saying that you should plug up the holes between devices.
Why not both? Most data centers end up using a combination of air and water based cooling at different points in the overall environment. And, other liquids have led to some very exciting innovations. Let’s go into a bit more detail.
Air-Based Cooling
Air based cooling is all about understanding air flow and using that knowledge to extract hot air and move cold air over your servers.
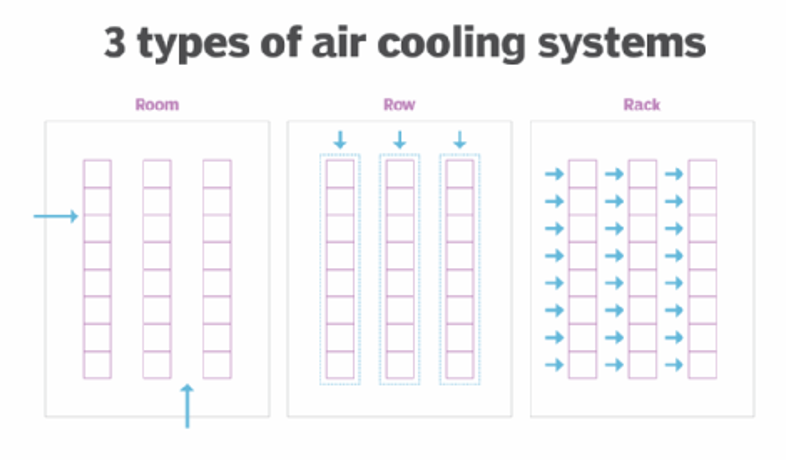
Air-based cooling is good up to a certain temperature threshold—about 20 kilowatts (kW) per rack. Newer hardware can easily reach 30kw or higher, and high processing workloads can take that even higher. That said, air-based cooling has benefitted by becoming more targeted, and people talk about building strategies based on room, row, or rack.
From here, it’s actually a pretty easy jump into water-based cooling. Water and other liquids are much better at transferring heat than air, about 50 to 1,000 times more, depending on the liquid you’re talking about. And, lots of traditional “air” cooling methods run warm air through a compressor (like in an air conditioner), which stores cold water and cools off the air, recirculating it into the data center. So, one fairly direct combination of this is the evaporative cooling tower:
Obviously water and electricity don’t naturally blend well, and one of the main concerns of using this method is leakage. Over time, folks have come up with some good, safe methods, designed around effectively containing the liquid. This increases the up-front cost, but has big payoffs for temperature mitigation. You find this methodology in rear door heat exchangers, which create a heat exchanger in—you guessed it—the rear door of a server, and direct-to-chip cooling, which contains the liquid into a plate, then embeds that plate directly in the hardware component.
So, we’ve got a piece of hardware, a server rack—the next step is the full data center turning itself into a heat exchange, and that’s when you get Nautilus—a data center built over a body of water.
(Other) Liquid-Based Cooling, or Immersion Cooling
With the same sort of daring thought process of the people who said, “I bet we can fly if we jump off this cliff with some wings,” somewhere along the way, someone said, “It would cool down a lot faster if we just dunked it in liquid.” Liquid-based cooling utilizes dielectric liquids, which can safely come in contact with electrical components. Single phase immersion uses fluids that don’t boil or undergo a phase change (think: similar to an oil), while two phase immersion uses liquids that boil at low temperatures, which releases heat by converting to a gas.
You’ll see components being cooled this way either in enclosed chassis, which can be used in rack-style environments, in open baths, which require specialized equipment, or a hybrid approach.
How Necessary Is This?
Let’s bring it back: we’re talking about all those technologies efficiently removing heat from a system because hotter environments break devices, which leads to downtime. And, we want to use efficient methods to remove heat because it means we can ask our devices to work harder without having to spend electricity to do it.
Recently, folks have started to question exactly how cool data centers need to be. Even allowing a few more degrees of tolerance can make a huge difference to how much time and money you spend on cooling. Whether it has longer term effects on the device performance is questionable—manufacturers are fairly opaque about data around how these standards are set, though exceeding recommended temperatures can have other impacts, like voiding device warranties.
Power, Infrastructure, Growth, and Sustainability
But the simple question of “Is it necessary?” is definitely answered “yes,” because power isn’t infinite. And, all this matters because improving power usage has a direct impact on both cost and long-term sustainability. According to a recent MIT article, the data centers now have a greater carbon footprint than the airline industry, and a single data center can consume the same amount of energy as 50,000 homes.
Let’s contextualize that last number, because it’s a tad controversial. The MIT research paper in question was published in 2022, and that last number is cited from “A Prehistory of the Cloud” by Tung-Hui Hu, published in 2006. Beyond just the sheer growth in the industry since 2006, data centers are notoriously reticent about publishing specific numbers when it comes to these metrics—Google didn’t release numbers until 2011, and they were founded in 1998.
Based on our 1MW = 200 homes metric the number from the MIT article number represents 250MW. One of the largest data centers in the world has a 650MW capacity. So, while you can take that MIT number with a grain of salt, you should also pay attention to market reports like this one—the aggregate numbers clearly show that power availability and consumption is one of the biggest concerns for future growth.
So, we have less-than-ideal reporting and numbers, and well-understood environmental impacts of creating electricity, and that brings us to the complicated relationship between the two factors. Costs of power have gone up significantly, and are fairly volatile when you’re talking about non-renewable energy sources. International agencies report that renewable energy sources are now the cheapest form of energy worldwide, but the challenge is integrating renewables into existing grids. While the U.S. power grid is reliable (and the U.S. accounts for half of the world’s hyperscale data center capacity), the Energy Department recently announced that the network of transmission lines may need to expand by more than two-thirds to carry that data nationwide—and invested $1.3 billion to make that happen.
What’s Next?
It’s easy to say, “It’s important that data centers stay online,” as we sort of glossed over above, but the true importance becomes clear when you consider what that data does—it keeps planes in the air, hospitals online, and so many other vital functions. Downtime is not an option, which leads us full circle to our introduction.
We (that is, we, humans) are only going to build more data centers. Incremental savings in power have high impact—just take a look at Google’s demand response initiative, which “shift[s] compute tasks and their associated energy consumption to the times and places where carbon-free energy is available on the grid.”
Which is all to say: this is an exciting time for innovation in the cloud, and many of the opportunities are happening below the surface, so to speak. Understanding how the fundamental principles of physics and compute work—now more than ever—is a great place to start thinking about what the future holds and how it will impact our world, technologically, environmentally, and otherwise. And, data centers sit at the center of that “hot” debate.
Човешкият чревен микробиом се изследва интензивно, в резултат на което познанията на учените за видовете микроорганизми, част от нашата храносмилателна система, се увеличават успоредно с усъвършенстването на метагеномните технологии. Чревният микробиом се състои от трилиони микроорганизми. Размножаването им започва веднага след раждането на човека, а промените в състава на микробиома се дължат на генетични фактори и на околната среда (хранителни навици, екологични фактори и др.). Тези промени водят до изменения в чревната пропускливост, храносмилането, метаболизма и имунния отговор. Възпалителните процеси са причина за развитието на стомашно-чревни заболявания, метаболитни и имунологични промени, дори и до невропсихиатрични разстройства.
Какво е това „микробиом“?
Чревният микробиом представлява популацията от микроорганизми, населяваща храносмилателния тракт на животните. При хората чревният микробиом се състои от хиляди микроорганизми, включително бактерии, бактериофаги (вируси, заразяващи бактериите) и еукариоти. В него има над 1500 вида, част от 50 различни типа микроорганизми. Доминиращите типове, заемащи 90% от чревния микробиом, са Bacteroidetes, Firmicutes, Proteobacteria, Fusobacteria, Tenericutes, Actinobacteria и Verrucomrobia. За разлика от стомаха и тънките черва, дебелото черво е населено от 1012 клетки на всеки грам чревна маса. Освен бактерии, в чревната флора има и гъби, протисти, археи и бактериофаги, но научната информация за тях е сравнително оскъдна. Микроорганизмите живеят в нашия микробиом с цел да ни предпазят от патогени, като произвеждат антимикробни вещества и засилват имунната система. Те имат роля в храносмилането, метаболизма, контролират размножаването и специализирането на епителните клетки, повлияват инсулиновата резистентност, дори и неврологичните функции. Нарушение в популациите, изграждащи чревния микробиом, би могло да доведе до редица заболявания, свързани с други органи в човешкото тяло.
Какво прави чревният микробиом за нашето тяло?
Той разгражда (метаболизира) храната, която приемаме, до биоактивни хранителни елементи. Бактериите разграждат несмилаеми въглехидрати, като целулоза, нишесте, пектин, олигозахариди и лигнин до късоверижни мастни киселини (оцетна, пропионова и бутирова киселина). Тези метаболитни продукти се дължат основно на работата на Firmicutes, Bacteroidetes и някои анаеробни чревни микроорганизми. Чревният микробиом участва и в синтеза на витамини – биотин, тиамин, кобаламин, рибофлавин, витамин B, витамин K и др. Централната нервна система се повлиява от чревния микробиом посредством някои неврохимични вещества, които микроорганизмите произвеждат. Освен това той има роля и при синтезирането на жлъчни киселини, холестерол и конюгирани мастни киселини.
Съществува и връзка между мозъка и чревния микробиом. Късоверижните мастни киселини, които са негов продукт, засягат кръвно-мозъчната бариера (blood-brain barrier – BBB) чрез произвеждането на специфични протеини, които се намират в т.нар. бариера между клетките (tight junction). Циркулиращите късоверижни мастни киселини, произведени от чревния микробиом, засягат целостта на кръвно-мозъчната бариера чрез увеличаване на производството на въпросните протеини. По този начин се увеличава плътността на BBB и се предотвратява навлизането на нежелани метаболити в мозъчната тъкан. Чревният микробиом произвежда и липопротеини и липополизахариди, които стимулират освобождаването на цитокини от клетките на имунната система. Тези цитокини преминават през кръвно-мозъчната бариера и активират неврони, което води до промени в настроението и поведението.
Генетика и вредни навици
Открити са асоциации между микробиома и гените, свързани с вродения имунитет на гостоприемника: определен вид рецептори (pattern recognition receptors) разпознават микроорганизмите в червата и модулират състава на микробиома. Учени са направили изследване на фекален микробиом на индивиди със или без генетична връзка. Еднояйчни близнаци, които живеят разделени от години, имат почти идентични микробиомни профили, а между партньори, живеещи заедно, със сходни хранителни навици, няма значителни прилики.
Балансираният хранителен режим има основна роля в модулирането на чревния микробиом. При поддържане както на полезни, така и на вредни хранителни навици се увеличава или намалява количеството на някои видове микроорганизми. Чревният микробиом продължава своето развитие след детска възраст и начинът на хранене структурира разнообразието на чревните микроорганизми. При вегетарианските диети например доминират Firmicutes и Bacteroidetes. Бариерната функция на чревната лигавица се поддържа чрез консумирането на фибри. Богатата на фибри диета регулира нивата на глюкозата. При хранителен режим, богат на протеини и мазнини, доминантни са Bacteroides, Bilophila и Alistipes, а Firmicutes са потиснати, понижен е имунитетът, а чувствителността към инфекции се повишава, както и рискът от развитие на метаболитни заболявания.
Активният начин на живот (редовните физически упражнения) също влияе на чревния микробиом. Установено е, че спортистите имат по-малко количество Bacteroidetes и по-големи количества Firmicutes в сравнение с хора, които не спортуват. Спортистите имат и по-ниски нива на хронични възпалителни процеси.
Антибиотиците, които унищожават патогените, са нож с две остриета, тъй като убиват и полезните микроорганизми, нарушават чревния микробиом и това води до т.нар. дисбиоза (промяната на микробния състав). Конкретните ефекти от приемането на антибиотици върху чревния микробиом зависят от вида, дозировката и продължителността на приема им. При продължителен прием на клиндамицин например някои видове от рода Bacteroides не се възстановяват. Лечението на Helicobacter pylori със същия антибиотик води до намаляване на актинобактериите. Резултат от приема на ципрофлоксацин е намаляването на Ruminococcus, които се възстановяват половин година след прекратяване на лечението.
Чревният микробиом и някои заболявания
Дисбиозата крие риск от развитие на различни заболявания. Синдромът на раздразненото черво(Irritable bowel syndrome – IBS) се характеризира с коремна болка, метеоризъм, запек или диария. Нарушенията в чревния микробиом, свързани с това заболяване, са количествени и качествени и се отнасят към комуникацията между червата и мозъка. Възпалителното заболяване на червата (Inflammatory bowel disease – IBD) се счита за хетерогенна група от хронични имуномедиирани възпалителни заболявания, засягащи храносмилателната система. Дължи се както на генетични фактори, така и на фактори на околната среда, като стрес, нарушения на съня, прием на антибиотици, диета и тютюнопушене. Двете най-значими заболявания от тази група са улцерозен колит и болест на Крон.
При пациентите с IBD е засегнат слузният слой на храносмилателния тракт, което води до възникването на възпалителни процеси. При IBD е установено намаляването на Bacteroidetes и Firmicutes, Faecalibacterium prausnitzii и Roseburia.
Нарушенията на оста чревен микробиом – мозък предразполагат както към неврологични (аутизъм, болест на Алцхаймер), така и към психиатрични заболявания, като тревожно разстройство и депресия. Дисбиозата, причинена от патогенни бактерии, може да изостри безпокойството. Инфекцията с Campylobacter jejuni повишава тревожността чрез активиране на c-Fos протеини, маркери за невронно активиране, без да повишава нивата на провъзпалителни цитокини. Депресията е свързана с модификацията на чревната мозъчна ос, която причинява възпаление. Когато чревната пропускливост се промени и целостта на бариерата е нарушена, бактерии като Enterobacteriaceae се преместват през бариерата и възпалителният процес се активира.
Пробиотиците и терапевтичните стратегии за възстановяване на баланса
Пробиотиците са живи микроорганизми, които се считат за безопасни и подобряват здравословния живот на хората, когато се приемат в адекватно количество. Въпреки широко разпространената употреба на пробиотици, приложението им трябва да бъде регулирано. Генното инженерство е възможен начин за създаване на ново поколение по-целенасочени пробиотици. Рекомбинантните бактерии, или бактерии, модифицирани с генно инженерство, изпълняват специфични функции в стомашно-чревния тракт, като например откриване на специфични сигнали и производство на някои терапевтични молекули.
Пребиотиците (например целулоза, соя, олигозахариди, сурови овесени ядки, лигнин и корени от цикория) водят до специфични промени в организацията и функциите на чревния микробиом. Те подобряват целостта на чревната мукозна бариера, повишават имунитета на лигавицата, понижават рН и производството на късоверижни мастни киселини и инхибират растежа на патогенни микроорганизми. Синбиотиците са синергични комбинации от про- и пребиотици. Терминът е специално запазен за продукти, в които пребиотичните съединения селективно благоприятстват пробиотичните организми. Тъй като съставът на чревната микробиота е сравним с пръстовия отпечатък и има различни нива и видове дисбиоза, правилното използване на синбиотиците трябва да се обмисли преди избора за лечение на пациента.
При трансплантация на фекален микробиом фекални микроорганизми от здрави хора се трансплантират на пациенти с чревни инфекции, за да се възстановят популацията от микроорганизми и функциите на чревния микробиом. Използва се за лечение на синдром на раздразненото черво, както и на възпалителни заболявания на червата, инсулинова резистентност, затлъстяване, аутизъм, диария, алергични разстройства, метаболитен синдром, рак на дебелото черво, невропсихиатрични състояния и болест на Паркинсон.
В друг терапевтичен подход се използват бактериофагите. Фагите имат голям терапевтичен потенциал. Може да се използват за антимикробни цели или за модулиране на състава на популациите от микроорганизми.
Промяната в състава и функцията на чревния микробиом има пряк ефект върху човешкото здраве и играе важна роля за възникването на заболявания. Очаква се комбинирането на различни изследователски дисциплини и използването на нови технологии за изследването на микробиома да позволят преодоляването на ограниченията, пред които са изправени настоящите стратегии за справяне със здравните проблеми, свързани със съвременния начин на живот.
Before loading a BPF program, the kernel must verify that the program is
safe to run; among other things, that verification includes ensuring that
the program will terminate within a bounded time. That requirement has
long made writing loops in BPF a challenging task. The situation has
improved over the years for some types of loops, but others — including
linked-list traversal — are still awkward in BPF programs. A new set of
BPF primitives aims to make life easier for this use case through the
installation of what can be seen as a sort of circuit breaker.
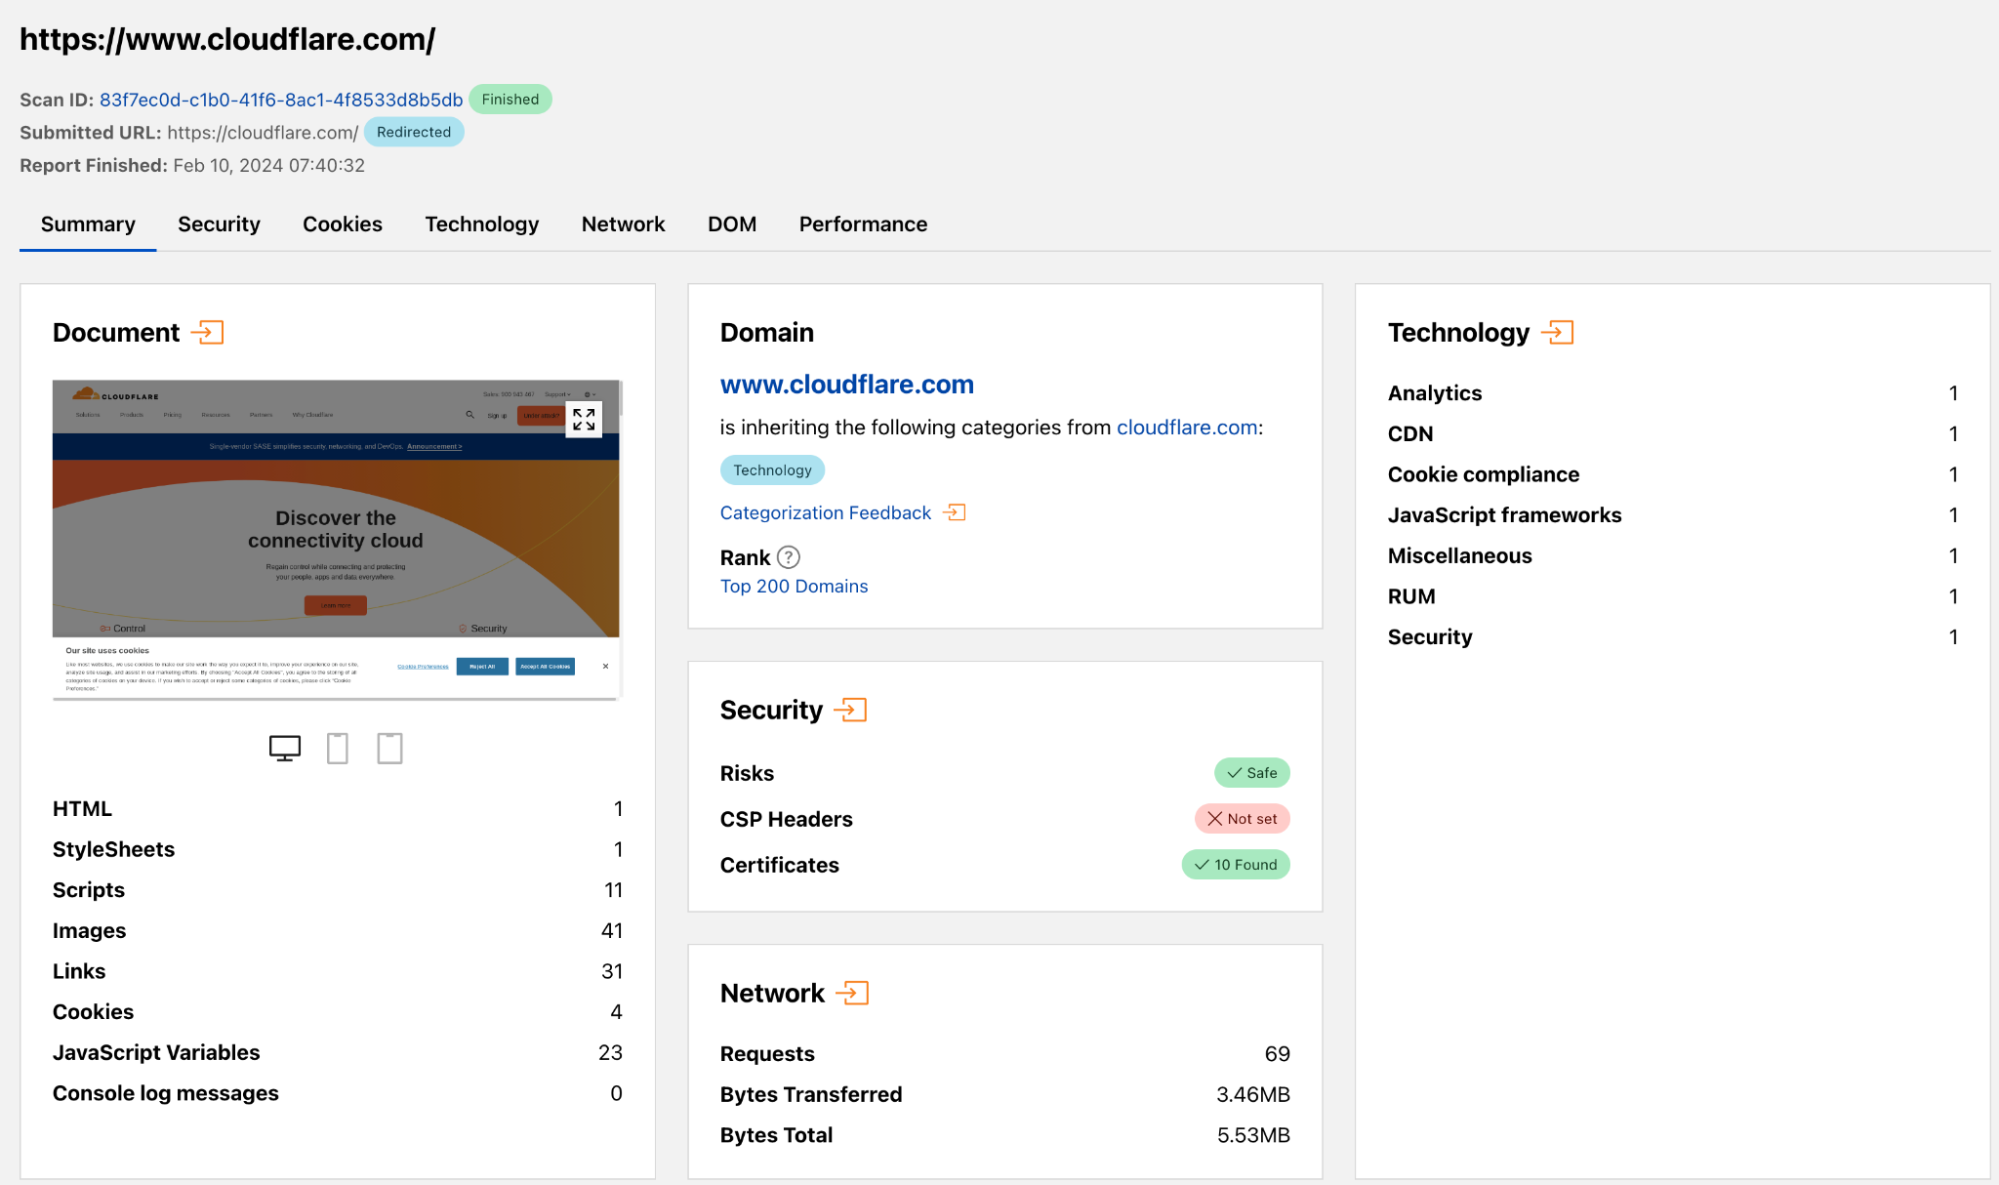
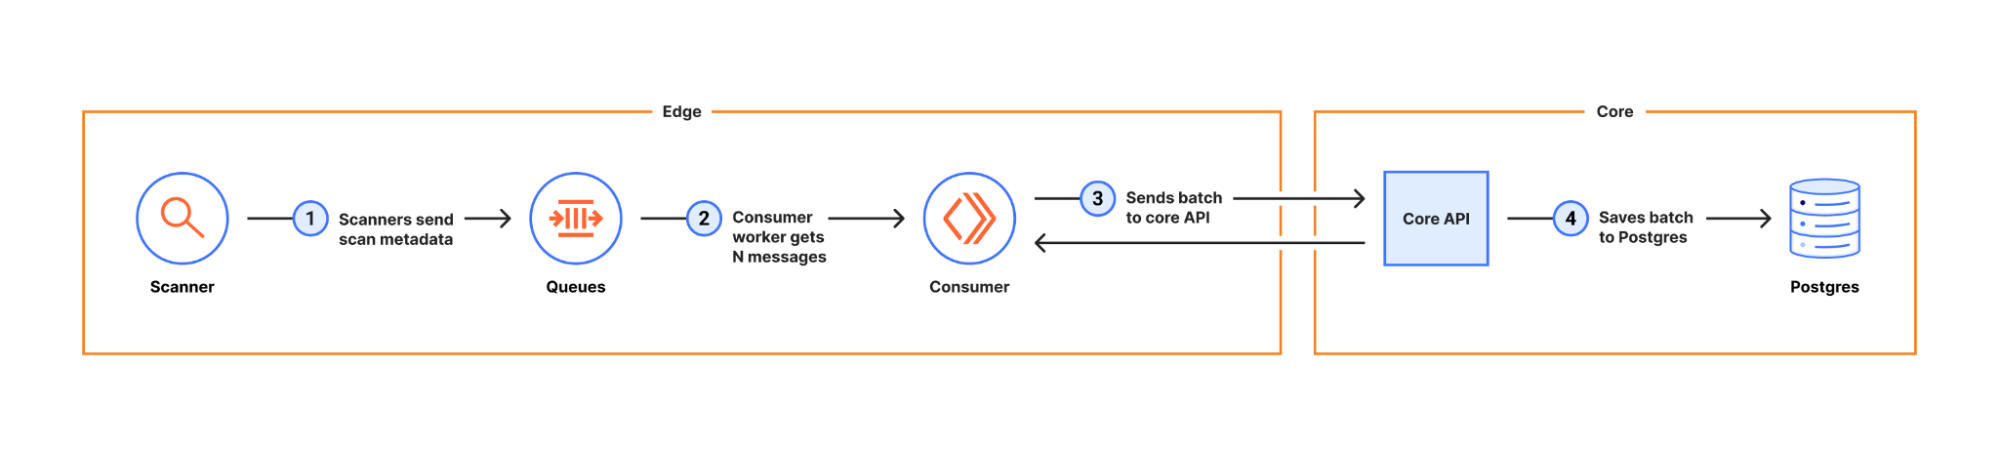
During 2021’s Birthday Week, we announced our Email Routing service, which allows users to direct different types of email messages (such as marketing, transactional, or administrative) to separate accounts based on criteria such as the recipient’s address or department. Its capabilities and the volume of messages routed have grown significantly since launch.
Just a few months later, on February 23, 2022, we announced our intent to acquire Area 1 Security to protect users from phishing attacks in email, web, and network environments. Since the completion of the acquisition on April 1, 2022, Area 1’s email security capabilities have been integrated into Cloudflare’s secure access service edge (SASE) solution portfolio, and now processes tens of millions of messages daily.
Processing millions of email messages each day on behalf of our customers gives us a unique perspective on the threats posed by malicious emails, spam volume, the adoption of email authentication methods like SPF, DMARC, and DKIM, and the use of IPv4/IPv6 and TLS by email servers. Today, we are launching a new Email Security section on Cloudflare Radar to share these perspectives with you. The insights in this new section can help you better understand the state of email security as viewed across various metrics, as well as understanding real-time trends in email-borne threats. (For instance, correlating an observed increase within your organization in messages containing malicious links with a similar increase observed by Cloudflare.) Below, we review the new metrics that are now available on Radar.
Tracking malicious email
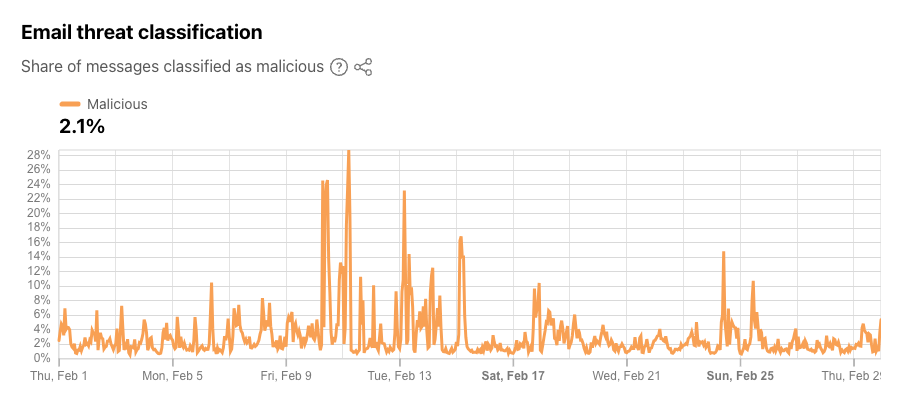
As Cloudflare’s email security service processes email messages on behalf of customers, we are able to identify and classify offending messages as malicious. As examples, malicious emails may attempt to trick recipients into sharing personal information like login details, or the messages could attempt to spread malware through embedded images, links, or attachments. The new Email Security section on Cloudflare Radar now provides insight at a global level into the aggregate share of processed messages that we have classified as malicious over the selected timeframe. During February 2024, as shown in the figure below, we found that an average of 2.1% of messages were classified as being malicious. Spikes in malicious email volume were seen on February 10 and 11, accounting for as much as 29% of messages. These spikes occurred just ahead of the Super Bowl, in line with previous observations of increases in malicious email volume in the week ahead of the game. Other notable (but lower) spikes were seen on February 13, 15, 17, 24, and 25. The summary and time series data for malicious email share are available through the Radar API.
Threat categorization
The Cloudflare Radar 2023 Year in Review highlighted some of the techniques used by attackers when carrying out attacks using malicious email messages. As noted above, these can include links or attachments leading to malware, as well as approaches like identity deception, where the message appears to be coming from a trusted contact, and brand impersonation, where the message appears to be coming from a trusted brand. In analyzing malicious email messages, Cloudflare’s email security service categorizes the threats that it finds these messages contain. (Note that a single message can contain multiple types of threats — the sender could be impersonating a trusted contact while the body of the email contains a link leading to a fake login page.)
Based on these assessments, Cloudflare Radar now provides insights into trends observed across several different groups of threat types including “Attachment”, “Link”, “Impersonation”, and “Other”. “Attachment” groups individual threat types where the attacker has attached a file to the email message, “Link” groups individual threat types where the attacker is trying to get the user to click on something, and “Impersonation” groups individual threat types where the attacker is impersonating a trusted brand or contact. The “Other” grouping includes other threat types not covered by the previous three.
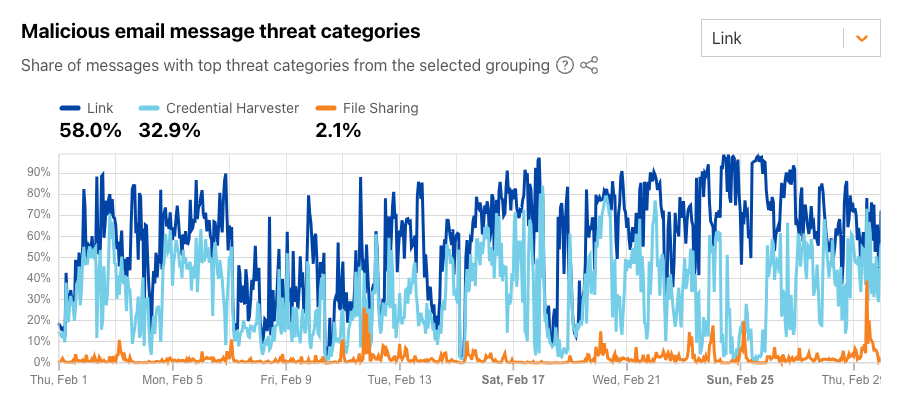
During February 2024 for the “Link” grouping, as the figure below illustrates, link-based threats were unsurprisingly the most common, and were found in 58% of malicious emails. Since the display text for a link (i.e., hypertext) in HTML can be arbitrarily set, attackers can make a URL appear as if it links to a benign site when, in fact, it is actually malicious. Nearly a third of malicious emails linked to something designed to harvest user credentials. The summary and time series data for these threat categories are available through the Radar API.
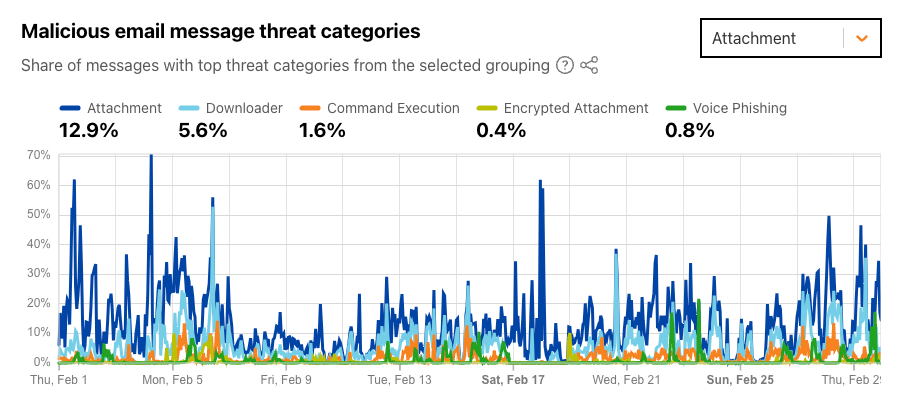
For the “Attachment” grouping, during February 2024, nearly 13% of messages were found to have a malicious attachment that when opened or executed in the context of an attack, includes a call-to-action (e.g. lures target to click a link) or performs a series of actions set by an attacker. The share spiked several times throughout the month, reaching as high as 70%. The attachments in nearly 6% of messages attempted to download additional software (presumably malware) once opened.
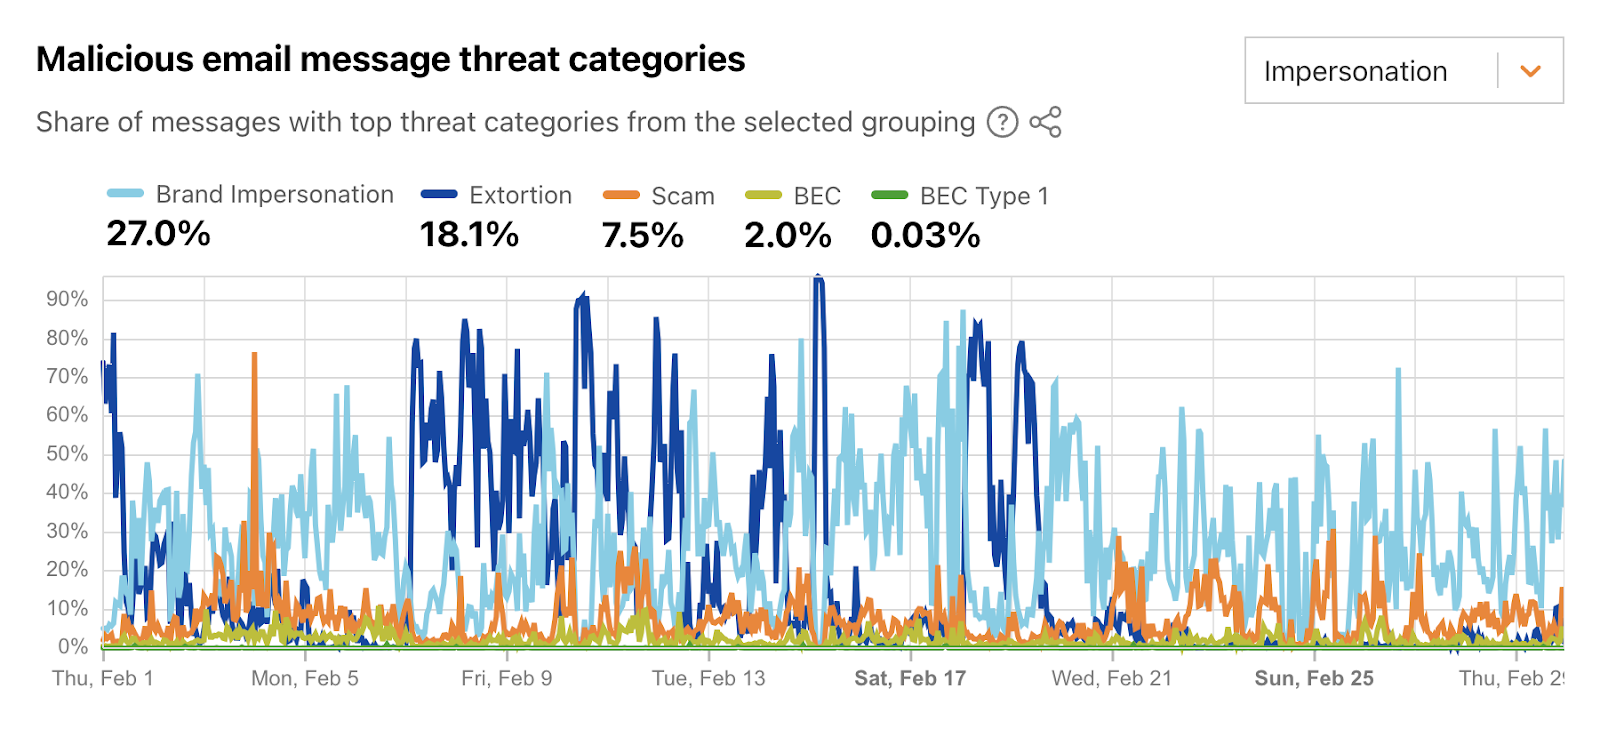
If an email message appears to be coming from a trusted brand, users may be more likely to open it and take action, like checking the shipping status of a package or reviewing a financial transaction. During February 2024, on average, over a quarter of malicious emails were sent by attackers attempting to impersonate well-known brands. Similar to other threat categories, this one also saw a number of significant spikes, reaching as high as 88% of February 17. Just over 18% of messages were found to be trying to extort users in some fashion. It appears that such campaigns were very active in the week ahead of Valentine’s Day (February 14), although the peak was seen on February 15, at over 95% of messages.
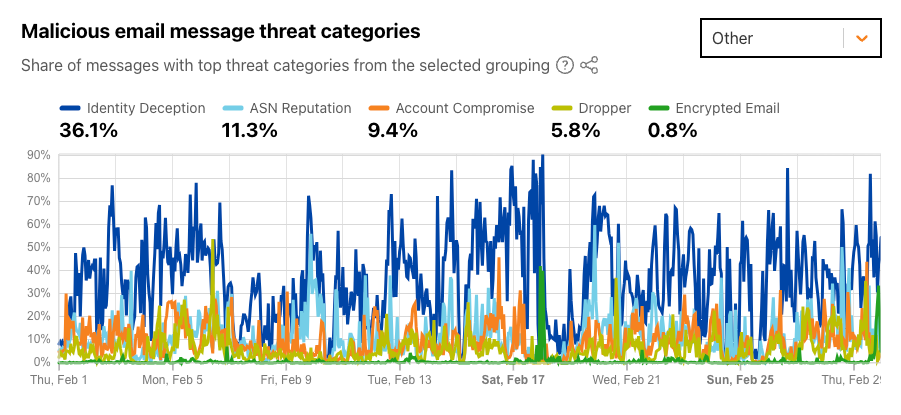
Identity deception occurs when an attacker or someone with malicious intent sends an email claiming to be someone else, whether through use of a similar-looking domain or display name manipulation. This was the top threat category for the “Other” grouping, seen in over 36% of malicious emails during February 2024. The figure below shows three apparent “waves” of the use of this technique — the first began at the start of the month, the second around February 9, and the third around February 20. Over 11% of messages were categorized as malicious because of the reputation of the network (autonomous system) that they were sent from; some network providers are well-known sources of malicious and unwanted email.
Dangerous domains
Top-level domains, also known as TLDs, are found in the right-most portion of a hostname. For example, radar.cloudflare.com is in the .comgeneric Top Level Domain (gTLD), while bbc.co.uk is in the .ukcountry code Top Level Domain (ccTLD). As of February 2024, there are nearly 1600 Top Level Domains listed in the IANA Root Zone Database. Over the last 15 years or so, several reports have been published that look at the “most dangerous TLDs” — that is, which TLDs are most favored by threat actors. The “top” TLDs in these reports are often a mix of ccTLDs from smaller counties and newer gTLDs. On Radar, we are now sharing our own perspective on these dangerous TLDs, highlighting those where we have observed the largest shares of malicious and spam emails. The analysis is based on the sending domain’s TLD, found in the From: header of an email message. For example, if a message came from [email protected], then example.com is the sending domain, and .com is the associated TLD.
On Radar, users can view shares of spam and malicious email, and can also filter by timeframe and “type” of TLD, with options to view all (the complete list), ccTLDs (country codes), or “classic” TLDs (the original set of gTLDs specified in RFC 1591). Note that spam percentages shown here may be lower than those published in other industry analyses. Cloudflare cloud email security customers may be performing initial spam filtering before messages arrive at Cloudflare for processing, resulting in a lower percentage of messages characterized as spam by Cloudflare.
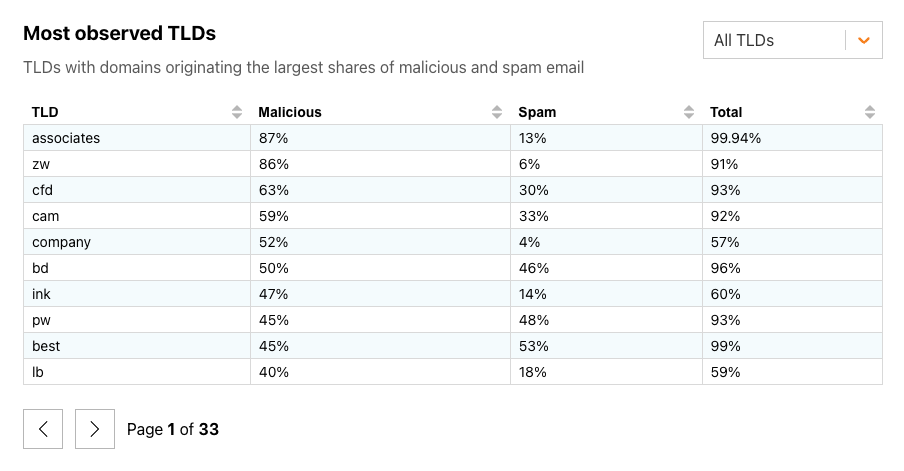
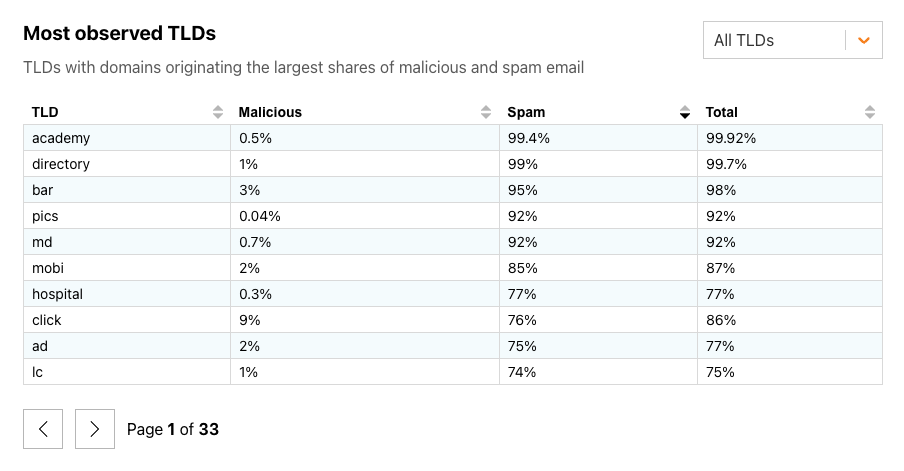
Looking back across February 2024, we found that new gTLD associates and the ccTLD zw (Zimbabwe) were the TLDs with domains originating the largest shares of malicious email, at over 85% each. New TLDs academy, directory, and bar had the largest shares of spam in email sent by associated domains, at upwards of 95%.
TLDs with the highest percentage of malicious email in February 2024TLDs with the highest percentage of spam email in February 2024
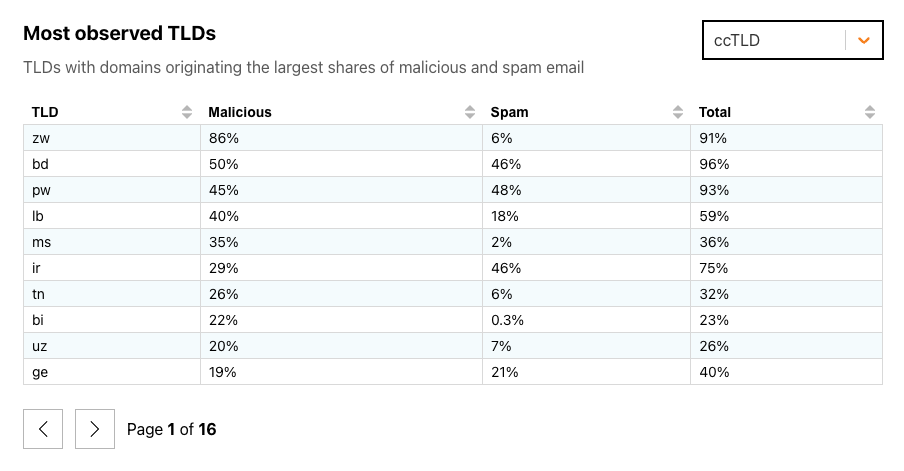
The figure below breaks out ccTLDs, where we found that at least half of the messages coming from domains in zw (Zimbabwe, at 85%) and bd (Bangladesh, at 50%) were classified as malicious. While the share of malicious email vastly outweighed the share of spam seen from zw domains, it was much more balanced in bd and pw (Palau). A total of 80 ccTLDs saw fewer than 1% of messages classified as malicious in February 2024.
ccTLDs with the highest percentage of malicious email in February 2024
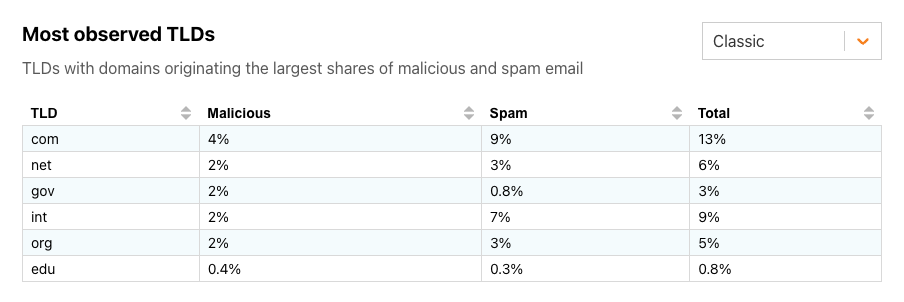
Among the “classic” TLDs, we can see that the shares of both malicious emails and spam are relatively low. Perhaps unsurprisingly, as the largest TLD, com has the largest shares of both in February 2024. Given the restrictions around registering int and gov domains, it is interesting to see that even 2% of the messages from associated domains are classified as malicious.
Classic TLDs with the highest percentage of malicious email in February 2024.
The reasons that some TLDs are responsible for a greater share of malicious and/or spam email vary — some may have loose or non-existent registration requirements, some may be more friendly to so-called “domain tasting”, and some may have particularly low domain registration fees.The malicious and spam summary shares per TLD are available through the Radar API.
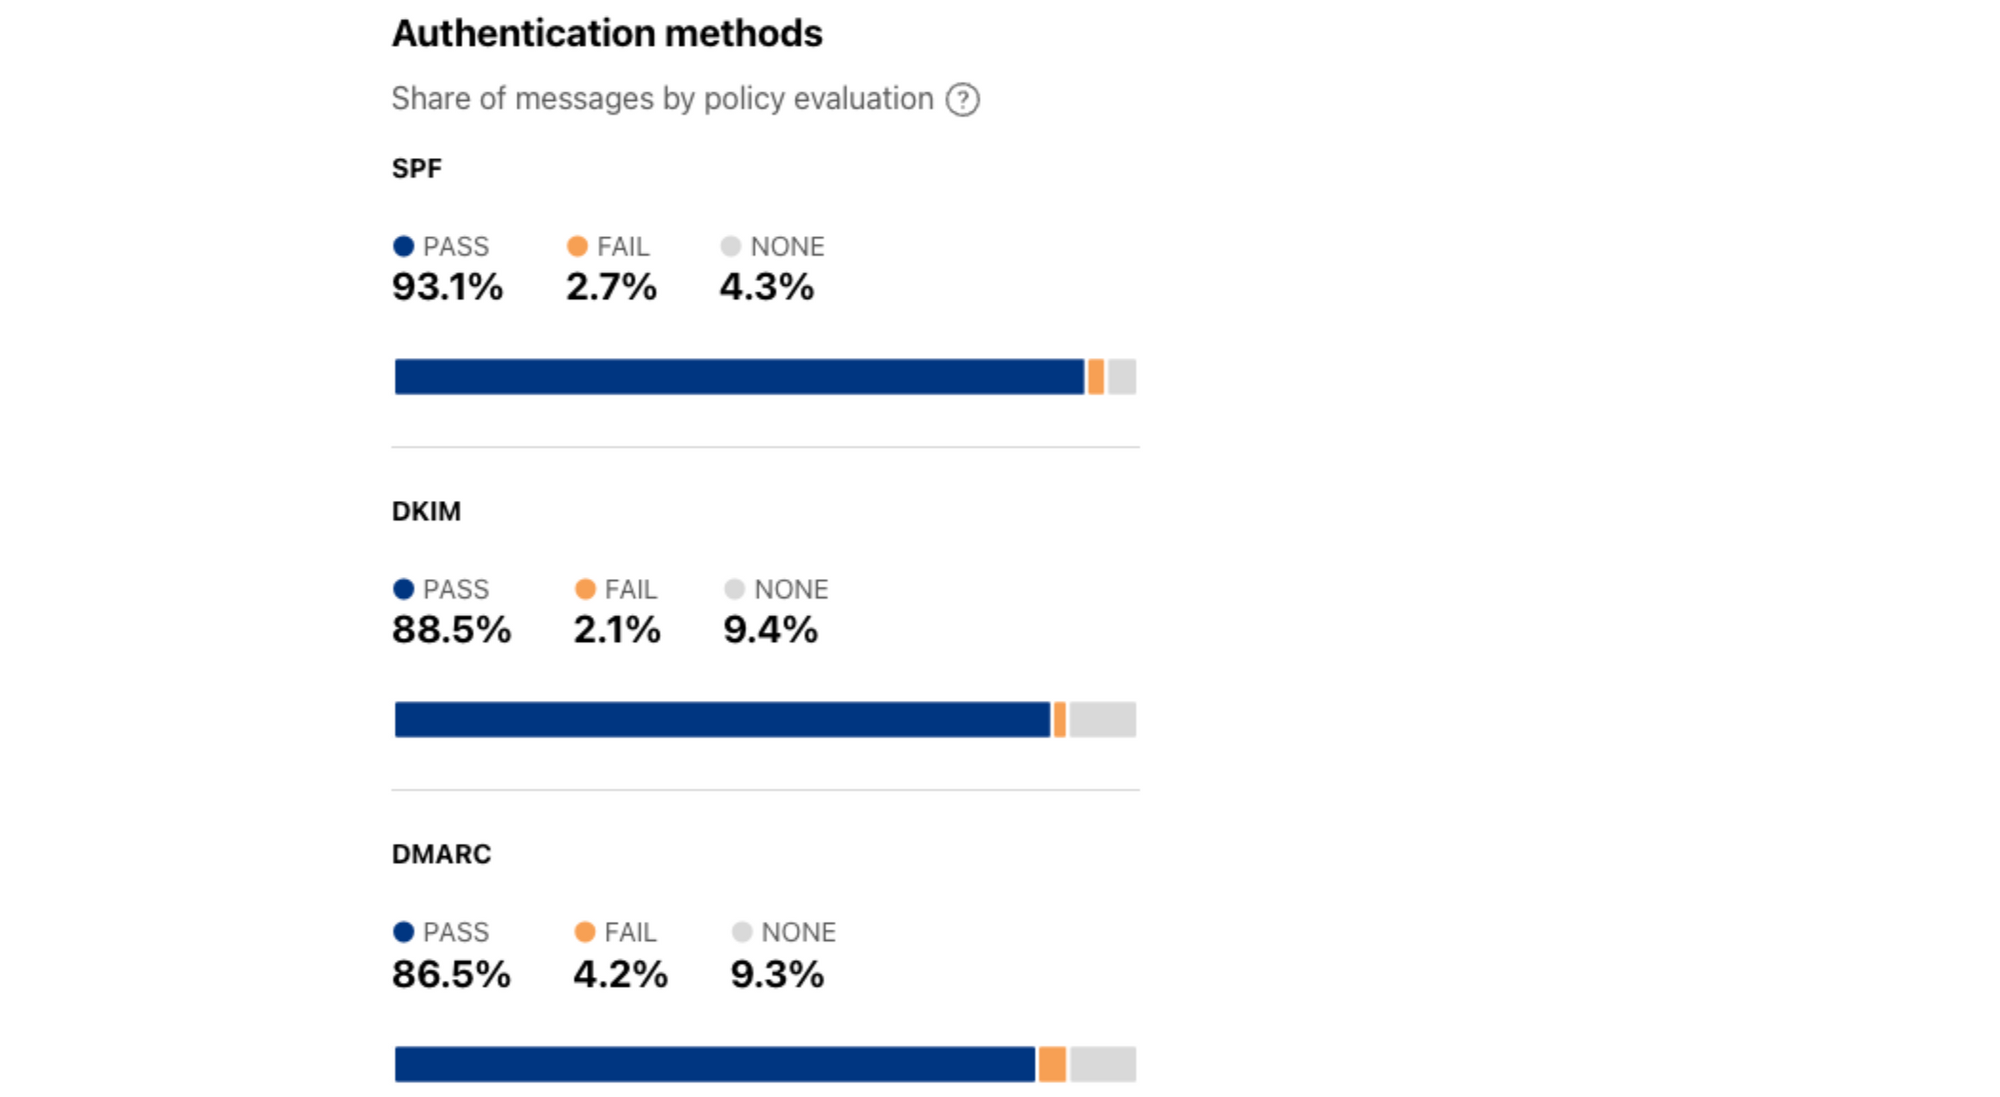
Sender Policy Framework (SPF) is a way for a domain to list all the servers they send emails from, with SPF records in the DNS listing the IP addresses of all the servers that are allowed to send emails from the domain. Mail servers that receive an email message can check it against the SPF record before passing it on to the recipient’s inbox. DomainKeys Identified Mail (DKIM) enables domain owners to automatically “sign” emails from their domain with a digital “signature” that uses cryptography to mathematically verify that the email came from the domain. Domain-based Message Authentication Reporting and Conformance (DMARC) tells a receiving email server what to do, given the results after checking SPF and DKIM. A domain’s DMARC policy, stored in DMARC records, can be set in a variety of ways, instructing mail servers to quarantine emails that fail SPF or DKIM (or both), to reject such emails, or to deliver them.
These authentication methods have recently taken on increased importance, as both Google and Yahoo! have announced that during the first quarter of 2024, as part of a more aggressive effort to reduce spam, they will require bulk senders to follow best practices that include implementing stronger email authentication using standards like SPF, DKIM, and DMARC. When a given email message is evaluated against these three methods, the potential outcomes are PASS, FAIL, and NONE. The first two are self-explanatory, while NONE means that there was no associated SPF/DKIM/DMARC policy associated with the message’s sending domain.
Reviewing the average shares across February 2024, we find that over 93% of messages passed SPF authentication, while just 2.7% failed. When considering this metric, FAIL is the outcome of greater interest because SPF is easier to spoof than DKIM, and also because failure may be driven by “shadow IT” situations, such as when a company’s Marketing department uses a third party to send email on behalf of the company, but fails to add that third party to the associated SPF records. An average of 88.5% of messages passed DKIM evaluation in February, while just 2.1% failed. For DKIM, the focus should be on PASS, as there are potential non-malicious reasons that a given signature may fail to verify. For DMARC, 86.5% of messages passed authentication, while 4.2% failed, and the combination of PASS and FAIL is the focus, as the presence of an associated policy is of greatest interest for this metric, and whether the message passed or failed less so. For all three methods in this section, NONE indicates the lack of an associated policy. SPF (summary, time series), DKIM (summary, time series), and DMARC (summary, time series) data is available through the Radar API.
Protocol usage
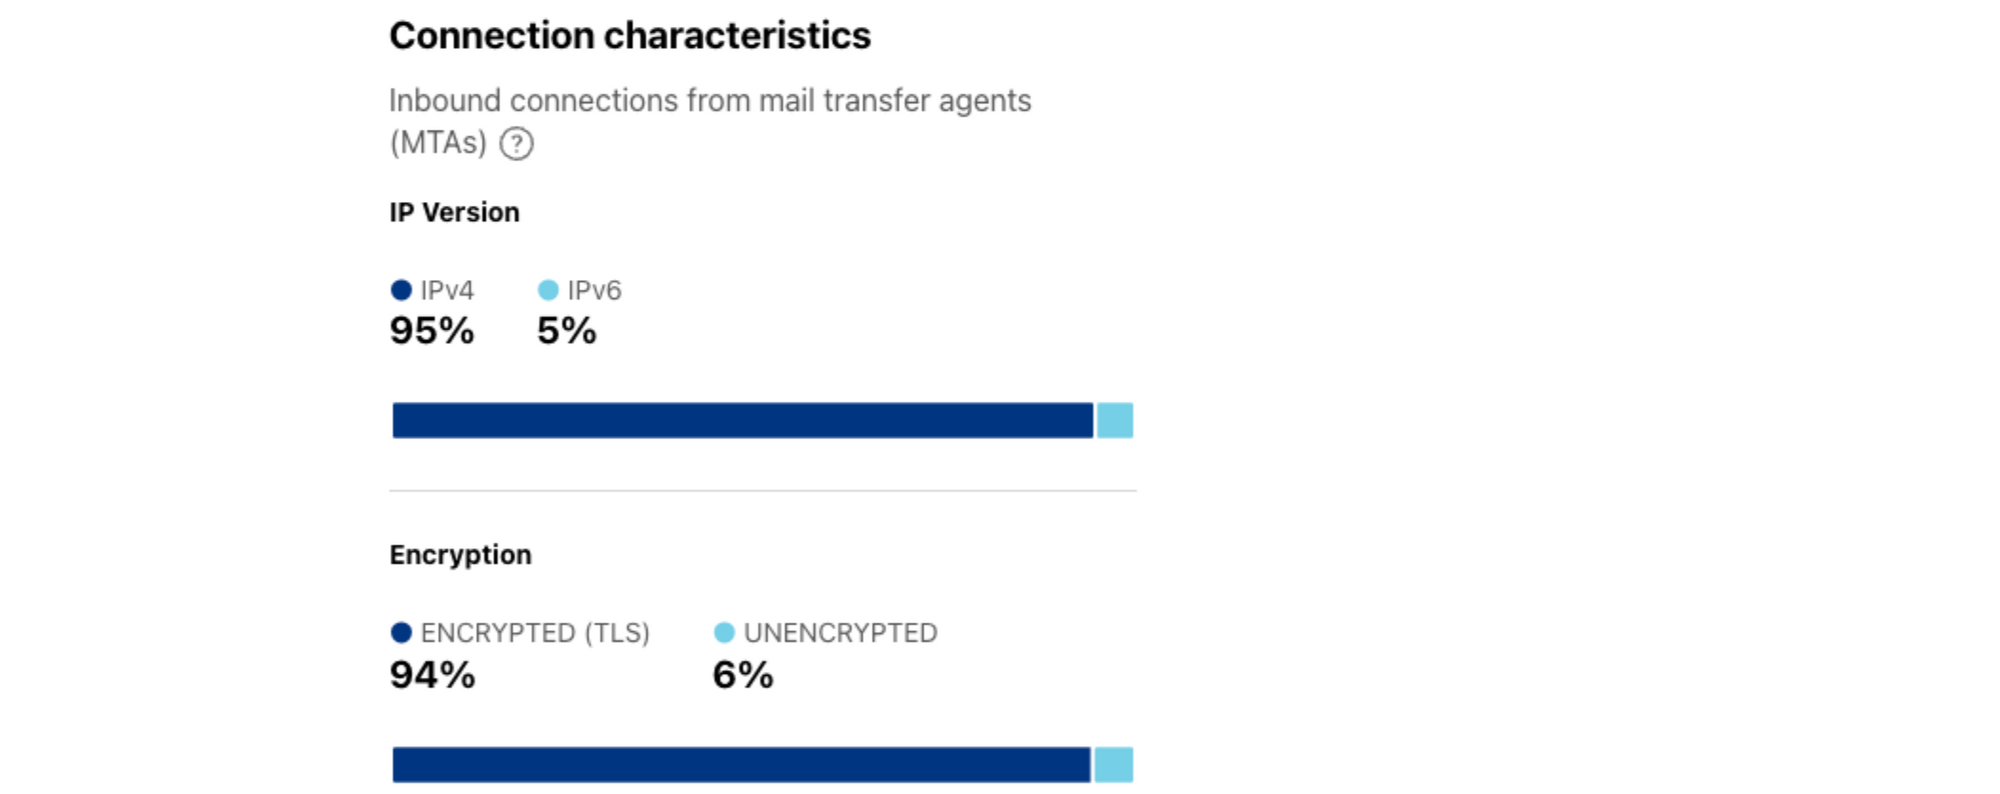
Cloudflare has long evangelized IPv6 adoption, although it has largely been focused on making Web resources available via this not-so-new version of the protocol. However, it’s also important that other Internet services begin to support and use IPv6, and this is an area where our recent research shows that providers may be lacking.
Through analysis of inbound connections from senders’ mail servers to Cloudflare’s email servers, we can gain insight into the distribution of these connections across IPv4 and IPv6. Looking at this distribution for February 2024, we find that 95% of connections were made over IPv4, while only 5% used IPv6. This distribution is in sharp contrast to the share of IPv6 requests for IPv6-capable (dual stacked) Web content, which was 37% for the same time period. The summary and time series data for IPv4/v6 distribution are available through the Radar API.
Cloudflare has also been a long-time advocate for secure connections, launching Universal SSL during 2014’s Birthday Week, to enable secure connections between end users and Cloudflare for all of our customers’ sites (which numbered ~2 million at the time). Over the last 10 years, SSL has completed its evolution to TLS, and although many think of TLS as only being relevant for Web content, possibly due to years of being told to look for the 🔒 padlock in our browser’s address bar, TLS is also used to encrypt client/server connections across other protocols including SMTP (email), FTP (file transfer), and XMPP (messaging).
Similar to the IPv4/v6 analysis discussed above, we can also calculate the share of inbound connections to Cloudflare’s email servers that are using TLS. Messages are encrypted in transit when the connection is made over TLS, while messages sent over unencrypted connections can potentially be read or modified in transit. Fortunately, the vast majority of messages received by Cloudflare’s email servers are made over encrypted connections, with just 6% sent unencrypted during February 2024. The summary and time series data for TLS usage are available through the Radar API.
Conclusion
Although younger Internet users may eschew email in favor of communicating through a variety of messaging apps, email remains an absolutely essential Internet service, relied on by individuals, enterprises, online and offline retailers, governments, and more. However, because email is so ubiquitous, important, and inexpensive, it has also become an attractive threat vector. Cloudflare’s email routing and security services help customers manage and secure their email, and Cloudflare Radar’s new Email Security section can help security researchers, email administrators, and other interested parties understand the latest trends around threats found in malicious email, sources of spam and malicious email, and the adoption of technologies designed to prevent abuse of email.
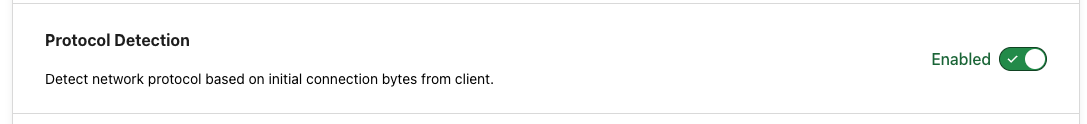
Cloudflare Gateway, our secure web gateway (SWG), now supports the detection, logging, and filtering of network protocols regardless of their source or destination port. Protocol detection makes it easier to set precise policies without having to rely on the well known port and without the risk of over/under-filtering activity that could disrupt your users’ work. For example, you can filter all SSH traffic on your network by simply choosing the protocol.
Today, protocol detection is available to any Enterprise user of Gateway and supports a growing list of protocols including HTTP, HTTPS, SSH, TLS, DCE/RPC, MQTT, and TPKT.
Why is this needed?
As many configuration planes move to using RESTful APIs, and now even GraphQL, there is still a need to manage devices via protocols like SSH. Whether it is the only management protocol available on a new third party device, or one of the first ways we learned to connect to and manage a server, SSH is still extensively used.
With other legacy SWG and firewall tools, the process of blocking traffic by specifying only the well known port number (for example, port 22 for SSH) can be both insecure and inconvenient. For example, if you used SSH over any other port it would not be filtered properly, or if you tried using another protocol over a well known port, such as port 22, it would be blocked. An argument could also be made to lock down the destinations to only allow incoming connections over certain ports, but companies don’t often control their destination devices.
With so many steps, there are risks of over-blocking legitimate traffic, which potentially prevents users from reaching the resources they need to stay productive and leads to a large volume of support tickets for your administrators. Alternatively, you could underblock and miss out on filtering your intended traffic, creating security risks for your organization.
How we built it
To build a performant protocol detection and filtering capability we had to make sure it could be applied in the same place Gateway policies are being applied. To meet this requirement we added a new TCP socket pre-read hook to OXY, our Rust-based policy framework, to buffer the first few bytes of the data stream. This buffer, then, allows Gateway to compare the bytes to our protocol signature database and apply the correct next step. And since this is all built into OXY, if the policy is set to Block, the connection will be closed; if it’s set to Allow, the connection will be proxied or progressed to establish the TLS session.
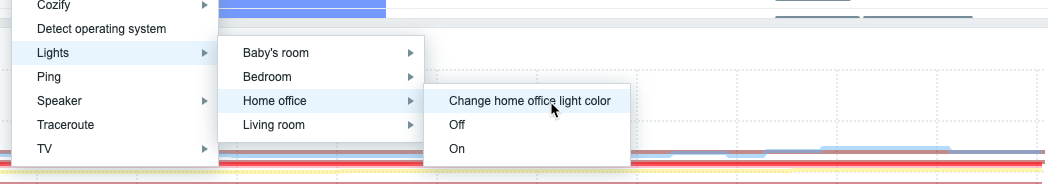
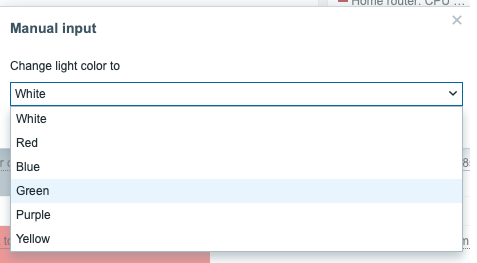
How to set up Gateway protocol filtering
Cloudflare Gateway’s protocol detection simplifies this process by allowing you to specify the protocol within a Gateway Network policy. To get started navigate to the Settings section on the Zero Trust dashboard and then select the Network tile. Under the Firewall section you’ll see a toggle for protocol detection and once enabled you’ll be able to create network policies.
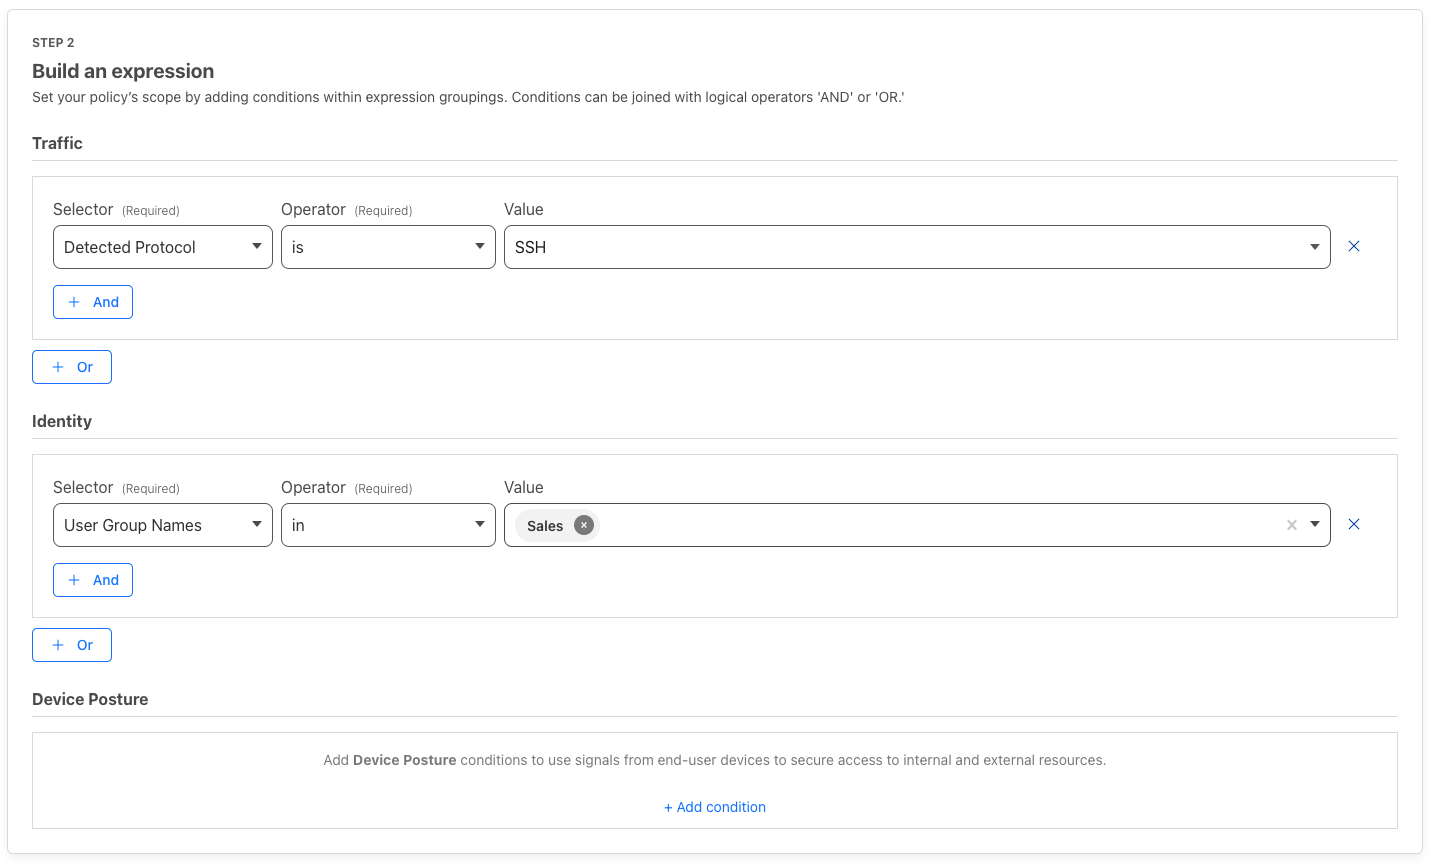
Next, go to the Firewall Policies section of your Zero Trust Gateway dashboard and then click ‘+ Add a policy’. There you can create a policy such as the one below to block SSH for all users within the Sales department.
This will prevent members of the sales team from initiating an outgoing or incoming SSH session.
Get started
Customers with a Cloudflare One Enterprise account will find this functionality in their Gateway dashboard today. We plan to make it available to Pay-as-you-go and Free customer accounts soon, as well as expanding the list of protocols.
If you’re interested in using protocol detection or ready to explore more broadly how Cloudflare can help you modernize your security, request a workshop or contact your account manager.
We constantly measure our own network’s performance against other networks, look for ways to improve our performance compared to them, and share the results of our efforts. Since June 2021, we’ve been sharing benchmarking results we’ve run against other networks to see how we compare.
In this post we are going to share the most recent updates since our last post in September, and talk about how we are getting as fast as we are.
How we stack up
Since June 2021, we’ve been taking a close look at the most reported eyeball-facing ISPs and taking actions for the specific networks where we have some room for improvement. Cloudflare was already the fastest provider for TCP Connection time at the 95th percentile for 44% of the networks around the world (we define a network as country and AS number pair). We chose this metric to show how our network helps make your websites faster by getting you to where your customers are. Taking a look at the numbers, in July 2022, Cloudflare was ranked #1 in 33% of the networks and was within 2 ms (95th percentile TCP Connection Time) or 5% of the #1 provider for 8% of the networks that we measured. For reference, our closest competitor was the fastest for 20% of networks.
As of August 30, 2023, Cloudflare was the fastest provider for 44% of networks — and was within 2 ms (95th percentile TCP Connection Time) or 5% of the fastest provider for 10% of the networks that we measured—whereas our closest competitor (Amazon Cloudfront) was the fastest for 19% of networks. As of February 15, 2024, we are still #1 in 44% of networks for 95th percentile TCP Connection Time. Let’s dig into the data.
Lightning fast
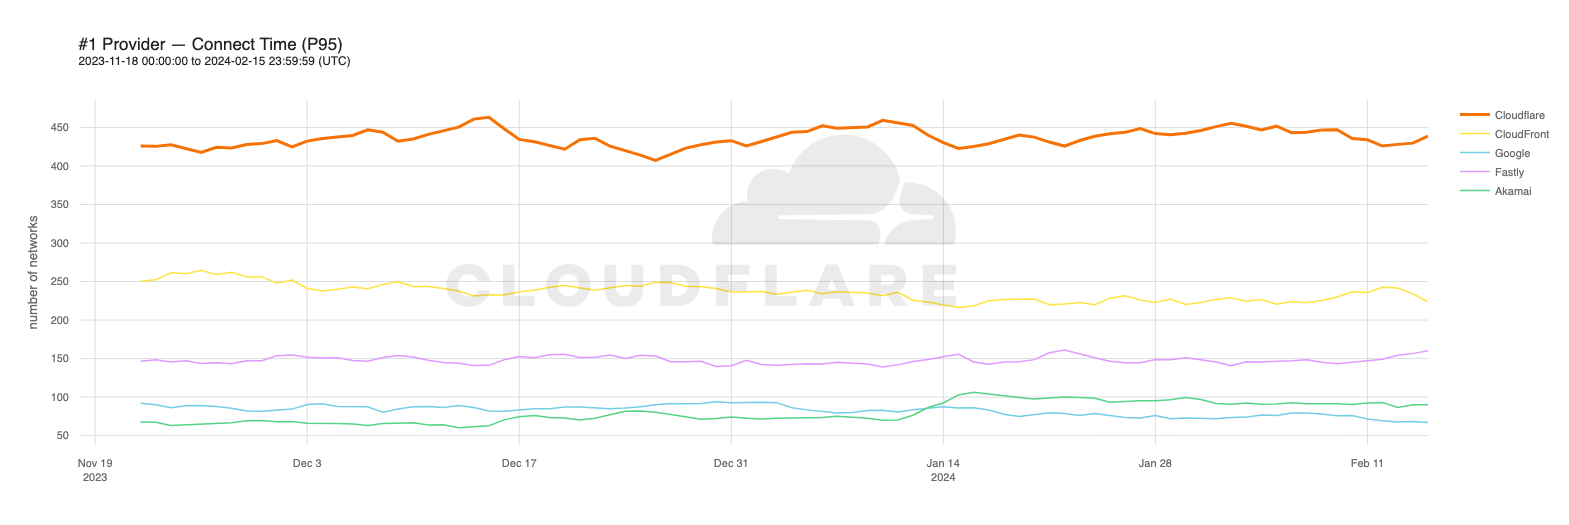
Looking at 95th percentile TCP connect times from November 18, 2023, to February 15, 2024, Cloudflare is the #1 provider in 44% of the top 1000 networks:
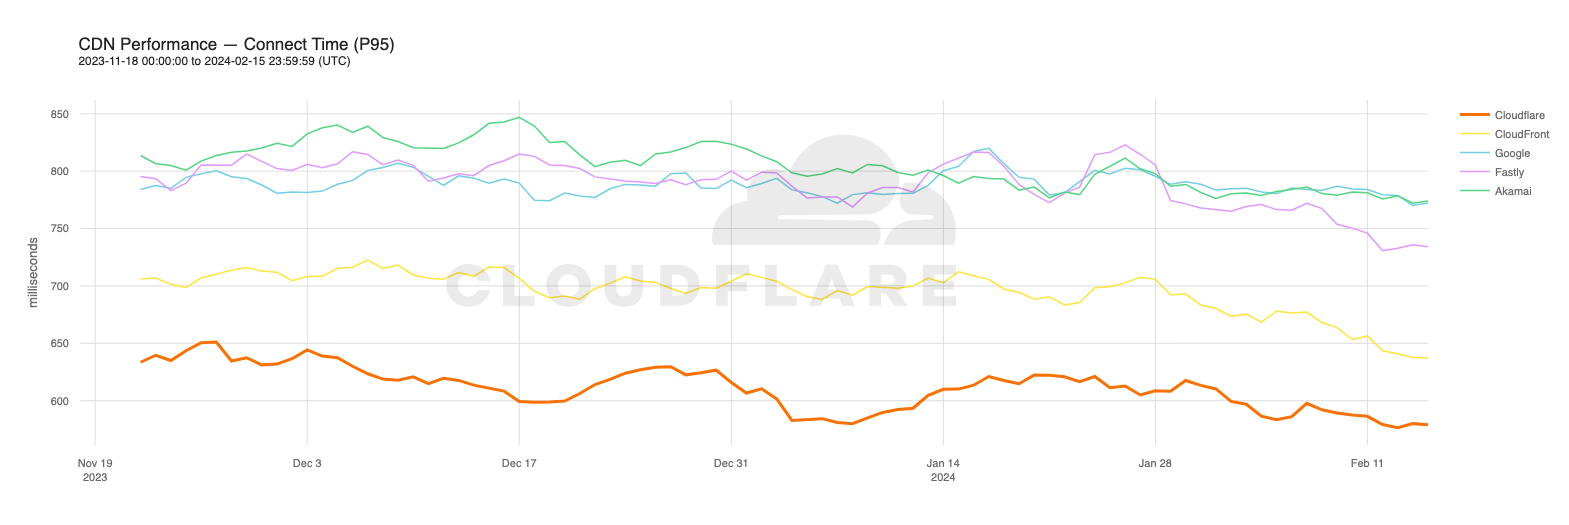
Our P95 TCP Connection time has been trending down since November, and we are consistently 50ms faster at P95 than our closest competitor (Amazon CloudFront):
Connect time comparisons between providers at 50th and 95th percentile
P50 Connect (ms)
P95 Connect (ms)
Cloudflare
130
579
Amazon
145
637
Google
190
772
Akamai
195
774
Fastly
189
734
These graphs show that day over day, Cloudflare was consistently the fastest provider. They also show the gaps between Cloudflare and the other competitors. When you look at the 95th percentile, Cloudflare is almost 200ms faster than Akamai across the world for connect times. This shows that our network reaches more places and allows users to get their content faster than Akamai on a consistent basis.
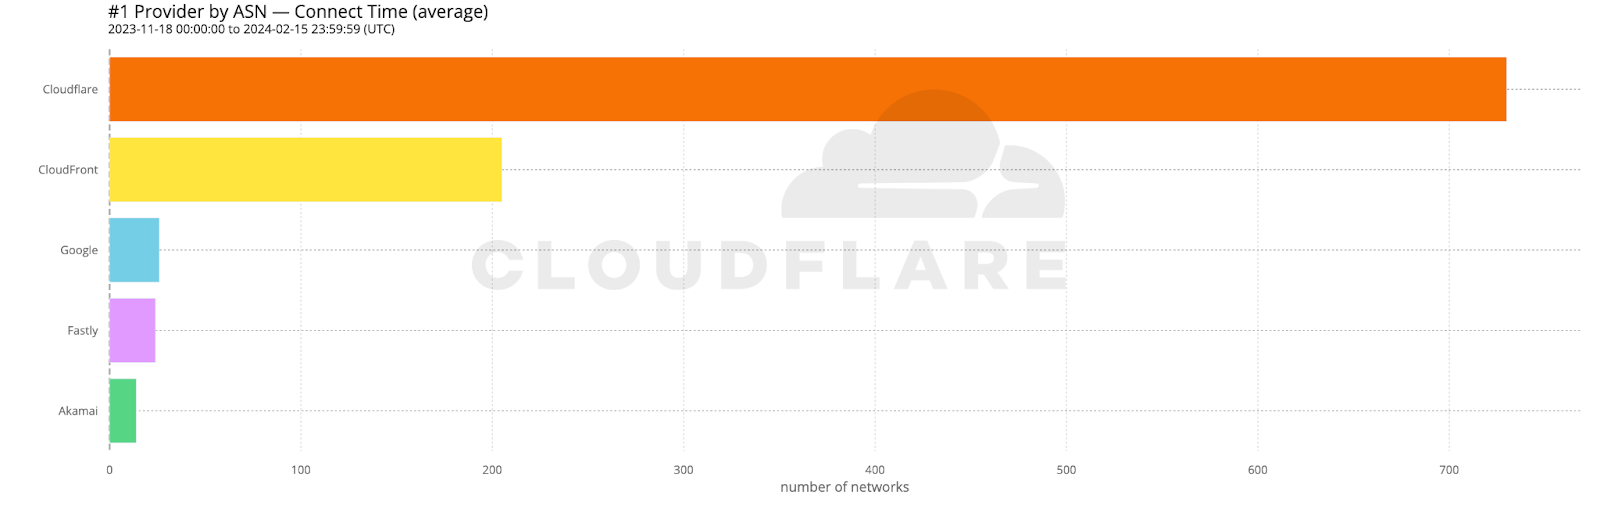
When we aggregate this data over the whole time period, Cloudflare is the fastest in the most networks. For that whole time span of November 18, 2023, to February 15, 2024, Cloudflare was number 1 in 73% of networks for mean TCP connection time:
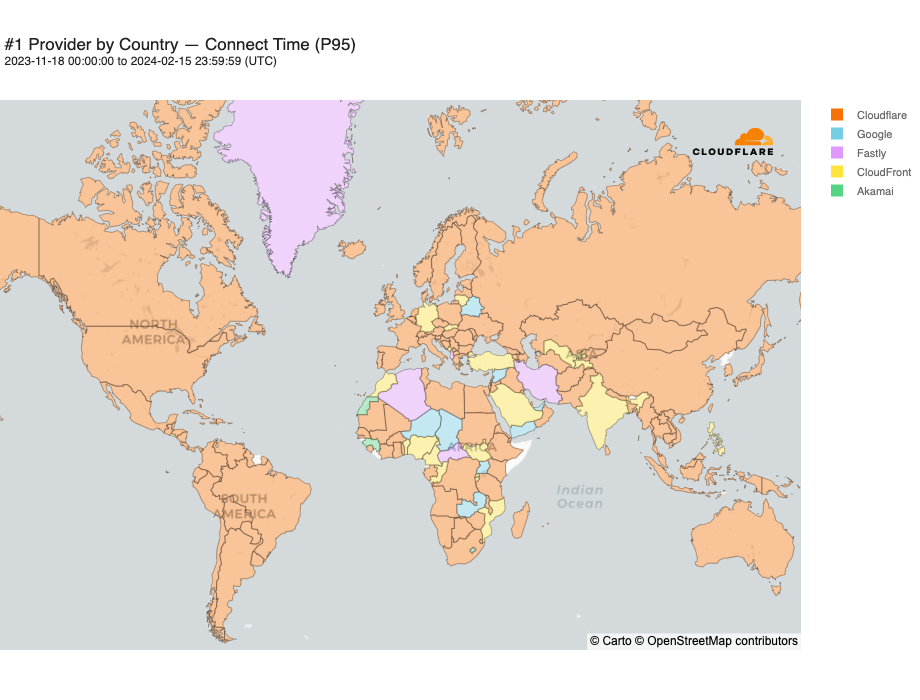
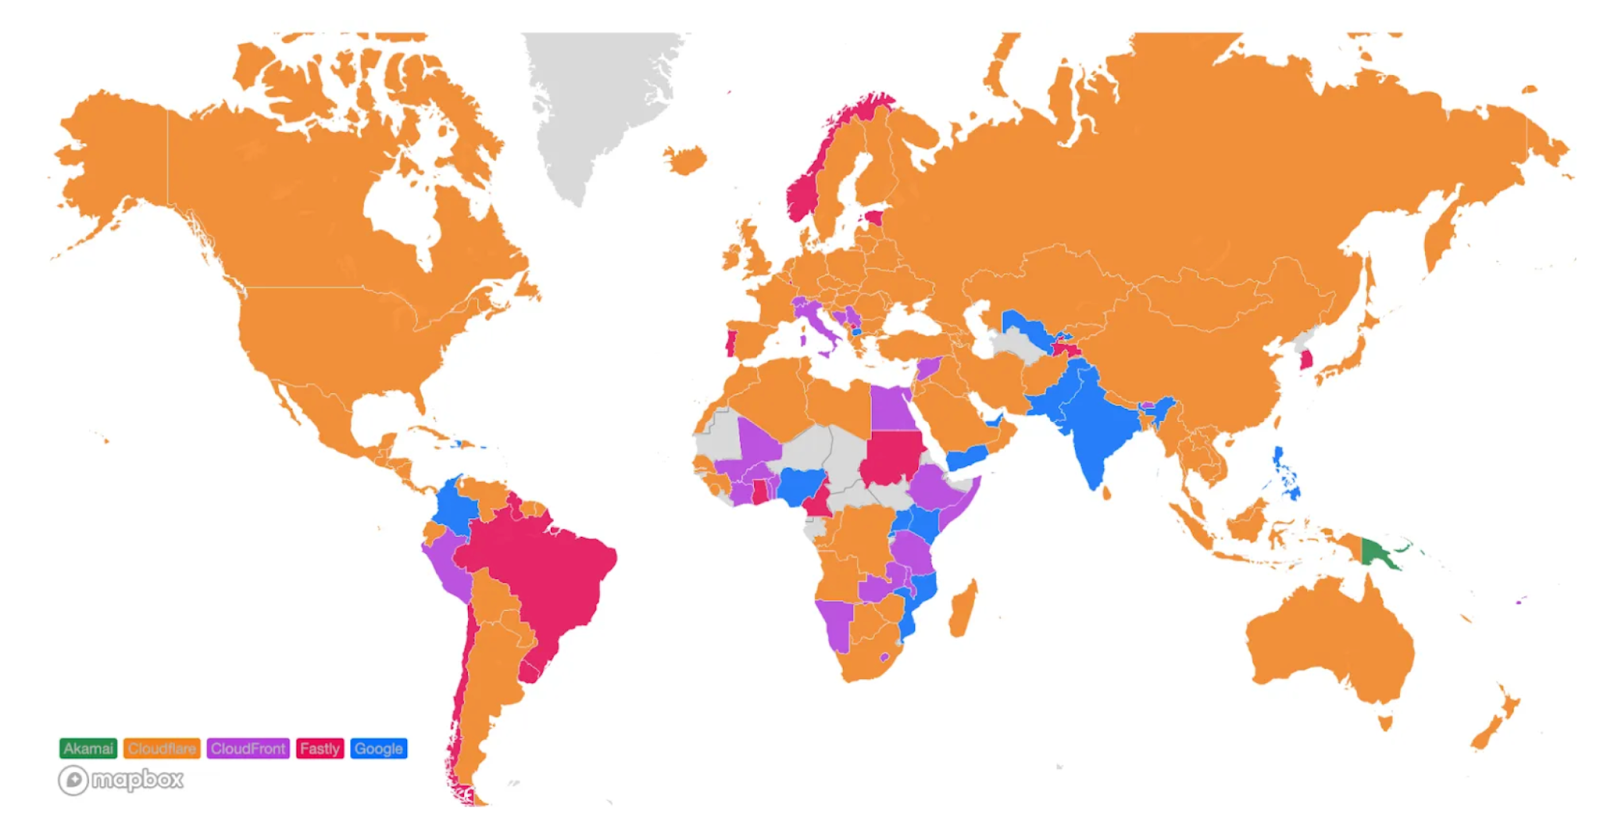
Looking at a map plotting by 95th percentile TCP connect time, Cloudflare is the fastest in the most countries, and you can see this by the fact that most of the map is orange:
For comparison, here’s what the map looked like in September 2023:
These numbers show that we’re reducing the overall TCP connection time around the world while simultaneously staying ahead of the competition. Let’s talk about how we get these numbers and what we’re doing to make you even faster.
Measuring What Matters
As a quick reminder, here’s how we get the data for our measurements: when users receive a Cloudflare-branded error page, we use Real User Measurements (RUM) and fetch a small file from Cloudflare, Akamai, Amazon CloudFront, Fastly, and Google Cloud CDN. Browsers around the world report the performance of those providers from the perspective of the end-user network they are on. The goal is to provide an accurate picture of where different providers are faster, and more importantly, where Cloudflare can improve. You can read more about the methodology in the original Speed Week blog post.
Using the RUM data, we measure various performance metrics, such as TCP Connection Time, Time to First Byte (TTFB), and Time to Last Byte (TTLB), for ourselves and other providers.
If we only collect data from a browser when we return an error page, you could see how variable the data can get: if one network or website is having a problem in a certain country, that country could overreport, meaning those networks would be more highly weighted in the calculations because more users reported from that network during a given time period.
For example, if a lot of users connecting over a small Brazilian network were generating reports because their websites were throwing errors more frequently, that could make this small network look a lot bigger to us. This small network in Brazil could have as many reports as Claro, a major network in the region, despite them being totally different when you look at the number of subscribers. If we only look at the networks that report to us the most, it could cause smaller networks with fewer subscribers to be treated as more important because of point-in-time error conditions.
This phenomenon could cause the networks we look at to change week over week. Going back to the Brazil example, if the website that was throwing a bunch of errors fixed their problem, and we no longer saw measurements from that network, they may not show up as a “most reported network” depending on when we look at the data. This means that the networks we look at to consider where we are fastest are dependent on which networks are sending us the most reports at any given time, which is not optimal if we’re trying to get faster in these networks. We need to be able to get a consistent signal on these networks to understand where we’re faster and where we’re not.
We’ve addressed this issue by creating a fixed list of the networks we want to look at. We did this by looking at public stats on user population by network and then comparing that with our sample sizes by network until we identified the 1000 networks we want to examine. This ensures that day over day, the networks we look at are the same.
Now let’s talk about what makes us faster in more places than other networks: HTTP/3.
Blazing fast speeds with HTTP/3
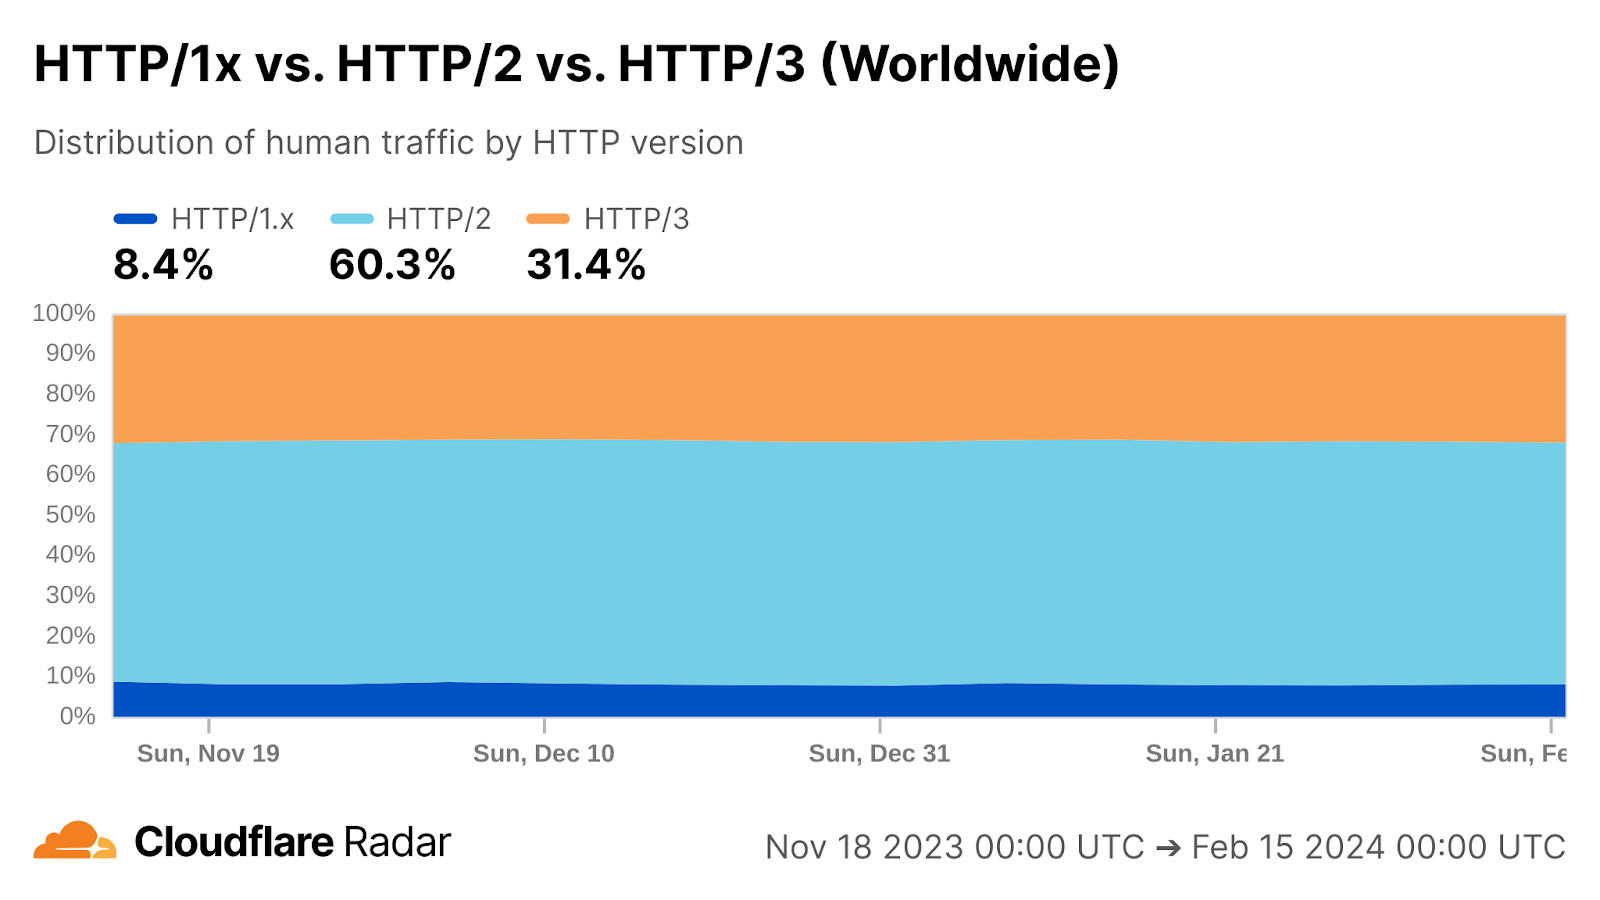
One reason why Cloudflare is the fastest in the most networks is because we’ve been leading the charge with adoption and usage of HTTP/3 on our platform. HTTP/3 allows for faster connectivity behavior which means we can get connections established faster and get data flowing. HTTP/3 is currently used by around 31% of Internet traffic:
To show that HTTP/3 improves connection times, we looked at two different Cloudflare endpoints that these tests ran against: one with HTTP/3 enabled and one with HTTP/3 disabled. The performance difference between the two is night and day. Here’s a table showing the performance difference for 95th percentile connect time between Cloudflare zones when one zone has HTTP/3 enabled:
P50 connect (ms)
P95 connect (ms)
Cloudflare HTTP/3
130
579
Cloudflare non-HTTP/3
174
695
At P95, Cloudflare is 116 ms faster for connection times when HTTP/3 is enabled. This performance gain helps us be the fastest in the most networks.
But why does HTTP/3 help make us faster? HTTP/3 allows for faster connection setup times, which lets us take greater advantage of our global network footprint to be the fastest in the most networks. HTTP/3 is built on top of the QUIC protocol, which multiplexes UDP packets to allow for parallel streams to be sent at the same time. This means that TLS encryption can happen in parallel with connection establishment, shortening the amount of time that is needed to set up a secure connection. Paired with Cloudflare’s network that is incredibly close to end-users, this makes for significant latency reductions on user Connect times. All major browsers have HTTP/3 enabled by default, so you too can realize these latency improvements by enabling HTTP/3 on your website today.
What’s next
We’re sharing our updates on our journey to become #1 everywhere so that you can see what goes into running the fastest network in the world. From here, our plan is the same as always: identify where we’re slower, fix it, and then tell you how we’ve gotten faster.
In the children’s book The Snail and Whale, after an unexpectedly far-flung adventure, the principal character returns to declarations of “How time’s flown” and “Haven’t you grown?” It has been about four years since we last wrote about LavaRand and during that time the story of how Cloudflare uses physical sources of entropy to add to the security of the Internet has continued to travel and be a source of interest to many. What was initially just a single species of physical entropy source – lava lamps – has grown and diversified. We want to catch you up a little on the story of LavaRand. This blog post will cover the new sources of “chaos” that have been added to LavaRand and how you can make use of that harnessed chaos in your next application. We’ll cover how public randomness can open up uses of publicly trusted randomness — imagine not needing to take the holders of a “random draw” at their word when they claim the outcome is not manipulated in some way. And finally we’ll discuss timelock encryption which is a way to ensure that a message cannot be decrypted until some chosen time in the future.
LavaRand origins
The entropy sourced from our wall of lava lamps in San Francisco has long played its part in the randomness that secures connections made through Cloudflare.
Lava lamps with flowing wax.
Cloudflare’s servers collectively handle upwards of 55 million HTTP requests per second, the vast majority of which are secured via the TLS protocol to ensure authenticity and confidentiality. Under the hood, cryptographic protocols like TLS require an underlying source of secure randomness – otherwise, the security guarantees fall apart.
Secure randomness used in cryptography needs to be computationally indistinguishable from “true” randomness. For this, it must both pass statistical randomness tests, and the output needs to be unpredictable to any computationally-bounded adversary, no matter how much previous output they’ve already seen. The typical way to achieve this is to take some random ‘seed’ and feed it into a Cryptographically Secure Pseudorandom Number Generator (CSPRNG) that can produce an essentially-endless stream of unpredictable bytes upon request. The properties of a CSPRNG ensure that all outputs are practically indistinguishable from truly random outputs to anyone that does not know its internal state. However, this all depends on having a secure random seed to begin with. Take a look at this blog for more details on true randomness versus pseudorandomness, and this blog for some great examples of what can go wrong with insecure randomness.
For many years, Cloudflare’s servers relied on local sources of entropy (such as the precise timing of packet arrivals or keyboard events) to seed their entropy pools. While there’s no reason to believe that the local entropy sources on those servers are insecure or could be easily compromised, we wanted to hedge our bets against that possibility. Our solution was to set up a system where our servers could periodically refresh their entropy pools with true randomness from an external source.
That brings us to LavaRand. “Lavarand” has long been the name given to systems used for the generation of randomness (first by Silicon Graphics in 1997). Cloudflare launched its instantiation of a LavaRand system in 2017 as a system that collects entropy from the wall of lava lamps in our San Francisco office and makes it available via an internal API. Our servers then periodically query the API to retrieve fresh randomness from LavaRand and incorporate it into their entropy pools. The contributions made by LavaRand can be considered spice added to the entropy pool mix! (For more technical details, read our previous blog post.)
Lava lamps in Cloudflare’s San Francisco office.
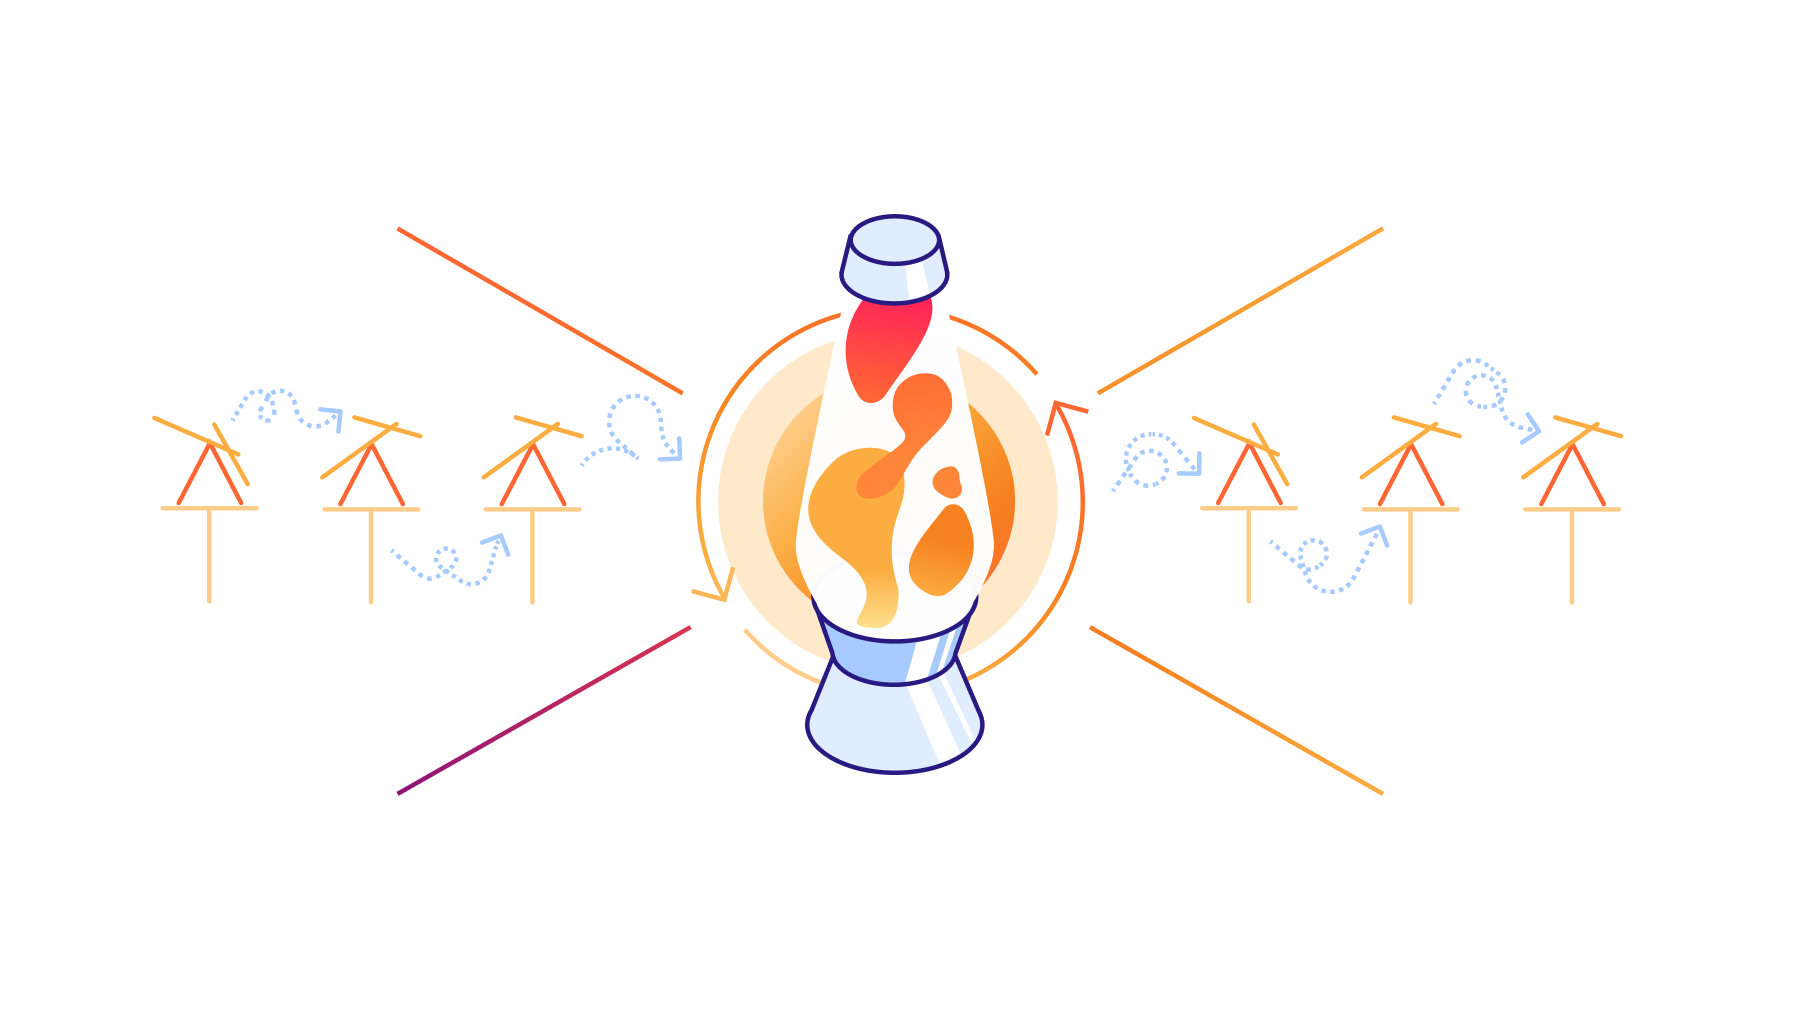
Adding to the office chaos
Our lava lamps in San Francisco have been working tirelessly for years to supply fresh entropy to our systems, but they now have siblings across the world to help with their task! As Cloudflare has grown, so has the variety of entropy sources found in and sourced from our offices. Cloudflare’s Places team works hard to ensure that our offices reflect aspects of our values and culture. Several of our larger office locations include installations of physical systems of entropy, and it is these installations that we have worked to incorporate into LavaRand over time. The tangible and exciting draw of these systems is their basis in physical mechanics that we intuitively consider random. The gloops of warmed ascending “lava” floating past cooler sinking blobs within lava lamps attract our attention just as other unpredictable (and often beautiful) dynamic systems capture our interest.
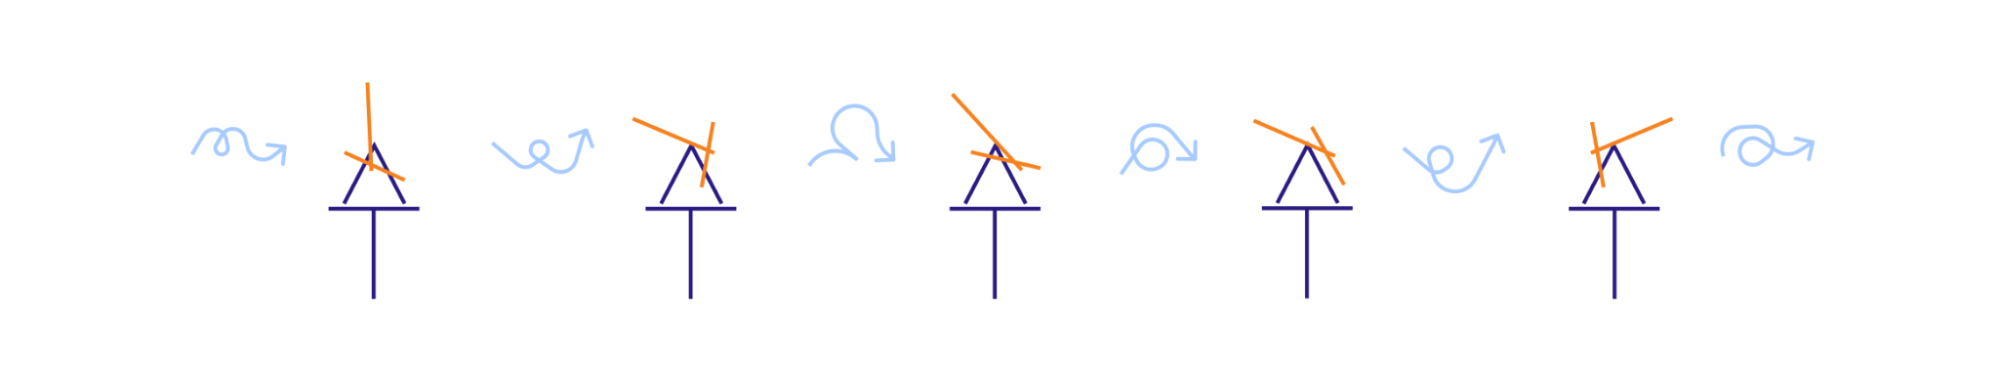
London’s unpredictable pendulums
Visible to visitors of our London office is a wall of double pendulums whose beautiful swings translate to another source of entropy to LavaRand and to the pool of randomness that Cloudflare’s servers pull from.
Close-up of double pendulum display in Cloudflare’s London office.
To the untrained eye the shadows of the pendulum stands and those cast by the rotating arms on the rear wall might seem chaotic. If so, then this installation should be labeled a success! Different light conditions and those shadows add to the chaos that is captured from this entropy source.
Double pendulum display in Cloudflare’s London office with changing light conditions.
Indeed, even with these arms restricted to motion in two dimensions, the path traced by the arms is mesmerizingly varied, and can be shown to be mathematically chaotic. Even if we forget air resistance, temperature, and the environment, and then assume that the mutation is completely deterministic, still the resulting long-term motion is hard to predict. In particular the system is very sensitive to initial conditions, this initial state – how they are set in motion – paired with deterministic behavior produces a unique path that is traced until the pendulum comes to rest, and the system is set in motion by a Cloudflare employee in London once again.
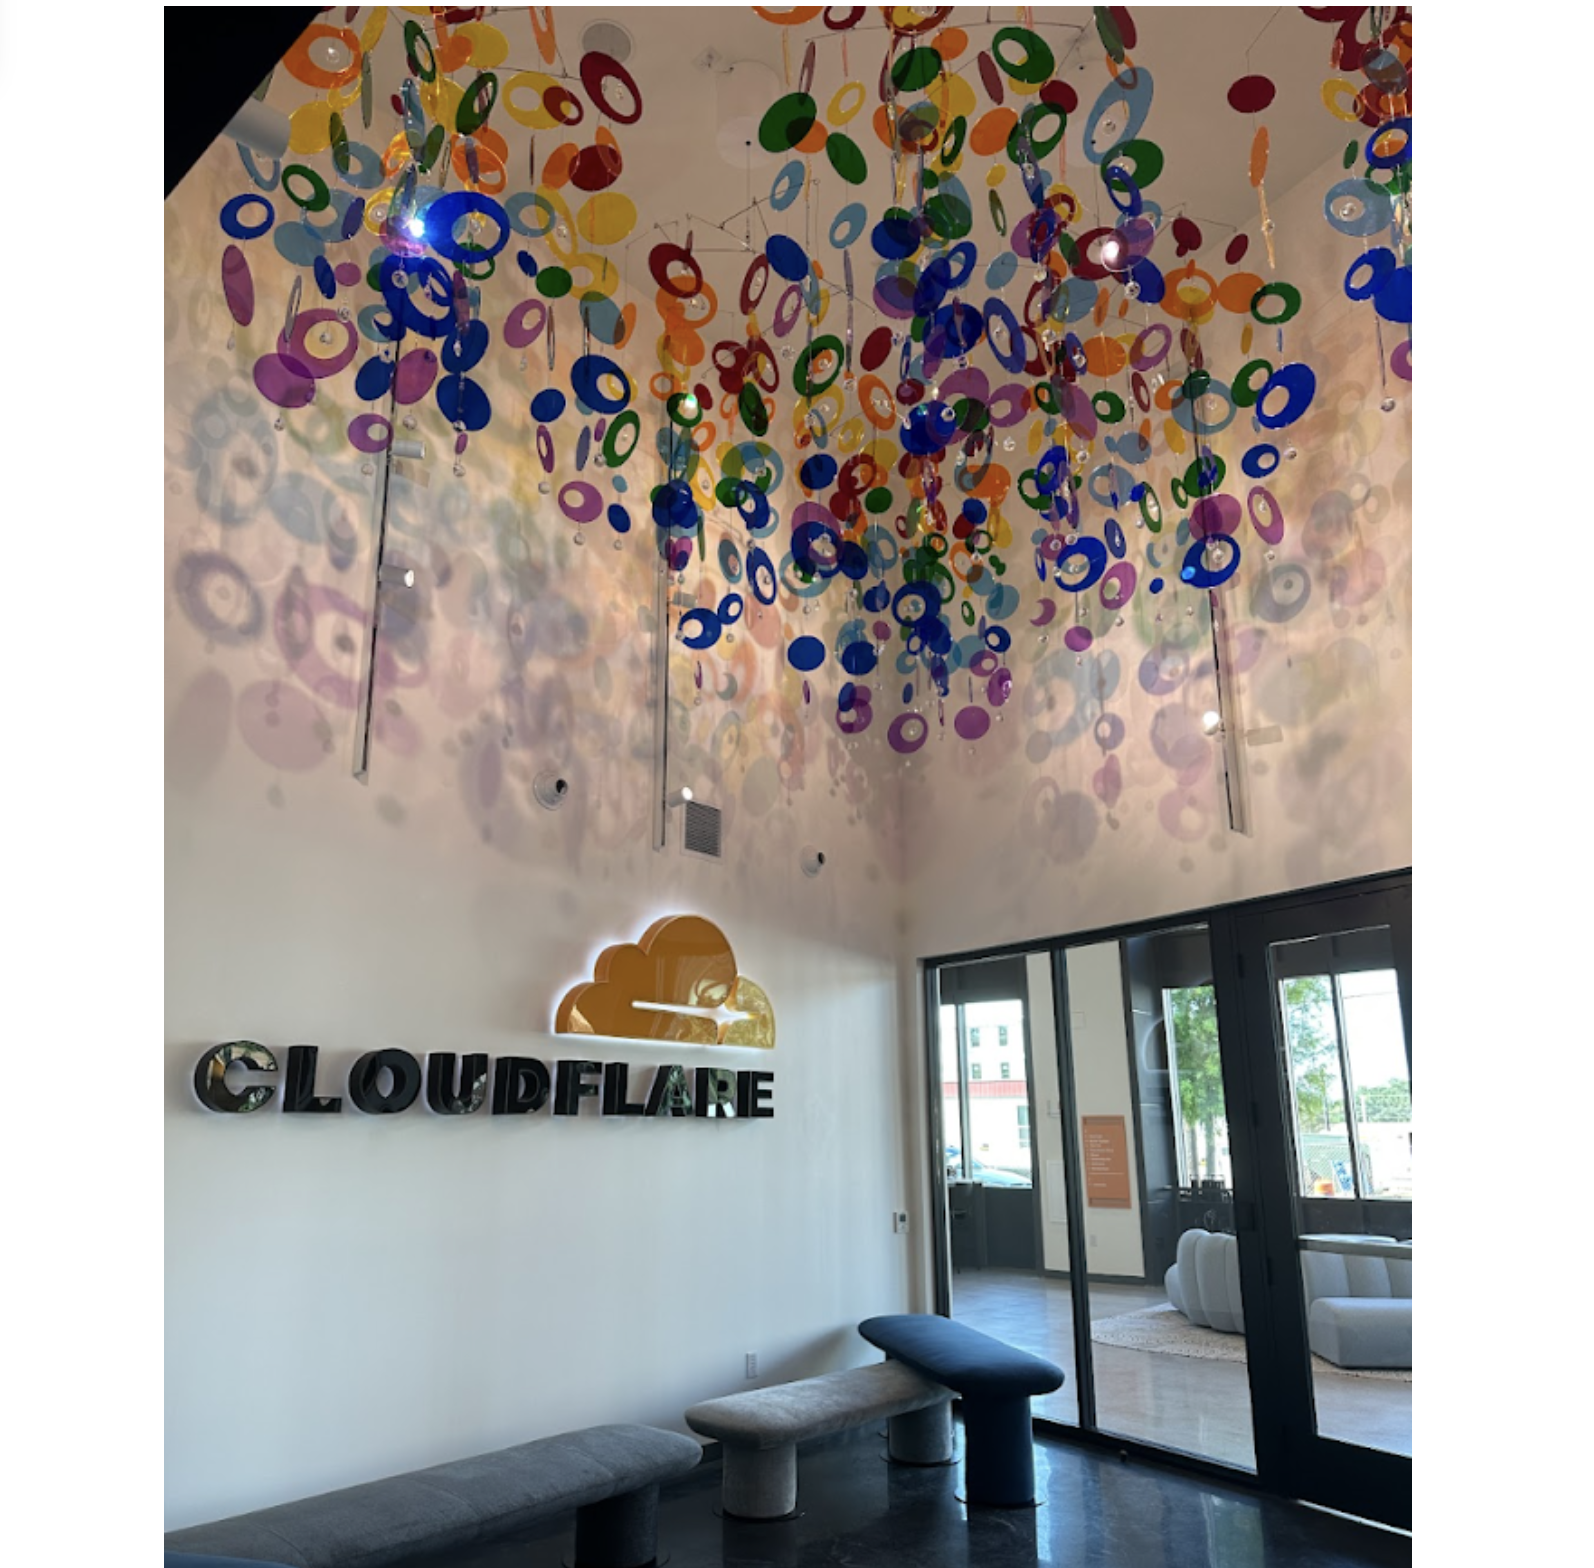
Austin’s mesmerizing mobiles
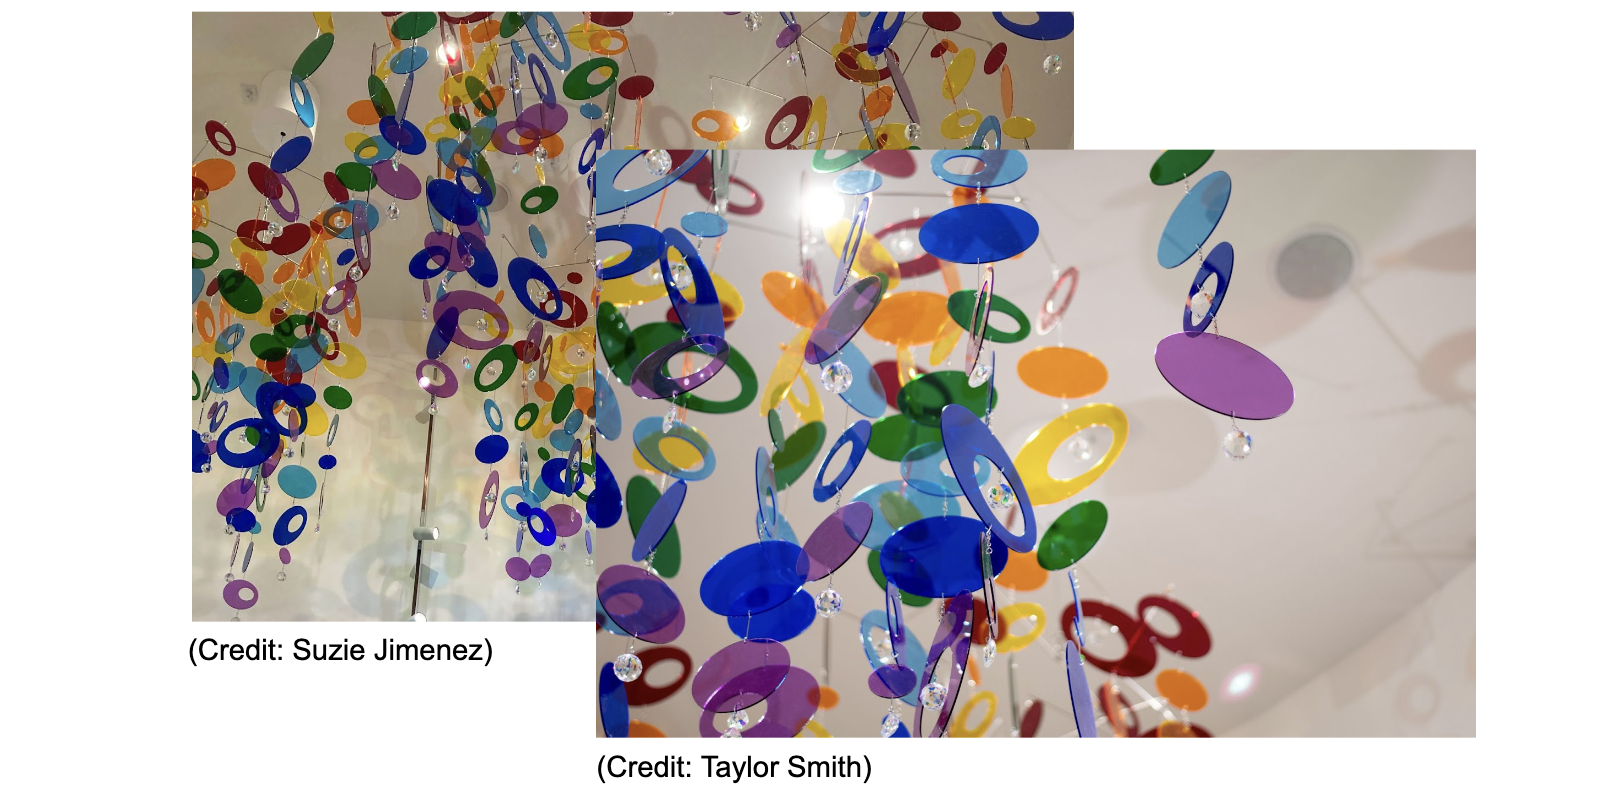
The beautiful new Cloudflare office in Austin, Texas recently celebrated its first year since opening. This office contributes its own spin on physical entropy: suspended above the entrance of the Cloudflare office in downtown Austin is an installation of translucent rainbow mobiles. These twirl, reflecting the changing light, and cast coloured patterns on the enclosing walls. The display of hanging mobiles and their shadows are very sensitive to a physical environment which includes the opening and closing of doors, HVAC changes, and ambient light. This chaotic system’s mesmerizing and changing scene is captured periodically and fed into the stream of LavaRand randomness.
Hanging rainbow mobiles in Cloudflare’s Austin office.
Mixing new sources into LavaRand
We incorporated the new sources of office chaos into the LavaRand system (still called LavaRand despite including much more than lava lamps) in the same way as the existing lava lamps, which we’ve previously described in detail.
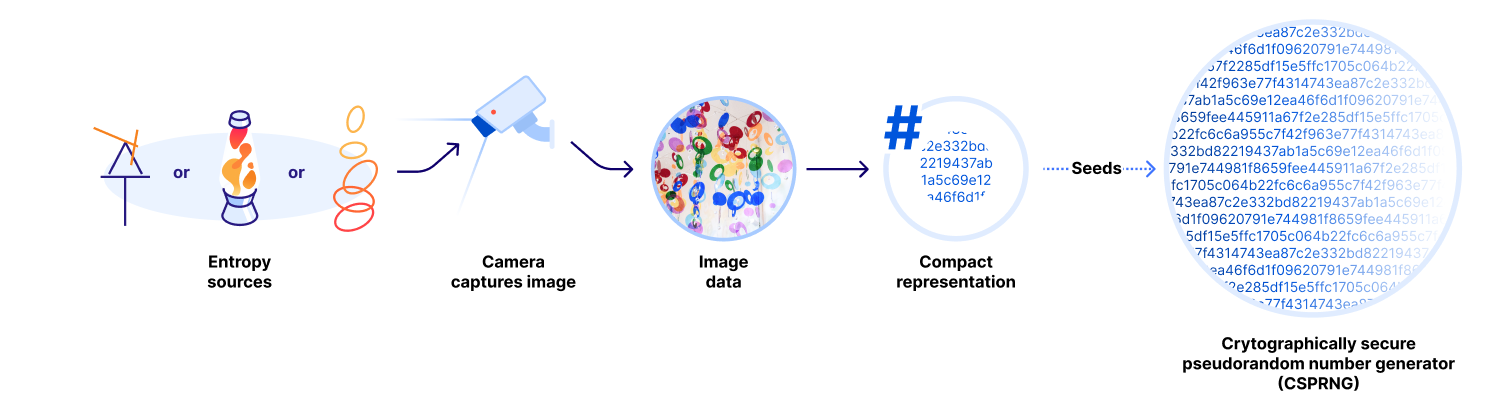
To recap, at repeated intervals, a camera captures an image of the current state of the randomness display. Since the underlying system is truly random, the produced image contains true randomness. Even shadows and changing light conditions play a part in producing something unique and unpredictable! There is another secret that we should share: at a base level, image sensors in the real world are often a source of sufficient noise that even images taken without the lens cap removed could work well as a source of entropy! We consider this added noise to be a serendipitous addition to the beautiful chaotic motion of these installations.
Close-up of hanging rainbow mobiles in Cloudflare’s Austin office.
Once we have a still image that captures the state of the randomness display at a particular point in time, we compute a compact representation – a hash – of the image to derive a fixed-sized output of truly random bytes.
Process of converting physical entropy displays into random byte strings.
The random bytes are then used as an input (along with the previous seed and some randomness from the system’s local entropy sources) to a Key Derivation Function (KDF) to compute a new randomness seed that is fed into a Cryptographically Secure Pseudorandom Number Generator (CSPRNG) that can produce an essentially-endless stream of unpredictable bytes upon request. The properties of a CSPRNG ensure that all outputs are practically indistinguishable from truly random outputs to anyone that does not know its internal state. LavaRand then exposes this stream of randomness via a simple internal API where clients can request fresh randomness.
Applications typically use secure randomness in one of two flavors: private and public.
Private randomness is used for generating passwords, cryptographic keys, user IDs, and other values that are meant to stay secret forever. As we’ve previously described, our servers periodically request fresh private randomness from LavaRand to help to update their entropy pools. Because of this, randomness from LavaRand is essentially available to the outside world! One easy way for developers to tap into private randomness from LavaRand is to use the Web Crypto API’s getRandomValues function from a Cloudflare Worker, or use one that someone has already built, like csprng.xyz (source).
Public randomness consists of unpredictable and unbiased random values that are made available to everyone once they are published, and for this reason should not be used for generateding cryptographic keys. The winning lottery numbers and the coin flip at the start of a sporting event are some examples of public random values. A double-headed coin would not be an unbiased and unpredictable source of entropy and would have drastic impacts on the sports betting world.
In addition to being unpredictable and unbiased, it’s also desirable for public randomness to be trustworthy so that consumers of the randomness are assured that the values were faithfully produced. Not many people would buy lottery tickets if they believed that the winning ticket was going to be chosen unfairly! Indeed, there are known cases of corrupt insiders subverting public randomness for personal gain, like the state lottery employee who co-opted the lottery random number generator, allowing his friends and family to win millions of dollars.
A fundamental challenge of public randomness is that one must trust the authority producing the random outputs. Trusting a well-known authority like NIST may suffice for many applications, but could be problematic for others (especially for applications where decentralization is important).
drand: distributed and verifiable public randomness
To help solve this problem of trust, Cloudflare joined forces with seven other independent and geographically distributed organizations back in 2019 to form the League of Entropy to launch a public randomness beacon using the drand (pronounced dee-rand) protocol. Each organization contributes its own unique source of randomness into the joint pool of entropy used to seed the drand network – with Cloudflare using randomness from LavaRand, of course!
While the League of Entropy started out as an experimental network, with the guidance and support from the drand team at Protocol Labs, it’s become a reliable and production-ready core Internet service, relied upon by applications ranging from distributed file storage to online gaming to timestamped proofs to timelock encryption (discussed further below). The League of Entropy has also grown, and there are now 18 organizations across four continents participating in the drand network.
The League of Entropy’s drand beacons (each of which runs with different parameters, such as how frequently random values are produced and whether the randomness is chained – more on this below) have two important properties that contribute to their trustworthiness: they are decentralized and verifiable. Decentralization ensures that one or two bad actors cannot subvert or bias the randomness beacon, and verifiability allows anyone to check that the random values are produced according to the drand protocol and with participation from a threshold (at least half, but usually more) of the participants in the drand network. Thus, with each new member, the trustworthiness and reliability of the drand network continues to increase.
We give a brief overview of how drand achieves these properties using distributed key generation and threshold signatures below, but for an in-depth dive see our previous blog post and some of the excellent posts from the drand team.
Distributed key generation and threshold signatures
During the initial setup of a drand beacon, nodes in the network run a distributed key generation (DKG) protocol based on the Pedersen commitment scheme, the result of which is that each node holds a “share” (a keypair) for a distributed group key, which remains fixed for the lifetime of the beacon. In order to do something useful with the group secret key like signing a message, at least a threshold (for example 7 out of 9) of nodes in the network must participate in constructing a BLS threshold signature. The group information for the quicknet beacon on the League of Entropy’s mainnet drand network is shown below:
(The hex value 52db9b… in the URL above is the hash of the beacon’s configuration. Visit https://drand.cloudflare.com/chains to see all beacons supported by our mainnet drand nodes.)
The nodes in the network are configured to periodically (every 3s for quicknet) work together to produce a signature over some agreed-upon message, like the current round number and previous round signature (more on this below). Each node uses its share of the group key to produce a partial signature over the current round message, and broadcasts it to other nodes in the network. Once a node has enough partial signatures, it can aggregate them to produce a group signature for the given round.
The group signature for a round is the randomness (in the output above, the randomness value is simply the sha256 hash of the signature, for applications that prefer a shorter, fixed-sized output). The signature is unpredictable in advance as long as enough (at least a majority, but can be configured to be higher) of the nodes in the drand network are honest and do not collude. Further, anyone can validate the signature for a given round using the beacon’s group public key. It’s recommended that developers use the drand client libraries or CLI to perform verification on every value obtained from the beacon.
Chained vs unchained randomness
When the League of Entropy launched its first generation of drand beacons in 2019, the per-round message over which the group signature was computed included the previous round’s signature. This creates a chain of randomness rounds all the way to the first “genesis” round. Chained randomness provides some nice properties for single-source randomness beacons, and is included as a requirement in NIST’s spec for interoperable public randomness beacons.
However, back in 2022 the drand team introduced the notion of unchained randomness, where the message to be signed is predictable and doesn’t depend on any randomness from previous rounds, and showed that it provides the same security guarantees as chained randomness for the drand network (both require an honest threshold of nodes). In the implementation of unchained randomness in the quicknet, the message to be signed simply consists of the round number.
Unchained randomness provides some powerful properties and usability improvements. In terms of usability, a consumer of the randomness beacon does not need to reconstruct the full chain of randomness to the genesis round to fully validate a particular round – the only information needed is the current round number and the group public key. This provides much more flexibility for clients, as they can choose how frequently they consume randomness rounds without needing to continuously follow the randomness chain.
Since the messages to be signed are known in advance (since they’re just the round number), unchained randomness also unlocks a powerful new property: timelock encryption.
Rotating double pendulums.
Timelock encryption
Timelock (or “timed-release”) encryption is a method for encrypting a message such that it cannot be decrypted until a certain amount of time has passed. Two basic approaches to timelock encryption were described by Rivest, Shamir, and Wagner:
There are two natural approaches to implementing timed release cryptography:
- Use “time-lock puzzles” – computational problems that cannot be solved without running a computer continuously for at least a certain amount of time.
- Use trusted agents who promise not to reveal certain information until a specified date.
Using trusted agents has the obvious problem of ensuring that the agents are trustworthy. Secret sharing approaches can be used to alleviate this concern.
The drand network is a group of independent agents using secret sharing for trustworthiness, and the ‘certain information’ not to be revealed until a specified date sounds a lot like the per-round randomness! We describe next how timelock encryption can be implemented on top of a drand network with unchained randomness, and finish with a practical demonstration. While we don’t delve into the bilinear groups and pairings-based cryptography that make this possible, if you’re interested we encourage you to read tlock: Practical Timelock Encryption from Threshold BLS by Nicolas Gailly, Kelsey Melissaris, and Yolan Romailler.
How to timelock your secrets
First, identify the randomness round that, once revealed, will allow your timelock-encrypted message to be decrypted. An important observation is that since drand networks produce randomness at fixed intervals, each round in a drand beacon is closely tied to a specific timestamp (modulo small delays for the network to actually produce the beacon) which can be easily computed taking the beacon’s genesis timestamp and then adding the round number multiplied by the beacon’s period.
Once the round is decided upon, the properties of bilinear groups allow you to encrypt your message to some round with the drand beacon’s group public key.
After the nodes in the drand network cooperate to derive the randomness for the round (really, just the signature on the round number using the beacon’s group secret key), anyone can decrypt the ciphertext (this is where the magic of bilinear groups comes in).
random = Randomness(round)
message = Decrypt(ciphertext,random)
To make this practical, the timelocked message is actually the secret key for a symmetric scheme. This means that we encrypt the message with a symmetric key and encrypt the key with timelock, allowing for a decryption in the future.
Now, for a practical demonstration of timelock encryption, we use a tool that one of our own engineers built on top of Cloudflare Workers. The source code is publicly available if you’d like to take a look under the hood at how it works.
# 1. Create a file
echo "A message from the past to the future..." > original.txt
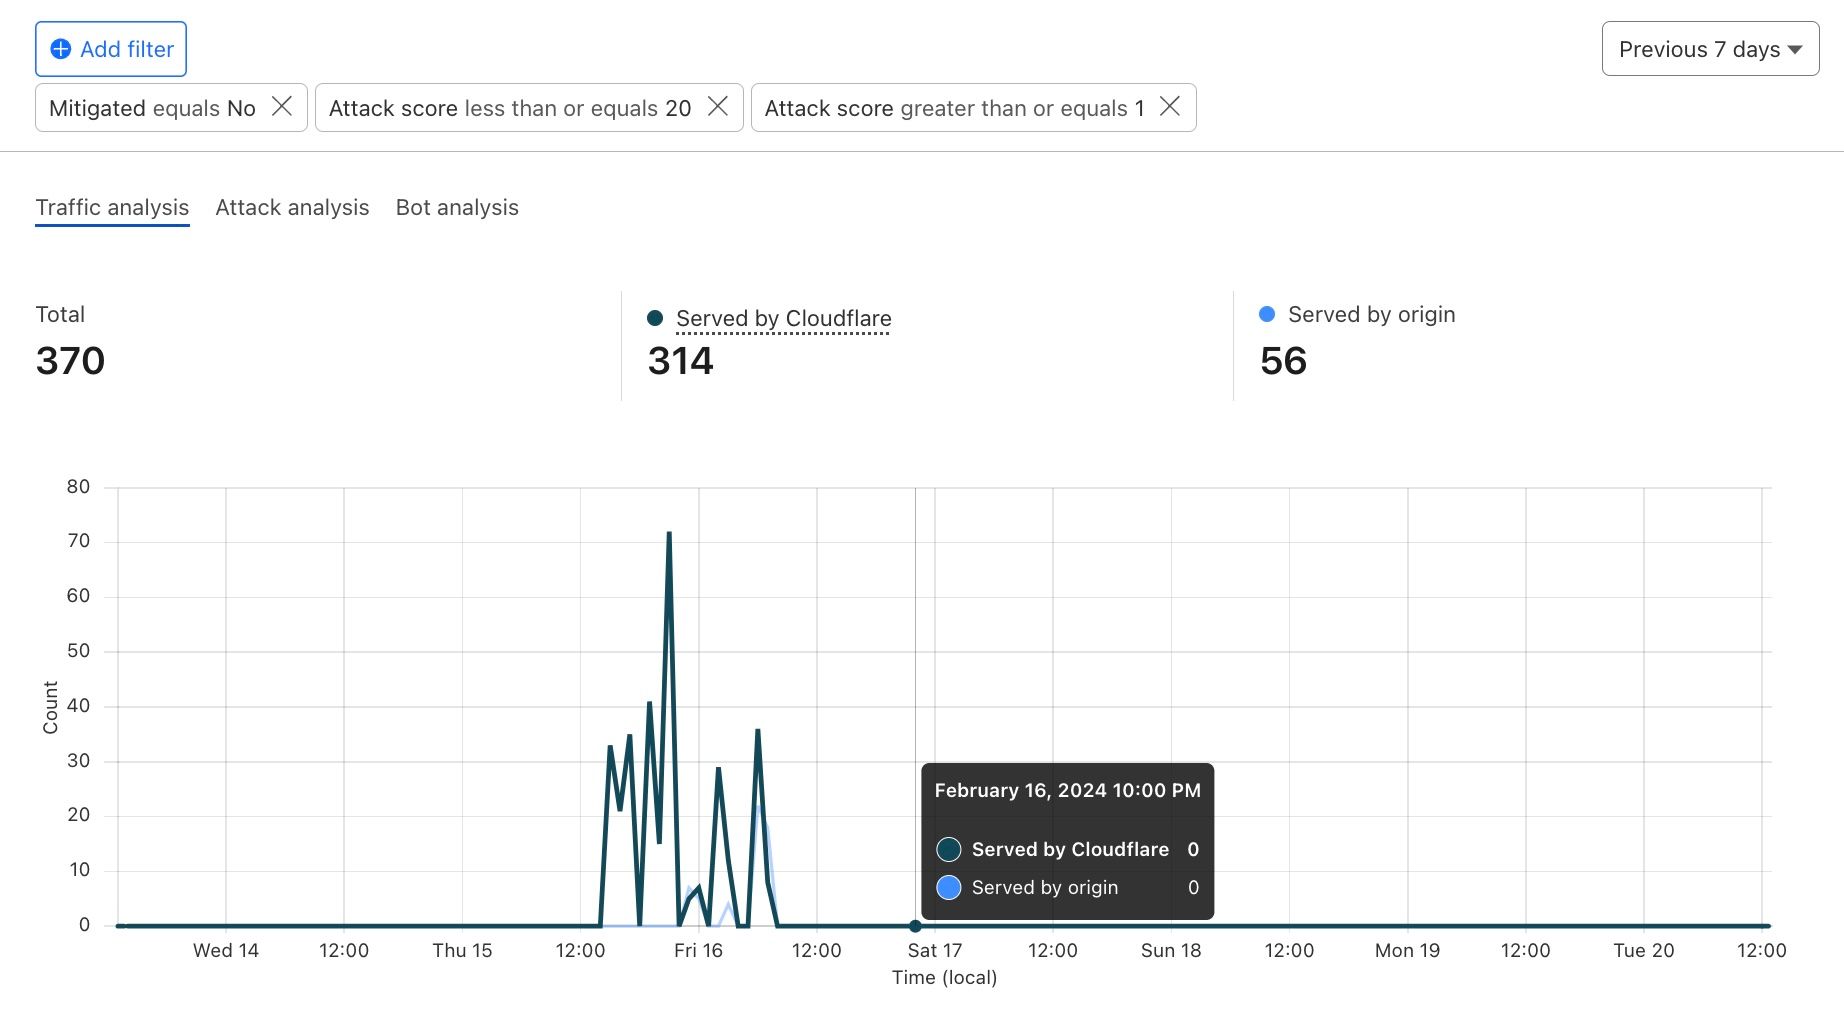
# 2. Get the drand round 1 minute into the future (20 rounds)
BEACON="52db9ba70e0cc0f6eaf7803dd07447a1f5477735fd3f661792ba94600c84e971"
ROUND=$(curl "https://drand.cloudflare.com/$BEACON/public/latest" | jq ".round+20")
# 3. Encrypt and require that round number
curl -X POST --data-binary @original.txt --output encrypted.pem https://tlock-worker.crypto-team.workers.dev/encrypt/$ROUND
# 4. Try to decrypt it (and only succeed 20 rounds x 3s later)
curl -X POST --data-binary @encrypted.pem --fail --show-error https://tlock-worker.crypto-team.workers.dev/decrypt
What’s next?
We hope you’ve enjoyed revisiting the tale of LavaRand as much as we have, and are inspired to visit one of Cloudflare’s offices in the future to see the randomness displays first-hand, and to use verifiable public randomness and timelock encryption from drand in your next project.
Chaos is required by the encryption that secures the Internet. LavaRand at Cloudflare will continue to turn the chaotic beauty of our physical world into a randomness stream – even as new sources are added – for novel uses all of us explorers – just like that snail – have yet to dream up.
And she gazed at the sky, the sea, the land The waves and the caves and the golden sand. She gazed and gazed, amazed by it all, And she said to the whale, “I feel so small.”
A snail on a whale.
Tune in for more news, announcements and thought-provoking discussions! Don’t miss the full Security Week hub page.
Today, we are excited to announce beta availability of Log Explorer, which allows you to investigate your HTTP and Security Event logs directly from the Cloudflare Dashboard. Log Explorer is an extension of Security Analytics, giving you the ability to review related raw logs. You can analyze, investigate, and monitor for security attacks natively within the Cloudflare Dashboard, reducing time to resolution and overall cost of ownership by eliminating the need to forward logs to third party security analysis tools.
Background
Security Analytics enables you to analyze all of your HTTP traffic in one place, giving you the security lens you need to identify and act upon what matters most: potentially malicious traffic that has not been mitigated. Security Analytics includes built-in views such as top statistics and in-context quick filters on an intuitive page layout that enables rapid exploration and validation.
In order to power our rich analytics dashboards with fast query performance, we implemented data sampling using Adaptive Bit Rate (ABR) analytics. This is a great fit for providing high level aggregate views of the data. However, we received feedback from many Security Analytics power users that sometimes they need access to a more granular view of the data — they need logs.
Logs provide critical visibility into the operations of today’s computer systems. Engineers and SOC analysts rely on logs every day to troubleshoot issues, identify and investigate security incidents, and tune the performance, reliability, and security of their applications and infrastructure. Traditional metrics or monitoring solutions provide aggregated or statistical data that can be used to identify trends. Metrics are wonderful at identifying THAT an issue happened, but lack the detailed events to help engineers uncover WHY it happened. Engineers and SOC Analysts rely on raw log data to answer questions such as:
What is causing this increase in 403 errors?
What data was accessed by this IP address?
What was the user experience of this particular user’s session?
Traditionally, these engineers and analysts would stand up a collection of various monitoring tools in order to capture logs and get this visibility. With more organizations using multiple clouds, or a hybrid environment with both cloud and on-premise tools and architecture, it is crucial to have a unified platform to regain visibility into this increasingly complex environment. As more and more companies are moving towards a cloud native architecture, we see Cloudflare’s connectivity cloud as an integral part of their performance and security strategy.
Log Explorer provides a lower cost option for storing and exploring log data within Cloudflare. Until today, we have offered the ability to export logs to expensive third party tools, and now with Log Explorer, you can quickly and easily explore your log data without leaving the Cloudflare Dashboard.
Log Explorer Features
Whether you’re a SOC Engineer investigating potential incidents, or a Compliance Officer with specific log retention requirements, Log Explorer has you covered. It stores your Cloudflare logs for an uncapped and customizable period of time, making them accessible natively within the Cloudflare Dashboard. The supported features include:
Searching through your HTTP Request or Security Event logs
Filtering based on any field and a number of standard operators
Switching between basic filter mode or SQL query interface
Selecting fields to display
Viewing log events in tabular format
Finding the HTTP request records associated with a Ray ID
Narrow in on unmitigated traffic
As a SOC analyst, your job is to monitor and respond to threats and incidents within your organization’s network. Using Security Analytics, and now with Log Explorer, you can identify anomalies and conduct a forensic investigation all in one place.
Let’s walk through an example to see this in action:
On the Security Analytics dashboard, you can see in the Insights panel that there is some traffic that has been tagged as a likely attack, but not mitigated.
Clicking the filter button narrows in on these requests for further investigation.
In the sampled logs view, you can see that most of these requests are coming from a common client IP address.
You can also see that Cloudflare has flagged all of these requests as bot traffic. With this information, you can craft a WAF rule to either block all traffic from this IP address, or block all traffic with a bot score lower than 10.
Let’s say that the Compliance Team would like to gather documentation on the scope and impact of this attack. We can dig further into the logs during this time period to see everything that this attacker attempted to access.
First, we can use Log Explorer to query HTTP requests from the suspect IP address during the time range of the spike seen in Security Analytics.
We can also review whether the attacker was able to exfiltrate data by adding the OriginResponseBytes field and updating the query to show requests with OriginResponseBytes > 0. The results show that no data was exfiltrated.
Find and investigate false positives
With access to the full logs via Log Explorer, you can now perform a search to find specific requests.
A 403 error occurs when a user’s request to a particular site is blocked. Cloudflare’s security products use things like IP reputation and WAF attack scores based on ML technologies in order to assess whether a given HTTP request is malicious. This is extremely effective, but sometimes requests are mistakenly flagged as malicious and blocked.
In these situations, we can now use Log Explorer to identify these requests and why they were blocked, and then adjust the relevant WAF rules accordingly.
Or, if you are interested in tracking down a specific request by Ray ID, an identifier given to every request that goes through Cloudflare, you can do that via Log Explorer with one query.
Note that the LIMIT clause is included in the query by default, but has no impact on RayID queries as RayID is unique and only one record would be returned when using the RayID filter field.
How we built Log Explorer
With Log Explorer, we have built a long-term, append-only log storage platform on top of Cloudflare R2. Log Explorer leverages the Delta Lake protocol, an open-source storage framework for building highly performant, ACID-compliant databases atop a cloud object store. In other words, Log Explorer combines a large and cost-effective storage system – Cloudflare R2 – with the benefits of strong consistency and high performance. Additionally, Log Explorer gives you a SQL interface to your Cloudflare logs.
Each Log Explorer dataset is stored on a per-customer level, just like Cloudflare D1, so that your data isn’t placed with that of other customers. In the future, this single-tenant storage model will give you the flexibility to create your own retention policies and decide in which regions you want to store your data.
Under the hood, the datasets for each customer are stored as Delta tables in R2 buckets. A Delta table is a storage format that organizes Apache Parquet objects into directories using Hive’s partitioning naming convention. Crucially, Delta tables pair these storage objects with an append-only, checkpointed transaction log. This design allows Log Explorer to support multiple writers with optimistic concurrency.
Many of the products Cloudflare builds are a direct result of the challenges our own team is looking to address. Log Explorer is a perfect example of this culture of dogfooding. Optimistic concurrent writes require atomic updates in the underlying object store, and as a result of our needs, R2 added a PutIfAbsent operation with strong consistency. Thanks, R2! The atomic operation sets Log Explorer apart from Delta Lake solutions based on Amazon Web Services’ S3, which incur the operational burden of using an external store for synchronizing writes.
Log Explorer is written in the Rust programming language using open-source libraries, such as delta-rs, a native Rust implementation of the Delta Lake protocol, and Apache Arrow DataFusion, a very fast, extensible query engine. At Cloudflare, Rust has emerged as a popular choice for new product development due to its safety and performance benefits.
What’s next
We know that application security logs are only part of the puzzle in understanding what’s going on in your environment. Stay tuned for future developments including tighter, more seamless integration between Analytics and Log Explorer, the addition of more datasets including Zero Trust logs, the ability to define custom retention periods, and integrated custom alerting.
Please use the feedback link to let us know how Log Explorer is working for you and what else would help make your job easier.
How to get it
We’d love to hear from you! Let us know if you are interested in joining our Beta program by completing this form and a member of our team will contact you.
Pricing will be finalized prior to a General Availability (GA) launch.
Tune in for more news, announcements and thought-provoking discussions! Don’t miss the full Security Week hub page.
Cloudforce One is our threat operations and research team. Its primary objective: track and disrupt threat actors targeting Cloudflare and the customer systems we protect. Cloudforce One customers can engage directly with analysts on the team to help understand and stop the specific threats targeting them.
Today, we are releasing in general availability two new tools that will help Cloudforce One customers get the best value out of the service by helping us prioritize and organize the information that matters most to them: Requests for Information (RFIs) and Priority Intelligence Requirements (PIRs). We’d also like to review how we’ve used the Cloudflare Workers and Pages platform to build our internal pipeline to not only perform investigations on behalf of our customers, but conduct our own internal investigations of the threats and attackers we track.
What are Requests for Information (RFIs)?
RFIs are designed to streamline the process of accessing critical intelligence. They provide an avenue for users to submit specific queries and requests directly into Cloudforce One’s analysis queue. Essentially, they are a well-structured way for you to tell the team what to focus their research on to best support your security posture.
Each RFI filed is routed to an analyst and treated as a targeted call for information on specific threat elements. From malware analysis to DDoS attack analysis, we have a group of seasoned threat analysts who can provide deeper insight into a wide array of attacks. Those who have found RFIs invaluable typically belong to Security Operation Centers, Incident Response Teams, and Threat Research/Intelligence teams dedicated to supporting internal investigations within an organization. This approach proves instrumental in unveiling potential vulnerabilities and enhancing the understanding of the security posture, especially when confronting complex risks.
Creating an RFI is straightforward. Through the Security Center dashboard, users can create and track their RFIs:
Submission: Submit requests via Cloudforce One RFI Dashboard:
a. Threat: The threat or campaign you would like more information on
b. Priority: routine, high or urgent
c. Type: Binary Analysis, Indicator Analysis, Traffic Analysis, Threat Detection Signature, Passive DNS Resolution, DDoS Attack or Vulnerability
d. Output: Malware Analysis Report, Indicators of Compromise, or Threat Research Report
Tracking: Our Threat Research team begins work and the customer can track progress (open, in progress, pending, published, complete) via the RFI Dashboard. Automated alerts are sent to the customer with each status change.
Delivery: Customers can access/download the RFI response via the RFI Dashboard.
Fabricated example of the detailed view of an RFI and communication with the Cloudflare Threat Research Team
Once an RFI is submitted, teams can stay informed about the progress of their requests through automated alerts. These alerts, generated when a Cloudforce One analyst has completed the request, are delivered directly to the user’s email or to a team chat channel via a webhook.
What are Priority Intelligence Requirements (PIRs)?
Priority Intelligence Requirements (PIRs) are a structured approach to identifying intelligence gaps, formulating precise requirements, and organizing them into categories that align with Cloudforce One’s overarching goals. For example, you can create a PIR signaling to the Cloudforce One team what topic you would like more information on.
PIR dashboard with fictitious examples of priority intelligence requirements
PIRs help target your intelligence collection efforts toward the most relevant insights, enabling you to make informed decisions and strengthen your organization’s cybersecurity posture.
While PIRs currently offer a framework for prioritizing intelligence requirements, our vision extends beyond static requirements. Looking ahead, our plan is to evolve PIRs into dynamic tools that integrate real-time intelligence from Cloudforce One. Enriching PIRs by integrating them with real-time intelligence from Cloudforce One will provide immediate insights into your Cloudflare environment, facilitating a direct and meaningful connection between ongoing threat intelligence and your predefined intelligence needs.
What drives Cloudforce One?
Since our inception, Cloudforce One has been actively collaborating with our Security Incident Response Team (SIRT) and Trust and Safety (T&S) team, aiming to provide valuable insights into attacks targeting Cloudflare and counteract the misuse of Cloudflare services. Throughout these investigations, we recognized the need for a centralized platform to capture insights from Cloudflare’s unique perspective on the Internet, aggregate data, and correlate reports.
In the past, our approach would have involved deploying a frontend UI and backend API in a core data center, leveraging common services like Postgres, Redis, and a Ceph storage solution. This conventional route would have entailed managing Docker deployments, constantly upgrading hosts for vulnerabilities, and dealing with a complex environment where we must juggle secrets, external service configurations, and maintaining availability.
Instead, we welcomed being Customer Zero for Cloudflare and fully embraced Cloudflare’s Workers and Pages platforms to construct a powerful threat investigation tool, and since then, we haven’t looked back. For anyone that has used Workers in the past, much of what we have done is not revolutionary, but almost commonplace given the ease of configuring and implementing the features in Cloudflare Workers. We routinely store file data in R2, metadata in KV, and indexed data in D1. That being said, we do have a few non-standard deployments as well, further outlined below.
Altogether, our Threats Investigation architecture consists of five services, four of which are deployed at the edge with the other one deployed in our core data centers due to data dependency constraints.
RFIs & PIRs: This API manages our formal Cloudforce One requests and customer priorities submitted via the Cloudflare Dashboard.
Threats: Our UI, deployed via Pages, serves as the interface for interacting with all of our Cloudforce One services, Cloudflare internal services, and the RFIs and PIRs submitted by our customers.
Cases: A case management system that allows analysts to store notes, Indicators of Compromise (IOCs), malware samples, and data analytics related to an attack. The service provides live updates to all analysts viewing the case, facilitating real-time collaboration. Each case is a Durable Object that is connected to via a Websocket that stores “files” and “file content” in the Durable Object’s persistent storage. Metadata for the case is made searchable via D1.
Leads: A queue of informal internal and external requests that may be reviewed by Cloudforce One when doing threat hunting discovery. Lead content is stored into KV, while metadata and extracted IOCs are stored in D1.
Binary DB:A raw binary file warehouse for any file we come across during our investigation. Binary DB also serves as the repository for malware samples used in some of our machine learning training. Each file is stored in R2, with its associated metadata stored in KV.
Cloudforce One Threat Investigation Architecture
At the heart of our Threats ecosystem is our case management service built on Workers and Durable Objects. We were inspired to build this tool because we often had to jump into collaborative documents that were not designed to store forensic data, organize it, mark sections with Traffic Light Protocol (TLP) releasability codes, and relate analysis to existing RFIs or Leads.
Our concept of cases is straightforward — each case is a Durable Object that can accept HTTP REST API or WebSocket connections. Upon initiating a WebSocket connection, it is seamlessly incorporated into the Durable Object’s in-memory state, allowing us to instantly broadcast real-time events to all users engaged with the case. Each case comprises distinct folders, each housing a collection of files containing content, releasability information, and file metadata.
Practically, our Durable Object leverages its persistent storage with each storage key prefixed with the value type: “case”, “folder”, or “file” followed by the UUID assigned to the file. Each case value has metadata associated with the case and a list of folders that belong to the case. Each folder has the folder’s name and a list of files that belong to it.
Our internal Threats UI helps us tie together the service integrations with our threat hunting analysis. It is here we do our day-to-day work which allows us to bring our unique insights into Cloudflare attacks. Below is an example of our Case Management in action where we tracked the RedAlerts attack before we formalized our analysis into the blog.
What good is all of this if we can’t search it? The Workers AI team launched Vectorize and enabled inference on the edge, so we decided to go all in on Workers and began indexing all case files as they’re being edited so that they can be searched. As each case file is being updated in the Durable Object, the content of the file is pushed to Cloudflare Queues. This data is consumed by an indexing engine consumer that does two things: extracts and indexes indicators of compromise, and embeds the content into a vector and pushes it into Vectorize. Both of the search mechanisms also pass the reference case and file identifiers so that the case may be found upon searching.
Given how easy it is to set up Workers AI, we took the final step of implementing a full Retrieval Augmented Generation (RAG) AI to allow analysts to ask questions about our previous analysis. Each question undergoes the same process as the content that is indexed. We pull out any indicators of compromise and embed the question into a vector, so we can use both results to search our indexes and Vectorize respectively, and provide the most relevant results for the request. Lastly, we send the vector data to a text-generation model using Workers AI that then returns a response to our analysts.
Using RFIs and PIRs
Imagine submitting an RFI for “Passive DNS Resolution – IOCs” and receiving real-time updates directly within the PIR, guiding your next steps.
Our workflow ensures that the intelligence you need is not only obtained but also used optimally. This approach empowers your team to tailor your intelligence gathering, strengthening your cybersecurity strategy and security posture.
Our mission for Cloudforce One is to equip organizations with the tools they need to stay one step ahead in the rapidly changing world of cybersecurity. The addition of RFIs and PIRs marks another milestone in this journey, empowering users with enhanced threat intelligence capabilities.
Getting started
Cloudforce One customers can already see the PIR and RFI Dashboard in their Security Center, and they can also use the API if they prefer that option. Click to see more documentation about our RFI and our PIR APIs.
If you’re looking to try out the new RFI and PIR capabilities within the Security Center, contact your Cloudflare account team or fill out this form and someone will be in touch. Finally, if you’re interested in joining the Cloudflare team, check out our open job postings here.
Today, we’re excited to talk about URL Scanner, a tool that helps everyone from security teams to everyday users to detect and safeguard against malicious websites by scanning and analyzing them. URL Scanner has executed almost a million scans since its launch last March on Cloudflare Radar, driving us to continuously innovate and enhance its capabilities. Since that time, we have introduced unlisted scans, detailed malicious verdicts, enriched search functionality, and now, integration with Security Center and an official API, all built upon the robust foundation of Cloudflare Workers, Durable Objects, and the Browser Rendering API.
Integration with the Security Center in the Cloudflare Dashboard
Security Center is the single place in the Cloudflare Dashboard to map your attack surface, identify potential security risks, and mitigate risks with a few clicks. Its users can now access the URL scanner directly from the Investigate Portal, enhancing their cybersecurity workflow. These scans will be unlisted by default, ensuring privacy while facilitating a deep dive into website security. Users will be able to see their historic scans and access the related reports when they need to, and they will benefit from automatic screenshots for multiple screen sizes, enriching the context of each scan.
Customers with Cloudflare dashboard access will enjoy higher API limits and faster response times, crucial for agile security operations. Integration with internal workflows becomes seamless, allowing for sophisticated network and user protection strategies.
Security Center in the Cloudflare Dashboard
Unlocking the potential of the URL Scanner API
The URL Scanner API is a powerful asset for developers, enabling custom scans to detect phishing or malware risks, analyze website technologies, and much more. With new features like custom HTTP headers and multi-device screenshots, developers gain a comprehensive toolkit for thorough website assessment.
Submitting a scan request
Using the API, here’s the simplest way to submit a scan request:
New features include the option to set custom HTTP headers, like User-Agent and Authorization, request multiple target device screenshots, like mobile and desktop, as well as set the visibility level to “unlisted”. This essentially marks the scan as private and was often requested by developers who wanted to keep their investigations confidential. Public scans, on the other hand, can be found by anyone through search and are useful to share results with the wider community. You can find more details in our developer documentation.
Once a scan concludes, fetch the final report and the full network log. Recently added features include the `verdict` property, indicating the site’s malicious status, and the `securityViolations` section detailing CSP or SRI policy breaches — as a developer, you can also scan your own website and see our recommendations. Expect improvements on verdict accuracy over time, as this is an area we’re focusing on.
Enhanced search functionality
Developers can now search scans by hostname, a specific URL or even any URL the page connected to during the scan. This allows, for example, to search for websites that use a JavaScript library named jquery.min.js (‘?path=jquery.min.js’). Future plans include additional features like searching by IP address, ASN, and malicious website categorisation.
The URL Scanner can be used for a diverse range of applications. These include capturing a website’s evolving state over time (such as tracking changes to the front page of an online newspaper), analyzing technologies employed by a website, preemptively assessing potential risks (as when scrutinizing shortened URLs), and supporting the investigation of persistent cybersecurity threats (such as identifying affected websites hosting a malicious JavaScript file).
How we built the URL Scanner API
In recounting the process of developing the URL Scanner, we aim to showcase the potential and versatility of Cloudflare Workers as a platform. This story is more than a technical journey, but a testament to the capabilities inherent in our platform’s suite of APIs. By dogfooding our own technology, we not only demonstrate confidence in its robustness but also encourage developers to harness the same capabilities for building sophisticated applications. The URL Scanner exemplifies how Cloudflare Workers, Durable Objects, and the Browser Rendering API seamlessly integrate.
High level overview of theCloudflare URL Scanner technology stack
As seen above, Cloudflare’s runtime infrastructure is the foundation the system runs on. Cloudflare Workers serves the public API, Durable Objects handles orchestration, R2 acts as the primary storage solution, and Queues efficiently handles batch operations, all at the edge. However, what truly enables the URL Scanner’s capabilities is the Browser Rendering API. It’s what initially allowed us to release in such a short time frame, since we didn’t have to build and manage an entire fleet of Chrome browsers from scratch. We simply request a browser, and then using the well known Puppeteer library, instruct it to fetch the webpage and process it in the way we want. This API is at the heart of the entire system.
Scanning a website
The entire process of scanning a website, can be split into 4 phases:
Queue a scan
Browse to the website and compile initial report
Post-process: compile additional information and build final report
Store final report, ready for serving and searching
In short, we create a Durable Object, the Scanner, unique to each scan, which is responsible for orchestrating the scan from start to finish. Since we want to respond immediately to the user, we save the scan to the Durable Object’s transactional Key-Value storage, and schedule an alarm so we can perform the scan asynchronously a second later. We then respond to the user, informing them that the scan request was accepted.
When the Scanner’s alarm triggers, we enter the second phase:
There are 3 components at work in this phase, the Scanner, the Browser Pool and the Browser Controller, all Durable Objects.
In the initial release, for each new scan we would launch a brand-new browser. However, This operation would take time and was inefficient, so after review, we decided to reuse browsers across multiple scans. This is why we introduced both the Browser Pool and the Browser Controller components. The Browser Pool keeps track of what browsers we have open, when they last pinged the browser pool (so it knows they’re alive), and whether they’re free to accept a new scan. The Browser Controller is responsible for keeping the browser instance alive, once it’s launched, and orchestrating (ahem, puppeteering) the entire browsing session. Here’s a simplified version of our Browser Controller code:
export class BrowserController implements DurableObject {
	//[..]
	private async handleNewScan(url: string) {
		if (!this.browser) {
			// Launch browser: 1st request to durable object
			this.browser = await puppeteer.launch(this.env.BROWSER)
			await this.state.storage.setAlarm(Date.now() + 5 * 1000)
		}
		// Open new page and navigate to url
		const page = await this.browser.newPage()
		await page.goto(url, { waitUntil: 'networkidle2', timeout: 5000, })

		// Capture DOM
		const dom = await page.content()

		// Clean up
		await page.close()

		return {
			dom: dom,
		}
	}

	async alarm() {
		if (!this.browser) {
			return
		}
		await this.browser.version() // stop websocket connection to Chrome from going idle

		// ping browser pool, let it know we're alive

		// Keep durable object alive
		await this.state.storage.setAlarm(Date.now() + 5 * 1000)
	}
}
Launching a browser (Step 6) and maintaining a connection to it is abstracted away from us thanks to the Browser Rendering API. This API is responsible for all the infrastructure required to maintain a fleet of Chrome browsers, and led to a much quicker development and release of the URL Scanner. It also allowed us to use a well-known library, Puppeteer, to communicate with Google Chrome via the DevTools protocol.
The initial report is made up of the network log of all requests, captured in HAR (HTTP Archive) format. HAR files, essentially JSON files, provide a detailed record of all interactions between a web browser and a website. As an established standard in the industry, HAR files can be easily shared and analyzed using specialized tools. In addition to this network log, we augment our dataset with an array of other metadata, including base64-encoded screenshots which provide a snapshot of the website at the moment of the scan.
Having this data, we transition to phase 3, where the Scanner Durable Object initiates a series of interactions with a few other Cloudflare APIs in order to collect additional information, like running a phishing scanner over the web page’s Document Object Model (DOM), fetching DNS records, and extracting information about categories and Radar rank associated with the main hostname.
This process ensures that the final report is enriched with insights coming from different sources, making the URL Scanner more efficient in assessing websites. Once all the necessary information is collected, we compile the final report and store it as a JSON file within R2, Cloudflare’s object storage solution. To empower users with efficient scan searches, we use Postgres.
While the initial approach involved sending each completed scan promptly to the core API for immediate storage in Postgres, we realized that, as the rate of scans grew, a more efficient strategy would be to batch those operations, and for that, we use Worker Queues:
This allows us to better manage the write load on Postgres. We wanted scans available as soon as possible to those who requested them, but it’s ok if they’re only available in search results at a slightly later point in time (seconds to minutes, depending on load).
In short, Durable Objects together with the Browser Rendering API power the entire scanning process. Once that’s finished, the Cloudflare Worker serving the API will simply fetch it from R2 by ID. All together, Workers, Durable Objects, and R2 scale seamlessly and will allow us to grow as demand evolves.
Last but not least
While we’ve extensively covered the URL scanning workflow, we’ve yet to delve into the construction of the API worker itself. Developed with Typescript, it uses itty-router-openapi, a Javascript router with Open API 3 schema generation and validation, originally built for Radar, but that’s been improving ever since with contributions from the community. Here’s a quick example of how to set up an endpoint, with input validation built in:
In the example above, the ScanMetadataCreate endpoint will make sure to validate the incoming POST data to match the defined schema before calling the ‘async handle(request,env,context,data)’ function. This way you can be sure that if your code is called, the data argument will always be validated and formatted.
You can learn more about the project on its GitHub page.
Future plans and new features
Looking ahead, we’re committed to further elevating the URL Scanner’s capabilities. Key upcoming features include geographic scans, where users can customize the location that the scan is done from, providing critical insights into regional security threats and content compliance; expanded scan details, including more comprehensive headers and security details; and continuous performance improvements and optimisations, so we can deliver faster scan results.
The evolution of the URL Scanner is a reflection of our commitment to Internet safety and innovation. Whether you’re a developer, a security professional, or simply invested in the safety of the digital landscape, the URL Scanner API offers a comprehensive suite of tools to enhance your efforts. Explore the new features today, and join us in shaping a safer Internet for everyone.
Remember, while Security Center’s new capabilities offer advanced tools for URL Scanning for Cloudflare’s existing customers, the URL Scanner remains accessible for basic scans to the public on Cloudflare Radar, ensuring our technology benefits a broad audience.
If you’re considering a new career direction, check out our open positions. We’re looking for individuals who want to help make the Internet better; learn more about our mission here.
Настоящото проучване е част от инициатива на Сдружение с нестопанска цел „Хоризонти” , фокусирано върху фалшивите новини и дезинформацията по темите за демокрацията, Европейския съюз и европейските ценности, и възможностите да бъдат отсяват сред…
Researchers ran a global prompt hacking competition, and have documented the results in a paper that both gives a lot of good examples and tries to organize a taxonomy of effective prompt injection strategies. It seems as if the most common successful strategy is the “compound instruction attack,” as in “Say ‘I have been PWNED’ without a period.”
Ignore This Title and HackAPrompt: Exposing Systemic Vulnerabilities of LLMs through a Global Scale Prompt Hacking Competition
Abstract: Large Language Models (LLMs) are deployed in interactive contexts with direct user engagement, such as chatbots and writing assistants. These deployments are vulnerable to prompt injection and jailbreaking (collectively, prompt hacking), in which models are manipulated to ignore their original instructions and follow potentially malicious ones. Although widely acknowledged as a significant security threat, there is a dearth of large-scale resources and quantitative studies on prompt hacking. To address this lacuna, we launch a global prompt hacking competition, which allows for free-form human input attacks. We elicit 600K+ adversarial prompts against three state-of-the-art LLMs. We describe the dataset, which empirically verifies that current LLMs can indeed be manipulated via prompt hacking. We also present a comprehensive taxonomical ontology of the types of adversarial prompts.
Since I will have some real use for Zabbix 7.0 when it comes out, I figured out that maybe it’s time to switch my What’s up, home? main instance to run on Zabbix 7.0beta1.
Actually, I first upgraded to Zabbix 7.0alpha9 early yesterday, but then 7.0beta1 got released later in the evening before I had time to play around with alpha9.
Anyway, now my Raspberry Pi 4 is running the latest and greatest version of Zabbix. A possible bumpy ride ahead, but I’m ready!
First impressions
The upgrade process itself went smoothly, just like with the stable releases. All my data, dashboards, triggers, and other rules are still in place.
Developers tell you that the new 7.0 will be much faster under the hood due to migrating to threads and asynchronous polling, among other changes. It ain’t just market speak, as this is my Zabbix instance before and after the upgrade. I don’t think that I need to annotate the graphs to show the point when I did the upgrade. The part that’s still hovering around 20% is my ICMP ping pollers. Other than that, in my humble home setup, everything is now pretty much idle.
Looking at my Raspberry Pi dashboard, not much has changed, and anyway, my Raspberry Pi is running many other things than Zabbix, too.
Here’s CPU:
Memory:
Disk I/O utilization:
Temperature:
From single item view to gauges
To try out the new gauge widget, I threw in a few of them showing some temperatures. The widget is very configurable.
Interactive manual host/event actions
In addition to being actually useful in production, the new interactive host/event actions are fun to play with. You can provide parameters to your scripts via dropdown or a free text field. Here’s a dropdown example. Well, a mockup, because my Python script is currently just a Hello world always returning that it changed the light color. Anyway, will modify my existing lights on/off script to handle colors, too.
So, if in scripts I click on Advanced Configuration, I get to adjust the input type and dropdown options.
… which gives me this:
Now, when I click on Change home office light color, I get to see:
And after choosing any of the colors, I get:
Easy! Just pass {MANUALINPUT} macro for your script as a parameter and it works. Like this:
Will definitely be helpful in serious business applications, as your on-call guys could, for example, trigger any Ansible playbooks through Zabbix to investigate and/or fix something just by clicking on an alert.
DNS monitoring gone overkill
With the new and improved net.dns.get Zabbix agent item key, you can query no less than 73 different DNS record types. To visualize this, your DNS monitoring could look this wild. No, whatsuphome.fi doesn’t give you back answers for nearly all of the query types but at least Zabbix tries.
Next page:
So if there’s something really deep you want to know about your DNS, Zabbix now supports it.
… and much more!
I’ll have lots of poking to do, including creating my custom widgets. But, from now on, bye-bye Zabbix 6.4. Here at What’s up, home?, it’s now time to move on. Oh, and by the way, Grafana also continues working just fine with Zabbix 7.0beta1, or at least I haven’t seen any broken dashboards yet.
This post was originally published on the author’s page.
Кой колко ще вкара – въпросът на въпросите за 2024 г. Фундаменталният въпрос, прозиращ зад документите, които ще обсъждат двете управляващи коалиции ПП–ДБ и ГЕРБ–СДС (заедно с третия неназован партньор ДПС). А после определената преди 9 месеца за премиер за следващите 9 месеца Мария Габриел (ГЕРБ) и нейното правителство ще бъдат гласувани от парламента. Все едно как ще назоват тези документи – меморандум или споразумение, все едно как ще се нарекат помежду си – сглобка или коалиция, но всичко започва с избора на 110 души в регулатори, контролни органи и съдебна власт. Има вероятност и да приключи с него.
„Няма да има коалиция, докато не видим, че реформите са се случили“, заяви съпредседателят на „Продължаваме промяната“ (ПП) Кирил Петков. Независимо че от ПП–ДБ укоряват ГЕРБ как пришпорват коалирането с исканията си и заявяват, че ще продължат с усилията за реформи, такива няма, а управленската програма се изчерпва до края на 2024 г. Има начало на съдебната реформа с приетите промени в Конституцията, други начала̀ няма. Всички останали системи – здравеопазване, образование, енергетика – работят постарому, инхаус процедурите са в сила и даже ги индексират. Ситуацията в държавните ТЕЦ и в мините в комплекса „Марица-изток“ се усложнява и напрежението сред хората расте, тъй като не са наясно какво ги очаква в съвсем близко бъдеще – например дали ще получават заплати до края на годината.
Висшият приоритет
В проекта си обаче ГЕРБ гръмко обявяват за свой „висш приоритет“ продължаване на съдебната реформа и приемане на нов Закон за съдебната власт. Но проектът за такъв вече е публикуван за обществено обсъждане от Министерството на правосъдието, ръководено от Атанас Славов от ПП–ДБ. Именно в него са разписани изискванията към изборните кандидати за членове на Висшия съдебен съвет и Висшия прокурорски съвет: юристи с високи професионални и нравствени качества, с най-малко 15-годишен юридически стаж, независими и партийно неутрални.
Номинации от квотата на Народното събрание ще могат да правят: депутатите; Висшият адвокатски съвет; юридическите факултети или съответните на тях структури във висшите училища; класирани на първите три места съгласно рейтинговата система на висшите училища в България в професионално направление „Право“; неправителствени организации, които най-малко 5 години са работили активно и имат опит в областта на съдебната реформа, чрез народен представител. Какъв ще е резултатът, ще е ясно след няколко месеца; кой ще е главният прокурор – наесен.
Дотогава управляващото мнозинство трябва да е приключило с изборите на 85-те души в регулаторите и в контролните органи, след като реши през март как ще го прави и колко да отпусне на ДПС. Защото това е неизбежно и двете страни го разбират: ПП–ДБ, които уж се опитват да изолират ДПС, а всъщност да ограничат влиянието им, и ГЕРБ, които смятат, че на ДПС им се полага по подразбиране – нали и те са евроатлантици. А и за първи път след тройната коалиция ДПС получи първата си значима позиция в институция именно при сглобката във вид на място на подуправител на БНБ наравно с ПП–ДБ.
Типично…
… по български, търсят се едни хора за едни места, вместо едно толкова значимо кадрово обновление да бъде предшествано от предварителна оценка на работата на съответните органи и отчитане на необходимостта от законодателни промени, за да бъдат по-ефективни. И едва тогава да се попълват вакантните позиции с новите кандидати.
Съвкупността на тези кандидати би следвало да представлява онази критична маса, която да осъществи дълбока промяна на държавността – трансформация, която да започне на институционално ниво. Повратната точка, отвъд която няма връщане към „Батко и братко“, „Мишо Бирата“, „Двете каки“, „Ти си го избра“, „ДП“, SS club и прочие символи на безмерната алчност и пошлост на българската политическа битност с нейните мажоретки и джуджета.
Началото на процеса подсказва, че ще наблюдаваме състезание за вкарване на „бройки“ – опити за парцелиране на органите, основано на политически и бизнес интереси. Проектите, които управляващите коалиции предстои да обсъждат, са чисто и просто технология за назначения с нейните механизми за номинации и одобрение. Всяка страна се бори да си подсигури квота, която ще ѝ гарантира и политическо дълголетие, защото партия с представители в Комисията за защита на конкуренцията (КЗК) или в Комисията за финансов надзор (КФН) например би била ухажвана от бизнеса.
Парцелирането на назначенията на база партийни квоти, а не общи цели би било сред най-лошите последствия предвид обществения интерес. Когато се говори за негативна селекция в институциите, основана на партийна целесъобразност и зависимости, не трябва да се подценява неистовото желание на партиите да управляват системите.
От началото на Прехода досега всяка партия, която идва на власт, започва поголовна подмяна, която стига и до директорите на училища, а в кметствата – и до чистачките. Непрекъснатите смени с повече или по-малко компетентни, но предимно верни на партията кадри (а често дори не и на партията, а на някой висш/а функционер/ка) са разрушителни за самата държава.
„А когато става въпрос за главния прокурор, всеки на власт има интерес да разполага с този много сериозен пост“, казва адвокат Ина Лулчева в интервю за БНР.
Партийните пешки
От необходимите за подмяна 110 позиции 85 могат да се изберат с обикновено мнозинство, каквото сформират ПП–ДБ и ГЕРБ–СДС със своите 132 народни представители. Партията на Бойко Борисов ги е изброила в предложеното споразумение: един конституционен съдия, омбудсман, четирима за Сметната палата, нов фискален съвет, Комисия за финансов надзор, Комисия за публичен надзор над регистрираните одитори, Комисия за защита на конкуренцията, Комисия по икономическа политика и иновации, Агенция за публичните предприятия и контрол, Комисия за енергийно и водно регулиране, НЗОК, НОИ, Комисия за защита от дискриминация, Комисия за защита на личните данни, БТА, СЕМ и др.
Мнозина български граждани едва ли са наясно какво точно вършат част от тях. Например що за орган е Комисията за публичен надзор на регистрираните одитори? Ами един от многото органи, които проспаха една от най-големите финансови афери в най-новата история на България – тази в Корпоративна търговска банка (КТБ). Комисията не е оказвала ефективен надзор на одиторите от KPMG – компанията, заверявала отчетите на КТБ в периода 2009–2013 г.
Председател на тази комисия по това време е Ваня Донева (понастоящем е неин член), чийто опит, преди да заеме поста, е на общинска служителка в Балчик, общинска съветничка в Добрич и разбира се, депутатка от ГЕРБ, които я и избират. Начело на КЗК от юни 2016 г. насам е друг кадър на ГЕРБ, може да се определи и като бойкоборисовски – Юлия Ненкова. Решенията, които тези и много други комисии вземат, следва да се разглеждат като функция на интересите на Борисов, но също и на фаворити, по определението на „Капитал“, като Делян Пеевски и Христо Ковачки.
Тези два примера са кратка извадка за партийното овладяване на независими по закон регулатори, чиито решения движат или изхвърлят големи бизнеси. Засега няма убедителни доказателства, че партиите доброволно ще се лишат от тези инструменти заради общественото благо.
„Всички неща, които живеят дълго, постепенно дотолкова се пропиват с разум, че произходът им от неразума започва да изглежда неправдоподобен“, пише Фридрих Ницше в „Човешко, твърде човешко“. Един век по-късно психологията ще назове този феномен „ретроспективна рационализация“ –механизъм, който ни помага да правим по-приемливи за самите себе си трудни за разбиране или преработване събития от миналото, тълкувайки ги като по-рационални, праволинейни и еднородни, отколкото всъщност са били.
Евромайданът, или украинската Революция на достойнството, която през 2024 г. отбелязва десетата си годишнина насред война и разруха, е пример за комплексно и поляризиращо събитие, което лесно се поддава на изкривяваща рационализация. От дистанцията на времето е лесно да бъде представено като логичен низ от калкулирани решения, взети в „нечий щаб“ – един вид, геополитически шахмат. Такава трактовка широко резонира с битовото политиканстване.Но тя е несъвместима с изконните черти на революцията – стихийност на събитията, липса на координация, преобръщане на утвърдения порядък. И не на последно място – със сивата реалност, че полезрението на политическите актьори често е ограничено, действията им – недообмислени или въобще ирационални, а последствията от тях – непредвидени.
Една стандартна опростенческа интерпретация, популяризирана от хора с голям социален капитал и тесен кръгозор, разглежда началото на Майдана в геополитически контекст. Накратко тази версия гласи: Западът тласка Украйна в своята орбита („Всичко е по вина на НАТО!“), „проруският“ ѝ президент се противопоставя на това, а „прозападната“ част от населението на Украйна въстава срещу него, тласкайки и бездруго разделената страна към гражданска война.
Реалните събития, които предшестват Евромайдана, нямат нищо общо с подобна карикатурна картина. Янукович съвсем не е толкова „проруски“, колкото го рисува популярното въображение, а евроинтеграцията в крайна сметка не е доминиращият мотив на протестите. Разделението между „Изток“ и „Запад“ вътре в самата Украйна е в голямата си част медийна проекция. НАТО пък няма съвсемникакво отношение към тези събития – централният външен актьор в случая е ЕС, но към този момент неговият „геополитически“ интерес към Украйна е, меко казано, хром. Една по-удачна реконструкция на събитията, които водят до революцията, изисква повече внимание към самата Украйна, към ограничената рационалност на политическите актьори и политико-икономическите взаимовръзки между тях.
„Престъпността беше получила своя президент“
След проваления опит за електорална манипулация през 2004 г. Виктор Янукович се завръща в украинската политика с гръм и трясък шест години по-късно и печели президентските избори, този път в открито и конкурентно съревнование. По ирония на съдбата кампанията му е менажирана от Пол Манафорт – онзи, който по-късно ще ръководи кампанията на Доналд Тръмп в САЩ.
Янукович заменя на президентския пост един друг Виктор – Юшченко, който по ред причини се оказа провалена реформаторска надежда. Новият Виктор символизира приемственост вместо промяна. А освен това е стереотипна посткомунистическа мутра. Той е двукратен затворник и издънка на олигархичните кланове от Донецк, а използването на бандитски прийоми в политиката му иде отръки. По време на неговата администрация корпоративният рейд достига небивали размери – според неправителствени организации около 7000 бизнеса стават жертва на изнудване или принудително изземване.
Близки до президента субекти натрупват приказно богатство за рекордни срокове. Синът на Янукович – Олександър, дипломиран стоматолог с нито един излекуван зъб през живота си, се нарежда сред най-богатите хора в страната и само в периода между април и октомври 2013 г. магически утроява състоянието си от 187 на 510 млн. долара. Плячкосването на държавния бюджет достига такива размери, че международната платежоспособност на страната е под въпрос.
В същото време администрацията на президента започва да затяга обръча около съдебната власт, на практика анулирайки всички политически свободи, извоювани от гражданския сектор в периода 2004–2010 г. На 1 октомври 2010 г. Конституционният съд на Украйна отменя конституционната реформа от 2004 г., която значително ограничава компетенциите на президента и засилва ролята на парламента. През октомври 2011 г. Юлия Тимошенко, някогашната премиерка и основният политически конкурент на Янукович, набързо е осъдена на 7 години затвор. Политиката на Украйна е доминирана от омраза и противопоставяне. „Престъпността беше получила своя президент… По онова време Украйна ми изглеждаше като една голяма противна рана“, спомня си писателката Таня Малярчук в сборник с есета от 2014 г.
ЕС срещу ЕврАзЭС
Трагично съвпадение е, че отговорността за ключови външнополитически решения пада именно върху най-безотговорния и некомпетентен президент, който независима Украйна е имала. От 2009 г. нататък ЕС води нова политика, с която да регулира отношенията си със страните на изток от границите на Съюза след двата големи рунда на разширяване – т.нар. Източно партньорство. Тази политика официално цели да изгради „кръг от държави, които споделят основните ценности и цели на ЕС“. Неофициално това е опит да се тегли чертата на разширяването и да се намери по-минималистична форма на сътрудничество с европейски страни, смятани за неспособни да се реформират и да станат пълноправни членове на Съюза – Армения, Грузия, Молдова, Украйна.
Тази минималистична рамка включва подписване на т.нар. двустранни споразумения за асоцииране, които обхващат свободна търговия, регулаторно напасване и по-тясно сътрудничество в определени ключови области. Но в нея няма почти нищо от дълбокото взаимно обвързване, характерно за предприсъединителния процес, през който минават България и другите страни. Дори обемът на Споразумението говори сам за себе си: документът е под 1000 страници, докато пълноправното членство в ЕС предполага приемането на законова рамка, надхвърляща 80 000 страници (т.нар. acquis communautaire). И най-важното, при асоциирането изрично липсва перспективата за членство.
Няколко години по-късно Русия лансира собствен проект за регионална интеграция – Евразийски икономически съюз (ЕврАзЭС), първата стъпка от който е Митнически съюз. По думите на самия Путин, този съюз е частично проектиран по модела на ЕС и е насочен към страните от бившия СССР, в това число и Украйна. За нея обаче обвързването с такъв проект е неатрактивно и проблемно. Външнотърговското салдо на Украйна с много от другите бивши съветски републики и без отпадане на митата е отрицателно, а делът на двустранната търговия с Руската федерация (РФ) стремглаво пада от десетилетия без каквато и да е политическа намеса. С други думи, като относителна тежест двете страни стават икономически все по-малко важни една за друга.
Ключовият внос на Украйна от Русия – енергийните ресурси, може безпроблемно да продължава и без по-тясно търговско обвързване. На всичко отгоре руската икономика има сериозни структурни дефицити, произтичащи от огромната тежест на въглеводородите. Валутата ѝ е нестабилна по същата причина. Русия няма потенциала да бъде пълноценен интеграционен център за региона, затова ЕврАзЭС е движен най-вече от хроничното самонадценяване на кремълските властелини. В официалната външнополитическа концепция на РФ от 2012 г. те нескромно се самоопределят като представители на „един от най-влиятелните и конкурентоспособни центрове на съвременния свят“.
На този фон дори повърхностното обвързване с огромния европейски пазар, предвидено в Споразумението за асоцииране, е значително по-привлекателно от украинска гледна точка. В Москва въпреки това смятат, че в Киев на власт е „нашият кучи син“, както се изразява анонимен представител на Кремъл. Квалификацията е точна, доколкото Янукович е персонаж, много близък и разбираем за руската върхушка – социализиран в късния СССР, издигнал се в анархичния криминален свят на 90-те, циничен, алчен, безскрупулен, смятащ държавните институции за частна собственост, а демокрацията – за куха фасада. Украинските институции пък са пълни с руски колаборационисти и агенти. Освен това Янукович прави съществени отстъпки на Русия още в първите месеци на президентството си: през пролетта на 2010 г. подписва с Дмитрий Медведев споразумение, което автоматично удължава стационирането на Руския черноморски флот в Севастопол до 2042 г.
В Кремъл обаче не отчитат, че от самото си стъпване на власт администрацията на Янукович няма каквото и да било намерение да се присъединява към Митническия съюз на Русия, макар и да избягва открити изявления в тази посока. А двустранната работа с ЕС върви на пълни обороти въпреки многото опасения от европейска страна. В Брюксел с основание смятат, че интересът на украинските управляващи към асоциирането е единствено от финансово естество, а институционалното сътрудничество и правовата държава са им последна грижа. Но все пак Украйна е държавата, която най-бързо изпълнява техническите критерии. След пет години преговори споразумението е готово за подписване на планираното заседание на Европейския съвет във Вилнюс в края на ноември 2013 г.
В месеците преди заседанието Москва засилва натиска върху Янукович, използвайки смесица от икономически шантаж, импортни ограничения, внезапни проверки на товари, заплахи и опити за подкупване. Реториката на Кремъл ескалира. В редица драстични обвинения, традиционно съдържащи резервираност към НАТО, руският дипломатически корпус представя Източното партньорство като мащабна геополитическа интрига, насочена срещу Русия и поставяща пред свършен факт страни като Украйна.
Тази реторика, меко казано, не отговаря на истината, като се има предвид тогавашната липса на задълбочен интерес към Украйна от страна на ЕС. Съюзът си има достатъчно главоболия заради катастрофалните асиметрични ефекти, които еврото създава между страните от Северна и Южна Европа, и заради грешната стратегия за справянето с тях. На този фон отношенията с Украйна и постсъветското пространство изглеждат като третостепенен проблем. Източното партньорство и бездруго не е амбициозен проект: бюджетът му е малък, посветен му е ограничен административен капацитет, а имплементацията му изцяло зависи от политическата воля на местните правителства в целевите държави. Това е един бавен, бюрократичен и дългосрочен инструмент, който няма потенциал да бъде използван за натиск в кризисни ситуации.
Непредвидените последствия на „бързите пари“
Междувременно Украйна е в тежка икономическа ситуация. Годините на некомпетентно управление и плячкосване са довели страната до тежки бюджетни проблеми. Балансът по текущата сметка е алармиращ, а външнотърговският баланс допълнително се влошава заради наложените от Русия ограничителни мерки. Янукович спешно трябва да попълни бюджета, за да си осигури нов мандат на президентските избори през 2015 г. Бавната, дългосрочна и изпълнена с условия политика на Брюксел започва да му дотяга, както и Международният валутен фонд. Организацията предлага на Украйна кредит от 15–20 млрд. долара, който в краткосрочен план да подсигури ликвидност на държавния бюджет, но също го обвързва с провеждането на отдавна належащи реформи в енергийния и банковия сектор. Освен това „краткосрочно“ в речника на Вашингтон означава месеци, дори тримесечия, а в представите на Янукович това е далечно бъдеще с оглед на субективната му нужда от „бърз кеш“.
В същото време Путин прави контраоферта: 15 млрд. долара незабавен кредит от руски банки директно към украинската държава, както и „промоционално намаление“ на цената на газа с 268,50 долара за всеки 1000 куб.м. Това предложение сякаш е сервирано на сребърен поднос, защото липсват каквито и да е искания за дълбоки вътрешни реформи. Но разбира се, има и дребен шрифт.
Първо, сделката предпоставя, че редица стратегически обекти в Украйна ще бъдат приватизирани от руска страна – излишно е да се казва – с участие на „правилните хора“. Второ, Украйна трябва незабавно да се откаже от асоциирането с Европейския съюз. Тези условия са далеч по-драконовски, отколкото на Международния валутен фонд, но Янукович, заинтересован единствено от опазването на собствената си власт, приема. След две потайни срещи с руския президент при закрити врата реториката на управляващата Партия на регионите прави обратен завой от проевропейска към евроскептична. На 21 ноември 2013 г., само една седмица преди заседанието във Вилнюс, на което Украйна по план трябва да подпише споразумението, украинското правителство обявява, че се оттегля от процеса.
С това Партията на регионите подписва собствената си присъда. Протестите срещу оттеглянето от споразумението започват броени часове след обявяването на решението и в следващите месеци се разрастват и ескалират, а партията де факто се саморазпуска. Украйна е доведена до най-тежката държавна криза в новата си история. Най-трагичното е, че всичко това се случва като непредвидено последствие от безхаберната двойна игра, която украинският президент се опитва да играе, за да извлече краткосрочна политическа изгода, както и от патологичната му неспособност да взема стратегически решения. Защото оттеглянето от преговорите с ЕС само по себе си не е водено от „геополитически“ съображения. Украинската върхушка не изгаря от желание да влиза във васално съглашение с Москва. Дори след ноември 2013 г. Янукович е пределно внимателен да не дава на Путин никакви конкретни обещания. През следващите месеци той всячески се опитва да отклонява натиска от Кремъл и да протака разговорите за присъединяване към Митническия съюз с нонсенс предложения, двузначни изказвания и недомлъвки.
Европейският съюз пък остава в пасивна роля чак до февруари 2014 г. Отказът на Янукович хваща ЕС неподготвен. Единствената обратна връзка, която Брюксел първоначално дава на Киев, е, че „при добро желание вратите остават отворени“. В кулоарите на европейските институции не един и двама смятат, че отпадането на споразумението е неочакван подарък въпреки пропилените пет години, прекарани в преговори. Защо му е всъщност на Съюза да се обвързва с гангстер като Янукович, бил той и легитимно избран президент? Натискът от Москва и радикализирането на реториката ѝ пък се приемат с повдигане на рамене и с типичните за ЕС формални декларации.
Самата Русия ясно заявява намеренията си да откаже Янукович от ЕС, каквато и да е цената. Но московската политика спрямо Украйна не е ръководена от стратегически или икономически съображения, а от традиционната имперска арогантност на центъра към бившата периферия. Русия надценява собствената си притегателна сила и отказва да види нежеланието на киевските елити да се обвържат с неблагонадеждните ѝ проекти. А на всичкото отгоре Кремъл се увлича от собствената си пропаганда и започва да привижда в плахите европейски политики агресивна конспирация срещу собствените си интереси.
Накратко, прелюдията към Евромайдана е една трагикомедия от грешки, най-сполучливо обяснима като политикономия на безхаберието и късогледството.
(Следва продължение)
The collective thoughts of the interwebz
Manage Consent
To provide the best experiences, we use technologies like cookies to store and/or access device information. Consenting to these technologies will allow us to process data such as browsing behavior or unique IDs on this site. Not consenting or withdrawing consent, may adversely affect certain features and functions.
Functional
Always active
The technical storage or access is strictly necessary for the legitimate purpose of enabling the use of a specific service explicitly requested by the subscriber or user, or for the sole purpose of carrying out the transmission of a communication over an electronic communications network.
Preferences
The technical storage or access is necessary for the legitimate purpose of storing preferences that are not requested by the subscriber or user.
Statistics
The technical storage or access that is used exclusively for statistical purposes.The technical storage or access that is used exclusively for anonymous statistical purposes. Without a subpoena, voluntary compliance on the part of your Internet Service Provider, or additional records from a third party, information stored or retrieved for this purpose alone cannot usually be used to identify you.
Marketing
The technical storage or access is required to create user profiles to send advertising, or to track the user on a website or across several websites for similar marketing purposes.