Едно от белите петна на София – част 2

Post Syndicated from original https://yurukov.net/blog/2023/edno-ot-belite-petna-na-sofia/

Преди точно 6 седмици писах за това как СДВР и ЦГМ имат сериозни бели петна в столицата и усърдно не забелязват определени проблеми и лица. В случая ставаше дума за нещо дребно и прието за ежедневие от повечето – редовно блокиране на тротоарите около ресторант 101, а понякога и буквално отцепване на района от джипове и гардове по време привидни сбирки на небезизвестни лица.

Три седмици след въпросния текст се забелязваха една идея повече патрулки в района на ресторанта, което даде надежда, че някой се е задействал. Проблемите са от двете страни на улицата, но най-вече от страната на тротоара на комплекс Диана и ресторанта, който се намира на ъгъла му. За овладяването на комплекса и околността му е писано доста.

Днес минавах от там и забелязах следната мила картинка. Патрулката беше спряла, изчакваше шофьори на спрели коли и пишеше актове. На отсрещната страна. Където не бяха джиповете на „не го знам тоя чий човек е“.

Докато детска количка се движеше по улицата пред фаровете на джиповете наредени по тротоара, приближих полицаите и ги попитай „След тези ще вземете ли мерки за ония отсреща? Там е основния проблем.“ Видимо изнервен и афектиран единия полицай ми се сопна, че е сам и сега ще се фокусира единствено на това по-отдалечено място. За колите около ресторанта нямали планове.

Отидох до другия. Той се опита да обяснява, че то било обособено място там и защо да им правили проблем. Посочих им къде е тротоара. Отделно, точно по диагонал от тях на място ясно видимо от камерата в колата им се виждаше джип паркирал на нещо, която дори опитите им за реинтерпретация на градската среда не успя да оспори, че е съвсем ясно тротоар. Отделно признаха, че е абсолютно забранено спирането конкретно там според закона. Там не пипали обаче днес.

Питах дали са викнали паяк. Казаха, че не са. Попитах дали ще седят тук докато дойде, защото от ЦГМ са ми казвали, че без патрулка на това място не вдигали, а всеки път като дойдат и патрулката избягала. Вдигнаха ръце възмутено какви глупости им говоря – нямало такова нещо. Викам ок.

Минах през същото място след 7-8 мин. Патрулката вече я нямаше. Джипът и останалите са още там. Една баба заобикаляше умело тях, прелитащите коли и кофите за боклук. Тя ще остане. И гардовете.

The post Едно от белите петна на София – част 2 first appeared on Блогът на Юруков.

Side-Channel Attack against CRYSTALS-Kyber

Post Syndicated from Bruce Schneier original https://www.schneier.com/blog/archives/2023/02/side-channel-attack-against-crystals-kyber.html

CRYSTALS-Kyber is one of the public-key algorithms currently recommended by NIST as part of its post-quantum cryptography standardization process.

Researchers have just published a side-channel attack—using power consumption—against an implementation of the algorithm that was supposed to be resistant against that sort of attack.

The algorithm is not “broken” or “cracked”—despite headlines to the contrary—this is just a side-channel attack. What makes this work really interesting is that the researchers used a machine-learning model to train the system to exploit the side channel.

Introducing AWS Lambda Powertools for .NET

Post Syndicated from Julian Wood original https://aws.amazon.com/blogs/compute/introducing-aws-lambda-powertools-for-net/

This blog post is written by Amir Khairalomoum, Senior Solutions Architect.

Modern applications are built with modular architectural patterns, serverless operational models, and agile developer processes. They allow you to innovate faster, reduce risk, accelerate time to market, and decrease your total cost of ownership (TCO). A microservices architecture comprises many distributed parts that can introduce complexity to application observability. Modern observability must respond to this complexity, the increased frequency of software deployments, and the short-lived nature of AWS Lambda execution environments.

The Serverless Applications Lens for the AWS Well-Architected Framework focuses on how to design, deploy, and architect your serverless application workloads in the AWS Cloud. AWS Lambda Powertools for .NET translates some of the best practices defined in the serverless lens into a suite of utilities. You can use these in your application to apply structured logging, distributed tracing, and monitoring of metrics.

Following the community’s continued adoption of AWS Lambda Powertools for Python, Java, and TypeScript, AWS Lambda Powertools for .NET is now generally available.

This post shows how to use the new open source Powertools library to implement observability best practices with minimal coding. It walks through getting started, with the provided examples available in the Powertools GitHub repository.

About Powertools

Powertools for .NET is a suite of utilities that helps with implementing observability best practices without needing to write additional custom code. It currently supports Lambda functions written in C#, with support for runtime versions .NET 6 and newer. Powertools provides three core utilities:

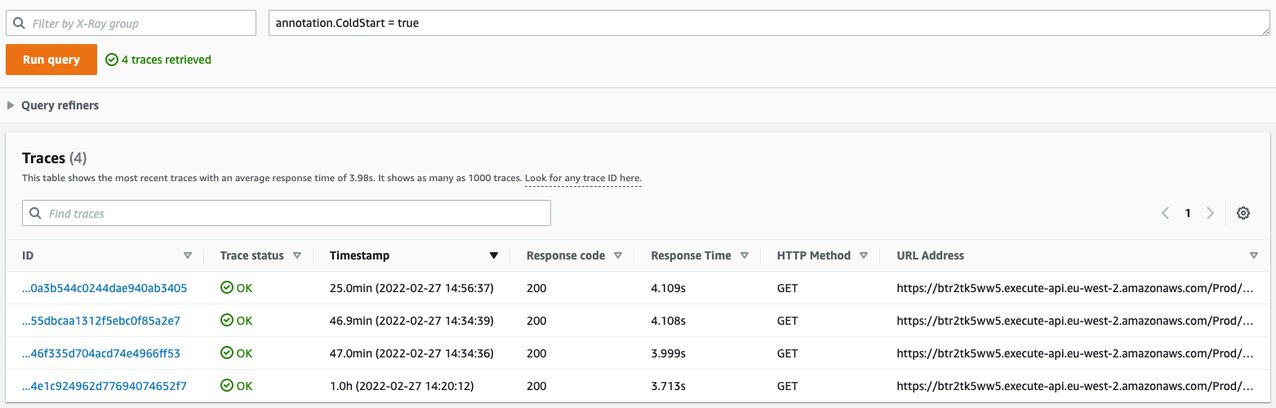
  • Tracing provides a simpler way to send traces from functions to AWS X-Ray. It provides visibility into function calls, interactions with other AWS services, or external HTTP requests. You can add attributes to traces to allow filtering based on key information. For example, when using the Tracing attribute, it creates a ColdStart annotation. You can easily group and analyze traces to understand the initialization process.
  • Logging provides a custom logger that outputs structured JSON. It allows you to pass in strings or more complex objects, and takes care of serializing the log output. The logger handles common use cases, such as logging the Lambda event payload, and capturing cold start information. This includes appending custom keys to the logger.
  • Metrics simplifies collecting custom metrics from your application, without the need to make synchronous requests to external systems. This functionality allows capturing metrics asynchronously using Amazon CloudWatch Embedded Metric Format (EMF) which reduces latency and cost. This provides convenient functionality for common cases, such as validating metrics against CloudWatch EMF specification and tracking cold starts.

Getting started

The following steps explain how to use Powertools to implement structured logging, add custom metrics, and enable tracing with AWS X-Ray. The example application consists of an Amazon API Gateway endpoint, a Lambda function, and an Amazon DynamoDB table. It uses the AWS Serverless Application Model (AWS SAM) to manage the deployment.

When you send a GET request to the API Gateway endpoint, the Lambda function is invoked. This function calls a location API to find the IP address, stores it in the DynamoDB table, and returns it with a greeting message to the client.

Example application

Example application

The AWS Lambda Powertools for .NET utilities are available as NuGet packages. Each core utility has a separate NuGet package. It allows you to add only the packages you need. This helps to make the Lambda package size smaller, which can improve the performance.

To implement each of these core utilities in a separate example, use the Globals sections of the AWS SAM template to configure Powertools environment variables and enable active tracing for all Lambda functions and Amazon API Gateway stages.

Sometimes resources that you declare in an AWS SAM template have common configurations. Instead of duplicating this information in every resource, you can declare them once in the Globals section and let your resources inherit them.

Logging

The following steps explain how to implement structured logging in an application. The logging example shows you how to use the logging feature.

To add the Powertools logging library to your project, install the packages from NuGet gallery, from Visual Studio editor, or by using following .NET CLI command:

dotnet add package AWS.Lambda.Powertools.Logging

Use environment variables in the Globals sections of the AWS SAM template to configure the logging library:

  Globals:
    Function:
      Environment:
        Variables:
          POWERTOOLS_SERVICE_NAME: powertools-dotnet-logging-sample
          POWERTOOLS_LOG_LEVEL: Debug
          POWERTOOLS_LOGGER_CASE: SnakeCase

Decorate the Lambda function handler method with the Logging attribute in the code. This enables the utility and allows you to use the Logger functionality to output structured logs by passing messages as a string. For example:

[Logging]
public async Task<APIGatewayProxyResponse> FunctionHandler
         (APIGatewayProxyRequest apigProxyEvent, ILambdaContext context)
{
  ...
  Logger.LogInformation("Getting ip address from external service");
  var location = await GetCallingIp();
  ...
}

Lambda sends the output to Amazon CloudWatch Logs as a JSON-formatted line.

{
  "cold_start": true,
  "xray_trace_id": "1-621b9125-0a3b544c0244dae940ab3405",
  "function_name": "powertools-dotnet-tracing-sampl-HelloWorldFunction-v0F2GJwy5r1V",
  "function_version": "$LATEST",
  "function_memory_size": 256,
  "function_arn": "arn:aws:lambda:eu-west-2:286043031651:function:powertools-dotnet-tracing-sample-HelloWorldFunction-v0F2GJwy5r1V",
  "function_request_id": "3ad9140b-b156-406e-b314-5ac414fecde1",
  "timestamp": "2022-02-27T14:56:39.2737371Z",
  "level": "Information",
  "service": "powertools-dotnet-sample",
  "name": "AWS.Lambda.Powertools.Logging.Logger",
  "message": "Getting ip address from external service"
}

Another common use case, especially when developing new Lambda functions, is to print a log of the event received by the handler. You can achieve this by enabling LogEvent on the Logging attribute. This is disabled by default to prevent potentially leaking sensitive event data into logs.

[Logging(LogEvent = true)]
public async Task<APIGatewayProxyResponse> FunctionHandler
         (APIGatewayProxyRequest apigProxyEvent, ILambdaContext context)
{
  ...
}

With logs available as structured JSON, you can perform searches on this structured data using CloudWatch Logs Insights. To search for all logs that were output during a Lambda cold start, and display the key fields in the output, run following query:

fields coldStart='true'
| fields @timestamp, function_name, function_version, xray_trace_id
| sort @timestamp desc
| limit 20
CloudWatch Logs Insights query for cold starts

CloudWatch Logs Insights query for cold starts

Tracing

Using the Tracing attribute, you can instruct the library to send traces and metadata from the Lambda function invocation to AWS X-Ray using the AWS X-Ray SDK for .NET. The tracing example shows you how to use the tracing feature.

When your application makes calls to AWS services, the SDK tracks downstream calls in subsegments. AWS services that support tracing, and resources that you access within those services, appear as downstream nodes on the service map in the X-Ray console.

You can instrument all of your AWS SDK for .NET clients by calling RegisterXRayForAllServices before you create them.

public class Function
{
  private static IDynamoDBContext _dynamoDbContext;
  public Function()
  {
    AWSSDKHandler.RegisterXRayForAllServices();
    ...
  }
  ...
}

To add the Powertools tracing library to your project, install the packages from NuGet gallery, from Visual Studio editor, or by using following .NET CLI command:

dotnet add package AWS.Lambda.Powertools.Tracing

Use environment variables in the Globals sections of the AWS SAM template to configure the tracing library.

  Globals:
    Function:
      Tracing: Active
      Environment:
        Variables:
          POWERTOOLS_SERVICE_NAME: powertools-dotnet-tracing-sample
          POWERTOOLS_TRACER_CAPTURE_RESPONSE: true
          POWERTOOLS_TRACER_CAPTURE_ERROR: true

Decorate the Lambda function handler method with the Tracing attribute to enable the utility. To provide more granular details for your traces, you can use the same attribute to capture the invocation of other functions outside of the handler. For example:

[Tracing]
public async Task<APIGatewayProxyResponse> FunctionHandler
         (APIGatewayProxyRequest apigProxyEvent, ILambdaContext context)
{
  ...
  var location = await GetCallingIp().ConfigureAwait(false);
  ...
}

[Tracing(SegmentName = "Location service")]
private static async Task<string?> GetCallingIp()
{
  ...
}

Once traffic is flowing, you see a generated service map in the AWS X-Ray console. Decorating the Lambda function handler method, or any other method in the chain with the Tracing attribute, provides an overview of all the traffic flowing through the application.

AWS X-Ray trace service view

AWS X-Ray trace service view

You can also view the individual traces that are generated, along with a waterfall view of the segments and subsegments that comprise your trace. This data can help you pinpoint the root cause of slow operations or errors within your application.

AWS X-Ray waterfall trace view

AWS X-Ray waterfall trace view

You can also filter traces by annotation and create custom service maps with AWS X-Ray Trace groups. In this example, use the filter expression annotation.ColdStart = true to filter traces based on the ColdStart annotation. The Tracing attribute adds these automatically when used within the handler method.

View trace attributes

View trace attributes

Metrics

CloudWatch offers a number of included metrics to help answer general questions about the application’s throughput, error rate, and resource utilization. However, to understand the behavior of the application better, you should also add custom metrics relevant to your workload.

The metrics utility creates custom metrics asynchronously by logging metrics to standard output using the Amazon CloudWatch Embedded Metric Format (EMF).

In the sample application, you want to understand how often your service is calling the location API to identify the IP addresses. The metrics example shows you how to use the metrics feature.

To add the Powertools metrics library to your project, install the packages from the NuGet gallery, from the Visual Studio editor, or by using the following .NET CLI command:

dotnet add package AWS.Lambda.Powertools.Metrics

Use environment variables in the Globals sections of the AWS SAM template to configure the metrics library:

  Globals:
    Function:
      Environment:
        Variables:
          POWERTOOLS_SERVICE_NAME: powertools-dotnet-metrics-sample
          POWERTOOLS_METRICS_NAMESPACE: AWSLambdaPowertools

To create custom metrics, decorate the Lambda function with the Metrics attribute. This ensures that all metrics are properly serialized and flushed to logs when the function finishes its invocation.

You can then emit custom metrics by calling AddMetric or push a single metric with a custom namespace, service and dimensions by calling PushSingleMetric. You can also enable the CaptureColdStart on the attribute to automatically create a cold start metric.

[Metrics(CaptureColdStart = true)]
public async Task<APIGatewayProxyResponse> FunctionHandler
         (APIGatewayProxyRequest apigProxyEvent, ILambdaContext context)
{
  ...
  // Add Metric to capture the amount of time
  Metrics.PushSingleMetric(
        metricName: "CallingIP",
        value: 1,
        unit: MetricUnit.Count,
        service: "lambda-powertools-metrics-example",
        defaultDimensions: new Dictionary<string, string>
        {
            { "Metric Type", "Single" }
        });
  ...
}

Conclusion

CloudWatch and AWS X-Ray offer functionality that provides comprehensive observability for your applications. Lambda Powertools .NET is now available in preview. The library helps implement observability when running Lambda functions based on .NET 6 while reducing the amount of custom code.

It simplifies implementing the observability best practices defined in the Serverless Applications Lens for the AWS Well-Architected Framework for a serverless application and allows you to focus more time on the business logic.

You can find the full documentation and the source code for Powertools in GitHub. We welcome contributions via pull request, and encourage you to create an issue if you have any feedback for the project. Happy building with AWS Lambda Powertools for .NET.

For more serverless learning resources, visit Serverless Land.

Емисиите докладвани от Ковачки в разбираем вид

Post Syndicated from original https://yurukov.net/blog/2023/emisiite-na-kovachki/

Покрай новината вчера, че европрокуратурата е влязла в ТЕЦ-овете и топлоцентралите свързвани с Ковачки заради измами и укриване на емисии, се сетих за инструмент, който пуснах преди повече от 9 години. Става въпрос за данните на ИАОС, които се подават всяка година от самите замърсяващи индустриални инсталации. Те се съхраняват от години в регистър на сайта им, който както се очаква е в доста труден за разбиране вид.

Затова бях направил интерактивен инструмент, с който да се преглеждат въпросните замърсители според категорията, собственика и прочие. Предвид, че съм го писал преди толкова години, видът не е особено добър и се разглежда удобно само на компютър. Ще се опитам в близките дни да го направя да се отваря прегледно и на телефон.

Последно бях обновявал данните с тези за 2018-ма. Снощи ги обнових до 2021-ва. От тези за 2022-ра само няколко площадки са подали информация. Ако не се лъжа, имат срок до средата на годината. В горната част се виждат бързи филтри за търсене на конкретни замърсители и замърсяващи. Добавих описаните в проверките на европрокурата и свързвани с Ковачки.

Интересното е, че се вижда колко много от замърсяването е изчислено, а не измерено. Всъщност, последно са измервали нещо в който и да е от ТЕЦ-овете му през 2016-та, а последното значимо измерване е имало през 2009-та. По практически всички показатели замърсяването на централите му намалява, с изключение на 2021-ва година, където има покачване. Това е вероятно заради увеличеното производство покрай високите цени на тока.

Показаните данни тук са единствено и само това, което Ковачки е декларирал пред агенцията за емисиите на централите му. Както многократно се коментираше, включително под статиите ми по темата, това е далеч от истината. За съжаление, родната прокуратура и надзорните органи прикриват всичко това години наред. Дори при нашумелите сигнали и проверки в последната година, Гешев не видя риск за хегемонията си, за да извади окото на гарвана. Наложи се Кьовеши да се намеси, за да се случи нещо, което показва отново защо ГЕРБ и Гешев имаха такъв отпор срещу институцията ѝ.

С тези уточнения, може да разгледате подробно данните в самия инструмент. Увеличавайки картата може да се фокусирате върху определени райони и инсталации. Върху всички графики и списъци има филтри. Избраното така съдържание може да се споделя, тъй като адреса на страницата се обновява всеки път. Ще пиша отново, когато обновената версия на графиката е готова.

The post Емисиите докладвани от Ковачки в разбираем вид first appeared on Блогът на Юруков.

2023-02-28 video-streaming (“видео-наблюдение”) на изборите

Post Syndicated from original https://vasil.ludost.net/blog/?p=3465

Тия дни от Дневник ме разпитваха някакви неща за видео streaming-а (“видеонаблюдението”) на изборите и решиш да доразкажа някакви подробности, ако на някой му е интересно.

Моят опит с тези неща идва от няколко места – генералното ми занимаване със сервиране на файлове и видеа, streaming-а на конференции (OpenFest и най-вече FOSDEM), и накрая – инфраструктурата и схемата, която сглобявах за tibroish.bg за излъчване на предишните избори.
(предишните видео-наблюдения бяха саботирани там, където вероятно ще бъдат и тези, на ниво секция, и на практика имаше твърде малко stream-ващи, може би около 1%. Съответно, цялостната схема не е минала пълен тест в production, но не успявам да намеря причина да не работи.)

(код на всичкото на tibroish)

Според мен, подобна система може да се реализира с почти подръчни средства. В нея няма нито един много специализиран, сложен или невиждан досега компонент. От друга страна, точно това не е правено особено много и има много интеграционна и тестова работа, която не намалява с идването на изборите, та най-големият проблем всъщност са сроковете.

Ще тръгна по потока на данните и ще обясня моето виждане (и как в общи линии работеше системата за streaming в tibroish, която за тези избори е спряна).

Самото заснемане се прави с телефон.
– Хардуерът на модерните телефони е доста добър, и като качество на картината, и като звук;
– в тях има хардуерен encoder за видео, който може да го сдъвче доста добре на хубаво качество;
– два варианта за свързаност (мобилна мрежа и wifi, като в този случай само мобилната мрежа вероятно ще се ползва);
– място за събиране на записи – на повечето телефони 6-часовия, 2.7GiB запис на 1mbps ще се събере във вътрешната памет и няма да има нужда от SD карта;
– самия телефон си има поддържаща операционна система и готови библиотеки;
– вграден UPS;
– ако трябва да се осигурят 12000 устройства за нещо и да се изпрограмират, телефоните нямат равни, понеже като цяло имат подобно производство.

Конкретно в tibroish нямахме особен избор, и задачата беше допълнително затруднена от това, че трябваше да поддържаме random телефони, което ако някоя фирма прави цялостното решение, няма да е проблем.

Приложението на tibroish има в себе си и video streaming, и е open-source, съответно може да се използва тази му част като основа.

Първата задача на приложението е да се оторизира пред зададен централен сървър и да разбере къде да си изпраща видео потока. Подобни системи и схеми има в най-различни видове и са нещо, което почти всеки е правил. Това е услуга с малко натоварване, свястна база данни и сравнително защитена от атаки (по темата сигурност ще пиша отделно).

След като получи информацията, приложението започва да записва и ако може, да stream-ва. Ако може, понеже в някакво количество секции internet няма и няма достатъчно мобилно покритие, за да излъчи 1Mbps видео.

Стойността 1Mbps идва от някакъв опит и проби/грешки, за повечето нужди в 1Mbps на 1280×720 (720p) може да се смести картина с четим текст и като цяло всичко да е добре различимо, при подходящ H.264 профил. Не съм успявал да докарам поносимо видео на по-малка разделителна способност, а 2Mbps ще е доста сложно за мобилната мрежа. Като опция, вероятно може да се записва на различен bitrate, но това ще увеличи доста натоварването на телефона.

Stream-ването го бяхме реализирали по RTMP. В момента опциите за подобно нещо са:
– WebRTC базирано – генерира UDP/RTP трафик и като цяло губи пакети, понеже е ориентирано за комуникация с ниска латентност. Голямото му предимство е сериозната поддръжка в телефоните и като цяло, понеже се използва много, но е доста по-сложно и като цяло неподходящо.
– Нещо файлово-базирано – например да генерира на телефона HLS фрагменти и да ги качва директно един по един – това би било страхотно решение и изисква най-малко от инфраструктурата, но не съм виждал такова.
– RTMP(S) – стандартен протокол в/у TCP, от ерата на Flash-а. Все още стандартът за stream-ване (всичките платформи като twitch, youtube и facebook май само него поддържат) и има добра open-source поддръжка. Аз все още ползвам nginx-rtmp за повечето streaming и стига да не се подава странно видео, работи добре.

Тук задачата в крайна сметка е да има видео и да изглежда добре, латентност от 5-10-30 секунди е поносима.

Този поток от данни с всички останали се праща до приемащ сървър. Сметките всеки може да си ги направи, при 1Mbps на поток и като цяло 12Gbps, ако се раздели на 50 виртуалки (както аз го бях направил), натоварването става поносимо и се издържа от и събира на почти всякаква машина в някаква cloud услуга. Единият път за tibroish използвах Hetzner, но има и други, които могат да свършат работа. За конкретния случай дори комбинация от няколко български доставчика ще свърши работа, и вероятно дори самите мобилни оператори могат да предоставят подобна мижава инфраструктура.
(по моя опит, нужната инфраструктура за това не стига размерите дори на среден cloud provider, може би е като един малък такъв. 12 Gbps и 30 TiB данни за записите би трябвало да не са нещо особено за когото и да било)

От гледна точка на сигурност, адресът на приемащия сървър се дава на приложението от централния, малко преди да е започнал streaming-а. Това се прави да се ограничи периодът, в който ще може да се подготви и засили DDoS атака, понеже такава ще има, както всяка година има спрямо сайта на ЦИК. Доколкото знам, ИО са отработили система за защита, и поне според мен може да се направи уговорка с мобилните оператори точно този трафик да не излиза никъде от мрежите им и да върви по трасета, които няма как да се DDoS-нат отвън.

След като трафикът стигне на приемните машини, от там те могат да генерират HLS потоци (за които няма нужда от reencode-ване, т.е. просто се препакетира трафика, което не яде почти никакъв процесор, от моите експерименти – бях пускал няколко-стотин потока към един сървър, докато сгъне) и може да се гледа. Като цяло гледането ще е по-малката част от трафика, и HLS се проксира доста лесно, та в tibroish просто ползвахме CloudFlare за proxy/филтър пред гледането. Мисля, че това е опция и за всеки друг, който го прави.

И на последно място, някъде трябва да има една красива страница, от която да се вижда къде има работещ stream и да може да се избере/гледа stream. Това се сглабя сравнително лесно (и пак го има в tibroish), като цяло начини да показваш видео – бол…

Няколко проблема, които не съм споменал горе:

– Цялото нещо има нужда минимум от DDoS защита. Може да се очаква да бъде блъскано усилено, ако се намери къде е, за това аз бих разчитал на елемента на изненадата (да не се вижда къде е докато не започне събитието), random имена на сървърите (и всичко в dns зоната, което не е тези сървъри, сочи към някакви blackhole-нати адреси, да затруднява допълнително), подходяща DDoS защита с подходящ капацитет и почистване на трафика, и различни, големи доставчици за проксиране, които да могат да издържат.

– Не сме правили запис, и не мога да кажа какви мотики може да се ударят там. Според мен и сметка на салфетка вътрешния storage на телефоните ще се справи, за удобство може да се пише И на SD карта, там е основно въпрос на логистика. Проблемът на SD картата е, че доста по-лесно изчезва…

– ЦИК има изискването да могат да се четат номерата на бюлетините. Това изисква най-вече добро осветление и поставяне на камерата, което не е от най-простите неща за обясняване (камерата има почти второстепенна роля). Според мен 1Mbps ще се справи със задачата.

– Не е ясно дали може да се записва звук или не. В tibroish го бяхме спрели директно, понеже юристите не можаха да се произнесат, според мен би бил страхотна идея да се записва и stream-ва, колкото и да е зле.

Та, технически може да стане. Практически – времето е малко и ще е сложно, и както обикновено, ще бъде саботирано в секциите. Ако няма конкретни глоби и наказания за липса на видео-наблюдение, може да се очаква поне 20% от него да не работи и да няма запис. Честно казано, ако видя да се случи от 50% от секциите, ще го броя за чудо.

Приемам всякакви идеи и корекции, че това ми е brain dump от една ранна сутрин 🙂

Introducing Client-side Evaluation for Amazon CloudWatch Evidently

Post Syndicated from Cole Thienes original https://aws.amazon.com/blogs/architecture/introducing-client-side-evaluation-for-amazon-cloudwatch-evidently/

Amazon CloudWatch Evidently enables developers to test new features on a small percentage of traffic and gauge the outcome before rolling it out to the rest of their users. Evidently feature flags are defined ahead of your release and, at runtime, your application code queries a remote service to determine whether to show the new feature to a given user. The remote call to fetch feature flags for a user is susceptible to network latency, adding several hundred milliseconds of delay in bad cases. Any additional latency added to fetching feature flags can directly impact the speed of a web page, where milliseconds matter. Our solution: client-side evaluation for Amazon CloudWatch Evidently. With client-side evaluation, developers can significantly decrease latency by fetching feature flags locally and avoiding network overhead altogether.

The term “client-side” does not refer to the browser in this case, but the operation taking place on your container application rather than through a remote API call. This removes the need for a network call by fetching feature flags for a user from the AWS AppConfig agent—a sidecar container running alongside your container application backend. The agent enables container runtimes to leverage AWS AppConfig, a service allowing customers to change the way an application behaves while running without deploying new code. In this post, we’ll walk through the solution architecture and how to instrument client-side evaluation in an Amazon Elastic Container Service (Amazon ECS) application.

Overview of solution

Figure 1 illustrates how client-side evaluation works in an application running on Amazon ECS. The webpage makes a call to the webpage backend to determine which website features to show an end-user. Let’s explore how this works.

High-level architecture of Client-side Evaluation for Amazon CloudWatch Evidently

Figure 1. High-level architecture of client-side evaluation for Amazon CloudWatch Evidently

  1. Create an Evidently project, feature, and launch through the AWS Console Mobile Application, API, or AWS CloudFormation.
  2. Create an Amazon ECS task for the backend application container and attach an AWS AppConfig agent container to the task. At runtime, the application container will invoke the EvaluateFeature API to fetch feature flags. Without client-side evaluation, this API call would perform a remote call to the Evidently cloud service.
  3. With client-side evaluation, the API call is made from the application container to the AWS AppConfig agent container on localhost, short-circuiting the network overhead.
  4. Evidently maintains a synchronized copy of the Evidently features in an AWS AppConfig configuration within your AWS account. When subsequent changes are made to the features, the configuration is updated (usually within a minute).
  5. When the backend application initializes, the agent fetches the necessary configuration profile and caches it, polling periodically to refresh the cache. When the AWS AppConfig agent is invoked from the backend application, it evaluates the requested feature flag using the cached data.
  6. After each successful EvaluateFeature call, a transaction record is generated, called an evaluation event. This useful bookkeeping mechanism helps developers view data to tell which of their users saw what feature and when. As the evaluation events are generated, they are placed in a buffer within the agent. Once the buffer reaches a certain size or age, events in the buffer are uploaded to Evidently via the PutProjectEvents API.
  7. The evaluation events are then available for offline analysis in developer-configured storage, including CloudWatch Logs, Amazon Simple Storage Service (Amazon S3), and CloudWatch Metrics.

Walkthrough

Let’s take a practical example to demonstrate client-side evaluation. I have a simple webpage with a search bar on it. I’ve implemented a newer, fancier search bar, but I only want to show it to 10 percent of my visitors to make sure it doesn’t cause issues on my existing webpage before rolling it out to everyone, as in Figure 2.

Web page experience where 10% of users see the new search bar

Figure 2. A webpage experience where 10% of users see the new search bar

We could set up the necessary AWS resources by hand, but let’s use a pre-built AWS Cloud Development Kit (AWS CDK) example to save time. The sample code for this example is available on GitHub. Here are the high-level steps:

  1. Provision the infrastructure. The infrastructure will consist of:
    • An ECS service with a Virtual Private Cloud (Amazon VPC) to serve as our backend application and return the search bar variation
    • An Evidently launch to split the traffic between the two search bars
    • An AWS AppConfig environment, which the AWS AppConfig agent will fetch Evidently data from
  2. Test our webpage. Once our code is deployed, we will visit our webpage to fetch feature flags using client-side evaluation.
  3.  Clean up by removing our infrastructure.

Prerequisites

Steps

Clone the repository

First, clone the official AWS CDK example repository:

git clone https://github.com/aws-samples/aws-cdk-examples

The repository has many examples for setting up AWS infrastructure in CDK. Let’s go to a client-side evaluation example.

Code explanation

Let’s take a look at the code example. When we visit our web page, a request will be routed to our application deployed on AWS Fargate, which allows us to run containers directly using ECS without having to manage Elastic Compute Cloud (Amazon EC2) instances. The application code is written in Node.js with Typescript and leverages the Express framework:

<p><code>// local-image/app.ts</code></p><p><code>import * as express from 'express';</code><br /><code>import {Evidently} from '@aws-sdk/client-evidently';</code></p><p><code>const app = express();</code></p><p><code>const evidently = new Evidently({</code><br /><code>    endpoint: 'http://localhost:2772',</code><br /><code>    disableHostPrefix: true</code><br /><code>});</code></p><p><code>app.get("/", async (_, res) =&gt; {</code><br /><code>    try {</code><br /><code>        console.time('latency')</code><br /><code>        const evaluation = await evidently.evaluateFeature({</code><br /><code>            project: 'WebPage',</code><br /><code>            feature: 'SearchBar',</code><br /><code>            entityId: 'WebPageVisitor43'</code><br /><code>        })</code><br /><code>        console.timeEnd('latency')</code><br /><code>        res.send(evaluation.variation)</code><br /><code>    } catch (err: any) {</code><br /><code>        console.timeEnd('latency')</code><br /><code>        res.send(err.toString())</code><br /><code>    }</code><br /><code>});</code></p>

The container application will invoke the EvaluateFeature API using the AWS SDK for Javascript and return the search bar variation, either the old or new search bar. Here we also log the latency of the operation. The EvaluateFeature request is forwarded to the endpoint we configure for the Evidently client: http://localhost:2772. This is the local address where the AWS AppConfig agent can be reached. To make this possible, we add the AWS AppConfig agent as a container to the Amazon ECS task definition:

// index.ts

service.taskDefinition.addContainer('AppConfigAgent', {
    image: ecs.ContainerImage.fromRegistry('public.ecr.aws/aws-appconfig/aws-appconfig-agent:2.x'),
    portMappings: [{
        containerPort: 2772
    }]
})

We also need to set up an AppConfig environment for the Evidently project. This tells Evidently where to create the configuration to keep a synchronized copy of the features in the project:

// index.ts

const application = new appconfig.CfnApplication(this,'AppConfigApplication', {
    name: 'MyApplication'
});

const environment = new appconfig.CfnEnvironment(this, 'AppConfigEnvironment', {
    applicationId: application.ref,
    name: 'MyEnvironment'
});

const project = new evidently.CfnProject(this, 'EvidentlyProject', {
    name: 'WebPage',
    appConfigResource: {
        applicationId: application.ref,
        environmentId: environment.ref
    }
});

Finally, we set up an Evidently feature and launch that ensures only 10 percent of traffic receives the new search bar:

// index.ts

const launch = new evidently.CfnLaunch(this, 'EvidentlyLaunch', {
  project: project.name,
  name: 'MyLaunch',
  executionStatus: {
    status: 'START'
  },
  groups: [
    {
      feature: feature.name,
      variation: OLD_SEARCH_BAR,
      groupName: OLD_SEARCH_BAR
    },
    {
      feature: feature.name,
      variation: NEW_SEARCH_BAR,
      groupName: NEW_SEARCH_BAR
    }
  ],
  scheduledSplitsConfig: [{
    startTime: '2022-01-01T00:00:00Z',
    groupWeights: [
      {
        groupName: OLD_SEARCH_BAR,
        splitWeight: 90000
      },
      {
        groupName: NEW_SEARCH_BAR,
        splitWeight: 10000
      }
    ]
  }]
})

We start the launch immediately by setting executionStatus to START and startTime to a timestamp in the past. If you want to wait to show the new search bar, we can specify a future start time.

Install dependencies

Install the necessary Node modules:

npm install

Build and deploy

Build the AWS CDK template from the source code:

npm run build

Before deploying the app:

  1. Ensure that you set up AWS credentials in your environment.
  2. The AWS CDK Toolkit is bootstrapped in your AWS account.
  3. Confirm the max number of VPCs has not been reached in your AWS account; the Amazon ECS service will deploy an Amazon VPC.

After that, you can deploy the AWS CDK template to your AWS account:

cdk deploy

Test the webpage

After the previous step, you should see the following output in your console:

Console output showing a successful CDK deployment

Figure 3. Console output showing a successful AWS CDK deployment

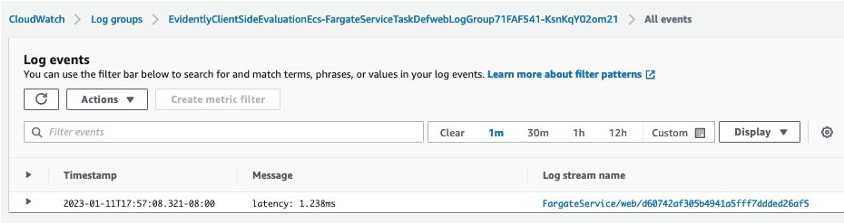
In your browser, visit the URL specified by the FargateServiceServiceURL output above and you will see oldSearchBar. We can visit our CloudWatch Logs from the Amazon ECS task to see our application logs. Go to the AWS console and visit the CloudWatch log groups page and visit the log group with the prefix EvidentlyClientSideEvaluationEcs. There, we can see that fetching feature flags took under two milliseconds, as in Figure 4.

CloudWatch Logs for the Amazon ECS task showing an EvaluateFeature latency of 1.238 milliseconds

Figure 4. CloudWatch Logs for the Amazon ECS task showing an EvaluateFeature latency of 1.238 milliseconds

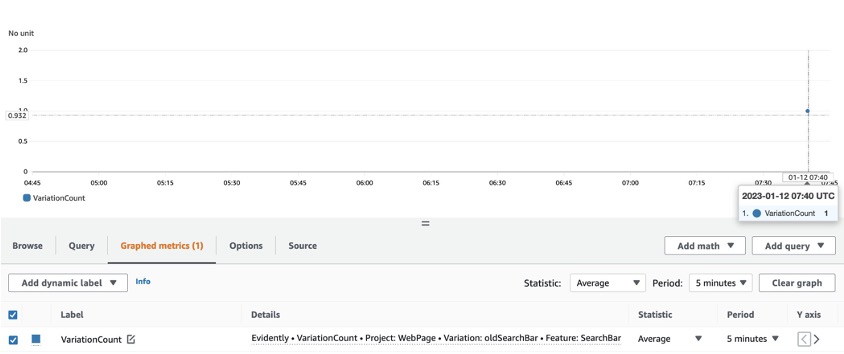
Additionally, we can see how visitors have seen each version of the search bar. On the AWS console, visit the CloudWatch metrics page and see the Evidently metrics under All > Evidently > Feature, Project, Variation, as in Figure 5:

CloudWatch metrics showing the VariationCount: the number of times each feature flag variation was fetched

Figure 5. CloudWatch metrics showing the VariationCount (the number of times each feature flag variation was fetched)

We can increase or decrease the percentage of visitors seeing the new search bar at any time. On the AWS console, go to the CloudWatch Evidently page and go to Projects > WebPage > Launches > MyLaunch > Modify launch traffic and adjust the Traffic percentage, as in Figure 6.

Adjusting the traffic percentage of an Evidently launch

Figure 6. Adjusting the traffic percentage of an Evidently launch

Cleaning up

To avoid incurring future charges, delete the resources. Let’s run:

cdk destroy

You can confirm the removal by going into CloudFormation and confirming the resources were deleted.

Conclusion

In this blog post, we learned how to set up a web page backend in Amazon ECS with client-side evaluation for Amazon CloudWatch Evidently. We easily deployed the example CloudFormation stack with AWS CDK Toolkit. Then we visited the example webpage and demonstrated the improved speed of fetching feature flags with client-side evaluation. If you’re interested in using client-side evaluation with AWS Lambda instead of Amazon ECS, check out this AWS CDK example.

Patterns for enterprise data sharing at scale

Post Syndicated from Venkata Sistla original https://aws.amazon.com/blogs/big-data/patterns-for-enterprise-data-sharing-at-scale/

Data sharing is becoming an important element of an enterprise data strategy. AWS services like AWS Data Exchange provide an avenue for companies to share or monetize their value-added data with other companies. Some organizations would like to have a data sharing platform where they can establish a collaborative and strategic approach to exchange data with a restricted group of companies in a closed, secure, and exclusive environment. For example, financial services companies and their auditors, or manufacturing companies and their supply chain partners. This fosters development of new products and services and helps improve their operational efficiency.

Data sharing is a team effort, it’s important to note that in addition to establishing the right infrastructure, successful data sharing also requires organizations to ensure that business owners sponsor data sharing initiatives. They also need to ensure that data is of high quality. Data platform owners and security teams should encourage proper data use and fix any privacy and confidentiality issues.

This blog discusses various data sharing options and common architecture patterns that organizations can adopt to set up their data sharing infrastructure based on AWS service availability and data compliance.

Data sharing options and data classification types

Organizations operate across a spectrum of security compliance constraints. For some organizations, it’s possible to use AWS services like AWS Data Exchange. However, organizations working in heavily regulated industries like federal agencies or financial services might be limited by the allow listed AWS service options. For example, if an organization is required to operate in a Fedramp Medium or Fedramp High environment, their options to share data may be limited by the AWS services that are available and have been allow listed. Service availability is based on platform certification by AWS, and allow listing is based on the organizations defining their security compliance architecture and guidelines.

The kind of data that the organization wants to share with its partners may also have an impact on the method used for data sharing. Complying with data classification rules may further limit their choice of data sharing options they may choose.

The following are some general data classification types:

  • Public data – Important information, though often freely available for people to read, research, review and store. It typically has the lowest level of data classification and security.
  • Private data – Information you might want to keep private like email inboxes, cell phone content, employee identification numbers, or employee addresses. If private data were shared, destroyed, or altered, it might pose a slight risk to an individual or the organization.
  • Confidential or restricted data – A limited group of individuals or parties can access sensitive information often requiring special clearance or special authorization. Confidential or restricted data access might involve aspects of identity and authorization management. Examples of confidential data include Social Security numbers and vehicle identification numbers.

The following is a sample decision tree that you can refer to when choosing your data sharing option based on service availability, classification type, and data format (structured or unstructured). Other factors like usability, multi-partner accessibility, data size, consumption patterns like bulk load/API access, and more may also affect the choice of data sharing pattern.

decisiontree

In the following sections, we discuss each pattern in more detail.

Pattern 1: Using AWS Data Exchange

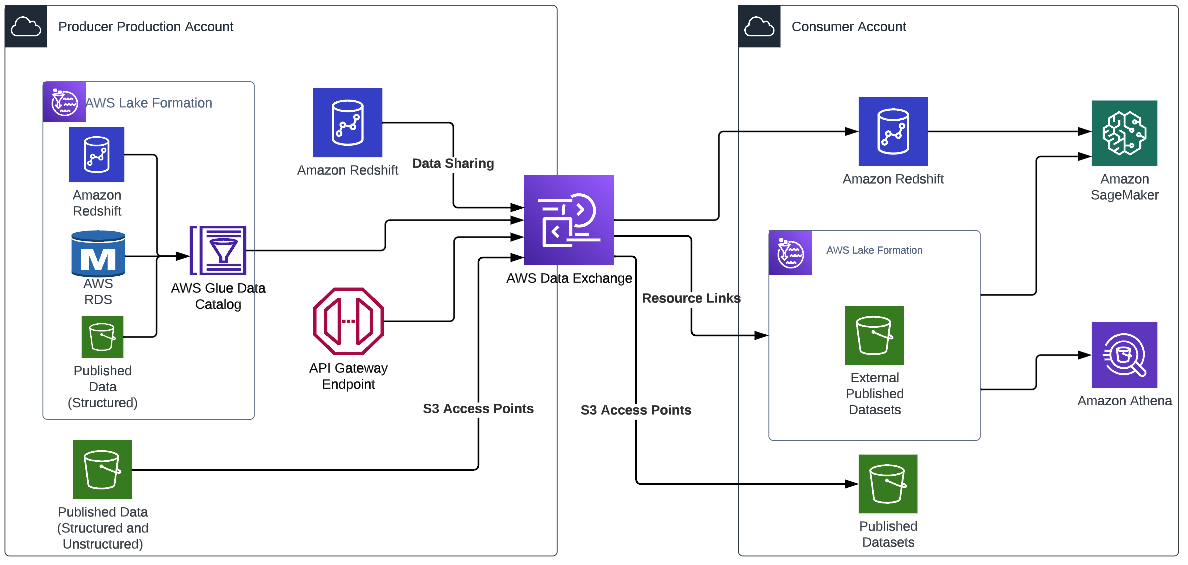
AWS Data Exchange makes exchanging data easier, helping organizations lower costs, become more agile, and innovate faster. Organizations can choose to share data privately using AWS Data Exchange with their external partners. AWS Data Exchange offers perimeter controls that are applied at identity and resource levels. These controls decide which external identities have access to specific data resources. AWS Data Exchange provides multiple different patterns for external parties to access data, such as the following:

The following diagram illustrates an example architecture.

pattern1

With AWS Data Exchange, once the dataset to share (or sell) is configured, AWS Data Exchange automatically manages entitlements (and billing) between the producer and the consumer. The producer doesn’t have to manage policies, set up new access points, or create new Amazon Redshift data shares for each consumer, and access is automatically revoked if the subscription ends. This can significantly reduce the operational overhead in sharing data.

Pattern 2: Using AWS Lake Formation for centralized access management

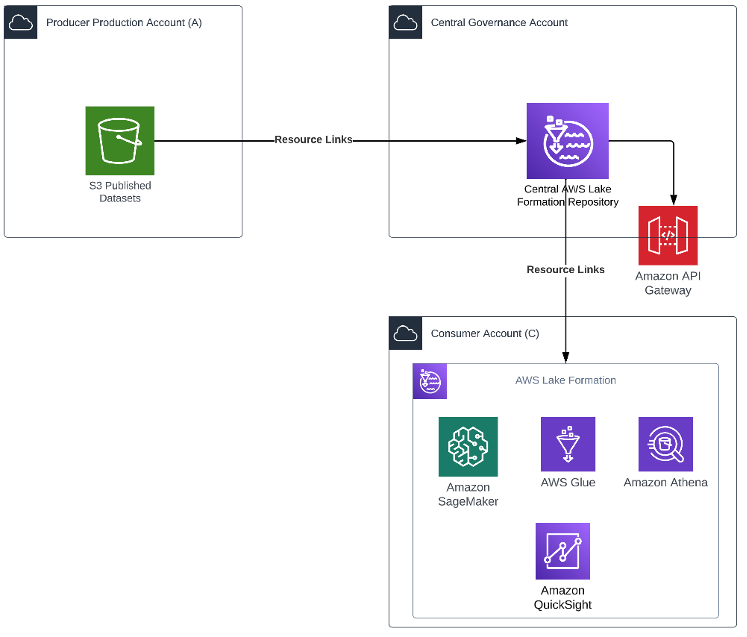
You can use this pattern in cases where both the producer and consumer are on the AWS platform with an AWS account that is enabled to use AWS Lake Formation. This pattern provides a no-code approach to data sharing. The following diagram illustrates an example architecture.

pattern2

In this pattern, the central governance account has Lake Formation configured for managing access across the producer’s org accounts. Resource links from the production account Amazon Simple Storage Service (Amazon S3) bucket are created in Lake Formation. The producer grants Lake Formation permissions on an AWS Glue Data Catalog resource to an external account, or directly to an AWS Identity and Access Management (IAM) principal in another account. Lake Formation uses AWS Resource Access Manager (AWS RAM) to share the resource. If the grantee account is in the same organization as the grantor account, the shared resource is available immediately to the grantee. If the grantee account is not in the same organization, AWS RAM sends an invitation to the grantee account to accept or reject the resource grant. To make the shared resource available, the consumer administrator in the grantee account must use the AWS RAM console or AWS Command Line Interface (AWS CLI) to accept the invitation.

Authorized principals can share resources explicitly with an IAM principal in an external account. This feature is useful when the producer wants to have control over who in the external account can access the resources. The permissions the IAM principal receives are a union of direct grants and the account-level grants that are cascaded down to the principals. The data lake administrator of the recipient account can view the direct cross-account grants, but can’t revoke permissions.

Pattern 3: Using AWS Lake Formation from the producer external sharing account

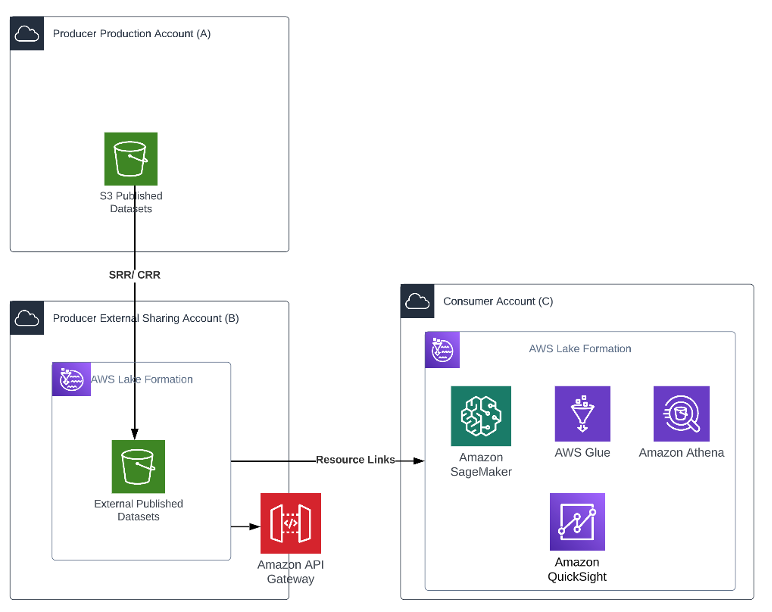
The producer may have stringent security requirements where no external consumer should access their production account or their centralized governance account. They may also not have Lake Formation enabled on their production platform. In such cases, as shown in the following diagram, the producer production account (Account A) is dedicated to its internal organization users. The producer creates another account, the producer external sharing account (Account B), which is dedicated for external sharing. This gives the producer more latitude to create specific policies for specific organizations.

The following architecture diagram shows an overview of the pattern.

pattern3

The producer implements a process to create an asynchronous copy of data in Account B. The bucket can be configured for Same Region Replication (SRR) or Cross Region Replication (CRR) for objects that need to be shared. This facilitates automated refresh of data to the external account to the “External Published Datasets” S3 bucket without having to write any code.

Creating a copy of the data allows the producer to add another degree of separation between the external consumer and its production data. It also helps meet any compliance or data sovereignty requirements.

Lake Formation is set up on Account B, and the administrator creates resources links for the “External Published Datasets” S3 bucket in its account to grant access. The administrator follows the same process to grant access as described earlier.

Pattern 4: Using Amazon Redshift data sharing

This pattern is ideally suited for a producer who has most of their published data products on Amazon Redshift. This pattern also requires the producer’s external sharing account (Account B) and the consumer account (Account C) to have an encrypted Amazon Redshift cluster or Amazon Redshift Serverless endpoint that meets the prerequisites for Amazon Redshift data sharing.

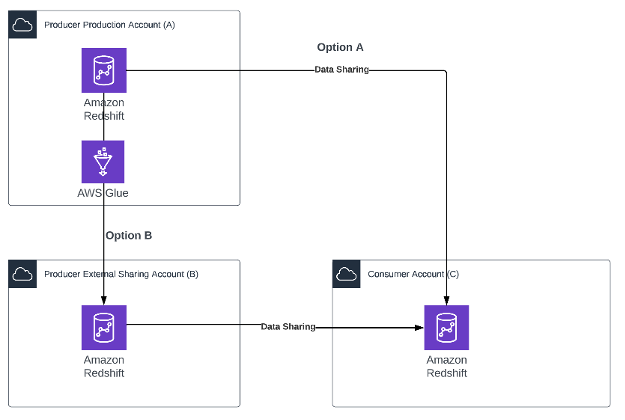
The following architecture diagram shows an overview of the pattern.

pattern4

Two options are possible depending on the producer’s compliance constraints:

  • Option A – The producer enables data sharing directly on the production Amazon Redshift cluster.
  • Option B – The producer may have constraints with respect to sharing the production cluster. The producer creates a simple AWS Glue job that copies data from the Amazon Redshift cluster in the production Account A to the Amazon Redshift cluster in the external Account B. This AWS Glue job can be scheduled to refresh data as needed by the consumer. When the data is available in Account B, the producer can create multiple views and multiple data shares as needed.

In both options, the producer maintains complete control over what data is being shared, and the consumer admin maintains full control over who can access the data within their organization.

After both the producer and consumer admins approve the data sharing request, the consumer user can access this data as if it were part of their own account without have to write any additional code.

Pattern 5: Sharing data securely and privately using APIs

You can adopt this pattern when the external partner doesn’t have a presence on AWS. You can also use this pattern when published data products are spread across various services like Amazon S3, Amazon Redshift, Amazon DynamoDB, and Amazon OpenSearch Service but the producer would like to maintain a single data sharing interface.

Here’s an example use case: Company A would like to share some of its log data in near-real time with its partner Company B, who uses this data to generate predictive insights for Company A. Company A stores this data in Amazon Redshift. The company wants to share this transactional information with its partner after masking the personally identifiable information (PII) in a cost-effective and secure way to generate insights. Company B doesn’t use the AWS platform.

Company A establishes a microbatch process using an AWS Lambda function or AWS Glue that queries Amazon Redshift to get incremental log data, applies the rules to redact the PII, and loads this data to the “Published Datasets” S3 bucket. This instantiates an SRR/CRR process that refreshes this data in the “External Sharing” S3 bucket.

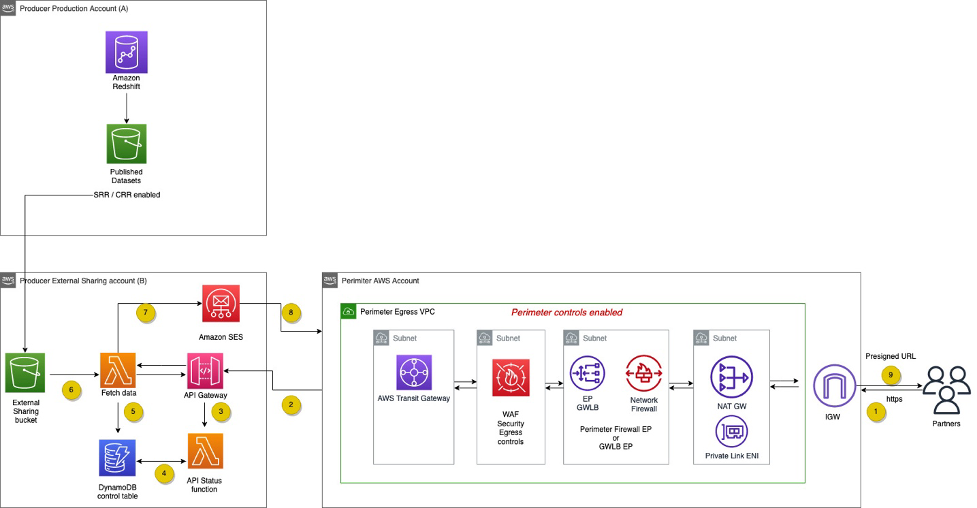
The following diagram shows how the consumer can then use an API-based approach to access this data.

pattern5

The workflow contains the following steps:

  1. An HTTPS API request is sent from the API consumer to the API proxy layer.
  2. The HTTPS API request is forwarded from the API proxy to Amazon API Gateway in the external sharing AWS account.
  3. Amazon API Gateway calls the request receiver Lambda function.
  4. The request receiver function writes the status to a DynamoDB control table.
  5. A second Lambda function, the poller, checks the status of the results in the DynamoDB table.
  6. The poller function fetches results from Amazon S3.
  7. The poller function sends a presigned URL to download the file from the S3 bucket to the requestor via Amazon Simple Email Service (Amazon SES).
  8. The requestor downloads the file using the URL.
  9. The network perimeter AWS account only allows egress internet connection.
  10. The API proxy layer enforces both the egress security controls and perimeter firewall before the traffic leaves the producer’s network perimeter.
  11. The AWS Transit Gateway security egress VPC routing table only allows connectivity from the required producer’s subnet, while preventing internet access.

Pattern 6: Using Amazon S3 access points

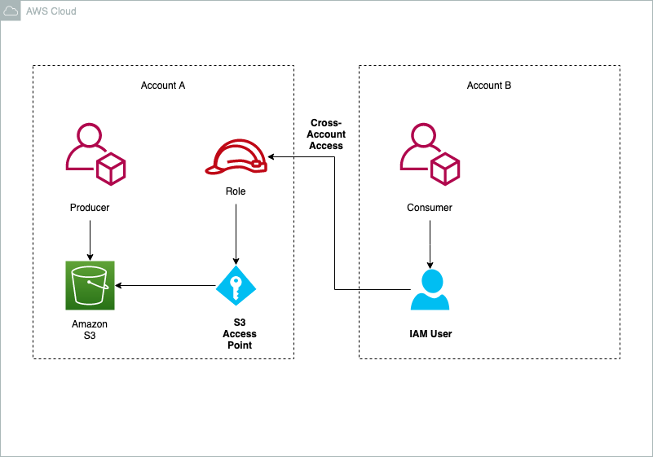
Data scientists may need to work collaboratively on image, videos, and text documents. Legal and audit groups may want to share reports and statements with the auditing agencies. This pattern discusses an approach to sharing such documents. The pattern assumes that the external partners are also on AWS. Amazon S3 access points allow the producer to share access with their consumer by setting up cross-account access without having to edit bucket policies.

Access points are named network endpoints that are attached to buckets that you can use to perform S3 object operations, such as GetObject and PutObject. Each access point has distinct permissions and network controls that Amazon S3 applies for any request that is made through that access point. Each access point enforces a customized access point policy that works in conjunction with the bucket policy attached to the underlying bucket.

The following architecture diagram shows an overview of the pattern.

pattern6

The producer creates an S3 bucket and enables the use of access points. As part of the configuration, the producer specifies the consumer account, IAM role, and privileges for the consumer IAM role.

The consumer users with the IAM role in the consumer account can access the S3 bucket via the internet or restricted to an Amazon VPC via VPC endpoints and AWS PrivateLink.

Conclusion

Each organization has its unique set of constraints and requirements that it needs to fulfill to set up an efficient data sharing solution. In this post, we demonstrated various options and best practices available to organizations. The data platform owner and security team should work together to assess what works best for your specific situation. Your AWS account team is also available to help.

Related resources

For more information on related topics, refer to the following:


About the Authors


Venkata Sistla
is a Cloud Architect – Data & Analytics at AWS. He specializes in building data processing capabilities and helping customers remove constraints that prevent them from leveraging their data to develop business insights.

Santosh Chiplunkar is a Principal Resident Architect at AWS. He has over 20 years of experience helping customers solve their data challenges. He helps customers develop their data and analytics strategy and provides them with guidance on how to make it a reality.
AWS Melbourne Region has achieved HCF Strategic Certification

Post Syndicated from Lori Klaassen original https://aws.amazon.com/blogs/security/aws-melbourne-region-has-achieved-hcf-strategic-certification/

Amazon Web Services (AWS) is delighted to confirm that our new AWS Melbourne Region has achieved Strategic Certification for the Australian Government’s Hosting Certification Framework (HCF).

We know that maintaining security and resiliency to keep critical data and infrastructure safe is a top priority for the Australian Government and all our customers in Australia. The Strategic Certification of both the existing Sydney and the new Melbourne Regions reinforces our ongoing commitment to meet security expectations for cloud service providers and means Australian citizens can now have even greater confidence that the Government is securing their data.

The HCF provides guidance to government customers to identify cloud providers that meet enhanced privacy, sovereignty, and security requirements. The expanded scope of the AWS HCF Strategic Certification gives Australian Government customers additional architectural options, including the ability to store backup data in geographically separated locations within Australia.

Our AWS infrastructure is custom-built for the cloud and designed to meet the most stringent security requirements in the world, and is monitored 24/7 to help support the confidentiality, integrity, and availability of customers’ data. All data flowing across the AWS global network that interconnects our data centers and Regions is automatically encrypted at the physical layer before it leaves our secured facilities. We will continue to expand the scope of our security assurance programs at AWS and are pleased that Australian Government customers can continue to innovate at a rapid pace and be confident AWS meets the Government’s requirements to support the secure management of government systems and data.

The Melbourne Region was officially added to the AWS HCF Strategic Certification on December 21, 2022, and the Sydney Region was certified in October 2021. AWS compliance status is available on the HCF Certified Service Providers website, and the Certificate of Compliance is available through AWS Artifact. AWS Artifact is a self-service portal for on-demand access to AWS compliance reports. Sign in to AWS Artifact in the AWS Management Console, or learn more at Getting Started with AWS Artifact. AWS has also achieved many international certifications and accreditations, demonstrating compliance with third-party assurance frameworks such as ISO 27017 for cloud security, ISO 27018 for cloud privacy, and SOC 1, SOC 2, and SOC 3.

To learn more about our compliance and security programs, see AWS Compliance Programs. As always, we value your feedback and questions; reach out to the AWS Compliance team through the Contact Us page.

Please reach out to your AWS account team if you have questions or feedback about HCF compliance.

If you have feedback about this post, submit comments in the Comments section below.

Want more AWS Security how-to content, news, and feature announcements? Follow us on Twitter.

Lori Klaassen

Lori Klaassen

Lori is a Senior Regulatory Specialist on the AWS Security Assurance team. She supports the operationalisation and ongoing assurance of direct regulatory oversight programs in ANZ.

TP-Link TL-SH1832 Review Cheapest 24x 2.5GbE and 8x 10GbE Switch with a Catch

Post Syndicated from Rohit Kumar original https://www.servethehome.com/tp-link-tl-sh1832-review-cheapest-24x-2-5gbe-and-8x-10gbe-switch-with-a-catch/

In our TP-Link TL-SH1832 review, we see why this is both the cheapest fanless 24-port 2.5GbE and 8x SFP+ 10GbE switch, and also frustrating

The post TP-Link TL-SH1832 Review Cheapest 24x 2.5GbE and 8x 10GbE Switch with a Catch appeared first on ServeTheHome.

AWS Week in Review – February 27, 2023

Post Syndicated from Antje Barth original https://aws.amazon.com/blogs/aws/aws-week-in-review-february-27-2023/

A couple days ago, I had the honor of doing a live stream on generative AI, discussing recent innovations and concepts behind the current generation of large language and vision models and how we got there. In today’s roundup of news and announcements, I will share some additional information—including an expanded partnership to make generative AI more accessible, a blog post about diffusion models, and our weekly Twitch show on Generative AI. Let’s dive right into it!

Last Week’s Launches
Here are some launches that got my attention during the previous week:

Integrated Private Wireless on AWS – The Integrated Private Wireless on AWS program is designed to provide enterprises with managed and validated private wireless offerings from leading communications service providers (CSPs). The offerings integrate CSPs’ private 5G and 4G LTE wireless networks with AWS services across AWS Regions, AWS Local Zones, AWS Outposts, and AWS Snow Family. For more details, read this Industries Blog post and check out this eBook. And, if you’re attending the Mobile World Congress Barcelona this week, stop by the AWS booth at the Upper Walkway, South Entrance, at the Fira Barcelona Gran Via, to learn more.

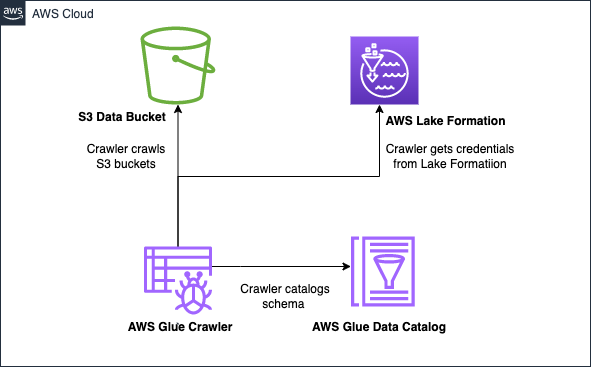
AWS Glue Crawlers – Now integrate with Lake Formation. AWS Glue Crawlers are used to discover datasets, extract schema information, and populate the AWS Glue Data Catalog. With this Glue Crawler and Lake Formation integration, you can configure a crawler to use Lake Formation permissions to access an S3 data store or a Data Catalog table with an underlying S3 location within the same AWS account or another AWS account. You can configure an existing Data Catalog table as a crawler’s target if the crawler and the Data Catalog table reside in the same account. To learn more, check out this Big Data Blog post.

AWS Glue Crawlers now support integration with AWS Lake Formation

Amazon SageMaker Model Monitor – You can now launch and configure Amazon SageMaker Model Monitor from the SageMaker Model Dashboard using a code-free point-and-click setup experience. SageMaker Model Dashboard gives you unified monitoring across all your models by providing insights into deviations from expected behavior, automated alerts, and troubleshooting to improve model performance. Model Monitor can detect drift in data quality, model quality, bias, and feature attribution and alert you to take remedial actions when such changes occur.

Amazon EKS – Now supports Kubernetes version 1.25. Kubernetes 1.25 introduced several new features and bug fixes, and you can now use Amazon EKS and Amazon EKS Distro to run Kubernetes version 1.25. You can create new 1.25 clusters or upgrade your existing clusters to 1.25 using the Amazon EKS console, the eksctl command line interface, or through an infrastructure-as-code tool. To learn more about this release named “Combiner,” check out this Containers Blog post.

Amazon Detective – New self-paced workshop available. You can now learn to use Amazon Detective with a new self-paced workshop in AWS Workshop Studio. AWS Workshop Studio is a collection of self-paced tutorials designed to teach practical skills and techniques to solve business problems. The Amazon Detective workshop is designed to teach you how to use the primary features of Detective through a series of interactive modules that cover topics such as security alert triage, security incident investigation, and threat hunting. Get started with the Amazon Detective Workshop.

For a full list of AWS announcements, be sure to keep an eye on the What’s New at AWS page.

Other AWS News
Here are some additional news items and blog posts that you may find interesting:

🤗❤☁ AWS and Hugging Face collaborate to make generative AI more accessible and cost-efficient – This previous week, we announced an expanded collaboration between AWS and Hugging Face to accelerate the training, fine-tuning, and deployment of large language and vision models used to create generative AI applications. Generative AI applications can perform a variety of tasks, including text summarization, answering questions, code generation, image creation, and writing essays and articles. For more details, read this Machine Learning Blog post.

If you are interested in generative AI, I also recommend reading this blog post on how to Fine-tune text-to-image Stable Diffusion models with Amazon SageMaker JumpStart. Stable Diffusion is a deep learning model that allows you to generate realistic, high-quality images and stunning art in just a few seconds. This blog post discusses how to make design choices, including dataset quality, size of training dataset, choice of hyperparameter values, and applicability to multiple datasets.

AWS open-source news and updates – My colleague Ricardo writes this weekly open-source newsletter in which he highlights new open-source projects, tools, and demos from the AWS Community. Read edition #146 here.

Upcoming AWS Events
Check your calendars and sign up for these AWS events:

Build On AWS - Generative AI#BuildOn Generative AI – Join our weekly live Build On Generative AI Twitch show. Every Monday morning, 9:00 US PT, my colleagues Emily and Darko take a look at aspects of generative AI. They host developers, scientists, startup founders, and AI leaders and discuss how to build generative AI applications on AWS.

In today’s episode, my colleague Chris walked us through an end-to-end ML pipeline from data ingestion to fine-tuning and deployment of generative AI models. You can watch the video here.

AWS Pi Day 2023 SmallAWS Pi Day – Join me on March 14 for the third annual AWS Pi Day live, virtual event hosted on the AWS On Air channel on Twitch as we celebrate the 17th birthday of Amazon S3 and the cloud.

We will discuss the latest innovations across AWS Data services, from storage to analytics and AI/ML. If you are curious about how AI can transform your business, register here and join my session.

AWS Innovate Data and AI/ML edition – AWS Innovate is a free online event to learn the latest from AWS experts and get step-by-step guidance on using AI/ML to drive fast, efficient, and measurable results. Register now for EMEA (March 9) and the Americas (March 14).

You can browse all upcoming AWS-led in-person, virtual events and developer focused events such as Community Days.

That’s all for this week. Check back next Monday for another Week in Review!

— Antje

This post is part of our Week in Review series. Check back each week for a quick roundup of interesting news and announcements from AWS!

A Linux-on-M1 update

Post Syndicated from original https://lwn.net/Articles/924557/

The Asahi Linux project has posted an
update and reality check
on the status of Linux support for Apple’s M1
hardware.

We are continuously upstreaming kernel features, and 6.2 notably
adds device trees and basic boot support for M1 Pro/Max/Ultra
machines.
However, there is still a long road before upstream kernels are
usable on laptops. There is no trackpad/keyboard support upstream
yet.

While you can boot an upstream 6.2 kernel on desktops (M1 Mac Mini,
M1 Max/Ultra Mac Studio) and do useful things with it, that is only
the case for 16K page size kernel builds.

No generic ARM64 distro ships 16K kernels today, to our knowledge.

[$] Red-black trees for BPF programs

Post Syndicated from original https://lwn.net/Articles/924128/

Most of the kernel’s code is written in C and intended to be run directly
on the underlying hardware. That situation is changing in a few ways,
though; one of those is the ability to write kernel code for the BPF
virtual machine. The 6.3 kernel release will include a new API making the red-black tree data structure available to BPF
programs. Beyond being an interesting feature in its own right, this new
API shows how BPF is bringing a different approach to kernel programming —
and to the C language in general.

Security updates for Monday

Post Syndicated from original https://lwn.net/Articles/924546/

Security updates have been issued by Debian (apr-util, freeradius, mono, nodejs, php7.3, php7.4, and python-cryptography), Fedora (epiphany, haproxy, and podman), SUSE (chromium, libraw, php7, php74, python-pip, and rubygem-activerecord-4_2), and Ubuntu (apr, clamav, curl, intel-microcode, nss, openvswitch, webkit2gtk, and zoneminder).

Banning TikTok

Post Syndicated from Bruce Schneier original https://www.schneier.com/blog/archives/2023/02/banning-tiktok.html

Congress is currently debating bills that would ban TikTok in the United States. We are here as technologists to tell you that this is a terrible idea and the side effects would be intolerable. Details matter. There are several ways Congress might ban TikTok, each with different efficacies and side effects. In the end, all the effective ones would destroy the free Internet as we know it.

There’s no doubt that TikTok and ByteDance, the company that owns it, are shady. They, like most large corporations in China, operate at the pleasure of the Chinese government. They collect extreme levels of information about users. But they’re not alone: Many apps you use do the same, including Facebook and Instagram, along with seemingly innocuous apps that have no need for the data. Your data is bought and sold by data brokers you’ve never heard of who have few scruples about where the data ends up. They have digital dossiers on most people in the United States.

If we want to address the real problem, we need to enact serious privacy laws, not security theater, to stop our data from being collected, analyzed, and sold—by anyone. Such laws would protect us in the long term, and not just from the app of the week. They would also prevent data breaches and ransomware attacks from spilling our data out into the digital underworld, including hacker message boards and chat servers, hostile state actors, and outside hacker groups. And, most importantly, they would be compatible with our bedrock values of free speech and commerce, which Congress’s current strategies are not.

At best, the TikTok ban considered by Congress would be ineffective; at worst, a ban would force us to either adopt China’s censorship technology or create our own equivalent. The simplest approach, advocated by some in Congress, would be to ban the TikTok app from the Apple and Google app stores. This would immediately stop new updates for current users and prevent new users from signing up. To be clear, this would not reach into phones and remove the app. Nor would it prevent Americans from installing TikTok on their phones; they would still be able to get it from sites outside of the United States. Android users have long been able to use alternative app repositories. Apple maintains a tighter control over what apps are allowed on its phones, so users would have to “jailbreak”—or manually remove restrictions from—their devices to install TikTok.

Even if app access were no longer an option, TikTok would still be available more broadly. It is currently, and would still be, accessible from browsers, whether on a phone or a laptop. As long as the TikTok website is hosted on servers outside of the United States, the ban would not affect browser access.

Alternatively, Congress might take a financial approach and ban US companies from doing business with ByteDance. Then-President Donald Trump tried this in 2020, but it was blocked by the courts and rescinded by President Joe Biden a year later. This would shut off access to TikTok in app stores and also cut ByteDance off from the resources it needs to run TikTok. US cloud-computing and content-distribution networks would no longer distribute TikTok videos, collect user data, or run analytics. US advertisers—and this is critical—could no longer fork over dollars to ByteDance in the hopes of getting a few seconds of a user’s attention. TikTok, for all practical purposes, would cease to be a business in the United States.

But Americans would still be able to access TikTok through the loopholes discussed above. And they will: TikTok is one of the most popular apps ever made; about 70% of young people use it. There would be enormous demand for workarounds. ByteDance could choose to move its US-centric services right over the border to Canada, still within reach of American users. Videos would load slightly slower, but for today’s TikTok users, it would probably be acceptable. Without US advertisers ByteDance wouldn’t make much money, but it has operated at a loss for many years, so this wouldn’t be its death knell.

Finally, an even more restrictive approach Congress might take is actually the most dangerous: dangerous to Americans, not to TikTok. Congress might ban the use of TikTok by anyone in the United States. The Trump executive order would likely have had this effect, were it allowed to take effect. It required that US companies not engage in any sort of transaction with TikTok and prohibited circumventing the ban. . If the same restrictions were enacted by Congress instead, such a policy would leave business or technical implementation details to US companies, enforced through a variety of law enforcement agencies.

This would be an enormous change in how the Internet works in the United States. Unlike authoritarian states such as China, the US has a free, uncensored Internet. We have no technical ability to ban sites the government doesn’t like. Ironically, a blanket ban on the use of TikTok would necessitate a national firewall, like the one China currently has, to spy on and censor Americans’ access to the Internet. Or, at the least, authoritarian government powers like India’s, which could force Internet service providers to censor Internet traffic. Worse still, the main vendors of this censorship technology are in those authoritarian states. China, for example, sells its firewall technology to other censorship-loving autocracies such as Iran and Cuba.

All of these proposed solutions raise constitutional issues as well. The First Amendment protects speech and assembly. For example, the recently introduced Buck-Hawley bill, which instructs the president to use emergency powers to ban TikTok, might threaten separation of powers and may be relying on the same mechanisms used by Trump and stopped by the court. (Those specific emergency powers, provided by the International Emergency Economic Powers Act, have a specific exemption for communications services.) And individual states trying to beat Congress to the punch in regulating TikTok or social media generally might violate the Constitution’s Commerce Clause—which restricts individual states from regulating interstate commerce—in doing so.

Right now, there’s nothing to stop Americans’ data from ending up overseas. We’ve seen plenty of instances—from Zoom to Clubhouse to others—where data about Americans collected by US companies ends up in China, not by accident but because of how those companies managed their data. And the Chinese government regularly steals data from US organizations for its own use: Equifax, Marriott Hotels, and the Office of Personnel Management are examples.

If we want to get serious about protecting national security, we have to get serious about data privacy. Today, data surveillance is the business model of the Internet. Our personal lives have turned into data; it’s not possible to block it at our national borders. Our data has no nationality, no cost to copy, and, currently, little legal protection. Like water, it finds every crack and flows to every low place. TikTok won’t be the last app or service from abroad that becomes popular, and it is distressingly ordinary in terms of how much it spies on us. Personal privacy is now a matter of national security. That needs to be part of any debate about banning TikTok.

This essay was written with Barath Raghavan, and previously appeared in Foreign Policy.

The collective thoughts of the interwebz