Good essay arguing that open-source software is a critical national-security asset and needs to be treated as such:
Open source is at least as important to the economy, public services, and national security as proprietary code, but it lacks the same standards and safeguards. It bears the qualities of a public good and is as indispensable as national highways. Given open source’s value as a public asset, an institutional structure must be built that sustains and secures it.
This is not a novel idea. Open-source code has been called the “roads and bridges” of the current digital infrastructure that warrants the same “focus and funding.” Eric Brewer of Google explicitly called open-source software “critical infrastructure” in a recent keynote at the Open Source Summit in Austin, Texas. Several nations have adopted regulations that recognize open-source projects as significant public assets and central to their most important systems and services. Germany wants to treat open-source software as a public good and launched a sovereign tech fund to support open-source projects “just as much as bridges and roads,” and not just when a bridge collapses. The European Union adopted a formal open-source strategy that encourages it to “explore opportunities for dedicated support services for open source solutions [it] considers critical.”
Designing an institutional framework that would secure open source requires addressing adverse incentives, ensuring efficient resource allocation, and imposing minimum standards. But not all open-source projects are made equal. The first step is to identify which projects warrant this heightened level of scrutiny—projects that are critical to society. CISA defines critical infrastructure as industry sectors “so vital to the United States that [its] incapacity or destruction would have a debilitating impact on our physical or economic security or public health or safety.” Efforts should target the open-source projects that share those features.
This post has been adapted from issue 19 of Hello World magazine, which explored the interaction between technology and sustainability.
We may have had the Coolest Projects livestream, but we are still in awe of the 2092 projects that young people sent in for this year’s online technology showcase! To continue the Coolest Projects Global 2022 celebrations, we’re shining a light on some of the participants and the topics that inspired their projects.
In this year’s showcase, the themes of sustainability and the environment were extremely popular. We received over 300 projects related to the environment from young people all over the world. Games, apps, websites, hardware — we’ve seen so many creative projects that demonstrate how important the environment is to young people.
Here are some of these projects and a glimpse into how kids and teens across the world are using technology to look after their environment.
Using tech to make one simple change
Has anyone ever told you that a small change can lead to a big impact? Check out these two Coolest Projects entries that put this idea into practice with clever inventions to make positive changes to the environment.
Arik (15) from the UK wanted to make something to reduce the waste he noticed at home. Whenever lots of people visited Arik’s house, getting the right drink for everyone was a challenge and often resulted in wasted, spilled drinks. This problem was the inspiration behind Arik’s ‘Liquid Dispenser’ project, which can hold two litres of any desired liquid and has an outer body made from reused cardboard. As Arik says, “You don’t need a plastic bottle, you just need a cup!”
Arik’s project helps you easily select a drink with the press of a button
Amrit (13), Kingston (12), and Henry (12) from Canada were also inspired to make a project to reduce waste. ‘Eco Light’ is a light that automatically turns off when someone leaves their house to avoid wasted electricity. For the project, the team used a micro:bit to detect the signal strength and decide whether the LED should be on (if someone is in the house) or off (if the house is empty).
“We wanted to create something that hopefully would create a meaningful impact on the world.”
Amrit, Kingston, and Henry
Projects for local and global positive change
We love to see young people invent things to have positive changes in the community, on a local and global level.
This year, Sashrika (11) from the US shared her ‘Gas Leak Detector’ project, which she designed to help people who heat their homes with diesel. On the east coast of America, many people store their gas tanks in the basement. This means they may not realise if the gas is leaking. To solve this problem, Sashrika has combined programming with physical computing to make a device that can detect if there is a gas leak and send a notification to your phone.
Sashrika and her gas leak detector
Sashrika’s project has the power to help lots of people and she has even thought about how she would make more changes to her project in the name of sustainability:
“I would probably add a solar panel because there are lots of houses that have outdoor oil tanks. Solar panel[s] will reduce electricity consumption and reduce CO2 emission[s].”
Sashrika
Amr in Syria was also thinking about renewable energy sources when he created his own ‘Smart Wind Turbine’.
The ‘Smart Wind Turbine’ is connected to a micro:bit to measure the electricity generated by a fan. Amr conducted tests that recorded that more electricity was generated when the turbine faced in the direction of the wind. So Amr made a wind vane to determine the wind’s direction and added another micro:bit to communicate the results to the turbine.
Creating projects for the future
We’ve also seen projects created by young people to make the world a better place for future generations.
Naira and Rhythm from India have designed houses that are suited for people and the planet. They carried out a survey and from their results they created the ‘Net Zero Home’. Naira and Rhythm’s project offers an idea for homes that are comfortable for people of all abilities and ages, while also being sustainable.
“Our future cities will require a lot of homes, this means we will require a lot of materials, energy, water and we will also produce a lot of waste. So we have designed this net zero home as a solution.”
Naira and Rhythm
Andrea (9) and Yuliana (10) from the US have also made something to benefit future generations. The ‘Bee Counter’ project uses sensors and a micro:bit to record bees’ activity around a hive. Through monitoring the bees, the team hope they can see (and then fix) any problems with the hive. Andrea and Yuliana want to maintain the bees’ home to help them continue to have a positive influence on our environment.
Knowledge is power: projects to educate and inspire
Some young creators use Coolest Projects as an opportunity to educate and inspire people to make environmental changes in their own lives.
Sabrina (13) from the UK created her own website, ‘A Guide to Climate Change’. It includes images, text, graphics of the Earth’s temperature change, and suggestions for people to minimise their waste. Sabrina also received the Broadcom Coding with Commitment award for using her skills to provide vital information about the effects of climate change.
Sabrina’s project
Kushal (12) from India wanted to use tech to encourage people to help save the environment. Kushal had no experience of app development before making his ‘Green Steps’ app. He says, “I have created a mobile app to connect like-minded people who want to do something about [the] environment.”
Kushal’s app helps people to upload and save pictures, like content from other users, and access helpful resources
These projects are just some of the incredible ideas we’ve seen young people enter for Coolest Projects this year. It’s clear from the projects submitted that the context of the environment and protecting our planet resonates with so many students, summarised by Sabrina, “Some of us don’t understand how important the earth is to us. And I hope we don’t have to wait until it is gone to realise.”
Check out the Coolest Projects showcase for even more projects about the environment, alongside other topics that have inspired young creators.
This year’s AWS re:Inforce conference in Boston has been jam-packed with thrilling speakers, deep insights on all things cloud, and some much-needed in-person collaboration from all walks of the technology community. It also coincides with some exciting announcements from AWS — and we’re honored to be a part of two of them. Here’s a look at how Rapid7 is building on our existing partnership with Amazon Web Services to help organizations securely advance in today’s cloud-native business landscape.
InsightIDR awarded AWS Security Competency
For seven years, AWS has issued security competencies to partners who have a proven track record of helping customers secure their AWS environments. Today at re:Inforce, AWS re-launched their Security Competency program, so that it better aligns with customers’ constantly evolving security challenges. Rapid7 is proud to be included in this re-launch, having obtained a security competency under the new criteria for its InsightIDR solution in the Threat Detection and Response category. This is Rapid7’s second AWS security competency and fourth AWS competency.
This designation recognizes that InsightIDR has demonstrated and successfully met AWS’s technical and quality requirements for providing customers with a deep level of software expertise in security incident and event management (SIEM), helping them achieve their cloud security goals.
InsightIDR integrates with a number of AWS services, including CloudTrail, GuardDuty, S3, VPC Traffic Mirroring, and SQS. InsightIDR’s UEBA feature includes dedicated AWS detections. The Insight Agent can be installed on EC2 instances for continuous monitoring. InsightIDR also features an out-of-the-box honeypot purpose-built for AWS environments. Taken together, these integrations and features give AWS customers the threat detection and response capabilities they need, all in a SaaS solution that can be deployed in a matter of weeks.
Adding another competency to Rapid7’s repertoire reaffirms our commitment to giving organizations the tools they need to innovate securely in a cloud-first world.
Rapid7 named a launch partner for AWS GuardDuty Malware Protection
Malware Protection is the new malware detection capability AWS has added to their GuardDuty service — and we’re honored to join them as a launch partner, with two products that support this new GuardDuty functionality.
GuardDuty is AWS’s threat detection service. It monitors AWS environments for suspicious behavior. Malware Protection introduces a new type of detection capability to GuardDuty. When GuardDuty fires an alert that’s related to an Amazon Elastic Cloud Compute (EC2) instance or a container running on EC2, Malware Protection will automatically run a scan on the instance in question and detect malware using machine learning and threat intelligence. When trojans, worms, rootkits, crypto miners, or other forms of malware are detected, they appear as new findings in GuardDuty, so security teams can take the right remediation actions.
Rapid7 customers can ingest GuardDuty findings (including the new malware detections) into InsightIDR and InsightCloudSec. In InsightIDR, each type of GuardDuty finding can be treated as a notable behavior or as an alert which will automatically trigger a new investigation. This allows security teams to know the instant suspicious activity is detected in their AWS environment and react accordingly. Should an investigation be triggered, teams can use InsightIDR’s native automation capabilities to enrich the data from GuardDuty, quarantine a user, and more. In the case where GuardDuty detects malware, teams can pull additional data from the Insight agent and even terminate malicious processes. In addition, customers can use InsightIDR’s Dashboards capability to keep an eye on GuardDuty and spot trends in the findings.
InsightCloudSec customers can likewise build automated bots that automatically react to GuardDuty findings. When GuardDuty has detected malware, a customer might configure a bot that terminates the infected instance. Alternatively, a customer might choose to reconfigure the instance’s security group to effectively isolate it while the team investigates. The options are practically endless.
Rapid7 and AWS continue to deepen partnership to protect your cloud workloads
AWS re:Inforce 2022 provides a welcome opportunity for the community to come together and share insights about managing and securing cloud environments, and we can’t think of better timing to announce these two areas of partnership with AWS. Click here to learn more about what we’re up to at this year’s AWS re:Inforce conference in Boston.
This post was co-authored by Vadym Dolin, Data Architect at SumUp. In their own words, SumUp is a leading financial technology company, operating across 35 markets on three continents. SumUp helps small businesses be successful by enabling them to accept card payments in-store, in-app, and online, in a simple, secure, and cost-effective way. Today, SumUp card readers and other financial products are used by more than 4 million merchants around the world.
The SumUp Engineering team is committed to developing convenient, impactful, and secure financial products for merchants. To fulfill this vision, SumUp is increasingly investing in artificial intelligence and machine learning (ML). The internal ML platform in SumUp enables teams to seamlessly build, deploy, and operate ML solutions at scale.
One of the central elements of SumUp’s ML platform is the online feature store. It allows multiple ML models to retrieve feature vectors with single-digit millisecond latency, and enables application of AI for latency-critical use cases. The platform processes hundreds of transactions every second, with volume spikes during peak hours, and has steady growth that doubles the number of transactions every year. Because of this, the ML platform requires its low-latency feature store to be also highly reliable and scalable.
In this post, we show how SumUp built a millisecond-latency feature store. We also discuss the architectural considerations when setting up this solution so it can scale to serve multiple use cases, and present results showcasing the setups performance.
Overview of solution
To train ML models, we need historical data. During this phase, data scientists experiment with different features to test which ones produce the best model. From a platform perspective, we need to support bulk read and write operations. Read latency isn’t critical at this stage because the data is read into training jobs. After the models are trained and moved to production for real-time inference, we have the following requirements for the platform change: we need to support low-latency reads and use only the latest features data.
To fulfill these needs, SumUp built a feature store consisting of offline and online data stores. These were optimized for the requirements as described in the following table.
Data Store
History Requirements
ML Workflow Requirements
Latency Requirements
Storage Requirements
Throughput Requirements
Storage Medium
Offline
Entire History
Training
Not important
Cost-effective for large volumes
Bulk read and writes
Amazon S3
Online
Only the latest Features
Inference
Single-digit millisecond
Not important
Read optimized
Amazon Keyspaces
Amazon Keyspaces (for Apache Cassandra) is a serverless, scalable, and managed Apache Cassandra–compatible database service. It is built for consistent, single-digit-millisecond response times at scale. SumUp uses Amazon Keyspaces as a key-value pair store, and these features make it suitable for their online feature store. Delta Lake is an open-source storage layer that supports ACID transactions and is fully compatible with Apache Spark, making it highly performant at bulk read and write operations. You can store Delta Lake tables on Amazon Simple Storage Service (Amazon S3), which makes it a good fit for the offline feature store. Data scientists can use this stack to train models against the offline feature store (Delta Lake). When the trained models are moved to production, we switch to using the online feature store (Amazon Keyspaces), which offers the latest features set, scalable reads, and much lower latency.
Another important consideration is that we write a single feature job to populate both feature stores. Otherwise, SumUp would have to maintain two sets of code or pipelines for each feature creation job. We use Amazon EMR and create the features using PySpark DataFrames. The same DataFrame is written to both Delta Lake and Amazon Keyspaces, which eliminates the hurdle of having separate pipelines.
Finally, SumUp wanted to utilize managed services. It was important to SumUp that data scientists and data engineers focus their efforts on building and deploying ML models. SumUp had experimented with managing their own Cassandra cluster, and found it difficult to scale because it required specialized expertise. Amazon Keyspaces offered scalability without management and maintenance overhead. For running Spark workloads, we decided to use Amazon EMR. Amazon EMR makes it easy to provision new clusters and automatically or manually add and remove capacity as needed. You can also define a custom policy for auto scaling the cluster to suit your needs. Amazon EMR version 6.0.0 and above supports Spark version 3.0.0, which is compatible with Delta Lake.
It took SumUp 3 months from testing out AWS services to building a production-grade feature store capable of serving ML models. In this post we share a simplified version of the stack, consisting of the following components:
S3 bucket A – Stores the raw data
EMR cluster – For running PySpark jobs for populating the feature store
Amazon Keyspaces feature_store – Stores the online features table
S3 Bucket B – Stores the Delta Lake table for offline features
IAM role feature_creator – For running the feature job with the appropriate permissions
Notebook instance – For running the feature engineering code
We use a simplified version of the setup to make it easy to follow the code examples. SumUp data scientists use Jupyter notebooks for exploratory analysis of the data. Feature engineering jobs are deployed using an AWS Step Functions state machine, which consists of an AWS Lambda function that submits a PySpark job to the EMR cluster.
The following diagram illustrates our simplified architecture.
We start by cloning the project git repository, which contains the dataset we need to place in bucket A. We use a synthetic dataset, under Data/daily_dataset.csv. This dataset consists of energy meter readings for households. The file contains information like the number of measures, minimum, maximum, mean, median, sum, and std for each household on a daily basis. To create an S3 bucket (if you don’t already have one) and upload the data file, follow these steps:
Clone the project repository locally by running the shell command:
Give the bucket a name. For this post, we use featurestore-blogpost-bucket-xxxxxxxxxx (it’s helpful to append the account number to the bucket name to ensure the name is unique for common prefixes).
Choose the Region you’re working in. It’s important that you create all resources in the same Region for this post.
Public access is blocked by default, and we recommend that you keep it that way.
Disable bucket versioning and encryption (we don’t need it for this post).
Choose Create bucket.
After the bucket is created, choose the bucket name and drag the folders Dataset and EMR into the bucket.
Set up Amazon Keyspaces
We need to generate credentials for Amazon Keyspaces, which we use to connect with the service. The steps for generating the credentials are as follows:
On the IAM console, choose Users in the navigation pane.
Choose an IAM user you want to generate credentials for.
On the Security credentials tab, under Credentials for Amazon Keyspaces (for Apache Cassandra), choose Generate Credentials. A pop-up appears with the credentials, and an option to download the credentials. We recommend downloading a copy because you won’t be able to view the credentials again.We also need to create a table in Amazon Keyspaces to store our feature data. We have shared the schema for the keyspace and table in the GitHub project files Keyspaces/keyspace.cql and Keyspaces/Table_Schema.cql.
On the Amazon Keyspaces console, choose CQL editor in the navigation pane.
Enter the contents of the file Keyspaces/Keyspace.cql in the editor and choose Run command.
Clear the contents of the editor, enter the contents of Keyspaces/Table_Schema.cql, and choose Run command.
Table creation is an asynchronous process, and you’re notified if the table is successfully created. You can also view it by choosing Tables in the navigation pane.
Set up an EMR cluster
Next, we set up an EMR cluster so we can run PySpark code to generate features. First, we need to set up a trust store password. A truststore file contains the Application Server’s trusted certificates, including public keys for other entities, this file is generated by the provided script and we need to provide a password for protecting this file. Amazon Keyspaces provides encryption in transit and at rest to protect and secure data transmission and storage, and uses Transport Layer Security (TLS) to help secure connections with clients. To connect to Amazon Keyspaces using TLS, we need to download an Amazon digital certificate and configure the Python driver to use TLS. This certificate is stored in a trust store; when we retrieve it, we need to provide the correct password.
In the file EMR/emr_bootstrap_script.sh, update the following line to a password you want to use:
# Create a JKS keystore from the certificate
PASS={your_truststore_password_here}
To point the bootstrap script to the one we uploaded to Amazon S3, update the following line to reflect the S3 bucket we created earlier:
To update the app.config file to reflect the correct trust store password, in the file EMR/app.config, update the value for truststore-password to the value you set earlier:
Next, we create an EMR cluster. The following code snippet is an AWS CLI command that has Hadoop, Spark 3.0, Livy and JupyterHub installed. This also runs the bootstrapping script on the cluster to set up the connection to Amazon Keyspaces.
Create the cluster with the following code. Provide the subnet ID to start a Jupyter notebook instance associated with this cluster, the S3 bucket you created earlier, and the Region you’re working in. You can provide the default Subnet, and to find this navigate to VPC>Subnets and copy the default subnet id.
Lastly, we create an EMR notebook instance to run the PySpark notebook Feature Creation and loading-notebook.ipynb (included in the repo).
On the Amazon EMR console, choose Notebooks in the navigation pane.
Choose Create notebook.
Give the notebook a name and choose the cluster emr_feature_store.
Optionally, configure the additional settings.
Choose Create notebook.It can take a few minutes before the notebook instance is up and running.
When the notebook is ready, select the notebook and choose either Open JupyterLab or Open Jupyter.
In the notebook instance import, open the notebook Feature Creation and loading-notebook.ipynb (included in the repo) and change the kernel to PySpark.
Follow the instructions in the notebook and run the cells one by one to read the data from Amazon S3, create features, and write these to Delta Lake and Amazon Keyspaces.
Performance testing
To test throughput for our online feature store, we run a simulation on the features we created. We simulate approximately 40,000 requests per second. Each request queries data for a specific key (an ID in our feature table). The process tasks do the following:
Initialize a connection to Amazon Keyspaces
Generate a random ID to query the data
Generate a CQL statement:
SELECT * FROM feature_store.energy_data_features WHERE id=[list_of_ids[random_index between 0-5559]];
Start a timer
Send the request to Amazon Keyspaces
Stop the timer when the response from Amazon Keyspaces is received
To run the simulation, we start 245 parallel AWS Fargate tasks running on Amazon Elastic Container Service (Amazon ECS). Each task runs a Python script that makes 1 million requests to Amazon Keyspaces. Because our dataset only contains 5,560 unique IDs, we generate 1 million random numbers between 0–5560 at the start of the simulation and query the ID for each request. To run the simulation, we included the code in the folder Simulation. You can run the simulation in a SageMaker notebook instance by completing the following steps:
On the Amazon SageMaker console, create a SageMaker notebook instance (or use an existing one).You can choose an ml.t3.large instance.
Let SageMaker create an execution role for you if you don’t have one.
Open the SageMaker notebook and choose Upload.
Upload the Simulation folder from the repository. Alternatively, open a terminal window on the notebook instance and clone the repository https://github.com/aws-samples/amazon-keyspaces-emr-featurestore-kit.git.
Follow the instructions and run the steps and cells in the Simulation/ECS_Simulation.ipynb notebook.
On the Amazon ECS console, choose the cluster you provisioned with the notebook and choose the Tasks tab to monitor the tasks.
Each task writes the latency figures to a file and moves this to an S3 location. When the simulation ends, we collect all the data to get aggregated stats and plot charts.
In our setup, we set the capacity mode for Amazon Keyspaces to Provisioned RCU (read capacity units) at 40000 (fixed). After we start the simulation, the RCU rise close to 40000. After we start the simulation, the RCU (read capacity units) rise close to 40000, and the simulation takes around an hour to finish, as illustrated in the following visualization.
The first analysis we present is the latency distribution for the 245 million requests made during the simulation. Here the 99% percentile falls inside single-digit millisecond latency, as we would expect.
Quantile
Latency (ms)
50%
3.11
90%
3.61
99%
5.56
99.90%
25.63
For the second analysis, we present the following time series charts for latency. The chart at the bottom shows the raw latency figures from all the 245 workers. The chart above that plots the average and minimum latency across all workers grouped over 1-second intervals. Here we can see both the minimum and the average latency throughout the simulation stays below 10 milliseconds. The third chart from the bottom plots maximum latency across all workers grouped over 1-second intervals. This chart shows occasional spikes in latency but nothing consistent we need to worry about. The top two charts are latency distributions; the one on the left plots all the data, and the one on the right plots the 99.9% percentile. Due to the presence of some outliers, the chart on the left shows a peak close to zero and a very tailed distribution. After we remove these outliers, we can see in the chart on the right that 99.9% of requests are completed in less than 5.5 milliseconds. This is a great result, considering we sent 245 million requests.
Cleanup
Some of the resources we created in this blogpost would incur costs if left running. Remember to terminate the EMR cluster, empty the S3 bucket and delete it, delete the Amazon KeySpaces table. Also delete the SageMaker and Amazon EMR notebooks. The Amazon ECS cluster is billed on tasks and would not incur any additional costs.
Conclusion
Amazon EMR, Amazon S3, and Amazon Keyspaces provide a flexible and scalable development experience for feature engineering. EMR clusters are easy to manage, and teams can share environments without compromising compute and storage capabilities. EMR bootstrapping makes it easy to install and test out new tools and quickly spin up environments to test out new ideas. Having the feature store split into offline and online store simplifies model training and deployment, and provides performance benefits.
In our testing, Amazon Keyspaces was able to handle peak throughput read requests within our desired requirement of single digit latency. It’s also worth mentioning that we found the on-demand mode to adapt to the usage pattern and an improvement in read/write latency a couple of days from when it was switched on.
Another important consideration to make for latency-sensitive queries is row length. In our testing, tables with lower row length had lower read latency. Therefore, it’s more efficient to split the data into multiple tables and make asynchronous calls to retrieve it from multiple tables.
We encourage you to explore adding security features and adopting security best practices according to your needs and potential company standards.
Shaheer Mansoor is a Data Scientist at AWS. His focus is on building machine learning platforms that can host AI solutions at scale. His interest areas are ML Ops, Feature Stores, Model Hosting and Model Monitoring.
Vadym Dolinin is a Machine Learning Architect in SumUp. He works with several teams on crafting the ML platform, which enables data scientists to build, deploy, and operate machine learning solutions in SumUp. Vadym has 13 years of experience in the domains of data engineering, analytics, BI, and ML.
Oliver Zollikofer is a Data Scientist at AWS. He enables global enterprise customers to build and deploy machine learning models, as well as architect related cloud solutions.
This advisory covers a number of issues identified in Velociraptor and disclosed by a security code review performed by Tim Goddard from CyberCX. We also thank Rhys Jenkins for working with the Velociraptor team to identify and rectify these issues. All of these identified issues have been fixed as of Version 0.6.5-2, released July 26, 2022.
CVE-2022-35629: Velociraptor client ID spoofing
Velociraptor uses client IDs to identify each client uniquely. The client IDs are derived from the client’s own cryptographic key and so usually require this key to be compromised in order to spoof another client.
Due to a bug in the handling of the communication between the client and server, it was possible for one client, already registered with their own client ID, to send messages to the server claiming to come from another client ID. This may allow a malicious client to attribute messages to another victim client ID (for example, claiming the other client contained some indicator or other data).
The impact of this issue is low because a successful exploitation would require:
The malicious client to identify a specific host’s client ID – since client IDs are random, it is unlikely that an attacker could guess a valid client ID. Client IDs are also not present in network communications, so without access to the Velociraptor server, or indeed the host’s Velociraptor client writeback file, it is difficult to discover the client ID.
Each collection of new artifacts from the client contains a unique random “flow ID.” In order to insert new data into a valid collection, the malicious client will need to guess the flow ID for a valid current flow. Therefore, this issue is most likely to affect client event monitoring feeds, which do not contain random flow IDs.
CVE-2022-35630: Unsafe HTML injection in artifact collection report
Velociraptor allows the user to export a “collection report” in HTML. This is a standalone HTML file containing a summary of the collection. The server will generate the HTML file, and the user’s browser will download it. Users then open the HTML file from their local disk.
A cross-site scripting (XSS) issue in generating this report made it possible for malicious clients to inject JavaScript code into the static HTML file.
The impact of this issue is considered low because the file is served locally (i.e. from a file:// URL) and so does not have access to server cookies or other information (although it may facilitate phishing attacks). This feature is also not used very often.
CVE-2022-35631: Filesystem race on temporary files
The Velociraptor client uses a local buffer file to store data it is unable to deliver to the server quickly enough. Although the file is created with restricted permissions, the filename is predictable (and stored in the client’s configuration file).
On MacOS and Linux, it may be possible to perform a symlink attack by replacing this predictable file name with a symlink to another file and have the Velociraptor client overwrite the other file.
This issue can be mitigated by using an in-memory buffer mechanism instead, or specifying that the buffer file should be created in a directory only writable by root. Set the Client.local_buffer.filename_linux to an empty string, or a directory only writable by root.
By default, on Windows, the buffer file is stored in C:\Program Files\Velociraptor\Tools,which is created with restricted permissions only writable by Administrators. Therefore, Windows clients in the default configuration are not affected by this issue.
CVE-2022-35632: XSS in user interface
The Velociraptor GUI contains an editor suggestion feature that can be used to offer help on various functions. It can also display the description field of a VQL function, plugin or artifact. This field was not properly sanitized and can lead to cross-site scripting (XSS).
Prior to the 0.6.5 release, the artifact description was also sent to this function, but after 0.6.5, this is no longer the case for performance reasons.
On servers older than 0.6.5, an authenticated attacker with the ARTIFACT_WRITER permission (usually only given to administrators) could create an artifact with raw HTML in the description field and trigger this XSS. Servers with version 0.6.5 or newer are not affected by this issue.
Remediation
To remediate these vulnerabilities, Velociraptor users should upgrade their servers.
Disclosure timeline
July, 2022: Issues discovered by Tim Goddard from CyberCX
July 11, 2022: Vulnerabilities disclosed by CyberCX
Well, hello there! Thanks for reading our inaugural blog post.
Who are we, you ask? We are the AWS Customer Incident Response Team (CIRT). The AWS CIRT is a specialized 24/7 global Amazon Web Services (AWS) team that provides support to customers during active security events on the customer side of the AWS Shared Responsibility Model. The team is made up of AWS Global Services Consultants and Solutions Architects with experience in incident response.
When the AWS CIRT supports you, you will receive assistance with triage and recovery for an active security event on AWS. We will assist in root cause analysis through the use of AWS service logs and provide you with recommendations for recovery. We will also provide security tips and best practices to help you avoid security events in the future.
AWS CIRT is thrilled to talk with you in this new medium! This is AWS after all; getting customer feedback and taking steps to make your experience better is our number one goal. The AWS CIRT has heard from customers that they are challenged with 24/7 security event prevention, detection, analysis, and response to security events. You’ve told us that you are seeking the right AWS skill sets, knowledge, and best practices to address your security response needs in the case of an active security event. AWS CIRT wants to share our knowledge with you so that you can excel in preventing and detecting security events in the cloud.
Figure 1 shows the two different sides of the shared responsibility model, in which AWS is responsible for security OF the cloud, while customers are responsible for security IN the cloud.
Figure 1: The Customer/AWS Shared Responsibility Model
In addition to this blog post, we’ve been working overtime on our favorite social media platform, AWS Twitch. In December 2021, we developed five episodes to share with you some of the most common causes of security events. We received so much positive customer feedback that we decided to create a bi-weekly series! You can find all episodes of The Safe Room on AWS Twitch.
We mentioned earlier that our number one goal is to help you. We’ve heard from you, and understand that many of you do not have the tools or playbooks necessary to operate your AWS workloads securely. We are pleased to announce that we have developed open-source tools to support your security needs:
AWS Customer Playbook Framework – Publicly available response frameworks that use AWS CIRT lessons learned from security events
AWS CloudSaga – A tool for testing security controls and alerts within an AWS environment by using generated simulated events based on common security events seen by the AWS CIRT
Stay tuned to this blog. More tools are coming soon!
We’ve told you who we are and what we do—now, how do you contact us? All AWS Customers can engage the AWS CIRT through an AWS support case. Yes, that is correct. We support allAWS customers! For those customers that do have an account team, you can start an escalation to the AWS CIRT with the account team. However, we will always require that you open an AWS support case.
Thanks again for stopping by and giving us your eyeballs for a few minutes. Please stay tuned to this blog, because this is where we will comment on security trends and interesting stuff we find in the security world, as well as make new open source tools public.
Cloud safe, everyone!
If you have feedback about this post, submit comments in the Comments section below. If you have questions about this post, contact AWS Support.
Want more AWS Security news? Follow us on Twitter.
Docker has transformed the way
many people develop and deploy software. It wasn’t the first
implementation of containers on Linux, but Docker’s ideas about how
containers should be structured and managed were different from its
predecessors. Those ideas matured into industry standards, and an
ecosystem of software has grown around them. Docker continues to be a
major player in the ecosystem, but it is no longer the only whale in the
sea — Red Hat has also done a lot of work on
container tools, and alternative implementations are
now available for many of Docker’s offerings.
Our recent Backup Awareness Survey showed that 61% of Americans who own a computer and back it up are not very confident that all of their data is being backed up. That just goes to show how complicated some backup solutions are.
And what good is a backup service if it’s hard to get your data back when you need it?
The Backblaze Computer Backup client is designed to stay out of the way and back up your data, while making restoring that data a walk in the park. One of the popular ways of enhancing our backup service is a feature called Extended Version History. But, we’ve found that some people still don’t quite understand what it does. With that in mind, I wanted to write an overview of the feature, how it works, and why it’s useful for anyone that uses our Computer Backup service, whether it’s for personal use or for their company or family group.
Extended Version History Explained
First, we need to define two key terms, “retention” and “version,” to help explain Extended Version History.
What Is Retention?
In simple terms, retention is how long something in your backup is kept backed up.
What Is a Version?
It seems simple enough, but it’s worth explaining what we mean by a “version.” Without getting in the weeds, whenever a file is added or created on your computer, that is a version. Whenever you change a file on your computer, whether you add more lines to a spreadsheet or edit your recent vacation photos, those changes also create another version of the file.
When you understand what retention is and what a version is, it’s easy to understand Extended Version History. It’s a feature that allows you to set a retention timeframe that specifies how long all the older versions—the version history—of your files should be kept as part of your backup.
How Long Is Backblaze’s Retention?
The standard Backblaze Computer Backup service comes with 30 days of Version History for the files that are backed up. This means that you can go back in time (using our roll back time feature) and access older versions of files for 30 days from the date they were last changed or deleted. After that 30-day mark, the version of the file that’s 30 days old will leave your backup, but any newer files will remain.
Note: If you last changed or added a file more than 30 days ago, but have not made any changes to it, it will remain in your backup as long as it remains on your computer (or is unchanged). If it gets removed or changed, that’s when the 30-day retention period starts.
What Does Extended Version History Do?
With Extended Version History, you can increase that 30-day period to one year or even forever. This essentially increases the duration for which you can roll back time when going to access your data.
A Very Simple Example (With Babies!)
As a new uncle, I have babies on the brain. Let’s say that a baby was born on July 1st and our family creates a spreadsheet to chart the growth of the baby. Every single day, we add a row to the spreadsheet to add in the baby’s weight, height, and maybe a cute note. The previous rows don’t get deleted, and so the spreadsheet grows by one row every single day.
On July 30th, our spreadsheet will have 30 rows (one per day). If that spreadsheet was being backed up by Backblaze, I could go back in time to July 1st and get a copy of that spreadsheet from the very first day, with just a single row of baby information. However, if I tried to do that on July 31, that original version would be gone, but I could go back and get a copy from July 2nd, the version with the first two rows of baby data. If I tried to go back on, say, August 30th, I could get a copy from August 1, which would have all of July’s rows of baby data.
To illustrate the point, here’s me as a Soviet baby.
With Extended Version History, using that same example, I have more time (a year or forever) to go back and retrieve that original copy of the spreadsheet created on July 1 with just the first row.
Why would you want the spreadsheet with just one row? Who knows, it’s an example!
Why Extended Version History? Because Mistakes Happen!
Our Backup Awareness Month survey found that 67% of respondents have reported accidentally deleting a file. 44% reported losing data, or access to data, because a shared or synced drive or folder was deleted. Having Extended Version History turned on for your Backblaze backup helps avoid data loss because of accidental deletions.
You may not always realize right away (or within 30 days) that you deleted a file accidentally. Or you may not regularly check that shared drive until it’s too late and your older versions are gone. With Extended Version History, you can go back in time up to a year later or forever later and get those files back.
How to Get Extended Version History?
I encourage everyone I know to enable Extended Version History as soon as they install Backblaze on their computer.
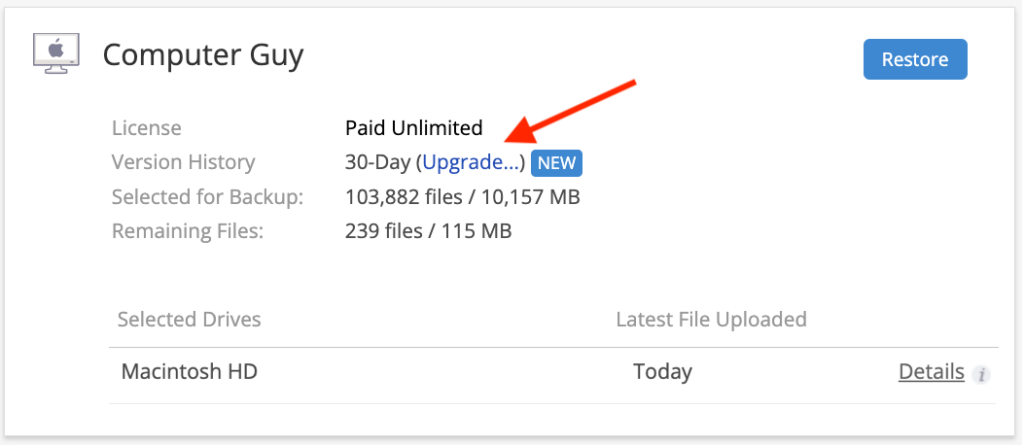
Step 1: Click “Upgrade.”
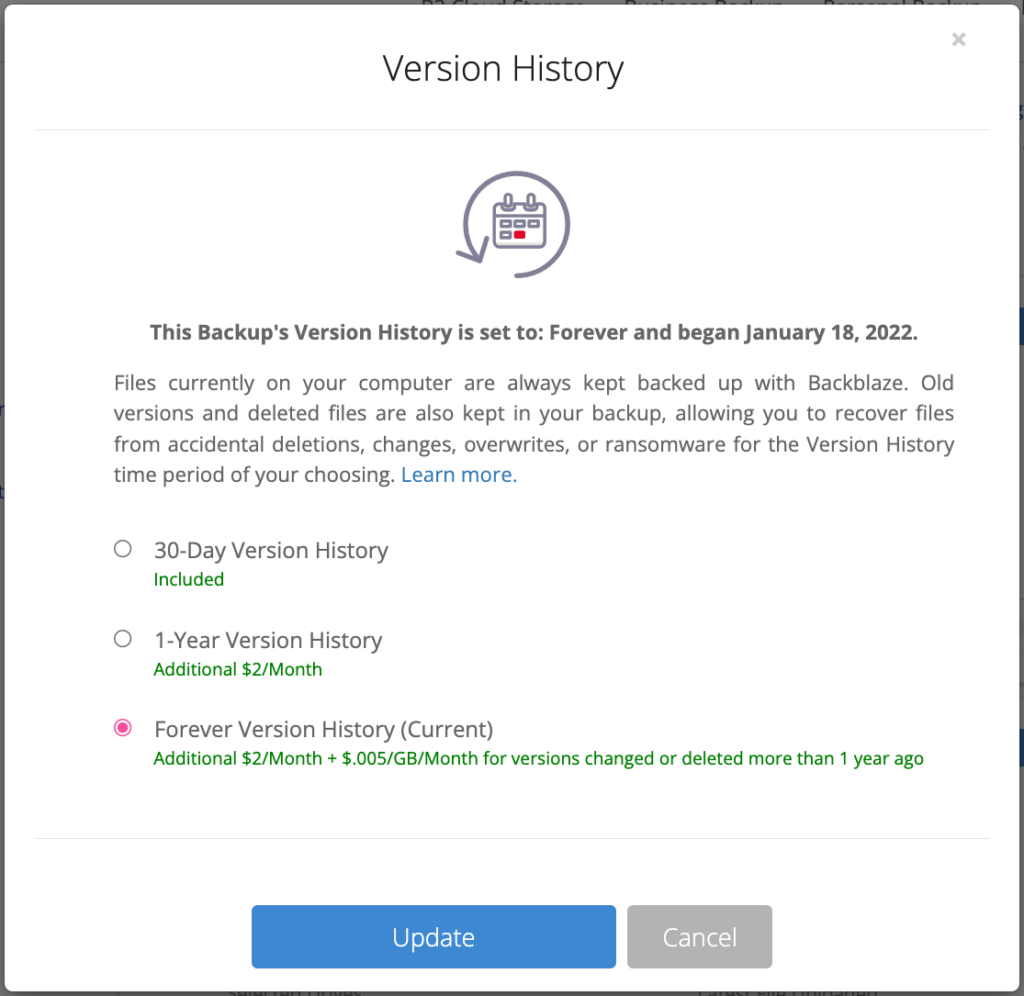
Step 2: Select how long you want to keep files—one year or forever.
One thing to keep in mind is that simply turning on Extended Version History won’t automatically extend the “life” of your files retroactively. For example, if you open your account on July 1 and enable Extended Version History on July 28, only the versions from July 28 onward will have Extended Version History, not the versions created between July 1 and July 28. Once enabled, any new or changed files will have their retention rate increased, which is why doing so when you first install Backblaze is the best policy.
Consider Extended Version History as getting additional “mistake insurance” for your data. If something happens, or you lose access to shared files and that goes unnoticed, we’ll have your back!
The JavaScript community downloads over 5 billion packages from npm a day, and we at GitHub recognize how important it is that developers can do so with confidence. As stewards of the npm registry, it’s important that we continue to invest in improvements that increase developer trust and the overall security of the registry itself.
Today, we are announcing the general availability of an enhanced 2FA experience on npm, as well as sharing additional investments we’ve made to the verification process of accounts and packages.
The following improvements to npm are available today, including:
A streamlined login and publishing experience with the npm CLI.
The ability to connect GitHub and Twitter accounts to npm.
All packages on npm have been re-signed and we’ve added a new npm CLI command to audit package integrity.
Streamlined login and publishing experience
Account security is significantly improved by adopting 2FA, but if the experience adds too much friction, we can’t expect customers to adopt it. We recently announced a variety of enhancements to the npm registry to make 2FA adoption easier for developers—in a public beta release. Early adopters of our new 2FA experience shared feedback around the process of logging in and publishing with the npm CLI, and we recognized there was room for improvement. Our initial design was created to be backwards compatible with npm 6 and other clients; in fact the Yarn project was able to backport support for our new experience to Yarn 1 in less than 10 lines of code!
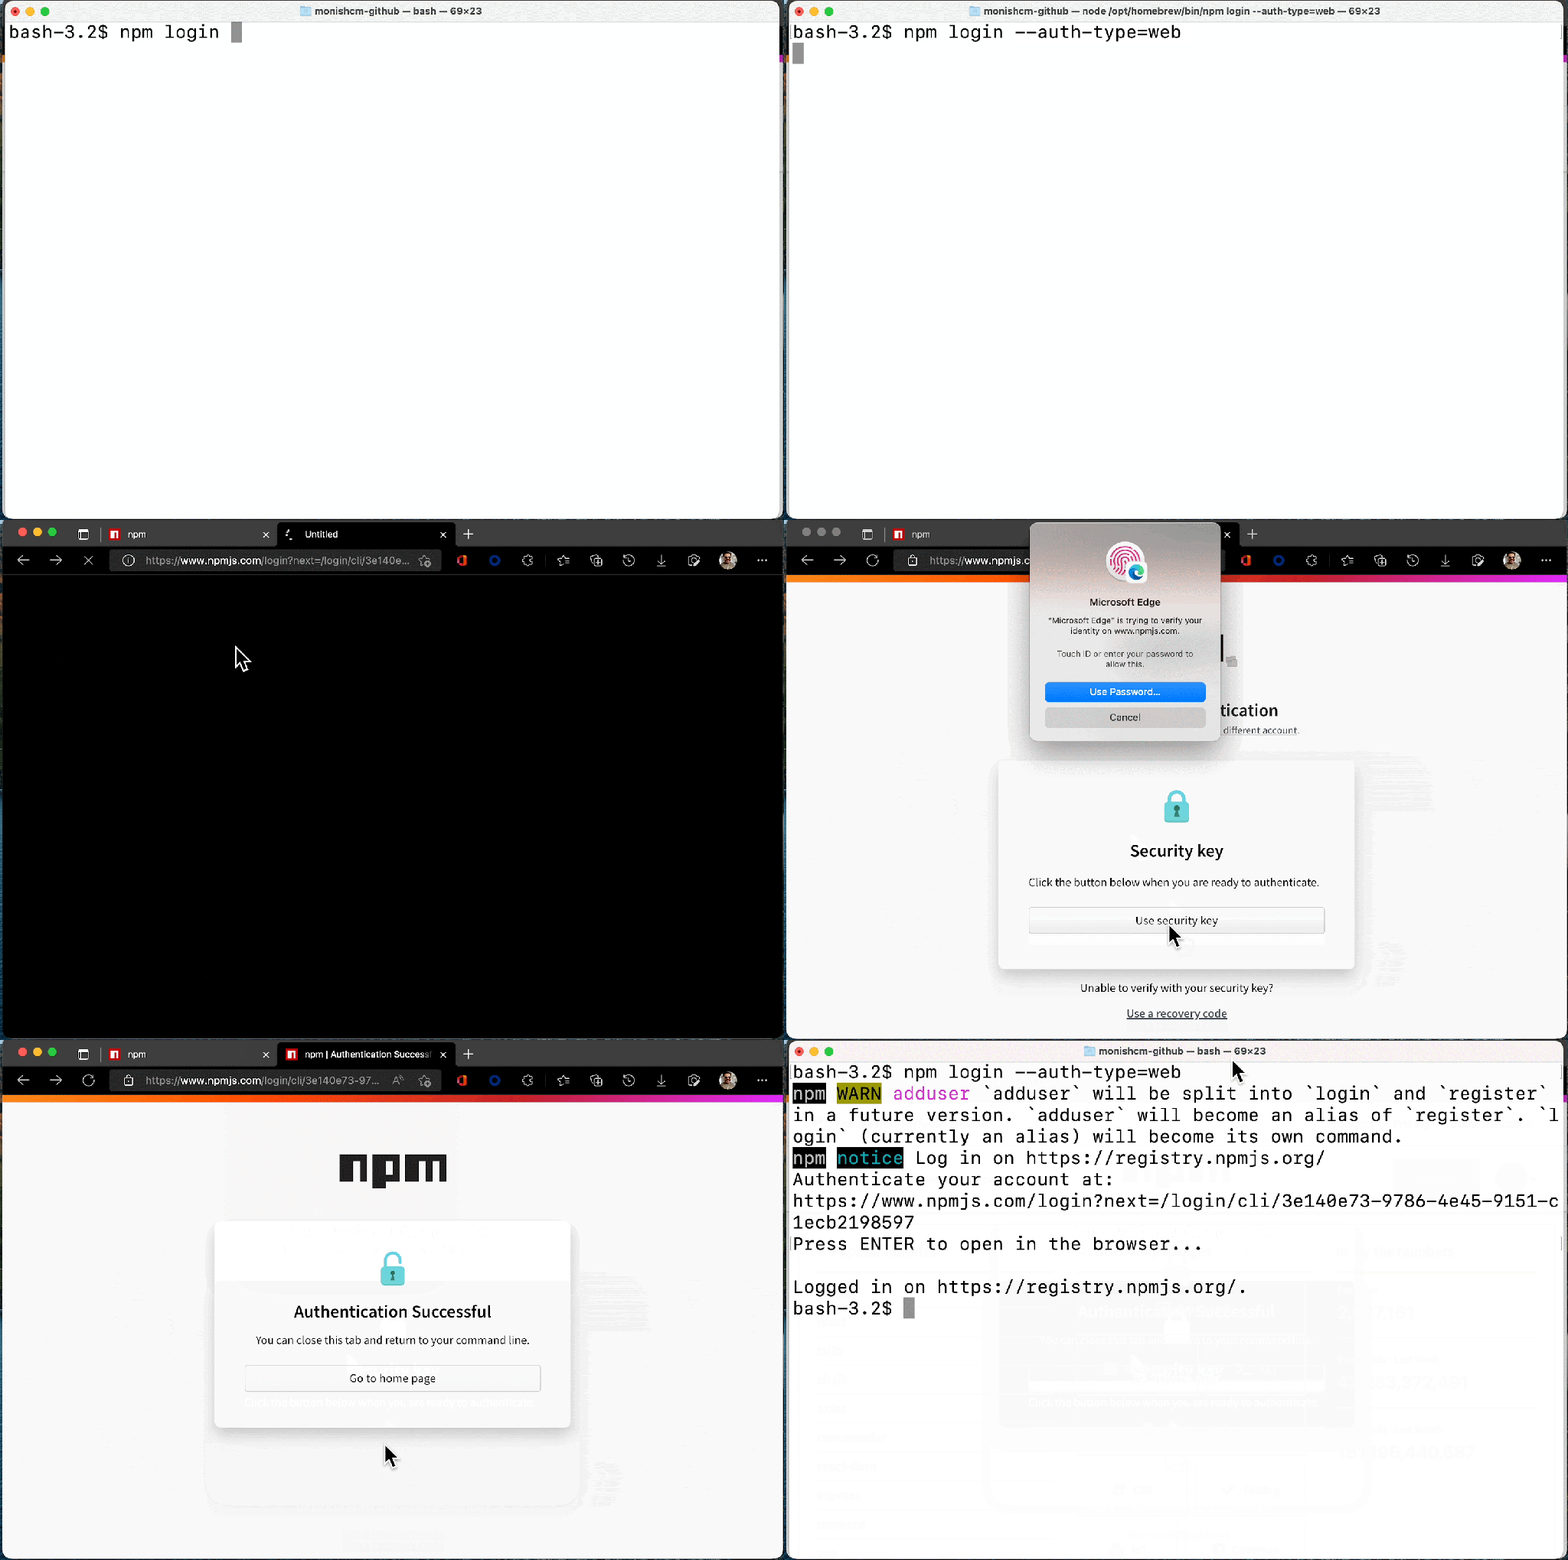
We’ve been hard at work making the CLI experience better than ever based on this feedback, and the improved login and publish experience is now available in npm 8.15.0 today. With the new experience, users will benefit from:
Login and publish authentication are managed in the browser.
Login can use an existing session only prompting for your second factor or email verification OTP to create a new session.
Publish now supports “remember me for 5 minutes” and allows for subsequent publishes from the same IP + access token to avoid the 2FA prompt for a 5-minute period. This is especially useful when publishing from a npm workspace.
It is currently opt-in with the --auth-type=web flag and will be the default experience in npm 9.
These improved experiences will make it easier for users to secure their accounts. A secure account is the beginning of a secure ecosystem. Check out our documentation to learn more about 2FA in npm.
Connecting GitHub and Twitter Accounts to npm
Developers have been able to include their GitHub and Twitter handles on their npm profiles for almost as long as npm accounts have been available. This data has been helpful to connect the identity of an account on npm to an identity on other platforms; however this data has historically been a free-form text field that wasn’t validated or verified.
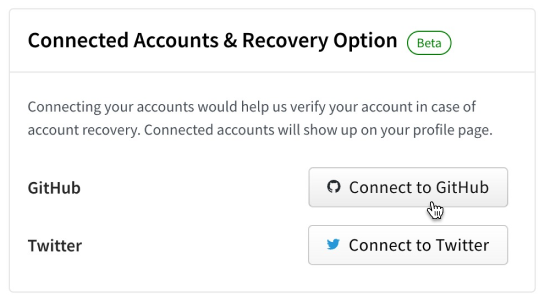
That’s why today we are launching the ability to link your npm account to your GitHub and Twitter accounts. Linking of these accounts is performed via official integrations with both GitHub and Twitter and ensures that verified account data are included on npm profiles moving forward. We will no longer be showing the previously unverified GitHub or Twitter data on public user profiles, making it possible for developers to audit identities and trust that an account is who they say they are.
Having a verified link between your identities across platforms significantly improves our ability to do account recovery. This new verified data lays the foundation for automating identity verification as part of account recovery. Over time, we will deprecate this legacy data, but we will continue to honor it for now to ensure that customers do not get locked out of their accounts.
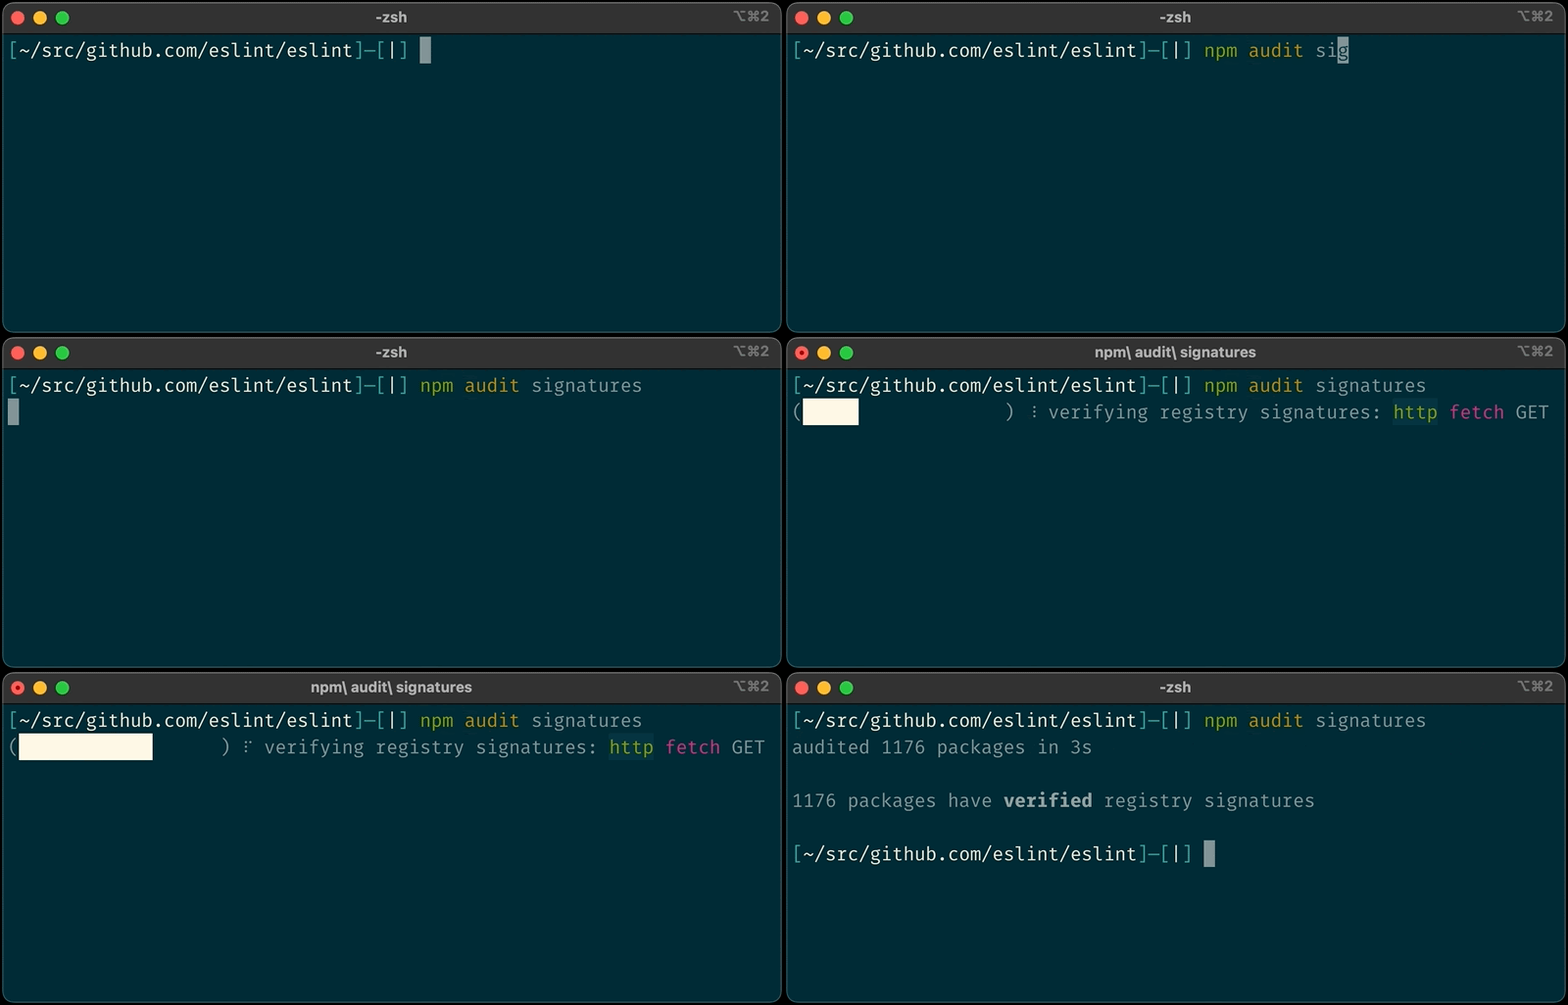
You can verify your packages locally with npm audit signatures
Until today npm users have had to rely on a multi-step process to validate the signature of npm packages. This PGP based process was both complex and required users to have knowledge on cryptographic tools which provided a poor developer experience. Developers relying on this existing process should soon start using the new “audit signatures” command. The PGP keys are set to expire early next year with more details to follow.
Recently, we began work to re-sign all npm packages with new signatures relying on the secure ECDSA algorithm and using an HSM for key management, and you can now rely on this signature to verify the integrity of the packages you install from npm.
We have introduced a new audit signatures command in npm CLI version 8.13.0 and above.
Example of a successful audit signature verification
The below sample GitHub Actions workflow with audit signature in action.
Our primary goal continues to be protecting the npm registry, and our next major milestone will be enforcing 2FA for all high-impact accounts, those that manage packages with more than 1 million weekly downloads or 500 dependents, tripling the number of accounts we will require to adopt a second factor. Prior to this enforcement we will be making even more improvements to our account recovery process, including introducing additional forms of identity verification and automating as much of the process as possible.
Learn more about these features by visiting our documentation:
Кметът на Царево – Георги Лапчев /многомандатник ГЕРБ-ераст/ щял да обжалва заповедта за еко-защитата на залива Корал, става ясно от репортаж на БНР. Най-същественият мотив за обжалването на заповедта посочва…
AWS Single Sign-On (AWS SSO) is now AWS IAM Identity Center. Amazon Web Services (AWS) is changing the name to highlight the service’s foundation in AWS Identity and Access Management (IAM), to better reflect its full set of capabilities, and to reinforce its recommended role as the central place to manage access across AWS accounts and applications. Although the technical capabilities of the service haven’t changed with this announcement, we want to take the opportunity to walk through some of the important features that drive our recommendation to consider IAM Identity Center your front door into AWS.
If you’ve worked with AWS accounts, chances are that you’ve worked with IAM. This is the service that handles authentication and authorization requests for anyone who wants to do anything in AWS. It’s a powerful engine, processing half a billion API calls per second globally, and it has underpinned and secured the growth of AWS customers since 2011. IAM provides authentication on a granular basis—by resource, within each AWS account. Although this gives you unsurpassed ability to tailor permissions, it also requires that you establish permissions on an account-by-account basis for credentials (IAM users) that are also defined on an account-by-account basis.
As AWS customers increasingly adopted a multi-account strategy for their environments, in December 2017 we launched AWS Single Sign-On (AWS SSO)—a service built on top of IAM to simplify access management across AWS accounts. In the years since, customer adoption of multi-account AWS environments continued to increase the need for centralized access control and distributed access management. AWS SSO evolved accordingly, adding integrations with new identity providers, AWS services, and applications; features for the consistent management of permissions at scale; multiple compliance certifications; and availability in most AWS Regions. The variety of use cases supported by AWS SSO, now known as AWS IAM Identity Center, makes it our recommended way to manage AWS access for workforce users.
IAM Identity Center, just like AWS SSO before it, is offered at no extra charge. You can follow along with our walkthrough in your own console by choosing Getting started on the console main page. If you don’t have the service enabled, you will be prompted to choose Enable IAM Identity Center, as shown in Figure 1.
Figure 1: IAM Identity Center Getting Started page
Freedom to choose your identity source
Once you’re in the IAM Identity Center console, you can choose your preferred identity source for use across AWS, as shown in Figure 2. If you already have a workforce directory, you can continue to use it by connecting, or federating, it. You can connect to the major cloud identity providers, including Okta, Ping Identity, Azure AD, JumpCloud, CyberArk, and OneLogin, as well as Microsoft Active Directory Domain Services. If you don’t have or don’t want to use a workforce directory, you have the option to create users in Identity Center. Whichever source you decide to use, you connect or create it in one place for use in multiple accounts and AWS or SAML 2.0 applications.
Figure 2 Choosing and connecting your identity source
Management of fine-grained permissions at scale
As noted before, IAM Identity Center builds on the per-account capabilities of IAM. The difference is that in IAM Identity Center, you can define and assign access across multiple AWS accounts. For example, permission sets create IAM roles and apply IAM policies in multiple AWS accounts, helping to scale the access of your users securely and consistently.
You can use predefined permission sets based on AWS managed policies, or custom permission sets, where you can still start with AWS managed policies but then tailor them to your needs.
Recently, we added the ability to use IAM customer managed policies (CMPs) and permissions boundary policies as part of Identity Center permission sets, as shown in Figure 3. This helps you improve your security posture by creating larger and finer-grained policies for least privilege access and by tailoring them to reference the resources of the account to which they are applied. By using CMPs, you can maintain the consistency of your policies, because CMP changes apply automatically to the permission sets and roles that use the CMP. You can govern your CMPs and permissions boundaries centrally, and auditors can find, monitor, and review them in one place. If you already have existing CMPs for roles you manage in IAM, you can reuse them without the need to create, review, and approve new inline policies.
Figure 3: Specify permission sets in IAM Identity Center
By default, users and permission sets in IAM Identity Center are administered by the management account in an organization in AWS Organizations. This management account has the power and authority to manage member accounts in the organization as well. Because of the power of this account, it is important to exercise least privilege and tightly control access to it. If you are managing a complex organization supporting multiple operations or business units, IAM Identity Center allows you to delegate a member account that can administer user permissions, reducing the need to access the AWS Organizations management account for daily administrative work.
One place for application assignments
If your workforce uses Identity Center enabled applications, such as Amazon Managed Grafana, Amazon SageMaker Studio, or AWS Systems Manager Change Manager, you can assign access to them centrally, through IAM Identity Center, and your users can have a single sign-on experience.
If you do not have a separate cloud identity provider, you have the option to use IAM Identity Center as a single place to manage user assignments to SAML 2.0-based cloud applications, such as top-tier customer relationship management (CRM) applications, document collaboration tools, and productivity suites. Figure 4 shows this option.
Figure 4: Assign users to applications in IAM Identity Center
Conclusion
IAM Identity Center (the successor to AWS Single Sign-On) is where you centrally create or connect your workforce users once, and manage their access to multiple AWS accounts and applications. It’s our recommended front door into AWS, because it gives you the freedom to choose your preferred identity source for use across AWS, helps you strengthen your security posture with consistent permissions across AWS accounts and applications, and provides a convenient experience for your users. Its new name highlights the service’s foundation in IAM, while also reflecting its expanded capabilities and recommended role.
With Amazon GuardDuty, you can monitor your AWS accounts and workloads to detect malicious activity. Today, we are adding to GuardDuty the capability to detect malware. Malware is malicious software that is used to compromise workloads, repurpose resources, or gain unauthorized access to data. When you have GuardDuty Malware Protection enabled, a malware scan is initiated when GuardDuty detects that one of your EC2 instances or container workloads running on EC2 is doing something suspicious. For example, a malware scan is triggered when an EC2 instance is communicating with a command-and-control server that is known to be malicious or is performing denial of service (DoS) or brute-force attacks against other EC2 instances.
GuardDuty supports many file system types and scans file formats known to be used to spread or contain malware, including Windows and Linux executables, PDF files, archives, binaries, scripts, installers, email databases, and plain emails.
When potential malware is identified, actionable security findings are generated with information such as the threat and file name, the file path, the EC2 instance ID, resource tags and, in the case of containers, the container ID and the container image used. GuardDuty supports container workloads running on EC2, including customer-managed Kubernetes clusters or individual Docker containers. If the container is managed by Amazon Elastic Kubernetes Service (EKS) or Amazon Elastic Container Service (Amazon ECS), the findings also include the cluster name and the task or pod ID so application and security teams can quickly find the affected container resources.
As with all other GuardDuty findings, malware detections are sent to the GuardDuty console, pushed through Amazon EventBridge, routed to AWS Security Hub, and made available in Amazon Detective for incident investigation.
How GuardDuty Malware Protection Works When you enable malware protection, you set up an AWS Identity and Access Management (IAM)service-linked role that grants GuardDuty permissions to perform malware scans. When a malware scan is initiated for an EC2 instance, GuardDuty Malware Protection uses those permissions to take a snapshot of the attached Amazon Elastic Block Store (EBS) volumes that are less than 1 TB in size and then restore the EBS volumes in an AWS service account in the same AWS Region to scan them for malware. You can use tagging to include or exclude EC2 instances from those permissions and from scanning. In this way, you don’t need to deploy security software or agents to monitor for malware, and scanning the volumes doesn’t impact running workloads. The EBS volumes in the service account and the snapshots in your account are deleted after the scan. Optionally, you can preserve the snapshots when malware is detected.
The service-linked role grants GuardDuty access to AWS Key Management Service (AWS KMS) keys used to encrypt EBS volumes. If the EBS volumes attached to a potentially compromised EC2 instance are encrypted with a customer-managed key, GuardDuty Malware Protection uses the same key to encrypt the replica EBS volumes as well. If the volumes are not encrypted, GuardDuty uses its own key to encrypt the replica EBS volumes and ensure privacy. Volumes encrypted with EBS-managed keys are not supported.
Security in cloud is a shared responsibility between you and AWS. As a guardrail, the service-linked role used by GuardDuty Malware Protection cannot perform any operation on your resources (such as EBS snapshots and volumes, EC2 instances, and KMS keys) if it has the GuardDutyExcluded tag. Once you mark your snapshots with GuardDutyExcluded set to true, the GuardDuty service won’t be able to access these snapshots. The GuardDutyExcluded tag supersedes any inclusion tag. Permissions also restrict how GuardDuty can modify your snapshot so that they cannot be made public while shared with the GuardDuty service account.
The EBS volumes created by GuardDuty are always encrypted. GuardDuty can use KMS keys only on EBS snapshots that have a GuardDuty scan ID tag. The scan ID tag is added by GuardDuty when snapshots are created after an EC2 finding. The KMS keys that are shared with GuardDuty service account cannot be invoked from any other context except the Amazon EBS service. Once the scan completes successfully, the KMS key grant is revoked and the volume replica in GuardDuty service account is deleted, making sure GuardDuty service cannot access your data after completing the scan operation.
Enabling Malware Protection for an AWS Account If you’re not using GuardDuty yet, Malware Protection is enabled by default when you activate GuardDuty for your account. Because I am already using GuardDuty, I need to enable Malware Protection from the console. If you’re using AWS Organizations, your delegated administrator accounts can enable this for existing member accounts and configure if new AWS accounts in the organization should be automatically enrolled.
In the GuardDuty console, I choose Malware Protection under Settings in the navigation pane. There, I choose Enable and then Enable Malware Protection.
Snapshots are automatically deleted after they are scanned. In General settings, I have the option to retain in my AWS account the snapshots where malware is detected and have them available for further analysis.
In Scan options, I can configure a list of inclusion tags, so that only EC2 instances with those tags are scanned, or exclusion tags, so that EC2 instances with tags in the list are skipped.
Testing Malware Protection GuardDuty Findings To generate several Amazon GuardDuty findings, including the new Malware Protection findings, I clone the Amazon GuardDuty Tester repo:
First, I create an AWS CloudFormation stack using the guardduty-tester.template file. When the stack is ready, I follow the instructions to configure my SSH client to log in to the tester instance through the bastion host. Then, I connect to the tester instance:
$ ssh tester
From the tester instance, I start the guardduty_tester.sh script to generate the findings:
$ ./guardduty_tester.sh

***********************************************************************
* Test #1 - Internal port scanning                                    *
* This simulates internal reconaissance by an internal actor or an   *
* external actor after an initial compromise. This is considered a    *
* low priority finding for GuardDuty because its not a clear indicator*
* of malicious intent on its own.                                     *
***********************************************************************


Starting Nmap 6.40 ( http://nmap.org ) at 2022-05-19 09:36 UTC
Nmap scan report for ip-172-16-0-20.us-west-2.compute.internal (172.16.0.20)
Host is up (0.00032s latency).
Not shown: 997 filtered ports
PORT     STATE  SERVICE
22/tcp   open   ssh
80/tcp   closed http
5050/tcp closed mmcc
MAC Address: 06:25:CB:F4:E0:51 (Unknown)

Nmap done: 1 IP address (1 host up) scanned in 4.96 seconds

-----------------------------------------------------------------------

***********************************************************************
* Test #2 - SSH Brute Force with Compromised Keys                     *
* This simulates an SSH brute force attack on an SSH port that we    *
* can access from this instance. It uses (phony) compromised keys in  *
* many subsequent attempts to see if one works. This is a common      *
* techique where the bad actors will harvest keys from the web in     *
* places like source code repositories where people accidentally leave*
* keys and credentials (This attempt will not actually succeed in     *
* obtaining access to the target linux instance in this subnet)       *
***********************************************************************

2022-05-19 09:36:29 START
2022-05-19 09:36:29 Crowbar v0.4.3-dev
2022-05-19 09:36:29 Trying 172.16.0.20:22
2022-05-19 09:36:33 STOP
2022-05-19 09:36:33 No results found...
2022-05-19 09:36:33 START
2022-05-19 09:36:33 Crowbar v0.4.3-dev
2022-05-19 09:36:33 Trying 172.16.0.20:22
2022-05-19 09:36:37 STOP
2022-05-19 09:36:37 No results found...
2022-05-19 09:36:37 START
2022-05-19 09:36:37 Crowbar v0.4.3-dev
2022-05-19 09:36:37 Trying 172.16.0.20:22
2022-05-19 09:36:41 STOP
2022-05-19 09:36:41 No results found...
2022-05-19 09:36:41 START
2022-05-19 09:36:41 Crowbar v0.4.3-dev
2022-05-19 09:36:41 Trying 172.16.0.20:22
2022-05-19 09:36:45 STOP
2022-05-19 09:36:45 No results found...
2022-05-19 09:36:45 START
2022-05-19 09:36:45 Crowbar v0.4.3-dev
2022-05-19 09:36:45 Trying 172.16.0.20:22
2022-05-19 09:36:48 STOP
2022-05-19 09:36:48 No results found...
2022-05-19 09:36:49 START
2022-05-19 09:36:49 Crowbar v0.4.3-dev
2022-05-19 09:36:49 Trying 172.16.0.20:22
2022-05-19 09:36:52 STOP
2022-05-19 09:36:52 No results found...
2022-05-19 09:36:52 START
2022-05-19 09:36:52 Crowbar v0.4.3-dev
2022-05-19 09:36:52 Trying 172.16.0.20:22
2022-05-19 09:36:56 STOP
2022-05-19 09:36:56 No results found...
2022-05-19 09:36:56 START
2022-05-19 09:36:56 Crowbar v0.4.3-dev
2022-05-19 09:36:56 Trying 172.16.0.20:22
2022-05-19 09:37:00 STOP
2022-05-19 09:37:00 No results found...
2022-05-19 09:37:00 START
2022-05-19 09:37:00 Crowbar v0.4.3-dev
2022-05-19 09:37:00 Trying 172.16.0.20:22
2022-05-19 09:37:04 STOP
2022-05-19 09:37:04 No results found...
2022-05-19 09:37:04 START
2022-05-19 09:37:04 Crowbar v0.4.3-dev
2022-05-19 09:37:04 Trying 172.16.0.20:22
2022-05-19 09:37:08 STOP
2022-05-19 09:37:08 No results found...
2022-05-19 09:37:08 START
2022-05-19 09:37:08 Crowbar v0.4.3-dev
2022-05-19 09:37:08 Trying 172.16.0.20:22
2022-05-19 09:37:12 STOP
2022-05-19 09:37:12 No results found...
2022-05-19 09:37:12 START
2022-05-19 09:37:12 Crowbar v0.4.3-dev
2022-05-19 09:37:12 Trying 172.16.0.20:22
2022-05-19 09:37:16 STOP
2022-05-19 09:37:16 No results found...
2022-05-19 09:37:16 START
2022-05-19 09:37:16 Crowbar v0.4.3-dev
2022-05-19 09:37:16 Trying 172.16.0.20:22
2022-05-19 09:37:20 STOP
2022-05-19 09:37:20 No results found...
2022-05-19 09:37:20 START
2022-05-19 09:37:20 Crowbar v0.4.3-dev
2022-05-19 09:37:20 Trying 172.16.0.20:22
2022-05-19 09:37:23 STOP
2022-05-19 09:37:23 No results found...
2022-05-19 09:37:23 START
2022-05-19 09:37:23 Crowbar v0.4.3-dev
2022-05-19 09:37:23 Trying 172.16.0.20:22
2022-05-19 09:37:27 STOP
2022-05-19 09:37:27 No results found...
2022-05-19 09:37:27 START
2022-05-19 09:37:27 Crowbar v0.4.3-dev
2022-05-19 09:37:27 Trying 172.16.0.20:22
2022-05-19 09:37:31 STOP
2022-05-19 09:37:31 No results found...
2022-05-19 09:37:31 START
2022-05-19 09:37:31 Crowbar v0.4.3-dev
2022-05-19 09:37:31 Trying 172.16.0.20:22
2022-05-19 09:37:34 STOP
2022-05-19 09:37:34 No results found...
2022-05-19 09:37:35 START
2022-05-19 09:37:35 Crowbar v0.4.3-dev
2022-05-19 09:37:35 Trying 172.16.0.20:22
2022-05-19 09:37:38 STOP
2022-05-19 09:37:38 No results found...
2022-05-19 09:37:38 START
2022-05-19 09:37:38 Crowbar v0.4.3-dev
2022-05-19 09:37:38 Trying 172.16.0.20:22
2022-05-19 09:37:42 STOP
2022-05-19 09:37:42 No results found...
2022-05-19 09:37:42 START
2022-05-19 09:37:42 Crowbar v0.4.3-dev
2022-05-19 09:37:42 Trying 172.16.0.20:22
2022-05-19 09:37:46 STOP
2022-05-19 09:37:46 No results found...

-----------------------------------------------------------------------

***********************************************************************
* Test #3 - RDP Brute Force with Password List                        *
* This simulates an RDP brute force attack on the internal RDP port  *
* of the windows server that we installed in the environment.  It uses*
* a list of common passwords that can be found on the web. This test  *
* will trigger a detection, but will fail to get into the target      *
* windows instance.                                                   *
***********************************************************************

Sending 250 password attempts at the windows server...
Hydra v9.4-dev (c) 2022 by van Hauser/THC & David Maciejak - Please do not use in military or secret service organizations, or for illegal purposes (this is non-binding, these *** ignore laws and ethics anyway).

Hydra (https://github.com/vanhauser-thc/thc-hydra) starting at 2022-05-19 09:37:46
[WARNING] rdp servers often don't like many connections, use -t 1 or -t 4 to reduce the number of parallel connections and -W 1 or -W 3 to wait between connection to allow the server to recover
[INFO] Reduced number of tasks to 4 (rdp does not like many parallel connections)
[WARNING] the rdp module is experimental. Please test, report - and if possible, fix.
[DATA] max 4 tasks per 1 server, overall 4 tasks, 1792 login tries (l:7/p:256), ~448 tries per task
[DATA] attacking rdp://172.16.0.24:3389/
[STATUS] 1099.00 tries/min, 1099 tries in 00:01h, 693 to do in 00:01h, 4 active
1 of 1 target completed, 0 valid password found
Hydra (https://github.com/vanhauser-thc/thc-hydra) finished at 2022-05-19 09:39:23

-----------------------------------------------------------------------

***********************************************************************
* Test #4 - CryptoCurrency Mining Activity                            *
* This simulates interaction with a cryptocurrency mining pool which *
* can be an indication of an instance compromise. In this case, we are*
* only interacting with the URL of the pool, but not downloading      *
* any files. This will trigger a threat intel based detection.        *
***********************************************************************

Calling bitcoin wallets to download mining toolkits

-----------------------------------------------------------------------

***********************************************************************
* Test #5 - DNS Exfiltration                                          *
* A common exfiltration technique is to tunnel data out over DNS      *
* to a fake domain.  Its an effective technique because most hosts    *
* have outbound DNS ports open.  This test wont exfiltrate any data,  *
* but it will generate enough unusual DNS activity to trigger the     *
* detection.                                                          *
***********************************************************************

Calling large numbers of large domains to simulate tunneling via DNS

***********************************************************************
* Test #6 - Fake domain to prove that GuardDuty is working            *
* This is a permanent fake domain that customers can use to prove that*
* GuardDuty is working.  Calling this domain will always generate the *
* Backdoor:EC2/C&CActivity.B!DNS finding type                         *
***********************************************************************

Calling a well known fake domain that is used to generate a known finding

; <<>> DiG 9.11.4-P2-RedHat-9.11.4-26.P2.amzn2.5.2 <<>> GuardDutyC2ActivityB.com any
;; global options: +cmd
;; Got answer:
;; ->>HEADER<<- opcode: QUERY, status: NOERROR, id: 11495
;; flags: qr rd ra; QUERY: 1, ANSWER: 8, AUTHORITY: 0, ADDITIONAL: 1

;; OPT PSEUDOSECTION:
; EDNS: version: 0, flags:; udp: 4096
;; QUESTION SECTION:
;GuardDutyC2ActivityB.com.	IN	ANY

;; ANSWER SECTION:
GuardDutyC2ActivityB.com. 6943	IN	SOA	ns1.markmonitor.com. hostmaster.markmonitor.com. 2018091906 86400 3600 2592000 172800
GuardDutyC2ActivityB.com. 6943	IN	NS	ns3.markmonitor.com.
GuardDutyC2ActivityB.com. 6943	IN	NS	ns5.markmonitor.com.
GuardDutyC2ActivityB.com. 6943	IN	NS	ns7.markmonitor.com.
GuardDutyC2ActivityB.com. 6943	IN	NS	ns2.markmonitor.com.
GuardDutyC2ActivityB.com. 6943	IN	NS	ns4.markmonitor.com.
GuardDutyC2ActivityB.com. 6943	IN	NS	ns6.markmonitor.com.
GuardDutyC2ActivityB.com. 6943	IN	NS	ns1.markmonitor.com.

;; Query time: 27 msec
;; SERVER: 172.16.0.2#53(172.16.0.2)
;; WHEN: Thu May 19 09:39:23 UTC 2022
;; MSG SIZE  rcvd: 238


*****************************************************************************************************
Expected GuardDuty Findings

Test 1: Internal Port Scanning
Expected Finding: EC2 Instance  i-011e73af27562827b  is performing outbound port scans against remote host. 172.16.0.20
Finding Type: Recon:EC2/Portscan

Test 2: SSH Brute Force with Compromised Keys
Expecting two findings - one for the outbound and one for the inbound detection
Outbound:  i-011e73af27562827b  is performing SSH brute force attacks against  172.16.0.20
Inbound:  172.16.0.25  is performing SSH brute force attacks against  i-0bada13e0aa12d383
Finding Type: UnauthorizedAccess:EC2/SSHBruteForce

Test 3: RDP Brute Force with Password List
Expecting two findings - one for the outbound and one for the inbound detection
Outbound:  i-011e73af27562827b  is performing RDP brute force attacks against  172.16.0.24
Inbound:  172.16.0.25  is performing RDP brute force attacks against  i-0191573dec3b66924
Finding Type : UnauthorizedAccess:EC2/RDPBruteForce

Test 4: Cryptocurrency Activity
Expected Finding: EC2 Instance  i-011e73af27562827b  is querying a domain name that is associated with bitcoin activity
Finding Type : CryptoCurrency:EC2/BitcoinTool.B!DNS

Test 5: DNS Exfiltration
Expected Finding: EC2 instance  i-011e73af27562827b  is attempting to query domain names that resemble exfiltrated data
Finding Type : Trojan:EC2/DNSDataExfiltration

Test 6: C&C Activity
Expected Finding: EC2 instance  i-011e73af27562827b  is querying a domain name associated with a known Command & Control server.
Finding Type : Backdoor:EC2/C&CActivity.B!DNS
After a few minutes, the findings appear in the GuardDuty console. At the top, I see the malicious files found by the new Malware Protection capability. One of the findings is related to an EC2 instance, the other to an ECS cluster.
First, I select the finding related to the EC2 instance. In the panel, I see the information on the instance and the malicious file, such as the file name and path. In the Malware scan details section, the Trigger finding ID points to the original GuardDuty finding that triggered the malware scan. In my case, the original finding was that this EC2 instance was performing RDP brute force attacks against another EC2 instance.
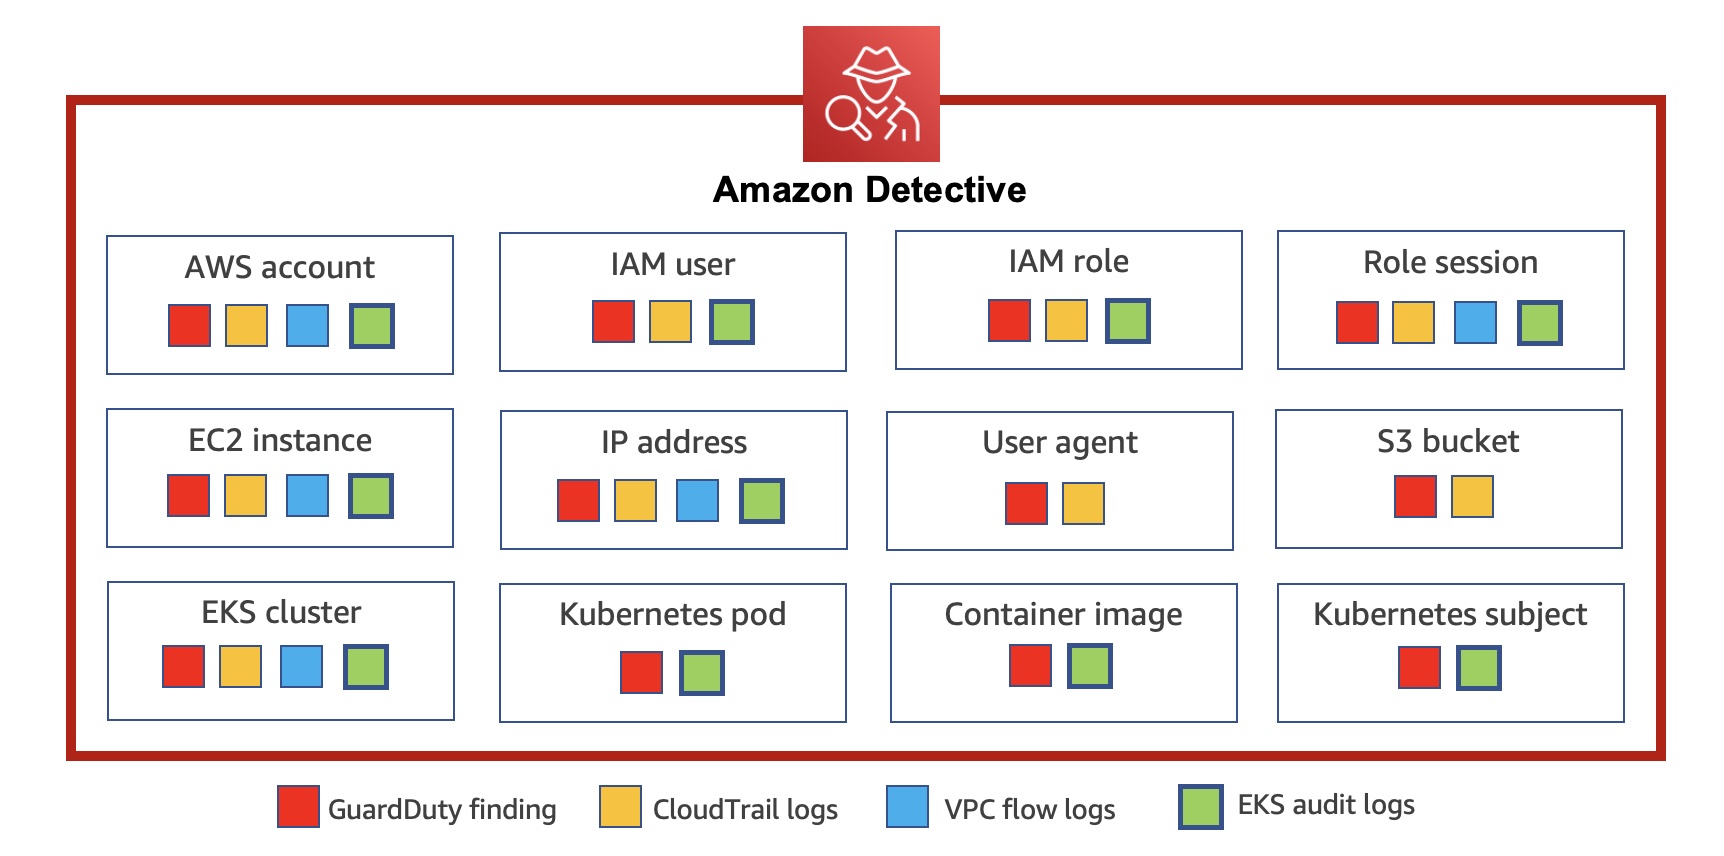
Here, I choose Investigate with Detective and, directly from the GuardDuty console, I go to the Detective console to visualize AWS CloudTrail and Amazon Virtual Private Cloud (Amazon VPC) flow data for the EC2 instance, the AWS account, and the IP address affected by the finding. Using Detective, I can analyze, investigate, and identify the root cause of suspicious activities found by GuardDuty.
When I select the finding related to the ECS cluster, I have more information on the resource affected, such as the details of the ECS cluster, the task, the containers, and the container images.
Using the GuardDuty tester scripts makes it easier to test the overall integration of GuardDuty with other security frameworks you use so that you can be ready when a real threat is detected.
Comparing GuardDuty Malware Protection with Amazon Inspector At this point, you might ask yourself how GuardDuty Malware Protection relates to Amazon Inspector, a service that scans AWS workloads for software vulnerabilities and unintended network exposure. The two services complement each other and offer different layers of protection:
Amazon Inspector offers proactive protection by identifying and remediating known software and application vulnerabilities that serve as an entry point for attackers to compromise resources and install malware.
GuardDuty Malware Protection detects malware that is found to be present on actively running workloads. At that point, the system has already been compromised, but GuardDuty can limit the time of an infection and take action before a system compromise results in a business-impacting event.
Availability and Pricing Amazon GuardDuty Malware Protection is available today in all AWS Regions where GuardDuty is available, excluding the AWS China (Beijing), AWS China (Ningxia), AWS GovCloud (US-East), and AWS GovCloud (US-West) Regions.
At launch, GuardDuty Malware Protection is integrated with these partner offerings:
With GuardDuty, you don’t need to deploy security software or agents to monitor for malware. You only pay for the amount of GB scanned in the file systems (not for the size of the EBS volumes) and for the EBS snapshots during the time they are kept in your account. All EBS snapshots created by GuardDuty are automatically deleted after they are scanned unless you enable snapshot retention when malware is found. For more information, see GuardDuty pricing and EBS pricing. Note that GuardDuty only scans EBS volumes less than 1 TB in size. To help you control costs and avoid repeating alarms, the same volume is not scanned more often than once every 24 hours.
In March 2020, we introduced Amazon Detective, a fully managed service that makes it easy to analyze, investigate, and quickly identify the root cause of potential security issues or suspicious activities.
Customers are rapidly moving to containers to deploy Kubernetes workloads with Amazon Elastic Kubernetes Service (Amazon EKS). Its highly programmatic nature allows thousands of individual container deployments and millions of configuration changes to occur in seconds. To effectively secure EKS workloads, it is important to monitor container deployments and configurations that are captured in the form of EKS audit logs and to correlate activities to user activity and network traffic happening across AWS accounts.
Today we announce new capabilities in Amazon Detective to expand security investigation coverage for Kubernetes workloads running on Amazon EKS. When you enable this new feature, Amazon Detective automatically starts ingesting EKS audit logs to capture chronological API activity from users, applications, and the control plane in Amazon EKS for clusters, pods, container images, and Kubernetes subjects (Kubernetes users and service accounts).
Detective automatically correlates user activity using CloudTrail, and network activity using Amazon VPC Flow logs, without the need for you to enable, store, or retain logs manually. The service gleans key security information from these logs and retains them in a security behavioral graph database that enables fast cross-referenced access to twelve months of activity. Detective provides a data analysis and visualization layer purpose-built to answer common security questions backed by a behavioral graph database that allows you to quickly investigate potential malicious behavior associated with your EKS workloads.
You can rapidly respond to security issues rather than focusing on log management, operational systems, or ongoing security tooling maintenance. Detective’s EKS capabilities come with a free 30-day trial for all customers that allows you to ensure that the capabilities meet your needs and to fully understand the cost for the service on an ongoing basis.
Getting Started with Security Investigations for EKS Audit Logs To get started, enable Amazon Detective with just a few clicks in the AWS Management Console. GuardDuty is a prerequisite of Amazon Detective. When you try to enable Detective, Detective checks whether GuardDuty has been enabled for your account. You must either enable GuardDuty or wait for 48 hours. This allows GuardDuty to assess the data volume that your account produces.
You can enable your account by attaching the AWS IAM policy or delegate it to an administrator of your organization. To learn more, refer to Setting up Detective in the AWS documentation.
To enable EKS support in Detective as an existing customer, navigate to the Settings menu in the left panel and select General. Under Optional source packages, enable EKS audit logs.
If you are a new customer of Detective, the EKS protection feature will be enabled by default. If you do not want to trial EKS audit logs right away, you can disable this feature within the first week of enabling Detective and preserve the full 30-day free trial period to use in the future.
Once enabled, Detective will begin monitoring the Kubernetes audit logs that are generated by Amazon EKS, extracting and correlating information for security usage. You do not need to enable any log sources or make any configuration changes to your existing EKS clusters or future deployments.
You can see recent monitoring results of your EKS clusters on the Summary page.
When you choose one of the EKS clusters, you will see the details of containers running in the cluster, Kubernetes API activities, and network activities that occurred on this resource around the scope time.
In the Overview tab, you also see details about all containers running in the cluster, including their pod, image and security context.
In the Kubernetes API activity tab, you can get an overview of the full API activities involving the EKS cluster. You can choose a time range to drill down based on specific API methods within the EKS cluster. When you select a specific time, you can see API subjects, IP addresses, and the number of API calls by the success, failure, unauthorized, or forbidden state.
You can also see details of newly observed Kubernetes API calls inside this cluster for the first time and subjects with increased volume that happened inside the cluster.
Enabling GuardDuty EKS Protection In January 2022, Amazon GuardDuty expanded coverage to EKS cluster activity to identify malicious or suspicious behavior that represents potential threats to container workloads.
When the optional GuardDuty EKS Protection is enabled, GuardDuty will continuously monitor your EKS deployments and alert you to threats detected in your workloads. You can view and investigate these security findings in Detective.
With Detective for EKS enabled, you can quickly access information about the resources involved in the finding, such as their CloudTrail and Kubernetes API activity, and netflow information. This can aid in investigation and help you determine root cause, impact, and other related resources that may also be compromised.
Now Available You can now use Amazon Detective for EKS protection in all Regions where Amazon Detective is available. This feature is priced based on the volume of audit logs processed and analyzed by Detective.
Detective provides a free 30-day trial to all customers that enable EKS coverage, allowing customers to ensure that Detective’s capabilities meet security needs and to get an estimate of the service’s monthly cost before committing to paid usage. To learn more, see the Detective pricing page.
Security updates have been issued by Debian (spip), Mageia (libtiff and logrotate), Oracle (java-1.8.0-openjdk and java-11-openjdk), SUSE (gpg2, logrotate, and phpPgAdmin), and Ubuntu (python-bottle).
Over the years I’ve been lurking around the Linux kernel and have investigated the TCP code many times. But when recently we were working on Optimizing TCP for high WAN throughput while preserving low latency, I realized I have gaps in my knowledge about how Linux manages TCP receive buffers and windows. As I dug deeper I found the subject complex and certainly non-obvious.
In this blog post I’ll share my journey deep into the Linux networking stack, trying to understand the memory and window management of the receiving side of a TCP connection. Specifically, looking for answers to seemingly trivial questions:
How much data can be stored in the TCP receive buffer? (it’s not what you think)
How fast can it be filled? (it’s not what you think either!)
Our exploration focuses on the receiving side of the TCP connection. We’ll try to understand how to tune it for the best speed, without wasting precious memory.
A case of a rapid upload
To best illustrate the receive side buffer management we need pretty charts! But to grasp all the numbers, we need a bit of theory.
We’ll draw charts from a receive side of a TCP flow, running a pretty straightforward scenario:
The client opens a TCP connection.
The client does send(), and pushes as much data as possible.
The server doesn’t recv() any data. We expect all the data to stay and wait in the receive queue.
How much data can fit in the server’s receive buffer? It turns out it’s not exactly the same as the default read buffer size on Linux; we’ll get there.
Assuming infinite bandwidth, what is the minimal time – measured in RTT – for the client to fill the receive buffer?
First, there is the buffer budget limit. ss manpage calls it skmem_rb, in the kernel it’s named sk_rcvbuf. This value is most often controlled by the Linux autotune mechanism using the net.ipv4.tcp_rmem setting:
Alternatively it can be manually set with setsockopt(SO_RCVBUF) on a socket. Note that the kernel doubles the value given to this setsockopt. For example SO_RCVBUF=16384 will result in skmem_rb=32768. The max value allowed to this setsockopt is limited to meager 208KiB by default:
The aforementioned blog post discusses why manual buffer size management is problematic – relying on autotuning is generally preferable.
Here’s a diagram showing how skmem_rb budget is being divided:
In any given moment, we can think of the budget as being divided into four parts:
Recv-q: part of the buffer budget occupied by actual application bytes awaiting read().
Another part of is consumed by metadata handling – the cost of struct sk_buff and such.
Those two parts together are reported by ss as skmem_r – kernel name is sk_rmem_alloc.
What remains is “free”, that is: it’s not actively used yet.
However, a portion of this “free” region is an advertised window – it may become occupied with application data soon.
The remainder will be used for future metadata handling, or might be divided into the advertised window further in the future.
The upper limit for the window is configured by tcp_adv_win_scale setting. By default, the window is set to at most 50% of the “free” space. The value can be clamped further by the TCP_WINDOW_CLAMP option or an internal rcv_ssthresh variable.
How much data can a server receive?
Our first question was “How much data can a server receive?”. A naive reader might think it’s simple: if the server has a receive buffer set to say 64KiB, then the client will surely be able to deliver 64KiB of data!
But this is totally not how it works. To illustrate this, allow me to temporarily set sysctl tcp_adv_win_scale=0. This is not a default and, as we’ll learn, it’s the wrong thing to do. With this setting the server will indeed set 100% of the receive buffer as an advertised window.
Here’s our setup:
The client tries to send as fast as possible.
Since we are interested in the receiving side, we can cheat a bit and speed up the sender arbitrarily. The client has transmission congestion control disabled: we set initcwnd=10000 as the route option.
The server has a fixed skmem_rb set at 64KiB.
The server has tcp_adv_win_scale=0.
There are so many things here! Let’s try to digest it. First, the X axis is an ingress packet number (we saw about 65). The Y axis shows the buffer sizes as seen on the receive path for every packet.
First, the purple line is a buffer size limit in bytes – skmem_rb. In our experiment we called setsockopt(SO_RCVBUF)=32K and skmem_rb is double that value. Notice, by calling SO_RCVBUF we disabled the Linux autotune mechanism.
Green recv-q line is how many application bytes are available in the receive socket. This grows linearly with each received packet.
Then there is the blue skmem_r, the used data + metadata cost in the receive socket. It grows just like recv-q but a bit faster, since it accounts for the cost of the metadata kernel needs to deal with.
The orange rcv_win is an advertised window. We start with 64KiB (100% of skmem_rb) and go down as the data arrives.
Finally, the dotted line shows rcv_ssthresh, which is not important yet, we’ll get there.
Running over the budget is bad
It’s super important to notice that we finished with skmem_r higher than skmem_rb! This is rather unexpected, and undesired. The whole point of the skmem_rb memory budget is, well, not to exceed it. Here’s how ss shows it:
$ ss -m
Netid  State  Recv-Q  Send-Q  Local Address:Port  Peer Address:Port
tcp    ESTAB  62464   0       127.0.0.3:1234      127.0.0.2:1235
     skmem:(r73984,rb65536,...)
As you can see, skmem_rb is 65536 and skmem_r is 73984, which is 8448 bytes over! When this happens we have an even bigger issue on our hands. At around the 62nd packet we have an advertised window of 3072 bytes, but while packets are being sent, the receiver is unable to process them! This is easily verifiable by inspecting an nstat TcpExtTCPRcvQDrop counter:
In our run 13 packets were dropped. This variable counts a number of packets dropped due to either system-wide or per-socket memory pressure – we know we hit the latter. In our case, soon after the socket memory limit was crossed, new packets were prevented from being enqueued to the socket. This happened even though the TCP advertised window was still open.
This results in an interesting situation. The receiver’s window is open which might indicate it has resources to handle the data. But that’s not always the case, like in our example when it runs out of the memory budget.
The sender will think it hit a network congestion packet loss and will run the usual retry mechanisms including exponential backoff. This behavior can be looked at as desired or undesired, depending on how you look at it. On one hand no data will be lost, the sender can eventually deliver all the bytes reliably. On the other hand the exponential backoff logic might stall the sender for a long time, causing a noticeable delay.
The root of the problem is straightforward – Linux kernel skmem_rb sets a memory budget for both the data and metadata which reside on the socket. In a pessimistic case each packet might incur a cost of a struct sk_buff + struct skb_shared_info, which on my system is 576 bytes, above the actual payload size, plus memory waste due to network card buffer alignment:
We now understand that Linux can’t just advertise 100% of the memory budget as an advertised window. Some budget must be reserved for metadata and such. The upper limit of window size is expressed as a fraction of the “free” socket budget. It is controlled by tcp_adv_win_scale, with the following values:
By default, Linux sets the advertised window at most at 50% of the remaining buffer space.
Even with 50% of space “reserved” for metadata, the kernel is very smart and tries hard to reduce the metadata memory footprint. It has two mechanisms for this:
TCP Coalesce – on the happy path, Linux is able to throw away struct sk_buff. It can do so, by just linking the data to the previously enqueued packet. You can think about it as if it was extending the last packet on the socket.
TCP Collapse – when the memory budget is hit, Linux runs “collapse” code. Collapse rewrites and defragments the receive buffer from many small skb’s into a few very long segments – therefore reducing the metadata cost.
Here’s an extension to our previous chart showing these mechanisms in action:
TCP Coalesce is a very effective measure and works behind the scenes at all times. In the bottom chart, the packets where the coalesce was engaged are shown with a pink line. You can see – the skmem_r bumps (blue line) are clearly correlated with a lack of coalesce (pink line)! The nstat TcpExtTCPRcvCoalesce counter might be helpful in debugging coalesce issues.
The TCP Collapse is a bigger gun. Mike wrote about it extensively, and I wrote a blog post years ago, when the latency of TCP collapse hit us hard. In the chart above, the collapse is shown as a red circle. We clearly see it being engaged after the socket memory budget is reached – from packet number 63. The nstat TcpExtTCPRcvCollapsed counter is relevant here. This value growing is a bad sign and might indicate bad latency spikes – especially when dealing with larger buffers. Normally collapse is supposed to be run very sporadically. A prominent kernel developer describes this pessimistic situation:
This also means tcp advertises a too optimistic window for a given allocated rcvspace: When receiving frames, sk_rmem_alloc can hit sk_rcvbuf limit and we call tcp_collapse() too often, especially when application is slow to drain its receive queue […] This is a major latency source.
If the memory budget remains exhausted after the collapse, Linux will drop ingress packets. In our chart it’s marked as a red “X”. The nstat TcpExtTCPRcvQDrop counter shows the count of dropped packets.
rcv_ssthresh predicts the metadata cost
Perhaps counter-intuitively, the memory cost of a packet can be much larger than the amount of actual application data contained in it. It depends on number of things:
Network card: some network cards always allocate a full page (4096, or even 16KiB) per packet, no matter how small or large the payload.
Payload size: shorter packets, will have worse metadata to content ratio since struct skb will be comparably larger.
Whether XDP is being used.
L2 header size: things like ethernet, vlan tags, and tunneling can add up.
Cache line size: many kernel structs are cache line aligned. On systems with larger cache lines, they will use more memory (see P4 or S390X architectures).
The first two factors are the most important. Here’s a run when the sender was specially configured to make the metadata cost bad and the coalesce ineffective (the details of the setup are messy):
You can see the kernel hitting TCP collapse multiple times, which is totally undesired. Each time a collapse kernel is likely to rewrite the full receive buffer. This whole kernel machinery, from reserving some space for metadata with tcp_adv_win_scale, via using coalesce to reduce the memory cost of each packet, up to the rcv_ssthresh limit, exists to avoid this very case of hitting collapse too often.
* The scheme does not work when sender sends good segments opening
* window and then starts to feed us spaghetti. But it should work
* in common situations. Otherwise, we have to rely on queue collapsing.
Notice that the rcv_ssthresh line dropped down on the TCP collapse. This variable is an internal limit to the advertised window. By dropping it the kernel effectively says: hold on, I mispredicted the packet cost, next time I’m given an opportunity I’m going to open a smaller window. Kernel will advertise a smaller window and be more careful – all of this dance is done to avoid the collapse.
Normal run – continuously updated window
Finally, here’s a chart from a normal run of a connection. Here, we use the default tcp_adv_win_wcale=1 (50%):
Early in the connection you can see rcv_win being continuously updated with each received packet. This makes sense: while the rcv_ssthresh and tcp_adv_win_scale restrict the advertised window to never exceed 32KiB, the window is sliding nicely as long as there is enough space. At packet 18 the receiver stops updating the window and waits a bit. At packet 32 the receiver decides there still is some space and updates the window again, and so on. At the end of the flow the socket has 56KiB of data. This 56KiB of data was received over a sliding window reaching at most 32KiB .
The saw blade pattern of rcv_win is enabled by delayed ACK (aka QUICKACK). You can see the “acked” bytes in red dashed line. Since the ACK’s might be delayed, the receiver waits a bit before updating the window. If you want a smooth line, you can use quickack 1 per-route parameter, but this is not recommended since it will result in many small ACK packets flying over the wire.
In normal connection we expect the majority of packets to be coalesced and the collapse/drop code paths never to be hit.
Large receive windows – rcv_ssthresh
For large bandwidth transfers over big latency links – big BDP case – it’s beneficial to have a very wide advertised window. However, Linux takes a while to fully open large receive windows:
In this run, the skmem_rb is set to 2MiB. As opposed to previous runs, the buffer budget is large and the receive window doesn’t start with 50% of the skmem_rb! Instead it starts from 64KiB and grows linearly. It takes a while for Linux to ramp up the receive window to full size – ~800KiB in this case. The window is clamped by rcv_ssthresh. This variable starts at 64KiB and then grows at a rate of two full-MSS packets per each packet which has a “good” ratio of total size (truesize) to payload size.
Stack is conservative about RWIN increase, it wants to receive packets to have an idea of the skb->len/skb->truesize ratio to convert a memory budget to RWIN. Some drivers have to allocate 16K buffers (or even 32K buffers) just to hold one segment (of less than 1500 bytes of payload), while others are able to pack memory more efficiently.
$ ip route change local 127.0.0.0/8 dev lo initrwnd 1000
With the patch and the route change deployed, this is how the buffers look:
The advertised window is limited to 64KiB during the TCP handshake, but with our kernel patch enabled it’s quickly bumped up to 1MiB in the first ACK packet afterwards. In both runs it took ~1800 packets to fill the receive buffer, however it took different time. In the first run the sender could push only 64KiB onto the wire in the second RTT. In the second run it could immediately push full 1MiB of data.
This trick of aggressive window opening is not really necessary for most users. It’s only helpful when:
You have high-bandwidth TCP transfers over big-latency links.
The metadata + buffer alignment cost of your NIC is sensible and predictable.
Immediately after the flow starts your application is ready to send a lot of data.
The sender has configured large initcwnd.
You care about shaving off every possible RTT.
On our systems we do have such flows, but arguably it might not be a common scenario. In the real world most of your TCP connections go to the nearest CDN point of presence, which is very close.
Getting it all together
In this blog post, we discussed a seemingly simple case of a TCP sender filling up the receive socket. We tried to address two questions: with our isolated setup, how much data can be sent, and how quickly?
With the default settings of net.ipv4.tcp_rmem, Linux initially sets a memory budget of 128KiB for the receive data and metadata. On my system, given full-sized packets, it’s able to eventually accept around 113KiB of application data.
Then, we showed that the receive window is not fully opened immediately. Linux keeps the receive window small, as it tries to predict the metadata cost and avoid overshooting the memory budget, therefore hitting TCP collapse. By default, with the net.ipv4.tcp_adv_win_scale=1, the upper limit for the advertised window is 50% of “free” memory. rcv_ssthresh starts up with 64KiB and grows linearly up to that limit.
On my system it took five window updates – six RTTs in total – to fill the 128KiB receive buffer. In the first batch the sender sent ~64KiB of data (remember we hacked the initcwnd limit), and then the sender topped it up with smaller and smaller batches until the receive window fully closed.
I hope this blog post is helpful and explains well the relationship between the buffer size and advertised window on Linux. Also, it describes the often misunderstood rcv_ssthresh which limits the advertised window in order to manage the memory budget and predict the unpredictable cost of metadata.
In case you wonder, similar mechanisms are in play in QUIC. The QUIC/H3 libraries though are still pretty young and don’t have so many complex and mysterious toggles…. yet.
I haven’t written about Apple’s Lockdown Mode yet, mostly because I haven’t delved into the details. This is how Apple describes it:
Lockdown Mode offers an extreme, optional level of security for the very few users who, because of who they are or what they do, may be personally targeted by some of the most sophisticated digital threats, such as those from NSO Group and other private companies developing state-sponsored mercenary spyware. Turning on Lockdown Mode in iOS 16, iPadOS 16, and macOS Ventura further hardens device defenses and strictly limits certain functionalities, sharply reducing the attack surface that potentially could be exploited by highly targeted mercenary spyware.
At launch, Lockdown Mode includes the following protections:
Messages: Most message attachment types other than images are blocked. Some features, like link previews, are disabled.
Web browsing: Certain complex web technologies, like just-in-time (JIT) JavaScript compilation, are disabled unless the user excludes a trusted site from Lockdown Mode.
Apple services: Incoming invitations and service requests, including FaceTime calls, are blocked if the user has not previously sent the initiator a call or request.
Wired connections with a computer or accessory are blocked when iPhone is locked.
Configuration profiles cannot be installed, and the device cannot enroll into mobile device management (MDM), while Lockdown Mode is turned on.
What Apple has done here is really interesting. It’s common to trade security off for usability, and the results of that are all over Apple’s operating systems—and everywhere else on the Internet. What they’re doing with Lockdown Mode is the reverse: they’re trading usability for security. The result is a user experience with fewer features, but a much smaller attack surface. And they aren’t just removing random features; they’re removing features that are common attack vectors.
There aren’t a lot of people who need Lockdown Mode, but it’s an excellent option for those who do.
EDITED TO ADD (7/31): An analysis of the effect of Lockdown Mode on Safari.
The collective thoughts of the interwebz
Manage Consent
To provide the best experiences, we use technologies like cookies to store and/or access device information. Consenting to these technologies will allow us to process data such as browsing behavior or unique IDs on this site. Not consenting or withdrawing consent, may adversely affect certain features and functions.
Functional
Always active
The technical storage or access is strictly necessary for the legitimate purpose of enabling the use of a specific service explicitly requested by the subscriber or user, or for the sole purpose of carrying out the transmission of a communication over an electronic communications network.
Preferences
The technical storage or access is necessary for the legitimate purpose of storing preferences that are not requested by the subscriber or user.
Statistics
The technical storage or access that is used exclusively for statistical purposes.The technical storage or access that is used exclusively for anonymous statistical purposes. Without a subpoena, voluntary compliance on the part of your Internet Service Provider, or additional records from a third party, information stored or retrieved for this purpose alone cannot usually be used to identify you.
Marketing
The technical storage or access is required to create user profiles to send advertising, or to track the user on a website or across several websites for similar marketing purposes.







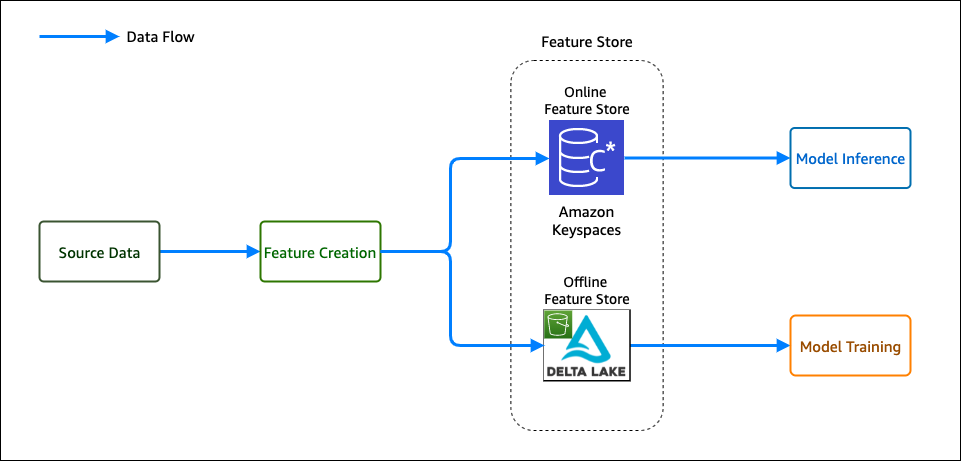
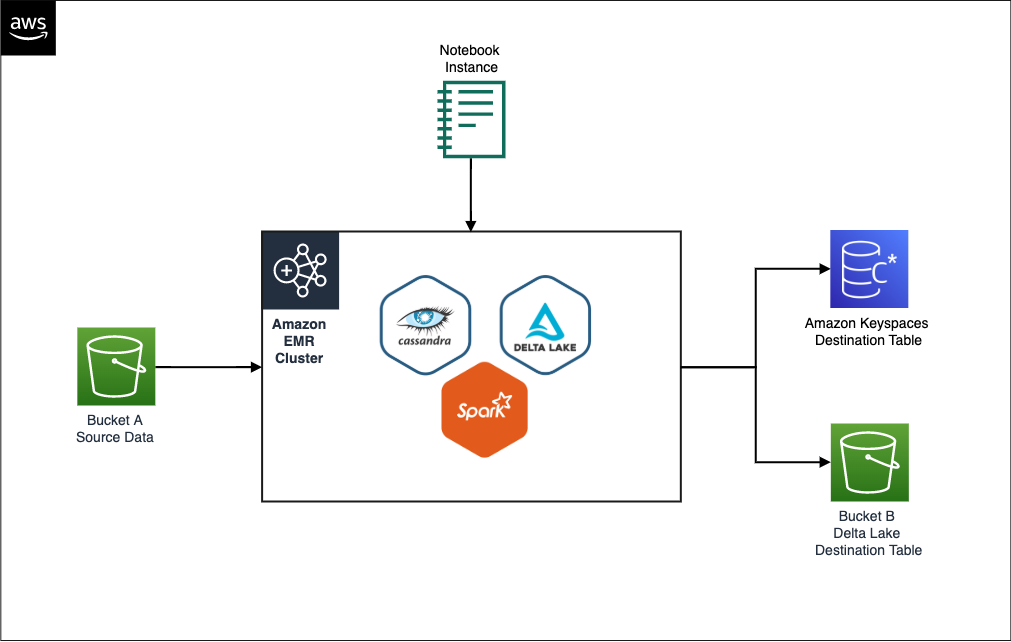
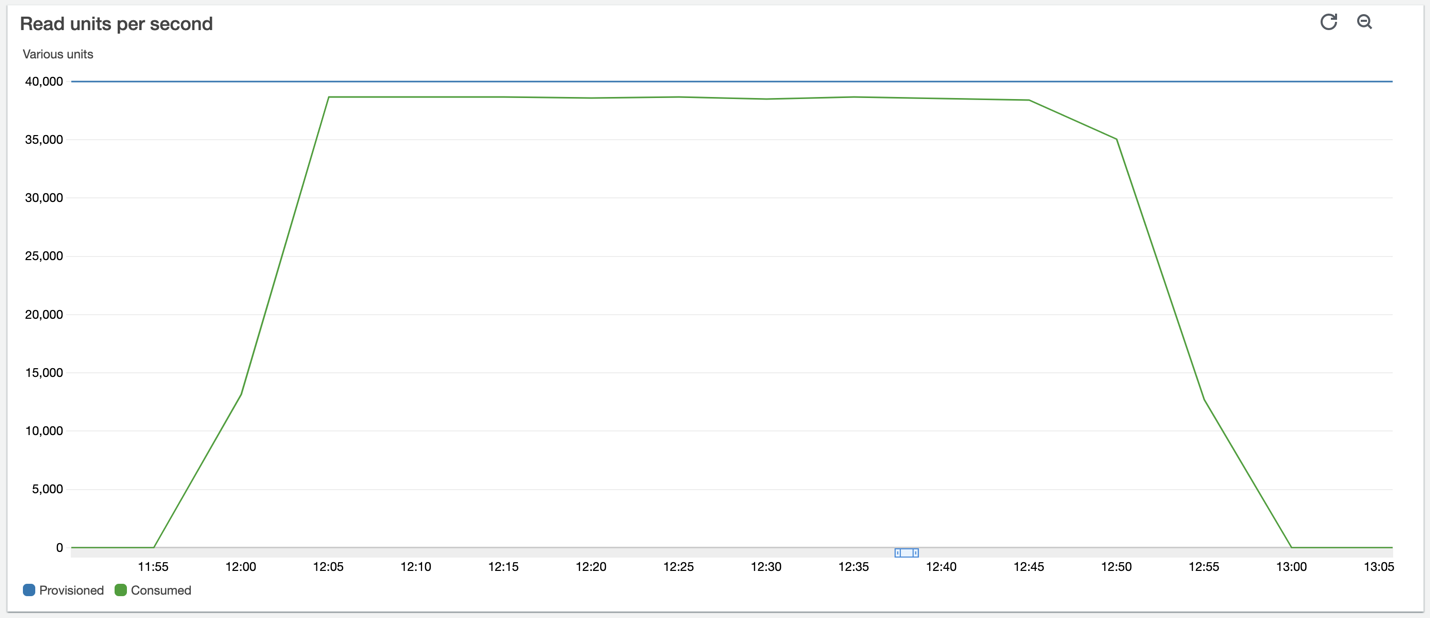
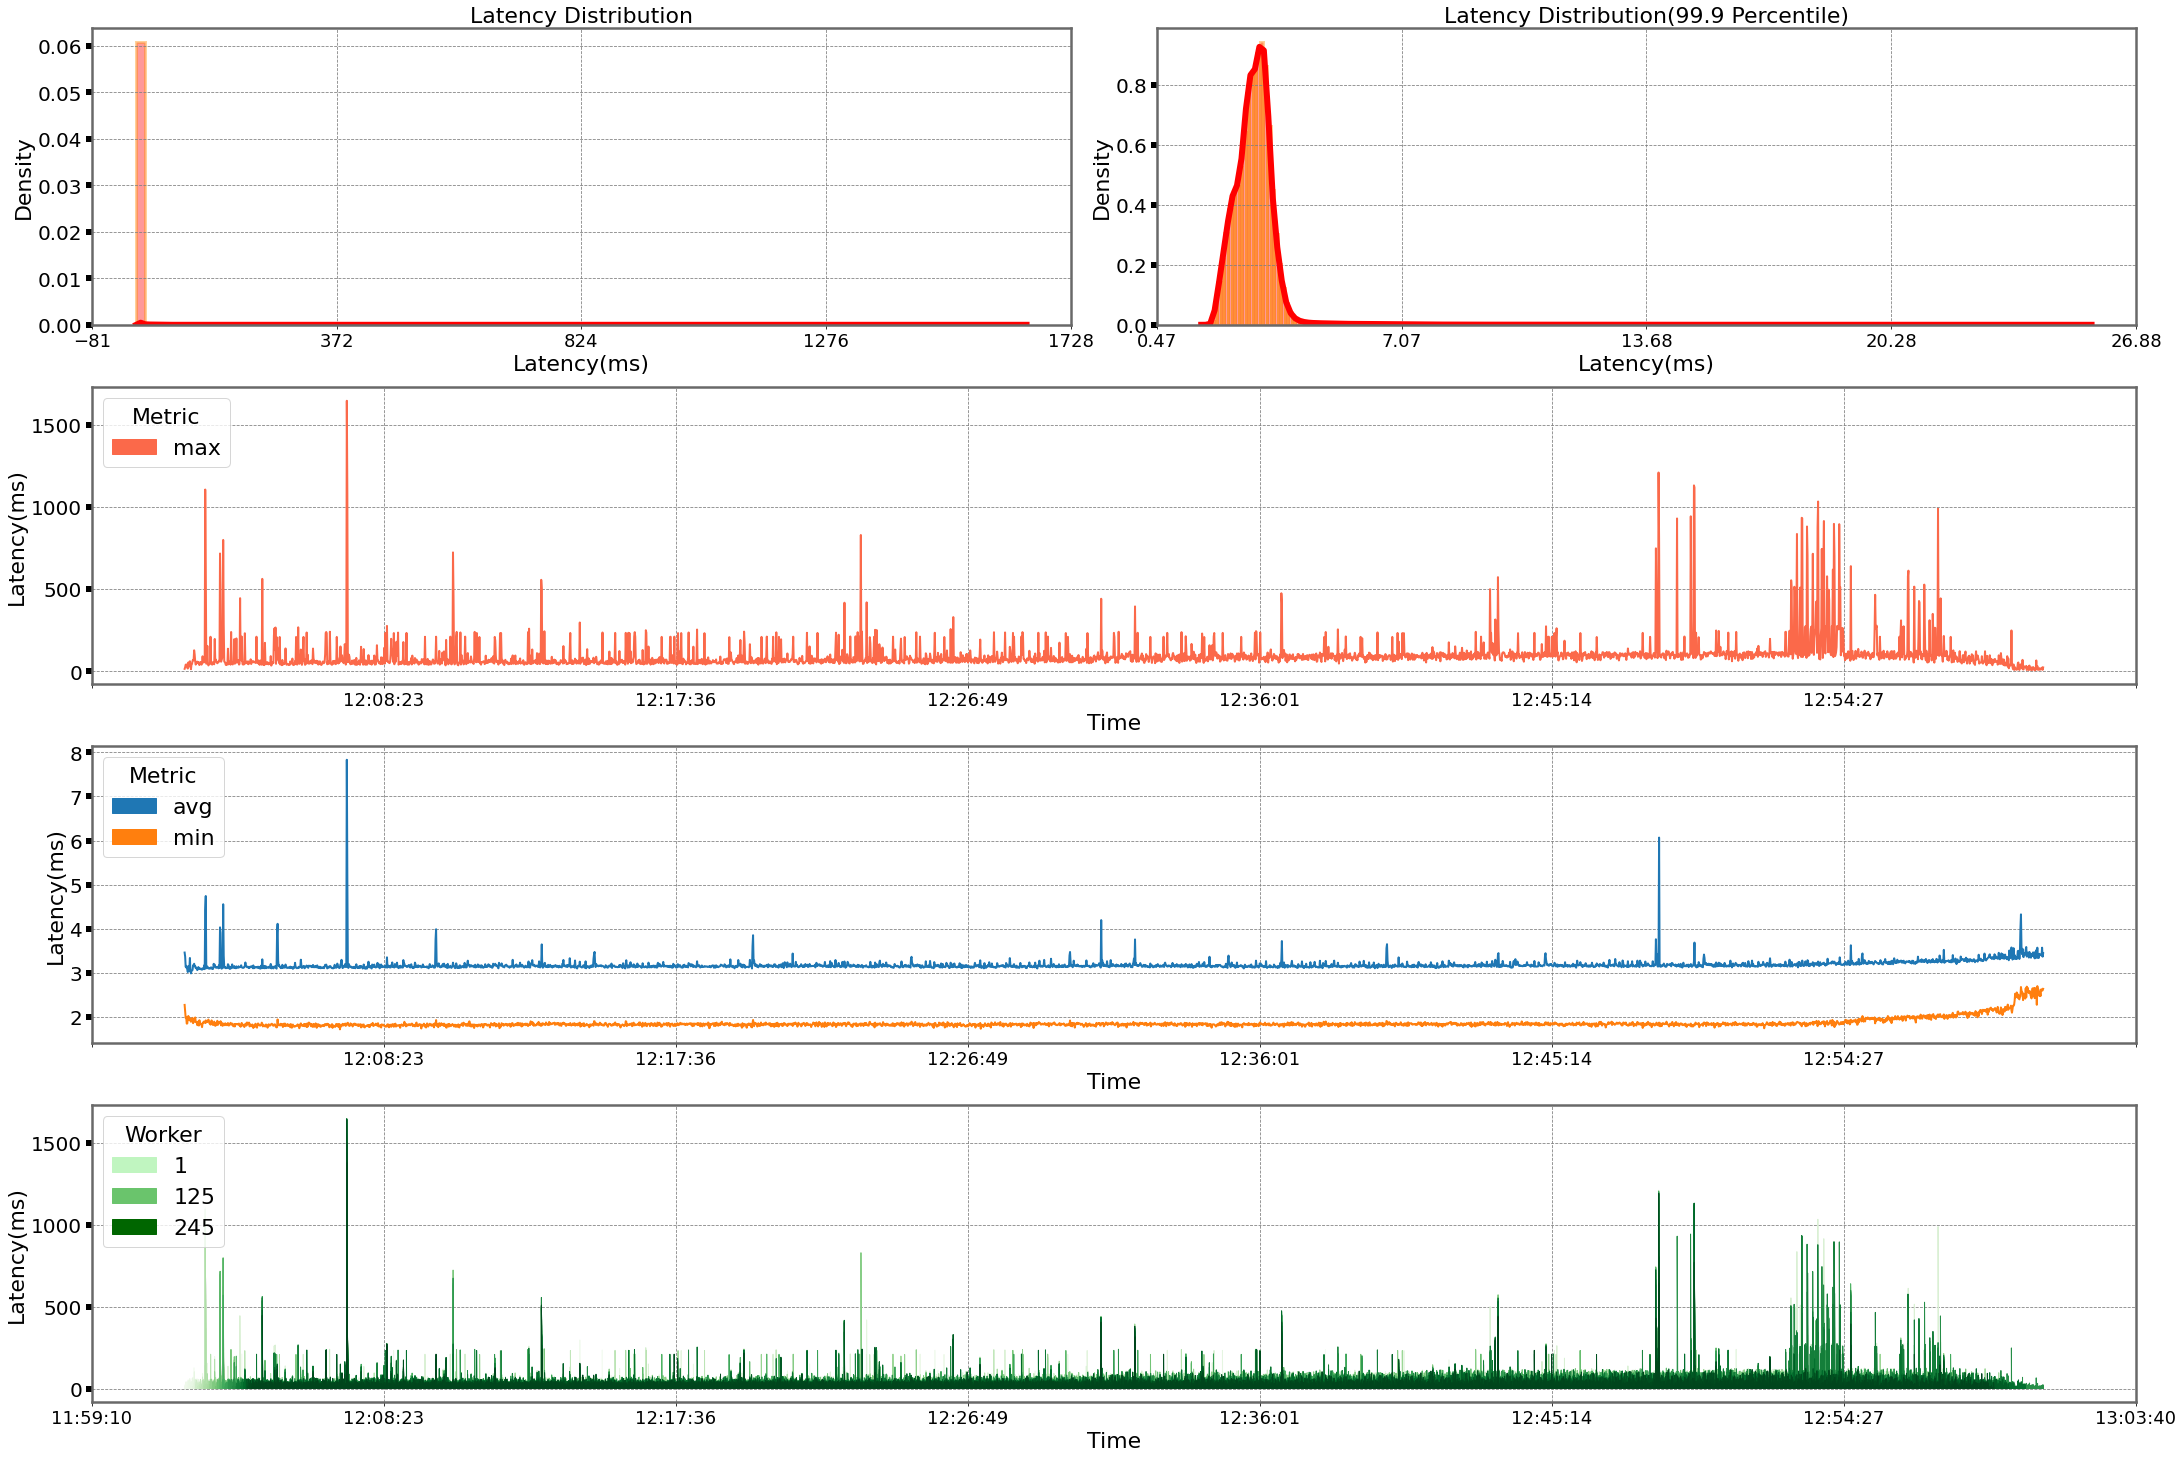
 Shaheer Mansoor is a Data Scientist at AWS. His focus is on building machine learning platforms that can host AI solutions at scale. His interest areas are ML Ops, Feature Stores, Model Hosting and Model Monitoring.
 Vadym Dolinin is a Machine Learning Architect in SumUp. He works with several teams on crafting the ML platform, which enables data scientists to build, deploy, and operate machine learning solutions in SumUp. Vadym has 13 years of experience in the domains of data engineering, analytics, BI, and ML.