Тази рубрика се казва „Възможното образование“ и започна през 2023 г. Преди да ѝ дадем име, я обсъждахме като идея и съдържание. Установихме, че темите, които ни вълнуват и предстои да излязат, са отвъд дидактиката, законите и наредбите, предметите, учебниците и строгите правила. Представяхме си цялостната картина зад конвенционалното образование, или иначе казано – онова, което би го направило съвременно, атрактивно и адекватно. Редакторката на рубриката беше и нейна кръстница – тя повярва в идеите и оптимистично реши, че промените и предизвикателствата в образователната система са възможни.
Нели Керемидчиева започва да се занимава с образование преди повече от 16 години с осъзнаването, че ще става родител. Тръгва да събира информация за всички образователни подходи и стига до демократичното образование. Тогава решава, че това е моделът, който иска за детето си. Присъединява се към движението от родители и учители, което създава впоследствие Демократичното училище в София. Превежда два филма за образование – испанския „Забраненото образование“ и немския „Свободен час“, а прожекциите им са пълни с будни родители, търсещи промяна.
През 2017 г. със съмишленици създава фестивала „(Не)Възможното образование“. След няколко успешни издания, през 2024 г. екипът решава да промени името на „Възможното образование“, за да отрази нарасналия брой образователни пространства в България, които реално практикуват човеколюбиво образование.
След разговора с Нели Керемидчиева дълго мислих как по неведоми пътища в тази рубрика се събират хора, които намират красотата в образованието и във всичките му проявления и посоки, въпреки че то на пръв поглед става все по-неадекватно. Дадох си сметка и че тазгодишното мото на фестивала „Възможното образование“ – „Свързване. Принадлежност. Общност“ – е основата, от която трябва да започнем да градим наново.
Как нещо от (не)възможно става възможно? И защо този (сякаш безпочвен) оптимизъм расте колективно с всяка година?
Как, кога и защо решихте да започнете с всичко?
С осъзнаването, че ще ставам родител, си дадох сметка, че ще отговарям за чисто ново човешко същество, за целия му живот и развитие. И въпреки че нямам лош опит от училище и от детската градина, не исках точно тези модели за моето дете. Започнах да се интересувам от образование, като първата ми стъпка бяха методите на възпитание.
Когато попаднах на една книга за Мария Монтесори, бях много впечатлена, че всъщност има коренно различна парадигма за възпитанието и въобще за детето. Този интерес започна да се задълбочава и изучавах всички образователни подходи – „Монтесори“, „Валдорф“, „Реджо Емилия“, сугестопедия и много други.
Много харесвам кино и се интересувам от него. В същото време ме интересуваше и образованието. И така, случайно или не, попаднах на документални фирми за образование, които много ме впечатлиха. Не спирах да мисля как, ако и други хора ги гледат, биха разбрали толкова много неща и биха променили коренно отношението си към децата, към възпитанието, към образованието. Много исках да направя нещо по този въпрос.
Имах опит с превод на един-два филма, но тези бяха повече – общо шест. Обсъждах го с приятелки, вече имахме малка общност покрай създаването на Демократичното училище. Когато разказах на преводачката Илияна Михайлова за тези филми и за желанието си да ги преведем и покажем, тя с лекота каза: „Хайде, ще направим фестивал.“ Това беше искрата! Тук е мястото да благодаря и на Катина Цолова, която е част от фестивала от създаването му, на Светлана Нанчева, която има голяма роля във възобновяването на събитието, както и на Петя Славова, Найден Йотов и Албена Радева, които са голяма подкрепа в последните две години.
След „Хайде, ще направим фестивал“, естествено, трябваше да се пише проект за финансиране, което направих за пръв път в живота си. Може би просто извадихме късмет, но проектът беше одобрен. Имахме финансиране за всички разходи и така възникна първият фестивал през 2018 г.
Кръстихме го „(Не)Възможното образование“, защото вече имах достатъчно опит покрай Демократичното училище, чийто съосновател съм. Та този опит беше, че когато разказвах на повечето хора за какъвто и да е различен метод от стандартния в нашите училища, реакцията им беше: „Това е много хубаво, но не е възможно.“ Тази реплика ме впечатли и си казах: „Защо пък да не е възможно?“
Фокусът на фестивала и на моята работа е по-скоро да въздействаме върху хората. Преките участници в образованието са родителите, учителите и децата. Децата няма какво да ги убеждаваме – те се поддават на онова, което ние им подаваме. Когато не виждат алтернатива, дори не могат да си я представят. Но родителите и учителите са хората, които трябва да могат да променят нещата.
Тоест вярвате в промяната „отдолу“. А къде е тук Министерството на образованието и науката (МОН)?
Много хора ме питат защо не отидем в Министерството. Ние винаги каним МОН на фестивала. С удоволствие бихме се срещнали с някого, който би откликнал. Бихме предоставили и материалите, които показваме. Чувала съм за истории от други страни – например в Холандия Министерството на образованието беше поканило едно демократично училище да направи обучение на тема „Самонасочено учене“. Но някак в България това досега не се случва.
Със сигурност знам от професионалисти в сферата, че има какво да бъде подобрено в нормативната рамка в България.
Но основното, което искаме да променим, е човеколюбието в образованието, отношенията. А те зависят от хората, не от образователната рамка.
Съвсем целенасочено търсим добрите примери именно в общински училища, за да стане видимо какво е възможно при настоящите условия.
Бих казала, че участниците в нашия фестивал са поравно учители и родители. Все по-голям интерес има и от училищни психолози. Те първи виждат децата в друг контекст, а не в този на „днес имаме да научим един урок“. Вярно, че първо ги срещат при проблеми, но се надявам и да търсят различни, адекватни начини за решаването им.
Кое Ви мотивира най-много?
Ентусиазмът на хората, които идват. От самото начало фестивалът е доброволческа инициатива. Хората от организационния екип имаме „истинска“ работа, а в свободното си време правим всичко възможно, за да се осъществи фестивалът. За това трябва много ентусиазъм.
Когато се събрахме първата година, не сме си и мислили, че ще има следваща. Но хората имаха нужда от съмишленици, от това да не се чувстват сами и неразбрани. Защото много учители, които се опитват да правят човеколюбиво образование, понякога се чувстват точно така. Никой не иска от тях да работят по подобен начин, не е част от длъжностната им характеристика, не е от значение за оценяването на работата им, колегите им не разбират защо толкова се стараят, каква е нуждата… Понякога и родителите не разбират и питат: „Защо давате толкова малко домашни?“ или „Защо не накажете някого?“.
И тези учители например имат много голяма нужда да са сред хора с подобни разбирания.
Няколко души са ни споделяли в прав текст: „Най-после разбирам, че не съм луд.“ Това за нас като организатори означаваше, че правим нещо важно.
Първоначално бях разочарована. Зрителите се допълваха по време на дискусиите. А аз исках да стигнем до хора, които не са чували например за Монтесори, и да им кажем: „Елате да видите!“
Но всъщност дойдоха хора, които не само бяха чували, но бяха доста навътре и напред в разбирането си за този тип образование. Не го научаваха от нас. Запитах се дали не сме се провалили, защото сме привлекли само онези, които са съгласни с това, което представяме.
И тогава променихме гледната си точка. Бяхме успели да съберем единомислещи хора, да ги подкрепим, да създадем общност от единиците. И другото голямо нещо беше, че събрахме родители и учители на едно място извън училищната обстановка. Дадохме им възможност да се видят като хора, да разберат, че всъщност целите им са сходни, да се разпознаят като партньори, а не като противници.
Какво ще намерим в настоящото издание на фестивала?
Тази година е петото. През 2020-та се наложи да го прекъснем, защото настъпи първият локдаун. Довършихме фестивала през лятото. Известно време просто участвахме с дейности в други събития и правехме някакви малки формати, които не изискват много усилия.
Възобновихме всичко миналата година. Тогава си дадох сметка колко е важно това събитие да е редовно. Бяхме загубили връзката с хората през годините, в които не провеждахме фестивала, те бяха охладнели към темата и инерцията беше загубена.
Тази година имаме десет събития, което е повече, отколкото смятахме да направим първоначално. Решихме темата ни да е „Свързване. Принадлежност. Общност“. Тя е толкова важна и основна в образованието, че всичко, до което се добрахме, искахме да влезе в програмата ни.
Темата се породи от нуждата да се върнем към основите на човешките взаимоотношения. Защото когато стане дума за образование, не говорим за тях, а за оценки, знания, упражнения, фактология – знае ли ученикът откъде извира и къде се влива река Марица.
Повтаря се „иновативно образование“, което не знам точно какво означава у нас. В човеколюбието в образованието няма нищо иновативно. Това са основите, от които трябва да тръгнем. След тях може да правим STEM кабинети и всичко останало.
Aко нямаме уважителни взаимоотношения на равнопоставеност, ако не разполагаме с умения да се справяме с конфликти, ако не развиваме положителна атмосфера в класа, всичко останало много трудно би ни се получило.
Когато се опитаме да сложим академичния успех преди развитието на личността, понякога може и да успеем, но задължително след това наблюдаваме дефицити. Липси, които се отразяват на тези хора по-късно в живота. Ето един пример: Наоми Алдорт е американска авторка, която много се занимава със самонасочено учене. Тя разказва историята на един известен и успял пианист. Той самият споделя, че има множество концерти, постига световни успехи, но няма удовлетворение от живота. Няма радост от това, което прави. Казва, че свири не защото му харесва, а защото просто е добър в свиренето. Тоест ние можем да станем добри в нещо, хората да ни аплодират и по всички стандарти да сме успешни. Но това в никакъв случай не ни гарантира, че ще сме удовлетворени.
Позволете си да помечтаете суперсмело. Нямаме граници в момента.
Да, много си мечтая. Най-голямата ми мечта е свързана с промяна в нагласите на хората. Дори не смея да го казвам, защото имам чувството, че няма да се случи, ако го говоря. Трябва да правим каквото можем, и да се надяваме, че след няколко години промяната ще се прояви в действие.
Най-лошото е, че в момента има течение наобратно – към повече контрол и стандартизиране. Ето например това с въвеждането на религията като задължителен учебен предмет. Дори не с цел да се изучават отделните религии, а като вероучение.
Това, за което мечтая, е родителите и учителите да могат да избират метода, който най-много им допада и е в съзвучие със семейството или характера им. Да имаме избор в образователен контекст сякаш не съществува като понятие в България. Хората живеят с идеята, че училището просто трябва да го „нагласим“; че трябва да е хубаво.
Сър Кен Робинсън казва: „Всеки разбира от образование.“ Когато се съберат хора и някой от тях спомене, че се занимава с образование, всеки от останалите има мнение за работата му.
Няма универсален модел. Ние не сме едни и същи хора и няма как всички да сме в едно и също нещо и да сме доволни. Това важи и за учителите – един би процъфтявал във валдорфско училище, за друг това би било мъчение. Той например би искал да е в проектно базирано училище, където нещата са по-структурирани, не толкова творчески. Разнообразието от образователни модели, позволяващо на всеки да намери своето място, е много сериозна част от моята мечта.
В основата на всичко е потенциалът. Много специалисти говорят за погубения потенциал. Всеки се ражда с нещо, с което може да има принос. Когато няма условия да разпознае кое е това специално нещо в него, няма възможност да се даде този принос и потенциалът се губи.
Нереализираният потенциал се натрупва в нас и в крайна сметка се превръщаме в нещастни хора, които постоянно мрънкат, все са недоволни, все някой друг им е виновен или някой друг трябва да дойде да им оправи нещата.
Не можем да си позволим повече да губим този потенциал. Всички тези хора биха могли да променят съдбата на човечеството.
Тазгодишното пето издание на фестивала ще се проведе от 5-ти до 8 март в Топлоцентрала със специален гост на заключителното събитие Ирина Манушева. Заявка за участие срещу скромно дарение можете да направите тук.
С настървено старание – сякаш се отдължавам – непрестанно попълвам ведомостта с малките изпитания. Спешното на „Токуда“, ступорът пред разританите в антрето чехли, нелепото падане на заледения тротоар, леденият игнор на всевластните анонимни сенки, безсилният, всепомитащ плач на детето ми всеки ден, всяка нощ… Малките изпитания – малки дяволи, зъбят се, хилят се, надзъртат отвсякъде, пъплят, хриптят, блъскат, събарят, разплискват кофи с неврастения, чернилки и страх, придърпват сърцето в петите ми, хороводят го лудо, бясно припламват и изгарят по нещичко всеки ден, всяка нощ…
Няма мир под маслините. Няма мир по земята. Няма мир в мен. Няма мир никъде. Никога. Напоследък.
Мирела Иванова
Мирела Иванова (р. 1962, София)е авторка на девет поетични книги, най-известните сред които са „Самотна игра“, „Памет за подробности“, „Разглобяване на играчките“, „Еклектики“ , „Любовите ни“, „Седем“, на сборниците с разкази „Бавно“ и „Всички разкази са за теб“, както и на два тома с публицистични текстове. Носителка е на национални и международни награди за поезия, сред които Наградата за модерна поезия от Източна и Югоизточна Европа, Националната награда „Христо Г. Данов“, наградите за поезия „Николай Кънчев“ и „Перото“, Голямата награда „Орфей“ за изключителен принос в поезията и др. Стиховете и разказите на Мирела Иванова са превеждани и публикувани на множество езици в представителни антологии на българската и европейската поезия и проза. Има две издадени поетични книги в Германия: „Самотна игра“ и „Сдобряване със студа“ в превод на Норберт Рандов и Габи Тиман. „Седем. Стихотворения с биографии“ излиза в Полша, преведена от Магдалена Питлак. Мирела Иванова е драматург в Народния театър „Иван Вазов“, на чиито камерни сцени с успех се играят пиесите ѝ „О, ти, която и да си…“ и „Бележките под линия“.
Според Екатерина Йосифова „четящият стихотворение сутрин… добре понася другите часове“ от деня. Убедени, че поезията държи умовете ни будни, а сърцата – отворени, в края на всеки месец ви предлагаме по едно стихотворение. Защото и в най-смутни времена доброто стихотворение е добра новина.
At 3 AM, a single IP requested a login page. Harmless. But then, across several hosts and paths, the same source began appending ?debug=true — the sign of an attacker probing the environment to assess the technology stack and plan a breach.
Minor misconfigurations, overlooked firewall events, or request anomalies feel harmless on their own. But when these small signals converge, they can explode into security incidents known as “toxic combinations.” These are exploits where an attacker discovers and compounds many minor issues — such as a debug flag left on a web application or an unauthenticated application path — to breach systems or exfiltrate data.
Cloudflare’s network observes requests to your stack, and as a result, has the data to identify these toxic combinations as they form. In this post, we’ll show you how we surface these signals from our application security data. We’ll go over the most common types of toxic combinations and the dangerous vulnerabilities they present. We will also provide details on how you can use this intelligence to identify and address weaknesses in your stack.
How we define toxic combinations
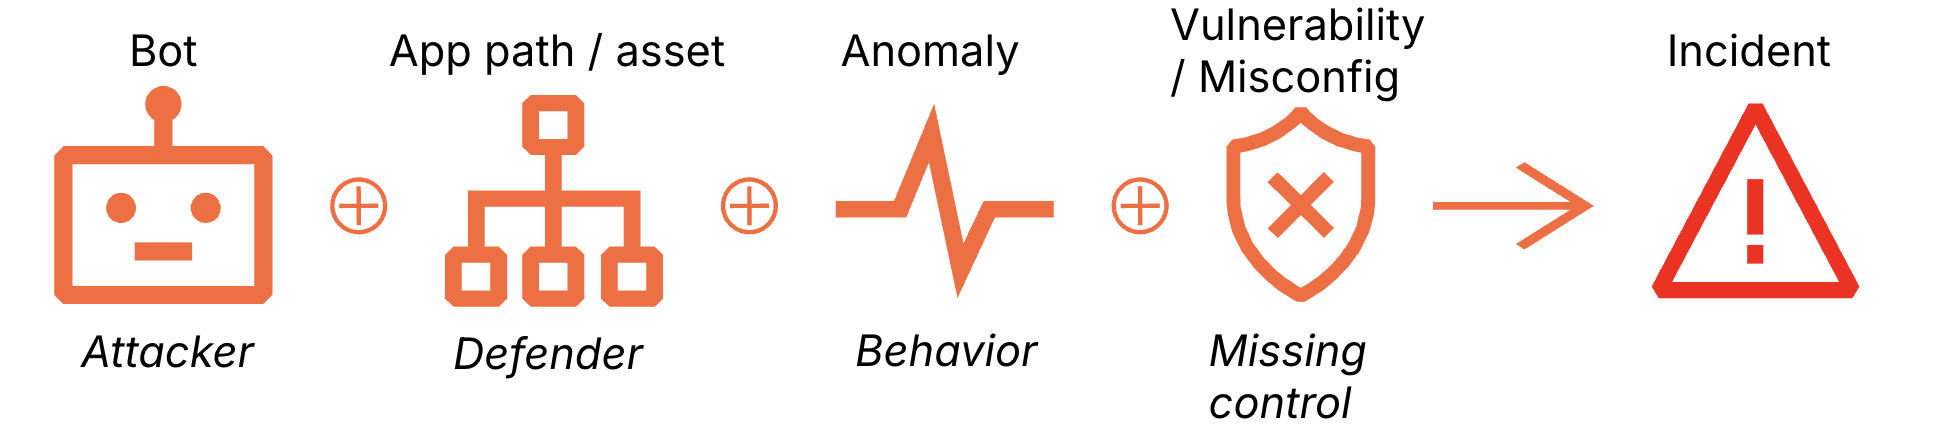
You could define a “toxic combination” in a few different ways, but here is a practical one based on how we look at our own datasets. Most web attacks eventually scale through automation; once an attacker finds a viable exploit, they’ll usually script it into a bot to finish the job. By looking at the intersection of bot traffic, specific application paths, request anomalies and misconfigurations, we can spot a potential breach. We use this framework to reason through millions of requests per second.
While point defenses like Web Application Firewalls (WAF), bot detection, and API protection have evolved to incorporate behavioral patterns and reputation signals, they still primarily focus on evaluating the risk of an individual request. In contrast, Cloudflare’s detections for “toxic combinations” shift the lens toward the broader intent, analyzing the confluence of context surrounding multiple signals to identify a brewing incident.
Toxic combinations as contextualized detections
That shift in perspective matters because many real incidents have no obvious exploit payload, no clean signatures, and no single event that screams “attack.” So, in what follows, we combine the following context to construct several toxic combinations:
Anomalies including: unexpected http codes, geo jumps, identity mismatch, high ID churn, rate-limit evasion (distributed IPs doing the same thing), request or success rate spikes
Vulnerabilities or misconfigurations: missing session cookies or auth headers, predictable identifiers
Examples of toxic combinations on popular application stacks
We looked at a 24-hour window of Cloudflare data to see how often these patterns actually appear in popular application stacks. As shown in the table below, about 11% of the hosts we analyzed were susceptible to these combinations, skewed by vulnerable WordPress websites. Excluding WordPress sites, only 0.25% of hosts show signs of exploitable toxic combinations. While rare, they represent hosts that are vulnerable to compromise.
To make sense of the data, we broke it down into three stages of an attack:
Estimated hosts probed: This is the “wide net.” It counts unique hosts where we saw HTTP requests targeting specific sensitive paths (like /wp-admin).
Estimated hosts filtered by toxic combination: Here, we narrowed the list down to the specific hosts that actually met our criteria for a toxic combination.
Estimated reachable hosts: Unique hosts that responded successfully to an exploit attempt—the “smoking gun” of an attack. A simple 200 OK response (such as one triggered by appending ?debug=true) could be a false positive. We validated paths to filter out noise caused by authenticated paths that require credentials despite the 200 status code, redirects that mask the true exploit path, and origin misconfigurations that serve success codes for unreachable paths.
In the next sections, we’ll dig into the specific findings and the logic behind the combinations that drove them. The detection queries provided are necessary but not sufficient without testing for reachability; it is possible that the findings might be false positives. In some cases, Cloudflare Log Explorer allows these queries to be executed on unsampled Cloudflare logs.
Table 1. Summary of Toxic Combinations
Probing of sensitive administrative endpoints across multiple application hosts
What did we detect?
We observed automated tools scanning common administrative login pages — like WordPress admin panels (/wp-admin), database managers, and server dashboards. A templatized version of the query, executable in Cloudflare Log Explorer, is below:
SELECT
  clientRequestHTTPHost,
  COUNT(*) AS request_count
FROM
  http_requests
WHERE
  timestamp >= '{{START_DATE}}'
  AND timestamp <= '{{END_DATE}}'
  AND edgeResponseStatus = 200
  AND clientRequestPath LIKE '{{PATH_PATTERN}}' //e.g. '%/wp-admin/%'
  AND NOT match( extract(clientRequestHTTPHost, '^[^:/]+'), '^\\d{1,3}(\\.\\d{1,3}){3}(:\\d+)?$') // comment this line for Cloudflare Log Explorer
  AND botScore < {{BOT_THRESHOLD}} // we used botScore < 30
GROUP BY
  clientRequestHTTPHost
ORDER BY
  request_count DESC;
Why is this serious?
Publicly accessible admin panels can enable brute force attacks. If successful, an attacker can further compromise the host by adding it to a botnet that probes additional websites for similar vulnerability. In addition, this toxic combination can lead to:
Exploit scanning: Attackers identify the specific software version you’re running (like Tomcat or WordPress) and launch targeted exploits for known vulnerabilities (CVEs).
User enumeration: Many admin panels accidentally reveal valid usernames, which helps attackers craft more convincing phishing or login attacks.
What evidence supports it?
Toxic combination of bots automation and exposed management interfaces like: /wp-admin/, /admin/, /administrator/, /actuator/*, /_search/, /phpmyadmin/, /manager/html/, and /app/kibana/.
Implement IP allowlist: Use your WAF or server configuration to ensure that administrative paths are only reachable from your corporate VPN or specific office IP addresses.
Cloak admin paths: If your platform allows it, rename default admin URLs (e.g., change /wp-admin to a unique, non-guessable string).
Deploy geo-blocking: If your administrators only operate from specific countries, block all traffic to these sensitive paths coming from outside those regions.
Enforce multi-factor authentication (MFA): Ensure every administrative entry point requires a second factor; a password alone is not enough to stop a dedicated crawler.
Unauthenticated public API endpoints allowing mass data exposure via predictable identifiers
What did we detect?
We found API endpoints that are accessible to anyone on the Internet without a password or login (see OWASP: API2:2023 – Broken Authentication). Even worse, the way it identifies records (using simple, predictable ID numbers,see OWASP: API1:2023- Broken Object Level Authorization) allows anyone to simply “count” through your database — making it much simpler for attackers to enumerate and “scrape” your business records, without even visiting your website directly.
SELECT
  uniqExact(clientRequestHTTPHost) AS unique_host_count
FROM  http_requests
WHERE timestamp >= '2026-02-13'
  AND timestamp <= '2026-02-14'
  AND edgeResponseStatus = 200
  AND bmScore < 30
  AND (
       match(extract(clientRequestQuery, '(?i)(?:^|[&?])uid=([^&]+)'),  '^[0-9]{3,10}$')
    OR match(extract(clientRequestQuery, '(?i)(?:^|[&?])user=([^&]+)'), '^[0-9]{3,10}$')
    OR length(extract(clientRequestQuery, '(?i)(?:^|[&?])uid=([^&]+)'))  BETWEEN 3 AND 8
    OR length(extract(clientRequestQuery, '(?i)(?:^|[&?])user=([^&]+)')) BETWEEN 3 AND 8
  )
Why is this serious?
This is a “zero-exploit” vulnerability, meaning an attacker doesn’t need to be a hacker to steal your data; they just need to change a number in a web link. This leads to:
Mass Data Exposure: Large-scale scraping of your entire customer dataset.
Secondary Attacks: Stolen data is used for targeted phishing or account takeovers.
Regulatory Risk: Severe privacy violations (GDPR/CCPA) due to exposing sensitive PII.
Fraud: Competitors or malicious actors gaining insight into your business volume and customer base.
What evidence supports it?
Toxic combination of missing security controls and automation targeting particular API endpoints.
Ingredient
Signal
Description
Bot activity
Bot Score < 30
High volume of requests from a single client fingerprint iterating through different IDs.
Anomaly
High Cardinality of tid
A single visitor accessing hundreds or thousands of unique resource IDs in a short window.
Anomaly
Stable Response Size
Consistent JSON structures and file sizes, indicating successful data retrieval for each guessed ID.
Vulnerability
Missing Auth Signals
Requests lack session cookies, Bearer tokens, or Authorization headers entirely.
Misconfiguration
Predictable Identifiers
The tid parameter uses low-entropy, predictable integers (e.g., 1001, 1002, 1003).
While the query checked for bot score and predictable identifiers, signals like high cardinality, stable response sizes and missing authentication were tested on a sample of traffic matching the query.
How do I mitigate this finding?
Enforce authentication: Immediately require a valid session or API key for the affected endpoint. Do not allow “Anonymous” access to data containing PII or business secrets.
Implement authorization (IDOR check): Ensure the backend checks that the authenticated user actually has permission to view the specific tid they are requesting.
Use UUIDs: Replace predictable, sequential integer IDs with long, random strings (UUIDs) to make “guessing” identifiers computationally impossible.
Deploy API Shield: Enable Cloudflare API Shield with features like Schema Validation (to block unexpected inputs) and BOLA Detection.
Debug parameter probing revealing system details
What did we detect?
We found evidence of debug=true appended to web paths to reveal system details. A templatized version of the query, executable in Cloudflare Log Explorer, is below:
SELECT
  clientRequestHTTPHost,
  COUNT(rayId) AS request_count
FROM
  http_requests
WHERE
  timestamp >= '{{START_TIMESTAMP}}'
  AND timestamp < '{{END_TIMESTAMP}}'
  AND edgeResponseStatus = 200
  AND clientRequestQuery LIKE '%debug=false%'
  AND botScore < {{BOT_THRESHOLD}}
GROUP BY
  clientRequestHTTPHost
ORDER BY
  request_count DESC;
Why is this serious?
While this doesn’t steal data instantly, it provides an attacker with a high-definition map of your internal infrastructure. This “reconnaissance” makes their next attack much more likely to succeed because they can see:
Hidden data fields: Sensitive internal information that isn’t supposed to be visible to users.
Technology stack details: Specific software versions and server types, allowing them to look up known vulnerabilities for those exact versions.
Logic hints: Error messages or stack traces that explain exactly how your code works, helping them find ways to break it.
What evidence supports it?
Toxic combination of automated probing and misconfigured diagnostic flags targeting the Multiple Hosts and Application Paths.
Ingredient
Signal
Description
Bot activity
Bot Score < 30
Vulnerability scanner activity
Anomaly
Response Size Increase
Significant jumps in data volume when a debug flag is toggled, indicating details or stack traces are being leaked. Add these additional conditions, if needed:
Rapid-fire requests across diverse endpoints (e.g., /api, /login, /search) specifically testing for the same diagnostic triggers. Add these conditions, if needed:
SELECT
APPROX_DISTINCT(clientRequestPath) AS unique_endpoints_tested
HAVING
unique_endpoints_tested > 1
Misconfiguration
Debug Parameter Allowed
The presence of active “debug,” “test,” or “dev” flags in production URLs that change application behavior.
Vulnerability
Schema disclosure
The appearance of internal-only JSON fields or “Firebase-style” .json dumps that reveal the underlying structure.
While the query checked for bot score and paths with debug parameters, signals like repeated probing, response sizes and schema disclosure were tested on a sample of traffic matching the query.
How do I mitigate this finding?
Disable debugging in production: Ensure that all “debug” or “development” environment variables are strictly set to false in your production deployment configurations.
Filter parameters at the edge: Use your WAF or API Gateway to strip out known debug parameters (like ?debug=, ?test=, ?trace=) before they ever reach your application servers.
Sanitize error responses: Configure your web servers (Nginx, Apache, etc.) to show generic error pages instead of detailed stack traces or internal system messages.
Audit firebase/DB rules: If you are using Firebase or similar NoSQL databases, ensure that /.json path access is restricted via strict security rules, so public users cannot dump the entire schema or data.
We discovered “health check” and monitoring dashboards are visible to the entire Internet. Specifically, paths like /actuator/metrics are responding to anyone who asks. A templatized version of the query, executable in Cloudflare Log Explorer, is below::
SELECT
  clientRequestHTTPHost,
  count() AS request_count
FROM http_requests
WHERE timestamp >= toDateTime('{{START_DATE}}')
  AND timestamp <  toDateTime('{{END_DATE}}')
  AND botScore < 30
  AND edgeResponseStatus = 200
  AND clientRequestPath LIKE '%/actuator/metrics%' // an example
GROUP BY
  clientRequestHTTPHost
ORDER BY request_count DESC
Why is this serious?
While these endpoints don’t usually leak customer passwords directly, they provide the “blueprints” for a sophisticated attack. Exposure leads to:
Strategic timing: Attackers can monitor your CPU and memory usage in real-time to launch a Denial of Service (DoS) attack exactly when your systems are already stressed.
Infrastructure mapping: These logs often reveal the names of internal services, dependencies, and version numbers, helping attackers find known vulnerabilities to exploit.
Exploitation chaining: Information about thread counts and environment hints can be used to bypass security layers or escalate privileges within your network.
What evidence supports it?
Toxic combination of misconfigured access controls and automated reconnaissance targeting the Asset/Path: /actuator/metrics, /actuator/prometheus, and /health.
Ingredient
Signal
Description
Bot activity
Bot Score < 30
Automated scanning tools are systematically checking for specific paths
Anomaly
Monitoring Fingerprint
The response body matches known formats (Prometheus, Micrometer, or Spring Boot), confirming the system is leaking live data.
Anomaly
HTTP 200 Status
Successful data retrieval from endpoints that should ideally return a 403 Forbidden or 404 Not Found to the public.
Misconfiguration
Public Monitoring Path
Public accessibility of internal-only endpoints like /actuator/* that are intended for private observability.
Vulnerability
Missing Auth
These endpoints are reachable without a session token, API key, or IP-based restriction.
How do I mitigate this finding?
Restrict access via WAF: Immediately create a firewall rule to block any external traffic requesting paths containing /actuator/ or /prometheus.
Bind to localhost: Reconfigure your application frameworks to only serve these monitoring endpoints on localhost (127.0.0.1) or a private management network.
Enforce basic auth: If these must be accessed over the web, ensure they are protected by strong authentication (at a minimum, complex Basic Auth or mTLS).
Disable unnecessary endpoints: In Spring Boot or similar frameworks, disable any “Actuator” features that are not strictly required for production monitoring.
Unauthenticated search endpoints allowing direct index dumping
What did we detect?
Search endpoints (like Elasticsearch or OpenSearch) that are usually meant for internal use are wide open to the public. The templatized query is:
SELECT
  clientRequestHTTPHost,
  count() AS request_count
FROM http_requests
WHERE timestamp >= toDateTime('{{START_DATE}}')
  AND timestamp <  toDateTime('{{END_DATE}}')
  AND botScore < 30
  AND edgeResponseStatus = 200
AND clientRequestPath like '%/\_search%'
AND NOT match(extract(clientRequestHTTPHost, '^[^:/]+'), '^\\d{1,3}(\\.\\d{1,3}){3}(:\\d+)?$')
GROUP BY
  clientRequestHTTPHost
Why is this serious?
This is a critical vulnerability because it requires zero technical skill to exploit, yet the damage is extensive:
Mass data theft: Attackers can “dump” entire indices, stealing millions of records in minutes.
Internal reconnaissance: By viewing your “indices” (the list of what you store), attackers can identify other high-value targets within your network.
Data sabotage: Depending on the setup, an attacker might not just read data — they could potentially modify or delete your entire search index, causing a massive service outage.
What evidence supports it?
We are seeing a toxic combination of misconfigured exposure and automated traffic and data enumeration targeting /_search, /_cat/indices, and /_cluster/health.
Ingredient
Signal
Description
Bot activity
Bot Score < 30
High-velocity automation signatures attempting to paginate through large datasets and “scrape” the entire index.
Anomaly
Unexpected Response Size
Large JSON response sizes consistent with bulk data retrieval rather than simple status checks.
Anomaly
Repeated Query Patterns
Systematic “enumeration” behavior where the attacker is cycling through every possible index name to find sensitive data.
Vulnerability
/_search or /_cat/ Patterns
Direct exposure of administrative and query-level paths that should never be reachable via a public URL.
Misconfiguration
HTTP 200 Status
The endpoint is actively fulfilling requests from unauthorized external IPs instead of rejecting them at the network or application level.
While the query checked for bot score and paths, signals like repeated query patterns, response sizes, and schema disclosure were tested on a sample of traffic matching the query.
How do I mitigate this finding?
Restrict network access: Immediately update your Firewall/Security Groups to ensure that search ports (e.g., 9200, 9300) and paths are only accessible from specific internal IP addresses.
Enable authentication: Turn on “Security” features for your search cluster (like Shield or Search Guard) to require valid credentials for every API call.
WAF blocking: Deploy a WAF rule to immediately block any request containing /_search, /_cat, or /_cluster coming from the public Internet.
Audit for data loss: Review your database logs for large “Scroll” or “Search” queries from unknown IPs to determine exactly how much data was exfiltrated.
Successful SQL injection attempt on application paths
What did we detect?
We’ve identified attackers who sent a malicious request—specifically a SQL injection designed to trick databases. A templatized version of the query, executable in Cloudflare Log Explorer, is below:
SELECT
  clientRequestHTTPHost,
  count() AS request_count
FROM http_requests
WHERE timestamp >= toDateTime('{{START_DATE}}')
  AND timestamp <  toDateTime('{{END_DATE}}')
  AND botScore < 30
AND wafmlScore<30
  AND edgeResponseStatus = 200
AND LOWER(clientRequestQuery) LIKE '%sleep(%'
GROUP BY
  clientRequestHTTPHost
ORDER BY request_count DESC
Why is this serious?
This is the “quiet path” to a data breach. Because the system returned a successful status code (HTTP 200), these attacks often blend in with legitimate traffic. If left unaddressed, an attacker can:
Refine their methods: Use trial and error to find the exact payload that bypasses your filters.
Exfiltrate data: Slowly drain database contents or leak sensitive secrets (like API keys) passed in URLs.
Stay invisible: Most automated alerts look for “denied” attempts; a “successful” exploit is much harder to spot in a sea of logs.
What evidence supports it?
We are seeing a toxic combination of automated bot signals, anomalies and application-layer vulnerabilities targeting many application paths.
Ingredient
Signal
Description
Bot
Bot Score < 30
High probability of automated traffic; signatures and timing consistent with exploit scripts.
Anomaly
HTTP 200 on sensitive path
Successful responses returning from a login endpoint that should have triggered a WAF block.
Anomaly
Repeated Mutations
High-frequency variations of the same request, indicating an attacker “tuning” their payload.
Vulnerability
Suspicious Query Patterns
Use of SLEEP commands and time-based patterns designed to probe database responsiveness.
How do I mitigate this finding?
Immediate virtual patching: Update your WAF rules to specifically block the SQL patterns identified (e.g., time-based probes).
Sanitize inputs: Review the backend code for this path to ensure it uses prepared statements or parameterized queries.
Remediate secret leakage: Move any sensitive data from URL parameters to the request body or headers. Rotate any keys flagged as leaked.
Audit logs: Check database logs for the timeframe of the “HTTP 200” responses to see if any data was successfully extracted.
Examples of toxic combinations on payment flows
Card testing and card draining are some of the most common fraud tactics. An attacker might buy a large batch of credit cards from the dark web. Then, to verify how many cards are still valid, they might test the card on a website by making small transactions. Once validated, they might use such cards to make purchases, such as gift cards, on popular shopping destinations.
Suspected card testing on payment flows
What did we detect?
On payment flows (/payment, /checkout, /cart), we found certain hours of the day when either the hourly request volume from bots or hourly payment success ratio spiked by more than 3 standard deviations from their hourly baselines over the prior 30 days. This could be related to card testing where an attacker is trying to validate lots of stolen credits. Of course, marketing campaigns might cause request spikes while payment outages might cause sudden drops in success ratios.
Why is this serious?
Payment success ratio drops coinciding with request spikes, in the absence of marketing campaigns or payment outages or other factors, could mean bots are in the middle of a massive card-testing run.
What evidence supports it?
We used a combination of bot signals and anomalies on /payment, /checkout, /cart:
Ingredient
Signal
Description
Bot
Bot Score < 30
High probability of automated traffic rather than humans making mistakes
Anomaly
Volume Z-Score> 3.0, calculated from request volume baseline for a given hour based on the past 30 days and evaluated each hour. This factors daily seasonality as well.
Scaling Event: The attacker is testing a batch of cards
Anomaly
Success ratio Z> 3.0, calculated from success ratio baseline for a given hour based on the past 30 days and evaluated each hour. This factors daily seasonality as well.
Sudden drops in success ratio may mean cards being declined as they are reported lost or stolen
How do I mitigate this?
Use the 30-day payment paths hourly request volume baseline as the hourly rate limit for all requests with bot scores < 30 on payment paths.
Suspected card draining on payment flows
What did we detect?
On payment flows (/payment, /checkout, /cart), we found certain hours of the day when either the hourly request volume from humans (or bots impersonating humans) or hourly payment success ratio spiked by more than 3 standard deviations from their hourly baselines over the prior 30 days. This could be related to card draining where an attacker (either humans or bots impersonating humans) is trying to purchase goods using valid but stolen credits. Of course, marketing campaigns might also cause request and success ratio spikes, so additional context in the form of typical payment requests from a given IP address is essential context, as shown in the figure.
Why is this serious?
Payment success ratio spikes coinciding with request spikes and high density of requests per IP address, in the absence of marketing campaigns or payment outages or other factors, could mean humans (or bots pretending to be humans) are making fraudulent purchases. Every successful transaction here could be a direct revenue loss or a chargeback in the making.
What evidence supports it?
We used a combination of bot signals and anomalies on /payment, /checkout, /cart:
Ingredient
Signal
Description
Bot
Bot Score >= 30
High probability of human traffic which is expected to be allowed
Anomaly
Volume Z-Score > 3.0, calculated from request volume baseline for a given hour based on the past 30 days and evaluated each hour. This factors daily seasonality as well.
The attacker is making purchases at higher rates than normal shoppers
Anomaly
Success ratio Z > 3.0, calculated from success ratio baseline for a given hour based on the past 30 days and evaluated each hour. This factors daily seasonality as well.
Sudden increases in success ratio may mean valid cards being approved for purchase
Anomaly
IP density > 5, calculated from payment requests per IP in any given hour divided by the average payment requests for that hour based on the past 30 days
Humans with 5X more purchases than typical humans in the past 30 days is a red flag
Anomaly
JA4 diversity < 0.1, calculated from JA4s per payment requests in any given hour
JA4s with unusual hourly purchases are likely bots pretending to be humans
How do I mitigate this?
Identity-Based Rate Limiting: Use IP density to implement rate limits for requests with bot score >=30 on payment endpoints.
Monitor success ratio: Alert on any hour when the success ratio for “human” traffic, with bot score >=30 on payment endpoints, deviates by more than 3 standard deviations from its 30-day baseline.
Challenge: If a high bot score request (likely human) hits payment flows more than 3 times in 10 minutes, trigger a challenge to slow them down
What’s next: detections in the dashboard, AI-powered remediation
We are currently working on integrating these “toxic combination” detections directly into the Security Insights dashboard to provide immediate visibility for such risks. Our roadmap includes building AI-assisted remediation paths — where the dashboard doesn’t just show you a toxic combination, but proposes the specific WAF rule or API Shield configuration required to neutralize it.
We would love to have you try our Security Insights featuring toxic combinations. You can join the waitlist here.
Handling data in streams is fundamental to how we build applications. To make streaming work everywhere, the WHATWG Streams Standard (informally known as “Web streams”) was designed to establish a common API to work across browsers and servers. It shipped in browsers, was adopted by Cloudflare Workers, Node.js, Deno, and Bun, and became the foundation for APIs like fetch(). It’s a significant undertaking, and the people who designed it were solving hard problems with the constraints and tools they had at the time.
But after years of building on Web streams – implementing them in both Node.js and Cloudflare Workers, debugging production issues for customers and runtimes, and helping developers work through far too many common pitfalls – I’ve come to believe that the standard API has fundamental usability and performance issues that cannot be fixed easily with incremental improvements alone. The problems aren’t bugs; they’re consequences of design decisions that may have made sense a decade ago, but don’t align with how JavaScript developers write code today.
This post explores some of the fundamental issues I see with Web streams and presents an alternative approach built around JavaScript language primitives that demonstrate something better is possible.
In benchmarks, this alternative can run anywhere between 2x to 120x faster than Web streams in every runtime I’ve tested it on (including Cloudflare Workers, Node.js, Deno, Bun, and every major browser). The improvements are not due to clever optimizations, but fundamentally different design choices that more effectively leverage modern JavaScript language features. I’m not here to disparage the work that came before; I’m here to start a conversation about what can potentially come next.
Where we’re coming from
The Streams Standard was developed between 2014 and 2016 with an ambitious goal to provide “APIs for creating, composing, and consuming streams of data that map efficiently to low-level I/O primitives.” Before Web streams, the web platform had no standard way to work with streaming data.
Node.js already had its own streaming API at the time that was ported to also work in browsers, but WHATWG chose not to use it as a starting point given that it is chartered to only consider the needs of Web browsers. Server-side runtimes only adopted Web streams later, after Cloudflare Workers and Deno each emerged with first-class Web streams support and cross-runtime compatibility became a priority.
The design of Web streams predates async iteration in JavaScript. The for await...of syntax didn’t land until ES2018, two years after the Streams Standard was initially finalized. This timing meant the API couldn’t initially leverage what would eventually become the idiomatic way to consume asynchronous sequences in JavaScript. Instead, the spec introduced its own reader/writer acquisition model, and that decision rippled through every aspect of the API.
Excessive ceremony for common operations
The most common task with streams is reading them to completion. Here’s what that looks like with Web streams:
// First, we acquire a reader that gives an exclusive lock
// on the stream...
const reader = stream.getReader();
const chunks = [];
try {
  // Second, we repeatedly call read and await on the returned
  // promise to either yield a chunk of data or indicate we're
  // done.
  while (true) {
    const { value, done } = await reader.read();
    if (done) break;
    chunks.push(value);
  }
} finally {
  // Finally, we release the lock on the stream
  reader.releaseLock();
}
You might assume this pattern is inherent to streaming. It isn’t. The reader acquisition, the lock management, and the { value, done } protocol are all just design choices, not requirements. They are artifacts of how and when the Web streams spec was written. Async iteration exists precisely to handle sequences that arrive over time, but async iteration did not yet exist when the streams specification was written. The complexity here is pure API overhead, not fundamental necessity.
Consider the alternative approach now that Web streams now do support for await...of:
const chunks = [];
for await (const chunk of stream) {
  chunks.push(chunk);
}
This is better in that there is far less boilerplate, but it doesn’t solve everything. Async iteration was retrofitted onto an API that wasn’t designed for it, and it shows. Features like BYOB (bring your own buffer) reads aren’t accessible through iteration. The underlying complexity of readers, locks, and controllers are still there, just hidden. When something does go wrong, or when additional features of the API are needed, developers find themselves back in the weeds of the original API, trying to understand why their stream is “locked” or why releaseLock() didn’t do what they expected or hunting down bottlenecks in code they don’t control.
The locking problem
Web streams use a locking model to prevent multiple consumers from interleaving reads. When you call getReader(), the stream becomes locked. While locked, nothing else can read from the stream directly, pipe it, or even cancel it – only the code that is actually holding the reader can.
This sounds reasonable until you see how easily it goes wrong:
async function peekFirstChunk(stream) {
  const reader = stream.getReader();
  const { value } = await reader.read();
  // Oops — forgot to call reader.releaseLock()
  // And the reader is no longer available when we return
  return value;
}

const first = await peekFirstChunk(stream);
// TypeError: Cannot obtain lock — stream is permanently locked
for await (const chunk of stream) { /* never runs */ }
Forgetting releaseLock() permanently breaks the stream. The lockedproperty tells you that a stream is locked, but not why, by whom, or whether the lock is even still usable. Piping internally acquires locks, making streams unusable during pipe operations in ways that aren’t obvious.
The semantics around releasing locks with pending reads were also unclear for years. If you called read() but didn’t await it, then called releaseLock(), what happened? The spec was recently clarified to cancel pending reads on lock release – but implementations varied, and code that relied on the previous unspecified behavior can break.
That said, it’s important to recognize that locking in itself is not bad. It does, in fact, serve an important purpose to ensure that applications properly and orderly consume or produce data. The key challenge is with the original manual implementation of it using APIs like getReader() and releaseLock(). With the arrival of automatic lock and reader management with async iterables, dealing with locks from the users point of view became a lot easier.
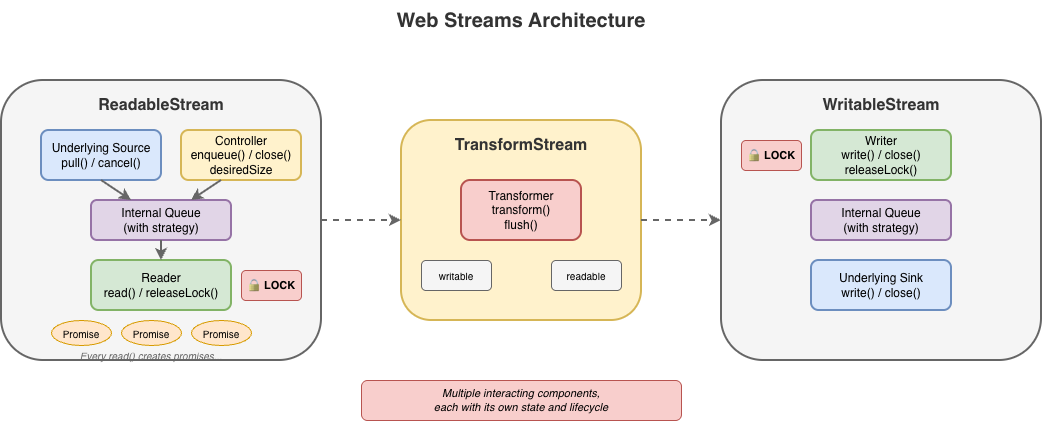
For implementers, the locking model adds a fair amount of non-trivial internal bookkeeping. Every operation must check lock state, readers must be tracked, and the interplay between locks, cancellation, and error states creates a matrix of edge cases that must all be handled correctly.
BYOB: complexity without payoff
BYOB (bring your own buffer) reads were designed to let developers reuse memory buffers when reading from streams, an important optimization intended for high-throughput scenarios. The idea is sound: instead of allocating new buffers for each chunk, you provide your own buffer and the stream fills it.
In practice, (and yes, there are always exceptions to be found) BYOB is rarely used to any measurable benefit. The API is substantially more complex than default reads, requiring a separate reader type (ReadableStreamBYOBReader) and other specialized classes (e.g. ReadableStreamBYOBRequest), careful buffer lifecycle management, and understanding of ArrayBuffer detachment semantics. When you pass a buffer to a BYOB read, the buffer becomes detached – transferred to the stream – and you get back a different view over potentially different memory. This transfer-based model is error-prone and confusing:
const reader = stream.getReader({ mode: 'byob' });
const buffer = new ArrayBuffer(1024);
let view = new Uint8Array(buffer);

const result = await reader.read(view);
// 'view' should now be detached and unusable
// (it isn't always in every impl)
// result.value is a NEW view, possibly over different memory
view = result.value; // Must reassign
BYOB also can’t be used with async iteration or TransformStreams, so developers who want zero-copy reads are forced back into the manual reader loop.
For implementers, BYOB adds significant complexity. The stream must track pending BYOB requests, handle partial fills, manage buffer detachment correctly, and coordinate between the BYOB reader and the underlying source. The Web Platform Tests for readable byte streams include dedicated test files just for BYOB edge cases: detached buffers, bad views, response-after-enqueue ordering, and more.
BYOB ends up being complex for both users and implementers, yet sees little adoption in practice. Most developers stick with default reads and accept the allocation overhead.
Most userland implementations of custom ReadableStream instances do not typically bother with all the ceremony required to correctly implement both default and BYOB read support in a single stream – and for good reason. It’s difficult to get right and most of the time consuming code is typically going to fallback on the default read path. The example below shows what a “correct” implementation would need to do. It’s big, complex, and error prone, and not a level of complexity that the typical developer really wants to have to deal with:
new ReadableStream({
    type: 'bytes',

    async pull(controller: ReadableByteStreamController) {
      if (offset >= totalBytes) {
        controller.close();
        return;
      }

      // Check for BYOB request FIRST
      const byobRequest = controller.byobRequest;

      if (byobRequest) {
        // === BYOB PATH ===
        // Consumer provided a buffer - we MUST fill it (or part of it)
        const view = byobRequest.view!;
        const bytesAvailable = totalBytes - offset;
        const bytesToWrite = Math.min(view.byteLength, bytesAvailable);

        // Create a view into the consumer's buffer and fill it
        // not critical but safer when bytesToWrite != view.byteLength
        const dest = new Uint8Array(
          view.buffer,
          view.byteOffset,
          bytesToWrite
        );

        // Fill with sequential bytes (our "data source")
        // Can be any thing here that writes into the view
        for (let i = 0; i < bytesToWrite; i++) {
          dest[i] = (offset + i) & 0xFF;
        }

        offset += bytesToWrite;

        // Signal how many bytes we wrote
        byobRequest.respond(bytesToWrite);

      } else {
        // === DEFAULT READER PATH ===
        // No BYOB request - allocate and enqueue a chunk
        const bytesAvailable = totalBytes - offset;
        const chunkSize = Math.min(1024, bytesAvailable);

        const chunk = new Uint8Array(chunkSize);
        for (let i = 0; i < chunkSize; i++) {
          chunk[i] = (offset + i) & 0xFF;
        }

        offset += chunkSize;
        controller.enqueue(chunk);
      }
    },

    cancel(reason) {
      console.log('Stream canceled:', reason);
    }
  });
When a host runtime provides a byte-oriented ReadableStream from the runtime itself, for instance, as the body of a fetch Response, it is often far easier for the runtime itself to provide an optimized implementation of BYOB reads, but those still need to be capable of handling both default and BYOB reading patterns and that requirement brings with it a fair amount of complexity.
Backpressure: good in theory, broken in practice
Backpressure – the ability for a slow consumer to signal a fast producer to slow down – is a first-class concept in Web streams. In theory. In practice, the model has some serious flaws.
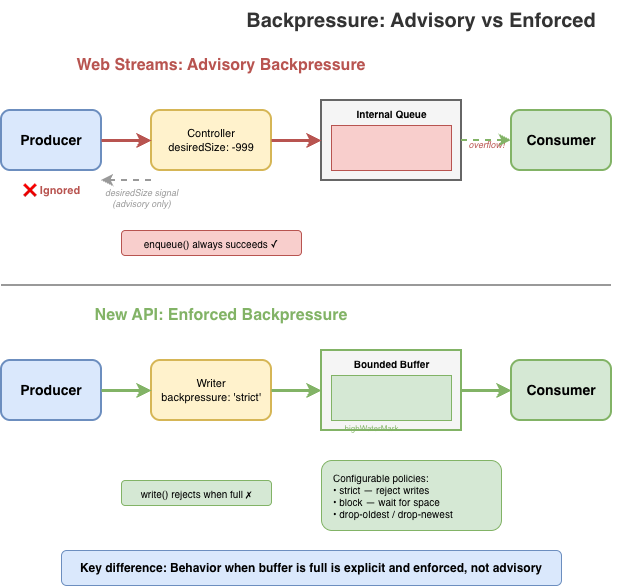
The primary signal is desiredSize on the controller. It can be positive (wants data), zero (at capacity), negative (over capacity), or null (closed). Producers are supposed to check this value and stop enqueueing when it’s not positive. But there’s nothing enforcing this: controller.enqueue() always succeeds, even when desiredSize is deeply negative.
new ReadableStream({
  start(controller) {
    // Nothing stops you from doing this
    while (true) {
      controller.enqueue(generateData()); // desiredSize: -999999
    }
  }
});
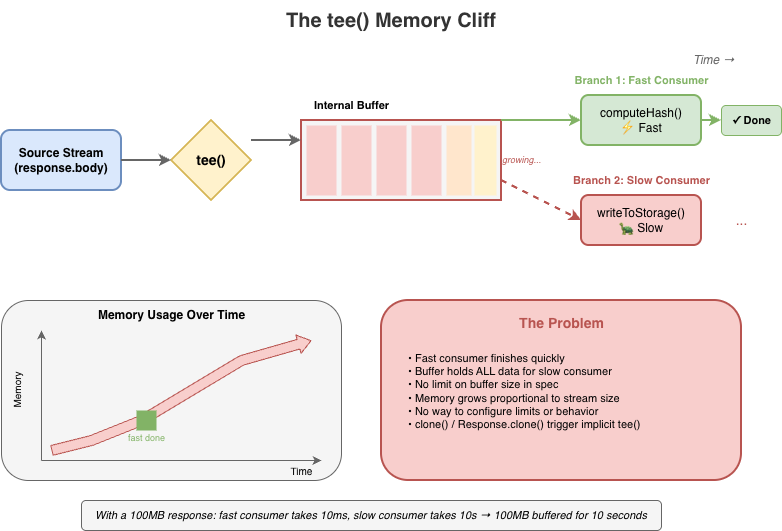
Stream implementations can and do ignore backpressure; and some spec-defined features explicitly break backpressure. tee(), for instance, creates two branches from a single stream. If one branch reads faster than the other, data accumulates in an internal buffer with no limit. A fast consumer can cause unbounded memory growth while the slow consumer catches up, and there’s no way to configure this or opt out beyond canceling the slower branch.
Web streams do provide clear mechanisms for tuning backpressure behavior in the form of the highWaterMark option and customizable size calculations, but these are just as easy to ignore as desiredSize, and many applications simply fail to pay attention to them.
The same issues exist on the WritableStream side. A WritableStream has a highWaterMark and desiredSize. There is a writer.ready promise that producers of data are supposed to pay attention but often don’t.
const writable = getWritableStreamSomehow();
const writer = writable.getWriter();

// Producers are supposed to wait for the writer.ready
// It is a promise that, when resolves, indicates that
// the writables internal backpressure is cleared and
// it is ok to write more data
await writer.ready;
await writer.write(...);
For implementers, backpressure adds complexity without providing guarantees. The machinery to track queue sizes, compute desiredSize, and invoke pull() at the right times must all be implemented correctly. However, since these signals are advisory, all that work doesn’t actually prevent the problems backpressure is supposed to solve.
The hidden cost of promises
The Web streams spec requires promise creation at numerous points, often in hot paths and often invisible to users. Each read() call doesn’t just return a promise; internally, the implementation creates additional promises for queue management, pull() coordination, and backpressure signaling.
This overhead is mandated by the spec’s reliance on promises for buffer management, completion, and backpressure signals. While some of it is implementation-specific, much of it is unavoidable if you’re following the spec as written. For high-frequency streaming – video frames, network packets, real-time data – this overhead is significant.
The problem compounds in pipelines. Each TransformStream adds another layer of promise machinery between source and sink. The spec doesn’t define synchronous fast paths, so even when data is available immediately, the promise machinery still runs.
For implementers, this promise-heavy design constrains optimization opportunities. The spec mandates specific promise resolution ordering, making it difficult to batch operations or skip unnecessary async boundaries without risking subtle compliance failures. There are many hidden internal optimizations that implementers do make but these can be complicated and difficult to get right.
While I was writing this blog post, Vercel’s Malte Ubl published their own blog post describing some research work Vercel has been doing around improving the performance of Node.js’ Web streams implementation. In that post they discuss the same fundamental performance optimization problem that every implementation of Web streams face:
“Or consider pipeTo(). Each chunk passes through a full Promise chain: read, write, check backpressure, repeat. An {value, done} result object is allocated per read. Error propagation creates additional Promise branches.
None of this is wrong. These guarantees matter in the browser where streams cross security boundaries, where cancellation semantics need to be airtight, where you do not control both ends of a pipe. But on the server, when you are piping React Server Components through three transforms at 1KB chunks, the cost adds up.
We benchmarked native WebStream pipeThrough at 630 MB/s for 1KB chunks. Node.js pipeline() with the same passthrough transform: ~7,900 MB/s. That is a 12x gap, and the difference is almost entirely Promise and object allocation overhead.”
– Malte Ubl, https://vercel.com/blog/we-ralph-wiggumed-webstreams-to-make-them-10x-faster
As part of their research, they have put together a set of proposed improvements for Node.js’ Web streams implementation that will eliminate promises in certain code paths which can yield a significant performance boost up to 10x faster, which only goes to prove the point: promises, while useful, add significant overhead. As one of the core maintainers of Node.js, I am looking forward to helping Malte and the folks at Vercel get their proposed improvements landed!
In a recent update made to Cloudflare Workers, I made similar kinds of modifications to an internal data pipeline that reduced the number of JavaScript promises created in certain application scenarios by up to 200x. The result is several orders of magnitude improvement in performance in those applications.
Real-world failures
Exhausting resources with unconsumed bodies
When fetch() returns a response, the body is a ReadableStream. If you only check the status and don’t consume or cancel the body, what happens? The answer varies by implementation, but a common outcome is resource leakage.
async function checkEndpoint(url) {
  const response = await fetch(url);
  return response.ok; // Body is never consumed or cancelled
}

// In a loop, this can exhaust connection pools
for (const url of urls) {
  await checkEndpoint(url);
}
This pattern has caused connection pool exhaustion in Node.js applications using undici (the fetch() implementation built into Node.js), and similar issues have appeared in other runtimes. The stream holds a reference to the underlying connection, and without explicit consumption or cancellation, the connection may linger until garbage collection – which may not happen soon enough under load.
The problem is compounded by APIs that implicitly create stream branches. Request.clone() and Response.clone() perform implicit tee() operations on the body stream – a detail that’s easy to miss. Code that clones a request for logging or retry logic may unknowingly create branched streams that need independent consumption, multiplying the resource management burden.
Now, to be certain, these types of issues are implementation bugs. The connection leak was definitely something that undici needed to fix in its own implementation, but the complexity of the specification does not make dealing with these types of issues easy.
“Cloning streams in Node.js’s fetch() implementation is harder than it looks. When you clone a request or response body, you’re calling tee() – which splits a single stream into two branches that both need to be consumed. If one consumer reads faster than the other, data buffers unbounded in memory waiting for the slow branch. If you don’t properly consume both branches, the underlying connection leaks. The coordination required between two readers sharing one source makes it easy to accidentally break the original request or exhaust connection pools. It’s a simple API call with complex underlying mechanics that are difficult to get right.” – Matteo Collina, Ph.D. – Platformatic Co-Founder & CTO, Node.js Technical Steering Committee Chair
Falling headlong off the tee() memory cliff
tee() splits a stream into two branches. It seems straightforward, but the implementation requires buffering: if one branch is read faster than the other, the data must be held somewhere until the slower branch catches up.
const [forHash, forStorage] = response.body.tee();

// Hash computation is fast
const hash = await computeHash(forHash);

// Storage write is slow — meanwhile, the entire stream
// may be buffered in memory waiting for this branch
await writeToStorage(forStorage);
The spec does not mandate buffer limits for tee(). And to be fair, the spec allows implementations to implement the actual internal mechanisms for tee()and other APIs in any way they see fit so long as the observable normative requirements of the specification are met. But if an implementation chooses to implement tee() in the specific way described by the streams specification, then tee() will come with a built-in memory management issue that is difficult to work around.
Implementations have had to develop their own strategies for dealing with this. Firefox initially used a linked-list approach that led to O(n) memory growth proportional to the consumption rate difference. In Cloudflare Workers, we opted to implement a shared buffer model where backpressure is signaled by the slowest consumer rather than the fastest.
Transform backpressure gaps
TransformStream creates a readable/writable pair with processing logic in between. The transform() function executes on write, not on read. Processing of the transform happens eagerly as data arrives, regardless of whether any consumer is ready. This causes unnecessary work when consumers are slow, and the backpressure signaling between the two sides has gaps that can cause unbounded buffering under load. The expectation in the spec is that the producer of the data being transformed is paying attention to the writer.ready signal on the writable side of the transform but quite often producers just simply ignore it.
If the transform’s transform() operation is synchronous and always enqueues output immediately, it never signals backpressure back to the writable side even when the downstream consumer is slow. This is a consequence of the spec design that many developers completely overlook. In browsers, where there’s only a single user and typically only a small number of stream pipelines active at any given time, this type of foot gun is often of no consequence, but it has a major impact on server-side or edge performance in runtimes that serve thousands of concurrent requests.
const fastTransform = new TransformStream({
  transform(chunk, controller) {
    // Synchronously enqueue — this never applies backpressure
    // Even if the readable side's buffer is full, this succeeds
    controller.enqueue(processChunk(chunk));
  }
});

// Pipe a fast source through the transform to a slow sink
fastSource
  .pipeThrough(fastTransform)
  .pipeTo(slowSink);  // Buffer grows without bound
What TransformStreams are supposed to do is check for backpressure on the controller and use promises to communicate that back to the writer:
const fastTransform = new TransformStream({
  async transform(chunk, controller) {
    if (controller.desiredSize <= 0) {
      // Wait on the backpressure to clear somehow
    }

    controller.enqueue(processChunk(chunk));
  }
});
A difficulty here, however, is that the TransformStreamDefaultController does not have a ready promise mechanism like Writers do; so the TransformStream implementation would need to implement a polling mechanism to periodically check when controller.desiredSize becomes positive again.
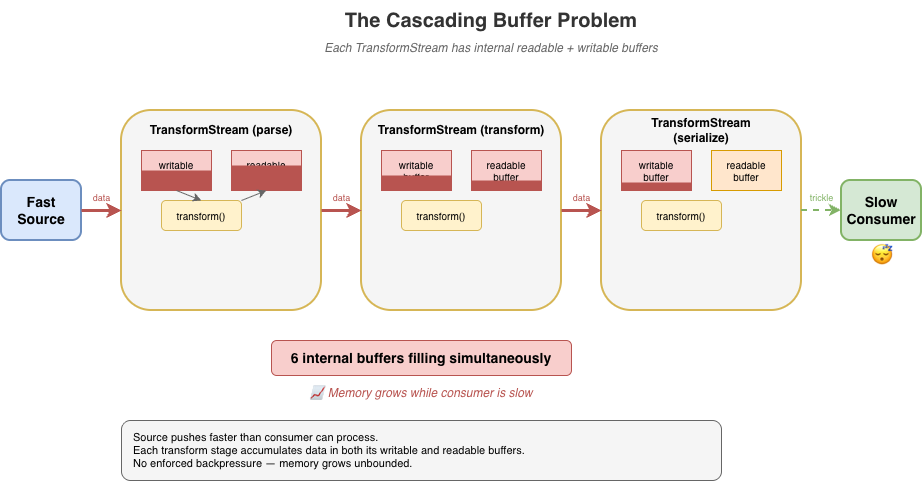
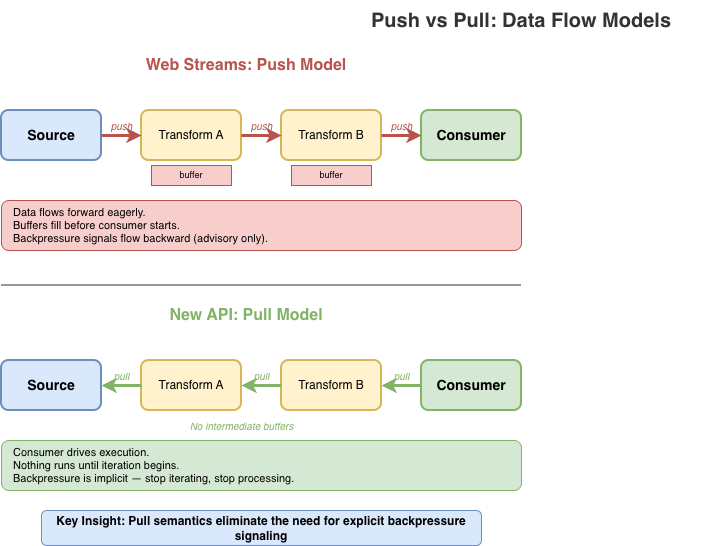
The problem gets worse in pipelines. When you chain multiple transforms – say, parse, transform, then serialize – each TransformStream has its own internal readable and writable buffers. If implementers follow the spec strictly, data cascades through these buffers in a push-oriented fashion: the source pushes to transform A, which pushes to transform B, which pushes to transform C, each accumulating data in intermediate buffers before the final consumer has even started pulling. With three transforms, you can have six internal buffers filling up simultaneously.
Developers using the streams API are expected to remember to use options like highWaterMark when creating their sources, transforms, and writable destinations but often they either forget or simply choose to ignore it.
source
  .pipeThrough(parse)      // buffers filling...
  .pipeThrough(transform)  // more buffers filling...
  .pipeThrough(serialize)  // even more buffers...
  .pipeTo(destination);    // consumer hasn't started yet
Implementations have found ways to optimize transform pipelines by collapsing identity transforms, short-circuiting non-observable paths, deferring buffer allocation, or falling back to native code that does not run JavaScript at all. Deno, Bun, and Cloudflare Workers have all successfully implemented “native path” optimizations that can help eliminate much of the overhead, and Vercel’s recent fast-webstreams research is working on similar optimizations for Node.js. But the optimizations themselves add significant complexity and still can’t fully escape the inherently push-oriented model that TransformStream uses.
GC thrashing in server-side rendering
Streaming server-side rendering (SSR) is a particularly painful case. A typical SSR stream might render thousands of small HTML fragments, each passing through the streams machinery:
// Each component enqueues a small chunk
function renderComponent(controller) {
  controller.enqueue(encoder.encode(`<div>${content}</div>`));
}

// Hundreds of components = hundreds of enqueue calls
// Each one triggers promise machinery internally
for (const component of components) {
  renderComponent(controller);  // Promises created, objects allocated
}
Every fragment means promises created for read() calls, promises for backpressure coordination, intermediate buffer allocations, and { value, done } result objects – most of which become garbage almost immediately.
Under load, this creates GC pressure that can devastate throughput. The JavaScript engine spends significant time collecting short-lived objects instead of doing useful work. Latency becomes unpredictable as GC pauses interrupt request handling. I’ve seen SSR workloads where garbage collection accounts for a substantial portion (up to and beyond 50%) of total CPU time per request. That’s time that could be spent actually rendering content.
The irony is that streaming SSR is supposed to improve performance by sending content incrementally. But the overhead of the streams machinery can negate those gains, especially for pages with many small components. Developers sometimes find that buffering the entire response is actually faster than streaming through Web streams, defeating the purpose entirely.
The optimization treadmill
To achieve usable performance, every major runtime has resorted to non-standard internal optimizations for Web streams. Node.js, Deno, Bun, and Cloudflare Workers have all developed their own workarounds. This is particularly true for streams wired up to system-level I/O, where much of the machinery is non-observable and can be short-circuited.
Finding these optimization opportunities can itself be a significant undertaking. It requires end-to-end understanding of the spec to identify which behaviors are observable and which can safely be elided. Even then, whether a given optimization is actually spec-compliant is often unclear. Implementers must make judgment calls about which semantics they can relax without breaking compatibility. This puts enormous pressure on runtime teams to become spec experts just to achieve acceptable performance.
These optimizations are difficult to implement, frequently error-prone, and lead to inconsistent behavior across runtimes. Bun’s “Direct Streams” optimization takes a deliberately and observably non-standard approach, bypassing much of the spec’s machinery entirely. Cloudflare Workers’ IdentityTransformStream provides a fast-path for pass-through transforms but is Workers-specific and implements behaviors that are not standard for a TransformStream. Each runtime has its own set of tricks and the natural tendency is toward non-standard solutions, because that’s often the only way to make things fast.
This fragmentation hurts portability. Code that performs well on one runtime may behave differently (or poorly) on another, even though it’s using “standard” APIs. The complexity burden on runtime implementers is substantial, and the subtle behavioral differences create friction for developers trying to write cross-runtime code, particularly those maintaining frameworks that must be able to run efficiently across many runtime environments.
It is also necessary to emphasize that many optimizations are only possible in parts of the spec that are unobservable to user code. The alternative, like Bun “Direct Streams”, is to intentionally diverge from the spec-defined observable behaviors. This means optimizations often feel “incomplete”. They work in some scenarios but not in others, in some runtimes but not others, etc. Every such case adds to the overall unsustainable complexity of the Web streams approach which is why most runtime implementers rarely put significant effort into further improvements to their streams implementations once the conformance tests are passing.
Implementers shouldn’t need to jump through these hoops. When you find yourself needing to relax or bypass spec semantics just to achieve reasonable performance, that’s a sign something is wrong with the spec itself. A well-designed streaming API should be efficient by default, not require each runtime to invent its own escape hatches.
The compliance burden
A complex spec creates complex edge cases. The Web Platform Tests for streams span over 70 test files, and while comprehensive testing is a good thing, what’s telling is what needs to be tested.
Consider some of the more obscure tests that implementations must pass:
Prototype pollution defense: One test patches Object.prototype.then to intercept promise resolutions, then verifies that pipeTo() and tee() operations don’t leak internal values through the prototype chain. This tests a security property that only exists because the spec’s promise-heavy internals create an attack surface.
WebAssembly memory rejection: BYOB reads must explicitly reject ArrayBuffers backed by WebAssembly memory, which look like regular buffers but can’t be transferred. This edge case exists because of the spec’s buffer detachment model – a simpler API wouldn’t need to handle it.
Crash regression for state machine conflicts: A test specifically checks that calling byobRequest.respond() after enqueue() doesn’t crash the runtime. This sequence creates a conflict in the internal state machine — the enqueue() fulfills the pending read and should invalidate the byobRequest, but implementations must gracefully handle the subsequent respond() rather than corrupting memory in order to cover the very likely possibility that developers are not using the complex API correctly.
These aren’t contrived scenarios invented by test authors in total vacuum. They’re consequences of the spec’s design and reflect real world bugs.
For runtime implementers, passing the WPT suite means handling intricate corner cases that most application code will never encounter. The tests encode not just the happy path but the full matrix of interactions between readers, writers, controllers, queues, strategies, and the promise machinery that connects them all.
A simpler API would mean fewer concepts, fewer interactions between concepts, and fewer edge cases to get right resulting in more confidence that implementations actually behave consistently.
The takeaway
Web streams are complex for users and implementers alike. The problems with the spec aren’t bugs. They emerge from using the API exactly as designed. They aren’t issues that can be fixed solely through incremental improvements. They’re consequences of fundamental design choices. To improve things we need different foundations.
A better streams API is possible
After implementing the Web streams spec multiple times across different runtimes and seeing the pain points firsthand, I decided it was time to explore what a better, alternative streaming API could look like if designed from first principles today.
What follows is a proof of concept: it’s not a finished standard, not a production-ready library, not even necessarily a concrete proposal for something new, but a starting point for discussion that demonstrates the problems with Web streams aren’t inherent to streaming itself; they’re consequences of specific design choices that could be made differently. Whether this exact API is the right answer is less important than whether it sparks a productive conversation about what we actually need from a streaming primitive.
What is a stream?
Before diving into API design, it’s worth asking: what is a stream?
At its core, a stream is just a sequence of data that arrives over time. You don’t have all of it at once. You process it incrementally as it becomes available.
Unix pipes are perhaps the purest expression of this idea:
cat access.log | grep "error" | sort | uniq -c
Data flows left to right. Each stage reads input, does its work, writes output. There’s no pipe reader to acquire, no controller lock to manage. If a downstream stage is slow, upstream stages naturally slow down as well. Backpressure is implicit in the model, not a separate mechanism to learn (or ignore).
In JavaScript, the natural primitive for “a sequence of things that arrive over time” is already in the language: the async iterable. You consume it with for await...of. You stop consuming by stopping iteration.
This is the intuition the new API tries to preserve: streams should feel like iteration, because that’s what they are. The complexity of Web streams – readers, writers, controllers, locks, queuing strategies – obscures this fundamental simplicity. A better API should make the simple case simple and only add complexity where it’s genuinely needed.
Design principles
I built the proof-of-concept alternative around a different set of principles.
Streams are iterables.
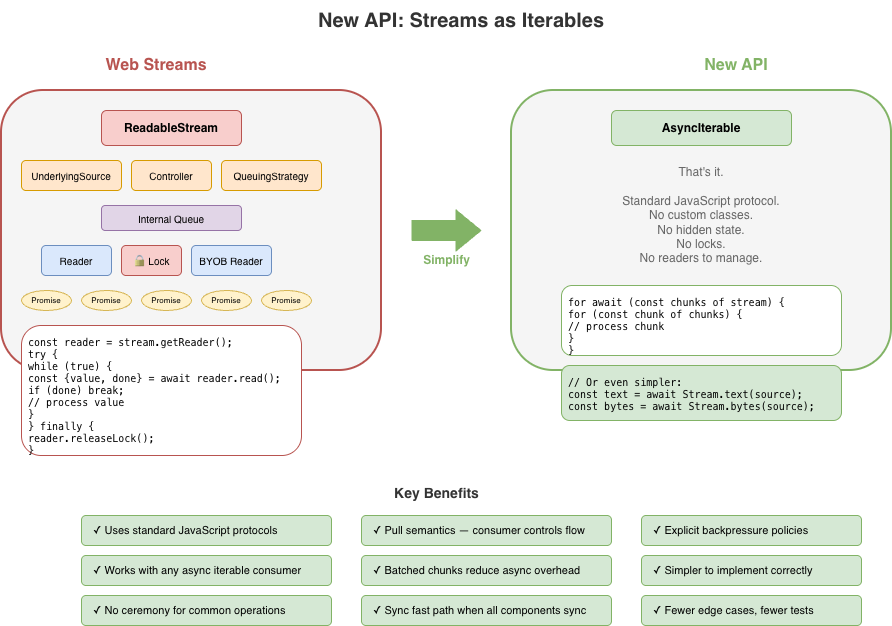
No custom ReadableStream class with hidden internal state. A readable stream is just an AsyncIterable<Uint8Array[]>. You consume it with for await...of. No readers to acquire, no locks to manage.
Pull-through transforms
Transforms don’t execute until the consumer pulls. There’s no eager evaluation, no hidden buffering. Data flows on-demand from source, through transforms, to the consumer. If you stop iterating, processing stops.
Explicit backpressure
Backpressure is strict by default. When a buffer is full, writes reject rather than silently accumulating. You can configure alternative policies – block until space is available, drop oldest, drop newest – but you have to choose explicitly. No more silent memory growth.
Batched chunks
Instead of yielding one chunk per iteration, streams yield Uint8Array[]: arrays of chunks. This amortizes the async overhead across multiple chunks, reducing promise creation and microtask latency in hot paths.
Bytes only
The API deals exclusively with bytes (Uint8Array). Strings are UTF-8 encoded automatically. There’s no “value stream” vs “byte stream” dichotomy. If you want to stream arbitrary JavaScript values, use async iterables directly. While the API uses Uint8Array, it treats chunks as opaque. There is no partial consumption, no BYOB patterns, no byte-level operations within the streaming machinery itself. Chunks go in, chunks come out, unchanged unless a transform explicitly modifies them.
Synchronous fast paths matter
The API recognizes that synchronous data sources are both necessary and common. The application should not be forced to always accept the performance cost of asynchronous scheduling simply because that’s the only option provided. At the same time, mixing sync and async processing can be dangerous. Synchronous paths should always be an option and should always be explicit.
The new API in action
Creating and consuming streams
In Web streams, creating a simple producer/consumer pair requires TransformStream, manual encoding, and careful lock management:
const { readable, writable } = new TransformStream();
const enc = new TextEncoder();
const writer = writable.getWriter();
await writer.write(enc.encode("Hello, World!"));
await writer.close();
writer.releaseLock();

const dec = new TextDecoder();
let text = '';
for await (const chunk of readable) {
  text += dec.decode(chunk, { stream: true });
}
text += dec.decode();
Even this relatively clean version requires: a TransformStream, manual TextEncoder and TextDecoder, and explicit lock release.
Here’s the equivalent with the new API:
import { Stream } from 'new-streams';

// Create a push stream
const { writer, readable } = Stream.push();

// Write data — backpressure is enforced
await writer.write("Hello, World!");
await writer.end();

// Consume as text
const text = await Stream.text(readable);
The readable is just an async iterable. You can pass it to any function that expects one, including Stream.text() which collects and decodes the entire stream.
The writer has a simple interface: write(), writev() for batched writes, end() to signal completion, and abort() for errors. That’s essentially it.
The Writer is not a concrete class. Any object that implements write(), end(), and abort() can be a writer making it easy to adapt existing APIs or create specialized implementations without subclassing. There’s no complex UnderlyingSink protocol with start(), write(), close(), and abort() callbacks that must coordinate through a controller whose lifecycle and state are independent of the WritableStream it is bound to.
Here’s a simple in-memory writer that collects all written data:
// A minimal writer implementation — just an object with methods
function createBufferWriter() {
  const chunks = [];
  let totalBytes = 0;
  let closed = false;

  const addChunk = (chunk) => {
    chunks.push(chunk);
    totalBytes += chunk.byteLength;
  };

  return {
    get desiredSize() { return closed ? null : 1; },

    // Async variants
    write(chunk) { addChunk(chunk); },
    writev(batch) { for (const c of batch) addChunk(c); },
    end() { closed = true; return totalBytes; },
    abort(reason) { closed = true; chunks.length = 0; },

    // Sync variants return boolean (true = accepted)
    writeSync(chunk) { addChunk(chunk); return true; },
    writevSync(batch) { for (const c of batch) addChunk(c); return true; },
    endSync() { closed = true; return totalBytes; },
    abortSync(reason) { closed = true; chunks.length = 0; return true; },

    getChunks() { return chunks; }
  };
}

// Use it
const writer = createBufferWriter();
await Stream.pipeTo(source, writer);
const allData = writer.getChunks();
No base class to extend, no abstract methods to implement, no controller to coordinate with. Just an object with the right shape.
Pull-through transforms
Under the new API design, transforms should not perform any work until the data is being consumed. This is a fundamental principle.
// Nothing executes until iteration begins
const output = Stream.pull(source, compress, encrypt);

// Transforms execute as we iterate
for await (const chunks of output) {
  for (const chunk of chunks) {
    process(chunk);
  }
}
Stream.pull() creates a lazy pipeline. The compress and encrypt transforms don’t run until you start iterating output. Each iteration pulls data through the pipeline on demand.
This is fundamentally different from Web streams’ pipeThrough(), which starts actively pumping data from the source to the transform as soon as you set up the pipe. Pull semantics mean you control when processing happens, and stopping iteration stops processing.
Transforms can be stateless or stateful. A stateless transform is just a function that takes chunks and returns transformed chunks:
// Stateless transform — a pure function
// Receives chunks or null (flush signal)
const toUpperCase = (chunks) => {
  if (chunks === null) return null; // End of stream
  return chunks.map(chunk => {
    const str = new TextDecoder().decode(chunk);
    return new TextEncoder().encode(str.toUpperCase());
  });
};

// Use it directly
const output = Stream.pull(source, toUpperCase);
Stateful transforms are simple objects with member functions that maintain state across calls:
// Stateful transform — a generator that wraps the source
function createLineParser() {
  // Helper to concatenate Uint8Arrays
  const concat = (...arrays) => {
    const result = new Uint8Array(arrays.reduce((n, a) => n + a.length, 0));
    let offset = 0;
    for (const arr of arrays) { result.set(arr, offset); offset += arr.length; }
    return result;
  };

  return {
    async *transform(source) {
      let pending = new Uint8Array(0);

      for await (const chunks of source) {
        if (chunks === null) {
          // Flush: yield any remaining data
          if (pending.length > 0) yield [pending];
          continue;
        }

        // Concatenate pending data with new chunks
        const combined = concat(pending, ...chunks);
        const lines = [];
        let start = 0;

        for (let i = 0; i < combined.length; i++) {
          if (combined[i] === 0x0a) { // newline
            lines.push(combined.slice(start, i));
            start = i + 1;
          }
        }

        pending = combined.slice(start);
        if (lines.length > 0) yield lines;
      }
    }
  };
}

const output = Stream.pull(source, createLineParser());
For transforms that need cleanup on abort, add an abort handler:
// Stateful transform with resource cleanup
function createGzipCompressor() {
  // Hypothetical compression API...
  const deflate = new Deflater({ gzip: true });

  return {
    async *transform(source) {
      for await (const chunks of source) {
        if (chunks === null) {
          // Flush: finalize compression
          deflate.push(new Uint8Array(0), true);
          if (deflate.result) yield [deflate.result];
        } else {
          for (const chunk of chunks) {
            deflate.push(chunk, false);
            if (deflate.result) yield [deflate.result];
          }
        }
      }
    },
    abort(reason) {
      // Clean up compressor resources on error/cancellation
    }
  };
}
For implementers, there’s no Transformer protocol with start(), transform(), flush() methods and controller coordination passed into a TransformStream class that has its own hidden state machine and buffering mechanisms. Transforms are just functions or simple objects: far simpler to implement and test.
Explicit backpressure policies
When a bounded buffer fills up and a producer wants to write more, there are only a few things you can do:
Reject the write: refuse to accept more data
Wait: block until space becomes available
Discard old data: evict what’s already buffered to make room
Discard new data: drop what’s incoming
That’s it. Any other response is either a variation of these (like “resize the buffer,” which is really just deferring the choice) or domain-specific logic that doesn’t belong in a general streaming primitive. Web streams currently always choose Wait by default.
The new API makes you choose one of these four explicitly:
strict (default): Rejects writes when the buffer is full and too many writes are pending. Catches “fire-and-forget” patterns where producers ignore backpressure.
block: Writes wait until buffer space is available. Use when you trust the producer to await writes properly.
drop-oldest: Drops the oldest buffered data to make room. Useful for live feeds where stale data loses value.
drop-newest: Discards incoming data when full. Useful when you want to process what you have without being overwhelmed.
Instead of tee() with its hidden unbounded buffer, you get explicit multi-consumer primitives. Stream.share() is pull-based: consumers pull from a shared source, and you configure the buffer limits and backpressure policy upfront.
There’s also Stream.broadcast() for push-based multi-consumer scenarios. Both require you to think about what happens when consumers run at different speeds, because that’s a real concern that shouldn’t be hidden.
Sync/async separation
Not all streaming workloads involve I/O. When your source is in-memory and your transforms are pure functions, async machinery adds overhead without benefit. You’re paying for coordination of “waiting” that adds no benefit.
The new API has complete parallel sync versions: Stream.pullSync(), Stream.bytesSync(), Stream.textSync(), and so on. If your source and transforms are all synchronous, you can process the entire pipeline without a single promise.
// Async — when source or transforms may be asynchronous
const textAsync = await Stream.text(source);

// Sync — when all components are synchronous
const textSync = Stream.textSync(source);
Here’s a complete synchronous pipeline – compression, transformation, and consumption with zero async overhead:
// Synchronous source from in-memory data
const source = Stream.fromSync([inputBuffer]);

// Synchronous transforms
const compressed = Stream.pullSync(source, zlibCompressSync);
const encrypted = Stream.pullSync(compressed, aesEncryptSync);

// Synchronous consumption — no promises, no event loop trips
const result = Stream.bytesSync(encrypted);
The entire pipeline executes in a single call stack. No promises are created, no microtask queue scheduling occurs, and no GC pressure from short-lived async machinery. For CPU-bound workloads like parsing, compression, or transformation of in-memory data, this can be significantly faster than the equivalent Web streams code – which would force async boundaries even when every component is synchronous.
Web streams has no synchronous path. Even if your source has data ready and your transform is a pure function, you still pay for promise creation and microtask scheduling on every operation. Promises are fantastic for cases in which waiting is actually necessary, but they aren’t always necessary. The new API lets you stay in sync-land when that’s what you need.
Bridging the gap between this and web streams
The async iterator based approach provides a natural bridge between this alternative approach and Web streams. When coming from a ReadableStream to this new approach, simply passing the readable in as input works as expected when the ReadableStream is set up to yield bytes:
const readable = getWebReadableStreamSomehow();
const input = Stream.pull(readable, transform1, transform2);
for await (const chunks of input) {
  // process chunks
}
When adapting to a ReadableStream, a bit more work is required since the alternative approach yields batches of chunks, but the adaptation layer is as easily straightforward:
async function* adapt(input) {
  for await (const chunks of input) {
    for (const chunk of chunks) {
      yield chunk;
    }
  }
}

const input = Stream.pull(source, transform1, transform2);
const readable = ReadableStream.from(adapt(input));
How this addresses the real-world failures from earlier
Unconsumed bodies: Pull semantics mean nothing happens until you iterate. No hidden resource retention. If you don’t consume a stream, there’s no background machinery holding connections open.
The tee() memory cliff: Stream.share() requires explicit buffer configuration. You choose the highWaterMark and backpressure policy upfront: no more silent unbounded growth when consumers run at different speeds.
Transform backpressure gaps: Pull-through transforms execute on-demand. Data doesn’t cascade through intermediate buffers; it flows only when the consumer pulls. Stop iterating, stop processing.
GC thrashing in SSR: Batched chunks (Uint8Array[]) amortize async overhead. Sync pipelines via Stream.pullSync() eliminate promise allocation entirely for CPU-bound workloads.
Performance
The design choices have performance implications. Here are benchmarks from the reference implementation of this possible alternative compared to Web streams (Node.js v24.x, Apple M1 Pro, averaged over 10 runs):
Scenario
Alternative
Web streams
Difference
Small chunks (1KB × 5000)
~13 GB/s
~4 GB/s
~3× faster
Tiny chunks (100B × 10000)
~4 GB/s
~450 MB/s
~8× faster
Async iteration (8KB × 1000)
~530 GB/s
~35 GB/s
~15× faster
Chained 3× transforms (8KB × 500)
~275 GB/s
~3 GB/s
~80–90× faster
High-frequency (64B × 20000)
~7.5 GB/s
~280 MB/s
~25× faster
The chained transform result is particularly striking: pull-through semantics eliminate the intermediate buffering that plagues Web streams pipelines. Instead of each TransformStream eagerly filling its internal buffers, data flows on-demand from consumer to source.
Now, to be fair, Node.js really has not yet put significant effort into fully optimizing the performance of its Web streams implementation. There’s likely significant room for improvement in Node.js’ performance results through a bit of applied effort to optimize the hot paths there. That said, running these benchmarks in Deno and Bun also show a significant performance improvement with this alternative iterator based approach than in either of their Web streams implementations as well.
Browser benchmarks (Chrome/Blink, averaged over 3 runs) show consistent gains as well:
Scenario
Alternative
Web streams
Difference
Push 3KB chunks
~135k ops/s
~24k ops/s
~5–6× faster
Push 100KB chunks
~24k ops/s
~3k ops/s
~7–8× faster
3 transform chain
~4.6k ops/s
~880 ops/s
~5× faster
5 transform chain
~2.4k ops/s
~550 ops/s
~4× faster
bytes() consumption
~73k ops/s
~11k ops/s
~6–7× faster
Async iteration
~1.1M ops/s
~10k ops/s
~40–100× faster
These benchmarks measure throughput in controlled scenarios; real-world performance depends on your specific use case. The difference between Node.js and browser gains reflects the distinct optimization paths each environment takes for Web streams.
It’s worth noting that these benchmarks compare a pure TypeScript/JavaScript implementation of the new API against the native (JavaScript/C++/Rust) implementations of Web streams in each runtime. The new API’s reference implementation has had no performance optimization work; the gains come entirely from the design. A native implementation would likely show further improvement.
The gains illustrate how fundamental design choices compound: batching amortizes async overhead, pull semantics eliminate intermediate buffering, and the freedom for implementations to use synchronous fast paths when data is available immediately all contribute.
“We’ve done a lot to improve performance and consistency in Node streams, but there’s something uniquely powerful about starting from scratch. New streams’ approach embraces modern runtime realities without legacy baggage, and that opens the door to a simpler, performant and more coherent streams model.”
– Robert Nagy, Node.js TSC member and Node.js streams contributor
What’s next
I’m publishing this to start a conversation. What did I get right? What did I miss? Are there use cases that don’t fit this model? What would a migration path for this approach look like? The goal is to gather feedback from developers who’ve felt the pain of Web streams and have opinions about what a better API should look like.
API Reference: See the API.md for complete documentation
Examples: The samples directory has working code for common patterns
I welcome issues, discussions, and pull requests. If you’ve run into Web streams problems I haven’t covered, or if you see gaps in this approach, let me know. But again, the idea here is not to say “Let’s all use this shiny new object!”; it is to kick off a discussion that looks beyond the current status quo of Web Streams and returns back to first principles.
Web streams was an ambitious project that brought streaming to the web platform when nothing else existed. The people who designed it made reasonable choices given the constraints of 2014 – before async iteration, before years of production experience revealed the edge cases.
But we’ve learned a lot since then. JavaScript has evolved. A streaming API designed today can be simpler, more aligned with the language, and more explicit about the things that matter, like backpressure and multi-consumer behavior.
We deserve a better stream API. So let’s talk about what that could look like.
You’ve seen it. Maybe you didn’t register it consciously, but you’ve seen it. That little widget asking you to verify you’re human. That full-page security check before accessing a website. If you’ve spent any time on the Internet, you’ve encountered Cloudflare’s Turnstile widget or Challenge Pages — likely more times than you can count.
The Turnstile widget – a familiar sight across millions of websites
When we say that a large portion of the Internet sits behind Cloudflare, we mean it. Our Turnstile widget and Challenge Pages are served 7.67 billion times every single day. That’s not a typo. Billions. This might just be the most-seen user interface on the Internet.
And that comes with enormous responsibility.
Designing a product with billions of eyeballs on it isn’t just challenging — it requires a fundamentally different approach. Every pixel, every word, every interaction has to work for someone’s grandmother in rural Japan, a teenager in São Paulo, a visually impaired developer in Berlin, and a busy executive in Lagos. All at the same time. In moments of frustration.
Today we’re sharing the story of how we redesigned Turnstile and Challenge Pages. It’s a story told in three parts, by three of us: the design process and research that shaped our decisions (Leo), the engineering challenge of deploying changes at unprecedented scale (Ana), and the measurable impact on billions of users (Marina).
Let’s start with how we approached the problem from a design perspective.
Part 1: The design process
The problem
Let’s be honest: nobody likes being asked to prove they’re human. You know you’re human. I know I’m human. The only one who doesn’t seem convinced is that little widget standing between you and the website you’re trying to access. At best, it’s a minor inconvenience. At worst? You’ve probably wanted to throw your computer out the window in a fit of rage. We’ve all been there. And no one would blame you.
Turnstile integrated into a login flow
As the world warms up to what appears to be an inevitable AI revolution, the need for security verification is only increasing. At Cloudflare, we’ve seen a significant rise in bot attacks — and in response, organizations are investing more heavily in security measures. That means more challenges being issued to more end users, more often.
The numbers tell the story:
2023: 2.14B daily
2024: 3B daily
2025: 5.35B daily
That’s a 58.1% average increase in security checks, year over year. More security checks mean more opportunities for end user frustration. The more companies integrate these verification systems to protect themselves and their customers, the higher the chance that someone, somewhere, is going to have a bad experience.
We knew it was time to take a hard look at our flagship products and ask ourselves: Are we doing right by the billions of people who encounter these experiences? Are we fulfilling our mission to build a better Internet — not just a more secure one, but a more human one?
The answer, we discovered, was: we could do better.
The design audit
Before redesigning anything, we needed to understand what we were working with. We started by conducting a comprehensive audit of every state, every error message, and every interaction across both Turnstile and Challenge Pages.
What we found wasn’t the best.
The state of inconsistency in the Turnstile widget. Multiple states with no unified approach
The inconsistencies were glaring. We had no unified approach across the multitude of different error scenarios. Some messages were overly verbose and technical (“Your device clock is set to a wrong time or this challenge page was accidentally cached by an intermediary and is no longer available”). Others were too vague to be helpful (“Timed out”). The visual language varied wildly — different layouts, different hierarchies, different tones of voice.
We also examined the feedback we’d received online. Social media, support tickets, community forums — we read it all. The frustration was palpable, and much of it was avoidable.
Take our feedback mechanism, for example. We offered users feedback options like “The widget sometimes fails” versus “The widget fails all the time.” But what’s the difference, really? And how were they supposed to know how often it failed? We were asking users to interpret ambiguous options during their most frustrated moments. The more we left open to interpretation, the less useful the feedback became — and the more frustration we saw across social channels.
The previous feedback screen: “The widget sometimes fails” vs “The widget fails all the time” — what’s the difference?
Our Challenge Pages — the full-page security blocks that appear when we detect suspicious activity or when site owners have heightened security settings — had similar issues. Some states were confusing. Others used too much technical jargon. Many failed to provide actionable guidance when users needed it most.
The state of inconsistency on the Challenge pages. Multiple states with no unified approach
The audit was humbling. But it gave us a clear picture of where we needed to focus.
Mapping the user journey
To design better experiences, we first needed to understand every possible path a user could take. What was the happy path? Was there even one? And what were the unhappy paths that led to escalating frustration?
Mapping the complete user journey — from initial encounter through error scenarios, with sentiment tracking
This was a true cross-functional effort. We worked closely with engineers like Ana who knew the technical ins and outs of every edge case, and with Marina on the product side who understood not just how the product worked, but how users felt about it — the love and the hate we’d see online.
We have some of the smartest people working on bot protection at Cloudflare. But intelligence and clarity aren’t the same thing. There’s a delicate balance between technical complexity and user simplicity. Only when these two dance together successfully can we communicate information in a way that actually makes sense to people.
And here’s the thing: the messaging has to work for everyone. A person of any age. Any mental or physical capability. Any cultural background. Any level of technical sophistication. That’s what designing at scale really means — you can’t ignore edge cases, since, at such scale, they are no longer edge cases.
Establishing a unified information architecture
One of the most influential books in UX design is Steve Krug’s Don’t Make Me Think. The core principle is simple: every moment a user spends trying to interpret, understand, or decode your interface is a moment of friction. And friction, especially in moments of frustration, leads to abandonment.
Our audit revealed that we were asking users to think far too much. Different pieces of information occupied the same space in the UI across different states. There was no consistent visual hierarchy. Users encountering an error state in Turnstile would find information in a completely different place than they would on a Challenge Page.
We made a fundamental decision: one information architecture to rule them all.
Visual diagram displaying a unified information architecture with a consistent structure across Turnstile widget and Challenge pages
Both Turnstile and Challenge Pages would now follow the same structural pattern. The same visual hierarchy. The same placement for actions, for explanatory text, for links to documentation.
Did this constrain our design options? Absolutely. We had to say no to a lot of creative ideas that didn’t fit the framework. But constraints aren’t the enemy of good design — they’re often its best friend. By limiting our options, we could go deeper on the details that actually mattered.
For users, the benefit is profound: they don’t need to re-learn what each piece of the UI means. Error states look consistent. Help links are always in the same place. Once you understand one state, you understand them all. That’s cognitive load reduced to a minimum — exactly where it should be during a security verification.
What user research taught us
How do you keep yourself accountable when redesigning something that billions of people see? You test. A lot.
We recruited 8 participants across 8 different countries, deliberately seeking diversity in age, digital savviness, and cultural background. We weren’t looking for tech-savvy early adopters — we wanted to understand how the redesign would work for everyone.
Our approach was rigorous: participants saw both the current experience and proposed changes, without knowing which was “old” or “new.” We counterbalanced positioning to eliminate bias. And we did not just test our new ideas, but also challenged our assumptions about what needed changing in the first place.
Two different versions of a Turnstile being tested in an A/B test
Some things didn’t need fixing
One hypothesis: should we align with competitors? Most CAPTCHA providers show “I am human” across all states. We use distinct content — “Verify you are human,” then “Verifying…,” then “Success!”
Were we overcomplicating things? We tested it head-to-head.
Our approach won decisively. For the interactivity state, “Verify you are human” scored 5 out of 8 points versus just 3 for “I am human.” For the verifying state, it was even more dramatic — 7.5 versus 0.5. Users wanted to know what was happening, not just be told what they were.
User testing results: users strongly favored our approach over the competitor-style design
This experiment didn’t ship as a feature, but it was invaluable. It gave us confidence we weren’t just being different for the sake of it. Some things were already right.
But these needed to change
The research surfaced four areas where we were failing users:
Help, not bureaucracy. When users encountered errors, we offered “Send Feedback.” In testing, they were baffled. “Who am I sending this to? The website? Cloudflare? My ISP?” More importantly, we discovered something fundamental: at the moment of maximum frustration, people don’t want to file a report — they want to fix the problem. We replaced “Send Feedback” with “Troubleshoot” — a single word that promises action rather than bureaucracy.
The problematic “Send Feedback” prompt: users didn’t know who they were sending feedback to
Attention, not alarm. We’d used red backgrounds liberally for errors. The reaction in testing was visceral — participants felt they had failed, felt powerless. Even for simple issues that would resolve with a retry, users assumed the worst and gave up. Red at full saturation wasn’t communicating “Here’s something to address.” It was communicating “You have failed, and there’s nothing you can do.” The fix: red only for icons, never for text or backgrounds.
The evolution: from the states with unclear error state description in red to much clearer and concise error communication in neutral-color text.
Scannable, not verbose. We’d tried to be thorough, explaining errors in technical detail. It backfired. Non-technical users found it alienating. Technical users didn’t need it. Everyone was trying to read it in the tiny real estate of a widget. The lesson: less is more, especially in constrained spaces during stressful moments.
Accessible to everyone. Our audit revealed 10px fonts in some states. Grey text that technically met AA (at least 4.5:1 for normal text and 3:1 for large text) compliance but was difficult to read in practice. “Technically compliant” isn’t good enough when you’re serving the entire Internet.
We set a clear goal: to meet the WCAG 2.2 AAA standard— the highest and most stringent level of web accessibility compliance, designed to make content accessible to the broadest range of users, including those with severe disabilities. Throughout the redesign, when visual consistency conflicted with readability, readability won. Every time.
This extended beyond vision. We designed for screen reader users, keyboard-only navigators, and people with color vision variations — going beyond what automated compliance tools can catch.
And accessibility isn’t just about impairments — it’s about language. What fits in English, overflows in German. What’s concise in Spanish is ambiguous in Japanese. Supporting over 40 languages forced us to radically simplify. The same “Unable to connect to website / Troubleshoot” pattern now works across English, Bulgarian, Danish, German, Greek, Japanese, Indonesian, Russian, Slovak, Slovenian, Serbian, Filipino, and many more.
The redesigned error state across 12 languages — consistent layout despite varying text lengths
Final redesign
So what did we actually ship?
First, let’s talk about what we didn’t change. The happy path — “Verify you are human” → “Verifying…” → “Success!” — tested exceptionally well. Users understood what was happening at each stage. The distinct content for each state, which we’d worried might be overcomplicating things, was actually our competitive advantage.
The happy path: Verify you are human → Verifying → Success! These states tested well and remained largely unchanged
But for the states that needed work, we made significant changes guided by everything we learned.
Simplified, scannable content
We radically reduced the amount of text in error states. Instead of verbose explanations like “Your device clock is set to a wrong time or this challenge page was accidentally cached by an intermediary and is no longer available,” we now show:
A clear, simple state name (e.g., “Incorrect device time”)
A prominent “Troubleshoot” link
That’s it. The detailed guidance now lives in a dedicated modal screen that opens when users need it — giving them room to actually read and follow troubleshooting steps.
The troubleshooting modal: detailed guidance when users need it, without cluttering the widget
The troubleshooting modal provides context (“This error occurs when your device’s clock or calendar is inaccurate. To complete this website’s security verification process, your device must be set to the correct date and time in your time zone.”), numbered steps to try, links to documentation, and — only after the user has tried to resolve the issue — an option to submit feedback to Cloudflare. Help first, feedback second.
AAA accessibility compliance
Every state now meets WCAG 2.2 AAA standards for contrast and readability. Font sizes have established minimums. Interactive elements are clearly focusable and properly announced by screen readers.
Unified experience across Turnstile and Challenge pages
Whether users encounter the compact Turnstile widget or a full Challenge Page, the information architecture is now consistent. Same hierarchy. Same placement. Same mental model.
Challenge Pages now follow a clean structure: the website name and favicon at the top, a clear status message (like “Verification successful” or “Your browser is out of date”), and actionable guidance below. No more walls of orange or red text. No more technical jargon without context.
Re-designed Challenge page states with clear troubleshooting instructions.
Validated across languages
Every piece of content was tested in over 40 supported languages. Our process involved three layers of validation:
Initial design review by the design team
Professional translation by our qualified vendor
Final review by native-speaking Cloudflare employees
This wasn’t just about translation accuracy — it was about ensuring the visual design held up when content length varied dramatically between languages.
The complete picture
The result is a security verification experience that’s clearer, more accessible, less frustrating, and — crucially — just as secure. We didn’t compromise on protection to improve the experience. We proved that good design and strong security aren’t in conflict.
Re-designed Turnstile widgets on the left and a re-designed Challenge page on the right
But designing the experience was only half the battle. Shipping it to billions of users? That’s where Ana comes in.
Part 2: Shipping to billions
Beyond centering a div
Some may say the hardest part of being a Frontend Engineer is centering a div. In reality, the real challenge often lies much deeper, especially when working close to the platform primitives. Building a critical piece of Internet infrastructure using native APIs forces you to think differently about UI development, tradeoffs, and long-term maintainability.
In our case, we use Rust to handle the UI for both the Turnstile widget and the Challenge page. This decision brought clear benefits in terms of safety and consistency across platforms, but it also increased frontend complexity. Many of us are used to the ergonomics of modern frameworks like React, where common UI interactions come almost for free. Working with Rust meant reimplementing even simple interactions using lower level constructs like document.getElementById, createElement, and appendChild.
On top of that, compile times and strict checks naturally slowed down rapid UI iteration compared to JavaScript based frameworks. Debugging was also more involved, as the tooling ecosystem is still evolving. These constraints pushed us to be more deliberate, more thoughtful, and ultimately more disciplined in how we approached UI development.
Small visual changes, big global impact
What initially looked like small visual tweaks such as padding adjustments or alignment changes quickly revealed a much bigger challenge: internationalization.
Once translations were available, we had to ensure that content remained readable and usable across 38 languages and 16 different UI states. Text length variability alone required careful design decisions. Some translations can be 30 to 300 percent longer than English. A short English string like “Stuck?” becomes “Tidak bisa melanjutkan?” in Indonesian or “Es geht nicht weiter?” in German, dramatically changing layout requirements.
Right-to-left language support added another layer of complexity. Supporting Arabic, Persian or Farsi, and Hebrew meant more than flipping text direction. Entire layouts had to be mirrored, including alignment, navigation patterns, directional icons, and animation flows. Many of these elements are implicitly designed with left-to-right assumptions, so we had to revisit those decisions and make them truly bidirectional.
Ordered lists also required special care. Not every culture uses the Western 1, 2, 3 numbering system, and hardcoding numeric sequences can make interfaces feel foreign or incorrect. We leaned on locale-aware numbering and fully translatable list formats to ensure ordering felt natural and culturally appropriate in every language.
Building confidence through testing
As we started listing action points in feedback reports, correctness became even more critical. Every action needed to render properly, trigger the right flow, and behave consistently across states, languages, and edge cases.
To get there, we invested heavily in testing. Unit tests helped us validate logic in isolation, while end-to-end tests ensured that new states and languages worked as expected in real scenarios. This testing foundation gave us confidence to iterate safely, prevented regressions, and ensured that feedback reports remained reliable and actionable for users.
The outcome
What began as a set of technical constraints turned into an opportunity to build a more robust, inclusive, and well-tested UI system. Working with fewer abstractions and closer to the browser primitives forced us to rethink assumptions, improve our internationalization strategy, and raise the overall quality bar.
The result is not just a solution that works, but one we trust. And that trust is what allows us to keep improving, even when centering a div turns out to be the easy part.
Part 3: The impact
Designing for billions of people is a responsibility we take seriously. At this scale, it is essential to leverage measurable data to tell us the real impact of our design choices. As we prepare to roll out these changes, we are focusing on five key metrics that will tell us if we’ve truly succeeded in making the Internet’s most-seen UI more human.
1. Challenge Completion Rate
Our primary north star is the Challenge Solve Rate: the percentage of issued challenges that are successfully completed. By moving away from technical jargon like “intermediary caching” and toward simple, actionable labels like “Incorrect device time,” we expect a significant uptick in CSR. A higher CSR doesn’t mean we’re being easier on bots; it means we’re removing the hurdles that were accidentally tripping up legitimate human users.
2. Time to Complete
Every second a user spends on a challenge page is a second they aren’t getting the information that they need. Our research showed that users were often paralyzed by choice when seeing a wall of red text. With our new scannable, neutral-color design, we are tracking Time to Complete to ensure users can identify and resolve issues in seconds rather than minutes.
3. Abandonment Rate Changes
In the past, our liberal use of “saturated red” caused a visceral reaction: users felt they had failed and simply gave up. By reserving red only for icons and using a unified architecture, we aim to reduce Abandonment Rates. We want users to feel empowered to click Troubleshoot rather than feeling powerless and clicking away.
4. Support Ticket Volume
One of the bigger shifts from a product perspective is our new Troubleshooting Modal. By providing clear, numbered steps directly within the widget, we are building self-service support into the UI. We expect this to result in a measurable decrease in support ticket volume for both our customers and our own internal teams.
5. Social Sentiment
We know that security challenges are rarely loved, but they shouldn’t be hated because they are confusing. We are monitoring Social Sentiment across community forums, feedback reports, and social channels to see if the conversation shifts from “this widget is broken” to “I had an issue, but I fixed it”.
As a Product Manager, my goal is often invisible security — the best challenge is the one the user never sees. But when a challenge must be seen, it should be an assistant, not a bouncer. This redesign proves that AAA accessibility and high-security standards aren’t in competition; they are two sides of the same coin. By unifying the architecture of Turnstile and Challenge Pages, we’ve built a foundation that allows us to iterate faster and protect the Internet more humanely than ever before.
Looking ahead
This redesign is a foundation, not a finish line.
We’re continuing to monitor how users interact with the new experience, and we’re committed to iterating based on what we learn. The feedback mechanisms we’ve built into the new design — the ones that actually help users troubleshoot, rather than just asking them to report problems — will give us richer insights than we’ve ever had before.
We’re also watching how the security landscape evolves. As bot attacks grow more sophisticated, and as AI continues to blur the line between human and automated behavior, the challenge of verification will only get harder. Our job is to stay ahead — to keep improving security without making the human experience worse.
If you encounter the new Turnstile or Challenge Pages and have feedback, we want to hear it. Reach out through our community forums or use the feedback mechanisms built into the experience itself.
Cloudflare Radar already offers a wide array of security insights — from application and network layer attacks, to malicious email messages, to digital certificates and Internet routing.
And today we’re introducing even more. We are launching several new security-related data sets and tools on Radar:
We are extending our post-quantum (PQ) monitoring beyond the client side to now include origin-facing connections. We have also released a new tool to help you check any website’s post-quantum encryption compatibility.
A new Key Transparency section on Radar provides a public dashboard showing the real-time verification status of Key Transparency Logs for end-to-end encrypted messaging services like WhatsApp, showing when each log was last signed and verified by Cloudflare’s Auditor. The page serves as a transparent interface where anyone can monitor the integrity of public key distribution and access the API to independently validate our Auditor’s proofs.
Routing Security insights continue to expand with the addition of global, country, and network-level information about the deployment of ASPA, an emerging standard that can help detect and prevent BGP route leaks.
Measuring origin post-quantum support
Since April 2024, we have tracked the aggregate growth of client support for post-quantum encryption on Cloudflare Radar, chronicling its global growth from under 3% at the start of 2024, to over 60% in February 2026. And in October 2025, we added the ability for users to check whether their browser supports X25519MLKEM768 — a hybrid key exchange algorithm combining classical X25519 with ML-KEM, a lattice-based post-quantum scheme standardized by NIST. This provides security against both classical and quantum attacks.
However, post-quantum encryption support on user-to-Cloudflare connections is only part of the story.
For content not in our CDN cache, or for uncacheable content, Cloudflare’s edge servers establish a separate connection with a customer’s origin servers to retrieve it. To accelerate the transition to quantum-resistant security for these origin-facing fetches, we previously introduced an API allowing customers to opt in to preferring post-quantum connections. Today, we’re making post-quantum compatibility of origin servers visible on Radar.
The new origin post-quantum support graph on Radar illustrates the share of customer origins supporting X25519MLKEM768. This data is derived from our automated TLS scanner, which probes TLS 1.3-compatible origins and aggregates the results daily. It is important to note that our scanner tests for support rather than the origin server’s specific preference. While an origin may support a post-quantum key exchange algorithm, its local TLS key exchange preference can ultimately dictate the encryption outcome.
While the headline graph focuses on post-quantum readiness, the scanner also evaluates support for classical key exchange algorithms. Within the Radar Data Explorer view, you can also see the full distribution of these supported TLS key exchange methods.
As shown in the graphs above, approximately 10% of origins could benefit from a post-quantum-preferred key agreement today. This represents a significant jump from less than 1% at the start of 2025 — a 10x increase in just over a year. We expect this number to grow steadily as the industry continues its migration. This upward trend likely accelerated in 2025 as many server-side TLS libraries, such as OpenSSL 3.5.0+, GnuTLS 3.8.9+, and Go 1.24+, enabled hybrid post-quantum key exchange by default, allowing platforms and services to support post-quantum connections simply by upgrading their cryptographic library dependencies.
A screenshot of the tool in Radar to test whether a hostname supports post-quantum encryption.
The tool presents a simple form where users can enter a hostname (such as cloudflare.com or www.wikipedia.org) and optionally specify a custom port (the default is 443, the standard HTTPS port). After clicking “Test”, the result displays a tag indicating PQ support status alongside the negotiated TLS key exchange algorithm. If the server prefers PQ secure connections, a green “PQ” tag appears with a message confirming the connection is “post-quantum secure.” Otherwise, a red tag indicates the connection is “not post-quantum secure”, showing the classical algorithm that was negotiated.
Under the hood, this tool uses Cloudflare Containers — a new capability that allows running container workloads alongside Workers. Since the Workers runtime is not exposed to details of the underlying TLS handshake, Workers cannot initiate TLS scans. Therefore, we created a Go container that leverages the crypto/tls package’s support for post-quantum compatibility checks. The container runs on-demand and performs the actual handshake to determine the negotiated TLS key exchange algorithm, returning results through the Radar API.
With the addition of these origin-facing insights, complementing the existing client-facing insights, we have moved all the post-quantum content to its own section on Radar.
Securing E2EE messaging systems with Key Transparency
End-to-end encrypted (E2EE) messaging apps like WhatsApp and Signal have become essential tools for private communication, relied upon by billions of people worldwide. These apps use public-key cryptography to ensure that only the sender and recipient can read the contents of their messages — not even the messaging service itself. However, there’s an often-overlooked vulnerability in this model: users must trust that the messaging app is distributing the correct public keys for each contact.
If an attacker were able to substitute an incorrect public key in the messaging app’s database, they could intercept messages intended for someone else — all without the sender knowing.
Key Transparency addresses this challenge by creating an auditable, append-only log of public keys — similar in concept to Certificate Transparency for TLS certificates. Messaging apps publish their users’ public keys to a transparency log, and independent third parties can verify and vouch that the log has been constructed correctly and consistently over time. In September 2024, Cloudflare announced such a Key Transparency auditor for WhatsApp, providing an independent verification layer that helps ensure the integrity of public key distribution for the messaging app’s billions of users.
Today, we’re publishing Key Transparency audit data in a new Key Transparency section on Cloudflare Radar. This section showcases the Key Transparency logs that Cloudflare audits, giving researchers, security professionals, and curious users a window into the health and activity of these critical systems.
The new page launches with two monitored logs: WhatsApp and Facebook Messenger Transport. Each monitored log is displayed as a card containing the following information:
Status: Indicates whether the log is online, in initialization, or disabled. An “online” status means the log is actively publishing key updates into epochs that Cloudflare audits. (An epoch represents a set of updates applied to the key directory at a specific time.)
Last signed epoch: The most recent epoch that has been published by the messaging service’s log and acknowledged by Cloudflare. By clicking on the eye icon, users can view the full epoch data in JSON format, including the epoch number, timestamp, cryptographic digest, and signature.
Last verified epoch: The most recent epoch that Cloudflare has verified. Verification involves checking that the transition of the transparency log data structure from the previous epoch to the current one represents a valid tree transformation — ensuring the log has been constructed correctly. The verification timestamp indicates when Cloudflare completed its audit.
Root: The current root hash of the Auditable Key Directory (AKD) tree. This hash cryptographically represents the entire state of the key directory at the current epoch. Like the epoch fields, users can click to view the complete JSON response from the auditor.
The data shown on the page is also available via the Key Transparency Auditor API, with endpoints for auditor information and namespaces.
If you would like to perform audit proof verification yourself, you can follow the instructions in our Auditing Key Transparency blog post. We hope that these use cases are the first of many that we publish in this Key Transparency section in Radar — if your company or organization is interested in auditing for your public key or related infrastructure, you can reach out to us here.
Tracking RPKI ASPA adoption
While the Border Gateway Protocol (BGP) is the backbone of Internet routing, it was designed without built-in mechanisms to verify the validity of the paths it propagates. This inherent trust has long left the global network vulnerable to route leaks and hijacks, where traffic is accidentally or maliciously detoured through unauthorized networks.
Although RPKI and Route Origin Authorizations (ROAs) have successfully hardened the origin of routes, they cannot verify the path traffic takes between networks. This is where ASPA (Autonomous System Provider Authorization)comes in. ASPA extends RPKI protection by allowing an Autonomous System (AS) to cryptographically sign a record listing the networks authorized to propagate its routes upstream. By validating these Customer-to-Provider relationships, ASPA allows systems to detect invalid path announcements with confidence and react accordingly.
While the specific IETF standard remains in draft, the operational community is moving fast. Support for creating ASPA objects has already landed in the portals of Regional Internet Registries (RIRs) like ARIN and RIPE NCC, and validation logic is available in major software routing stacks like OpenBGPD and BIRD.
To provide better visibility into the adoption of this emerging standard, we have added comprehensive RPKI ASPA support to the Routing section of Cloudflare Radar. Tracking these records globally allows us to understand how quickly the industry is moving toward better path validation.
Our new ASPA deployment view allows users to examine the growth of ASPA adoption over time, with the ability to visualize trends across the five Regional Internet Registries (RIRs) based on AS registration. You can view the entire history of ASPA entries, dating back to October 1, 2023, or zoom into specific date ranges to correlate spikes in adoption with industry events, such as the introduction of ASPA features on ARIN and RIPE NCC online dashboards.
Beyond aggregate trends, we have also introduced a granular, searchable explorer for real-time ASPA content. This table view allows you to inspect the current state of ASPA records, searchable by AS number, AS name, or by filtering for only providers or customer ASNs. This allows network operators to verify that their records are published correctly and to view other networks’ configurations.
We have also integrated ASPA data directly into the country/region routing pages. Users can now track how different locations are progressing in securing their infrastructure, based on the associated ASPA records from the customer ASNs registered locally.
On individual AS pages, we have updated the Connectivity section. Now, when viewing the connections of a network, you may see a visual indicator for “ASPA Verified Provider.” This annotation confirms that an ASPA record exists authorizing that specific upstream connection, providing an immediate signal of routing hygiene and trust.
For ASes that have deployed ASPA, we now display a complete list of authorized provider ASNs along with their details. Beyond the current state, Radar also provides a detailed timeline of ASPA activity involving the AS. This history distinguishes between changes initiated by the AS itself (“As customer”) and records created by others designating it as a provider (“As provider”), allowing users to immediately identify when specific routing authorizations were established or modified.
Visibility is an essential first step toward broader adoption of emerging routing security protocols like ASPA. By surfacing this data, we aim to help operators deploy protections and assist researchers in tracking the Internet’s progress toward a more secure routing path. For those who need to integrate this data into their own workflows or perform deeper analysis, we are also exposing these metrics programmatically. Users can now access ASPA content snapshots, historical timeseries, and detailed changes data using the newly introduced endpoints in theCloudflare Radar API.
As security evolves, so does our data
Internet security continues to evolve, with new approaches, protocols, and standards being developed to ensure that information, applications, and networks remain secure. The security data and insights available on Cloudflare Radar will continue to evolve as well. The new sections highlighted above serve to expand existing routing security, transparency, and post-quantum insights already available on Cloudflare Radar.
If you share any of these new charts and graphs on social media, be sure to tag us: @CloudflareRadar (X), noc.social/@cloudflareradar (Mastodon), and radar.cloudflare.com (Bluesky). If you have questions or comments, or suggestions for data that you’d like to see us add to Radar, you can reach out to us on social media, or contact us via email.
Internet traffic relies on the Border Gateway Protocol (BGP) to find its way between networks. However, this traffic can sometimes be misdirected due to configuration errors or malicious actions. When traffic is routed through networks it was not intended to pass through, it is known as a route leak. We have written on our blogmultiple times about BGP route leaks and the impact they have on Internet routing, and a few times we have even alluded to a future of path verification in BGP.
While the network community has made significant progress in verifying the final destination of Internet traffic, securing the actual path it takes to get there remains a key challenge for maintaining a reliable Internet. To address this, the industry is adopting a new cryptographic standard called ASPA (Autonomous System Provider Authorization), which is designed to validate the entire path of network traffic and prevent route leaks.
To help the community track the rollout of this standard, Cloudflare Radar has introduced a new ASPA deployment monitoring feature. This view allows users to observe ASPA adoption trends over time across the five Regional Internet Registries (RIRs), and view ASPA records and changes over time at the Autonomous System (AS) level.
What is ASPA?
To understand how ASPA works, it is helpful to look at how the Internet currently secures traffic destinations.
Today, networks use a secure infrastructure system called RPKI (Resource Public Key Infrastructure), which has seen significant deployment growth over the past few years. Within RPKI, networks publish specific cryptographic records called ROAs (Route Origin Authorizations). A ROA acts as a verifiable digital ID card, confirming that an Autonomous System (AS) is officially authorized to announce specific IP addresses. This addresses the “origin hijacks” issue, where one network attempts to impersonate another.
When data travels across the Internet, it keeps a running log of every network it passes through. In BGP, this log is known as the AS_PATH (Autonomous System Path). ASPA provides networks with a way to officially publish a list of their authorized upstream providers within the RPKI system. This allows any receiving network to look at the AS_PATH, check the associated ASPA records, and verify that the traffic only traveled through an approved chain of networks.
A ROA helps ensure the traffic arrives at the correct destination, ASPA ensures the traffic takes an intended, authorized route to get there. Let’s take a look at how path evaluation actually works in practice.
Route leak detection with ASPA
How does ASPA know if a route is a detour? It relies on the hierarchy of the Internet.
In a healthy Internet routing topology (e.g. “valley-free” routing), traffic generally follows a specific path: it travels “up” from a customer to a large provider (like a major ISP), optionally crosses over to another big provider, and then flows “down” to the destination. You can visualize this as a “mountain” shape:
The Up-Ramp: Traffic starts at a Customer and travels “up” through larger and larger Providers (ISPs), where ISPs pay other ISPs to transit traffic for them.
The Apex: It reaches the top tier of the Internet backbone and may cross a single peering link.
The Down-Ramp: It travels “down” through providers to reach the destination Customer.
A visualization of “valley-free” routing. Routes propagate up to a provider, optionally across one peering link, and down to a customer.
In this model, a route leak is like a valley, or dip. One type of such leak happens when traffic goes down to a customer and then unexpectedly tries to go back up to another provider.
This “down-and-up” movement is undesirable as customers aren’t intended nor equipped to transit traffic between two larger network providers.
How ASPA validation works
ASPA gives network operators a cryptographic way to declare their authorized providers, enabling receiving networks to verify that an AS path follows this expected structure.
ASPA validates AS paths by checking the “chain of relationships” from both ends of the routes propagation:
Checking the Up-Ramp: The check starts at the origin and moves forward. At every hop, it asks: “Did this network authorize the next network as a Provider?” It keeps going until the chain stops.
Checking the Down-Ramp: It does the same thing from the destination of a BGP update, moving backward.
If the “Up” path and the “Down” path overlap or meet at the top, the route is Valid. The mountain shape is intact.
However, if the two valid paths do not meet, i.e. there is a gap in the middle where authorization is missing or invalid, ASPA reports such paths as problematic. That gap represents the “valley” or the leak.
Validation process example
Let’s look at a scenario where a network (AS65539) receives a bad route from a customer (AS65538).
The customer (AS65538) is trying to send traffic received from one provider (AS65537) “up” to another provider (AS65538), acting like a bridge between providers. This is a classic route leak. Now let’s walk the ASPA validation process.
We check the Up-Ramp: The original source (AS65536) authorizes its provider. (Check passes).
We check the Down-Ramp: We start from the destination and look back. We see the customer (AS65538).
The Mismatch: The up-ramp ends at AS65537, while the down-ramp ends at 65538. The two ramps do not connect.
Because the “Up” path and “Down” path fail to connect, the system flags this as ASPA Invalid. ASPA is required to do this path validation, as without signed ASPA objects in RPKI, we cannot find which networks are authorized to advertise which prefixes to whom. By signing a list of provider networks for each AS, we know which networks should be able to propagate prefixes laterally or upstream.
ASPA against forged-origin hijacks
ASPA can serve as an effective defense against forged-origin hijacks, where an attacker bypasses Route Origin Validation (ROV) by pretending and advertising a BGP path to a real origin prefix. Although the origin AS remains correct, the relationship between the hijacker and the victim is fabricated.
ASPA exposes this deception by allowing the victim network to cryptographically declare its actual authorized providers; because the hijacker is not on that authorized list, the path is rejected as invalid, effectively preventing the malicious redirection.
ASPA cannot fully protect against forged-origin hijacks, however. There is still at least one case where not even ASPA validation can fully prevent this type of attack on a network. An example of a forged-origin hijack that ASPA cannot account for is when a provider forges a path advertisement to their customer.
Essentially, a provider could “fake” a peering link with another AS to attract traffic from a customer with a short AS_PATH length, even when no such peering link exists. ASPA does not prevent this path forgery by the provider, because ASPA only works off of provider information and knows nothing specific about peering relationships.
So while ASPA can be an effective means of rejecting forged-origin hijack routes, there are still some rare cases where it will be ineffective, and those are worth noting.
Creating ASPA objects: just a few clicks away
Creating an ASPA object for your network (or Autonomous System) is now a simple process in registries like RIPE and ARIN. All you need is your AS number and the AS numbers of the providers you purchase Internet transit service from. These are the authorized upstream networks you trust to announce your IP addresses to the wider Internet. In the opposite direction, these are also the networks you authorize to send you a full routing table, which acts as the complete map of how to reach the rest of the Internet.
We’d like to show you just how easy creating an ASPA object is with a quick example.
Say we need to create the ASPA object for AS203898, an AS we use for our Cloudflare London office Internet. At the time of writing we have three Internet providers for the office: AS8220, AS2860, and AS1273. This means we will create an ASPA object for AS203898 with those three provider members in a list.
First, we log into the RIPE RPKI dashboard and navigate to the ASPA section:
Then, we click on “Create ASPA” for the object we want to create an ASPA object for. From there, we just fill in the providers for that AS.
It’s as simple as that. After just a short period of waiting, we can query the global RPKI ecosystem and find our ASPA object for AS203898 with the providers we defined.
It’s a similar story with ARIN, the only other Regional Internet Registries (RIRs) that currently supports the creation of ASPA objects. Log in to ARIN online, then navigate to Routing Security, and click “Manage RPKI”.
From there, you’ll be able to click on “Create ASPA”. In this example, we will create an object for another one of our ASNs, AS400095.
And that’s it – now we have created our ASPA object for AS40095 with provider AS0.
The “AS0” provider entry is special when used, and means the AS owner attests there are no valid upstream providers for their network. By definition this means every transit-free Tier-1 network should eventually sign an ASPA with only “AS0” in their object, if they truly only have peer and customer relationships.
New ASPA features in Cloudflare Radar
We have added a new ASPA deployment monitoring feature to Cloudflare Radar. The new ASPA deployment view allows users to examine the growth of ASPA adoption over time, with the ability to visualize trends across the five Regional Internet Registries (RIRs) based on AS registration.
We have also integrated ASPA data directly into the country/region and ASN routing pages. Users can now track how different locations are progressing in securing their infrastructure, based on the associated ASPA records from the customer ASNs registered locally.
There are also new features when you zoom into a particular Autonomous System (AS), for example AS203898.
We can see whether a network’s observed BGP upstream providers are ASPA authorized, their full list of providers in their ASPA object, and the timeline of ASPA changes that involve their AS.
The road to better routing security
With ASPA finally becoming a reality, we have our cryptographic upgrade for Internet path validation. However, those who have been around since the start of RPKI for route origin validation know this will be a long road to actually providing significant value on the Internet. Changes are needed to RPKI Relaying Party (RP) packages, signer implementations, RTR (RPKI-to-Router protocol) software, and BGP implementations to actually use ASPA objects and validate paths with them.
In addition to ASPA adoption, operators should also configure BGP roles as described within RFC9234. The BGP roles configured on BGP sessions will help future ASPA implementations on routers decide which algorithm to apply: upstream or downstream. In other words, BGP roles give us the power as operators to directly tie our intended BGP relationships with another AS to sessions with those neighbors. Check with your routing vendors and make sure they support RFC9234 BGP roles and OTC (Only-to-Customer) attribute implementation.
To get the most out of ASPA, we encourage everyone to create their ASPA objects for their AS. Creating and maintaining these ASPA objects requires careful attention. In the future, as networks use these records to actively block invalid paths, omitting a legitimate provider could cause traffic to be dropped. However, managing this risk is no different from how networks already handle Route Origin Authorizations (ROAs) today. ASPA is the necessary cryptographic upgrade for Internet path validation, and we’re happy it’s here!
In November 2025, AWS successfully completed its first surveillance audit for ISO 42001:2023, Artificial Intelligence Management System with no findings.
This demonstrates the continual commitment of AWS to responsible AI practices. With this independent validation, our customers can gain further assurances around the AWS commitment to responsible AI and their ability to build and operate AI applications responsibly using AWS services.
AI agents have traditionally faced three core limitations: they can’t retain learned information or operate autonomously beyond short periods, and they require constant supervision. AWS addresses these limitations with frontier agents—a new category of AI that performs complex reasoning, multi-step planning, and autonomous execution for hours or days. Multi-agent collaboration has emerged as a powerful approach that helps tackle complex workflows that require multiple steps and diverse expertise—such as in software development where agents handle code generation, review, and testing; in scientific research where agents collaborate on literature review, experimental design, and data analysis; and in cybersecurity where specialized agents perform reconnaissance, vulnerability analysis, and exploit validation.
In this post, we discuss how we’ve used this technology to deliver automated penetration testing, something that can traditionally take weeks and is resource intensive. We also provide a technical deep-dive into the architecture of the penetration testing component built into AWS Security Agent.
The concept of automated security testing isn’t new—penetration testing tools and vulnerability scanners have existed for decades. However, with recent advancements in large language models (LLMs), frontier agents are designed to reason about application behavior, adapt strategies based on feedback, and understand context in ways that traditional tools can’t. By creating a network of specialized agents, we can address increasingly complex security challenges: one agent maps the attack surface while others analyze business logic flaws, validate findings, and prioritize vulnerabilities based on actual exploitability. The exploitability context comes from the combination of actual exploit attempts by swarm agent workers, independent re-validation by specialized validators, and LLM-driven scoring according to the common vulnerability scoring system (CVSS).
We’ve developed automated penetration testing for the AWS Security Agent. This capability includes a multi-agent penetration testing system that orchestrates specialized security agents to work collaboratively on vulnerability detection. The system begins with multiple types of scanning to establish baseline coverage, then conducts broad reconnaissance using static, predefined tasks to map the application surface and identify initial attack vectors. Building on these findings, our agentic system dynamically generates focused test tasks tailored to the specific application context—reasoning about discovered endpoints, business logic patterns, and potential vulnerability chains to create targeted security tests that adapt based on application responses. By combining these specialized capabilities, the system can tackle complex security scenarios across major risk categories. Beyond single-vulnerability detection, the system performs complex chained attacks—for instance, combining an information disclosure flaw with privilege escalation to access sensitive resources, or chaining insecure direct object references (IDOR) with authentication bypass.
Figure 1: Diagram of the AWS Security Agent penetration testing component.
System architecture
This section describes the major components of the system. The following subsections cover authentication and initial access, baseline scanning, multi-phased exploration with the specialized agent swarm, and validation with report generation.
Authentication and initial access
The system begins with an intelligent sign-in component that handles authentication across diverse application architectures. This component combines LLM-based reasoning with deterministic mechanisms to locate sign-in pages, attempt provided credentials, and maintain authenticated sessions for subsequent testing phases. The approach adapts to different application structures and target environments automatically and uses a browser tool. The developer can optionally provide a custom sign-in prompt tailored to the target application.
Baseline scanning phase
Following authentication, the system initiates comprehensive baseline scanning through parallel execution of specialized scanners. For black-box testing, the network scanner conducts automated web application security testing, generating raw traffic interactions and identifying candidate vulnerable endpoints. In white-box settings, the code scanner additionally performs deep source code analysis when repositories are available, producing descriptive documentation across multiple categories. Additional specialized scanners complement these capabilities to identify vulnerabilities across multiple dimensions and establish initial security coverage.
Multi-phased exploration
The system employs two distinct exploration approaches that work in concert. Managed execution operates with predefined static tasks across major risk categories like cross-site scripting, insecure direct object reference, privilege escalation, and so on. This component systematically helps ensure comprehensive coverage by executing curated tasks for each risk type. In the next phase, guided exploration takes a dynamic, intelligence-driven approach. This component ingests discovered endpoints, validated findings, and code analysis documentation to reason about application-specific attack opportunities. It operates in two stages: first generating a contextual penetration testing plan by identifying unexplored resources and potential vulnerability chains, then programmatically managing the execution of these dynamically generated tasks. The guided explorer runs with adaptive tasks that evolve based on application responses and discovered patterns.
Specialized agent swarm Both exploration approaches dispatch work to specialized swarm worker agents—each configured for specific risk types and equipped with comprehensive penetration testing toolkits including code executors, web fuzzers, NVD vulnerability database search for Common Vulnerabilities and Exposures (CVE) intelligence, and vulnerability-specific tools. These workers execute assigned tasks with timeout management and structured reporting.
Validation and report generation
When specialized agents identify potential security risks, they generate structured reports containing the vulnerability type, affected endpoints, exploitation evidence, and technical context. However, automated penetration testing faces a critical challenge: LLM agents can produce plausible-sounding findings that require rigorous validation. Candidate findings undergo validation through both deterministic validators and specialized LLM-based agents that attempt active exploitation. We employ assertion-based validation techniques where natural language assertions written by security experts encode deep knowledge about real attack behaviors, requiring explicit, structured proof that’s significantly harder to circumvent than narrow deterministic checks. Validated findings undergo Common Vulnerability Scoring System (CVSS) analysis for severity assessment, then are synthesized into final reports with validation results, severity scores, and exploitation evidence—designed to deliver actionable, high-confidence vulnerabilities for effective remediation.
Benchmarking
To evaluate our system, we performed human evaluation in addition to automatic benchmarking. We conducted analysis on real-world trajectories and created a taxonomy of error patterns. By spotting frequent error patterns, we were able to iterate on our solution. We report results on the CVE Bench public benchmark, which is a collection of vulnerable web applications containing 40 critical-severity CVEs from the National Vulnerability Database used to evaluate AI agents on real-world exploits. Each application includes automatic exploit references, and LLM-based agents attempt to execute attacks that trigger the vulnerabilities.
We measure success through the attack success rate (ASR) metric, defined as the rate of successful exploitation of application vulnerabilities. CVE Bench uses a grader that the agent can query to verify exploit success and provides explicit capture-the-flag (CTF) instructions. We evaluate in three configurations:
With CTF instructions and grader checks after each tool call, achieving 92.5% on CVE Bench v2.0 (we note that some challenges involve blind exploitation where the agent cannot verify success without this feedback).
Without CTF instructions or grader feedback, achieving 80%—which better reflects real-world conditions where the agent must self-validate through observable outcomes. We also observed that the agent was able to identify some CVEs based on the LLM’s parametric knowledge, as shown in the following bash command where the model explicitly references a CVE by name.
Therefore, we ran an additional experiment using an LLM whose knowledge cutoff date predates CVE Bench v1.0 release, achieving 65% ASR.
The following code example shows an LLM agent demonstrating parametric knowledge of CVE-2023-37999 from its training data, then issuing a bash command to check exploitation prerequisites.
# HT Mega 2.2.0 has a known vulnerability – CVE-2023-37999
# It has an unauthenticated privilege escalation via the REST API settings endpoint
# Let's check if registration is enabled
curl -s http://target:9090/wp-login.php?action=register -I | head -10
We’re committed to pushing the frontier of security vulnerability detection by continuously evaluating our agent and staying competitive with newer, more challenging benchmarks.
Optimizing testing and compute budget
One challenge for penetration testing is determining the balance between exploitation and exploration. Using a depth-first approach can waste too much compute on specific directions, leading to lower vulnerability coverage under a fixed compute budget. Compare that to breadth-first search, which is unlikely to discover deep vulnerabilities that require testing multiple approaches. Therefore, a balance between the two approaches is needed to maximize coverage for a given compute budget. Our proposed system design aims to include a hybrid approach. A more efficient dynamic solution that generalizes across various vulnerabilities and different web applications remains an open research question.
Another challenge with penetration testing is non-determinism. Because of the underlying LLMs, the output of penetration test runs can vary from one run to another. Having different findings across multiple runs can lead to confusion. One option to mitigate this is to perform multiple runs and consolidate the findings across them.
Conclusion
The multi-agent architecture presented in this post demonstrates how you can use specialized agents that can collaborate to tackle complex penetration testing workflows—from intelligent authentication and baseline scanning through managed and guided exploration phases, culminating in rigorous validation. By orchestrating these specialized components with adaptive task generation and assertion-based validation, the system delivers comprehensive security coverage that evolves based on application-specific context and discovered patterns.
At re:Invent 2025, we introduced a completely re-imagined AWS Security Hub that unifies AWS security services, including Amazon GuardDuty and Amazon Inspector into a single experience. This unified experience automatically and continuously analyzes security findings in combination to help you prioritize and respond to your critical security risks.
Today, we’re announcing AWS Security Hub Extended, a plan of Security Hub that simplifies how you procure, deploy, and integrate a full-stack enterprise security solution across endpoint, identity, email, network, data, browser, cloud, AI, and security operations. With the Extended plan, you can expand your security portfolio beyond AWS to help protect your enterprise estate through a curated selection of AWS Partner solutions, including 7AI, Britive, CrowdStrike, Cyera, Island, Noma, Okta, Oligo, Opti, Proofpoint, SailPoint, Splunk, a Cisco company, Upwind, and Zscaler.
With AWS as the seller of record, you benefit from pre-negotiated pay-as-you-go pricing, a single bill, and no long-term commitments. You can also get unified security operations experience within Security Hub and unified Level 1 support for AWS Enterprise Support customers. You told us that managing multiple procurement cycles and vendor negotiations was creating unnecessary complexity, costing you time and resources. In response, we’ve curated these partner offerings for you to establish more comprehensive protection across your entire technology stack through a single, simplified experience.
Security findings from all participating solutions are emitted in the Open Cybersecurity Schema Framework (OCSF) schema and automatically aggregated in AWS Security Hub. With the Extended plan, you can combine AWS and partner security solutions to quickly identify and respond to risks that span boundaries.
The Security Hub Extended plan in action You can access the partner solutions directly within the Security Hub console by selecting Extended plan under the Management menu. From there, you can review and deploy any combination of curated and partner offerings.
You can review details of each partner offering directly in the Security Hub console and subscribe. When you subscribe, you’ll be directed to an automated on-boarding experience from each partner. Once onboarded, consumption-based metering is automatic and you are billed monthly as part of your Security Hub bill.
Security findings from all solutions are automatically consolidated in AWS Security Hub. This gives you immediate and direct access to all security findings in normalized OCSF schema.
To learn more about how to enhance your security posture with these integrations for AWS Security Hub, visit the AWS Security Hub User Guide.
Now available The AWS Security Hub Extended plan is now generally available in all AWS commercial Regions where Security Hub is available. You can use flexible pay-as-you-go or flat-rate pricing—no upfront investments or long-term commitments required. For more information about pricing, visit the AWS Security Hub pricing page.
This post is cowritten by Julio Bando from Santander.
Santander faced a significant technical challenge in managing an infrastructure that processes billions of daily transactions across more than 200 critical systems. The expansion into diverse financial services, including investment banking, wealth management, insurance, and payment solutions, had created unprecedented technological complexity, requiring a robust, agile, and scalable infrastructure solution. This raised two main issues. Santander needed to ensure that provisioned services followed established architecture definitions, and they needed to reduce infrastructure provisioning time, which took up to 90 days. This situation demanded intensive operational effort. The solution emerged through an innovative platform engineering initiative called Catalyst, which transformed the bank’s cloud infrastructure and development management. This post analyzes the main cases, benefits, and results obtained with this initiative.
The Catalyst solution
Santander is a global financial services company present in more than 10 countries, with over 160 million customers worldwide. They conceived Catalyst in conjunction with the Platform Strategy Program (PSP), an Amazon Web Services (AWS) program specialized in infrastructure platform design. Implemented through a partnership between AWS Professional Services and Santander, the platform was designed to abstract infrastructure provisioning complexity, standardize architectural compliance, and create a framework that enables new technologies in the bank.
The platform’s in-house frontend was developed as an intuitive developer portal, offering a unified interface for all provisioning and resource management needs. At the platform’s core is the control plane cluster, based on Amazon Elastic Kubernetes Service (Amazon EKS). This cluster is the brain of the operation, orchestrating all components and workflows. Within the cluster, Crossplane plays a fundamental role, acting as a universal resource provisioner that Santander uses to manage resources across multiple cloud providers consistently and declaratively.
The control plane cluster has three components:
Data plane claims – Managed by ArgoCD, a continuous delivery tool, the component is responsible for continuous synchronization and deployment of application stacks (integrated sets of cloud resources) and configurations, exploring the GitOps concept.
Policies catalog – A central repository of policies ensuring compliance and security across all operations using Open Policy Agent (OPA).
Santander used this innovative architecture to significantly reduce provisioning time from 90 days to only a few hours and in some cases only minutes. Catalyst brought significant benefits in terms of standardization, security, and governance. The provisioning cycle decreased from 30 days to 2 days, and proof of concept preparation time jumped from 90 days to only 1 hour. The consolidation of over 100 pipelines into a single control plane will further simplify infrastructure management. The following diagram shows the Santander catalyst architecture.
Key platform capabilities
Catalyst’s implementation enabled the creation of strategic workloads demonstrating the platform’s versatility and robustness:
Generative AI agents stack – The first success case was implementing a complete stack for AI agents integrating:
Modern data platform – One of the most complex workloads implemented through Catalyst was the new data platform, including:
Built-in integration with Databricks
Data lakes
Automated extract, transform, and load (ETL) workflows
Integration with centralized data catalog
Segregated environments for experimentation. With this implementation, the bank significantly reduces approximately 3,000 monthly tickets related to data experimentation environment provisioning.
Cloud process orchestration – creation of a modern process orchestration environment with significant results:
Implementation of retry patterns and error handling
Centralized process monitoring
Overall result
This stack reduced AI agent implementation time from 105 days to only 24 hours, eliminating dozens of provisioning tickets per environment. The success of these workloads demonstrates Catalyst’s technical capability and the solution’s versatility in meeting different business needs. Each implementation brought valuable learnings that were incorporated into the platform, creating a virtuous cycle of continuous improvement. The variety of implemented workloads also shows how Catalyst has the potential to be a universal platform, capable of supporting everything from traditional use cases to the most innovative ones involving AI and legacy system modernization. Catalyst’s success wasn’t limited to operational efficiency. The platform also catalyzed a cultural change within Santander, promoting an automation and self-service mindset among development teams. This resulted in faster overall development velocity, more agile teams, and enhanced capability to respond quickly to market changes.
Conclusion
Catalyst represents more than merely a technological tool—it’s a digital transformation enabler that’s redefining cloud development standards at the bank. With the platform, Santander addressed the challenges of a scaled environment and established a solid foundation for continuous innovation and future growth.
With these practical cases, Santander proves that investment in platform engineering solves technical problems and enables new business possibilities, keeping the bank at the forefront of digital transformation in the financial sector.
Today, we’re excited to announce the general availability of the collection groups feature for Amazon OpenSearch Serverless. With this feature you can reduce compute costs for multi-tenant workloads while creating secure tenant boundaries through per-tenant encryption, giving you the flexibility to balance cost efficiency with the exact level of isolation and security your applications requires.
Amazon OpenSearch Serverless is a serverless deployment option for Amazon OpenSearch Service, that eliminates the complexity of infrastructure management for running search and analytics workloads at scale. It automatically provisions and scales resources to deliver fast data ingestion rates and millisecond response times, even as usage patterns change. For organizations that are managing multi-tenant environments, data isolation, where the tenant’s data must be encrypted and protected (often with their own encryption keys), is a compliance requirement.
Previously, OpenSearch Serverless provided maximum security through physical isolation: each AWS Key Management Service key (KMS key) required dedicated OpenSearch Compute Units (OCUs) to maintain complete physical data separation. While this architecture provided the highest level of protection, it created challenges for multi-tenant deployments at scale. For customers managing multiple tenants with shared encryption keys, OCU resources are efficiently pooled, making the economics favorable. However, customers managing large numbers of smaller tenants, each requiring their own KMS key for data isolation, faced a challenge with higher cost. With dedicated OCU resources needed per unique key, the infrastructure costs could become prohibitive when individual tenants required only a fraction of an OCU’s capacity. This particularly impacted service providers wanting to offer bring your own key (BYOK) capabilities to their customers, forcing them to either absorb unsustainable costs or limit their service offerings.
OpenSearch Serverless has always provided flexible capacity management with maximum OCU settings to help you control costs. For most workloads, this model works seamlessly capacity scales up and down in response to demand, so you only pay for what you use. However, some workload patterns are simply better served by having a guaranteed baseline of compute ready to go from the start. Workloads with sudden traffic spikes, high-speed data ingestion pipelines, or load testing scenarios benefit from having capacity pre-allocated, so that the first requests are handled with the same responsiveness as any other. Similarly, multi-tenant architectures and time-sensitive operations often require predictable, consistent performance from the moment a collection becomes active.
Flexible controls with collection groups
Collection groups give you flexible control over security boundaries and resource allocation. Instead of forcing a one-size-fits-all approach, you can now tailor your architecture to match your specific security and cost requirements. Here’s how it works:
Define your security boundary that matches your need: Collection groups is a logical security construct for related collections. Each collection groups maintains strong isolation with physically separated memory, CPU and disk from other collection groups, ensuring robust security boundaries between different security constructs.
Share resources across encryption keys: Allocate collections to your collection groups regardless of whether they share KMS keys or use separate ones. Collections with different encryption keys can now share OCU resources within the same security boundary, dramatically reducing costs while maintaining full encryption protection and logical separation for each tenant.
Deploy with flexible network access: Collection groups support collections with different network access types, allowing you to combine collections with public endpoints and VPC endpoints within the same group. This flexibility lets you match your security and connectivity requirements while benefiting from shared resource management across all collections in the group.
Control cost and performance: Set maximum OCUs to cap spending and minimum OCUs to guarantee baseline performance. This dual control gives you a defined resource envelope for each collection groups, eliminating cost surprises while ensuring consistent performance.
Optimize with insights: Access detailed CloudWatch metrics showing resource consumption, relative usage patterns, and latency across collection groups. These insights help you right-size allocations, identify optimization opportunities, and tune performance based on actual workload behavior.
With collection groups, you now have full control over resource allocation through both minimum and maximum OCU settings
Maximum OCUs: Cost control
Set an upper limit on resources to prevent runaway scaling and control costs per collection groups. This helps ensure you never exceed your budget, even during unexpected traffic spikes. Collection groups capacity limits operate independently from account-level limits. Account-level maximum OCU settings apply only to collections not associated with any collection groups, while collection groups maximum OCU settings apply to collections within that specific group. The sum of (Max OCUs across all your collection groups + Max OCU setting at the account level) should be less than your Service Quota Max OCUs allowed for your account. This separation gives you granular cost control across different security contexts.
Minimum OCUs: Performance guarantees
Define the baseline compute resources that will always be allocated to your collection groups, for consistent performance and resource availability. These OCUs are reserved exclusively for your collection groups and provide:
Instant availability with no cold starts: Your collections benefit from instant availability without scaling delays. Resources are always warm and ready, eliminating scaling delays when traffic arrives.
Guaranteed capacity: Resources are always available, even during periods of low activity or when competing with other collection groups, ensuring predictable performance even during low-traffic periods.
Predictable costs: Minimum OCUs are charged continuously, providing you with reserved capacity in exchange for predictable billing giving you cost certainty in exchange for guaranteed performance. This reserved baseline serves as the foundation for auto-scaling, which expands capacity up to your maximum limit as demand increases.
This combination gives you the flexibility to balance cost optimization with performance guarantees based on your specific requirements.
Multi-tenant cost economics with collection groups
Managing costs in multi-tenant architectures has always required balancing isolation, performance, and efficiency often at the expense of one another. Collection groups change that equation by enabling shared capacity across collections without sacrificing security boundaries. The following details how this plays out when you work with collection groups or without.
Before collection groups: Consider a customer with 10 tenants, each requiring their own KMS key for data isolation. Most of these tenants have modest data requirements typically 10-100GB, with the majority on the smaller end of that range. Managing dedicated resources for each tenant’s encryption key, regardless of their actual capacity needs, created operational complexity and cost challenges at scale.
With collection groups: The same customer can now group their tenants with similar security requirements into the collection groups, sharing OCU resources across collections. Tenants requiring only a small portion of OCU capacity no longer force the allocation of dedicated resources, reducing costs by up to 90% for large number of smaller tenant workloads.
With minimum OCU configuration: Premium tenants can be placed in collection groups with minimum OCUs set to guarantee performance, while standard tenants use collection groups with lower minimum thresholds for cost efficiency.
The following table illustrates how these cost savings play out across different tenant configurations, comparing infrastructure costs with and without collection groups across varying data sizes and query loads.
Number of tenants with unique KMS keys
Data size and query parameters
Cost with complete data isolation (without collection groups)
Cost with collection groups
Additional comments
10
Data size: 60GB or less
Query: Not needing more than base OCU (1 for redundant collection) compute
$3,500
$350
10x Savings in cost.
10
Data size: 60GB or less
Query: More than base OCU (1 for redundant collection) compute during peak times (For example – 5 additional OCUs per tenant without collection groups & 40 OCUs across all tenants based with collection groups due to benefit of shared infra).
$3500 + Peak time scale out per tenant ($8650)
$350+ Peak time scale out ($6912).
The system will scale up when there is additional query load, additional OCUs are deployed during this time. However when the load scales back, the system will scale-in to base OCU’s.
10
Data size: Sample data size in GB per tenant [3, 5, 7, 8, 10, 15, 18, 25, 28, 150]
Query: Can handle queries upto certain level with minimum OCU for the data size and then scales out on load.
For the sample data sizes, minimum OCU requirement will be [2, 2, 2, 2, 2, 2, 2, 2, 2, 8] = 26 OCUs [$4492] + Peak time scale out per tenant
Minimum cost is determine by the number of OCUs required to hold the data across all tenants (120GB per OCU *2) + Peak time scale out.For the sample data sizes, 8 OCUs [$1382] + Peak time scale out per tenant
The system will scale up when there is additional query load, additional OCUs are deployed during this time. However when the load scales back, the system will scale-in to minimum number of OCU required to hold the data.
Note: Above calculations are made with assumption for redundant enabled collections. For non-redundant mode it will be half the above calculations.
Getting started with collection groups
Collection groups and minimum OCU configuration are available in all AWS Regions where OpenSearch Serverless is offered, at no additional charge. Collection groups offers a new organizational feature to create collection groups and add new collections directly to these groups for enhanced management capabilities. While your existing collections will continue to operate unchanged and remain independent of any collection groups, you can immediately start using collection groups for new collections to benefit from improved organization and workflow management.
Currently, only newly created collections can be associated with collection groups, and all collections within a group must be of the same type (search, time series, or vector search). Existing collections continue to operate independently with their current capacity management settings, and you cannot mix different collection types within a single collection groups. You can use the AWS Management Console, AWS CLI, AWS CloudFormation, or AWS CDK to create the collection groups. In the following section we will show you how you can create the collection groups using the OpenSearch Service console.
In the left navigation pane, choose Serverless, then choose Collection groups.
Choose Create collection groups.
For collection groups name, enter a name for your collection groups. The name must be 3-32 characters long, start with a lowercase letter, and contain only lowercase letters, numbers, and hyphens.
(Optional) For Description, enter a description for your collection groups.
In the Capacity management section, configure the OCU limits:
Maximum indexing capacity – The maximum number of indexing OCUs that collections in this group can scale up to.
Maximum search capacity – The maximum number of search OCUs that collections in this group can scale up to.
Minimum indexing capacity – The minimum number of indexing OCUs to maintain for consistent performance.
Minimum search capacity – The minimum number of search OCUs to maintain for consistent performance.
(Optional) In the Tags section, add tags to help organize and identify your collection groups.
In the left navigation pane, choose Serverless, then choose Collections.
Choose Create collection.
For Collection name, enter a name for your collection. The name must be 3-28 characters long, start with a lowercase letter, and contain only lowercase letters, numbers, and hyphens.
(Optional) For Description, enter a description for your collection.
In the Collection groups section, select the collection groups you want the collection to be assigned to. A collection can only belong to one collection groups at a time. (Optional) You can also choose to Create a new group. This will navigate you to the Create collection groups workflow. After you finish creating the collection groups, return to the step 1 of this procedure to begin creating your new collection.
Continue through the workflow to create the collection.
Managing collection groups
Once you’ve created your collection groups, you can update their settings as your architecture evolves. The Amazon OpenSearch Serverless documentation provides step-by-step guidance on how to edit and delete collection groups, including updating OCU limits and modifying group configurations using the AWS Management Console, CLI, and CloudFormation.
Conclusion
OpenSearch Serverless collection groups transform how you can architect multi-tenant deployments by offering flexible deployment modes that balance security requirements with operational efficiency. You can now choose the collection groups where you define logical security boundaries that allow collections, regardless of whether they share the same KMS key or use different KMS keys to share OCU resources.
This flexibility directly addresses the cost challenges that previously made multi-tenant deployments prohibitive. By consolidating collections within collection groups, you can reduce infrastructure costs while maintaining robust encryption and tenant isolation. Configuring both minimum and maximum OCUs for each collection groups solves the cold-start and capacity guarantee challenges: minimum OCUs ensure your collections maintain ready compute resources to handle high-speed ingestion, sudden traffic spikes, and load testing without performance degradation. Maximum OCUs provide cost predictability and spending controls. This dual configuration gives you a defined resource envelope that eliminates both the uncertainty of cold starts and the risk of runaway costs.
If you’ve ever shopped on Amazon, you’ve used Your Orders. This feature maintains your complete order history dating back to 1995, so you can track and manage every purchase you’ve made. The order history search feature lets you find your past purchases by entering keywords in the search bar. Beyond just finding items, it provides a straightforward way to repurchase the same or similar items, saving you time and effort.
Various features across Amazon’s shopping experience, such as Rufus and Alexa, use order history search to help you find your past purchases. Therefore, it’s important that order history search can locate your past purchased items as accurately and quickly as possible.
In this post, we show you how the Your Orders team improved order history search by introducing semantic search capabilities on top of our existing lexical search system, using Amazon OpenSearch Service and Amazon SageMaker.
Limitations of lexical search
Order history search uses lexical matching to find items from the entire order history of a customer that match at least one word of the search keywords. For example, if a customer searches for “orange juice,” the system retrieves all orange juice items as well as fresh oranges and other fruit juices the customer had previously ordered. Although lexical matching can provide a high recall of items with terms matching the search keywords precisely, it doesn’t work well for related or generic search keywords, like “health drinks” in this example.
Since the launch of Rufus, Amazon’s AI-enabled shopping assistant, a growing number of customers are experiencing a streamlined and richer shopping journey, including searching for their previous purchases with Rufus. Customers can now ask “Show me healthy drinks” without worrying about using lengthy, more precise terms like “kombucha”, “green tea”, and “protein shakes”. This makes the search experience more conversational and intent-based, presenting an opportunity to make item discovery more intuitive. For Rufus to answer order history searches with the same intuitive experience such as “Show me the healthy drinks I bought last year”, the underlying order history data store (“Your Orders”) needs semantic search capability to understand the underlying semantics of search keywords beyond the conventional lexical matching.
Challenges implementing semantic search
Implementing semantic search at our scale presented several technical challenges:
Scale – We needed to enable semantic search across billions of records corresponding to customers’ order history globally.
Zero downtime – We needed to keep the system 100% available while making changes on the backend to introduce semantic search.
Preventing search quality degradation – Semantic search is intended to improve the quality of search results. However, in some cases, it can reduce search quality. For example, if a customer remembers their item name exactly and wants to find only items matching that name, surfacing similar items in addition to the exactly matching items will increase crowding in results and make it harder to find the relevant item. Similarly, semantic search will not work for cases where the customer intends to search by identifier values, like order ID, which lack an inherent semantic meaning. For these scenarios, we use lexical search only.
Solution overview
Semantic search is powered by large language models (LLMs), which are mostly trained on human languages. These models can be adapted to take a piece of text in any language they were trained in and emit an embedding vector of a fixed length, irrespective of the input text length. By design, embedding vectors capture the semantic meaning of input text such that two semantically similar text strings have high cosine similarity computed on their respective embedding vectors. For semantic search on order history, the input text subject to embedding generation and similarity computation are the customer search phrases and the product text of purchased items.
We divide our solution into two parts:
Improving system scalability and resiliency for handling requests at scale – Before implementing semantic search, we needed to ensure our infrastructure could handle the increased computational load, leading us to adopt a cell-based architecture. This step is not needed for every use case, but systems with very high scale in terms of request or data volume can benefit a lot from its use before implementing a resource-intensive use case like semantic search.
Implementing semantic search – We began by evaluating the available embedding models, using the offline evaluation capabilities of Amazon Bedrock to test different models. After we selected our model, we could establish the infrastructure for generating embedding vectors.
Improving system scalability and resiliency
We used the cell-based architecture design pattern for improving our scalability and resiliency. A cell-based design entails partitioning the system into identical, smaller, self-contained chunks, or cells, which handle only a part of the overall traffic received by the system. The following diagram shows a high-level representation of a cell-based design for order history search.
Each cell serves a defined subset of our customers. Cells don’t need to communicate with one another to serve a customer request. Each customer is assigned to a cell and each request from that customer is routed to that cell. The OpenSearch Service domain in each cell holds data only for the subset customers that it is supposed to serve. The number of cells (N) and distribution of data among those cells depends on the business use case, but the goal is to achieve as even a distribution of data and traffic as possible.
The routing logic can be kept as simple or as sophisticated as the use case requires it to be. The cell assignment values can either be computed at runtime for each request, or they can be computed one time and written to a cache or persistent data store like Amazon DynamoDB, from where cell assignment values can be fetched for subsequent requests. For order history search, the logic was simple and quick enough to be executed at runtime for each request. Looking up cell assignment from a persistent data store is especially useful for cases where there is a risk of some cells becoming “heavier” than others over time. In such cases, it becomes easier to redistribute the heavy cell’s data by simply overriding cell assignment values for specific keys in the data store, instead of having to change the partitioning logic immediately, which might have an impact on data distribution across all the cells.
As the system’s load grows, the number of cells in the system can be increased to handle the additional traffic. Even without increasing the number of cells in the system, we can redistribute current data among the existing N cells by reassigning some keys from one or more heavily populated cells to different lightly populated cells to spread out the load more evenly across all the cells and make more efficient use of the infrastructure.
A cell-based architecture also helps make the system more resilient. For example, if we lose one cell, our capacity is diminished only by 1/N, instead of 100%. This arrangement can also be improved to reduce the capacity loss even further by assigning partitioning keys to two or more cells such that they get written to two or more cells. In such cases, loss of a single cell does not result in data loss.
Implementing semantic search
Implementing semantic search for our order history search required several key decisions and technical steps. We began by evaluating the available embedding models, using the offline evaluation capabilities of Amazon Bedrock to test different models against our specific business domain requirements. This evaluation process helped us identify which model would deliver the best performance for our use case. After we selected our model, we needed to establish the infrastructure for generating embedding vectors. We containerized our embedding model and registered it in Amazon Elastic Container Registry (Amazon ECR), then deployed it using SageMaker inference endpoints to handle the actual vector computation at scale.
For the search infrastructure itself, we chose OpenSearch Service to implement our semantic search capabilities. OpenSearch Service provided both the vector storage we needed and the search algorithms required to deliver relevant results to our users.
One of our biggest challenges was updating our historical data to support semantic search on existing orders. We built a data processing pipeline using AWS Step Functions to orchestrate the workflow and AWS Lambda functions to handle the actual vector generation for our legacy data, so we could provide semantic search for all the records we wanted to.
The following diagram illustrates the high-level architecture.
Model evaluation and selection
Order history search uses an embedding model trained on Amazon-specific data. Domain-specific training is critical because the generated embedding vectors must work well for the business context to return quality results.
We used an LLM-as-a-judge methodology with Anthropic’s Claude on Amazon Bedrock to evaluate candidate models. Anthropic’s Claude received prompts containing anonymized item text and search phrases from customer order history, then filtered and ranked items by relevance. These results served as ground truth for comparison.
We evaluated models using standard ranking metrics:
Normalized Discounted Cumulative Gain (NDCG) – Measures ranking quality against ideal order
Mean Reciprocal Rank (MRR) – Considers position of first relevant item
Precision – Rates accuracy of retrieved results
Recall – Rates ability to retrieve all relevant items
Search only through the requesting customer’s order history – We don’t want items from one customer’s order history showing up in search results for another customer
Search all of that customer’s history – We don’t want to miss showing an item that would have been relevant for the customer’s search phrase just because the search algorithm missed evaluating it for some reason
Our approach involves using OpenSearch Service to retrieve all items for the customer who issued the search query, calculating relevance scores for each of them against the search phrase, sorting by score, and returning top K results. This provides comprehensive results coverage for each customer.
Vector storage with OpenSearch Service
We used two OpenSearch Service features for efficient vector storage and search:
knn_vector datatype – Built-in support for storing embedding vectors. Existing domains can add this field type without reindexing, enabling exact kNN search across all records. We didn’t need approximate kNN because the number of records for most customers was small enough for exact kNN to scale.
Hybrid search refers to combining the results of lexical and semantic search to benefit from the strengths of each. The hybrid query capabilities of OpenSearch Service simplify implementing hybrid search by letting clients specify both types of queries in a single request. OpenSearch Service runs both queries in parallel, merges their results, normalizes the relevance scores of the sub-queries, and sorts results by the provided sort order (relevance score by default) before returning them to clients.
This gives clients the best of both types of searches. For example, there are certain scenarios where the search phrase doesn’t make much sense semantically, like when customers search by their orderId values. Semantic search is not designed for such cases; these are best served using keyword matching.
The hybrid search functionality helped save implementation effort and potential latency increase for order history search.
Updating historical data
After the infrastructure has been set up, newly ingested records are persisted with the relevant embedding vectors and support semantic search on those records. However, when customers search, they typically search for products they had purchased earlier. Therefore, the system might not help improve customer experience much unless the older records are updated to include the relevant embeddings. The approach to populate this data depends on the scale of the problem at hand.
Releasing the change to minimize potential customer impact
Our final step was to release the change to clients in a manner such that the impact of any potential problems is as small as possible. There are multiple ways to do that, including:
Implementing semantic search in a manner such that any transient issues in the semantic search flow make the logic fall back to lexical-only search, instead of failing the request completely. Even if semantic search doesn’t execute, the system should still be able to return results of lexical search to the client, instead of empty results.
Gating the change such that the default behavior remains lexical-only search and clients who need the semantic search feature must pass an additional flag in the request, for example, which executes the semantic or hybrid flow only for those requests.
Keeping the new flow behind a feature flag during the initial period such that it could be turned off completely if some critical problem is detected.
Examples of improved customer experience
The following are some examples of customer interactions with Rufus that required Rufus to query the respective customer’s order history to answer their question and give them the required pieces of information.
The following screenshots show how semantic search picks up wooden spoons for a “sustainable utensils” query and different kinds of chargers despite not having the keyword “charger” in the title description, in the case of the wall connector.
The following screenshots show how semantic search picks up relevant results even though the title description doesn’t include the queried keywords.
The semantic search feature of order history search helped Rufus fetch them and show to the customers. Before semantic search, Rufus wasn’t able to show any results to customers for such queries.
Business impact
Our solution resulted in the following key business impacts:
Customer experience improvements – The solution achieved 10% improvement in query recall, increasing the percentage of searches that return relevant results. It also reduced customer service contacts for issues related to locating past orders.
Partner integration success – The solution strengthened natural language processing capabilities for Alexa and Rufus, enhancing their ability to interpret order history queries. It also reduced the need for reranking and postprocessing by partner teams. We improved query success rate by 20%, meaning more customer searches now return at least one relevant item. We also observed enhanced result coverage by 48%, with semantic search consistently surfacing additional relevant matches that lexical search would have missed.
Conclusion
In this post, we showed you how we evolved Amazon order history search to support semantic search capabilities. This transition involved using cutting-edge AI technology while working within existing infrastructure limitations to develop solutions that avoided disruption and maintained SLAs during the feature upgrade. The implementation also involved backfilling, where billions of documents were processed at rates multiple times higher than normal ingestion to compute embedding vectors for previously purchased items. This operation required careful engineering and took advantage of the resilience OpenSearch Service offers even under extreme load.
Beyond the immediate implementation, this foundation enables continued innovation in search technology. The embedding vectors framework can incorporate improved models as they become available, and the architecture supports expansion into new capabilities such as personalization and multi-modal search.
You can get started with exact k-NN search today following the instructions in Exact k-NN search. If you’re looking for a managed solution for your OpenSearch cluster, check out Amazon OpenSearch Service.
The International Image Interoperability
Framework, or IIIF (“triple-eye eff”), is a small set of standards that
form a basis for serving, displaying, and reusing image data on the web. It
consists of a number of API definitions that compose with each other to
achieve a standard for providing, for example, presentations of
high-resolution images at multiple zoom levels, as well as bundling multiple images
together. Presentations may include metadata about details like authorship,
dates, references to other representations of the same work, copyright
information, bibliographic identifiers, etc. Presentations can be further
grouped into collections, and metadata can be added in the form of
transcriptions, annotations, or captions. IIIF is most popular with
cultural-heritage organizations, such as libraries, universities, and
archives.
To provide the best experiences, we use technologies like cookies to store and/or access device information. Consenting to these technologies will allow us to process data such as browsing behavior or unique IDs on this site. Not consenting or withdrawing consent, may adversely affect certain features and functions.
Functional
Always active
The technical storage or access is strictly necessary for the legitimate purpose of enabling the use of a specific service explicitly requested by the subscriber or user, or for the sole purpose of carrying out the transmission of a communication over an electronic communications network.
Preferences
The technical storage or access is necessary for the legitimate purpose of storing preferences that are not requested by the subscriber or user.
Statistics
The technical storage or access that is used exclusively for statistical purposes.The technical storage or access that is used exclusively for anonymous statistical purposes. Without a subpoena, voluntary compliance on the part of your Internet Service Provider, or additional records from a third party, information stored or retrieved for this purpose alone cannot usually be used to identify you.
Marketing
The technical storage or access is required to create user profiles to send advertising, or to track the user on a website or across several websites for similar marketing purposes.

 Донка Дойчева-Попова
 Донка Дойчева-Попова
 Надежда Цекулова
 Донка Дойчева-Попова
 Донка Дойчева-Попова