We are opening up a preview of the next generation of Amazon Elastic Compute Cloud (Amazon EC2) instances. Equipped with brand-new Graviton4 processors, the new R8g instances will deliver better price performance than any existing memory-optimized instance. The R8g instances are suitable for your most demanding memory-intensive workloads: big data analytics, high-performance databases, in-memory caches and so forth.
Graviton history Let’s take a quick look back in time and recap the evolution of the Graviton processors:
November 2018 – The Graviton processor made its debut in the A1 instances, optimized for both performance and cost, and delivering cost reductions of up to 45% for scale-out workloads.
December 2019 – The Graviton2 processor debuted with the announcement of M6g, M6gd, C6g, C6gd, R6g, and R6gd instances with up to 40% better price performance than equivalent non-Graviton instances. The second-generation processor delivered up to 7x performance of the first one, including twice the floating point performance.
November 2021 – The Graviton3 processor made its debut with the announcement of the compute-optimized C7g instances. In addition to up to 25% better compute performance, this generation of processors once again doubled floating point and cryptographic performance when compared to the previous generation.
November 2022 – The Graviton 3E processor was announced, for use in the Hpc7g and C7gn instances, with up to 35% higher vector instruction processing performance than the Graviton3.
Today, every one of the top 100 Amazon Elastic Compute Cloud (EC2) customers makes use of Graviton, choosing between more than 150 Graviton-powered instances.
New Graviton4 I’m happy to be able to tell you about the latest in our series of innovative custom chip designs, the energy-efficient AWS Graviton4 processor.
96 Neoverse V2 cores, 2 MB of L2 cache per core, and 12 DDR5-5600 channels work together to make the Graviton4 up to 40% faster for databases, 30% faster for web applications, and 45% faster for large Java applications than the Graviton3.
Graviton4 processors also support all of the security features from the previous generations, and includes some important new ones including encrypted high-speed hardware interfaces and Branch Target Identification (BTI).
R8g instance sizes The 8th generation R8g instances will be available in multiple sizes with up to triple the number of vCPUs and triple the amount of memory of the 7th generation (R7g) of memory-optimized, Graviton3-powered instances.
The new Amazon S3 Express One Zone storage class is designed to deliver up to 10x better performance than the S3 Standard storage class while handling hundreds of thousands of requests per second with consistent single-digit millisecond latency, making it a great fit for your most frequently accessed data and your most demanding applications. Objects are stored and replicated on purpose built hardware within a single AWS Availability Zone, allowing you to co-locate storage and compute (Amazon EC2, Amazon ECS, and Amazon EKS) resources to further reduce latency.
Amazon S3 Express One Zone With very low latency between compute and storage, the Amazon S3 Express One Zone storage class can help to deliver a significant reduction in runtime for data-intensive applications, especially those that use hundreds or thousands of parallel compute nodes to process large amounts of data for AI/ML training, financial modeling, media processing, real-time ad placement, high performance computing, and so forth. These applications typically keep the data around for a relatively short period of time, but access it very frequently during that time.
This new storage class can handle objects of any size, but is especially awesome for smaller objects. This is because for smaller objects the time to first byte is very close to the time for last byte. In all storage systems, larger objects take longer to stream because there is more data to download during the transfer, and therefore the storage latency has less impact on the total time to read the object. As a result, smaller objects receive an outsized benefit from lower storage latency compared to large objects. Because of S3 Express One Zone’s consistent very low latency, small objects can be read up to 10x faster compared to S3 Standard.
The extremely low latency provided by Amazon S3 Express One Zone, combined with request costs that are 50% lower than for the S3 Standard storage class, means that your Spot and On-Demand compute resources are used more efficiently and can be shut down earlier, leading to an overall reduction in processing costs.
In order to reduce latency and to make this storage class as efficient & scalable as possible, we are introducing a new bucket type, a new authentication model, and a bucket naming convention:
New bucket type – The new directory buckets are specific to this storage class, and support hundreds of thousands of requests per second. They have a hierarchical namespace and store object key names in a directory-like manner. The path delimiter must be “/“, and any prefixes that you supply to ListObjectsV2 must end with a delimiter. Also, list operations return results without first sorting them, so you cannot do a “start after” retrieval.
New authentication model – The new CreateSession function returns a session token that grants access to a specific bucket for five minutes. You must include this token in the requests that you make to other S3 API functions that operate on the bucket or the objects in it, with the exception of CopyObject, which requires IAM credentials. The newest versions of the AWS SDKs handle session creation automatically.
Bucket naming – Directory bucket names must be unique within their AWS Region, and must specify an Availability Zone ID in a specially formed suffix. If my base bucket name is jbarr and it exists in Availability Zone use1-az5 (Availability Zone 5 in the US East (N. Virginia) Region) the name that I supply to CreateBucket would be jbarr--use1-az5--x-s3. Although the bucket exists within a specific Availability Zone, it is accessible from the other zones in the region, and there are no data transfer charges for requests from compute resources in one Availability Zone to directory buckets in another one in the same region.
Amazon S3 Express One Zone in action Let’s put this new storage class to use. I will focus on the command line, but AWS Management Console and API access are also available.
My EC2 instance is running in my us-east-1f Availability Zone. I use jq to map this value to an Availability Zone Id:
The Management Console for S3 shows General purpose buckets and Directory buckets on separate tabs:
I can import the contents of an existing bucket (or a prefixed subset of the contents) into a directory bucket using the Import button, as seen above. I select a source bucket, click Import, and enter the parameters that will be used to generate an inventory of the source bucket and to create and an S3 Batch Operations job.
The job is created and begins to execute:
Things to know Here are some important things to know about this new S3 storage class:
Regions – Amazon S3 Express One Zone is available in the US East (N. Virginia), US West (Oregon), Asia Pacific (Tokyo), and Europe (Stockholm) Regions, with plans to expand to others over time.
Pricing – Pricing, like the other S3 storage classes, is on a pay-as-you-go basis. You pay $0.16/GB/month in the US East (N. Virginia) Region, with a one-hour minimum billing time for each object, and additional charges for certain request types. You pay an additional per-GB fee for the portion of any request that exceeds 512 KB. For more information, see the Amazon S3 Pricing page.
Durability – In the unlikely case of the loss or damage to all or part of an AWS Availability Zone, data in a One Zone storage class may be lost. For example, events like fire and water damage could result in data loss. Apart from these types of events, our One Zone storage classes use similar engineering designs as our Regional storage classes to protect objects from independent disk, host, and rack-level failures, and each are designed to deliver 99.999999999% data durability.
SLA – Amazon S3 Express One Zone is designed to deliver 99.95% availability with an availability SLA of 99.9%; for information see the Amazon S3 Service Level Agreement page.
This new storage class is available now and you can start using it today!
Today, I’m excited to introduce the new Amazon CodeCatalyst enterprise tier and custom blueprints.
Amazon CodeCatalyst enterprise tier is a new pricing tier that offers features like custom blueprints and project lifecycle management. The enterprise tier is $20/user per month, and each enterprise tier space gets 1,500 compute minutes, 160 Dev Environment hours, and 64GB of Dev Environment storage per paying user. You can use custom blueprints to define best practices for your application code, workflows, and infrastructure. You can publish these blueprints to your CodeCatalyst space, utilizing them for project creation or applying standards to existing projects.
Blueprints help you set up projects in minutes so you can get to work on code immediately. With just a few clicks, you can set up project files and configure built-in, fully integrated tools (for example, source repository, issue management, and continuous integration and delivery (CI/CD) pipeline) with best practices for your particular type of project. You can swap in popular tools like GitHub if needed, while maintaining the unified experience. You spend less time on building, integrating, or operating developer tools over the project’s lifetime.
With custom blueprints, you can define various elements of your CodeCatalyst project, like workflow definitions, infrastructure as code (IaC), and application code. When custom blueprints are updated, those changes are reflected in any project using the blueprint as a pull request update. This streamlined process reduces overhead in setting up your projects and ensures that best practices are consistently applied across your projects. As an admin, you can easily view details about which projects are using each blueprint in your CodeCatalyst space, giving you visibility into how standards are being applied across your projects.
Creating a custom blueprint in CodeCatalyst I open the CodeCatalyst console and then I navigate to my space. On the Settings tab, I choose Blueprints on the left navigation pane, and then I select Create blueprint. At this point, I codify my best practices in this blueprint. When ready, I’ll publish it back to my space so my teams can use it to create projects.
After I publish my blueprint, I can view and manage it in my CodeCatalyst space in the Settings tab. In the left panel, I choose Blueprints. Then I select Space blueprints.
I select Create project > Space blueprints to create a CodeCatalyst project from my custom blueprint.
Availability
The Amazon CodeCatalyst enterprise tier is available in US West (Oregon) and Europe (Ireland) Regions, but you can deploy to any commercial Region. To learn more, visit the Amazon CodeCatalyst webpage.
As cloud environments—and security risks associated with them—become more complex, it becomes increasingly critical to understand your cloud security posture so that you can quickly and efficiently mitigate security gaps. AWS Security Hub offers close to 300 automated controls that continuously check whether the configuration of your cloud resources aligns with the best practices identified by Amazon Web Services (AWS) security experts and with industry standards. Furthermore, you can manage your cloud security posture at scale by using a single action to enable Security Hub across your organization with the default settings, and by aggregating findings across your organization accounts and Regions to a single account and Region of your choice.
With the release of the new central configuration feature of Security Hub, the setup and management of control and policy configurations is simplified and centralized to the same account you have already been using to aggregate findings. In this blog post, we will explain the benefits of the new feature and describe how you can quickly onboard to it.
Central configuration overview
With the release of the new central configuration capabilities in Security Hub, you are now able to use your delegated administrator (DA) account (an AWS Organizations account designated to manage Security Hub throughout your organization) to centrally manage Security Hub controls and standards and to view your Security Hub configuration throughout your organization from a single place. To facilitate this functionality, central configuration allows you to set up policies that specify whether or not Security Hub should be enabled and which standards and controls should be turned on. You can then choose to associate your policies with your entire organization or with specific accounts or organizational units (OUs), with your policies applying automatically across linked Regions. Policies applied to specific OUs (or to the entire organization) are inherited by child accounts. This not only applies to existing accounts, but also to new accounts added to those OUs (or to the entire organization) after you created the policy. Furthermore, when you add a new linked Region to Security Hub, your existing policies will be applied to that Region immediately. This allows you to stop maintaining manual lists of accounts and Regions to which you’d like to apply your custom configurations; instead, you can maintain several policies for your organization, with each one being associated to a different set of accounts in your organization. As a result, by using the central configuration capabilities, you can significantly reduce the time spent on configuring Security Hub and switch your focus to remediating its findings.
After applying your policies, Security Hub also provides you with a view of your organization that shows the policy status per OU and account while also preventing drift. This means that after you set up your organization by using central configuration, account owners will not be able to deviate from your chosen settings—your policies will serve as the source of truth for your organizational configuration, and you can use them to understand how Security Hub is configured for your organization.
The use of the new central configuration feature is now the recommended approach to configuring Security Hub, and its standards and controls, across some or all AWS accounts in your AWS Organizations structure.
Prerequisites
To get started with central configuration, you need to complete three prerequisites:
Enable AWS Config in the accounts and Regions where you plan to enable Security Hub. (For more information on how to optimize AWS Config configuration for Security Hub usage, see this blog post.)
Turn on Security Hub in your AWS Organizations management account at least in one Region where you plan to use Security Hub.
Use your Organizations management account to delegate an administrator account for Security Hub.
If you are new to Security Hub, simply navigate to it in the AWS Management Console from your organization management account, and the console will walk you through setting the last two prerequisites listed here. If you already use Security Hub, these can be configured from the Settings page in Security Hub. In both cases, upon completing these three prerequisites, you can proceed with the central configuration setup from the account you set as the DA.
Recommended setup
To begin the setup, open the Security Hub console from your AWS Organizations management account or from your Security Hub delegated administrator account. In the left navigation menu, choose Configuration to open the new Configuration page, shown in Figure 1. Choose Start central configuration.
Figure 1: The new Configuration page, where you can see your current organizational configuration and start using the new capabilities
If you signed in to Security Hub using the AWS Organizations management account, you will be brought to step 1, Designate delegated administrator, where you will be able to designate a new delegated administrator or confirm your existing selection before continuing the setup. If you signed in to Security Hub using your existing delegated administrator account, you will be brought directly to step 2, Centralize organization, which is shown in Figure 2. In step 2, you are first asked to choose your home Region, which is the AWS Region you will use to create your configuration policies. By default, the current Region is selected as your home Region, unless you already use cross-Region finding aggregation — in which case, your existing aggregation Region is pre-selected as your home Region.
You are then prompted to select your linked Regions, which are the Regions you will configure by using central configuration. Regions that were already linked as part of your cross-Region aggregation settings will be pre-selected. You will also be able to add additional Regions or choose to include all AWS Regions, including future Regions. If your selection includes opt-in Regions, note that Security Hub will not be enabled in them until you enable those Regions directly.
Figure 2: The Centralize organization page
Step 3, Configure organization, is shown in Figure 3. You will see a recommendation that you use the AWS recommended Security Hub configuration policy (SHCP) across your entire organization. This includes enabling the AWS Foundational Security Best Practices (FSBP) v1.0.0 standard and enabling new and existing FSBP controls in accounts in your AWS Organizations structure. This is the recommended configuration for most customers, because the AWS FSBP have been carefully curated by AWS security experts and represent trusted security practices for customers to build on.
Alternatively, if you already have a custom configuration in Security Hub and would like to import it into the new capabilities, choose Customize my Security Hub configuration and then choose Pre-populate configuration.
Figure 3: Step 3 – creating your first policy
Step 4, Review and apply, is where you can review the policy you just created. Until you complete this step, your organization’s configuration will not be changed. This step will override previous account configurations and create and apply your new policy. After you choose Create policy and apply, you will be taken to the new Configuration page, which was previously shown in Figure 1. The user interface will now be updated to include three tabs — Organization, Policies, and Invitation account — where you can do the following:
On the Organization tab, which serves as a single pane of glass for your organization configuration in Security Hub, you can see the policy status for each account and OU and verify that your desired configuration is in effect.
On the Policies tab, you can view your policies, update them, and create new ones.
On the Invitation accounts tab, you can view and update findings for invitation accounts, which do not belong to your AWS Organizations structure. These accounts cannot be configured using the new central configuration capabilities.
Together, those tabs serve as a single pane of glass for your organization configuration in Security Hub. To that end, the organization chart you now see shows which of your accounts have already been affected by the policy you just created and which are still pending. Normally, an account will show as pending only for a few minutes after you create new policies or update existing ones. However, an account can stay in pending status for up to 24 hours. During this time, Security Hub will try to configure the account with your chosen policy settings.
If Security Hub determines that a policy cannot be successfully propagated to an account, it will show its status as failed (see Figure 4). This is most likely to happen when you missed completing the prerequisites in the account where the failure is showing. For example, if AWS Config is not yet enabled in an account, the policy will have a failed status. When you hover your pointer over the word “Failed”, Security Hub will show an error message with details about the issue. After you fix the error, you can try again to apply the policy by selecting the failed account and choosing the Re-apply policy button.
Figure 4: The Organization tab on the Configuration page shows all your organization accounts, if they are being managed by a policy, and the policy status for each account and OU
Flexibility in onboarding to central configuration
As mentioned earlier, central configuration makes it significantly more accessible for you to centrally manage Security Hub and its controls and standards. This feature also gives you the granularity to choose the specific accounts to which your chosen settings will be applied. Even though we recommend to use central configuration to configure all your accounts, one advantage of the feature is that you can initially create a test configuration and then apply it across your organization. This is especially useful when you have already configured Security Hub using previously available methods and you would like to check that you have successfully imported your existing configuration.
When you onboard to central configuration, accounts in the organization are self-managed by default, which means that they still maintain their previous configuration until you apply a policy to them, to one of their parent OUs, or to the entire organization. This gives you the option to create a test policy when you onboard, apply it only to a test account or OU, and check that you achieved your desired outcome before applying it to other accounts in the organization.
Configure and deploy different policies per OU
Although we recommend that you use the policy recommended by Security Hub whenever possible, every customer has a different environment and some customization might be required. Central configuration does not require you to use the recommended policy, and you can instead create your own custom policies that specify how Security Hub is used across organization accounts and Regions. You can create one configuration policy for your entire organization, or multiple policies to customize Security Hub settings in different accounts.
In addition, you might need to implement different policies per OU. For example, you might need to do that when you have a finance account or OU in which you want to use Payment Card Industry Data Security Standard (PCI DSS) v3.2.1. In this case, you can go to the Policies tab, choose Create policy, specify the configuration you’d like to have, and apply it to those specific OUs or accounts, as shown in Figure 5. Note that each policy must be complete — which means that it must contain the full configuration settings you would like to apply to the chosen set of accounts or OUs. In particular, an account cannot inherit part of its settings from a policy associated with a parent OU, and the other part from its own policy. The benefit of this requirement is that each policy serves as the source of truth for the configuration of the accounts it is applied to. For more information on this behavior or on how to create new policies, see the Security Hub documentation.
Figure 5: Creation of a new policy with the FSBP and the PCI DSS standards
You might find it necessary to exempt accounts from being centrally configured. You have the option to set an account or OU to self-managed status. Then only the account owner can configure the settings for that account. This is useful if your organization has teams that need to be able to set their own security coverage. Unless you disassociate self-managed accounts from your Security Hub organization, you will still see findings from self-managed accounts, giving you organization-wide visibility into your security posture. However, you won’t be able to view the configuration of those accounts, because they are not centrally managed.
Understand and manage where controls are applied
In addition to being able to centrally create and view your policies, you can use the control details page to define, review, and apply how policies are configured at a control level. To access the control details page, go to the left navigation menu in Security Hub, choose Controls, and then choose any individual control.
The control details page allows you to review the findings of a control in accounts where it is already enabled. Then, if you decide that these findings are not relevant to specific accounts and OUs, or if you decide that you want to use the control in additional accounts where it is not currently enabled, you can choose Configure, view the policies to which the control currently applies, and update the configuration accordingly as shown in Figure 6.
Figure 6: Configuring a control from the control details page
Organizational visibility
As you might already have noticed in the earlier screenshot of the Organization view (Figure 4), the new central configuration capability gives you a new view of the policies applied (and by extension, the controls and standards deployed) to each account and OU. If you need to customize this configuration, you can modify an existing policy or create a new policy to quickly apply to all or a subset of your accounts. At a glance, you can also see which accounts are self-managed or don’t have Security Hub turned on.
Conclusion
Security Hub central configuration helps you to seamlessly configure Security Hub and its controls and standards across your accounts and Regions so that your organization’s accounts have the level of security controls coverage that you want. AWS recommends that you use this feature when configuring, deploying, and managing controls in Security Hub across your organization’s accounts and Regions. Central configuration is now available in all commercial AWS Regions. Try it out today by visiting the new Configuration page in Security Hub from your DA. You can benefit from the Security Hub 30-day free trial even if you use central configuration, and the trial offer will be automatically applied to organization accounts in which you didn’t use Security Hub before.
If you have feedback about this post, submit comments in the Comments section below. If you have questions about this post, contact AWS Support.
Want more AWS Security news? Follow us on Twitter.
I am pleased to announce that IBM and AWS have come together to offer Amazon Relational Database Service (Amazon RDS) for Db2, a fully managed Db2 database engine running on AWS infrastructure.
IBM Db2 is an enterprise-grade relational database management system (RDBMS) developed by IBM. It offers a comprehensive set of features, including strong data processing capabilities, robust security mechanisms, scalability, and support for diverse data types. Db2 is a well-established choice among organizations for effectively managing data in various applications and handling data-intensive workloads due to its reliability and performance. Db2 has its roots in the pioneering work around data storage and structured query language (SQL) IBM has done since the 1970s. It has been commercially available since 1983, initially just for mainframes, and was later ported to Linux, Unix, and Windows platforms (LUW). Today, Db2 powers thousands of business-critical applications in all verticals.
With Amazon RDS for Db2, you can now create a Db2 database with just a few clicks in the AWS Management Console, one command to type with the AWS Command Line Interface (AWS CLI), or a few lines of code with the AWS SDKs. AWS takes care of the infrastructure heavy lifting, freeing your time for higher-level tasks such as schema and query optimizations for your applications.
If you are new to Amazon RDS or coming from an on-premises Db2 background, let me quickly recap the benefits of Amazon RDS.
Amazon RDS offers the same Db2 database as the one you use on-premises today. Your existing applications will reconnect to RDS for Db2 without changing their code.
The database runs on a fully managed infrastructure. You don’t have to provision servers, install the packages, install patches, or maintain the infrastructure in an operational state.
The database is also fully managed. We take care of the installation, minor version upgrades, daily backup, scaling, and high availability.
The infrastructure can scale up and down as required. You can simply stop and then restart the database to change the underlying hardware and meet changing performance requirements or benefit from last-generation hardware.
Amazon RDS offers a choice of storage types designed to deliver fast, predictable, and consistent I/O performance. For new or unpredictable workloads, you can configure the system to automatically scale your storage.
Amazon RDS automatically takes care of your backups, and you can restore them to a new database with just a few clicks.
Amazon RDS helps to deploy highly available architectures. Amazon RDS synchronously replicates data to a standby database in a different Availability Zone (an Availability Zone is a group of distinct data centers). When a failure is detected with a Multi-AZ deployment, Amazon RDS automatically fails over to the standby instance and routes requests without changing the database endpoint DNS name. This switch happens with minimal downtime and zero data loss.
You can migrate your existing on-premises Db2 database to Amazon RDS using native Db2 tools, such as restore and import, or AWS Database Migration Service (AWS DMS). AWS DMS allows you to migrate databases in a single operation or continuously, while your applications continue to update the data on the source database, until you decide on the cut off.
Let’s see how it works I always like to get my hands on a new service to learn how it works. Let’s create a Db2 database and connect to it using the standard tool provided by IBM. I assume most of you reading this post come from an IBM Db2 background and don’t know much about Amazon RDS.
First, I create a Db2 database. To do this, I navigate to the Amazon RDS page of the AWS Management Console and select Create database. For this demo, I’ll accept most of the default values. I’ll show you, however, all the sections and will comment on the important configuration points you have to think about.
I select Db2 from among the multiple database engines Amazon RDS offers.
I select Production. Amazon RDS will deploy a default configuration tuned for high availability and fast, consistent performance.
Under Settings, I give a name to my RDS instance (this is not the Db2 catalog name!), and I select the master username and password.
Under Instance configuration, I choose the type of node to run my database. This will define the hardware characteristics of the virtual server: the number of vCPUs, quantity of memory, and so on. Depending on the requirements of your application, you can allocate instances offering up to 32 vCPUs and 128 GiB of RAM for IBM Db2 Standard instances. When you select IBM Db2 Advanced instances, you can allocate instances offering up to 128 vCPUs and 1 TiB of RAM. This parameter has a direct impact on the price.
Under Storage, I choose the type of Amazon Elastic Block Store (Amazon EBS) volumes, their size, and their IOPS and throughput. For this demo, I accept the values proposed by default. This is also a set of parameters that directly impact the price.
Under Connectivity, I select the VPC (in AWS terms, a VPC is a private network) where the database will be deployed. Under Public access, I select No to make sure the database instance is only accessible from my private network. I can’t think of a (good) use case where you want to select Yes for this option.
This is also where you select the VPC security group. A security group is a network filter that defines what IP addresses or networks can access your database instance and on what TCP port. Be sure to select or create a security group with TCP 50000 open to allow applications to connect to your Db2 database.
I leave all other options with their default value. It is important to open the Additional configuration section at the very bottom of the page. This is where you can give an Initial database name. If you don’t name your Db2 database here, your only option will be to restore an existing Db2 database backup on that instance.
This section also contains the parameters for the Amazon RDS automatic backup. You can choose a time window and how long we will retain the backups.
I accept all the defaults and select Create database.
After a few minutes, you can see your database is available.
I select the DNS name of the database instance Endpoint, and I connect to a Linux machine running in the same network. After installing the Db2 client package that I downloaded from the IBM website, I type the following commands to connect to the database. There is nothing specific to Amazon RDS here.
db2 catalog TCPIP node blognode remote awsnewsblog-demo.abcdef.us-east-2.rds-preview.amazonaws.com server 50000
db2 catalog database NEWSBLOG as blogdb2 at node blognode authentication server_encrypt
db2 connect to blogdb2 user admin using MySuperPassword
Once connected, I download a sample dataset and script from the popular Db2Tutorial website. I run the scripts against the database I just created.
As you can see, there is nothing specific to Amazon RDS when it comes to connecting and using the database. I use standard Db2 tools and scripts.
One more thing Amazon RDS for Db2 requires you to bring your own Db2 license. You must enter your IBM customer ID and site number before starting a Db2 instance.
To do so, create a custom DB parameter group and attach it to your database instance at launch time. A DB parameter group acts as a container for engine configuration values that are applied to one or more DB instances. In a Db2 parameter group, there are two parameters specific to IBM Db2 licenses: your IBM Customer Number (rds.ibm_customer_id) and your IBM site number (rds.ibm_site_id).
If you do not know your site number, reach out to your IBM sales organization for a copy of a recent Proof-of-Entitlement (PoE), invoice, or sales order. All these documents should include your site number.
Pricing and availability Amazon RDS for Db2 is available in all AWS Regions except China and GovCloud.
Amazon RDS pricing is on demand, and there are no upfront costs or subscriptions. You only pay by the hour when the database is running, plus the GB per month of database storage provisioned and backup storage you use and the number of IOPS you provision. The Amazon RDS for Db2 pricing page has the details of pricing per Region. As I mentioned earlier, Amazon RDS for Db2 requires you to bring your own Db2 license.
If you already know Amazon RDS, you’ll be delighted to have a new database engine available for your application developers. If you’re coming from an on-premises world, you will love the simplicity and automation that Amazon RDS offers.
With Amazon Simple Queue Service (Amazon SQS), you can send, store, and receive messages between software components at any volume. Today, Amazon SQS has introduced two new capabilities for first-in, first-out (FIFO) queues:
Maximum throughput has been increased up to 70,000 transactions per second (TPS) per API action in selected AWS Regions, supporting sending or receiving up to 700,000 messages per second with batching.
Dead letter queue (DLQ) redrive support to handle messages that are not consumed after a specific number of retries in a way similar to what was already available for standard queues.
Let’s take a more in-depth look at how these work in practice.
FIFO queues throughput increase up to 70K TPS FIFO queues are designed for applications that require messages to be processed exactly once and in the order in which they are sent. While standard queues have an unlimited throughput, FIFO queues have an upper quota in the number of TPS per API action.
Standard and FIFO queues support batch actions that can send and receive up to 10 messages with a single API call (up to a maximum total payload of 256 KB). This means that a FIFO queue can process up to 10 times more messages per second than its maximum throughput.
At launch in 2016, FIFO queues supported up to 300 TPS per API action (3,000 messages per second with batching). This was enough for many use cases, but some customers asked for more throughput.
This year, Amazon SQS has already increased FIFO queue throughput quota two times, to up to 9,000 TPS per API action in August and up to 18,000 TPS per API action in October (depending on the Region).
Today, the Amazon SQS team has been able to increase the FIFO queue throughput quota again, allowing you to process up to 70,000 TPS per API action (up to 700,000 messages per second with batching) in the US East (N. Virginia), US West (Oregon), and Europe (Ireland) Regions. This is more than two hundred times the maximum throughput at launch.
DLQ redrive support for FIFO queues With Amazon SQS, messages that are not consumed after a specific number of retries can automatically be moved to a DLQ. There, messages can be analyzed to understand the reason why they have not been processed correctly. Sometimes there is a bug or a misconfiguration in the consumer application. Other times the messages contain invalid data from the source applications that needs to be fixed to allow the messages to be processed again.
Either way, you can define a plan to reprocess these messages. For example, you can fix the consumer application and redrive all messages to the source queue. Or you can create a dedicated queue where a custom application receives the messages, fixes their content, and then sends them to the source queue.
To simplify moving the messages back to the source queue or to a different queue, Amazon SQS allows you to create a redrive task. Redrive tasks are already available for standard queues. Starting today, you can also start a redrive task for FIFO queues.
Using the Amazon SQS console, I create a first queue (my-dlq.fifo) to be used as a DLQ. To redrive messages back to the source FIFO queue, the queue type must match, so this is also a FIFO queue.
Then, I create a source FIFO queue (my-source-queue.fifo) to handle messages as usual. When I create the source queue, I configure the first queue (my-dlq.fifo) as the DLQ and specify 3 as the Maximum receives condition under which messages are moved from the source queue to the DLQ.
When a message has been received by a consumer for more than the number of times specified by this condition, Amazon SQS moves the message to the DLQ. The original message ID is retained and can be used to uniquely track the message.
To test this setup, I use the console to send a message to the source queue. Then, I use the AWS Command Line Interface (AWS CLI) to receive the message multiple times without deleting it.
{
    "Messages": [
        {
            "MessageId": "ef2f1c72-4bfe-4093-a451-03fe2dbd4d0f",
            "ReceiptHandle": "...",
            "MD5OfBody": "0f445a578fbcb0c06ca8aeb90a36fcfb",
            "Body": "My important message."
        }
    ]
}
To receive the same message more than once, I wait for the time specified in the queue visibility timeout to pass (30 seconds by default).
After the third time, the message is not in the source queue because it has been moved to the DLQ. When I try to receive messages from the source queue, the list is empty.
In Redrive configuration, I choose to redrive the messages to the source queue. Optionally, I can specify another FIFO queue as a custom destination. I use System optimized in Velocity control settings to redrive messages with the maximum number of messages per second optimized by Amazon SQS. Optionally, if there is a large number of messages in the DLQ, I can configure a custom maximum rate of messages per second to avoid overloading consumers.
Before starting the redrive task, I can use the Inspect messages section to poll and check messages. I already decided what to do, so I choose DLQ redrive to start the task. I have only one message to process, so the redrive task completes very quickly.
As expected, the message is back in the source queue and is ready to be processed again.
Things to know Dead letter queue (DLQ) support for FIFO queues is available today in all AWS Regions where Amazon SQS is offered with the exception of GovCloud Regions and those based in China.
In the DLQ configuration, the maximum number of receives should be between 1 and 1,000.
There is no additional cost for using high throughput mode or a DLQ. Every Amazon SQS action counts as a request. A single request can send or receive from 1 to 10 messages, up to a maximum total payload of 256 KB. You pay based on the number of requests, and requests are priced differently between standard and FIFO queues.
As part of the AWS Free Tier, there is no cost for the first million requests per month for standard queues and for the first million requests per month for FIFO queues. For more information, see Amazon SQS pricing.
With these updates and the increased throughput, you can cover the vast majority of use cases with FIFO queues.
Replication failback – Failback support for EFS replication makes it easier and more cost-effective to synchronize changes between EFS file systems when performing disaster recovery (DR) workflows. You can now quickly replicate incremental changes from your secondary back to your primary file system after disaster events and other DR-related activities.
Increased IOPS – Amazon EFS now supports up to 250,000 read IOPS and up to 50,000 write IOPS per file system, making it easier to run more IOPS-heavy workloads at any scale for virtual servers, containers, and serverless functions that require shared storage.
Let’s see more in depth how these work in practice.
Introducing Amazon EFS replication failback With Amazon EFS replication, you can create a replica of your file system in the same or in another AWS Region. When replication is enabled, Amazon EFS automatically keeps the primary (source) and secondary (destination) file systems synchronized. To help you meet your compliance and business continuity goals, EFS replication is designed to provide a recovery point objective (RPO) and a recovery time objective (RTO) measured in minutes.
Now, with failback support, you can respond to disaster recovery (DR) events, conduct planned business continuity tests, and manage other DR-related activities with greater speed and cost efficiency. Failback support allows you to switch the direction of replication between the primary and secondary file systems. EFS replication keeps the two file systems in sync by copying only incremental changes, eliminating the need to make full copies of your data or use a self-managed, custom solution to complete a recovery workflow.
Using Amazon EFS replication failback I have a file system replicated to another Region. As part of a periodic DR test, I want to switch to using the secondary file system and then revert back to the primary file system, preserving all the changes made on the secondary file system. To do so, I can use EFS Replication failback in just a few steps.
First, I delete the replication from the primary (source) to the secondary (destination) file system. After this, the secondary file system becomes writable. To do so, in the Amazon EFS console, I check I am in the correct Region and select the secondary file system. In the Replication tab, I choose Delete replication and confirm deletion. I can also start from the primary file system. In that case, the Delete replication link in the Replication tab opens a new browser tab and asks to confirm deletion like before.
I can now use the secondary file system and change its data as needed.
To go back to using the primary file system, I create a “reverse replication” from the secondary to the primary file system. To do so, I check I am in the correct Region and select the secondary file system. In the Replication tab, I choose Create replication and the new option Replicate to existing file system. Then, I select the Region of the primary file system and use the console to browse the EFS file systems in that Region and choose the primary one.
The console warns me that Replication overwrite protection is enabled for the primary file system. I follow the Disable protection link to open a new browser tab and edit the primary file system to disable replication overwrite protection.
Now, I go back to the browser tab where I am creating the failback replication from the secondary to the primary file system. I refresh the protection check and choose to create the replication.
In the following dialog, I confirm that I want Amazon EFS to write to the primary file system.
To know when the primary file system is back in sync, I check the Last synced timestamp in the Replication tab, which indicates that all changes made to the source file system before that time are replicated to the destination. Optionally, I can look at the TimeSinceLastSync metric (expressed in minutes) in Amazon CloudWatch to understand how data is being replicated.
When the primary file system is back in sync, I delete the replication from the secondary to the primary file system. To complete the restore of the original configuration, I again create the replication from the primary to the secondary file system.
Increased IOPS per file system The Amazon EFS team has been able to increase IOPS again! The last time they did it was just a few months back. Starting today, an EFS file system can handle up to 50,000 write IOPS (a 2x improvement) and up to 250,000 read IOPS (a 4.5x improvement) when working with frequently-accessed data from a high-performance cache managed by Amazon EFS.
You can monitor the percentage utilization of your file system’s available IOPS using the PercentIOLimit CloudWatch metric. This metric considers the maximum IOPS for writes and uncached reads, including combinations of the two. Reads from the cache are not included in the PercentIOLimit metric.
With these performance improvements, you can run even more IOPS-demanding workloads on Amazon EFS, such as machine learning (ML) training, fine-tuning, and inference. Other use cases that can benefit from the increased IOPS are data science user shares, SaaS applications, and media processing.
Things to know EFS replication failback is available in all AWS Regions where EFS is available. There are no additional costs for using replication failback. You pay for the usual replication and file system changes as described in Amazon EFS pricing.
The increased IOPS limits are immediately available for all file systems using the Elastic Throughput mode in all Regions where EFS is available. You don’t need to do anything to benefit from these performance improvements. To achieve the maximum IOPS, your application needs sufficient parallelization. For example, using multiple clients and distributing the load across a large number of files. For more information, see the performance tips in the user guide.
Today, we added to AWS Control Tower a set of 65 purpose-built controls to help you meet your digital sovereignty requirements.
Digital sovereignty is the control of your digital assets: where the data resides, where it flows, and who has control over it. Since the creation of the AWS Cloud 17 years ago, we have been committed to giving you control over your data.
In November last year, we launched the AWS Digital Sovereignty Pledge, our commitment to offering all AWS customers the most advanced set of sovereignty controls and features available in the cloud. Since then, we have announced several steps in that direction. The AWS Nitro Systemhas been validated by an independent third party to confirm that it contains no mechanism that allows anyone at AWS to access your data on AWS hosts. We launched AWS Dedicated Local Zones, a piece of infrastructure that is fully managed by AWS and built for exclusive use by a customer or community and placed in a customer-specified location or data center. And more recently, we announced the construction of a new independent sovereign Region in Europe.
The introduction of AWS Control Tower controls that support digital sovereignty is an additional step in our roadmap of capabilities for data residency, granular access restriction, encryption, and resilience.
AWS Control Tower offers a simple and efficient way to set up and govern a secure, multi-account AWS environment. It establishes a landing zone that is based on best-practices blueprints, and it enables governance using controls you can choose from a prepackaged list. The landing zone is a well-architected, multi-account baseline that follows AWS best practices. Controls implement governance rules for security, compliance, and operations.
The level of control required for digital assets greatly varies across industries and countries. Customers operating in highly regulated sectors might have the obligation to keep their data in a specific country or region, such as the European Union. Others might have obligations related to data encryption and where the encryption keys are kept, and so on. Furthermore, digital sovereignty requirements evolve rapidly, making it challenging to define and implement all the required controls. Many customers have told us they are concerned that they will have to choose between the full power of AWS and a feature-limited sovereign cloud solution that could hamper their ability to innovate, transform, and grow. We firmly believe that you shouldn’t have to make this choice.
AWS Control Tower helps reduce the time it takes to define, implement, and manage controls required to govern where your data is stored, transferred, and processed at scale.
AWS Control Tower offers you a consolidated view of the controls enabled, your compliance status, and controls evidence across your multiple accounts. This information is available on the console and by calling our APIs. As requirements and AWS services evolve, AWS Control Tower provides you with updated controls to help you continually manage your digital sovereignty needs.
Here are a couple of examples of the controls we added:
Encryption at rest and in transit, including advanced key management strategies – Require an EC2 instance to use an AWS Nitro instance type that supports encryption in-transit between instances when created using the AWS::EC2::Instance resource type. It also requires that an Amazon Relational Database Service (Amazon RDS) database instance has encryption at rest configured to use an AWS KMS key that you specify for supported engine types.
One of the technical mechanisms AWS Control Tower uses to prevent accidental data storage or flow in a Region is the Region deny control. This parameter allows system administrators to deny access to AWS services and operations in selected AWS Regions. Until today, Region deny control could only be applied for an entire landing zone and all its organizational units (OUs) and accounts. With this launch, you can configure a new Region deny control at the organizational unit level and select the services and IAM principals to allow based on your unique business needs.
Let’s see how to get started For this demo, let’s imagine that I want to restrict access to AWS services in a set of Regions.
I locate and select the control I want to enable: Deny access to AWS based on the requested AWS Region for an organizational unit. There is a description of the control and a list of frameworks it applies to (NIST 800 and PCI DSS). I select Enable control.
On the next page, I select the Organizational units (OU) for which I want to enable this control.
I select the AWS Regions where I will allow access. All Regions left unchecked will have their access denied once the control is enforced.
Then, I review the service control policy (SCP). It contains a Deny statement to prevent access to the services or APIs listed. Optionally, I can add NotActions. This is a list of exceptions. The services or APIs listed under NotActions are authorized. In this example, I deny everything excepted three APIs: sqs:SendMessage, ec2:StartInstances, and s3:GetObject.
On the last page, I add a list of IAM principals (users or roles) that will be exempted from the control. This is an exception list. I also tag my control as usual with AWS resources.
On the last screen (not shown here), I review all my parameters and select Enable control.
I can verify the list of OU for which the control is enabled under the OUs enabled tab.
The summary page shows all Regions, APIs, and IAM principals enabled for this OU. All the rest is denied. I can update the parameters at any time.
Pricing and availability AWS Control Tower is available in all commercial Regions and in US GovCloud.
There is no additional charge to use AWS Control Tower. However, when you set up AWS Control Tower, you will begin to incur costs for AWS services configured to set up your landing zone and mandatory controls.
The new AWS Control Tower controls alleviate the burden of identifying and deploying safeguards to meet your digital sovereignty requirements. This set of controls is fully managed, and we will update them as AWS services and digital sovereignty requirements evolve over time.
Today we’re launching AWS B2B Data Interchange, a fully managed service allowing organizations to automate and monitor the transformation of EDI-based business-critical transactions at cloud scale. With this launch, AWS brings automation, monitoring, elasticity, and pay-as-you-go pricing to the world of B2B document exchange.
Electronic data interchange (EDI) is the electronic exchange of business documents in a standard electronic format between business partners. While email is also an electronic approach, the documents exchanged via email must still be handled by people rather than computer systems. Having people involved slows down the processing of the documents and also introduces errors. Instead, EDI documents can flow straight through to the appropriate application on the receiver’s system, and processing can begin immediately. Electronic documents exchanged between computer systems help businesses reduce cost, accelerate transactional workflows, reduce errors, and improve relationships with business partners.
Work on EDI started in the 1970s. I remember reading a thesis about EDIFACT, a set of standards defining the structure of business documents, back in 1994. But despite being a more than 50-year-old technology, traditional self-managed EDI solutions deployed to parse, validate, map, and translate data from business applications to EDI data formats are difficult to scale as the volume of business changes. They typically do not provide much operational visibility into communication and content errors. These challenges often oblige businesses to fall back to error-prone email document exchanges, leading to high manual work, increased difficulty controlling compliance, and ultimately constraining growth and agility.
AWS B2B Data Interchange is a fully managed, easy-to-use, and cost-effective service for accelerating your data transformations and integrations. It eliminates the heavy lifting of establishing connections with your business partners and mapping the documents to your system’s data-formats and gives visibility on documents that can’t be processed.
It provides a low-code interface for business partner onboarding and EDI data transformation to easily import the processed data to your business applications and analytics solutions. B2B Data Interchange gives you easy access to monitoring data, allowing you to build dashboards to monitor the volume of documents exchanged and the status of each document transformation. For example, it is easy to create alarms when incorrectly formatted documents can’t be transformed or imported into your business applications.
It is common for large enterprises to have thousands of business partners and hundreds of types of documents exchanged with each partner, leading to millions of combinations to manage. AWS B2B Data Interchange is not only available through the AWS Management Console, it is also accessible with the AWS Command Line Interface (AWS CLI) and AWS SDKs. This allows you to write applications or scripts to onboard new business partners and their specific data transformations and to programmatically add alarms and monitoring logic to new or existing dashboards.
B2B Data Interchange supports the X12 EDI data format. It makes it easier to validate and transform EDI documents to the formats expected by your business applications, such as JSON or XML. The raw documents and the transformed JSON or XML files are stored on Amazon Simple Storage Service (Amazon S3). This allows you to build event-driven applications for real-time business data processing or to integrate business documents with your existing analytics or AI/ML solutions.
For example, when you receive a new EDI business document, you can trigger additional routing, processing, and transformation logic using AWS Step Functions or Amazon EventBridge. When an error is detected in an incoming document, you can configure the sending of alarm messages by email or SMS or trigger an API call or additional processing logic using AWS Lambda.
Let’s see how it works As usual on this blog, let me show you how it works. Let’s imagine I am in charge of the supply chain for a large retail company, and I have hundreds of business partners to exchange documents such as bills of lading, customs documents, advanced shipment notices, invoices, or receiving advice certificates.
In this demo, I use the AWS Management Console to onboard a new business partner. By onboarding, I mean defining the contact details of the business partner, the type of documents I will exchange with them, the technical data transformation to the JSON formats expected by my existing business apps, and where to receive the documents.
With this launch, the configuration of the transport mechanism for the EDI document is managed outside B2B Data Interchange. Typically, you will configure a transfer gateway and propose that your business partner transfer the document using SFTP or AS2.
There are no servers to manage or application packages to install and configure. I can get started in just four steps.
First, I create a profile for my business partner.
Second, I create a transformer. A transformer defines the source document format and the mapping to my existing business application data format: JSON or XML. I can use the graphical editor to validate a sample document and see the result of the transformation directly from the console. We use the standard JSONATA query and transformation language to define the transformation logic to JSON documents and standard XSLT when transforming to XML documents.
I activate the transformer once created.
Third, I create a trading capability. This defines which Amazon Simple Storage Service (Amazon S3) buckets will receive the documents from a specific business partner and where the transformed data will be stored.
There is a one-time additional configuration to make sure proper permissions are defined on the S3 bucket policy. I select Copy policy and navigate to the Amazon S3 page of the console to apply the policies to the S3 bucket. One policy allows B2B Data Interchange to read from the incoming bucket, and one policy allows it to write to your outgoing bucket.
While I am configuring the S3 bucket, it is also important to turn on Amazon EventBridge on the S3 bucket. This is the mechanism we use to trigger the data transformation upon the arrival of a new business document.
Finally, back at the B2B Data Interchange configuration, I create a partnership. Partnerships are dedicated resources that establish a relationship between you and your individual trading partners. Partnerships contain details about a specific trading partner, the types of EDI documents you receive from them, and how those documents should be transformed into custom JSON or XML formats. A partnership links the business profile I created in the first step with one or multiple document types and transformations I defined in step two.
This is also where I can monitor the status of the last set of documents I received and the status of their transformation. For more historical data, you can navigate to Amazon CloudWatch using the links provided in the console.
To test my setup, I upload an EDI 214 document to the incoming bucket and a few seconds later, I can see the transformed JSON document appearing in the destination bucket.
I can observe the status of document processing and transformation using Invocations and TriggeredRules CloudWatch metrics from EventBridge. From there, together with the CloudWatch Logs, I can build dashboards and configure alarms as usual. I can also configure additional enrichment, routing, and processing of the incoming or transformed business documents by writing an AWS Lambda function or a workflow using AWS Step Functions.
Pricing and availability AWS B2B Data Interchange is available today in three of the AWS Regions: US East (Ohio, N. Virginia) and US West (Oregon).
There is no one-time setup fee or recurring monthly subscription. AWS charges you on demand based on your real usage. There is a price per partnership per month and a price per document transformed. The B2B Data Interchange pricing page has the details.
AWS B2B Data Interchange makes it easy to manage your trading partner relationships so you can automatically exchange, transform, and monitor EDI workflows at cloud scale. It doesn’t require you to install or manage any infrastructure and makes it easy for you to integrate with your existing business applications and systems. You can use the AWS B2B Data Interchange API or the AWS SDK to automate the onboarding of your partners. Combined with a fully managed and scalable infrastructure, AWS B2B Data Interchange helps your business to be more agile and scale your operations.
AWS Identity and Access Management (IAM)Access Analyzer was launched in late 2019. Access Analyzer guides customers toward least-privilege permissions across Amazon Web Services (AWS) by using analysis techniques, such as automated reasoning, to make it simpler for customers to set, verify, and refine IAM permissions. Today, we are excited to announce the general availability of IAM Access Analyzer custom policy checks, a new IAM Access Analyzer feature that helps customers accurately and proactively check IAM policies for critical permissions and increases in policy permissiveness.
In this post, we’ll show how you can integrate custom policy checks into builder workflows to automate the identification of overly permissive IAM policies and IAM policies that contain permissions that you decide are sensitive or critical.
What is the problem?
Although security teams are responsible for the overall security posture of the organization, developers are the ones creating the applications that require permissions. To enable developers to move fast while maintaining high levels of security, organizations look for ways to safely delegate the ability of developers to author IAM policies. Many AWS customers implement manual IAM policy reviews before deploying developer-authored policies to production environments. Customers follow this practice to try to prevent excessive or unwanted permissions finding their way into production. Depending on the volume and complexity of the policies that need to be reviewed; these reviews can be intensive and take time. The result is a slowdown in development and potential delay in deployment of applications and services. Some customers write custom tooling to remove the manual burden of policy reviews, but this can be costly to build and maintain.
How do custom policy checks solve that problem?
Custom policy checks are a new IAM Access Analyzer capability that helps security teams accurately and proactively identify critical permissions in their policies. Custom policy checks can also tell you if a new version of a policy is more permissive than the previous version. Custom policy checks use automated reasoning, a form of static analysis, to provide a higher level of security assurance in the cloud. For more information, see Formal Reasoning About the Security of Amazon Web Services.
Custom policy checks can be embedded in a continuous integration and continuous delivery (CI/CD) pipeline so that checks can be run against policies without having to deploy the policies. In addition, developers can run custom policy checks from their local development environments and get fast feedback about whether or not the policies they are authoring are in line with your organization’s security standards.
How to analyze IAM policies with custom policy checks
In this section, we provide step-by-step instructions for using custom policy checks to analyze IAM policies.
Prerequisites
To complete the examples in our walkthrough, you will need the following:
An AWS account, and an identity that has permissions to use the AWS services, and create the resources, used in the following examples. For more information, see the full sample code used in this blog post on GitHub.
An installed and configured AWS CLI. For more information, see Configure the AWS CLI.
Example 1: Use custom policy checks to compare two IAM policies and check that one does not grant more access than the other
In this example, you will create two IAM identity policy documents, NewPolicyDocument and ExistingPolicyDocument. You will use the new CheckNoNewAccess API to compare these two policies and check that NewPolicyDocument does not grant more access than ExistingPolicyDocument.
Step 1: Create two IAM identity policy documents
Use the following command to create ExistingPolicyDocument.
Notice that ExistingPolicyDocument grants access to the ec2:StartInstances and ec2:StopInstances actions if the condition key aws:ResourceTag/Owner resolves to true. In other words, the value of the tag matches the policy variable aws:username. NewPolicyDocument grants access to the same actions, but does not include a condition key.
Step 2: Check the policies by using the AWS CLI
Use the following command to call the CheckNoNewAccess API to check whether NewPolicyDocument grants more access than ExistingPolicyDocument.
After a moment, you will see a response from Access Analyzer. The response will look similar to the following.
{
    "result": "FAIL",
    "message": "The modified permissions grant new access compared to your existing policy.",
    "reasons": [
        {
            "description": "New access in the statement with index: 1.",
            "statementIndex": 1
        }
    ]
}
In this example, the validation returned a result of FAIL. This is because NewPolicyDocument is missing the condition key, potentially granting any principal with this identity policy attached more access than intended or needed.
Example 2: Use custom policy checks to check that an IAM policy does not contain sensitive permissions
In this example, you will create an IAM identity-based policy that contains a set of permissions. You will use the CheckAccessNotGranted API to check that the new policy does not give permissions to disable AWS CloudTrail or delete any associated trails.
Step 1: Create a new IAM identity policy document
Use the following command to create IamPolicyDocument.
Use the following command to call the CheckAccessNotGranted API to check if the new policy grants permission to the set of sensitive actions. In this example, you are asking Access Analyzer to check that IamPolicyDocument does not contain the actions cloudtrail:StopLogging or cloudtrail:DeleteTrail (passed as a list to the access parameter).
Because the policy that you created contains both cloudtrail:StopLogging and cloudtrail:DeleteTrail actions, Access Analyzer returns a FAIL.
{
    "result": "FAIL",
    "message": "The policy document grants access to perform one or more of the listed actions.",
    "reasons": [
        {
            "description": "One or more of the listed actions in the statement with index: 0.",
            "statementIndex": 0
        }
    ]
}
Example 3: Integrate custom policy checks into the developer workflow
Building on the previous two examples, in this example, you will automate the analysis of the IAM policies defined in an AWS CloudFormation template. Figure 1 shows the workflow that will be used. The workflow will initiate each time a pull request is created against the main branch of an AWS CodeCommit repository called my-iam-policy (the commit stage in Figure 1). The first check uses the CheckNoNewAccess API to determine if the updated policy is more permissive than a reference IAM policy. The second check uses the CheckAccessNotGranted API to automatically check for critical permissions within the policy (the validation stage in Figure 1). In both cases, if the updated policy is more permissive, or contains critical permissions, a comment with the results of the validation is posted to the pull request. This information can then be used to decide whether the pull request is merged into the main branch for deployment (the deploy stage is shown in Figure 1).
Figure 1: Diagram of the pipeline that will check policies
Step 1: Deploy the infrastructure and set up the pipeline
Use the following command to download and unzip the Cloud Development Kit (CDK) project associated with this blog post.
git clone https://github.com/aws-samples/access-analyzer-automated-policy-analysis-blog.git
cd ./access-analyzer-automated-policy-analysis-blog
Create a virtual Python environment to contain the project dependencies by using the following command.
python3 -m venv .venv
Activate the virtual environment with the following command.
source .venv/bin/activate
Install the project requirements by using the following command.
pip install -r requirements.txt
Use the following command to update the CDK CLI to the latest major version.
npm install -g aws-cdk@2 --force
Before you can deploy the CDK project, use the following command to bootstrap your AWS environment. Bootstrapping is the process of creating resources needed for deploying CDK projects. These resources include an Amazon Simple Storage Service (Amazon S3) bucket for storing files and IAM roles that grant permissions needed to perform deployments.
cdk bootstrap
Finally, use the following command to deploy the pipeline infrastructure.
cdk deploy --require-approval never
The deployment will take a few minutes to complete. Feel free to grab a coffee and check back shortly.
When the deployment completes, there will be two stack outputs listed: one with a name that contains CodeCommitRepo and another with a name that contains ConfigBucket. Make a note of the values of these outputs, because you will need them later.
The deployed pipeline is displayed in the AWS CodePipeline console and should look similar to the pipeline shown in Figure 2.
Figure 2: AWS CodePipeline and CodeBuild Management Console view
In addition to initiating when a pull request is created, the newly deployed pipeline can also be initiated when changes to the main branch of the AWS CodeCommit repository are detected. The pipeline has three stages, CheckoutSources, IAMPolicyAnalysis, and deploy. The CheckoutSource stage checks out the contents of the my-iam-policy repository when the pipeline is triggered due to a change in the main branch.
The IAMPolicyAnalysis stage, which runs after the CheckoutSource stage or when a pull request has been created against the main branch, has two actions. The first action, Check no new access, verifies that changes to the IAM policies in the CloudFormation template do not grant more access than a pre-defined reference policy. The second action, Check access not granted, verifies that those same updates do not grant access to API actions that are deemed sensitive or critical. Finally, the Deploy stage will deploy the resources defined in the CloudFormation template, if the actions in the IAMPolicyAnalysis stage are successful.
To analyze the IAM policies, the Check no new access and Check access not granted actions depend on a reference policy and a predefined list of API actions, respectively.
Use the following command to create the reference policy.
This reference policy sets out the maximum permissions for policies that you plan to validate with custom policy checks. The iam:PassRole permission is a permission that allows an IAM principal to pass an IAM role to an AWS service, like Amazon Elastic Compute Cloud (Amazon EC2) or AWS Lambda. The reference policy says that the only way that a policy is more permissive is if it allows iam:PassRole on this group of sensitive resources: arn:aws:iam::*:role/my-sensitive-roles/*”.
Why might a reference policy be useful? A reference policy helps ensure that a particular combination of actions, resources, and conditions is not allowed in your environment. Reference policies typically allow actions and resources in one statement, then deny the problematic permissions in a second statement. This means that a policy that is more permissive than the reference policy allows access to a permission that the reference policy has denied.
In this example, a developer who is authorized to create IAM roles could, intentionally or unintentionally, create an IAM role for an AWS service (like EC2 for AWS Lambda) that has permission to pass a privileged role to another service or principal, leading to an escalation of privilege.
Use the following command to create a list of sensitive actions. This list will be parsed during the build pipeline and passed to the CheckAccessNotGranted API. If the policy grants access to one or more of the sensitive actions in this list, a result of FAIL will be returned. To keep this example simple, add a single API action, as follows.
So that the CodeBuild projects can access the dependencies, use the following command to copy the cnna-reference-policy.file and sensitive-actions.file to an S3 bucket. Refer to the stack outputs you noted earlier and replace <ConfigBucket> with the name of the S3 bucket created in your environment.
Step 2: Create a new CloudFormation template that defines an IAM policy
With the pipeline deployed, the next step is to clone the repository that was created and populate it with a CloudFormation template that defines an IAM policy.
Install git-remote-codecommit by using the following command.
pip install git-remote-codecommit
For more information on installing and configuring git-remote-codecommit, see the AWS CodeCommit User Guide.
With git-remote-codecommit installed, use the following command to clone the my-iam-policy repository from AWS CodeCommit.
git clone codecommit://my-iam-policy && cd ./my-iam-policy
If you’ve configured a named profile for use with the AWS CLI, use the following command, replacing <profile> with the name of your named profile.
git clone codecommit://<profile>@my-iam-policy && cd ./my-iam-policy
Use the following command to create the CloudFormation template in the local clone of the repository.
The actions in the IAMPolicyValidation stage are run by a CodeBuild project. CodeBuild environments run arbitrary commands that are passed to the project using a buildspec file. Each project has already been configured to use an inline buildspec file.
You can inspect the buildspec file for each project by opening the project’s Build details page as shown in Figure 3.
Figure 3: AWS CodeBuild console and build details
Step 3: Run analysis on the IAM policy
The next step involves checking in the first version of the CloudFormation template to the repository and checking two things. First, that the policy does not grant more access than the reference policy. Second, that the policy does not contain any of the sensitive actions defined in the sensitive-actions.file.
To begin tracking the CloudFormation template created earlier, use the following command.
git add ec2-instance-role.yaml
Commit the changes you have made to the repository.
git commit -m 'committing a new CFN template with IAM policy'
Finally, push these changes to the remote repository.
git push
Pushing these changes will initiate the pipeline. After a few minutes the pipeline should complete successfully. To view the status of the pipeline, do the following:
Navigate to https://<region>.console.aws.amazon.com/codesuite/codepipeline/pipelines (replacing <region> with your AWS Region).
Choose the pipeline called accessanalyzer-pipeline.
Scroll down to the IAMPolicyValidation stage of the pipeline.
For both the check no new access and check access not granted actions, choose View Logs to inspect the log output.
If you inspect the build logs for both the check no new access and check access not granted actions within the pipeline, you should see that there were no blocking or non-blocking findings, similar to what is shown in Figure 4. This indicates that the policy was validated successfully. In other words, the policy was not more permissive than the reference policy, and it did not include any of the critical permissions.
Figure 4: CodeBuild log entry confirming that the IAM policy was successfully validated
Step 4: Create a pull request to merge a new update to the CloudFormation template
In this step, you will make a change to the IAM policy in the CloudFormation template. The change deliberately makes the policy grant more access than the reference policy. The change also includes a critical permission.
Use the following command to create a new branch called add-new-permissions in the local clone of the repository.
git checkout -b add-new-permissions
Next, edit the IAM policy in ec2-instance-role.yaml to include an additional API action, dynamodb:Delete* and update the resource property of the inline policy to use an IAM role in the /my-sensitive-roles/*” path. You can copy the following example, if you’re unsure of how to do this.
Commit the policy change and push the updated policy document to the repo by using the following commands.
git add ec2-instance-role.yaml
git commit -m "adding new permission and allowing my ec2 instance to assume a pass sensitive IAM role"
The add-new-permissions branch is currently a local branch. Use the following command to push the branch to the remote repository. This action will not initiate the pipeline, because the pipeline only runs when changes are made to the repository’s main branch.
git push -u origin add-new-permissions
With the new branch and changes pushed to the repository, follow these steps to create a pull request:
Navigate to https://console.aws.amazon.com/codesuite/codecommit/repositories (don’t forget to the switch to the correct Region).
Choose the repository called my-iam-policy.
Choose the branch add-new-permissions from the drop-down list at the top of the repository screen.
Figure 5: my-iam-policy repository with new branch available
Choose Create pull request.
Enter a title and description for the pull request.
(Optional) Scroll down to see the differences between the current version and new version of the CloudFormation template highlighted.
Choose Create pull request.
The creation of the pull request will Initiate the pipeline to fetch the CloudFormation template from the repository and run the check no new access and check access not granted analysis actions.
After a few minutes, choose the Activity tab for the pull request. You should see a comment from the pipeline that contains the results of the failed validation.
Figure 6: Results from the failed validation posted as a comment to the pull request
Why did the validations fail?
The updated IAM role and inline policy failed validation for two reasons. First, the reference policy said that no one should have more permissions than the reference policy does. The reference policy in this example included a deny statement for the iam:PassRole permission with a resource of /my-sensitive-role/*. The new created inline policy included an allow statement for the iam:PassRole permission with a resource of arn:aws:iam::*:role/my-sensitive-roles/my-custom-admin-role. In other words, the new policy had more permissions than the reference policy.
Second, the list of critical permissions included the dynamodb:DeleteTable permission. The inline policy included a statement that would allow the EC2 instance to perform the dynamodb:DeleteTable action.
Cleanup
Use the following command to delete the infrastructure that was provisioned as part of the examples in this blog post.
cdk destroy
Conclusion
In this post, I introduced you to two new IAM Access Analyzer APIs: CheckNoNewAccess and CheckAccessNotGranted. The main example in the post demonstrated one way in which you can use these APIs to automate security testing throughout the development lifecycle. The example did this by integrating both APIs into the developer workflow and validating the developer-authored IAM policy when the developer created a pull request to merge changes into the repository’s main branch. The automation helped the developer to get feedback about the problems with the IAM policy quickly, allowing the developer to take action in a timely way. This is often referred to as shifting security left — identifying misconfigurations early and automatically supporting an iterative, fail-fast model of continuous development and testing. Ultimately, this enables teams to make security an inherent part of a system’s design and architecture and can speed up product development workflow.
You can find the full sample code used in this blog post on GitHub.
Today, we’re announcing the general availability of artificial intelligence (AI)-powered code remediation and infrastructure as code (IaC) support for Amazon CodeWhisperer, an AI-powered productivity tool for the IDE and command line. Amazon CodeWhisperer is also now available in Visual Studio, in preview. These new enhancements to Amazon CodeWhisperer help to enable faster and more efficient software development by offloading undifferentiated work and delivering more automation, security, efficiency, and accelerated code delivery for customers, and provides this support in more places where developers love to work.
AI-powered code remediation – Since its launch, Amazon CodeWhisperer has identified hard-to-find security vulnerabilities with built-in security scans. It now provides generative AI-powered code suggestions to help remediate identified security and code quality issues. Built-in security scanning is designed to detect issues such as exposed credentials and log injection. Generative AI-powered code suggestions are designed to remediate the identified vulnerabilities, and are tailored to your application code so that you can quickly accept fixes with confidence. When a security scan is completed in CodeWhisperer, you are presented with code suggestions that you can simply accept to close the identified vulnerabilities quickly. Generative AI-powered code suggestions speed up the process of addressing security issues, so you can focus on higher-value work instead of manually reviewing code line by line to find the correct solution. You do not need to perform any additional setup in Amazon CodeWhisperer to start using this capability.
Security scanning is available for Java, Python, JavaScript, and now available for TypeScript, C#, AWS CloudFormation (YAML, JSON), AWS CDK (TypeScript, Python), and HashiCorp Terraform (HCL). Code suggestions to remediate vulnerabilities are currently available for code written in Java, Python, and JavaScript.
Infrastructure as code (IaC) – Amazon CodeWhisperer announces support for IaC, now encompassing AWS CloudFormation (YAML, JSON), AWS CDK (Typescript, Python), and HashiCorp Terraform (HCL). This update enhances the efficiency of IaC script development, allowing developers and DevOps teams to write infrastructure code seamlessly. With support for multiple IaC languages, CodeWhisperer promotes collaboration and consistency across diverse teams. This marks a significant advancement in cloud infrastructure development, offering a more streamlined and productive coding experience for users.
Visual Studio – Amazon CodeWhisperer is now available in Visual Studio 2022 (preview). Developers can build applications faster with real-time code suggestions for C#. Get started with the Individual Tier for free by installing the AWS Toolkit extension and signing in with an AWS Builder ID.
CodeWhisperer also helps developers code responsibly by flagging code suggestions that may resemble publicly available code. CodeWhisperer will provide the repository URL and license when code similar to public code.
Finally, Amazon CodeWhisperer recently previewed (11/20) a new time-saving capability for the command line interface. Now, Amazon CodeWhisperer adds typeahead code completions and inline documentation for hundreds of popular CLIs like Git, npm, AWS CLI, and Docker. It also adds the ability for you to translate natural language to shell code. For more details, read Introducing Amazon CodeWhisperer for command line.
Amazon EMR is pleased to announce integration with Amazon Simple Storage Service (Amazon S3) Access Grants that simplifies Amazon S3 permission management and allows you to enforce granular access at scale. With this integration, you can scale job-based Amazon S3 access for Apache Spark jobs across all Amazon EMR deployment options and enforce granular Amazon S3 access for better security posture.
In this post, we’ll walk through a few different scenarios of how to use Amazon S3 Access Grants. Before we get started on walking through the Amazon EMR and Amazon S3 Access Grants integration, we’ll set up and configure S3 Access Grants. Then, we’ll use the AWS CloudFormation template below to create an Amazon EMR on Amazon Elastic Compute Cloud (Amazon EC2) Cluster, an EMR Serverless application and two different job roles.
After the setup, we’ll run a few scenarios of how you can use Amazon EMR with S3 Access Grants. First, we’ll run a batch job on EMR on Amazon EC2 to import CSV data and convert to Parquet. Second, we’ll use Amazon EMR Studio with an interactive EMR Serverless application to analyze the data. Finally, we’ll show how to set up cross-account access for Amazon S3 Access Grants. Many customers use different accounts across their organization and even outside their organization to share data. Amazon S3 Access Grants make it easy to grant cross-account access to your data even when filtering by different prefixes.
Before you launch the AWS CloudFormation stack, ensure you have the following:
An AWS account that provides access to AWS services
The latest version of the AWS Command Line Interface (AWS CLI)
An AWS Identity and Access Management (AWS IAM) user with an access key and secret key to configure the AWS CLI, and permissions to create an IAM role, IAM policies, and stacks in AWS CloudFormation
A second AWS account if you wish to test the cross-account functionality
Walkthrough
Create resources with AWS CloudFormation
In order to use Amazon S3 Access Grants, you’ll need a cluster with Amazon EMR 6.15.0 or later. For more information, see the documentation for using Amazon S3 Access Grants with an Amazon EMR cluster, an Amazon EMR on EKS cluster, and an Amazon EMR Serverless application. For the purpose of this post, we’ll assume that you have two different types of data access users in your organization—analytics engineers with read and write access to the data in the bucket and business analysts with read-only access. We’ll utilize two different AWS IAM roles, but you can also connect your own identity provider directly to IAM Identity Center if you like.
Here’s the architecture for this first portion. The AWS CloudFormation stack creates the following AWS resources:
A Virtual Private Cloud (VPC) stack with private and public subnets to use with EMR Studio, route tables, and Network Address Translation (NAT) gateway.
An Amazon S3 bucket for EMR artifacts like log files, Spark code, and Jupyter notebooks.
An Amazon S3 bucket with sample data to use with S3 Access Grants.
An Amazon EMR cluster configured to use runtime roles and S3 Access Grants.
An Amazon EMR Serverless application configured to use S3 Access Grants.
An Amazon EMR Studio where users can login and create workspace notebooks with the EMR Serverless application.
Two AWS IAM roles we’ll use for our EMR job runs: one for Amazon EC2 with write access and another for Serverless with read access.
One AWS IAM role that will be used by S3 Access Grants to access bucket data (i.e., the Role to use when registering a location with S3 Access Grants. S3 Access Grants use this role to create temporary credentials).
To get started, complete the following steps:
Choose Launch Stack:
Accept the defaults and select I acknowledge that this template may create IAM resources.
The AWS CloudFormation stack takes approximately 10–15 minutes to complete. Once the stack is finished, go to the outputs tab where you will find information necessary for the following steps.
Create Amazon S3 Access Grants resources
First, we’re going to create an Amazon S3 Access Grants resources in our account. We create an S3 Access Grants instance, an S3 Access Grants location that refers to our data bucket created by the AWS CloudFormation stack that is only accessible by our data bucket AWS IAM role, and grant different levels of access to our reader and writer roles.
To create the necessary S3 Access Grants resources, use the following AWS CLI commands as an administrative user and replace any of the fields between the arrows with the output from your CloudFormation stack.
Next, we create a new S3 Access Grants location. What is a Location? Amazon S3 Access Grants works by vending AWS IAM credentials with access scoped to a particular S3 prefix. An S3 Access Grants location will be associated with an AWS IAM Role from which these temporary sessions will be created.
In our case, we’re going to scope the AWS IAM Role to the bucket created with our AWS CloudFormation stack and give access to the data bucket role created by the stack. Go to the outputs tab to find the values to replace with the following code snippet:
Note the AccessGrantsLocationId value in the response. We’ll need that for the next steps where we’ll walk through creating the necessary S3 Access Grants to limit read and write access to your bucket.
For the read/write user, use s3-control create-access-grant to allow READWRITE access to the “output/*” prefix:
Demo Scenario 1: Amazon EMR on EC2 Spark Job to generate Parquet data
Now that we’ve got our Amazon EMR environments set up and granted access to our roles via S3 Access Grants, it’s important to note that the two AWS IAM roles for our EMR cluster and EMR Serverless application have an IAM policy that only allow access to our EMR artifacts bucket. They have no IAM access to our S3 data bucket and instead use S3 Access Grants to fetch short-lived credentials scoped to the bucket and prefix. Specifically, the roles are granted s3:GetDataAccess and s3:GetDataAccessGrantsInstanceForPrefix permissions to request access via the specific S3 Access Grants instance created in our region. This allows you to easily manage your S3 access in one place in a highly scoped and granular fashion that enhances your security posture. By combining S3 Access Grants with job roles on EMR on Amazon Elastic Kubernetes Service (Amazon EKS) and EMR Serverless as well as runtime roles for Amazon EMR steps beginning with EMR 6.7.0, you can easily manage access control for individual jobs or queries. S3 Access Grants are available on EMR 6.15.0 and later. Let’s first run a Spark job on EMR on EC2 as our analytics engineer to convert some sample data into Parquet.
For this, use the sample code provided in converter.py. Download the file and copy it to the EMR_ARTIFACTS_BUCKET created by the AWS CloudFormation stack. We’ll submit our job with the ReadWrite AWS IAM role. Note that for the EMR cluster, we configured S3 Access Grants to fall back to the IAM role if access is not provided by S3 Access Grants. The DATA_WRITER_ROLE has read access to the EMR artifacts bucket through an IAM policy so it can read our script. As before, replace all the values with the <> symbols from the Outputs tab of your CloudFormation stack.
Once the job finishes, we should see some Parquet data in s3://<DATA_BUCKET>/output/weather-data/. You can see the status of the job in the Steps tab of the EMR console.
Demo Scenario 2: EMR Studio with an interactive EMR Serverless application to analyze data
Now let’s go ahead and login to EMR Studio and connect to your EMR Serverless application with the ReadOnly runtime role to analyze the data from scenario 1. First we need to enable the interactive endpoint on your Serverless application.
Select the EMRStudioURL in the Outputs tab of your AWS CloudFormation stack.
Select Applications under the Serverless section on the left-hand side.
Select the EMRBlog application, then the Action dropdown, and Configure.
Expand the Interactive endpoint section and make sure that Enable interactive endpoint is checked.
Scroll down and click Configure application to save your changes.
Back on the Applications page, select EMRBlog application, then the Start application button.
Next, create a new workspace in our Studio.
Choose Workspaces on the left-hand side, then the Create workspace button.
Enter a Workspace name, leave the remaining defaults, and choose Create Workspace.
After creating the workspace, it should launch in a new tab in a few seconds.
Now connect your Workspace to your EMR Serverless application.
Select the EMR Compute button on the left-hand side as shown in the following code.
Choose EMR Serverless as the compute type.
Choose the EMRBlog application and the runtime role that starts with EMRBlog.
Choose Attach. The window will refresh and you can open a new PySpark notebook and follow along below. To execute the code yourself, download the AccessGrantsReadOnly.ipynb notebook and upload it into your workspace using the Upload Files button in the file browser.
While you can also grant similar access via AWS IAM policies, Amazon S3 Access Grants can be useful for situations where your organization has outgrown managing access via IAM, wants to map S3 Access Grants to IAM Identity Center principals or roles, or has previously used EMR File System (EMRFS) Role Mappings. S3 Access Grants credentials are also temporary providing more secure access to your data. In addition, as shown below, cross-account access also benefits from the simplicity of S3 Access Grants.
Demo Scenario 3 – Cross-account access
One of the other more common access patterns is accessing data across accounts. This pattern has become increasingly common with the emergence of data mesh, where data producers and consumers are decentralized across different AWS accounts.
Previously, cross-account access required setting up complex cross-account assume role actions and custom credentials providers when configuring your Spark job. With S3 Access Grants, we only need to do the following:
Create an Amazon EMR job role and cluster in a second data consumer account
The data producer account grants access to the data consumer account with a new instance resource policy
The data producer account creates an access grant for the data consumer job role
And that’s it! If you have a second account handy, go ahead and deploy this AWS CloudFormation stack in the data consumer account, to create a new EMR Serverless application and job role. If not, just follow along below. The AWS CloudFormation stack should finish creating in under a minute. Next, let’s go ahead and grant our data consumer access to the S3 Access Grants instance in our data producer account.
Replace <DATA_PRODUCER_ACCOUNT_ID> and <DATA_CONSUMER_ACCOUNT_ID> with the relevant 12-digit AWS account IDs.
You may also need to change the region in the command and policy.
Now that we’ve done that, we can read data in the data consumer account from the bucket in the data producer account. We’ll just run a simple COUNT(*) again. Replace the <APPLICATION_ID>, <DATA_CONSUMER_JOB_ROLE>, and <DATA_CONSUMER_LOG_BUCKET> with the values from the Outputs tab on the AWS CloudFormation stack created in your second account.
And replace <DATA_PRODUCER_BUCKET> with the bucket from your first account.
Wait for the job to reach a completed state, and then fetch the stdout log from your bucket, replacing the <APPLICATION_ID>, <JOB_RUN_ID> from the job above, and <DATA_CONSUMER_LOG_BUCKET>.
If you are on a unix-based machine and have gunzip installed, then you can use the following command as your administrative user.
Note that this command only uses AWS IAM Role Policies, not Amazon S3 Access Grants.
aws s3 ls s3:// <DATA_CONSUMER_LOG_BUCKET>/logs/applications/<APPLICATION_ID>/jobs/<JOB_RUN_ID>/SPARK_DRIVER/stdout.gz - | gunzip
Otherwise, you can use the get-dashboard-for-job-run command and open the resulting URL in your browser to view the Driver stdout logs in the Executors tab of the Spark UI.
In order to avoid incurring future costs for examples resources in your AWS accounts, be sure to take the following steps:
You must manually delete the Amazon EMR Studio workspace created in the first part of the post
Empty the Amazon S3 buckets created by the AWS CloudFormation stacks
Make sure you delete the Amazon S3 Access Grants, resource policies, and S3 Access Grants location created in the steps above using the delete-access-grant, delete-access-grants-instance-resource-policy, delete-access-grants-location, and delete-access-grants-instance commands.
Delete the AWS CloudFormation Stacks created in each account
Comparison to AWS IAM Role Mapping
In 2018, EMR introduced EMRFS role mapping as a way to provide storage-level authorization by configuring EMRFS with multiple IAM roles. While effective, role mapping required managing users or groups locally on your EMR cluster in addition to maintaining the mappings between those identities and their corresponding IAM roles. In combination with runtime roles on EMR on EC2 and job roles for EMR on EKS and EMR Serverless, it is now easier to grant access to your data on S3 directly to the relevant principal on a per-job basis.
Conclusion
In this post, we showed you how to set up and use Amazon S3 Access Grants with Amazon EMR in order to easily manage data access for your Amazon EMR workloads. With S3 Access Grants and EMR, you can easily configure access to data on S3 for IAM identities or using your corporate directory in IAM Identity Center as your identity source. S3 Access Grants is supported across EMR on EC2, EMR on EKS, and EMR Serverless starting in EMR release 6.15.0.
Damon Cortesi is a Principal Developer Advocate with Amazon Web Services. He builds tools and content to help make the lives of data engineers easier. When not hard at work, he still builds data pipelines and splits logs in his spare time.
You can now create Amazon FSx for NetApp ONTAP file systems that are up to 9x faster than even before. As is already the case with this service, the file systems are fully managed, with latency to primary storage at the sub-millisecond level and latency to the capacity pool in the tens of milliseconds. This new level of performance will allow you to bring even more of your most demanding electronic design automation (EDA), visual effects (VFX), and statistical computing workloads (to name just a few) to the cloud.
Existing FSx for ONTAP scale-up file systems are powered by a single pair of servers in an active/passive high availability (HA) configuration, and can support a maximum of 4 GBps of throughput and 192 TiB of SSD storage. The server pair can be deployed across distinct fault domains of a single Availability Zone, or in two separate Availability Zones to provide continuous availability even when an Availability Zone is unavailable.
With today’s launch you can now create scale-out FSx for ONTAP file systems that are powered by two to six HA pairs. Here are the specs for the scale-up and scale-out file systems (these are all listed as “up to” since you can specify your desired values for each one when you create your file system):
Deployment Type
Read Throughput
Write Throughput
SSD IOPS
SSD Storage
Availability Zones
Scale-up
Up to 4 GBps
Up to 1.8 GBps
Up to 160K
Up to 192 TiB
Single or Multiple
Scale-out
Up to 36 GBps
Up to 6.6 GBps
Up to 1.2M
Up to 1 PiB
Single
The amount of throughput that you specify for your file system will determine the actual server configuration as follows:
Specified Throughput
Deployment Type
HA Pairs
Throughput (Per Server)
SSD Storage (Per Server)
SSD IOPS (Per Server)
4 GBps or less
Scale-up
Single
Up to 4 GBps Read Up to 1.1 GBps Write (Single-AZ) Up to 1.8 GBps Write (Multi-AZ)
I choose Standard create, enter a name, select a Single-AZ deployment, and enter my desired SSD storage capacity. I can accepted the recommended throughput capacity, choose a value from the dropdown, or enter a value and see my options (more on that in a sec):
The dropdown has a helpful magical feature. If I type my desired throughput capacity it will show me one or more options:
The console will sometimes show me several options for the same amount of desired throughput capacity. Here are some guidelines to help you make a choice that will be a good fit for your workload:
Low Throughput – If you choose an option that provides 4 GBps or less, you will be running on a single HA pair. This is the simplest option to choose if you don’t need a high degree of throughput.
High Throughput and/or High Storage – Maximum throughput scales with the number of HA pairs that you provision. Also, choosing an option with more pairs will maximize your headroom for future growth in provisioned storage.
I make selections and enter values for the remaining options as usual, and click Next to review my settings. I check to make sure that I have made good choices for any of the attributes that can’t be edited after creation, and click Create file system.
I take a break to see what’s happening upstairs, feed my dog, and when I return my new 2 TB file system is ready to go:
I can increase the storage capacity and I can change provisioned IOPS as frequently as every 6 hours:
At the moment, the provisioned throughput capacity cannot be changed after creation if the file system uses more than one HA pair.
Available Now Scale-out file systems are available in the US East (Ohio, N. Virginia), US West (Oregon), Asia Pacific (Sydney), and Europe (Ireland) Regions and you can start to create and use them today.
Today we’re adding to Amazon FSx for OpenZFS the capability to send a snapshot from a file system to another file system in your account.
You can trigger the copy with one single API call or CLI command, and we take care of the rest. You don’t need to use commands like rsync and monitor the state of the transfer. The service takes care of the copy on your behalf. It manages potential network interruptions and retries automatically until the transfer completes. It transfers data incrementally at block level using OpenZFS’s native send and receive capabilities.
This new capability helps you to maintain agility by, for example, allowing quicker and easier creation of testing and development environments, and performance improvements by simplifying the management of read replicas to provide scale-out performance.
Amazon FSx for OpenZFS is a fully managed file storage service that lets you launch, run, and scale fully managed file systems built on the open source OpenZFS file system. FSx for OpenZFS makes it easy to migrate your on-premises ZFS file servers without changing your applications or how you manage data and to build new high-performance, data-intensive applications on the cloud.
Snapshots are one of the most powerful features of ZFS file systems. A snapshot is a read-only copy of a file system or volume. Snapshots can be created almost instantly and initially consume no additional disk space within the storage pool. When a snapshot is created, its space is initially shared between the snapshot and the file system and possibly with previous snapshots. As the file system changes, space that was previously shared becomes unique to the snapshot. The snapshot consumes incremental disk space by continuing to reference the old data and so prevents the space from being freed. Snapshots can be rolled back on-demand and almost instantly, even on very large file systems. Snapshots can also be cloned to form new volumes.
Snapshots are block-level copies. They are more efficient to transfer than traditional file-level copies, where the system must sometimes traverse millions of files to detect the ones that changed. Transferring an incremental snapshot is also more efficient than transferring an incremental file-based copy because snapshots are incremental at block level. They only contain blocks modified since the last snapshot.
On-demand replication of ZFS snapshots allows the transfer of terabytes of data using the native send and receive capability of OpenZFS without having to worry about the underlying infrastructure. We detect and manage network interruptions and other types of errors for you, making it easier for you to replicate data across file systems.
There are two main use cases where you might want to use this new capability.
Developers and quality assurance (QA) engineers might send on-demand snapshots to development and testing environments. It allows them to work with production data, ensuring accurate testing and development outcomes. The use of recent snapshots as consistent starting points for testing enhances the efficiency of the development and testing processes.
Data engineers might use on-demand replication to run parallel experiments on a dataset. Imagine your application processes a large dataset. You want to run multiple versions of your data processing algorithm on the same base dataset to find the best tuning for your use case. With on-demand data replication, you can create multiple identical copies of your file system and run each experiment in parallel.
Let’s see how it works To prepare this demo, I use the FSx for OpenZFS section of the AWS Management Console. First, I create two Amazon FSx for OpenZFS volumes. Then, I mount the two file systems on one Amazon Linux instance (/zfs-filesystem1 and /zfs-filesystem2). I prepare a file on the first volume, and I expect to find the same file on the second volume after an on-demand replication.
To synchronize data between my two volumes, I navigate to the snapshot section of the console. Then I select Copy snapshot and update volume. I also have the option to copy the snapshot to a new ZFS volume.
On the Copy snapshot and update volume page, I select the destination File system and Volume. I also confirm the source snapshot. I choose the Source snapshot copy strategy, either requesting a full copy or an incremental copy. When ready, I select Update.
After a while—how long depends on the amount of data to transfer—I observe a new snapshot listed on the destination volume. In my demo scenario, it just takes a few seconds.
I return to my Linux instance and list the content available in my second mount point /zfs-snapshot. I am happy to see my cow ASCII art on the second file system .
Alternatively, I can automate on-demand transfers using the new FSx APIs: CopySnapshotAndUpdateVolume and CopySnapshotAndCreateVolume.
To set up an ongoing periodic replication, I use the provided CloudFormation template to create an automated replication schedule. When deployed, the system periodically takes a snapshot of the volume on the source file system and performs an incremental replication to a volume on the destination file system. For example, I could schedule replication to a development file system to happen once every 15 minutes for testing purposes.
Pricing and availability This new capability is available in all AWS Regions where FSx for OpenZFS is available.
It comes at no additional cost. AWS charges the usual fees for network data transfer between Availability Zones.
You pay standard FSx for OpenZFS charges for the amount of storage used by the remote file system.
The new on-demand replication for Amazon FSx for OpenZFS allows you to efficiently transfer incremental file system snapshots to a new volume on your account. It allows developers and QA engineers to work with copies of production data and data engineers to run parallel experiments on datases.
Now AWS Lambda scales up to 12 times faster. Each synchronously invoked Lambda function now scales by 1,000 concurrent executions every 10 seconds until the aggregate concurrency across all functions reaches the account’s concurrency limit. In addition, each function within an account now scales independently from each other, no matter how the functions are invoked. These improvements come at no additional cost, and you don’t need to do any configuration in your existing functions.
Building scalable and high-performing applications can be challenging with traditional architectures, often requiring over-provisioning of compute resources or complex caching solutions for peak demands and unpredictable traffic. Many developers choose Lambda because it scales on-demand when applications face unpredictable traffic.
Before this update, Lambda functions could initially scale at the account level by 500–3,000 concurrent executions (depending on the Region) in the first minute, followed by 500 concurrent executions every minute until the account’s concurrency limit is reached. Because this scaling limit was shared between all the functions in the same account and Region, if one function experienced an influx of traffic, it could affect the throughput of other functions in the same account. This increased engineering efforts to monitor a few functions that could burst beyond the account limits, causing a noisy neighbor scenario and reducing the overall concurrency of other functions in the same account.
Now, with these scaling improvements, customers with highly variable traffic can reach concurrency targets faster than before. For instance, a news site publishing a breaking news story or an online store running a flash sale would experience a significant influx of visitors. Thanks to these improvements, they can now scale 12 times faster than before.
In addition, customers that use services such as Amazon Athena and Amazon Redshift with scalar Lambda-based UDFs to perform data enrichment or data transformations will see benefits from these improvements. These services rely on batching data and passing it in chunks to Lambda, simultaneously invoking multiple parallel functions. The enhanced concurrency scaling behavior ensures Lambda can rapidly scale and service level agreement (SLA) requirements are met.
How does this work in practice? The following graph shows a function receiving requests and processing them every 10 seconds. The account concurrency limit is set to 7,000 concurrent requests and is shared between all the functions in the same account. Each function scaling-up rate is fixed to 1,000 concurrent executions every 10 seconds. This rate is independent from other functions in the same account, making it easier for you to predict how this function will scale and throttle the requests if needed.
09:00:00 – The function has been running for a while, and there are already 1,000 concurrent executions that are being processed.
09:00:10 – Ten seconds later, there is a new burst of 1,000 new requests. This function can process them with no problem because the function can scale up to 1,000 concurrent executions every 10 seconds.
09:00:20 – The same happens here: a thousand new requests.
09:00:30 – The function now receives 1,500 new requests. Because the maximum scale-up capacity for a function is 1,000 requests per 10 seconds, 500 of those requests will get throttled.
09:01:00 – At this time, the function is already processing 4,500 concurrent requests. But there is a burst of 3,000 new requests. Lambda processes 1,000 of the new requests and throttles 2,000 because the function can scale up to 1,000 requests every 10 seconds.
09:01:10 – After 10 seconds, there is another burst of 2,000 requests, and the function can now process 1,000 more requests. However, the remaining 1,000 requests get throttled because the function can scale to 1,000 requests every 10 seconds.
09:01:20 – Now the function is processing 6,500 concurrent requests, and there are 1,000 incoming requests. The first 500 of those requests get processed, but the other 500 get throttled because the function reached the account concurrency limit of 7,000 requests. It’s important to remember that you can raise the account concurrency limit by creating a support ticket in the AWS Management Console.
In the case of having more than one function in your account, the functions scale independently until the total account concurrency limit is reached. After that, all new invocations will be throttled.
Availability These scaling improvements will be enabled by default for all functions. Starting on November 26 through mid-December, AWS is gradually rolling out these scaling improvements to all AWS Regions except China and GovCloud Regions.
Now AWS Step Functions HTTPS endpoints let you integrate third-party APIs and external services to your workflows. HTTPS endpoints provide a simpler way of making calls to external APIs and integrating with existing SaaS providers, like Stripe for handling payments, GitHub for code collaboration and repository management, and Salesforce for sales and marketing insights. Before this launch, customers needed to use an AWS Lambda function to call the external endpoint, handling authentication and errors directly from the code.
Also, we are announcing a new capability to test your task states individually without the need to deploy or execute the state machine.
AWS Step Functions is a visual workflow service that makes it easy for developers to build distributed applications, automate processes, orchestrate microservices, and create data and machine learning (ML) pipelines. Step Functions integrates with over 220 AWS services and provides features that help developers build, such as built-in error handling, real-time and auditable workflow execution history, and large-scale parallel processing.
HTTPS endpoints HTTPS endpoints are a new resource for your task states that allow you to connect to third-party HTTP targets outside AWS. Step Functions invokes the HTTP endpoint, deliver a request body, headers, and parameters, and get a response from the third-party services. You can use any preferred HTTP method, such as GET or POST.
HTTPS endpoints use Amazon EventBridge connections to manage the authentication credentials for the target. This defines the authorization type used, which can be a basic authentication with a username and password, an API key, or OAuth. EventBridge connections use AWS Secrets Manager to store the secret. This keeps the secrets out of the state machine, reducing the risks of accidentally exposing your secrets in logs or in the state machine definition.
Getting started with HTTPS endpoints To get started with HTTPS endpoints, first you need to create an EventBridge connection. Then you need to create a new AWS Identity and Access Management (IAM) role and give permissions so your state machine can access the connection resource, get the secret from Secrets Manager, and get permissions to invoke an HTTP endpoint.
Here are the policies that you need to include in your state machine execution role:
After you have everything ready, you can create your state machine. In your state machine, add a new task state to call a third-party API. You can configure the API endpoint to point to the third-party URL you need, set the correct HTTP method, pick the connection Amazon Resource Name (ARN) for the connection you created previously as the authentication for that endpoint, and provide a request body if needed. In addition, all these parameters can be set dynamically at runtime from the state JSON input.
Now, making external requests with Step Functions is easy, and you can take advantage of all the configurations that Step Functions provides to handle errors, such as retries for transient errors or momentary service unavailability, and redrive for errors that require longer investigation or resolution time.
Test state To accelerate feedback cycles, we are also announcing a new capability to test individual states. This new feature allows you to test states independently from the execution of your workflow. This is particularly useful for testing endpoints configuration. You can change the input and test the different scenarios without the need to deploy your workflow or execute the whole state machine. This new feature is available in all task, choice, and pass states.
You will see the testing capability in the Step Functions Workflow Studio when you select a task.
When you choose the Test state, you will be redirected to a different view where you can test the task state. You can test that the state machine role has the right permissions, the endpoint you want to call is correctly configured, and verify that the data manipulations work as expected.
Availability Now, with all the features that Step Functions provides, it’s never been easier to build state machines that can solve a wide variety of problems, like payment flows, workflows with manual inputs, and integration to legacy systems. Using Step Functions HTTPS endpoints, you can directly integrate with popular payment platforms while ensuring that your users’ credit cards are only charged once and errors are handled automatically. In addition, you can test this new integration even before you deploy the state machine using the new test state feature.
These new features are available in all AWS Regions except Asia Pacific (Hyderabad), Asia Pacific (Melbourne), AWS Israel (Tel Aviv), China, and GovCloud Regions.
Starting today, you can use Amazon EKS Pod Identity to simplify your applications that access AWS services. This enhancement provides you with a seamless and easy to configure experience that lets you define required IAM permissions for your applications in Amazon Elastic Kubernetes Service (Amazon EKS) clusters so you can connect with AWS services outside the cluster.
Amazon EKS Pod Identity helps you solve growing challenges for managing permissions across many of your EKS clusters.
Simplifying experience with Amazon EKS Pod Identity In 2019, we introduced IAM roles for service accounts (IRSA). IRSA lets you associate an IAM role with a Kubernetes service account. This helps you to implement the principle of least privilege by giving pods only the permissions they need. This approach prioritizes pods in IAM and helps developers configure applications with fine-grained permissions that enable the least privileged access to AWS services.
Now, with Amazon EKS Pod Identity, it’s even easier to configure and automate granting AWS permissions to Kubernetes identities. As the cluster administrator, you no longer need to switch between Amazon EKS and IAM services to authenticate your applications to all AWS resources.
The overall workflow to start using Amazon EKS Pod Identity can be summarized in a few simple steps:
Step 1: Create an IAM role with required permissions for your application and specify pods.eks.amazonaws.com as the service principal in its trust policy.
Step 2: Install Amazon EKS Pod Identity Agent add-on using the Amazon EKS console or AWS Command Line Interface (AWS CLI).
Step 3: Map the role to a service account directly in the Amazon EKS console, APIs, or AWS CLI.
Once it’s done, any new pods that use that service account will automatically be configured to receive IAM credentials.
Let’s get started Let me show you how you can get started with EKS Pod Identity. For the demo in this post, I need to configure permission for a simple API running in my Amazon EKS cluster, which will return the list of files in my Amazon Simple Storage Service (Amazon S3) bucket.
First, I need to create an IAM role to provide the required permissions so my applications can run properly. In my case, I need to configure permissions to access my S3 bucket.
Next, on the same IAM role, I need to configure its trust policy and configure the principal to pods.eks.amazonaws.com. The following is the IAM template that I use:
At this stage, my IAM role is ready, and now we need to configure the Amazon EKS Pod Identity Agent in my cluster. For this article, I’m using my existing EKS cluster. If you want to learn how to do that, visit Getting started with Amazon EKS.
Moving on, I navigate to the Amazon EKS dashboard and then select my EKS cluster.
In my EKS cluster page, I need to select the Add-ons tab and then choose Get more add-ons.
Then, I need to add the Amazon EKS Pod Identity Agent add-on.
On the next page, I can add additional configuration if needed. In this case, I leave the default configuration and choose Next.
Then, I just need to review my add-on configuration and choose Create.
After a few minutes, the Amazon EKS Pod Identity Agent add-on is active for my cluster.
Once I have Amazon EKS Pod Identity in my cluster, I need to associate the IAM role to my Kubernetes pods.
I need to navigate to the Access tab in my EKS cluster. On the Pod Identity associations section, I select Create Pod Identity association to map my IAM role to Kubernetes pods.
Here, I use the IAM role that I created in the beginning. I also need to define my Kubernetes namespace and service account. If they don’t exist yet, I can type in the name of the namespace and service account. If they already exist, I can select them from the dropdown. Then, I choose Create.
Those are all the steps I need to do to configure IAM permissions for my applications running on Amazon EKS with EKS Pod Identity. Now, I can see my IAM role is listed in Pod Identity associations.
When I test my API running on Amazon EKS, it runs as expected and returns the list of files in my S3 bucket.
I found that Amazon EKS Pod Identity simplifies the experience of managing IAM roles for my applications running on Amazon EKS. I can easily reuse IAM roles across multiple EKS clusters without needing to update the role trust policy each time a new cluster is created.
New AWS APIs to configure EKS Pod Identity You also have the flexibility to configure Amazon EKS Pod Identity for your cluster using AWS CLI. Amazon EKS Pod Identity provides a new set of APIs that you can use.
For example, I can use aws eks create-addon to install the Amazon EKS Pod Identity Agent add-on into my cluster. Here’s the AWS CLI command:
Availability – Amazon EKS Pod Identity is available in all AWS Regions supported by Amazon EKS, except the AWS GovCloud (US-East), AWS GovCloud (US-West), China (Beijing, operated by Sinnet), and China (Ningxia, operated by NWCD).
Pricing – Amazon EKS Pod Identity is available at no charge.
Supported Amazon EKS cluster – Amazon EKS Pod Identity supports Kubernetes running version 1.24 and above in Amazon EKS. You can see EKS Pod Identity cluster versions for more information.
Supported AWS SDK versions – You need to update your application to use the latest AWS SDK versions. Check out AWS developer tools to find out how to install and update your AWS SDK.
Get started today and visit EKS Pod Identities documentation page to learn more about how to simplify IAM management for your applications.
The new Amazon WorkSpaces Thin Client improves end-user and IT staff productivity with cost-effective, secure, easy-to-manage access to virtual desktops. The devices are preconfigured and shipped directly to the end user, ready to deploy, connect, and use.
Here’s my testing setup:
The Thin Client is a small cube that connects directly to a monitor, keyboard, mouse, and other USB peripherals such as headsets, microphones, and cameras. With the optional hub it can also drive a second monitor. The administrator can create environments that give users access to Amazon WorkSpaces, Amazon WorkSpaces Web, or Amazon AppStream 2.0, with multiple options for managing user identities and credentials using Active Directory.
Thin Clients in action As a very long-time user of Amazon WorkSpaces via a thin client, I am thrilled to be able to tell you about this device and the administrative service behind it. While my priority is the ease with which I can switch from client to client while maintaining my working context (running apps, browser tabs, and so forth), administrators will find it attractive for other reasons. For example:
Cost – The device itself is low cost ($195 in the United States), far less expensive than a laptop and the associated operating system. Because the working environments are centrally configured and administered, there’s less work to be done in the field, leading to further cost savings. Further, the devices are far simpler than laptops, with less parts to break, wear out, or replace.
Security – The devices are shipped with a secure “secret” that is used to establish a trust relationship with the administrative service. There’s no data storage on the device, and it cannot host rogue apps that could attempt to exfiltrate data. It also helps to reduce risk of data leakage should a worker leave their job without returning their employer-supplied laptop.
Ease of Management – Administrators can easily create new environments for users or groups of users, distribute activation codes to them, and manage the environment via the AWS Management Console. They can set schedules for software updates and patches, verify compliance, and manage users over time.
Ease of Use – Users can unpack and connect the devices in minutes, enter their activation codes, log in to their virtual desktop environment, and start to work right away. They don’t have to take responsibility for installing software patches or updates, and can focus on their jobs.
There are lots of great use cases for these devices! First, there are situations where there’s a long-term need for regular access: call centers, task workers, training centers, and so forth. Second, there are other situations, where there’s a transient or short-term need for access: registration systems at large events, call centers stood up on a temporary basis for a special event or an emergency, disaster response, and the like. Given that some employees do not return laptops to their employers when they leave their job, providing them with inexpensive devices that do not have local storage makes a lot of sense.
Let’s walk through the process of getting set up, first as an administrator and then as a user.
Getting started as an administrator The first step is to order some devices and have them shipped to my users, along with any desired peripherals.
Next, in my position as administrator, I open the Amazon WorkSpaces Thin Client Console, and click Get started:
Each Amazon WorkSpaces Thin Client environment provides access to a specific virtual desktop service (WorkSpaces, WorkSpaces Web, or Amazon AppStream 2.0). I click Create environment to move ahead:
I give my environment a name, indicate that I want patches applied automatically, and select WorkSpaces Web:
Next, I click Create WorkSpaces Web portal and go through those steps (not shown, basically choosing a VPC and two or more subnets, a security group, and an optional Private Certificate Authority):
I refresh, and my new portal is visible. I select it, enter a tag for tracking, and click Create environment:
My environment is ready right away. I keep a copy of the activation code (aci3a5yj) at hand to use later in the post:
I am using AWS Identity Center as my identity provider. I already set up my first user, and assigned myself to the MyWebPortal app (the precise steps that you take to do this will vary depending on your choice of identity provider):
Finally, as my last step in this process in my role as administrator, I share the activation code with my users (that would be me, in this case).
Getting started as a user In my role as a user I return to my testing setup, power-on, go through a couple of quick steps to select my keyboard and connect to my home Wi-Fi, and enter my activation code:
Then I sign in using my AWS Identity Center user name and password:
And my WorkSpace is ready to use:
Administrator tools As an administrator, I can manage environments, devices, and device software updates from the Thin Client Console. For example, I can review the list of devices that I manage:
Things to know Here are a couple of things that are important to know:
Regions – The Thin Client Console is available in the US East (N. Virginia), US West (Oregon), Asia Pacific (Mumbai), Canada (Central), and Europe (Frankfurt, Ireland, Ireland, London) Regions.
Device Sales – The Amazon WorkSpaces Thin Clients are available in the United States now, with availability in other countries in early 2024.
Pricing – Devices are priced at $195, or $280 with an optional hub that allows you to use a second monitor. There’s a $6 per month fee to manage, maintain, and monitor each device, and you also pay for the underlying virtual desktop service.
GuardDuty combines machine learning (ML), anomaly detection, network monitoring, and malicious file discovery against various AWS data sources. When threats are detected, GuardDuty generates security findings and automatically sends them to AWS Security Hub, Amazon EventBridge, and Amazon Detective. These integrations help centralize monitoring for AWS and partner services, initiate automated responses, and launch security investigations.
GuardDuty ECS Runtime Monitoring helps detect runtime events such as file access, process execution, and network connections that might indicate runtime threats. It checks hundreds of threat vectors and indicators and can produce over 30 different finding types. For example, it can detect attempts of privilege escalation, activity generated by crypto miners or malware, or activity suggesting reconnaissance by an attacker. This is in addition to GuardDuty‘s primary detection categories.
GuardDuty ECS Runtime Monitoring uses a managed and lightweight security agent that adds visibility into individual container runtime behaviors. When using AWS Fargate, there is no need for you to install, configure, manage, or update the agent. We take care of that for you. This simplifies the management of your clusters and reduces the risk of leaving some tasks without monitoring. It also helps to improve your security posture and pass regulatory compliance and certification for runtime threats.
GuardDuty ECS Runtime Monitoring findings are visible directly in the console. You can configure GuardDuty to also send its findings to multiple AWS services or to third-party monitoring systems connected to your security operations center (SOC).
With this launch, Amazon Detective now receives security findings from GuardDuty ECS Runtime Monitoring and includes them in its collection of data for analysis and investigations. Detective helps to analyze, investigate, and quickly identify the root cause of potential security issues or suspicious activities. It collects log data from AWS resources and uses machine learning, statistical analysis, and graph theory to build a linked set of data that enables you to easily conduct security investigations.
Configure GuardDuty ECS Runtime Monitoring on AWS Fargate For this demo, I choose to show the experience provided for AWS Fargate. When using Amazon ECS, you must ensure your EC2 instances have the GuardDuty agent installed. You can install the agent manually, bake it into your AMI, or use GuardDuty‘s provided AWS Systems Managerdocument to install it (go to Systems Manager in the console, select Documents, and then search for GuardDuty). The documentation has more details about installing the agent on EC2 instances.
When operating from a GuardDuty administrator account, I can enable GuardDuty ECS Runtime Monitoring at the organization level to monitor all ECS clusters in all organizations’ AWS accounts.
In this demo, I use the AWS Management Console to enable Runtime Monitoring. Enabling GuardDuty ECS Runtime Monitoring in the console has an effect on all your clusters.
When I want GuardDuty to automatically deploy the GuardDuty ECS Runtime Monitoring agent on Fargate, I enable GuardDuty agent management. To exclude individual clusters from automatic management, I can tag them with GuardDutyManaged=false. I make sure I tag my clusters before enabling ECS Runtime Monitoring in the console. When I don’t want to use the automatic management option, I can leave the option disabled and selectively choose the clusters to monitor with the tag GuardDutyManaged=true.
The Amazon ECS or AWS Fargate cluster administrator must have authorization to manage tags on the clusters.
The IAM TaskExecutionRole you attach to tasks must have permissions to download the GuardDuty agent from a private ECR repository. This is done automatically when you use the AmazonECSTaskExecutionRolePolicymanaged IAM policy.
Here is my view of the console when the Runtime Monitoring and agent management are enabled.
I can track the deployment of the security agent by assessing the Coverage statistics across all the ECS clusters.
Once monitoring is enabled, there is nothing else to do. Let’s see what findings it detects on my simple demo cluster.
Check out GuardDuty ECS runtime security findings When GuardDuty ECS Runtime Monitoring detects potential threats, they appear in a list like this one.
I select a specific finding to view more details about it.
Things to know By default, a Fargate task is immutable. GuardDuty won’t deploy the agent to monitor containers on existing tasks. If you want to monitor containers for already running tasks, you must stop and start the tasks after enabling GuardDuty ECS Runtime Monitoring. Similarly, when using Amazon ECS services, you must force a new deployment to ensure tasks are restarted with the agent. As I mentioned already, be sure the tasks have IAM permissions to download the GuardDuty monitoring agent from Amazon ECR.
When you choose automatic agent management, GuardDuty also creates a VPC endpoint to allow the agent to communicate with GuardDuty APIs. When—just like me—you create your cluster with a CDK or CloudFormation script with the intention to delete the cluster after a period of time (for example, in a continuous integration scenario), bear in mind that the VPC endpoint must be deleted manually to allow CloudFormation to delete your stack.
Pricing and availability You can now use GuardDuty ECS Runtime Monitoring on AWS Fargate and Amazon EC2 instances. For a full list of Regions where GuardDuty ECS Runtime Monitoring is available, visit our Region-specific feature availability page.
You can try GuardDuty ECS Runtime Monitoring for free for 30 days. When you enable GuardDuty for the first time, you have to explicitly enable GuardDuty ECS Runtime Monitoring. At the end of the trial period, we charge you per vCPU per hour of the monitoring agents. The GuardDuty pricing page has all the details.
Today, Amazon Detective adds four new capabilities to help you save time and strengthen your security operations.
First, Detective investigations for IAM help security analysts investigate AWS Identity and Access Management (IAM) objects, such as users and roles, for indicators of compromise (IoCs) to determine potential involvement in known tactics from the MITRE ATT&CK framework. These automatic investigations are available in the Detective section of the AWS Management Console and through a new API to automate your analysis or incident response or to send these findings to other systems, such as AWS Security Hub or your SIEM.
Second, Detective finding group summaries uses generative artificial intelligence (AI) to enrich its investigations. It automatically analyzes finding groups and provides insights in natural language to accelerate security investigations. It provides a plain language title based on the analysis of the finding group with relevant summarized insights, such as describing the activity that initiated the event and its impact, if any. Finding group summaries handles the heavy lifting of analyzing the finding group built across multiple AWS data sources, making it easier and faster to investigate unusual or suspicious activity.
In addition to these two new capabilities that I describe in this post, Detective adds another two capabilities not covered here:
Detective now supports security investigations for threats detected by Amazon GuardDutyECS Runtime Monitoring.
Detective now integrates with Amazon Security Lake, enabling security analysts to query and retrieve logs stored in Security Lake.
Amazon Detective makes it easier to analyze, investigate, and quickly identify the root cause of security findings or suspicious activities. Detective uses machine learning (ML), statistical analysis, and graph theory to help you visualize and conduct faster and more efficient security investigations. Detective automatically collects logs data and events from sources like AWS CloudTrail logs, Amazon Virtual Private Cloud (Amazon VPC)Flow Logs, Amazon GuardDuty findings, Amazon Elastic Kubernetes Service (Amazon EKS) audit logs, and AWS security findings. Detective maintains up to a year of aggregated data for analysis and investigations.
Cloud security professionals often find threat hunting and incident investigations to be resource-intensive and time-consuming. They must manually gather and analyze data from various sources to identify potential IAM-related threats. IAM investigations are particularly challenging due to dynamic cloud permissions and credentials. Analysts need to piece together data from different systems, including audit logs, entitlement reports, and CloudTrail events, which can be dispersed. Cloud permissions are often granted on-demand or through automation scripts, making authorization changes hard to track. Reconstructing activity timelines and identifying irregular entitlements can take hours or days, depending on complexity. Limited visibility into legacy systems and incomplete logs further complicates IAM investigations, making it difficult to obtain a definitive understanding of unauthorized access.
Detective investigations for IAM triage findings and surface only the most critical, suspicious issues, allowing security analysts to focus on high-level investigations. It automatically analyzes resources in your AWS environment to identify potential indicators of compromise or suspicious activity using machine learning and threat intelligence. This allows analysts to identify patterns and comprehend which resources are impacted by security events, offering a proactive approach to threat identification and mitigation.
The investigations are not only available in the console; you can use the new StartInvestigation API to automate a remediation workflow or collect information about all IP involved or AWS resources compromised. You can also use the API to feed the data to other systems to build a consolidated view of your security posture.
Finding group summaries evaluates the connections between security events across an environment and provides insights in natural language that link related threats, compromised resources, and malicious actor behavior. This narrative offers security analysts a comprehensive overview of security incidents that goes beyond individual service reports. By grouping and contextualizing data from multiple sources, finding group summaries identifies threats that might go unnoticed when insights are isolated. This approach improve the speed and efficiency of investigations and responses. Security analysts can utilize finding group summaries to gain a holistic understanding of security events and their interrelationships, helping them make informed decisions regarding containment and remediation.
Let’s see these two capabilities in action In this demo, I start with Detective investigations for IAM in the Detective section of the console. The Detective dashboard shows me the number of investigations done and the number of IAM roles and users involved in suspicious activities.
From there, I drill down the list of investigations.
And I select one specific investigation to get the details. There is a summary first.
I scroll down the page to see what IP addresses are involved and for what type of activities. This example shows me a physical impossibility: the same IP was used in a short time from two different places, Australia and Japan.
The most interesting section of the page, in my opinion, is the mappings to tactics, techniques, and procedures (TTP). All TTPs are classified according to their severity. The console shows the techniques and actions used. When selecting a specific TTP, I can see the details in the right pane. In this example, the suspicious IP address has been involved in more than 2,000 failed attempts to change the trusted policy of an IAM role.
Finally, I navigate to the Indicators tab to see the list of indicators.
On the other side, finding group summaries is available under Finding groups. I select a finding group to receive a natural language explanation of the findings and risks involved.
Pricing and availability These two new capabilities are now available to all AWS customers.
Detective investigations for IAM is available in all AWS Regions where Detective is available. Finding group summaries is available in five AWS Regions: US East (N. Virginia), US West (Oregon), Asia Pacific (Singapore, Tokyo), and Europe (Frankfurt).
To provide the best experiences, we use technologies like cookies to store and/or access device information. Consenting to these technologies will allow us to process data such as browsing behavior or unique IDs on this site. Not consenting or withdrawing consent, may adversely affect certain features and functions.
Functional
Always active
The technical storage or access is strictly necessary for the legitimate purpose of enabling the use of a specific service explicitly requested by the subscriber or user, or for the sole purpose of carrying out the transmission of a communication over an electronic communications network.
Preferences
The technical storage or access is necessary for the legitimate purpose of storing preferences that are not requested by the subscriber or user.
Statistics
The technical storage or access that is used exclusively for statistical purposes.The technical storage or access that is used exclusively for anonymous statistical purposes. Without a subpoena, voluntary compliance on the part of your Internet Service Provider, or additional records from a third party, information stored or retrieved for this purpose alone cannot usually be used to identify you.
Marketing
The technical storage or access is required to create user profiles to send advertising, or to track the user on a website or across several websites for similar marketing purposes.
 I’m happy to be able to tell you about the latest in our series of innovative custom chip designs, the energy-efficient AWS Graviton4 processor.


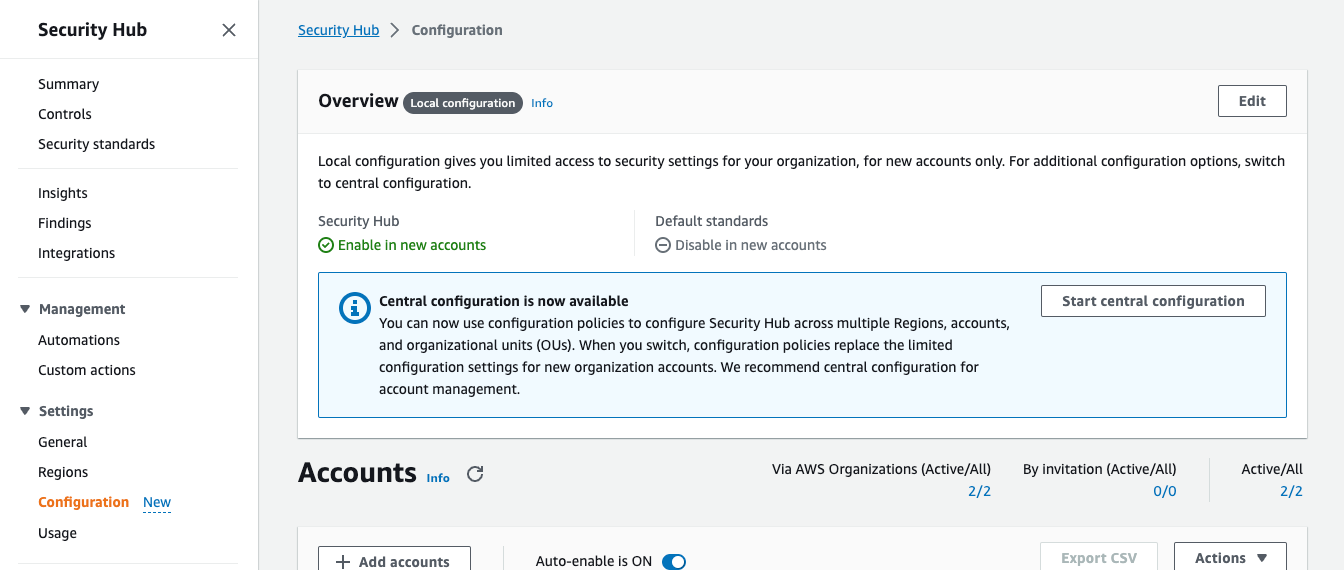
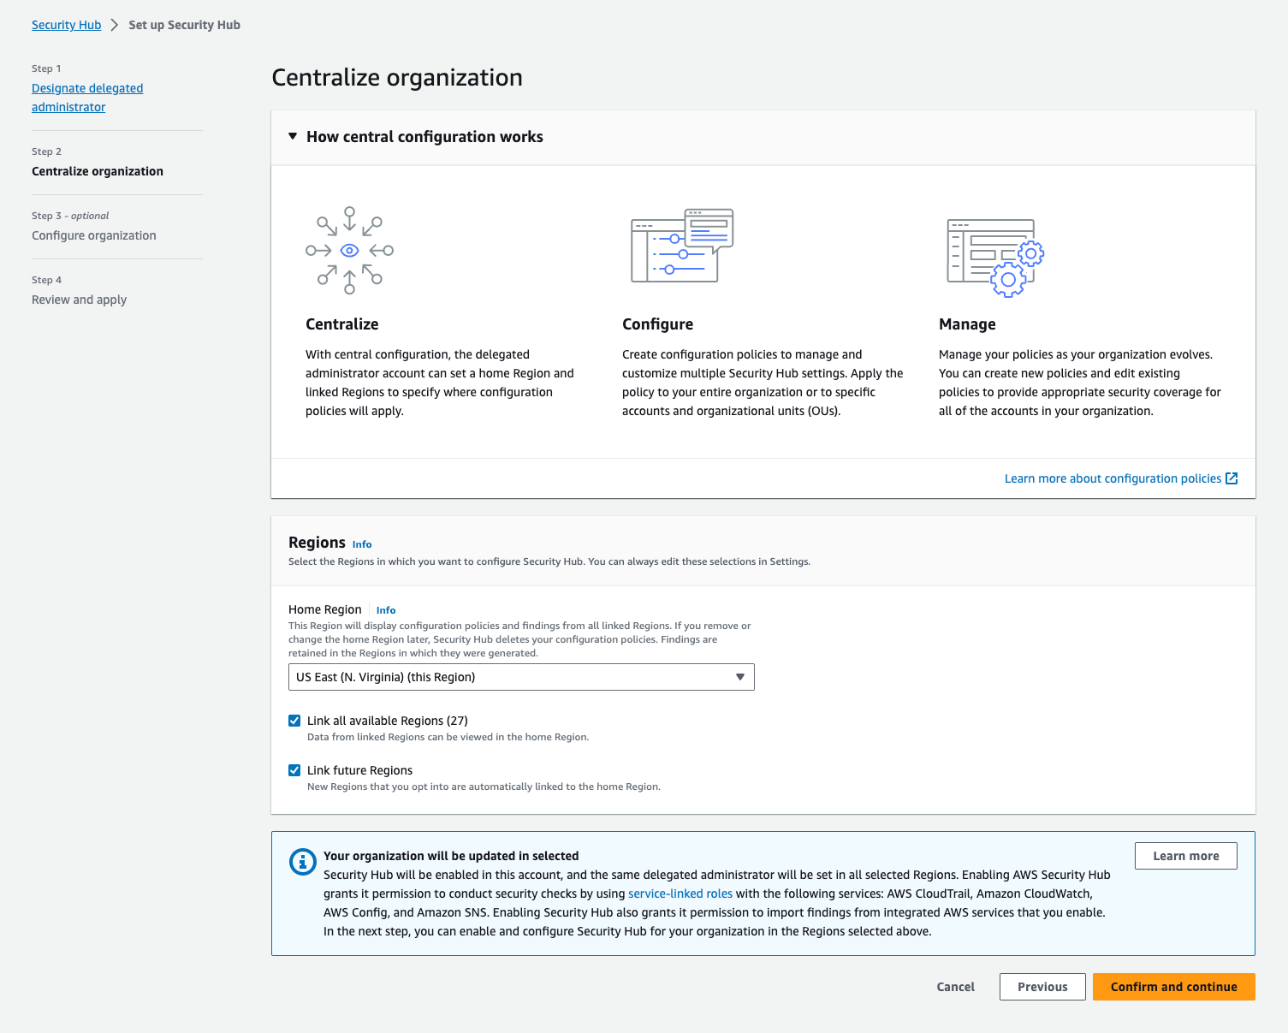
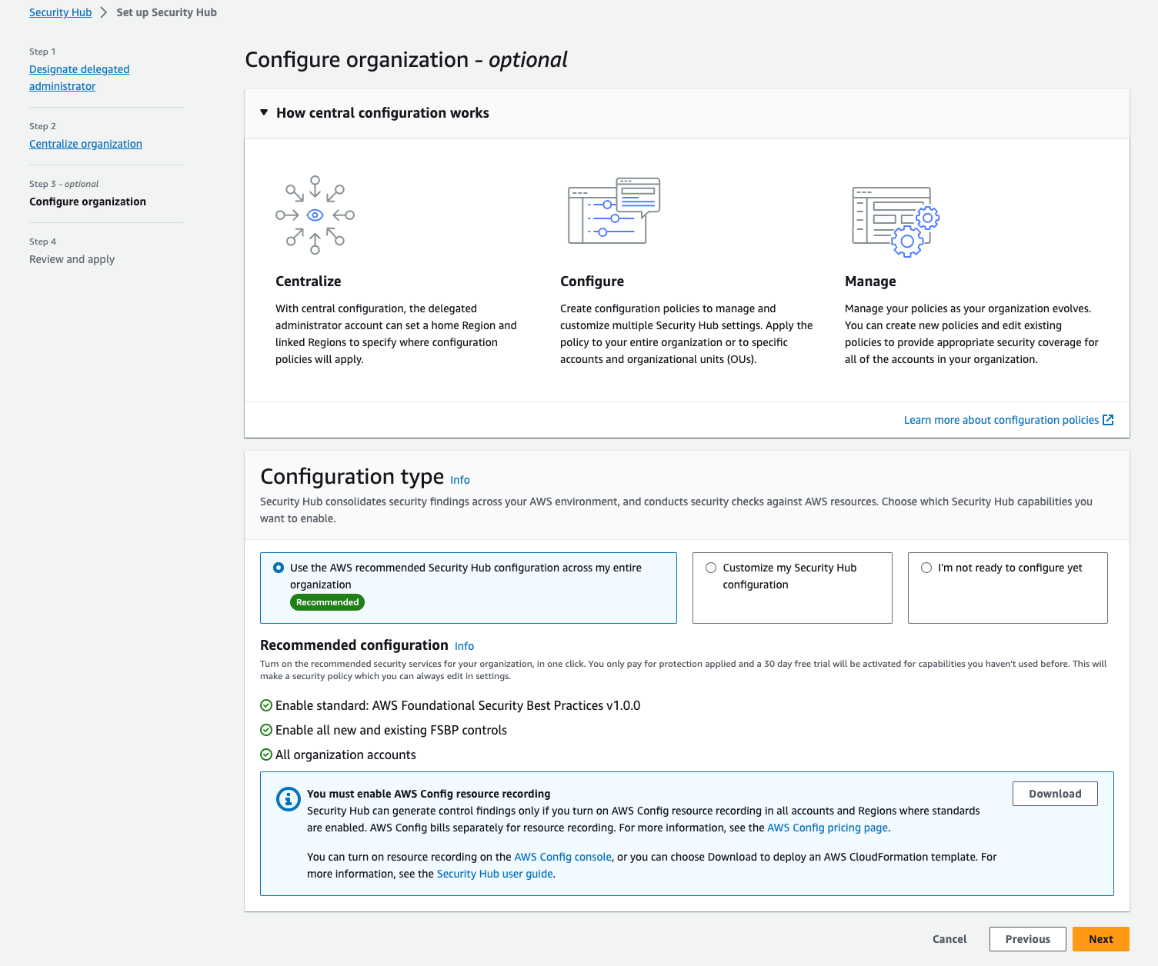
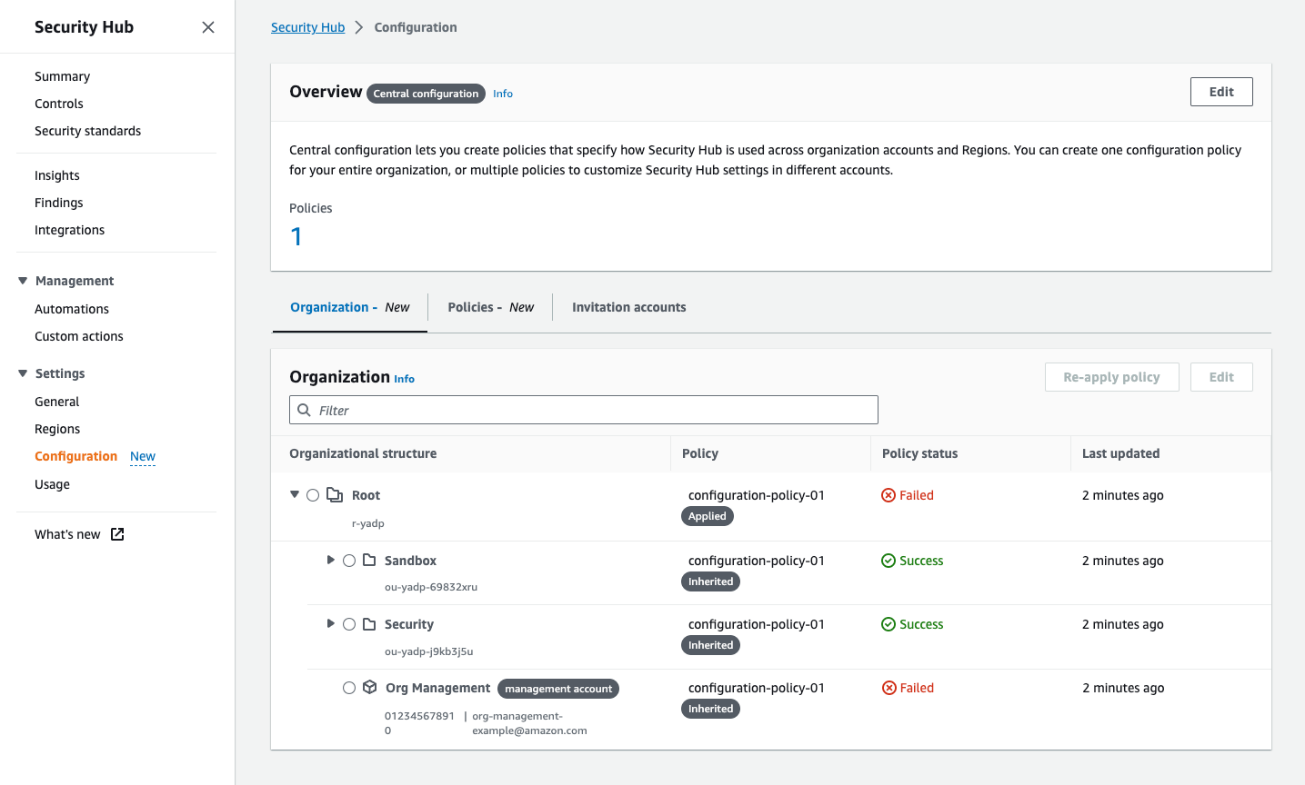 Figure 4: The Organization tab on the Configuration page shows all your organization accounts, if they are being managed by a policy, and the policy status for each account and OU
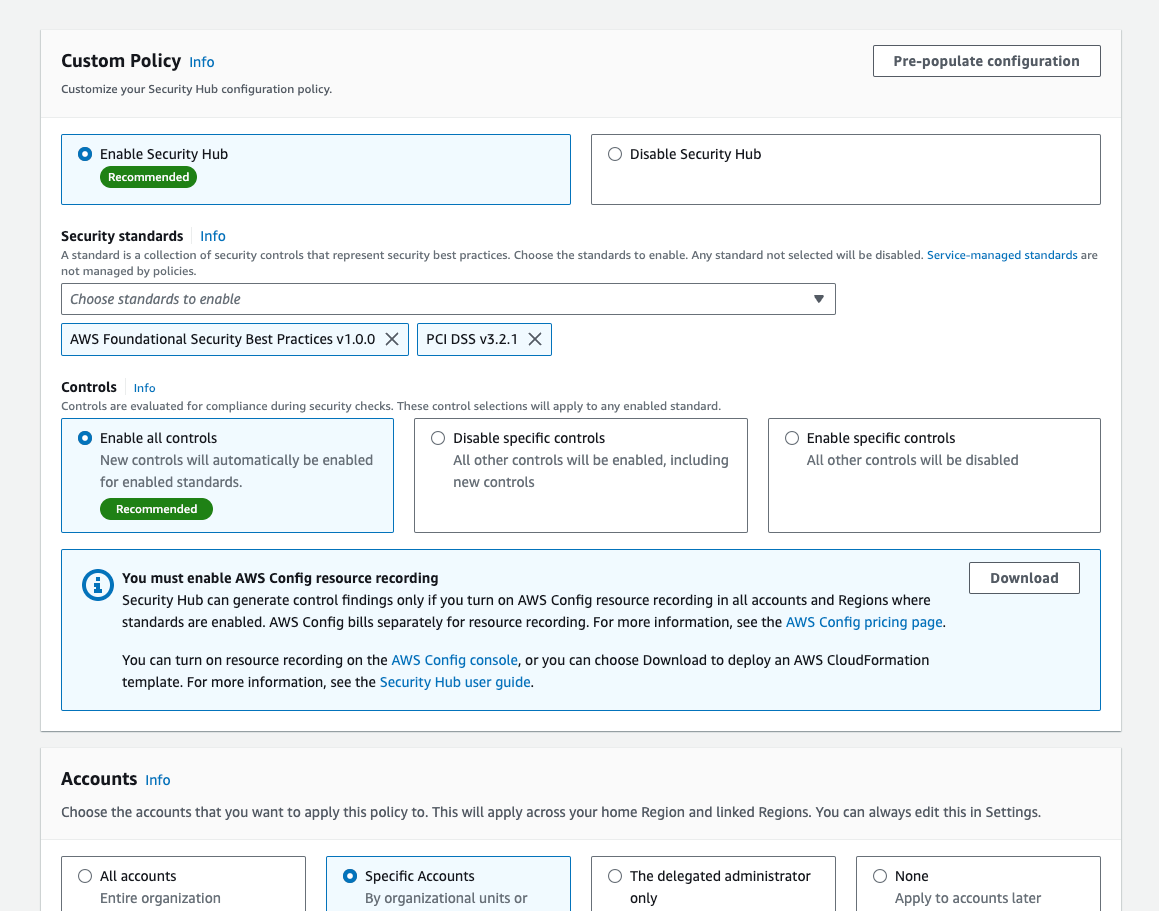
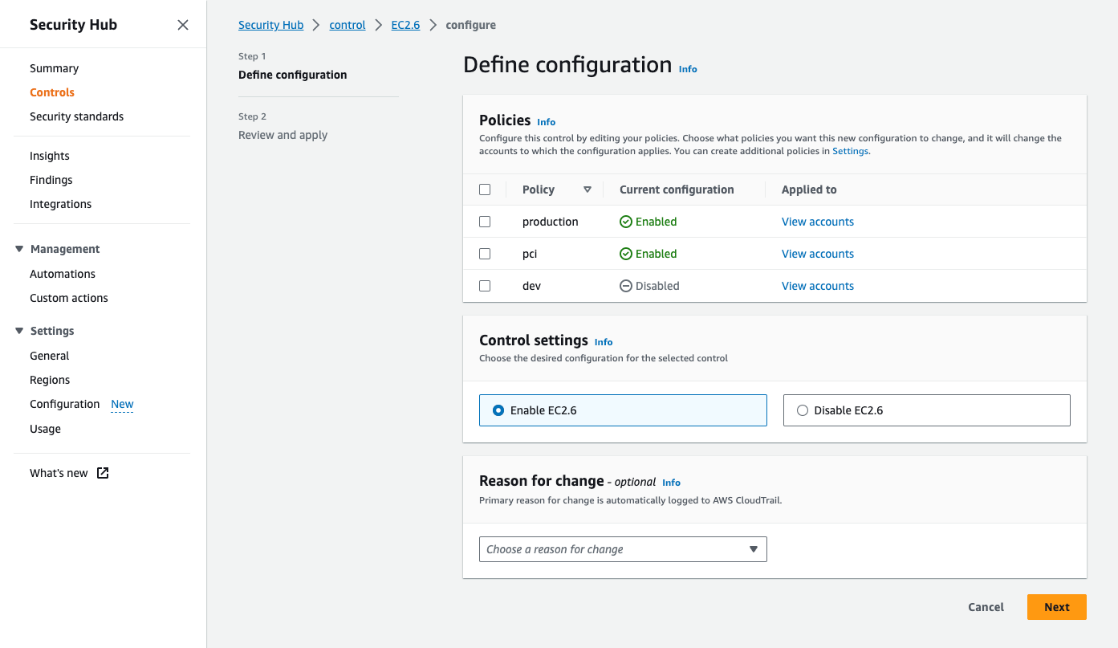


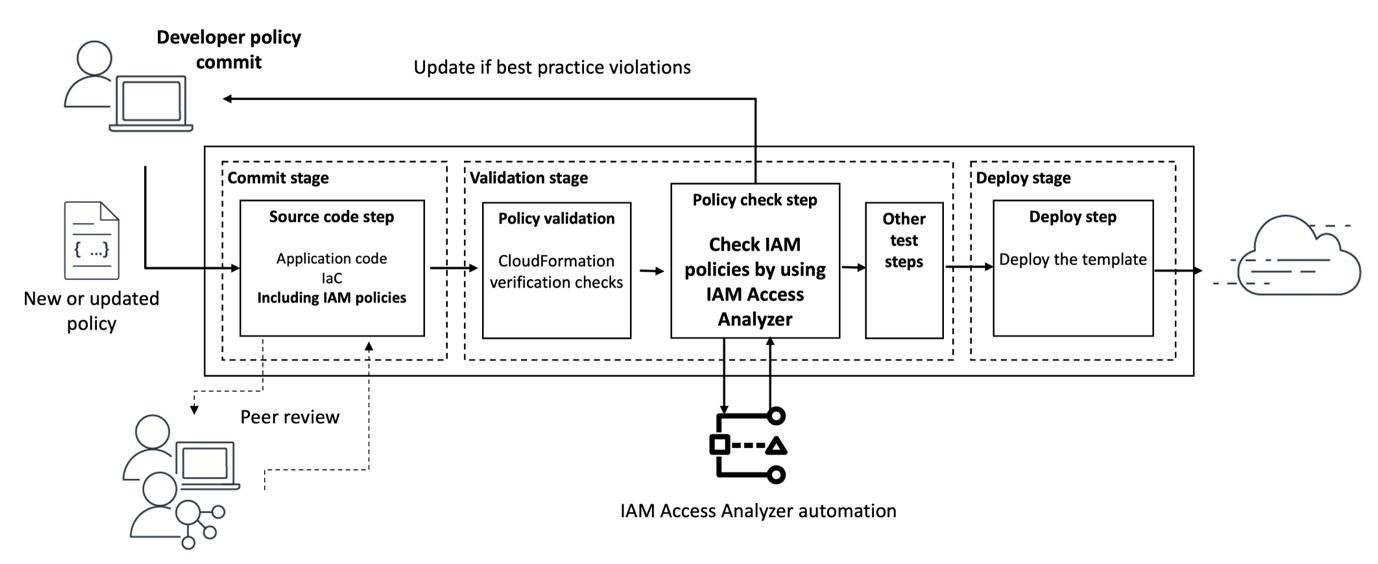

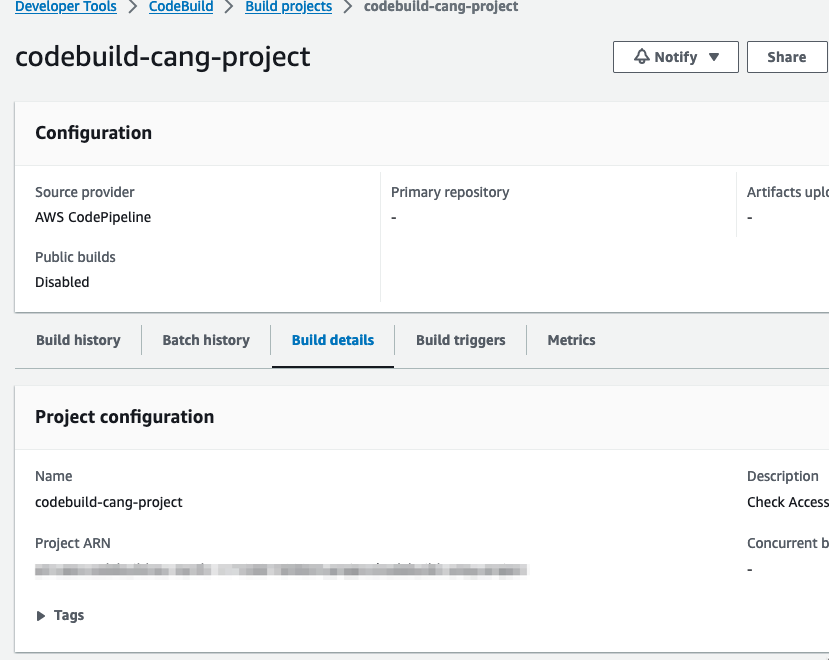


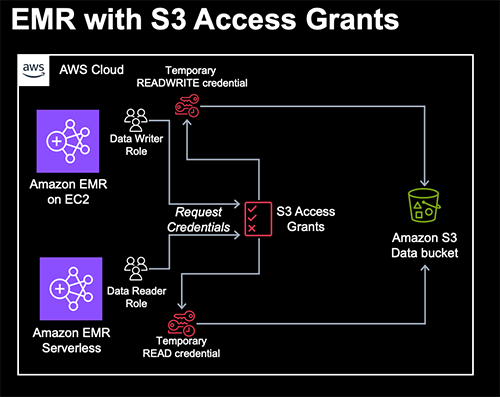


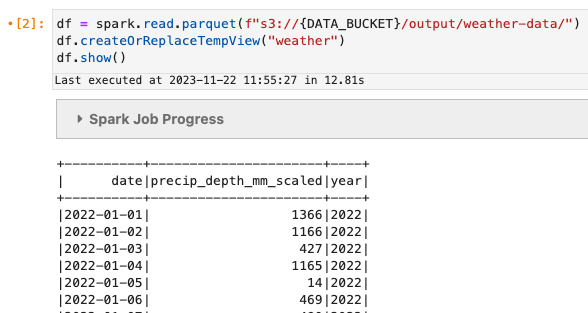
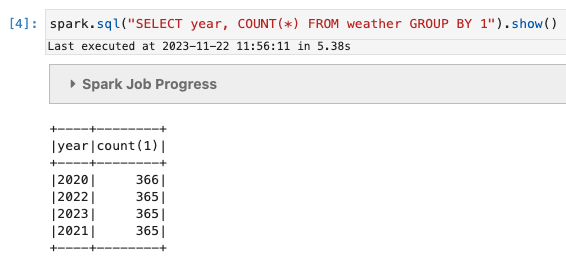

 Damon Cortesi is a Principal Developer Advocate with Amazon Web Services. He builds tools and content to help make the lives of data engineers easier. When not hard at work, he still builds data pipelines and splits logs in his spare time.


 Low Throughput – If you choose an option that provides 4 GBps or less, you will be running on a single HA pair. This is the simplest option to choose if you don’t need a high degree of throughput.


 .
.


