Post Syndicated from The History Guy: History Deserves to Be Remembered original https://www.youtube.com/watch?v=OjH5qlT0eP8
Squid Fishing in Japan
Post Syndicated from Bruce Schneier original https://www.schneier.com/blog/archives/2024/09/squid-fishing-in-japan.html
Fishermen are catching more squid as other fish are depleted.
Leverage IAM Roles for email sending via SES from EC2 and eliminate a common credential risk
Post Syndicated from Zip Zieper original https://aws.amazon.com/blogs/messaging-and-targeting/leverage-iam-roles-for-email-sending-via-ses-from-ec2-and-eliminate-a-common-credential-risk/
Sending automated transactional emails, such as account verifications and password resets, is a common requirement for web applications hosted on Amazon EC2 instances. Amazon SES provides multiple interfaces for sending emails, including SMTP, API, and the SES console itself. The type of SES credential you use with Amazon SES depends on the method through which you are sending the emails.
In this blog post, we describe how to leverage IAM roles for EC2 instances to securely send emails via the Amazon SES API, without the need to embed IAM credentials directly in the application code, link to a shared credentials file, or manage IAM credentials within the EC2 instance. By adopting the approach outlined in this blog, you can enhance security by eliminating the risk of credential exposure and simplify credential management for your web applications.
Solution Overview
Below we provide step-by-step instructions to configure an IAM role with SES permissions to use on your EC2 instance. This allows the EC2 hosted web application to securely send emails via Amazon SES without storing or managing IAM credentials within the EC2 instance. We present an option for running EC2 and SES in the same AWS account, as well as an option to accommodate running EC2 and SES in different AWS accounts. Both options offer a way to enhance security and simplify credential management.
Either option begins with creating an IAM role with SES permissions. Next, the IAM role is attached to your EC2 instance, providing it with the necessary permissions for SES without needing to embed IAM credentials in your application code or on a file in the EC2 instance. In option 2, we’ll add cross-account permissions that allow the code on the EC2 instance in account “A” to send email via the SES API in account “B”. We also provide a sample Python script that demonstrates how to send an email from your EC2 instance using the attached IAM role.
Option 1 – SES and EC2 are in a single AWS account
In a typical scenario where an EC2 instance is operating in the same AWS account as SES, the process of using an IAM role to send emails via SES is straightforward. In the steps below, you’ll configure and attach an IAM role to the EC2 instance. You’ll then update a sample Python script to use the permissions provided by the attached IAM role to send emails via SES. This direct access simplifies the SES sending process, as no explicit credential management is required in the code, nor do you need to include a shared credentials file on the EC2 instance.
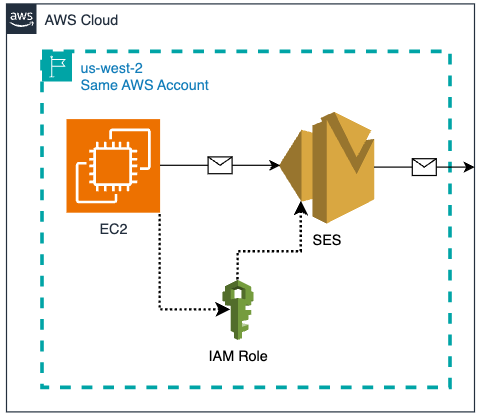
EC2 & SES in the same AWS Account
Prerequisites – single AWS account for EC2 and SES
- A single AWS account in a region that supports SES
- Verified domain or email identity in Amazon SES.
- Make note of a verified sending email address here: ___________
- EC2 instance (Linux) in running state
- If you don’t have a EC2 instance create one (Linux)
- Administrative Access to Amazon SES, IAM and EC2 consoles.
- Access to a recipient email address to receive test emails from the python script.
- Make note of a SES verified recipient email address to send test emails here: ___________
Step 1 – Create IAM Role for EC2 instance with SES Permissions
To start, create an IAM role that grants the necessary permissions to send emails using Amazon SES by following these steps:
- Sign in to the AWS Management Console and open the IAM console.
- In the navigation pane, choose “Roles,” and then choose “Create role.”
- Choose the trusted entity type as “AWS service” and select “EC2” as the service that will use this role, then click ‘Next’

- Search for and select the “AmazonSESFullAccess” policy from the list (or create a custom policy with the necessary SES permissions), then click ‘Next’.


- Provide a name for your role (e.g.,
EC2_SES_SendEmail_Role). - Click “Create role“.
Step 2 – Attach the IAM Role to EC2 instance.
Next, attach the IAM role to your EC2 instance:
- Open the EC2 Management Console.
- In the navigation pane, choose “Instances,” and select the running EC2 instance to which you want to attach the IAM role.
- With the instance selected, choose “Actions,” then “Security,” and “Modify IAM role.“

- Choose the IAM role you created (
EC2_SES_SendEmail_Role) from the drop-down menu and click “Update IAM role.”


Step 3 – Create a sample python script that sends emails from the EC2 instance with the attached role.
- Now that your EC2 instance is configured with the necessary permissions, you can set up an example Python script to send emails via Amazon SES using the IAM Role. Here, we’re using the AWS SDK for Python (Boto3), a powerful and versatile library to interact with the SES API endpoint. Before running the example script, ensure that Python, pip (the package installer for Python), and the Boto3 library are installed on your EC2 instance:
-
- Run the ‘
python3 –version‘ command to check if Python is installed on your EC2 instance. If Python is installed, the version will be displayed, otherwise you’ll receive a ‘command not found’ or similar error message.- If python is not installed, run the command ‘
sudo yum install python3 -y‘
- If python is not installed, run the command ‘
- Run the ‘
pip3 --version‘ command to check if pip is installed on your EC2 instance. If pip3 is installed, is installed, the version will be displayed, otherwise you’ll receive a ‘command not found’ or similar error message.- If pip3 is not installed, run the command ‘
sudo yum install python3-pip‘
- If pip3 is not installed, run the command ‘
- Install the Boto3 Library which allows Python scripts to interact with AWS services including SES. Run the command ‘
pip3 install boto3‘ to install (or update) Boto3 using pip.
- Run the ‘
- Save the code below as a Python file named ‘
sesemail.py‘ on your EC2 instance. - Edit
'sesemail.py‘ and replace the placeholder values of SENDER, RECIPIENT, and AWS_REGION with your values (see prerequisites). Do not modify any “” marks.
[copy]
import boto3
from botocore.exceptions import ClientError

SENDER = "[email protected]"
RECIPIENT = "[email protected]"
#CONFIGURATION_SET = "ConfigSet"
AWS_REGION = "us-west-2"
SUBJECT = "Amazon SES Test Email (SDK for Python) using IAM Role"
BODY_TEXT = ("Amazon SES Test (Python)\r\n"
             "This email was sent with Amazon SES using the "
             "AWS SDK for Python (Boto)."
            )

BODY_HTML = """<html>
<head></head>
<body>
  <h1>Amazon SES Test (SDK for Python) using IAM Role</h1>
  <p>This email was sent with
    <a href='https://aws.amazon.com/ses/'>Amazon SES</a> using the
    <a href='https://aws.amazon.com/sdk-for-python/'>
      AWS SDK for Python (Boto)</a>.</p>
</body>
</html>
            """

CHARSET = "UTF-8"

client = boto3.client('ses',region_name=AWS_REGION)

try:
    response = client.send_email(
        Destination={
            'ToAddresses': [
                RECIPIENT,
            ],
        },
        Message={
            'Body': {
                'Html': {
                    'Charset': CHARSET,
                    'Data': BODY_HTML,
                },
                'Text': {
                    'Charset': CHARSET,
                    'Data': BODY_TEXT,
                },
            },
            'Subject': {
                'Charset': CHARSET,
                'Data': SUBJECT,
            },
        },
        Source=SENDER,
    )
except ClientError as e:
    print(e.response['Error']['Message'])
else:
    print("Email sent! Message ID:"),
    print(response['MessageId'])
- Run ‘
python3 sesmail.py‘ to execute the Python script. - When ‘
python3 sesmail.py‘ runs successfully, an email is sent to theRECIPIENT(check the inbox), and the command line will display the sent Message ID.

Option 2 – SES and EC2 are in different AWS accounts
In some scenarios, your EC2 instance might operate in a different AWS account than SES. Let’s call the EC2 AWS account “A” and SES AWS account “B”. Because the AWS resources in account A don’t automatically have permission to access AWS resources account B, we need some way to allow the code on EC2 to assume a role in the SES Account using the AWS Security Token Service (STS). This involves a method that generates temporary credentials that include an access key, secret access key, and session token, which are only valid for a limited time.

EC2 & SES in different AWS Accounts
In the steps below, you’ll configure and attach an IAM role to the EC2 instance in account “A” such that it can run an example Python script. This Python script can use the permissions provided by the attached IAM role to send emails via SES in account “B”. This approach leverages cross-account access and simplifies sending email from the EC2 in account A via SES in account B. As with Option 1, no explicit credential management is required in the code running on EC2, nor do you need to include a shared credentials file on the Ec2 instance.
Prerequisites – different AWS accounts for EC2 and SES (use cross-account access)
- An AWS account “A” with:
- EC2 instance (Linux) in running state. (If you don’t have a EC2 instance, create one using Amazon Linux)
- Administrative Access to Amazon IAM and EC2 consoles.
- Make note of your “A” AWS account ID here: ________________
- An AWS account “B” with:
- Verified domain (or email identity for testing only) in Amazon SES
- Make note of a verified sending email address here: ___________
- Administrative Access to Amazon SES and IAM consoles.
- Make note of your “B” AWS account ID here: ________________
- In the steps below, you will create a “
SES_Role_for_account_A” role.- Make note of the ARN of the “
SES_Role_for_account_A” role here: ___________
- Make note of the ARN of the “
- Access to a recipient email address to receive test emails from the python script.
- Make note of a SES verified recipient email address to send test emails here: ___________
- Verified domain (or email identity for testing only) in Amazon SES
Step 1 – Create IAM Role in the SES “B” account
- Sign in to the SES “B” account via the AWS Management Console and open the IAM console.
- In the navigation pane, choose “Roles,” and then choose “Create role“.
- Choose the trusted entity type as ‘AWS account’ and select ‘Another AWS account’.

- Add the AWS account ID where your EC2 instance resides (AWS account “A” in the prerequisites) and click ‘Next’.
- Search for and select the “
AmazonSESFullAccess” policy or create a custom policy with the necessary SES permissions, then click ‘Next’. - Provide a name for your role (e.g., ‘
SES_Role_for_account_A').
- Click “Create role“.
- Copy the arn for the new
SES_Role_for_account_A(you’ll need the arn in the next step).


Step 2 – Create a IAM policy in the EC2 “A” account that allows this role to assume the SES_Role_for_account_A role you just created in the SES “B” Account.
- Sign in to the EC2 “A” account via the AWS Management Console and open the IAM console.
- In the navigation pane, choose “Policies,” and then choose “Create Policy”.
- Choose the service as ‘EC2’ and select policy editor as JSON.
- Copy the policy below, and in the policy editor, replace the Resource with the arn of the
SES_Role_for_account_Ain the SES account “B” (you created this in step 1).
[copy, paste into policy editor & replace the arn with SES_Role_for_account_A]
{
"Version": "2012-10-17",
"Statement": [
{
"Effect": "Allow",
"Action": "sts:AssumeRole",
"Resource": "arn:aws:iam::<SES_Account_ID>:role/<Role_Name>"
}
]
}
- Click ‘Next’ and provide a name for your role (e.g.,
EC2_Policy_for_account_B). - Click ‘Create the Policy’

Step 3 – Create an IAM role in the EC2 “A” account, and attach the previously created IAM policy (EC2_Policy_for_account_B) to it.
- In the EC2 “A” account IAM console navigation pane, choose “Roles,” and then choose “Create role.”
- Choose the trusted entity type as “AWS service” and select “EC2” as the service, then click ‘Next’.

- Filter by type “customer managed”, search for (
EC2_Policy_for_account_B) and select that policy and ‘Next’ (note – if you are using AWS Session Manger to remotely connect to your EC2 instance, you may need to add the “AmazonSSMManagedInstanceCore” policy to the role).

- Provide a name for your role (e.g.,
EC2_SES_in_account_B_role). - Click “Create role“.

Step 4 – Attach the IAM Role (EC2_SES_in_account_B_role) to the EC2 instance in AWS account “A”.
- Open the EC2 Management Console in AWS account “A”
- In the navigation pane, choose “Instances,” and select the instance to which you want to attach the
EC2_SES_in_account_B_roleIAM role. - With the instance selected, choose “Actions,” then “Security,” and “Modify IAM role.”

- Choose the IAM role you created (
EC2_SES_in_account_B_role) from the drop-down menu. - Click “Update IAM role.”

Step 5 – Create a sample python script that sends emails via SES in AWS account “B” from the EC2 instance in AWS account “A” using the EC2 attached role.
- Now that your EC2 instance is configured with the necessary permissions, you can set up an example Python script to send emails via Amazon SES in AWS Account “B” using the IAM Role on EC2 in AWS Account “A”. We’ll use the AWS SDK for Python (Boto3), a powerful and versatile library to interact with the SES API endpoint. Before running the example script, ensure that Python, pip (the package installer for Python), and the Boto3 library are installed on your EC2 instance:
-
- Run the ‘
python3 –version‘ command to check if Python is installed on your EC2 instance. If Python is installed, the version will be displayed, otherwise you’ll receive a ‘command not found’ or similar error message.- If python is not installed, run the command ‘
sudo yum install python3 -y‘
- If python is not installed, run the command ‘
- Run the ‘
pip3 --version‘ command to check if pip is installed on your EC2 instance. If pip3 is installed, is installed, the version will be displayed, otherwise you’ll receive a ‘command not found’ or similar error message.- If pip3 is not installed, run the command ‘
sudo yum install python3-pip‘
- If pip3 is not installed, run the command ‘
- Install the Boto3 Library which allows Python scripts to interact with AWS services including SES. Run the command ‘
pip3 install boto3‘ to install (or update) Boto3 using pip.
- Run the ‘
- Save the code below as a Python file named
cross_sesemail.pyon your EC2 instance.
4b. Editcross_sesemail.pyand replace the placeholder values of theROLE_ARNwith ARN of theSES_Role_for_account_Ayou created in SES Account “B” (see prerequisites), SENDER, RECIPIENT, and AWS_REGION with your values (see prerequisites). Do not modify any “” marks.
[copy, edit & replace the ROLE_ARN]
import boto3
from botocore.exceptions import ClientError

# Replace with your role ARN in SES Account
ROLE_ARN = "arn:aws:iam::<Account_ID>:role/<Role_Name>"

# Create an STS client
sts_client = boto3.client('sts')

# Assume the role
assumed_role = sts_client.assume_role(
    RoleArn=ROLE_ARN,
    RoleSessionName="SESSession"
)

# Extract the temporary credentials
credentials = assumed_role['Credentials']

# Create an SES client using the assumed role credentials
ses_client = boto3.client(
    'ses',
    region_name='us-west-2',
    aws_access_key_id=credentials['AccessKeyId'],
    aws_secret_access_key=credentials['SecretAccessKey'],
    aws_session_token=credentials['SessionToken']
)

# Email parameters
SENDER = "[email protected]"
RECIPIENT = "[email protected]"
SUBJECT = "Amazon SES Test (SDK for Python) using cross-account IAM Role"
BODY_TEXT = ("Amazon SES Test (Python)\r\n"
             "This email was sent with Amazon SES using the "
             "AWS SDK for Python (Boto) using IAM Role."
            )
BODY_HTML = """<html>
<head></head>
<body>
  <h1>Amazon SES Test (SDK for Python) using IAM Role</h1>
  <p>This email was sent with
    <a href='https://aws.amazon.com/ses/'>Amazon SES</a> using the
    <a href='https://aws.amazon.com/sdk-for-python/'>
      AWS SDK for Python (Boto)</a> using IAM Role.</p>
</body>
</html>
            """
CHARSET = "UTF-8"

# Send the email
try:
    response = ses_client.send_email(
        Destination={
            'ToAddresses': [RECIPIENT],
        },
        Message={
            'Body': {
                'Html': {
                    'Charset': CHARSET,
                    'Data': BODY_HTML,
                },
                'Text': {
                    'Charset': CHARSET,
                    'Data': BODY_TEXT,
                },
            },
            'Subject': {
                'Charset': CHARSET,
                'Data': SUBJECT,
            },
        },
        Source=SENDER,
    )
except ClientError as e:
    print(e.response['Error']['Message'])
else:
    print("Email sent! Message ID:"),
    print(response['MessageId'])
- Run the python script
python3 cross_sesemail.py. When the email is sent successfully, the command line output will display the message ID of the sent email, and the recipient will receive an email.

Conclusion:
By implementing IAM roles for EC2 instances with SES permissions, you can securely send emails via the SES APIs from your web applications without the need to store or manage IAM credentials within the EC2 instance or application code. This approach not only enhances security by eliminating the risk of credential exposure, but also simplifies the management of credentials. With the step-by-step guide provided in this blog post, you can easily configure IAM roles for your EC2 instances and start sending emails via the Amazon SES API in a secure and efficient manner, regardless of whether your EC2 and SES resources reside in the same or different AWS accounts.
Next Steps:
- Sign up for the AWS Free Tier and try out Amazon SES with IAM roles for EC2 instances as demonstrated in this blog post.
- Consult the AWS documentation on IAM Roles for Amazon EC2 and Amazon SES for more detailed instructions and best practices.
- Join the AWS Community Forums to ask questions, share experiences, and learn from other AWS users who have implemented similar solutions for secure email sending from their web applications.
About the Authors

Manas Murali M
Manas Murali M is a Cloud Support Engineer II at AWS and subject matter expert in Amazon Simple Email Service (SES) and Amazon CloudFront. With over 5 years of experience in the IT industry, he is passionate about resolving technical issues for customers. In his free time, he enjoys spending time with friends, traveling, and exploring emerging technologies.

Zip
Zip is an Amazon Pinpoint and Amazon Simple Email Service Sr. Specialist Solutions Architect at AWS. Outside of work he enjoys time with his family, cooking, mountain biking and plogging.
Metasploit Weekly Wrap-Up 09/27/2024
Post Syndicated from Christophe De La Fuente original https://blog.rapid7.com/2024/09/27/metasploit-weekly-wrap-up-09-27-2024/
Epic Release!

This week’s release includes 5 new modules, 6 enhancements, 4 fixes and 1 documentation update. Among the new additions, we have an account take over, SQL injection, RCE, and LPE! Thank you to all the contributors who made it possible!
New Module Content (5)
Cisco Smart Software Manager (SSM) On-Prem Account Takeover (CVE-2024-20419)
Authors: Michael Heinzl and Mohammed Adel
Type: Auxiliary
Pull request: #19375 contributed by h4x-x0r
Path: admin/http/cisco_ssm_onprem_account
AttackerKB reference: CVE-2024-20419
Description: This is a new module which exploits an account takeover vulnerability in Cisco Smart Software Manager (SSM) On-Prem <= 8-202206, by changing the password of the admin user to one that is attacker-controlled.
WhatsUp Gold SQL Injection (CVE-2024-6670)
Authors: Michael Heinzl and Sina Kheirkhah ( <Sina Kheirkhah (@SinSinology) of Summoning Team (@SummoningTeam)>
Type: Auxiliary
Pull request: #19436 contributed by h4x-x0r
Path: admin/http/whatsup_gold_sqli
CVE reference: ZDI-24-1185
Description: This is a new module which exploits a SQL injection vulnerability in WhatsUp Gold versions before v24.0.0. Successful exploitation allows an unauthenticated remote attacker to change the password of the admin user.
Vicidial SQL Injection Time-based Admin Credentials Enumeration
Authors: Jaggar Henry of KoreLogic, Inc. and Valentin Lobstein
Type: Auxiliary
Pull request: #19453 contributed by Chocapikk
Path: scanner/http/vicidial_sql_enum_users_pass
AttackerKB reference: CVE-2024-8503
Description: This adds a new auxiliary module that exploits a time-based SQL injection vulnerability in VICIdial to enumerate admin credentials. This auxiliary module is designed for MySQL databases and allows the retrieval of admin usernames and passwords through blind SQL injection.
Traccar v5 Remote Code Execution (CVE-2024-31214 and CVE-2024-24809)
Authors: Michael Heinzl, Naveen Sunkavally, and yiliufeng168
Type: Exploit
Pull request: #19416 contributed by h4x-x0r
Path: linux/http/traccar_rce_upload
AttackerKB reference: CVE-2024-24809
Description: This module exploits two vulnerabilities in Traccar v5.1 – v5.12 to obtain remote code execution: A path traversal vulnerability CVE-2024-24809 and an unrestricted file upload vulnerability CVE-2024-31214.
Local Privilege Escalation via CVE-2023-0386
Authors: Takahiro Yokoyama, sxlmnwb, and xkaneiki
Type: Exploit
Pull request: #19441 contributed by Takahiro-Yoko
Path: linux/local/cve_2023_0386_overlayfs_priv_esc
AttackerKB reference: CVE-2023-0386
Description: This adds an exploit module that leverages a flaw in the Linux kernel’s OverlayFS subsystem, which allows unauthorized access to the execution of the setuid file with capabilities (CVE-2023-0386). This enables a local user to escalate their privileges on the system.
Enhancements and Features (6)
- #19397 from sjanusz-r7 – This replaces the Readline library with Reline.
- #19448 from jvoisin – Adds a number of improvements to modules/post/multi/manage/screensaver.rb. A new UNLOCK action has been added. When the LOCK action is selected instead of only checking to see if
xdg-screensaver lockexists on the target, the module will check for the presence ofqdbus,dbus-sendandloginctl. Improved error handling when running on Windows or Solaris has also been added. - #19451 from jvoisin – Before this change php NOP sleds would be comprised of only spaces. Now the space, tab, semi-colon, carriage return and line feed characters will all be used in a random assortment to generate NOP sleds when needed.
- #19462 from jvoisin – This adds an
Autooption to theMsf::Post::Linux::Compilelibrary. This enables automatic selection of the compiler according to what is available locally on the target system. - #19467 from jvoisin – This updates the
lib/msf/core/exploit/remote/http/wordpress/admin.rblibrary such that when generate_plugin method gets called and the payload type is not ARCH_PHP – the library will use thephp_preamble/php_system_blockcombo instead of hardcoding system/base64, as system might not be available on some WordPress deployments, and the combo has some low-hanging evasions for this case. This change also randomizes the license header of the plugin. - #19478 from bcoles – Updates Metasploit to support new constants for RISCV32BE, RISCV32LE, RISCV64BE, RISCV64LE, LOONGARCH64.
Bugs Fixed (4)
- #19184 from adfoster-r7 – This updates bundler version and fixes multiple warnings when booting msfconsole.
- #19474 from sfewer-r7 – This fixes a bug in the DNS resolver on Windows platforms that prevented it from initializing.
- #19475 from NtAlexio2 – This refactors the
pipe_auditorscanner module to allow an RPORT argument to be specified and refactors it to follow more recent patterns used by SMB modules. - #19491 from jvoisin – Fixes a crash in
lib/msf/core/payload/php.rb.
Documentation Added (1)
- #19493 from adfoster-r7 – Improves the documentation for testing that the post exploitation API works against the currently opened sessions.
You can always find more documentation on our docsite at docs.metasploit.com.
Get It
As always, you can update to the latest Metasploit Framework with msfupdate
and you can get more details on the changes since the last blog post from
GitHub:
If you are a git user, you can clone the Metasploit Framework repo (master branch) for the latest.
To install fresh without using git, you can use the open-source-only Nightly Installers or the
commercial edition Metasploit Pro
Научни новини: Минилуни, комети, зоонози и фораминифери
Post Syndicated from Михаил Ангелов original https://www.toest.bg/nauchni-novini-miniluni-kometi-zoonozi-i-foraminiferi/
Това не е луна (а малък астероид)

Луната е стар другар на планетата ни, близо e до нея през по-голямата част от съществуването ѝ. Към момента най-широко приетата хипотеза е, че тя се е формирала след сблъсъка на обект с големината на Марс (Тея) и Протоземята. Поради близостта си до Слънцето и сравнително малката си маса след това събитие Земята не е успяла да привлече друг обект в постоянна орбита около себе си, затова Луната е нейният единствен постоянен естествен спътник.
Но понякога орбитата на някои астероиди минава близо до Земята и за известен период те са прихванати от нейното гравитационно поле. Тези събития може да са кратки – в рамките на няколко месеца астероидите само прелитат покрай планетата ни. Или по-дълги, продължаващи няколко години, като през този период обектите изминават една или повече пълни орбити около Земята. Тъй като са естествени спътници на планетата за известно време, могат да бъдат приети за своеобразни луни.
Примери за това са 2020 CD3, който напуска земното пространство през 2020 г., след като е прекарал там няколко години, и 2022 NX1, който е периодичен гост на планетата – прелетял е покрай нас през 1981 и 2022 г., а следващото му посещение трябва да е през 2051-ва.
Това предстои да стане и с астероида 2024 PT5, открит преди два месеца. Той е с размер около 10 м и е представител на групата астероиди Арджуна (наречени на хиндуистки герой) с орбити, сходни на земната. На 29 септември орбитата му ще се приближи до планетата дотолкова, че той ще стане минилуна до 25 ноември. Астероидът ще прелети отново покрай Земята на 9 януари 2025 г., след което ще се отправи на далечно пътешествие за 30 години, връщайки се при нас през 2055 г. Поради малкия си размер и голямото разстояние от Земята (около 10 пъти по-далеч от Луната) наблюдението на астероида ще бъде възможно само с големи телескопи. Имайки предвид характеристиките на орбитата му, учените отбелязват, че е малко вероятно обектът да е изкуствен.
Реално обектът няма да е същинска луна, тъй като няма да има стабилна орбита около планетата, но това е забавен начин да се гледа на сравнително рядък феномен.
Случаят обръща вниманието и към по-неприятния аспект на такива събития – сравнително късното откриване на малки обекти, които преминават близо до Земята. Въпреки че не са чак толкова опасни, колкото астероида, довел до загиването на динозаврите, те все пак могат да причинят огромни щети. Интензитетът на експлозията от метеорита, който избухна над Челябинск през 2013 г., се определя като над 20 пъти по-голям от този на бомбата, пусната над Хирошима. За справяне с проблема има предложени различни подходи, но техническите предизвикателства и необходимостта от финансиране са въпроси, на които все още няма точни отговори.
Посещение от комета
Преминаването на 2024 PT5 ще съвпадне с посещението и на друг далечен пътник – кометата C/2023 A3 (Tsuchinshan–ATLAS). Тя е забелязана първо в началото на 2023 г. от китайска обсерватория. След месец е наблюдавана от южноафриканската обсерватория ATLAS, открила и астероида по-горе. Кометата идва от облака на Оорт – своеобразна сфера от обекти, която обвива Слънчевата система и се намира след хелиопаузата. Счита се, че повечето комети, които наблюдаваме, са с такъв произход. Орбитата на A3 я отведе най-близо до Слънцето (т.нар. перихелий) на 27 септември.
След откриването ѝ кометата постоянно се наблюдава, за да се проследи нейният път и да се прецени състоянието ѝ. Тъй като в повечето случаи кометите не са много големи и при всяко преминаване покрай Слънцето отделят материал и са изложени на силни гравитационни сили, има голям риск от разделянето им на по-малки обекти, около които не може да се образува голяма опашка и които не достигат достатъчна яркост за наблюдение с просто око. Такъв беше случаят с C/2019 Y4 (ATLAS), която даваше първоначални индикации за отдавна невиждан интензитет, но няколко месеца преди да достигне перихелий, започна да се разпада.
В началото на юли беше публикувана статия, според която кометата е започнала да отделя по-малко прах, което е знак, че ядрото ѝ се е фрагментирало. Притесненията за това нараснаха поради липсата на наблюдения, но за радост на астрономите в началото на септември бяха публикувани редица съобщения, че кометата е видима и е с добра яркост. Южното полукълбо на Земята ще предостави по-добра възможност за наблюдение, което вече дава резултат – преди ден кометата е заснета над Чили с красива дълга опашка, видима и с просто око. Това показва, че най-вероятно A3 ще издържи на острия завой около Слънцето и ще можем да ѝ се полюбуваме.
This morning, I captured another image of Comet C/2023 A3 (Tsuchinshan-ATLAS) from the @LCOAstro site in the Atacama Desert, Chile 🇨🇱✨😱. The view was absolutely stunning !!! The comet is clearly visible visually. My gear: Nikon D810a camera with a 135mm lens. Exposure: 20 x 30… pic.twitter.com/lieSFHEP1W
— Yuri Beletsky (@YBeletsky) September 26, 2024
Очаква се кометата да бъде видима в рамките на месец – от края на септември до края на октомври. До средата на октомври наблюденията ще са възможни рано сутрин, преди изгрев, ниско над хоризонта в посока изток, а след това привечер, след залез, в посока запад.
Зоонозите са все така актуални
Инфекциозните заболявания, които се предават от животни на човек, са предизвикателство, при справянето с което съвременната медицина продължава да изпитва трудности. При патогените, за които гостоприемник е само човекът, може да се разработи ваксина, която да помогне за почти пълното заличаване на заболяванията, причинени от тях. Примери за това са едрата шарка и полиомиелитът. Но когато вирусите могат да бъдат приютени в друг вид, особено див, изпълнението на тази задача става практически невъзможно. Въпреки че прескачането на междувидовата бариера се наблюдава рядко, то може да доведе до много сериозни последици, както показа пандемията от COVID-19.
Преди няколко дни беше публикувана нова информация, която допълнително подкрепя животинския произход на вируса причинител на последната пандемия (SARS-CoV-2). Проучването се базира на набор от данни, който е публикуван от Китайският център по заразни болести и съдържа информация от над 800 проби, събрани от пазара Хуанан в Ухан. Пробите са взети както от животни, останали непродадени след затварянето на пазара, така и от повърхности, с които животните са били в контакт – клетки, канали и др. Така събраният материал е бил секвениран с цел получаване на пълен набор от всички налични нуклеинови киселини – без значение от какъв вид са те.
Новият анализ успешно е определил от кой вид бозайник е пробата и дали в нея има следи от SARS-CoV-2. Благодарение на детайлната информация за конкретното местоположение, от което са събрани, учените са направили карта на пазара, в която могат да се видят огнищата на COVID и видовете, които са най-засегнати от него. Това са цивети и енотовидни кучета, които бяха уличени като преносители още в началото на пандемията, а също и по време на епидемията от SARS през 2002 г.
Тези проби са сравнени линиите на вируса, изолирани в началото на пандемията. Те са практически идентични, което е силен аргумент, че именно пазарът (или общ доставчик) е бил мястото, от което се е разпространило заболяването. Определена още в началото като малко вероятна, хипотезата за изкуствения произход на вируса вече е още по-съмнителна.
За съжаление, повечето животни са премахнати от пазара, преди китайският екип да започне събиране на проби, поради което директното установяване на произхода на вируса става невъзможно. Единственият достъпен материал са РНК и ДНК, останали по клетките, в които са държани животните. Въпреки това експертите се надяват, че благодарение на установяването на конкретни видове болни животни ще може да се проследи техният произход и да се проучи местната популация на прилепи, които са основният резервоар на коронавируси.
Проследяването на източника на новопоявилите се вирусни заболявания е от изключително значение, защото може да помогне както за превенция на разпространението им, така и за ускоряване на създаването на ваксини за тях. Въпросът е повече от актуален на фона на продължаващото разпространение на птичи грип в САЩ. Нов случай в Мисури буди притеснение, защото все още не е ясно как се е заразил пациентът.
Към момента вирусът е установен в 14 души в САЩ: деветима са се заразили след контакт с птици, а четирима – от крави. Източникът при най-новия случай не може да се установи и не е ясно дали става въпрос за пренос от човек, или друг вектор. Пациентът е постъпил в болница и при тест за грип е дал положителен резултат. Тъй като вирусът се е оказал различен от сезонните щамове, той е секвениран и е потвърдено, че е от птича разновидност. Пациентът се е възстановил и вече е изписан, но учените се тревожат най-вече поради неясния произход на заразата.
Данните от секвенирането не помагат да се разплете напълно мистерията. Секвенцията е непълна, което може да се дължи на това, че пробата е взета прекалено късно след острото развитие на вируса. Не може да се заключи със сигурност, че става въпрос за пренос от човек. Както вече е известно, вирусът се отделя в млякото на болни крави, така че неправилно обработено мляко може да бъде евентуален вектор.
Въпреки че към момента описаните случаи при хора са малко, вирусът е установен в много други бозайници – крави, лисици, мишки, еноти, котки, което означава, че прескачането на междувидовата бариера става често. Така потенциалните източници на зараза се увеличават. Расте и възможността на вируса да рекомбинира в по-агресивни щамове. Успокоителното е, че към момента няма данни за широко разпространение сред хора и в изявлението си Центърът за контрол и превенция на заболявания (CDC) определя риска за населението като нисък.
Пренареждане в Средиземно море
Глобалните промени в климата обикновено се свързват с температурни аномалии и по-непредвидимо време, но те влияят на всички части от екосферата. Повишаването на нивата на въглероден диоксид (CO2) в атмосферата има различен ефект върху различните организми. За растенията леко повишените нива могат да бъдат полезни – CO2 е източник на въглерод за техния метаболизъм. Наред с това, тъй като могат да отворят по-малко устицата си, за да приемат същото количество въглерод, те губят по-малко вода и така стават по-устойчиви на засушаване. Разбира се, това е деликатен баланс и над определена граница растенията започват да страдат.
Антропогенното покачване на CO2 влияе и на водните екосистеми – той се разтваря във водата и така понижава нейното pH, правейки я по-кисела. Един от подходящите хабитати за изследване на последиците от вкисляването на Световния океан е Средиземно море, което е по-алкално (с по-високо pH). Това се дължи на няколко специфични за него фактора. Един от тях са по-високите температури. Вследствие от тях изпаряването на вода е по-бързо. Те също имат значение и за способността на водата да поглъща CO2, по-топлите течности могат да задържат по-малко от газа. Морето също е със завишено съдържание на карбонати, които могат да формират кристали. При това се отделя CO2 и така концентрацията му във водата намалява.
Това помага за забавяне на процеса на вкисляване, но все пак pH на водата спада, като в западната част на морето това става по-бързо, отколкото в световен мащаб. Въпреки че промяната, погледната като абсолютна стойност, не е висока, трябва да се има предвид, че водните обитатели имат сравнително тесен диапазон от условия на околната среда, в който могат да се развиват.
Едни от тези организми са фораминиферите, микроскопични едноклетъчни, близки до радиолариите, които образуват защитна черупка от карбонати. Разглеждайки масата на обвивката на два вида в западната част на Средиземно море, учени са установили, че се забелязва голям спад след индустриалната революция, както и повишение в степента на нейната вариация – черупките са по-леки и отделните индивиди не са хомогенни, както се предполага в популациите им. За проследяване на масата през годините е използвано радиоизотопно датиране с помощта на няколко изотопа.
Най-вероятната хипотеза е, че промяната в масата на черупките на фораминиферите се дължи на променящите се условия в морето, като един от важните фактори е именно киселинността на водата – по-киселата среда води до по-трудно формиране и разграждане на обвивката от калциев карбонат.
Но природата е разнообразна и понякога лошите условия за един вид се оказват изключително подходящи за друг. Amphistegina lobifera е важен пясъкоформиращ вид, който се развива много добре в топли и бедни на хранителни вещества води. След като изчезва от Средиземно море преди около 6 млн. години, след построяването на Суецкия канал той се завръща от Червено море.
Оказва се, че видът е изключително пригоден за сегашните условия – издържа на по-широк температурен диапазон, има способността да се хибернира и създава междинна черупка от магнезиев карбонат, която е по-устойчива на киселинна среда. Всичко това води до бързото нарастване на неговите популации, което дори повдига дискусия дали трябва да бъде определен като инвазивен.
Дори да е така, той може да се окаже изключително ценен за държавите, близо до чиито брегове се развива, защото карбонатните му черупки са материал, който се превръща в прекрасни плажове. С повишаването на морското равнище отлагането на нов материал е от изключителна важност и според учените популациите към момента са толкова големи, че най-вероятно ще могат да компенсират промяната в нивото. Отлаганията по някои брегове в Турция са около един сантиметър годишно, а сегашните нива на покачване на морското равнище се определят на половин сантиметър годишно. Друга добра новина е, че според наличната информация видът ще продължи да процъфтява в региона още дълго – той е еволюирал в сходни условия и сега се завръща в позната среда.
Amazon EMR Serverless observability, Part 1: Monitor Amazon EMR Serverless workers in near real time using Amazon CloudWatch
Post Syndicated from Kashif Khan original https://aws.amazon.com/blogs/big-data/amazon-emr-serverless-observability-part-1-monitor-amazon-emr-serverless-workers-in-near-real-time-using-amazon-cloudwatch/
Amazon EMR Serverless allows you to run open source big data frameworks such as Apache Spark and Apache Hive without managing clusters and servers. With EMR Serverless, you can run analytics workloads at any scale with automatic scaling that resizes resources in seconds to meet changing data volumes and processing requirements.
We have launched job worker metrics in Amazon CloudWatch for EMR Serverless. This feature allows you to monitor vCPUs, memory, ephemeral storage, and disk I/O allocation and usage metrics at an aggregate worker level for your Spark and Hive jobs.
This post is part of a series about EMR Serverless observability. In this post, we discuss how to use these CloudWatch metrics to monitor EMR Serverless workers in near real time.
CloudWatch metrics for EMR Serverless
At the per-Spark job level, EMR Serverless emits the following new metrics to CloudWatch for both driver and executors. These metrics provide granular insights into job performance, bottlenecks, and resource utilization.
| WorkerCpuAllocated | The total numbers of vCPU cores allocated for workers in a job run |
| WorkerCpuUsed | The total numbers of vCPU cores utilized by workers in a job run |
| WorkerMemoryAllocated | The total memory in GB allocated for workers in a job run |
| WorkerMemoryUsed | The total memory in GB utilized by workers in a job run |
| WorkerEphemeralStorageAllocated | The number of bytes of ephemeral storage allocated for workers in a job run |
| WorkerEphemeralStorageUsed | The number of bytes of ephemeral storage used by workers in a job run |
| WorkerStorageReadBytes | The number of bytes read from storage by workers in a job run |
| WorkerStorageWriteBytes | The number of bytes written to storage from workers in a job run |
The following are the benefits of monitoring your EMR Serverless jobs with CloudWatch:
- Optimize resource utilization – You can gain insights into resource utilization patterns and optimize your EMR Serverless configurations for better efficiency and cost savings. For example, underutilization of vCPUs or memory can reveal resource wastage, allowing you to optimize worker sizes to achieve potential cost savings.
- Diagnose common errors – You can identify root causes and mitigation for common errors without log diving. For example, you can monitor the usage of ephemeral storage and mitigate disk bottlenecks by preemptively allocating more storage per worker.
- Gain near real-time insights – CloudWatch offers near real-time monitoring capabilities, allowing you to track the performance of your EMR Serverless jobs as and when they are running, for quick detection of any anomalies or performance issues.
- Configure alerts and notifications – CloudWatch enables you to set up alarms using Amazon Simple Notification Service (Amazon SNS) based on predefined thresholds, allowing you to receive notifications through email or text message when specific metrics reach critical levels.
- Conduct historical analysis – CloudWatch stores historical data, allowing you to analyze trends over time, identify patterns, and make informed decisions for capacity planning and workload optimization.
Solution overview
To further enhance this observability experience, we have created a solution that gathers all these metrics on a single CloudWatch dashboard for an EMR Serverless application. You need to launch one AWS CloudFormation template per EMR Serverless application. You can monitor all the jobs submitted to a single EMR Serverless application using the same CloudWatch dashboard. To learn more about this dashboard and deploy this solution into your own account, refer to the EMR Serverless CloudWatch Dashboard GitHub repository.
In the following sections, we walk you through how you can use this dashboard to perform the following actions:
- Optimize your resource utilization to save costs without impacting job performance
- Diagnose failures due to common errors without the need for log diving and resolve those errors optimally
Prerequisites
To run the sample jobs provided in this post, you need to create an EMR Serverless application with default settings using the AWS Management Console or AWS Command Line Interface (AWS CLI), and then launch the CloudFormation template from the GitHub repo with the EMR Serverless application ID provided as the input to the template.
You need to submit all the jobs in this post to the same EMR Serverless application. If you want to monitor a different application, you can deploy this template for your own EMR Serverless application ID.
Optimize resource utilization
When running Spark jobs, you often start with the default configurations. It can be challenging to optimize your workload without any visibility into actual resource utilization. Some of the most common configurations that we’ve seen customers adjust are spark.driver.cores, spark.driver.memory, spark.executor.cores, and spark.executors.memory.
To illustrate how the newly added CloudWatch dashboard worker-level metrics can help you fine-tune your job configurations for better price-performance and enhanced resource utilization, let’s run the following Spark job, which uses the NOAA Integrated Surface Database (ISD) dataset to run some transformations and aggregations.
Use the following command to run this job on EMR Serverless. Provide your Amazon Simple Storage Service (Amazon S3) bucket and EMR Serverless application ID for which you launched the CloudFormation template. Make sure to use the same application ID to submit all the sample jobs in this post. Additionally, provide an AWS Identity and Access Management (IAM) runtime role.
Now let’s check the executor vCPUs and memory from the CloudWatch dashboard.

This job was submitted with default EMR Serverless Spark configurations. From the Executor CPU Allocated metric in the preceding screenshot, the job was allocated 396 vCPUs in total (99 executors * 4 vCPUs per executor). However, the job only used a maximum of 110 vCPUs based on Executor CPU Used. This indicates oversubscription of vCPU resources. Similarly, the job was allocated 1,584 GB memory in total based on Executor Memory Allocated. However, from the Executor Memory Used metric, we see that the job only used 176 GB of memory during the job, indicating memory oversubscription.
Now let’s rerun this job with the following adjusted configurations.
| Original Job (Default Configuration) | Rerun Job (Adjusted Configuration) | |
| spark.executor.memory | 14 GB | 3 GB |
| spark.executor.cores | 4 | 2 |
| spark.dynamicAllocation.maxExecutors | 99 | 30 |
| Total Resource Utilization |
6.521 vCPU-hours 26.084 memoryGB-hours 32.606 storageGB-hours |
1.739 vCPU-hours 3.688 memoryGB-hours 17.394 storageGB-hours |
| Billable Resource Utilization |
7.046 vCPU-hours 28.182 memoryGB-hours 0 storageGB-hours |
1.739 vCPU-hours 3.688 memoryGB-hours 0 storageGB-hours |
We use the following code:
Let’s check the executor metrics from the CloudWatch dashboard again for this job run.

In the second job, we see lower allocation of both vCPUs (396 vs. 60) and memory (1,584 GB vs. 120 GB) as expected, resulting in better utilization of resources. The original job ran for 4 minutes, 41 seconds. The second job took 4 minutes, 54 seconds. This reconfiguration has resulted in 79% lower cost savings without affecting the job performance.
You can use these metrics to further optimize your job by increasing or decreasing the number of workers or the allocated resources.
Diagnose and resolve job failures
Using the CloudWatch dashboard, you can diagnose job failures due to issues related to CPU, memory, and storage such as out of memory or no space left on the device. This enables you to identify and resolve common errors quickly without having to check the logs or navigate through Spark History Server. Additionally, because you can check the resource utilization from the dashboard, you can fine-tune the configurations by increasing the required resources only as much as needed instead of oversubscribing to the resources, which further saves costs.
Driver errors
To illustrate this use case, let’s run the following Spark job, which creates a large Spark data frame with a few million rows. Typically, this operation is done by the Spark driver. While submitting the job, we also configure spark.rpc.message.maxSize, because it’s required for task serialization of data frames with a large number of columns.
After a few minutes, the job failed with the error message “Encountered errors when releasing containers,” as seen in the Job details section.

When encountering non-descriptive error messages, it becomes crucial to investigate further by examining the driver and executor logs to troubleshoot further. But before further log diving, let’s first check the CloudWatch dashboard, specifically the driver metrics, because releasing containers is generally performed by the driver.

We can see that the Driver CPU Used and Driver Storage Used are well within their respective allocated values. However, upon checking Driver Memory Allocated and Driver Memory Used, we can see that the driver was using all of the 16 GB memory allocated to it. By default, EMR Serverless drivers are assigned 16 GB memory.
Let’s rerun the job with more driver memory allocated. Let’s set driver memory to 27 GB as the starting point, because spark.driver.memory + spark.driver.memoryOverhead should be less than 30 GB for the default worker type. park.rpc.messsage.maxSize will be unchanged.
The job succeeded this time around. Let’s check the CloudWatch dashboard to observe driver memory utilization.


As we can see, the allocated memory is now 30 GB, but the actual driver memory utilization didn’t exceed 21 GB during the job run. Therefore, we can further optimize costs here by reducing the value of spark.driver.memory. We reran the same job with spark.driver.memory set to 22 GB, and the job still succeeded with better driver memory utilization.
Executor errors
Using CloudWatch for observability is ideal for diagnosing driver-related issues because there is only one driver per job and driver resources used is the actual resource usage of the single driver. On the other hand, executor metrics are aggregated across all the workers. However, you can use this dashboard to provide only an adequate amount of resources to make your job succeed, thereby avoiding oversubscription of resources.
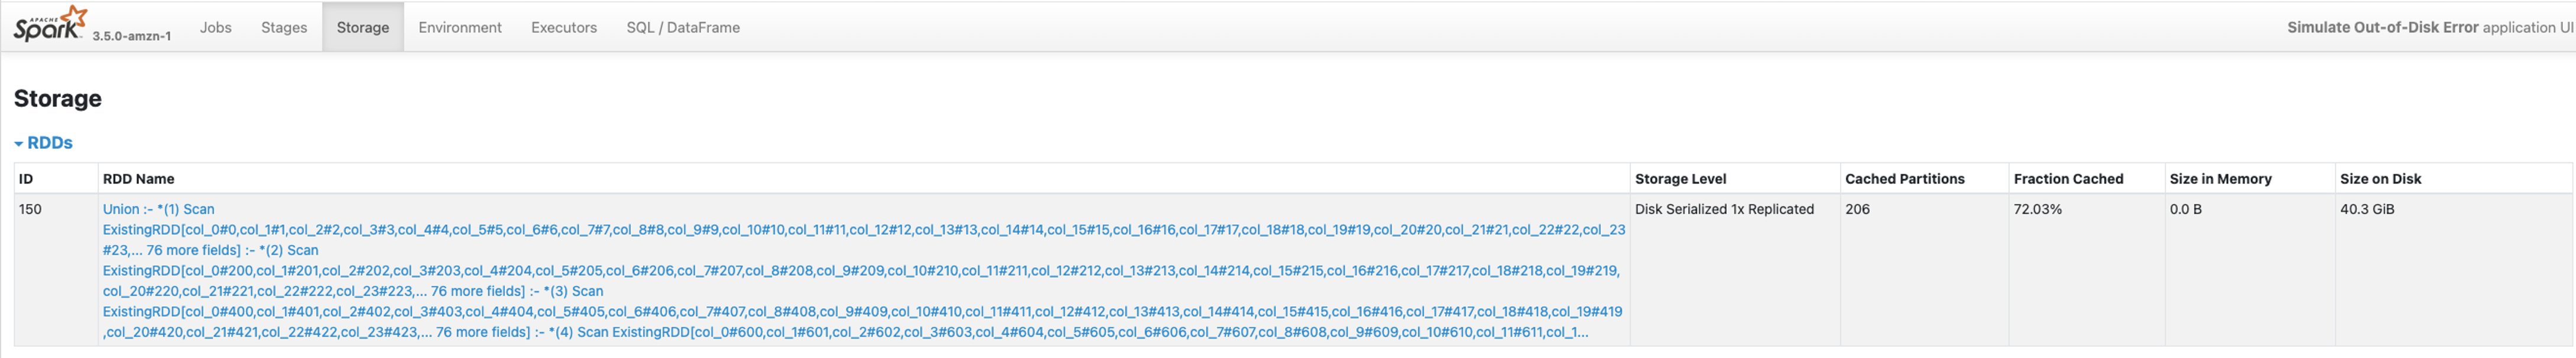
To illustrate, let’s run the following Spark job, which simulates uniform disk over-utilization across all workers by processing very large NOAA datasets from several years. This job also transiently caches a very large data frame on disk.
After a few minutes, we can see that the job failed with “No space left on device” error in the Job details section, which indicates that some of the workers have run out of disk space.

Checking the Running Executors metric from the dashboard, we can identify that there were 99 executor workers running. Each worker comes with 20 GB storage by default.

Because this is a Spark task failure, let’s check the Executor Storage Allocated and Executor Storage Used metrics from the dashboard (because the driver won’t run any tasks).

As we can see, the 99 executors have used up a total of 1,940 GB from the total allocated executor storage of 2,126 GB. This includes both the data shuffled by the executors and the storage used for caching the data frame. We don’t see the full 2,126 GB being utilized from this graph because there might be a few executors out of the 99 executors that weren’t holding much data when the job failed (before these executors could start processing tasks and store the data frame chunks).
Let’s rerun the same job but with increased executor disk size using the parameter spark.emr-serverless.executor.disk. Let’s try with 40 GB disk per executor as a starting point.
This time, the job ran successfully. Let’s check the Executor Storage Allocated and Executor Storage Used metrics.

Executor Storage Allocated is now 4,251 GB because we’ve doubled the value of spark.emr-serverless.executor.disk. Although there is now twice as much aggregated executors’ storage, the job still used only a maximum of 1,940 GB out of 4,251 GB. This indicates that our executors were likely running out of disk space only by a few GBs. Therefore, we can try to set spark.emr-serverless.executor.disk to an even lower value like 25 GB or 30 GB instead of 40 GB to save storage costs as we did in the previous scenario. In addition, you can monitor Executor Storage Read Bytes and Executor Storage Write Bytes to see if your job is I/O intensive. In this case, you can use the Shuffle-optimized disks feature of EMR Serverless to further enhance your job’s I/O performance.
The dashboard is also useful to capture information about transient storage used while caching or persisting the data frames, including spill-to-disk scenarios. The Storage tab of Spark History Server records any caching activities, as seen in the following screenshot. However, this data will be lost from Spark History Server after the cache is evicted or when the job finishes. Therefore, Executor Storage Used can be used to do an analysis of a failed job run due to transient storage issues.
In this particular example, the data was evenly distributed among the executors. However, if you have a data skew (for, example only 1–2 executors out of 99 process the most amount of data, and as a result, your job runs out of disk space), the CloudWatch dashboard won’t accurately capture this scenario because the storage data is aggregated across all the executors for a job. For diagnosing issues at the individual executor level, we need to track per-executor-level metrics. We explore more advanced examples of how per-worker-level metrics can help you identify, mitigate, and resolve hard-to-find issues through EMR Serverless integration with Amazon Managed Service for Prometheus.
Conclusion
In this post, you learned how to effectively manage and optimize your EMR Serverless application using a single CloudWatch dashboard with enhanced EMR Serverless metrics. These metrics are available in all AWS Regions where EMR Serverless is available. For more details about this feature, refer to Job-level monitoring.
About the Authors
 Kashif Khan is a Sr. Analytics Specialist Solutions Architect at AWS, specializing in big data services like Amazon EMR, AWS Lake Formation, AWS Glue, Amazon Athena, and Amazon DataZone. With over a decade of experience in the big data domain, he possesses extensive expertise in architecting scalable and robust solutions. His role involves providing architectural guidance and collaborating closely with customers to design tailored solutions using AWS analytics services to unlock the full potential of their data.
 Veena Vasudevan is a Principal Partner Solutions Architect and Data & AI specialist at AWS. She helps customers and partners build highly optimized, scalable, and secure solutions; modernize their architectures; and migrate their big data, analytics, and AI/ML workloads to AWS.
This is Intel Clearwater Forest the Next-Gen E-Core Xeon
Post Syndicated from John Lee original https://www.servethehome.com/this-is-intel-clearwater-forest-the-next-gen-e-core-xeon/
Intel Clearwater Forest is the next generation E-core Xeon that is set to incorporate 18A and advanced packaging in 2025. We have photos
The post This is Intel Clearwater Forest the Next-Gen E-Core Xeon appeared first on ServeTheHome.
[$] Debian changes OpenSSH packaging
Post Syndicated from jzb original https://lwn.net/Articles/991088/
In the wake of the XZ
backdoor, the Debian project has revisited some of the
patches included in its OpenSSH
packages to improve security. The outcome of this is that the project
will be splitting out support for Kerberos key exchange into a
separate set of packages, though not until after the Debian 13
(“trixie”) release expected next year. The impact on Debian users
should be minimal, but it is an interesting look into the changes
Linux distributions make to upstream software as well as some of the
long-term consequences of those choices.
Седмото пришествие на същите
Post Syndicated from Емилия Милчева original https://www.toest.bg/sedmoto-prishestvie-na-syshtite/

Изглежда, че в българските избиратели още се крие жилав като плевел оптимизъм, щом реденето на листите за седмите за три години парламентарни избори предизвиква интерес – макар изборите да не са важни за гражданите, ако се съди по активността за гласуване. Вместо натиск върху политиците да не шикалкавят, а да дадат честни отговори за коалиране, вървят гадания като на хвърлен боб кой е в немилост и кой – фаворит, като че ли подредбата има значение за някой друг освен за самите кандидат-депутати и за вождовете, поставили ги там.
Колко е представителна демокрацията
В крайна сметка, колкото и да влязат в парламента, ще имат по-силна връзка с партийната централа, отколкото с избирателния си район. Защо ли не ги наричат партийни вместо народни представители? В крайна сметка партията ги спуска или отстранява, поради което връзката между депутата и района, който представлява, в повечето случаи е прекъсната. Нововъведението на ГЕРБ – да издига за водачи успешни кметове с по 4–5 мандата, които след това ще се оттеглят в общините си и ще оставят следващите в листите, е мюре за електората и недотам честно.
В българската политика е практика и политиците да водят по две листи, както и да сменят избирателните си райони за всеки вот. А именно свързаността на депутата с избирателния му район е важен елемент от функционирането на представителната демокрация. Личната ангажираност винаги дава по-силна мотивация за решаване на проблемите.
Ако депутатът има силна връзка с избирателния си район, той е по-добре запознат с местните проблеми, нужди и приоритети. Когато е в редовен контакт с хората от региона, е подложен на по-пряк контрол, тъй като се създава механизъм за обратна връзка. Избирателите мога да държат отговорен „своя“ депутат дали и как изпълнява обещанията си. Народният представител също ще е по-полезен на общността, като насочва ресурси и участва в създаването на закони, които отговарят на реалните ѝ нужди.
Ако тези механизми работят, избирателите знаят, че гласът им е чут и техните проблеми са взети под внимание, което е от съществено значение за поддържането на легитимността на демократичните институции. В началото на българския Преход, когато дори не функционираха демократични институции, депутатите имаха много по-здрави връзки с избирателните си райони и избягваха да пропускат приемните си дни.
Впоследствие тези контакти изтъняха, а платформи като Facebook и YouTube станаха основни канали за комуникация между избраници и избиращи, което прави връзките по-малко лични и много по-масови, едностранчиви и по-скоро имиджови, отколкото ефективни.
С изключение на Ахмед Доган и Делян Пеевски, всички лидери на парламентарно представените партии се скупчиха в трите избирателни района в София, осигуряващи общо 46 мандата. Тази софиоцентричност, която се проявява не само в най-голямото население, най-голямата икономическа активност и най-високите средни заплати, взема връх и в парламентарната конкуренция.
ГЕРБ заложи на фундамента си
Монополист в местната власт, ГЕРБ заложи на няколко кметове за водачи – от една страна, символно, от друга – практично в стремежа да постигне целта от 80 депутати в 51-вия парламент. За разлика от изпълнителната власт, където редовни и служебни правителства се редуват за по 6–7 месеца, местната стои стабилно и харчи милионите, одобрени с бюджета за 2024 г. Инвестиционната програма на общините за периода 2024–2026 г., гласувана от парламента към бюджета, е за 6,2 млрд. лв. Само за 2024 г. средствата са 4,5 млрд. лв. Така, докато е в ход дестабилизацията на парламентарната република, доминираната от ГЕРБ и от доскоро единното ДПС местна власт е осигурена, а значи и свързаните с нея бизнеси.
За кметове като Живко Тодоров (Стара Загора) и Димитър Николов (Бургас), изкарали по няколко мандата, преутвърждаването им като регионални лидери няма да е проблем. За кмета на Смолян Николай Мелемов, който трудно спечели своя четвърти пореден мандат, ще е изпитание. В Пловдив-град кметът Костадин Димитров е втори след лидера Бойко Борисов, който и заяви, че се разчита „да привлече гласове и да бъде част от витрината за постиженията на партията“.
В София бившата кметица Йорданка Фандъкова е водач на листата в 24-ти МИР на фона на остра кампания срещу настоящия кмет Васил Терзиев (ПП–ДБ–„Спаси София“) и неуспехите му да се справи с наследството на ГЕРБ – над 20-те милиона задължения на столичния градски транспорт, конфликта с местни общности заради проекта на ул. „Опълченска“, лошата комуникационна политика и др.
ПП–ДБ залага на София
Значението, което в коалицията отдават на София, където печелят най-много гласове и депутатски места, особено силно проличава при настоящото разпределение на листите без значими промени. Целта обаче е да си върнат поне 100 000 избиратели, след като изгубиха три пъти повече на вота на 9 юни.
В ПП–ДБ така и не успяха да се споразумеят по искането на „Да, България“ за нови критерии и механизми за номинации, при които да имат тежест свършената работа, отварянето към гражданското общество и разпознаваемостта. Предимството отново е на страната на „Продължаваме промяната“, която има водачи в двайсет многомандатни избирателни района, „Да, България“ – в пет, а партньорът ѝ в „Демократична България“ (ДБ) – ДСБ, получава три челни места.
В ДБ залагат на изпитаната тактика на гласуване с преференции, която обикновено пренарежда листите. В Пловдив-град например издателят Манол Пейков е четвърти в листата на ПП–ДБ, но е лидер по преференции досега. Първи в пловдивската листа е съпредседателят на ПП Асен Василев, втори е председателят на Правната комисия Стою Стоев, също от ПП, трета е Катя Панева от ДБ. Във Варна начело отново е Даниел Лорер от ПП, но на предишните избори Стела Николова от ДБ, тогава четвърта, пренареди листата със своите 3280 гласа подкрепа, или 16% от всички гласове за ПП–ДБ.
Политици, знакови за ДБ, няма да водят листи – Ивайло Мирчев и Божидар Божанов са в софийските листи, но не на първите позиции, докато Атанас Атанасов е втори в една от тях, а Антоанета Цонева е трета в Бургас, което почти сигурно я оставя и извън парламента. Цонева, която беше водач в Разград на предишния вот, бе изместена с преференции от Джипо Джипов, а сега той е водач. Синът на Никола Джипов Николов, председател на Икономическата комисия по времето на Иван Костов, е предприемач в региона и трети мандат общински съветник в Разград.
ДПС се бори със себе си
Разцепеното Движение за права и свободи ще води битка със… себе си. ДПС – Ново начало и Алиансът за права и свободи ще сблъскат местни активисти и кметове, преминали в единия или в другия лагер. В най-силния за ДПС район – Кърджали, осигуряващ пет мандата, трима кметове, верни на Делян Пеевски – на Кърджали, Черноочене и Джебел, се изправят срещу депесарите на Доган, силни в другите четири общини – Ардино, Момчилград, Крумовград и Кирково.
Конфликтът в района, където е най-голямата организация на ДПС, ще е особено остър предвид факта, че центърът Кърджали премина към олигарха, партийна креатура на почетния председател Ахмед Доган. Самият Доган води листата в Кърджали, а срещу него е кметът първи мандат Ерол Мюмюн, когото „изпитваше“ миналия септември в Сараите заедно с Хасан Азис. Ходът да се изправи Мюмюн е доста символен – той се опитва да убеди избирателите, че именно с него се слага ново начало за Кърджали с ремонтите на улици и разчистването на дълговете от Азис.
В Бургас листата на ДПС – Ново начало води бившият кмет на община Руен – Исмаил Осман. От тази община са и повечето гласове за ДПС в района. След него е бившият вътрешен министър Калин Стоянов, който обаче е и водач на листата на ДПС – Ново начало в София-област – обещание, дадено му по-рано от самия Пеевски.
Иначе нищо ново в кампанията на двете ДПС-та. Доган пак напомня за Възродителния процес, Пеевски обещава възмездие за същото и двамата горещо уверяват, че ще работят за хората. Но всеки опит на Доган да омаловажи ролята си в създаването на феномена „Пеевски“ е комичен, както е комичен и опитът да дистанцира ДПС от зависимостите в съдебната система. Контролът на това задкулисие обаче засега остава в ръцете на Пеевски, доказателство за което са акциите на прокуратурата и Антикорупционната комисия срещу кметове, останали верни на Доган и свитата му.
Един от проблемите за лагера на Доган е, че старите „автентични“ лица на ДПС досега оставяха изборите в ръцете на Пеевски и кръга му, а сега ще им се наложи да правят кампания.
Разцеплението в ДПС обаче намали значително конкуренцията за второто място, оспорвано още от предишните избори. Тогава ДПС, ръководено от Делян Пеевски, се класира второ. Сега битката ще е между ПП–ДБ и „Възраждане“. Националпопулистите обаче ще бъдат отслабени заради „Величие“ и МЕЧ, които се борят да прескочат 4-процентовата бариера и са на терена за един и същи електорат. За парченце от него ще се борят, доколкото им е по силите със заявените ретролисти, и БСП и трудно скрепената коалиция.
Всички те се надяват на участие в едно бъдещо управление, където им се привиждат властови позиции и порции. По-далечни стратегии засега няма, само опити да е още от същото.
Губи ли Америка стратегическата си инициатива, или по-скоро я възражда?
Post Syndicated from Искрен Иванов original https://www.toest.bg/gubi-li-america-strategicheskata-si-initsiativa-ili-po-skoro-ya-vuzrajda/

Системата на международните отношения днес отразява две противоречащи си реалности, които дават повод на много анализатори да говорят за залеза на Америка и за края на „американския век“. От една страна, това се дължи на възпламеняването на регионални конфликти и глобални кризи, които бяха приспани след края на Студената война. А от друга – на стремежа на САЩ да съхрани глобалния либерален ред и системата от съюзи, които създаде след края на Втората световна война.
Деклинизмът като феномен не е ново явление в американската политическа реалност и най-общо изразява идеята, че упадъкът на Америка, на нейния модел и на глобално ѝ лидерство са неизбежни, предстоящи, а в някои случаи – дори необходими.
И все пак къде се крият корените на деклинизма и дали днес сме свидетели на този упадък, за който говорят поколения от автори и политици? Обречен ли е американският модел и какво кара толкова много хора все още да гледат към него като към най-предпочитаната форма на обществено-политически отношения? Струва си да си зададем и въпроса защо, след като политическото семейство на т.нар. недемокрации е толкова голямо, то все пак не може да представи културно-исторически образци, които да сплотят човечеството зад идеи, по-устойчиви от тези на либералната демокрация? Отговорите на поставените въпроси ще се опитаме да потърсим в този анализ.
Деклинизмът в САЩ като политическа реалност
Учените с безспорен принос към теорията на международните отношения, като бащата на меката сила Джоузеф Най и автора на цивилизационната теория Самюъл Хънтингтън, приемат, че деклинизмът е присъщ не просто на САЩ, но и на всяка велика сила, която обективно се старае да осъзнае границите на своята мощ.
Ето защо трудно бихме приели, че деклинизмът е модерна политическа реалност, и смело може да кажем, че в Америка той датира не от Голямата депресия, както твърдят много автори, а от самото възникване на САЩ. Американският проект в своята същност инкорпорира деклинизма като опция за развитието си най-малкото защото първият опит за конституция на младата държава – т.нар. Устав на Конфедерацията, се проваля с гръм и трясък. Последван е от Конституцията на САЩ, която задава основите на едно устойчиво държавно-политическо обединение, което коренно се отличава от автократичния модел на европейските колониални империи.
Сходен е историческият казус с Гражданската война в САЩ и опитите на робовладелците да запазят привилегирования си статут, превърнал ги в потомствени аристократи. И въпреки че тогава мнозина се съмняват в оцеляването на Америка, тя възкръсва от това разделение много по-силна и по-единна, отколкото в първите години на своето съществуване.
Годините след Испанско-американската война (1898), която поставя началото на модерната американска дипломация, също не са леки за американците. Изолационистката фракция в САЩ чертае черни сценарии в Конгреса, предупреждавайки, че всяка намеса в европейските конфликти може да коства на Америка нейната независимост. По подобен начин се държат и авторите на много расистки закони, които виждат в доктрините на президентите Теодор Рузвелт и Хауърд Тафт заплаха за националната сигурност заради политиката на доларовата дипломация, която постепенно започва да измества европейците от икономическите им позиции в Далечния изток. Иронично, но мнозина от авторите на тези закони по-късно ще подкрепят Конгреса на САЩ в решението му да обяви война на Централните сили.
И макар изолационисткият дух да става особено популярен по време на Голямата депресия, когато хиляди американци губят собствеността си, президентът Франклин Рузвелт ще открие, че най-прагматичният начин Америка да бъде съживена е включването ѝ във Втората световна война, което ѝ позволява по-късно да закрепи стойността на банкрутиралия щатски долар към тази на златото.
За разлика от годините на Студената война, когато външнополитическият дебат в Америка изобщо изключва изолационистката линия, днес в САЩ се появиха много радетели на тази политика, някои от които поразително приличат на своите предшественици от времената на Конфедерацията и Голямата депресия. Сред тях се открояват имената на Кристофър Лейн, Чарлс Купчан и Иън Бремър, които – въпреки различията в подходите си – застъпват тезата, че краят на еднополюсния модел неизбежно ще доведе и до упадъка на Америка като велика сила.
Общото между тези автори е, че те приемат САЩ като хегемон, който се опитва да наложи свой модел на развитие в глобалната политика, а различното – че всеки от тях има своя визия за това какво ще замени Pax Americana. Подобни разсъждения се приемат с охота от много китайски учени, европейски популисти и крайнодесни фракции в Америка, чиято цел е да докажат, че времето на американския модел изтича и той трябва да бъде заменен с някаква утопична форма на мирно съжителство, в която всеки да избира сам пътя на своето геополитическо развитие. Утопична, защото, от една страна, историята на човечеството сочи, че хората много повече обичат да воюват, отколкото да живеят в мир, а от друга – тъй като в условията на една анархична международна система без глобален център на власт основното, което движи отношенията между държавите, е конкуренцията.
В упадък ли е Америка?
Твърдението, че краят на еднополюсния модел и на американското глобално лидерство са двете страни на една и съща монета, звучи убедително, но и крайно подвеждащо. Причината е, че много деклинисти възприемат твърдата и меката сила на САЩ като тясно свързани със способността им да проектират влиянието си в глобалната политика. Пример в това отношение е Студената война, по време на която светът е двуполюсен във военно-стратегическо отношение, но еднополюсен в икономическо, защото повече от половината световни разплащания се извършват в щатски долари. Това дава повод на много анализатори от школата на структурния реализъм, като Робърт Джървис и Кенет Уолц, да твърдят, че въпреки ядрения паритет между суперсилите съветският експеримент е обречен на провал, тъй като плановата икономика изкуствено потиска свободата на инициатива и пазара.
През 70-те години на миналия век Джак Снайдър – преподавател в Колумбийския университет в Ню Йорк, дори измисля понятието „стратегическа култура“, сравнявайки културата на СССР с тази на САЩ. Резултатите от неговото изследване, по-късно използвани от ЦРУ в стратегиите им за контраразузнаване, доказват, че пазарната икономика е двигателят на свободата в САЩ, а социалистическият модел ограничава гражданите в тяхното развитие, което не позволява на съветския лагер да разгърне пълния си потенциал в икономическо и културно отношение. Най-голямото доказателство за теорията на Снайдър идва през 1992 г., когато СССР се разпада, а по-голямата част от социалистическия блок тръгва по пътя на демокрацията и пазарния модел.
Казано с други думи, еднополюсният модел от 90-те години на миналия век наистина вече не съществува, но самият характер на еднополюсността също се е променил значително по три основни причини.
Първата е възходът на Китай, който се дължи най-вече на факта, че социализмът с китайски характеристики отразява функционирането на държавен тип капитализъм, който способства за развитието на средната класа и формира устойчив модел на политическо поведение, колкото и авторитарно да е то.
Втората причина е завръщането на руския неоимпериализъм, който през 90-те години на миналия век беше потиснат от плахата европейска надежда, че след разпада на СССР Русия може да се превърне в истинска демокрация. Уви, това не стана, защото Кремъл предпочете да вложи ресурсите на страната в изграждането на мощна олигархия, вместо да ги инвестира в един по-добър живот за руснаците.
Новата олигархична класа стимулира сериозна вълна от национализъм, която намери своя завършен израз в стремежа да се възстанови Съветската империя с аргумента, че разпадът ѝ е най-голямата геополитическа катастрофа на XX в.
И трето, широкото разтваряне на ножицата между много богати и бедни в развитите демокрации стана причина голяма част от крайнодесните и популистките движения в САЩ и Европа да надигнат глава и да поставят под въпрос ценностите на либералната демокрация.
На фона на тези три геополитически реалности еднополюсният модел наистина се свива, но неговият характер, неговата природа изначално остават същите. Или по-просто казано: кой диктува правилата в глобалната политика, се определя от три неща – оръжия, култура, икономика.
Във военно-стратегическо отношение САЩ имат само един сериозен опонент – Китай, и то все още не се знае доколко това твърдение е основателно предвид факта, че не сме виждали как работят китайските технологии на бойното поле. Учени като Греъм Алисън например лансират тезата, че за военнотехнологичен паритет между САЩ и Китай може да се говори едва когато установим каква е боеспособността на Пекин.
Оставяме настрани явното нежелание на Китай да воюва с Америка и голямото подозрение, с което той гледа на дружбата между Русия и Северна Корея. В икономическо отношение Америка е образец за това как функционира невидимата ръка на пазара, и последните завои в нейната ценностна политика са най-голямото доказателство за това.
Свободата, която излъчва американският икономически модел, се състои в принципа на равния старт, даващ възможност на всеки гражданин да реализира пълния си потенциал, както и да понесе отговорността, в случай че продуктът – било то научен, политически или какъвто и да е – не се продава на пазара.
Единственото предизвикателство в това отношение е кризата на средната класа, но по този проблем се работи усърдно и систематично. Първата стъпка вече беше направена с плана на администрацията на Байдън да обложи богатите с 25% корпоративен данък, който да бъде заделен в полза на семействата, получаващи доходи на средна класа. Нещо повече, за разлика от китайската средна класа, американската разполага с правата и свободите, които са ѝ гарантирани от Конституцията и дават право на гражданите сами да избират политиците си. Тук с пълна тежест важи и един факт, който се подценява от много привърженици на т.нар. алтернативни системи – че китайската средна класа е пряко зависима от американската. Икономиките на двете страни са свързани и точно поради тази причина Вашингтон и Пекин все още не са във война помежду си.
Културата като символ на американското глобално лидерство
Културата е основната променлива, която придава легитимност на политиката на Великите сили именно защото тя предопределя външнополитическата им философия. Проблемите, с които се сблъскват САЩ, не са малко, но устойчивият характер на американската демокрация ѝ помага значително лесно да балансира периодите на сътресения в страната. Най-значимото предизвикателство в това отношение е поляризацията на обществото в Америка и най-вече изборът на Доналд Тръмп за американски президент, довело до зараждането на радикални фракции, чийто стремеж беше да извършат своеобразна културна революция в страната.
Допълните ефекти обаче дойдоха дори по-рано – при администрацията на Обама, когато Русия се възползва от затрудненията, които САЩ изпитваха в Близкия изток с ИДИЛ, и индиректно започна да всява разделение в американското общество с помощта на дезинформация. Тази стратегия кулминира в избирането на Тръмп за първи президентски мандат и в появата на популистки лидери в Европа, които се сплотиха около кандидатурата му за втори мандат. Ефектите бяха смекчени от администрацията Байдън–Харис, която успешно постигна целта си да бъде обединител за американците след събитията от 6 януари 2021 г.
Въпреки огромните сътресения, които преживяха САЩ, и тежките щети върху авторитета им, краят на Pax Americana така и не дойде. Осъзнатият елит в Америка предприе бързи крачки към изграждането на нови културни парадигми, които да сплотят Запада срещу опитите на автокрациите да започнат нова Студена война, а идеологиите на алтернативата в крайна сметка се оказаха привлекателни единствено за реваншистки актьори като Иран и Северна Корея, които искат да си отмъстят на САЩ.
За разлика от демократичния лагер, който е обединен от общи ценности, тоталитарният е воден единствено от идеята да ревизира Pax Americana. Като изключим това, той представлява разнородно семейство от режими, които коренно се различават помежду си като стратегически култури и нагласи.
Ето защо той е относително неспособен да постигне координация и да излъчи единни културно-политически образци, които да са алтернатива на либералната демокрация.
Американската култура, от друга страна, продължава да генерира визията за свят, основан на правила, които произтичат не от закона на джунглата, а от човешките права, демокрацията и равенството между хората. Тези ценности може и да не могат да бъдат приложени универсално, както смяташе Фукуяма, но са единствените, които са в състояние да гарантират човешкото достойнство и – доколкото това е възможно – мирното съществуване на човешката цивилизация. Макар и несъвършена като лидер, Америка е единствената велика сила, която може да понесе тази мисия, защото в най-голяма степен олицетворява стремежа на хората да бъдат истински свободни.
И така, отговорът на изначалния въпрос е: не, Америка не губи стратегическата си инициатива. Тя я възражда, защото, за разлика от останалите политически семейства, демокрациите имат механизми, чрез които да коригират политиката си тогава, когато допускат грешки. Гражданската война, Голямата депресия, Виетнамската война, Ирак и Афганистан… Това са само част от примерите за моменти, в които САЩ падат и отново се изправят, тъй като отказват да се предадат и да предадат доверието на своите съюзници.
Същото става и в момента, когато войната в Украйна обединява политически и ценностно демокрациите, и то не просто европейските, но и голяма част от азиатските. Мощният външнополитически заряд, който излъчва културата на САЩ, съчетаващ американския ядрен чадър, свободата на пазарния модел и защитата на човешките права, направи много от европейските и азиатските съюзници на Вашингтон преуспяващи и свободни държави, чиято сигурност Америка разглежда и гарантира като част от своята.
И обратно, много страни, които избират да бъдат партньори на автокрациите, се превръщат в хибридни режими с власт, почиваща не върху правилата, а върху силата. Не за друго, а защото майките автокрации не се интересуват как живеят съюзниците им, а доколко са им лоялни.
Финалният въпрос е защо тогава САЩ не направят света истински свободен, а отговорът е философски. Защото не можеш да накараш никого да бъде насила свободен. Да избереш автокрацията пред демокрацията е уви, съзнателен избор, който Америка винаги е уважавала и ще уважава. Да си американски съюзник обаче не е въпрос на патриотична гордост или пасивна привилегия. Това е отговорност, при която няма място за самосъжаление и компромиси. Демокрацията е борба, и то постоянна. Но за разлика от онази утопична борба, която проповядва марксизъм-ленинизмът и която дели човечеството на класи, либералната демокрация, зачената в САЩ, е тази, която примирява класовата борба и дава на хората онова, което те наистина заслужават – правото на добър, достоен и свободен живот.
Security updates for Friday
Post Syndicated from daroc original https://lwn.net/Articles/992030/
Security updates have been issued by Debian (chromium and trafficserver), Fedora (chromium), Mageia (apache-mod_jk, gnome-shell, kernel, kmod-xtables-addons, and kmod-virtualbox, kernel-linus, and python3), Oracle (container-tools:ol8, dovecot, emacs, expat, firefox, git-lfs, gtk3, kernel, nano, net-snmp, osbuild-composer, python3, python3.11, python3.12, ruby:3.3, and virt:ol and virt-devel:rhel), Slackware (boost), SUSE (kernel), and Ubuntu (configobj, cups, cups-browsed, cups-filters, libcupsfilters, and libppd).
Expanding Cloudflare’s support for open source projects with Project Alexandria
Post Syndicated from Veronica Marin original https://blog.cloudflare.com/expanding-our-support-for-oss-projects-with-project-alexandria
At Cloudflare, we believe in the power of open source. It’s more than just code, it’s the spirit of collaboration, innovation, and shared knowledge that drives the Internet forward. Open source is the foundation upon which the Internet thrives, allowing developers and creators from around the world to contribute to a greater whole.
But oftentimes, open source maintainers struggle with the costs associated with running their projects and providing access to users all over the world. We’ve had the privilege of supporting incredible open source projects such as Git and the Linux Foundation through our open source program and learned first-hand about the places where Cloudflare can help the most.
Today, we’re introducing a streamlined and expanded open source program: Project Alexandria. The ancient city of Alexandria is known for hosting a prolific library and a lighthouse that was one of the Seven Wonders of the Ancient World. The Lighthouse of Alexandria served as a beacon of culture and community, welcoming people from afar into the city. We think Alexandria is a great metaphor for the role open source projects play as a beacon for developers around the world and a source of knowledge that is core to making a better Internet.
This project offers recurring annual credits to even more open source projects to provide our products for free. In the past, we offered an upgrade to our Pro plan, but now we’re offering upgrades tailored to the size and needs of each project, along with access to a broader range of products like Workers, Pages, and more. Our goal with Project Alexandria is to ensure every OSS project not only survives but thrives, with access to Cloudflare’s enhanced security, performance optimization, and developer tools — all at no cost.
Building a program based on your needs
We realize that open source projects have different needs. Some projects, like package repositories, may be most concerned about storage and transfer costs. Other projects need help protecting them from DDoS attacks. And some projects need a robust developer platform to enable them to quickly build and deploy scalable and secure applications.
With our new program we’ll work with your project to help unlock the following based on your needs:
-
An upgrade to a Cloudflare Pro, Business, or Enterprise plan, which will give you more flexibility with more Cloudflare Rules to manage traffic with, Image Optimization with Polish to accelerate the speed of image downloads, and enhanced security with Web Application Firewall (WAF), Security Analytics, and Page Shield, to protect projects from potential threats and vulnerabilities.
-
Increased requests to Cloudflare Workers and Pages, allowing you to handle more traffic and scale your applications globally.
-
Increased R2 storage for builds and artifacts, ensuring you have the space needed to store and access your project’s assets efficiently.
-
Enhanced Zero Trust access, including Remote Browser Isolation, no user limits, and extended activity log retention to give you deeper insights and more control over your project’s security.
Every open source project in the program will receive additional resources and support through a dedicated channel on our Discord server. And if there’s something you think we can do to help that we don’t currently offer, we’re here to figure out how to make it happen.
Many open source projects run within the limits of Cloudflare’s generous free tiers. Our mission to help build a better Internet means that cost should not be a barrier to creating, securing, and distributing your open source packages globally, no matter the size of the project. Indie or niche open source projects can still run for free without the need for credits. For larger open source projects, the annual recurring credits are available to you, so your money can continue to be reinvested into innovation, instead of paying for infrastructure to store, secure, and deliver your packages and websites.
We’re dedicated to supporting projects that are not only innovative but also crucial to the continued growth and health of the internet. The criteria for the program remain the same:
-
Operate solely on a non-profit basis and/or otherwise align with the project mission.
-
Be an open source project with a recognized OSS license.
If you’re an open source project that meets these requirements, you can apply for the program here.
Empowering the Open Source community
We’re incredibly lucky to have open source projects that we admire, and the incredible people behind those projects, as part of our program — including the OpenJS Foundation, OpenTofu, and JuliaLang.
OpenJS Foundation
Node.js has been part of our OSS Program since 2019, and we’ve recently partnered with the OpenJS Foundation to provide technical support and infrastructure improvements to other critical JavaScript projects hosted at the foundation, including Fastify, jQuery, Electron, and NativeScript.
One prominent example of the OpenJS Foundation using Cloudflare is the Node.js CDN Worker. It’s currently in active development by the Node.js Web Infrastructure and Build teams and aims to serve all Node.js release assets (binaries, documentations, etc.) provided on their website.
Aaron Snell explained that these release assets are currently being served by a single static origin file server fronted by Cloudflare. This worked fine up until a few years ago when issues began to pop up with new releases. With a new release came a cache purge, meaning that all the requests for the release assets were cache misses, causing Cloudflare to go forward directly to the static file server, overloading it. Because Node.js releases nightly builds, this issue occurs every day.
The CDN Worker plans to fix this by using Cloudflare Workers and R2 to serve requests for the release assets, taking all the load off the static file server, resulting in improved availability for Node.js downloads and documentation, and ultimately making the process more sustainable in the long run.
OpenTofu
OpenTofu has been focused on building a free and open alternative to proprietary infrastructure-as-code platforms. One of their major challenges has been ensuring the reliability and scalability of their registry while keeping costs low. Cloudflare’s R2 storage and caching services provided the perfect fit, allowing OpenTofu to serve static files at scale without worrying about bandwidth or performance bottlenecks.
The OpenTofu team noted that it was paramount for OpenTofu to keep the costs of running the registry as low as possible both in terms of bandwidth and also in human cost. However, they also needed to make sure that the registry had an uptime close to 100% since thousands upon thousands of developers would be left without a means to update their infrastructure if it went down.
The registry codebase (written in Go) pre-generates all possible answers of the OpenTofu Registry API and uploads the static files to an R2 bucket. With R2, OpenTofu has been able to run the registry essentially for free with no servers and scaling issues to worry about.
JuliaLang
JuliaLang has recently joined our OSS Sponsorship Program, and we’re excited to support their critical infrastructure to ensure the smooth operation of their ecosystem. A key aspect of this support is enabling the use of Cloudflare’s services to help JuliaLang deliver packages to its user base.
According to Elliot Saba, JuliaLang had been using Amazon Lightsail as a cost-effective global CDN to serve packages to their user base. However, as their user base grew they would occasionally exceed their bandwidth limits and rack up serious cloud costs, not to mention experiencing degraded performance due to load balancer VMs getting overloaded by traffic spikes. Now JuliaLang is using Cloudflare R2, and the speed and reliability of R2 object storage has so far exceeded that of their own within-datacenter solutions, and the lack of bandwidth charges means JuliaLang is now getting faster, more reliable service for less than a tenth of their previous spend.
How can we help?
If your project fits our criteria, and you’re looking to reduce costs and eliminate surprise bills, we invite you to apply! We’re eager to help the next generation of open source projects make their mark on the internet.
For more details and to apply, visit our new Project Alexandria page. And if you know other projects that could benefit from this program, please spread the word!
Advancing cybersecurity: Cloudflare implements a new bug bounty VIP program as part of CISA Pledge commitment
Post Syndicated from Sri Pulla original https://blog.cloudflare.com/cisa-pledge-commitment-bug-bounty-vip
As our digital world becomes increasingly more complex, the importance of cybersecurity grows ever more critical. As a result, Cloudflare is proud to promote our commitment to the Cybersecurity and Infrastructure Security Agency (CISA) ‘Secure by Design’ pledge. The commitment is built around seven security goals, aimed at enhancing the safety of our products and delivering the most secure solutions to our customers.
Cloudflare’s commitment to the CISA pledge reflects our dedication to transparency and accountability to our customers, and to cybersecurity best practices. Furthermore, Cloudflare is committed to being a trusted partner by sharing our strategies to ensure the highest priority is placed on safeguarding our customers’ security.
Bug bounty VIP program
Cloudflare has successfully managed a public Vulnerability Disclosure Program (VDP) for years; our belief is that collaboration is the cornerstone of effective cybersecurity. We are excited to announce a major milestone in our journey to meet Goal #5 of the pledge: our program will now include a bug bounty VIP program in conjunction with our bug bounty public program.
Continuous investment in maturing our bug bounty program is a vital tool for the success of any security organization. By encouraging broader participation in vulnerability testing, we open the door to more diverse perspectives and expertise, ultimately leading to stronger, more resilient security measures. Additionally, the new VIP program will allow us greater flexibility in engaging security researchers on upcoming betas for Cloudflare products, and will allow us to award higher bounty payouts.
Our commitment to this effort underscores our belief that a safer Internet is achievable through shared responsibility and proactive engagement. The security team at Cloudflare is looking forward to implementing a more proactive approach to securing our products with the launch of the new bug bounty VIP program!
What is in scope for the new VIP program?
The new bug bounty VIP program is an exclusive hub for select security researchers who either have the specialized technical expertise in the niche areas Cloudflare is building products in (such as Cloudflare Workers) or have demonstrated a deep understanding of our products and platform by actively participating in the public program with meaningful security findings. As a VIP member, security researchers will have access to beta testing environments for Cloudflare products. This includes early access to our newest features and unannounced products before they go live.
The VIP program’s scope will be carefully modeled from Cloudflare’s product release roadmap. Security researchers will have the opportunity to influence Cloudflare’s product and security development before release. VIP program participants also have the option to participate in external/gray box penetration testing activities (Spot Checks) for higher bounties related to security findings for upcoming product releases or critical infrastructure and services.

The VIP program’s new & enhanced reward structure
We believe that exceptional contributions deserve exceptional rewards. As a result, we’ve restructured our bounty offerings for the VIP program with higher payouts. Recognizing the specialized skills and expertise required, VIP researchers will be eligible for significantly higher rewards. We have also introduced bonus rewards for high-impact findings, particularly those that address critical vulnerabilities in our beta projects through the aforementioned Spot Checks. To further incentivize meaningful contributions, security researchers in our public program will receive milestone bonuses and be invited to our VIP program based on the number and quality of their submissions over time.
|
VIP Program (Private) |
|||
|
Critical |
High |
Medium |
Low |
|
$10,000-15,000 |
$4,000-7,000 |
$1,000-3,000 |
$250-750 |
What outcomes are we driving with the new VIP program?
The VIP bug bounty program’s focus is not only finding and fixing bugs, but it’s also aimed at fostering a deeper, more impactful relationship with our security researchers. Moreover, these outcomes align well with the CISA Vulnerability Disclosure Policy (VDP) goal. By offering exclusive access to beta software and enhanced rewards, our goals are as follows:
-
Elevate security standards: VIP researchers focusing on the most critical assets allows for further hardening of the overall security posture of Cloudflare’s products and services.
-
Accelerate product development: Early identification of vulnerabilities allows the remediation of potential issues before they reach production, yielding faster, more secure, and more stable releases.
-
Foster innovation: Involving researchers in the development process creates an additional feedback loop that encourages innovative approaches to security challenges.
-
Encourage collaboration: The bug bounty team will encourage collaborative blog posts for select reports as a way to disseminate security learnings and build partnerships with researchers.
This is a great professional growth opportunity for anyone in the technical research space as it gives participants the ability to work on cutting-edge technology with complex challenges, and can provide future opportunities for career/skill development.
How does Cloudflare benefit from it?
The launch of the VIP program marks a new chapter in Cloudflare’s security journey. We are excited about the opportunity to partner more closely with our top security researchers to build safer products for customers. Together, we can achieve new heights in security excellence:
-
Stronger security: Security researchers with expertise in niche topics can help enhance Cloudflare’s defenses against emerging and novel threats.
-
Proactive risk management: The new VIP program provides Cloudflare an additional avenue to identify and mitigate risks early in the product release cycle, reducing the likelihood of future security incidents.
-
Reinforced trust: Our commitment to security is central to our customer relationships and the trust they place in Cloudflare; by continuously improving our security posture, we seek to preserve that trust.
How can you help?
If you are a software manufacturer, we encourage you to familiarize yourself with CISA’s ‘Secure by Design’ principles and create a plan to implement them in your company.
As an individual, we encourage you to participate in the Cloudflare bug bounty program and promote cybersecurity awareness in your community.
Stay tuned for more updates, and if you’re part of our public program, keep submitting those reports — you might just earn an invitation to join the VIP ranks! You can also find more updates on our blog, as we build our roadmap to meet all seven CISA Secure by Design pledge goals by May 2025!
Let’s help build a better Internet together.
Empowering builders: introducing the Dev Alliance and Workers Launchpad Cohort #4
Post Syndicated from Melissa Kargiannakis original https://blog.cloudflare.com/launchpad-cohort4-dev-starter-pack
Today we’re announcing the Dev Starter Pack, an alliance of innovative tools for developers to get started with discounts and free services. We’re also excited to share an update on our Workers Launchpad Program.
Creating from the ground up often means spending countless hours piecing together the right development stack, navigating different pricing models, and managing growing costs — all of which can take your focus away from what truly matters: building your product and growing your business.
Introducing Dev Starter Pack: the tools you need to start building your startup
Hey! Dani Grant here, one of the first PMs at Cloudflare and co-founder of Jam.dev. Ten years ago (during 2014’s Birthday Week), Cloudflare launched Universal SSL, making SSL free on the Internet for the first time, and in one night doubling the size of the encrypted web.
I was a college student back then, and I immediately became enraptured by Cloudflare’s mission: helping build a better Internet. As part of this mission, Cloudflare has developed powerful tools typically accessible only to Internet giants, oftentimes offering them for free to developers and individuals alike. Heck yeah! I joined Cloudflare in January 2015, and 5 years after that, co-founded a developer tool company called Jam, inspired by the impact that I saw building tools for developers could have while at Cloudflare.
It’s now 10 years later, and a lot has changed –– “software ate the world” and it’s now powering all aspects of our lives, from health to finances to how we work. It’s more important than ever to empower every developer with the best tools available, because the faster we build software, the sooner people’s experiences improve.
Today we’re thrilled to announce the Dev Starter Pack, an alliance of like-minded dev tool companies giving away their services for free, or heavily discounting them for developers who want to start companies and build the future.
Not only does this stack include all the tools you need to build a startup, it also includes all the tools you need to build AI-powered features. We believe that the next wave of startups will be AI-native, as AI becomes as ubiquitous as the electricity that powers the servers.
We haven’t even scratched the surface of what’s possible with AI, and we hope this launch gets developers closer to solving the challenges of building non-deterministic software.
If you’re a software engineer, and you want to build a project or a company and need an off the shelf stack of dev tools to get started, go to devstarterpack.io to start using all of these tools.
Each provider is offering developers a heavily discounted or even free plan to get started building. You can redeem these services by either using the special code “devstarterpack” or selecting “Dev Starter Pack” while applying to relevant programs.
We welcome more tools to join the alliance — this is just the beginning. If you are building a developer tool and would like to include your product in the Dev Starter Pack, let us know here, so we can include you.
What will you build?
We are very excited to see what you will build. Please share with us in Cloudflare’s Discord and community forum, so we can support you however it makes sense.
Software developers are changing the world, and we believe in providing support to help you make an even greater impact. If you’re looking for additional funding or support, check out Cloudflare’s Launchpad for developers turned founders building startups.

Introducing Workers Launchpad Cohort #4
Melissa and Chris from the Cloudflare for Startups team here. Our team is blown away by what customers are demonstrating on the Developer Platform. Just a few weeks ago, our Workers Launchpad Cohort #3 wrapped up. On Demo Day, customers demoed their applications built on Cloudflare, spanning AI, dev tools, IaaS, observability, SaaS, media, and beyond. We’re incredibly proud of Cohort #3 participants, and we look forward to their continued success with Cloudflare.
Following Demo Day of Workers Launchpad Cohort #3, we’ve been excited to receive a surge of new applications from startups around the world. These startups are pushing the boundaries of innovation, particularly in areas like observability, PaaS, AI, automation, e-commerce, and other industries. Many startups that applied this go-around demonstrated that they’ve built some great applications on Cloudflare, and today, we’re excited to announce the accepted participants for our upcoming Workers Launchpad Cohort #4.
Let’s take a look at what Cohort #4 participants are building in their own words:

|
Hyperscale revenue powered by real-time data intelligence and AI |
|
|
Predict customer behavior on your website |
|
|
Disruptive educational travel marketplace for Gen Z under 18 |
|
|
Companion app to make therapy an engaging daily practice |
|
|
A unified data catalog for generative AI infrastructure |
|
|
Create professional 3D projects without technical experience |
|
|
Your own Internet scale events infrastructure |
|
|
Connecting stars with their fans in paid meet & greets and virtual experiences |
|
|
No-code solution to deploy AI models as internal tools |
|
|
Development tool that uses observability data to help test and debug APIs |
|
|
An engineering observability tool that operates at scale inside customer infrastructure |
|
|
Video-first podcast hosting & distribution |
|
|
AI Analytics and Footage in the aviation industry. |
|
|
Powerful, collaborative and lightweight computing platform based on Git |
|
|
AI-powered organic growth engine for cybersecurity B2B SaaS |
|
|
Community-driven blogging network read by millions of technologists |
|
|
Prompt to REST API with AI-driven building, testing, and deployment |
|
|
Next-gen application intelligence and observability platform for developers |
|
|
AI productivity companion |
|
|
Combined marketing workflows, website, and customer journey for a seamless, AI-accelerated experience |
|
|
Make the Internet more shoppable, starting with fashion on socials |
|
|
Data-intensive inference solutions |
|
|
Multi-platform money management powered by AI |
|
|
Visual tool to build software and AI agents |
|
|
Transformative geospatial analytics experience with Google Colab, QGIS, ChatGPT, and Miro in one solution |
|
|
AI-Powered API Testing Tool |
|
|
View, edit, query, and visualize your data with AI |
|
|
AI procurement platform to empower hardware engineers to source smarter and launch sooner |
|
|
Process management and automation platform to get work done fast |
|
|
Increase e-commerce revenue by optimizing your site speed, automatically |
|
|
AI-first no-code platform to build and sell digital content |
|
|
AI platform to surface top talent by evaluating candidates against custom criteria |
|
|
Embedded community engagement platform built for SaaS |
|
|
Powerful analytics with cryptographic privacy guarantees |
|
|
AI gateway to monitor, evaluate, and optimize features |
|
|
An advanced visual site builder that connects to any headless CMS |
|
|
Streamlined visitor management |
The Cloudflare team is ecstatic to work with the amazing participants of Cohort #4. If you want to follow along on Cohort #4’s journey, be sure to follow @CloudflareDev on X and join our Developer Discord server.
Are you a startup building on Cloudflare? Apply for Cohort #5!
Network trends and natural language: Cloudflare Radar’s new Data Explorer & AI Assistant
Post Syndicated from David Belson original https://blog.cloudflare.com/radar-data-explorer-ai-assistant
Cloudflare Radar showcases global Internet traffic patterns, attack activity, and technology trends and insights. It is powered by data from Cloudflare’s global network, as well as aggregated and anonymized data from Cloudflare’s 1.1.1.1 public DNS Resolver, and is built on top of a rich, publicly accessible API. This API allows users to explore Radar data beyond the default set of visualizations, for example filtering by protocol, comparing metrics across multiple locations or autonomous systems, or examining trends over two different periods of time. However, not every user has the technical know-how to make a raw API query or process the JSON-formatted response.
Today, we are launching the Cloudflare Radar Data Explorer, which provides a simple Web-based interface to enable users to easily build more complex API queries, including comparisons and filters, and visualize the results. And as a complement to the Data Explorer, we are also launching an AI Assistant, which uses Cloudflare Workers AI to translate a user’s natural language statements or questions into the appropriate Radar API calls, the results of which are visualized in the Data Explorer. Below, we introduce the AI Assistant and Data Explorer, and also dig into how we used Cloudflare Developer Platform tools to build the AI Assistant.
Ask the AI Assistant
Sometimes, a user may know what they are looking for, but aren’t quite sure how to build the relevant API query by selecting from the available options and filters. (The sheer number may appear overwhelming.) In those cases, they can simply pose a question to the AI Assistant, like “Has there been an uptick in malicious email over the last week?” The AI Assistant makes a series of Workers AI and Radar API calls to retrieve the relevant data, which is visualized within seconds:
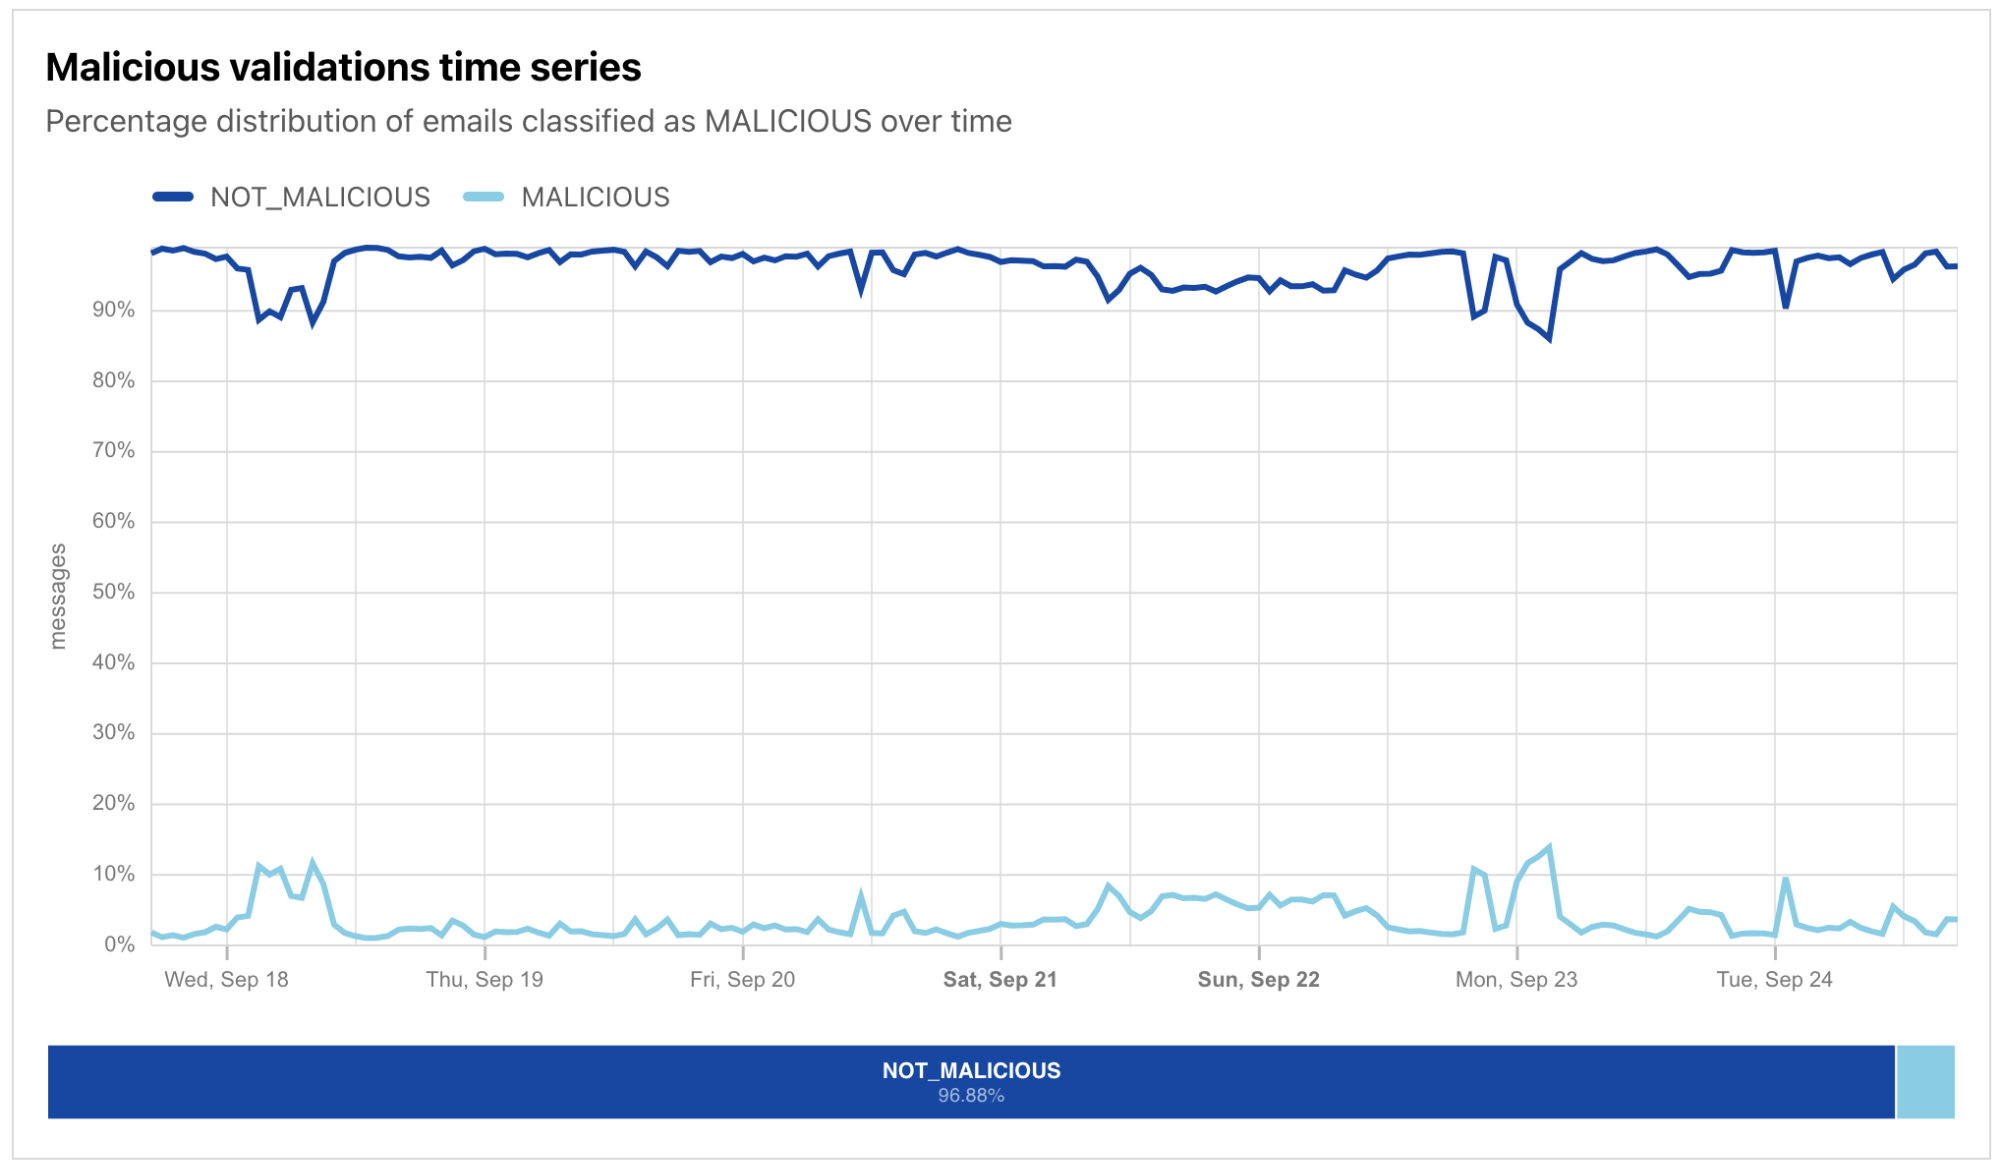
The AI Assistant pane is found on the right side of the page in desktop browsers, and appears when the user taps the “AI Assistant” button on a mobile browser. To use the AI Assistant, users just need to type their question into the “Ask me something” area at the bottom of the pane and submit it. A few sample queries are also displayed by default to provide examples of how and what to ask, and clicking on one submits it.
The submitted question is evaluated by the AI Assistant (more below on how that happens), and the resulting visualization is displayed in the Results section of the Data Explorer. In addition to the visualization of the results, the appropriate Data, Filter, and Compare options are selected in the Query section above the visualization, allowing the user to further tune or refine the results if necessary. The Keep current filters toggle within the AI Assistant pane allows users to build on the previous question. For example, with that toggle active, a user could ask “Traffic in the United States”, see the resultant graph, and then ask “Compare it with traffic in Mexico” to add Mexico’s data to the graph.
Building a query directly
For users that prefer a more hands-on approach, a wide variety of Radar datasets are available to explore, including traffic metrics, attacks, Internet quality, email security, and more. Once the user selects a dataset, the Breakdown By: dropdown is automatically populated with relevant options (if any), and Filter options are also dynamically populated. As the user selects additional options, the visualization in the Result section is automatically updated.
In addition to building the query of interest, Data Explorer also enables the user to compare the results, both against a specific date range and/or another location or autonomous system (AS). To compare results with the immediately previous period (the last seven days with the seven days before that, for instance), just toggle on the Previous period switch. Otherwise, clicking on the Date Range field brings up a calendar that enables the user to select a starting date — the corresponding date range is intelligently selected, based on the date range selected in the Filter section. To compare results across locations or ASNs, clicking on the “Location or ASN” field brings up a search box in which the user can enter a location (country/region) name, AS name, or AS number, with search results updating as the user types. Note that locations can be compared with other locations or ASes, and ASes can be compared with other ASes or locations. This enables a user, for example, to compare trends for their ISP with trends for their country.
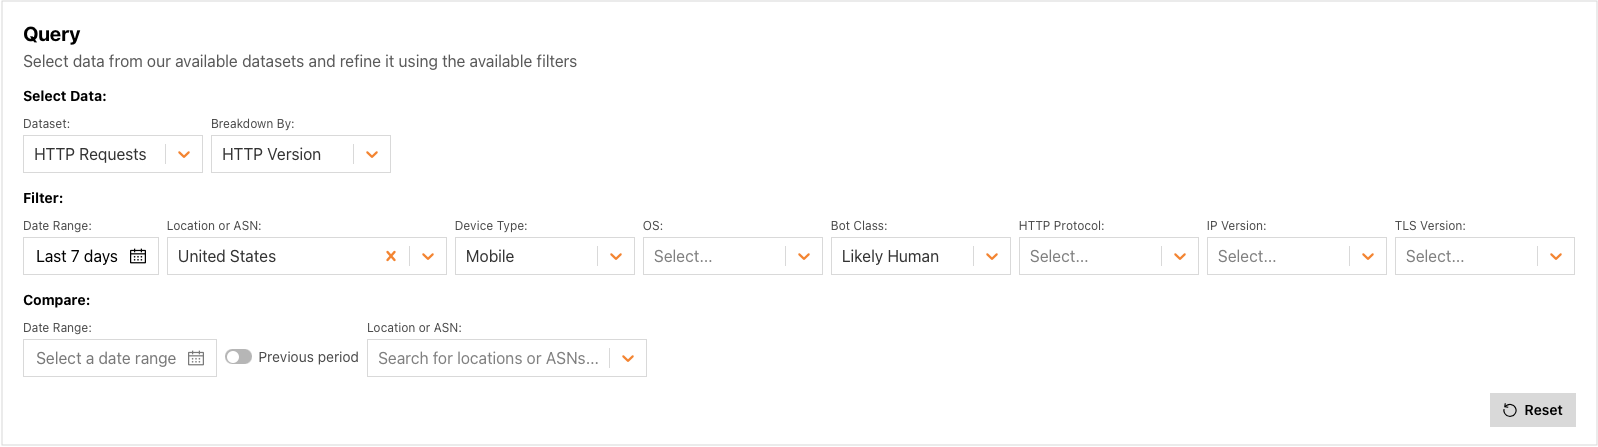
Visualizing the results
Much of the value of Cloudflare Radar comes from its visualizations – the graphs, maps, and tables that illustrate the underlying data, and Data Explorer does not disappoint here. Depending on the dataset and filters selected, and the volume of data returned, results may be visualized in a time series graph, bar chart, treemap, or global choropleth map. The visualization type is determined automatically based on the contents of the API response. For example, the presence of countryalpha2 keys in the response means a choropleth map will be used, the presence of timestamps in the response means a line graph (“xychart”) should be shown, and more than 40 items in the response selects a treemap as the visualization type.
To illustrate the extended visualizations available in Data Explorer, the figure below is an expanded version of one that would normally be found on Radar’s Adoption & Usage page. The “standard” version of the graph plots the shares of the HTTP versions over the last seven days for the United States, as well as the summary share values. In this extended version of the graph generated in the Data Explorer, we compare data for the United States with HTTP version share data for AS701 (Verizon), for both the past seven days and the previous seven-day period. In addition to the comparisons plotted on the time series graph, the associated summary values are also compared in an accompanying bar chart. This comprehensive visualization makes comparisons easy.
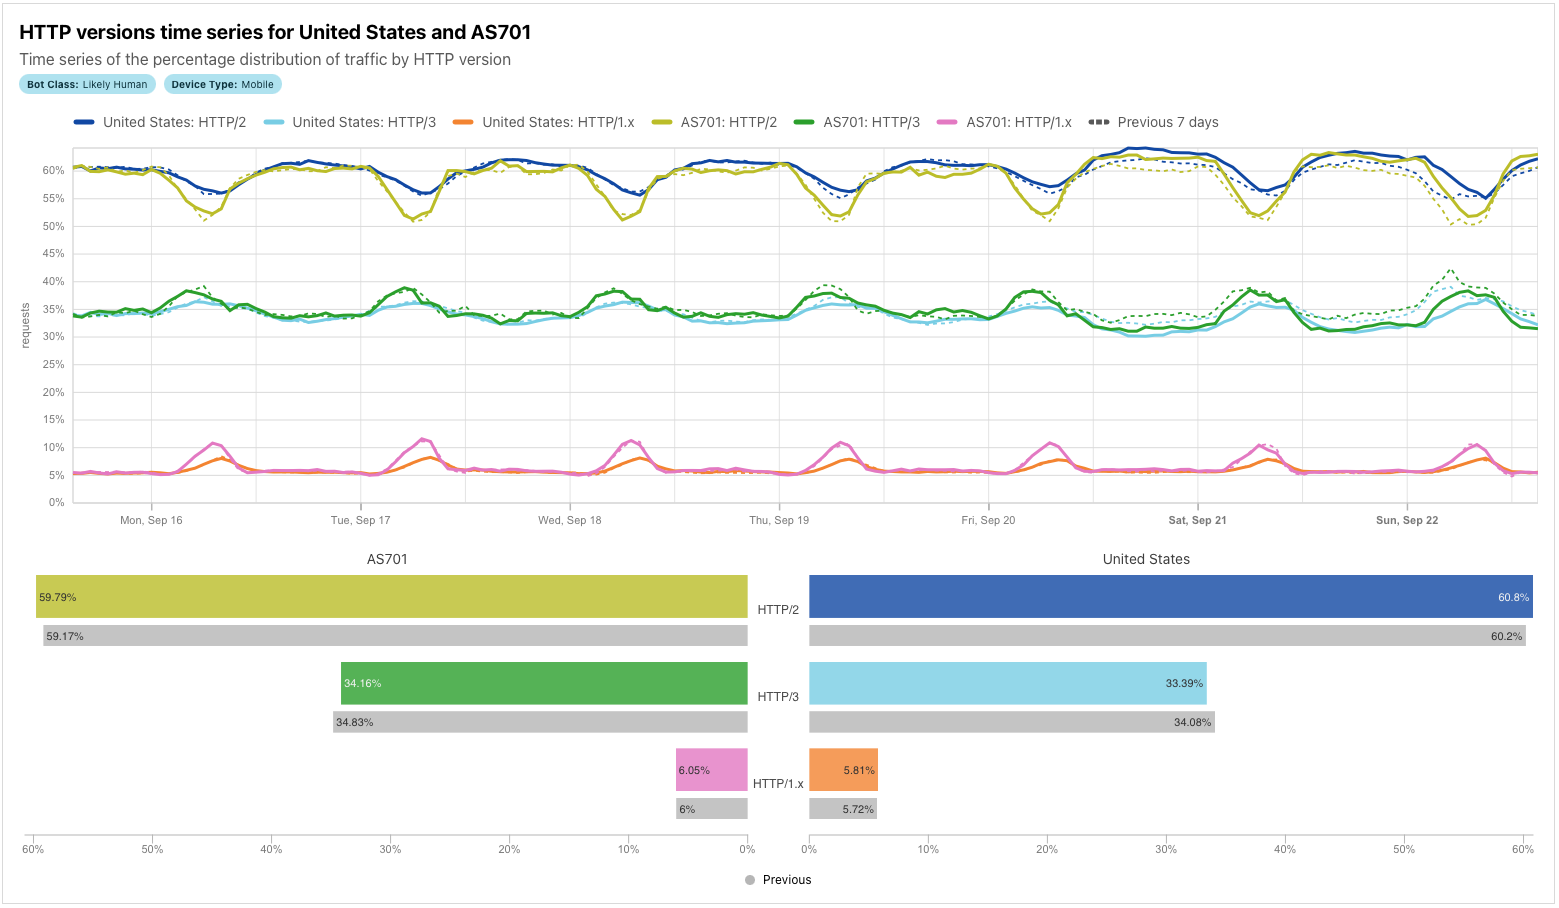
For some combinations of datasets/filters/comparisons, time series graphs can get quite busy, with a significant number of lines being plotted. To isolate just a single line on the graph, double-click on the item in the legend. To add/remove additional lines back to/from the graph, single-click on the relevant legend item.
Similar to other visualizations on Radar, the resulting graphs or maps can be downloaded, copied, or embedded into another website or application. Simply click on the “Share” button above the visualization card to bring up the Share modal dialog. We hope to see these graphs shared in articles, blog posts, and presentations, and to see embedded visualizations with real-time data in your portals and operations centers!
Still want to use the API? No problem.
Although Data Explorer was designed to simplify the process of building, and viewing the results of, more complex API queries, we recognize that some users may still want to retrieve data directly from the API. To enable that, Data Explorer’s API section provides copyable API calls as a direct request URL and a cURL command. The raw data returned by the query is also available to copy or download as a JSON blob, for those users that want to save it locally, or paste it into another application for additional manipulation or analysis.
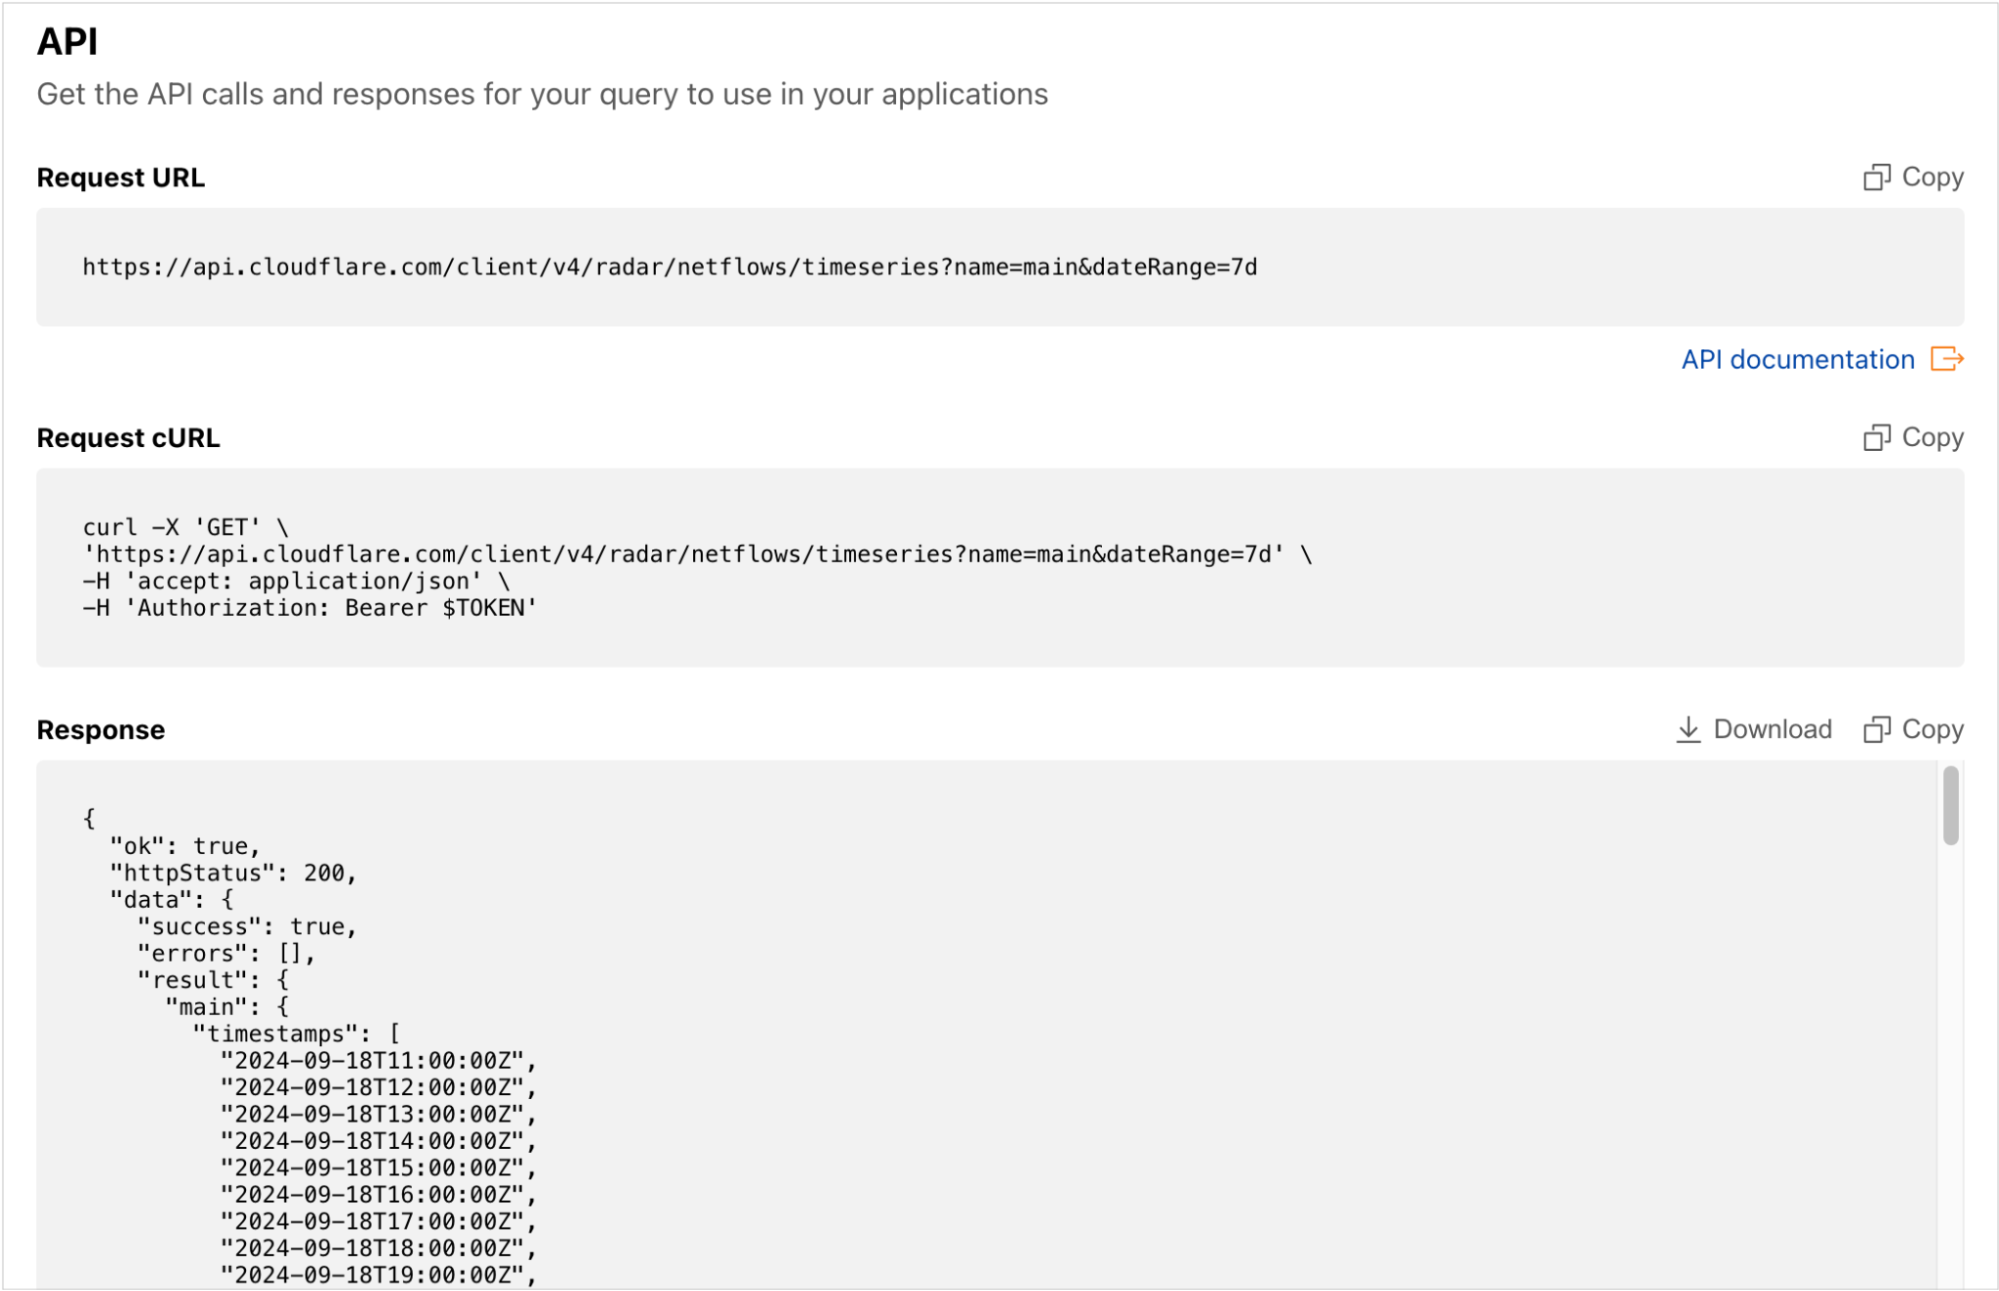
How we built the AI Assistant
Knowing all that AI is capable of these days, we thought that creating a system for an LLM to answer questions didn’t seem like an overly complex task. While there were some challenges, Cloudflare’s developer platform tools thankfully made it fairly straightforward.
LLM-assisted API querying
The main challenge we encountered in building the API Assistant was the large number of combinations of datasets and parameters that can potentially be visualized in the Data Explorer. There are around 100 API endpoints from which the data can be fetched, with most able to take multiple parameters.
There were a few potential approaches to getting started. One was to take a previously trained LLM and further train it with the API endpoint descriptions in order to have it return the output in the required structured format which would then be used to execute the API query. However, for the first version, we decided against this approach of fine-tuning, as we wanted to quickly test a few different models supported by Workers AI, and we wanted the flexibility to easily add or remove parameter combinations, as Data Explorer development was still under way. As such, we decided to start with prompt engineering, where all the endpoint-specific information is placed in the instructions sent to the LLM.
Putting the full detailed description of the API endpoints supported by the Data Explorer into the system prompt would be possible for an LLM with a larger context window (the number of tokens the model takes as input before generating output). Newer models are getting better with the needle in a haystack problem, which refers to the issue whereby LLMs do not retrieve information (the needle) equally well if it is placed in different positions within the long textual input (the haystack). However, it has been empirically shown that the position of information within the large context still matters. Additionally, many of the Radar API endpoints have quite similar descriptions, and putting all the descriptions in a single instruction could be more confusing for the model, and the processing time also increases with larger contexts. Based on this, we adopted the approach of having multiple inference calls to an LLM.
First, when the user enters a question, a Worker sends this question and a short general description of the available datasets to the LLM, asking it to determine the topic of the question. Then, based on the topic returned by the model, a system prompt is generated with the endpoint descriptions, including only those related to the topic. This prompt, along with the original question, is sent to the LLM asking it to select the appropriate endpoint and its specific parameters. At the same time, two parallel inference calls to the model are also made, one with the question and the system prompt related to the description of location parameters, and another with the description of time range parameters. Then, all three model outputs are put together and validated.
If the final output is a valid dataset and parameter combination, it is sent back to the Data Explorer, which executes the API query and displays the resulting visualization for the user. Different LLMs were tested for this task, and at the end, openhermes-2.5-mistral-7b, trained on code datasets, was selected as the best option. To give the model more context, not only is the user’s current question sent to the model, but the previous one and its response are as well, in case the next question asked by the user is related to the previous one. In addition, calls to the model are sent through Cloudflare’s AI Gateway, to allow for caching, rate limiting, and logging.
After the user is shown the result, they can indicate whether what was shown to them was useful or not by clicking the “thumbs up” or “thumbs down” icons in the response. This rating information is saved with the original question in D1, our serverless SQL database, so the results can be analyzed and applied to future AI Assistant improvements.
The full end-to-end data flow for the Cloudflare Radar AI Assistant is illustrated in the diagram below.
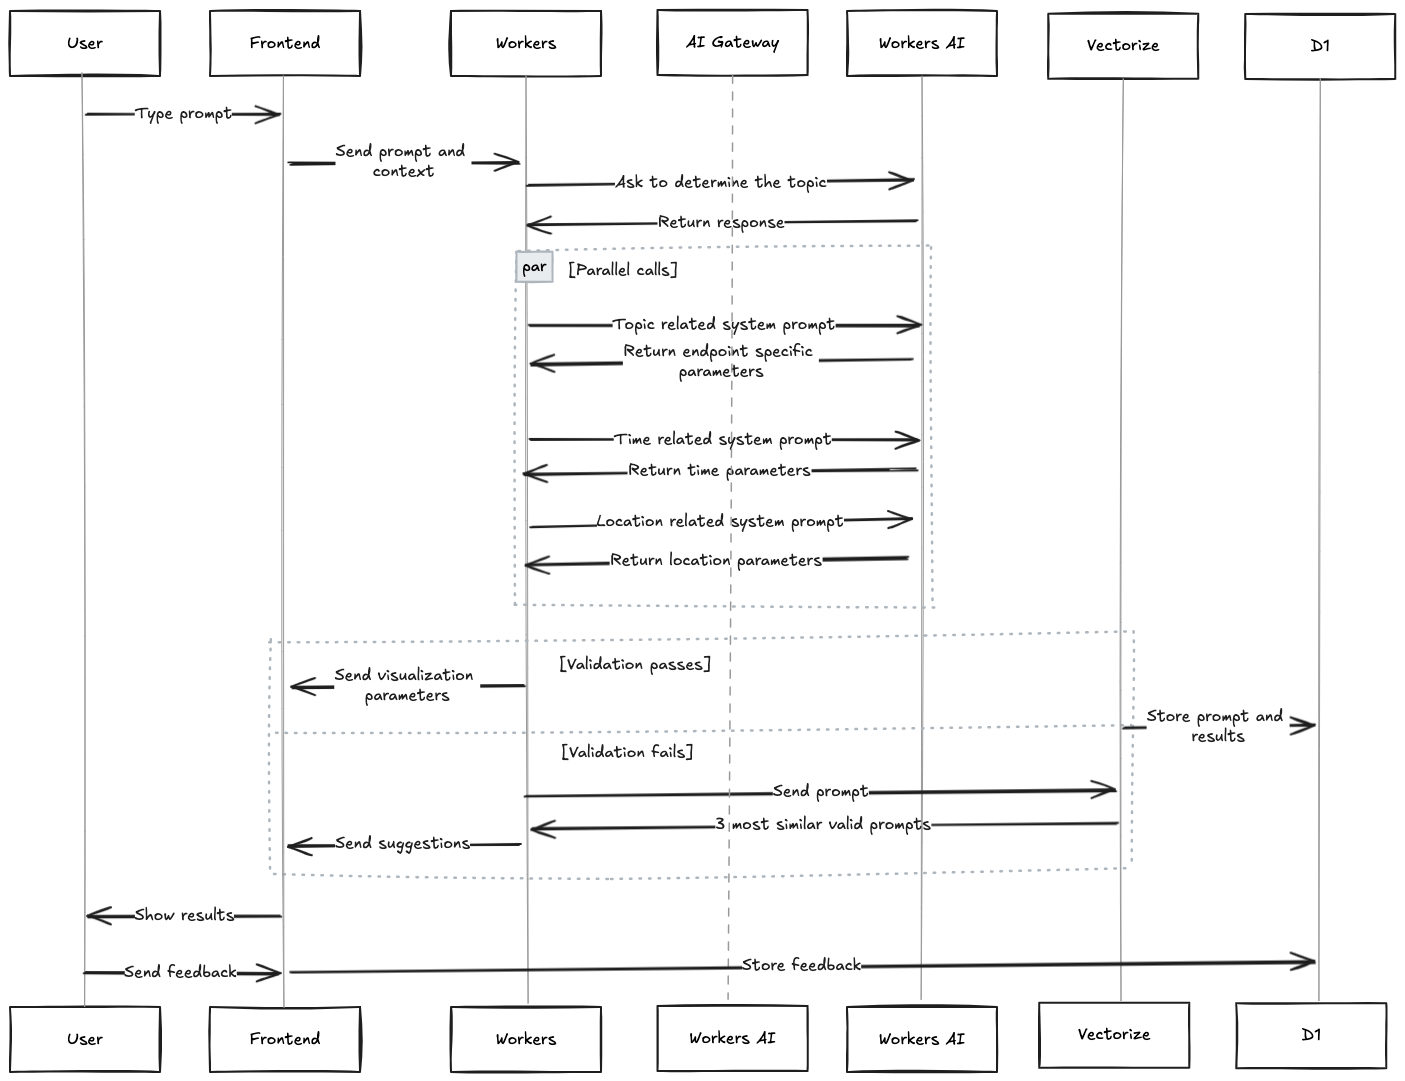
When the LLM doesn’t know the answer
In some cases, however, the LLM may not “know” the answer to the question posed by the user. If the model does not generate a valid final response, then the user is shown three alternative questions. The intent here is to guide the user into asking an answerable question — that is, a question that is answerable with data from Radar.
This is achieved using a previously compiled (static) list of various questions related to different Radar datasets. For each of these questions, their embedding is calculated using an embeddings model, and stored in our Vectorize vector database. “Embeddings” are numerical representations of textual data (vectors) capturing their semantic meaning and relationships, with similar text having vectors that are closer. When a user’s question does not generate a valid model response, the embedding of that question is calculated, and its vector is compared against all the stored vectors from the vector database, and the three most similar ones are selected. These three questions, determined to be similar to the user’s original question, are then shown to the user.
There are also cases when the LLM gives answers which do not correspond to what the user asked, as hallucinations are currently inevitable in LLMs, or when time durations are calculated inaccurately, as LLMs sometimes struggle with mathematical calculations. To help guard against this, AI Assistant responses are first validated against the API schema to confirm that the dataset and the parameter combination is valid. Additionally, Data Explorer dropdown options are automatically populated based on the AI Assistant’s response, and the chart titles are also automatically generated, so the user always knows exactly what data is shown in the visualization, even if it might not answer their actual question.
Looking ahead
We’re excited to enable more granular access to the rich datasets that currently power Cloudflare Radar. As we add new datasets in the future, such as DNS metrics, these will be available through Data Explorer and AI Assistant as well.
As noted above, Radar offers a predefined set of visualizations, and these serve as an excellent starting point for further exploration. We are adding links from each Radar visualization into Data Explorer, enabling users to further analyze the associated data to answer more specific questions. Clicking the “pie chart” icon next to a graph’s description brings up a Data Explorer page with the relevant metrics, options, and filters selected.
Correlating observations across two different metrics is another capability that we are also working on adding to Data Explorer. For example, if you are investigating an Internet disruption, you will be able to plot traffic trends and announced IP address space for a given country or autonomous system on the same graph to determine if both dropped concurrently.
But for now, use the Data Explorer and AI Assistant to go beyond what Cloudflare Radar offers, finding answers to your questions about what’s happening on the Internet. If you share Data Explorer visualizations on social media, be sure to tag us: @CloudflareRadar (X), noc.social/@cloudflareradar (Mastodon), and radar.cloudflare.com (Bluesky). You can also reach out on social media, or contact us via email, with suggestions for future Data Explorer and AI Assistant functionality.

Reaffirming our commitment to free
Post Syndicated from Nitin Rao original https://blog.cloudflare.com/cloudflares-commitment-to-free
Cloudflare launched our free tier at the same time our company launched — fourteen years ago, on September 27, 2010. Of course, a bit has changed since then — there are now millions of Internet properties behind Cloudflare. As we’ve grown in size and amassed millions of free customers, one of the questions we often get asked is: how can Cloudflare afford to do this at such scale?
Cloudflare always has, and always will, offer a generous free version for public-facing applications (Application Services), internal private networks and people (Cloudflare One), and developer tools (Developer Platform). Counterintuitively: our free service actually helps us keep our costs lower. Not only is it mission-aligned, our free tier is business-aligned. We want to make abundantly clear: our free plan is here to stay, and we reaffirmed that commitment this week with 15 releases across our product portfolio that make the Free plan even better.
Understanding our Cost of Goods Sold
To understand the economics of Free, you need to understand our Cost of Goods Sold (COGS). Cloudflare hasn’t outsourced its network — we built it ourselves, and it spans more than 330 cities. We design and ship our own hardware across the world, we interconnect with more than 12,500 networks, and we manage over 300 Tbps of network capacity. We even have a dedicated backbone that spans the globe.
There are three major costs of running our network, which together comprise about 80% of our COGS. First and largest is bandwidth: the traffic that traverses our network. Then there is hardware: the servers that process traffic. And third are colocation costs: the power and space at the data centers where we house our servers. There are other parts of COGS, too, like our SRE team that keeps the network running, and our payment processor fees, without which we couldn’t collect revenue.
To get traffic across the Internet for a network of our scale, we need a lot of bandwidth. Typically, a network like ours would pay third-party transit networks and Internet Service Providers (ISPs) to transmit data anywhere on the Internet. But there are thousands of ISPs that we don’t have to pay at all, and hundreds that also offer us space in their data center at no cost. How did we manage that? The surprising answer: Free.
How our Free services keep costs low
Imagine you run an ISP serving your local community. Your job is to connect your customers to the Internet. You notice that your customers are often visiting sites behind Cloudflare, which sits in front of roughly 20% of the web. You need to deliver those webpages and facilitate connections to the applications behind Cloudflare, but right now you have to pay a transit provider to reach them. Instead, you could choose to peer directly with Cloudflare and exchange traffic at no cost.
Cloudflare is one of the most peered networks in the world. We freely exchange traffic with thousands of ISPs, who in turn benefit because they can cut out a third-party transit provider to reach the millions of sites and applications behind Cloudflare.
Continuing with this hypothetical, if as an ISP, your customers pay for Internet connectivity based on data usage (a common model outside of Western Europe and the US), your revenue scales with data consumption. One simple way to increase data consumption? Make the Internet faster! Hosting Cloudflare’s servers in your facility, as close to your users as possible, reduces latency for millions of websites and apps. So it’s in your best interest to host Cloudflare’s servers in your data centers, too.
We have hundreds of ISP partnerships that look just like that. The value ISPs get from Cloudflare stems from the breadth of the web that sits behind Cloudflare, a number driven by our Free customers. This arrangement is a big part of why we have a free service, and is part of what enables us to continue to offer one. PS: If you really are an operator for a local ISP and don’t partner with us yet, please connect with us through our peering portal!
These days, we are at such a scale that the traffic our customers generate requires much more capacity than can fit within our ISP partners. To reliably serve our enterprise customers, we operate in multiple facilities in every major Internet hub city. And yet, the traffic patterns of our enterprise customers are typically very predictable. They usually follow a diurnal cycle, with peaks and troughs throughout a day. Enterprise customer traffic is prioritized and served as close to end users as possible, regardless of the time of day. But our Free customers use off-cycle headroom. That’s why we’re able to continue to offer unmetered bandwidth on the Free plan: we serve the traffic from across our network, wherever there is spare room. It might not have quite the same performance as our enterprise traffic, but it’s still reliable and fast.
There do have to be some rules for this to continue to work, however. Free traffic needs to remain a manageable proportion of our total traffic. To ensure that remains true, and that we can continue to offer unmetered traffic to Free customers at no cost, we have to be opinionated about what kind of traffic we serve for free. Our terms of service specify that large assets (like videos) are not supported on our Free plan. So we require that customers pushing large files and videos move onto one of our paid services, like Images and Stream.
Free customers help us build better products and grow our business
The benefits of our Free plan extend well beyond direct economics.
Our Free plan gives Cloudflare access to unique threat intelligence. A wide surface area exposes our network to diverse traffic and attacks that we wouldn’t otherwise see, often allowing us to identify potential security and reliability issues at the earliest stage. Like an immune system, we learn from these attacks and adapt to improve our products for all customers. This is a special competitive advantage. Visibility into attacks allows us to build products that no one else could.
Our Free customers help us do quality assurance (QA) quickly. Free customers are often the first to try new products and features. When we launch something new, we get signal immediately and at an incredible scale. We use that signal to swiftly address bugs and iterate on our products.
Offering a Free plan challenges us to build more intuitive products. Free customers represent a broad audience, from tech enthusiasts to those simply looking to secure their website or build an application. Building for a broad spectrum of users forces us to create more user-friendly tools for everyone.
Offering a Free service has other benefits, too. Some of our strongest customer advocates are folks that used our Free plan on their hobby projects before bringing Cloudflare with them to work. Some of them even end up working at Cloudflare!
Our free plan will keep getting better
Our Free offering is a flywheel that helps make Cloudflare’s products, team, and cost structure more efficient. We pay back these efficiencies by continuing to improve our free offerings. Just this week, we’ve announced 15 updates that make our Free plans even better:
-
Free customers can audit and control the AI models accessing their content.
-
Turnstile, our privacy-first CAPTCHA alternative available to everyone, gets more accurate with granular, device-level identification.
-
Free customers now have access to our Cloud Access Security Broker (CASB), Data Loss Prevention (DLP), Digital Experience Monitoring (DEX), and Magic Network Monitoring (MNM) tools, for up to 50 seats.
-
A new version of Leaked Credential Checks (LCC) is available to all customers to help mitigate account takeover (ATO) attacks.
-
All customers can now monitor third-party scripts with Page Shield Script Monitor.
-
Free customers can use API Shield’s Schema Validation to ensure only valid requests to their API make it through to the origin.
-
Free customers get more robust analytics, with versions of Security Analytics and DNS GraphQL for everyone.
-
All customers can now log in to the Cloudflare Dashboard using Sign in with Google.
-
Free customers using our Terraform provider to configure their infrastructure will now benefit from autogenerated API SDKs.
-
Cloudflare Calls managed TURN service is now GA and free up to 1,000 GB per month.
-
All customers will benefit from the introduction of Zstandard compression, which improves web performance by compressing up to 42% faster than Brotli.
-
Free customer traffic is now more private as we roll out Encrypted Client Hello (ECH) which obfuscates the Server Name Identifier (SNI) during a TLS handshake.
-
All customers can store and query 3 days of logs from their Cloudflare Worker.
-
Requests made through Service Bindings and to Tail Workers are now free.
-
Cloudflare Image Optimization is now available for free to all Cloudflare customers.
We offer a Free plan out of more than goodwill — it is a core business differentiator that helps us build better products, drive growth, and keep costs low. And it helps us advance our mission. Building a better Internet is a collective effort. Today, more than 30 million domains, comprising some 20% of the web, sit behind Cloudflare. Our Free plan makes that portion of the web faster, more secure, and more efficient. Free is not just a commitment — it’s a cornerstone of our strategy.
Become part of a better Internet and sign up for Cloudflare’s Free plan.

Our container platform is in production. It has GPUs. Here’s an early look
Post Syndicated from Brendan Irvine-Broque original https://blog.cloudflare.com/container-platform-preview
We’ve been working on something new — a platform for running containers across Cloudflare’s network. We already use it in production for Workers AI, Workers Builds, Remote Browsing Isolation, and the Browser Rendering API. Today, we want to share an early look at how it’s built, why we built it, and how we use it ourselves.
In 2024, Cloudflare Workers celebrates its 7th birthday. When we first announced Workers, it was a completely new model for running compute in a multi-tenant way — on isolates, as opposed to containers. While, at the time, Workers was a pretty bare-bones functions-as-a-service product, we took a big bet that this was going to become the way software was going to be written going forward. Since introducing Workers, in addition to expanding our developer products in general to include storage and AI, we have been steadily adding more compute capabilities to Workers:
|
2020 |
|
|
2021 |
|
|
2022 |
|
|
2023 |
|
|
2024 |
With each of these, we’ve faced a question — can we build this natively into the platform, in a way that removes, rather than adds complexity? Can we build it in a way that lets developers focus on building and shipping, rather than managing infrastructure, so that they don’t have to be a distributed systems engineer to build distributed systems?
In each instance, the answer has been YES. We try to solve problems in a way that simplifies things for developers in the long run, even if that is the harder path for us to take ourselves. If we didn’t, you’d be right to ask — why not self-host and manage all of this myself? What’s the point of the cloud if I’m still provisioning and managing infrastructure? These are the questions many are asking today about the earlier generation of cloud providers.
Pushing ourselves to build platform-native products and features helped us answer this question. Particularly because some of these actually use containers behind the scenes, even though as a developer you never interact with or think about containers yourself.
If you’ve used AI inference on GPUs with Workers AI, spun up headless browsers with Browser Rendering, or enqueued build jobs with the new Workers Builds, you’ve run containers on our network, without even knowing it. But to do so, we needed to be able to run untrusted code across Cloudflare’s network, outside a v8 isolate, in a way that fits what we promise:
-
You shouldn’t have to think about regions or data centers. Routing, scaling, load balancing, scheduling, and capacity are our problem to solve, not yours, with tools like Smart Placement.
-
You should be able to build distributed systems without being a distributed systems engineer.
-
Every millisecond matters — Cloudflare has to be fast.
There wasn’t an off-the-shelf container platform that solved for what we needed, so we built it ourselves — from scheduling to IP address management, pulling and caching images, to improving startup times and more. Our container platform powers many of our newest products, so we wanted to share how we built it, optimized it, and well, you can probably guess what’s next.
Global scheduling — “The Network is the Computer”
Cloudflare serves the entire world — region: earth. Rather than asking developers to provision resources in specific regions, data centers and availability zones, we think “The Network is the Computer”. When you build on Cloudflare, you build software that runs on the Internet, not just in a data center.
When we started working on this, Cloudflare’s architecture was to just run every service via systemd on every server (we call them “metals” — we run our own hardware), allowing all services to take advantage of new capacity we add to our network. That fits running NGINX and a few dozen other services, but cannot fit a world where we need to run many thousands of different compute heavy, resource hungry workloads. We’d run out of space just trying to load all of them! Consider a canonical AI workload — deploying Llama 3.1 8B to an inference server. If we simply ran a Llama 3.1 8B service on every Cloudflare metal, we’d have no flexibility to use GPUs for the many other models that Workers AI supports.
We needed something that would allow us to still take advantage of the full capacity of Cloudflare’s entire network, not just the capacity of individual machines. And ideally not put that burden on the developer.
The answer: we built a control plane on our own Developer Platform that lets us schedule a container anywhere on Cloudflare’s Network:
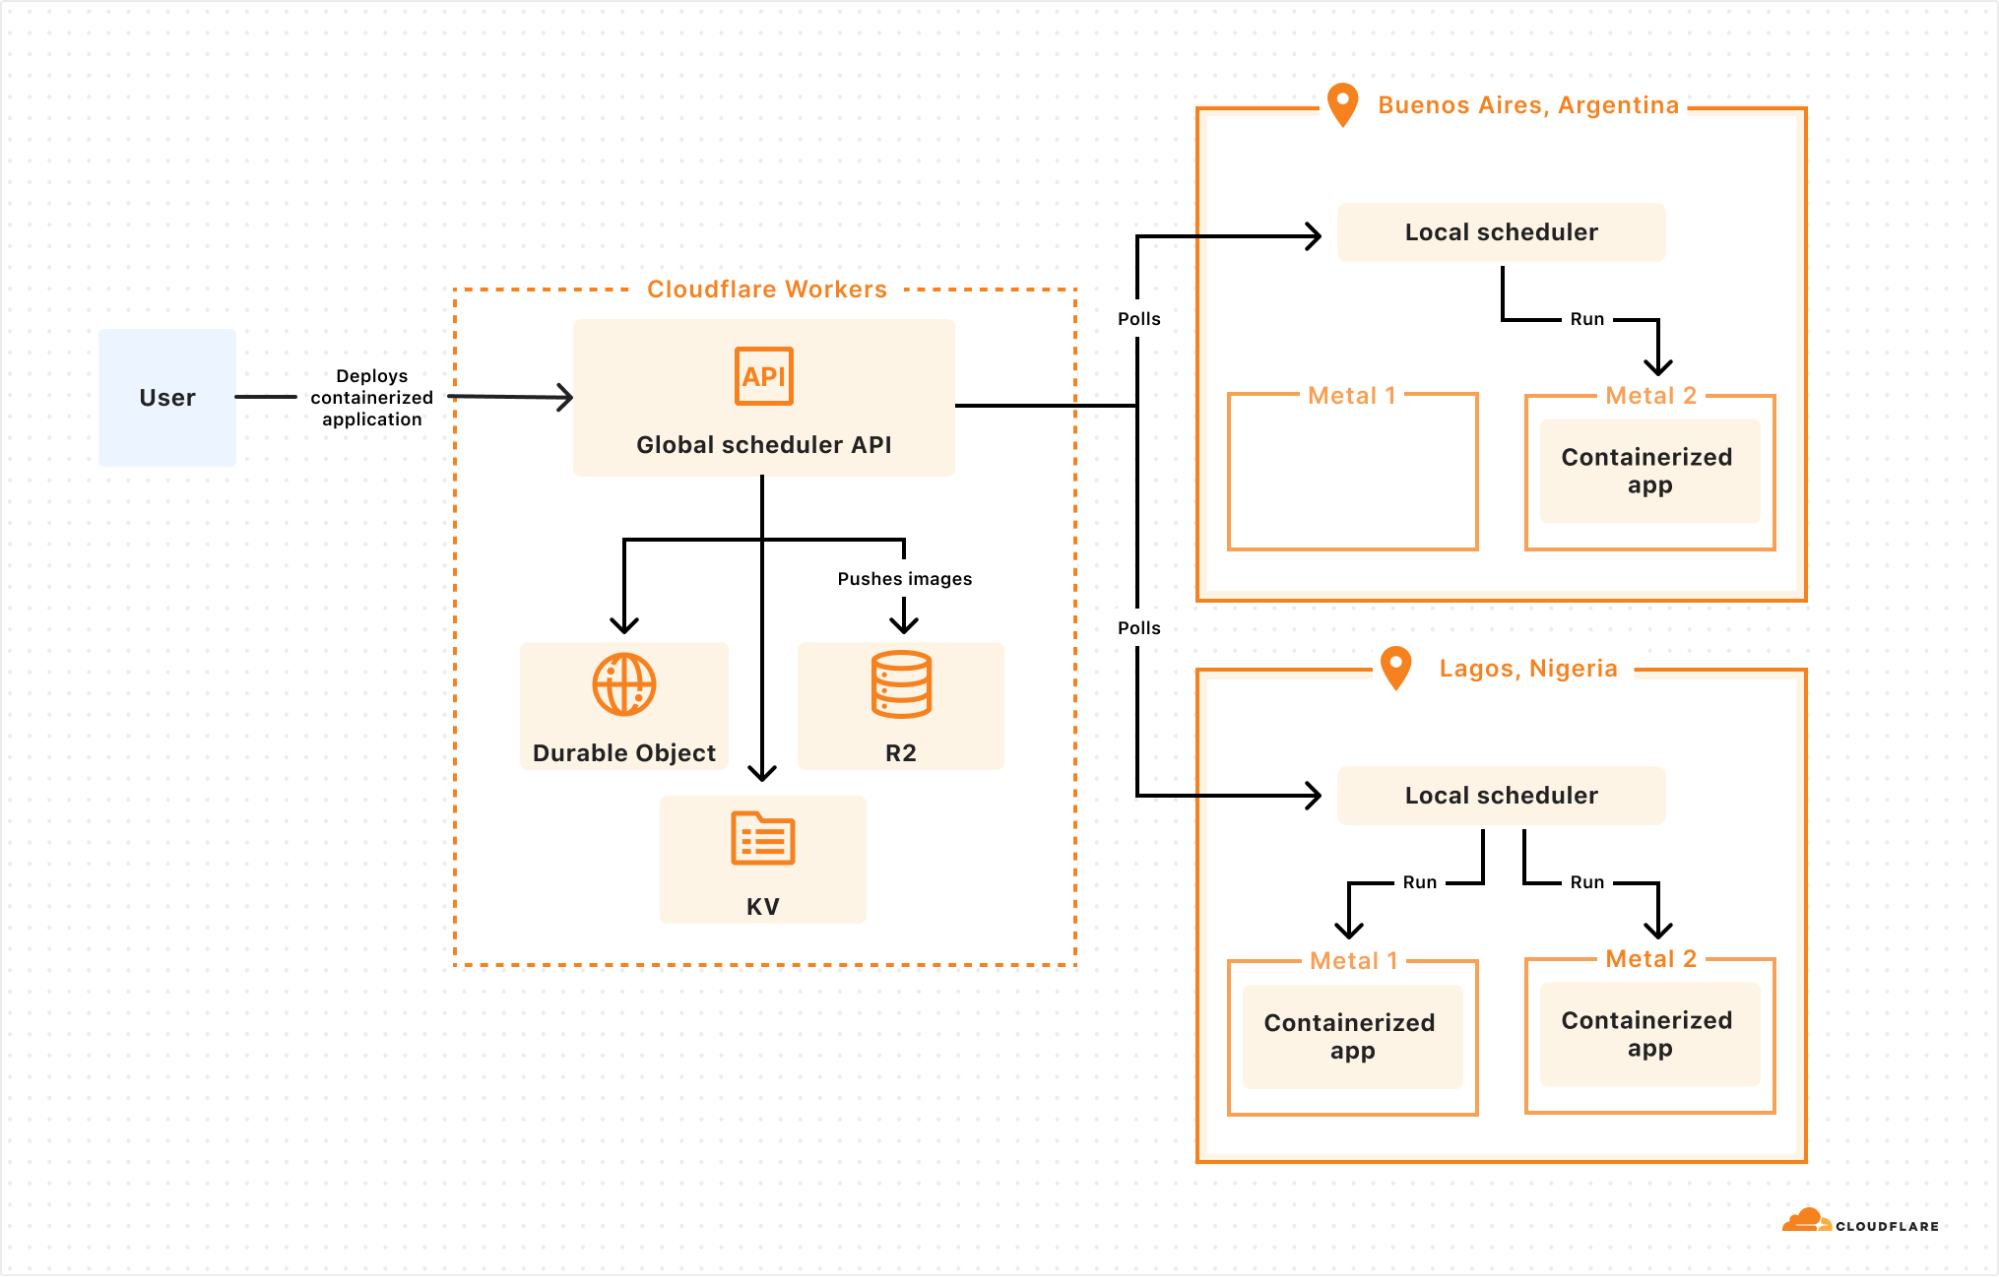
The global scheduler is built on Cloudflare Workers, Durable Objects, and KV, and decides which Cloudflare location to schedule the container to run in. Each location then runs its own scheduler, which decides which metals within that location to schedule the container to run on. Location schedulers monitor compute capacity, and expose this to the global scheduler. This allows Cloudflare to dynamically place workloads based on capacity and hardware availability (e.g. multiple types of GPUs) across our network.
Why does global scheduling matter?
When you run compute on a first generation cloud, the “contract” between the developer and the platform is that the developer must specify what runs where. This is regional scheduling, the status quo.
Let’s imagine for a second if we applied regional scheduling to running compute on Cloudflare’s network, with locations in 330+ cities, across 120+ countries. One of the obvious reasons people tell us they want to run on Cloudflare is because we have compute in places where others don’t, within 50ms of 95% of the world’s Internet-connected population. In South America, other clouds have one region in one city. Cloudflare has 19:
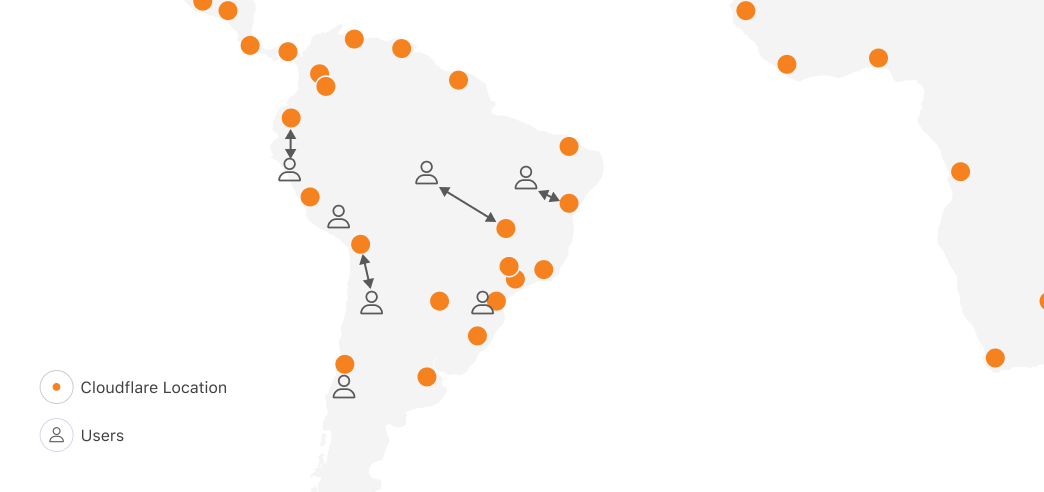
Running anywhere means you can be faster, highly available, and have more control over data location. But with regional scheduling, the more locations you run in, the more work you have to do. You configure and manage load balancing, routing, auto-scaling policies and more. Balancing performance and cost in a multi-region setup is literally a full-time job (or more) at most companies who have reached meaningful scale on traditional clouds.
But most importantly, no matter what tools you bring, you were the one who told the cloud provider, “run this container over here”. The cloud platform can’t move it for you, even if moving it would make your workload faster. This prevents the platform from adding locations, because for each location, it has to convince developers to take action themselves to move their compute workloads to the new location. Each new location carries a risk that developers won’t migrate workloads to it, or migrate too slowly, delaying the return on investment.
Global scheduling means Cloudflare can add capacity and use it immediately, letting you benefit from it. The “contract” between us and our customers isn’t tied to a specific datacenter or region, so we have permission to move workloads around to benefit customers. This flexibility plays an essential role in all of our own uses of our container platform, starting with GPUs and AI.
GPUs everywhere: Scheduling large images with Workers AI
In late 2023, we launched Workers AI, which provides fast, easy to use, and affordable GPU-backed AI inference.
The more efficiently we can use our capacity, the better pricing we can offer. And the faster we can make changes to which models run in which Cloudflare locations, the closer we can move AI inference to the application, lowering Time to First Token (TTFT). This also allows us to be more resilient to spikes in inference requests.
AI models that rely on GPUs present three challenges though:
-
Models have different GPU memory needs. GPU memory is the most scarce resource, and different GPUs have different amounts of memory.
-
Not all container runtimes, such as Firecracker, support GPU drivers and other dependencies.
-
AI models, particularly LLMs, are very large. Even a smaller parameter model, like @cf/meta/llama-3.1-8b-instruct, is at least 5 GB. The larger the model, the more bytes we need to pull across the network when scheduling a model to run in a new location.
Let’s dive into how we solved each of these…
First, GPU memory needs. The global scheduler knows which Cloudflare locations have blocks of GPU memory available, and then delegates scheduling the workload on a specific metal to the local scheduler. This allows us to prioritize placement of AI models that use a large amount of GPU memory, and then move smaller models to other machines in the same location. By doing this, we maximize the overall number of locations that we run AI models in, and maximize our efficiency.
Second, container runtimes and GPU support. Thankfully, from day one we built our container platform to be runtime agnostic. Using a runtime agnostic scheduler, we’re able to support gVisor, Firecracker microVMs, and traditional VMs with QEMU. We are also evaluating adding support for another one: cloud-hypervisor which is based on rust-vmm and has a few compelling advantages for our use case:
-
GPU passthrough support using VFIO
-
vhost-user-net support, enabling high throughput between the host network interface and the VM
-
vhost-user-blk support, adding flexibility to introduce novel network-based storage backed by other Cloudflare Workers products
-
all the while being a smaller codebase than QEMU and written in a memory-safe language
Our goal isn’t to build a platform that makes you as the developer choose between runtimes, and ask, “should I use Firecracker or gVisor”. We needed this flexibility in order to be able to run workloads with different needs efficiently, including workloads that depend on GPUs. gVisor has GPU support, while Firecracker microVMs currently does not.
gVisor’s main component is an application kernel (called Sentry) that implements a Linux-like interface but is written in a memory-safe language (Go) and runs in userspace. It works by intercepting application system calls and acting as the guest kernel, without the need for translation through virtualized hardware.
The resource footprint of a containerized application running on gVisor is lower than a VM because it does not require managing virtualized hardware and booting up a kernel instance. However, this comes at the price of reduced application compatibility and higher per-system call overhead.
To add GPU support, the Google team introduced nvproxy which works using the same principles as described above for syscalls: it intercepts ioctls destined to the GPU and proxies a subset to the GPU kernel module.
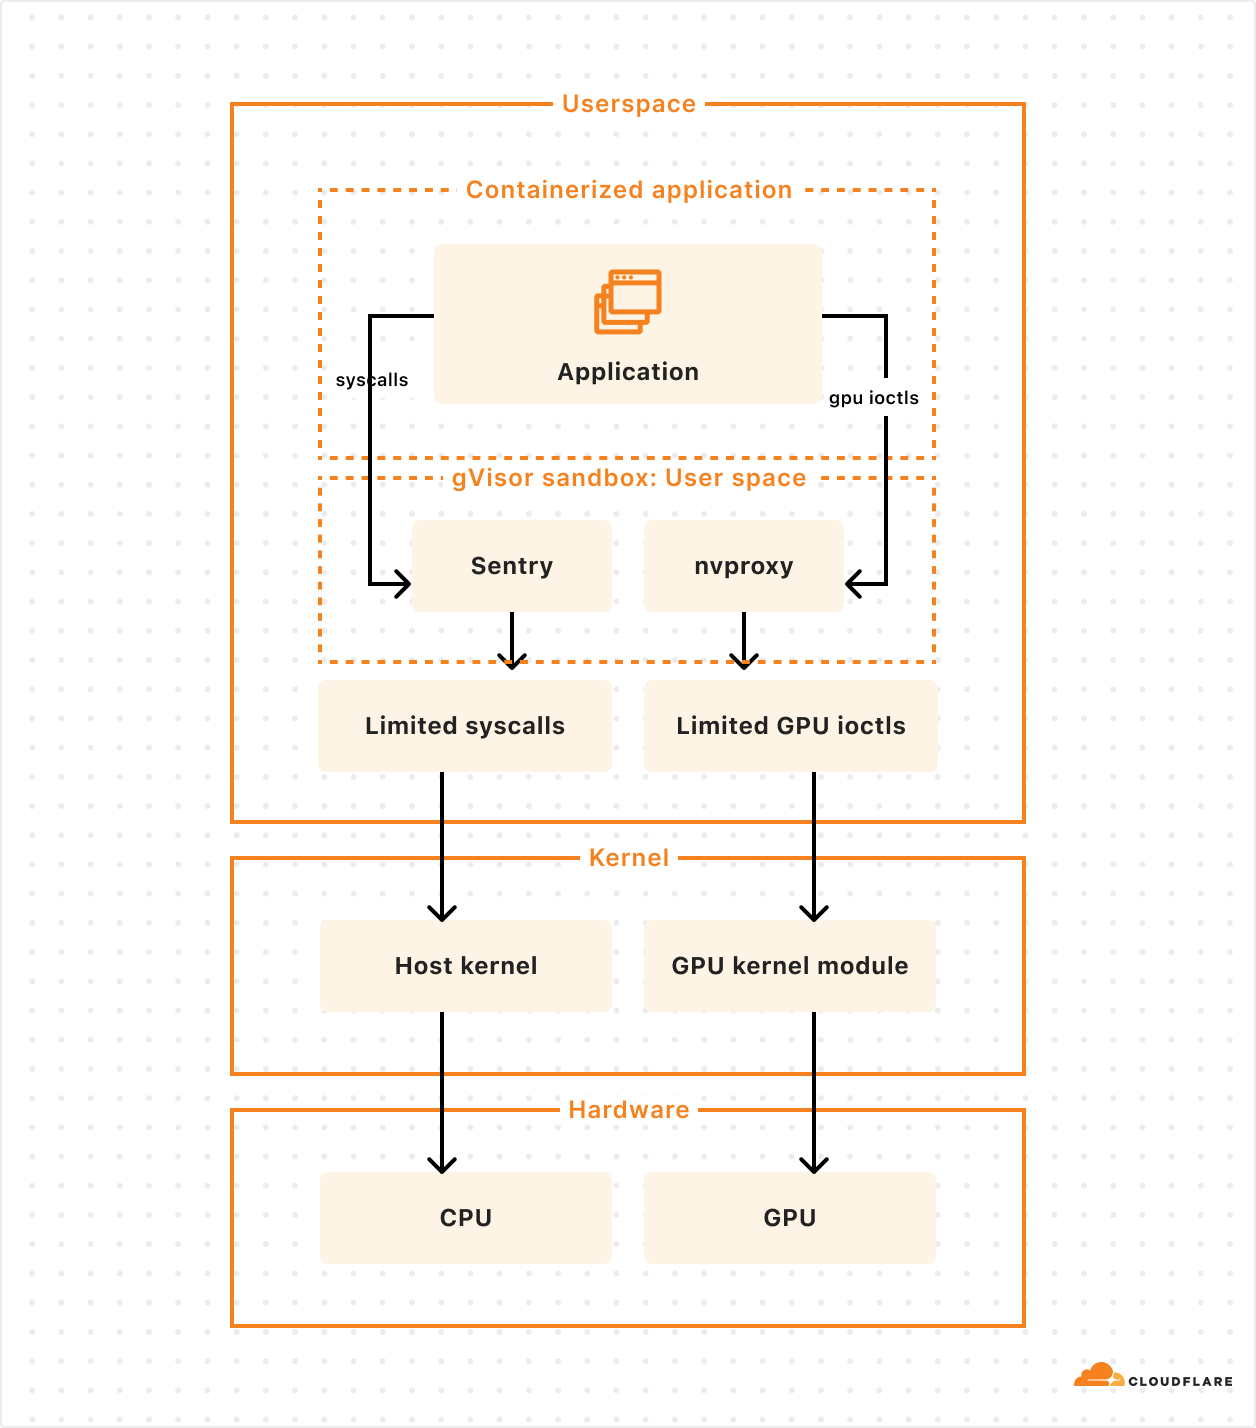
To solve the third challenge, and make scheduling fast with large models, we weren’t satisfied with the status quo. So we did something about it.
Docker pull was too slow, so we fixed it (and cut the time in half)
Many of the images we need to run for AI inference are over 15 GB. Specialized inference libraries and GPU drivers add up fast. For example, when we make a scheduling decision to run a fresh container in Tokyo, naively running docker pull to fetch the image from a storage bucket in Los Angeles would be unacceptably slow. And scheduling speed is critical to being able to scale up and down in new locations in response to changes in traffic.
We had 3 essential requirements:
-
Pulling and pushing very large images should be fast
-
We should not rely on a single point of failure
-
Our teams shouldn’t waste time managing image registries
We needed globally distributed storage, so we used R2. We needed the highest cache hit rate possible, so we used Cloudflare’s Cache, and will soon use Tiered Cache. And we needed a fast container image registry that we could run everywhere, in every Cloudflare location, so we built and open-sourced serverless-registry, which is built on Workers. You can deploy serverless-registry to your own Cloudflare account in about 5 minutes. We rely on it in production.
This is fast, but we can be faster. Our performance bottleneck was, somewhat surprisingly, docker push. Docker uses gzip to compress and decompress layers of images while pushing and pulling. So we started using Zstandard (zstd) instead, which compresses and decompresses faster, and results in smaller compressed files.
In order to build, chunk, and push these images to the R2 registry, we built a custom CLI tool that we use internally in lieu of running docker build and docker push. This makes it easy to use zstd and split layers into 500 MB chunks, which allows uploads to be processed by Workers while staying under body size limits.
Using our custom build and push tool doubled the speed of image pulls. Our 30 GB GPU images now pull in 4 minutes instead of 8. We plan on open sourcing this tool in the near future.
Anycast is the gift that keeps on simplifying — Virtual IPs and the Global State Router
We still had another challenge to solve. And yes, we solved it with anycast. We’re Cloudflare, did you expect anything else?
First, a refresher — Cloudflare operates Unimog, a Layer 4 load balancer that handles all incoming Cloudflare traffic. Cloudflare’s network uses anycast, which allows a single IP address to route requests to a variety of different locations. For most Cloudflare services with anycast, the given IP address will route to the nearest Cloudflare data center, reducing latency. Since Cloudflare runs almost every service in every data center, Unimog can simply route traffic to any Cloudflare metal that is online and has capacity, without needing to map traffic to a specific service that runs on specific metals, only in some locations.
The new compute-heavy, GPU-backed workloads we were taking on forced us to confront this fundamental “everything runs everywhere” assumption. If we run a containerized workflow in 20 Cloudflare locations, how does Unimog know which locations, and which metals, it runs in? You might say “just bring your own load balancer” — but then what happens when you make scheduling decisions to migrate a workload between locations, scale up, or scale down?
Anycast is foundational to how we build fast and simple products on our network, and we needed a way to keep building new types of products this way — where a team can deploy an application, get back a single IP address, and rely on the platform to balance traffic, taking load, container health, and latency into account, without extra configuration. We started letting teams use the container platform without solving this, and it was painfully clear that we needed to do something about it.
So we started integrating directly into our networking stack, building a sidecar service to Unimog. We’ll call this the Global State Router. Here’s how it works:
-
An eyeball makes a request to a virtual IP address issued by Cloudflare
-
Request sent to the best location as determined by BGP routing. This is anycast routing.
-
A small eBPF program sits on the main networking interface and ensures packets bound to a virtual IP address are handled by the Global State Router.
-
The main Global State Router program contains a mapping of all anycast IPs addresses to potential end destination container IP addresses. It updates this mapping based on container health, readiness, distance, and latency. Using this information, it picks a best-fit container.
-
Packets are forwarded at the L4 layer.
-
When a target container’s server receives a packet, its own Global State Router program intercepts the packet and routes it to the local container.
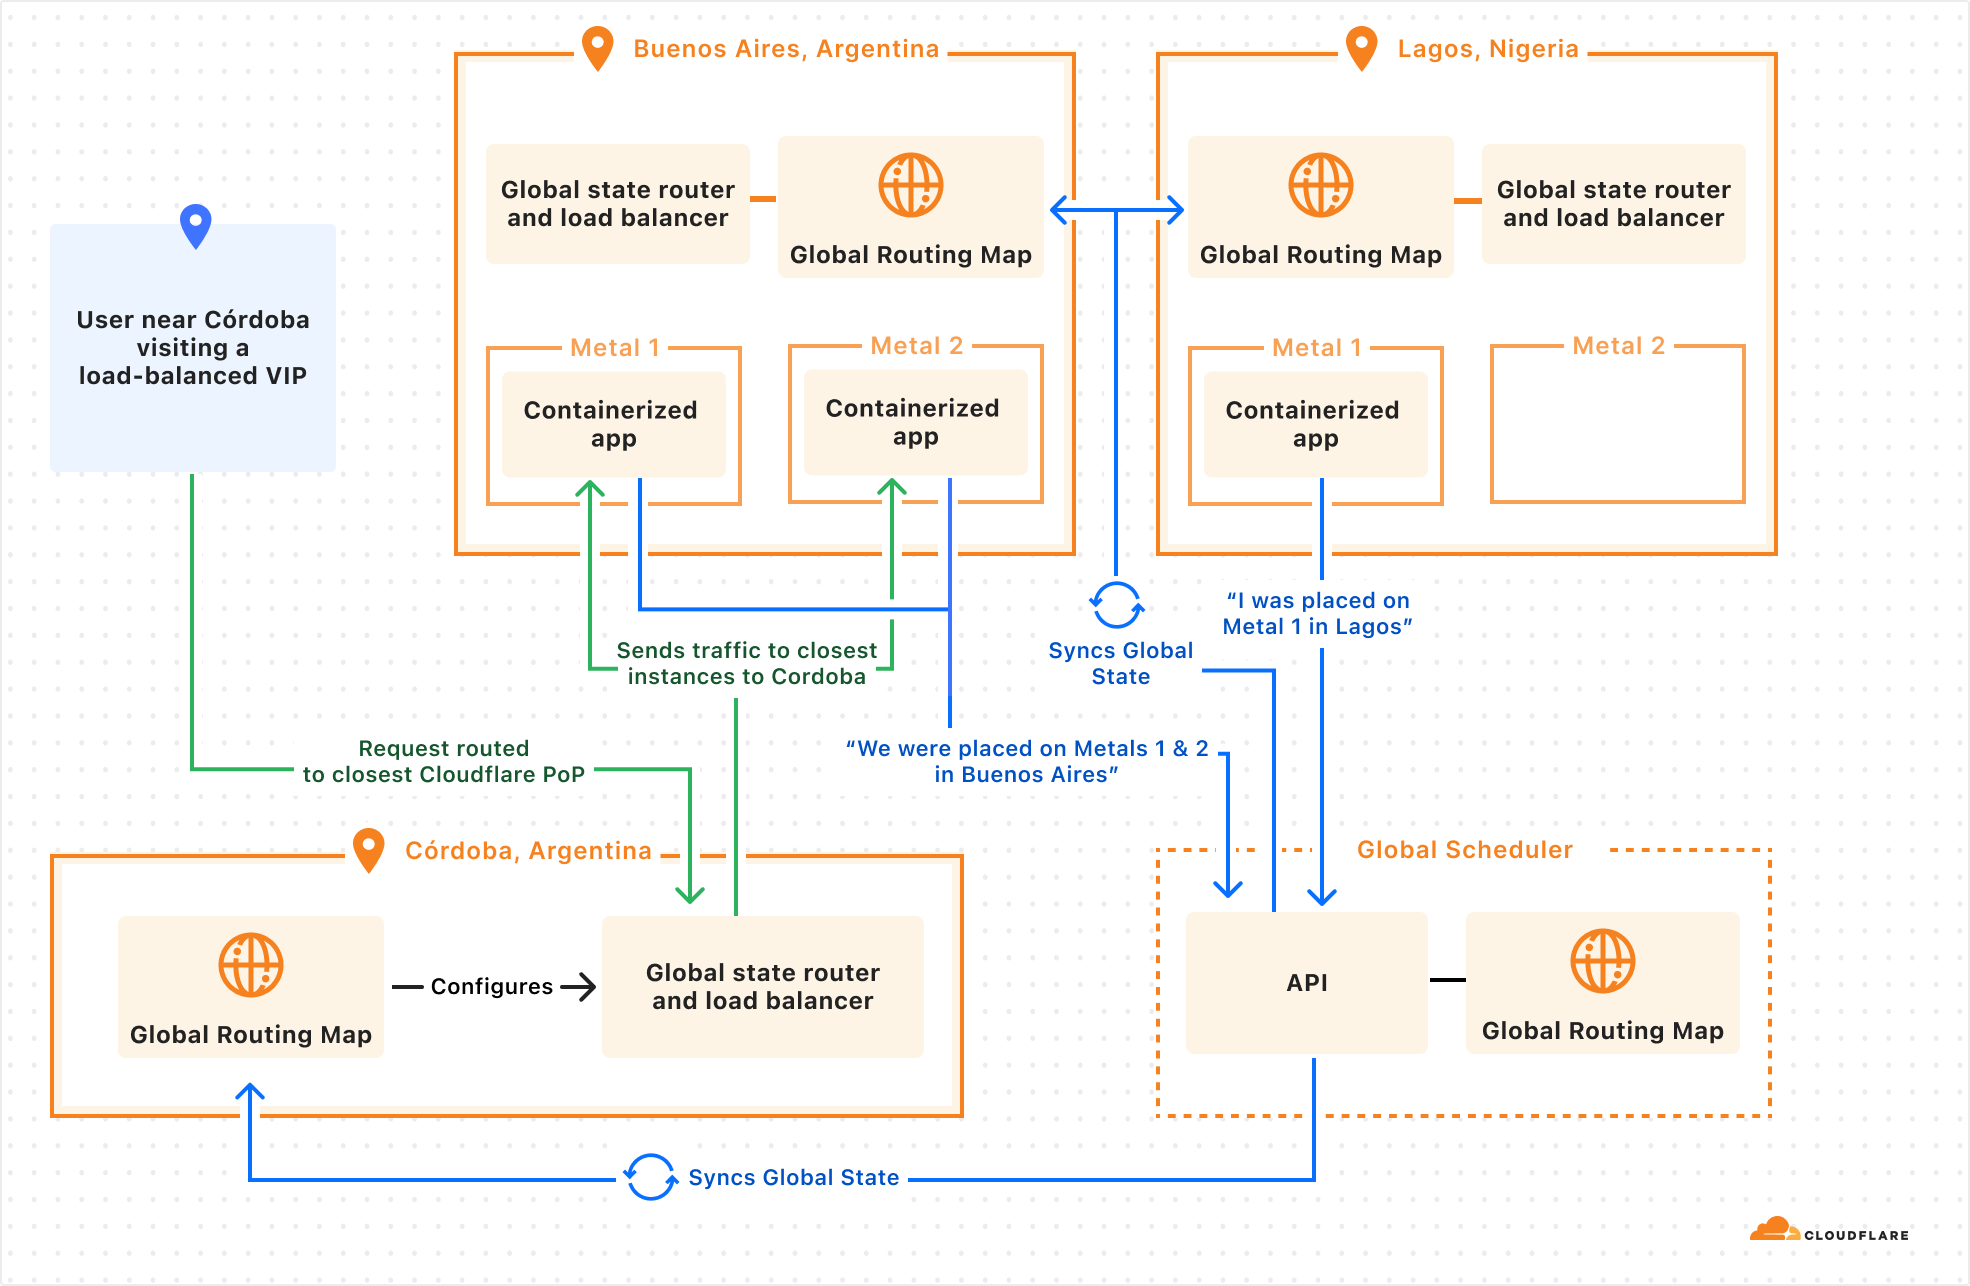
This might sound like just a lower level networking detail, disconnected from developer experience. But by integrating directly with Unimog, we can let developers:
-
Push a containerized application to Cloudflare.
-
Provide constraints, health checks, and load metrics that describe what the application needs.
-
Delegate scheduling and scaling many containers across Cloudflare’s network.
-
Get back a single IP address that can be used everywhere.
We’re actively working on this, and are excited to continue building on Cloudflare’s anycast capabilities, and pushing to keep the simplicity of running “everywhere” with new categories of workloads.
Low latency & global — Remote Browser Isolation & Browser Rendering
Our container platform actually started because of a very specific challenge, running Remote Browser Isolation across our network. Remote Browser Isolation provides Chromium browsers that run on Cloudflare, in containers, rather than on the end user’s own computer. Only the rendered output is sent to the end user. This provides a layer of protection against zero-day browser vulnerabilities, phishing attacks, and ransomware.
Location is critical — people expect their interactions with a remote browser to feel just as fast as if it ran locally. If the server is thousands of miles away, the remote browser will feel slow. Running across Cloudflare’s network of over 330 locations means the browser is nearly always as close to you as possible.
Imagine a user in Santiago, Chile, if they were to access a browser running in the same city, each interaction would incur negligible additional latency. Whereas a browser in Buenos Aires might add 21 ms, São Paulo might add 48 ms, Bogota might add 67 ms, and Raleigh, NC might add 128 ms. Where the container runs significantly impacts the latency of every user interaction with the browser, and therefore the experience as a whole.
It’s not just browser isolation that benefits from running near the user: WebRTC servers stream video better, multiplayer games have less lag, online advertisements can be served faster, financial transactions can be processed faster. Our container platform lets us run anything we need to near the user, no matter where they are in the world.
Using spare compute — “off-peak” jobs for Workers CI/CD builds
At any hour of the day, Cloudflare has many CPU cores that sit idle. This is compute power that could be used for something else.
Via anycast, most of Cloudflare’s traffic is handled as close as possible to the eyeball (person) that requested it. Most of our traffic originates from eyeballs. And the eyeballs of (most) people are closed and asleep between midnight and 5:00 AM local time. While we use our compute capacity very efficiently during the daytime in any part of the world, overnight we have spare cycles. Consider what a map of the world looks like at night-time in Europe and Africa:
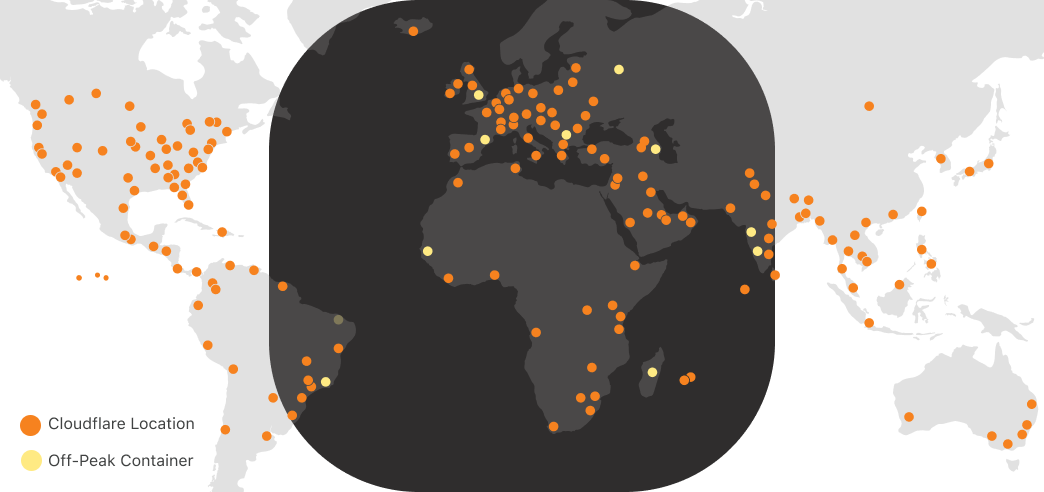
As shown above, we can run containers during “off-peak” in Cloudflare locations receiving low traffic at night. During this time, the CPU utilization of a typical Cloudflare metal looks something like this:
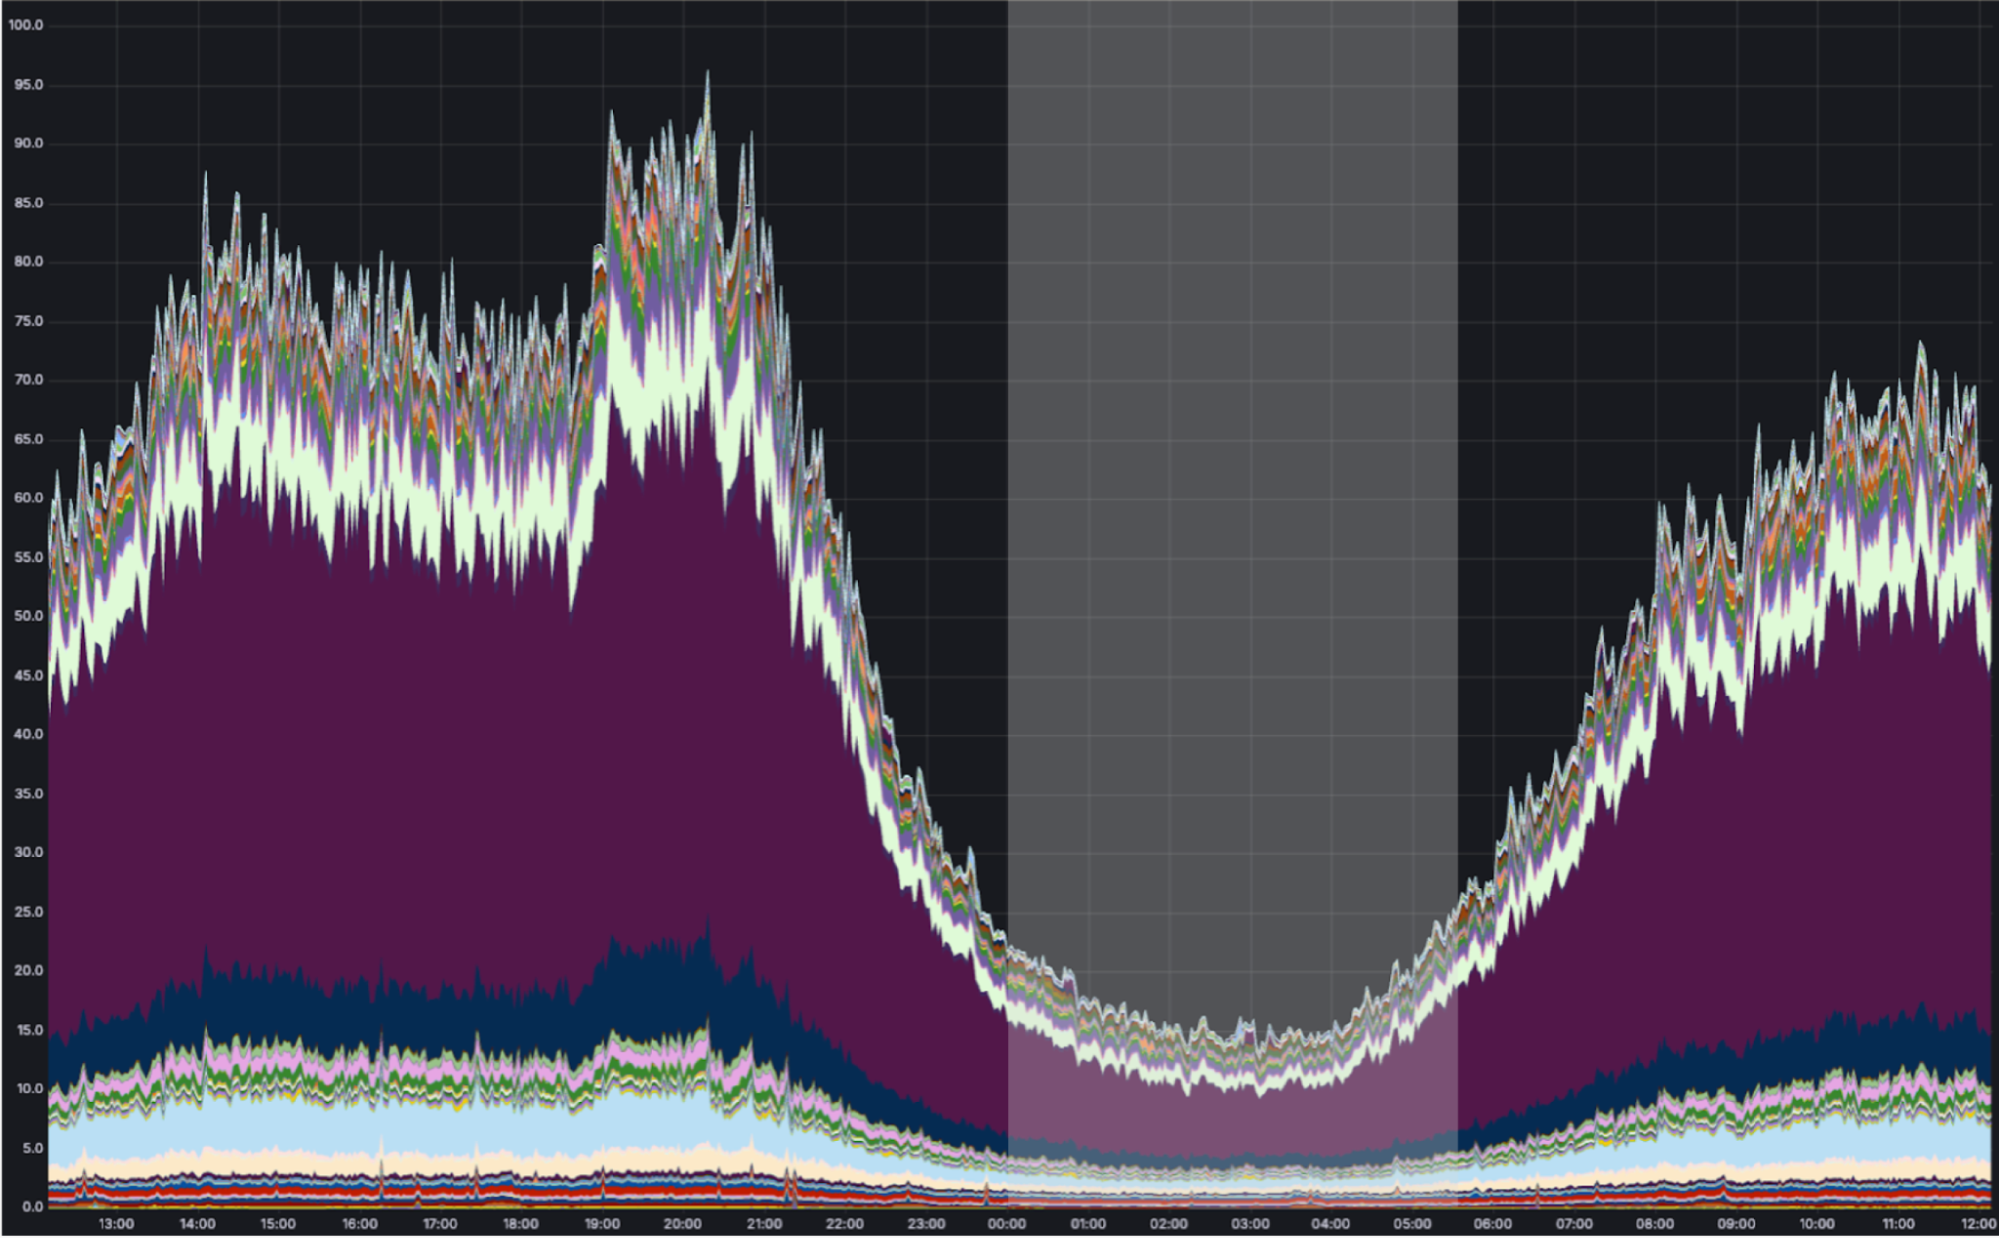
We have many “background” compute workloads at Cloudflare. These are workloads that don’t actually need to run close to the eyeball because there is no eyeball waiting on the request. The challenge is that many of these workloads require running untrusted code — either a dependency on open-source code that we don’t trust enough to run outside of a sandboxed environment, or untrusted code that customers deploy themselves. And unlike Cron Triggers, which already make a best-effort attempt to use off-peak compute, these other workloads can’t run in v8 isolates.
On Builder Day 2024, we announced Workers Builds in open beta. You connect your Worker to a git repository, and Cloudflare builds and deploys your Worker each time you merge a pull request. Workers Builds run on our containers platform, using otherwise idle “off-peak” compute, allowing us to offer lower pricing, and hold more capacity for unexpected spikes in traffic in Cloudflare locations during daytime hours when load is highest. We preserve our ability to serve requests as close to the eyeball as possible where it matters, while using the full compute capacity of our network.
We developed a purpose-built API for these types of jobs. The Workers Builds service has zero knowledge of where Cloudflare has spare compute capacity on its network — it simply schedules an “off-peak” job to run on the containers platform, by defining a scheduling policy:
scheduling_policy: "off-peak"
Making off-peak jobs faster with prewarmed images
Just because a workload isn’t “eyeball-facing” doesn’t mean speed isn’t relevant. When a build job starts, you still want it to start as soon as possible.
Each new build requires a fresh container though, and we must avoid reusing containers to provide strong isolation between customers. How can we keep build job start times low, while using a new container for each job without over-provisioning?
We prewarm servers with the proper image.
Before a server becomes eligible to receive an “off peak” job, the container platform instructs it to download the correct image. Once the image is downloaded and cached locally, new containers can start quickly in a Firecracker VM after receiving a request for a new build. When a build completes, we throw away the container, and start the next build using a fresh container based on the prewarmed image.
Without prewarming, pulling and unpacking our Workers Build images would take roughly 75 seconds. With prewarming, we’re able to spin up a new container in under 10 seconds. We expect this to get even faster as we introduce optimizations like pre-booting images before new runs, or Firecracker snapshotting, which can restore a VM in under 200ms.
Workers and containers, better together
As more of our own engineering teams rely on our containers platform in production, we’ve noticed a pattern: they want a deeper integration with Workers.
We plan to give it to them.
Let’s take a look at a project deployed on our container platform already, Key Transparency. If the container platform were highly integrated with Workers, what would this team’s experience look like?
Cloudflare regularly audits changes to public keys used by WhatsApp for encrypting messages between users. Much of the architecture is built on Workers, but there are long-running compute-intensive tasks that are better suited for containers.
We don’t want our teams to have to jump through hoops to deploy a container and integrate with Workers. They shouldn’t have to pick specific regions to run in, figure out scaling, expose IPs and handle IP updates, or set up Worker-to-container auth.
We’re still exploring many different ideas and API designs, and we want your feedback. But let’s imagine what it might look like to use Workers, Durable Objects and Containers together.
In this case, an outer layer of Workers handles most business logic and ingress, a specialized Durable Object is configured to run alongside our new container, and the platform ensures the image is loaded on the right metals and can scale to meet demand.
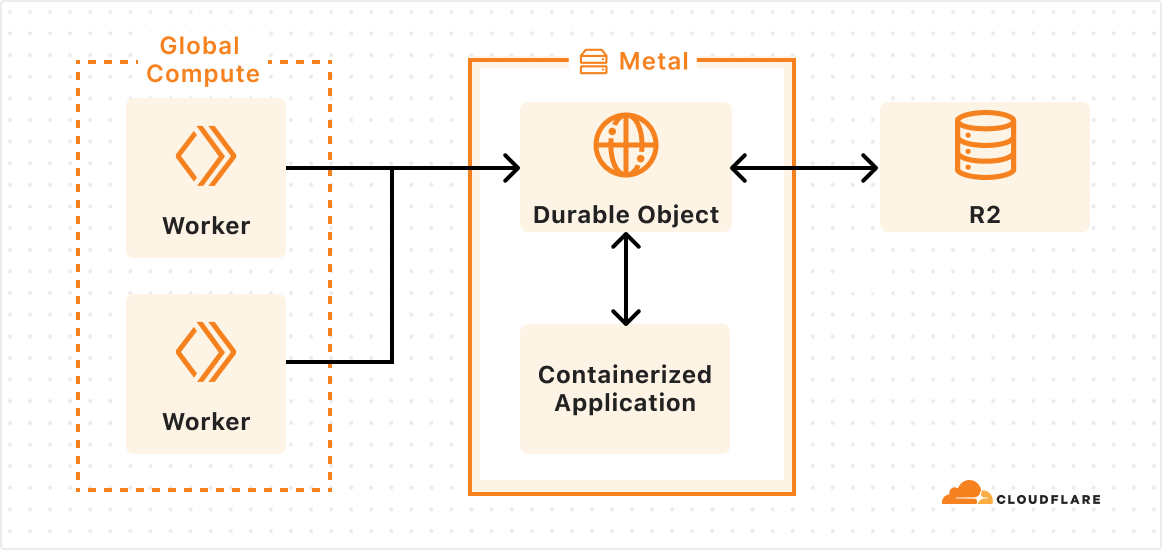
I add a containerized app to the wrangler.toml configuration file of my Worker (or Terraform):
[[container-app]]
image = "./key-transparency/verifier/Dockerfile"
name = "verifier"

[durable_objects]
bindings = { name = "VERIFIER", class_name = "Verifier", container = "verifier" } }
Then, in my Worker, I call the runVerification RPC method of my Durable Object:
fetch(request, env, ctx) {
  const id = new URL(request.url).searchParams.get('id')
  const durableObjectId = env.VERIFIER.idFromName(request.params.id);
  await env.VERIFIER.get(durableObjectId).runVerification()
  //...
}
From my Durable Object I can boot, configure, mount storage buckets as directories, and make HTTP requests to the container:
class Verifier extends DurableObject {
  constructor(state, env) {
    this.ctx.blockConcurrency(async () => {

      // starts the container
      await this.ctx.container.start();

      // configures the container before accepting traffic
      const config = await this.state.storage.get("verifierConfig");
      await this.ctx.container.fetch("/set-config", { method: "PUT", body: config});
    })
  }

  async runVerification(updateId) {
    // downloads & mounts latest updates from R2
    const latestPublicKeyUpdates = await this.env.R2.get(`public-key-updates/${updateId}`);
    await this.ctx.container.mount(`/updates/${updateId}`, latestPublicKeyUpdates);

    // starts verification via HTTP call
    return await this.ctx.container.fetch(`/verifier/${updateId}`);
  }
}
And… that’s it.
I didn’t have to worry about placement, scaling, service discovery authorization, and I was able to leverage integrations into other services like KV and R2 with just a few lines of code. The container platform took care of routing, placement, and auth. If I needed more instances, I could call the binding with a new ID, and the platform would scale up containers for me.
We are still in the early stages of building these integrations, but we’re excited about everything that containers will bring to Workers and vice versa.
So, what do you want to build?
If you’ve read this far, there’s a non-zero chance you were hoping to get to run a container yourself on our network. While we’re not ready (quite yet) to open up the platform to everyone, now that we’ve built a few GA products on our container platform, we’re looking for a handful of engineering teams to start building, in advance of wider availability in 2025. And we’re continuing to hire engineers to work on this.
We’ve told you about our use cases for containers, and now it’s your turn. If you’re interested, tell us here what you want to build, and why it goes beyond what’s possible today in Workers and on our Developer Platform. What do you wish you could build on Cloudflare, but can’t yet today?
AI Everywhere with the WAF Rule Builder Assistant, Cloudflare Radar AI Insights, and updated AI bot protection
Post Syndicated from Adam Martinetti original https://blog.cloudflare.com/bringing-ai-to-cloudflare
The continued growth of AI has fundamentally changed the Internet over the past 24 months. AI is increasingly ubiquitous, and Cloudflare is leaning into the new opportunities and challenges it presents in a big way. This year for Cloudflare’s birthday, we’ve extended our AI Assistant capabilities to help you build new WAF rules, added AI bot traffic insights on Cloudflare Radar, and given customers new AI bot blocking capabilities.
AI Assistant for WAF Rule Builder

At Cloudflare, we’re always listening to your feedback and striving to make our products as user-friendly and powerful as possible. One area where we’ve heard your feedback loud and clear is in the complexity of creating custom and rate-limiting rules for our Web Application Firewall (WAF). With this in mind, we’re excited to introduce a new feature that will make rule creation easier and more intuitive: the AI Assistant for WAF Rule Builder.
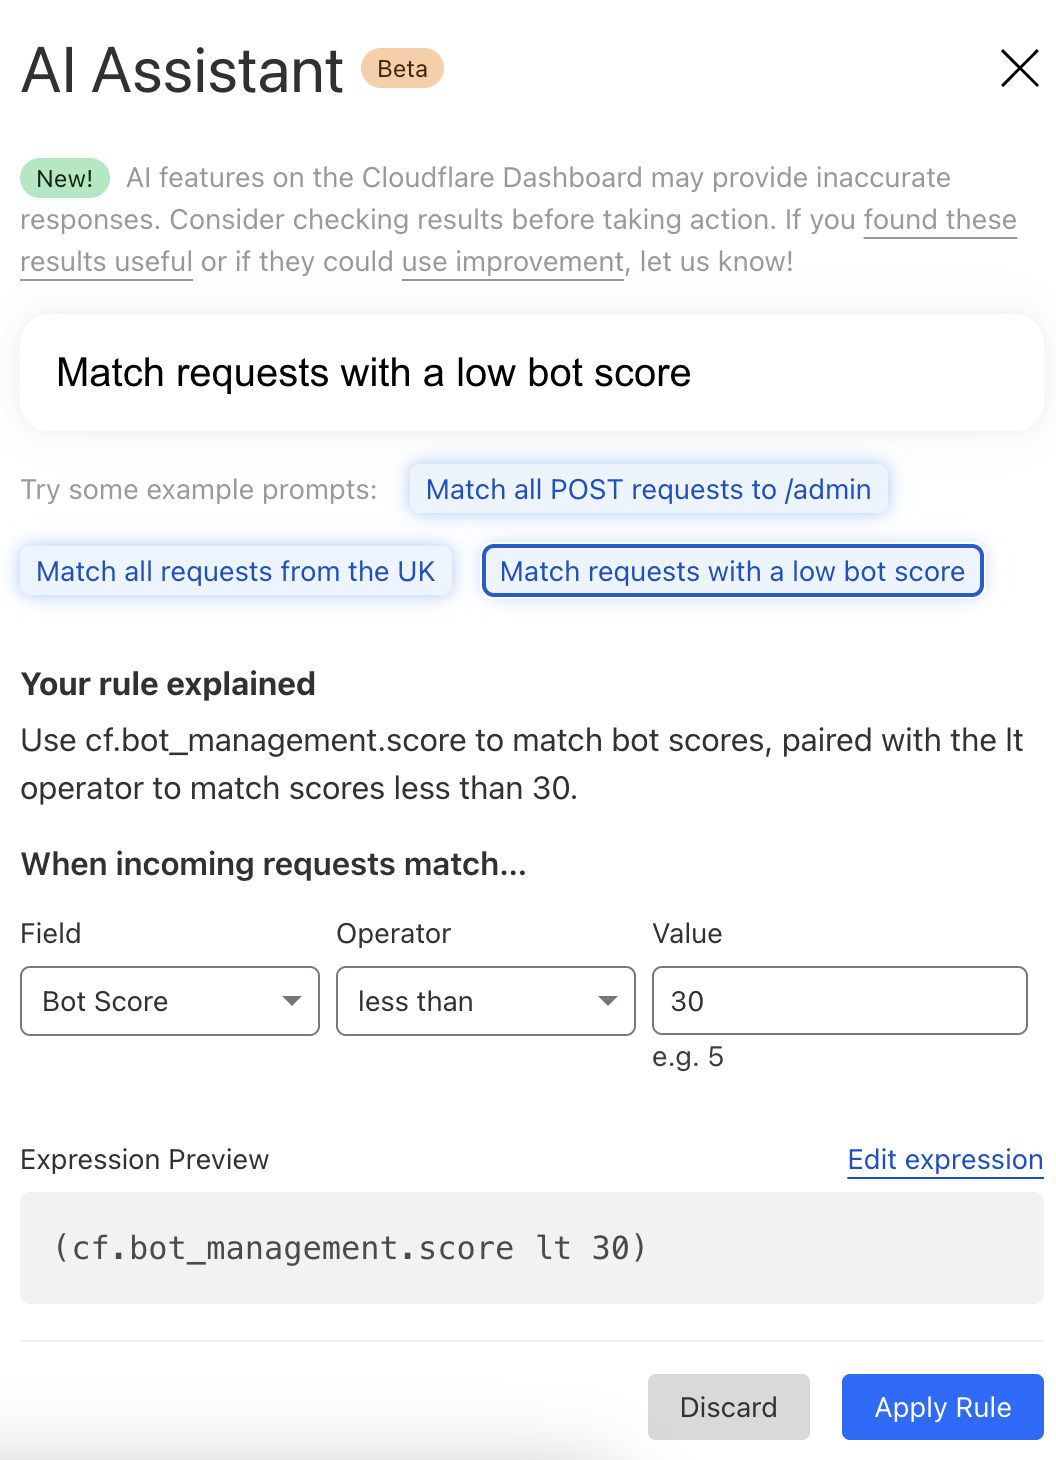
By simply entering a natural language prompt, you can generate a custom or rate-limiting rule tailored to your needs. For example, instead of manually configuring a complex rule matching criteria, you can now type something like, “Match requests with low bot score,” and the assistant will generate the rule for you. It’s not about creating the perfect rule in one step, but giving you a strong foundation that you can build on.
The assistant will be available in the Custom and Rate Limit Rule Builder for all WAF users. We’re launching this feature in Beta for all customers, and we encourage you to give it a try. We’re looking forward to hearing your feedback (via the UI itself) as we continue to refine and enhance this tool to meet your needs.
AI bot traffic insights on Cloudflare Radar
AI platform providers use bots to crawl and scrape websites, vacuuming up data to use for model training. This is frequently done without the permission of, or a business relationship with, the content owners and providers. In July, Cloudflare urged content owners and providers to “declare their AIndependence”, providing them with a way to block AI bots, scrapers, and crawlers with a single click. In addition to this so-called “easy button” approach, sites can provide more specific guidance to these bots about what they are and are not allowed to access through directives in a robots.txt file. Regardless of whether a customer chooses to block or allow requests from AI-related bots, Cloudflare has insight into request activity from these bots, and associated traffic trends over time.
Tracking traffic trends for AI bots can help us better understand their activity over time — which are the most aggressive and have the highest volume of requests, which launch crawls on a regular basis, etc. The new AI bot & crawler traffic graph on Radar’s Traffic page provides insight into these traffic trends gathered over the selected time period for the top known AI bots. The associated list of bots tracked here is based on the ai.robots.txt list, and will be updated with new bots as they are identified. Time series and summary data is available from the Radar API as well. (Traffic trends for the full set of AI bots & crawlers can be viewed in the new Data Explorer.)
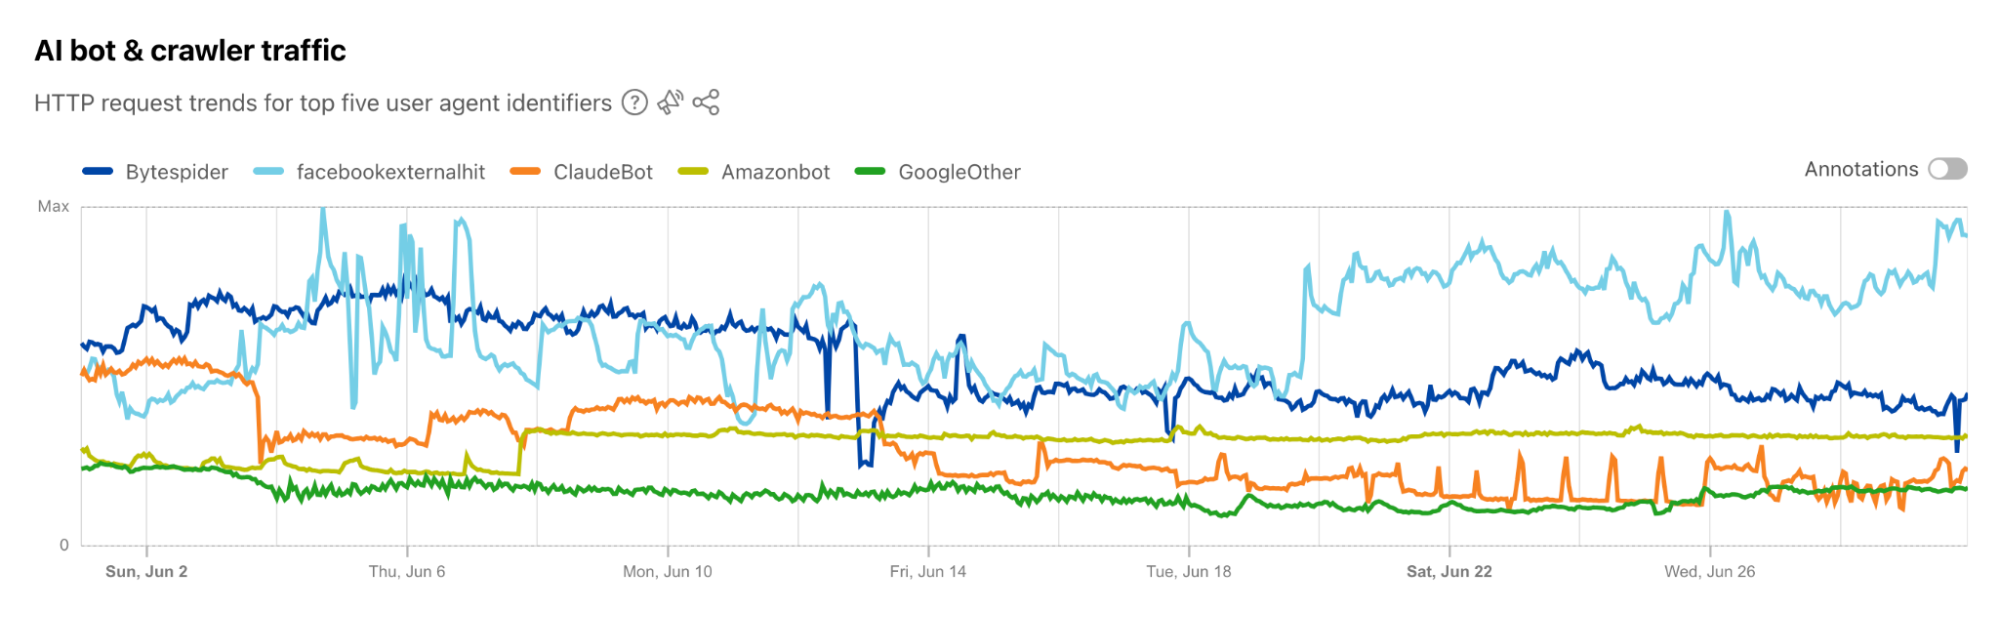
Blocking more AI bots

For Cloudflare’s birthday, we’re following up on our previous blog post, Declaring Your AIndependence, with an update on the new detections we’ve added to stop AI bots. Customers who haven’t already done so can simply click the button to block AI bots to gain more protection for their website.
Enabling dynamic updates for the AI bot rule
The old button allowed customers to block verified AI crawlers, those that respect robots.txt and crawl rate, and don’t try to hide their behavior. We’ve added new crawlers to that list, but we’ve also expanded the previous rule to include 27 signatures (and counting) of AI bots that don’t follow the rules. We want to take time to say “thank you” to everyone who took the time to use our “tip line” to point us towards new AI bots. These tips have been extremely helpful in finding some bots that would not have been on our radar so quickly.
For each bot we’ve added, we’re also adding them to our “Definitely automated” definition as well. So, if you’re a self-service plan customer using Super Bot Fight Mode, you’re already protected. Enterprise Bot Management customers will see more requests shift from the “Likely Bot” range to the “Definitely automated” range, which we’ll discuss more below.
Under the hood, we’ve converted this rule logic to a Cloudflare managed rule (the same framework that powers our WAF). This enables our security analysts and engineers to safely push updates to the rule in real-time, similar to how new WAF rule changes are rapidly delivered to ensure our customers are protected against the latest CVEs. If you haven’t logged back into the Bots dashboard since the previous version of our AI bot protection was announced, click the button again to update to the latest protection.
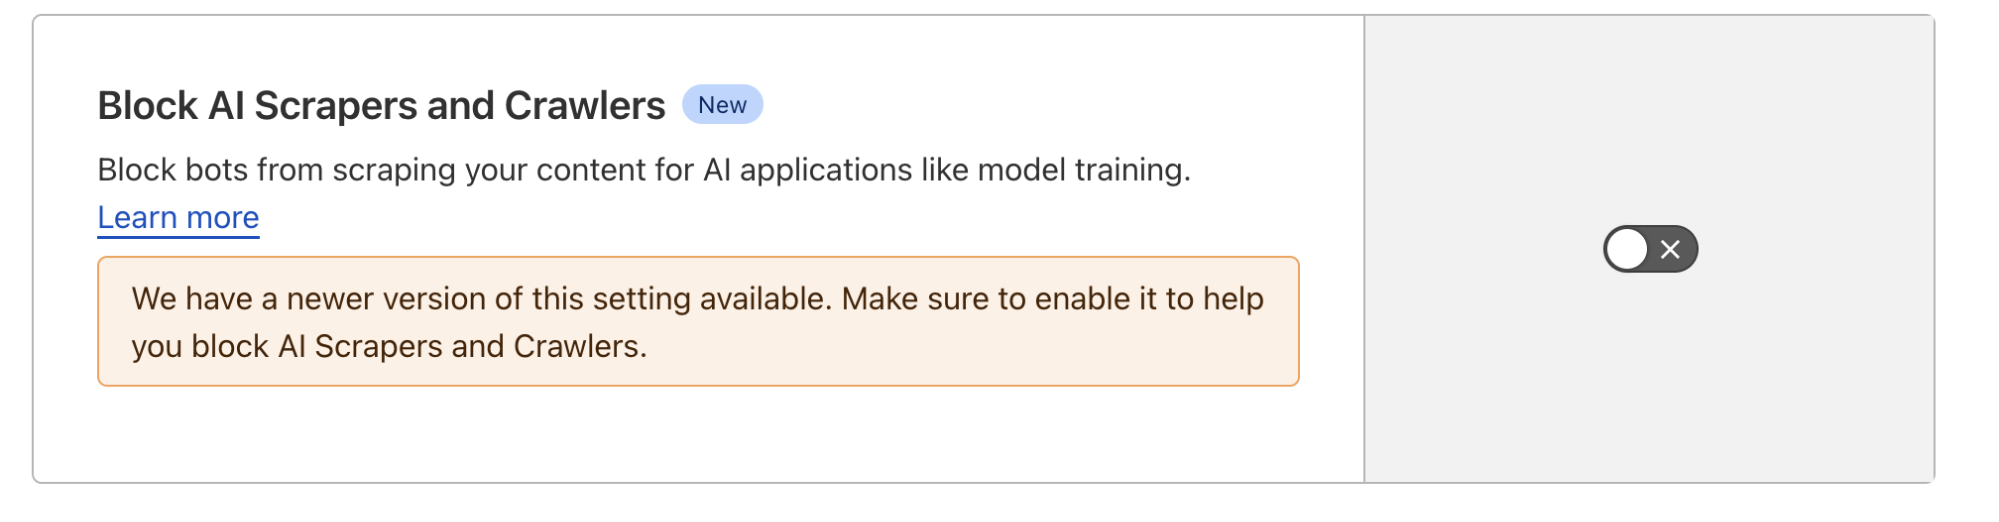
The impact of new fingerprints on the model
One hidden beneficiary of fingerprinting new AI bots is our ML model. As we’ve discussed before, our global ML model uses supervised machine learning and greatly benefits from more sources of labeled bot data. Below, you can see how well our ML model recognized these requests as automated, before and after we updated the button, adding new rules. To keep things simple, we have shown only the top 5 bots by the volume of requests on the chart. With the introduction of our new managed rule, we have observed an improvement in our detection capabilities for the majority of these AI bots. Button v1 represents the old option that let customers block only verified AI crawlers, while Button v2 is the newly introduced feature that includes managed rule detections.
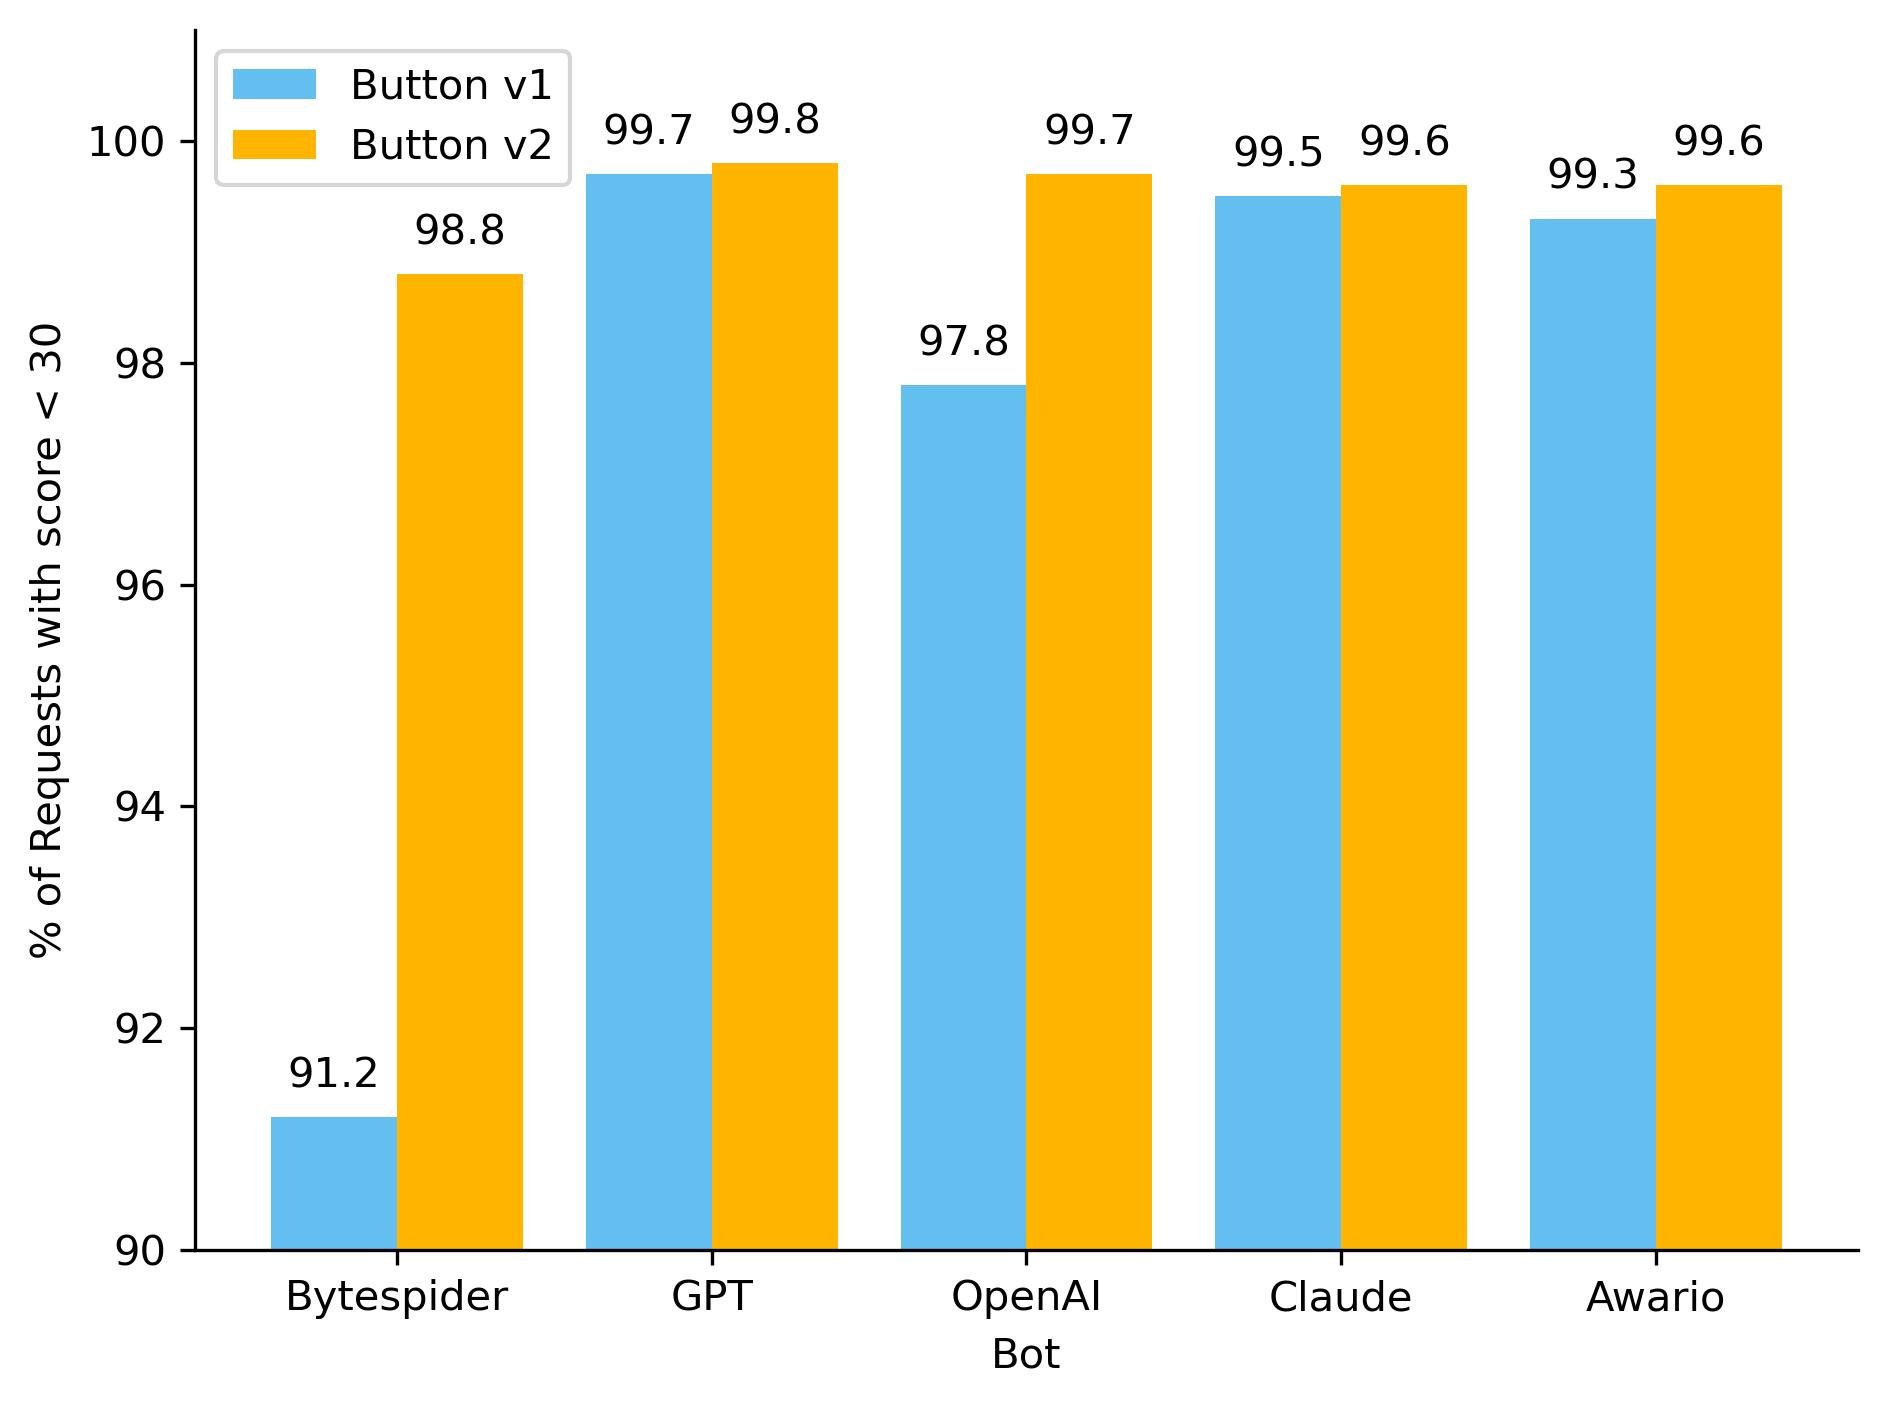
So how did we make our detections more robust? As we have mentioned before, sometimes a single attribute can give a bot away. We developed a sophisticated set of heuristics tailored to these AI bots, enabling us to effortlessly and accurately classify them as such. Although our ML model was already detecting the vast majority of these requests, the integration of additional heuristics has resulted in a noticeable increase in detection rates for each bot, and ensuring we score every request correctly 100% of the time. Transitioning from a purely machine learning approach to incorporating heuristics offers several advantages, including faster detection times and greater certainty in classification. While deploying a machine learning model is complex and time-consuming, new heuristics can be created in minutes.
The initial launch of the AI bots block button was well-received and is now used by over 133,000 websites, with significant adoption even among our Free tier customers. The newly updated button, launched on August 20, 2024, is rapidly gaining traction. Over 90,000 zones have already adopted the new rule, with approximately 240 new sites integrating it every hour. Overall, we are now helping to protect the intellectual property of more than 146,000 sites from AI bots, and we are currently blocking 66 million requests daily with this new rule. Additionally, we’re excited to announce that support for configuring AI bots protection via Terraform will be available by the end of this year, providing even more flexibility and control for managing your bot protection settings.
Bot behavior
With the enhancements to our detection capabilities, it is essential to assess the impact of these changes to bot activity on the Internet. Since the launch of the updated AI bots block button, we have been closely monitoring for any shifts in bot activity and adaptation strategies. The most basic fingerprinting technique we use to identify AI bot looking for simple user-agent matches. User-agent matches are important to monitor because they indicate the bot is transparently announcing who they are when they’re crawling a website.
The graph below shows a volume of traffic we label as AI bot over the past two months. The blue line indicates the daily request count, while the red line represents the monthly average number of requests. In the past two months, we have seen an average reduction of nearly 30 million requests, with a decrease of 40 million in the most recent month.This decline coincides with the release of Button v1 and Button v2. Our hypothesis is that with the new AI bots blocking feature, Cloudflare is blocking a majority of these bots, which is discouraging them from crawling.
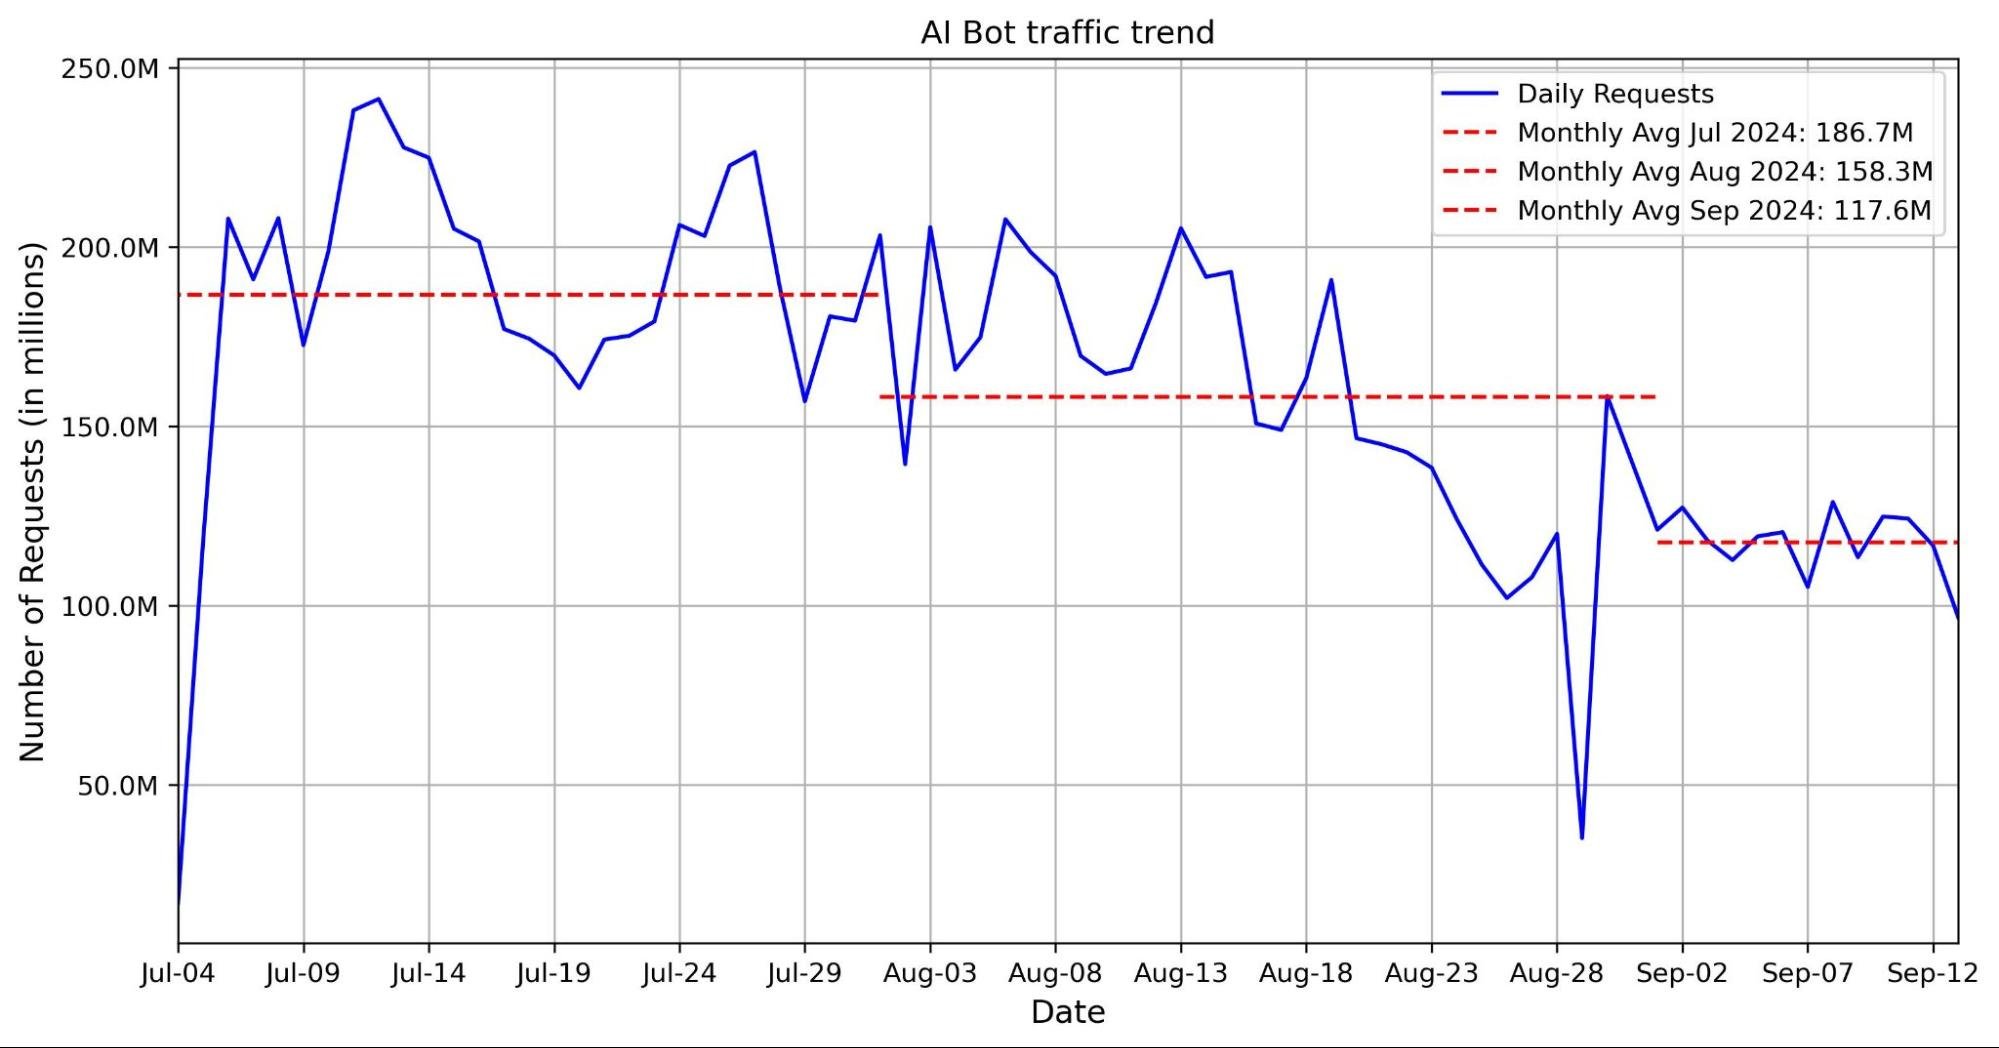
This hypothesis is supported by the observed decline in requests from several top AI crawlers. Specifically, the Bytespider bot reduced its daily requests from approximately 100 million to just 50 million between the end of June and the end of August (see graph below). This reduction could be attributed to several factors, including our new AI bots block button and changes in the crawler’s strategy.
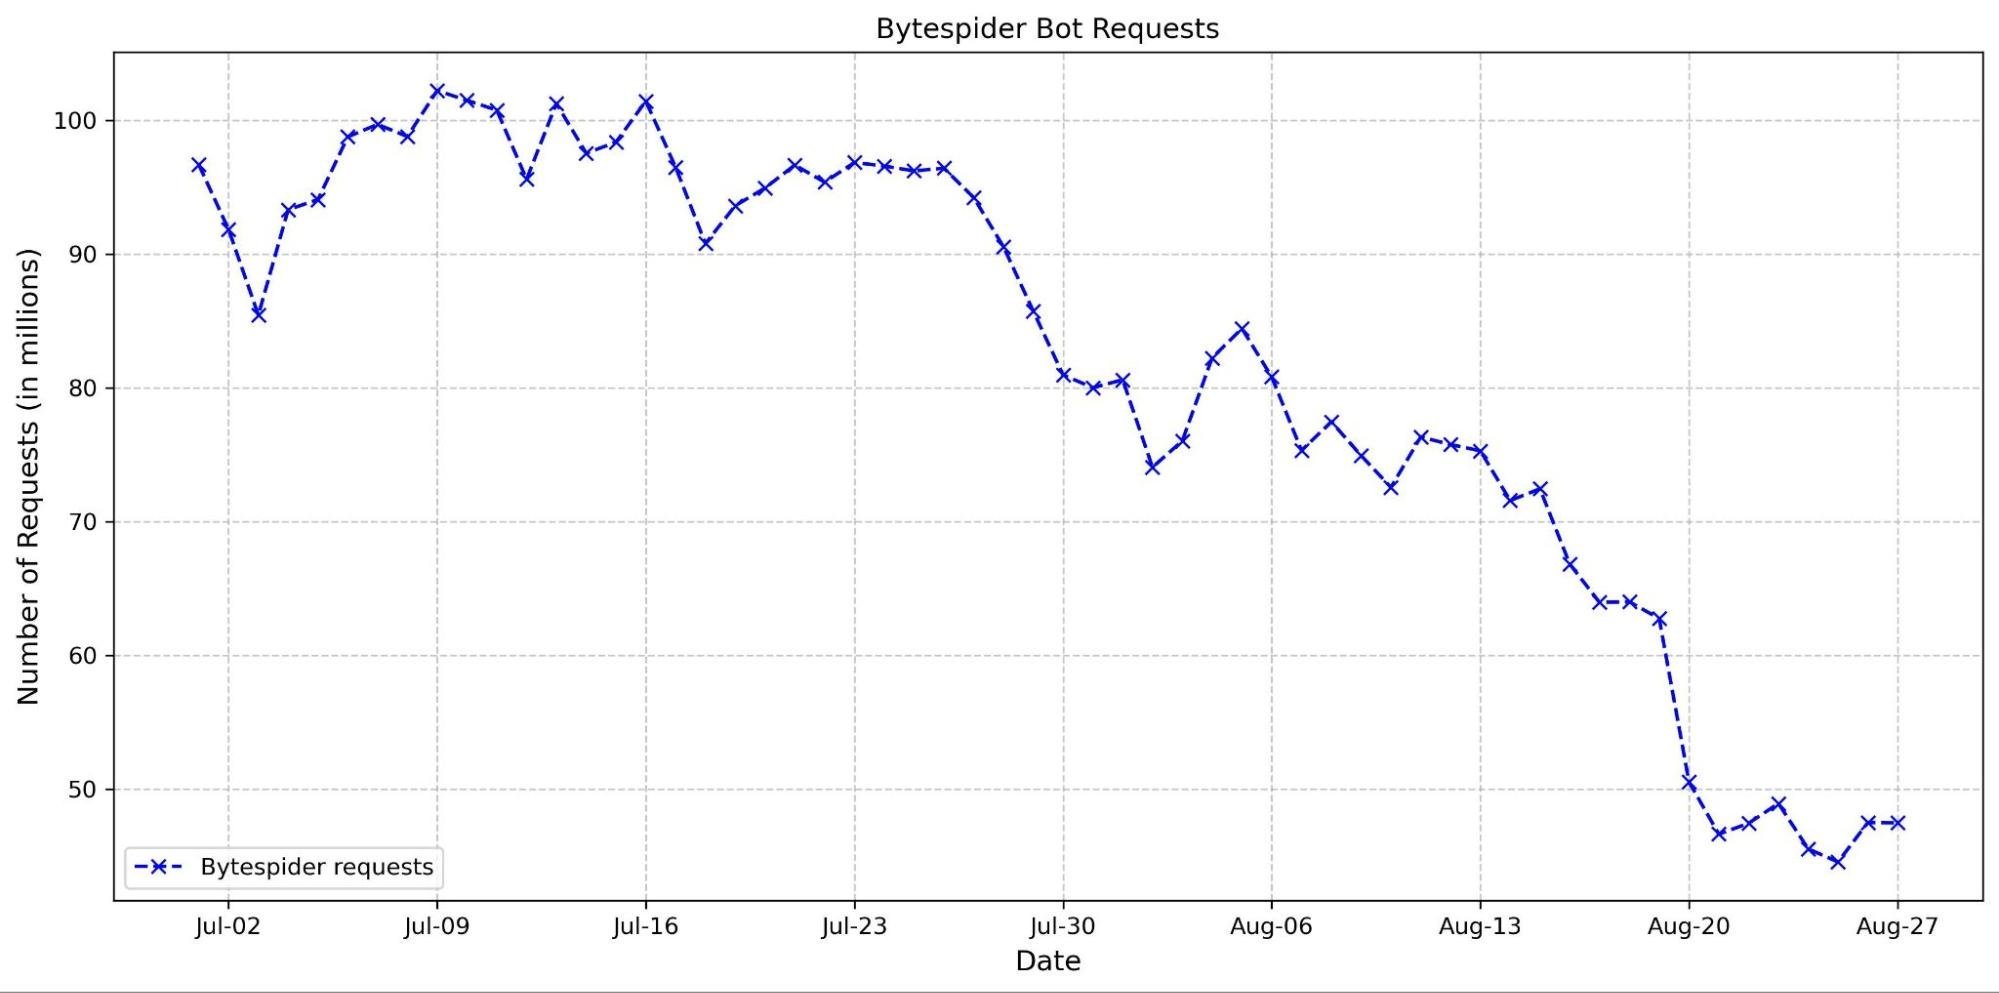
We have also observed an increase in the accountability of some AI crawlers. The most basic fingerprinting technique we use to identify AI bot looking for simple user-agent matches. User-agent matches are important to monitor because they indicate the bot is transparently announcing who they are when they’re crawling a website. These crawlers are now more frequently using their agents, reflecting a shift towards more transparent and responsible behavior. Notably, there has been a dramatic surge in the number of requests from the Perplexity user agent. This increase might be linked to previous accusations that Perplexity did not properly present its user agent, which could have prompted a shift in their approach to ensure better identification and compliance.
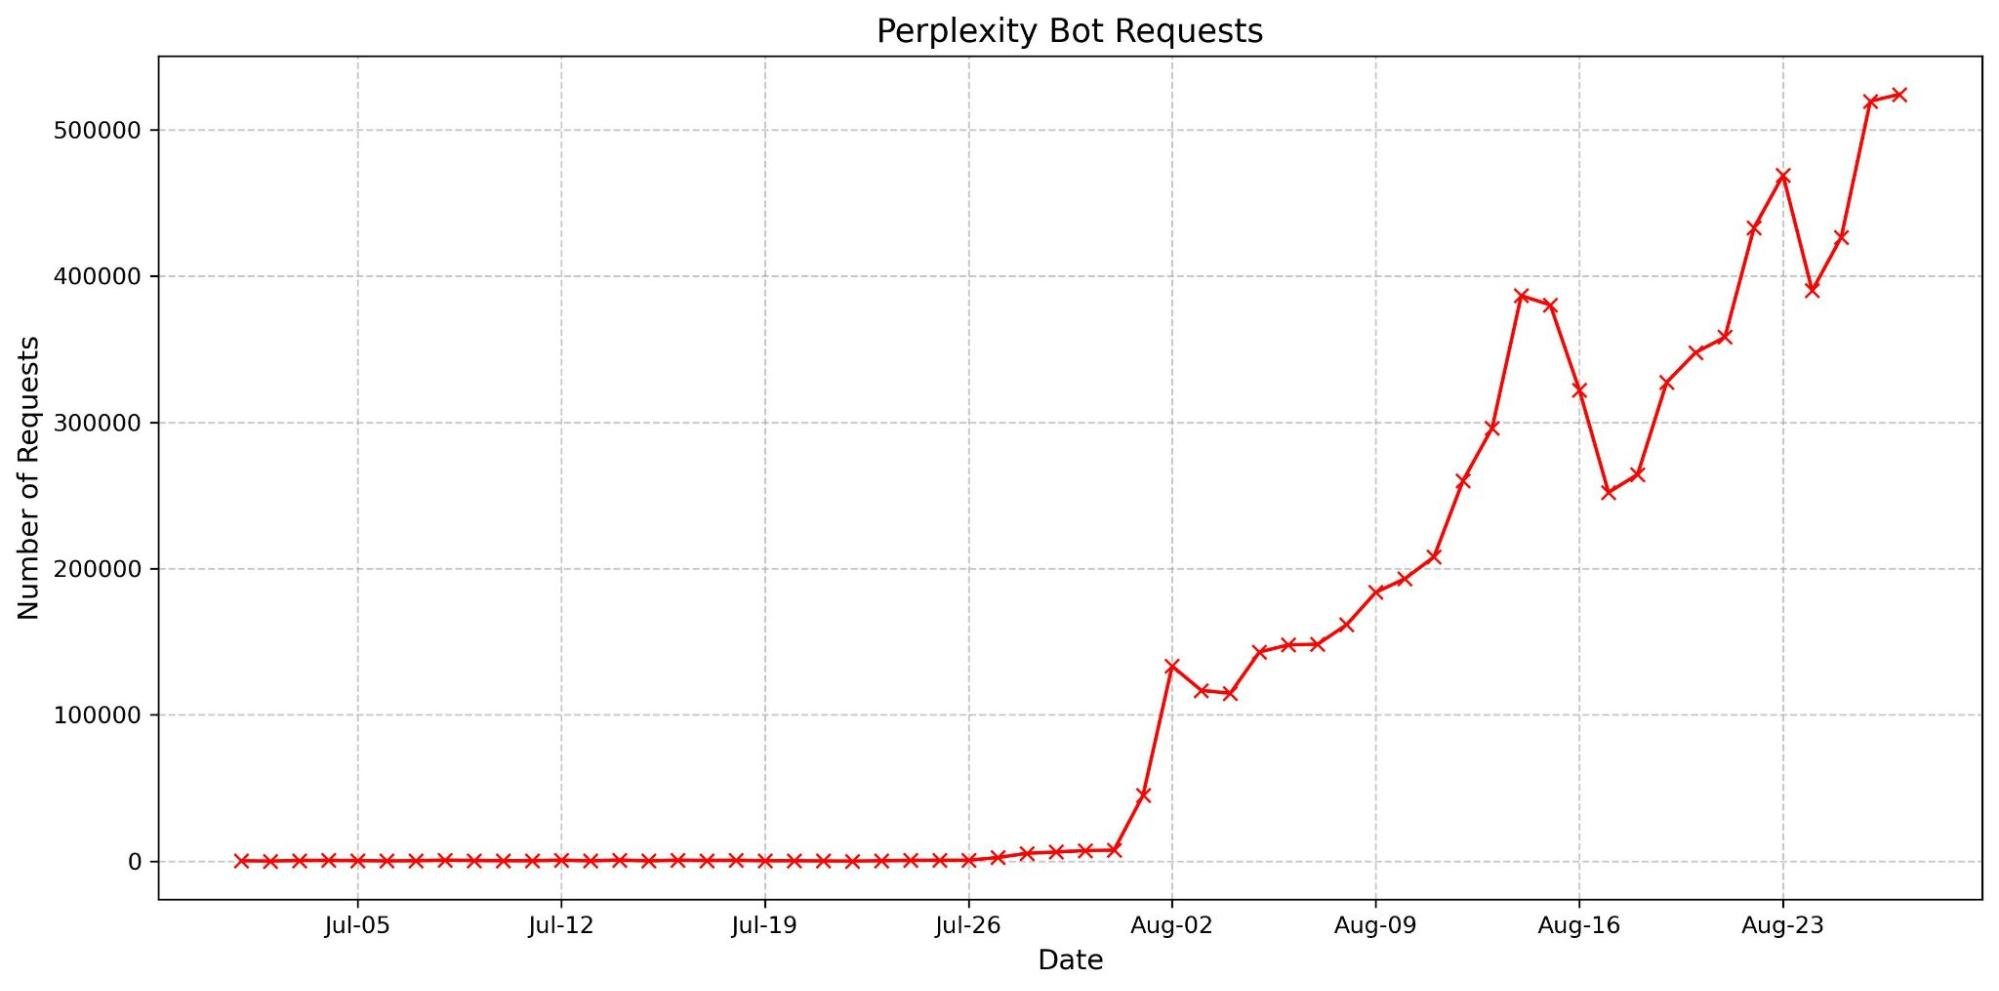
These trends suggest that our updates are likely affecting how AI crawlers interact with content. We will continue to monitor AI bot activity to help users control who accesses their content and how. By keeping a close watch on emerging patterns, we aim to provide users with the tools and insights needed to make informed decisions about managing their traffic.
Wrap up
We’re excited to continue to explore the AI landscape, whether we’re finding more ways to make the Cloudflare dashboard usable or new threats to guard against. Our AI insights on Radar update in near real-time, so please join us in watching as new trends emerge and discussing them in the Cloudflare Community.
The Modern Political Assassin
Post Syndicated from The Atlantic original https://www.youtube.com/watch?v=kgnR_71LSaY
When the US Government Tried to Control Hurricanes: Project Stormfury
Post Syndicated from The History Guy: History Deserves to Be Remembered original https://www.youtube.com/watch?v=k3BYSZQG0R4