DNS resolvers (those that handle DNSSEC, at least) are almost uniformly
vulnerable to an exploit
that has been named “KeyTrap”. In short, the right type of packet can
send a DNS system into something close to an infinite loop, taking it out
of service indefinitely.
With just a single DNS packet, hackers could paralyze all common
DNS implementations and public DNS providers. Exploiting this
attack would have serious consequences for any application that
uses the internet, including the unavailability of technologies
such as web browsers, email and instant messaging. This devastating
effect prompted major DNS vendors to call KeyTrap “The worst attack
on DNS ever discovered”
Some more information and pointers to updates can be found on the
CVE-2023-50387 page; some distributors have been faster to get updates
out than others.
Qubes OS is a security-focused desktop Linux distribution built on Fedora Linux and the Xen hypervisor. Qubes uses virtualization to run applications, system services, and devices access via virtual machines called “qubes” that have varying levels of trust and persistence to provide an open-source “reasonably secure” operating system with “serious privacy“. The Qubes 4.2.0 release, from December 2023, brings a number of refinements to make Qubes OS easier to manage and use.
You can ingest and integrate data from multiple Internet of Things (IoT) sensors to get insights. However, you may have to integrate data from multiple IoT sensor devices to derive analytics like equipment health information from all the sensors based on common data elements. Each of these sensor devices could be transmitting data with unique schemas and different attributes.
You can ingest data from all your IoT sensors to a central location on Amazon Simple Storage Service (Amazon S3). Schema evolution is a feature where a database table’s schema can evolve to accommodate for changes in the attributes of the files getting ingested. With the schema evolution functionality available in AWS Glue, Amazon Redshift Spectrum can automatically handle schema changes when new attributes get added or existing attributes get dropped. This is achieved with an AWS Glue crawler by reading schema changes based on the S3 file structures. The crawler creates a hybrid schema that works with both old and new datasets. You can read from all the ingested data files at a specified Amazon S3 location with different schemas through a single Amazon Redshift Spectrum table by referring to the AWS Glue metadata catalog.
In this post, we demonstrate how to use the AWS Glue schema evolution feature to read from multiple JSON formatted files with various schemas that are stored in a single Amazon S3 location. We also show how to query this data in Amazon S3 with Redshift Spectrum without redefining the schema or loading the data into Redshift tables.
Solution overview
The solution consists of the following steps:
Create an Amazon Data Firehose delivery stream with Amazon S3 as its destination.
Generate sample stream data from the Amazon Kinesis Data Generator (KDG) with the Firehose delivery stream as the destination.
Upload the initial data files to the Amazon S3 location.
Create and run an AWS Glue crawler to populate the Data Catalog with external table definition by reading the data files from Amazon S3.
Create the external schema called iotdb_ext in Amazon Redshift and query the Data Catalog table.
Query the external table from Redshift Spectrum to read data from the initial schema.
Add additional data elements to the KDG template and send the data to the Firehose delivery stream.
Validate that the additional data files are loaded to Amazon S3 with additional data elements.
Run an AWS Glue crawler to update the external table definitions.
Query the external table from Redshift Spectrum again to read the combined dataset from two different schemas.
Delete a data element from the template and send the data to the Firehose delivery stream.
Validate that the additional data files are loaded to Amazon S3 with one less data element.
Run an AWS Glue crawler to update the external table definitions.
Query the external table from Redshift Spectrum to read the combined dataset from three different schemas.
This solution is depicted in the following architecture diagram.
Prerequisites
This solution requires the following prerequisites:
For Kinesis Data Generator setup instructions, refer to this blog.
Implement the solution
Complete the following steps to build the solution:
On the Kinesis console, create a Firehose delivery stream with the following parameters:
For Source, choose Direct PUT.
For Destination, choose Amazon S3.
For S3 bucket, enter your S3 bucket.
For Dynamic partitioning, select Enabled.
Add the following dynamic partitioning keys:
Key year with expression .connectionTime | strptime("%d/%m/%Y:%H:%M:%S") | strftime("%Y")
Key month with expression .connectionTime | strptime("%d/%m/%Y:%H:%M:%S") | strftime("%m")
Key day with expression .connectionTime | strptime("%d/%m/%Y:%H:%M:%S") | strftime("%d")
Key hour with expression .connectionTime | strptime("%d/%m/%Y:%H:%M:%S") | strftime("%H")
For S3 bucket prefix, enter year=!{partitionKeyFromQuery:year}/month=!{partitionKeyFromQuery:month}/day=!{partitionKeyFromQuery:day}/hour=!{partitionKeyFromQuery:hour}/
You can review your delivery stream details on the Kinesis Data Firehose console.
Your delivery stream configuration details should be similar to the following screenshot.
Generate sample stream data from the KDG with the Firehose delivery stream as the destination with the following template:
When the crawler is complete, you can validate that the table was created on the AWS Glue console.
In Amazon Redshift Query Editor v2, connect to the Redshift instance and create an external schema pointing to the AWS Glue Data Catalog database. In the following code, use the Amazon Resource Name (ARN) for the IAM role that your cluster uses for authentication and authorization. As a minimum, the IAM role must have permission to perform a LIST operation on the S3 bucket to be accessed and a GET operation on the S3 objects the bucket contains.
CREATE external SCHEMA iotdb_ext FROM data catalog DATABASE 'iotdb' IAM_ROLE 'arn:aws:iam::<AWS account-id>:role/<role-name>'
CREATE external DATABASE if not exists;
Query the table defined in the Data Catalog from the Redshift external schema and note the columns defined in the KDG template:
select * from iotdb_ext.sensorsiotschemaevol;
Add an additional data element in the KDG template and send the data to the Firehose delivery stream:
"serviceRecommendedDate": "{{date.future}}",
Validate that the new data was added to the S3 bucket.
Rerun the AWS Glue crawler.
Query the table again from the Redshift external schema and note the newly populated dataset vs. the previous dataset for the servicerecommendeddate column:
select * from iotdb_ext.sensorsiotschemaevol where servicerecommendeddate is not null;
select * from iotdb_ext.sensorsiotschemaevol where servicerecommendeddate is null;
Delete the data element status from the KDG template and resend the data to the Firehose delivery stream.
Validate that new data was added to the S3 bucket.
Rerun the AWS Glue crawler.
Query the table again from the Redshift external schema and note the newly populated dataset vs. previous datasets with values for the status column:
select * from iotdb_ext.sensorsiotschemaevol order by connectiontime desc;
select * from iotdb_ext.sensorsiotschemaevol order by connectiontime;
Troubleshooting
If data is not loaded into Amazon S3 after sending it from the KDG template to the Firehose delivery stream, refresh and make sure you are logged in to the KDG.
Clean up
You may want to delete your S3 data and Redshift cluster if you are not planning to use it further to avoid unnecessary cost to your AWS account.
Conclusion
With the emergence of requirements for predictive and prescriptive analytics based on big data, there is a growing demand for data solutions that integrate data from multiple heterogeneous data models with minimal effort. In this post, we showcased how you can derive metrics from common atomic data elements from different data sources with unique schemas. You can store data from all the data sources in a common S3 location, either in the same folder or multiple subfolders by each data source. You can define and schedule an AWS Glue crawler to run at the same frequency as the data refresh requirements for your data consumption. With this solution, you can create a Redshift Spectrum table to read from an S3 location with varying file structures using the AWS Glue Data Catalog and schema evolution functionality.
If you have any questions or suggestions, please leave your feedback in the comment section. If you need further assistance with building analytics solutions with data from various IoT sensors, please contact your AWS account team.
About the Authors
Swapna Bandla is a Senior Solutions Architect in the AWS Analytics Specialist SA Team. Swapna has a passion towards understanding customers data and analytics needs and empowering them to develop cloud-based well-architected solutions. Outside of work, she enjoys spending time with her family.
Indira Balakrishnan is a Principal Solutions Architect in the AWS Analytics Specialist SA Team. She is passionate about helping customers build cloud-based analytics solutions to solve their business problems using data-driven decisions. Outside of work, she volunteers at her kids’ activities and spends time with her family.
This setup has been a key enabler to make corporate users and groups available inside EMR clusters and define access control policies to control their data access (for example, through the Amazon EMR native Apache Ranger integration).
Although this option is still available, Amazon EMR has released support for native LDAP authentication, a new security feature that simplifies the integration with OpenLDAP and Active Directory.
This feature enables the following:
automatic configuration of security for the supported applications (HiveServer2, Trino, Presto and Livy) to use the Kerberos protocol under the hood and LDAP as external authentication. This allows a more straightforward integration from external tools that, to connect with cluster endpoints, do not have anymore to setup kerberos authentication but, instead, can simply be configured to provide an LDAP username and password
fine-grained access control (FGAC) over who can access your EMR clusters through SSH
fine-grained authorization policies on top of Hive Metastore database and tables if used in combination with the native Amazon EMR Apache Ranger integration.
In this post, we dive deep into the Amazon EMR LDAP authentication, showing how the authentication flow works, how to retrieve and test the needed LDAP configurations, and how to confirm an EMR cluster is properly LDAP integrated.
Using the information on this blog:
Teams managing EMR clusters can enhance coordination with their LDAP IdP administrators in order to request the proper information and properly perform pre-configuration tests
EMR cluster end-users can understand how straightforward it is to connect from external tools to LDAP-enabled EMR clusters compared to the previous Kerberos-based authentication
How Amazon EMR LDAP integration works
When talking about authentication in the context of EMR frameworks, we can distinguish between two levels:
External authentication – Used by users and external components to interact with the installed frameworks
Internal authentication – Used within the frameworks to authenticate the communications of internal components
With this new feature, internal framework authentication is still managed through Kerberos, but this is transparent to the end-users or external services that, on the other side, use a user name and password to authenticate.
The supported EMR installed frameworks implement an LDAP-based authentication method that, given a set of user name and password credentials, validates them against the LDAP endpoint and, in the case of success, enables the use of the framework.
The following diagram summarizes how the authentication flow works.
The workflow includes the following steps:
A user connects with one of the supported endpoints (such as HiveServer2, Trino/Presto Coordinator, or Hue WebUI) and provides their corporate credentials (user name and password).
The contacted framework uses a custom authenticator that performs the authentication using the EMR Secret Agent service running inside the cluster instances.
The EMR Secret Agent service validates the provided credentials against the LDAP endpoint.
In the case of success, the following occurs:
A Kerberos principal is created for the specific user on the cluster MIT key distribution center (MIT KDC) running inside the primary node.
The Kerberos principal keytab is created inside the home directory of the user on the primary node.
After the authentication is complete, the user can start using the framework.
Inside all the cluster instances, the SSSD service is configured to retrieve users and groups from the LDAP endpoint and make them available as system users.
The authentication flow when connecting with SSH is a bit different, and is summarized in the following diagram.
The workflow includes the following steps:
A user connects with SSH to the EMR primary instance, providing the corporate credentials (user name and password).
The contacted SSHD service uses the SSSD service to validate the provided credentials.
The SSSD service validates the provided credentials against the LDAP endpoint. In the case of success, the user lands on the related home directory. At this point, the user can use the different CLIs (beeline, trino-cli, presto-cli, curl) to access Hive, Trino/Presto, or Livy.
To use the Spark CLIs (spark-submit, pyspark, spark-shell), the user has to invoke the ldap-kinit script and provide the requested user name and password.
The authentication is performed using the EMR Secret Agent service running inside the cluster instances.
The EMR Secret Agent service validates the provided credentials against the LDAP endpoint.
In the case of success, the following occurs:
A Kerberos principal is created for the specific user on the cluster MIT KDC running inside the primary node.
The Kerberos principal keytab is created inside the home directory of the user on the primary node.
A kerberos ticket is obtained and stored on the user Kerberos ticket cache on the primary node.
After the ldap-kinit script completes, the user can start using the Spark CLIs.
In the following sections, we show how to retrieve the required LDAP setting values and investigate how to launch a cluster with EMR LDAP authentication and test it.
Find the proper LDAP parameters
To configure LDAP authentication for Amazon EMR, the first step is to retrieve the LDAP properties to be used to set up your cluster. You need the following information:
The LDAP server DNS name
A certificate in PEM format to be used to interact over Secure LDAP (LDAPS) with the LDAP endpoint
The LDAP user search base, which is a path (or branch) on the LDAP tree from where to search users (only users belonging to this branch will be retrieved)
The LDAP groups search base, which is a path (or branch) on the LDAP tree from where to search groups (only groups belonging to this branch will be retrieved)
The LDAP server bind user credentials, which are the user name and password for a service user (usually called a bind user) to be used to trigger LDAP queries and retrieve user information such as user name and group membership.
With Active Directory, an AD admin can retrieve this information directly from the Active Directory Users and Computers tool. When you choose a user in this tool, you can see the related attributes (for example, distinguishedName). The following screenshot shows an example.
From the screenshot, we can see that the distinguishedName for the user john is CN=john,OU=users,OU=italy,OU=emr,DC=awsemr,DC=com, which means that john belongs to the following search bases, ordered from the most narrow to the most wide:
OU=users,OU=italy,OU=emr,DC=awsemr,DC=com
OU=italy,OU=emr,DC=awsemr,DC=com
OU=emr,DC=awsemr,DC=com
DC=awsemr,DC=com
Depending on the amount of entries inside a company LDAP directory, using a wide search base may lead to long retrieval times and timeouts. It’s a good practice to configure the search base to be as narrow as possible in order to include all the needed users. In the preceding example, OU=users,OU=italy,OU=emr,DC=awsemr,DC=com may be a good search base if all the users you want to provide access to the EMR cluster are part of that Organizational Unit.
Another way to retrieve user attributes is by using the ldapsearch tool. You can use this method for Active Directory as well as OpenLDAP, and it’s extremely useful to test the connectivity with the LDAP endpoint.
The following is an example with Active Directory (OpenLDAP is similar).
The LDAP endpoint should be resolvable and reachable by Amazon Elastic Compute Cloud (Amazon EC2) EMR cluster instances via TCP on port 636. It’s suggested to run the test from an Amazon Linux 2 EC2 instance belonging to the same subnet as the EMR cluster and having the same EMR security group associated as the EMR cluster instances.
After you launch an EC2 instance, install the nc tool and test the DNS resolution and connectivity. Assuming that DC1.awsemr.com is the DNS name for the LDAP endpoint, run the following commands:
sudo yum install nc
nc -vz DC1.awsemr.com 636
If the DNS resolution isn’t working properly, you should receive an error like the following:
Ncat: Version 7.50 ( https://nmap.org/ncat )
Ncat: Could not resolve hostname "DC1.awsemr.com": Name or service not known. QUITTING.
If the endpoint is not reachable, you should receive an error like the following:
Ncat: Version 7.50 ( https://nmap.org/ncat )
Ncat: Connection timed out.
In either of these cases, the networking and DNS team should be involved in order to troubleshot and solve the issues.
In case of success, the output should look like the following:
Ncat: Version 7.50 ( https://nmap.org/ncat )
Ncat: Connected to 10.0.1.235:636.
Ncat: 0 bytes sent, 0 bytes received in 0.01 seconds.
If everything works, proceed with the testing and install the openldap clients as follows:
sudo yum install openldap-clients
Then run ldapsearch commands to retrieve information about users and groups from the LDAP endpoint. The following are sample ldapsearch commands:
-D – This indicates the user to perform the search.
-w – This indicates the user password.
-H – This indicates the URL of the LDAP server.
-b – This is the base search.
LDAPTLS_CACERT – This indicates the LDAPS endpoint SSL PEM public certificate or the LDAPS endpoint root certificate authority SSL PEM public certificate. This can be obtained from an AD or OpenLDAP admin user.
The following is a sample output of the preceding command:
filter: (sAMAccountName=john)
requesting: *
dn: CN=john,OU=users,OU=italy,OU=emr,DC=awsemr,DC=com
objectClass: top
objectClass: person
objectClass: organizationalPerson
objectClass: user
cn: john
givenName: john
distinguishedName: CN=john,OU=users,OU=italy,OU=emr,DC=awsemr,DC=com
instanceType: 4
whenCreated: 20230804094021.0Z
whenChanged: 20230804094021.0Z
displayName: john
uSNCreated: 262459
memberOf: CN=data-engineers,OU=groups,OU=italy,OU=emr,DC=awsemr,DC=com
uSNChanged: 262466
name: john
objectGUID:: gTxn8qYvy0SVL+mYAAbb8Q==
userAccountControl: 66048
badPwdCount: 0
codePage: 0
countryCode: 0
badPasswordTime: 0
lastLogoff: 0
lastLogon: 0
pwdLastSet: 133356156212864439
primaryGroupID: 513
objectSid:: AQUAAAAAAAUVAAAAIKyNe7Dn3azp7Sh+rgQAAA==
accountExpires: 9223372036854775807
logonCount: 0
sAMAccountName: john
sAMAccountType: 805306368
userPrincipalName: [email protected]
objectCategory: CN=Person,CN=Schema,CN=Configuration,DC=awsemr,DC=com
dSCorePropagationData: 20230804094021.0Z
dSCorePropagationData: 16010101000000.0Z
As we can see from the sample output, the user john is identified by the distinguished name CN=john,OU=users,OU=italy,OU=emr,DC=awsemr,DC=com, and the data-engineers group to which the user belongs (memberOf value) is identified by the distinguished name CN=data-engineers,OU=groups,OU=italy,OU=emr,DC=awsemr,DC=com.
We can run our ldapsearch queries to retrieve the user and group information using a narrowed search base:
You can also apply other filters while searching. For more information about how to create LDAP filters, refer to LDAP Filters.
By running ldapsearch commands, you can test the LDAP connectivity and LDAP properties, and determine the needed setup.
Test the solution
After you have verified that the connectivity to the LDAP endpoint is open and the LDAP configurations are correct, proceed with setting up the environment to launch an EMR LDAP-enabled cluster.
Create AWS Secret Manager secrets
Before you create the EMR security configuration, you need to create two AWS Secret Manager secrets. You use these credentials to interact with the LDAP endpoint and retrieve user details such as user name and group membership.
On the Secrets Manager console, choose Secrets in the navigation pane.
Choose Store a new secret.
For Secret type, select Other type of secret.
Create a new secret specifying the binduser distinguished name as the key and the binduser password as the value.
Create a second secret specifying in plaintext the LDAPS endpoint SSL public certificate or the LDAPS root certificate authority public certificate. This certificate is trusted, allowing a secure communication between the EMR cluster and the LDAPS endpoint.
Create the EMR security configuration
Complete the following steps to create the EMR security configuration:
On the Amazon EMR console, choose Security configurations under EMR on EC2 in the navigation pane.
Choose Create.
For Security configuration name, enter a name.
For Security configuration setup options, select Choose custom settings.
For Encryption, select Turn on in-transit encryption.
For LDAP server location, enter the LDAPS endpoint (ldaps://<ldap_endpoint_DNS_name>).
For LDAP SSL certificate, enter the second secret you created in Secrets Manager.
For LDAP access filter, enter an LDAP filter that is applied in order to restrict access to a subset of users retrieved from the LDAP user search base. If the field is left empty, no filters are applied and all users belonging to the LDAP user search base can access the EMR LDAP-protected endpoints with their corporate credentials. The following are example filters and their functions:
(objectClass=person) – Filter users with the attribute objectClass set as person
(memberOf=CN=admins,OU=groups,OU=italy,OU=emr,DC=awsemr,DC=com) – Filter users belonging to the admins group
(|(memberof=CN=data-engineers,OU=groups,OU=italy,OU=emr,DC=awsemr,DC=com)(memberof=CN=admins,OU=groups,OU=italy,OU=emr,DC=awsemr,DC=com)) – Filter users belonging either to the data-engineers or the admins group (which we use for this post)
Enter values for LDAP user search base and LDAP group search base. Note that the two search bases do not support inline filters (for example, the following is not supported: OU=users,OU=italy,OU=emr,DC=awsemr,DC=com?subtree?(|(memberof=CN=data-engineers,OU=groups,OU=italy,OU=emr,DC=awsemr,DC=com)(memberof=CN=admins,OU=groups,OU=italy,OU=emr,DC=awsemr,DC=com))).
Select Turn on SSH login. This is needed only if you want your LDAP users to be able to SSH inside cluster instances with their corporate credentials. If SSH login is enabled, the LDAP access filter is needed—otherwise, SSH authentication will fail.
For LDAP server bind credentials, enter the first secret you created in Secrets Manager.
In the Authorization section, keep the defaults selected:
For IAM role for applications, select Instance profile.
For Fine-grained access control method, select None.
Choose Next.
Review the configuration summary and choose Create.
When you’re creating the EMR on EC2 cluster, be sure to specify the following configurations:
EMR version – Use Amazon EMR 6.12.0 or above.
Applications – Select Hadoop, Spark, Hive, Hue, Livy and Presto/Trino.
Security configuration – Specify the security configuration you created in the previous step.
EC2 key pair – Use an existing key pair.
Network and security groups – Use a configuration that allows the EMR EC2 instances to interact with the LDAPS endpoint. In the Find the proper LDAP parameters section, you should have confirmed a valid setup.
Confirm the LDAP authentication is working
When the cluster is up and running, you can check the LDAP authentication is working properly.
If SSH login was enabled as part of LDAP authentication inside the EMR SecurityConfiguration, you can SSH into your cluster by specifying an LDAP user, prompting the related password when requested:
ssh myldapuser@<emr_primary_node>
If SSH login was disabled, you can SSH inside the cluster by using the EC2 key pair specified during cluster creation:
When you’re inside the primary instance, you can test that the LDAP users and groups are properly retrieved by using the id command. The following is a sample command to check if the user john is properly retrieved with the related groups:
[ec2-user@ip-10-0-2-237 ~]# id john
uid=941601122(john) gid=941600513(users-group) groups=941600513(users-group),941601123(data-engineers)
You can then test authentication on the different installed frameworks.
First, let’s retrieve the frameworks’ public certificate and store it inside a truststore. All the frameworks share the same public certificate (the one we used to set up in-transit encryption), so you can use any of the SSL protected endpoints (Hive port 10000, Presto/Trino port 8446, Livy port 8998) to retrieve it. Take the certificate from the HiveServer2 endpoint (port 10000):
#Export Hive Server 2 public SSL certificate to a PEM file
openssl s_client -showcerts -connect $(hostname -f):10000 </dev/null 2>/dev/null|openssl x509 -outform PEM > certificate.pem

#Import the PEM certificate inside a truststore
echo "yes" | keytool -import -alias hive_cert -file certificate.pem -storetype JKS -keystore truststore.jks -storepass myStrongPassword
Then use this truststore to securely communicate with the different frameworks.
Use the following code to test HiveServer2 authentication with beeline:
#Use the truststore to connect to the Hive Server 2
beeline -u "jdbc:hive2://$(hostname -f):10000/default;ssl=true;sslTrustStore=truststore.jks;trustStorePassword=myStrongPassword" -n john -p johnPassword
If using Presto, test Presto authentication with the presto CLI (provide the user password when requested):
#Use the truststore to connect to the Presto coordinator
presto-cli \
--user john \
--password \
--catalog hive \
--server https://$(hostname -f):8446 \
--truststore-path truststore.jks \
--truststore-password myStrongPassword
If using Trino, test Trino authentication with the trino CLI (provide the user password when requested):
#Use the truststore to connect to the Trino coordinator
trino-cli \
--user john \
--password \
--catalog hive \
--server https://$(hostname -f):8446 \
--truststore-path truststore.jks \
--truststore-password myStrongPassword
Test Livy authentication with curl:
#Trust the PEM certificte to connect to the Livy server

#Start session
curl --cacert certificate.pem -X POST \
-u "john:johnPassword" \
--data '{"kind": "spark"}' \
-H "Content-Type: application/json" \
https://$(hostname -f):8998/sessions \
-c cookies.txt

#Example of output
#{"id":0,"name":null,"appId":null,"owner":"john","proxyUser":"john","state":"starting","kind":"spark","appInfo":{"driverLogUrl":null,"sparkUiUrl":null},"log":["stdout: ","\nstderr: ","\nYARN Diagnostics: "]}
Test Spark commands with pyspark:
#SSH inside the primary instance with the specific user
ssh john@<emr-primary-node>
#Or impersonate the user
sudo su - john

#Create a keytab and obtain a kerberos ticket running the ldap-kinit tool
$ ldap-kinit
Username: john
Password:

#Output
{"message":"ok","contents":{"username":"john","expirationTime":"2023-09-14T15:24:06.303Z[UTC]"}}

#Check the kerberos ticket has been created
$ klist

# Test spark CLIs
$ pyspark

>>> spark.sql("show databases").show()
>>> quit()
Note that here we tested the authentication from within the cluster, but we can interact with Trino, Hive, Presto and Livy even from outside the cluster as far as connectivity and DNS resolution are properly configured. Spark CLIs are the only ones which can be used only from inside the cluster.
To test Hue authentication, complete the following steps:
Navigate to the Hue web UI hosted on http://<emr_primary_node>:8888/ and provide an LDAP user name and password.
Test SQL queries inside the Hive and Trino/Presto editors.
To test with an external SQL tool (such as DBeaver connecting to Trino), complete the following steps. Be sure to configure the EMR primary node security group so that it allows TCP traffic from the DBeaver IP to the desired framework endpoint port (for example, 10000 for HiveServer2, 8446 for Trino/Presto) and to properly configure DNS resolution on the DBeaver client machine to properly resolve the EMR primary node hostname.
From your EMR cluster primary instance, copy to an S3 bucket the files truststore.jks (previously created) and /usr/lib/trino/trino-jdbc/trino-jdbc-XXX-amzn-0.jar (change the version XXX depending on the EMR version).
Download on your DBeaver client machine the truststore.jks and trino-jdbc-XXX-amzn-0.jar files.
Open DBeaver and choose Database, then choose Driver Manager.
Choose New to create a new driver.
On the Settings tab, provide the following information:
For Driver Name, enter EMR Trino.
For Class Name, enter io.trino.jdbc.TrinoDriver.
For URL Template, enter jdbc:trino://{host}:{port}.
On the Libraries tab, complete the following steps:
Choose Add File.
Choose the Trino JDBC driver JAR file from the local file system (trino-jdbc-XXX-amzn-0.jar).
Choose OK to create the driver.
Choose Database and New Database Connection.
On the Main tab, specify the following:
For Connect by, select Host.
For Host, enter the EMR primary node.
For Port, enter the Trino port (8446 by default).
On the Driver properties tab, add the following properties:
Add SSL with True as the value.
Add SSLTrustStorePath with the truststore.jks file location as the value.
Add SSLTrustStorePassword with the truststore.jks password that you used to create it as the value.
Choose Finish.
Choose the created connection and choose the Connect icon.
Enter your LDAP user name and password, then choose OK.
If everything is working, you should be able to browse the Trino catalogs, databases, and tables in the navigation pane. To run queries, choose SQL Editor, then choose Open SQL Editor.
From the SQL Editor, you can query your tables.
Next steps
The new Amazon EMR LDAP authentication feature simplifies the way users can gain access to EMR installed frameworks. When users are using a framework, you may want to govern the data they can access. For this specific topic, you can use LDAP authentication in combination with the native EMR Apache Ranger integration. For more information, refer to Integrate Amazon EMR with Apache Ranger.
Clean up
Complete the following cleanup actions to remove the resources you created following this post and avoid incurring additional costs. For this post, we clean up using the AWS CLI. You can also clean up using similar actions via the console.
If you launched an EC2 instance to check the LDAP connectivity and don’t need it anymore, delete it with the following command (specify your instance ID):
Note that if the EMR cluster has Termination Protection enabled, before you run the preceding terminate-clusters command, you have to disable it. You can do so with the following command (specify your EMR cluster ID):
In this post, we discussed how you can configure and test LDAP authentication on EMR on EC2 clusters. We discussed how to retrieve the needed LDAP settings, test connectivity with the LDAP endpoint, configure your EMR security configuration, and test that the LDAP authentication is properly working. This post also highlighted how the authentication flow is simplified compared to the standard Active Directory cross-realm trust configuration. To learn more about this feature, refer to Use Active Directory or LDAP servers for authentication with Amazon EMR.
About the Authors
Stefano Sandona is a Senior Big Data Solution Architect at AWS. He loves data, distributed systems and security. He helps customers around the world architecting secure, scalable and reliable big data platforms.
Adnan Hemani is a Software Development Engineer at AWS working with the EMR team. He focuses on the security posture of applications running on EMR clusters. He is interested in modern Big Data applications and how customers interact with them.
Business leaders and data analysts use near-real-time transaction data to understand buyer behavior to help evolve products. The primary challenge businesses face with near-real-time analytics is getting the data prepared for analytics in a timely manner, which can often take days. Companies commonly maintain entire teams to facilitate the flow of data from ingestion to analysis.
The consequence of delays in your organization’s analytics workflow can be costly. As online transactions have gained popularity with consumers, the volume and velocity of data ingestion has led to challenges in data processing. Consumers expect more fluid changes to service and products. Organizations that can’t quickly adapt their business strategy to align with consumer behavior may experience loss of opportunity and revenue in competitive markets.
To overcome these challenges, businesses need a solution that can provide near-real-time analytics on transactional data with services that don’t lead to latent processing and bloat from managing the pipeline. With a properly deployed architecture using the latest technologies in artificial intelligence (AI), data storage, streaming ingestions, and cloud computing, data will become more accurate, timely, and actionable. With such a solution, businesses can make actionable decisions in near-real time, allowing leaders to change strategic direction as soon as the market changes.
In this post, we discuss how to architect a near-real-time analytics solution with AWS managed analytics, AI and machine learning (ML), and database services.
Solution overview
The most common workloads, agnostic of industry, involve transactional data. Transactional data volumes and velocity have continued to rapidly expand as workloads have been pushed online. Near-real-time data is data stored, processed, and analyzed on a continual basis. It generates information that is available for use almost immediately after being generated. With the power of near-real-time analytics, business units across an organization, including sales, marketing, and operations, can make agile, strategic decisions. Without the proper architecture to support near real-time analytics, organizations will be dependent on delayed data and will not be able to capitalize on emerging opportunities. Missed opportunities could impact operational efficiency, customer satisfaction, or product innovation.
Managed AWS Analytics and Database services allow for each component of the solution, from ingestion to analysis, to be optimized for speed, with little management overhead. It is crucial for critical business solutions to follow the six pillars of the AWS Well-Architected Framework. The framework helps cloud architects build the most secure, high performing, resilient, and efficient infrastructure for critical workloads.
The following diagram illustrates the solution architecture.
By combining the appropriate AWS services, your organization can run near-real-time analytics off a transactional data store. In the following sections, we discuss the key components of the solution.
Transactional data storage
In this solution, we use Amazon DynamoDB as our transactional data store. DynamoDB is a managed NoSQL database solution that acts as a key-value store for transactional data. As a NoSQL solution, DynamoDB is optimized for compute (as opposed to storage) and therefore the data needs to be modeled and served up to the application based on how the application needs it. This makes DynamoDB good for applications with known access patterns, which is a property of many transactional workloads.
In DynamoDB, you can create, read, update, or delete items in a table through a partition key. For example, if you want to keep track of how many fitness quests a user has completed in your application, you can query the partition key of the user ID to find the item with an attribute that holds data related to completed quests, then update the relevant attribute to reflect a specific quests completion. There are also some added benefits of DynamoDB by design, such as the ability to scale to support massive global internet-scale applications while maintaining consistent single-digit millisecond latency performance, because the date will be horizontally partitioned across the underlying storage nodes by the service itself through the partition keys. Modeling your data here is very important so DynamoDB can horizontally scale based on a partition key, which is again why it’s a good fit for a transactional store. In transactional workloads, when you know what the access patterns are, it will be easier to optimize a data model around those patterns as opposed to creating a data model to accept ad hoc requests. All that being said, DynamoDB doesn’t perform scans across many items as efficiently, so for this solution, we integrate DynamoDB with other services to help meet the data analysis requirements.
Data streaming
Now that we have stored our workload’s transactional data in DynamoDB, we need to move that data to another service that will be better suited for analysis of said data. The time to insights on this data matters, so rather than send data off in batches, we stream the data into an analytics service, which helps us get the near-real time aspect of this solution.
We use Amazon Kinesis Data Streams to stream the data from DynamoDB to Amazon Redshift for this specific solution. Kinesis Data Streams captures item-level modifications in DynamoDB tables and replicates them to a Kinesis data stream. Your applications can access this stream and view item-level changes in near-real time. You can continuously capture and store terabytes of data per hour. Additionally, with the enhanced fan-out capability, you can simultaneously reach two or more downstream applications. Kinesis Data Streams also provides durability and elasticity. The delay between the time a record is put into the stream and the time it can be retrieved (put-to-get delay) is typically less than 1 second. In other words, a Kinesis Data Streams application can start consuming the data from the stream almost immediately after the data is added. The managed service aspect of Kinesis Data Streams relieves you of the operational burden of creating and running a data intake pipeline. The elasticity of Kinesis Data Streams enables you to scale the stream up or down, so you never lose data records before they expire.
Analytical data storage
The next service in this solution is Amazon Redshift, a fully managed, petabyte-scale data warehouse service in the cloud. As opposed to DynamoDB, which is meant to update, delete, or read more specific pieces of data, Amazon Redshift is better suited for analytic queries where you are retrieving, comparing, and evaluating large amounts of data in multi-stage operations to produce a final result. Amazon Redshift achieves efficient storage and optimum query performance through a combination of massively parallel processing, columnar data storage, and very efficient, targeted data compression encoding schemes.
Beyond just the fact that Amazon Redshift is built for analytical queries, it can natively integrate with Amazon streaming engines. Amazon Redshift Streaming Ingestion ingests hundreds of megabytes of data per second, so you can query data in near-real time and drive your business forward with analytics. With this zero-ETL approach, Amazon Redshift Streaming Ingestion enables you to connect to multiple Kinesis data streams or Amazon Managed Streaming for Apache Kafka (Amazon MSK) data streams and pull data directly to Amazon Redshift without staging data in Amazon Simple Storage Service (Amazon S3). You can define a schema or choose to ingest semi-structured data with the SUPER data type. With streaming ingestion, a materialized view is the landing area for the data read from the Kinesis data stream, and the data is processed as it arrives. When the view is refreshed, Redshift compute nodes allocate each data shard to a compute slice. We recommend you enable auto refresh for this materialized view so that your data is continuously updated.
Data analysis and visualization
After the data pipeline is set up, the last piece is data analysis with Amazon QuickSight to visualize the changes in consumer behavior. QuickSight is a cloud-scale business intelligence (BI) service that you can use to deliver easy-to-understand insights to the people who you work with, wherever they are.
QuickSight connects to your data in the cloud and combines data from many different sources. In a single data dashboard, QuickSight can include AWS data, third-party data, big data, spreadsheet data, SaaS data, B2B data, and more. As a fully managed cloud-based service, QuickSight provides enterprise-grade security, global availability, and built-in redundancy. It also provides the user-management tools that you need to scale from 10 users to 10,000, all with no infrastructure to deploy or manage.
QuickSight gives decision-makers the opportunity to explore and interpret information in an interactive visual environment. They have secure access to dashboards from any device on your network and from mobile devices. Connecting QuickSight to the rest of our solution will complete the flow of data from being initially ingested into DynamoDB to being streamed into Amazon Redshift. QuickSight can create a visual analysis of the data in near-real time because that data is relatively up to date, so this solution can support use cases for making quick decisions on transactional data.
Using AWS for data services allows for each component of the solution, from ingestion to storage to analysis, to be optimized for speed and with little management overhead. With these AWS services, business leaders and analysts can get near-real-time insights to drive immediate change based on customer behavior, enabling organizational agility and ultimately leading to customer satisfaction.
Next steps
The next step to building a solution to analyze transactional data in near-real time on AWS would be to go through the workshop Enable near real-time analytics on data stored in Amazon DynamoDB using Amazon Redshift. In the workshop, you will get hands-on with AWS managed analytics, AI/ML, and database services to dive deep into an end-to-end solution delivering near-real-time analytics on transactional data. By the end of the workshop, you will have gone through the configuration and deployment of the critical pieces that will enable users to perform analytics on transactional workloads.
Conclusion
Developing an architecture that can serve transactional data to near-real-time analytics on AWS can help business become more agile in critical decisions. By ingesting and processing transactional data delivered directly from the application on AWS, businesses can optimize their inventory levels, reduce holding costs, increase revenue, and enhance customer satisfaction.
The end-to-end solution is designed for individuals in various roles, such as business users, data engineers, data scientists, and data analysts, who are responsible for comprehending, creating, and overseeing processes related to retail inventory forecasting. Overall, being able to analyze near-real time transactional data on AWS can provide businesses timely insight, allowing for quicker decision making in fast paced industries.
About the Authors
Jason D’Alba is an AWS Solutions Architect leader focused on database and enterprise applications, helping customers architect highly available and scalable database solutions.
Veerendra Nayak is a Principal Database Solutions Architect based in the Bay Area, California. He works with customers to share best practices on database migrations, resiliency, and integrating operational data with analytics and AI services.
Evan Day is a Database Solutions Architect at AWS, where he helps customers define technical solutions for business problems using the breadth of managed database services on AWS. He also focuses on building solutions that are reliable, performant, and cost efficient.
By: Dominick Vitolo, VP of Security Services, MegaplanIT
As a Certified Qualified Security Assessor (QSA) company and a trusted Rapid7 partner, MegaplanIT is committed to guiding organizations through the complexities of compliance and security standards.
PCI DSS version 4.0 is a significant update on the horizon and is set to take effect March 31, 2025. One of the key changes around vulnerability scanning within this update is requirement 11.3.1.2. This new requirement mandates authenticated internal vulnerability scans.
Here, we’ll shed light on why organizations should immediately transition to authenticated vulnerability scanning and how Rapid7’s InsightVM can facilitate this essential change.
The Shift in PCI DSS 4.0
New Requirement 11.3.1.2
Under PCI DSS 4.0, requirement 11.3.1.2 introduces the need for authenticated internal vulnerability scans, marking a departure from the widely practiced unauthenticated scans.
Currently, many organizations rely on unauthenticated scanning which, while useful, offers limited visibility into system vulnerabilities. In previous versions the PCI DSS never specifically called out the need for authenticated vulnerability scanning internally, which led the requirement subject to interpretation.
This established procedure from retirement 11.3.1 remains applicable and is complemented by the new requirement mandating authenticated internal vulnerability scans.
Scans must be conducted at least every three months.
All high-risk and critical vulnerabilities – as defined by the entity’s own risk rankings established in Requirement 6.3.1 – must be remediated.
Follow-up rescans are required to verify the resolution of these high-risk and critical vulnerabilities.
The scanning tool used must be regularly updated with the latest vulnerability information.
The scans must be carried out by qualified individuals, and there must be an organizational separation between the testers and the systems they are testing.
MegaplanIT Perspective: Why Adopt Authenticated Scanning Now Before the Requirement Takes Effect?
Deeper security insights: Authenticated scans delve into systems more deeply, uncovering vulnerabilities that unauthenticated scans may miss. This depth is critical for maintaining robust security.
Proactive compliance strategy: We always advocate for early adoption of new standards. It allows for a smoother transition and avoids the rush associated with impending compliance deadlines. Authenticated vulnerability scanning typically uncovers a greater number of vulnerabilities than unauthenticated scanning. Consequently, this will necessitate a greater allocation of internal resources for planning and executing remediation strategies.
Enhanced risk management: Authenticated scanning enables more effective identification and remediation of vulnerabilities, thus fortifying your defense against potential breaches. Authenticated vulnerability scanning may also lead to a reduced number of false positives.
Operational efficiency: Early adoption allows for the refinement of scanning processes, ensuring they become a seamless part of your security routine and may also lead to a reduced amount of false positives.
How Rapid7’s InsightVM Aligns with This Transition
Credential-Based Scanning
InsightVM’s capability to perform scans with provided credentials aligns perfectly with the authenticated scanning requirements of PCI DSS 4.0. Scanning with credentials allows you to gather information about your network and assets that you could not otherwise access. You can inspect assets for a wider range of vulnerabilities or security policy violations.
Additionally, authenticated scans can check for software applications and packages as well as verify patches. When you scan a site with credentials, target assets in that site authenticate the Scan Engine as they would an authorized user.
Leveraging the Rapid7 Insight Agent
Rapid7’s universal Insight Agent gathers extensive vulnerability data, supporting the authenticated scanning process effectively.
Advantages of Implementing InsightVM
Comprehensive detection: InsightVM is equipped with a vast and continuously updated repository of known vulnerabilities and identification of configuration issues.
User-friendly interface: IT teams experience a simplified transition, making the process less daunting.
Transitioning to authenticated internal vulnerability scanning in order to meet the control requirements of PCI DSS 4.0 is a crucial step towards strengthening your organization’s security posture. As a certified QSA, MegaplanIT strongly recommends that organizations begin this shift now.
Tools like Rapid7’s InsightVM are pivotal in this journey, offering a comprehensive, scalable, and user-friendly solution. By embracing this change today, your organization will not only be compliant, but also significantly more secure against ever-evolving cyber threats.
Това е домът ми, сам избрах да се върна. Това е най-хубавият ми ден за последните пет месеца… Не се страхувам… и ви призовавам и вие да не се страхувате. (Алексей Навални при завръщането си в Русия след опита да бъде отровен и последвалото лечение в Германия, 2021 г.)
„Не можете да вкарате цяла държава в затвора“, обърна се Навални към съда при произнасянето на присъдата. След като три години беше измъчван пред очите на света както физически, така и психически, на 16 февруари 2024 г. Навални беше обявен за мъртъв от властите, пратили го в една от най-строгите наказателни колонии в Русия. Стотици, осмелили се да почетат паметта на опозиционера, бяха арестувани още на следващия ден. Защото Кремъл не може да вкара цялата държава в затвор, но успешно я превърна в затвор.
Началото
Алексей Навални е роден на 4 юни 1976 г. в село Бутин, западно от Москва, в семейството на офицер от Съветската армия и счетоводителка. Местят се често. Баща му слуша тайно Voice of America. Алексей прекарва летата при баба си в село до Чернобил, където спира да ходи след аварията през 1986 г. Ако има разказ за СССР, който е пълен антипод на Путиновата носталгия по епохата, това е разказът на Навални, който си спомня опашките за продукти от първа необходимост и лицемерието на партийните комунисти, възхваляващи системата, докато мечтаят за западни вещи и начин на живот.
В интервюта Навални е казвал, че малко преди да навърши пълнолетие, вече е бил наясно с политическите си възгледи – либерални. Руските либерали през 90-те се надяват да реформират новопоявилата се Русия в държава със здрава икономика, почиваща на принципите на свободния пазар и върховенството на закона. Как точно ще се проведе тази реформа, е основният спор, който я убива в зародиш.
Police block access to a spot where Russians had left tributes to Alexei Navalny – & the flowers were scooped up & removed
The authorities don’t want the size of the pile of flowers to show the scale of support for Putin’s biggest rival
Руската полиция разчиства Соловецкия камък в Москва от цветя, донесени в памет на Навални
Навални узрява в една Русия, в която идеалите се раждат точно толкова бързо, колкото умират, в която мутрите и престъпниците са пазители на реда, а вчерашните заклети комунисти са днешните умели предприемачи. В нея едни вярват, че преходът трябва да се извърши плавно, а други – че е необходима авторитарна ръка, за да бъде възможен изобщо. Тази картина не е непозната на българската публика.
Оформяне на политическите възгледи, първи опити
Навални подкрепя Борис Елцин въпреки реформите, които предизвикват криза и удрят най-уязвимите, въпреки авторитарния привкус, с който идват. В университета учи право, след това финанси и се превръща в млад пазарен абсолютист, десен, по-късно сам се определя и като консервативен. По това време няма интерес към професионалната политика; впуска се в света на финансите. Сам казва, че така е видял отблизо как се движат парите – как се перат, как се правят измами с големи компании. Това е и част от мотивацията му да се занимава с активизъм.
Присъединява се към либералната „Яблоко“ през 2000 г. – по негови думи, единствената партия, която говори за идеи и не е готова да ги размени за пари или държавна служба. В началото на новия век Навални организира политически дебати, създава мрежа от контакти в Москва, говори често в ефира на „Ехото на Москва“, цитиран е редовно от бизнес всекидневника „Комерсант“. Става авторитетно име в т.нар. либерална тусовка.
Но политическата дейност на либералните сили не се материализира в гласове и публична подкрепа. По това време Владимир Путин, назначен от Елцин, успява да спечели демократичните избори и затяга хватката си около страната и свободата на словото. Между 2003 и 2006 г. умират журналистите Юрий Шчекочихин и Анна Политковская – той след скоротечно боледуване, вероятно вследствие на отравяне, тя – застреляна в асансьора пред дома си.
Москва. Люди восстановили разгромленный властями мемориал в память о Навальном и продолжают нести цветы pic.twitter.com/eCP1oxk7BZ
Търсейки баланс между идеалите и реалността, Навални стига до заключението, че бъдещето на либерализма може би включва помирение с национализма. Така около 2007 г. започва най-противоречивата глава в живота му.
И в Русия, както и в България, има разлика между патриотизъм и национализъм. В двете десетилетия след разпада на СССР се заражда вариация на съветския национализъм, с щипка носталгия по образа на Русия като световна сила в двуполюсен свят, заквасена с псевдонауката и псевдофилософията на хора като Александър Дугин. След унизителния край на Студената война и неуспешния преход руснаците отново се осмеляват да мечтаят за Русия, която доминира в Евразия – земите между Западна Европа и Източна Азия, където славянските и тюркските народи споделят обща култура, несъвместима с европейските ценности на хуманизма и Просвещението. САЩ и Западът са архиврагове на Русия и следването на техните ценности би означавало изтриване на руската идентичност, която има различни потребности (например твърда, авторитарна ръка). Днес философията за руската изключителност е официална част от политиката на Кремъл и оправдава както хибридната война, така и зверствата в Украйна и отричането на правото на Украйна да съществува.
За известно време Навални е част от националдемократическото движение НАРОД, чийто националистически манифест включва „запазването и развитието на руския народ, културата, езика и историческите територии“ и отхвърля мултикултурния характер на Русия. НАРОД се стреми към национализъм с човешко лице, изключвайки скинари и неонацисти, съветски патриоти и ултраортодоксални християни. И макар движението да остава в историята като не особено успешно, публикуваните през 2007 г. видеа със силно ксенофобски и антиимигрантски жилки, в които Навални призовава за „Русия за руснаците“, са най-голямото петно в биографията му.
Макар по-късно да съжалява за този период от живота си, разбирането на мотивацията зад действията му е важна за разбирането на самия Навални. Според него истински успех на опозицията е възможен само ако спечелиш сърцата на хората през общи проблеми, близки както до най-образованите и заможните, така и до най-бедните и изтерзаните. На Навални му отнема време да открие тази обща кауза. Освен това той отчита, че Путин е най-популярният руски политик и би останал такъв дори без манипулирани избори и при наличието на свободна преса. Въпросът тогава е на какво почива тази популярност и има ли тя слаби места.
В биографията за опозиционера авторите ѝ Жан Мати Долбом, Морван Лалуе и Бен Нобъл пишат:
Навални е добре образован и начетен. Но той не е част от интелигенцията. Военните като баща му не се смятат за интелигенция в Русия. Стилът му също го отличава. Той е интелигентен, умее да говори и дори да пише добре… Но при него липсва тази специфична учтивост, многословието, склонността да обмисля прекалено онова, което казва, както повечето хора от интелигенцията. Няма скрита дълбочина, няма вътрешен диалог, който Навални се опитва да дестилира, когато говори. Това, което казва, е това, което мисли; това, което виждаш, е това, което получаваш.
Въпреки че се определя като консерватор, той подкрепя равните права на хората с различна сексуална ориентация, което не се радва на особена популярност в Русия. Критиците му често се заяждат, че си позволява луксозен живот, но все пак извън всякакво възможно сравнение с олигарсите на Кремъл. Навални има чувство за хумор и е харизматичен, но може да бъде и прекомерно директен и се пали лесно, поради което е влизал в конфликт с множество журналисти, бивши съюзници и политици.
Нобъл и компания се опитват да обяснят парадоксите на Навални през трима Алексеевци: антикорупционния активист, политика и протестиращия човек.
Опитът на младия Навални в Русия, която през първото десетилетие на новия век се превръща бавно, но сигурно в Русия на Путин, го води до заключението, че в страната е невъзможно да има борба за идеологии и техните нюанси, ако липсват основите: свобода на печата, върховенство на закона, справедливо наказание за онези, които постъпват несправедливо спрямо народа си.
Всичко останало следва да бъде изяснено по-късно; идеологическите спорове са лукс за държавите, които изобщо са държави, а не нещо друго – например клептокрации.
Опити за разбиване на системата
През 2007 г. Навални започва да купува дялове в руски компании, някои от които са почти изцяло държавна собственост. Така постига две цели: достъп до информация за дейностите на компаниите и възможност да задава неудобни въпроси. Образованието му в областта на правото и икономиката му помага в това начинание. По време на заседание на борда в компанията за преработка на нефт и газ „Сургутнефтегаз“, по това време една от най-печелившите и най-непрозрачните в Русия, Навални задава простички въпроси, които предизвикват изумление, тъй като никой досега не се е осмелил да пита. Чия е „Сургутнефтегаз“? Защо е толкова трудно да се намери информация за компанията? И защо печалбите на хартия са толкова ниски? Този и други подобни случаи, заедно с цялата информация, до която успява да се добере, публикува в своя блог в LiveJournal. В ерата преди социалните мрежи блогосферата в Русия, както и в България, е средище на демократичния граждански активизъм.
Снимка от първия блог на Навални
Блогът на Навални постепенно се превръща в общност, като, по негови думи, над 500 души участват в едно от разследванията му за „Газпром“. Към края на 2011 г. блогът се чете от над 55 000 души дневно. Борбата с корупцията се оказва обединяващата тема както за десния човек, чийто бизнес не би се развивал добре в среда на корупция и търговия с влияние, така и за левия борец за социални права, който се стреми да намали социалните неравенства.
Последният пост на сайта navalny.com, където е преместен блогът, е от 15 януари 2024 г. и включва видео с разследване колко печели дъщерята на Путин. След убийството на Навални се появява надписът НАВАЛЬНЬIЙ УБИТ
Навални успява да покаже как корупцията влияе върху всеки аспект от живота, независимо от социалния статус, професията или местожителството на човека – от лошите пътища (една от най-успешните инициативи на Навални е РосЯма, уебсайт, на който граждани докладват за инфраструктурни проблеми) до високите цени в магазина.
Напипването на този важен обединяващ елемент е ключово за оформянето му като обществена фигура. По това време започват и първите опити законът да се използва срещу него. Често Навални е обвиняван за същите деяния, които самият той изобличава като активист и блогър.
ФБК: От лакея до двореца на Путин
Постепенно Навални започва да гледа на себе си като на борец за правата на руската средна класа – онези, които губят парите си заради корупция и лошо управление. Чрез т.нар. crowdsourcing, или въвличане на други активисти в даден процес, Навални черпи не само човешки ресурси, но и се опитва да създаде нетипичното за Русия вярване, че от хората зависи нещо и че те са в състояние да държат властта отговорна. През 2011 г. Навални събира екип, който година по-късно се превръща в организацията „Фонд за борба с корупцията“ (ФБК).
Police have detained several people at a makeshift gathering in memory of @Navalny in Moscow, as others throw snow & shout "shame!" pic.twitter.com/kLtujMVTRB
Руската полиция задържа хора, решили да отдадат почит на Навални в Москва, 16 февруари 2024 г.
Двама от по-известните спонсори на ФБК са предприемачът и общественик Борис Зимин и политическият деец Владимир Ашурков (понастоящем Зимин е обявен от Кремъл за „чуждестранен агент“, а Ашурков получава политическо убежище в Обединеното кралство още през 2015 г.). Планът е ФБК да се издържа от дарения: „Всичко ще бъде чисто и без пари под масата. Имената на всичките ни дарители и дарените суми ще бъдат публични, както и разходите ни“, казва Навални. В тези първи години подкрепата за ФБК идва от хора като Ашурков, както и от либерални (тоест демократично настроени) журналисти, писатели, икономисти.
Отначало за Кремъл е лесно да омаловажи работата на Навални, като едно от най-известните проявления е отказът публично да се споменава името на опозиционера, който е наричан от говорителите на режима с най-различни имена, например „блогъра“. След 2010 г. обаче набира сила нов комуникационен феномен – социалните мрежи, които Навални владее до съвършенство.
Докато властите разиграват циркове около кандидатурата му за кмет през 2013 г., активистът Алексей Навални се превръща в колектива „Навални“: каналите му за комуникация се използват от целия му екип, които овладяват директния му шеговит стил. Това се оказва особено полезно, тъй като по същото време режимът на Путин започва активно да праща Навални в ареста за кратки периоди. YouTube каналът, който Навални създава през 2007 г., става телевизия алтернатива на все по-строго контролирания от Кремъл информационен поток. През 2017 г., точно когато форматът лайвстрийм набира популярност в Русия, започва излъчването на „Навальный 20:18“ – предаване, в което опозиционерът коментира новини, отговаря на въпроси и обяснява на публиката политическата си стратегия. Всеки епизод се гледа от средно 400 000 души още от първата година.
Кадър от „Навальный 20:18“ в деня, в който опозиционерът е залят със зелена боя и е увредено окото му
През 2015 г. популярност набират и разследвания като филма за тогавашния главен прокурор Юрий Чайка, който към днешна дата има над 26 млн. гледания. Сензацията продължава с „Он вам не Димон“, документално разследване за богатството на Дмитрий Медведев, заемащ най-различни длъжности под опеката на Путин.
Яхти, вила в Тоскана, имение в един от най-скъпите квартали на Москва, лозя, вила в планината, наследствен дом в Курск, дворец в Санкт Петербург – разследването на екипа на Навални показва какво може да си позволи човек, който вярно служи на властта с години. Филмът и други разследвания на Навални обръщат внимание на тенденцията руските елити да громят Запада, където самите те живеят в разкош и където учат децата им.
В първата седмица от публикуването разследването е гледано 9 млн. пъти, а към момента има 42 млн. гледания. Дори опитът за отравяне през август 2020 г. не спира Навални и екипа му да публикуват пълномащабно разследване, този път за имотите на самия Владимир Путин. „Дворецът на Путин“, подобно на други изобличаващи материали, предизвиква протести, в които хората излизат с четки за тоалетни – намигване към огромните суми, разписани за най-обикновени вещи за обзавеждане на зданието. Гуменото пате пък се превръща в символ за богатството на Медведев, а руснаци биват арестувани само защото са се осмелили да поставят надуваема жълта патица на прозореца си.
«Медиазона» нашла по камерам кортеж ФСИН между Лабытнанги и Салехардом. Он мог перевозить тело Навального
Переправа между Лабытнанги и Салехардом— единственный наземный маршрут из Харпа в областной центр. Мы нашли кортеж ФСИН, который ехал там в ночь после гибели Навального… pic.twitter.com/zhUpqaG5hb
Журналистите от „Медиазона“ използват отворени данни, за да установят кога и в каква посока е било изнесено тялото на Навални, което към 19 февруари 2024 г. все още не е предоставено на близките му
Виждаме ли във ФБК Навални, журналиста? Последователите са категорични, че да, а критиците (легитимните, разбира се) са несигурни. ФБК е една от най-ефективните комуникационни машини в съвременната история. Разследванията на организацията в по-голямата си част са фактологически издържани. Но тя си остава политическа, а целта е свалянето на режима в Кремъл. Истината е, че конкретен и обективен отговор на горния въпрос би бил възможен в онази Русия, за която се бореше Алексей Навални. Русия, в която има независими медии, разделение между властта и икономиката; разделение между онзи, който е начело на държавата, и идеята за самата държава.
Навални може би не е бил героят, на когото мнозина са се надявали – приживе много руски граждански активисти не се колебаеха да го кажат. Но е героят, от когото Русия имаше нужда. И продължава да има.
Навални като лидер на опозицията
Краят на ФБК е печално предизвестен. На 25 ноември 2016 г. Сергей Мохов, съпруг на адвокатката на ФБК Собол Любов, е атакуван със спринцовка и отровен. ФБК е обект на постоянен натиск от съда. Отначало властите изпитват трудности да подведат организацията под влезлия в сила закон за „чуждестранни агенти“, но дарение от 50 долара от руснак, живеещ във Флорида, както и 1700 паунда от испански боксьор дават необходимия аргумент на руските съдилища.
След разследване за „Готвача на Путин“ Евгений Пригожин (чиято фирма за кетъринг става причина за епидемия от дизентерия в детски градини в Москва) ФБК е осъдена за клевета и задължена да плати непосилни суми. На 26 декември 2019 г. офисът на организацията е обискиран от властите, а през юли 2020 г. тя е закрита. Месец по-късно Евгений Пригожин изкупува дълга на ФБК към компанията, свързвана с него, а екипът на Навални просто преосновава организацията, продължавайки да ползва същата марка.
Юлия и Алексей Навални заедно с опозиционния политик Иля Яшин, който днес е в затвора. 12 юни 2013 г. Снимка: Bogomolov.PL
Навални успява да открие слабото място на Путин – „реда“, който диктаторът внася в кървящата Русия на 90-те, не е ред, почиващ на справедливост, а на овладяване на корупцията и жестокостта и на монополизирането им от държавата.
Стратегиите на Навални са многостранни и с различна ефективност, но винаги имат последствия. Такъв е примерът с „тактическото гласуване“, дало резултати и през 2021 г.: след като партиите на опозицията не могат да се вредят в листите за изборите, то гласоподавателите трябва да подкрепят сламената опозиция в ущърб на „Единна Русия“. Така на парламентарните избори през декември 2011 г. резултатът на „Единна Русия“ пада под 50% за пръв път от 2003 г. въпреки изборните манипулации. След изборите през 2012 г. Навални става лидер на движението за честни избори, а след 2013 г. органично се превръща в лидер на опозицията. Дори когато е ясно, че кампаниите му за обществени постове са обречени на провал, Навални превръща това в политическо комуникационно оръжие. Протестите с неговото участие и организираните по-късно от него и екипа му се превръщат в най-многочислените в съвременната история на Русия.
One of the last moments Alexei and Yulia had together – watching Rick and Morty on that 2021 flight back to Moscow. pic.twitter.com/DfzcsBgzAS
Един от последните моменти, в които Алексей и Юлия са заедно, на път за Русия след лечението му в Германия, малко преди да бъде арестуван. Двамата гледат анимацията „Рик и Морти“
Руснаците десетки пъти излизаха на протести или след призиви на Навални, или за да се срещнат с него на улицата. Заедно с тях той беше арестуван, двукратно заливан със зелена боя (в характерния си стил заяви, че и като Шрек ще се бори с корупцията), преследван под какъв ли не претекст, с какви ли не абсурдни обвинения. Тези действия на руската държава будеха съмнение, че вместо новини от реалния живот човек чете разкази на Франц Кафка. С неговата харизматична, противоречива фигура порасна цяло едно поколение – същото, което не познава друг лидер освен Владимир Владимирович. Милиони не само в Русия, но и по света бяха свидетели на опитите на Навални да се кандидатира за президент, както и на правните капани, които все по-свирепата руска държава поставяше пред него. В тази кампания за президент Навални заяви, че Русия трябва да следва европейски път на развитие – демокрация, върховенство на правото, свободни пазари и социални политики. Тези свои убеждения той отстояваше до смъртта си.
Протест в подкрепа на Навални. Санкт Петербург, 23 януари 2021 г. Снимка: Tcapb
Руската инвазия в Украйна
Алексей Навални открито осъди нахлуването на Путин в Украйна през февруари 2022, макар и това да не го издигна особено в очите на много украинци, виждащи в него приемливо за Запада лице на същия руски империализъм, който движи политиките на Владимир Путин и алчността на Русия да „освобождава“ различни територии от собствената им свобода на избор към кой свят да принадлежат.
От 2014 г., когато Русия незаконно анексира Кримския полуостров, Навални избягва да дава конкретен отговор чий е Крим, отчасти за да не отблъсне потенциални избиратели и съюзници, много от които одобряват връщането на Крим към територията на Русия. Въпреки че Навални се противопоставя и осъжда действията на Путин, когато го питат дали би върнал полуострова на Украйна, ако бъде избран за президент, отговорите варират от предлагане на варианти за провеждане на втори референдум, този път независим, до шеги дали Крим е някакъв сандвич, който двете държави да си подават една на друга.
6. Russia must leave Ukraine alone and allow it to develop the way its people want. Stop the aggression, end the war and withdraw all of its troops from Ukraine. Continuation of this war is just a tantrum caused by powerlessness, and putting an end to it would be a strong move.
„15 тези на един руски гражданин, който иска най-доброто за страната си“
Четири дни преди годишнината от началото на войната срещу Украйна Навални предлага свой план за развитието на Русия в 15 точки, публикуван в профила му в Twitter. По това време той вече е в колонията. „Комбинацията от военна агресия, корупция, неадекватно военно ръководство, слаба икономика, в добавка с героизма и висока мотивация на защитните сили ще доведе до пълна загуба за Русия“, пише Навални. Границите както на Русия, така и на Украйна са признати и от двете страни през 1991 г. и няма нищо повече за дискутиране, допълва той. В плана на Навални се говори и за репарации, които Русия да плаща на Украйна.
През лятото на 2023 г., няколко месеца след публикацията на позицията на Навални, опозиционерът е осъден на още 19 години в колонията по обвинения в екстремизъм.
Героят Навални
За последните близо три години в заточение Навални е прекарал над 300 дни в изолатора. Почти година в чудовищна самота. В колонията стражите будят затворниците в 5 сутринта с руския химн. Карат ги да се разхождат и да работят в арктически студ. На Навални му беше забранено да се вижда с близките си, дори да говори с тях. Многократно му бе отказвана медицинска помощ. Мъжът, когото виждахме на кадрите от съдебните процеси след присъдата през 2021 г., беше сянка на предишния човек. Познаваше се само по хумора, който е проявил и по време на последния процес на 15 февруари 2024 г., когато е видян жив за последно.
През годините многократно е питан защо, ако е истинската опозиция, властта все още не го е убила. Е, 16 февруари 2024 г. беше така търсеният от някои лакмус.
След като Кремъл не успя да го отрови бързо и тайно, го уби бавно и явно. Към момента на писането на този текст тялото на опозиционера продължава да е заложник на властите, чиито обяснения за смъртта се променят с хода на стрелките на часовника. Майка му все още не е видяла тялото му.
В XXI в. дефиницията на думата „мъченик“ не може да бъде изградена през мистицизма на ранните християнски текстове, митовете и легендите. Но ако има модерна дефиниция, то можем да се съгласим: изстраданото от Алексей Навални е достатъчно, за да я заслужи.
Лъжа е, че героите се раждат. Те се създават в пресата на времената; в избирането на трудните пътища за сметка на всичко останало, понякога дори на собствения живот; в осъзнаването на собствените грешки; в опитите грешките да бъдат поправени. „Идеалът ми не е Навални. Идеалът ми е Вацлав Хавел. Ние нямаме Хавел. Но имаме Навални“, казва писателката Людмила Улицкая, която през годините също е подкрепяла ФБК.
Възстановка на интериора на изолатора, в който е лежал Навални повече от дузина пъти. На тази килия ѝ казват „шизото“. Женева, юни 2023 г. Снимка: Markus Schweizer
Предстои да бъдат написани много книги за живота на опозиционера, а ако Русия има бъдеще като свободна страна – тепърва да осъзнава новата си история. Но постепенното затягане на примката – от овладяването на медиите, през непрозрачното и превратно тълкувано законодателство, та чак до явните убийства на опозиционери, – всяка стъпка от пътя на Алексей Навални осветява този процес тук и сега, показва как диктатурата се строи като „Лего“, блокче по блокче. И как, докато човек е зает с всекидневието си, държавата може да бъде превърната в карцер. Историята си има поука за онези, които слушат внимателно.
Я буду продолжать дело Алексея Навального. Продолжать бороться за нашу с вами страну. И я призываю вас встать рядом со мной. pic.twitter.com/aBOIvcYHHk
На 19 февруари 2024 г. Юлия Навалная съобщава, че ще продължи делото на убития си съпруг.
В дните след убийството на Алексей Навални стотици московчани положиха цветя на Соловецкия камък в Москва. Първоначални спонтанни прояви избраха именно паметника на жертвите на политическите репресии в СССР. Подобни възпоменания имаше из цяла Русия. Властите направиха опит да ограничат достъпа, имаше и арести. Но хората възстановиха мемориалите, а цветята продължаваха да се множат. Човешкото достойнство е сред малкото неща, които не могат да се вземат насила. Символите не могат да бъдат отровени, да получат инфаркт, да паднат през прозореца, да загинат случайно в самолетна катастрофа. Ръкописите не горят.
Кадри с цветя, оставени на различни мемориали в руски градове. Уляновск, Ижевск, Красногорск, Краснодар, Омск, Ярослав и др.
На Владимир Путин остава да праща полицията да разчиства цветята и да бие жените, които ги носят. На кремълската пропаганда обикновено ѝ е нужен най-много ден, за да активира опорни точки, които вече се разпространяват: че ЦРУ или Запада е проникнал до Сибир (нищо че Русия е най-умната, най-силната, най-хитрата държава) и западняците са убили Навални, за да очернят имиджа на Путин. Вероятно ЦРУ арестува руснаците по улиците, вероятно злите американци панически чистят червените карамфили.
Най-голямата болка на диктаторите, независимо какъв език говорят и коя история обитават, е, че, когато си отидат, никой няма да тъгува истински по тях. Затова и протестиращите срещу диктатурите винаги са „платени“, винаги са нечии агенти, винаги са „чужди“. Човекът, чиято кауза винаги е за продан, е неспособен да си представи, че има каузи, за които си заслужава дори да умреш. Най-голямата болка – че на диктатора се налага да изпраща някого да чисти червените карамфили. Че карамфилите се появяват отново. И отново. И отново…
Водещо изображение: Алексей Навални и Юлия по време на поход в памет на убития опозиционен политик Борис Немцов. Москва, 29 февруари 2020 г. Снимка: Michał Siergiejevicz
.select_cpu() implements the logic to assign a target CPU to a task
that wants to run, typically you have to decide if you want to keep
the task on the same CPU or if it needs to be migrated to a
different one (for example if the current CPU is busy); if we can
find an idle CPU at this stage there’s no reason to call the
scheduler, the task can be immediately dispatched here.
Many Hare users want to ship their Hare projects to users, and as such, software written in Hare is making its way into Linux distributions and the like. However, due to Hare’s unstable nature, we have not provided any versioned releases, forcing any distributions who want to package Hare to package Hare’s master branch, which is less than ideal.
Security updates have been issued by Fedora (freeglut, hugin, libmodsecurity, qemu, rust-asyncgit, rust-bat, rust-cargo-c, rust-eza, rust-git-absorb, rust-git-delta, rust-git2, rust-gitui, rust-libgit2-sys, rust-lsd, rust-pore, rust-pretty-git-prompt, rust-shadow-rs, rust-silver, rust-tokei, and rust-vergen), Mageia (packages, radare2, ruby-rack, and wireshark), Oracle (.NET 8.0 and python-pillow), Red Hat (gimp:2.8, java-1.8.0-ibm, and kpatch-patch), SUSE (dpdk and opera), and Ubuntu (bind9, curl, linux-raspi, linux-raspi-5.4, node-ip, and tiff).
Microsoft announced that it caught Chinese, Russian, and Iranian hackers using its AI tools—presumably coding tools—to improve their hacking abilities.
In collaboration with OpenAI, we are sharing threat intelligence showing detected state affiliated adversaries—tracked as Forest Blizzard, Emerald Sleet, Crimson Sandstorm, Charcoal Typhoon, and Salmon Typhoon—using LLMs to augment cyberoperations.
The only way Microsoft or OpenAI would know this would be to spy on chatbot sessions. I’m sure the terms of service—if I bothered to read them—gives them that permission. And of course it’s no surprise that Microsoft and OpenAI (and, presumably, everyone else) are spying on our usage of AI, but this confirms it.
EDITED TO ADD (2/22): Commentary on my use of the word “spying.”
The Grab superapp offers a comprehensive array of services from ride-hailing and food delivery to financial services. This creates multifaceted user journeys, traversing homepages, product pages, checkouts, and interactions with diverse content, including advertisements and promo codes.
Background: Why ads and attribution matter in our superapp
Ads are crucial for Grab in driving user engagement and supporting our ecosystem by seamlessly connecting users with our services. In the ever-evolving world of advertising, the ability to gauge the impact of marketing investments takes on pivotal significance. Advertisers dedicate substantial resources to promote their businesses, necessitating a clear understanding of the return on AdSpend (ROAS) for each campaign. In this context, attribution plays a central role, serving as the guiding compass for advertisers and marketers, elucidating the effectiveness of touchpoints within campaigns.
For instance, a merchant-partner seeks to enhance its reach by advertising on the Grab food delivery homepage. With the assistance of our attribution system, the merchant-partner can now precisely gauge the impact of their homepage ads on Grab. This involves tracking user engagement and monitoring the resulting orders that stem from these interactions. This level of granularity not only highlights the value of attribution but also demonstrates its capability in providing detailed insights into the effectiveness of advertising campaigns and enabling merchant-partners to optimise their campaigns with more precision.
In this blog, we delve into the technical intricacies, software architecture, challenges, and solutions involved in crafting a state-of-the-art engineering solution for the attribution platform.
Genesis: Pre-project landscape
When our journey began in 2020, Grab’s marketing efforts had limited attribution capabilities and data analytics was predominantly reliant on ad hoc queries conducted by business and data analysts. Before the introduction of a standardised approach, we had to manage discrepant results and a time-consuming manual process of data preparation, cleansing, and storage across teams. When issues arose in the analytical pipeline, resolution efforts took relatively longer and were reoccurring. We needed a comprehensive engineering solution that would address the identified gaps, and significantly enhance metrics related to ROI, attribution accuracy, and data-handling efficiency.
Inception: The pure ads attribution engine (Kappa architecture)
We chose Kappa architecture due to its imperative role in achieving near real-time attribution, especially in support of our new pricing model, cost per order (CPO). With this solution, we aimed to drastically reduce data latency from 2-3 days to just a few minutes. Traditional ETL (Extract, Transform, and Load) based batch processing methods were evaluated but quickly found to be inadequate for our purposes, mainly due to their speed.
In the advertising industry, rapid decision-making is critical. Traditional batch processing solutions would introduce significant latency, hampering our ability to make real-time, data-driven decisions. With its architecture’s inherent capability for real-time stream processing, Kappa emerged as the logical choice. Additionally, Kappa offers the agility required to empower our ad-serving team for real-time decision support, and better ad ranking and selection, enabling dynamic and effective targeting decisions without delay.
The first step on this journey was to create a pure and near real-time stream processing Ads Attribution Engine. This engine was based on the Kappa architecture to provide advertisers with quick insights into their ROAS offering real-time attribution, enabling advertisers to optimise their campaigns efficiently.
High-level workflow of the Ads Attribution Engine
In this solution, we used the following tools in our tech stack:
Kafka for event streams
DDB for events storage
Amazon S3 as the data lake
An in-house stream processing framework similar to Keystone
Redis for caching events
ScyllaDB for storing ad metadata
Amazon relational database service (RDS) for analytics
Architecture of the near real-time stream processing Ads Attribution Engine
Evolution: Merging marketing levers – Ads and promos
We began to envision a world where we could merge various marketing levers into a unified Attribution Engine, starting with ads and promos. This evolved vision also aimed to prevent order double counting (when a user interacts with both ads and promos in the same checkout), which would provide a more holistic attribution solution.
With the unified Attribution Engine, we would also enable more sophisticated personalisation through machine learning models and drive higher conversions.
The unified Attribution Engine workflow, which included Promo touch points
The unified attribution engine used mostly the same tech stack, except for analytics where Druid was used instead of RDS.
Architecture of the unified Attribution Engine
Introspection: Identifying shortcomings and the path to improvement
While the unified attribution engine was a step in the right direction, it wasn’t without its challenges. There were challenges related to real-time data processing costs, scalability for longer attribution windows, latency and lag issues, out-of-order events leading to misattribution, and the complexity of implementing multi-touch attribution models. To truly empower advertisers and enhance the attribution process, we knew we needed to evolve further.
Rebirth: The birth of a full-fledged attribution platform (Lambda architecture)
This journey eventually led us to build a full-fledged attribution platform using Lambda architecture, which blended both batch and real-time stream processing methods. With this change, our platform could rapidly and accurately process data and attribute the impact of ads and promos on user behaviour.
Why Lambda architecture?
This choice was a strategic one – real-time processing is vital for tracking events as they occur, but it offers only a current snapshot of user behaviour. This means we would not be able to analyse historical data, which is a crucial aspect of accurate attribution and exploring multiple attribution models. Historical data allows us to identify trends, patterns, and correlations not evident in real-time data alone.
High level workflow for the full-fledged attribution platform with Lambda architecture
In this system’s tech stack, the key components are:
Coban, an in-house stream processing framework used for real-time data processing
Spark-based ETL jobs for batch processing
Amazon S3 as the data warehouse
An offline layer that is capable of providing historical context, handling large data volumes, performing complex analytics, and so on.
Key benefits of the offline layer
Provides historical context: The offline layer enriches the attribution process by providing a historical perspective on user interactions, essential for precise attribution analysis spanning extended time periods.
Handles enormous data volumes: This layer efficiently manages and processes extensive data generated by advertising campaigns, ensuring that attribution seamlessly accommodates large-scale data sets.
Performs complex analytics: Enables more intricate computations and data analysis than real-time processing alone, the offline layer is instrumental in fine-tuning attribution models and enhancing their accuracy.
Ensures reliability in the face of challenges: By providing fault tolerance and resilience against system failures, the offline layer ensures the continuous and dependable operation of the attribution system, even during unexpected events.
Optimises data storage and serving: Relying on Amazon S3, the storage layer for raw data optimises storage by building interactive reporting APIs.
Architecture of our comprehensive offline attribution platform
Challenges with Lambda and mitigation
Lambda architecture allows us to have the accuracy and robustness of batch processing along with real-time stream processing. However, we noticed some drawbacks that may lead to complexity due to maintaining both batch and stream processing:
Operating two parallel systems for batch and stream processing can lead to increased complexity in production environments.
Lambda architecture requires two sets of business logic – one for the batch layer and another for the stream layer.
Synchronisation across both layers can make system alterations more challenging.
This dual implementation could also allude to inconsistencies and introduce potential bugs into the system.
To mitigate these complications, we’re establishing an optimisation strategy for our current system. By distinctly separating the responsibilities of our real-time pipelines from those of our offline jobs, we intend to harness the full potential of each approach, while simultaneously curbing the added complexity.
Hence, redefining the way we utilise Lambda architecture, striking an efficient balance between real-time responsiveness and sturdy accuracy with the below proposal.
Vanguard: Enhancements in the future
In the coming months, we will be implementing the optimisation strategy and improving our attribution platform solution. This strategy can be broken down into the following sections.
Real-time pipeline handling time-sensitive data: Real-time pipelines can process and deliver time-sensitive metrics like CPO-related data in near real-time, allowing for budget capping and immediate adjustments to marketing spend. This can provide us with actionable insights that can help with areas like real-time bidding, real-time marketing, or dynamic pricing. By limiting the volume of data through the real-time path, we can ensure it’s more manageable and focused on immediate actionable data.
Batch jobs handling all other reporting data: Batch processing is best suited for computations that are not time-bound and where completeness is more important. By dedicating more time to the processing phase, batch processing can handle larger volumes and more complex computations, providing more comprehensive and accurate reporting.
This approach will simplify our Lambda architecture, as the batch and real-time pipelines will have clear separation of duties. It may also reduce the chance of discrepancies between the real-time and batch-processing datasets and lower the operational load of our real-time system.
Conclusion: A holistic attribution picture
Through our journey of building a comprehensive attribution platform, we can now deliver a holistic and dependable view of user behaviour and empower merchant-partners to use insights from advertisements and promotions. This journey has been a long one, but we were able to improve our attribution solution in several ways:
Attribution latency: Successfully reduced attribution latency from 2-3 days to just a few minutes, ensuring that advertisers can access real-time insights and feedback.
Data accuracy: Through improved data collection and processing, we achieved data discrepancies of less than 1%, enhancing the accuracy and reliability of attribution data.
Conversion rate: Advertisers witnessed a significant increase in conversion rates, a direct result of our real-time attribution capabilities.
Cost efficiency: Embracing the Lambda architecture led to a ~25% reduction in real-time data processing costs, allowing for more efficient campaign optimisations.
Operational resilience: Building an offline layer provided fault tolerance and resilience against system failures, ensuring that our attribution system continued to operate seamlessly, even during unexpected events.
Join us
Grab is the leading superapp platform in Southeast Asia, providing everyday services that matter to consumers. More than just a ride-hailing and food delivery app, Grab offers a wide range of on-demand services in the region, including mobility, food, package and grocery delivery services, mobile payments, and financial services across 428 cities in eight countries.
Powered by technology and driven by heart, our mission is to drive Southeast Asia forward by creating economic empowerment for everyone. If this mission speaks to you, join our team today!
We have a cabin out in the forest, and when I say “out in the forest” I mean “in a national forest subject to regulation by the US Forest Service” which means there’s an extremely thick book describing the things we’re allowed to do and (somewhat longer) not allowed to do. It’s also down in the bottom of a valley surrounded by tall trees (the whole “forest” bit). There used to be AT&T copper but all that infrastructure burned down in a big fire back in 2021 and AT&T no longer supply new copper links, and Starlink isn’t viable because of the whole “bottom of a valley surrounded by tall trees” thing along with regulations that prohibit us from putting up a big pole with a dish on top. Thankfully there’s LTE towers nearby, so I’m simply using cellular data. Unfortunately my provider rate limits connections to video streaming services in order to push them down to roughly SD resolution. The easy workaround is just to VPN back to somewhere else, which in my case is just a Wireguard link back to San Francisco.
This worked perfectly for most things, but some streaming services simply wouldn’t work at all. Attempting to load the video would just spin forever. Running tcpdump at the local end of the VPN endpoint showed a connection being established, some packets being exchanged, and then… nothing. The remote service appeared to just stop sending packets. Tcpdumping the remote end of the VPN showed the same thing. It wasn’t until I looked at the traffic on the VPN endpoint’s external interface that things began to become clear.
This probably needs some background. Most network infrastructure has a maximum allowable packet size, which is referred to as the Maximum Transmission Unit or MTU. For ethernet this defaults to 1500 bytes, and these days most links are able to handle packets of at least this size, so it’s pretty typical to just assume that you’ll be able to send a 1500 byte packet. But what’s important to remember is that that doesn’t mean you have 1500 bytes of packet payload – that 1500 bytes includes whatever protocol level headers are on there. For TCP/IP you’re typically looking at spending around 40 bytes on the headers, leaving somewhere around 1460 bytes of usable payload. And if you’re using a VPN, things get annoying. In this case the original packet becomes the payload of a new packet, which means it needs another set of TCP (or UDP) and IP headers, and probably also some VPN header. This still all needs to fit inside the MTU of the link the VPN packet is being sent over, so if the MTU of that is 1500, the effective MTU of the VPN interface has to be lower. For Wireguard, this works out to an effective MTU of 1420 bytes. That means simply sending a 1500 byte packet over a Wireguard (or any other VPN) link won’t work – adding the additional headers gives you a total packet size of over 1500 bytes, and that won’t fit into the underlying link’s MTU of 1500.
And yet, things work. But how? Faced with a packet that’s too big to fit into a link, there are two choices – break the packet up into multiple smaller packets (“fragmentation”) or tell whoever’s sending the packet to send smaller packets. Fragmentation seems like the obvious answer, so I’d encourage you to read Valerie Aurora’s article on how fragmentation is more complicated than you think. tl;dr – if you can avoid fragmentation then you’re going to have a better life. You can explicitly indicate that you don’t want your packets to be fragmented by setting the Don’t Fragment bit in your IP header, and then when your packet hits a link where your packet exceeds the link MTU it’ll send back a packet telling the remote that it’s too big, what the actual MTU is, and the remote will resend a smaller packet. This avoids all the hassle of handling fragments in exchange for the cost of a retransmit the first time the MTU is exceeded. It also typically works these days, which wasn’t always the case – people had a nasty habit of dropping the ICMP packets telling the remote that the packet was too big, which broke everything.
What I saw when I tcpdumped on the remote VPN endpoint’s external interface was that the connection was getting established, and then a 1500 byte packet would arrive (this is kind of the behaviour you’d expect for video – the connection handshaking involves a bunch of relatively small packets, and then once you start sending the video stream itself you start sending packets that are as large as possible in order to minimise overhead). This 1500 byte packet wouldn’t fit down the Wireguard link, so the endpoint sent back an ICMP packet to the remote telling it to send smaller packets. The remote should then have sent a new, smaller packet – instead, about a second after sending the first 1500 byte packet, it sent that same 1500 byte packet. This is consistent with it ignoring the ICMP notification and just behaving as if the packet had been dropped.
All the services that were failing were failing in identical ways, and all were using Fastly as their CDN. I complained about this on social media and then somehow ended up in contact with the engineering team responsible for this sort of thing – I sent them a packet dump of the failure, they were able to reproduce it, and it got fixed. Hurray!
(Between me identifying the problem and it getting fixed I was able to work around it. The TCP header includes a Maximum Segment Size (MSS) field, which indicates the maximum size of the payload for this connection. iptables allows you to rewrite this, so on the VPN endpoint I simply rewrote the MSS to be small enough that the packets would fit inside the Wireguard MTU. This isn’t a complete fix since it’s done at the TCP level rather than the IP level – so any large UDP packets would still end up breaking)
I’ve no idea what the underlying issue was, and at the client end the failure was entirely opaque: the remote simply stopped sending me packets. The only reason I was able to debug this at all was because I controlled the other end of the VPN as well, and even then I wouldn’t have been able to do anything about it other than being in the fortuitous situation of someone able to do something about it seeing my post. How many people go through their lives dealing with things just being broken and having no idea why, and how do we fix that?
Today customers want to reduce manual operations for deploying and maintaining their infrastructure. The recommended method to deploy and manage infrastructure on AWS is to follow Infrastructure-As-Code (IaC) model using tools like AWS CloudFormation, AWS Cloud Development Kit (AWS CDK) or Terraform.
One of the critical components in terraform is managing the state file which keeps track of your configuration and resources. When you run terraform in an AWS CI/CD pipeline the state file has to be stored in a secured, common path to which the pipeline has access to. You need a mechanism to lock it when multiple developers in the team want to access it at the same time.
In this blog post, we will explain how to manage terraform state files in AWS, best practices on configuring them in AWS and an example of how you can manage it efficiently in your Continuous Integration pipeline in AWS when used with AWS Developer Tools such as AWS CodeCommit and AWS CodeBuild. This blog post assumes you have a basic knowledge of terraform, AWS Developer Tools and AWS CI/CD pipeline. Let’s dive in!
Challenges with handling state files
By default, the state file is stored locally where terraform runs, which is not a problem if you are a single developer working on the deployment. However if not, it is not ideal to store state files locally as you may run into following problems:
When working in teams or collaborative environments, multiple people need access to the state file
Data in the state file is stored in plain text which may contain secrets or sensitive information
Local files can get lost, corrupted, or deleted
Best practices for handling state files
The recommended practice for managing state files is to use terraform’s built-in support for remote backends. These are:
Remote backend on Amazon Simple Storage Service (Amazon S3): You can configure terraform to store state files in an Amazon S3 bucket which provides a durable and scalable storage solution. Storing on Amazon S3 also enables collaboration that allows you to share state file with others.
Remote backend on Amazon S3 with Amazon DynamoDB: In addition to using an Amazon S3 bucket for managing the files, you can use an Amazon DynamoDB table to lock the state file. This will allow only one person to modify a particular state file at any given time. It will help to avoid conflicts and enable safe concurrent access to the state file.
There are other options available as well such as remote backend on terraform cloud and third party backends. Ultimately, the best method for managing terraform state files on AWS will depend on your specific requirements.
When deploying terraform on AWS, the preferred choice of managing state is using Amazon S3 with Amazon DynamoDB.
AWS configurations for managing state files
Create an Amazon S3 bucket using terraform. Implement security measures for Amazon S3 bucket by creating an AWS Identity and Access Management (AWS IAM) policy or Amazon S3 Bucket Policy. Thus you can restrict access, configure object versioning for data protection and recovery, and enable AES256 encryption with SSE-KMS for encryption control.
Next create an Amazon DynamoDB table using terraform with Primary key set to LockID. You can also set any additional configuration options such as read/write capacity units. Once the table is created, you will configure the terraform backend to use it for state locking by specifying the table name in the terraform block of your configuration.
For a single AWS account with multiple environments and projects, you can use a single Amazon S3 bucket. If you have multiple applications in multiple environments across multiple AWS accounts, you can create one Amazon S3 bucket for each account. In that Amazon S3 bucket, you can create appropriate folders for each environment, storing project state files with specific prefixes.
Now that you know how to handle terraform state files on AWS, let’s look at an example of how you can configure them in a Continuous Integration pipeline in AWS.
Architecture
Figure 1: Example architecture on how to use terraform in an AWS CI pipeline
This diagram outlines the workflow implemented in this blog:
The AWS CodeCommit repository contains the application code
The AWS CodeBuild job contains the buildspec files and references the source code in AWS CodeCommit
The AWS Lambda function contains the application code created after running terraform apply
Amazon S3 contains the state file created after running terraform apply. Amazon DynamoDB locks the state file present in Amazon S3
Implementation
Pre-requisites
Before you begin, you must complete the following prerequisites:
Install the latest version of AWS Command Line Interface (AWS CLI)
After cloning, you could see the following folder structure:
Figure 2: AWS CodeCommit repository structure
Let’s break down the terraform code into 2 parts – one for preparing the infrastructure and another for preparing the application.
Preparing the Infrastructure
The main.tf file is the core component that does below:
It creates an Amazon S3 bucket to store the state file. We configure bucket ACL, bucket versioning and encryption so that the state file is secure.
It creates an Amazon DynamoDB table which will be used to lock the state file.
It creates two AWS CodeBuild projects, one for ‘terraform plan’ and another for ‘terraform apply’.
Note – It also has the code block (commented out by default) to create AWS Lambda which you will use at a later stage.
AWS CodeBuild projects should be able to access Amazon S3, Amazon DynamoDB, AWS CodeCommit and AWS Lambda. So, the AWS IAM role with appropriate permissions required to access these resources are created via iam.tf file.
Next you will find two buildspec files named buildspec-plan.yaml and buildspec-apply.yaml that will execute terraform commands – terraform plan and terraform apply respectively.
Modify AWS region in the provider.tf file.
Update Amazon S3 bucket name, Amazon DynamoDB table name, AWS CodeBuild compute types, AWS Lambda role and policy names to required values using variable.tf file. You can also use this file to easily customize parameters for different environments.
With this, the infrastructure setup is complete.
You can use your local terminal and execute below commands in the same order to deploy the above-mentioned resources in your AWS account.
terraform init
terraform validate
terraform plan
terraform apply
Once the apply is successful and all the above resources have been successfully deployed in your AWS account, proceed with deploying your application.
Preparing the Application
In the cloned repository, use the backend.tf file to create your own Amazon S3 backend to store the state file. By default, it will have below values. You can override them with your required values.
bucket = "tfbackend-bucket"
key    = "terraform.tfstate"
region = "eu-central-1"
The repository has sample python code stored in main.py that returns a simple message when invoked.
In the main.tf file, you can find the below block of code to create and deploy the Lambda function that uses the main.py code (uncomment these code blocks).
Now you can deploy the application using AWS CodeBuild instead of running terraform commands locally which is the whole point and advantage of using AWS CodeBuild.
Run the two AWS CodeBuild projects to execute terraform plan and terraform apply again.
Once successful, you can verify your deployment by testing the code in AWS Lambda. To test a lambda function (console):
Open AWS Lambda console and select your function “tf-codebuild”
In the navigation pane, in Code section, click Test to create a test event
Provide your required name, for example “test-lambda”
Accept default values and click Save
Click Test again to trigger your test event “test-lambda”
It should return the sample message you provided in your main.py file. In the default case, it will display “Hello from AWS Lambda !” message as shown below.
Figure 3: Sample Amazon Lambda function response
To verify your state file, go to Amazon S3 console and select the backend bucket created (tfbackend-bucket). It will contain your state file.
Figure 4: Amazon S3 bucket with terraform state file
Open Amazon DynamoDB console and check your table tfstate-lock and it will have an entry with LockID.
Figure 5: Amazon DynamoDB table with LockID
Thus, you have securely stored and locked your terraform state file using terraform backend in a Continuous Integration pipeline.
Cleanup
To delete all the resources created as part of the repository, run the below command from your terminal.
terraform destroy
Conclusion
In this blog post, we explored the fundamentals of terraform state files, discussed best practices for their secure storage within AWS environments and also mechanisms for locking these files to prevent unauthorized team access. And finally, we showed you an example of how efficiently you can manage them in a Continuous Integration pipeline in AWS.
Many customers building applications on Amazon Web Services (AWS) use Stripe global payment services to help get their product out faster and grow revenue, especially in the internet economy. It’s critical for customers to securely and properly handle the credentials used to authenticate with Stripe services. Much like your AWS API keys, which enable access to your AWS resources, Stripe API keys grant access to the Stripe account, which allows for the movement of real money. Therefore, you must keep Stripe’s API keys secret and well-controlled. And, much like AWS keys, it’s important to invalidate and re-issue Stripe API keys that have been inadvertently committed to GitHub, emitted in logs, or uploaded to Amazon Simple Storage Service (Amazon S3).
Customers have asked us for ways to reduce the risk of unintentionally exposing Stripe API keys, especially when code files and repositories are stored in Amazon S3. To help meet this need, we collaborated with Stripe to develop a new managed data identifier that you can use to help discover and protect Stripe API keys.
“I’m really glad we could collaborate with AWS to introduce a new managed data identifier in Amazon Macie. Mutual customers of AWS and Stripe can now scan S3 buckets to detect exposed Stripe API keys.” — Martin Pool,Staff Engineer in Cloud Security at Stripe
In this post, we will show you how to use the new managed data identifier in Amazon Macie to discover and protect copies of your Stripe API keys.
About Stripe API keys
Stripe provides payment processing software and services for businesses. Using Stripe’s technology, businesses can accept online payments from customers around the globe.
Stripe authenticates API requests by using API keys, which are included in the request. Stripe takes various measures to help customers keep their secret keys safe and secure. Stripe users can generate test-mode keys, which can only access simulated test data, and which doesn’t move real money. Stripe encourages its customers to use only test API keys for testing and development purposes to reduce the risk of inadvertent disclosure of live keys or of accidentally generating real charges.
Stripe also supports publishable keys, which you can make publicly accessible in your web or mobile app’s client-side code to collect payment information.
In this blog post, we focus on live-mode keys, which are the primary security concern because they can access your real data and cause money movement. These keys should be closely held within the production services that need to use them. Stripe allows keys to be restricted to read or write specific API resources, or used only from certain IP ranges, but even with these restrictions, you should still handle live mode keys with caution.
Stripe keys have distinctive prefixes to help you detect them such as sk_live_ for secret keys, and rk_live_ for restricted keys (which are also secret).
Amazon Macie
Amazon Macie is a fully managed service that uses machine learning (ML) and pattern matching to discover and help protect your sensitive data, such as personally identifiable information. Macie can also provide detailed visibility into your data and help you align with compliance requirements by identifying data that needs to be protected under various regulations, such as the General Data Protection Regulation (GDPR) and the Health Insurance Portability and Accountability Act (HIPAA).
Macie supports a suite of managed data identifiers to make it simpler for you to configure and adopt. Managed data identifiers are prebuilt, customizable patterns that help automatically identify sensitive data, such as credit card numbers, social security numbers, and email addresses.
Now, Macie has a new managed data identifier STRIPE_CREDENTIALS that you can use to identify Stripe API secret keys.
Configure Amazon Macie to detect Stripe credentials
In this section, we show you how to use the managed data identifier STRIPE_CREDENTIALS to detect Stripe API secret keys. We recommend that you carry out these tutorial steps in an AWS account dedicated to experimentation and exploration before you move forward with detection in a production environment.
Prerequisites
To follow along with this walkthrough, complete the following prerequisites.
The first step is to create some example objects in an S3 bucket in the AWS account. The objects contain strings that resemble Stripe secret keys. You will use the example data later to demonstrate how Macie can detect Stripe secret keys.
Note: The keys mentioned in the preceding files are mock data and aren’t related to actual live Stripe keys.
Create a Macie job with the STRIPE_CREDENTIALS managed data identifier
Using Macie, you can scan your S3 buckets for sensitive data and security risks. In this step, you run a one-time Macie job to scan an S3 bucket and review the findings.
To create a Macie job with STRIPE_CREDENTIALS
Open theAmazon Macie console, and in the left navigation pane, choose Jobs. On the top right, choose Create job.
Figure 1: Create Macie Job
Select the bucket that you want Macie to scan or specify bucket criteria, and then choose Next.
Figure 2: Select S3 bucket
Review the details of the S3 bucket, such as estimated cost, and then choose Next.
Figure 3: Review S3 bucket
On the Refine the scope page, choose One-time job, and then choose Next.
Note: After you successfully test, you can schedule the job to scan S3 buckets at the frequency that you choose.
Figure 4: Select one-time job
For Managed data identifier options, select Custom and then select Use specific managed data identifiers. For Select managed data identifiers, search for STRIPE_CREDENTIALS and then select it. Choose Next.
Figure 5: Select managed data identifier
Enter a name and an optional description for the job, and then choose Next.
Figure 6: Enter job name
Review the job details and choose Submit. Macie will create and start the job immediately, and the job will run one time.
When the Status of the job shows Complete, select the job, and from the Show results dropdown, select Show findings.
Figure 7: Select the job and then select Show findings
You can now review the findings for sensitive data in your S3 bucket. As shown in Figure 8, Macie detected Stripe keys in each of the four files, and categorized the findings as High severity. You can review and manage the findings in the Macie console, retrieve them through the Macie API for further analysis, send them to Amazon EventBridge for automated processing, or publish them to AWS Security Hub for a comprehensive view of your security state.
Figure 8: Review the findings
Respond to unintended disclosure of Stripe API keys
If you discover Stripe live-mode keys (or other sensitive data) in an S3 bucket, then through the Stripe dashboard, you can roll your API keys to revoke access to the compromised key and generate a new one. This helps ensure that the key can’t be used to make malicious API requests. Make sure that you install the replacement key into the production services that need it. In the longer term, you can take steps to understand the path by which the key was disclosed and help prevent a recurrence.
Conclusion
In this post, you learned about the importance of safeguarding Stripe API keys on AWS. By using Amazon Macie with managed data identifiers, setting up regular reviews and restricted access to S3 buckets, training developers in security best practices, and monitoring logs and repositories, you can help mitigate the risk of key exposure and potential security breaches. By adhering to these practices, you can help ensure a robust security posture for your sensitive data on AWS.
If you have feedback about this post, submit comments in the Comments section below. If you have questions about this post, start a new thread on Amazon Macie re:Post.
Over the past week, our service teams have continued to innovate on your behalf, and a lot has happened in the Amazon Web Services (AWS) universe that I want to tell you about. I’ll also share about all the AWS Community events and initiatives that are happening around the world.
Let’s dive in!
Last week’s launches Here are some launches that got my attention during the previous week.
AWS Control Tower introduces APIs to register organizational units – With these new APIs, you can extend governance to organizational units (OUs) using APIs and automate your OU provisioning workflow. The APIs can also be used for OUs that are already under AWS Control Tower governance to re-register OUs after landing zone updates. These APIs include AWS CloudFormation support, allowing customers to manage their OUs with infrastructure as code (IaC).
API Gateway now supports TLS 1.3 – By using TLS 1.3 with API Gateway as the centralized point of control, developers can secure communication between the client and the gateway; uphold the confidentiality, integrity, and authenticity of their API traffic; and benefit from API Gateway’s integration with AWS Certificate Manager (ACM) for centralized deployment of SSL certificates using TLS.
Amazon OpenSearch Service now lets you update cluster volume without blue/green – While blue/green deployments are meant to avoid any disruption to your clusters because the deployment uses additional resources on the domain, it is recommended that you perform them during low traffic periods. Now, you can update volume-related cluster configuration without requiring a blue/green deployment, ensuring minimal performance impact on your online traffic and avoiding any potential disruption to your cluster operations.
Amazon GuardDuty Runtime Monitoring protects clusters running in shared VPC – With this launch, customers who are already opted into automated agent management in GuardDuty will benefit from a renewed 30-day trial of GuardDuty Runtime Monitoring, where we will automatically start monitoring the resources (clusters) deployed in a shared VPC setup. Customers also have the option to manually manage the agent and provision the virtual private cloud (VPC) endpoint in their shared VPC environment.
AWS Marketplace now supports managing Private Marketplace catalogs for OUs – This capability supports distinct product catalogs per business unit or development environment, empowering organizations to align software procurement with specific needs. Additionally, customers can designate a trusted member account as a delegated administrator for Private Marketplace administration, reducing the operational burden on management account administrators. With this launch, organizations can procure more quickly by providing administrators with the agile controls they need to scale their procurement governance across distinct business and user needs.
Join AWS Cloud Clubs Captains – The C3 cohort of AWS Cloud Club Captains is open for applications from February 5–23, 2024, at 5:00 PM EST.
AWS open source news and updates – Our colleague Ricardo writes this weekly open source newsletter highlighting new open source projects, tools, and demos from the AWS Community.
Upcoming AWS events
Check your calendars and sign up for upcoming AWS events:
Building with Generative AI on AWS using PartyRock, Amazon Bedrock and Amazon Q – You will gain skills in prompt engineering and using the Amazon Bedrock API. We will also explore how to “chat with your documents” through knowledge bases, Retrieval Augmented Generation (RAG), embeddings, and agents. We will also use next-generation developer tools Amazon Q and Amazon CodeWhisperer to assist in coding and debugging.
Location: AWS Skills Center, 1550-G Crystal Drive, Arlington, VA
AI/ML security – Artificial intelligence and machine learning (AI/ML) and especially generative AI have become top of mind for many organizations, but even the companies who want to move forward with this new and transformative technology are hesitating. They don’t necessarily understand how they can ensure that what they build will be secure. This webinar explains how they can do that.
AWS Jam Session – Canada Edition – AWS JAM is a gamified learning platform where you come to play, learn, and validate your AWS skills. The morning will include a mix of challenges across various technical domains – security, serverless, AI/ML, analytics, and more. The afternoon will be focused on a different specialty domain each month. You can form teams of up to four people to solve the challenges. There will be prizes for the top three winning teams.
Whether you’re in the Americas, Asia Pacific and Japan, or the EMEA region, there’s an upcoming AWS Innovate Online event that fits your time zone. Innovate Online events are free, online, and designed to inspire and educate you about AWS.
AWS Summits are a series of free online and in-person events that bring the cloud computing community together to connect, collaborate, and learn about AWS. These events are designed to educate you about AWS products and services and help you develop the skills needed to build, deploy, and operate your infrastructure and applications. Find an AWS Summit near you and register or set a notification to know when registration opens for a Summit that interests you.
AWS Community re:Invent re:Caps – Join a Community re:Cap event organized by volunteers from AWS User Groups and AWS Cloud Clubs around the world to learn about the latest announcements from AWS re:Invent.
That’s all for this week. Check back next Monday for another Weekly Roundup!
– Irshad
This post is part of our Weekly Roundup series. Check back each week for a quick roundup of interesting news and announcements from AWS!
The collective thoughts of the interwebz
Manage Consent
To provide the best experiences, we use technologies like cookies to store and/or access device information. Consenting to these technologies will allow us to process data such as browsing behavior or unique IDs on this site. Not consenting or withdrawing consent, may adversely affect certain features and functions.
Functional
Always active
The technical storage or access is strictly necessary for the legitimate purpose of enabling the use of a specific service explicitly requested by the subscriber or user, or for the sole purpose of carrying out the transmission of a communication over an electronic communications network.
Preferences
The technical storage or access is necessary for the legitimate purpose of storing preferences that are not requested by the subscriber or user.
Statistics
The technical storage or access that is used exclusively for statistical purposes.The technical storage or access that is used exclusively for anonymous statistical purposes. Without a subpoena, voluntary compliance on the part of your Internet Service Provider, or additional records from a third party, information stored or retrieved for this purpose alone cannot usually be used to identify you.
Marketing
The technical storage or access is required to create user profiles to send advertising, or to track the user on a website or across several websites for similar marketing purposes.


 Swapna Bandla is a Senior Solutions Architect in the AWS Analytics Specialist SA Team. Swapna has a passion towards understanding customers data and analytics needs and empowering them to develop cloud-based well-architected solutions. Outside of work, she enjoys spending time with her family.
 Indira Balakrishnan is a Principal Solutions Architect in the AWS Analytics Specialist SA Team. She is passionate about helping customers build cloud-based analytics solutions to solve their business problems using data-driven decisions. Outside of work, she volunteers at her kids’ activities and spends time with her family.


 Stefano Sandona is a Senior Big Data Solution Architect at AWS. He loves data, distributed systems and security. He helps customers around the world architecting secure, scalable and reliable big data platforms.
 Adnan Hemani is a Software Development Engineer at AWS working with the EMR team. He focuses on the security posture of applications running on EMR clusters. He is interested in modern Big Data applications and how customers interact with them.




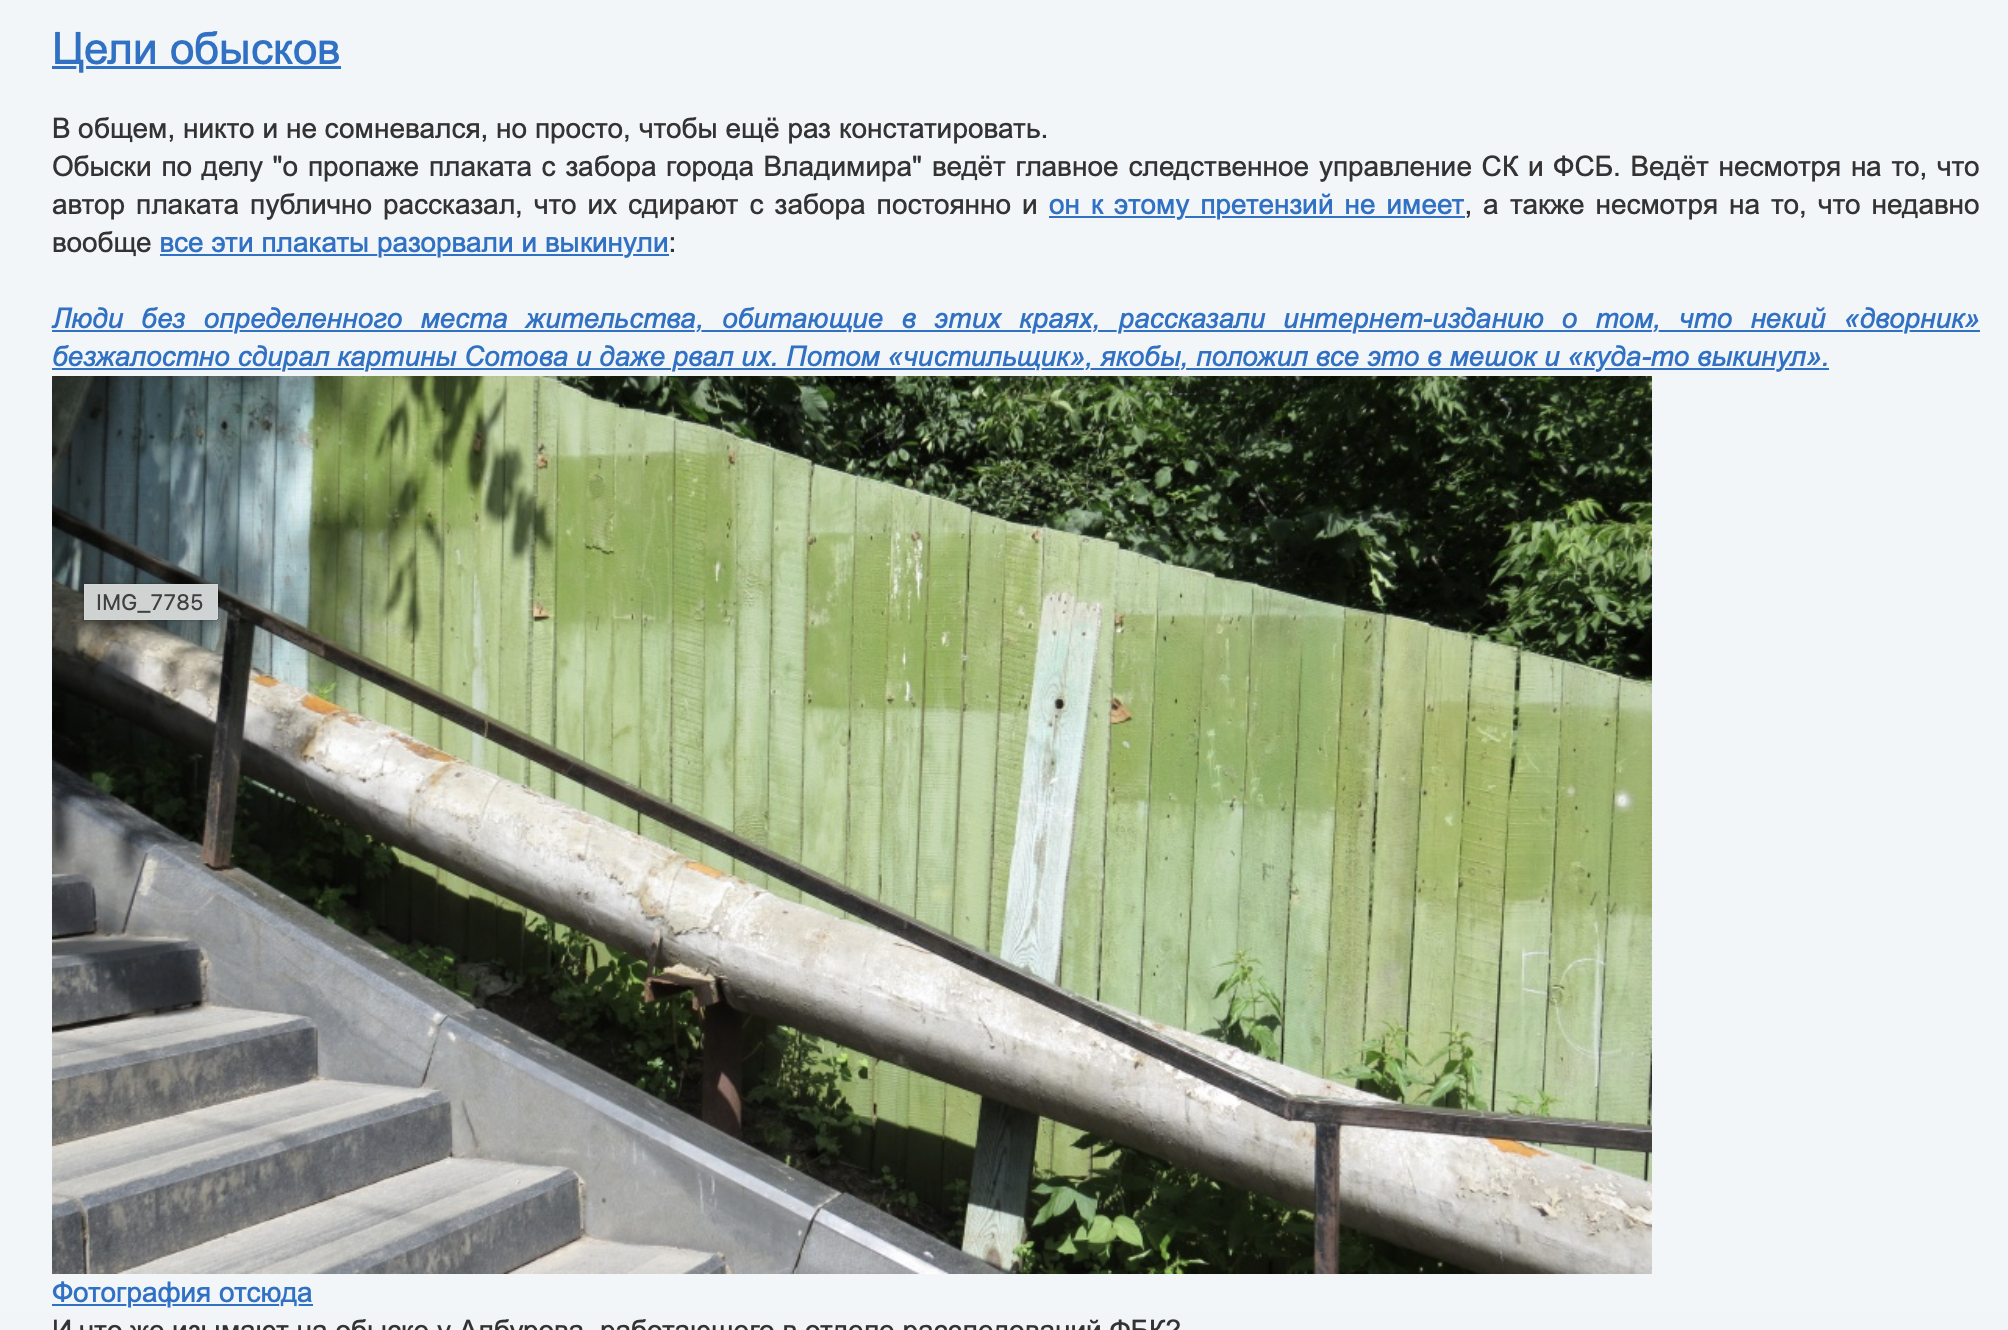
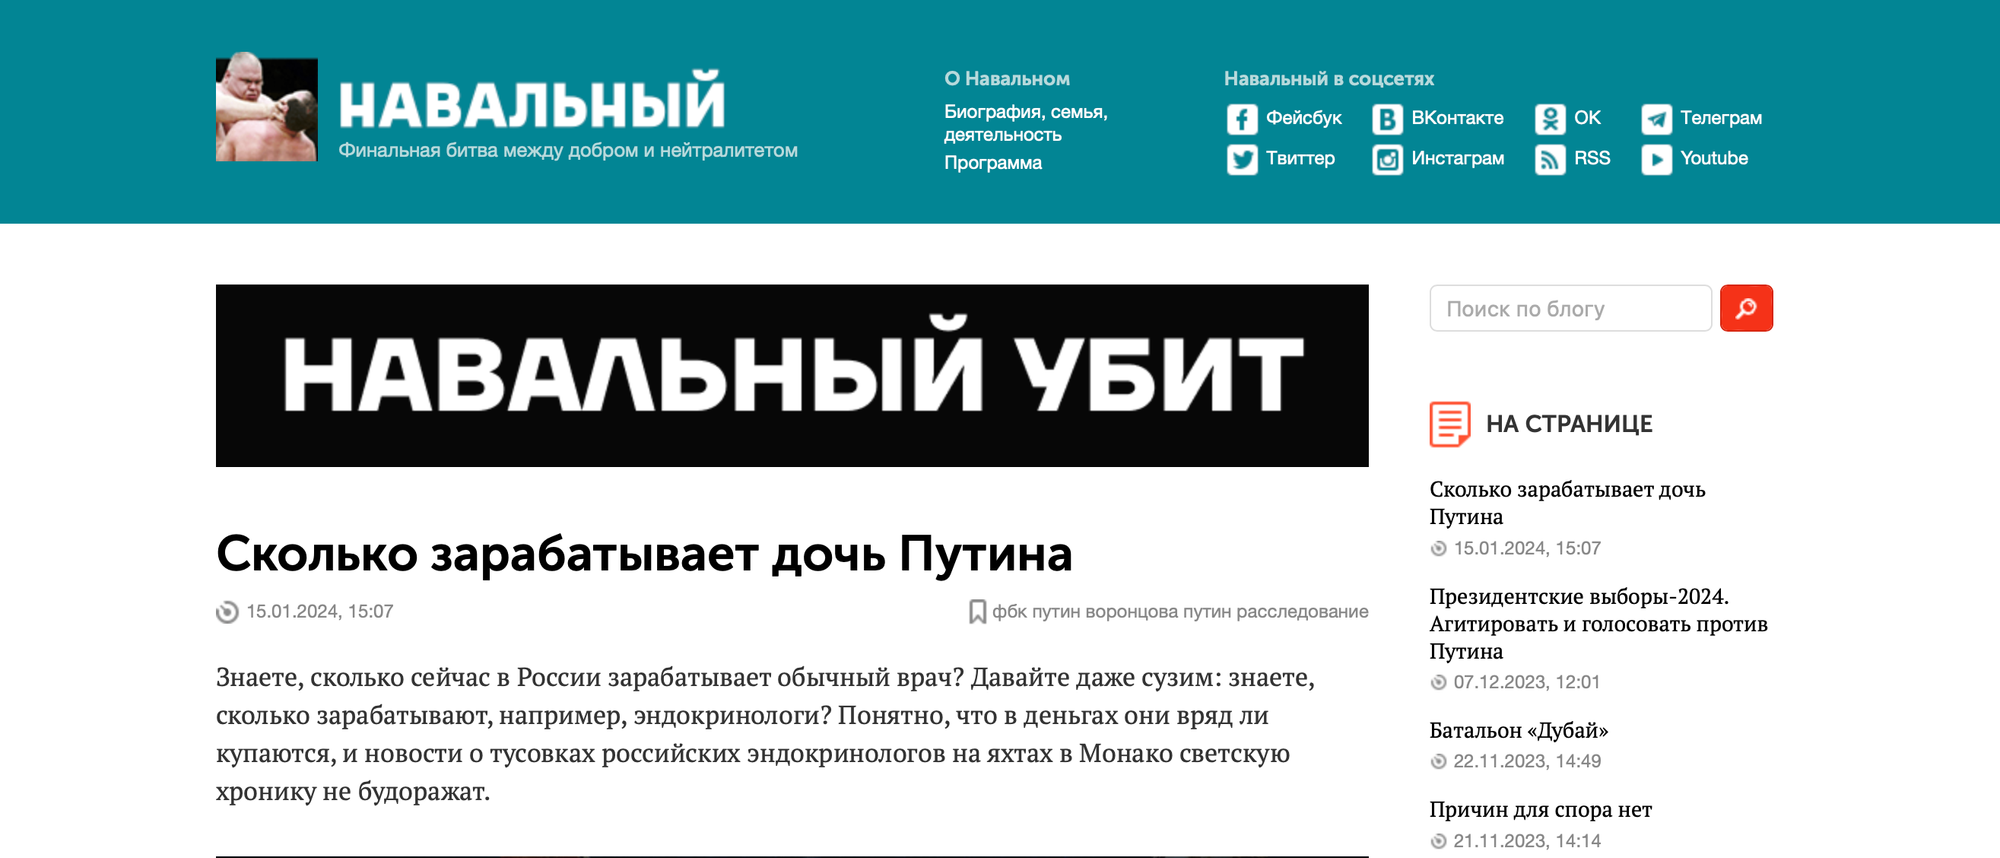














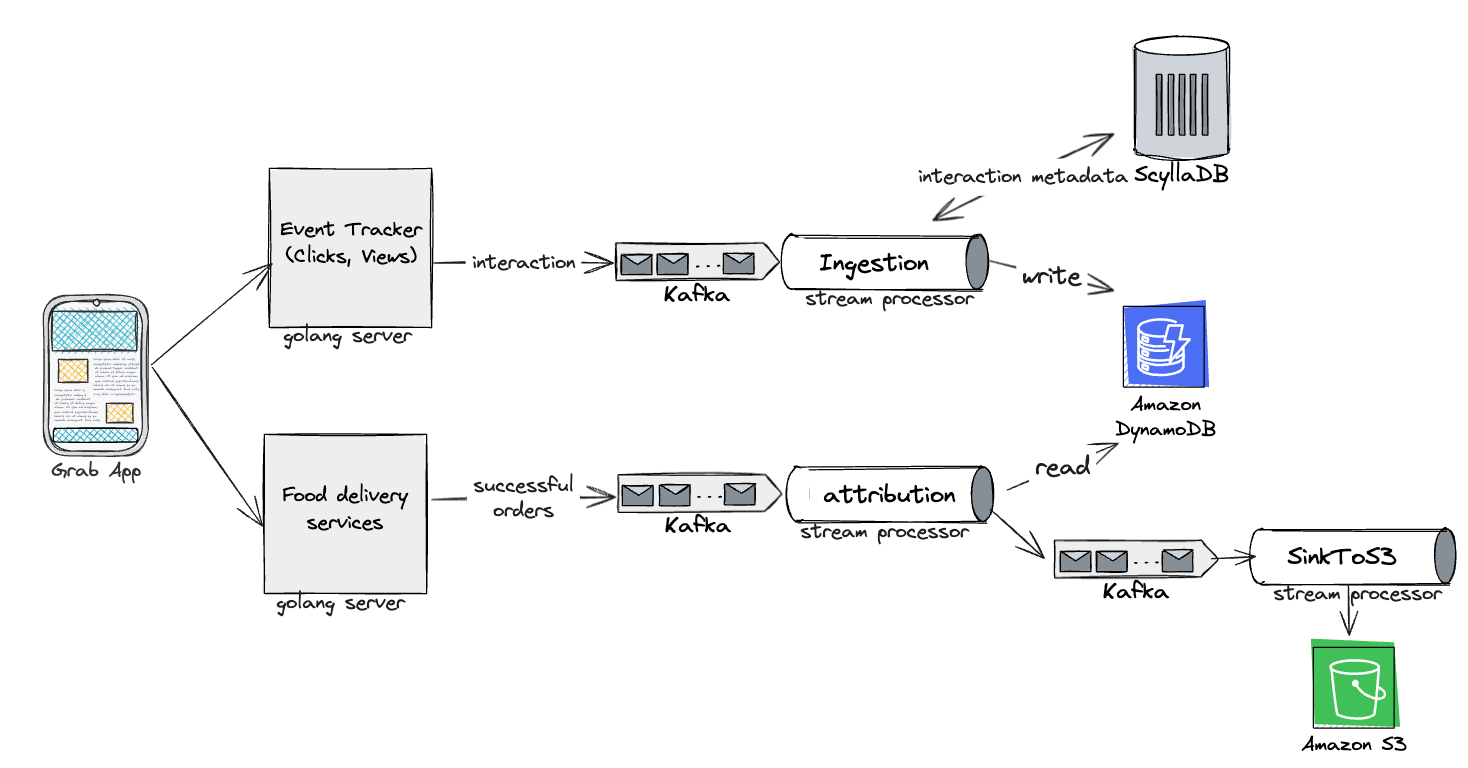
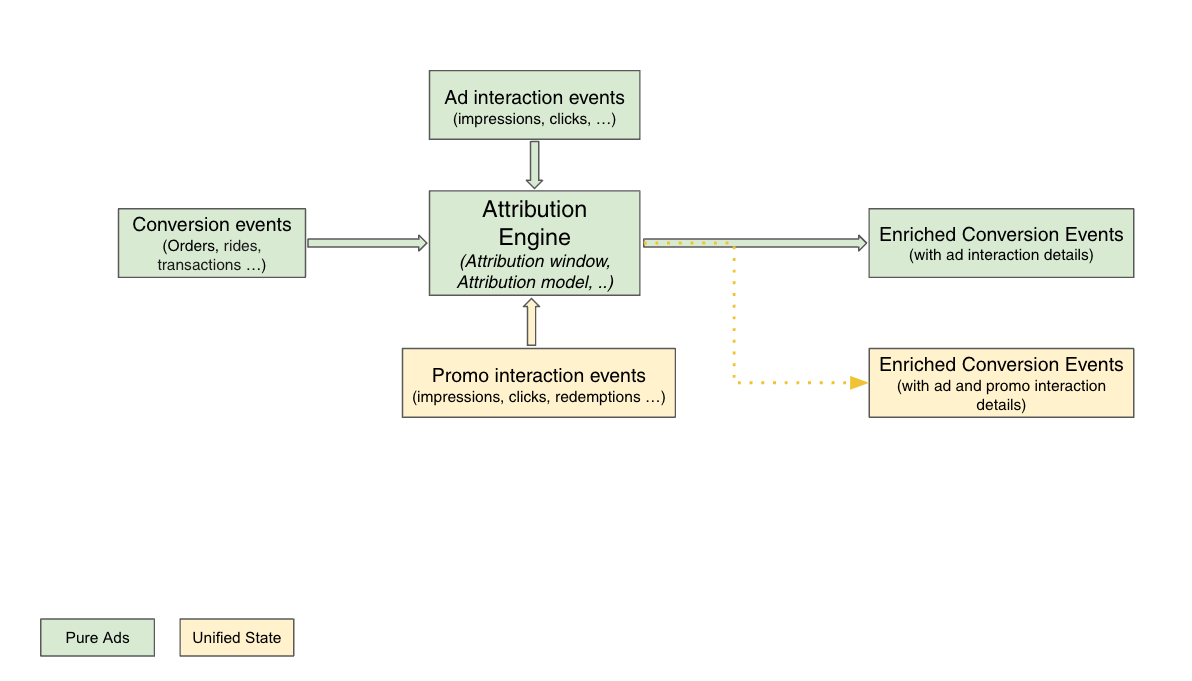
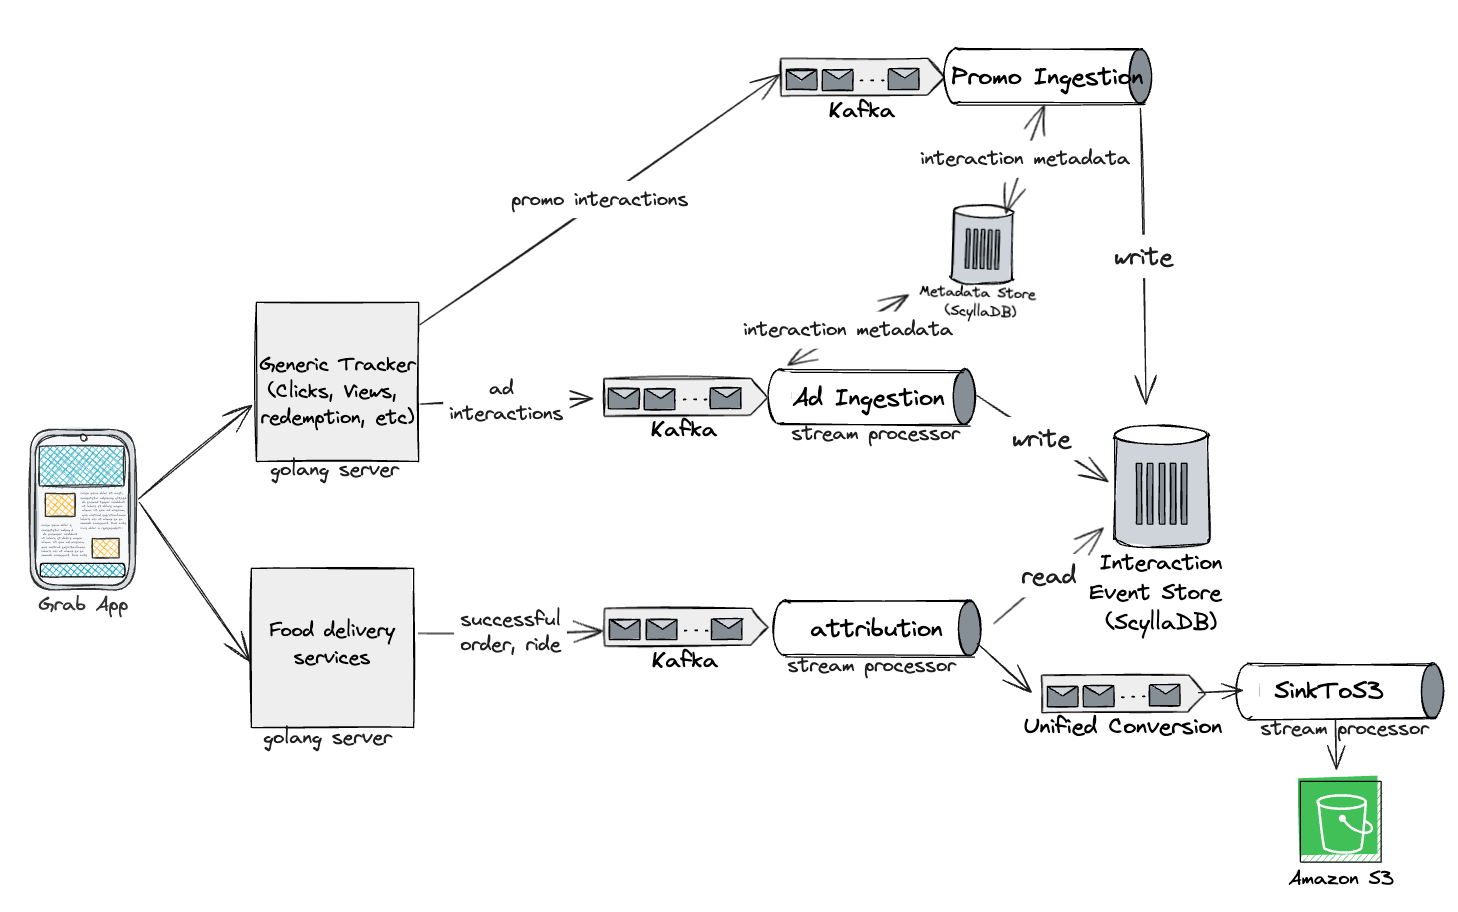
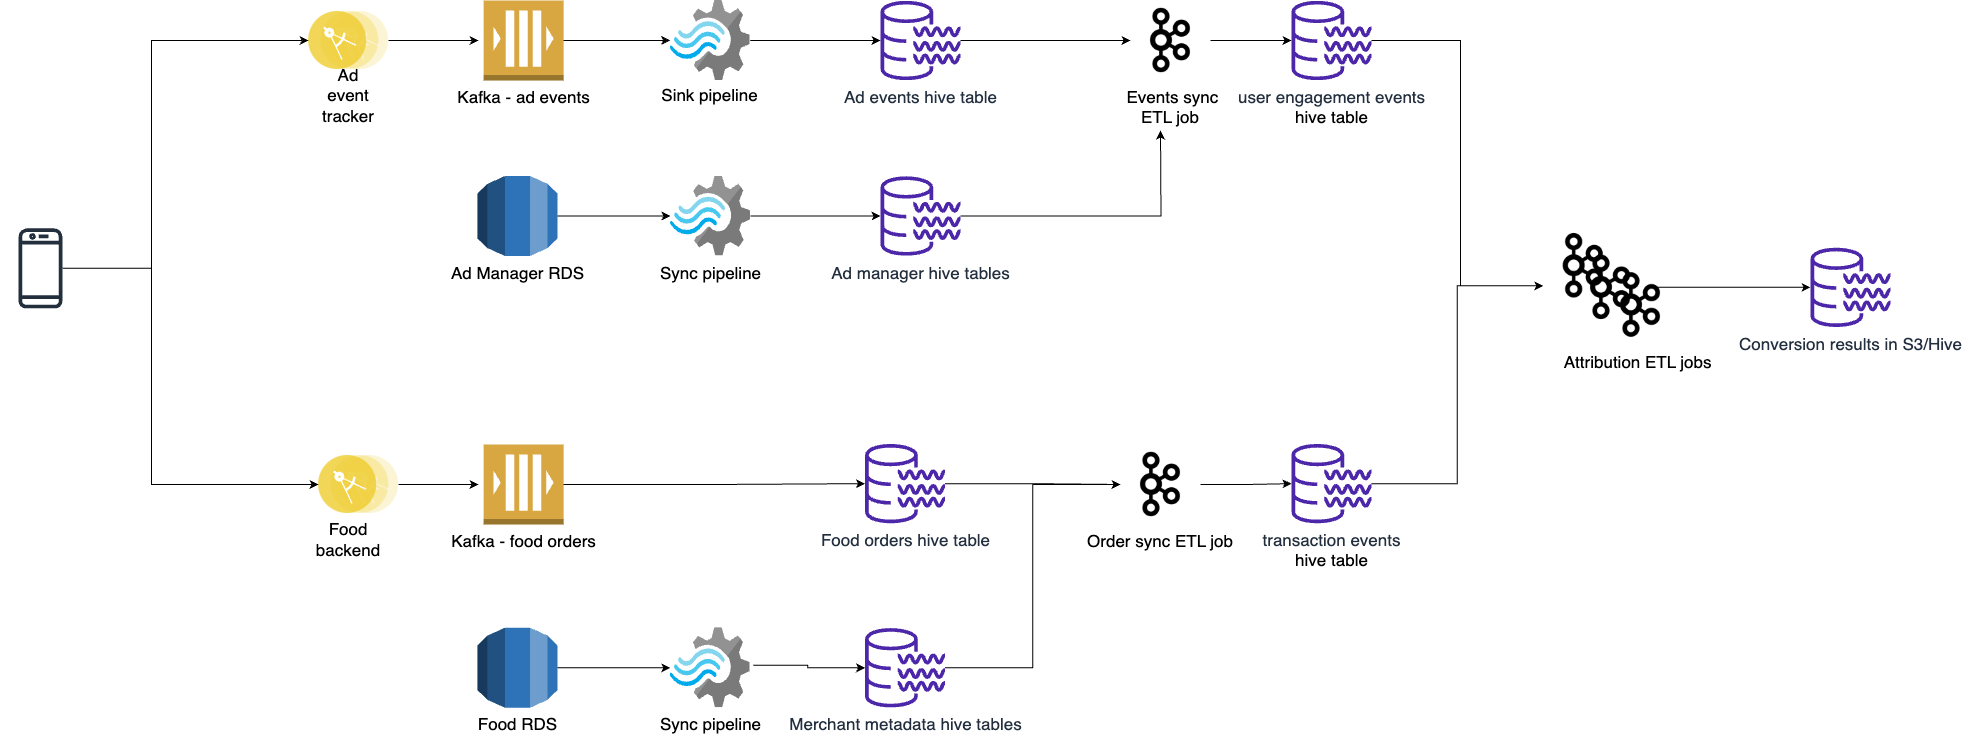
 comments