Introducing embedded function calling and a new ai-utils package
Today, we’re excited to announce a novel way to do function calling that co-locates LLM inference with function execution, and a new ai-utils package that upgrades the developer experience for function calling.
This is a follow-up to our mid-June announcement for traditional function calling, which allows you to leverage a Large Language Model (LLM) to intelligently generate structured outputs and pass them to an API call. Function calling has been largely adopted and standardized in the industry as a way for AI models to help perform actions on behalf of a user.
Our goal is to make building with AI as easy as possible, which is why we’re introducing a new @cloudflare/ai-utils npm package that allows developers to get started quickly with embedded function calling. These helper tools drastically simplify your workflow by actually executing your function code and dynamically generating tools from OpenAPI specs. We’ve also open-sourced our ai-utils package, which you can find on GitHub. With both embedded function calling and our ai-utils, you’re one step closer to creating intelligent AI agents, and from there, the possibilities are endless.
Why Cloudflare’s AI platform?
OpenAI has been the gold standard when it comes to having performant model inference and a great developer experience. However, they mostly support their closed-source models, while we want to also promote the open-source ecosystem of models. One of our goals with Workers AI is to match the developer experience you might get from OpenAI, but with open-source models.
There are other open-source inference providers out there like Azure or Bedrock, but most of them are focused on serving inference and the underlying infrastructure, rather than being a developer toolkit. While there are external libraries and frameworks like AI SDK that help developers build quickly with simple abstractions, they rely on upstream providers to do the actual inference. With Workers AI, it’s the best of both worlds – we offer open-source model inference and a killer developer experience out of the box.
With the release of embedded function calling and ai-utils today, we’ve advanced how we do inference for function calling and improved the developer experience by making it dead simple for developers to start building AI experiences.
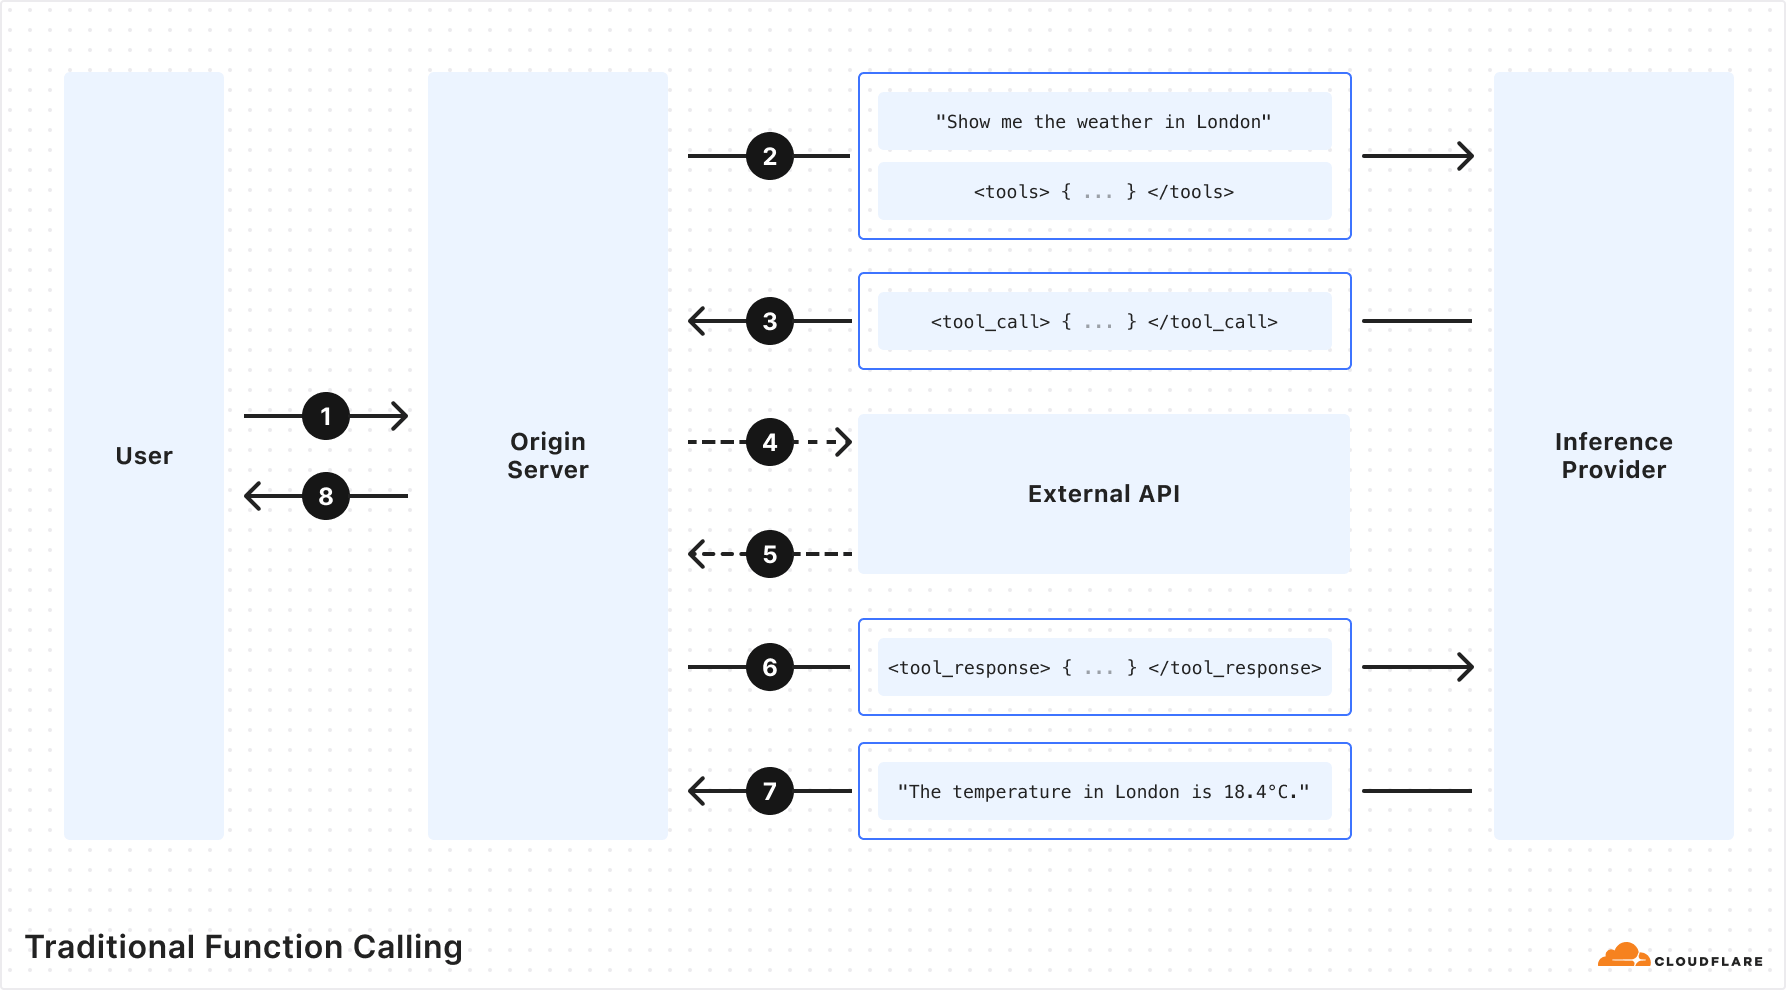
How does traditional function calling work?
Traditional LLM function calling allows customers to specify a set of function names and required arguments along with a prompt when running inference on an LLM. The LLM returns the names and arguments for the functions that the customer can then make to perform actions. These actions give LLMs the ability to do things like fetch fresh data not present in the training dataset and “perform actions” based on user intent.
Traditional function calling requires multiple back-and-forth requests passing through the network in order to get to the final output. This includes requests to your origin server, an inference provider, and external APIs. As a developer, you have to orchestrate all the back-and-forths and handle all the requests and responses. If you were building complex agents with multi-tool calls or recursive tool calls, it gets infinitely harder. Fortunately, this doesn’t have to be the case, and we’ve solved it for you.
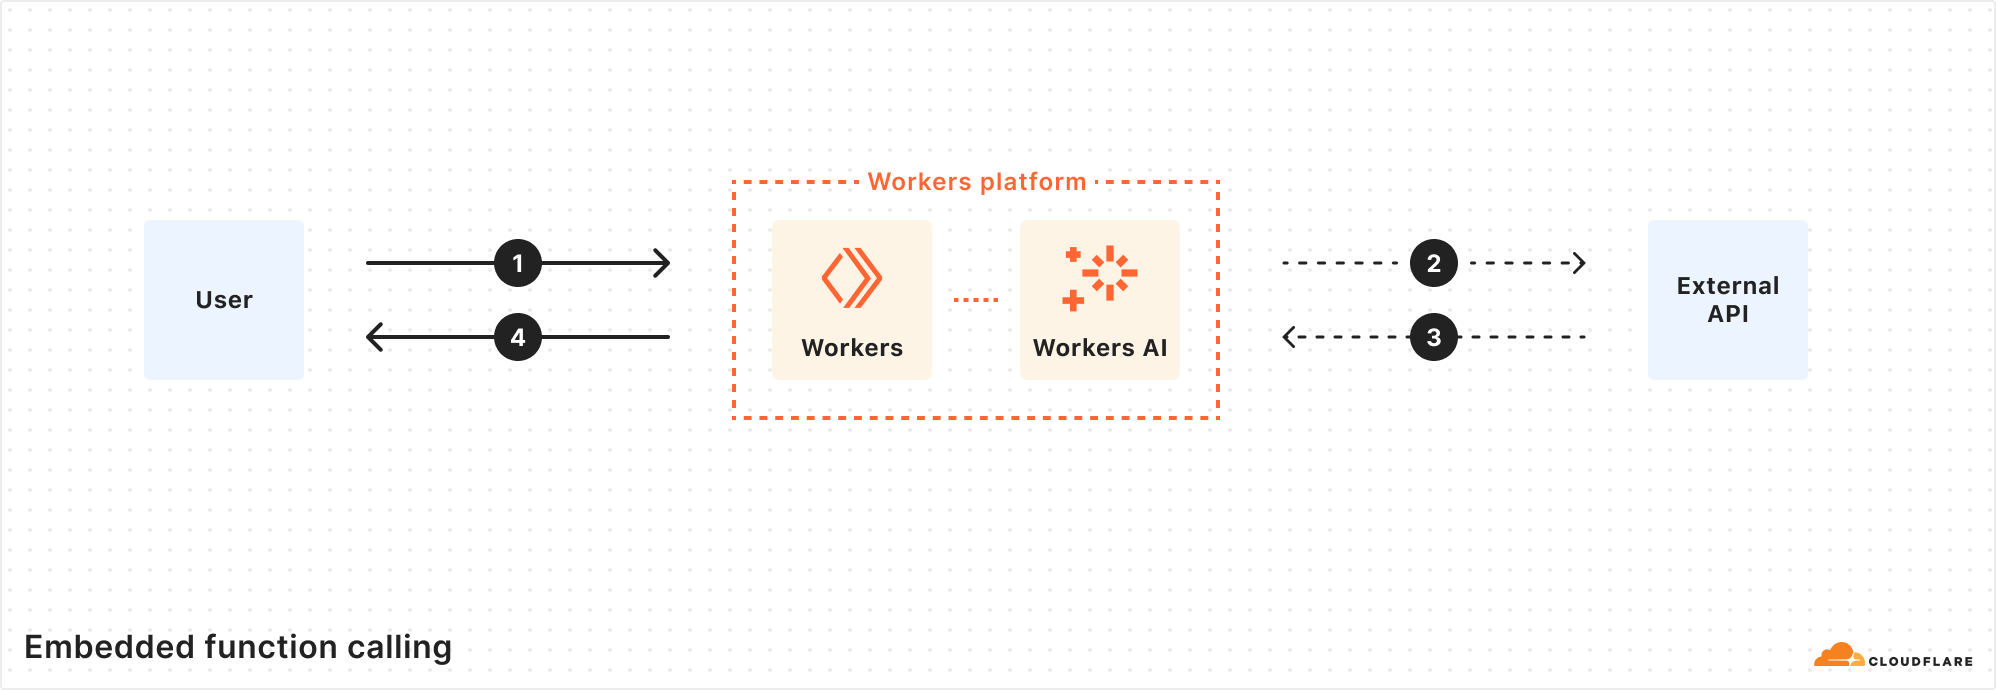
Embedded function calling
With Workers AI, our inference runtime is the Workers platform, and the Workers platform can be seen as a global compute network of distributed functions (RPCs). With this model, we can run inference using Workers AI, and supply not only the function names and arguments, but also the runtime function code to be executed. Rather than performing multiple round-trips across networks, the LLM inference and function can run in the same execution environment, cutting out all the unnecessary requests.
Cloudflare is one of the few inference providers that is able to do this because we offer more than just inference – our developer platform has compute, storage, inference, and more, all within the same Workers runtime.
We made it easy for you with a new ai-utils package
And to make it as simple as possible, we created a @cloudflare/ai-utils package that you can use to get started. These powerful abstractions cut down on the logic you have to implement to do function calling – it just works out of the box.
runWithTools
runWithTools is our method that you use to do embedded function calling. You pass in your AI binding (env.AI), model, prompt messages, and tools. The tools array includes the description of the function, similar to traditional function calling, but you also pass in the function code that needs to be executed. This method makes the inference calls and executes the function code in one single step. runWithTools is also able to handle multiple function calls, recursive tool calls, validation for model responses, streaming for the final response, and other features.
Another feature to call out is a helper method called autoTrimTools that automatically selects the relevant tools and trims the tools array based on the names and descriptions. We do this by adding an initial LLM inference call to intelligently trim the tools array before the actual function-calling inference call is made. We found that autoTrimTools helped decrease the number of total tokens used in the entire process (especially when there’s a large number of tools provided) because there’s significantly fewer input tokens used when generating the arguments list. You can choose to use autoTrimTools by setting it as a parameter in the runWithTools method.
const response = await runWithTools(env.AI,"@hf/nousresearch/hermes-2-pro-mistral-7b",
  {
    messages: [{ role: "user", content: "What's the weather in Austin, Texas?"}],
    tools: [
      {
        name: "getWeather",
        description: "Return the weather for a latitude and longitude",
        parameters: {
          type: "object",
          properties: {
            latitude: {
              type: "string",
              description: "The latitude for the given location"
            },
            longitude: {
              type: "string",
              description: "The longitude for the given location"
            }
          },
          required: ["latitude", "longitude"]
        },
	 // function code to be executed after tool call
        function: async ({ latitude, longitude }) => {
          const url = `https://api.weatherapi.com/v1/current.json?key=${env.WEATHERAPI_TOKEN}&q=${latitude},${longitude}`
          const res = await fetch(url).then((res) => res.json())

          return JSON.stringify(res)
        }
      }
    ]
  },
  {
    streamFinalResponse: true,
    maxRecursiveToolRuns: 5,
    trimFunction: autoTrimTools,
    verbose: true,
    strictValidation: true
  }
)
createToolsFromOpenAPISpec
For many use cases, users will need to make a request to an external API call during function calling to get the output needed. Instead of having to hardcode the exact API endpoints in your tools array, we made a helper function that takes in an OpenAPI spec and dynamically generates the corresponding tool schemas and API endpoints you’ll need for the function call. You call createToolsFromOpenAPISpec from within runWithTools and it’ll dynamically populate everything for you.
const response = await runWithTools(env.AI, "@hf/nousresearch/hermes-2-pro-mistral-7b", {
  messages: [{ role: "user",content: "Can you name me 5 repos created by Cloudflare"}],
  tools: [
    ...(await createToolsFromOpenAPISpec(  "https://raw.githubusercontent.com/github/rest-api-description/main/descriptions-next/api.github.com/api.github.com.json"
    ))
  ]
})
Putting it all together
When you make a function calling inference request with runWithTools and createToolsFromOpenAPISpec, the only thing you need is the prompts – the rest is automatically handled. The LLM will choose the correct tool based on the prompt, the runtime will execute the function needed, and you’ll get a fast, intelligent response from the model. By leveraging our Workers runtime’s bindings and RPC calls along with our global network, we can execute everything from a single location close to the user, enabling developers to easily write complex agentic chains with fewer lines of code.
We’re super excited to help people build intelligent AI systems with our new embedded function calling and powerful tools. Check out our developer docs on how to get started, and let us know what you think on Discord.
Bots using residential proxies are a major source of frustration for security engineers trying to fight online abuse. These engineers often see a similar pattern of abuse when well-funded, modern botnets target their applications. Advanced bots bypass country blocks, ASN blocks, and rate-limiting. Every time, the bot operator moves to a new IP address space until they blend in perfectly with the “good” traffic, mimicking real users’ behavior and request patterns. Our new Bot Management machine learning model (v8) identifies residential proxy abuse without resorting to IP blocking, which can cause false positives for legitimate users.
Background
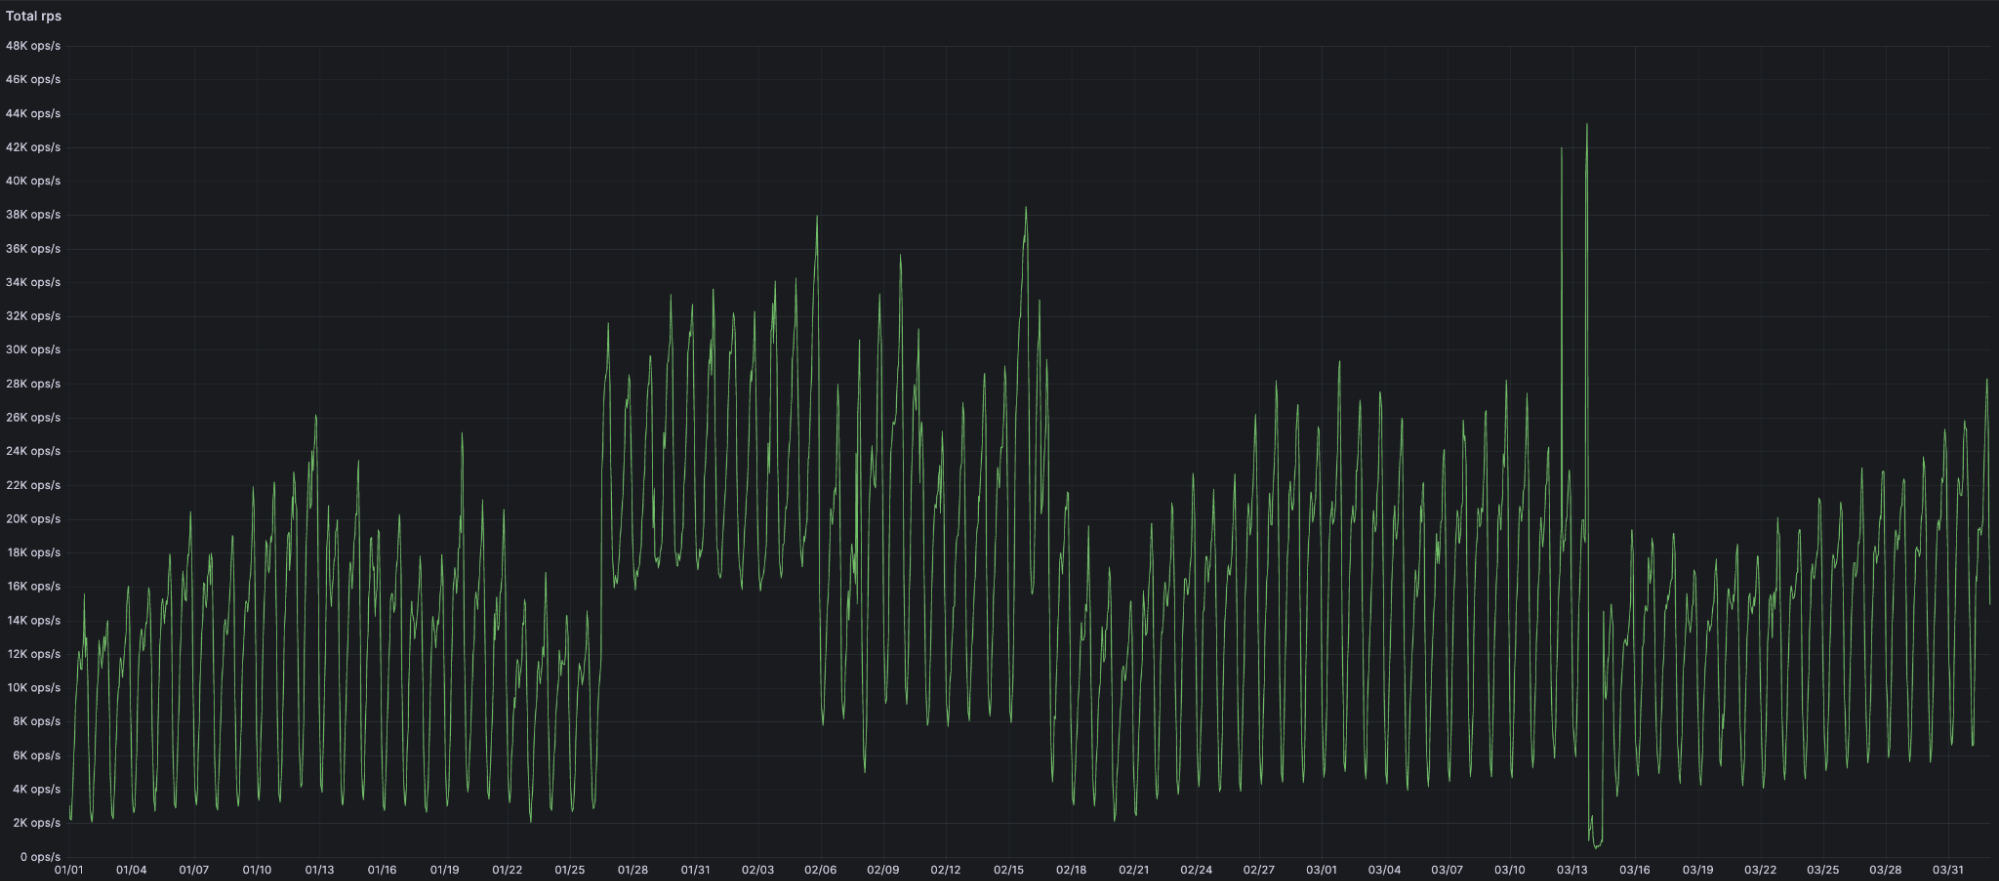
One of the main sources of Cloudflare’s bot score is our bot detection machine learning model which analyzes, on average, over 46 million HTTP requests per second in real time. Since our first Bot Management ML model was released in 2019, we have continuously evolved and improved the model. Nowadays, our models leverage features based on request fingerprints, behavioral signals, and global statistics and trends that we see across our network.
Each iteration of the model focuses on certain areas of improvement. This process starts with a rigorous R&D phase to identify the emerging patterns of bot attacks by reviewing feedback from our customers and reports of missed attacks. In v8, we mainly focused on two areas of abuse. First, we analyzed the campaigns that leverage residential IP proxies, which are proxies on residential networks commonly used to launch widely distributed attacks against high profile targets. In addition to that, we improved model accuracy for detecting attacks that originate from cloud providers.
Residential IP proxies
Proxies allow attackers to hide their identity and distribute their attack. Moreover, IP address rotation allows attackers to directly bypass traditional defenses such as IP reputation and IP rate limiting. Knowing this, defenders use a plethora of signals to identify malicious use of proxies. In its simplest forms, IP reputation signals (e.g., data center IP addresses, known open proxies, etc.) can lead to the detection of such distributed attacks.
However, in the past few years, bot operators have started favoring proxies operating in residential network IP address space. By using residential IP proxies, attackers can masquerade as legitimate users by sending their traffic through residential networks. Nowadays, residential IP proxies are offered by companies that facilitate access to large pools of IP addresses for attackers. Residential proxy providers claim to offer 30-100 million IPs belonging to residential and mobile networks across the world. Most commonly, these IPs are sourced by partnering with free VPN providers, as well as including the proxy SDKs into popular browser extensions and mobile applications. This allows residential proxy providers to gain a foothold on victims’ devices and abuse their residential network connections.
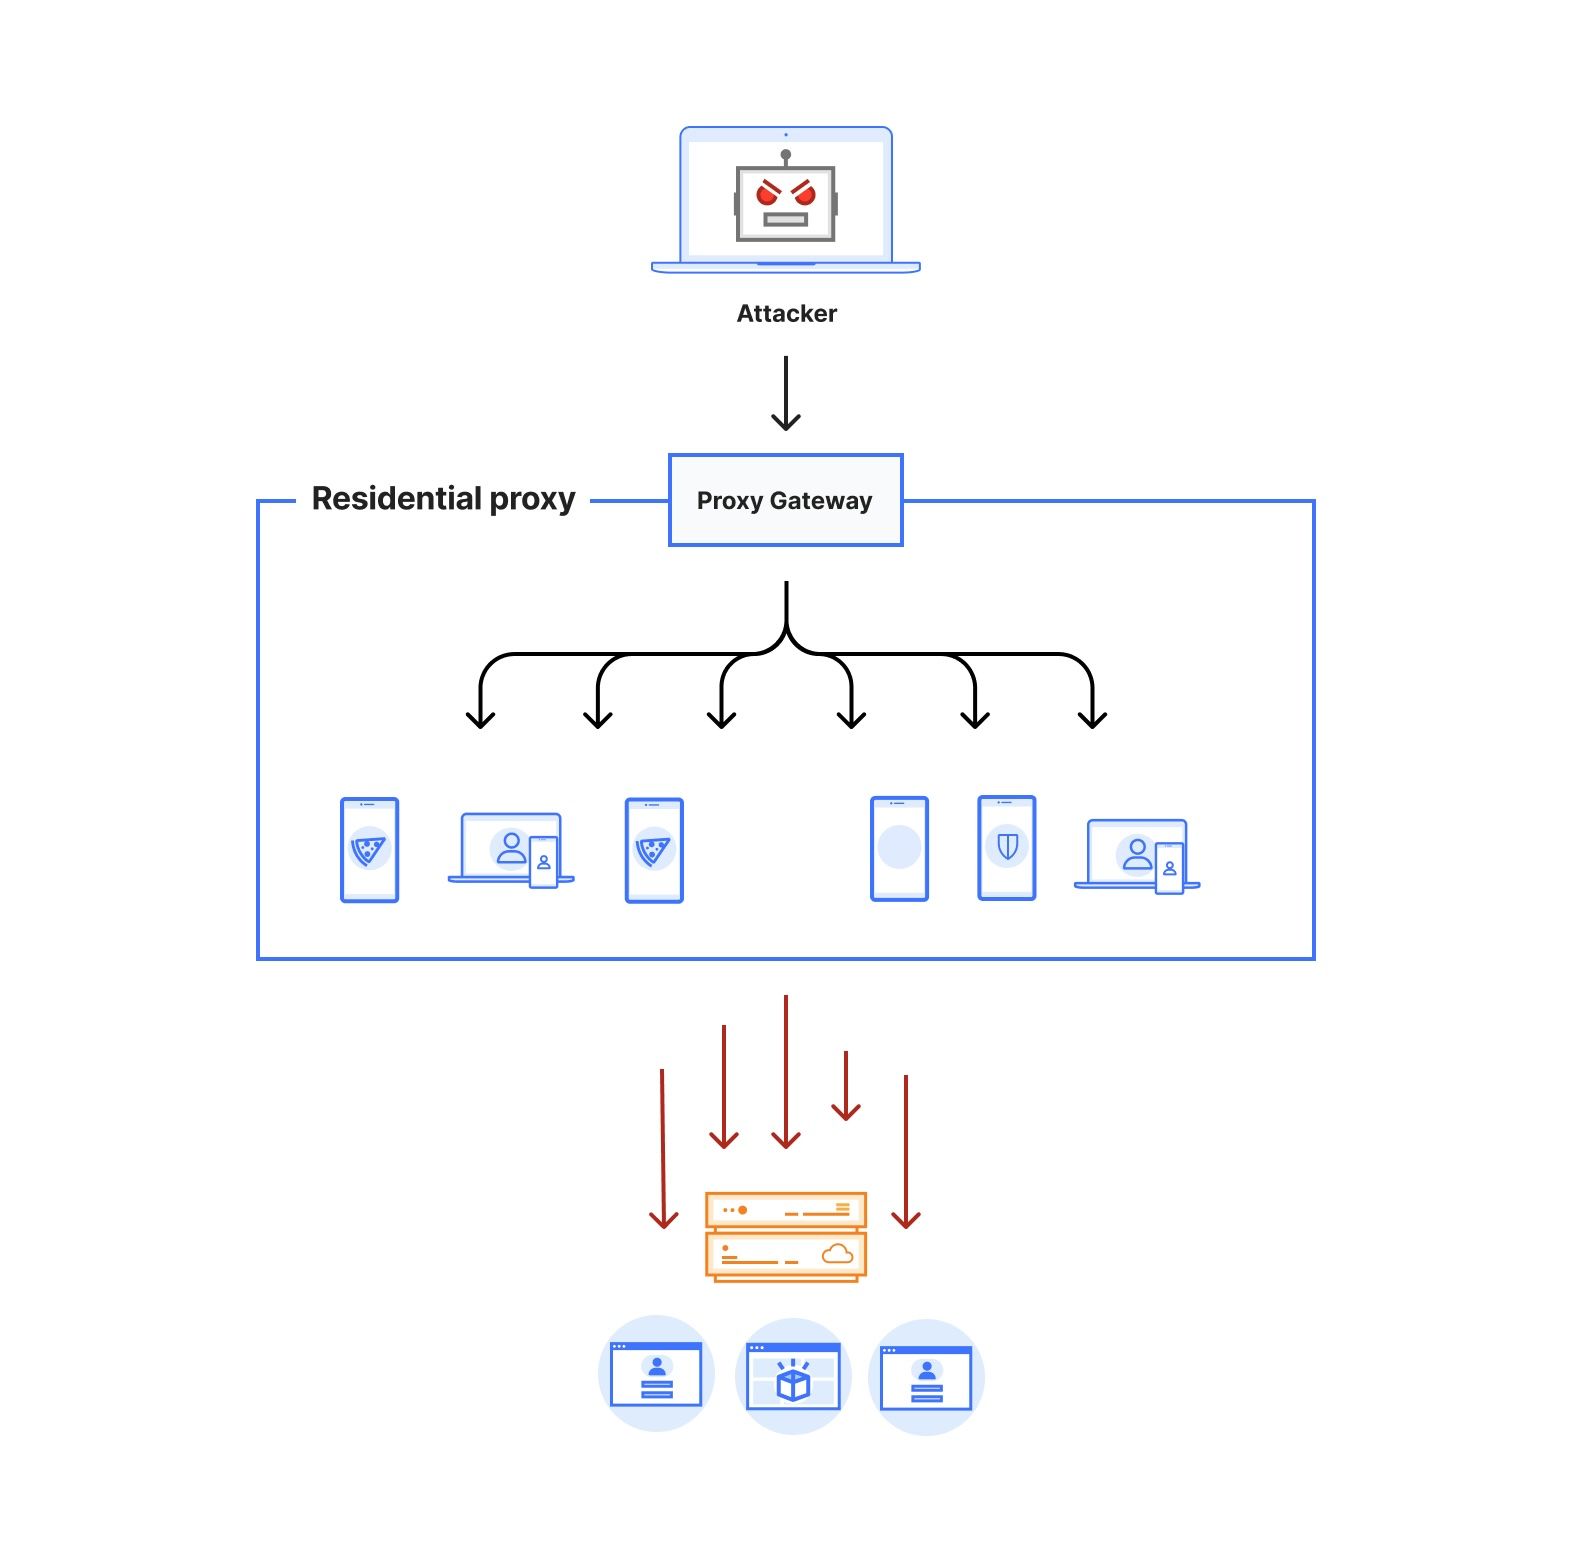
Figure 1: Architecture of a residential proxy network
Figure 1 depicts the architecture of a residential proxy. By subscribing to these services, attackers gain access to an authenticated proxy gateway address commonly using the HTTPS/SOCKS5 proxy protocol. Some residential proxy providers allow their users to select the country or region for the proxy exit nodes. Alternatively, users can choose to keep the same IP address throughout their session or rotate to a new one for each outgoing request. Residential proxy providers then identify active exit nodes on their network (on devices that they control within residential networks across the world) and route the proxied traffic through them.
The large pool of IP addresses and the diversity of networks poses a challenge to traditional bot defense mechanisms that rely on IP reputation and rate limiting. Moreover, the diversity of IPs enables the attackers to rotate through them indefinitely. This shrinks the window of opportunity for bot detection systems to effectively detect and stop the attacks. Effective defense against residential proxy attacks should be able to detect this type of bot traffic either based on single request features to stop the attack immediately, or identify unique fingerprints from the browsing agent to track and mitigate the bot traffic regardless of the IP source. Overly broad blocking actions, such as IP block-listing, by definition, would result in blocking legitimate traffic from residential networks where at least one device is acting as a residential proxy node.
ML model training
At its heart, our model is built using a chain of modules that work together. Initially, we fetch and prepare training and validation datasets from our Clickhouse data storage. We use datasets with high confidence labels as part of our training. For model validation, we use datasets consisting of missed attacks reported by our customers, known sources of bot traffic (e.g., verified bots), and high confidence detections from other bot management modules (e.g., heuristics engine). We orchestrate these steps using Apache Airflow, which enables us to customize each stage of the ML model training and define the interdependencies of our training, validation, and reporting modules in the form of directed acyclic graphs (DAGs).
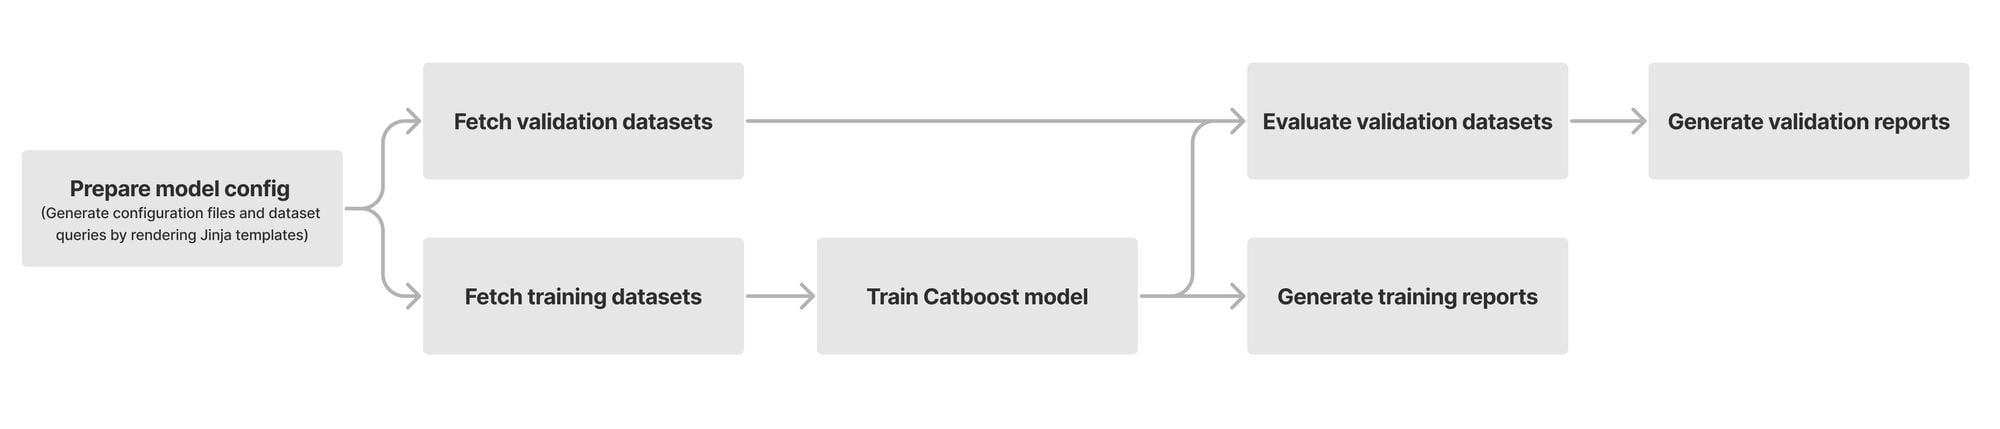
The first step of training a new model is fetching labeled training data from our data store. Under the hood, our dataset definitions are SQL queries that will materialize by fetching data from our Clickhouse cluster where we store feature values and calculate aggregates from the traffic on our network. Figure 2 depicts these steps as train and validation dataset fetch operations. Introducing new datasets can be as straightforward as writing the SQL queries to filter the desired subset of requests.
Figure 2: Airflow DAG for model training and validation
After fetching the datasets, we train our Catboost model and tune its hyper parameters. During evaluation, we compare the performance of the newly trained model against the current default version running for our customers. To capture the intricate patterns in subsets of our data, we split certain validation datasets into smaller slivers called specializations. For instance, we use the detections made by our heuristics engine and managed rulesets as ground truth for bot traffic. To ensure that larger sources of traffic (large ASNs, different HTTP versions, etc.) do not mask our visibility into patterns for the rest of the traffic, we define specializations for these sources of traffic. As a result, improvements in accuracy of the new model can be evaluated for common patterns (e.g., HTTP/1.1 and HTTP/2) as well as less common ones. Our model training DAG will provide a breakdown report for the accuracy, score distribution, feature importance, and SHAP explainers for each validation dataset and its specializations.
Once we are happy with the validation results and model accuracy, we evaluate our model against a checklist of steps to ensure the correctness and validity of our model. We start by ensuring that our results and observations are reproducible over multiple non-overlapping training and validation time ranges. Moreover, we check for the following factors:
Check for the distribution of feature values to identify irregularities such as missing or skewed values.
Check for overlaps between training and validation datasets and feature values.
Verify the diversity of training data and the balance between labels and datasets.
Evaluate performance changes in the accuracy of the model on validation datasets based on their order of importance.
Check for model overfitting by evaluating the feature importance and SHAP explainers.
After the model passes the readiness checks, we deploy it in shadow mode. We can observe the behavior of the model on live traffic in log-only mode (i.e., without affecting the bot score). After gaining confidence in the model’s performance on live traffic, we start onboarding beta customers, and gradually switch the model to active mode all while closely monitoring the real-world performance of our new model.
ML features for bot detection
Each of our models uses a set of features to make inferences about the incoming requests. We compute our features based on single request properties (single request features) and patterns from multiple requests (i.e., inter-request features). We can categorize these features into the following groups:
Global features: inter-request features that are computed based on global aggregates for different types of fingerprints and traffic sources (e.g., for an ASN) seen across our global network. Given the relatively lower cardinality of these features, we can scalably calculate global aggregates for each of them.
High cardinality features: inter-request features focused on fine-grained aggregate data from local traffic patterns and behaviors (e.g., for an individual IP address)
Single request features: features derived from each individual request (e.g., user agent).
Our Bot Management system (named BLISS) is responsible for fetching and computing these feature values and making them available on our servers for inference by active versions of our ML models.
Detecting residential proxies using network and behavioral signals
Attacks originating from residential IP addresses are commonly characterized by a spike in the overall traffic towards sensitive endpoints on the target websites from a large number of residential ASNs. Our approach for detecting residential IP proxies is twofold. First, we start by comparing direct vs proxied requests and looking for network level discrepancies. Revisiting Figure 1, we notice that a request routed through residential proxies (red dotted line) has to traverse through multiple hops before reaching the target, which affects the network latency of the request.
Based on this observation alone, we are able to characterize residential proxy traffic with a high true positive rate (i.e., all residential proxy requests have high network latency). While we were able to replicate this in our lab environment, we quickly realized that at the scale of the Internet, we run into numerous exceptions with false positive detections (i.e., non-residential proxy traffic with high latency). For instance, countries and regions that predominantly use satellite Internet would exhibit a high network latency for the majority of their requests due to the use of performance enhancing proxies.
Realizing that relying solely on network characteristics of connections to detect residential proxies is inadequate given the diversity of the connections on the Internet, we switched our focus to the behavior of residential IPs. To that end, we observe that the IP addresses from residential proxies express a distinct behavior during periods of peak activity. While this observation singles out highly active IPs over their peak activity time, given the pool size of residential IPs, it is not uncommon to only observe a small number of requests from the majority of residential proxy IPs.
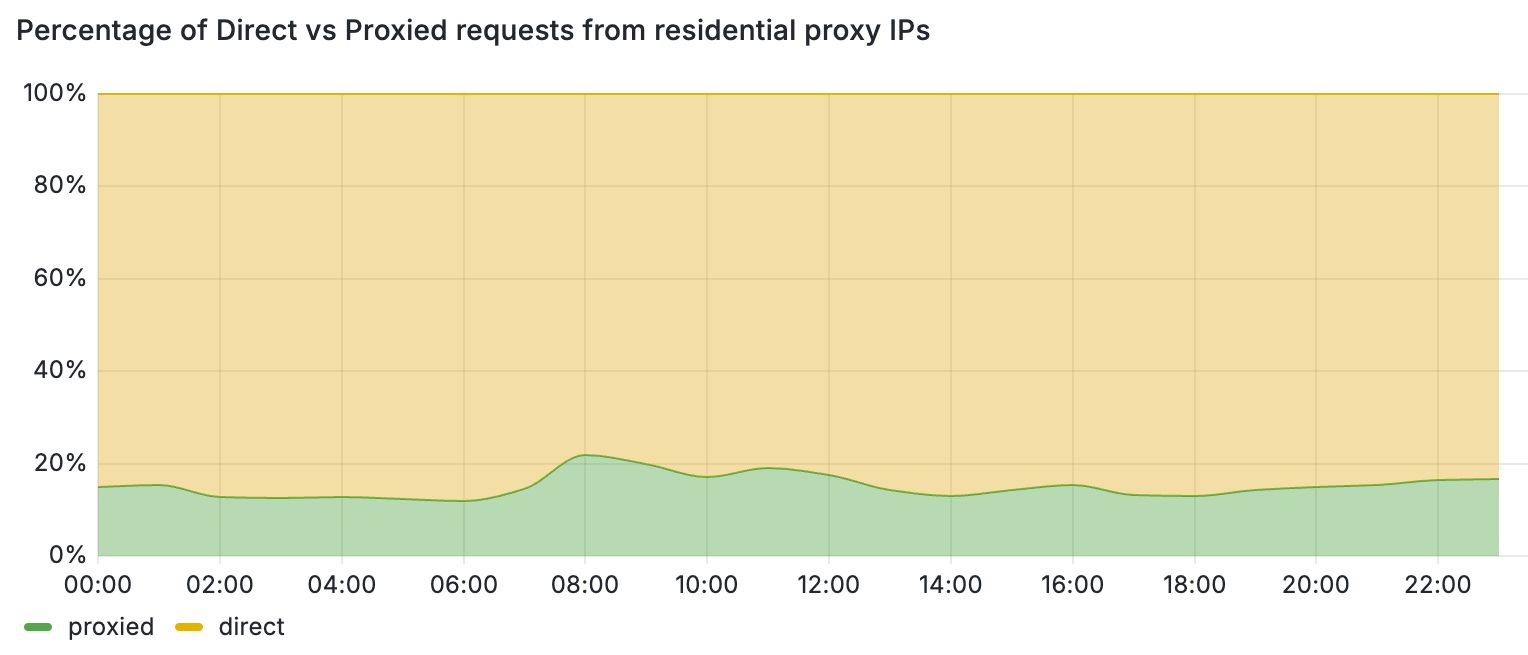
These periods of inactivity can be attributed to the temporary nature of residential proxy exit nodes. For instance, when the client software (i.e., browser or mobile application) that runs the exit nodes of these proxies is closed, the node leaves the residential proxy network. One way to filter out periods of inactivity is to increase the monitoring time and punish each IP address that exhibits residential proxy behavior for a period of time. This block-listing approach, however, has certain limitations. Most importantly, by relying only on IP-based behavioral signals, we would block traffic from legitimate users that may unknowingly run mobile applications or browser extensions that turn their devices into proxies. This is further detrimental for mobile networks where many users share their IPs behind CGNATs. Figure 3 demonstrates this by comparing the share of direct vs proxied requests that we received from active residential proxy IPs over a 24-hour period. Overall, we see that 4 out of 5 requests from these networks belong to direct and benign connections from residential devices.
Figure 3: Percentage of direct vs proxied requests from residential proxy IPs.
Using this insight, we combined behavioral and latency-based features along with new datasets to train a new machine learning model that detects residential proxy traffic on a per-request basis. This scheme allows us to block residential proxy traffic while allowing benign residential users to visit Cloudflare-protected websites from the same residential network.
Detection results and case studies
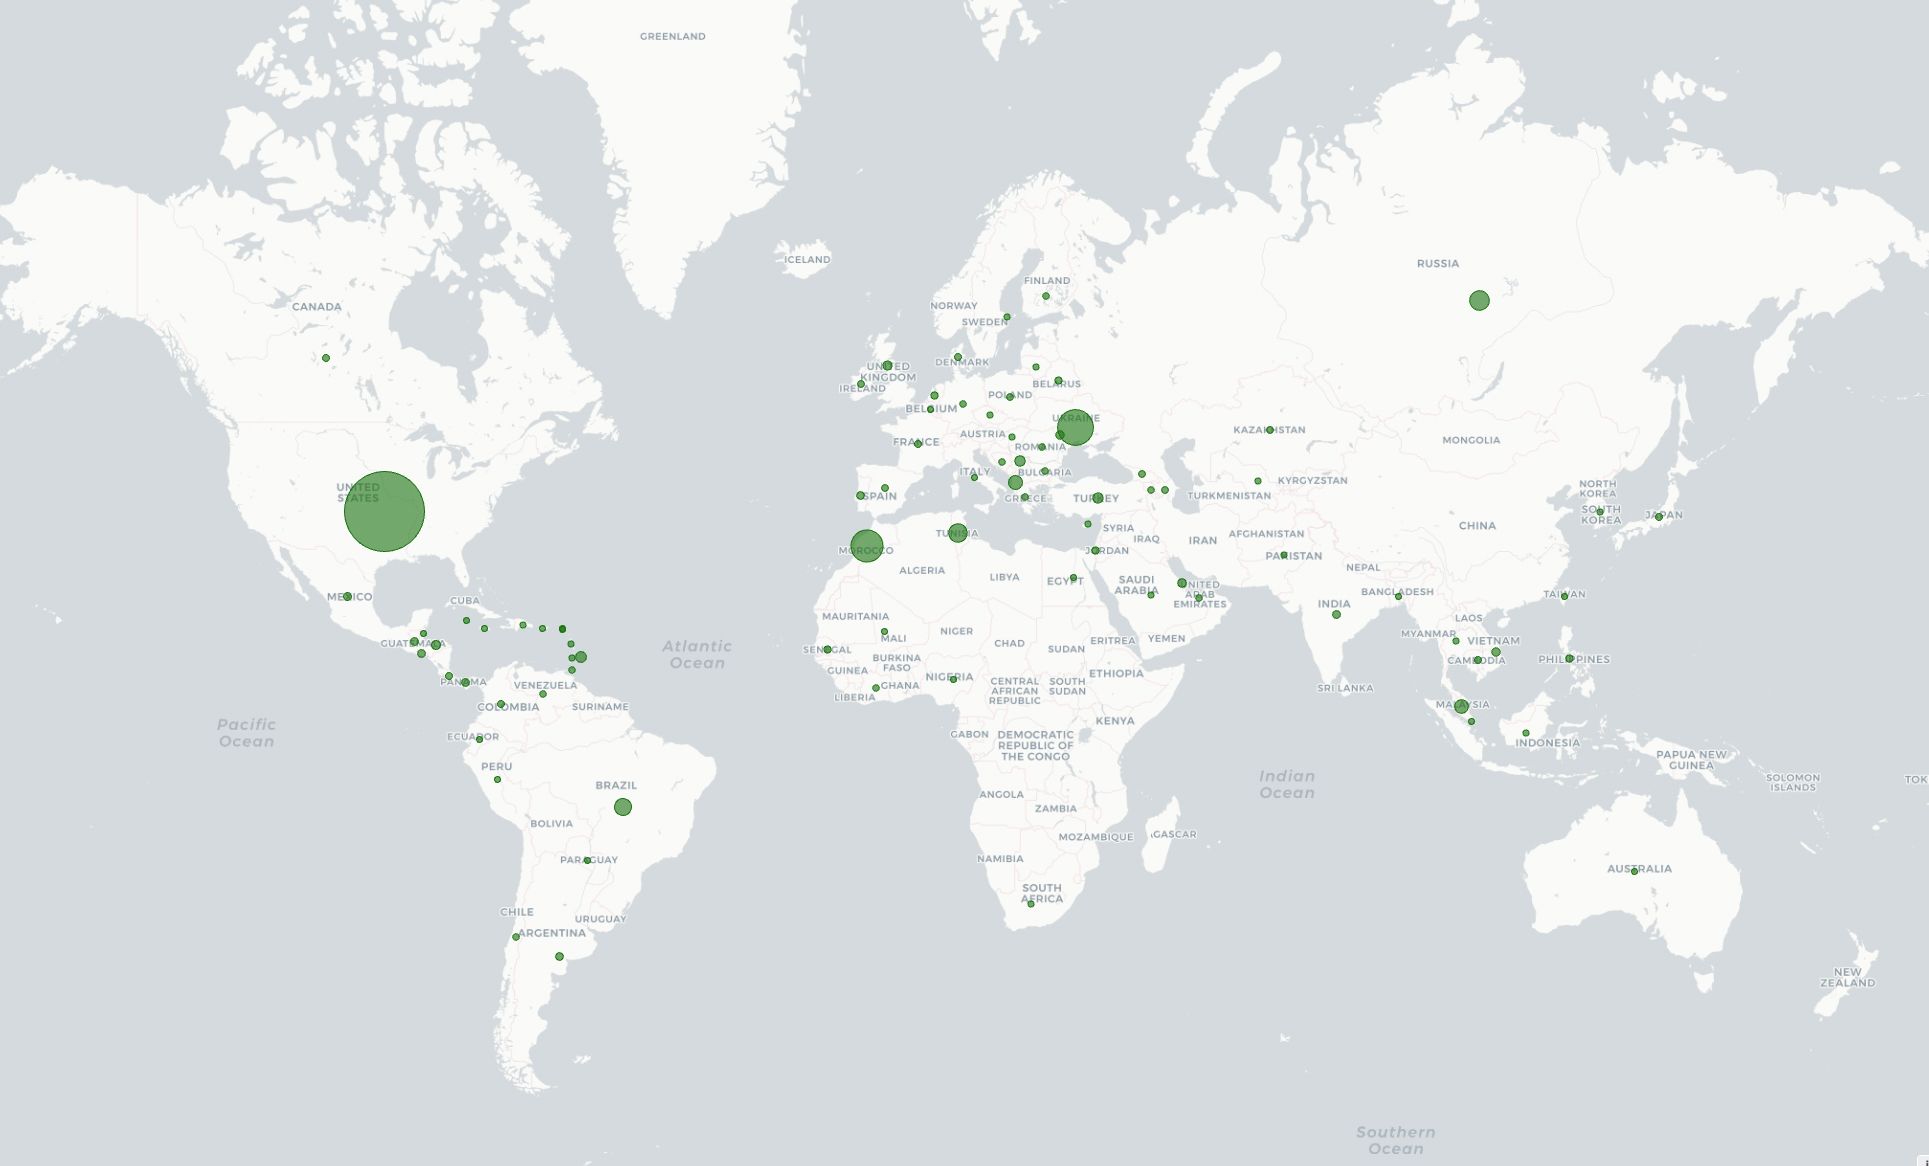
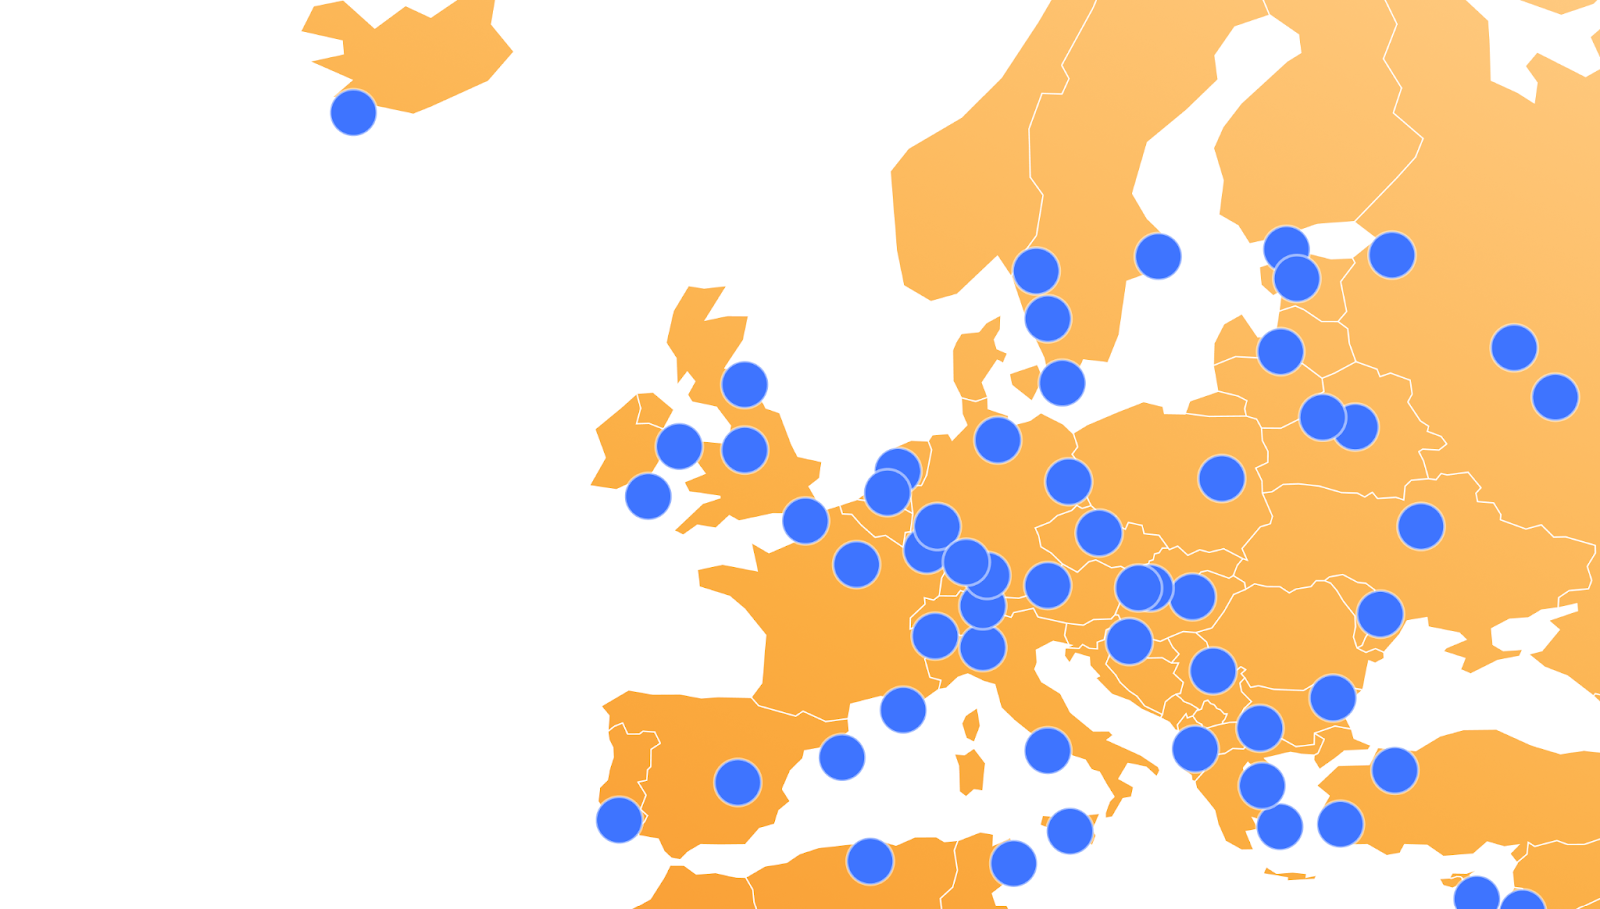
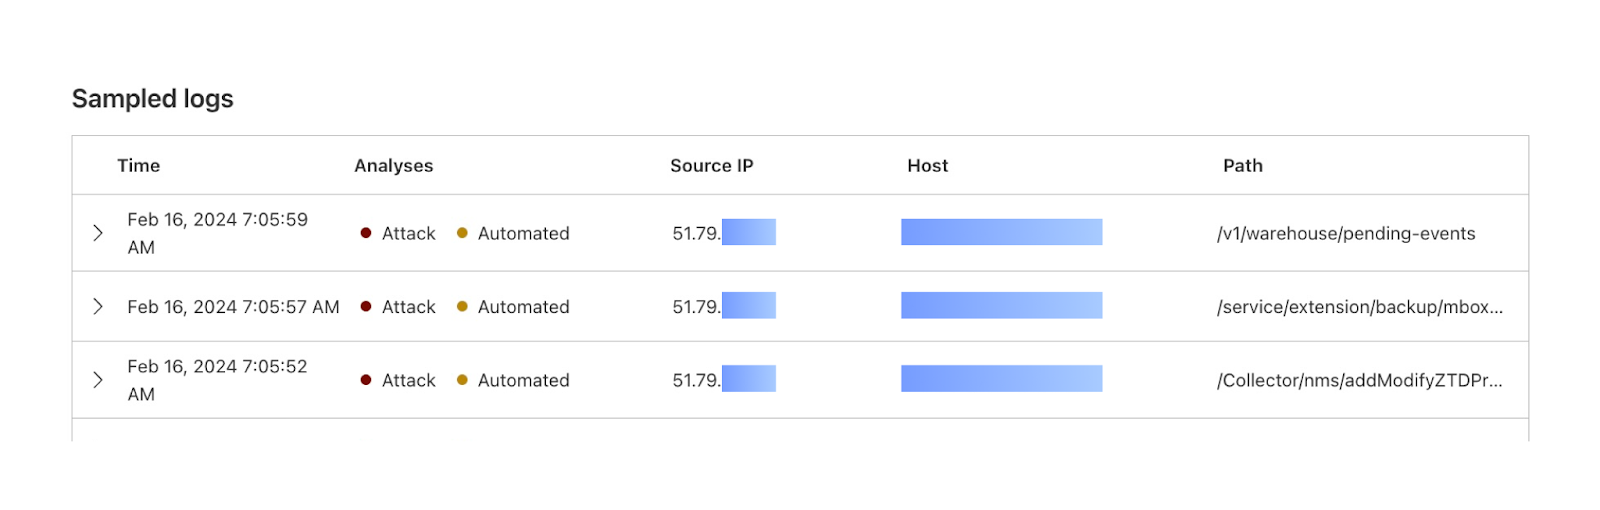
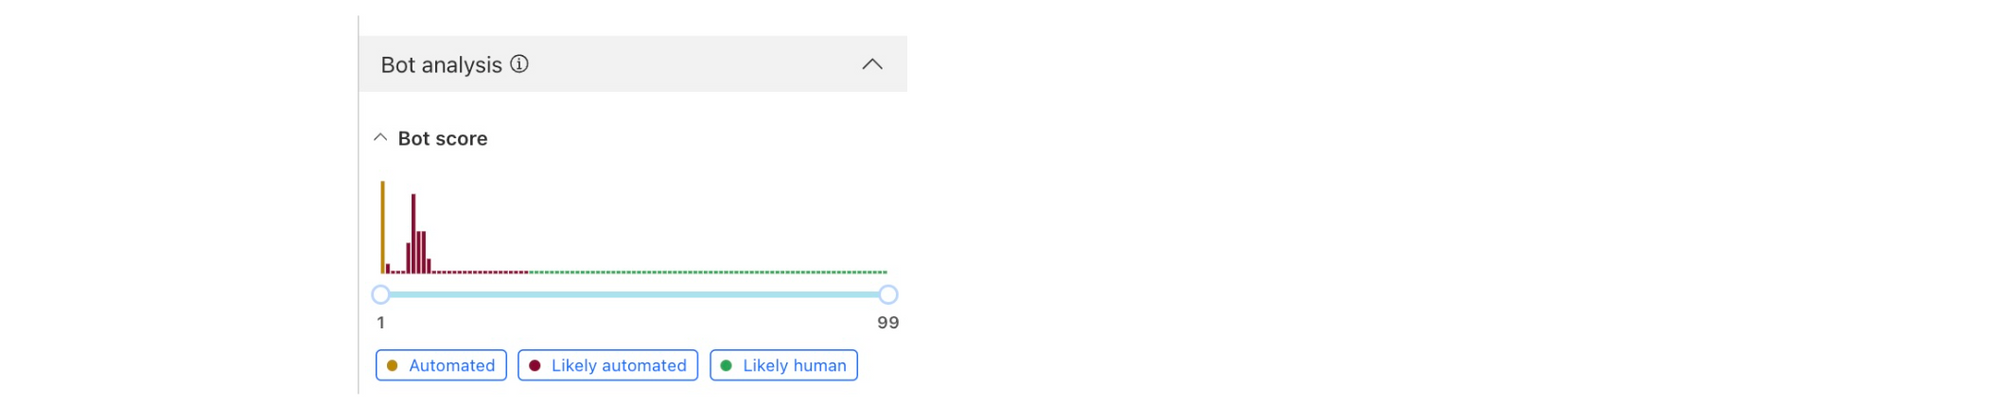
We started testing v8 in shadow mode in March 2024. Every hour, v8 is classifying more than 17 million unique IPs that participate in residential proxy attacks. Figure 4 shows the geographic distribution of IPs with residential proxy activity belonging to more than 45 thousand ASNs in 237 countries/regions. Among the most commonly requested endpoints from residential proxies, we observe patterns of account takeover attempts, such as requests to /login, /auth/login, and /api/login.
Figure 4: Countries and regions with residential network activity. Size of markers are proportionate to the number of IPs with residential proxy activity.
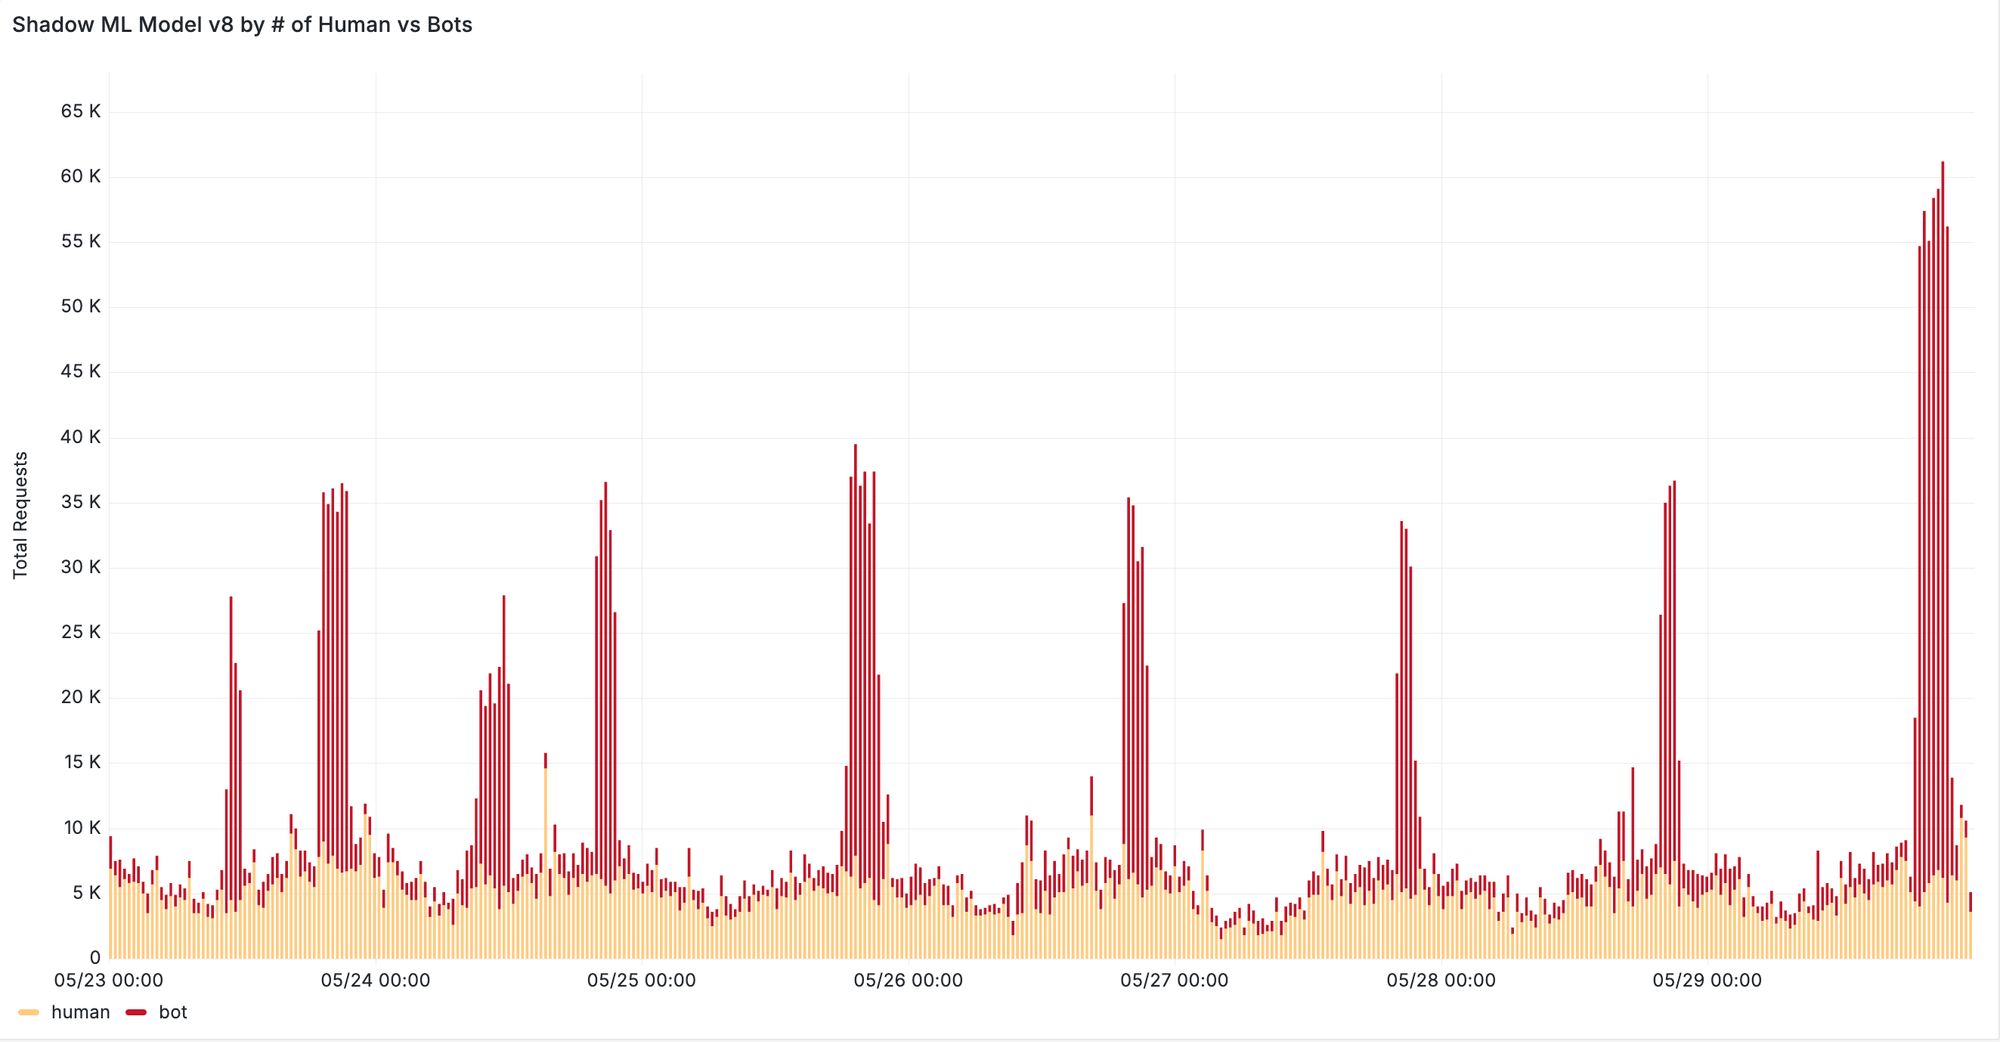
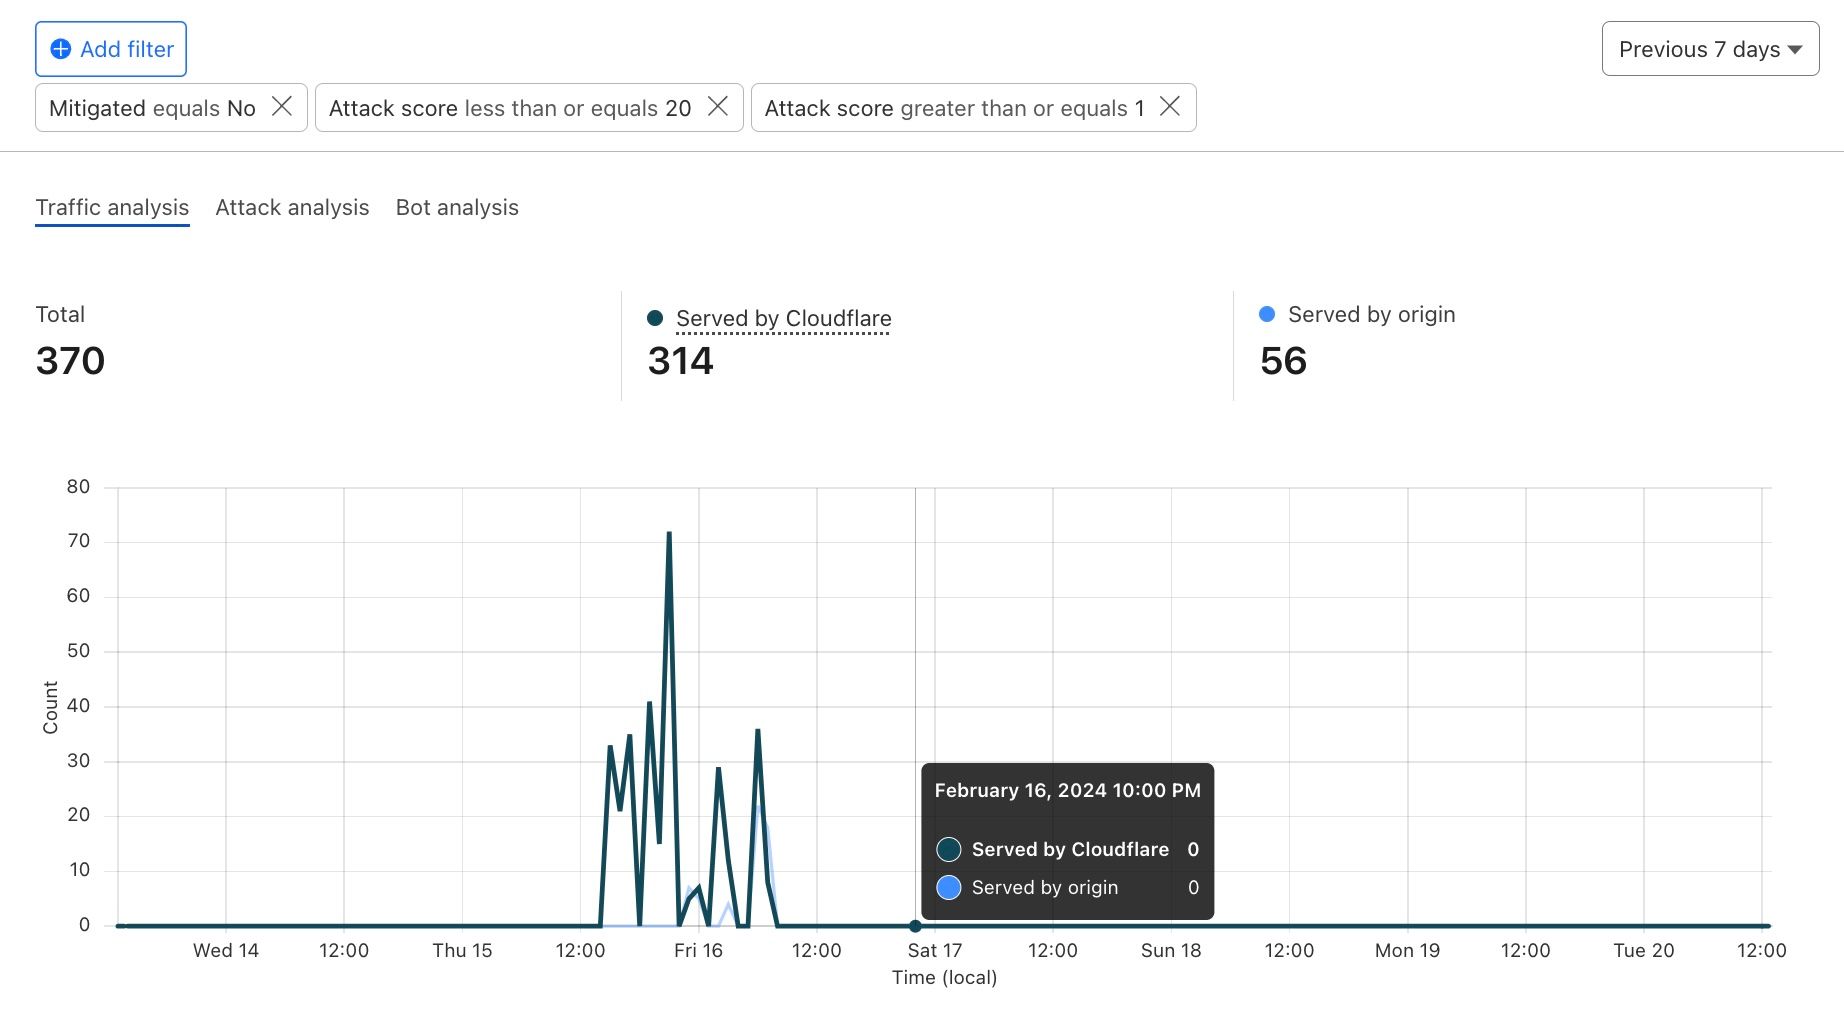
Furthermore, we see significant improvements when evaluating our new machine learning model on previously missed attacks reported by our customers. In one case, v8 was able to correctly classify 95% of requests from distributed residential proxy attacks targeting the voucher redemption endpoint of the customer’s website. In another case, our new model successfully detected a previously missed content scraping attack evident by increased detection during traffic spikes depicted in Figure 5. We are continuing to monitor the behavior of residential proxy attacks in the wild and work with our customers to ensure that we can provide robust detection against these distributed attacks.
Figure 5: Spikes in bot requests from residential proxies detected by ML v8
Improving detection for bots from cloud providers
In addition to residential IP proxies, bot operators commonly use cloud providers to host and run bot scripts that attack our customers. To combat these attacks, we improved our ground truth labels for cloud provider attacks in our latest ML training datasets. Early results show that v8 detects 20% more bots from cloud providers, with up to 70% more bots detected on zones that are marked as under attack. We further plan to expand the list of cloud providers that v8 detects as part of our ongoing updates.
Check out ML v8
For existing Bot Management customers we recommend toggling “Auto-update machine learning model” to instantly gain the benefits of ML v8 and its residential proxy detection, and to stay up to date with our future ML model updates. If you’re not a Cloudflare Bot Management customer, contact our sales team to try out Bot Management.
With one click, customers can now generate video captions effortlessly using Stream’s newest feature: AI-generated captions for on-demand videos and recordings of live streams. As part of Cloudflare’s mission to help build a better Internet, this feature is available to all Stream customers at no additional cost.
This solution is designed for simplicity, eliminating the need for third-party transcription services and complex workflows. For videos lacking accessibility features like captions, manual transcription can be time-consuming and impractical, especially for large video libraries. Traditionally, it has involved specialized services, sometimes even dedicated teams, to transcribe audio and deliver the text along with video, so it can be displayed during playback. As captions become more widely expected for a variety of reasons, including ethical obligation, legal compliance, and changing audience preferences, we wanted to relieve this burden.
With Stream’s integrated solution, the caption generation process is seamlessly integrated into your existing video management workflow, saving time and resources. Regardless of when you uploaded a video, you can easily add automatic captions to enhance accessibility. Captions can now be generated within the Cloudflare Dashboard or via an API request, all within the familiar and unified Stream platform.
This feature is designed with utmost consideration for privacy and data protection. Unlike other third-party transcription services that may share content with external entities, your data remains securely within Cloudflare’s ecosystem throughout the caption generation process. Cloudflare does not utilize your content for model training purposes. For more information about data protection, review Your Data and Workers AI.
Getting Started
Starting June 20th, 2024, this beta is available for all Stream customers as well as subscribers of the Professional and Business plans, which include 100 minutes of video storage.
To get started, upload a video to Stream (from the Cloudflare Dashboard or via API).
Next, navigate to the “Captions” tab on the video, click “Add Captions,” then select the language and “Generate captions with AI.” Finally, click save and within a few minutes, the new captions will be visible in the captions manager and automatically available in the player, too. Captions can also be generated via the API.
Captions are usually generated in a few minutes. When captions are ready, the Stream player will automatically be updated to offer them to users. The HLS and DASH manifests are also updated so third party players that support text tracks can display them as well.
On-demand videos and recordings of live streams, regardless of when they were created, are supported. While in beta, only English captions can be generated, and videos must be shorter than 2 hours. The quality of the transcription is best on videos with clear speech and minimal background noise.
We’ve been pleased with how well the AI model transcribes different types of content during our tests. That said, there are times when the results aren’t perfect, and another method might work better for some use cases. It’s important to check if the accuracy of the generated captions are right for your needs.
Technical Details
Built using Workers AI
The Stream engineering team built this new feature using Workers AI, allowing us to access the Whisper model – an open source Automatic Speech Recognition model – with a single API call. Using Workers AI radically simplified the AI model deployment, integration, and scaling with an out-of-the-box solution. We eliminated the need for our team to handle infrastructure complexities, enabling us to focus solely on building the automated captions feature.
Writing software that utilizes an AI model can involve several challenges. First, there’s the difficulty of configuring the appropriate hardware infrastructure. AI models require substantial computational resources to run efficiently and require specialized hardware, like GPUs, which can be expensive and complex to manage. There’s also the daunting task of deploying AI models at scale, which involve the complexities of balancing workload distribution, minimizing latency, optimizing throughput, and maintaining high availability. Not only does Workers AI solve the pain of managing underlying infrastructure, it also automatically scales as needed.
Using Workers AI transformed a daunting task into a Worker that transcribes audio files with less than 30 lines of code.
import { Ai } from '@cloudflare/ai'


export interface Env {
 AI: any
}


export type AiVTTOutput = {
 vtt?: string
}


export default {
 async fetch(request: Request, env: Env) {
   const blob = await request.arrayBuffer()


   const ai = new Ai(env.AI)
   const input = {
     audio: [...new Uint8Array(blob)],
   }


   try {
     const response: AiVTTOutput = (await ai.run(
       '@cf/openai/whisper-tiny-en',
       input
     )) as any
     return Response.json({ vtt: response.vtt })
   } catch (e) {
     const errMsg =
       e instanceof Error
         ? `${e.name}\n${e.message}\n${e.stack}`
         : 'unknown error type'
     return new Response(`${errMsg}`, {
       status: 500,
       statusText: 'Internal error',
     })
   }
 },
}
Quickly captioning videos at scale
The Stream team wanted to ensure this feature is fast and performant at scale, which required engineering work to process a high volume of videos regardless of duration.
First, our team needed to pre-process the audio prior to running AI inference to ensure the input is compatible with Whisper’s input format and requirements.
There is a wide spectrum of variability in video content, from a short grainy video filmed on a phone to a multi-hour high-quality Hollywood-produced movie. Videos may be silent or contain an action-driven cacophony. Also, Stream’s on-demand videos include recordings of live streams which are packaged differently from videos uploaded as whole files. With this variability, the audio inputs are stored in an array of different container formats, with different durations, and different file sizes. We ensured our audio files were properly formatted to be compatible with Whisper’s requirements.
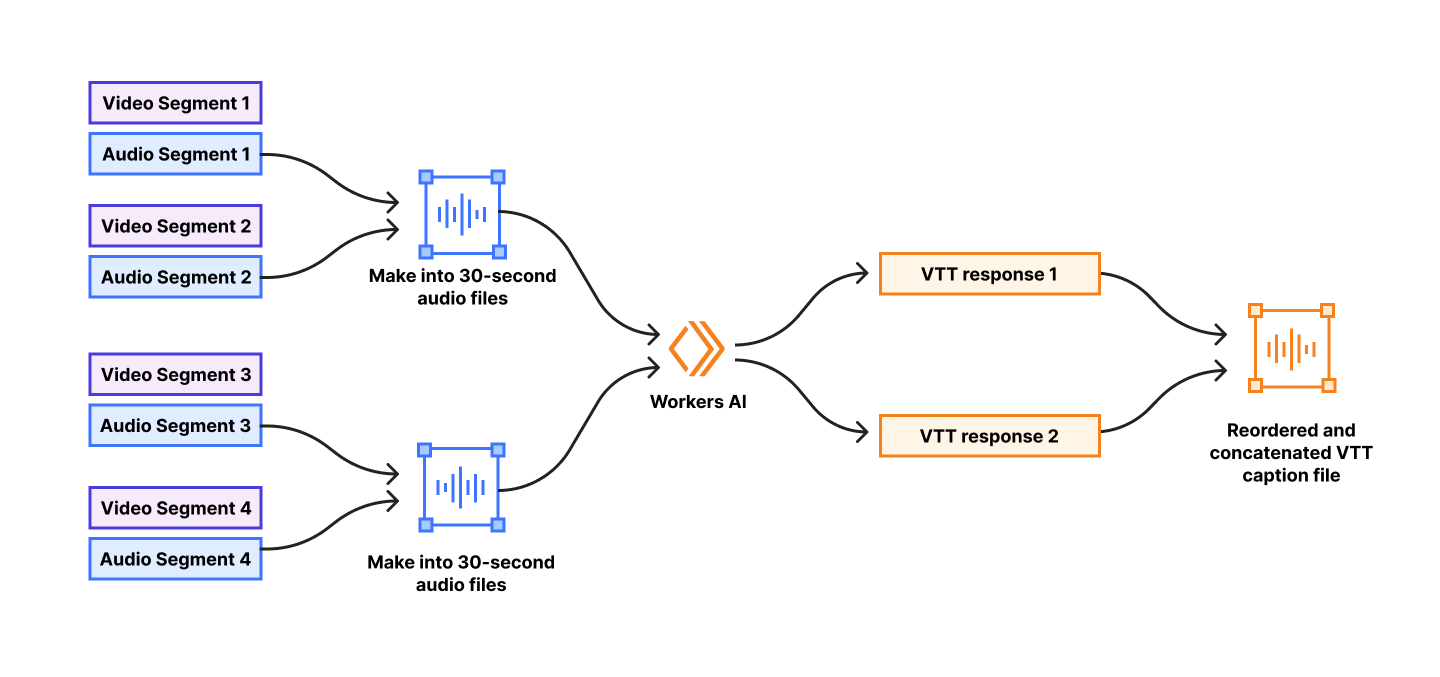
One aspect for pre-processing is ensuring files are a sensible duration for optimized inference. Whisper has an “sweet spot” of 30 seconds for the duration of audio files for transcription. As they note in this Github discussion: “Too short, and you’d lack surrounding context. You’d cut sentences more often. A lot of sentences would cease to make sense. Too long, and you’ll need larger and larger models to contain the complexity of the meaning you want the model to keep track of.” Fortunately, Stream already splits videos into smaller segments to ensure fast delivery during playback on the web. We wrote functionality to concatenate those small segments into 30-second batches prior to sending to Workers AI.
To optimize processing speed, our team parallelized as many operations as possible. By concurrently creating the 30-second audio batches and sending requests to Workers AI, we take full advantage of the scalability of the Workers AI platform. Doing this greatly reduces the time it takes to generate captions, but adds some additional complexity. Because we are sending requests to Workers AI in parallel, transcription responses may arrive out-of-order. For example, if a video is one minute in duration, the request to generate captions for the second 30 seconds of a video may complete before the request for the first 30 seconds of the video. The captions need to be sequential to align with the video, so our team had to maintain an understanding of the audio batch order to ensure our final combined WebVTT caption file is properly synced with the video. We sort the incoming Workers AI responses and re-order timestamps for a final accurate transcript.
The end result is the ability to generate captions for longer videos quickly and efficiently at scale.
Try it now
We are excited to bring this feature to open beta for all of our subscribers as well as Pro and Business plan customers today! Get started by uploading a video to Stream. Review our documentation for tutorials and current beta limitations. Up next, we will be focused on adding more languages and supporting longer videos.
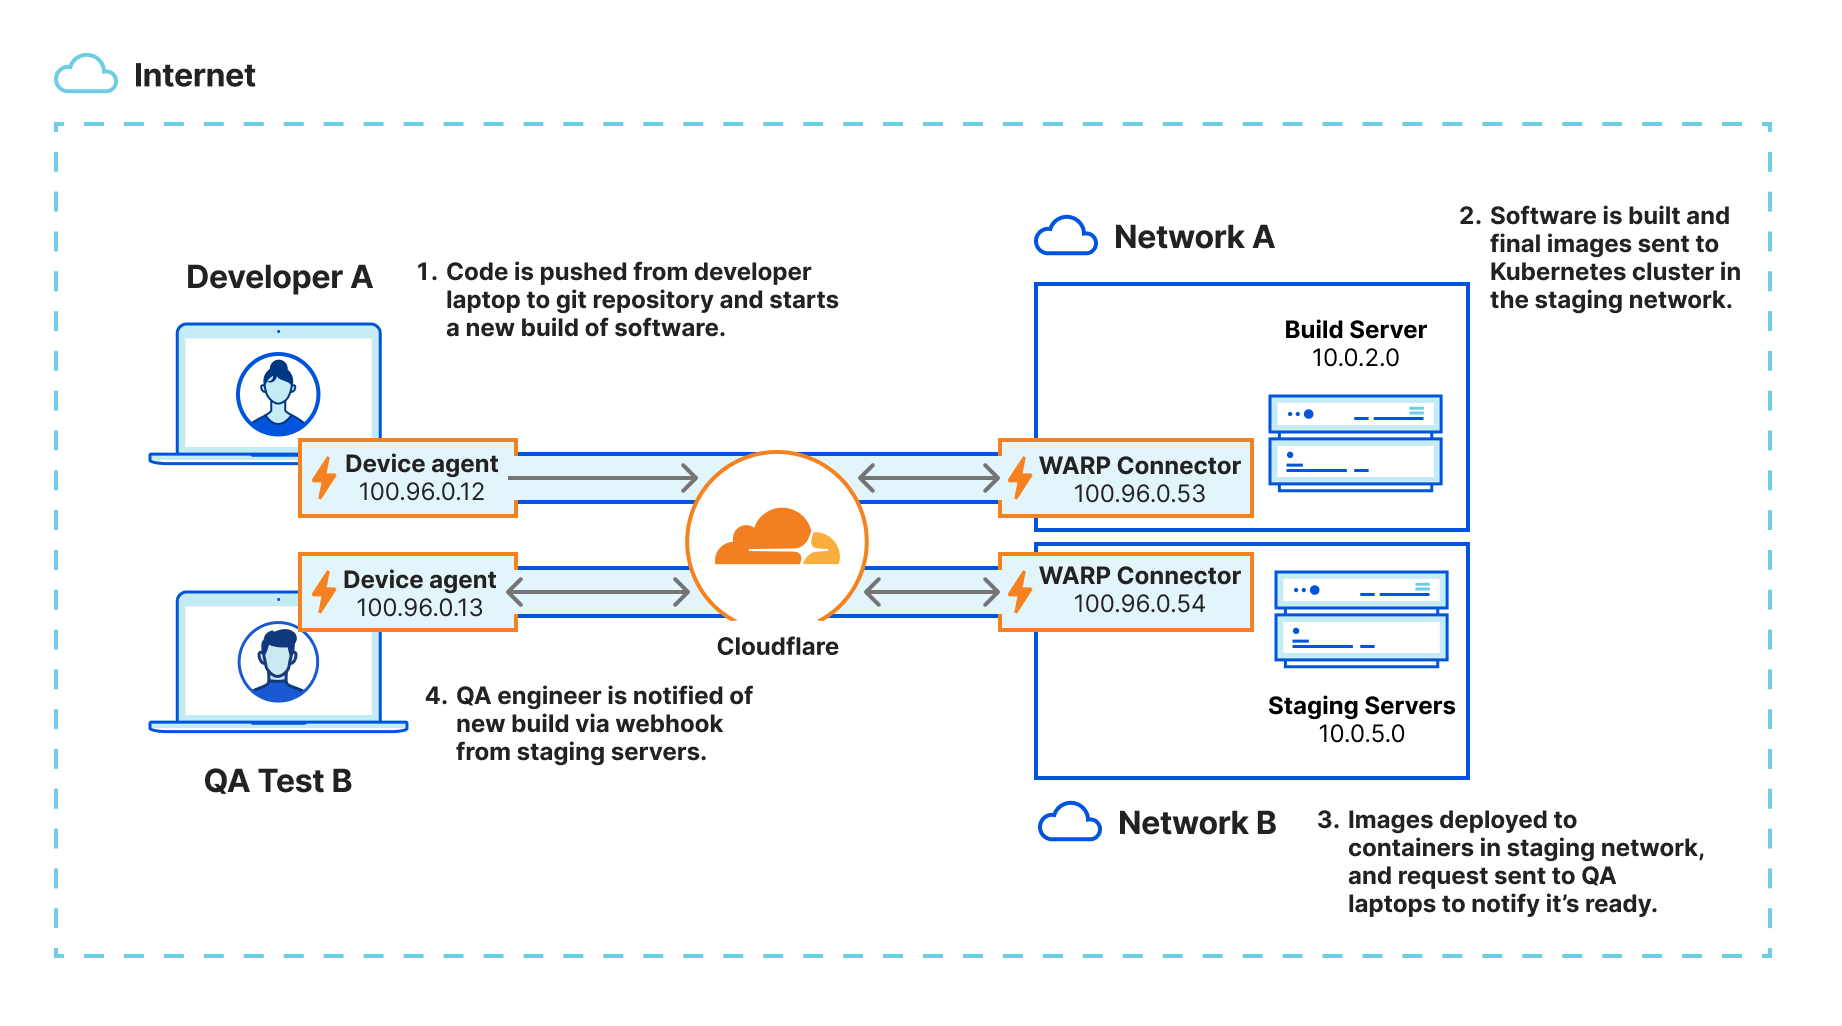
We’re excited to announce that BastionZero, a Zero Trust infrastructure access platform, has joined Cloudflare. This acquisition extends our Zero Trust Network Access (ZTNA) flows with native access management for infrastructure like servers, Kubernetes clusters, and databases.
Security teams often prioritize application and Internet access because these are the primary vectors through which users interact with corporate resources and external threats infiltrate networks. Applications are typically the most visible and accessible part of an organization’s digital footprint, making them frequent targets for cyberattacks. Securing application access through methods like Single Sign-On (SSO) and Multi-Factor Authentication (MFA) can yield immediate and tangible improvements in user security.
However, infrastructure access is equally critical and many teams still rely on castle-and-moat style network controls and local resource permissions to protect infrastructure like servers, databases, Kubernetes clusters, and more. This is difficult and fraught with risk because the security controls are fragmented across hundreds or thousands of targets. Bad actors are increasingly focusing on targeting infrastructure resources as a way to take down huge swaths of applications at once or steal sensitive data. We are excited to extend Cloudflare One’s Zero Trust Network Access to natively protect infrastructure with user- and device-based policies along with multi-factor authentication.
Application vs. infrastructure access
Application access typically involves interacting with web-based or client-server applications. These applications often support modern authentication mechanisms such as Single Sign-On (SSO), which streamline user authentication and enhance security. SSO integrates with identity providers (IdPs) to offer a seamless and secure login experience, reducing the risk of password fatigue and credential theft.
Infrastructure access, on the other hand, encompasses a broader and more diverse range of systems, including servers, databases, and network devices. These systems often rely on protocols such as SSH (Secure Shell), RDP (Remote Desktop Protocol), and Kubectl (Kubernetes) for administrative access. The nature of these protocols introduces additional complexities that make securing infrastructure access more challenging.
SSH Authentication: SSH is a fundamental tool for accessing Linux and Unix-based systems. SSH access is typically facilitated through public key authentication, through which a user is issued a public/private key pair that a target system is configured to accept. These keys must be distributed to trusted users, rotated frequently, and monitored for any leakage. If a key is accidentally leaked, it can grant a bad actor direct control over the SSH-accessible resource.
RDP Authentication: RDP is widely used for remote access to Windows-based systems. While RDP supports various authentication methods, including password-based and certificate-based authentication, it is often targeted by brute force and credential stuffing attacks.
Kubernetes Authentication: Kubernetes, as a container orchestration platform, introduces its own set of authentication challenges. Access to Kubernetes clusters involves managing roles, service accounts, and kubeconfig files along with user certificates.
Infrastructure access with Cloudflare One today
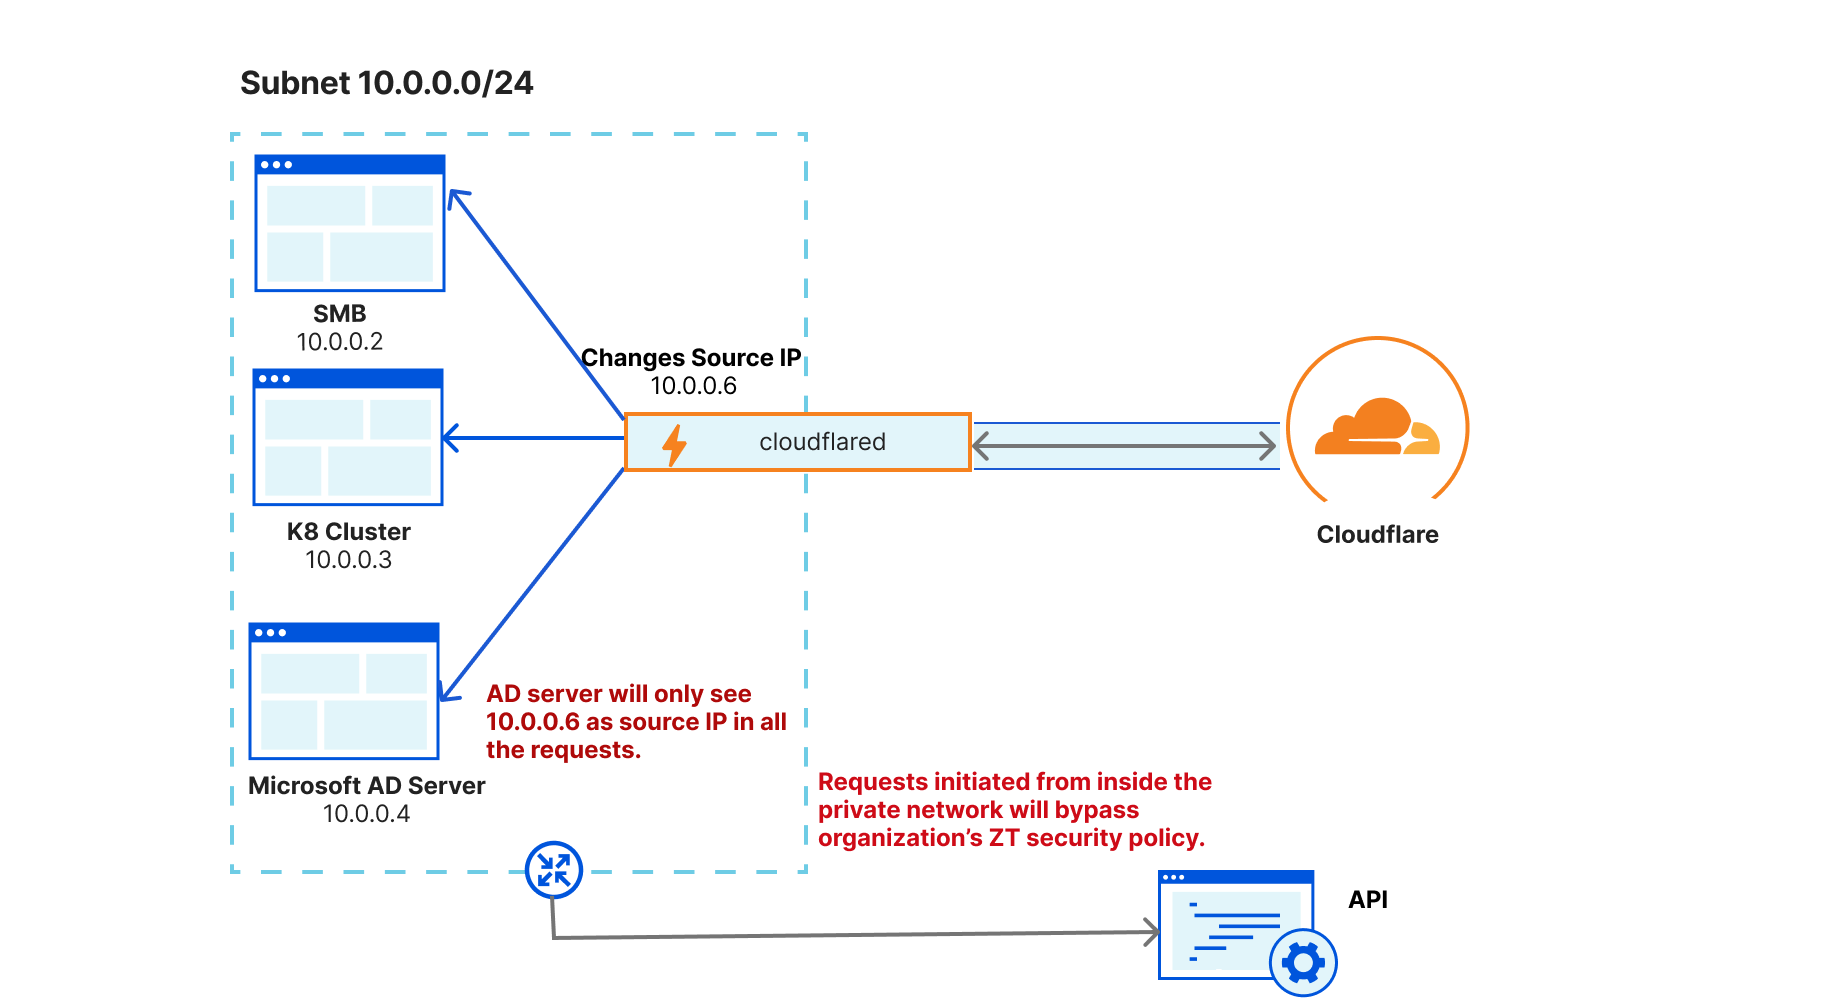
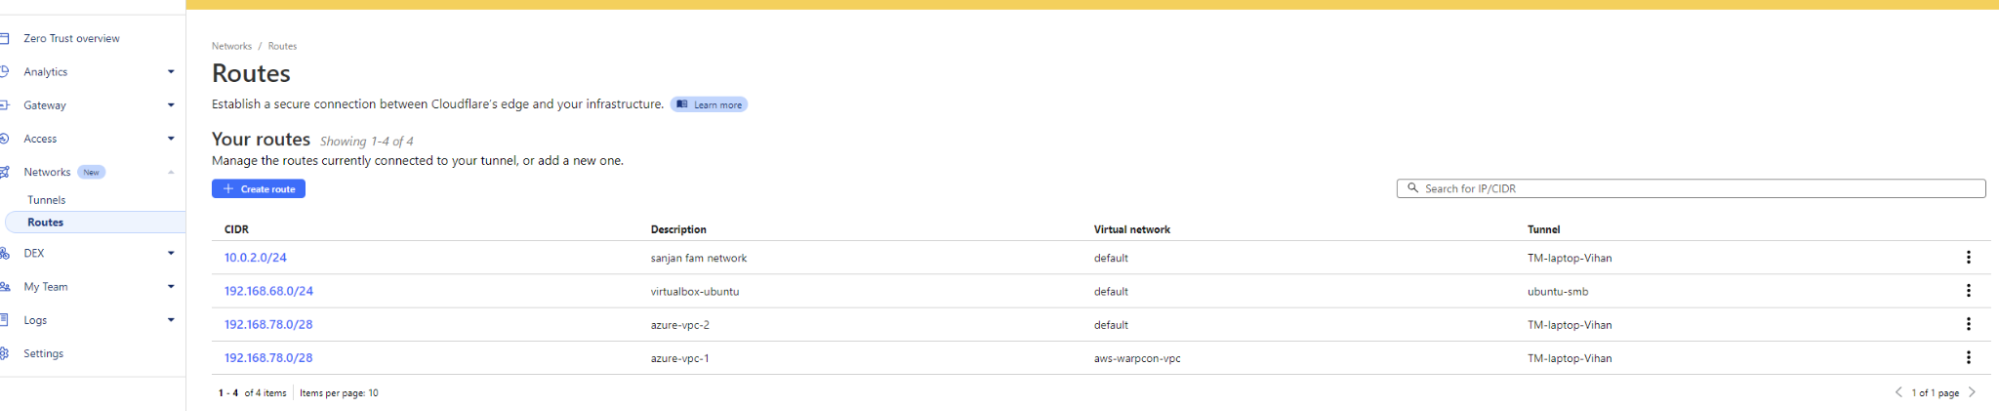
Cloudflare One facilitates Zero Trust Network Access (ZTNA) for infrastructure resources with an approach superior to traditional VPNs. An administrator can define a set of identity, device, and network-aware policies that dictate if a user can access a specific IP address, hostname, and/or port combination. This allows you to create policies like “Only users in the identity provider group ‘developers’ can access resources over port 22 (default SSH port) in our corporate network,” which is already much finer control than a VPN with basic firewall policies would allow.
However, this approach still has limitations, as it relies on a set of assumptions about how corporate infrastructure is provisioned and managed. If an infrastructure resource is configured outside of the assumed network structure, e.g. SSH over a non-standard port is allowed, all network-level controls may be bypassed. This leaves only the native authentication protections of the specific protocol protecting that resource and is often how leaked SSH keys or database credentials can lead to a wider system outage or breach.
Many organizations will leverage more complex network structures like a bastion host model or complex Privileged Access Management (PAM) solutions as an added defense-in-depth strategy. However, this leads to significantly more cost and management overhead for IT security teams and sometimes complicates challenges related to least-privileged access. Tools like bastion hosts or PAM solutions end up eroding least-privilege over time because policies expand, change, or drift from a company’s security stance. This leads to users incorrectly retaining access to sensitive infrastructure.
How BastionZero fits in
While our goal for years has been to help organizations of any size replace their VPNs as simply and quickly as possible, BastionZero expands the scope of Cloudflare’s VPN replacement solution beyond apps and networks to provide the same level of simplicity for extending Zero Trust controls to infrastructure resources. This helps security teams centralize the management of even more of their hybrid IT environment, while using standard Zero Trust practices to keep DevOps teams productive and secure. Together, Cloudflare and BastionZero can help organizations replace not only VPNs but also bastion hosts; SSH, Kubernetes, or database key management systems; and redundant PAM solutions.
BastionZero provides native integration to major infrastructure access protocols and targets like SSH, RDP, Kubernetes, database servers, and more to ensure that a target resource is configured to accept connections for that specific user, instead of relying on network level controls. This allows administrators to think in terms of resources and targets, not IP addresses and ports. Additionally, BastionZero leverages OpenPubKey, an open source library that uses two forms of authentication to generate an OpenID Connect (OIDC) token, which avoids single point of failure risks inherent to a standalone Identity Provider.
BastionZero will add the following capabilities to Cloudflare’s SASE platform:
The elimination of long-lived keys/credentials through frictionless infrastructure privileged access management (PAM) capabilities that modernize credential management (e.g., SSH keys, kubeconfig files, database passwords) through a new ephemeral, decentralized approach.
A DevOps-based approach for securing SSH connections to support least privilege access that records sessions and logs every command for better visibility to support compliance requirements. Teams can operate in terms of auto-discovered targets, not IP addresses or networks, as they define just-in-time access policies and automate workflows.
Clientless RDP to support access to desktop environments without the overhead and hassle of installing a client on a user’s device.
What’s next for BastionZero
The BastionZero team will be focused on integrating their infrastructure access controls directly into Cloudflare One. During the third and fourth quarters of this year, we will be announcing a number of new features to facilitate Zero Trust infrastructure access via Cloudflare One. All functionality delivered this year will be included in the Cloudflare One free tier for organizations less than 50 users. We believe that everyone should have access to world-class security controls.
We are looking for early beta testers and teams to provide feedback about what they would like to see with respect to infrastructure access. If you are interested in learning more, please sign up here.
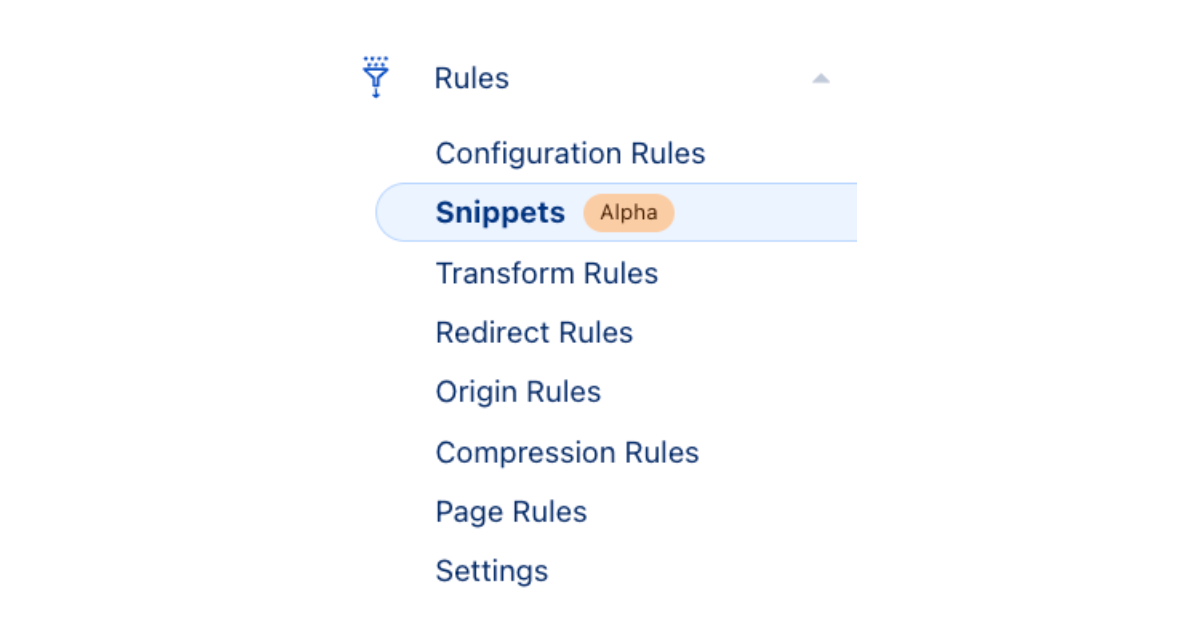
Managing consent online can be challenging. After you’ve figured out the necessary regulations, you usually need to configure some Consent Management Platform (CMP) to load all third-party tools and scripts on your website in a way that respects these demands. Cloudflare Zaraz manages the loading of all of these third-party tools, so it was only natural that in April 2023 we announced the Cloudflare Zaraz CMP: the simplest way to manage consent in a way that seamlessly integrates with your third-party tools manager.
As more and more third-party tool vendors are required to handle consent properly, our CMP has evolved to integrate with these new technologies and standardization efforts. Today, we’re happy to announce that the Cloudflare Zaraz CMP is now compatible with the Interactive Advertising Bureau Transparency and Consent Framework (IAB TCF) requirements, and fully supports Google’s Consent Mode v2 signals. Separately, we’ve taken efforts to improve the way Cloudflare Zaraz handles traffic coming from online bots.
IAB TCF Compatibility
Earlier this year, Google announced that websites that would like to use AdSense and other advertising solutions in the European Economic Area (EEA), the UK, and Switzerland, will be required to use a CMP that is approved by IAB Europe, an association for digital marketing and advertising. Their Transparency and Consent Framework sets guidelines for how CMPs should operate. Since March 2024, the Cloudflare Zaraz CMP is compliant with these guidelines, and Zaraz users in Europe can use Google’s advertising products without any restrictions.
Since the IAB TCF requirements can make the consent modal a little complex for users, we have made this compliance mode an opt-in feature. See the official documentation for information on how to enable it.
Google Consent Mode v2
Another new requirement from Google was the need to send “Consent Signals”. These signals are part of what is also known as “Consent Mode”, and later, Consent Mode v2. Together with each event sent to Google Analytics and Google Ads, they tell the Google servers about the consent status of the current visitor – did they agree to have their data used for personalized advertising? Did they accept cookies? These and other questions are answered by Consent Mode v2, telling the Google servers how to treat the data it receives.
Consent Mode v2 usually requires setting two values for each consent category – a default value and an updated one. The default value represents the consent status (granted or denied) a certain category (e.g. using cookies) has before the user has submitted their personal preferences. Usually, and especially within the EU, the default value would be `denied`. Once the user submits their preferences, Consent Mode v2 sends an additional “updated” value that represents the choice the user made.
Implementing Consent Mode v2 is quick and easy with Cloudflare Zaraz, although the specific implementation depends on your CMP. Examples, including integration with the Cloudflare Zaraz CMP, are available in our official documentation.
We believe that better standardization around online consent benefits everyone, and we are glad to be working on tools that respect users’ privacy and improve online user experience.
Bot Management
We also recently integrated better Bot Management support within Cloudflare Zaraz. You often want crawlers to be able to access your website, but you don’t want them to trigger your analytics and conversion pixels. Using the Bot Management feature in the Cloudflare Zaraz Settings page allows you to fine tune which requests will make it to Cloudflare Zaraz and which ones will be skipped. Since Zaraz pricing is based on the total number of Zaraz Events, this can also be useful if you want more control over your Cloudflare Zaraz costs, ensuring you will not be paying for events triggered by bots. Like all other Cloudflare Zaraz features, these new features are also available to users on all plans, including the free plan. For us, it is part of making sure that everyone can benefit from a faster, safer, and more private way to manage third parties online. If you haven’t started using Cloudflare Zaraz already, now is a great time. Go to the Cloudflare dashboard and set it up in just a few clicks.
Workers AI’s initial launch in beta included support for Llama 2, as it was one of the most requested open source models from the developer community. Since that initial launch, we’ve seen developers build all kinds of innovative applications including knowledge sharing chatbots, creative content generation, and automation for various workflows.
At Cloudflare, we know developers want simplicity and flexibility, with the ability to build with multiple AI models while optimizing for accuracy, performance, and cost, among other factors. Our goal is to make it as easy as possible for developers to use their models of choice without having to worry about the complexities of hosting or deploying models.
As soon as we learned about the development of Llama 3 from our partners at Meta, we knew developers would want to start building with it as quickly as possible. Workers AI’s serverless inference platform makes it extremely easy and cost effective to start using the latest large language models (LLMs). Meta’s commitment to developing and growing an open AI-ecosystem makes it possible for customers of all sizes to use AI at scale in production. All it takes is a few lines of code to run inference to Llama 3:
export interface Env {
  // If you set another name in wrangler.toml as the value for 'binding',
  // replace "AI" with the variable name you defined.
  AI: any;
}

export default {
  async fetch(request: Request, env: Env) {
    const response = await env.AI.run('@cf/meta/llama-3-8b-instruct', {
        messages: [
{role: "user", content: "What is the origin of the phrase Hello, World?"}
	 ]
      }
    );

    return new Response(JSON.stringify(response));
  },
};
Built with Meta Llama 3
Llama 3 offers leading performance on a wide range of industry benchmarks. You can learn more about the architecture and improvements on Meta’s blog post. Cloudflare Workers AI supports Llama 3 8B, including the instruction fine-tuned model.
Meta’s testing shows that Llama 3 is the most advanced open LLM today on evaluation benchmarks such as MMLU, GPQA, HumanEval, GSM-8K, and MATH. Llama 3 was trained on an increased number of training tokens (15T), allowing the model to have a better grasp on language intricacies. Larger context windows doubles the capacity of Llama 2, and allows the model to better understand lengthy passages with rich contextual data. Although the model supports a context window of 8k, we currently only support 2.8k but are looking to support 8k context windows through quantized models soon. As well, the new model introduces an efficient new tiktoken-based tokenizer with a vocabulary of 128k tokens, encoding more characters per token, and achieving better performance on English and multilingual benchmarks. This means that there are 4 times as many parameters in the embedding and output layers, making the model larger than the previous Llama 2 generation of models.
Under the hood, Llama 3 uses grouped-query attention (GQA), which improves inference efficiency for longer sequences and also renders their 8B model architecturally equivalent to Mistral-7B. For tokenization, it uses byte-level byte-pair encoding (BPE), similar to OpenAI’s GPT tokenizers. This allows tokens to represent any arbitrary byte sequence — even those without a valid utf-8 encoding. This makes the end-to-end model much more flexible in its representation of language, and leads to improved performance.
Along with the base Llama 3 models, Meta has released a suite of offerings with tools such as Llama Guard 2, Code Shield, and CyberSec Eval 2, which we are hoping to release on our Workers AI platform shortly.
We are very excited to announce the official release of Foundation DNS, with new advanced nameservers, even more resilience, and advanced analytics to meet the complex requirements of our enterprise customers. Foundation DNS is one of Cloudflare’s largest leaps forward in our authoritative DNS offering since its launch in 2010, and we know our customers are interested in an enterprise-ready authoritative DNS service with the highest level of performance, reliability, security, flexibility, and advanced analytics.
Starting today, every new enterprise contract that includes authoritative DNS will have access to the Foundation DNS feature set and existing enterprise customers will have Foundation DNS features made available to them over the course of this year. If you are an existing enterprise customer already using our authoritative DNS services, and you’re interested in getting your hands on Foundation DNS earlier, just reach out to your account team, and they can enable it for you. Let’s get started…
Why is DNS so important?
From an end user perspective, DNS makes the Internet usable. DNS is the phone book of the Internet which translates hostnames like www.cloudflare.com into IP addresses that our browsers, applications, and devices use to connect to services. Without DNS, users would have to remember IP addresses like 108.162.193.147 or 2606:4700:58::adf5:3b93 every time they wanted to visit a website on their mobile device or desktop – imagine having to remember something like that instead of just www.cloudflare.com. DNS is used in every end user application on the Internet, from social media to banking to healthcare portals. People’s usage of the Internet is entirely reliant on DNS.
From a business perspective, DNS is the very first step in reaching websites and connecting to applications. Devices need to know where to connect in order to reach services, authenticate users, and provide the information being requested. Resolving DNS queries quickly can be the difference between a website or application being perceived as responsive or not and can have a real impact on user experience.
When DNS outages occur, the impacts are obvious. Imagine your go-to ecommerce site not loading, just like what happened with the outage Dyn experienced in 2016, which took down multiple popular ecommerce sites among others. Or, if you are part of a company, and customers aren’t able to reach your website to purchase the goods or services you are selling, a DNS outage will literally lose you money. DNS is often taken for granted, but make no mistake, you’ll notice it when it’s not working properly. Thankfully, if you use Cloudflare Authoritative DNS, these are problems you don’t worry about very much.
There is always room for improvement
Cloudflare has been providing authoritative DNS services for over a decade. Our authoritative DNS service hosts millions of domains across many different top level domains (TLDs). We have customers of all sizes, from single domains with just a few records to customers with tens of millions of records spread across multiple domains. Our enterprise customers, rightfully, demand the highest level of performance, reliability, security, and flexibility from our DNS service, along with detailed analytics. While our customers love our authoritative DNS, we recognize there is always room for improvement in some of those categories. To that end, we set off to make some major improvements to our DNS architecture, with new features as well as structural changes. We are proudly calling this improved offering Foundation DNS.
Meet Foundation DNS
As our new enterprise authoritative DNS offering, Foundation DNS was designed to enhance the reliability, security, flexibility, and analytics of our existing authoritative DNS service. Before we dive into all the specifics of Foundation DNS, here is a quick summary of what Foundation DNS brings to our authoritative DNS offering:
Advanced nameservers bring DNS reliability to the next level.
New zone-level DNS settings provide more flexible configuration of DNS specific settings.
Unique DNSSEC keys per account and zone provide additional security and flexibility for DNSSEC.
GraphQL-based DNS analytics provide even more insights into your DNS queries.
A new release process ensures enterprise customers have the utmost stability and reliability.
Simpler DNS pricing with more generous quotas for DNS-only zones and DNS records.
Now, let’s dive deeper into each of these new Foundation DNS features:
Advanced nameservers
With Foundation DNS, we’re introducing advanced nameservers with a specific focus on enhancing reliability for your enterprise. You might be familiar with our standard authoritative nameservers which come as a pair per zone and use names within the cloudflare.com domain. Here’s an example:
$ dig mycoolwebpage.xyz ns +noall +answer
mycoolwebpage.xyz.	86400	IN	NS	kelly.ns.cloudflare.com.
mycoolwebpage.xyz.	86400	IN	NS	christian.ns.cloudflare.com.
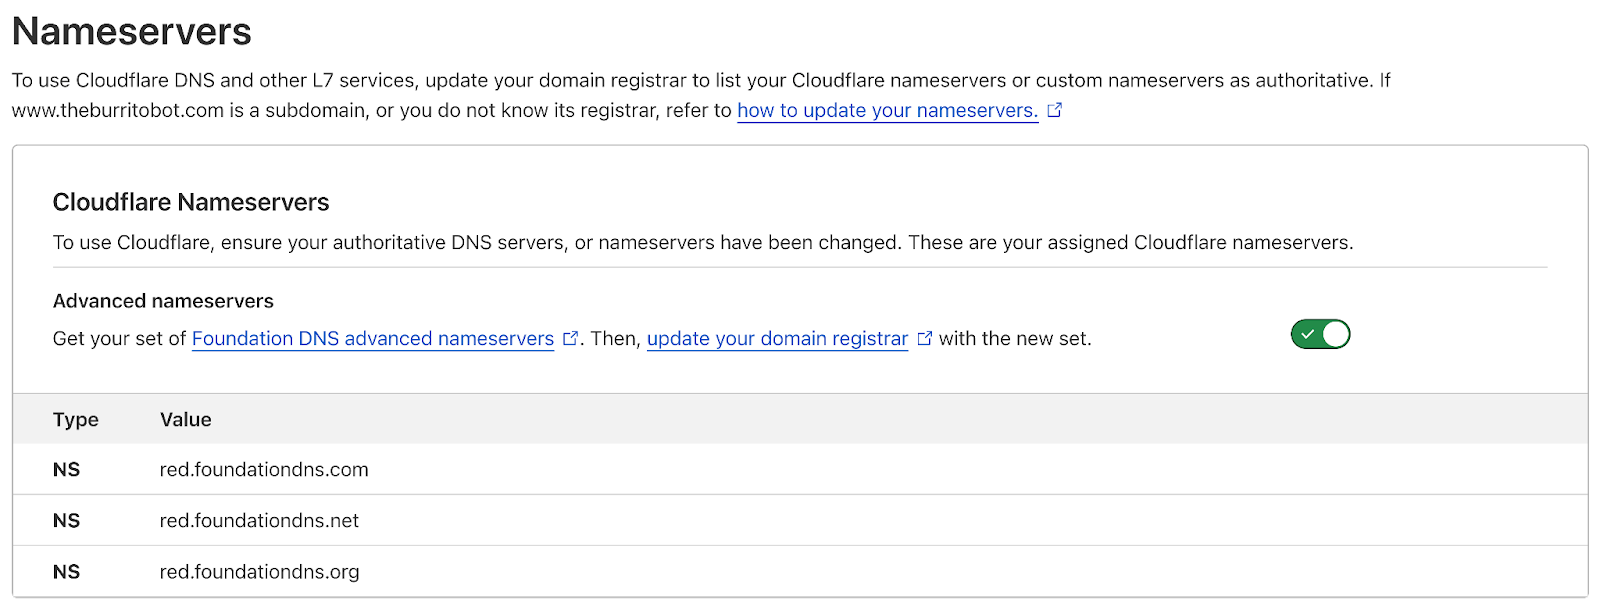
Now, let’s look at the same zone using Foundation DNS advanced nameservers:
$ dig mycoolwebpage.xyz ns +noall +answer
mycoolwebpage.xyz.	86400	IN	NS	blue.foundationdns.com.
mycoolwebpage.xyz.	86400	IN	NS	blue.foundationdns.net.
mycoolwebpage.xyz.	86400	IN	NS	blue.foundationdns.org.
Advanced nameservers improve reliability in a few different ways. The first improvement comes from the Foundation DNS authoritative servers being spread across multiple TLDs. This provides protection from larger scale DNS outages and DDoS attacks that could potentially affect DNS infrastructure further up the tree, including TLD name servers. Foundation DNS authoritative nameservers are now located across multiple branches of the global DNS tree structure, further insulating our customers from these potential outages and attacks.
You might also have noticed that there is an additional nameserver listed with Foundation DNS. While this is an improvement, it’s not for the reason you might think it is. If we resolve each one of these nameservers to their respective IP addresses, we can make this a little easier to understand. Let’s do that here starting with our standard nameservers:
$ dig kelly.ns.cloudflare.com. +noall +answer
kelly.ns.cloudflare.com. 86353  IN      A       108.162.194.91
kelly.ns.cloudflare.com. 86353  IN      A       162.159.38.91
kelly.ns.cloudflare.com. 86353  IN      A       172.64.34.91

$ dig christian.ns.cloudflare.com. +noall +answer
christian.ns.cloudflare.com. 86353 IN   A       108.162.195.247
christian.ns.cloudflare.com. 86353 IN   A       162.159.44.247
christian.ns.cloudflare.com. 86353 IN   A       172.64.35.247
There are six total IP addresses for the two nameservers. As it turns out, this is all DNS resolvers actually care about when querying authoritative nameservers. DNS resolvers usually don’t track the actual domain names of authoritative servers; they simply maintain an unordered list of IP addresses that they can use to resolve queries for a given domain. So with our standard authoritative nameservers, we give resolvers six IP addresses to use to resolve DNS queries. Now, let’s look at the IP addresses for our Foundation DNS advanced nameservers:
$ dig blue.foundationdns.com. +noall +answer
blue.foundationdns.com. 300     IN      A       108.162.198.1
blue.foundationdns.com. 300     IN      A       162.159.60.1
blue.foundationdns.com. 300     IN      A       172.64.40.1

$ dig blue.foundationdns.net. +noall +answer
blue.foundationdns.net. 300     IN      A       108.162.198.1
blue.foundationdns.net. 300     IN      A       162.159.60.1
blue.foundationdns.net. 300     IN      A       172.64.40.1

$ dig blue.foundationdns.org. +noall +answer
blue.foundationdns.org. 300     IN      A       108.162.198.1
blue.foundationdns.org. 300     IN      A       162.159.60.1
blue.foundationdns.org. 300     IN      A       172.64.40.1
Would you look at that! Foundation DNS provides the same IP addresses for each of the authoritative nameservers that we provide to a zone. So in this case, we have only provided three IP addresses for resolvers to use to resolve DNS queries. And you might be wondering,“isn’t six better than three? Isn’t this a downgrade?” It turns out more isn’t always better. Let’s talk about why.
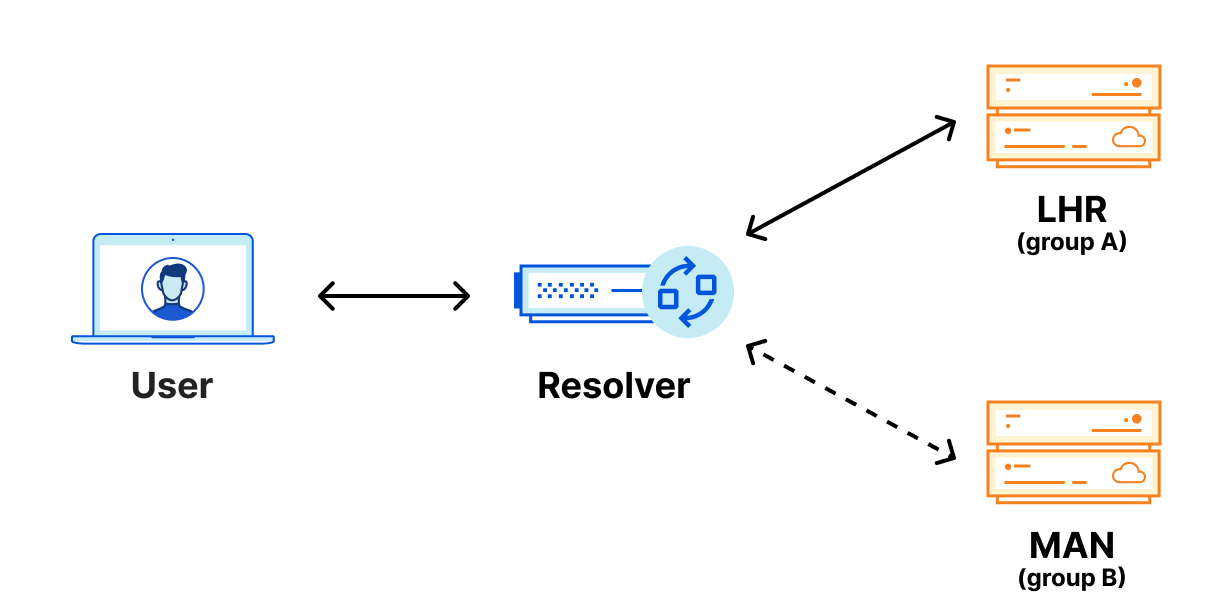
You are probably aware of Cloudflare’s use of Anycast and, as you might assume, our DNS services leverage Anycast to ensure that our authoritative DNS servers are available globally and as close as possible to users and resolvers across the Internet. Our standard nameservers are all advertised out of every Cloudflare data center by a single Anycast group. If we zoom in on Europe, you can see that in a standard nameserver deployment, both nameservers are advertised from every data center.
We can take those six IP addresses from our standard nameservers above and perform a lookup for their “hostname.bind” TXT record which will show us the airport code or physical location of the closest data center where our DNS queries are being resolved from. This output helps explain the reason why more isn’t always better.
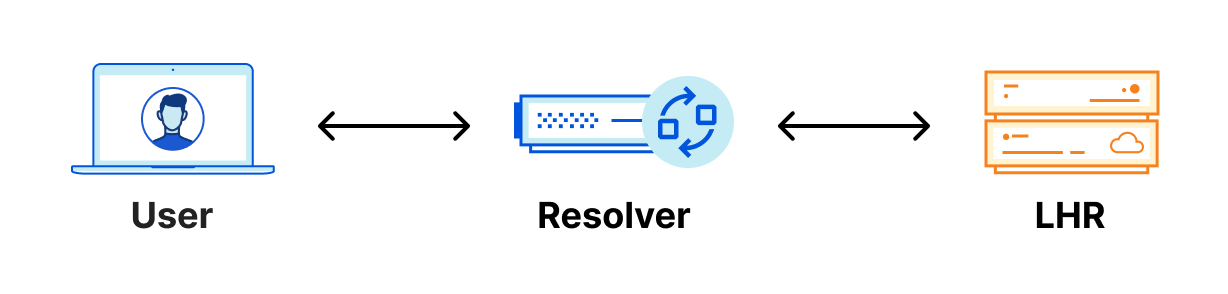
As you can see, when queried from near London, all six of those IP addresses route to the same London (LHR) data center. Meaning that when a resolver in London is resolving DNS queries for a domain using Cloudflare’s standard authoritative DNS, no matter which nameserver IP address is being queried, they are always connecting to the same physical location.
You might be asking, “So what? What does that mean to me?” Let’s look at an example. If you wanted to resolve a domain using Cloudflare standard nameservers from London, and I am using a public resolver that is also located in London, the resolver will always connect to the Cloudflare LHR data center regardless of which nameserver it’s trying to reach. It doesn’t have any other option, because of Anycast.
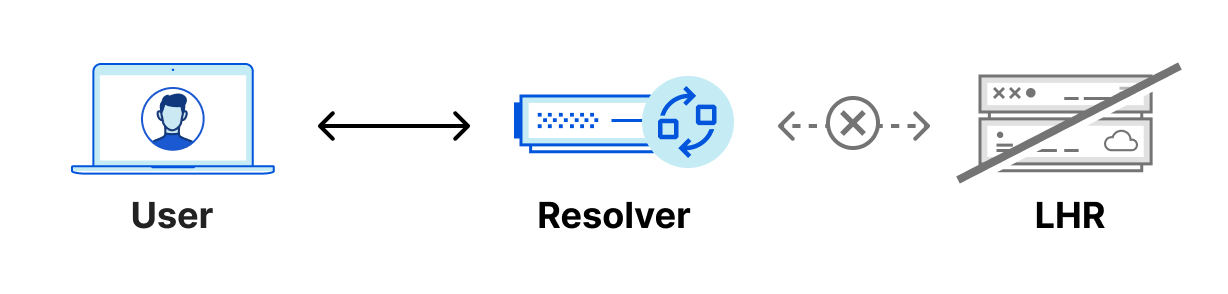
Because of Anycast, should the LHR data center go offline completely, all the traffic intended for LHR would be routed to other nearby data centers and resolvers would continue to function normally. However, in the unlikely scenario where the LHR data center was online, but our DNS services aren’t able to respond to DNS queries, the resolver would have no way to resolve these DNS queries since they can’t reach out to any other data center. We could have 100 IP addresses, and it would not help us in this scenario. Eventually, cached responses will expire, and the domain will eventually stop being resolved.
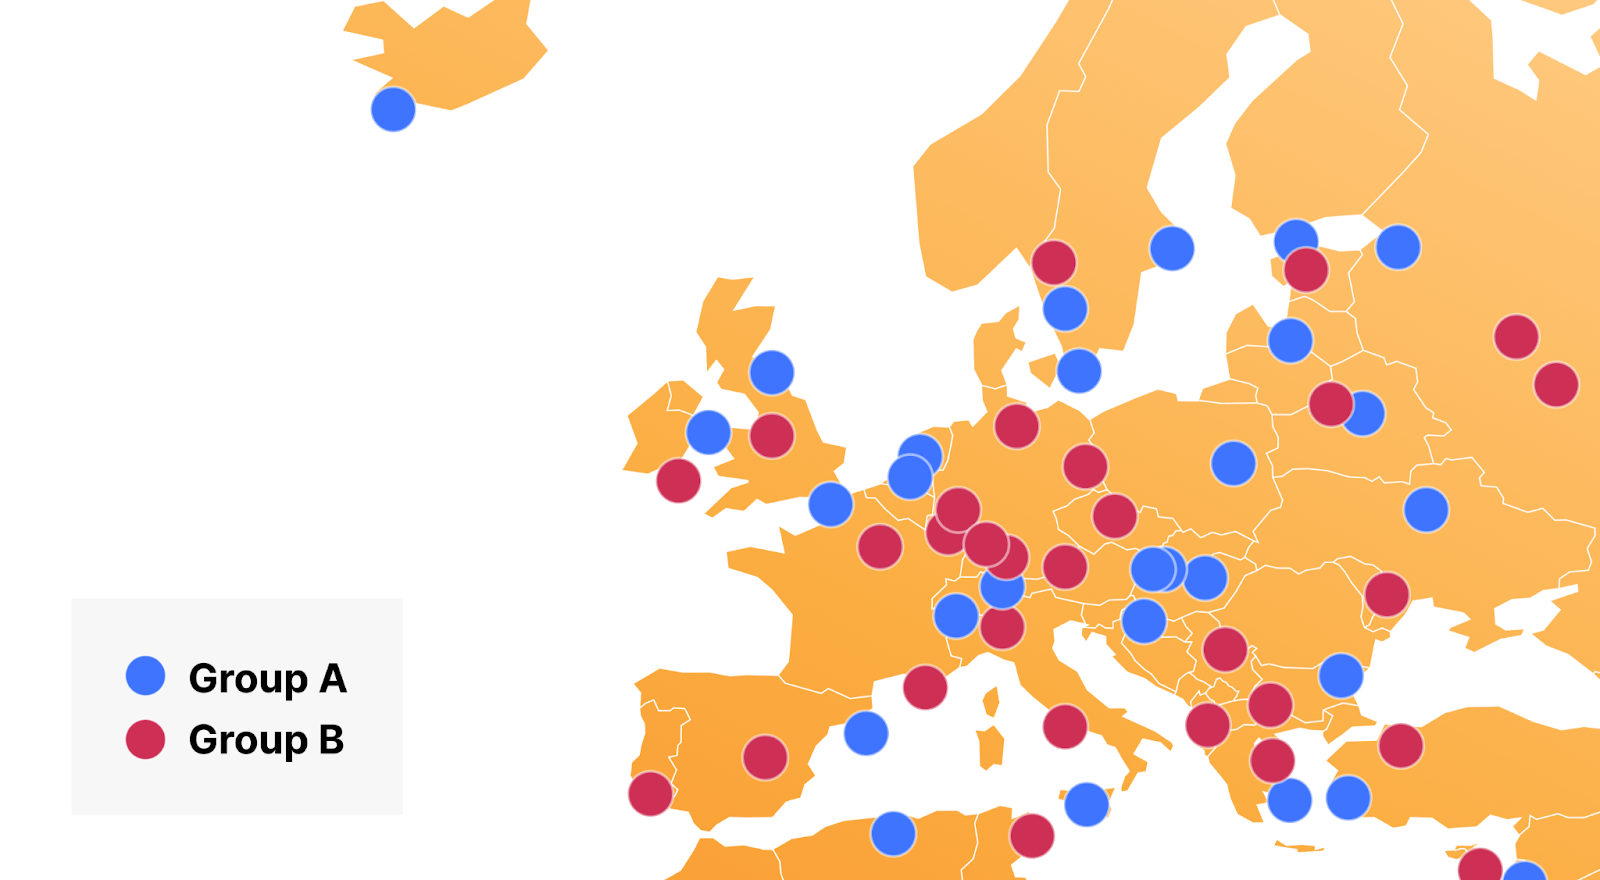
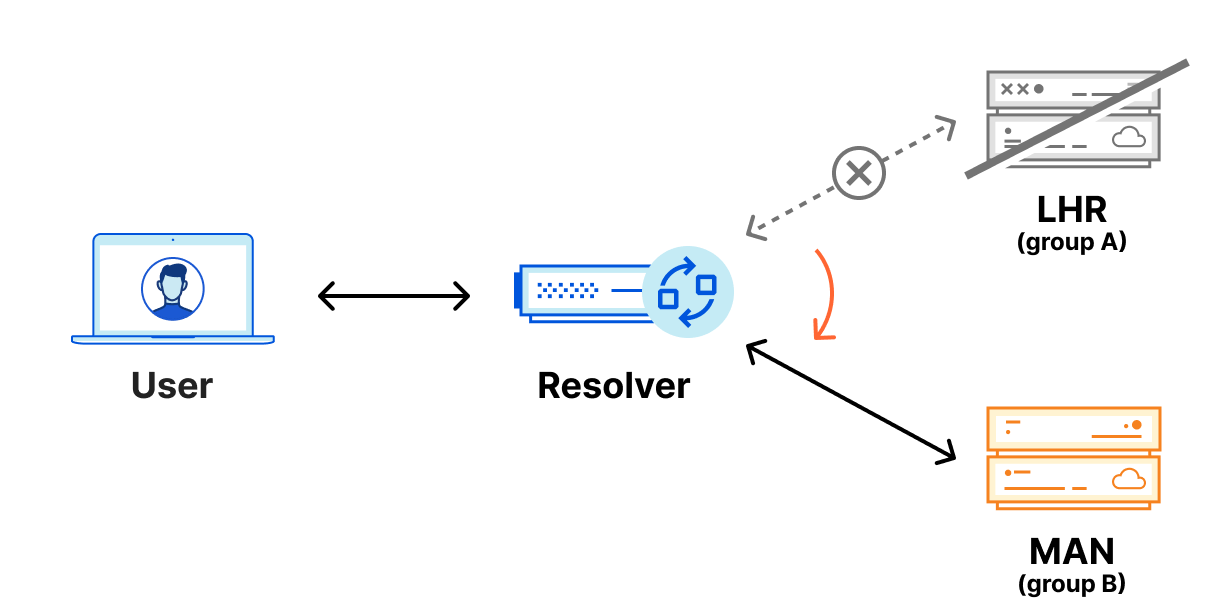
Foundation DNS advanced nameservers are changing the way we use Anycast by leveraging two Anycast groups, which breaks the previous paradigm of every authoritative nameserver IP being advertised from every data center. Using two Anycast groups means that Foundation DNS authoritative nameservers actually have different physical locations from one another, rather than all being advertised from each data center. Here is how that same region would look using two Anycast groups:
Let’s go back and finish our comparison of six authoritative IP addresses for standard authoritative DNS vs three IP addresses for Foundation DNS now that it’s understood that Foundation DNS is using two Anycast groups for advertising nameservers. Let’s see where Foundation DNS servers are being advertised from for our example:
Look at that! One of our three nameserver IP addresses is being advertised out of a different data center, Manchester (MAN), making Foundation DNS more reliable and resilient for the previously mentioned outage scenario. It’s worth mentioning that in some cities, Cloudflare operates out of multiple data centers which will result in all three queries returning the same airport code. While we guarantee that at least one of those IP addresses is being advertised out of a different data center, we understand some customers may want to test for themselves. In those cases, an additional query can show that IP addresses are being advertised out of different data centers.
In the “94m30” returned in the response, the number before the “m” represents the data center that answered the query. As long as that number is different in one of the three responses, you know that one of your Foundation DNS authoritative nameservers is being advertised out of a different physical location.
With Foundation DNS leveraging two Anycast groups, the previous outage scenario is handled seamlessly. DNS resolvers monitor requests to all the authoritative nameservers returned for a given domain, but primarily use the nameserver that is providing the fastest responses.
With this configuration, DNS resolvers are able to send requests to two different Cloudflare data centers, so, should a failure happen at one physical location, queries are then automatically sent to the second data center where they can be properly resolved.
Foundation DNS advanced nameservers are a big step forward in reliability for our enterprise customers. We welcome our enterprise customers to enable advanced nameservers for existing zones today. Migrating to Foundation DNS won’t involve any downtime either because even after Foundation DNS advanced nameservers are enabled for a zone, the previous standard authoritative DNS nameservers will continue to function and respond to queries for the zone. Customers don’t need to plan for a cutover or other service-impacting event to migrate to Foundation DNS advanced nameservers.
New zone-level DNS settings
Historically, we have received regular requests from our enterprise customers to adjust specific DNS settings that were not exposed via our API or dashboard, such as enabling secondary DNS overrides. When customers wanted these settings adjusted, they had to reach out to their account teams, who would change the configurations. With Foundation DNS, we are exposing the most commonly requested settings via the API and dashboard to give our customers increased flexibility with their Cloudflare authoritative DNS solution.
Enterprise customers can now configure the following DNS settings on their zones:
Allows you to have multiple authoritative DNS providers while using Cloudflare as a primary nameserver.
Unique DNSSEC keys per account and zone
DNSSEC, which stands for Domain Name System Security Extensions, adds security to a domain or zone by providing a way to check that the response you receive for a DNS query is authentic and hasn’t been modified. DNSSEC prevents DNS cache poisoning (DNS spoofing) which helps ensure that DNS resolvers are responding to DNS queries with the correct IP addresses.
Since we launched Universal DNSSEC in 2015, we’ve made quite a few improvements, like adding support for pre-signed DNSSEC for secondary zones and multi-signer DNSSEC. By default, Cloudflare signs DNS records on the fly (live signing) as we respond to DNS queries. This allows Cloudflare to host a DNSSEC-secured domain while dynamically allocating IP addresses for the proxied origins. It also enables certain load balancing use cases since the IP addresses served in the DNS response in these cases change based on steering.
Cloudflare uses the Elliptic Curve algorithm ECDSA P-256, which is stronger than most RSA keys used today. It uses less CPU to generate signatures, making them more efficient to generate on the fly. Usually two keys are used as part of DNSSEC, the Zone Signing Key (ZSK) and the Key Signing Key (KSK). At the simplest level, the ZSK is used for signing the DNS records that are served in response to queries and the KSK is used to sign the DNSKEYs, including the ZSK to ensure its authenticity.
Today, Cloudflare uses a shared ZSK and KSK globally for all DNSSEC signing, and since we use such a strong cryptographic algorithm, we know how secure this key set is and as such, do not believe there is a need to regularly rotate the ZSK or KSK – at least for security reasons. There are customers, however, that have policies that require the rotation of these keys at certain intervals. Because of this, we’ve added the ability for our new Foundation DNS advanced nameservers to rotate both their ZSK and KSK as needed per account or per zone. This will first be available via the API and subsequently through the Cloudflare dashboard. So now, customers with strict policy requirements around their DNSSEC key rotation can meet those requirements with Cloudflare Foundation DNS.
GraphQL-based DNS analytics
For those who are not familiar with it, GraphQL is a query language for APIs and a runtime for executing those queries. It allows clients to request exactly what they need, no more, no less, enabling them to aggregate data from multiple sources through a single API call, and supports real-time updates through subscriptions.
As you might know, Cloudflare has had a GraphQL API for a while now, but as part of Foundation DNS we are adding a new DNS dataset to that API that is only available with our new Foundation DNS advanced nameservers.
The new DNS dataset in our GraphQL API can be used to fetch information about the DNS queries a zone has received. This faster and more powerful alternative to our current DNS Analytics API allows you to query data from large time periods quickly and efficiently without running into limits or timeouts. The GraphQL API is more flexible with regard to which queries it accepts, and exposes more information than the DNS Analytics API.
For example, you can run this query to fetch the mean and 90th percentile processing time of your queries, grouped by source IP address, in 15 minute buckets. A query like this would be useful to see which IPs are querying your records most often for a given time range:
Previously, a query like this wouldn’t have been possible for several reasons. The first is that we have added new fields like sourceIP,which allows us to filter data based on which client IP addresses (usually resolvers) are making DNS queries. The second is that the GraphQL API query is able to process and return data from much larger time ranges. A DNS zone with sufficiently large amounts of queries was previously only able to query across a few days of traffic, while the new GraphQL API can provide data for a period of up to 31 days. We are planning further enhancements to that range, as well as how far back historical data can be stored and queried.
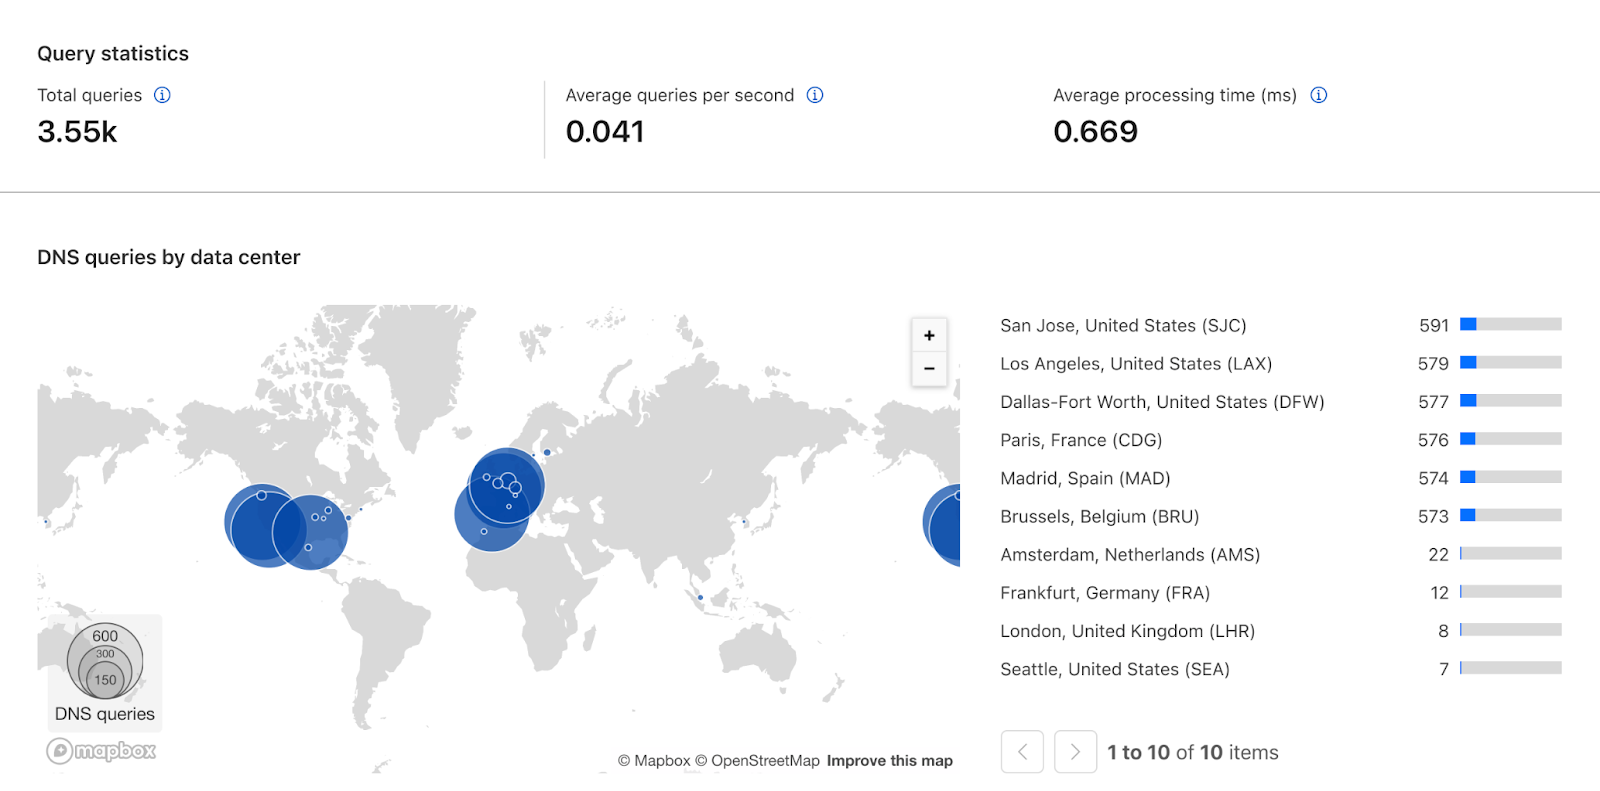
The GraphQL API also allows us to add a new DNS analytics section to the Cloudflare dashboard. Customers will be able to track the most queried records, see which data centers are answering those queries, see how many queries are being made, and much more.
The new DNS dataset in our GraphQL API and the new DNS analytics page work together to help our DNS customers to monitor, analyze, and troubleshoot their Foundation DNS deployments.
New release process
Cloudflare’s Authoritative DNS product receives software updates roughly once a week. Cloudflare has a sophisticated release process that helps prevent regressions from affecting production traffic. While uncommon, it’s possible to have issues only surface once the new release is subject to the volume and uniqueness of production traffic.
Because our enterprise customers desire stability even more than new features, new releases will be subject to a two-week soak time with our standard nameservers before our Foundation DNS advanced nameservers are upgraded. After two weeks with no issues, the Foundation DNS advanced nameservers will be upgraded as well.
Zones using Foundation DNS advanced nameservers will see increased reliability as they are better protected against regressions in new software releases.
Simpler DNS pricing
Historically, Cloudflare has charged for Authoritative DNS based on monthly DNS queries and the number of domains in the account. Our enterprise DNS customers are often interested in DNS-only zones, which are DNS zones hosted in Cloudflare that do not use our reverse proxy (layer 7) services such as our CDN, WAF, or Bot Management. With Foundation DNS, we’re making pricing simpler for the vast majority of those customers by including 10,000 DNS only domains by default. This change means most customers will only pay for the number of DNS queries they consume.
We’re also including 1 million DNS records across all domains in an account. But that doesn’t mean we can’t support more. In fact, the biggest single zone on our platform has over 3.9 million records, while our largest DNS account is just shy of 30 million DNS records spread across multiple zones. With Cloudflare DNS, there is no trouble handling even the largest deployments.
There is more to come
We are just getting started. In the future, we will add more exclusive features to Foundation DNS. One example is a highly requested feature: per-record scoped API tokens and user permissions. This will allow you to configure permissions on an even more granular level. For example, you could specify that a particular member of your account is only allowed to create and manage records of the type TXT and MX, so they don’t accidentally delete or edit address records impacting web traffic to your domain. Another example would be to specify permissions based on subdomain to further restrict the scope of specific users.
If you’re an existing enterprise customer and want to use Foundation DNS, get in touch with your account team to provision Foundation DNS on your account.
Developer Week 2024 has officially come to a close. Each day last week, we shipped new products and functionality geared towards giving developers the components they need to build full-stack applications on Cloudflare.
Even though Developer Week is now over, we are continuing to innovate with the over two million developers who build on our platform. Building a platform is only as exciting as seeing what developers build on it. Before we dive into a recap of the announcements, to send off the week, we wanted to share how a couple of companies are using Cloudflare to power their applications:
We have been using Workers for image delivery using R2 and have been able to maintain stable operations for a year after implementation. The speed of deployment and the flexibility of detailed configurations have greatly reduced the time and effort required for traditional server management. In particular, we have seen a noticeable cost savings and are deeply appreciative of the support we have received from Cloudflare Workers. – FAN Communications
Milkshake helps creators, influencers, and business owners create engaging web pages directly from their phone, to simply and creatively promote their projects and passions. Cloudflare has helped us migrate data quickly and affordably with R2. We use Workers as a routing layer between our users’ websites and their images and assets, and to build a personalized analytics offering affordably. Cloudflare’s innovations have consistently allowed us to run infrastructure at a fraction of the cost of other developer platforms and we have been eagerly awaiting updates to D1 and Queues to sustainably scale Milkshake as the product continues to grow. – Milkshake
In case you missed anything, here’s a quick recap of the announcements and in-depth technical explorations that went out last week:
A core part of any full-stack application is storing and persisting data! We kicked off the week with announcements that help developers build stateful applications on top of Cloudflare, including making D1, Cloudflare’s SQL database and Hyperdrive, our database accelerating service, generally available.
D1, Cloudflare’s SQL database, is now generally available. With new support for 10GB databases, data export, and enhanced query debugging, we empower developers to build production-ready applications with D1 to meet all their relational SQL needs. To support Workers in global applications, we’re sharing a sneak peek of our design and API for D1 global read replication to demonstrate how developers scale their workloads with D1.
Bindings don’t just reduce boilerplate. They are a core design feature of the Workers platform which simultaneously improve developer experience and application security in several ways. Usually these two goals are in opposition to each other, but bindings elegantly solve for both at the same time.
We made a series of AI-related announcements, including Workers AI, Cloudflare’s inference platform becoming GA, support for fine-tuned models with LoRAs, one-click deploys from HuggingFace, Python support for Cloudflare Workers, and more.
Workers AI now supports fine-tuned models using LoRAs. But what is a LoRA and how does it work? In this post, we dive into fine-tuning, LoRAs and even some math to share the details of how it all works under the hood.
We introduced Python support for Cloudflare Workers, now in open beta. We’ve revamped our systems to support Python, from the Workers runtime itself to the way Workers are deployed to Cloudflare’s network. Learn about a Python Worker’s lifecycle, Pyodide, dynamic linking, and memory snapshots in this post.
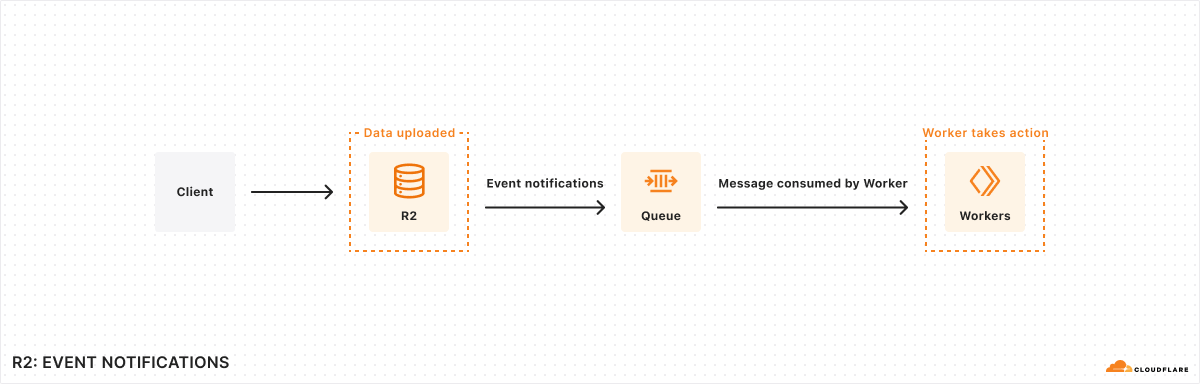
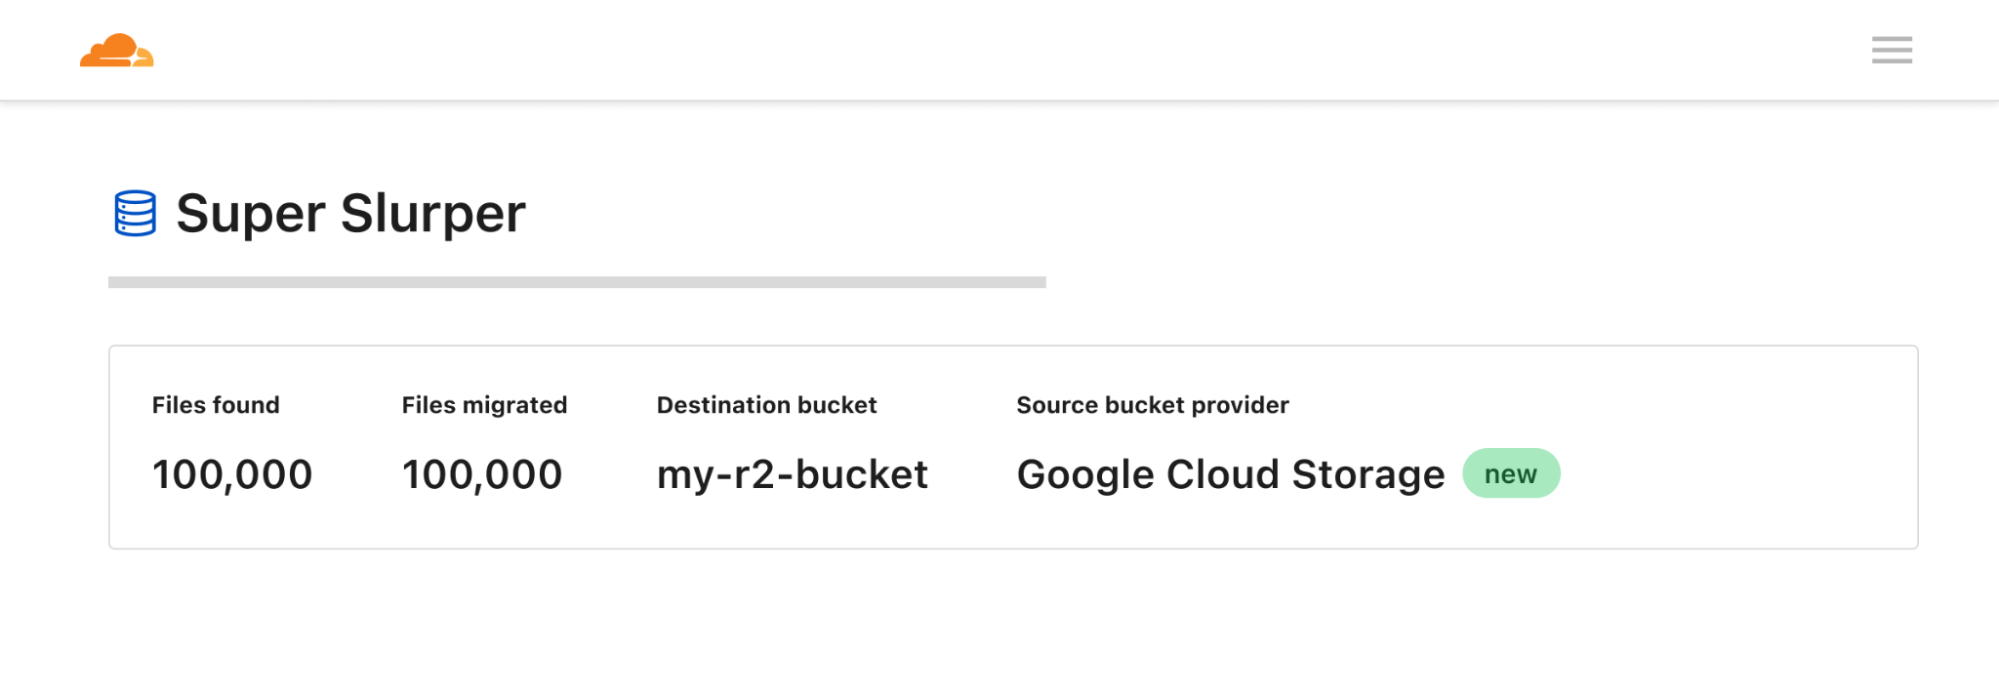
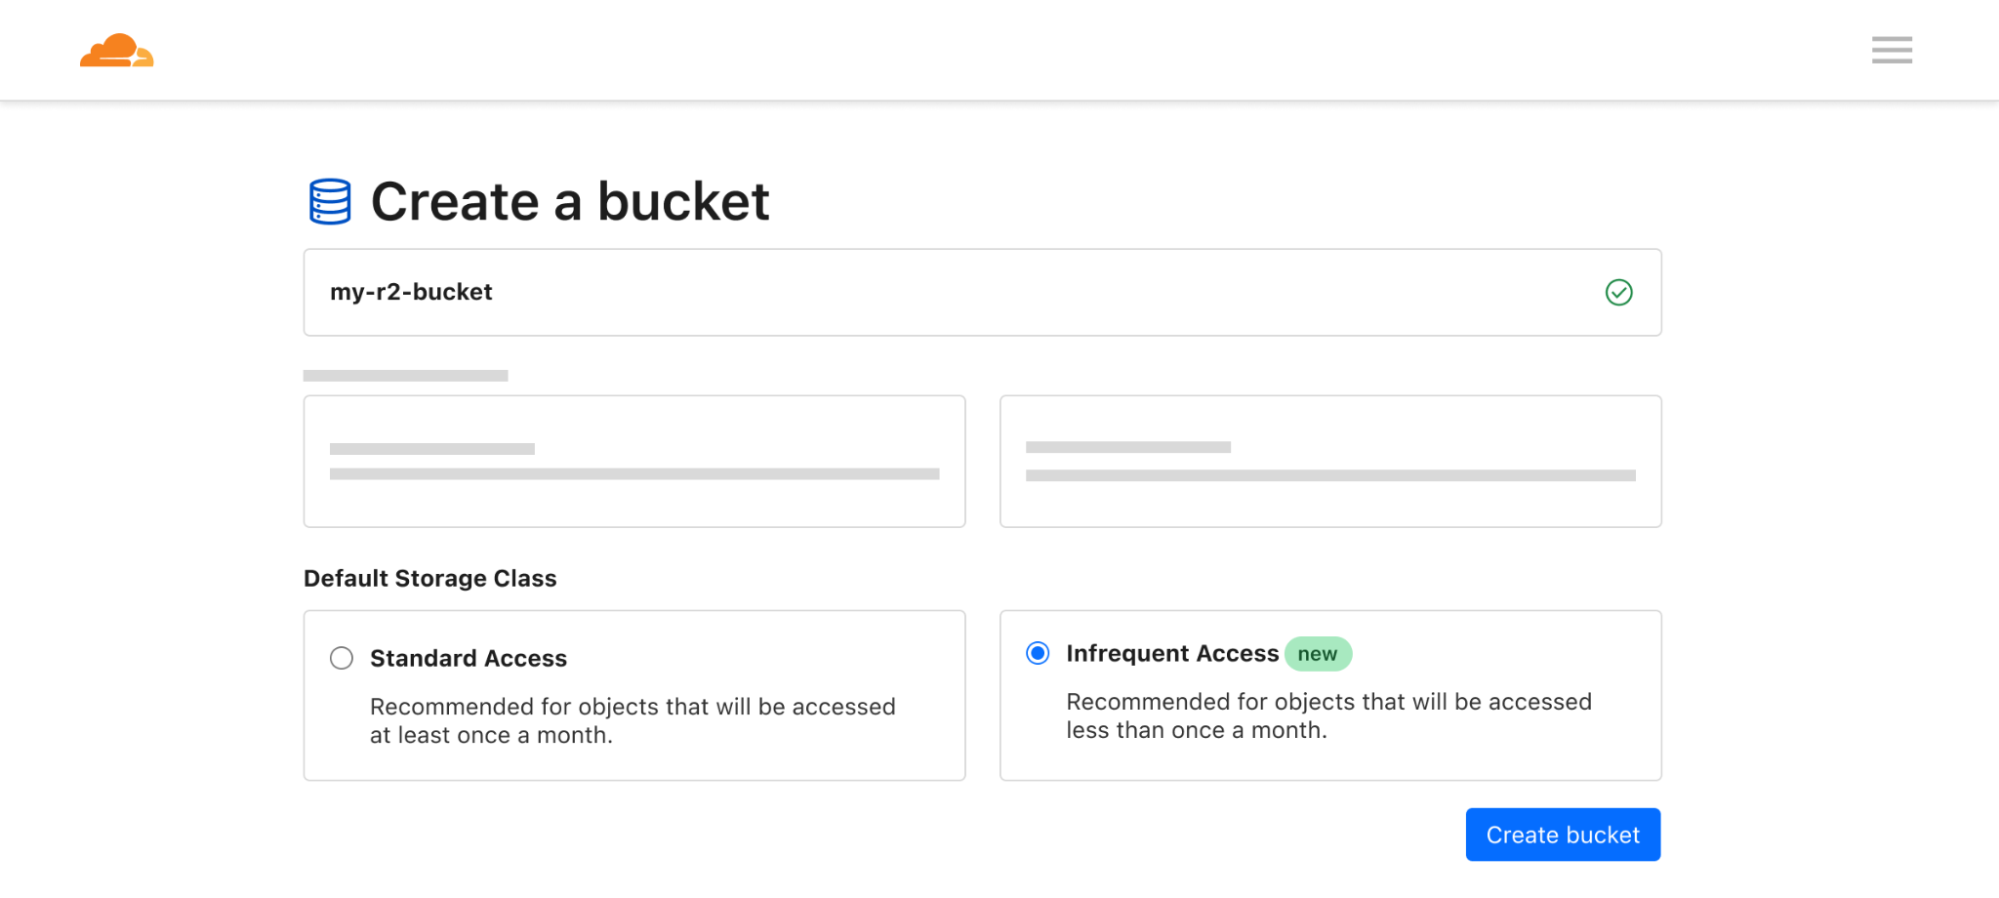
We announced three new features for Cloudflare R2: event notifications, support for migrations from Google Cloud Storage, and an infrequent access storage tier.
We’re making it easier to build scalable, reliable, data-driven applications on top of our global network, and so we announced a new Event Notifications framework; our take on durable execution, Workflows; and an upcoming streaming ingestion service, Pipelines.
Together, Cloudflare and Prisma make it easier than ever to deploy globally available apps with a focus on developer experience. To further that goal, Prisma ORM now natively supports Cloudflare Workers and D1 in Preview. With version 5.12.0 of Prisma ORM you can now interact with your data stored in D1 from your Cloudflare Workers with the convenience of the Prisma Client API. Learn more and try it out now.
Picsart, one of the world’s largest digital creation platforms, encountered performance challenges in catering to its global audience. Adopting Cloudflare’s global-by-default Developer Platform emerged as the optimal solution, empowering Picsart to enhance performance and scalability substantially.
We launched four improvements to Pages that bring functionality previously restricted to Workers, with the goal of unifying the development experience between the two. Support for monorepos, wrangler.toml, new additions to Next.js support and database integrations!
Production readiness isn’t just about scale and reliability of the services you build with. We announced five updates that put more power in your hands – Gradual Deployments, Source mapped stack traces in Tail Workers, a new Rate Limiting API, brand-new API SDKs, and updates to Durable Objects – each built with mission-critical production services in mind.
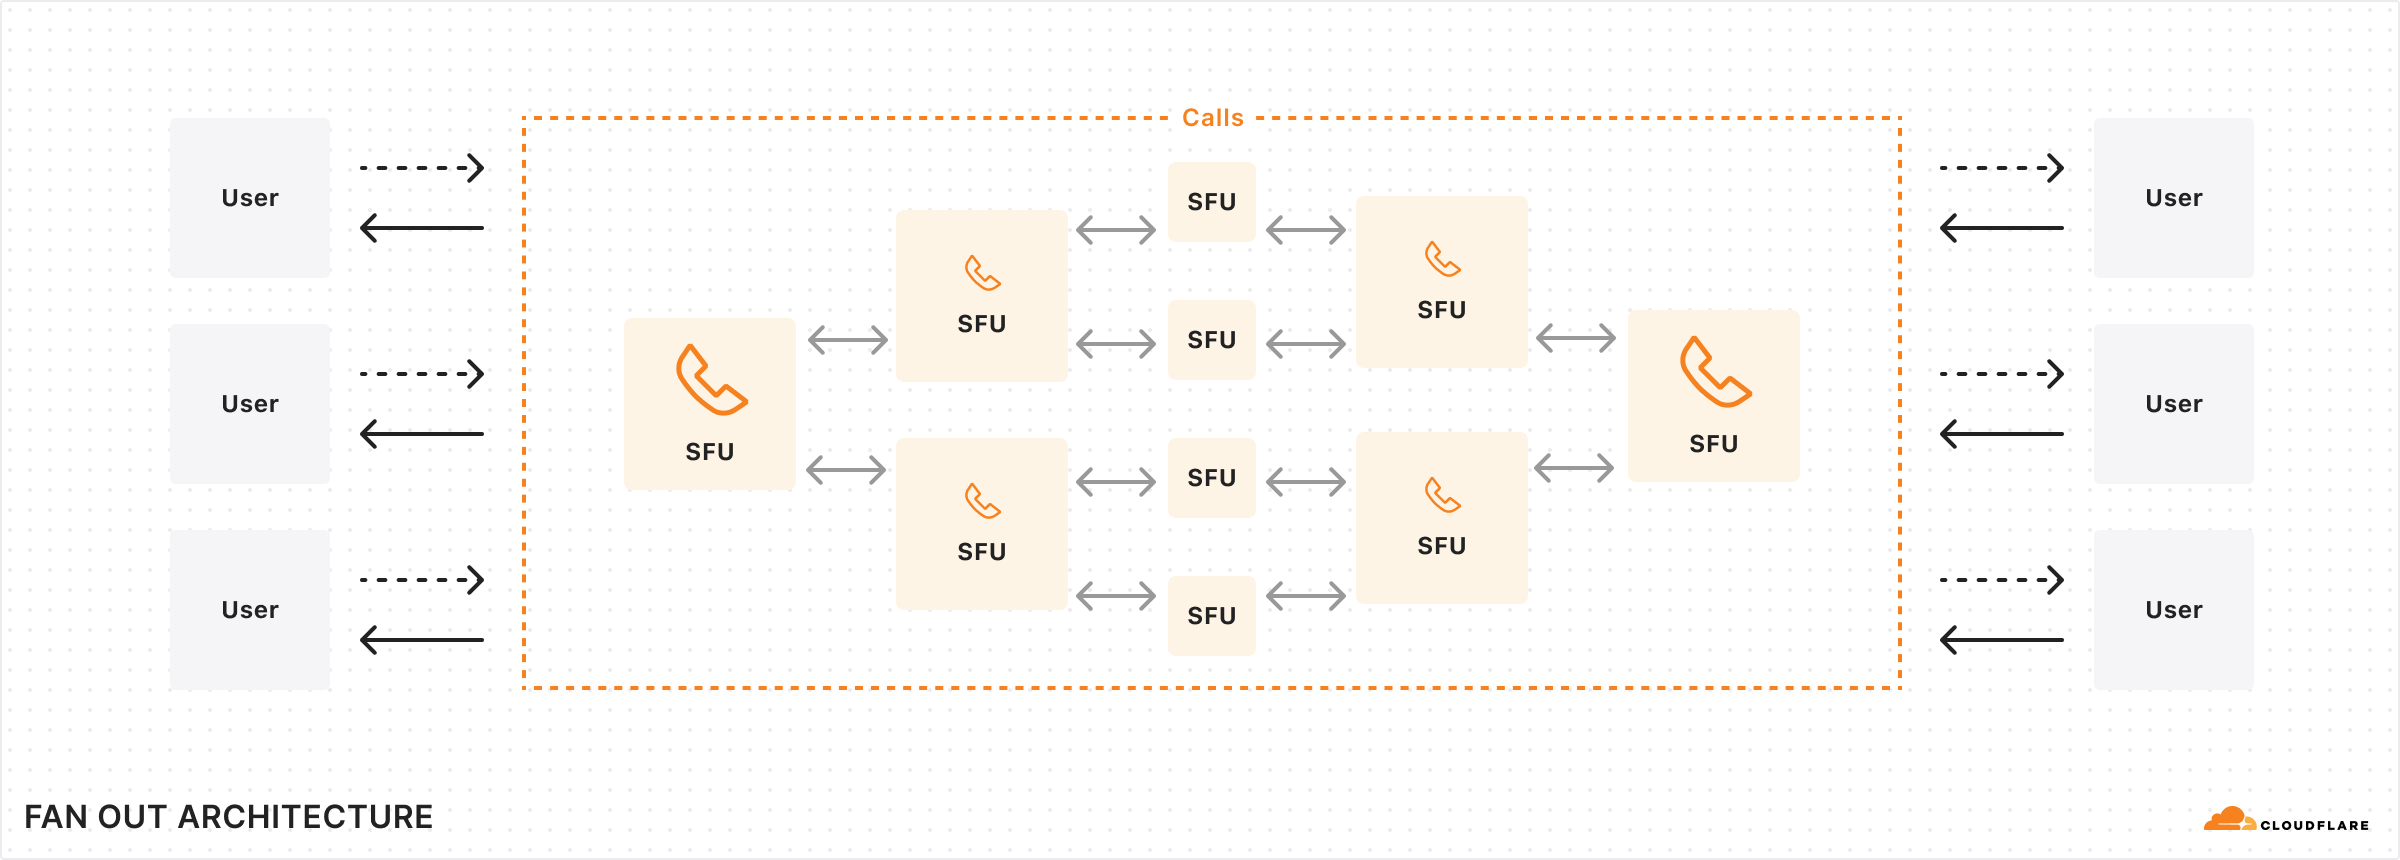
With Cloudflare Calls in open beta, you can build real-time, serverless video and audio applications. Cloudflare Stream lets your viewers instantly clip from ongoing streams. Finally, Cloudflare Images now supports automatic face cropping and has an upload widget that lets you easily integrate into your application.
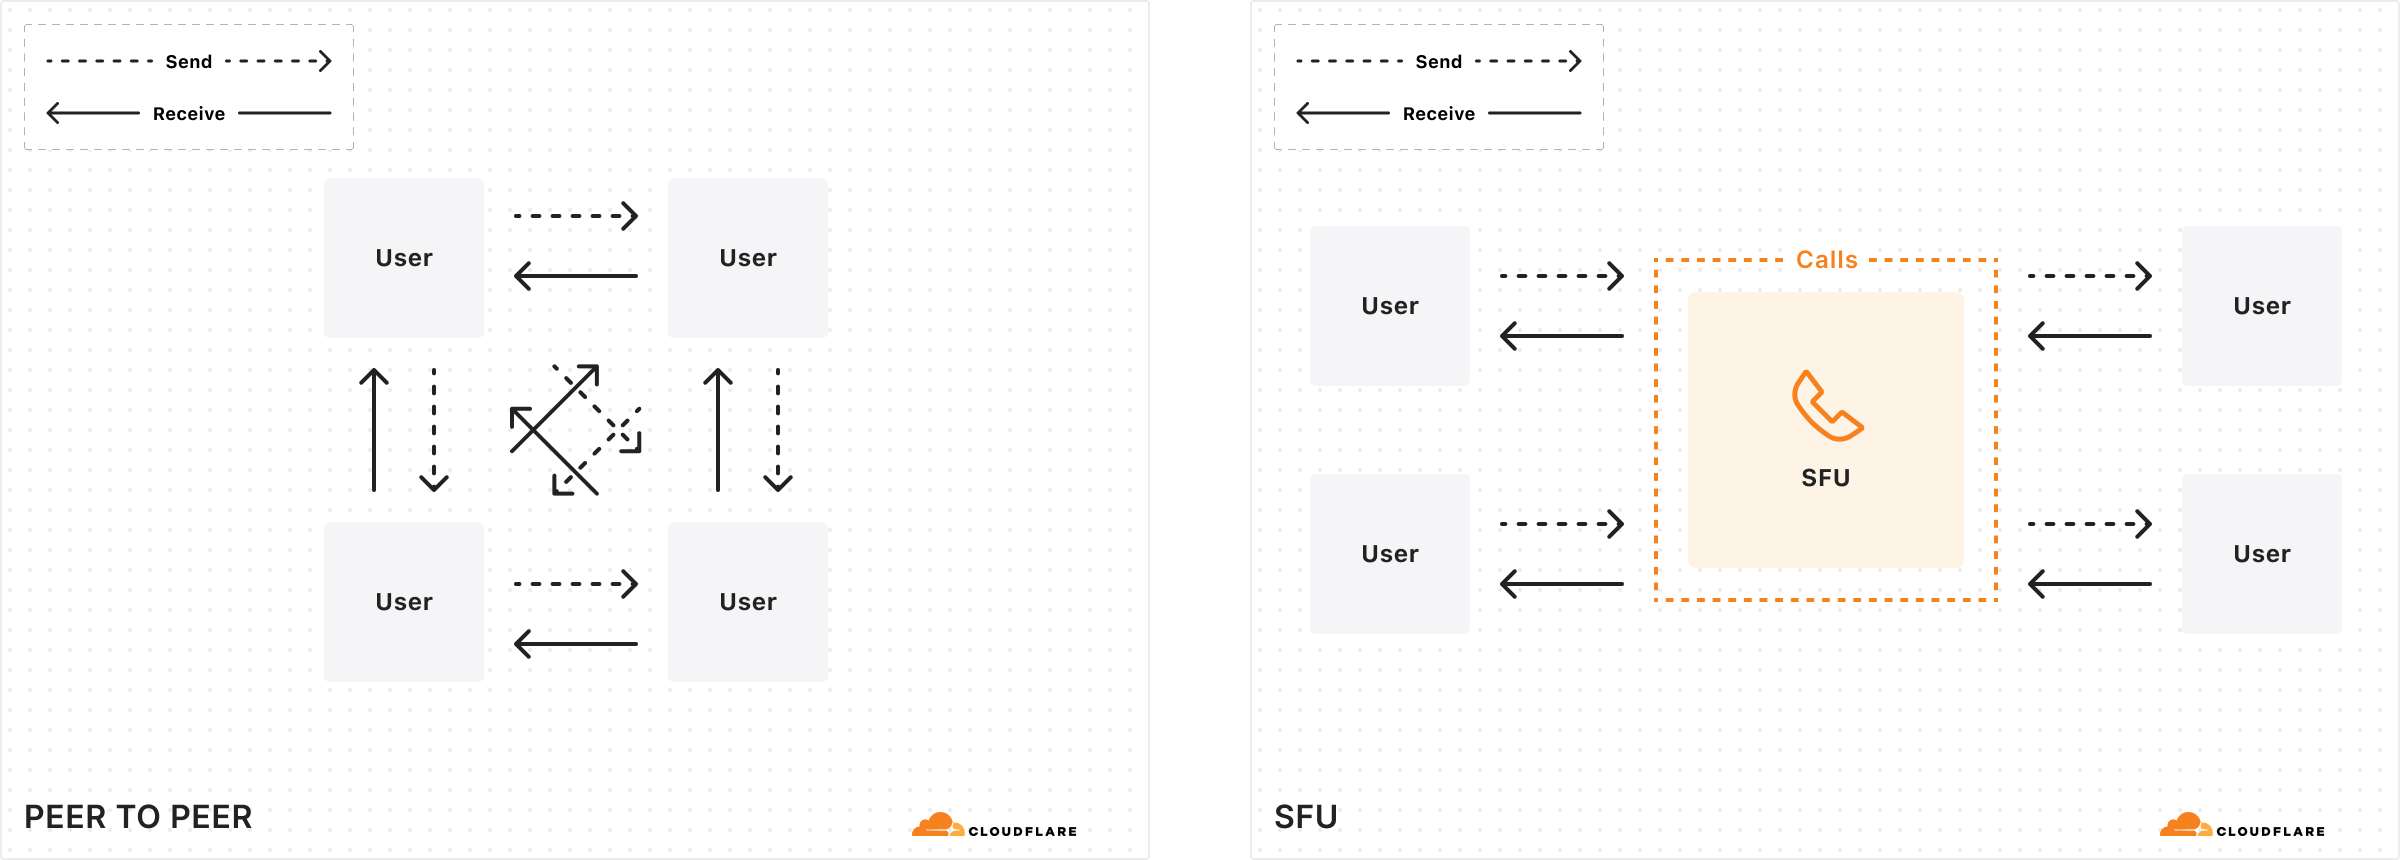
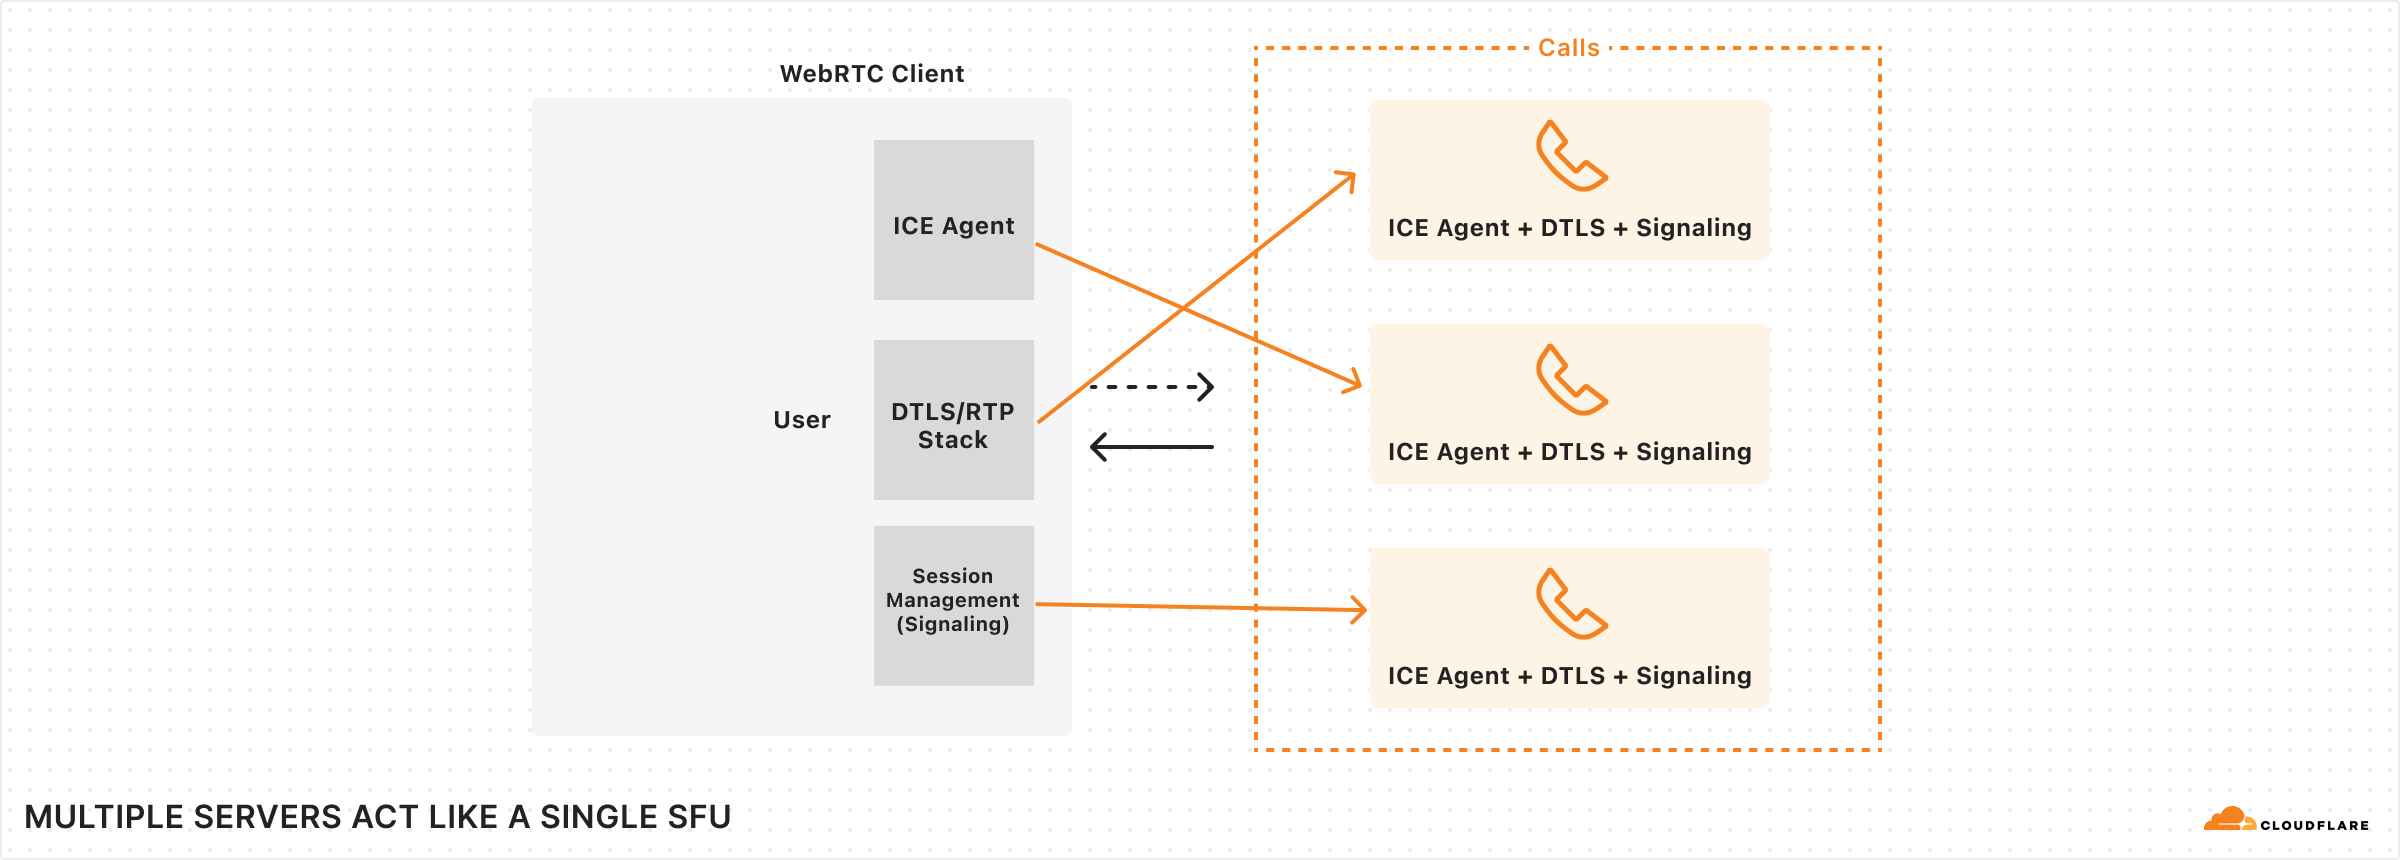
Cloudflare Calls is a serverless SFU and TURN service running at Cloudflare’s edge. It’s now in open beta and costs $0.05/ real-time GB. It’s 100% anycast WebRTC.
We announced that PartyKit, a trailblazer in enabling developers to craft ambitious real-time, collaborative, multiplayer applications, is now a part of Cloudflare. This acquisition marks a significant milestone in our journey to redefine the boundaries of serverless computing, making it more dynamic, interactive, and, importantly, stateful.
Full-stack web development with Cloudflare is now faster and easier! You can now use your framework’s development server while accessing D1 databases, R2 object stores, AI models, and more. Iterate locally in milliseconds to build sophisticated web apps that run on Cloudflare. Let’s dev together!
Cloudflare Workers now features a built-in RPC (Remote Procedure Call) system for use in Worker-to-Worker and Worker-to-Durable Object communication, with absolutely minimal boilerplate. We’ve designed an RPC system so expressive that calling a remote service can feel like using a library.
We closed out Developer Week by sharing updates on our Workers Launchpad program, our latest Developer Challenge, and the work we’re doing to ensure our community spaces – like our Discord and Community forums – are safe and inclusive for all developers.
Continue the conversation
Thank you for being a part of Developer Week! Want to continue the conversation and share what you’re building? Join us on Discord. To get started building on Workers, check out our developer documentation.
The cloud is changing. Just a few years ago, serverless functions were revolutionary. Today, entire applications are built on serverless architectures, from compute to databases, storage, queues, etc. — with Cloudflare leading the way in making it easier than ever for developers to build, without having to think about their architecture. And while the adoption of serverless has made it simple for developers to run fast, it has also made one of the most difficult problems in software even harder: how the heck do you unravel the behavior of distributed systems?
When I started Baselime 2 years ago, our goal was simple: enable every developer to build, ship, and learn from their serverless applications such that they can resolve issues before they become problems.
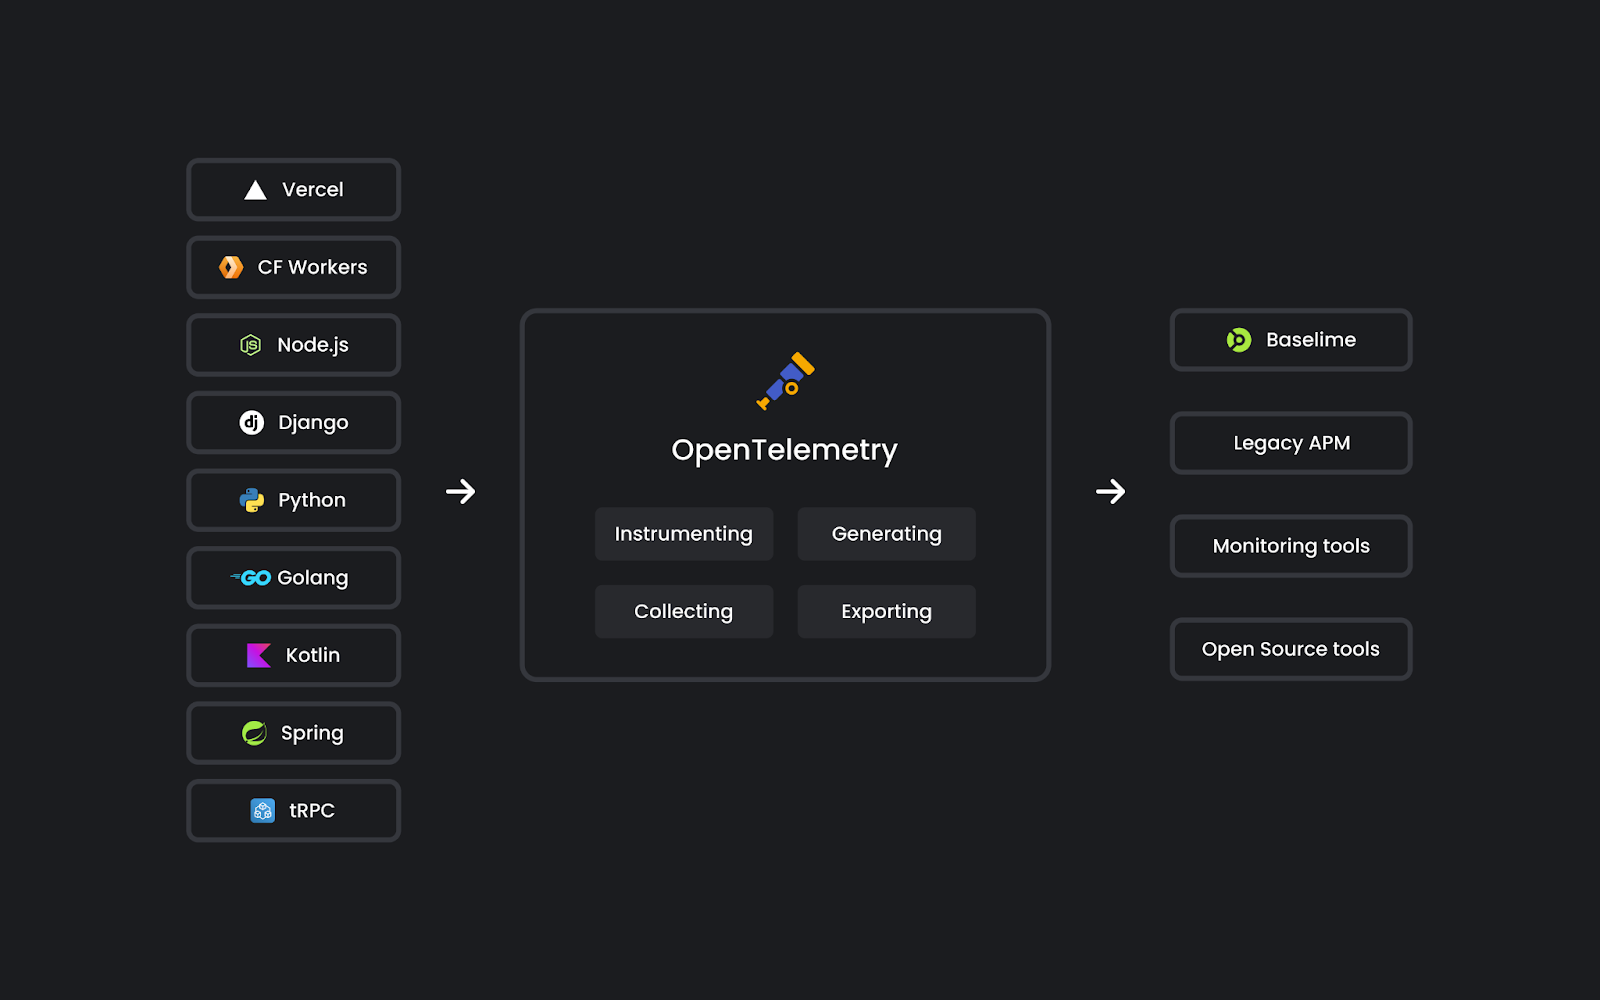
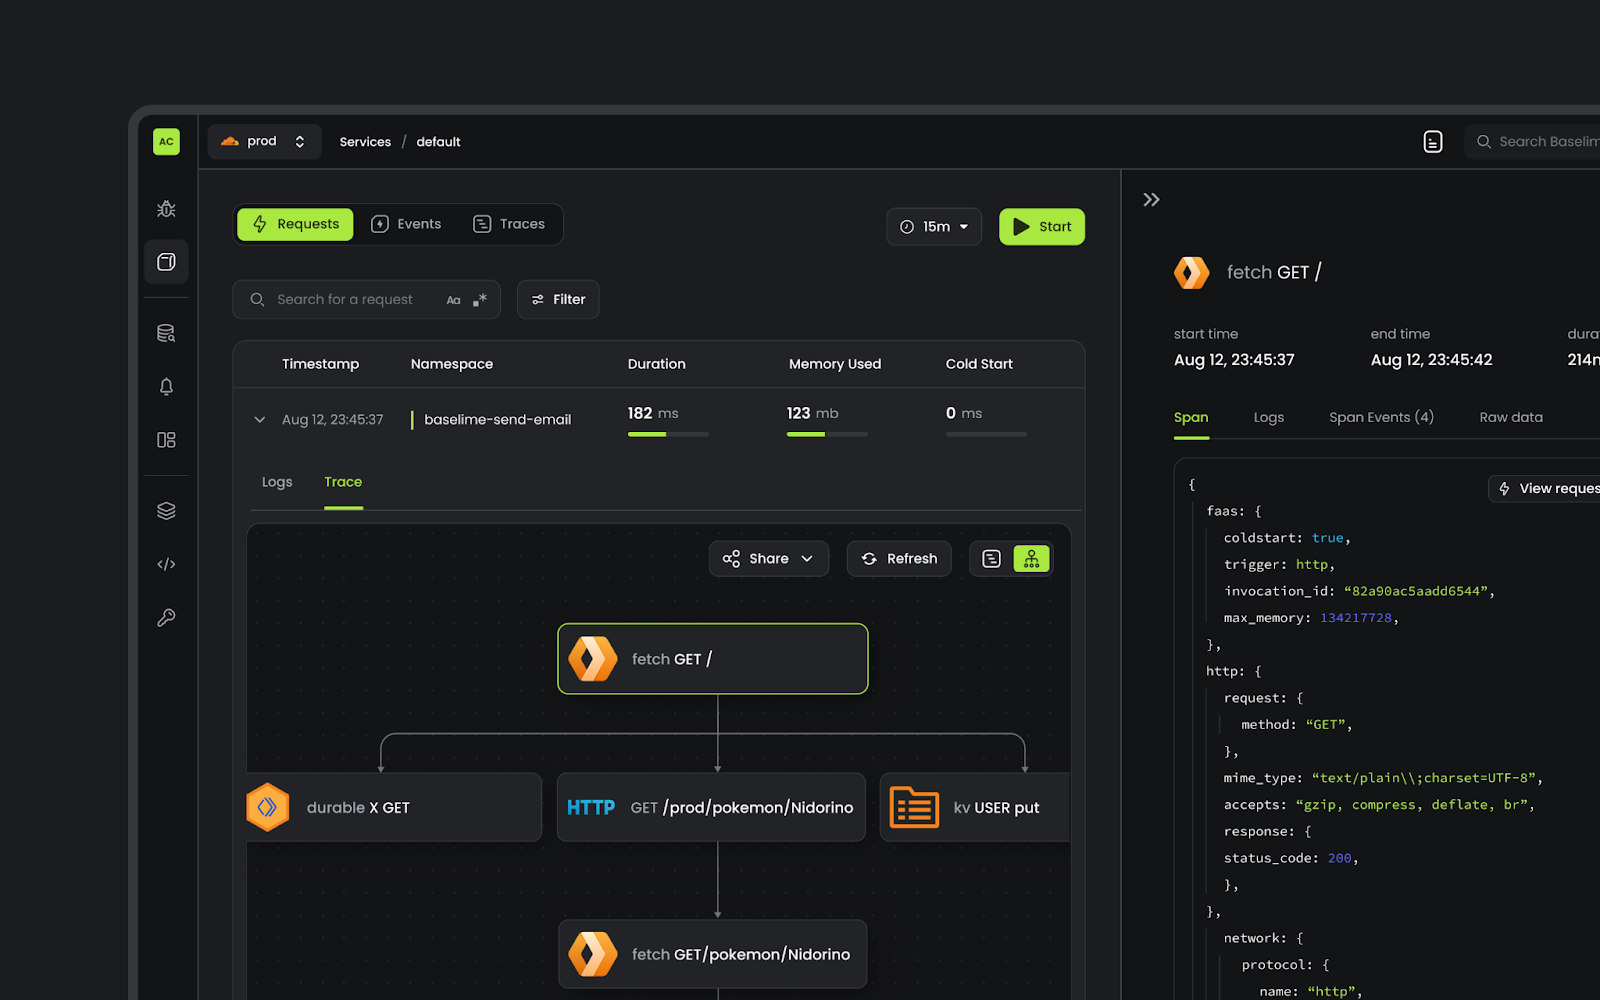
Since then, we built an observability platform that enables developers to understand the behaviour of their cloud applications. It’s designed for high cardinality and dimensionality data, from logs to distributed tracing with OpenTelemetry. With this data, we automatically surface insights from your applications, and enable you to quickly detect, troubleshoot, and resolve issues in production.
In parallel, Cloudflare has been busy the past few years building the next frontier of cloud computing: the connectivity cloud. The team is building primitives that enable developers to build applications with a completely new set of paradigms, from Workers to D1, R2, Queues, KV, Durable Objects, AI, and all the other services available on the Cloudflare Developers Platform.
This synergy makes Cloudflare the perfect home for Baselime. Our core mission has always been to simplify and innovate around observability for the future of the cloud, and Cloudflare’s ecosystem offers the ideal ground to further this cause. With Cloudflare, we’re positioned to deeply integrate into a platform that tens of thousands of developers trust and use daily, enabling them to quickly build, ship, and troubleshoot applications. We believe that every Worker, Queue, KV, Durable Object, AI call, etc. should have built-in observability by default.
That’s why we’re incredibly excited about the potential of what we can build together and the impact it will have on developers around the world.
To give you a preview into what’s ahead, I wanted to dive deeper into the 3 core concepts we followed while building Baselime.
High Cardinality and Dimensionality
Cardinality and dimensionality are best described using examples. Imagine you’re playing a board game with a deck of cards. High cardinality is like playing a game where every card is a unique character, making it hard to remember or match them. And high dimensionality is like each card has tons of details like strength, speed, magic, aura, etc., making the game’s strategy complex because there’s so much to consider.
This also applies to the data your application emits. For example, when you log an HTTP request that makes database calls.
High cardinality means that your logs can have a unique userId or requestId (which can take millions of distinct values). Those are high cardinality fields.
High dimensionality means that your logs can have thousands of possible fields. You can record each HTTP header of your request and the details of each database call. Any log can be a key-value object with thousands of individual keys.
The ability to query on high cardinality and dimensionality fields is key to modern observability. You can surface all errors or requests for a specific user, compute the duration of each of those requests, and group by location. You can answer all of those questions with a single tool.
OpenTelemetry
OpenTelemetry provides a common set of tools, APIs, SDKs, and standards for instrumenting applications. It is a game-changer for debugging and understanding cloud applications. You get to see the big picture: how fast your HTTP APIs are, which routes are experiencing the most errors, or which database queries are slowest. You can also get into the details by following the path of a single request or user across your entire application.
Baselime is OpenTelemetry native, and it is built from the ground up to leverage OpenTelemetry data. To support this, we built a set of OpenTelemetry SDKs compatible with several serverless runtimes.
Cloudflare is building the cloud of tomorrow and has developed workerd, a modern JavaScript runtime for Workers. With Cloudflare, we are considering embedding OpenTelemetry directly in the Workers’ runtime. That’s one more reason we’re excited to grow further at Cloudflare, enabling more developers to understand their applications, even in the most unconventional scenarios.
Developer Experience
Observability without action is just storage. I have seen too many developers pay for tools to store logs and metrics they never use, and the key reason is how opaque these tools are.
The crux of the issue in modern observability isn’t the technology itself, but rather the developer experience. Many tools are complex, with a significant learning curve. This friction reduces the speed at which developers can identify and resolve issues, ultimately affecting the reliability of their applications. Improving developer experience is key to unlocking the full potential of observability.
We built Baselime to be an exploratory solution that surfaces insights to you rather than requiring you to dig for them. For example, we notify you in real time when errors are discovered in your application, based on your logs and traces. You can quickly search through all of your data with full-text search, or using our powerful query engine, which makes it easy to correlate logs and traces for increased visibility, or ask our AI debugging assistant for insights on the issue you’re investigating.
It is always possible to go from one insight to another, asking questions about the state of your app iteratively until you get to the root cause of the issue you are troubleshooting.
Cloudflare has always prioritised the developer experience of its developer platform, especially with Wrangler, and we are convinced it’s the right place to solve the developer experience problem of observability.
What’s next?
Over the next few months, we’ll work to bring the core of Baselime into the Cloudflare ecosystem, starting with OpenTelemetry, real-time error tracking, and all the developer experience capabilities that make a great observability solution. We will keep building and improving observability for applications deployed outside Cloudflare because we understand that observability should work across providers.
But we don’t want to stop there. We want to push the boundaries of what modern observability looks like. For instance, directly connecting to your codebase and correlating insights from your logs and traces to functions and classes in your codebase. We also want to enable more AI capabilities beyond our debugging assistant. We want to deeply integrate with your repositories such that you can go from an error in your logs and traces to a Pull Request in your codebase within minutes.
We also want to enable everyone building on top of Large Language Models to do all your LLM observability directly within Cloudflare, such that you can optimise your prompts, improve latencies and reduce error rates directly within your cloud provider. These are just a handful of capabilities we can now build with the support of the Cloudflare platform.
Thanks
We are incredibly thankful to our community for its continued support, from day 0 to today. With your continuous feedback, you’ve helped us build something we’re incredibly proud of.
To all the developers currently using Baselime, you’ll be able to keep using the product and will receive ongoing support. Also, we are now making all the paid Baselime features completely free.
Baselime products remain available to sign up for while we work on integrating with the Cloudflare platform. We anticipate sunsetting the Baselime products towards the end of 2024 when you will be able to observe all of your applications within the Cloudflare dashboard. If you’re interested in staying up-to-date on our work with Cloudflare, we will release a signup link in the coming weeks!
We are looking forward to continuing to innovate with you.
Browser Rendering API is now available to all paid Workers customers with improved session management
In May 2023, we announced the open beta program for the Browser Rendering API. Browser Rendering allows developers to programmatically control and interact with a headless browser instance and create automation flows for their applications and products.
At the same time, we launched a version of the Puppeteer library that works with Browser Rendering. With that, developers can use a familiar API on top of Cloudflare Workers to create all sorts of workflows, such as taking screenshots of pages or automatic software testing.
Today, we take Browser Rendering one step further, taking it out of beta and making it available to all paid Workers’ plans. Furthermore, we are enhancing our API and introducing a new feature that we’ve been discussing for a long time in the open beta community: session management.
Session Management
Session management allows developers to reuse previously opened browsers across Worker’s scripts. Reusing browser sessions has the advantage that you don’t need to instantiate a new browser for every request and every task, drastically increasing performance and lowering costs.
Before, to keep a browser instance alive and reuse it, you’d have to implement complex code using Durable Objects. Now, we’ve simplified that for you by keeping your browsers running in the background and extending the Puppeteer API with new session management methods that give you access to all of your running sessions, activity history, and active limits.
Observability is an essential part of any Cloudflare product. You can find detailed analytics and logs of your Browser Rendering usage in the dashboard under your account’s Worker & Pages section.
Browser Rendering is now available to all customers with a paid Workers plan. Each account is limited to running two new browsers per minute and two concurrent browsers at no cost during this period. Check our developers page to get started.
We are rolling out access to Cloudflare Snippets
Powerful, programmable, and free of charge, Snippets are the best way to perform complex HTTP request and response modifications on Cloudflare. What was once too advanced to achieve using Rules products is now possible with Snippets. Since the initial announcement during Developer Week 2022, the promise of extending out-of-the-box Rules functionality by writing simple JavaScript code is keeping the Cloudflare community excited.
During the first 3 months of 2024 alone, the amount of traffic going through Snippets increased over 7x, from an average of 2,200 requests per second in early January to more than 17,000 in March.
However, instead of opening the floodgates and letting millions of Cloudflare users in to test (and potentially break) Snippets in the most unexpected ways, we are going to pace ourselves and opt for a phased rollout, much like the newly released Gradual Rollouts for Workers.
In the next few weeks, 5% of Cloudflare users will start seeing “Snippets” under the Rules tab of the zone-level menu in their dashboard. If you happen to be part of the first 5%, snip into action and try out how fast and powerful Snippets are even for advanced use cases like dynamically changing the date in headers or A / B testing leveraging the `math.random` function. Whatever you use Snippets for, just keep one thing in mind: this is still an alpha, so please do not use Snippets for production traffic just yet.
Until then, keep your eyes out for the new Snippets tab in the Cloudflare dashboard and learn more how powerful and flexible Snippets are at the developer documentation in the meantime.
Coming soon: asynchronous revalidation with stale-while-revalidate
One of the features most requested by our customers is the asynchronous revalidation with stale-while-revalidate (SWR) cache directive, and we will be bringing this to you in the second half of 2024. This functionality will be available by design as part of our new CDN architecture that is being built using Rust with performance and memory safety at top of mind.
Currently, when a client requests a resource, such as a web page or an image, Cloudflare checks to see if the asset is in cache and provides a cached copy if available. If the file is not in the cache or has expired and become stale, Cloudflare connects to the origin server to check for a fresh version of the file and forwards this fresh version to the end user. This wait time adds latency to these requests and impacts performance.
Stale-while-revalidate is a cache directive that allows the expired or stale version of the asset to be served to the end user while simultaneously allowing Cloudflare to check the origin to see if there’s a fresher version of the resource available. If an updated version exists, the origin forwards it to Cloudflare, updating the cache in the process. This mechanism allows the client to receive a response quickly from the cache while ensuring that it always has access to the most up-to-date content. Stale-while-revalidate strikes a balance between serving content efficiently and ensuring its freshness, resulting in improved performance and a smoother user experience.
Customers who want to be part of our beta testers and “cache” in on the fun can register here, and we will let you know when the feature is ready for testing!
Coming on April 16, 2024: Workers for Platforms for our pay-as-you-go plan
Today, we’re excited to share that on April 16th, Workers for Platforms will be available to all developers through our new $25 pay-as-you-go plan!
Workers for Platforms is changing the way we build software – it gives you the ability to embed personalization and customization directly into your product. With Workers for Platforms, you can deploy custom code on behalf of your users or let your users directly deploy their own code to your platform, without you or your users having to manage any infrastructure. You can use Workers for Platforms with all the exciting announcements that have come out this Developer Week – it supports all the bindings that come with Workers (including Workers AI, D1 and Durable Objects) as well as Python Workers.
Here’s what some of our customers – ranging from enterprises to startups – are building on Workers for Platforms:
Shopify Oxygen is a hosting platform for their Remix-based eCommerce framework Hydrogen, and it’s built on Workers for Platforms! The Hydrogen/Oxygen combination gives Shopify merchants control over their buyer experience without the restrictions of generic storefront templates.
Grafbase is a data platform for developers to create a serverless GraphQL API that unifies data sources across a business under one endpoint. They use Workers for Platforms to give their developers the control and flexibility to deploy their own code written in JavaScript/TypeScript or WASM.
Triplit is an open-source database that syncs data between server and browser in real-time. It allows users to build low latency, real-time applications with features like relational querying, schema management and server-side storage built in. Their query and sync engine is built on top of Durable Objects, and they’re using Workers for Platforms to allow their customers to package custom Javascript alongside their Triplit DB instance.
Tools for observability and platform level controls
Workers for Platforms doesn’t just allow you to deploy Workers to your platform – we also know how important it is to have observability and control over your users’ Workers. We have a few solutions that help with this:
Custom Limits: Set CPU time or subrequest caps on your users’ Workers. Can be used to set limits in order to control your costs on Cloudflare and/or shape your own pricing and packaging model. For example, if you run a freemium model on your platform, you can lower the CPU time limit for customers on your free tier.
Tail Workers: Tail Worker events contain metadata about the Worker, console.log() messages, and capture any unhandled exceptions. They can be used to provide your developers with live logging in order to monitor for errors and troubleshoot in real time.
Outbound Workers: Get visibility into all outgoing requests from your users’ Workers. Outbound Workers sit between user Workers and the fetch() requests they make, so you get full visibility over the request before it’s sent out to the Internet.
Pricing
We wanted to make sure that Workers for Platforms was affordable for hobbyists, solo developers, and indie developers. Workers for Platforms is part of a new $25 pay-as-you-go plan, and it includes the following:
Included Amounts
Requests
20 million requests/month +$0.30 per additional million
CPU time
60 million CPU milliseconds/month +$0.02 per additional million CPU milliseconds
Scripts
1000 scripts +0.02 per additional script/month
Workers for Platforms will be available to purchase on April 16, 2024!
The Workers for Platforms will be available to purchase under the Workers for Platforms tab on the Cloudflare Dashboard on April 16, 2024.
Following its initial announcement in September 2022, Cloudflare Calls is now in open beta and available in your Cloudflare Dashboard. Cloudflare Calls lets developers build real-time audio/video apps using WebRTC, and it abstracts away the complexity by turning the Cloudflare network into a singular SFU. In this post, we dig into how we make this possible.
WebRTC growing pains
WebRTC is the only way to send UDP traffic out of a web browser – everything else uses TCP.
As a developer, you need a UDP-based transport layer for applications demanding low latency and real-time feedback, such as audio/video conferencing and interactive gaming. This is because unlike WebSocket and other TCP-based solutions, UDP is not subject to head-of-line blocking, afrequenttopic on the Cloudflare Blog.
When building a new video conferencing app, you typically start with a peer-to-peer web application using WebRTC, where clients exchange data directly. This approach is efficient for small-scale demos, but scalability issues arise as the number of participants increases. This is because the amount of data each client must transmit grows substantially, following an almost exponential increase relative to the number of participants, as each client needs to send data to n-1 other clients.
Selective Forwarding Units (SFUs) play pivotal roles in scaling WebRTC applications. An SFU functions by receiving multiple media or data flows from participants and deciding which streams should be forwarded to other participants, thus acting as a media stream routing hub. This mechanism significantly reduces bandwidth requirements and improves scalability by managing stream distribution based on network conditions and participant needs. Even though it hasn’t always been this way from when video calling on computers first became popular, SFUs are often found in the cloud, rather than home computers of clients, because of superior connectivity offered in a data center.
A modern audio/video application thus quickly becomes complicated with the addition of this server side element. Since all clients connect to this central SFU server, there are numerous things to consider when you’re architecting and scaling a real-time application:
How close is the SFU server location(s) to the end user clients, how is a client assigned to a server?
Where is the SFU hosted, and if it’s hosted in the cloud, what are the egress costs from VMs?
How many participants can fit in a “room”? Are all participants sending and receiving data? With cameras on? Audio only?
Some SFUs require the use of custom SDKs. Which platforms do these run on and are they compatible with the application you’re trying to build?
Monitoring/reliability/other issues that come with running infrastructure
Some of these concerns, and the complexity of WebRTC infrastructure in general, has made the community look in different directions. However, it is clear that in 2024, WebRTC is alive and well with plenty of new and old uses. AI startups build characters that converse in real time, cars leverage WebRTC to stream live footage of their cameras to smartphones, and video conferencing tools are going strong.
WebRTC has been interesting to us for a while. Cloudflare Stream implemented WHIP and WHEP WebRTC video streaming protocols in 2022, which remain the lowest latency way to broadcast video. OBS Studio implemented WHIP broadcasting support as have a variety of software and hardware vendors alongside Cloudflare. In late 2022, we launched Cloudflare Calls in closed beta. When we blogged about it back then, we were very impressed with how WebRTC fared, and spoke to many customers about their pain points as well as creative ideas the existing browser APIs can foster. We also saw other WebRTC-based apps like Clubhouse rise in popularity and Twitter Spaces play a role in popular culture. Today, we see real-time applications of a different sort. Many AI projects have impressive demos with voice/video interactions. All of these apps are built with the same WebRTC APIs and system architectures.
We are confident that Cloudflare Calls is a new kind of WebRTC infrastructure you should try. When we set out to build Cloudflare Calls, we had a few ideas that we weren’t sure would work, but were worth trying:
Build every WebRTC component on Anycast with a single IP address for DTLS, ICE, STUN, SRTP, SCTP, etc.
Don’t force an SDK – WebRTC APIs by themselves are enough, and allow for the most novel uses to shine, because best developers always find ways to hit the limits of SDKs.
Deploy in all 310+ cities Cloudflare operates in – use every Cloudflare server, not just a subset
Exchange offer and answer over HTTP between Cloudflare and the WebRTC client. This way there is only a single PeerConnection to manage.
Now we know this is all possible, because we made it happen, and we think it’s the best experience a developer can get with pure WebRTC.
Is Cloudflare Calls a real SFU?
Cloudflare is in the business of having computers in numerous places. Historically, our core competency was operating a caching HTTP reverse proxy, and we are very good at this. With Cloudflare Calls, we asked ourselves “how can we build a large distributed system that brings together our global network to form one giant stateful system that feels like a single machine?”
When using Calls, every PeerConnection automatically connects to the closest Cloudflare data center instead of a single server. Rather than connecting every client that needs to communicate with each other to a single server, anycast spreads out connections as much as possible to minimize last mile latency sourced from your ISP between your client and Cloudflare.
It’s good to minimize last mile latency because after the data enters Cloudflare’s control, the underlying media can be managed carefully and routed through the Cloudflare backbone. This is crucial for WebRTC applications where millisecond delays can significantly impact user experience. To give you a sense about latency between Cloudflare’s data centers and end-users, about 95% of the Internet connected population is within 50ms of a Cloudflare data center. As I write this, I am about 20ms away, but in the past, I have been lucky enough to be connected to a **great** home Wi-Fi network less than 1ms away in Manhattan. “But you are just one user!” you might be thinking, so here is a chart from Cloudflare Radar showing recent global latency measurements:
This setup allows more opportunities for packets lost to be replied with retransmissions closer to users, more opportunities for bandwidth adjustments.
Eliminating SFU region selection
A traditional challenge in WebRTC infrastructure involves the manual selection of Selective Forwarding Units (SFUs) based on geographic location to minimize latency. Some systems solve this problem by selecting a location for the SFU after the first user joins the “room”. This makes routing inefficient when the rest of the participants in the conversation are clustered elsewhere. The anycast architecture of Calls eliminates this issue. When a client initiates a connection, BGP dynamically determines the closest data center. Each selected server only becomes responsible for the PeerConnection of the clients closest to it.
One might see this is actually a simpler way of managing servers, as there is no need to maintain a layer of WebRTC load balancing for traffic or CPU capacity between servers. However, anycast has its own challenges, and we couldn’t take a laissez-faire approach.
Steps to establishing a PeerConnection
One of the challenging parts in assigning a server to a client PeerConnection is supporting dual stack networking for backwards compatibility with clients that only support the old version of the Internet Protocol, IPv4.
Cloudflare Calls uses a single IP address per protocol, and our L4 load balancer directs packets to a single server per client by using the 4-tuple {client IP, client port, destination IP, destination port} hashing. This means that every ICE connectivity check packet arrives at different servers: one for IPv4 and one for IPv6.
ICE is not the only protocol used for WebRTC; there is also STUN and TURN for connectivity establishment. Actual media bits are encrypted using DTLS, which carries most of the data during a session.
DTLS packets don’t have any identifiers in them that would indicate they belong to a specific connection (unlike QUIC’s connection ID field), so every server should be able to handle DTLS packets and get the necessary certificates to be able to decrypt them for processing. DTLS encryption is negotiated at the SDP layer using the HTTPS API.
The HTTPS API for Calls also lands on a different server than DTLS and ICE connectivity checks. Since DTLS packets need information from the SDP exchanged using the HTTPS API, and ICE connectivity checks depend on the HTTPS API for userFragment and password fields in the connectivity check packets, it would be very useful for all of these to be available in one server. Yet in our setup, they’re not.
Fippo and Gustavo of WebRTCHacks complained (gracefully noted) about slow replies to ICE connectivity checks in their great article as they were digging into our WHIP implementation right around our announcement in 2022:
Looking at the Wireshark dumps we see a surprisingly large amount of time pass between the first STUN request and the first STUN response – it was 1.8 seconds in the screenshot below.
In other tests, it was shorter, but still 600ms long.
After that, the DTLS packets do not get an immediate response, requiring multiple attempts. This ultimately leads to a call setup time of almost three seconds – way above the global average of 800ms Fippo has measured previously (for the complete handshake, 200ms for the DTLS handshake). For Cloudflare with their extensive network, we expected this to be way below that average.
Gustavo and Fippo observed our solution to this problem of different parts of the WebRTC negotiation landing on different servers. Since Cloudflare Calls unbundles the WebRTC protocol to make the entire network act like a single computer, at this critical moment, we need to form consensus across the network. We form consensus by configuring every server to handle any incoming PeerConnection just in time. When a packet arrives, if the server doesn’t know about it, it quickly learns about the negotiated parameters from another server, such as the ufrag and the DTLS fingerprint from the SDP, and responds with the appropriate response.
Getting faster
Even though we’ve sped up the process of forming consensus across the Cloudflare network, any delays incurred can still have weird side effects. For example, up until a few months ago, delays of a few hundred milliseconds caused slow connections in Chrome.
A connectivity check packet delayed by a few hundred milliseconds signals to Chrome that this is a high latency network, even though every other STUN message after that was replied to in less than 5-10ms. Chrome thus delays sending a USE-CANDIDATE attribute in the responses for a few seconds, degrading the user experience.
Fortunately, Chrome also sends DTLS ClientHello before USE-CANDIDATE (behavior we’ve seen only on Chrome), so to help speed up Chrome, Calls uses DTLS packets in place of STUN packets with USE-CANDIDATE attributes.
After solving this issue with Chrome, PeerConnections globally now take about 100-250ms to get connected. This includes all consensus management, STUN packets, and a complete DTLS handshake.
Sessions and Tracks are the building blocks of Cloudflare’s SFU, not rooms
Once a PeerConnection is established to Cloudflare, we call this a Session. Many media Tracks or DataChannels can be published using a single Session, which returns a unique ID for each. These then can be subscribed to over any other PeerConnection anywhere around the world using the unique ID. The tracks can be published or subscribed anytime during the lifecycle of the PeerConnection.
In the background, Cloudflare takes care of scaling through a fan-out architecture with cascading trees that are unique per track. This structure works by creating a hierarchy of nodes where the root node distributes the stream to intermediate nodes, which then fan out to end-users. This significantly reduces the bandwidth required at the source and ensures scalability by distributing the load across the network. This simple but powerful architecture allows developers to build anything from 1:1 video calls to large 1:many or many:many broadcasting scenarios with Calls.
There is no “room” concept in Cloudflare Calls. Each client can add as many tracks into a PeerConnection as they’d like. The limit is the bandwidth available between Cloudflare and the client, which is practically limited by the client side every time. The signaling or the concept of a “room” is left to the application developer, who can choose to pull as many tracks as they’d like from the tracks they have pushed elsewhere into a PeerConnection. This allows developers to move participants into breakout rooms and then back into a plenary room, and then 1:1 rooms while keeping the same PeerConnection and MediaTracks active.
Cloudflare offers an unopinionated approach to bandwidth management, allowing for greater control in customizing logic to suit your business needs. There is no active bandwidth management or restriction on the number of tracks. The WebRTC Stats API provides a standardized way to access data on packet loss and possible congestion, enabling you to incorporate client-side logic based on this information. For instance, if poor Wi-Fi connectivity leads to degraded service, your front-end could inform the user through a notice and automatically reduce the number of video tracks for that client.
“NACK shield” at the edge
The Internet can’t guarantee timely and orderly delivery of packets, leading to the necessity of retransmission mechanisms, particularly in protocols like TCP. This ensures data eventually reaches its destination, despite possible delays. Real-time systems, however, need special consideration of these delays. A packet that is delayed past its deadline for rendering on the screen is worthless, but a packet that is lost can be recovered if it can be retransmitted within a very short period of time, on the order of milliseconds. This is where NACKs come to play.
A WebRTC client receiving data constantly checks for packet loss. When one or more packets don’t arrive at the expected time or a sequence number discontinuity is seen on the receiving buffer, a special NACK packet is sent back to the source in order to ask for a packet retransmission.
In a peer-to-peer topology, if it receives a NACK packet, the source of the data has to retransmit packets for every participant. When an SFU is used, the SFU could send NACKs back to source, or keep a complex buffer for each client to handle retransmissions.
This gets more complicated with Cloudflare Calls, since both the publisher and the subscriber connect to Cloudflare, likely to different servers and also probably in different locations. In addition, there is a possibility of other Cloudflare data centers in the middle, either through Argo, or just as part of scaling to many subscribers on the same track.
It is common for SFUs to backpropagate NACK packets back to the source, losing valuable time to recover packets. Calls goes beyond this and can handle NACK packets in the location closest to the user, which decreases overall latency. The latency advantage gives more chance for the packet to be recovered compared to a centralized SFU or no NACK handling at all.
Since there is possibly a number of Cloudflare data centers between clients, packet loss within the Cloudflare network is also possible. We handle this by generating NACK packets in the network. With each hop that is taken with the packets, the receiving end can generate NACK packets. These packets are then recovered or backpropagated to the publisher to be recovered.
Cloudflare Calls does TURN over Anycast too
Separately from the SFU, Calls also offers a TURN service. TURN relays act as relay points for traffic between WebRTC clients like the browser and SFUs, particularly in scenarios where direct communication is obstructed by NATs or firewalls. TURN maintains an allocation of public IP addresses and ports for each session, ensuring connectivity even in restrictive network environments.
Cloudflare Calls’ TURN service supports a few ports to help with misbehaving middleboxes and firewalls:
TURN-over-UDP over port 3748 (standard), and also port 53
TURN-over-TCP over ports 3748 and 80
TURN-over-TLS over ports 5349 and 443
TURN works the same way as Calls, available over anycast and always connecting to the closest datacenter.
Pricing and how to get started
Cloudflare Calls is now in open beta and available in your Cloudflare Dashboard. Depending on your use case, you can set up an SFU application and/or a TURN service with only a few clicks.
To kick off its open beta phase, Calls is available at no cost for a limited time. Starting May 15, 2024, customers will receive the first terabyte each month for free, with any usage beyond that charged at $0.05 per real-time gigabyte. Beta customers will be provided at least 30 days to upgrade from the free beta to a paid subscription. Additionally, there are no charges for in-bound traffic to Cloudflare. For volume pricing, talk to your account manager.
Cloudflare Calls is ideal if you are building new WebRTC apps. If you have existing SFUs or TURN infrastructure, you may still consider using Calls alongside your existing infrastructure. Building a bridge to Calls from other places is not difficult as Cloudflare Calls supports standard WebRTC APIs and acts like just another WebRTC peer.
We understand that getting started with a new platform is difficult, so we’re also open sourcing our internal video conferencing app, Orange Meets. Orange Meets supports small and large conference calls by maintaining room state in Workers Durable Objects. It has screen sharing, client-side noise-canceling, and background blur. It is written with TypeScript and React and is available on GitHub.
We’re hiring
We think the current state of Cloudflare Calls enables many use cases. Calls already supports publishing and subscribing to media tracks and DataChannels. Soon, it will support features like simulcasting.
But we’re just scratching the surface and there is so much more to build on top of this foundation.
If you are passionate about WebRTC (and other real-time protocols!!), the Media Platform team building the Calls product at Cloudflare is hiring and would love to talk to you.
The lifecycle of data often doesn’t stop immediately after upload to an R2 bucket – event data may need to be transformed and loaded into a data warehouse, media files may need to go through a post-processing step, etc. We’re releasing event notifications for R2 in open beta to enable building applications and workflows driven by your changing data.
Event notifications work by sending messages to your queue each time there is a change to your data. These messages are then received by a consumer Worker where you can then define any subsequent action that needs to be taken.
To get started enabling event notifications on your R2 bucket, you can run the following Wrangler command (replacing bucket_name and queue_name with your bucket and queue names respectively):
For more information on how to set up event notifications on your R2 buckets today and limitations during beta, please refer to the documentation.
Super Slurper for Google Cloud Storage
Super Slurper can now migrate data from Google Cloud Storage (GCS) to Cloudflare R2. We released Super Slurper last year with the goal of making one-time comprehensive data migrations fast, reliable, and easy: there’s no need to spin up migration VMs and implement complicated retry logic. Since then, thousands of developers have used Super Slurper to migrate petabytes of data from AWS S3 to R2. Now Google Cloud Storage customers can migrate data to Cloudflare R2 to benefit from Cloudflare’s zero egress fees, whether you are permanently moving data to another provider or not.
To get started migrating data from GCS:
From the Cloudflare dashboard, select R2 > Data Migration.
Select Migrate files.
Select Google Cloud Storage for the source bucket provider.
Enter your bucket name and associated credentials and select Next.
Enter your R2 bucket name and associated credentials and select Next.
After you finish reviewing the details of your migration, select Migrate files.
You can view the status of your migration job at any time on the dashboard. For more information on how to use Super Slurper, please refer to the documentation here.
Infrequent Access Private Beta
We’re excited to introduce the private beta of our new Infrequent Access storage class. For use cases that involve data that isn’t frequently accessed (long tail user-generated content, logs, etc), Infrequent Access gives you the ability to pay less for storage while maintaining performance and durability.
Here’s an example of how you can upload an object to your R2 bucket with the new Infrequent Access storage class using Workers:
In addition to uploading objects directly to Infrequent Access, you can define an object lifecycle policy to move data to Infrequent Access after a period of time goes by and you no longer need to access your data as often. In the future, we plan to automatically optimize storage classes for data so you can avoid manually creating rules and better adapt to changing data access patterns.
For data stored in the Infrequent Access storage class, the pricing components will be similar to what you’re used to with R2: storage, Class A operations (writes, lists), Class B operations (reads), and data retrieval (processing). Data retrieval is charged per GB when data in the Infrequent Access storage class is retrieved and is what allows us to provide storage at a lower price. It reflects the additional computational resources required to fetch data from underlying storage optimized for less frequent access. And when the time comes, and you do need to use your data, there are still no egress fees.
Component
Price
Storage
$0.01 / GB-month
Class A Operations
$9.00 / million requests
Class B Operations
$0.90 / million requests
Data Retrieval (Processing)
$0.01 / GB
Egress (or Data Transfer)
$0 – No Charge
Are you interested in participating in the private beta for Infrequent Access?
We would love to hear from you! To share your feedback about R2 and our data migration services, please join the Cloudflare Developer Discord. If you’re interested in learning more about R2, get started by visiting R2’s developer documentation or see how much you could save with our pricing calculator.
It’s time to ship. For us (that’s what Innovation Weeks are all about!), and also for our developers.
Shipping itself is always fun, but getting there is not always easy. Bringing something from idea to life requires many stars to align. That’s what this week is all about — helping developers, including the two million developers already building on our platform, bring their ideas to life.
The full-stack cloud
Building applications requires assembling many different components.
The frontend, the face of the application, must be intuitive, responsive, and visually appealing to engage users effectively. Behind the scenes, you need a backend to handle data processing, storage, and retrieval, ensuring smooth functionality and performance. On top of all that, in the past year AI has entered the chat, so to speak, and increasingly every application requires an element of AI, making it a crucial part of the stack.
The job of a good platform is to provide all these components, and any others you will need, to you, the developer.
Just as there’s nothing more frustrating than coming home from the grocery store and realizing you left out an ingredient, realizing a platform is missing a major component or piece of functionality is no different.
We view providing the tooling that developers need as a critical part of our job as a platform, which is why with every Developer Week, we make it our mission to provide you with more and more pieces you may need. This week is no different — you can expect us to announce more tools and primitives from the frontend to backend to AI.
However, our job doesn’t stop there. If a good platform provides the components, a great platform goes a step further than that.
The job of a great platform is not only to provide the components, but make sure they play well with each other in a way that makes your job as a developer easier. Our vision for the developer platform is exactly that: to anticipate not just the tools you need but also think about how they work with each other, and how they integrate into your development flow.
This week, you will see announcements and deep dives that expound on our vision for an integrated platform: pulling back the curtain on the way we expose services in Workers through bindings for an integrated developer experience, talking about our vision for a unified data platform, updating you on framework support, and more.
The connectivity cloud
While we’re excited for you to build on us as much as possible, we also realize that development projects are rarely greenfield. If you’ve been at this for a long time, chances are a large portion of your application already lives somewhere, whether on another cloud, or on-prem.
That’s why we’re constantly making it easier for you to connect to existing infrastructure or other providers, and working hard to make sure you can still reap the benefits of building on Cloudflare by making your application feel fast and global, regardless of where your backend is.
And vice versa, if your data is on us, but you need to access it from other providers, it’s not our job to keep it hostage in a captivity cloud by charging a tariff for egress.
The experimentation cloud
Before you start assembling components, or even coming up with a plan or a spec for it, there’s an important but overlooked step to the development process — experimentation.
Experimentation can take many forms. Experimentation can be in the form of prototyping an MVP before you spend months developing a product or a feature. If you’ve found yourself rewriting your entire personal website just to try out a new tool or framework, that’s also experimentation.
It’s easy to overlook experimentation as a part of the process, but innovation doesn’t happen without it, which is why it’s something we always want to encourage and support as a part of our platform.
That’s why offering a generous free tier is something that’s been a part of our DNA since the very beginning, and something you can expect to forever be a staple of our platform.
The demo to production cloud
Alright, you’ve got all the tools you need, you’ve had a chance to experiment, and at some point… it’s time to ship.
Shipping is exciting, but shipping is also vulnerable and scary. You’re exposing the thing you’ve been working hard on to the world to criticize. You’re exposing your code to a world of untested edge cases and abuse. You’re exposing your colleagues who are on call to the possibility of getting paged at 1 AM due to the code you released.
Of course, the wrong answer is not shipping.
The right answer is having a platform that supports you and holds your hand through the scary parts. This means a platform that can seamlessly scale from zero to sixty. A platform gives you the tools to test your code, and release it gradually to the world to help you gain confidence. Or a platform provides the observability you need when you are trying to figure out what’s gone wrong at 1 AM.
That’s why this week, you can look forward to some announcements from us that we hope will help you sleep better.
The demo to production cloud — for inference
We talked about some of the scary parts of deploying to production, and while all these apply to AI as well, building AI applications today, especially in production, presents its own unique set of challenges.
Almost every day you see a new AI demo go viral — from Sora to Devin, it’s easy and inspiring to imagine our world completely changed by AI. But if you’ve started actually playing with and implementing AI use cases, you know the harsh reality of making AI truly work. It requires a lot of trial and error to get the results you want — choosing a model, RAG, fine-tuning…
And that’s before you even go to production.
That’s when you encounter the real challenge — provisioning enough capacity to stay up, without over-provisioning and overpaying. This is the exact challenge we set out to solve from the early days of Workers — helping developers not worry about infrastructure, just the application they want to build.
With the recent rise of AI, we’ve noticed many of these challenges return. Thankfully, managing loads and infrastructure is what we’re good at here at Cloudflare. It’s what we’ve had practice at for over a decade of running our platform. It’s all just one giant scheduler.
Our vision for our AI platform is to help solve the exact challenges in deploying AI workloads that we’ve been helping developers solve for, well, any other type of workload. Whether you’re deploying directly on us with Workers AI, or another provider, we’ll help provide the tools you need to access the models you need, without overpaying for idle compute.
Don’t worry, it’s all going to be fine.
So what can you expect this week?
No one in my family can keep a secret — my sister cannot get me a birthday present without spoiling it the week before. For me, the anticipation and the look of surprise is part of the fun! My coworkers seem to have clued into this.
While I won’t give away too much, we’ve already teased out a few things last week (you can find some hints here, here and here), as well as in this blog post if you read closely (because as it turns out, I too, can’t help myself).
See you tomorrow!
Our series of announcements starts on Monday, April 1st. We look forward to sharing them with you here on our blog, and discussing them with you on Discord and X.
In the ever-evolving domain of enterprise security, CISOs and CIOs have to tirelessly build new enterprise networks and maintain old ones to achieve performant any-to-any connectivity. For their team of network architects, surveying their own environment to keep up with changing needs is half the job. The other is often unearthing new, innovative solutions which integrate seamlessly into the existing landscape. This continuous cycle of construction and fortification in the pursuit of secure, flexible infrastructure is exactly what Cloudflare’s SASE offering, Cloudflare One, was built for.
Cloudflare One has progressively evolved based on feedback from customers and analysts., Today, we are thrilled to introduce the public availability of the Cloudflare WARP Connector, a new tool that makes bidirectional, site-to-site, and mesh-like connectivity even easier to secure without the need to make any disruptive changes to existing network infrastructure.
Bridging a gap in Cloudflare’s Zero Trust story
Cloudflare’s approach has always been focused on offering a breadth of products, acknowledging that there is no one-size-fits-all solution for network connectivity. Our vision is simple: any-to-any connectivity, any way you want it.
Prior to the WARP Connector, one of the easiest ways to connect your infrastructure to Cloudflare, whether that be a local HTTP server, web services served by a Kubernetes cluster, or a private network segment, was through the Cloudflare Tunnel app connector, cloudflared. In many cases this works great, but over time customers began to surface a long tail of use cases which could not be supported based on the underlying architecture of cloudflared. This includes situations where customers utilize VOIP phones, necessitating a SIP server to establish outgoing connections to user’s softphones, or a CI/CD server sending notifications to relevant stakeholders for each stage of the CI/CD pipelines. Later in this blog post, we explore these use cases in detail.
As clouflared proxies at Layer 4 of the OSI model, its design was optimized specifically to proxy requests to origin services — it was not designed to be an active listener to handle requests from origin services. This design trade-off means that cloudflared needs to source NAT all requests it proxies to the application server. This setup is convenient for scenarios where customers don’t need to update routing tables to deploy cloudflared in front of their original services. However, it also means that customers can’t see the true source IP of the client sending the requests. This matters in scenarios where a network firewall is logging all the network traffic, as the source IP of all the requests will be cloudflared’s IP address, causing the customer to lose visibility into the true client source.
Build or borrow
To solve this problem, we identified two potential solutions: start from scratch by building a new connector, or borrow from an existing connector, likely in either cloudflared or WARP.
The following table provides an overview of the tradeoffs of the two approaches:
Features
Build in cloudflared
Borrow from WARP
Bidirectional traffic flows
As described in the earlier section, limitations of Layer 4 proxying.
This does proxying at
Layer 3, because of which it can act as default gateway for that subnet, enabling it to support traffic flows from both directions.
User experience
For Cloudflare One customers, they have to work with two distinct products (cloudflared and WARP) to connect their services and users.
For Cloudflare One customers, they just have to get familiar with a single product to connect their users as well as their networks.
Site-to-site connectivity between branches, data centers (on-premise and cloud) and headquarters.
Not recommended
For sites where running agents on each device is not feasible, this could easily connect the sites to users running WARP clients in other sites/branches/data centers. This would work seamlessly where the underlying tunnels are all the same.
Visibility into true source IP
It does source NATting.
Since it acts as the default gateway, it preserves the true source IP address for any traffic flow.
High availability
Inherently reliable by design and supports replicas for failover scenarios.
Reliability specifications are very different for a default gateway use case vs endpoint device agent. Hence, there is opportunity to innovate here.
Introducing WARP Connector
Starting today, the introduction of WARP Connector opens up new possibilities: server initiated (SIP/VOIP) flows; site-to-site connectivity, connecting branches, headquarters, and cloud platforms; and even mesh-like networking with WARP-to-WARP. Under the hood, this new connector is an extension of warp-client that can act as a virtual router for any subnet within the network to on/off-ramp traffic through Cloudflare.
By building on WARP, we were able to take advantage of its design, where it creates a virtual network interface on the host to logically subdivide the physical interface (NIC) for the purpose of routing IP traffic. This enables us to send bidirectional traffic through the WireGuard/MASQUE tunnel that’s maintained between the host and Cloudflare edge. By virtue of this architecture, customers also get the added benefit of visibility into the true source IP of the client.
WARP Connector can be easily deployed on the default gateway without any additional routing changes. Alternatively, static routes can be configured for specific CIDRs that need to be routed via WARP Connector, and the static routes can be configured on the default gateway or on every host in that subnet.
Private network use cases
Here we’ll walk through a couple of key reasons why you may want to deploy our new connector, but remember that this solution can support numerous services, such as Microsoft’s System Center Configuration Manager (SCCM), Active Directory server updates, VOIP and SIP traffic, and developer workflows with complex CI/CD pipeline interaction. It’s also important to note this connector can either be run alongside cloudflared and Magic WAN, or can be a standalone remote access and site-to-site connector to the Cloudflare Global network.
Softphone and VOIP servers
For users to establish a voice or video call over a VOIP software service, typically a SIP server within the private network brokers the connection using the last known IP address of the end-user. However, if traffic is proxied anywhere along the path, this often results in participants only receiving partial voice or data signals. With the WARP Connector, customers can now apply granular policies to these services for secure access, fortifying VOIP infrastructure within their Zero Trust framework.
Securing access to CI/CD pipeline
An organization’s DevOps ecosystem is generally built out of many parts, but a CI/CD server such as Jenkins or Teamcity is the epicenter of all development activities. Hence, securing that CI/CD server is critical. With the WARP Connector and WARP Client, organizations can secure the entire CI/CD pipeline and also streamline it easily.
Let’s look at a typical CI/CD pipeline for a Kubernetes application. The environment is set up as depicted in the diagram above, with WARP clients on the developer and QA laptops and a WARP Connector securely connecting the CI/CD server and staging servers on different networks:
Typically, the CI/CD pipeline is triggered when a developer commits their code change, invoking a webhook on the CI/CD server.
Once the images are built, it’s time to deploy the code, which is typically done in stages: test, staging and production.
Notifications are sent to the developer and QA engineer to notify them when the images are ready in the test/staging environments.
QA engineers receive the notifications via webhook from the CI/CD servers to kick-start their monitoring and troubleshooting workflow.
With WARP Connector, customers can easily connect their developers to the tools in the DevOps ecosystem by keeping the ecosystem private and not exposing it to the public. Once the DevOps ecosystem is securely connected to Cloudflare, granular security policies can be easily applied to secure access to the CI/CD pipeline.
True source IP address preservation
Organizations running Microsoft AD Servers or non-web application servers often need to identify the true source IP address for auditing or policy application. If these requirements exist, WARP Connector simplifies this, offering solutions without adding NAT boundaries. This can be useful to rate-limit unhealthy source IP addresses, for ACL-based policies within the perimeter, or to collect additional diagnostics from end-users.
Getting started with WARP Connector
As part of this launch, we’re making some changes to the Cloudflare One Dashboard to better highlight our different network on/off ramp options. As of today, a new “Network” tab will appear on your dashboard. This will be the new home for the Cloudflare Tunnel UI.
We are also introducing the new “Routes” tab next to “Tunnels”. This page will present an organizational view of customer’s virtual networks, Cloudflare Tunnels, and routes associated with them. This new page helps answer a customer’s questions pertaining to their network configurations, such as: “Which Cloudflare Tunnel has the route to my host 192.168.1.2 ” or “If a route for CIDR 192.168.2.1/28 exists, how can it be accessed” or “What are the overlapping CIDRs in my environment and which VNETs do they belong to?”. This is extremely useful for customers who have very complex enterprise networks that use the Cloudflare dashboard for troubleshooting connectivity issues.
Embarking on your WARP Connector journey is straightforward. Currently deployable on Linux hosts, users can select “create a Tunnel” and pick from either cloudflared or WARP to deploy straight from the dashboard. Follow our developer documentation to get started in a few easy steps. In the near future we will be adding support for more platforms where WARP Connectors can be deployed.
What’s next?
Thank you to all of our private beta customers for their invaluable feedback. Moving forward, our immediate focus in the coming quarters is on simplifying deployment, mirroring that of cloudflared, and enhancing high availability through redundancy and failover mechanisms.
Stay tuned for more updates as we continue our journey in innovating and enhancing the Cloudflare One platform. We’re excited to see how our customers leverage WARP Connector to transform their connectivity and security landscape.
Today, we are excited to announce beta availability of Log Explorer, which allows you to investigate your HTTP and Security Event logs directly from the Cloudflare Dashboard. Log Explorer is an extension of Security Analytics, giving you the ability to review related raw logs. You can analyze, investigate, and monitor for security attacks natively within the Cloudflare Dashboard, reducing time to resolution and overall cost of ownership by eliminating the need to forward logs to third party security analysis tools.
Background
Security Analytics enables you to analyze all of your HTTP traffic in one place, giving you the security lens you need to identify and act upon what matters most: potentially malicious traffic that has not been mitigated. Security Analytics includes built-in views such as top statistics and in-context quick filters on an intuitive page layout that enables rapid exploration and validation.
In order to power our rich analytics dashboards with fast query performance, we implemented data sampling using Adaptive Bit Rate (ABR) analytics. This is a great fit for providing high level aggregate views of the data. However, we received feedback from many Security Analytics power users that sometimes they need access to a more granular view of the data — they need logs.
Logs provide critical visibility into the operations of today’s computer systems. Engineers and SOC analysts rely on logs every day to troubleshoot issues, identify and investigate security incidents, and tune the performance, reliability, and security of their applications and infrastructure. Traditional metrics or monitoring solutions provide aggregated or statistical data that can be used to identify trends. Metrics are wonderful at identifying THAT an issue happened, but lack the detailed events to help engineers uncover WHY it happened. Engineers and SOC Analysts rely on raw log data to answer questions such as:
What is causing this increase in 403 errors?
What data was accessed by this IP address?
What was the user experience of this particular user’s session?
Traditionally, these engineers and analysts would stand up a collection of various monitoring tools in order to capture logs and get this visibility. With more organizations using multiple clouds, or a hybrid environment with both cloud and on-premise tools and architecture, it is crucial to have a unified platform to regain visibility into this increasingly complex environment. As more and more companies are moving towards a cloud native architecture, we see Cloudflare’s connectivity cloud as an integral part of their performance and security strategy.
Log Explorer provides a lower cost option for storing and exploring log data within Cloudflare. Until today, we have offered the ability to export logs to expensive third party tools, and now with Log Explorer, you can quickly and easily explore your log data without leaving the Cloudflare Dashboard.
Log Explorer Features
Whether you’re a SOC Engineer investigating potential incidents, or a Compliance Officer with specific log retention requirements, Log Explorer has you covered. It stores your Cloudflare logs for an uncapped and customizable period of time, making them accessible natively within the Cloudflare Dashboard. The supported features include:
Searching through your HTTP Request or Security Event logs
Filtering based on any field and a number of standard operators
Switching between basic filter mode or SQL query interface
Selecting fields to display
Viewing log events in tabular format
Finding the HTTP request records associated with a Ray ID
Narrow in on unmitigated traffic
As a SOC analyst, your job is to monitor and respond to threats and incidents within your organization’s network. Using Security Analytics, and now with Log Explorer, you can identify anomalies and conduct a forensic investigation all in one place.
Let’s walk through an example to see this in action:
On the Security Analytics dashboard, you can see in the Insights panel that there is some traffic that has been tagged as a likely attack, but not mitigated.
Clicking the filter button narrows in on these requests for further investigation.
In the sampled logs view, you can see that most of these requests are coming from a common client IP address.
You can also see that Cloudflare has flagged all of these requests as bot traffic. With this information, you can craft a WAF rule to either block all traffic from this IP address, or block all traffic with a bot score lower than 10.
Let’s say that the Compliance Team would like to gather documentation on the scope and impact of this attack. We can dig further into the logs during this time period to see everything that this attacker attempted to access.
First, we can use Log Explorer to query HTTP requests from the suspect IP address during the time range of the spike seen in Security Analytics.
We can also review whether the attacker was able to exfiltrate data by adding the OriginResponseBytes field and updating the query to show requests with OriginResponseBytes > 0. The results show that no data was exfiltrated.
Find and investigate false positives
With access to the full logs via Log Explorer, you can now perform a search to find specific requests.
A 403 error occurs when a user’s request to a particular site is blocked. Cloudflare’s security products use things like IP reputation and WAF attack scores based on ML technologies in order to assess whether a given HTTP request is malicious. This is extremely effective, but sometimes requests are mistakenly flagged as malicious and blocked.
In these situations, we can now use Log Explorer to identify these requests and why they were blocked, and then adjust the relevant WAF rules accordingly.
Or, if you are interested in tracking down a specific request by Ray ID, an identifier given to every request that goes through Cloudflare, you can do that via Log Explorer with one query.
Note that the LIMIT clause is included in the query by default, but has no impact on RayID queries as RayID is unique and only one record would be returned when using the RayID filter field.
How we built Log Explorer
With Log Explorer, we have built a long-term, append-only log storage platform on top of Cloudflare R2. Log Explorer leverages the Delta Lake protocol, an open-source storage framework for building highly performant, ACID-compliant databases atop a cloud object store. In other words, Log Explorer combines a large and cost-effective storage system – Cloudflare R2 – with the benefits of strong consistency and high performance. Additionally, Log Explorer gives you a SQL interface to your Cloudflare logs.
Each Log Explorer dataset is stored on a per-customer level, just like Cloudflare D1, so that your data isn’t placed with that of other customers. In the future, this single-tenant storage model will give you the flexibility to create your own retention policies and decide in which regions you want to store your data.
Under the hood, the datasets for each customer are stored as Delta tables in R2 buckets. A Delta table is a storage format that organizes Apache Parquet objects into directories using Hive’s partitioning naming convention. Crucially, Delta tables pair these storage objects with an append-only, checkpointed transaction log. This design allows Log Explorer to support multiple writers with optimistic concurrency.
Many of the products Cloudflare builds are a direct result of the challenges our own team is looking to address. Log Explorer is a perfect example of this culture of dogfooding. Optimistic concurrent writes require atomic updates in the underlying object store, and as a result of our needs, R2 added a PutIfAbsent operation with strong consistency. Thanks, R2! The atomic operation sets Log Explorer apart from Delta Lake solutions based on Amazon Web Services’ S3, which incur the operational burden of using an external store for synchronizing writes.
Log Explorer is written in the Rust programming language using open-source libraries, such as delta-rs, a native Rust implementation of the Delta Lake protocol, and Apache Arrow DataFusion, a very fast, extensible query engine. At Cloudflare, Rust has emerged as a popular choice for new product development due to its safety and performance benefits.
What’s next
We know that application security logs are only part of the puzzle in understanding what’s going on in your environment. Stay tuned for future developments including tighter, more seamless integration between Analytics and Log Explorer, the addition of more datasets including Zero Trust logs, the ability to define custom retention periods, and integrated custom alerting.
Please use the feedback link to let us know how Log Explorer is working for you and what else would help make your job easier.
How to get it
We’d love to hear from you! Let us know if you are interested in joining our Beta program by completing this form and a member of our team will contact you.
Pricing will be finalized prior to a General Availability (GA) launch.
Tune in for more news, announcements and thought-provoking discussions! Don’t miss the full Security Week hub page.
File upload is a common feature in many web applications. Applications may allow users to upload files like images of flood damage to file an insurance claim, PDFs like resumes or cover letters to apply for a job, or other documents like receipts or income statements. However, beneath the convenience lies a potential threat, since allowing unrestricted file uploads can expose the web server and your enterprise network to significant risks related to security, privacy, and compliance.
Cloudflare recently introduced WAF Content Scanning, our in-line malware file detection and prevention solution to stop malicious files from reaching the web server, offering our Enterprise WAF customers an additional line of defense against security threats.
Today, we’re pleased to announce that the feature is now generally available. It will be automatically rolled out to existing WAF Content Scanning customers before the end of March 2024.
In this blog post we will share more details about the new version of the feature, what we have improved, and reveal some of the technical challenges we faced while building it. This feature is available to Enterprise WAF customers as an add-on license, contact your account team to get it.
What to expect from the new version?
The feedback from the early access version has resulted in additional improvements. The main one is expanding the maximum size of scanned files from 1 MB to 15 MB. This change required a complete redesign of the solution’s architecture and implementation. Additionally, we are improving the dashboard visibility and the overall analytics experience.
Let’s quickly review how malware scanning operates within our WAF.
Behind the scenes
WAF Content Scanning operates in a few stages: users activate and configure it, then the scanning engine detects which requests contain files, the files are sent to the scanner returning the scan result fields, and finally users can build custom rules with these fields. We will dig deeper into each step in this section.
Activate and configure
Customers can enable the feature via the API, or through the Settings page in the dashboard (Security → Settings) where a new section has been added for incoming traffic detection configuration and enablement. As soon as this action is taken, the enablement action gets distributed to the Cloudflare network and begins scanning incoming traffic.
Customers can also add a custom configuration depending on the file upload method, such as a base64 encoded file in a JSON string, which allows the specified file to be parsed and scanned automatically.
In the example below, the customer wants us to look at JSON bodies for the key “file” and scan them.
As soon as the feature is activated and configured, the scanning engine runs the pre-scanning logic, and identifies content automatically via heuristics. In this case, the engine logic does not rely on the Content-Type header, as it’s easy for attackers to manipulate. When relevant content or a file has been found, the engine connects to the antivirus (AV) scanner in our Zero Trust solution to perform a thorough analysis and return the results of the scan. The engine uses the scan results to propagate useful fields that customers can use.
Integrate with WAF
For every request where a file is found, the scanning engine returns various fields, including:
The scanning engine integrates with the WAF where customers can use those fields to create custom WAF rules to address various use cases. The basic use case is primarily blocking malicious files from reaching the web server. However, customers can construct more complex logic, such as enforcing constraints on parameters such as file sizes, file types, endpoints, or specific paths.
In-line scanning limitations and file types
One question that often comes up is about the file types we detect and scan in WAF Content Scanning. Initially, addressing this query posed a challenge since HTTP requests do not have a definition of a “file”, and scanning all incoming HTTP requests does not make sense as it adds extra processing and latency. So, we had to decide on a definition to spot HTTP requests that include files, or as we call it, “uploaded content”.
The WAF Content Scanning engine makes that decision by filtering out certain content types identified by heuristics. Any content types not included in a predefined list, such as text/html, text/x-shellscript, application/json, and text/xml, are considered uploaded content and are sent to the scanner for examination. This allows us to scan a wide range of content types and file types without affecting the performance of all requests by adding extra processing. The wide range of files we scan includes:
Executable (e.g., .exe, .bat, .dll, .wasm)
Documents (e.g., .doc, .docx, .pdf, .ppt, .xls)
Compressed (e.g., .7z, .gz, .zip, .rar)
Image (e.g., .jpg, .png, .gif, .webp, .tif)
Video and audio files within the 15 MB file size range.
The file size scanning limit of 15 Megabytes comes from the fact that the in-line file scanning as a feature is running in real time, which offers safety to the web server and instant access to clean files, but also impacts the whole request delivery process. Therefore, it’s crucial to scan the payload without causing significant delays or interruptions; namely increased CPU time and latency.
Scaling the scanning process to 15 MB
In the early design of the product, we built a system that could handle requests with a maximum body size of 1 MB, and increasing the limit to 15 MB had to happen without adding any extra latency. As mentioned, this latency is not added to all requests, but only to the requests that have uploaded content. However, increasing the size with the same design would have increased the latency by 15x for those requests.
In this section, we discuss how we previously managed scanning files embedded in JSON request bodies within the former architecture as an example, and why it was challenging to expand the file size using the same design, then compare the same example with the changes made in the new release to overcome the extra latency in details.
Old architecture used for the Early Access release
In order for customers to use the content scanning functionality in scanning files embedded in JSON request bodies, they had to configure a rule like:
lookup_json_string(http.request.body.raw, “file”)
This means we should look in the request body but only for the “file” key, which in the image below contains a base64 encoded string for an image.
When the request hits our Front Line (FL) NGINX proxy, we buffer the request body. This will be in an in-memory buffer, or written to a temporary file if the size of the request body exceeds the NGINX configuration of client_body_buffer_size. Then, our WAF engine executes the lookup_json_string function and returns the base64 string which is the content of the file key. The base64 string gets sent via Unix Domain Sockets to our malware scanner, which does MIME type detection and returns a verdict to the file upload scanning module.
This architecture had a bottleneck that made it hard to expand on: the expensive latency fees we had to pay. The request body is first buffered in NGINX and then copied into our WAF engine, where rules are executed. The malware scanner will then receive the execution result — which, in the worst scenario, is the entire request body — over a Unix domain socket. This indicates that once NGINX buffers the request body, we send and buffer it in two other services.
New architecture for the General Availability release
In the new design, the requirements were to scan larger files (15x larger) while not compromising on performance. To achieve this, we decided to bypass our WAF engine, which is where we introduced the most latency.
In the new architecture, we made the malware scanner aware of what is needed to execute the rule, hence bypassing the Ruleset Engine (RE). For example, the configuration “lookup_json_string(http.request.body.raw, “file”)”, will be represented roughly as:
{
   Function: lookup_json_string
   Args: [“file”]
}
This is achieved by walking the Abstract Syntax Tree (AST) when the rule is configured, and deploying the sample struct above to our global network. The struct’s values will be read by the malware scanner, and rule execution and malware detection will happen within the same service. This means we don’t need to read the request body, execute the rule in the Ruleset Engine (RE) module, and then send the results over to the malware scanner.
The malware scanner will now read the request body from the temporary file directly, perform the rule execution, and return the verdict to the file upload scanning module.
The file upload scanning module populates these fields, so they can be used to write custom rules and take actions. For example:
This module also enriches our logging pipelines with these fields, which can then be read in Log Push, Edge Log Delivery, Security Analytics, and Firewall Events in the dashboard. For example, this is the security log in the Cloudflare dashboard (Security → Analytics) for a web request that triggered WAF Content Scanning:
WAF content scanning detection visibility
Using the concept of incoming traffic detection, WAF Content Scanning enables users to identify hidden risks through their traffic signals in the analytics before blocking or mitigating matching requests. This reduces false positives and permits security teams to make decisions based on well-informed data. Actually, this isn’t the only instance in which we apply this idea, as we also do it for a number of other products, like WAF Attack Score and Bot Management.
We have integrated helpful information into our security products, like Security Analytics, to provide this data visibility. The Content Scanning tab, located on the right sidebar, displays traffic patterns even if there were no WAF rules in place. The same data is also reflected in the sampled requests, and you can create new rules from the same view.
On the other hand, if you want to fine-tune your security settings, you will see better visibility in Security Events, where these are the requests that match specific rules you have created in WAF.
Last but not least, in our Logpush datastream, we have included the scan fields that can be selected to send to any external log handler.
What’s next?
Before the end of March 2024, all current and new customers who have enabled WAF Content Scanning will be able to scan uploaded files up to 15 MB. Next, we’ll focus on improving how we handle files in the rules, including adding a dynamic header functionality. Quarantining files is also another important feature we will be adding in the future. If you’re an Enterprise customer, reach out to your account team for more information and to get access.
Cookies are small files of information that a web server generates and sends to a web browser. For example, a cookie stored in your browser will let a website know that you are already logged in, so instead of showing you a login page, you would be taken to your account page welcoming you back.
Though cookies are very useful, they are also used for tracking and advertising, sometimes with repercussions for user privacy. Cookies are a core tool, for example, for all advertising networks. To protect users, privacy laws may require website owners to clearly specify what cookies are being used and for what purposes, and, in many cases, to obtain a user’s consent before storing those cookies in the user’s browser. A key example of this is the ePrivacy Directive.
Herein lies the problem: often website administrators, developers, or compliance team members don’t know what cookies are being used by their website. A common approach for gaining a better understanding of cookie usage is to set up a scanner bot that crawls through each page, collecting cookies along the way. However, many websites requiring authentication or additional security measures do not allow for these scans, or require custom security settings to allow the scanner bot access.
To address these issues, we developed Page Shield Cookie Monitor, which provides a full single dashboard view of all first-party cookies being used by your websites. Over the next few weeks, we are rolling out Page Shield Cookie Monitor to all paid plans, no configuration or scanners required if Page Shield is enabled.
HTTP cookies
HTTP cookies are designed to allow persistence for the stateless HTTP protocol. A basic example of cookie usage is to identify a logged-in user. The browser submits the cookie back to the website whenever you access it again, letting the website know who you are, providing you a customized experience. Cookies are implemented as HTTP headers.
Cookies can be classified as first-party or third-party.
First-party cookies are normally set by the website owner1, and are used to track state against the given website. The logged in example above falls into this category. First party cookies are normally restricted and sent to the given website only and won’t be visible by other sites.
Third-party cookies, on the other hand, are often set by large advertising networks, social networks, or other large organizations that want to track user journeys across the web (across domains). For example, some websites load advertisement objects from a different domain that may set a third-party cookie associated with that advertising network.
Cookies are used for tracking
Growing concerns around user privacy has led browsers to start blocking third-party cookies by default. Led by Firefox and Safari a few years back, Google Chrome, which currently has the largest browser market share, and whose parent company owns Google Ads, the dominant advertising network, started restricting third-party cookies beginning in January of this year.
However, this does not mean the end of tracking users for advertising purposes; the technology has advanced allowing tracking to continue based on first-party cookies. Facebook Pixel, for example, started offering to set first-party cookies alongside third-party cookies in 2018 when being embedded in a website, in order “to be more accurate in measurement and reporting”.
Scanning for cookies?
To inventory all the cookies used when your website is accessed, you can open up any modern browser’s developer console and review which cookie is being set and sent back per HTTP request. However, collecting cookies with this approach won’t be practical unless your website is rather static, containing few external snippets.
Screen capture of Chrome’s developer console listing cookies being set and sent back when visiting a website.
To resolve this, a cookie scanner can be used to automate cookie collection. Depending on your security setup, additional configurations are sometimes required in order to let the scanner bots pass through protection and/or authentication. This may open up a potential attack surface, which isn’t ideal.
Introducing Page Shield Cookie Monitor
With Page Shield enabled, all the first-party cookies, whether set by your website or by external snippets, are collected and displayed in one place, no scanner required. With the click of a button, the full list can be exported in CSV format for further inventory processing.
If you run multiple websites like a marketing website and an admin console that require different cookie strategies, you can simply filter the list based on either domain or path, under the same view. This includes the websites that require authentication such as the admin console.
Dashboard showing a table of cookies seen, including key details such as cookie name, domain and path, and which host set the cookie.
To examine a particular cookie, clicking on its name takes you to a dedicated page that includes all the cookie attributes. Furthermore, similar to Script Monitor and Connection Monitor, we collect the first seen and last seen time and pages for easier tracking of your website’s behavior.
Detailed view of a captured cookie in the dashboard, including all cookie attributes as well as under which host and path this cookie has been set.
Last but not least, we are adding one more alert type specifically for newly seen cookies. When subscribed to this alert, we will notify you through either email or webhook as soon as a new cookie is detected with all the details mentioned above. This allows you to trigger any workflow required, such as inventorying this new cookie for compliance.
How Cookie Monitor works
Let’s imagine you run an e-commerce website example.com. When a user logs in to view their ongoing orders, your website would send a header with key Set-Cookie, and value to identify each user’s login activity:
login_id=ABC123; Domain=.example.com
To analyze visitor behaviors, you make use of Google Analytics that requires embedding a code snippet in all web pages. This snippet will set two more cookies after the pages are loaded in the browser:
_ga=GA1.2; Domain=.example.com;
_ga_ABC=GS1.3; Domain=.example.com;
As these two cookies from Google Analytics are considered first-party given their domain attribute, they are automatically included together with the logged-in cookie sent back to your website. The final cookie sent back for a logged-in user would be Cookie: login_id=ABC123; _ga=GA1.2; _ga_ABC=GS1.3 with three cookies concatenated into one string, even though only one of them is directly consumed by your website.
If your website happens to be proxied through Cloudflare already, we will observe oneSet-Cookie header with cookie name of login_id during response, while receiving three cookies back: login_id, _ga, and _ga_ABC. Comparing one cookie set with three returned cookies, the overlapping login_id cookie is then tagged as set by your website directly. The same principle applies to all the requests passing through Cloudflare, allowing us to build an overview of all the first-party cookies used by your websites.
All cookies in one jar
Inventorying all cookies set through using your websites is a first step towards protecting your users’ privacy, and Page Shield makes this step just one click away. Sign up now to be notified when Page Shield Cookie Monitor becomes available!
…
1Technically, a first-party cookie is a cookie scoped to the given domain only (so not cross domain). Such a cookie can also be set by a third party snippet used by the website to the given domain.
Today we are excited to announce Magic Cloud Networking, supercharged by Cloudflare’s recent acquisition of Nefeli Networks’ innovative technology. These new capabilities to visualize and automate cloud networks will give our customers secure, easy, and seamless connection to public cloud environments.
Public clouds offer organizations a scalable and on-demand IT infrastructure without the overhead and expense of running their own datacenter. Cloud networking is foundational to applications that have been migrated to the cloud, but is difficult to manage without automation software, especially when operating at scale across multiple cloud accounts. Magic Cloud Networking uses familiar concepts to provide a single interface that controls and unifies multiple cloud providers’ native network capabilities to create reliable, cost-effective, and secure cloud networks.
Nefeli’s approach to multi-cloud networking solves the problem of building and operating end-to-end networks within and across public clouds, allowing organizations to securely leverage applications spanning any combination of internal and external resources. Adding Nefeli’s technology will make it easier than ever for our customers to connect and protect their users, private networks and applications.
Why is cloud networking difficult?
Compared with a traditional on-premises data center network, cloud networking promises simplicity:
Much of the complexity of physical networking is abstracted away from users because the physical and ethernet layers are not part of the network service exposed by the cloud provider.
There are fewer control plane protocols; instead, the cloud providers deliver a simplified software-defined network (SDN) that is fully programmable via API.
There is capacity — from zero up to very large — available instantly and on-demand, only charging for what you use.
However, that promise has not yet been fully realized. Our customers have described several reasons cloud networking is difficult:
Poor end-to-end visibility: Cloud network visibility tools are difficult to use and silos exist even within single cloud providers that impede end-to-end monitoring and troubleshooting.
Faster pace: Traditional IT management approaches clash with the promise of the cloud: instant deployment available on-demand. Familiar ClickOps and CLI-driven procedures must be replaced by automation to meet the needs of the business.
Different technology: Established network architectures in on-premises environments do not seamlessly transition to a public cloud. The missing ethernet layer and advanced control plane protocols were critical in many network designs.
New cost models: The dynamic pay-as-you-go usage-based cost models of the public clouds are not compatible with established approaches built around fixed cost circuits and 5-year depreciation. Network solutions are often architected with financial constraints, and accordingly, different architectural approaches are sensible in the cloud.
New security risks: Securing public clouds with true zero trust and least-privilege demands mature operating processes and automation, and familiarity with cloud-specific policies and IAM controls.
Multi-vendor: Oftentimes enterprise networks have used single-vendor sourcing to facilitate interoperability, operational efficiency, and targeted hiring and training. Operating a network that extends beyond a single cloud, into other clouds or on-premises environments, is a multi-vendor scenario.
Nefeli considered all these problems and the tensions between different customer perspectives to identify where the problem should be solved.
Trains, planes, and automation
Consider a train system. To operate effectively it has three key layers:
tracks and trains
electronic signals
a company to manage the system and sell tickets.
A train system with good tracks, trains, and signals could still be operating below its full potential because its agents are unable to keep up with passenger demand. The result is that passengers cannot plan itineraries or purchase tickets.
The train company eliminates bottlenecks in process flow by simplifying the schedules, simplifying the pricing, providing agents with better booking systems, and installing automated ticket machines. Now the same fast and reliable infrastructure of tracks, trains, and signals can be used to its full potential.
Solve the right problem
In networking, there are an analogous set of three layers, called the networking planes:
Data Plane: the network paths that transport data (in the form of packets) from source to destination.
Control Plane: protocols and logic that change how packets are steered across the data plane.
Management Plane: the configuration and monitoring interfaces for the data plane and control plane.
In public cloud networks, these layers map to:
Cloud Data Plane: The underlying cables and devices are exposed to users as the Virtual Private Cloud (VPC) or Virtual Network (VNet) service that includes subnets, routing tables, security groups/ACLs and additional services such as load-balancers and VPN gateways.
Cloud Control Plane: In place of distributed protocols, the cloud control plane is a software defined network (SDN) that, for example, programs static route tables. (There is limited use of traditional control plane protocols, such as BGP to interface with external networks and ARP to interface with VMs.)
Cloud Management Plane: An administrative interface with a UI and API which allows the admin to fully configure the data and control planes. It also provides a variety of monitoring and logging capabilities that can be enabled and integrated with 3rd party systems.
Like our train example, most of the problems that our customers experience with cloud networking are in the third layer: the management plane.
Nefeli simplifies, unifies, and automates cloud network management and operations.
Avoid cost and complexity
One common approach to tackle management problems in cloud networks is introducing Virtual Network Functions (VNFs), which are virtual machines (VMs) that do packet forwarding, in place of native cloud data plane constructs. Some VNFs are routers, firewalls, or load-balancers ported from a traditional network vendor’s hardware appliances, while others are software-based proxies often built on open-source projects like NGINX or Envoy. Because VNFs mimic their physical counterparts, IT teams could continue using familiar management tooling, but VNFs have downsides:
VMs do not have custom network silicon and so instead rely on raw compute power. The VM is sized for the peak anticipated load and then typically runs 24x7x365. This drives a high cost of compute regardless of the actual utilization.
High-availability (HA) relies on fragile, costly, and complex network configuration.
Service insertion — the configuration to put a VNF into the packet flow — often forces packet paths that incur additional bandwidth charges.
VNFs are typically licensed similarly to their on-premises counterparts and are expensive.
VNFs lock in the enterprise and potentially exclude them benefitting from improvements in the cloud’s native data plane offerings.
For these reasons, enterprises are turning away from VNF-based solutions and increasingly looking to rely on the native network capabilities of their cloud service providers. The built-in public cloud networking is elastic, performant, robust, and priced on usage, with high-availability options integrated and backed by the cloud provider’s service level agreement.
In our train example, the tracks and trains are good. Likewise, the cloud network data plane is highly capable. Changing the data plane to solve management plane problems is the wrong approach. To make this work at scale, organizations need a solution that works together with the native network capabilities of cloud service providers.
Nefeli leverages native cloud data plane constructs rather than third party VNFs.
Introducing Magic Cloud Networking
The Nefeli team has joined Cloudflare to integrate cloud network management functionality with Cloudflare One. This capability is called Magic Cloud Networking and with it, enterprises can use the Cloudflare dashboard and API to manage their public cloud networks and connect with Cloudflare One.
End-to-end
Just as train providers are focused only on completing train journeys in their own network, cloud service providers deliver network connectivity and tools within a single cloud account. Many large enterprises have hundreds of cloud accounts across multiple cloud providers. In an end-to-end network this creates disconnected networking silos which introduce operational inefficiencies and risk.
Imagine you are trying to organize a train journey across Europe, and no single train company serves both your origin and destination. You know they all offer the same basic service: a seat on a train. However, your trip is difficult to arrange because it involves multiple trains operated by different companies with their own schedules and ticketing rates, all in different languages!
Magic Cloud Networking is like an online travel agent that aggregates multiple transportation options, books multiple tickets, facilitates changes after booking, and then delivers travel status updates.
Through the Cloudflare dashboard, you can discover all of your network resources across accounts and cloud providers and visualize your end-to-end network in a single interface. Once Magic Cloud Networking discovers your networks, you can build a scalable network through a fully automated and simple workflow.
Resource inventory shows all configuration in a single and responsive UI
Taming per-cloud complexity
Public clouds are used to deliver applications and services. Each cloud provider offers a composable stack of modular building blocks (resources) that start with the foundation of a billing account and then add on security controls. The next foundational layer, for server-based applications, is VPC networking. Additional resources are built on the VPC network foundation until you have compute, storage, and network infrastructure to host the enterprise application and data. Even relatively simple architectures can be composed of hundreds of resources.
The trouble is, these resources expose abstractions that are different from the building blocks you would use to build a service on prem, the abstractions differ between cloud providers, and they form a web of dependencies with complex rules about how configuration changes are made (rules which differ between resource types and cloud providers). For example, say I create 100 VMs, and connect them to an IP network. Can I make changes to the IP network while the VMs are using the network? The answer: it depends.
Magic Cloud Networking handles these differences and complexities for you. It configures native cloud constructs such as VPN gateways, routes, and security groups to securely connect your cloud VPC network to Cloudflare One without having to learn each cloud’s incantations for creating VPN connections and hubs.
Continuous, coordinated automation
Returning to our train system example, what if the railway maintenance staff find a dangerous fault on the railroad track? They manually set the signal to a stop light to prevent any oncoming trains using the faulty section of track. Then, what if, by unfortunate coincidence, the scheduling office is changing the signal schedule, and they set the signals remotely which clears the safety measure made by the maintenance crew? Now there is a problem that no one knows about and the root cause is that multiple authorities can change the signals via different interfaces without coordination.
The same problem exists in cloud networks: configuration changes are made by different teams using different automation and configuration interfaces across a spectrum of roles such as billing, support, security, networking, firewalls, database, and application development.
Once your network is deployed, Magic Cloud Networking monitors its configuration and health, enabling you to be confident that the security and connectivity you put in place yesterday is still in place today. It tracks the cloud resources it is responsible for, automatically reverting drift if they are changed out-of-band, while allowing you to manage other resources, like storage buckets and application servers, with other automation tools. And, as you change your network, Cloudflare takes care of route management, injecting and withdrawing routes globally across Cloudflare and all connected cloud provider networks.
Magic Cloud Networking is fully programmable via API, and can be integrated into existing automation toolchains.
The interface warns when cloud network infrastructure drifts from intent
Ready to start conquering cloud networking?
We are thrilled to introduce Magic Cloud Networking as another pivotal step to fulfilling the promise of the Connectivity Cloud. This marks our initial stride in empowering customers to seamlessly integrate Cloudflare with their public clouds to get securely connected, stay securely connected, and gain flexibility and cost savings as they go.
Join us on this journey for early access: learn more and sign up here.
We’re excited to announce the largest update to Cloudflare Network Interconnect (CNI) since its launch, and because we’re making CNIs faster and easier to deploy, we’re calling this Express CNI. At the most basic level, CNI is a cable between a customer’s network router and Cloudflare, which facilitates the direct exchange of information between networks instead of via the Internet. CNIs are fast, secure, and reliable, and have connected customer networks directly to Cloudflare for years. We’ve been listening to how we can improve the CNI experience, and today we are sharing more information about how we’re making it faster and easier to order CNIs, and connect them to Magic Transit and Magic WAN.
Interconnection services and what to consider
Interconnection services provide a private connection that allows you to connect your networks to other networks like the Internet, cloud service providers, and other businesses directly. This private connection benefits from improved connectivity versus going over the Internet and reduced exposure to common threats like Distributed Denial of Service (DDoS) attacks.
Cost is an important consideration when evaluating any vendor for interconnection services. The cost of an interconnection is typically comprised of a fixed port fee, based on the capacity (speed) of the port, and the variable amount of data transferred. Some cloud providers also add complex inter-region bandwidth charges.
Other important considerations include the following:
How much capacity is needed?
Are there variable or fixed costs associated with the port?
Is the provider located in the same colocation facility as my business?
Are they able to scale with my network infrastructure?
Are you able to predict your costs without any unwanted surprises?
What additional products and services does the vendor offer?
Cloudflare does not charge a port fee for Cloudflare Network Interconnect, nor do we charge for inter-region bandwidth. Using CNI with products like Magic Transit and Magic WAN may even reduce bandwidth spending with Internet service providers. For example, you can deliver Magic Transit-cleaned traffic to your data center with a CNI instead of via your Internet connection, reducing the amount of bandwidth that you would pay an Internet service provider for.
To underscore the value of CNI, one vendor charges nearly \$20,000 a year for a 10 Gigabit per second (Gbps) direct connect port. The same 10 Gbps CNI on Cloudflare for one year is $0. Their cost also does not include any costs related to the amount of data transferred between different regions or geographies, or outside of their cloud. We have never charged for CNIs, and are committed to making it even easier for customers to connect to Cloudflare, and destinations beyond on the open Internet.
3 Minute Provisioning
Our first big announcement is a new, faster approach to CNI provisioning and deployment. Starting today, all Magic Transit and Magic WAN customers can order CNIs directly from their Cloudflare account. The entire process is about 3 clicks and takes less than 3 minutes (roughly the time to make coffee). We’re going to show you how simple it is to order a CNI.
The first step is to find out whether Cloudflare is in the same data center or colocation facility as your routers, servers, and network hardware. Let’s navigate to the new “Interconnects” section of the Cloudflare dashboard, and order a new Direct CNI.
Search for the city of your data center, and quickly find out if Cloudflare is in the same facility. I’m going to stand up a CNI to connect my example network located in Ashburn, VA.
It looks like Cloudflare is in the same facility as my network, so I’m going to select the location where I’d like to connect.
As of right now, my data center is only exchanging a few hundred Megabits per second of traffic on Magic Transit, so I’m going to select a 1 Gigabit per second interface, which is the smallest port speed available. I can also order a 10 Gbps link if I have more than 1 Gbps of traffic in a single location. Cloudflare also supports 100 Gbps CNIs, but if you have this much traffic to exchange with us, we recommend that you coordinate with your account team.
After selecting your preferred port speed, you can name your CNI, which will be referenceable later when you direct your Magic Transit or Magic WAN traffic to the interconnect. We are given the opportunity to verify that everything looks correct before confirming our CNI order.
Once we click the “Confirm Order” button, Cloudflare will provision an interface on our router for your CNI, and also assign IP addresses for you to configure on your router interface. Cloudflare will also issue you a Letter of Authorization (LOA) for you to order a cross connect with the local facility. Cloudflare will provision a port on our router for your CNI within 3 minutes of your order, and you will be able to ping across the CNI as soon as the interface line status comes up.
After downloading the Letter of Authorization (LOA) to order a cross connect, we’ll navigate back to our Interconnects area. Here we can see the point to point IP addressing, and the CNI name that is used in our Magic Transit or Magic WAN configuration. We can also redownload the LOA if needed.
Simplified Magic Transit and Magic WAN onboarding
Our second major announcement is that Express CNI dramatically simplifies how Magic Transit and Magic WAN customers connect to Cloudflare. Getting packets into Magic Transit or Magic WAN in the past with a CNI required customers to configure a GRE (Generic Routing Encapsulation) tunnel on their router. These configurations are complex, and not all routers and switches support these changes. Since both Magic Transit and Magic WAN protect networks, and operate at the network layer on packets, customers rightly asked us, “If I connect directly to Cloudflare with CNI, why do I also need a GRE tunnel for Magic Transit and Magic WAN?”
Starting today, GRE tunnels are no longer required with Express CNI. This means that Cloudflare supports standard 1500-byte packets on the CNI, and there’s no need for complex GRE or MSS adjustment configurations to get traffic into Magic Transit or Magic WAN. This significantly reduces the amount of configuration required on a router for Magic Transit and Magic WAN customers who can connect over Express CNI. If you’re not familiar with Magic Transit, the key takeaway is that we’ve reduced the complexity of changes you must make on your router to protect your network with Cloudflare.
What’s next for CNI?
We’re excited about how Express CNI simplifies connecting to Cloudflare’s network. Some customers connect to Cloudflare through our Interconnection Platform Partners, like Equinix and Megaport, and we plan to bring the Express CNI features to our partners too.
We have upgraded a number of our data centers to support Express CNI, and plan to upgrade many more over the next few months. We are rapidly expanding the number of global locations that support Express CNI as we install new network hardware. If you’re interested in connecting to Cloudflare with Express CNI, but are unable to find your data center, please let your account team know.
If you’re on an existing classic CNI today, and you don’t need Express CNI features, there is no obligation to migrate to Express CNI. Magic Transit and Magic WAN customers have been asking for BGP support to control how Cloudflare routes traffic back to their networks, and we expect to extend BGP support to Express CNI first, so keep an eye out for more Express CNI announcements later this year.
Get started with Express CNI today
As we’ve demonstrated above, Express CNI makes it fast and easy to connect your network to Cloudflare. If you’re a Magic Transit or Magic WAN customer, the new “Interconnects” area is now available on your Cloudflare dashboard. To deploy your first CNI, you can follow along with the screenshots above, or refer to our updated interconnects documentation.
In June 2023, we told you that we were building a new protocol, MASQUE, into WARP. MASQUE is a fascinating protocol that extends the capabilities of HTTP/3 and leverages the unique properties of the QUIC transport protocol to efficiently proxy IP and UDP traffic without sacrificing performance or privacy
At the same time, we’ve seen a rising demand from Zero Trust customers for features and solutions that only MASQUE can deliver. All customers want WARP traffic to look like HTTPS to avoid detection and blocking by firewalls, while a significant number of customers also require FIPS-compliant encryption. We have something good here, and it’s been proven elsewhere (more on that below), so we are building MASQUE into Zero Trust WARP and will be making it available to all of our Zero Trust customers — at WARP speed!
This blog post highlights some of the key benefits our Cloudflare One customers will realize with MASQUE.
Before the MASQUE
Cloudflare is on a mission to help build a better Internet. And it is a journey we’ve been on with our device client and WARP for almost five years. The precursor to WARP was the 2018 launch of 1.1.1.1, the Internet’s fastest, privacy-first consumer DNS service. WARP was introduced in 2019 with the announcement of the 1.1.1.1 service with WARP, a high performance and secure consumer DNS and VPN solution. Then in 2020, we introduced Cloudflare’s Zero Trust platform and the Zero Trust version of WARP to help any IT organization secure their environment, featuring a suite of tools we first built to protect our own IT systems. Zero Trust WARP with MASQUE is the next step in our journey.
The current state of WireGuard
WireGuard was the perfect choice for the 1.1.1.1 with WARP service in 2019. WireGuard is fast, simple, and secure. It was exactly what we needed at the time to guarantee our users’ privacy, and it has met all of our expectations. If we went back in time to do it all over again, we would make the same choice.
But the other side of the simplicity coin is a certain rigidity. We find ourselves wanting to extend WireGuard to deliver more capabilities to our Zero Trust customers, but WireGuard is not easily extended. Capabilities such as better session management, advanced congestion control, or simply the ability to use FIPS-compliant cipher suites are not options within WireGuard; these capabilities would have to be added on as proprietary extensions, if it was even possible to do so.
Plus, while WireGuard is popular in VPN solutions, it is not standards-based, and therefore not treated like a first class citizen in the world of the Internet, where non-standard traffic can be blocked, sometimes intentionally, sometimes not. WireGuard uses a non-standard port, port 51820, by default. Zero Trust WARP changes this to use port 2408 for the WireGuard tunnel, but it’s still a non-standard port. For our customers who control their own firewalls, this is not an issue; they simply allow that traffic. But many of the large number of public Wi-Fi locations, or the approximately 7,000 ISPs in the world, don’t know anything about WireGuard and block these ports. We’ve also faced situations where the ISP does know what WireGuard is and blocks it intentionally.
This can play havoc for roaming Zero Trust WARP users at their local coffee shop, in hotels, on planes, or other places where there are captive portals or public Wi-Fi access, and even sometimes with their local ISP. The user is expecting reliable access with Zero Trust WARP, and is frustrated when their device is blocked from connecting to Cloudflare’s global network.
Now we have another proven technology — MASQUE — which uses and extends HTTP/3 and QUIC. Let’s do a quick review of these to better understand why Cloudflare believes MASQUE is the future.
Unpacking the acronyms
HTTP/3 and QUIC are among the most recent advancements in the evolution of the Internet, enabling faster, more reliable, and more secure connections to endpoints like websites and APIs. Cloudflare worked closely with industry peers through the Internet Engineering Task Force on the development of RFC 9000 for QUIC and RFC 9114 for HTTP/3. The technical background on the basic benefits of HTTP/3 and QUIC are reviewed in our 2019 blog post where we announced QUIC and HTTP/3 availability on Cloudflare’s global network.
Most relevant for Zero Trust WARP, QUIC delivers better performance on low-latency or high packet loss networks thanks to packet coalescing and multiplexing. QUIC packets in separate contexts during the handshake can be coalesced into the same UDP datagram, thus reducing the number of receive and system interrupts. With multiplexing, QUIC can carry multiple HTTP sessions within the same UDP connection. Zero Trust WARP also benefits from QUIC’s high level of privacy, with TLS 1.3 designed into the protocol.
MASQUE unlocks QUIC’s potential for proxying by providing the application layer building blocks to support efficient tunneling of TCP and UDP traffic. In Zero Trust WARP, MASQUE will be used to establish a tunnel over HTTP/3, delivering the same capability as WireGuard tunneling does today. In the future, we’ll be in position to add more value using MASQUE, leveraging Cloudflare’s ongoing participation in the MASQUE Working Group. This blog post is a good read for those interested in digging deeper into MASQUE.
OK, so Cloudflare is going to use MASQUE for WARP. What does that mean to you, the Zero Trust customer?
Proven reliability at scale
Cloudflare’s network today spans more than 310 cities in over 120 countries, and interconnects with over 13,000 networks globally. HTTP/3 and QUIC were introduced to the Cloudflare network in 2019, the HTTP/3 standard was finalized in 2022, and represented about 30% of all HTTP traffic on our network in 2023.
We are also using MASQUE for iCloud Private Relay and other Privacy Proxy partners. The services that power these partnerships, from our Rust-based proxy framework to our open source QUIC implementation, are already deployed globally in our network and have proven to be fast, resilient, and reliable.
Cloudflare is already operating MASQUE, HTTP/3, and QUIC reliably at scale. So we want you, our Zero Trust WARP users and Cloudflare One customers, to benefit from that same reliability and scale.
Connect from anywhere
Employees need to be able to connect from anywhere that has an Internet connection. But that can be a challenge as many security engineers will configure firewalls and other networking devices to block all ports by default, and only open the most well-known and common ports. As we pointed out earlier, this can be frustrating for the roaming Zero Trust WARP user.
We want to fix that for our users, and remove that frustration. HTTP/3 and QUIC deliver the perfect solution. QUIC is carried on top of UDP (protocol number 17), while HTTP/3 uses port 443 for encrypted traffic. Both of these are well known, widely used, and are very unlikely to be blocked.
We want our Zero Trust WARP users to reliably connect wherever they might be.
Compliant cipher suites
MASQUE leverages TLS 1.3 with QUIC, which provides a number of cipher suite choices. WireGuard also uses standard cipher suites. But some standards are more, let’s say, standard than others.
NIST, the National Institute of Standards and Technology and part of the US Department of Commerce, does a tremendous amount of work across the technology landscape. Of interest to us is the NIST research into network security that results in FIPS 140-2 and similar publications. NIST studies individual cipher suites and publishes lists of those they recommend for use, recommendations that become requirements for US Government entities. Many other customers, both government and commercial, use these same recommendations as requirements.
Our first MASQUE implementation for Zero Trust WARP will use TLS 1.3 and FIPS compliant cipher suites.
How can I get Zero Trust WARP with MASQUE?
Cloudflare engineers are hard at work implementing MASQUE for the mobile apps, the desktop clients, and the Cloudflare network. Progress has been good, and we will open this up for beta testing early in the second quarter of 2024 for Cloudflare One customers. Your account team will be reaching out with participation details.
Continuing the journey with Zero Trust WARP
Cloudflare launched WARP five years ago, and we’ve come a long way since. This introduction of MASQUE to Zero Trust WARP is a big step, one that will immediately deliver the benefits noted above. But there will be more — we believe MASQUE opens up new opportunities to leverage the capabilities of QUIC and HTTP/3 to build innovative Zero Trust solutions. And we’re also continuing to work on other new capabilities for our Zero Trust customers. Cloudflare is committed to continuing our mission to help build a better Internet, one that is more private and secure, scalable, reliable, and fast. And if you would like to join us in this exciting journey, check out our open positions.
The collective thoughts of the interwebz
Manage Consent
To provide the best experiences, we use technologies like cookies to store and/or access device information. Consenting to these technologies will allow us to process data such as browsing behavior or unique IDs on this site. Not consenting or withdrawing consent, may adversely affect certain features and functions.
Functional
Always active
The technical storage or access is strictly necessary for the legitimate purpose of enabling the use of a specific service explicitly requested by the subscriber or user, or for the sole purpose of carrying out the transmission of a communication over an electronic communications network.
Preferences
The technical storage or access is necessary for the legitimate purpose of storing preferences that are not requested by the subscriber or user.
Statistics
The technical storage or access that is used exclusively for statistical purposes.The technical storage or access that is used exclusively for anonymous statistical purposes. Without a subpoena, voluntary compliance on the part of your Internet Service Provider, or additional records from a third party, information stored or retrieved for this purpose alone cannot usually be used to identify you.
Marketing
The technical storage or access is required to create user profiles to send advertising, or to track the user on a website or across several websites for similar marketing purposes.