Tag Archives: security

Snaring the Bad Folks

Post Syndicated from Netflix Technology Blog original https://netflixtechblog.com/snaring-the-bad-folks-66726a1f4c80

Project by Netflix’s Cloud Infrastructure Security team (Alex Bainbridge, Mike Grima, Nick Siow)

Cloud security is a hard problem, but an even harder one is cloud security at scale. In recent years we’ve seen several cloud focused data breaches and evidence shows that threat actors are becoming more advanced with their techniques, goals, and tooling. With 2021 set to be a new high for the number of data breaches, it was plainly evident that we needed to evolve how we approach our cloud infrastructure security strategy.

In 2020, we decided to reinvent how we handle cloud security findings by redefining how we write and respond to cloud detections. We knew that given our scale, we needed to rely heavily on automations and that we needed to build our solutions using battle tested scalable infrastructure.

Introducing Snare

Snare Logo

Snare is our Detection, Enrichment, and Response platform for handling cloud security related findings at Netflix. Snare is responsible for receiving millions of records a minute, analyzing, alerting, and responding to them. Snare also provides a space for our security engineers to track what’s going on, drill down into various findings, follow their investigation flow, and ensure that findings are reaching their proper resolution. Snare can be broken down into the following parts: Detection, Enrichment, Reporting & Management, and Remediation.

Snare Finding Lifecycle

Overview

Snare was built from the ground up to be scalable to manage Netflix’s massive scale. We currently process tens of millions of log records every minute and analyze these events to perform in-house custom detections. We collect findings from a number of sources, which includes AWS Security Hub, AWS Config Rules, and our own in-house custom detections. Once ingested, findings are then enriched and processed with additional metadata collected from Netflix’s internal data sources. Finally, findings are checked against suppression rules and routed to our control plane for triaging and remediation.

Where We Are Today

We’ve developed, deployed, and operated Snare for almost a year, and since then, we’ve seen tremendous improvements while handling our cloud security findings. A number of findings are auto remediated, others utilize slack alerts to loop in the oncall to triage via the Snare UI. One major improvement was a direct time savings for our detection squad. Utilizing Snare, we were able to perform more granular tuning and aggregation of findings leading to an average of 73.5% reduction in our false positive finding volume across our ingestion streams. With this additional time, we were able to focus on new detections and new features for Snare.

Speaking of new detections, we’ve more than doubled the number of our in-house detections, and onboarded several detection solutions from security vendors. The Snare framework enables us to write detections quickly and efficiently with all of the plumbing and configurations abstracted away from us. Detection authors only need to be concerned with their actual detection logic, and everything else is handled for them.

Simple Snare Root User Detection

As for security vendors, we’ve most notably worked with AWS to ensure that services like GuardDuty and Security Hub are first class citizens when it comes to detection sources. Integration with Security Hub was a critical design decision from the start due to the high amount of leverage we get from receiving all of the AWS Security findings in a normalized format and in a centralized location. Security Hub has played an integral role in our platform, and made evaluations of AWS security services and new features easy to try out and adopt. Our plumbing between Security Hub and Snare is managed through AWS Organizations as well as EventBridge rules deployed in every region and account to aid in aggregating all findings into our centralized Snare platform.

High Level Security Service Plumbing
Example AWS Security Finding from our testing/sandbox account In Snare UI

One area that we are investing heavily is our automated remediation potential. We’ve explored a few different options ranging from fully automated remediations, manually triggered remediations, as well as automated playbooks for additional data gathering during incident triage. We decided to employ AWS Step Functions to be our execution environment due to the unique DAGs we could build and the simplistic “wait”/”task token” functionality, which allows us to involve humans when necessary for approval/input.

Building on top of step functions, we created a 4 step remediation process: pre-processing, decision, remediation, and post-processing. Pre/post processing can be used for managing out-of-band resource checks, or any work that needs to be done in order to ensure a successful remediation. The decision step is used to perform a final pre-flight check before remediation. This can involve a human reachout, verifying the resource is still around, etc. The remediation step is where we perform our actual remediation. We’ve been able to use this to a great deal of success with infrastructure-wide misconfigured resources being automatically fixed near real time, and enabling the creation of new fully automated incident response playbooks. We’re still exploring new ways we might be able to use this, and are excited for how we might evolve our approach in the near future.

Step Function DAG for S3 Public Access Block Remediation

Diagram from a remediation to enable S3’s public access block on a non-compliant bucket. Each choice stage allows for dynamic routing to a variety of different stages based on the output of the previous function. Wait stages are used when human intervention/approval is needed.

Extensible Learnings

We’ve come a long way in our journey, and we’ve had numerous learning opportunities that we wanted to collect and share. Hopefully, we’ve made the mistakes and learned from those experiences.

Information is Key

Home grown context and metadata streams are invaluable for a detection and response program. By uniting detections and context, you’re able to unlock a new world of possibilities for reducing false positives, creating new detections that rely on business specific context, and help better tailor your severities and automated remediation decisions based on your desired risk appetite. A common theme we’ve often encountered is the need to bring additional context throughout various stages of our pipeline, so make sure to plan for that from the get-go.

Step Functions for Remediations

Step functions provide a highly extensible and unique platform to create remediations. Utilizing the AWS CDK, we were able to build a platform to enable us to easily roll out new remediations. While creating our remediation platform, we explored SSM Automation Runbooks. While SSM Automation Runbooks have great potential for remediating simple issues, we found they weren’t flexible enough to cover a wide spread of our needs, nor did they offer some of the more advanced features we were looking for such as reaching out to humans. Step functions gave us the right amount of flexibility, control, and ease of use in order to be a great asset for the Snare platform.

Closing Thoughts

We’ve come a long way in a year, and we still have a number of interesting things on the horizon. We’re looking at continuing to create new, more advanced features and detections for Snare to reduce cloud security risks in order to keep up with all of the exciting things happening here at Netflix. Make sure to check out some of our other recent blog posts!

Special Thanks

Special thanks to everyone who helped to contribute and provide feedback during the design and implementation of Snare. Notably Shannon Morrison, Sapna Solanki, Jason Schroth from our partner team Detection Engineering, as well as some of the folks from AWS — Prateek Sharma & Ely Kahn. Additional thanks to the rest of our Cloud Infrastructure Security team (Hee Won Kim, Joseph Kjar, Steven Reiling, Patrick Sanders, Srinath Kuruvadi) for their support and help with Snare features, processes, and design decisions!


Snaring the Bad Folks was originally published in Netflix TechBlog on Medium, where people are continuing the conversation by highlighting and responding to this story.

Zabbix 6.0 LTS – The next great leap in monitoring by Alexei Vladishev / Zabbix Summit Online 2021

Post Syndicated from Alexei Vladishev original https://blog.zabbix.com/zabbix-6-0-lts-the-next-great-leap-in-monitoring-by-alexei-vladishev-zabbix-summit-online-2021/17683/

The Zabbix Summit Online 2021 keynote speech by Zabbix founder and CEO Alexei Vladishev focuses on the role of Zabbix in modern, dynamic IT infrastructures. The keynote speech also highlights the major milestones leading up to Zabbix 6.0 LTS and together we take a look at the future of Zabbix.

The full recording of the speech is available on the official Zabbix Youtube channel.

Digital transformation journey
Infrastructure monitoring challenges
Zabbix – Universal Open Source enterprise-level monitoring solution
Cost-Effectiveness
Deploy Anywhere
Monitor Anything
Monitoring of Kubernetes and Hybrid Clouds
Data collection and Aggregation
Security on all levels
Powerful Solution for MSPs
Scalability and High Availability
Machine learning and Statistical analysis
More value to users
New visualization capabilities
IoT monitoring
Infrastructure as a code
Tags for classification
What’s next?
Advanced event correlation engine
Multi DC Monitoring
Zabbix Release Schedule
Zabbix Roadmap
Questions

Digital transformation journey

First, let’s talk about how Zabbix plays a role as a part of the Digital Transformation journey for many companies.

As IT infrastructures evolve, there are many ongoing challenges. Most larger companies for example have a set of legacy systems that require to be integrated with more modern systems. This results in a mix of legacy and new technologies and protocols. This means that most management and monitoring tools need to support all of these technologies – Zabbix is no exception here.

Hybrid clouds, containers, and container orchestration systems such as K8S and OpenShift have also played an immense part in the digital transformation of enterprises. It has been a very major paradigm shift – from physical machines to virtual machines, to containers and hybrid parts. We certainly must provide the required set of technologies to monitor such environments and the monitoring endpoints unique to them.

The rapid increase in the complexity of IT infrastructures caused by the two previous points requires our tools to be a lot more scalable than before. We have many more moving parts, likely located in different locations that we need to stay aware of. This also means that any downtime is not acceptable – this is why the high availability of our tools is also vital to us.

Let’s not forget that with increased complexity, many new potential security attack vectors arise and our tools need to support features that can help us with minimizing the security risks.

But making our infrastructures more agile usually comes at a very real financial cost. We must not forget that most of the time we are working with a dedicated budget for our tools and procedures.

Infrastructure monitoring challenges

The increase in the complexity of IT infrastructures also poses multiple monitoring challenges that we have to strive to overcome:

  • Requirements for scalability and high availability for our tools
    • The growing number of devices and networks as well as the increased complexity of IT infrastructures
  • Increasingly complex infrastructures often force us to utilize multiple tools to obtain the required metrics
    • This leads to a requirement for a single pane of glass to enable centralized monitoring
  • Collecting values is often not enough – we need to be able to leverage the collected data to gain the most value out of it
  • We need a solution that can deliver centralized visualization and reporting based on the obtained data
  • Our tools need to be hand-picked so that they can deliver the best ROI in an already complex infrastructure

Zabbix – Universal Open Source enterprise-level monitoring solution

Zabbix is a Universal free and Open Source enterprise-level monitoring solution. The tool comes at absolutely no cost and is available for everyone to try out and use. Zabbix provides the monitoring of modern IT infrastructures on multiple levels.

Universal is the term that we are focusing on. Given the open-source nature of the product, Zabbix can be used in infrastructures of different sizes – from small and medium organizations to large, globe-spanning enterprises. Zabbix is also capable of delivering monitoring of the whole IT stack – from hardware and network monitoring to high-level monitoring such as Business Service monitoring and more.

Cost-Effectiveness

Zabbix delivers a large set of enterprise-grade features at no cost! Features such as 2FA, Single sign-on solutions, no restrictions when it comes to data collection methods, number of monitored devices and services, or database size.

  • Exceptionally low total cost of ownership
    • Free and Open Source solution with quality and security in mind
    • Backed by reliable vendors, a global partner network, and commercial services, such as the 24/7 support
    • No limitations regarding how you use the software
    • Free and readily available documentation, HOWTOs, community resources, videos, and more.
    • Zabbix engineers are easy to find and hire for your organization
    • Cost is fully under your control – Zabbix Commercial services are under fixed-price agreements

Deploy Anywhere

Our users always have the choice of where and how they wish to deploy Zabbix. With official packages for the most popular operating systems such as RHEL, Oracle Linux, Ubuntu, Raspberry Pi OS, and more. With official Helm charts, you can quickly also deploy Zabbix in a Kubernetes cluster or in your OpenShift instance. We also provide official Docker container images with pre-installed Zabbix components that you can deploy in your environment.

We also provide one-click deployment options for multiple cloud service providers, such as Amazon AWS, Microsoft Azure, Google Cloud, Openstack, and many other cloud service providers.
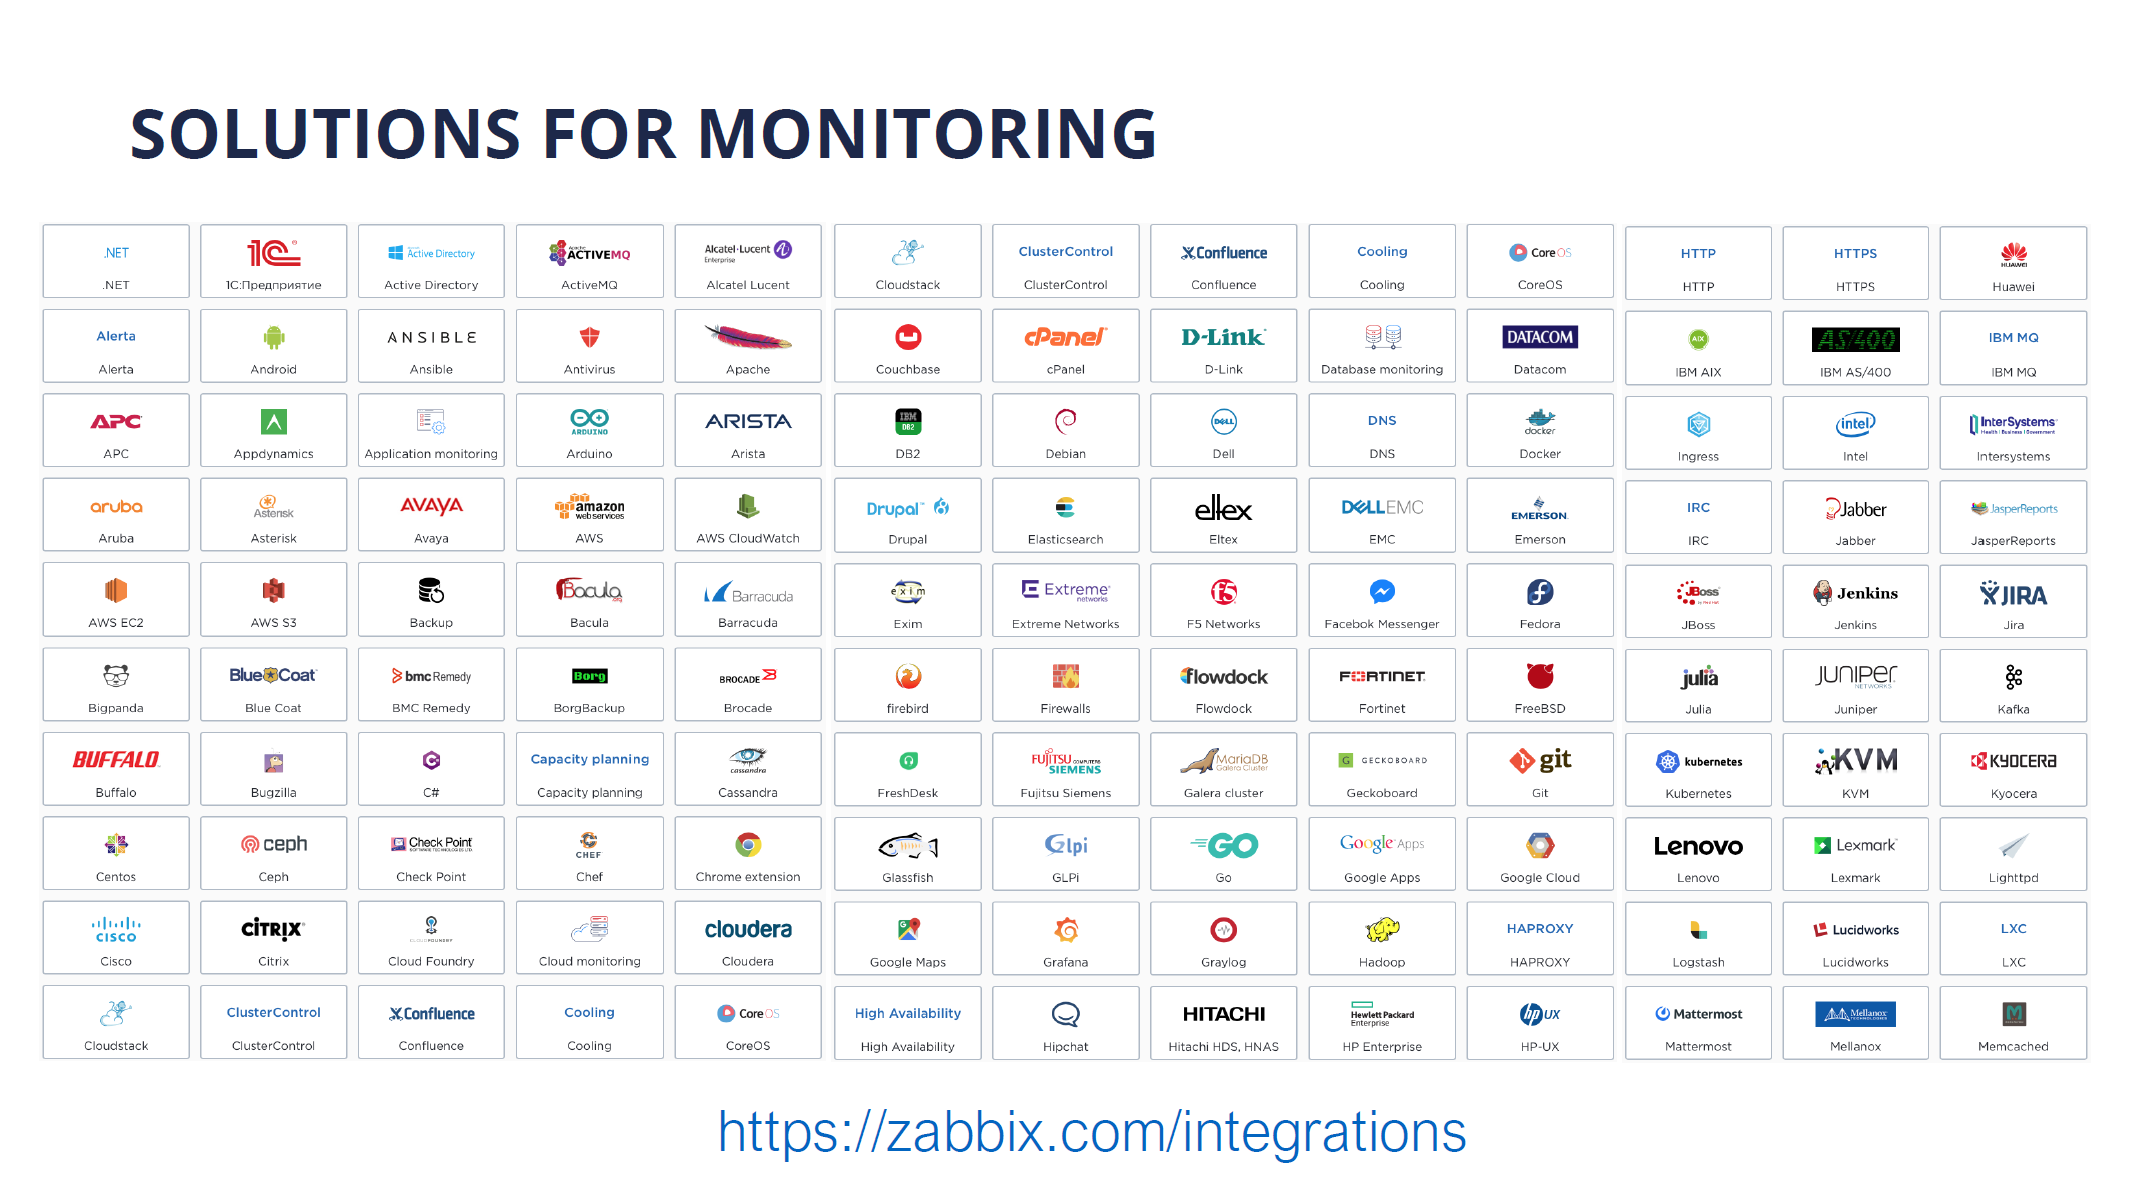
Monitor Anything

With Zabbix, you can monitor anything – from legacy solutions to modern systems. With a large selection of official solutions and substantial community backing our users can be sure that they can find a suitable approach to monitor their IT infrastructure components. There are hundreds of ready-to-use monitoring solutions by Zabbix.

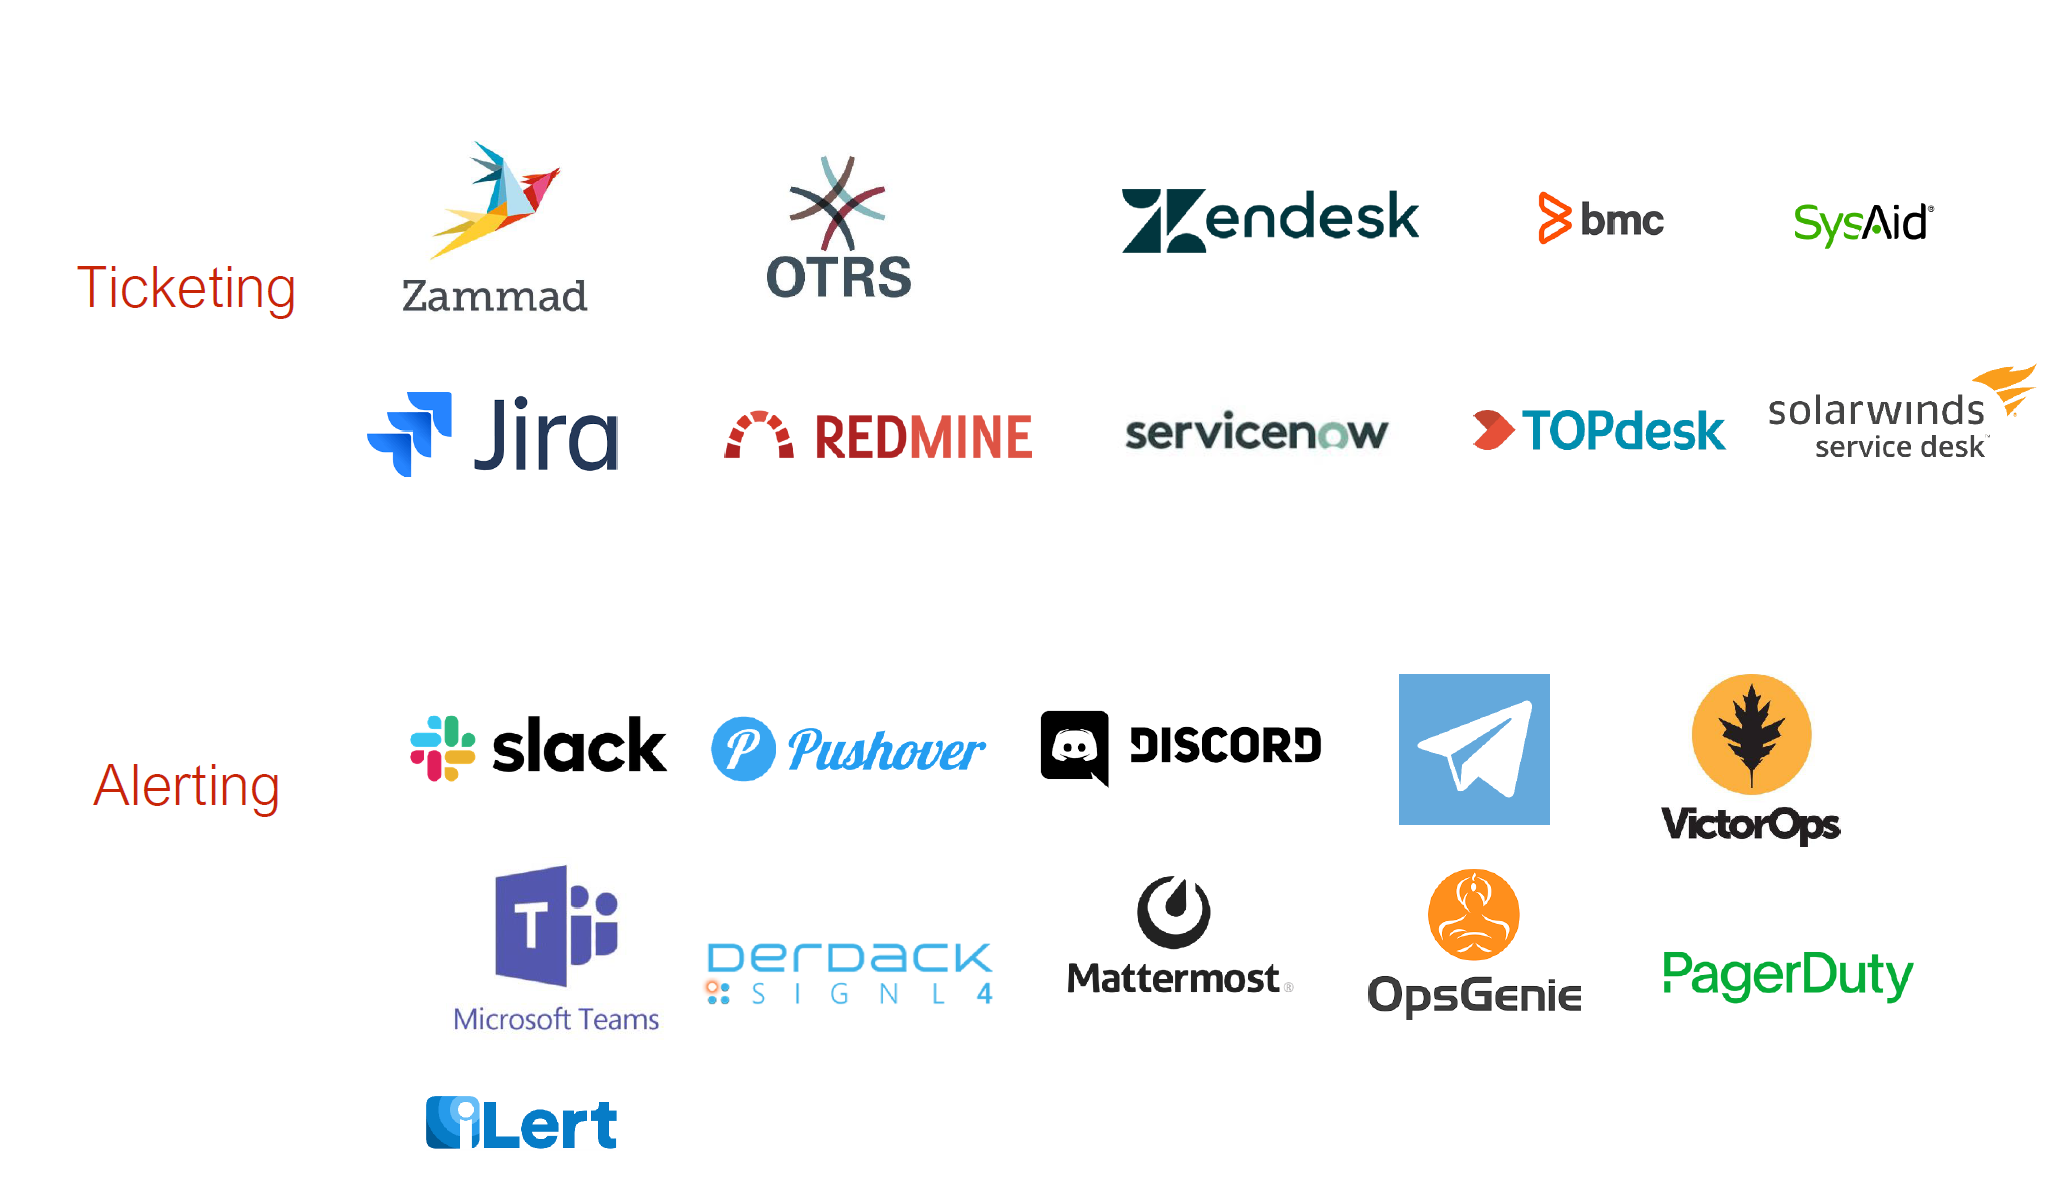
Whenever you deploy a new IT solution in your enterprise, you will want to tie it together with the existing toolset. Zabbix provides many out of the box integrations for the most popular ticketing and alerting systems

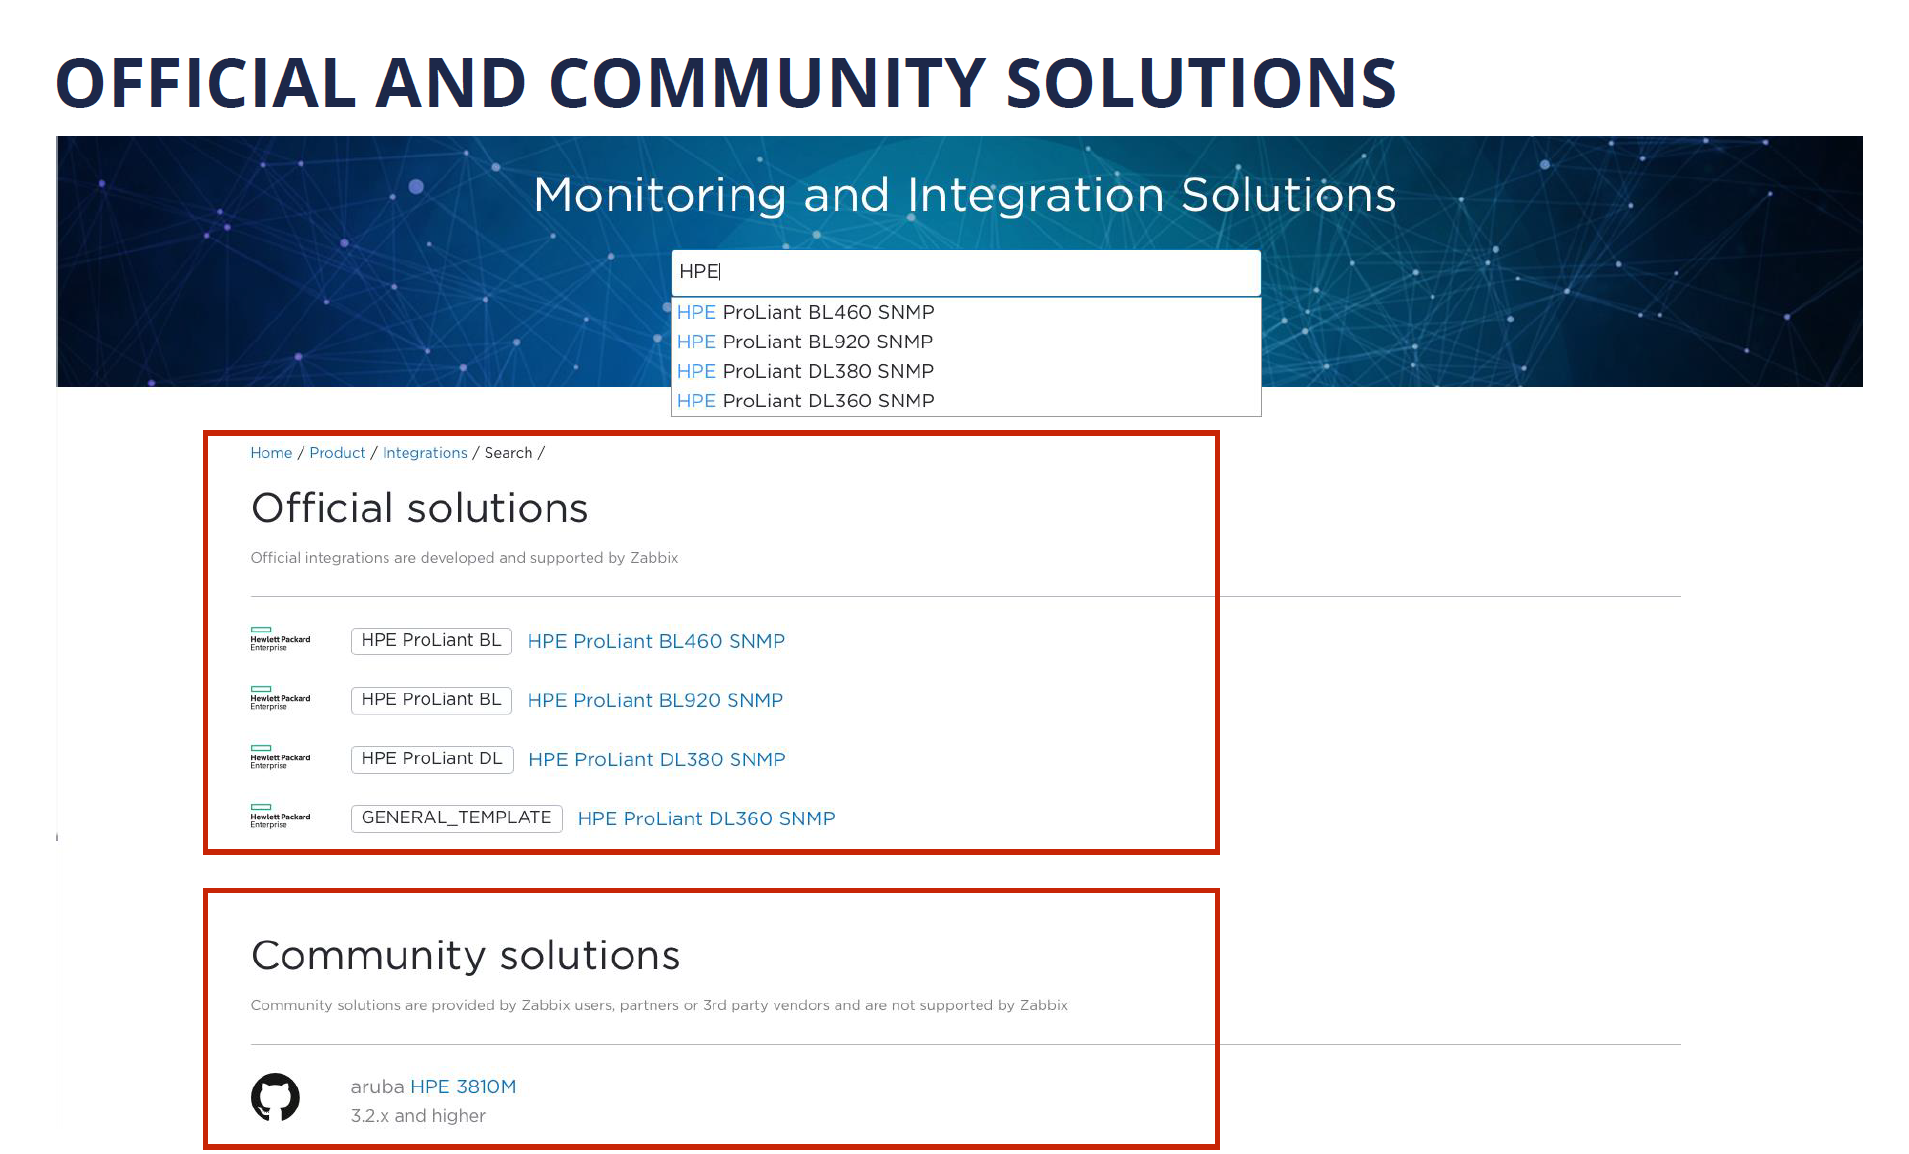
Recently we have introduced advanced search capabilities for the Zabbix integrations page, which allows you to quickly lookup the integrations that currently exist on the market. If you visit the Zabbix integrations page and look up a specific vendor or tool, you will see a list of both the official solutions supported by Zabbix and also a long list of community solutions backed by our users, partners, and customers.

Monitoring of Kubernetes and Hybrid Clouds

Nowadays many existing companies are considering migrating their existing infrastructure to either solutions such as Kubernetes or OpenShift, or utilizing cloud service providers such as Amazon AWS or Microsoft Azure.

I am proud to announce, that with the release of Zabbix 6.0 LTS, Zabbix will officially support out-of-the-box monitoring of OpenShfit and Kubernetes clusters.

Data collection and Aggregation

Let’s cover a few recent features that improve the out-of-the-box flexibility of Zabbix by a large margin.

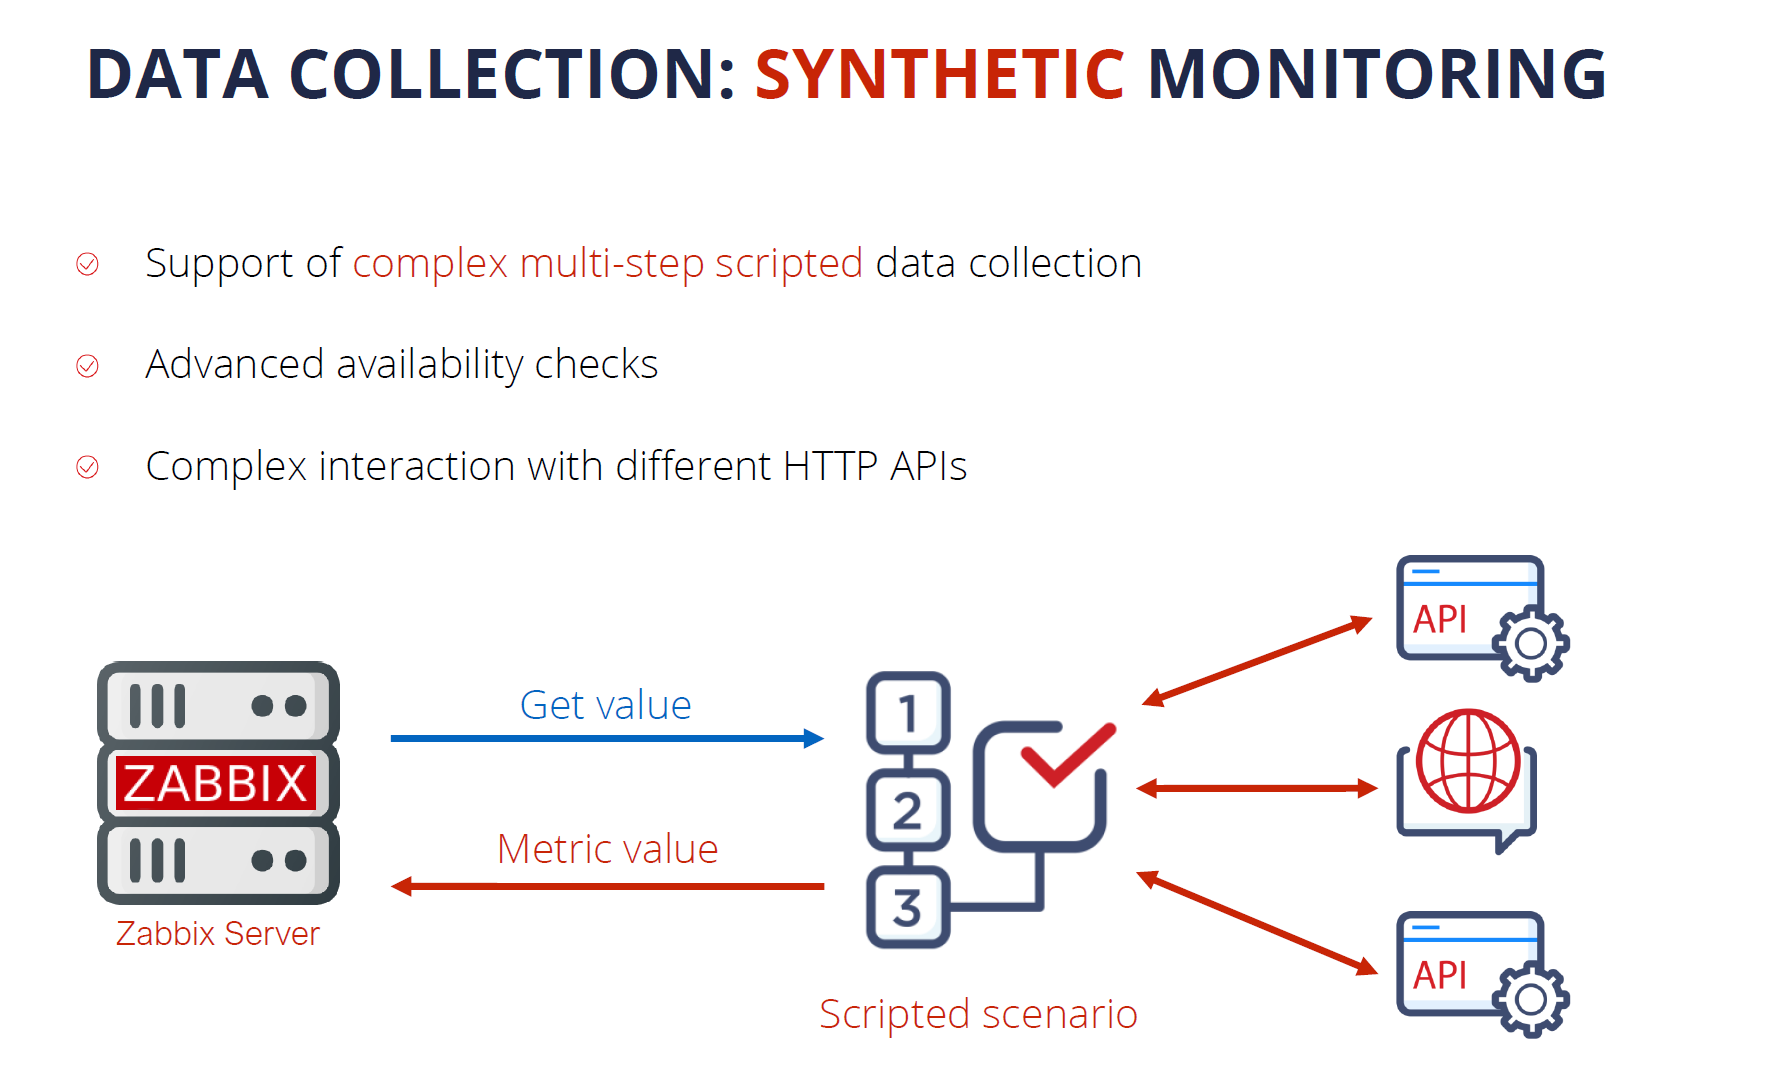
Synthetic monitoring is a feature that was introduced a year ago in Zabbix version 5.2 and it has already become quite popular with our user base. The feature enables monitoring of different devices and solutions over the HTTP protocol. By using synthetic monitoring Zabbix can connect to your HTTP endpoints, such as cloud APIs, Kubernetes, and OpenShift APIs, and other HTTP endpoints, collect the metrics and then process them to extract the required information. Synthetic monitoring is extremely transparent and flexible – it can be fine-tuned to communicate with any HTTP endpoints.

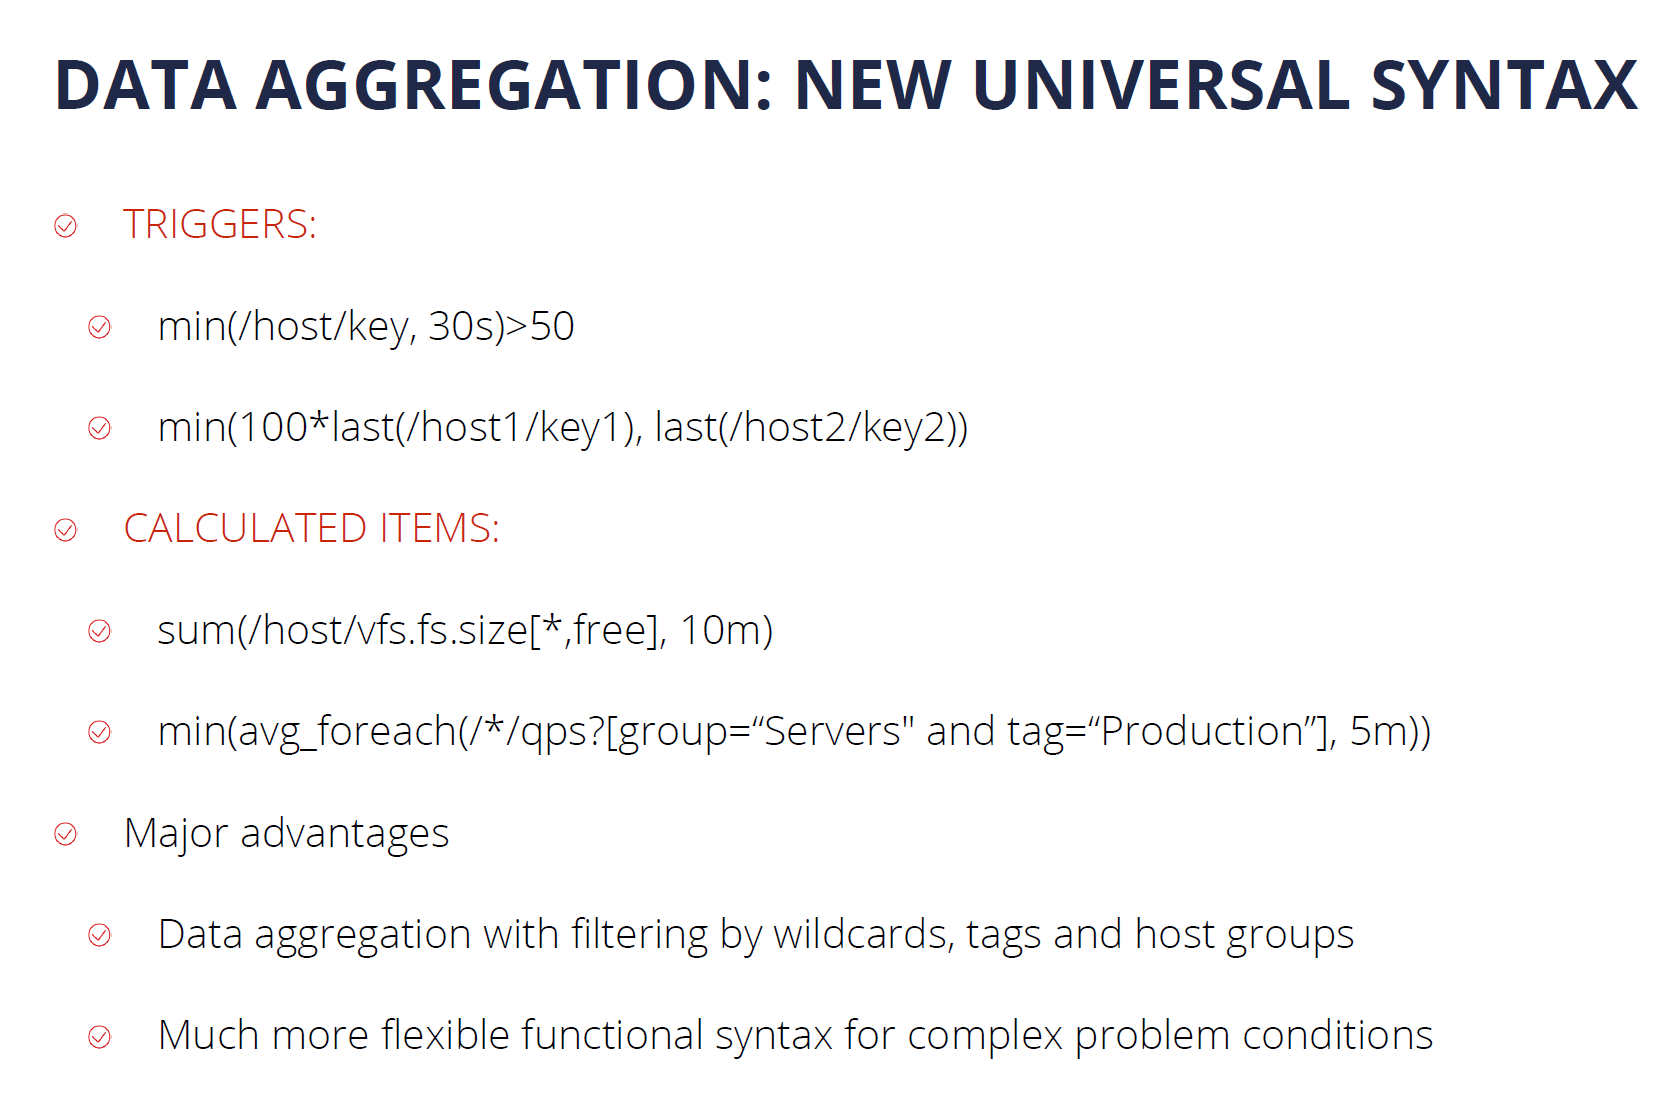
Another major feature introduced in Zabbix 5.4 is the new trigger syntax. This enables our users to define much more flexible trigger expressions, supporting many new problem detection use cases. In addition, we can use this syntax to perform flexible data aggregation operations. For example, now we can aggregate data filtered by wildcards, tags, and host groups, instead of specifying individual items. This is extremely valuable for monitoring complex infrastructures, such as Kubernetes or cloud environments. At the same time, the new syntax is a lot more simple to learn and understand when compared to the old trigger syntax.

Security on all levels

Many companies are concerned about security and data protection when it comes to the tools that they are using in their day-to-day tasks. I’m happy to tell you that Zabbix follows the highest security standards when it comes to the development and usage of the product.

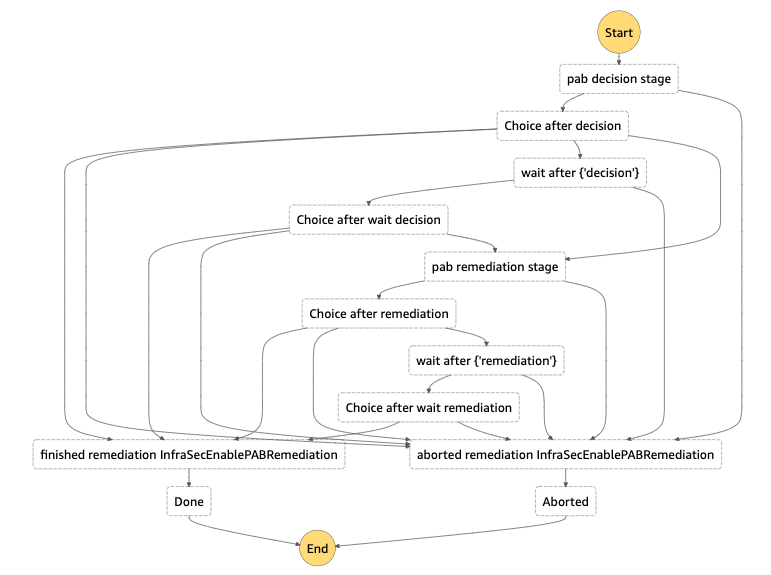
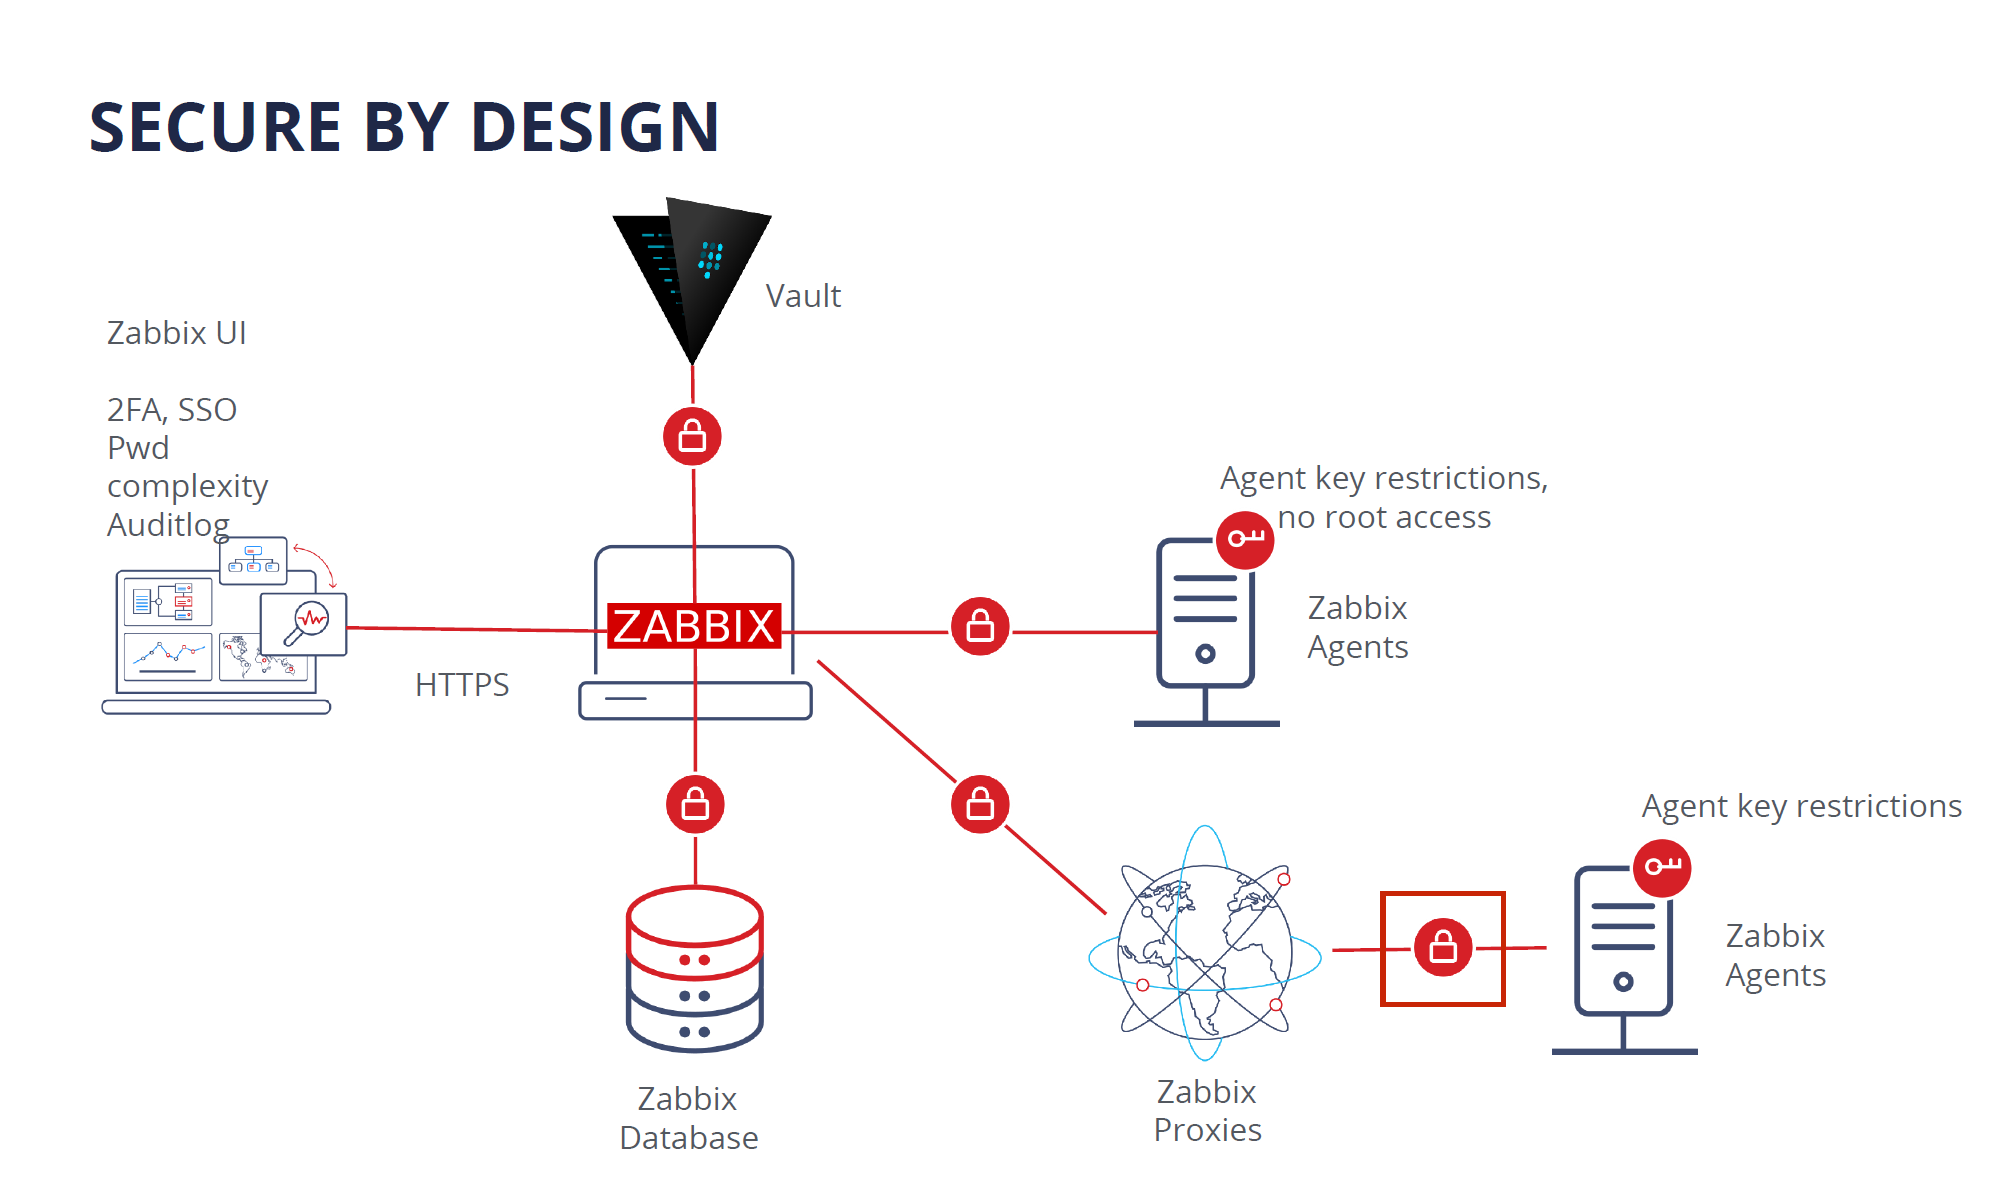
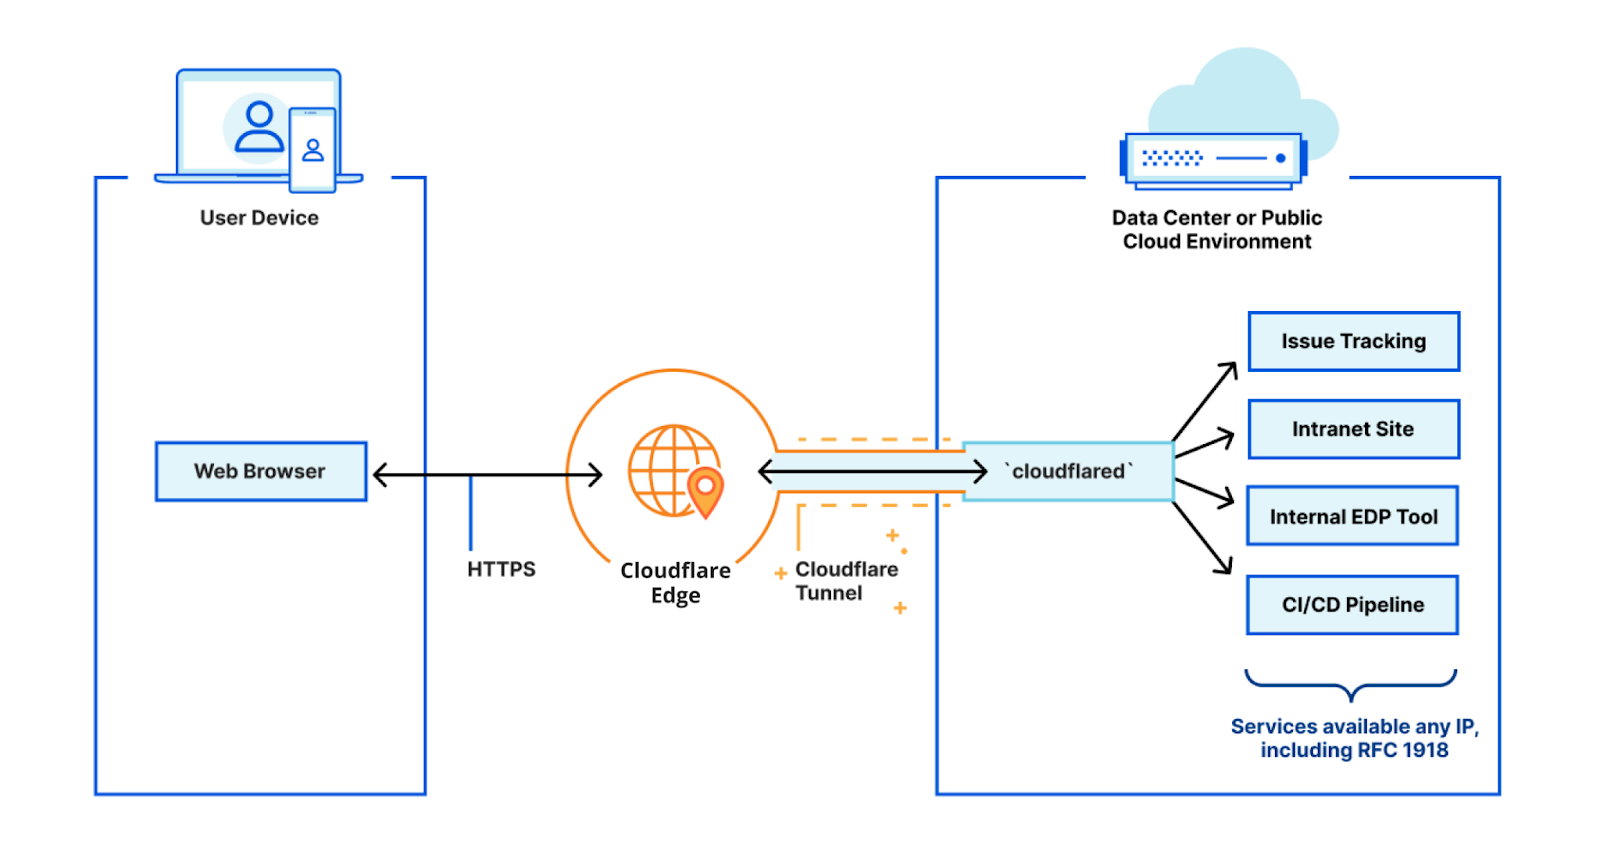
Zabbix is secure by design. In the diagram below you can see all of the Zabbix components, all of which are interconnected, like Zabbix Agent, Server, Proxy, Database, and Frontend. All of the communication between different Zabbix components can be encrypted by using strong encryption protocols like TLS.

If you’re using Zabbix Agent, the agent does not require root privileges. You can run Zabbix Agent under a normal user with all of the necessary user level restrictions in place. Zabbix agent can also be restricted with metric allow and deny lists, so it has access only to the metrics which are permitted for collection by your company policies.

The connections between the Zabbix database backend and the Zabbix Frontend and Zabbix Server also support encryption as of version 5.0 LTS.

As for the frontend component – users can add an additional security layer for their Zabbix frontends by configuring 2FA and SSO logins. Zabbix 6.0 LTS also introduces flexible login password complexity requirements, which can reduce the security breach risk if your frontend is exposed to the internet. To ensure that Zabbix meets the highest standards of the company security compliance, the new Audit log, introduced in Zabbix 6.0 LTS, is capable of logging all of the Zabbix Frontend and Zabbix Server operations.

For an additional security layer – sensitive information like Usernames, Passwords, API keys can be stored in an external vault. Currently, Zabbix supports secret storage in the HashiCorp Vault. Support for the CyberArk vault will be added in the Zabbix 6.2 release.

Another Zabbix feature – the Zabbix API, is often used for the automation of day-to-day configuration workflows, as well as custom integrations and data migration tasks. Zabbix 5.4 added the ability to create API tokens for particular frontend users with pre-defined token expiration dates.

In Zabbix 5.2 we added another layer for the Zabbix Frontend user permissions – User Roles. Now it is possible to define granular user roles with different types of rights and privileges, assigned to specific types of users in your organization. With User Roles, we can define which parts of the Zabbix UI the specific user role has access to and which UI actions the members of this role can perform. This can be combined with API method restrictions which can also be defined for a particular role.

Powerful Solution for MSPs

When we combine all of these features, we can see how Zabbix becomes a powerful solution for MSP customers. MSPs can use Zabbix as an added value service. This way they can provide a monitoring service for their customers and get additional revenue out of it. It is possible to build a customer portal which is a combination of User Roles for read-only access to dashboards and customized UI, rebranding option – which was just introduced in Zabbix 6.0 LTS, and a combination of SLA reporting together with scheduled PDF reports, so the customers can receive reports on a weekly, daily or monthly basis.

Scalability and High Availability

With a growing number of devices and ever-increasing network complexity, Scalability and High availability are extremely important requirements.

Zabbix provides Load balancing options for Zabbix UI and Zabbix API. In order to scale the Zabbix Frontend and Zabbix API, we can simply deploy additional Zabbix Frontend nodes, thus introducing redundancy and high availability.

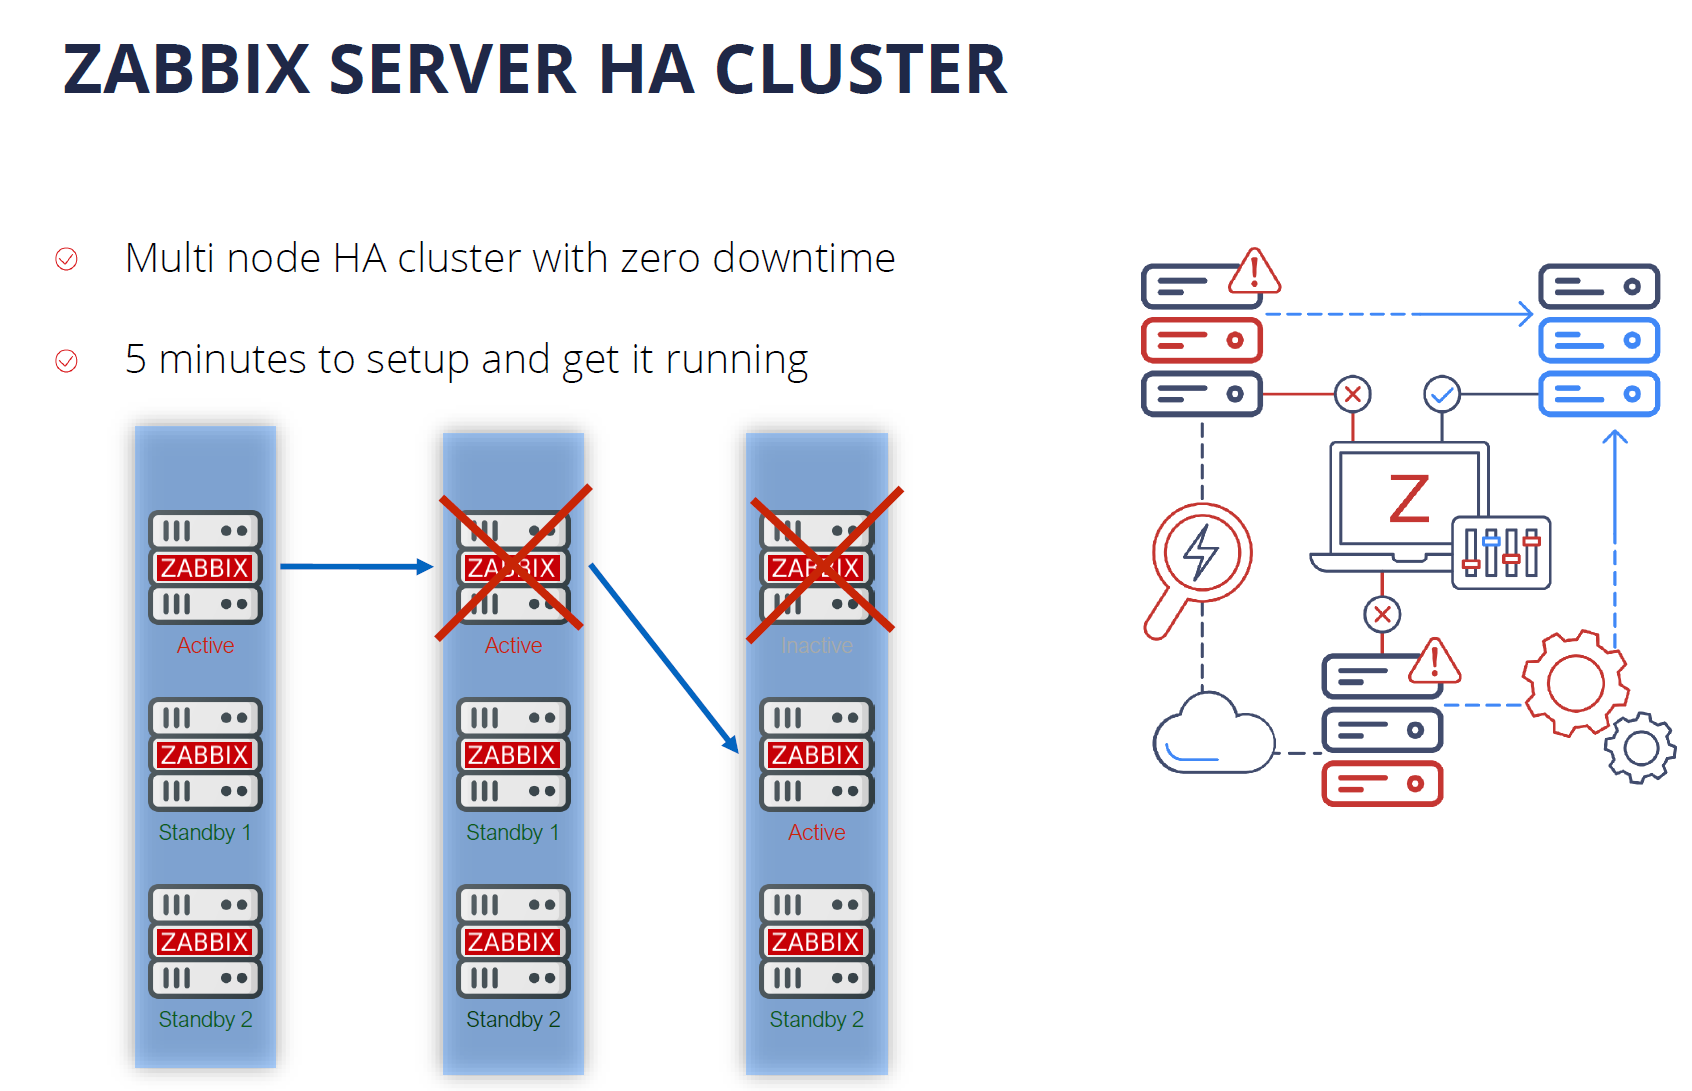
Zabbix 6.0 LTS comes with out-of-the-box support for the Zabbix Server High Availability cluster. If one of the Zabbix Server nodes goes down, Zabbix will automatically switch to one of the standby nodes. And the best thing about the Zabbix Server High Availability cluster – it takes only 5 minutes to get it up and running. the HA cluster is very easy to configure and use.

One of the features in our future roadmap is introducing support for the History API to work with different time-series DB backends for extra efficiency and scalability. Another feature that we would like to implement in the future is load balancing for Zabbix Servers and Zabbix Proxies. Combining all of these features would truly make Zabbix a cloud-native application with unlimited horizontal scalability.

Machine learning and Statistical analysis

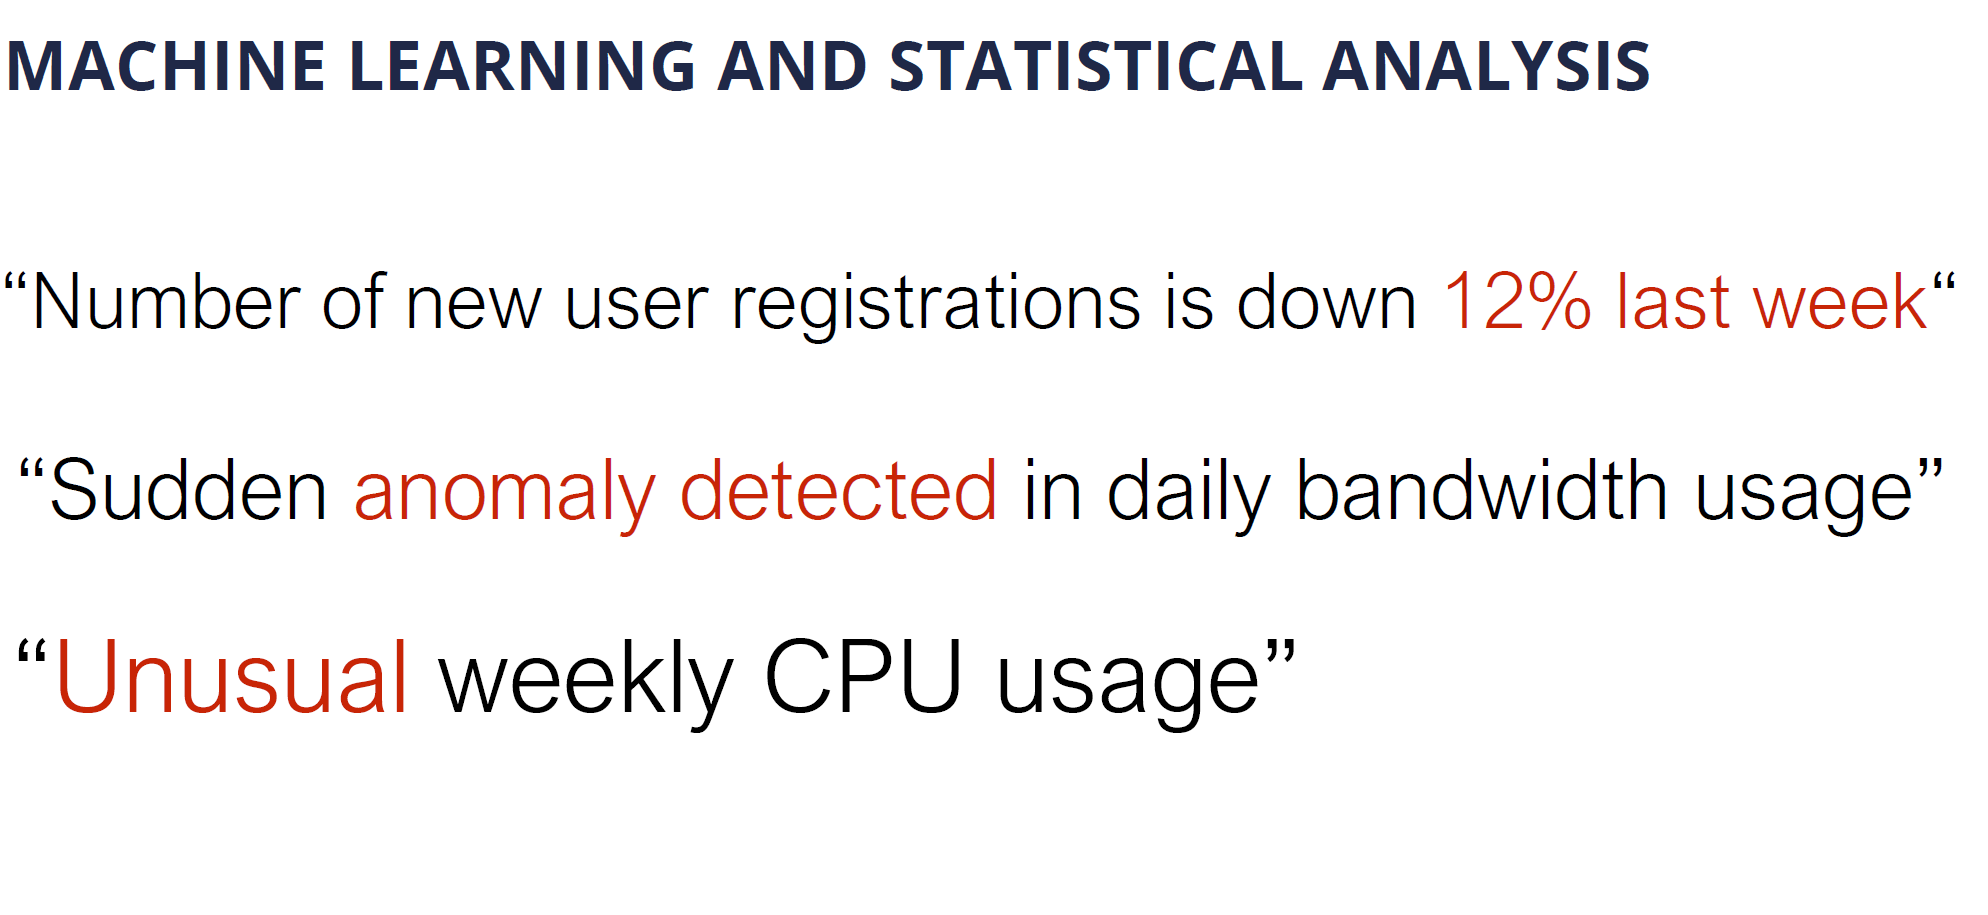
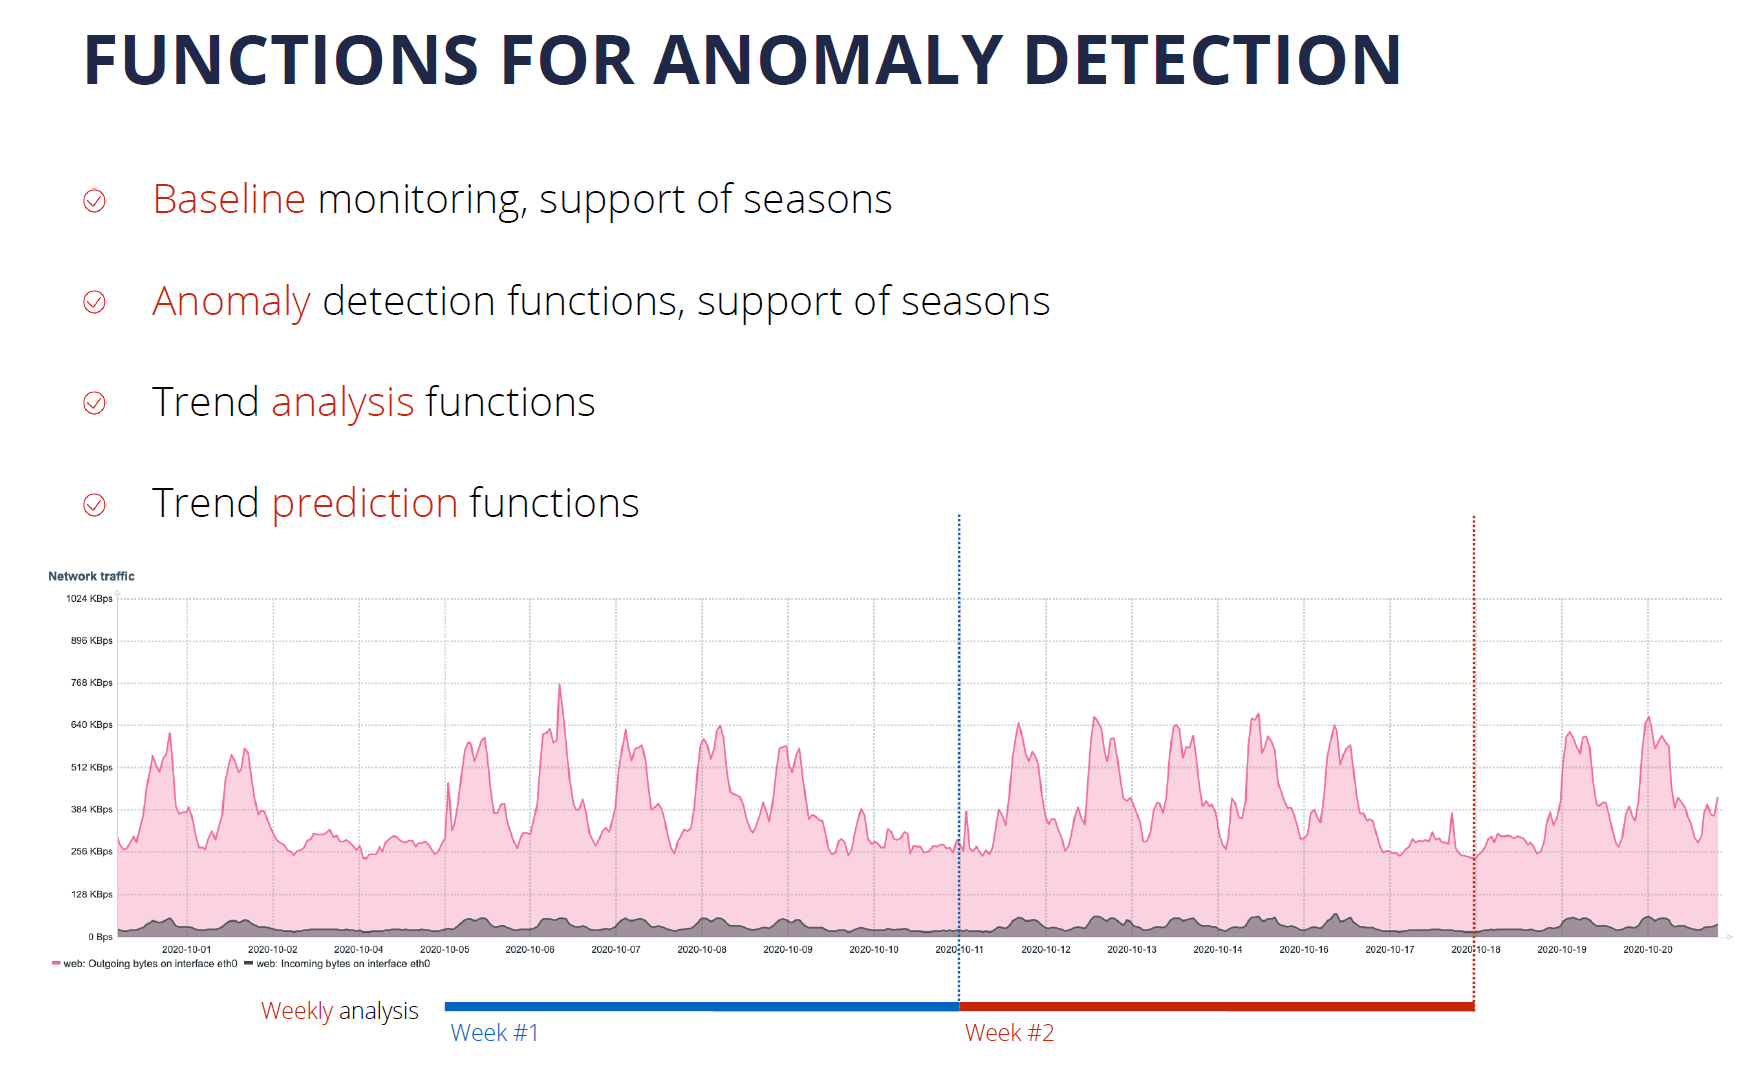
Defining static trigger thresholds is a relatively simple task, but it doesn’t scale too well in dynamic environments. With Machine Learning and Statistical Analysis, we can analyze our data trends and perform anomaly detection. This has been greatly extended in Zabbix 6.0 LTS with Anomaly Detection and Baseline Monitoring functionality.

Zabbix 6.0 Adds an extended set of functions for trend analysis and trend prediction. These support multiple flexible parameters, such as the ability to define seasonality for your data analysis. This is another way how to get additional insights out of the data collected by Zabbix

More value to users

When I think about the direction that Zabbix is headed in, and look at the Zabbix roadmap, one of the main questions I ask is “How can we deliver more value to our enterprise users?”

In Zabbix 6.0 LTS we made some major steps to make Zabbix fit not only for infrastructure monitoring but also fit for Business Service monitoring – the monitoring of services that we provide for our end-users or internal company users. Zabbix 6.0 LTS comes with complex service level object definitions, real-time SLA reporting, multi-tenancy options, Business Service alerting options, and root cause and Impact analysis.

New visualization capabilities

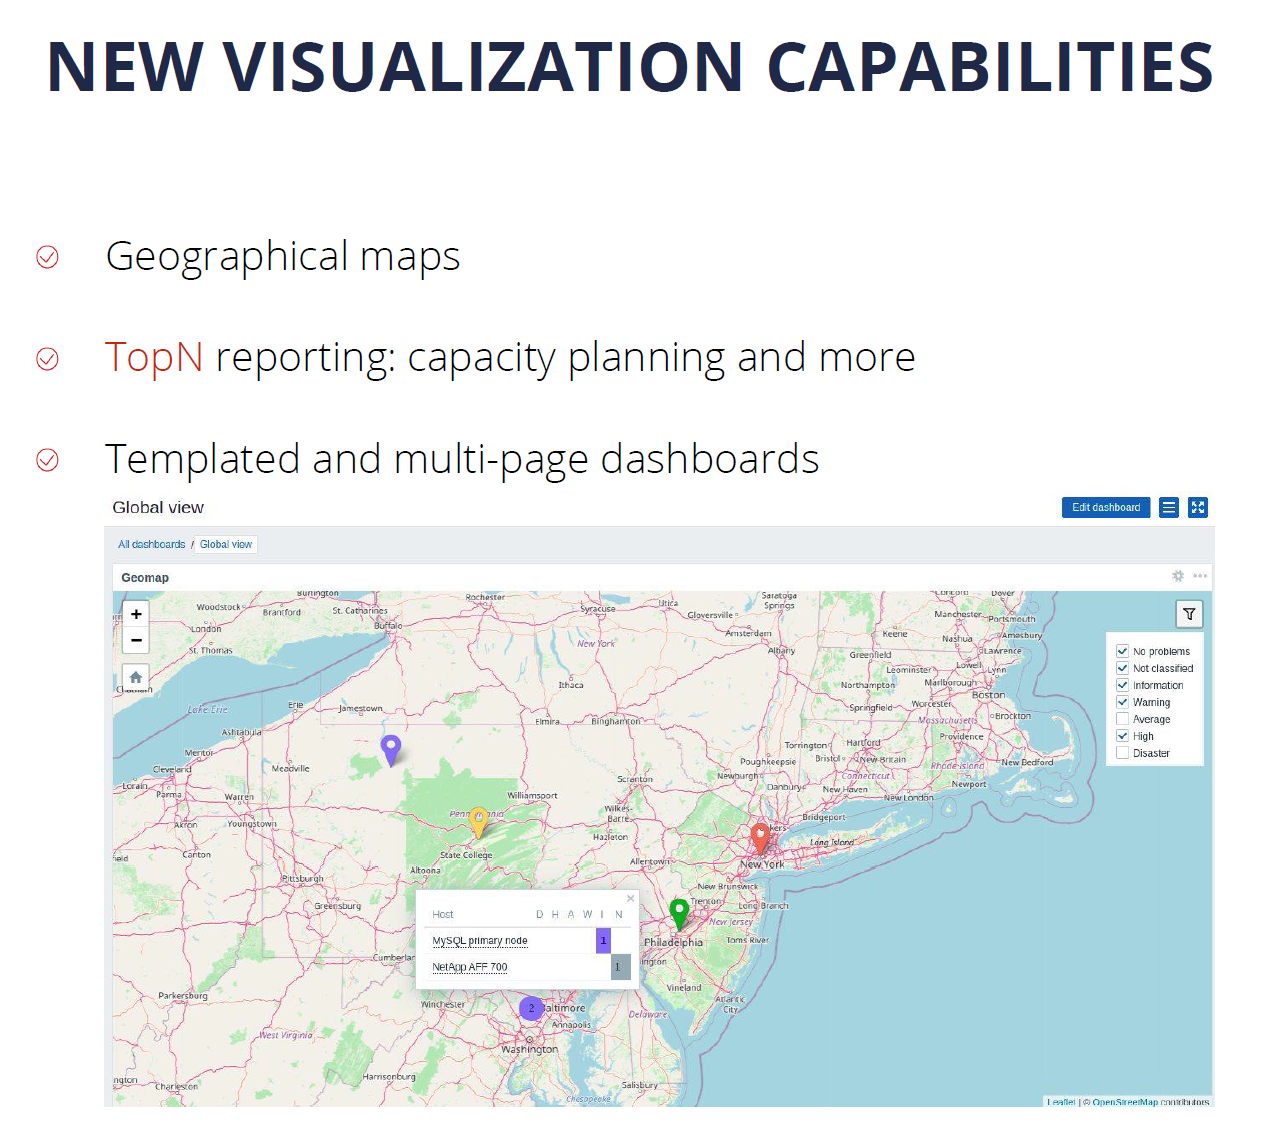
It is important to present the collected data in a human-readable way. That’s why we invest a lot of time and effort in order to improve the native visualization capabilities. In Zabbix 6.0 LTS we have introduced Geographical Maps together with additional widgets for TOP N reporting and templated and multi-page dashboards.

The introduction of reports in Zabbix 5.2 allowed our users to leverage their Zabbix Dashboards to generate scheduled PDF reports with respect to user permissions. Our users can generate daily, weekly, monthly or yearly reports and send them to their infrastructure administrators or customers.

IoT monitoring

With the introduction of support for Modbus and MQTT protocols, Zabbix can be used to monitor IoT devices and obtain environmental information from different sensors such as temperature, humidity, and more. In addition, Zabbix can now be used to monitor factory equipment, building management systems, IoT gateways, and more.

Infrastructure as a code

With IT infrastructures growing in scale, automation is more important than ever. For this reason, many companies prefer preserving and deploying their infrastructure as code. With the support of YAML format for our templates, you can now keep them in a git repository and by utilizing CI/CD tools you can now deploy your templates automatically.

This enables our users to manage their templates in a central location – the git repository, which helps users to perform change management and versioning and then deploy the template to Zabbix by using CI/CD tools.

Tags for classification

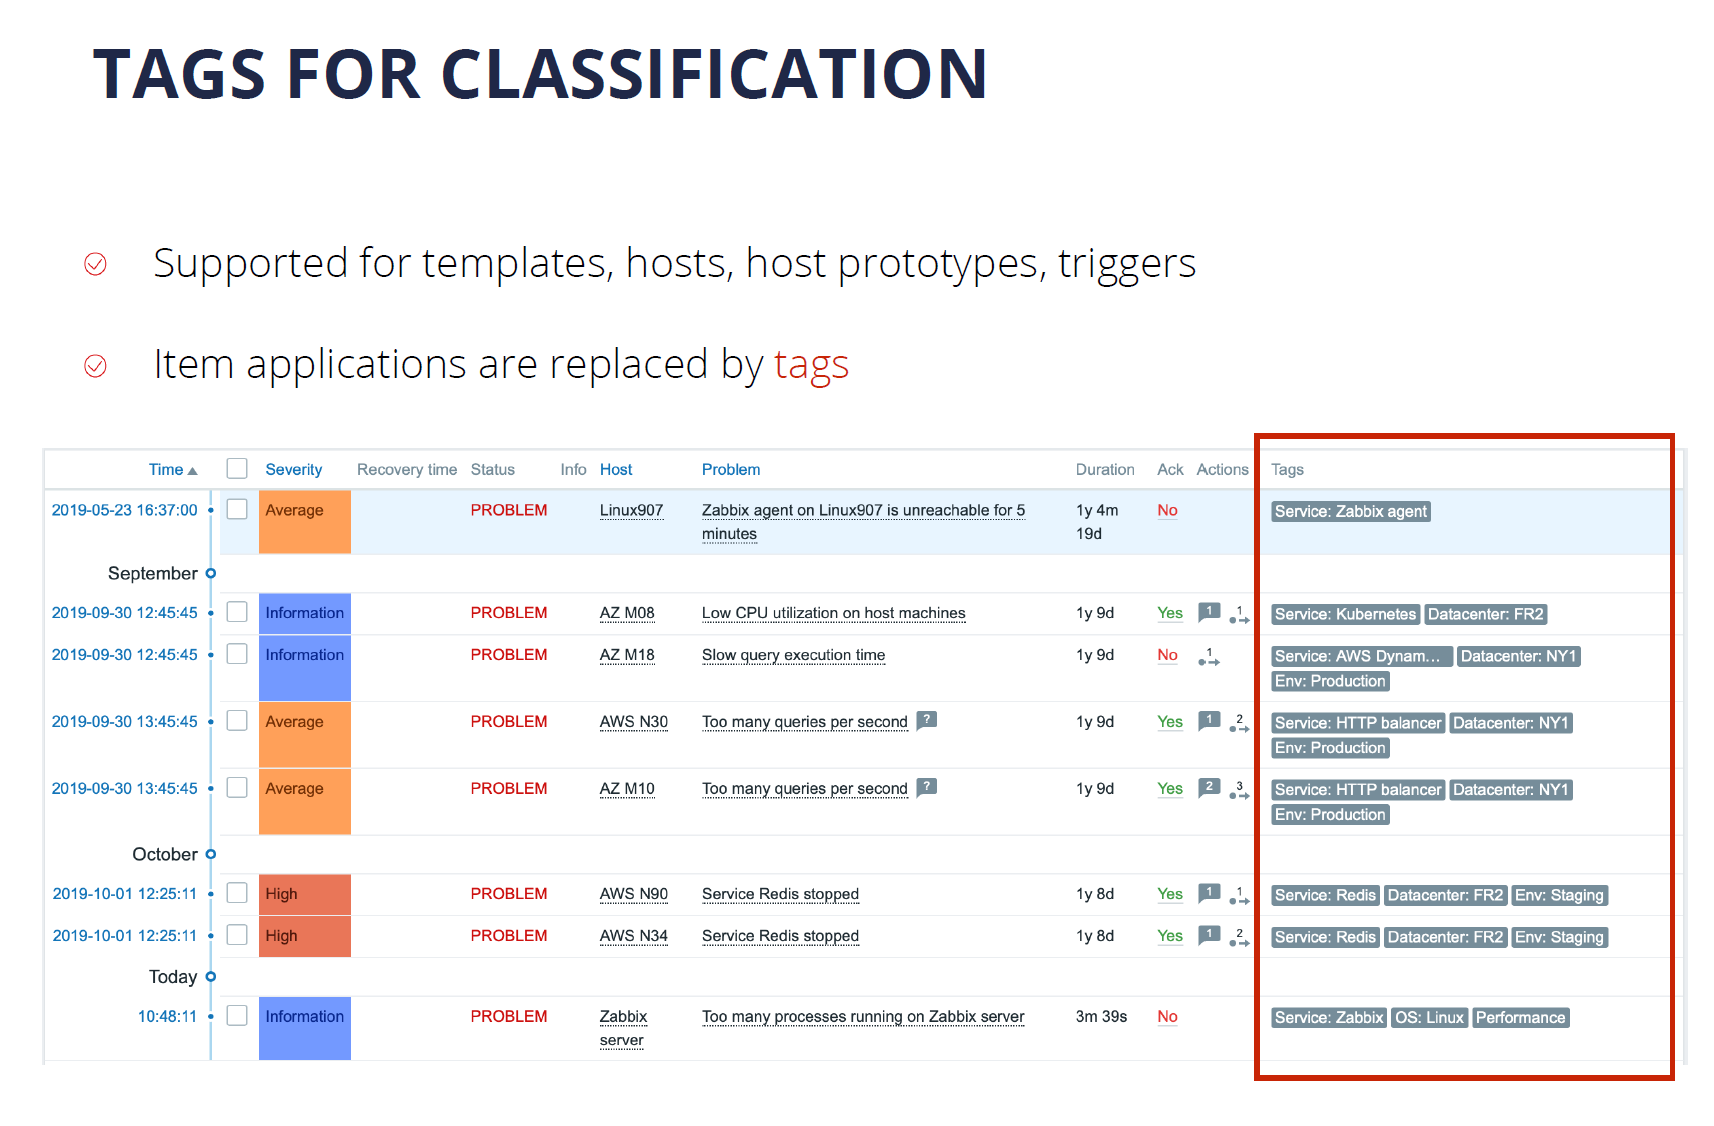
Over the past few versions, we have made a major push to support tags for most Zabbix entities. The switch from applications to tags in Zabbix 5.4 made the tool much more flexible. Tags can now be used for the classification of items, triggers, hosts, business services. The tags that the users define can also be used in alerting, filtering, and reporting.

What’s next?

You’re probably wondering – what’s coming next? What are the main vectors for the future development of Zabbix?

First off – we will continue to invest in usability. While the tool is made by professionals for professionals, it is important for us to make using the tool as easy as possible. Improvements to the Zabbix Frontend, general usability, and UX can be expected very soon.

We plan to continue to invest in the visualization and reporting capabilities of Zabbix. We want all data collected by our monitoring tool to provide information in a single pane of glass. This way our users can see the full picture of their environment while also seeing the root cause analysis for the ongoing problems that we face. This way we can get most of the data that Zabbix collects.

Extending the scope of monitoring is an ongoing process for us. We would like to implement additional features for compliance monitoring. I think that we will be able to introduce a solution for application performance monitoring very soon. We’d like to make log monitoring more powerful and comprehensive. monitoring of public and private clouds is also very important for us, given the current IT paradigms.

We’d like to make sure that Zabbix is absolutely extendable on all levels. While we can already extend Zabbix with different types of plugins, webhooks, and UI modules there’s more to come in the near future.

The topic of high availability, scalability, and load balancing is extremely important to us. We will continue building on the existing foundations to make Zabbix a truly cloud-native solution.

Advanced event correlation engine

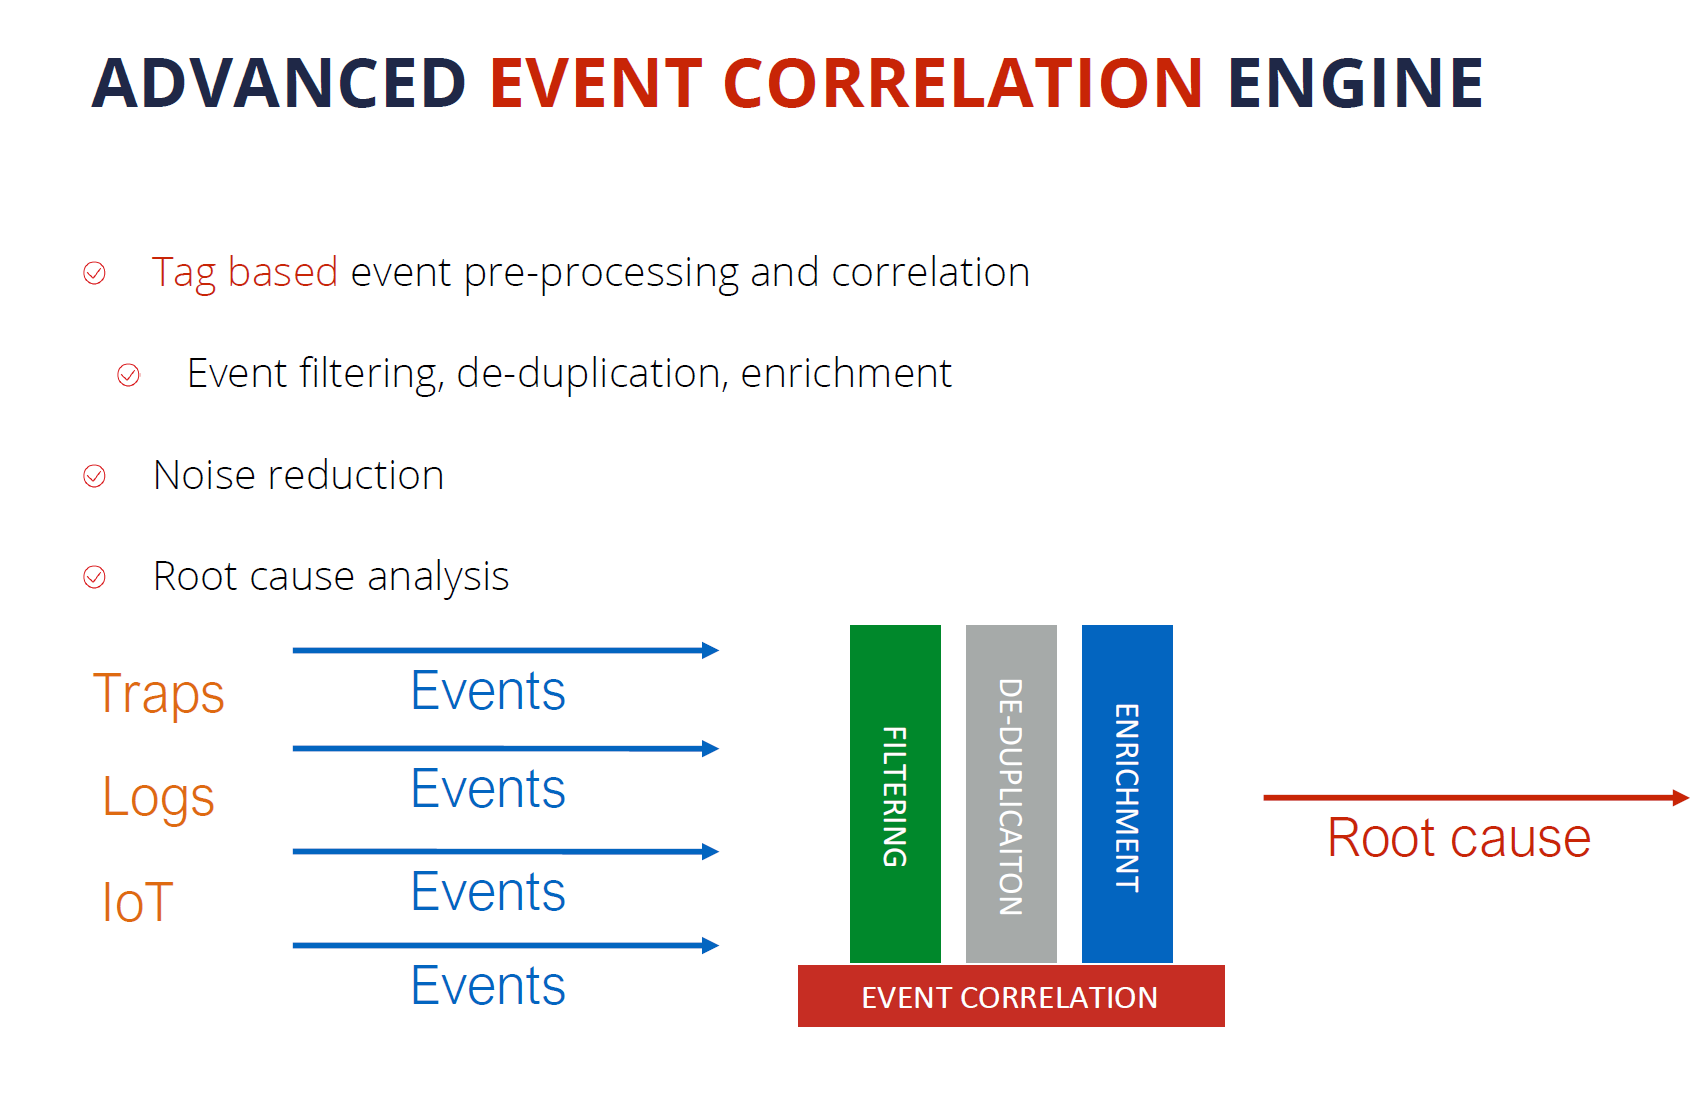
Advanced event processing is a really important topic. When we talk about a monitoring solution, we pay very much attention to the number of metrics that we are collecting. We mustn’t forget, that for large-scale environments the number of events that we generate based on those metrics is also extremely important. We need to keep control and manage the ever-growing number of different events coming from different sources. This is why we would like to focus on noise reduction, specifically – root cause analysis.

For this reason, we can expect Zabbix to introduce an advanced event correlation model in the future. This model should have the ability to filter and deduplicate the events as well as perform event enrichment, thus leading to a much better root cause analysis.
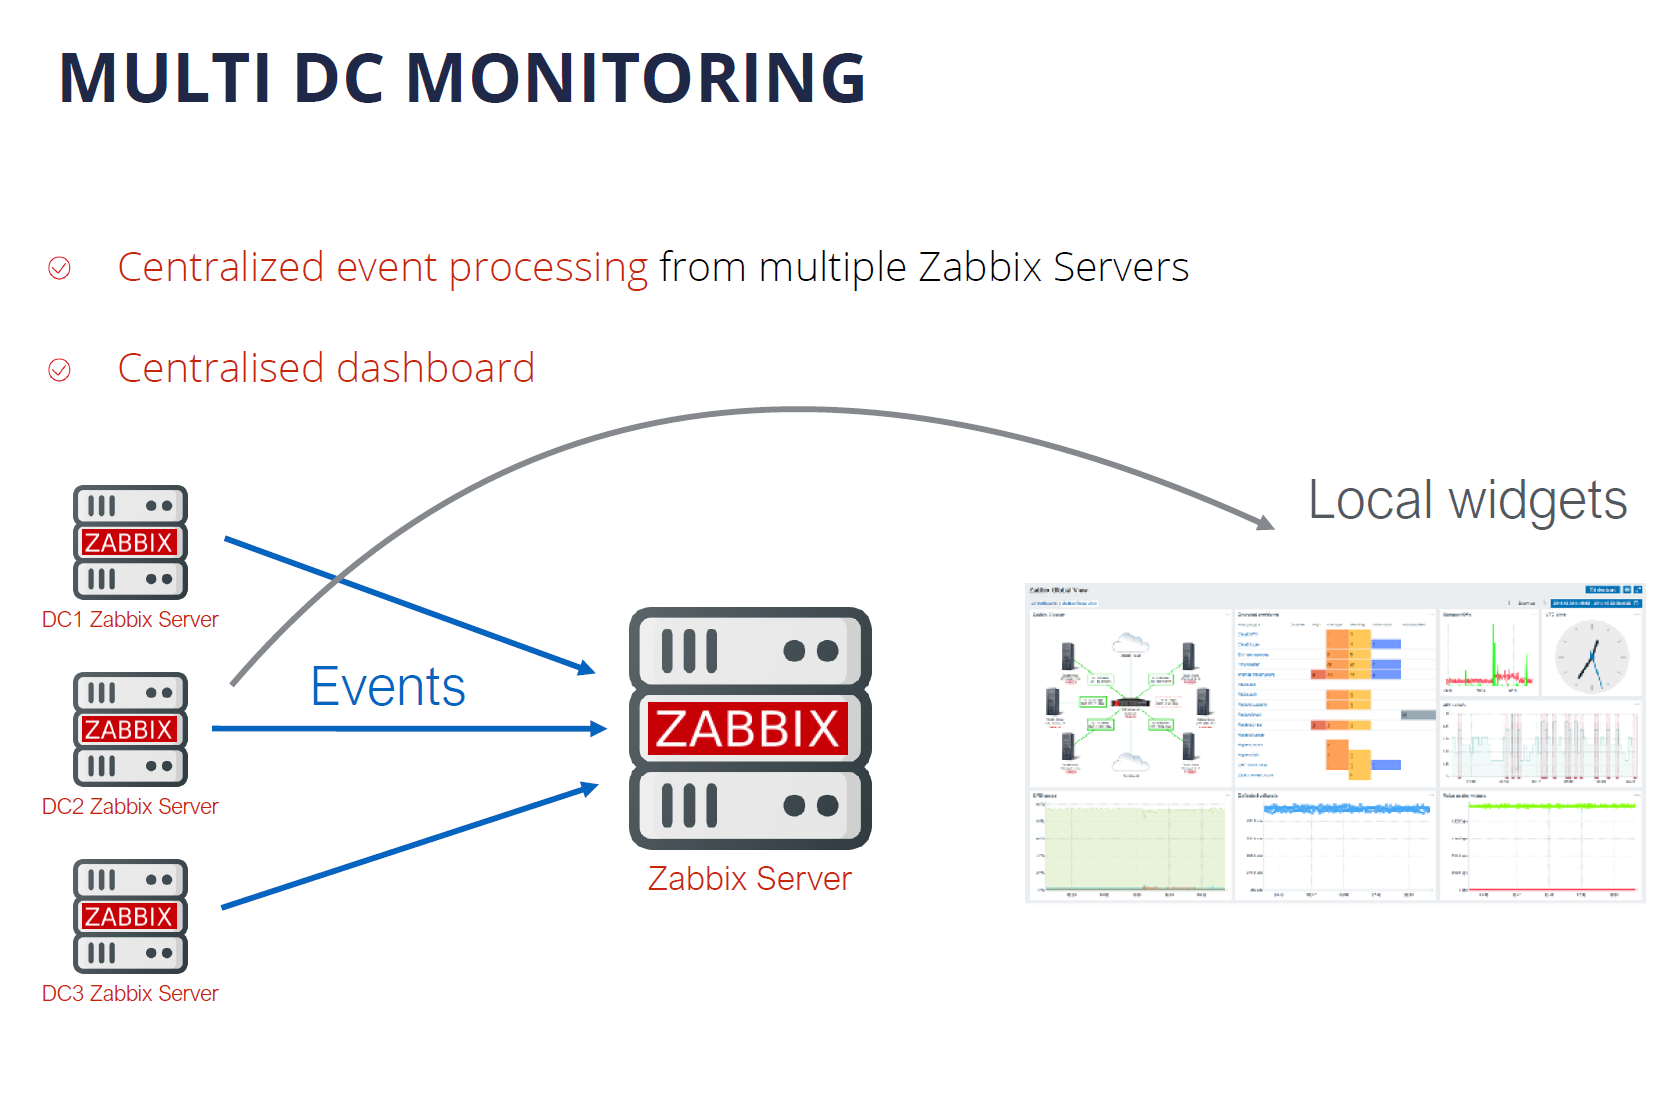
Multi DC Monitoring

Currently, Multi DC monitoring can be done with Zabbix by deploying a distributed Zabbix instance that utilizes Zabbix proxies. But there are use cases, where it would be more beneficial to have multiple Zabbix servers deployed across different datacenters – all reporting to a single location for centralized event processing, centralized visualization, and reporting as well as centralized dashboards. This is something that is coming soon to Zabbix.

Zabbix Release Schedule

Of course, the burning question is – when is Zabbix 6.0 LTS going to be released? And we are very close to finalizing the next LTS release. I would expect Zabbix 6.0 LTS to be officially released in January 2022.

As for Zabbix 6.2 and 6.4 – these releases are still planned for Q2 and Q4, 2022. The next LTS release – Zabbix 7.0 LTS is planned to be released in Q2, 2023.

Zabbix Roadmap

If you want to follow the development of Zabbix – we have a special page just for that – the Zabbix Roadmap. Here you can find up-to-date information about the development plans for Zabbix 6.2, 6.4, and 7.0 LTS. The Roadmap also represents the current development status of Zabbix 6.0 LTS.

Questions

Q: What would you say is the main benefit of why users should migrate from Zabbix 5.0/4.0 or older versions to 6.0 LTS?

A: I think that Zabbix 6.0 LTS is a very different product – even when you compare it with the relatively recent Zabbix 5.0 LTS. It comes with many improvements, some of which I mentioned here in my keynote. For example, Business Service monitoring provides huge added value to enterprise customers.

With the new trigger syntax and the new functions related to anomaly detection and baseline monitoring our users can get much more out of the data that they already have in their monitoring tool.

The new visualization options – multiple new widgets, geographical maps, scheduled PDF reporting provide a lot of added value to our end-users and to their customers as well.

Q: Any plans to make changes on the Zabbix DB backend level – make it more scaleable or completely redesign it?

A: Right now we keep all of our information in a relational database such as MySQL or PostgreSQL. We have added the support for TimescaleDB which brings some huge advantages to our users, thanks to improved data storage and performance efficiency.

But we still have users that wish to connect different storage engines to Zabbix – maybe specifically optimized to keep time-series data. Actually, this is already on our roadmap. Our plan is to introduce a unified API for historical data so that if you wish to attach your own storage, we just have to deploy a plugin that will communicate both with our historical API and also talk to the storage engine of your choosing. This feature is coming and is already on our Roadmap.

Q: What is your personal favorite feature? Something that you 100% wanted to see implemented in Zabbix 6.0 LTS?

A: I see Zabbix 6.0 LTS as a combination of Zabbix 5.2, 5.4, and finally the features introduced directly in Zabbix 6.0 LTS. Personally, I think that my favorite features in Zabbix 6.0 LTS are features that make up the latest implementation of Anomaly detection.

We could be at the very beginning of exploring more advanced machine learning and statistical analysis capabilities, but I’m pretty sure that with every new release of Zabbix there will be new features related to machine learning, anomaly detection, and trend prediction.

This could provide a way for Zabbix to generate and share insights with our users. Analysis of what’s happening with your system, with your metrics – how the metrics in your system behave.

Store your Cloudflare logs on R2

Post Syndicated from Tanushree Sharma original https://blog.cloudflare.com/store-your-cloudflare-logs-on-r2/

Store your Cloudflare logs on R2

Store your Cloudflare logs on R2

We’re excited to announce that customers will soon be able to store their Cloudflare logs on Cloudflare R2 storage. Storing your logs on Cloudflare will give CIOs and Security Teams an opportunity to consolidate their infrastructure; creating simplicity, savings and additional security.

Cloudflare protects your applications from malicious traffic, speeds up connections, and keeps bad actors out of your network. The logs we produce from our products help customers answer questions like:

  • Why are requests being blocked by the Firewall rules I’ve set up?
  • Why are my users seeing disconnects from my applications that use Spectrum?
  • Why am I seeing a spike in Cloudflare Gateway requests to a specific application?

Storage on R2 adds to our existing suite of logging products. Storing logs on R2 fills in gaps that our customers have been asking for: a cost-effective solution to store logs for any of our products for any period of time.

Goodbye to old school logging

Let’s rewind to the early 2000s. Most organizations were running their own self-managed infrastructure: network devices, firewalls, servers and all the associated software. Each company has to manage logs coming from hundreds of sources in the IT stack. With dedicated storage needed for retaining an endless volume of logs, specialized teams are required to build an ETL pipeline and make the data actionable.

Fast-forward to the 2010s. Organizations are transitioning to using managed services for their IT functions. As a result of this shift, the way that customers collect logs for all their services have changed too. With managed services, much of the logging load is shifted off of the customer.

The challenge now: collecting logs from a combination of managed services, each of which has its own quirks. Logs can be sent at varying latencies, in different formats and some are too detailed while others not detailed enough. To gain a single pane view of their IT infrastructure, companies need to build or buy a SIEM solution.

Cloudflare replaces these sets of managed services. When a customer onboards to Cloudflare, we make it super easy to gain visibility to their traffic that hits our network. We’ve built analytics for many of our products, such as CDN, Firewall, Magic Transit and Spectrum to both view high level trends and dig into patterns by slicing and dicing data.

Analytics are a great way to see data at an aggregate level, but we know that raw logs are important to our customers as well, so we’ve built out a set of logging products.

Logging today

During Speed Week we announced Instant Logs to show customers traffic as it hits their domain. Instant Logs is perfect for live debugging and triaging use cases. Monitor your traffic, make a config change and instantly view its impacts. In cases where you need to retroactively inspect your logs, we have Logpush.

We’ve built an impressive logging pipeline to get data from the 250+ cities that house our data centers to our customers in under a minute using Logpush. If your organization has existing practices for getting data across your stack into one place, we support Logpush to a variety of cloud storage or SIEM destinations. We also have partnerships in place with major SIEM platforms to surface Cloudflare data in ways that are meaningful to our customers.

Last but not least is Logpull. Using Logpull, customers can access HTTP request logs using our REST API. Our customers like Logpull because it’s easy to configure, they don’t have to worry about storing logs on a third party, and you can pull data ad hoc for up to seven days.

Why Cloudflare storage?

The top four requests we’ve heard from customers when it comes to logs are:

  • I have tight budgets and need low cost log storage.
  • They should be low effort to set up and maintain.
  • I should be able to store logs for as long as I need to.
  • I want to access my logs on Cloudflare for any product.

For many of our customers, Cloudflare is one of the most important data sources, and it also generates more data than other applications on their IT stack. R2 is significantly cheaper than other cloud providers, so our customers don’t need to compromise by sampling or leaving out logs from products all together in order to cut down on costs.

Just like the simplicity of Logpull, log storage on R2 will be quick and easy. With a one click setup, we’ll store your logs, and you don’t have to worry about any configuration details. Retention is totally in our customer’s control to match the security and compliance needs of their business. With R2, you can also store your logs for any products we have logging for today (and we’re always adding more as our product line expands).

Log storage; we’re just getting started

With log storage on Cloudflare, we’re creating the building blocks to allow customers to perform log analysis and forensics capabilities directly on Cloudflare. Whether conducting an investigation, responding to a support request or addressing an incident, using analytics for a birds eye view and inspecting logs to determine the root cause is a powerful combination.

If you’re interested in getting notified when you can store your logs on Cloudflare, sign up through this form.

We’re always looking for talented engineers to take on the challenges of working with data at an incredible scale. If you’re interested apply here.

Replace your hardware firewalls with Cloudflare One

Post Syndicated from Ankur Aggarwal original https://blog.cloudflare.com/replace-your-hardware-firewalls-with-cloudflare-one/

Replace your hardware firewalls with Cloudflare One

Replace your hardware firewalls with Cloudflare One

Today, we’re excited to announce new capabilities to help customers make the switch from hardware firewall appliances to a true cloud-native firewall built for next-generation networks. Cloudflare One provides a secure, performant, and Zero Trust-enabled platform for administrators to apply consistent security policies across all of their users and resources. Best of all, it’s built on top of our global network, so you never need to worry about scaling, deploying, or maintaining your edge security hardware.

As part of this announcement, Cloudflare launched the Oahu program today to help customers leave legacy hardware behind; in this post we’ll break down the new capabilities that solve the problems of previous firewall generations and save IT teams time and money.

How did we get here?

In order to understand where we are today, it’ll be helpful to start with a brief history of IP firewalls.

Stateless packet filtering for private networks

The first generation of network firewalls were designed mostly to meet the security requirements of private networks, which started with the castle and moat architecture we defined as Generation 1 in our post yesterday. Firewall administrators could build policies around signals available at layers 3 and 4 of the OSI model (primarily IPs and ports), which was perfect for (e.g.) enabling a group of employees on one floor of an office building to access servers on another via a LAN.

This packet filtering capability was sufficient until networks got more complicated, including by connecting to the Internet. IT teams began needing to protect their corporate network from bad actors on the outside, which required more sophisticated policies.

Better protection with stateful & deep packet inspection

Firewall hardware evolved to include stateful packet inspection and the beginnings of deep packet inspection, extending basic firewall concepts by tracking the state of connections passing through them. This enabled administrators to (e.g.) block all incoming packets not tied to an already present outgoing connection.

These new capabilities provided more sophisticated protection from attackers. But the advancement came at a cost: supporting this higher level of security required more compute and memory resources. These requirements meant that security and network teams had to get better at planning the capacity they’d need for each new appliance and make tradeoffs between cost and redundancy for their network.

In addition to cost tradeoffs, these new firewalls only provided some insight into how the network was used. You could tell users were accessing 198.51.100.10 on port 80, but to do a further investigation about what these users were accessing would require you to do a reverse lookup of the IP address. That alone would only land you at the front page of the provider, with no insight into what was accessed, reputation of the domain/host, or any other information to help answer “Is this a security event I need to investigate further?”. Determining the source would be difficult here as well, it would require correlating a private IP address handed out via DHCP with a device and then subsequently a user (if you remembered to set long lease times and never shared devices).

Application awareness with next generation firewalls

To accommodate these challenges, the industry introduced the Next Generation Firewall (NGFW). These were the long reigning, and in some cases are still the industry standard, corporate edge security device. They adopted all the capabilities of previous generations while adding in application awareness to help administrators gain more control over what passed through their security perimeter. NGFWs introduced the concept of vendor-provided or externally-provided application intelligence, the ability to identify individual applications from traffic characteristics. Intelligence which could then be fed into policies defining what users could and couldn’t do with a given application.

As more applications moved to the cloud, NGFW vendors started to provide virtualized versions of their appliances. These allowed administrators to no longer worry about lead times for the next hardware version and allowed greater flexibility when deploying to multiple locations.

Over the years, as the threat landscape continued to evolve and networks became more complex, NGFWs started to build in additional security capabilities, some of which helped consolidate multiple appliances. Depending on the vendor, these included VPN Gateways, IDS/IPS, Web Application Firewalls, and even things like Bot Management and DDoS protection. But even with these features, NGFWs had their drawbacks — administrators still needed to spend time designing and configuring redundant (at least primary/secondary) appliances, as well as choosing which locations had firewalls and incurring performance penalties from backhauling traffic there from other locations. And even still, careful IP address management was required when creating policies to apply pseudo identity.

Adding user-level controls to move toward Zero Trust

As firewall vendors added more sophisticated controls, in parallel, a paradigm shift for network architecture was introduced to address the security concerns introduced as applications and users left the organization’s “castle” for the Internet. Zero Trust security means that no one is trusted by default from inside or outside the network, and verification is required from everyone trying to gain access to resources on the network. Firewalls started incorporating Zero Trust principles by integrating with identity providers (IdPs) and allowing users to build policies around user groups — “only Finance and HR can access payroll systems” — enabling finer-grained control and reducing the need to rely on IP addresses to approximate identity.

These policies have helped organizations lock down their networks and get closer to Zero Trust, but CIOs are still left with problems: what happens when they need to integrate another organization’s identity provider? How do they safely grant access to corporate resources for contractors? And these new controls don’t address the fundamental problems with managing hardware, which still exist and are getting more complex as companies go through business changes like adding and removing locations or embracing hybrid forms of work. CIOs need a solution that works for the future of corporate networks, instead of trying to duct tape together solutions that address only some aspects of what they need.

The cloud-native firewall for next-generation networks

Cloudflare is helping customers build the future of their corporate networks by unifying network connectivity and Zero Trust security. Customers who adopt the Cloudflare One platform can deprecate their hardware firewalls in favor of a cloud-native approach, making IT teams’ lives easier by solving the problems of previous generations.

Connect any source or destination with flexible on-ramps

Rather than managing different devices for different use cases, all traffic across your network — from data centers, offices, cloud properties, and user devices — should be able to flow through a single global firewall. Cloudflare One enables you to connect to the Cloudflare network with a variety of flexible on-ramp methods including network-layer (GRE or IPsec tunnels) or application-layer tunnels, direct connections, BYOIP, and a device client. Connectivity to Cloudflare means access to our entire global network, which eliminates many of the challenges with physical or virtualized hardware:

  • No more capacity planning: The capacity of your firewall is the capacity of Cloudflare’s global network (currently >100Tbps and growing).
  • No more location planning: Cloudflare’s Anycast network architecture enables traffic to connect automatically to the closest location to its source. No more picking regions or worrying about where your primary/backup appliances are — redundancy and failover are built in by default.
  • No maintenance downtimes: Improvements to Cloudflare’s firewall capabilities, like all of our products, are deployed continuously across our global edge.
  • DDoS protection built in: No need to worry about DoS attacks overwhelming your firewalls; Cloudflare’s network automatically blocks attacks close to their source and sends only the clean traffic on to its destination.

Configure comprehensive policies, from packet filtering to Zero Trust

Cloudflare One policies can be used to secure and route your organizations traffic across all the various traffic ramps. These policies can be crafted using all the same attributes available through a traditional NGFW while expanding to include Zero Trust attributes as well. These Zero Trust attributes can include one or more IdPs or endpoint security providers.

When looking strictly at layers 3 through 5 of the OSI model, policies can be based on IP, port, protocol, and other attributes in both a stateless and stateful manner. These attributes can also be used to build your private network on Cloudflare when used in conjunction with any of the identity attributes and the Cloudflare device client.

Additionally, to help relieve the burden of managing IP allow/block lists, Cloudflare provides a set of managed lists that can be applied to both stateless and stateful policies. And on the more sophisticated end, you can also perform deep packet inspection and write programmable packet filters to enforce a positive security model and thwart the largest of attacks.

Cloudflare’s intelligence helps power our application and content categories for our Layer 7 policies, which can be used to protect your users from security threats, prevent data exfiltration, and audit usage of company resources. This starts with our protected DNS resolver, which is built on top of our performance leading consumer 1.1.1.1 service. Protected DNS allows administrators to protect their users from navigating or resolving any known or potential security risks. Once a domain is resolved, administrators can apply HTTP policies to intercept, inspect, and filter a user’s traffic. And if those web applications are self-hosted or SaaS enabled you can even protect them using a Cloudflare access policy, which acts as a web based identity proxy.

Last but not least, to help prevent data exfiltration, administrators can lock down access to external HTTP applications by utilizing remote browser isolation. And coming soon, administrators will be able to log and filter which commands a user can execute over an SSH session.

Simplify policy management: one click to propagate rules everywhere

Traditional firewalls required deploying policies on each device or configuring and maintaining an orchestration tool to help with this process. In contrast, Cloudflare allows you to manage policies across our entire network from a simple dashboard or API, or use Terraform to deploy infrastructure as code. Changes propagate across the edge in seconds thanks to our Quicksilver technology. Users can get visibility into traffic flowing through the firewall with logs, which are now configurable.

Consolidating multiple firewall use cases in one platform

Firewalls need to cover a myriad of traffic flows to satisfy different security needs, including blocking bad inbound traffic, filtering outbound connections to ensure employees and applications are only accessing safe resources, and inspecting internal (“East/West”) traffic flows to enforce Zero Trust. Different hardware often covers one or multiple use cases at different locations; we think it makes sense to consolidate these as much as possible to improve ease of use and establish a single source of truth for firewall policies. Let’s walk through some use cases that were traditionally satisfied with hardware firewalls and explain how IT teams can satisfy them with Cloudflare One.

Protecting a branch office

Traditionally, IT teams needed to provision at least one hardware firewall per office location (multiple for redundancy). This involved forecasting the amount of traffic at a given branch and ordering, installing, and maintaining the appliance(s). Now, customers can connect branch office traffic to Cloudflare from whatever hardware they already have — any standard router that supports GRE or IPsec will work — and control filtering policies across all of that traffic from Cloudflare’s dashboard.

Step 1: Establish a GRE or IPsec tunnel
The majority of mainstream hardware providers support GRE and/or IPsec as tunneling methods. Cloudflare will provide an Anycast IP address to use as the tunnel endpoint on our side, and you configure a standard GRE or IPsec tunnel with no additional steps — the Anycast IP provides automatic connectivity to every Cloudflare data center.

Step 2: Configure network-layer firewall rules
All IP traffic can be filtered through Magic Firewall, which includes the ability to construct policies based on any packet characteristic — e.g., source or destination IP, port, protocol, country, or bit field match. Magic Firewall also integrates with IP Lists and includes advanced capabilities like programmable packet filtering.

Step 3: Upgrade traffic for application-level firewall rules
After it flows through Magic Firewall, TCP and UDP traffic can be “upgraded” for fine-grained filtering through Cloudflare Gateway. This upgrade unlocks a full suite of filtering capabilities including application and content awareness, identity enforcement, SSH/HTTP proxying, and DLP.

Replace your hardware firewalls with Cloudflare One

Protecting a high-traffic data center or VPC

Firewalls used for processing data at a high-traffic headquarters or data center location can be some of the largest capital expenditures in an IT team’s budget. Traditionally, data centers have been protected by beefy appliances that can handle high volumes gracefully, which comes at an increased cost. With Cloudflare’s architecture, because every server across our network can share the responsibility of processing customer traffic, no one device creates a bottleneck or requires expensive specialized components. Customers can on-ramp traffic to Cloudflare with BYOIP, a standard tunnel mechanism, or Cloudflare Network Interconnect, and process up to terabits per second of traffic through firewall rules smoothly.

Replace your hardware firewalls with Cloudflare One

Protecting a roaming or hybrid workforce

In order to connect to corporate resources or get secure access to the Internet, users in traditional network architectures establish a VPN connection from their devices to a central location where firewalls are located. There, their traffic is processed before it’s allowed to its final destination. This architecture introduces performance penalties and while modern firewalls can enable user-level controls, they don’t necessarily achieve Zero Trust. Cloudflare enables customers to use a device client as an on-ramp to Zero Trust policies; watch out for more updates later this week on how to smoothly deploy the client at scale.

Replace your hardware firewalls with Cloudflare One

What’s next

We can’t wait to keep evolving this platform to serve new use cases. We’ve heard from customers who are interested in expanding NAT Gateway functionality through Cloudflare One, who want richer analytics, reporting, and user experience monitoring across all our firewall capabilities, and who are excited to adopt a full suite of DLP features across all of their traffic flowing through Cloudflare’s network. Updates on these areas and more are coming soon (stay tuned).

Cloudflare’s new firewall capabilities are available for enterprise customers today. Learn more here and check out the Oahu Program to learn how you can migrate from hardware firewalls to Zero Trust — or talk to your account team to get started today.

How We Used eBPF to Build Programmable Packet Filtering in Magic Firewall

Post Syndicated from Chris J Arges original https://blog.cloudflare.com/programmable-packet-filtering-with-magic-firewall/

How We Used eBPF to Build Programmable Packet Filtering in Magic Firewall

How We Used eBPF to Build Programmable Packet Filtering in Magic Firewall

Cloudflare actively protects services from sophisticated attacks day after day. For users of Magic Transit, DDoS protection detects and drops attacks, while Magic Firewall allows custom packet-level rules, enabling customers to deprecate hardware firewall appliances and block malicious traffic at Cloudflare’s network. The types of attacks and sophistication of attacks continue to evolve, as recent DDoS and reflection attacks against VoIP services targeting protocols such as Session Initiation Protocol (SIP) have shown. Fighting these attacks requires pushing the limits of packet filtering beyond what traditional firewalls are capable of. We did this by taking best of class technologies and combining them in new ways to turn Magic Firewall into a blazing fast, fully programmable firewall that can stand up to even the most sophisticated of attacks.

Magical Walls of Fire

Magic Firewall is a distributed stateless packet firewall built on Linux nftables. It runs on every server, in every Cloudflare data center around the world. To provide isolation and flexibility, each customer’s nftables rules are configured within their own Linux network namespace.

How We Used eBPF to Build Programmable Packet Filtering in Magic Firewall

This diagram shows the life of an example packet when using Magic Transit, which has Magic Firewall built in. First, packets go into the server and DDoS protections are applied, which drops attacks as early as possible. Next, the packet is routed into a customer-specific network namespace, which applies the nftables rules to the packets. After this, packets are routed back to the origin via a GRE tunnel. Magic Firewall users can construct firewall statements from a single API, using a flexible Wirefilter syntax. In addition, rules can be configured via the Cloudflare dashboard, using friendly UI drag and drop elements.

Magic Firewall provides a very powerful syntax for matching on various packet parameters, but it is also limited to the matches provided by nftables. While this is more than sufficient for many use cases, it does not provide enough flexibility to implement the advanced packet parsing and content matching we want. We needed more power.

Hello eBPF, meet Nftables!

When looking to add more power to your Linux networking needs, Extended Berkeley Packet Filter (eBPF) is a natural choice. With eBPF, you can insert packet processing programs that execute in the kernel, giving you the flexibility of familiar programming paradigms with the speed of in-kernel execution. Cloudflare loves eBPF and this technology has been transformative in enabling many of our products. Naturally, we wanted to find a way to use eBPF to extend our use of nftables in Magic Firewall. This means being able to match, using an eBPF program within a table and chain as a rule. By doing this we can have our cake and eat it too, by keeping our existing infrastructure and code, and extending it further.

If nftables could leverage eBPF natively, this story would be much shorter; alas, we had to continue our quest. To get us started in our search, we know that iptables integrates with eBPF. For example, one can use iptables and a pinned eBPF program for dropping packets with the following command:

iptables -A INPUT -m bpf --object-pinned /sys/fs/bpf/match -j DROP

This clue helped to put us on the right path. Iptables uses the xt_bpf extension to match on an eBPF program. This extension uses the BPF_PROG_TYPE_SOCKET_FILTER eBPF program type, which allows us to load the packet information from the socket buffer and return a value based on our code.

Since we know iptables can use eBPF, why not just use that? Magic Firewall currently leverages nftables, which is a great choice for our use case due to its flexibility in syntax and programmable interface. Thus, we need to find a way to use the xt_bpf extension with nftables.

How We Used eBPF to Build Programmable Packet Filtering in Magic Firewall

This diagram helps explain the relationship between iptables, nftables and the kernel. The nftables API can be used by both the iptables and nft userspace programs, and can configure both xtables matches (including xt_bpf) and normal nftables matches.

This means that given the right API calls (netlink/netfilter messages), we can embed an xt_bpf match within an nftables rule. In order to do this, we need to understand which netfilter messages we need to send. By using tools such as strace, Wireshark, and especially using the source we were able to construct a message that could append an eBPF rule given a table and chain.

NFTA_RULE_TABLE table
NFTA_RULE_CHAIN chain
NFTA_RULE_EXPRESSIONS | NFTA_MATCH_NAME
	NFTA_LIST_ELEM | NLA_F_NESTED
	NFTA_EXPR_NAME "match"
		NLA_F_NESTED | NFTA_EXPR_DATA
		NFTA_MATCH_NAME "bpf"
		NFTA_MATCH_REV 1
		NFTA_MATCH_INFO ebpf_bytes	

The structure of the netlink/netfilter message to add an eBPF match should look like the above example. Of course, this message needs to be properly embedded and include a conditional step, such as a verdict, when there is a match. The next step was decoding the format of `ebpf_bytes` as shown in the example below.

 struct xt_bpf_info_v1 {
	__u16 mode;
	__u16 bpf_program_num_elem;
	__s32 fd;
	union {
		struct sock_filter bpf_program[XT_BPF_MAX_NUM_INSTR];
		char path[XT_BPF_PATH_MAX];
	};
};

The bytes format can be found in the kernel header definition of struct xt_bpf_info_v1. The code example above shows the relevant parts of the structure.

The xt_bpf module supports both raw bytecodes, as well as a path to a pinned ebpf program. The later mode is the technique we used to combine the ebpf program with nftables.

With this information we were able to write code that could create netlink messages and properly serialize any relevant data fields. This approach was just the first step, we are also looking into incorporating this into proper tooling instead of sending custom netfilter messages.

Just Add eBPF

Now we needed to construct an eBPF program and load it into an existing nftables table and chain. Starting to use eBPF can be a bit daunting. Which program type do we want to use? How do we compile and load our eBPF program? We started this process by doing some exploration and research.

First we constructed an example program to try it out.

SEC("socket")
int filter(struct __sk_buff *skb) {
  /* get header */
  struct iphdr iph;
  if (bpf_skb_load_bytes(skb, 0, &iph, sizeof(iph))) {
    return BPF_DROP;
  }

  /* read last 5 bytes in payload of udp */
  __u16 pkt_len = bswap_16(iph.tot_len);
  char data[5];
  if (bpf_skb_load_bytes(skb, pkt_len - sizeof(data), &data, sizeof(data))) {
    return BPF_DROP;
  }

  /* only packets with the magic word at the end of the payload are allowed */
  const char SECRET_TOKEN[5] = "xyzzy";
  for (int i = 0; i < sizeof(SECRET_TOKEN); i++) {
    if (SECRET_TOKEN[i] != data[i]) {
      return BPF_DROP;
    }
  }

  return BPF_OK;
}

The excerpt mentioned is an example of an eBPF program that only accepts packets that have a magic string at the end of the payload. This requires checking the total length of the packet to find where to start the search. For clarity, this example omits error checking and headers.

Once we had a program, the next step was integrating it into our tooling. We tried a few technologies to load the program, like BCC, libbpf, and we even created a custom loader. Ultimately, we ended up using cilium’s ebpf library, since we are using Golang for our control-plane program and the library makes it easy to generate, embed and load eBPF programs.

# nft list ruleset
table ip mfw {
	chain input {
		#match bpf pinned /sys/fs/bpf/mfw/match drop
	}
}

Once the program is compiled and pinned, we can add matches into nftables using netlink commands. Listing the ruleset shows the match is present. This is incredible! We are now able to deploy custom C programs to provide advanced matching inside a Magic Firewall ruleset!

More Magic

With the addition of eBPF to our toolkit, Magic Firewall is an even more flexible and powerful way to protect your network from bad actors. We are now able to look deeper into packets and implement more complex matching logic than nftables alone could provide. Since our firewall is running as software on all Cloudflare servers, we can quickly iterate and update features.

One outcome of this project is SIP protection, which is currently in beta. That’s only the beginning. We are currently exploring using eBPF for protocol validations, advanced field matching, looking into payloads, and supporting even larger sets of IP lists.

We welcome your help here, too! If you have other use cases and ideas, please talk to your account team. If you find this technology interesting, come join our team!

PII and Selective Logging controls for Cloudflare’s Zero Trust platform

Post Syndicated from Ankur Aggarwal original https://blog.cloudflare.com/pii-and-selective-logging-controls-for-cloudflares-zero-trust-platform/

PII and Selective Logging controls for Cloudflare’s Zero Trust platform

PII and Selective Logging controls for Cloudflare’s Zero Trust platform

At Cloudflare, we believe that you shouldn’t have to compromise privacy for security. Last year, we launched Cloudflare Gateway — a comprehensive, Secure Web Gateway with built-in Zero Trust browsing controls for your organization. Today, we’re excited to share the latest set of privacy features available to administrators to log and audit events based on your team’s needs.

Protecting your organization

Cloudflare Gateway helps organizations replace legacy firewalls while also implementing Zero Trust controls for their users. Gateway meets you wherever your users are and allows them to connect to the Internet or even your private network running on Cloudflare. This extends your security perimeter without having to purchase or maintain any additional boxes.

Organizations also benefit from improvements to user performance beyond just removing the backhaul of traffic to an office or data center. Cloudflare’s network delivers security filters closer to the user in over 250 cities around the world. Customers start their connection by using the world’s fastest DNS resolver. Once connected, Cloudflare intelligently routes their traffic through our network with layer 4 network and layer 7 HTTP filters.

To get started, administrators deploy Cloudflare’s client (WARP) on user devices, whether those devices are macOS, Windows, iOS, Android, ChromeOS or Linux. The client then sends all outbound layer 4 traffic to Cloudflare, along with the identity of the user on the device.

With proxy and TLS decryption turned on, Cloudflare will log all traffic sent through Gateway and surface this in Cloudflare’s dashboard in the form of raw logs and aggregate analytics. However, in some instances, administrators may not want to retain logs or allow access to all members of their security team.

The reasons may vary, but the end result is the same: administrators need the ability to control how their users’ data is collected and who can audit those records.

Legacy solutions typically give administrators an all-or-nothing blunt hammer. Organizations could either enable or disable all logging. Without any logging, those services did not capture any personally identifiable information (PII). By avoiding PII, administrators did not have to worry about control or access permissions, but they lost all visibility to investigate security events.

That lack of visibility adds even more complications when teams need to address tickets from their users to answer questions like “why was I blocked?”, “why did that request fail?”, or “shouldn’t that have been blocked?”. Without logs related to any of these events, your team can’t help end users diagnose these types of issues.

Protecting your data

Starting today, your team has more options to decide the type of information Cloudflare Gateway logs and who in your organization can review it. We are releasing role-based dashboard access for the logging and analytics pages, as well as selective logging of events. With role-based access, those with access to your account will have PII information redacted from their dashboard view by default.

We’re excited to help organizations build least-privilege controls into how they manage the deployment of Cloudflare Gateway. Security team members can continue to manage policies or investigate aggregate attacks. However, some events call for further investigation. With today’s release, your team can delegate the ability to review and search using PII to specific team members.

We still know that some customers want to reduce the logs stored altogether, and we’re excited to help solve that too. Now, administrators can now select what level of logging they want Cloudflare to store on their behalf. They can control this for each component, DNS, Network, or HTTP and can even choose to only log block events.

That setting does not mean you lose all logs — just that Cloudflare never stores them. Selective logging combined with our previously released Logpush service allows users to stop storage of logs on Cloudflare and turn on a Logpush job to their destination of choice in their location of choice as well.

How to Get Started

To get started, any Cloudflare Gateway customer can visit the Cloudflare for Teams dashboard and navigate to Settings > Network. The first option on this page will be to specify your preference for activity logging. By default, Gateway will log all events, including DNS queries, HTTP requests and Network sessions. In the network settings page, you can then refine what type of events you wish to be logged. For each component of Gateway you will find three options:

  1. Capture all
  2. Capture only blocked
  3. Don’t capture
PII and Selective Logging controls for Cloudflare’s Zero Trust platform

Additionally, you’ll find an option to redact all PII from logs by default. This will redact any information that can be used to potentially identify a user including User Name, User Email, User ID, Device ID, source IP, URL, referrer and user agent.

We’ve also included new roles within the Cloudflare dashboard, which provide better granularity when partitioning Administrator access to Access or Gateway components. These new roles will go live in January 2022 and can be modified on enterprise accounts by visiting Account Home → Members.

If you’re not yet ready to create an account, but would like to explore our Zero Trust services, check out our interactive demo where you can take a self-guided tour of the platform with narrated walkthroughs of key use cases, including setting up DNS and HTTP filtering with Cloudflare Gateway.

What’s Next

Moving forward, we’re excited to continue adding more and more privacy features that will give you and your team more granular control over your environment. The features announced today are available to users on any plan; your team can follow this link to get started today.

Get notified when your site is under attack

Post Syndicated from Michael Tremante original https://blog.cloudflare.com/get-notified-when-your-site-is-under-attack/

Get notified when your site is under attack

Get notified when your site is under attack

Our core application security features such as the WAF, firewall rules and rate limiting help keep millions of Internet properties safe. They all do so quietly without generating any notifications when attack traffic is blocked, as our focus has always been to stop malicious requests first and foremost.

Today, we are happy to announce a big step in that direction. Business and Enterprise customers can now set up proactive alerts whenever we observe a spike in firewall related events indicating a likely ongoing attack.

Alerts can be configured via email, PagerDuty or webhooks, allowing for flexible integrations across many systems.

You can find and set up the new alert types under the notifications tab in your Cloudflare account.

What Notifications are available?

Two new notification types have been added to the platform.

Security Events Alert

This notification can be set up on Business and Enterprise zones, and will alert on any spike of firewall related events across all products and services. You will receive the alert within two hours of the attack being mitigated.

Advanced Security Events Alert

This notification can be set up on Enterprise zones only. It allows you to filter on the exact security service you are interested in monitoring and different notifications can be set up for different services as necessary. The alert will fire within five minutes of the attack being mitigated.

Alerting on Application Security Anomalies

We’ve previously blogged about how accurately calculating anomalies in time series data sets is hard. Simple threshold alerting — “notify me if there are more than X events” — doesn’t work well. It takes a lot of work to tune the specific thresholds to be accurate, and even then you’re still likely to end up with false positives or missed events.

For Origin Error Rate notifications, we leaned on the methodology outlined in the Google SRE Handbook for alerting based on Service Level Objectives (SLOs). However, SLO alerting assumes that there is an established baseline. We know exactly what percentage of responses from your origin are “allowed” to be errors before something is definitely wrong. We don’t know what that percentage is for Firewall events. For example, Internet properties with many Firewall rules are more likely to have more Firewall events than Internet properties with few Firewall rules.

Instead of using SLO based alerting for Security Event notifications, we’re using Z-score calculations. The z-score methodology calculates how many standard deviations away from the mean a certain data point is. For Security Event notifications we can take the mean number of Firewall events for each distinct Internet property as the effective “baseline”, and compare the current number of Firewall events to see if there is a significant spike.

In this first iteration, a z-score threshold of 3.5 has been configured in the system and will be adjusted based on customer feedback. You can read more about the system in our WAF developer docs.

Getting started with Application Security Event notifications

To configure these notifications, navigate to the Notifications tab of the dashboard and click “Add”. Select Security Events Alert or Advanced Security Events Alert.

Get notified when your site is under attack

As with all Cloudflare notifications, you’re able to name and describe your notification, and choose how you want to be notified. From there, you can select which domains you want to monitor.

Get notified when your site is under attack

For Advanced Security Event notifications, you can also select which services the notification should monitor. The log value in Firewall Event logs for each relevant service is also displayed in the event you are integrating directly with Cloudflare logs and wish to filter relevant events in your existing SIEMs.

Get notified when your site is under attack

Once the notifications have been set up, you can rely on Cloudflare to warn you whenever an anomaly is detected. An example email notification is shown below:

Get notified when your site is under attack

The alert provides details on the service detecting the events (in this case the WAF), the timestamp and the affected zone. A link is provided that will direct you to the Firewall Events dashboard filtered on the correct service and time range.

The first of many alerts!

We are looking forward to customers setting up their notifications, so they can stay on top of any malicious activity affecting their applications.

This is just the first step of many towards building a much more comprehensive suite of notifications and incident management systems directly embedded in the Cloudflare dashboard. We look forward to posting feature improvements to our application security alert system in the near future.

New – Amazon VPC Network Access Analyzer

Post Syndicated from Jeff Barr original https://aws.amazon.com/blogs/aws/new-amazon-vpc-network-access-analyzer/

If you are a member of your organization’s networking, cloud operations, or security teams, you are going to love this new feature. The new Amazon VPC Network Access Analyzer helps you identify network configurations that lead to unintended network access. As you will see in a moment, it will point out ways that you can improve your security posture while still letting you and your organization be agile and flexible. In contrast to manual checking of network configurations, which is error prone and hard to scale, this tool lets you analyze your AWS networks of any size and complexity.

Introducing Network Access Analyzer
Network Access Analyzer takes advantage of our automated reasoning technology that already powers AWS IAM Access Analyzer, Amazon VPC Reachability Analyzer, Amazon Inspector Network Reachability, and other provable security tools.

This new tool uses Network Access Scopes to specify the desired connectivity between your AWS resources. You can get started with a set of Amazon-created scopes, and then either copy & customize them, or create your own from scratch. The scopes are high-level and independent of any particular network architecture or configuration, and can be thought of as a language for specifying the proper level of access & connectivity for your network. You can, for example, create a scope to verify that all web apps use a firewall to access Internet resources, or to indicate that AWS resources used by your Finance team are separate, distinct, and unreachable from the resources used by your Development team.

To evaluate your network against a particular scope, you select it and initiate an analysis. It runs for a few minutes and then generates a set of findings, each of which indicates an unexpected network path between the AWS resources defined in the scope. You can analyze the findings, adjust your configuration or modify the scope in response to the findings, and re-run the analysis, all in just a few minutes.

The analysis process examines a very wide range of AWS resources including Security Groups, CIDR blocks, prefix lists, Elastic Network Interfaces, EC2 instances, Load Balancers, VPC, VPC subnets, VPC endpoints, VPC endpoint services, Transit Gateways, NAT Gateways, Internet Gateways, VPN Gateways, Peering Connections, and Network Firewalls. Your scopes can use Resource Groups to reference all resources that are tagged in a particular way.

Using Network Access Analyzer
To get started, I open the VPC Console, find the Network Analysis section on the left-side navigation, and click Network Access Analyzer:

I can see all of my scopes. Initially, I have four, all created by Amazon and ready to use:

To conduct an analysis, I select a scope (AWS-VPC-Ingress (Amazon created)) and click Analyze. The scope’s description reads:

“Identify ingress paths into your VPCs from Internet Gateways, Peering Connections, VPC Service Endpoints, VPN and Transit Gateways.”

The analysis runs for a couple of minutes and displays the findings as soon as it is done:

There’s a lot of very useful information here! The spectrum chart provides an overview of the resources that are in the findings. I can hover my mouse over any of the segments to learn more, or click on one in order to filter the findings and show only those that reference a particular resource or resource type:

For example, I click VPC Peering Connections and I can see all of the findings that reference the VPC peering connection:

As you can see, the Path details highlight the VPC peering connection in the path! The next step is to examine the findings, decide which ones are expected, and to add them to the scope so that they are excluded from future findings (more on that in a bit).

Inside a Network Access Scope
Let’s take a quick look inside of the Network Access Scope that I used above, and then build another scope from scratch using the visual builder. Each scope is represented in JSON format, and indicates what is considered in-scope (acceptable) traffic between sources and destinations:

{
          "networkInsightsAccessScopeId": "nis-070dc1d37ca315e86",
          "matchPaths": [
                    {
                              "source": {
                                        "resourceStatement": {
                                                  "resources": [],
                                                  "resourceTypes": [
                                                            "AWS::EC2::InternetGateway",
                                                            "AWS::EC2::VPCPeeringConnection",
                                                            "AWS::EC2::VPCEndpointService",
                                                            "AWS::EC2::TransitGatewayAttachment",
                                                            "AWS::EC2::VPNGateway"
                                                  ]
                                        }
                              },
                              "destination": {
                                        "resourceStatement": {
                                                  "resources": [],
                                                  "resourceTypes": [
                                                            "AWS::EC2::NetworkInterface"
                                                  ]
                                        }
                              }
                    }
          ],
          "excludePaths": []
}

The matchPaths element contains source and destination elements. Each of these elements, in turn, identifies AWS resource types and specific resources. While not shown here, scopes can also contain source and destination IP addresses, ports, prefix lists, and traffic types (TCP or UDP). The excludePaths can contain resource types, specific resources, and so forth. I could, for example, define sources and destinations that match all Internet Gateway ingress traffic, but exclude traffic that flows through a Load Balancer, or I could exclude SSH traffic destined for my bastion instances.

Building a Network Access Scope
I can build a new scope in three ways. I can Duplicate and modify an existing one, I can start from scratch and use the visual builder, or I can write my own JSON and use either the CLI or the API to create a scope. I click Create Network Access Scope to use the builder:

I can start with one of five predefined templates, or I can build my own:

I enter a name and a description:

Then I define the source and destinations by resource type, id, traffic type, and so forth:

I have many options for matching the traffic type. This allows me to create scopes for very specific purposes:

I can use a similar interface to add any optional exclusions.

Things to Know
This is a very powerful tool and one that I think you are going to love. Here are a couple of things to know about it:

Pricing – You pay $0.002 for each Elastic Network Interface (ENI) analyzed as part of an assessment.

Regions – Network Access Analyzer is available in the US East (N. Virginia), US East (Ohio), US West (N. California), US West (Oregon), Africa (Cape Town), Asia Pacific (Hong Kong), Asia Pacific (Mumbai), Asia Pacific (Seoul), Asia Pacific (Singapore), Asia Pacific (Sydney), Asia Pacific (Tokyo), Canada (Central), Europe (Frankfurt), Europe (Ireland), Europe (London), Europe (Milan), Europe (Paris), Europe (Stockholm), South America (São Paulo), and Middle East (Bahrain) Regions.

In the Works – We have lots of additional features on the product roadmap including support for AWS Organizations, the ability to run your analyses on a regular schedule, and support for IPv6 address ranges and resources.

Jeff;

New for AWS Control Tower – Region Deny and Guardrails to Help You Meet Data Residency Requirements

Post Syndicated from Danilo Poccia original https://aws.amazon.com/blogs/aws/new-for-aws-control-tower-region-deny-and-guardrails-to-help-you-meet-data-residency-requirements/

Many customers, such as those in highly regulated industries and the public sector, want to have control over where their data is stored and processed. AWS already offers many tools and features to comply with local laws and regulations, but we want to provide a simplified way to translate data residency requirements into controls that can be applied to single- and multi-account environments.

Starting today, you can use AWS Control Tower to deploy data residency preventive and detective controls, referred to as guardrails. These guardrails will prevent provisioning resources in unwanted AWS Regions by restricting access to AWS APIs through service control policies (SCPs) built and managed by AWS Control Tower. In this way, content cannot be created or transferred outside of your selected Regions at the infrastructure level. In this context, content can be software (including machine images), data, text, audio, video, or images hosted on AWS for processing or storage. For example, AWS customers in Germany can deny access to AWS services in Regions outside of Frankfurt with the exception of global services such as AWS Identity and Access Management (IAM) and AWS Organizations.

AWS Control Tower also offers guardrails to further control data residency in underlying AWS service options, for example, blocking Amazon Simple Storage Service (Amazon S3) cross-region replication or blocking the creation of internet gateways.

The AWS account used for managing AWS Control Tower is not restricted by the new Region deny settings. That account can be used for remediation if you have data in an unwanted Region before enabling Region deny.

Detective guardrails are implemented via AWS Config rules and can further detect unexpected configuration changes that should not be allowed.

You still retain a shared responsibility model for data residency at the application level, but these controls can help you restrict what infrastructure and application teams can do on AWS.

Using Data Residency Guardrails in AWS Control Tower
To use the new data residency guardrails, you need to have created a landing zone using AWS Control Tower. See Plan your AWS Control Tower landing zone for more information.

To see all the new controls that are available, I select Guardrails on the left pane of the AWS Control Tower console and then find those in the Data Residency category. I sort results by Behavior. Guardrails that have a Prevention behavior are implemented as SCPs. Those that have a Detection behavior are implemented as AWS Config rules.

Console screenshot.

The most interesting guardrail is probably the one denying access to AWS based on the requested AWS Region. I choose it from the list and find that it is different from the other guardrails because it affects all Organizational Units (OUs) and cannot be activated here but must be activated in the landing zone settings.

Console screenshot.

Below the Overview, in the Guardrail components, there is a link to the full SCP for this guardrail, and I can see the list of the AWS APIs that, when this setting is enabled, are still going to be allowed towards non-governed Regions. Depending on your requirements, some of those services, such as Amazon CloudFront or AWS Global Accelerator, can be further limited by a custom SCP.

In the Landing zone settings, the Region deny guardrail is currently not enabled. I choose Modify settings and then enable the Region deny settings.

Console screenshot.

Below the Region deny settings, there is the list of AWS Regions governed by the landing zone. Those will be the regions allowed when I enable Region deny.

Console screenshot.

In my case, I have four governed Regions, two in the US and two in Europe:

  • US East (N. Virginia), which is also the home Region for the landing zone
  • US West (Oregon)
  • Europe (Ireland)
  • Europe (Frankfurt)

I choose Update landing zone at the bottom. The update of the landing zone takes a few minutes to complete. Now, the vast majority of the AWS APIs are blocked if they are not directed to one of those governed Regions. Let’s do a few tests.

Testing Region Deny in a Sandbox Account
Using AWS Single Sign-On, I copy the AWS credentials to use the sandbox account with AWSAdministratorAccess permissions. In a terminal, I paste the commands setting the environment variables to use those credentials.

Console screenshot.

Now, I try to start a new Amazon Elastic Compute Cloud (Amazon EC2) instance in US East (Ohio), one of the non-governed Regions. In a landing zone, the default VPC is replaced by a VPC managed by AWS Control Tower. To start the instance, I need to specify a VPC subnet. Let’s find a subnet ID that I can use.

aws ec2 describe-subnets --query 'Subnets[0].SubnetId' --region us-east-2

An error occurred (UnauthorizedOperation) when calling the DescribeSubnets operation:
You are not authorized to perform this operation.

As expected, I am not authorized to perform this operation in US East (Ohio). Let’s try to start an EC2 instance without passing the subnet ID.

aws ec2 run-instances --image-id ami-0dd0ccab7e2801812 --region us-east-2 \
    --instance-type t3.small                                     

An error occurred (UnauthorizedOperation) when calling the RunInstances operation:
You are not authorized to perform this operation.
Encoded authorization failure message: <ENCODED MESSAGE>

Again, I am not authorized. More information is included in the encoded authorization failure message that I can decode as described in this article:

aws sts decode-authorization-message --encoded-message <ENCODED MESSAGE>

The decoded message (that I have omitted for brevity) tells me that there was an explicit deny to my request and includes the full SCP that caused the deny. This information is really useful for debugging these kind of errors.

Now, let’s try in US East (N. Virginia), one of the four governed regions.

aws ec2 describe-subnets --query 'Subnets[0].SubnetId' --region us-east-1
"subnet-0f3580c0c5e56c210"

This time, the command returns the subnet ID of the first subnet returned by the request. Let’s start an instance in US East (N. Virginia) using this subnet.

aws ec2 run-instances --image-id  ami-04ad2567c9e3d7893 --region us-east-1 \
    --instance-type t3.small --subnet-id subnet-0f3580c0c5e56c210

As expected, it works, and I can see the EC2 instance running in the console.

Console screenshot.

Similarly, APIs for other AWS services are limited by the Region deny settings. For example, I can’t create an S3 bucket in a non-governed Region.

Console screenshot.

When I try to create the bucket, I get an access denied error.

Console screenshot.

As expected, the creation of an S3 bucket works in a governed Region.

Even if someone gives this account access to a bucket in a non-governed Region, I would not be able to copy any data into that bucket.

Other preventive guardrails can enforce data residency, for example:

  • Disallow cross-region networking for Amazon EC2, Amazon CloudFront, and AWS Global Accelerator
  • Disallow internet access for an Amazon VPC instance managed by a customer
  • Disallow Amazon Virtual Private Network (VPN) connections

Now, let’s see how detective guardrails work.

Testing Detective Guardrails in a Sandbox Account
I enable the following guardrails for all accounts in the sandbox OU:

  • Detect whether Amazon EBS snapshots are restorable by all AWS accounts
  • Detect whether public routes exist in the route table for an internet gateway

Now, I want to see what happens if I go against these guardrails. In the EC2 console, I create an EBS snapshot for the volume of the EC2 instance I started before. Then, I modify permissions to share it with all AWS accounts.

Console screenshot.

Then, in the VPC console, I create an internet gateway, attach it to the AWS Control Tower managed VPC, and update the route table of one of the private subnets to use the internet gateway.

Console screenshot.

After a few minutes, the noncompliant resources in the sandbox account are found by the detective guardrails.

Console screenshot.

I look at the information provided by the guardrails and update my configuration to fix the issues. In a multi-account setup I’d contact the account owner and ask for remediation.

Availability and Pricing
You can use data-residency guardrails to control resources in any AWS Region. To create a landing zone, you should start from one of the Regions where AWS Control Tower is offered. For more information, see the AWS Regional Services List. There is no additional cost for this feature. You pay the costs of other services used, such as AWS Config.

This feature provides you with a framework of controls and guidance for setting up a multi-account environment that addresses data residency requirements. Depending on your use case, you may use any subset of the new data residency guardrails.

Set up guardrails based on your data residency requirements with AWS Control Tower.

Danilo

Amazon CodeGuru Reviewer Introduces Secrets Detector to Identify Hardcoded Secrets and Secure Them with AWS Secrets Manager

Post Syndicated from Alex Casalboni original https://aws.amazon.com/blogs/aws/codeguru-reviewer-secrets-detector-identify-hardcoded-secrets/

Amazon CodeGuru helps you improve code quality and automate code reviews by scanning and profiling your Java and Python applications. CodeGuru Reviewer can detect potential defects and bugs in your code. For example, it suggests improvements regarding security vulnerabilities, resource leaks, concurrency issues, incorrect input validation, and deviation from AWS best practices.

One of the most well-known security practices is the centralization and governance of secrets, such as passwords, API keys, and credentials in general. As many other developers facing a strict deadline, I’ve often taken shortcuts when managing and consuming secrets in my code, using plaintext environment variables or hard-coding static secrets during local development, and then inadvertently commit them. Of course, I’ve always regretted it and wished there was an automated way to detect and secure these secrets across all my repositories.

Today, I’m happy to announce the new Amazon CodeGuru Reviewer Secrets Detector, an automated tool that helps developers detect secrets in source code or configuration files, such as passwords, API keys, SSH keys, and access tokens.

These new detectors use machine learning (ML) to identify hardcoded secrets as part of your code review process, ultimately helping you to ensure that all new code doesn’t contain hardcoded secrets before being merged and deployed. In addition to Java and Python code, secrets detectors also scan configuration and documentation files. CodeGuru Reviewer suggests remediation steps to secure your secrets with AWS Secrets Manager, a managed service that lets you securely and automatically store, rotate, manage, and retrieve credentials, API keys, and all sorts of secrets.

This new functionality is included as part of the CodeGuru Reviewer service at no additional cost and supports the most common API providers, such as AWS, Atlassian, Datadog, Databricks, GitHub, Hubspot, Mailchimp, Salesforce, SendGrid, Shopify, Slack, Stripe, Tableau, Telegram, and Twilio. Check out the full list here.

Secrets Detectors in Action
First, I select CodeGuru from the AWS Secrets Manager console. This new flow lets me associate a new repository and run a full repository analysis with the goal of identifying hardcoded secrets.

Associating a new repository only takes a few seconds. I connect my GitHub account, and then select a repository named hawkcd, which contains a few Java, C#, JavaScript, and configuration files.

A few minutes later, my full repository is successfully associated and the full scan is completed. I could also have a look at a demo repository analysis called DemoFullRepositoryAnalysisSecrets. You’ll find this demo in the CodeGuru console, under Full repository analysis, in your AWS Account.

I select the repository analysis and find 42 recommendations, including one recommendation for a hardcoded secret (you can filter recommendations by Type=Secrets). CodeGuru Reviewer identified a hardcoded AWS Access Key ID in a .travis.yml file.

The recommendation highlights the importance of storing these secrets securely, provides a link to learn more about the issue, and suggests rotating the identified secret to make sure that it can’t be reused by malicious actors in the future.

CodeGuru Reviewer lets me jump to the exact file and line of code where the secret appears, so that I can dive deeper, understand the context, verify the file history, and take action quickly.

Last but not least, the recommendation includes a Protect your credential button that lets me jump quickly to the AWS Secrets Manager console and create a new secret with the proper name and value.

I’m going to remove the plaintext secret from my source code and update my application to fetch the secret value from AWS Secrets Manager. In many cases, you can keep the current configuration structure and use existing parameters to store the secret’s name instead of the secret’s value.

Once the secret is securely stored, AWS Secrets Manager also provides me with code snippets that fetch my new secret in many programming languages using the AWS SDKs. These snippets let me save time and include the necessary SDK call, as well as the error handling, decryption, and decoding logic.

I’ve showed you how to run a full repository analysis, and of course the same analysis can be performed continuously on every new pull request to help you prevent hardcoded secrets and other issues from being introduced in the future.

Available Today with CodeGuru Reviewer
CodeGuru Reviewer Secrets Detector is available in all regions where CodeGuru Reviewer is available, at no additional cost.

If you’re new to CodeGuru Reviewer, you can try it for free for 90 days with repositories up to 100,000 lines of code. Connecting your repositories and starting a full scan takes only a couple of minutes, whether your code is hosted on AWS CodeCommit, BitBucket, or GitHub. If you’re using GitHub, check out the GitHub Actions integration as well.

You can learn more about Secrets Detector in the technical documentation.

Alex

Hands-on walkthrough of the AWS Network Firewall flexible rules engine – Part 2

Post Syndicated from Shiva Vaidyanathan original https://aws.amazon.com/blogs/security/hands-on-walkthrough-of-the-aws-network-firewall-flexible-rules-engine-part-2/

This blog post is Part 2 of Hands-on walkthrough of the AWS Network Firewall flexible rules engine – Part 1. To recap, AWS Network Firewall is a managed service that offers a flexible rules engine that gives you the ability to write firewall rules for granular policy enforcement. In Part 1, we shared how to write a rule and how the rule engine processes rules differently depending on whether you are performing stateless or stateful inspection using the action order method.

In this blog, we focus on how stateful rules are evaluated using a recently added feature—the strict rule order method. This feature gives you the ability to set one or more default actions. We demonstrate how you can use this feature to create or update your rule groups and share scenarios where this feature can be useful.

In addition, after reading this post, you’ll be able to deploy an automated serverless solution that retrieves the latest Suricata-specific rules from the community, such as from Proofpoint’s Emerging Threats OPEN ruleset. By deploying such solutions into your Amazon Web Services (AWS) environment, you can seamlessly enhance your overall security posture as the solutions fetch the latest set of intrusion detection system (IDS) rules from Proofpoint (formerly Emerging Threats) and optionally using them as intrusion prevention system (IPS) thereby keeping the rule groups updated on your Network Firewall. You can select the refresh interval to update these rulesets—the default refresh interval is 6 hours. You can also convert the set of rule groups to intrusion prevention system (IPS) mode. Finally, you have granular visibility of the various categories of rules for your Network Firewall on the AWS Management Console.

How does Network Firewall evaluate your stateful rule group?

There are two ways that Network Firewall can evaluate your stateful rule groups: the action ordering method or the strict ordering method. The settings of your rule groups must match the settings of the firewall policy that they belong to.

With the action order evaluation method for stateless inspection, all individual packets in a flow are evaluated against each rule in the policy. The rules are processed in order based on the priority assigned to them with lowest numbered rules evaluated first. For stateful inspection using the action order evaluation method, the rule engine evaluates based on the order of their action setting with pass rules processed first, then drop, then alert. The engine stops processing rules when it finds a match. The firewall also takes into consideration the order that the rules appear in the rule group, and the priority assigned to the rule, if any. Part 1 provides more details on action order evaluation.

If your firewall policy is set up to use strict ordering, Network Firewall now allows you the option to manually set a strict rule group order for stateful rule groups. Using this optional setting, the rule groups are evaluated in order of priority, starting from the lowest numbered rule, and the rules in each rule group are processed in the order in which they’re defined. You can also select which of the default actionsdrop all, drop established, alert all, or alert established—Network Firewall will take when following strict rule ordering.

A customer scenario where strict rule order is beneficial

Configuring rule groups by action order is appropriate for IDS use cases, but can be an obstacle for use cases where you deploy firewalls that follow security best practice, which is to allow only what’s required and deny everything else (default deny). You can’t achieve this best practice by using the default action order behavior. However, with strict order functionality, you can create a firewall policy that allows prioritization of stateful rules, or that can run 5-tuple and Suricata rules simultaneously. Strict rule order allows you to have a block of fine-grain rules with specific actions at the beginning followed by a coarse set of rules with specific actions and finally a default drop action. An example is shown in Figure 1 that follows.

Figure 1: An example snippet of a Network Firewall firewall policy with strict rule order

Figure 1: An example snippet of a Network Firewall firewall policy with strict rule order

Figure 1 shows that there are two different default drop actions that you can choose:
drop established and
drop all. If you choose
drop established, Network Firewall drops only the packets that are in established connections. This allows the layer 3 and 4 connection establishment packets that are needed for the upper-layer connections to be established, while dropping the packets for connections that are already established. This allows application-layer
pass rules to be written in a default-deny setup without the need to write additional rules to allow the lower-layer handshaking parts of the underlying protocols.

The drop all action drops all packets. In this scenario, you need additional rules to explicitly allow lower-level handshakes for protocols to succeed. Evaluation order for stateful rule groups provides details of how Network Firewall evaluates the different actions. In order to set the additional environment variables that are shown in the snippet, follow the instructions outlined in Examples of stateful rules for Network Firewall and the Suricata rule variables.

An example walkthrough to set up a Network Firewall policy with a stateful rule group with strict rule order and default drop action

In this section, you’ll start by creating a firewall policy with strict rule order. From there, you’ll build on it by adding a stateful rule group with strict rule order and modifying the priority order of the rules within a stateful rule group.

Step 1: Create a firewall policy with strict rule order

You can configure the default actions on policies using strict rule order, which is a property that can only be set at creation time as described below.

  1. Log in to the console and select the AWS Region where you have Network Firewall.
  2. Select VPC service on the search bar.
  3. On the left pane, under the Network Firewall section, select Firewall policies.
  4. Choose Create Firewall policy. In Describe firewall policy, enter an appropriate name and (optional) description. Choose Next.
  5. In the Add rule groups section.
    1. Select the Stateless default actions:
      1. Under Choose how to treat fragmented packets choose one of the options.
      2. Choose one of the actions for stateless default actions.
    2. Under Stateful rule order and default action
      1. Under Rule order choose Strict.
      2. Under Default actions choose the default actions for strict rule order. You can select one drop action and one or both of the alert actions from the list.
  6. Next, add an optional tag (for example, for Key enter Name, and for Value enter Firewall-Policy-Non-Production). Review and choose Create to create the firewall policy.

Step 2: Create a stateful rule group with strict rule order

  1. Log in to the console and select the AWS Region where you have Network Firewall.
  2. Select VPC service on the search bar.
  3. On the left pane, under the Network Firewall section, select Network Firewall rule groups.
  4. In the center pane, select Create Network Firewall rule group on the top right.
    1. In the rule group type, select Stateful rule group.
    2. Enter a name, description, and capacity.
    3. In the stateful rule group options select either 5-tuple or Suricata compatible IPS rules. These allow rule order to be strict.
    4. In the Stateful rule order, choose Strict.
    5. In the Add rule section, add the stateful rules that you require. Detailed instructions on creating a rule can be found at Creating a stateful rule group.
    6. Finally, Select Create stateful rule group.

Step 3: Add the stateful rule group with strict rule order to a Network Firewall policy

  1. Log in to the console and select the AWS Region where you have Network Firewall.
  2. Select VPC service on the search bar.
  3. On the left pane, under the Network Firewall section, select Firewall policies.
  4. Chose the network firewall policy you created in step 1.
  5. In the center pane, in the Stateful rule groups section, select Add rule group.
  6. Select the stateful rule group you created in step 2. Next, choose Add stateful rule group. This is explained in detail in Updating a firewall policy.

Step 4: Modify the priority of existing rules in a stateful rule group

  1. Log in to the console and select the AWS Region where you have Network Firewall.
  2. Select VPC service on the search bar.
  3. On the left pane, under the Network Firewall section, choose Network Firewall rule groups.
  4. Select the rule group that you want to edit the priority of the rules.
  5. Select the Edit rules tab. Select the rule you want to change the priority of and select the Move up and Move down buttons to reorder the rule. This is shown in Figure 2.


Figure 2: Modify the order of the rules within a stateful rule groups

Figure 2: Modify the order of the rules within a stateful rule groups

Note:

  • Rule order can be set to strict order only when network firewall policies or rule groups are created. The rule order can’t be changed to strict order evaluation on existing objects.
  • You can only associate strict-order rule groups with strict-order policies, and default-order rule groups with default-order policies. If you try to associate an incompatible rule group, you will get a validation exception.
  • Today, creating domain list-type rule groups using strict order isn’t supported. So, you won’t be able to associate domain lists with strict order policies. However, 5-tuple and Suricata compatible rules are supported.

Automated serverless solution to retrieve Suricata rules

To help simplify and maintain your more advanced Network Firewall rules, let’s look at an automated serverless solution. This solution uses an Amazon CloudWatch Events rule that’s run on a schedule. The rule invokes an AWS Lambda function that fetches the latest Suricata rules from Proofpoint’s Emerging Threats OPEN ruleset and extracts them to an Amazon Simple Storage Service (Amazon S3) bucket. Once the files lands in the S3 bucket another Lambda function is invoked that parses the Suricata rules and creates rule groups that are compatible with Network Firewall. This is shown in Figure 3 that follows. This solution was developed as an AWS Serverless Application Model (AWS SAM) package to make it less complicated to deploy. AWS SAM is an open-source framework that you can use to build serverless applications on AWS. The deployment instructions for this solution can be found in this code repository on GitHub. 

Figure 3: Network Firewall Suricata rule ingestion workflow

Figure 3: Network Firewall Suricata rule ingestion workflow

Multiple rule groups are created based on the Suricata IDS categories. This solution enables you to selectively change certain rule groups to IPS mode as required by your use case. It achieves this by modifying the default action from alert to drop in the ruleset. The modified stateful rule group can be associated to the active Network Firewall firewall policy. The quota for rule groups might need to be increased to incorporate all categories from Proofpoint’s Emerging Threats OPEN ruleset to meet your security requirements. An example screenshot of various IPS categories of rule groups created by the solution is shown in Figure 4. Setting up rule groups by categories is the preferred way to define an IPS rule, because the underlying signatures have already been grouped and maintained by Proofpoint.   

Figure 4: Rule groups created by the solution based on Suricata IPS categories

Figure 4: Rule groups created by the solution based on Suricata IPS categories

The solution provides a way to use logs in CloudWatch to troubleshoot the Suricata rulesets that weren’t successfully transformed into Network Firewall rule groups.
The final rulesets and discarded rules are stored in an S3 bucket for further analysis. This is shown in Figure 5. 

Figure 5: Amazon S3 folder structure for storing final applied and discarded rulesets

Figure 5: Amazon S3 folder structure for storing final applied and discarded rulesets

Conclusion

AWS Network Firewall lets you inspect traffic at scale in a variety of use cases. AWS handles the heavy lifting of deploying the resources, patch management, and ensuring performance at scale so that your security teams can focus less on operational burdens and more on strategic initiatives. In this post, we covered a sample Network Firewall configuration with strict rule order and default drop. We showed you how the rule engine evaluates stateful rule groups with strict rule order and default drop. We then provided an automated serverless solution from Proofpoint’s Emerging Threats OPEN ruleset that can aid you in establishing a baseline for your rule groups. We hope this post is helpful and we look forward to hearing about how you use these latest features that are being added to Network Firewall.

Author

Shiva Vaidyanathan

Shiva is a senior cloud infrastructure architect at AWS. He provides technical guidance, and designs and leads implementation projects for customers to ensure their success on AWS. He works towards making cloud networking simpler for everyone. Prior to joining AWS, he worked on several NSF-funded research initiatives on how to perform secure computing in public cloud infrastructures. He holds a MS in Computer Science from Rutgers University and a MS in Electrical Engineering from New York University.

Author

Lakshmikanth Pandre

Lakshmikanth is a senior technical consultant with an AWS Professional Services team based out of Dallas, Texas. With more than 20 years of industry experience, he works as a trusted advisor with a broad range of customers across different industries and segments, helping the customers on their cloud journey. He focuses on design and implementation, and he consults on devops strategies, infrastructure automation, and security for AWS customers.

Author

Brian Lazear

Brian is head of product management for AWS Network Firewall and Firewall Manager services. He has over 15 years of experience helping enterprise customers build secure applications in the cloud. In AWS, his focus is on network security, firewalls, NDR/EDR, monitoring, and traffic-mirroring services.

Cybersecurity Awareness Month: Learn about the job zero of securing your data using Amazon Redshift

Post Syndicated from Thiyagarajan Arumugam original https://aws.amazon.com/blogs/big-data/cybersecurity-awareness-month-learn-about-the-job-zero-of-securing-your-data-using-amazon-redshift/

Amazon Redshift is the most widely used cloud data warehouse. It allows you to run complex analytic queries against terabytes to petabytes of structured and semi-structured data, using sophisticated query optimization, columnar on high-performance storage, and massively parallel query execution.

At AWS, we embrace the culture that security is job zero, by which we mean it’s even more important than any number one priority. AWS provides comprehensive security capabilities to satisfy the most demanding requirements, and Amazon Redshift provides data security out of the box at no extra cost. Amazon Redshift uses the AWS security frameworks to implement industry-leading security in the areas of authentication, access control, auditing, logging, compliance, data protection, and network security.

Cybersecurity Awareness Month raises awareness about the importance of cybersecurity, ensuring everyone has the resources they need to be safer and more secure online. This post highlights some of the key out-of-the-box capabilities available in Amazon Redshift to manage your data securely.

Authentication

Amazon Redshift supports industry-leading security with built-in AWS Identity and Access Management (IAM) integration, identity federation for single sign-on (SSO), and multi-factor authentication. You can federate database user authentication easily with IAM and Amazon Redshift using IAM and a third-party SAML-2.0 identity provider (IdP), such as AD FS, PingFederate, or Okta.

To get started, see the following posts:

Access control

Granular row and column-level security controls ensure users see only the data they should have access to. You can achieve column-level access control for data in Amazon Redshift by using the column-level grant and revoke statements without having to implement views-based access control or use another system. Amazon Redshift is also integrated with AWS Lake Formation, which makes sure that column and row level access in Lake Formation is enforced for Amazon Redshift queries on the data in the data lake.

The following guides can help you implement fine-grained access control on Amazon Redshift:

Auditing and logging

To monitor Amazon Redshift for any suspicious activities, you can take advantage of the auditing and logging features. Amazon Redshift logs information about connections and user activities, which can be uploaded to Amazon Simple Storage Service (Amazon S3) if you enable the audit logging feature. The API calls to Amazon Redshift are logged to AWS CloudTrail, and you can create a log trail by configuring CloudTrail to upload to Amazon S3. For more details, see Database audit logging, Analyze logs using Amazon Redshift spectrum, Querying AWS CloudTrail Logs, and System object persistence utility.

Compliance

Amazon Redshift is assessed by third-party auditors for compliance with multiple programs. If your use of Amazon Redshift is subject to compliance with standards like HIPAA, PCI, or FedRAMP, you can find more details at Compliance validation for Amazon Redshift.

Data protection

To protect data both at rest and while in transit, Amazon Redshift provides options to encrypt the data. Although the encryption settings are optional, we highly recommend enabling them. When you enable encryption at rest for your cluster, it encrypts both the data blocks as well as the metadata, and there are multiple ways to manage the encryption key (see Amazon Redshift database encryption). To safeguard your data while it’s in transit from your SQL clients to the Amazon Redshift cluster, we highly recommend configuring the security options as described in Configuring security options for connections.

For additional data protection options, see the following resources:

Amazon Redshift enables you to use an AWS Lambda function as a UDF in Amazon Redshift. You can write Lambda UDFs to enable external tokenization of data dynamic data masking, as illustrated in Amazon Redshift – Dynamic Data Masking.

Network security

Amazon Redshift is a service that runs within your VPC. There are multiple configurations to ensure access to your Amazon Redshift cluster is secured, whether the connection is from an application within your VPC or an on-premises system. For more information, see VPCs and subnets. Amazon Redshift for AWS PrivateLink ensures that all API calls from your VPC to Amazon Redshift stay within the AWS network. For more information, see Connecting to Amazon Redshift using an interface VPC endpoint.

Customer success stories

You can run your security-demanding analytical workload using out-of-the-box features. For example, SoePay, a Hong Kong–based payments solutions provider, uses AWS Fargate and Amazon Elastic Container Service (Amazon ECS) to scale its infrastructure, AWS Key Management Service (AWS KMS) to manage cryptographic keys, and Amazon Redshift to store data from merchants’ smart devices.

With AWS services, GE Renewable Energy has created a data lake where it collects and analyses machine data captured at GE wind turbines around the world. GE relies on Amazon S3 to store and protect its ever-expanding collection of wind turbine data and Amazon Redshift to help them gain new insights from the data it collects.

For more customer stories, see Amazon Redshift customers.

Conclusion and Next Steps

In this post, we discussed some of the key out-of-the-box capabilities at no extra cost available in Amazon Redshift to manage your data securely, such as authentication, access control, auditing, logging, compliance, data protection, and network security.

You should periodically review your AWS workloads to ensure security best practices have been implemented. The AWS Well-Architected Framework helps you understand the pros and cons of decisions you make while building systems on AWS. This framework can help you learn architectural best practices for designing and operating reliable, secure, efficient, and cost-effective systems in the cloud. Review your security pillar provided in this framework.

In addition, AWS Security Hub, an AWS service, provides a comprehensive view of your security state within AWS that helps you check your compliance with security industry standards and best practices.

To adhere to the security needs of your organization, you can automate the deployment of an Amazon Redshift cluster in an AWS account using AWS CloudFormation and AWS Service Catalog. For more information, see Automate Amazon Redshift cluster creation using AWS CloudFormation and Automate Amazon Redshift Cluster management operations using AWS CloudFormation.


About the Authors

Kunal Deep Singh is a Software Development Manager at Amazon Web Services (AWS) and leads development of security features for Amazon Redshift. Prior to AWS he has worked at Amazon Ads and Microsoft Azure. He is passionate about building customer solutions for cloud, data and security.

Thiyagarajan Arumugam is a Principal Solutions Architect at Amazon Web Services and designs customer architectures to process data at scale. Prior to AWS, he built data warehouse solutions at Amazon.com. In his free time, he enjoys all outdoor sports and practices the Indian classical drum mridangam.

Detect Python and Java code security vulnerabilities with Amazon CodeGuru Reviewer

Post Syndicated from Haider Naqvi original https://aws.amazon.com/blogs/devops/detect-python-and-java-code-security-vulnerabilities-with-codeguru-reviewer/

with Aaron Friedman (Principal PM-T for xGuru services)

Amazon CodeGuru is a developer tool that uses machine learning and automated reasoning to catch hard to find defects and security vulnerabilities in application code. The purpose of this blog is to show how new CodeGuru Reviewer features help improve the security posture of your Python applications and highlight some of the specific categories of code vulnerabilities that CodeGuru Reviewer can detect. We will also cover newly expanded security capabilities for Java applications.

Amazon CodeGuru Reviewer can detect code vulnerabilities and provide actionable recommendations across dozens of the most common and impactful categories of code security issues (as classified by industry-recognized standards, Open Web Application Security, OWASP , “top ten” and Common Weakness Enumeration, CWE. The following are some of the most severe code vulnerabilities that CodeGuru Reviewer can now help you detect and prevent:

  • Injection weaknesses typically appears in data-rich applications. Every year, hundreds of web servers are compromised using SQL Injection. An attacker can use this method to bypass access control and read or modify application data.
  • Path Traversal security issues occur when an application does not properly handle special elements within a provided path name. An attacker can use it to overwrite or delete critical files and expose sensitive data.
  • Null Pointer Dereference issues can occur due to simple programming errors, race conditions, and others. Null Pointer Dereference can cause availability issues in rare conditions. Attackers can use it to read and modify memory.
  • Weak or broken cryptography is a risk that may compromise the confidentiality and integrity of sensitive data.

Security vulnerabilities present in source code can result in application downtime, leaked data, lost revenue, and lost customer trust. Best practices and peer code reviews aren’t sufficient to prevent these issues. You need a systematic way of detecting and preventing vulnerabilities from being deployed to production. CodeGuru Reviewer Security Detectors can provide a scalable approach to DevSecOps, a mechanism that employs automation to address security issues early in the software development lifecycle. Security detectors automate the detection of hard-to-find security vulnerabilities in Java and now Python applications, and provide actionable recommendations to developers.

By baking security mechanisms into each step of the process, DevSecOps enables the development of secure software without sacrificing speed. However, false positive issues raised by Static Application Security Testing (SAST) tools often must be manually triaged effectively and work against this value. CodeGuru uses techniques from automated reasoning, and specifically, precise data-flow analysis, to enhance the precision of code analysis. CodeGuru therefore reports fewer false positives.

Many customers are already embracing open-source code analysis tools in their DevSecOps practices. However, integrating such software into a pipeline requires a heavy up front lift, ongoing maintenance, and patience to configure. Furthering the utility of new security detectors in Amazon CodeGuru Reviewer, this update adds integrations with Bandit  and Infer, two widely-adopted open-source code analysis tools. In Java code bases, CodeGuru Reviewer now provide recommendations from Infer that detect null pointer dereferences, thread safety violations and improper use of synchronization locks. And in Python code, the service detects instances of SQL injection, path traversal attacks, weak cryptography, or the use of compromised libraries. Security issues found and recommendations generated by these tools are shown in the console, in pull requests comments, or through CI/CD integrations, alongside code recommendations generated by CodeGuru’s code quality and security detectors. Let’s dive deep and review some examples of code vulnerabilities that CodeGuru Reviewer can help detect.

Injection (Python)

Amazon CodeGuru Reviewer can help detect the most common injection vulnerabilities including SQL, XML, OS command, and LDAP types. For example, SQL injection occurs when SQL queries are constructed through string formatting. An attacker could manipulate the program inputs to modify the intent of the SQL query. The following python statement executes a SQL query constructed through string formatting and can be an attack vector:

import sqlite3
from flask import request

def removing_product():
    productId = request.args.get('productId')
    str = 'DELETE FROM products WHERE productID = ' + productId
    return str

def sql_injection():
    connection = psycopg2.connect("dbname=test user=postgres")
    cur = db.cursor()
    query = removing_product()
    cur.execute(query)

CodeGuru will flag a potential SQL injection using Bandit security detector, will make the following recommendation:

>> We detected a SQL command that might use unsanitized input. 
This can result in an SQL injection. To increase the security of your code, 
sanitize inputs before using them to form a query string.

To avoid this, the user should correct the code to use a parameter sanitization mechanism that guards against SQL injection as done below:

import sqlite3
from flask import request

def removing_product():
    productId = sanitize_input(request.args.get('productId'))
    str = 'DELETE FROM products WHERE productID = ' + productId
    return str

def sql_injection():
    connection = psycopg2.connect("dbname=test user=postgres")
    cur = db.cursor()
    query = removing_product()
    cur.execute(query)

In the above corrected code, user supplied sanitize_input method will take care of sanitizing user inputs.

Path Traversal (Python)

When applications use user input to create a path to read or write local files, an attacker can manipulate the input to overwrite or delete critical files or expose sensitive data. These critical files might include source code, sensitive, or application configuration information.

@app.route('/someurl')
def path_traversal():
    file_name = request.args["file"]
    f = open("./{}".format(file_name))
    f.close()

In above example, file name is directly passed to an open API without checking or filtering its content.

CodeGuru’s recommendation:

>> Potentially untrusted inputs are used to access a file path.
To protect your code from a path traversal attack, verify that your inputs are
sanitized.

In response, the developer should sanitize data before using it for creating/opening file.

@app.route('/someurl')
def path_traversal():
file_name = sanitize_data(request.args["file"])
f = open("./{}".format(file_name))
f.close()

In this modified code, input data file_name has been clean/filtered by sanitized_data api call.

Null Pointer Dereference (Java)

Infer detectors are a new addition that complement CodeGuru Reviewer native Java Security Detectors. Infer detectors, based on the Facebook Infer static analyzer, include rules to detect null pointer dereferences, thread safety violations, and improper use of synchronization locks. In particular, the null-pointer-dereference rule detects paths in the code that lead to null pointer exceptions in Java. Null pointer dereference is a very common pitfall in Java and is considered one of 25 most dangerous software weaknesses.

The Infer null-pointer-dereference rule guards against unexpected null pointer exceptions by detecting locations in the code where pointers that could be null are dereferenced. CodeGuru augments the Infer analyzer with knowledge about the AWS APIs, which allows the security detectors to catch potential null pointer exceptions when using AWS APIs.

For example, the AWS DynamoDBMapper class provides a convenient abstraction for mapping Amazon DynamoDB tables to Java objects. However, developers should be aware that DynamoDB Mapper load operations can return a null pointer if the object was not found in the table. The following code snippet updates a record in a catalog using a DynamoDB Mapper:

DynamoDBMapper mapper = new DynamoDBMapper(client);
// Retrieve the item.
CatalogItem itemRetrieved = mapper.load(
CatalogItem.class, 601);
// Update the item.
itemRetrieved.setISBN("622-2222222222");
itemRetrieved.setBookAuthors(
new HashSet<String>(Arrays.asList(
"Author1", "Author3")));
mapper.save(itemRetrieved);

CodeGuru will protect against a potential null dereference by making the following recommendation:

object `itemRetrieved` last assigned on line 88 could be null
and is dereferenced at line 90.

In response, the developer should add a null check to prevent the null pointer dereference from occurring.

DynamoDBMapper mapper = new DynamoDBMapper(client);
// Retrieve the item.
CatalogItem itemRetrieved = mapper.load(CatalogItem.class, 601);
// Update the item.
if (itemRetrieved != null) {
itemRetrieved.setISBN("622-2222222222");
itemRetrieved.setBookAuthors(
new HashSet<String>(Arrays.asList(
"Author1","Author3")));
mapper.save(itemRetrieved);
} else {
throw new CatalogItemNotFoundException();
}

Weak or broken cryptography  (Python)

Python security detectors support popular frameworks along with built-in APIs such as cryptography, pycryptodome etc. to identify ciphers related vulnerability. As suggested in CWE-327 , the use of a non-standard/inadequate key length algorithm is dangerous because attacker may be able to break the algorithm and compromise whatever data has been protected. In this example, `PBKDF2` is used with a weak algorithm and may lead to cryptographic vulnerabilities.
from Crypto.Protocol.KDF import PBKDF2
from Crypto.Hash import SHA1

def risky_crypto_algorithm(password):
salt = get_random_bytes(16)
keys = PBKDF2(password, salt, 64, count=1000000,
hmac_hash_module=SHA1)

SHA1 is used to create a PBKDF2, however, it is insecure hence not recommended for PBKDF2. CodeGuru’s identifies the issue and makes the following recommendation:

>> The `PBKDF2` function is using a weak algorithm which might
lead to cryptographic vulnerabilities. We recommend that you use the
`SHA224`, `SHA256`, `SHA384`,`SHA512/224`, `SHA512/256`, `BLAKE2s`,
`BLAKE2b`, `SHAKE128`, `SHAKE256` algorithms.

In response, the developer should use the correct SHA algorithm to protect against potential cipher attacks.

from Crypto.Protocol.KDF import PBKDF2
from Crypto.Hash import SHA512

def risky_crypto_algorithm(password):
salt = get_random_bytes(16)
keys = PBKDF2(password, salt, 64, count=1000000,
hmac_hash_module=SHA512)

This modified example uses high strength SHA512 algorithm.

Conclusion

This post reviewed Amazon CodeGuru Reviewer security detectors and how they automatically check your code for vulnerabilities and provide actionable recommendations in code reviews. We covered new capabilities for detecting issues in Python applications, as well as additional security features from Bandit and Infer. Together CodeGuru Reviewer’s security features provide a scalable approach for customers embracing DevSecOps, a mechanism that requires automation to address security issues earlier in the software development lifecycle. CodeGuru automates detection and helps prevent hard-to-find security vulnerabilities, accelerating DevSecOps processes for application development workflow.

You can get started from the CodeGuru console by running a full repository scan or integrating CodeGuru Reviewer with your supported CI/CD pipeline. Code analysis from Infer and Bandit is included as part of the standard CodeGuru Reviewer service.

For more information about automating code reviews and application profiling with Amazon CodeGuru, check out the AWS DevOps Blog. For more details on how to get started, visit the documentation.

Custom Headers for Cloudflare Pages

Post Syndicated from Nevi Shah original https://blog.cloudflare.com/custom-headers-for-pages/

Custom Headers for Cloudflare Pages

Custom Headers for Cloudflare Pages

Until today, Cloudflare Workers has been a great solution to setting headers, but we wanted to create an even smoother developer experience. Today, we’re excited to announce that Pages now natively supports custom headers on your projects! Simply create a _headers file in the build directory of your project and within it, define the rules you want to apply.

/developer-docs/*
  X-Hiring: Looking for a job? We're hiring engineers
(https://www.cloudflare.com/careers/jobs)

What can you set with custom headers?

Being able to set custom headers is useful for a variety of reasons — let’s explore some of your most popular use cases.

Search Engine Optimization (SEO)

When you create a Pages project, a pages.dev deployment is created for your project which enables you to get started immediately and easily preview changes as you iterate. However, we realize this poses an issue — publishing multiple copies of your website can harm your rankings in search engine results. One way to solve this is by disabling indexing on all pages.dev subdomains, but we see many using their pages.dev subdomain as their primary domain. With today’s announcement you can attach headers such as X-Robots-Tag to hint to Google and other search engines how you’d like your deployment to be indexed.

For example, to prevent your pages.dev deployment from being indexed, you can add the following to your _headers file:

https://:project.pages.dev/*
  X-Robots-Tag: noindex

Security

Customizing headers doesn’t just help with your site’s search result ranking — a number of browser security features can be configured with headers. A few headers that can enhance your site’s security are:

  • X-Frame-Options: You can prevent click-jacking by informing browsers not to embed your application inside another (e.g. with an <iframe>).
  • X-Content-Type-Option: nosniff: To prevent browsers from interpreting a response as any other content-type than what is defined with the Content-Type header.
  • Referrer-Policy: This allows you to customize how much information visitors give about where they’re coming from when they navigate away from your page.
  • Permissions-Policy: Browser features can be disabled to varying degrees with this header (recently renamed from Feature-Policy).
  • Content-Security-Policy: And if you need fine-grained control over the content in your application, this header allows you to configure a number of security settings, including similar controls to the X-Frame-Options header.

You can configure these headers to protect an /app/* path, with the following in your _headers file:

/app/*
  X-Frame-Options: DENY
  X-Content-Type-Options: nosniff
  Referrer-Policy: no-referrer
  Permissions-Policy: document-domain=()
  Content-Security-Policy: script-src 'self'; frame-ancestors 'none';

CORS

Modern browsers implement a security protection called CORS or Cross-Origin Resource Sharing. This prevents one domain from being able to force a user’s action on another. Without CORS, a malicious site owner might be able to do things like make requests to unsuspecting visitors’ banks and initiate a transfer on their behalf. However, with CORS, requests are prevented from one origin to another to stop the malicious activity.

There are, however, some cases where it is safe to allow these cross-origin requests. So-called, “simple requests” (such as linking to an image hosted on a different domain) are permitted by the browser. Fetching these resources dynamically is often where the difficulty arises, and the browser is sometimes overzealous in its protection. Simple static assets on Pages are safe to serve to any domain, since the request takes no action and there is no visitor session. Because of this, a domain owner can attach CORS headers to specify exactly which requests can be allowed in the _headers file for fine-grained and explicit control.

For example, the use of the asterisk will enable any origin to request any asset from your Pages deployment:

/*
  Access-Control-Allow-Origin: *

To be more restrictive and limit requests to only be allowed from a ‘staging’ subdomain, we can do the following:

https://:project.pages.dev/*
  Access-Control-Allow-Origin: https://staging.:project.pages.dev

How we built support for custom headers

To support all these use cases for custom headers, we had to build a new engine to determine which rules to apply for each incoming request. Backed, of course, by Workers, this engine supports splats and placeholders, and allows you to include those matched values in your headers.

Although we don’t support all of its features, we’ve modeled this matching engine after the URLPattern specification which was recently shipped with Chrome 95. We plan to be able to fully implement this specification for custom headers once URLPattern lands in the Workers runtime, and there should hopefully be no breaking changes to migrate.

Enhanced support for redirects

With this same engine, we’re bringing these features to your _redirects file as well. You can now configure your redirects with splats, placeholders and status codes as shown in the example below:

/blog/* https://blog.example.com/:splat 301
/products/:code/:name /products?name=:name&code=:code
/submit-form https://static-form.example.com/submit 307

Get started

Custom headers and redirects for Cloudflare Pages can be configured today. Check out our documentation to get started, and let us know how you’re using it in our Discord server. We’d love to hear about what this unlocks for your projects!

Coming up…

And finally, if a _headers file and enhanced support for _redirects just isn’t enough for you, we also have something big coming very soon which will give you the power to build even more powerful projects. Stay tuned!

Cloudflare for SaaS for All, now Generally Available!

Post Syndicated from Dina Kozlov original https://blog.cloudflare.com/cloudflare-for-saas-for-all-now-generally-available/

Cloudflare for SaaS for All, now Generally Available!

Cloudflare for SaaS for All, now Generally Available!

During Developer Week a few months ago, we opened up the Beta for Cloudflare for SaaS: a one-stop shop for SaaS providers looking to provide fast load times, unparalleled redundancy, and the strongest security to their customers.

Since then, we’ve seen numerous developers integrate with our technology, allowing them to spend their time building out their solution instead of focusing on the burdens of running a fast, secure, and scalable infrastructure — after all, that’s what we’re here for.

Today, we are very excited to announce that Cloudflare for SaaS is generally available, so that every customer, big and small, can use Cloudflare for SaaS to continue scaling and building their SaaS business.

What is Cloudflare for SaaS?

If you’re running a SaaS company, you have customers that are fully reliant on you for your service. That means you’re responsible for keeping their domain fast, secure, and protected. But this isn’t simple. There’s a long checklist you need to get through to put a solution in your customers’ hands:

  • Set up an origin server
  • Encrypt your customers’ traffic
  • Keep your customers online
  • Boost the performance of global customers
  • Support vanity domains
  • Protect against attacks and bots
  • Scale for growth
  • Provide insights and analytics

And on top of that, you need to also focus on building out your solution and your business. As a developer or startup with limited resources, this can delay your product launch by weeks or months.

That’s what we’re here to help with! We have numerous engineering teams whose sole focus is to work on products that take care of each one of these tasks, so you don’t have to!

The Cloudflare solution:

  • Set up an origin server  → Workers
  • Encrypt your customers’ traffic →  SSL for SaaS
  • Keep your customers online → Cloudflare’s global Anycast network
  • Boost the performance of global customers → Argo Smart Routing/Cache
  • Support vanity domains → Custom Hostnames
  • Protect against attacks and bots → WAF and Bot Management
  • Scale for growth → Workers
  • Provide insights and analytics → Custom Hostname Analytics

Pricing, Made for Developers

Starting today, Cloudflare for SaaS is available to purchase on Free, Pro, and Business plans. We wanted to make sure that the pricing made sense for developers. At the time of building, you don’t know how many customers you’ll have, so we wanted to offer flexibility by keeping the pricing as simple as possible: only pay for the customers you use.

Each customer domain using the service is called a Custom Hostname. For each Custom Hostname, we automatically provision a TLS certificate. But not just that!  Beyond the TLS certificate, each of your Custom Hostnames inherits the full suite of Cloudflare products that you set up on your SaaS zone. From Bot Management to Argo Smart Routing, you can extend these add-ons that protect and accelerate your domain to your customers.

Custom Hostnames cost two dollars per month. We will only charge you after each Custom Hostname has been onboarded, adjusted according to when you created it. That means that if you created 10 Custom Hostnames at the start of the month and 10 Custom Hostnames halfway through, at the end of the month you will be billed $30.

This way, you’re only charged for the Custom Hostnames that you provision. It’s also a great incentive to make sure you clean up after your churned customers.

If you’re an Enterprise customer and want to learn more about the benefits that you can from Cloudflare for SaaS, make sure you check out our blog post about the latest developments.

Show us what you’re building!

During the beta alone, we’ve seen incredible projects built out on the platform. We wanted to showcase these developers to show you what’s possible. And even better, some of these have been built on our Workers platform! We’d love to see what you’re working on. Join our Discord channel and showcase your work! Have feature requests for us? Let us know!

mmm.page: Simple Personal Websites

Cloudflare for SaaS for All, now Generally Available!

mmm.page is a drag-and-drop website builder that makes it dead simple to create auto-responsive, collage-like websites: websites with overlapping text, images, GIFs, YouTube videos, Spotify embeds, and (a lot) more. To make it easier, all the standard website tedium — uptime, usability, performance, reliability, responsiveness, SEO, etc. — are handled under the hood so all you have to worry about is adding content and arranging it how you want.

Under their hood is Cloudflare. Cloudflare’s CDN allows both the flexibility of server-side pages as well as the instant loading times of static pages — not to mention an 80% reduction in server costs. Custom Hostnames alone saved months of development time by handling domain names and SSL management (which are otherwise tricky to get perfect and reliable).

They’ve used Workers for increasingly more tasks that would’ve otherwise taken an order of magnitude more time if implemented with their current backend monolith — the ease of deployment and comparatively low cost of Workers is something that keeps them coming back.

The longer-term hope is for pages to be used as a sort of beacon signal, an easy-to-make yet unbounded way to express to others the things you’re interested in, especially for things that aren’t so easily describable or captured in words. They look forward to a world of a ton more DIY micro-sites. Cloudflare has been crucial in taking care of much of the difficult technical plumbing and giving them more time to work on designs and features that get them closer to this hope.

Lightfunnels

Cloudflare for SaaS for All, now Generally Available!

Lightfunnels is a performance driven e-commerce and lead generation platform. It focuses on delivering fast, reliable, and highly converting sales funnels to its users and their customers.

With Cloudflare for SaaS, Lightfunnels allows users to preserve their brand by easily connecting their own domain names with SSL to use on their funnels.

The platform handles large e-commerce traffic volume through Cloudflare Workers. This helps Lightfunnels serve pages from the closest edge to the customer, wherever they are in the world, allowing for blazing fast page load speeds.

Workers also come with a powerful caching API that eliminates a great percentage of back-end trips and reduces the stress on their servers.

“Our aim is to build the best performing e-commerce and lead generation platform on the market. Page load speeds play a significant role in performance. Using Cloudflare for SaaS along with Cloudflare Workers made building a reliable, secure, and fast infrastructure a breeze.”
Yassir Ennazk, Co-founder & CEO at Lightfunnels

Ventrata

Ventrata is a SaaS multi-channel booking platform for large attractions and tour operators. They power booking sites and B2B booking portals for clients that run on other domains. Cloudflare for SaaS has allowed them to leverage all of Cloudflare’s tools, including Firewall, image caching, Workers, and free TLS certificates on Custom Hostnames, while allowing their clients to keep full control of their brand. Their implementation involved just 4 lines of code without any infrastructure/DevOps help required, which would have been impossible before.

Currently a part of the Beta?

If you were accepted as a part of the Cloudflare for SaaS Beta, you will get a notice next week about migrating to the paid version.  

Help build a better Internet

Want to be a part of the Cloudflare team and work on the products that power Cloudflare for SaaS? We’re hiring!

Getting Cloudflare Tunnels to connect to the Cloudflare Network with QUIC

Post Syndicated from Sudarsan Reddy original https://blog.cloudflare.com/getting-cloudflare-tunnels-to-connect-to-the-cloudflare-network-with-quic/

Getting Cloudflare Tunnels to connect to the Cloudflare Network with QUIC

Getting Cloudflare Tunnels to connect to the Cloudflare Network with QUIC

I work on Cloudflare Tunnel, which lets customers quickly connect their private services and networks through the Cloudflare network without having to expose their public IPs or ports through their firewall. Tunnel is managed for users by cloudflared, a tool that runs on the same network as the private services. It proxies traffic for these services via Cloudflare, and users can then access these services securely through the Cloudflare network.

Recently, I was trying to get Cloudflare Tunnel to connect to the Cloudflare network using a UDP protocol, QUIC. While doing this, I ran into an interesting connectivity problem unique to UDP. In this post I will talk about how I went about debugging this connectivity issue beyond the land of firewalls, and how some interesting differences between UDP and TCP came into play when sending network packets.

How does Cloudflare Tunnel work?

Getting Cloudflare Tunnels to connect to the Cloudflare Network with QUIC

cloudflared works by opening several connections to different servers on the Cloudflare edge. Currently, these are long-lived TCP-based connections proxied over HTTP/2 frames. When Cloudflare receives a request to a hostname, it is proxied through these connections to the local service behind cloudflared.

While our HTTP/2 protocol mode works great, we’d like to improve a few things. First, TCP traffic sent over HTTP/2 is susceptible to Head of Line (HoL) blocking — this affects both HTTP traffic and traffic from WARP routing. Additionally, it is currently not possible to initiate communication from cloudflared’s HTTP/2 server in an efficient way. With the current Go implementation of HTTP/2, we could use Server-Sent Events, but this is not very useful in the scheme of proxying L4 traffic.

The upgrade to QUIC solves possible HoL blocking issues and opens up avenues that allow us to initiate communication from cloudflared to a different cloudflared in the future.

Naturally, QUIC required a UDP-based listener on our edge servers which cloudflared could connect to. We already connect to a TCP-based listener for the existing protocols, so this should be nice and easy, right?

Failed to dial to the edge

Things weren’t as straightforward as they first looked. I added a QUIC listener on the edge, and the ability for cloudflared to connect to this new UDP-based listener. I tried to run my brand new QUIC tunnel and this happened.

$  cloudflared tunnel run --protocol quic my-tunnel
2021-09-17T18:44:11Z ERR Failed to create new quic connection, err: failed to dial to edge: timeout: no recent network activity

cloudflared wasn’t even establishing a connection to the edge. I started looking at the obvious places first. Did I add a firewall rule allowing traffic to this port? Check. Did I have iptables rules ACCEPTing or DROPping appropriate traffic for this port? Check. They seemed to be in order. So what else could I do?

tcpdump all the packets

I started by logging for UDP traffic on the machine my server was running on to see what could be happening.

$  sudo tcpdump -n -i eth0 port 7844 and udp
tcpdump: verbose output suppressed, use -v or -vv for full protocol decode
listening on eth0, link-type EN10MB (Ethernet), capture size 262144 bytes
14:44:27.742629 IP 173.13.13.10.50152 > 198.41.200.200.7844: UDP, length 1252
14:44:27.743298 IP 203.0.113.0.7844 > 173.13.13.10.50152: UDP, length 37

Looking at this tcpdump helped me understand why I had no connectivity! Not only was this port getting UDP traffic but I was also seeing traffic flow out. But there seemed to be something strange afoot. Incoming packets were being sent to 198.41.200.200:7844 while responses were being sent back from 203.0.113.0:7844 (this is an example IP used for illustration purposes)  instead.

Why is this a problem? If a host (in this case, the server) chooses an address from a network unable to communicate with a public Internet host, it is likely that the return half of the communication will never arrive. But wait a minute. Why is some other IP getting prioritized over a source address my packets were already being sent to? Let’s take a deeper look at some IP addresses. (Note that I’ve deliberately oversimplified and scrambled results to minimally illustrate the problem)

$  ip addr list
eth0: <BROADCAST,MULTICAST,UP,LOWER_UP> mtu 1600 qdisc noqueue state UP group default qlen 1000
inet 203.0.113.0/32 scope global eth0
inet 198.41.200.200/32 scope global eth0 

$ ip route show
default via 203.0.113.0 dev eth0

So this was clearly why the server was working fine on my machine but not on the Cloudflare edge servers. It looks like I have multiple IPs on the interface my service is bound to. The IP that is the default route is being sent back as the source address of the packet.

Why does this work for TCP but not UDP?

Connection-oriented protocols, like TCP, initiate a connection (connect()) with a three-way handshake. The kernel therefore maintains a state about ongoing connections and uses this to determine the source IP address at the time of a response.

Because UDP (unless SOCK_SEQPACKET is involved) is connectionless, the kernel cannot maintain state like TCP does. The recvfrom  system call is invoked from the server side and tells who the data comes from. Unfortunately, recvfrom  does not tell us which IP this data is addressed for. Therefore, when the UDP server invokes the sendto system call to respond to the client, we can only tell it which address to send the data to. The responsibility of determining the source-address IP then falls to the kernel. The kernel has certain heuristics that it uses to determine the source address. This may or may not work, and in the ip routes example above, these heuristics did not work. The kernel naturally (and wrongly) picks the address of the default route to respond with.

Telling the kernel what to do

I had to rely on my application to set the source address explicitly and therefore not rely on kernel heuristics.

Linux has some generic I/O system calls, namely recvmsg  and sendmsg. Their function signatures allow us to both read or write additional out-of-band data we can pass the source address to. This control information is passed via the msghdr struct’s msg_control field.

ssize_t sendmsg(int socket, const struct msghdr *message, int flags)
ssize_t recvmsg(int socket, struct msghdr *message, int flags);
 
struct msghdr {
     void    *   msg_name;   /* Socket name          */
     int     msg_namelen;    /* Length of name       */
     struct iovec *  msg_iov;    /* Data blocks          */
     __kernel_size_t msg_iovlen; /* Number of blocks     */
     void    *   msg_control;    /* Per protocol magic (eg BSD file descriptor passing) */
    __kernel_size_t msg_controllen; /* Length of cmsg list */
     unsigned int    msg_flags;
};

We can now copy the control information we’ve gotten from recvmsg back when calling sendmsg, providing the kernel with information about the source address.The library I used (https://github.com/lucas-clemente/quic-go) had a recent update that did exactly this! I pulled the changes into my service and gave it a spin.

But alas. It did not work! A quick tcpdump showed that the same source address was being sent back. It seemed clear from reading the source code that the recvmsg and sendmsg were being called with the right values. It did not make sense.

So I had to see for myself if these system calls were being made.

strace all the system calls

strace is an extremely useful tool that tracks all system calls and signals sent/received by a process. Here’s what it had to say. I’ve removed all the information not relevant to this specific issue.

17:39:09.130346 recvmsg(3, {msg_name={sa_family=AF_INET6,
sin6_port=htons(35224), inet_pton(AF_INET6, "::ffff:171.54.148.10", 
&sin6_addr), sin6_flowinfo=htonl(0), sin6_scope_id=0}, msg_namelen=112->28, msg_iov=
[{iov_base="_\5S\30\273]\275@\34\24\322\243{2\361\312|\325\n\1\314\316`\3
03\250\301X\20", iov_len=1452}], msg_iovlen=1, msg_control=[{cmsg_len=36, 
cmsg_level=SOL_IPV6, cmsg_type=0x32}, {cmsg_len=28, cmsg_level=SOL_IP, 
cmsg_type=IP_PKTINFO, cmsg_data={ipi_ifindex=if_nametoindex("eth0"),
ipi_spec_dst=inet_addr("198.41.200.200"),ipi_addr=inet_addr("198.41.200.200")}},
{cmsg_len=17, cmsg_level=SOL_IP, 
cmsg_type=IP_TOS, cmsg_data=[0]}], msg_controllen=96, msg_flags=0}, 0) = 28 <0.000007>
17:39:09.165160 sendmsg(3, {msg_name={sa_family=AF_INET6, 
sin6_port=htons(35224), inet_pton(AF_INET6, "::ffff:171.54.148.10", 
&sin6_addr), sin6_flowinfo=htonl(0), sin6_scope_id=0}, msg_namelen=28, 
msg_iov=[{iov_base="Oe4\37:3\344 &\243W\10~c\\\316\2640\255*\231 
OY\326b\26\300\264&\33\""..., iov_len=1302}], msg_iovlen=1, msg_control=
[{cmsg_len=28, cmsg_level=SOL_TCP, cmsg_type=0x8}], msg_controllen=28, 
msg_flags=0}, 0) = 1302 <0.000054>

Let’s start with recvmsg . We can clearly see that the ipi_addr for the source is being passed correctly: ipi_addr=inet_addr(“172.16.90.131”). This part works as expected. Looking at sendmsg  almost instantly tells us where the problem is. The field we want, ip_spec_dst is not being set as we make this system call. So the kernel continues to make wrong guesses as to what the source address may be.

This turned out to be a bug where the library was using IPROTO_TCP instead of IPPROTO_IPV4 as the control message level while making the sendmsg call. Was that it? Seemed a little anticlimactic. I submitted a slightly more typesafe fix and sure enough, straces now showed me what I was expecting to see.

18:22:08.334755 sendmsg(3, {msg_name={sa_family=AF_INET6, 
sin6_port=htons(37783), inet_pton(AF_INET6, "::ffff:171.54.148.10", 
&sin6_addr), sin6_flowinfo=htonl(0), sin6_scope_id=0}, msg_namelen=28, 
msg_iov=
[{iov_base="Ki\20NU\242\211Y\254\337\3107\224\201\233\242\2647\245}6jlE\2
70\227\3023_\353n\364"..., iov_len=33}], msg_iovlen=1, msg_control=
[{cmsg_len=28, cmsg_level=SOL_IP, cmsg_type=IP_PKTINFO, cmsg_data=
{ipi_ifindex=if_nametoindex("eth0"), 
ipi_spec_dst=inet_addr("198.41.200.200"),ipi_addr=inet_addr("0.0.0.0")}}
], msg_controllen=32, msg_flags=0}, 0) =
33 <0.000049>

cloudflared is now able to connect with UDP (QUIC) to the Cloudflare network from anywhere in the world!

$  cloudflared tunnel --protocol quic run sudarsans-tunnel
2021-09-21T11:37:30Z INF Starting tunnel tunnelID=a72e9cb7-90dc-499b-b9a0-04ee70f4ed78
2021-09-21T11:37:30Z INF Version 2021.9.1
2021-09-21T11:37:30Z INF GOOS: darwin, GOVersion: go1.16.5, GoArch: amd64
2021-09-21T11:37:30Z INF Settings: map[p:quic protocol:quic]
2021-09-21T11:37:30Z INF Initial protocol quic
2021-09-21T11:37:32Z INF Connection 3ade6501-4706-433e-a960-c793bc2eecd4 registered connIndex=0 location=AMS

While the programmatic bug causing this issue was a trivial one, the journey into systematically discovering the issue and understanding how Linux internals worked for UDP along the way turned out to be very rewarding for me. It also reiterated my belief that tcpdump and strace are indeed invaluable tools in anybody’s arsenal when debugging network problems.

What’s next?

You can give this a try with the latest cloudflared release at https://github.com/cloudflare/cloudflared/releases/latest. Just remember to set the protocol flag to quic. We plan to leverage this new mode to roll out some exciting new features for Cloudflare Tunnel. So upgrade away and keep watching this space for more information on how you can take advantage of this.

Zero Trust — Not a Buzzword

Post Syndicated from Fernando Serto original https://blog.cloudflare.com/zero-trust-not-a-buzzword/

Zero Trust — Not a Buzzword

Zero Trust — Not a Buzzword

Over the last few years, Zero Trust, a term coined by Forrester, has picked up a lot of steam. Zero Trust, at its core, is a network architecture and security framework focusing on not having a distinction between external and internal access environments, and never trusting users/roles.

In the Zero Trust model, the network only delivers applications and data to authenticated and authorised users and devices, and gives organisations visibility into what is being accessed and to apply controls based on behavioural analysis. It gained popularity as the media reported on several high profile breaches caused by misuse, abuse or exploitation of VPN systems, breaches into end-users’ devices with access to other systems within the network, or breaches through third parties — either by exploiting access or compromising software repositories in order to deploy malicious code. This would later be used to provide further access into internal systems, or to deploy malware and potentially ransomware into environments well within the network perimeter.

When we first started talking to CISOs about Zero Trust, it felt like it was just a buzzword, and CISOs were bombarded with messaging from different cybersecurity vendors offering them Zero Trust solutions. Recently, another term, SASE (Secure Access Services Edge), a framework released by Gartner, also came up and added even more confusion to the mix.

Then came COVID-19 in 2020, and with it the reality of lockdowns and remote work. And while some organizations took that as an opportunity to accelerate projects around modernising their access infrastructure, others, due to procurement processes, or earlier technology decisions, ended up having to take a more tactical approach, ramping up existing remote access infrastructure by adding more licenses or capacity without having an opportunity to rethink their approach, nor having an opportunity to take into account the impact of their employees’ experience while working remotely full time in the early days of the pandemic.

So we thought it might be a good time to check on organizations in Asia Pacific, and look at the following:

  • The pandemic’s impact on businesses
  • Current IT security approaches and challenges
  • Awareness, adoption and implementation of Zero Trust
  • Key drivers and challenges in adopting Zero Trust

In August 2021, we commissioned a research company called The Leading Edge to conduct a survey that touches on these topics. The survey was conducted across five countries — Australia, India, Japan, Malaysia, and Singapore, and 1,006 IT and cybersecurity decision-makers and influencers from companies with more than 500 employees participated.

For example, 54% of organisations said they saw an increase in security incidents in 2021, when compared to the previous year, with 83% of respondents who experienced security incidents saying they had to make significant changes to their IT security procedures as a result.

Zero Trust — Not a Buzzword
Increase in security incidents when compared to 2020. ▲▼ Significantly higher/lower than total sample

And while the overall APAC stats are already quite interesting, I thought it would be even more fascinating to look at the unique characteristics of each of the five countries, so let’s have a look:

Australia

Australian organisations reported the highest impact of COVID-19 when it comes to their IT security approach, with 87% of the 203 respondents surveyed saying the pandemic had a moderate to significant impact on their IT security posture. The two biggest cities in Australia (Sydney and Melbourne) were in lockdown for over 100 days, each in the second half of 2021 alone. With the extensive lockdowns, it’s not a surprise that 48% of respondents reported challenges with maximising remote workers’ productivity without exposing them or their devices to new risks.

With 94% of organisations in Australia having reported they will be implementing a combination of return to office and work from home, building an effective and uniform security approach can be quite challenging. If you combine that with the fact that 62% saw an increase in security incidents over the last year, we can safely assume IT and cybersecurity decision-makers and influencers in Australia have been working on improving their security posture over the last year, even though 40% of respondents indicated they struggled to secure the right level of funding for such projects.

Australia seems to be well advanced on the journey into implementing Zero Trust when compared to other four countries included in the report, with 45% of the organisations that have adopted Zero Trust starting their Zero Trust journey over the last one to four years. Australian organisations have always been known for fast cloud adoption, and even in the early 2010s Australians were already consuming IaaS quite heavily.

India

When compared to the other countries in the report, India has a very challenging environment when it comes to working from home, with Internet connectivity being inconsistent, even though there’s been significant improvement in internet speeds in the country, and problems like power outages regularly occurring in certain areas outside of city centres. Surprisingly, the biggest challenge reported by Indian organisations was that they could benefit from newer security functionality, which goes to show that legacy security approaches are still widely present in India. Likewise, 37% of the respondents reported that their access technologies are too complex, which supports the previous point that newer security functionality would be beneficial to the same organisations.

When asked about their concerns around the shift in how their users will access applications, one of the biggest concerns raised by 59% of the respondents was around applications being protected by VPN or IP address controls alone. This shows Zero Trust would fit really well with their IT strategy moving forward, as controls can now be applied to users and their devices.

Another interesting point to make, and where Zero Trust can be leveraged, is 65% of respondents saying internal IT and security staff shortage and cuts is a huge challenge. Most security technologies out there would require special skills to build, maintain and operate, and this is where simplifying access with the right Zero Trust approach could really help improve the productivity of those teams.

Japan

When we look at the results of the survey across all five countries, it’s fairly obvious that Japan didn’t seem to have quite the same challenges as the other countries when the pandemic started. Businesses continued to operate normally for most of 2020 and 2021, which would explain why the impact wasn’t in line with the other countries. Having said that, 51% of the respondents surveyed in Japan still reported they saw a moderate to significant impact in their IT security approach, which is still significant, even though lower than the other countries.

Japanese organisations also reported an increase in the number of security incidents, which supports the fact that even though the impact of the pandemic wasn’t as severe as in other countries, 45% of the respondents still reported an increase in security incidents, and 63% still had to make changes to their IT security procedures as a direct result of incidents.

Malaysia

Malaysia rated second highest (at 80%) in our report on the impact the pandemic has had on organisations’ IT security approach, and rated highest on both employees using their home networks and using personal devices for work, at 94% and 92% respectively. From a security perspective, that poses a significant impact to an organization’s security posture and increases the attack surface for an organisation substantially.

From a risk perspective, Malaysian organisations rated lack of management over employees’ devices pretty highly, with 65% of them expressing concerns over it. Other areas worth calling out were applications and data being exposed to the public Internet, and lack of visibility into staff activity inside applications.

With 57% of the respondents calling out an increase in security incidents when compared to the previous year, 89% of the respondents said they had to make significant changes to their IT security procedures due to either security incidents or attack attempts against their environments.

Singapore

In Singapore, 79% of IT and cybersecurity decision-makers and influencers reported that the pandemic has impacted their IT security approach, and two in five organisations said they could benefit from more modern security functionality as a direct result of the impact caused by the pandemic. 52% of the organisations also reported an increase in security incidents compared to 2020, with almost half having seen an increase in phishing attempts.

Singaporean organisations were also not immune to a significant increase in IT security spend as a direct result of the pandemic, with 62% of them having reported more investment in security. Some of the challenges these organisations were facing were related to applications being directly exposed to the public Internet, limited oversight on third party access and applications being protected by username and password only.

While Singapore is known for high speed home Internet, it was quite a surprise for me to see that 40% of organisations surveyed reported issues with latency or slow connectivity into applications via VPN. This goes to show that the problem of concentrating traffic into a single location can impact application performance even across relatively small geographies, and even if bandwidth is not necessarily a problem, like what happens in Singapore.

The work in IT security never stops

While there were distinct differences in each country around IT security posture and Zero Trust adoption, across Asia Pacific, the similarities are what stand out the most:

  • Cyberattacks continue to rise
  • Flexible work is here to stay
  • Skilled in-house IT security workers are a scarce resource
  • Need to educate stakeholders around Zero Trust

These challenges are not easy to tackle, add to these the required focus on improving employee experience, reducing operational complexities, better visibility into 3rd party activity, and tighter controls due to the increase in security incidents, and you’ve got a heck of a huge responsibility for IT.

And this is where Cloudflare comes in. Not only have we been helping our employees work security throughout the pandemic, we have also been helping organisations all over the globe streamline their IT security operations when it comes to users accessing applications through Cloudflare Access, or securing their activity on the Internet through our Secure Web Gateway services, which even includes controls around SaaS applications and browser isolation, all with the best possible user experience.

So come talk to us!

Introducing the Security at the Edge: Core Principles whitepaper

Post Syndicated from Maddie Bacon original https://aws.amazon.com/blogs/security/introducing-the-security-at-the-edge-core-principles-whitepaper/

Amazon Web Services (AWS) recently released the Security at the Edge: Core Principles whitepaper. Today’s business leaders know that it’s critical to ensure that both the security of their environments and the security present in traditional cloud networks are extended to workloads at the edge. The whitepaper provides security executives the foundations for implementing a defense in depth strategy for security at the edge by addressing three areas of edge security:

  • AWS services at AWS edge locations
  • How those services and others can be used to implement the best practices outlined in the design principles of the AWS Well-Architected Framework Security Pillar
  • Additional AWS edge services, which customers can use to help secure their edge environments or expand operations into new, previously unsupported environments

Together, these elements offer core principles for designing a security strategy at the edge, and demonstrate how AWS services can provide a secure environment extending from the core cloud to the edge of the AWS network and out to customer edge devices and endpoints. You can find more information in the Security at the Edge: Core Principles whitepaper.

If you have feedback about this post, submit comments in the Comments section below.

Want more AWS Security how-to content, news, and feature announcements? Follow us on Twitter.

Author

Maddie Bacon

Maddie (she/her) is a technical writer for AWS Security with a passion for creating meaningful content. She previously worked as a security reporter and editor at TechTarget and has a BA in Mathematics. In her spare time, she enjoys reading, traveling, and all things Harry Potter.

Author

Jana Kay

Since 2018, Jana has been a cloud security strategist with the AWS Security Growth Strategies team. She develops innovative ways to help AWS customers achieve their objectives, such as security table top exercises and other strategic initiatives. Previously, she was a cyber, counter-terrorism, and Middle East expert for 16 years in the Pentagon’s Office of the Secretary of Defense.

Accepting API keys as a query string in Amazon API Gateway

Post Syndicated from Eric Johnson original https://aws.amazon.com/blogs/compute/accepting-api-keys-as-a-query-string-in-amazon-api-gateway/

This post was written by Ronan Prenty, Sr. Solutions Architect and Zac Burns, Cloud Support Engineer & API Gateway SME

Amazon API Gateway is a fully managed service that makes it easier for developers to create, publish, maintain, monitor, and secure APIs at any scale. APIs act as the front door to applications and allow developers to offload tasks like authorization, throttling, caching, and more.

A common feature requested by customers is the ability to track usage for specific users or services through API keys. API Gateway REST APIs support this feature and, for added security, require that the API key resides in a header or an authorizer.

Developers may also need to pass API keys in the query string parameters. Best practices encourage refactoring the requests at the client level to move API keys to the header. However, this may not be possible during the migration.

This blog explains how to build an API Gateway REST API that temporarily accepts API keys as query string parameters. This post helps customers who have APIs that accept API keys as query string parameters and want to migrate to API Gateway with minimal impact on their clients. The post also discusses increasing security by refactoring the client to send API keys as a header instead of a query string.

There is also an example project for you to test and evaluate. This solution uses a custom authorizer AWS Lambda function to extract the API key from the query string parameter and apply it to a usage plan. The sample application uses the AWS Serverless Application Model (AWS SAM) for deployment.

Key concepts

API keys and usage plans

API keys are alphanumeric strings that are distributed to developers to grant access to an API. API Gateway can generate these on your behalf, or you can import them.

Usage plans let you provide API keys to your customers so that you can track and limit their usage. API keys are not a primary authorization mechanism for your APIs. If multiple APIs are associated with a usage plan, a user with a valid API key can access all APIs in that usage plan. We provide numerous options for securing access to your APIs, including resource policies, Lambda authorizers, and Amazon Cognito user pools.

Usage plans define who can access deployed API stages and methods along with metering their usage. Usage plans use API keys to identify who is making requests and apply throttling and quota limits.

How API Gateway handles API keys

API Gateway supports API keys sent as headers in a request. It does not support API keys sent as a query string parameter. API Gateway only accepts requests over HTTPS, which means that the request is encrypted. When sending API keys as query string parameters, there is still a risk that URLs are logged in plaintext by the client sending requests.

API Gateway has two settings to accept API keys:

  1. Header: The request contains the values as the X-API-Key header. API Gateway then validates the key against a usage plan.
  2. Authorizer: The authorizer includes the API key as part of the authorization response. Once API Gateway receives the API key as part of the response, it validates it against a usage plan.

Solution overview

To accept an API key as a query string parameter temporarily, create a custom authorizer using a Lambda function:

Note: the apiKeySource property of your API must be set to Authorizer instead of Header.

Note: the apiKeySource property of your API must be set to Authorizer instead of Header.

  1. The client sends an HTTP request to the API Gateway endpoint with the API key in the query string.
  2. API Gateway sends the request to a REQUEST type custom authorizer
  3. The custom authorizer function extracts the API Key from the payload. It constructs the response object with the API Key as the value for the `usageIdentifierKey` property
  4. The response gets sent back to API Gateway for validation.
  5. API Gateway validates the API key against a usage plan.
  6. If valid, API Gateway passes the request to the backend.

Deploying the solution

Prerequisites

This solution requires no pre-existing AWS resources and deploys everything you need from the template. Deploying the solution requires:

You can find the solution on GitHub using this link.

With the prerequisites completed, deploy the template with the following commands:

git clone https://github.com/aws-samples/amazon-apigateway-accept-apikeys-as-querystring.git
cd amazon-apigateway-accept-apikeys-as-querystring
sam build --use-container
sam deploy --guided

Long term considerations

This temporary solution enables developers to migrate APIs to API Gateway and maintain query string-based API keys. While this solution does work, it does not follow best practices.

In addition to security, there is also a cost factor. Each time the client request contains an API key, the custom authorizer AWS Lambda function will be invoked, increasing the total amount of Lambda invocations you are billed for. To ensure you are billed only for valid requests, you can add an identity source to the custom authorizer meaning that only requests containing this identity source will be sent to the Lambda function. Requests that do not contain this identity source will not be billed by Lambda or API Gateway. Migrating to a header-based API key removes the need for a custom authorizer and the extra Lambda function invocations. You can find out more information on AWS Lambda billing here.

Customer migration process

With this in mind, the structure of the request sent by API clients must change from:

GET /some-endpoint?apiKey=abc123456789

To:

GET /some-endpoint
x-api-key: abc123456789

You can provide clients with a notice period when this temporary solution is operational. After, they must migrate to a new API endpoint using a header to provide the API keys. Once the client migration is complete, they can retire the custom solution.

Developer portal

In addition to migrating API keys to a header-based solution, customers also ask us how to manage customer keys and usage plans. One option is to deploy the API Gateway developer portal.

This portal enables your customers to discover available APIs, browse API documentation, register for API keys, test APIs in the user interface, and monitor their API usage. This portal also allows you to publish non-API Gateway managed APIs by uploading OpenAPI definitions. The serverless developer portal can be customized and branded to suit your organization.

Conclusion

This blog post demonstrates how to use custom authorizers in API Gateway to accept API keys as a query string parameter. It also provides an AWS SAM template to deploy an example application for testing. Finally, it discusses the importance of moving customers to header-based API keys and managing those keys with the developer portal.

For more serverless content, visit Serverless Land.

Privacy-Preserving Compromised Credential Checking

Post Syndicated from Luke Valenta original https://blog.cloudflare.com/privacy-preserving-compromised-credential-checking/

Privacy-Preserving Compromised Credential Checking

Privacy-Preserving Compromised Credential Checking

Today we’re announcing a public demo and an open-sourced Go implementation of a next-generation, privacy-preserving compromised credential checking protocol called MIGP (“Might I Get Pwned”, a nod to Troy Hunt’s “Have I Been Pwned”). Compromised credential checking services are used to alert users when their credentials might have been exposed in data breaches. Critically, the ‘privacy-preserving’ property of the MIGP protocol means that clients can check for leaked credentials without leaking any information to the service about the queried password, and only a small amount of information about the queried username. Thus, not only can the service inform you when one of your usernames and passwords may have become compromised, but it does so without exposing any unnecessary information, keeping credential checking from becoming a vulnerability itself. The ‘next-generation’ property comes from the fact that MIGP advances upon the current state of the art in credential checking services by allowing clients to not only check if their exact password is present in a data breach, but to check if similar passwords have been exposed as well.

For example, suppose your password last year was amazon20\$, and you change your password each year (so your current password is amazon21\$). If last year’s password got leaked, MIGP could tell you that your current password is weak and guessable as it is a simple variant of the leaked password.

The MIGP protocol was designed by researchers at Cornell Tech and the University of Wisconsin-Madison, and we encourage you to read the paper for more details. In this blog post, we provide motivation for why compromised credential checking is important for security hygiene, and how the MIGP protocol improves upon the current generation of credential checking services. We then describe our implementation and the deployment of MIGP within Cloudflare’s infrastructure.

Our MIGP demo and public API are not meant to replace existing credential checking services today, but rather demonstrate what is possible in the space. We aim to push the envelope in terms of privacy and are excited to employ some cutting-edge cryptographic primitives along the way.

The threat of data breaches

Data breaches are rampant. The regularity of news articles detailing how tens or hundreds of millions of customer records have been compromised have made us almost numb to the details. Perhaps we all hope to stay safe just by being a small fish in the middle of a very large school of similar fish that is being predated upon. But we can do better than just hope that our particular authentication credentials are safe. We can actually check those credentials against known databases of the very same compromised user information we learn about from the news.

Many of the security breaches we read about involve leaked databases containing user details. In the worst cases, user data entered during account registration on a particular website is made available (often offered for sale) after a data breach. Think of the addresses, password hints, credit card numbers, and other private details you have submitted via an online form. We rely on the care taken by the online services in question to protect those details. On top of this, consider that the same (or quite similar) usernames and passwords are commonly used on more than one site. Our information across all of those sites may be as vulnerable as the site with the weakest security practices. Attackers take advantage of this fact to actively compromise accounts and exploit users every day.

Credential stuffing is an attack in which malicious parties use leaked credentials from an account on one service to attempt to log in to a variety of other services. These attacks are effective because of the prevalence of reused credentials across services and domains. After all, who hasn’t at some point had a favorite password they used for everything? (Quick plug: please use a password manager like LastPass to generate unique and complex passwords for each service you use.)

Website operators have (or should have) a vested interest in making sure that users of their service are using secure and non-compromised credentials. Given the sophistication of techniques employed by malevolent actors, the standard requirement to “include uppercase, lowercase, digit, and special characters” really is not enough (and can be actively harmful according to NIST’s latest guidance). We need to offer better options to users that keep them safe and preserve the privacy of vulnerable information. Dealing with account compromise and recovery is an expensive process for all parties involved.

Users and organizations need a way to know if their credentials have been compromised, but how can they do it? One approach is to scour dark web forums for data breach torrent links, download and parse gigabytes or terabytes of archives to your laptop, and then search the dataset to see if their credentials have been exposed. This approach is not workable for the majority of Internet users and website operators, but fortunately there’s a better way — have someone with terabytes to spare do it for you!

Making compromise checking fast and easy

This is exactly what compromised credential checking services do: they aggregate breach datasets and make it possible for a client to determine whether a username and password are present in the breached data. Have I Been Pwned (HIBP), launched by Troy Hunt in 2013, was the first major public breach alerting site. It provides a service, Pwned Passwords, where users can efficiently check if their passwords have been compromised. The initial version of Pwned Passwords required users to send the full password hash to the service to check if it appears in a data breach. In a 2018 collaboration with Cloudflare, the service was upgraded to allow users to run range queries over the password dataset, leaking only the salted hash prefix rather than the entire hash. Cloudflare continues to support the HIBP project by providing CDN and security support for organizations to download the raw Pwned Password datasets.

The HIBP approach was replicated by Google Password Checkup (GPC) in 2019, with the primary difference that GPC alerts are based on username-password pairs instead of passwords alone, which limits the rate of false positives. Enzoic and Microsoft Password Monitor are two other similar services. This year, Cloudflare also released Exposed Credential Checks as part of our Web Application Firewall (WAF) to help inform opted-in website owners when login attempts to their sites use compromised credentials. In fact, we use MIGP on the backend for this service to ensure that plaintext credentials never leave the edge server on which they are being processed.

Most standalone credential checking services work by having a user submit a query containing their password’s or username-password pair’s hash prefix. However, this leaks some information to the service, which could be problematic if the service turns out to be malicious or is compromised. In a collaboration with researchers at Cornell Tech published at CCS’19, we showed just how damaging this leaked information can be. Malevolent actors with access to the data shared with most credential checking services can drastically improve the effectiveness of password-guessing attacks. This left open the question: how can you do compromised credential checking without sharing (leaking!) vulnerable credentials to the service provider itself?

What does a privacy-preserving credential checking service look like?

In the aforementioned CCS’19 paper, we proposed an alternative system in which only the hash prefix of the username is exposed to the MIGP server (independent work out of Google and Stanford proposed a similar system). No information about the password leaves the user device, alleviating the risk of password-guessing attacks. These credential checking services help to preserve password secrecy, but still have a limitation: they can only alert users if the exact queried password appears in the breach.

The present evolution of this work, Might I Get Pwned (MIGP), proposes a next-generation similarity-aware compromised credential checking service that supports checking if a password similar to the one queried has been exposed in the data breach. This approach supports the detection of credential tweaking attacks, an advanced version of credential stuffing.

Credential tweaking takes advantage of the fact that many users, when forced to change their password, use simple variants of their original password. Rather than just attempting to log in using an exact leaked password, say ‘password123’, a credential tweaking attacker might also attempt to log in with easily-predictable variants of the password such as ‘password124’ and ‘password123!’.

There are two main mechanisms described in the MIGP paper to add password variant support: client-side generation and server-side precomputation. With client-side generation, the client simply applies a series of transform rules to the password to derive the set of variants (e.g., truncating the last letter or adding a ‘!’ at the end), and runs multiple queries to the MIGP service with each username and password variant pair. The second approach is server-side precomputation, where the server applies the transform rules to generate the password variants when encrypting the dataset, essentially treating the password variants as additional entries in the breach dataset. The MIGP paper describes tradeoffs between the two approaches and techniques for generating variants in more detail. Our demo service includes variant support via server-side precomputation.

Breach extraction attacks and countermeasures

One challenge for credential checking services are breach extraction attacks, in which an adversary attempts to learn username-password pairs that are present in the breach dataset (which might not be publicly available) so that they can attempt to use them in future credential stuffing or tweaking attacks. Similarity-aware credential checking services like MIGP can make these attacks more effective, since adversaries can potentially check for more breached credentials per API query. Fortunately, additional measures can be incorporated into the protocol to help counteract these attacks. For example, if it is problematic to leak the number of ciphertexts in a given bucket, dummy entries and padding can be employed, or an alternative length-hiding bucket format can be used. Slow hashing and API rate limiting are other common countermeasures that credential checking services can deploy to slow down breach extraction attacks. For instance, our demo service applies the memory-hard slow hash algorithm scrypt to credentials as part of the key derivation function to slow down these attacks.

Let’s now get into the nitty-gritty of how the MIGP protocol works. For readers not interested in the cryptographic details, feel free to skip to the demo below!

MIGP protocol

There are two parties involved in the MIGP protocol: the client and the server. The server has access to a dataset of plaintext breach entries (username-password pairs), and a secret key used for both the precomputation and the online portions of the protocol. In brief, the client performs some computation over the username and password and sends the result to the server; the server then returns a response that allows the client to determine if their password (or a similar password) is present in the breach dataset.

Privacy-Preserving Compromised Credential Checking
Full protocol description from the MIGP paper: clients learn if their credentials are in the breach dataset, leaking only the hash prefix of the queried username to the server

Precomputation

At a high level, the MIGP server partitions the breach dataset into buckets based on the hash prefix of the username (the bucket identifier), which is usually 16-20 bits in length.

Privacy-Preserving Compromised Credential Checking
During the precomputation phase of the MIGP protocol, the server derives password variants, encrypts entries, and stores them in buckets based on the hash prefix of the username

We use server-side precomputation as the variant generation mechanism in our implementation. The server derives one ciphertext for each exact username-password pair in the dataset, and an additional ciphertext per password variant. A bucket consists of the set ciphertexts for all breach entries and variants with the same username hash prefix. For instance, suppose there are n breach entries assigned to a particular bucket. If we compute m variants per entry, counting the original entry as one of the variants, there will be n*m ciphertexts stored in the bucket. This introduces a large expansion in the size of the processed dataset, so in practice it is necessary to limit the number of variants computed per entry. Our demo server stores 10 ciphertexts per breach entry in the input: the exact entry, eight variants (see Appendix A of the MIGP paper), and a special variant for allowing username-only checks.

Each ciphertext is the encryption of a username-password (or password variant) pair along with some associated metadata. The metadata describes whether the entry corresponds to an exact password appearing in the breach, or a variant of a breached password. The server derives a per-entry secret key pad using a key derivation function (KDF) with the username-password pair and server secret as inputs, and uses XOR encryption to derive the entry ciphertext. The bucket format also supports storing optional encrypted metadata, such as the date the breach was discovered.

Input:
  Secret sk       // Server secret key
  String u        // Username
  String w        // Password (or password variant)
  Byte mdFlag     // Metadata flag
  String mdString // Optional metadata string

Output:
  String C        // Ciphertext

function Encrypt(sk, u, w, mdFlag, mdString):
  padHdr=KDF1(u, w, sk)
  padBody=KDF2(u, w, sk)
  zeros=[0] * KEY_CHECK_LEN
  C=XOR(padHdr, zeros || mdFlag) || mdString.length || XOR(padBody, mdString)

The precomputation phase only needs to be done rarely, such as when the MIGP parameters are changed (in which case the entire dataset must be re-processed), or when new breach datasets are added (in which case the new data can be appended to the existing buckets).

Online phase

Privacy-Preserving Compromised Credential Checking
During the online phase of the MIGP protocol, the client requests a bucket of encrypted breach entries corresponding to the queried username, and with the server’s help derives a key that allows it to decrypt an entry corresponding to the queried credentials

The online phase of the MIGP protocol allows a client to check if a username-password pair (or variant) appears in the server’s breach dataset, while only leaking the hash prefix of the username to the server. The client and server engage in an OPRF protocol message exchange to allow the client to derive the per-entry decryption key, without leaking the username and password to the server, or the server’s secret key to the client. The client then computes the bucket identifier from the queried username and downloads the corresponding bucket of entries from the server. Using the decryption key derived in the previous step, the client scans through the entries in the bucket attempting to decrypt each one. If the decryption succeeds, this signals to the client that their queried credentials (or a variant thereof) are in the server’s dataset. The decrypted metadata flag indicates whether the entry corresponds to the exact password or a password variant.

The MIGP protocol solves many of the shortcomings of existing credential checking services with its solution that avoids leaking any information about the client’s queried password to the server, while also providing a mechanism for checking for similar password compromise. Read on to see the protocol in action!

MIGP demo

As the state of the art in attack methodologies evolve with new techniques such as credential tweaking, so must the defenses. To that end, we’ve collaborated with the designers of the MIGP protocol to prototype and deploy the MIGP protocol within Cloudflare’s infrastructure.

Our MIGP demo server is deployed at migp.cloudflare.com, and runs entirely on top of Cloudflare Workers. We use Workers KV for efficient storage and retrieval of buckets of encrypted breach entries, capping out each bucket size at the current KV value limit of 25MB. In our instantiation, we set the username hash prefix length to 20 bits, so that there are a total of 2^20 (or just over 1 million) buckets.

There are currently two ways to interact with the demo MIGP service: via the browser client at migp.cloudflare.com, or via the Go client included in our open-sourced MIGP library. As shown in the screenshots below, the browser client displays the request from your device and the response from the MIGP service. You should take caution to not input any sensitive credentials in a third-party service (feel free to use the test credentials [email protected] and password1 for the demo).

Keep in mind that “absence of evidence is not evidence of absence”, especially in the context of data breaches. We intend to periodically update the breach datasets used by the service as new public breaches become available, but no breach alerting service will be able to provide 100% accuracy in assuring that your credentials are safe.

See the MIGP demo in action in the attached screenshots. Note that in all cases, the username ([email protected]) and corresponding username prefix hash (000f90f4) remain the same, so the client retrieves the exact same bucket contents from the server each time. However, the blindElement parameter in the client request differs per request, allowing the client to decrypt different bucket elements depending on the queried credentials.

Privacy-Preserving Compromised Credential Checking
Example query in which the credentials are exposed in the breach dataset
Privacy-Preserving Compromised Credential Checking
Example query in which similar credentials were exposed in the breach dataset
Privacy-Preserving Compromised Credential Checking
Example query in which the username is present in the breach dataset
Privacy-Preserving Compromised Credential Checking
Example query in which the credentials are not found in the dataset

Open-sourced MIGP library

We are open-sourcing our implementation of the MIGP library under the BSD-3 License. The code is written in Go and is available at https://github.com/cloudflare/migp-go. Under the hood, we use Cloudflare’s CIRCL library for OPRF support and Go’s supplementary cryptography library for scrypt support. Check out the repository for instructions on setting up the MIGP client to connect to Cloudflare’s demo MIGP service. Community contributions and feedback are welcome!

Future directions

In this post, we announced our open-sourced implementation and demo deployment of MIGP, a next-generation breach alerting service. Our deployment is intended to lead the way for other credential compromise checking services to migrate to a more privacy-friendly model, but is not itself currently meant for production use. However, we identify several concrete steps that can be taken to improve our service in the future:

  • Add more breach datasets to the database of precomputed entries
  • Increase the number of variants in server-side precomputation
  • Add library support in more programming languages to reach a broader developer base
  • Hide the number of ciphertexts per bucket by padding with dummy entries
  • Add support for efficient client-side variant checking by batching API calls to the server

For exciting future research directions that we are investigating — including one proposal to remove the transmission of plaintext passwords from client to server entirely — take a look at https://blog.cloudflare.com/research-directions-in-password-security.

We are excited to share and build upon these ideas with the wider Internet community, and hope that our efforts impact positive change in the password security ecosystem. We are particularly interested in collaborating with stakeholders in the space to develop, test, and deploy next-generation protocols to improve user security and privacy. You can reach us with questions, comments, and research ideas at [email protected]. For those interested in joining our team, please visit our Careers Page.