Post Syndicated from Danilo Poccia original https://aws.amazon.com/blogs/aws/aws-lambda-functions-powered-by-aws-graviton2-processor-run-your-functions-on-arm-and-get-up-to-34-better-price-performance/
Many of our customers (such as Formula One, Honeycomb, Intuit, SmugMug, and Snap Inc.) use the Arm-based AWS Graviton2 processor for their workloads and enjoy better price performance. Starting today, you can get the same benefits for your AWS Lambda functions. You can now configure new and existing functions to run on x86 or Arm/Graviton2 processors.
With this choice, you can save money in two ways. First, your functions run more efficiently due to the Graviton2 architecture. Second, you pay less for the time that they run. In fact, Lambda functions powered by Graviton2 are designed to deliver up to 19 percent better performance at 20 percent lower cost.
With Lambda, you are charged based on the number of requests for your functions and the duration (the time it takes for your code to execute) with millisecond granularity. For functions using the Arm/Graviton2 architecture, duration charges are 20 percent lower than the current pricing for x86. The same 20 percent reduction also applies to duration charges for functions using Provisioned Concurrency.
In addition to the price reduction, functions using the Arm architecture benefit from the performance and security built into the Graviton2 processor. Workloads using multithreading and multiprocessing, or performing many I/O operations, can experience lower execution time and, as a consequence, even lower costs. This is particularly useful now that you can use Lambda functions with up to 10 GB of memory and 6 vCPUs. For example, you can get better performance for web and mobile backends, microservices, and data processing systems.
If your functions don’t use architecture-specific binaries, including in their dependencies, you can switch from one architecture to the other. This is often the case for many functions using interpreted languages such as Node.js and Python or functions compiled to Java bytecode.
All Lambda runtimes built on top of Amazon Linux 2, including the custom runtime, are supported on Arm, with the exception of Node.js 10 that has reached end of support. If you have binaries in your function packages, you need to rebuild the function code for the architecture you want to use. Functions packaged as container images need to be built for the architecture (x86 or Arm) they are going to use.
To measure the difference between architectures, you can create two versions of a function, one for x86 and one for Arm. You can then send traffic to the function via an alias using weights to distribute traffic between the two versions. In Amazon CloudWatch, performance metrics are collected by function versions, and you can look at key indicators (such as duration) using statistics. You can then compare, for example, average and p99 duration between the two architectures.
You can also use function versions and weighted aliases to control the rollout in production. For example, you can deploy the new version to a small amount of invocations (such as 1 percent) and then increase up to 100 percent for a complete deployment. During rollout, you can lower the weight or set it to zero if your metrics show something suspicious (such as an increase in errors).
Let’s see how this new capability works in practice with a few examples.
Changing Architecture for Functions with No Binary Dependencies
When there are no binary dependencies, changing the architecture of a Lambda function is like flipping a switch. For example, some time ago, I built a quiz app with a Lambda function. With this app, you can ask and answer questions using a web API. I use an Amazon API Gateway HTTP API to trigger the function. Here’s the Node.js code including a few sample questions at the beginning:
const questions = [
  {
    question:
      "Are there more synapses (nerve connections) in your brain or stars in our galaxy?",
    answers: [
      "More stars in our galaxy.",
      "More synapses (nerve connections) in your brain.",
      "They are about the same.",
    ],
    correctAnswer: 1,
  },
  {
    question:
      "Did Cleopatra live closer in time to the launch of the iPhone or to the building of the Giza pyramids?",
    answers: [
      "To the launch of the iPhone.",
      "To the building of the Giza pyramids.",
      "Cleopatra lived right in between those events.",
    ],
    correctAnswer: 0,
  },
  {
    question:
      "Did mammoths still roam the earth while the pyramids were being built?",
    answers: [
      "No, they were all exctint long before.",
      "Mammooths exctinction is estimated right about that time.",
      "Yes, some still survived at the time.",
    ],
    correctAnswer: 2,
  },
];

exports.handler = async (event) => {
  console.log(event);

  const method = event.requestContext.http.method;
  const path = event.requestContext.http.path;
  const splitPath = path.replace(/^\/+|\/+$/g, "").split("/");

  console.log(method, path, splitPath);

  var response = {
    statusCode: 200,
    body: "",
  };

  if (splitPath[0] == "questions") {
    if (splitPath.length == 1) {
      console.log(Object.keys(questions));
      response.body = JSON.stringify(Object.keys(questions));
    } else {
      const questionId = splitPath[1];
      const question = questions[questionId];
      if (question === undefined) {
        response = {
          statusCode: 404,
          body: JSON.stringify({ message: "Question not found" }),
        };
      } else {
        if (splitPath.length == 2) {
          const publicQuestion = {
            question: question.question,
            answers: question.answers.slice(),
          };
          response.body = JSON.stringify(publicQuestion);
        } else {
          const answerId = splitPath[2];
          if (answerId == question.correctAnswer) {
            response.body = JSON.stringify({ correct: true });
          } else {
            response.body = JSON.stringify({ correct: false });
          }
        }
      }
    }
  }

  return response;
};
To start my quiz, I ask for the list of question IDs. To do so, I use curl with an HTTP GET on the /questions endpoint:
$ curl https://<api-id>.execute-api.us-east-1.amazonaws.com/questions
[
  "0",
  "1",
  "2"
]
Then, I ask more information on a question by adding the ID to the endpoint:
$ curl https://<api-id>.execute-api.us-east-1.amazonaws.com/questions/1
{
  "question": "Did Cleopatra live closer in time to the launch of the iPhone or to the building of the Giza pyramids?",
  "answers": [
    "To the launch of the iPhone.",
    "To the building of the Giza pyramids.",
    "Cleopatra lived right in between those events."
  ]
}
I plan to use this function in production. I expect many invocations and look for options to optimize my costs. In the Lambda console, I see that this function is using the x86_64 architecture.

Because this function is not using any binaries, I switch architecture to arm64 and benefit from the lower pricing.

The change in architecture doesn’t change the way the function is invoked or communicates its response back. This means that the integration with the API Gateway, as well as integrations with other applications or tools, are not affected by this change and continue to work as before.
I continue my quiz with no hint that the architecture used to run the code has changed in the backend. I answer back to the previous question by adding the number of the answer (starting from zero) to the question endpoint:
$ curl https://<api-id>.execute-api.us-east-1.amazonaws.com/questions/1/0
{
  "correct": true
}
That’s correct! Cleopatra lived closer in time to the launch of the iPhone than the building of the Giza pyramids. While I am digesting this piece of information, I realize that I completed the migration of the function to Arm and optimized my costs.
Changing Architecture for Functions Packaged Using Container Images
When we introduced the capability to package and deploy Lambda functions using container images, I did a demo with a Node.js function generating a PDF file with the PDFKit module. Let’s see how to migrate this function to Arm.
Each time it is invoked, the function creates a new PDF mail containing random data generated by the faker.js module. The output of the function is using the syntax of the Amazon API Gateway to return the PDF file using Base64 encoding. For convenience, I replicate the code (app.js) of the function here:
const PDFDocument = require('pdfkit');
const faker = require('faker');
const getStream = require('get-stream');

exports.lambdaHandler = async (event) => {

    const doc = new PDFDocument();

    const randomName = faker.name.findName();

    doc.text(randomName, { align: 'right' });
    doc.text(faker.address.streetAddress(), { align: 'right' });
    doc.text(faker.address.secondaryAddress(), { align: 'right' });
    doc.text(faker.address.zipCode() + ' ' + faker.address.city(), { align: 'right' });
    doc.moveDown();
    doc.text('Dear ' + randomName + ',');
    doc.moveDown();
    for(let i = 0; i < 3; i++) {
        doc.text(faker.lorem.paragraph());
        doc.moveDown();
    }
    doc.text(faker.name.findName(), { align: 'right' });
    doc.end();

    pdfBuffer = await getStream.buffer(doc);
    pdfBase64 = pdfBuffer.toString('base64');

    const response = {
        statusCode: 200,
        headers: {
            'Content-Length': Buffer.byteLength(pdfBase64),
            'Content-Type': 'application/pdf',
            'Content-disposition': 'attachment;filename=test.pdf'
        },
        isBase64Encoded: true,
        body: pdfBase64
    };
    return response;
};
To run this code, I need the pdfkit, faker, and get-stream npm modules. These packages and their versions are described in the package.json and package-lock.json files.
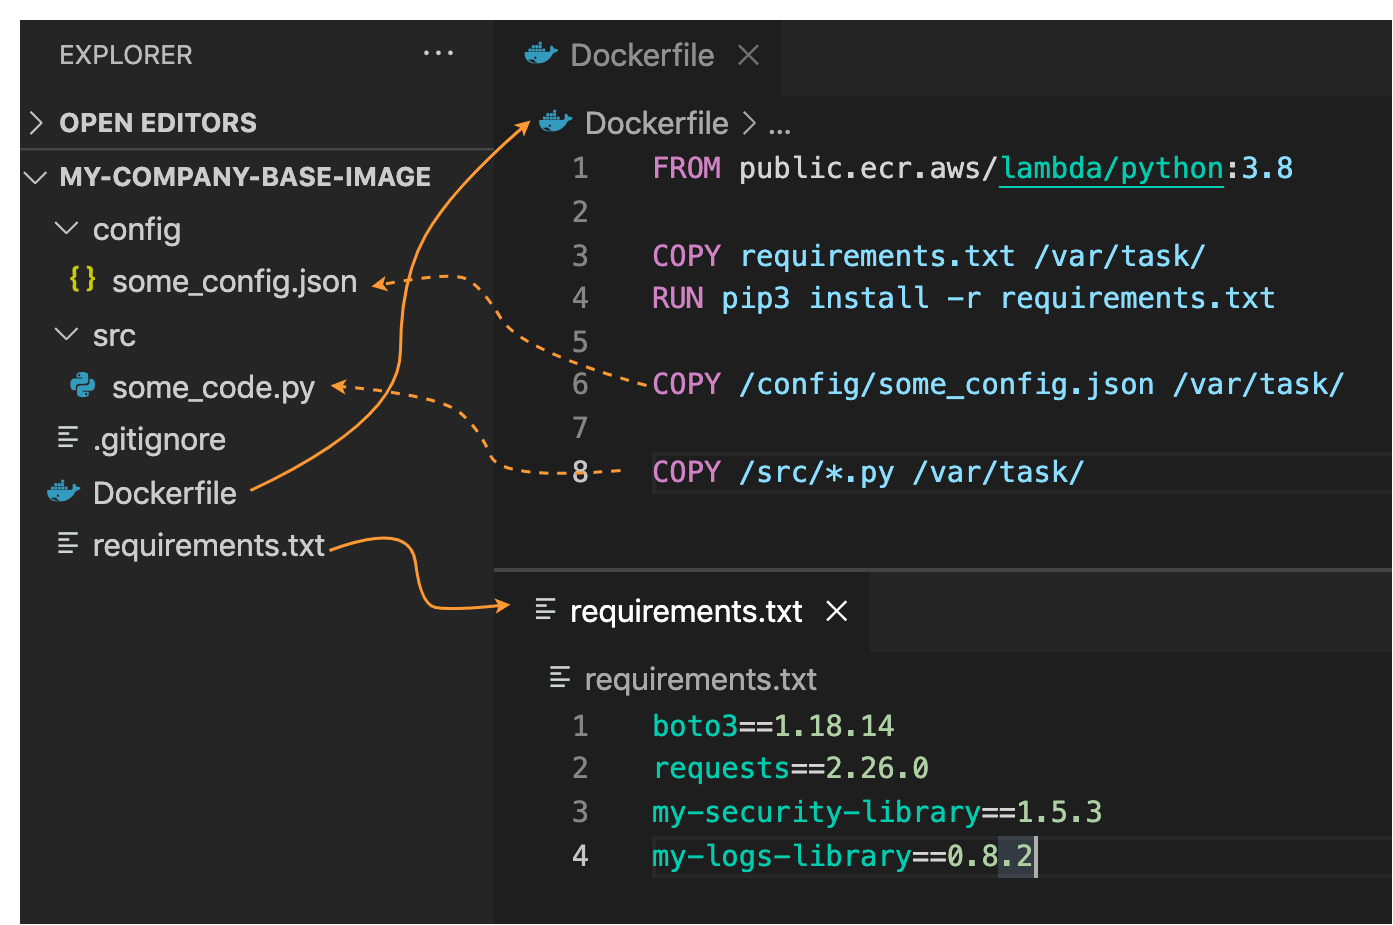
I update the FROM line in the Dockerfile to use an AWS base image for Lambda for the Arm architecture. Given the chance, I also update the image to use Node.js 14 (I was using Node.js 12 at the time). This is the only change I need to switch architecture.
FROM public.ecr.aws/lambda/nodejs:14-arm64
COPY app.js package*.json ./
RUN npm install
CMD [ "app.lambdaHandler" ]
For the next steps, I follow the post I mentioned previously. This time I use random-letter-arm for the name of the container image and for the name of the Lambda function. First, I build the image:
$ docker build -t random-letter-arm .
Then, I inspect the image to check that it is using the right architecture:
$ docker inspect random-letter-arm | grep Architecture

"Architecture": "arm64",
To be sure the function works with the new architecture, I run the container locally.
$ docker run -p 9000:8080 random-letter-arm:latest
Because the container image includes the Lambda Runtime Interface Emulator, I can test the function locally:
$ curl -XPOST "http://localhost:9000/2015-03-31/functions/function/invocations" -d '{}'
It works! The response is a JSON document containing a base64-encoded response for the API Gateway:
{
    "statusCode": 200,
    "headers": {
        "Content-Length": 2580,
        "Content-Type": "application/pdf",
        "Content-disposition": "attachment;filename=test.pdf"
    },
    "isBase64Encoded": true,
    "body": "..."
}
Confident that my Lambda function works with the arm64 architecture, I create a new Amazon Elastic Container Registry repository using the AWS Command Line Interface (CLI):
$ aws ecr create-repository --repository-name random-letter-arm --image-scanning-configuration scanOnPush=true
I tag the image and push it to the repo:
$ docker tag random-letter-arm:latest 123412341234.dkr.ecr.us-east-1.amazonaws.com/random-letter-arm:latest
$ aws ecr get-login-password | docker login --username AWS --password-stdin 123412341234.dkr.ecr.us-east-1.amazonaws.com
$ docker push 123412341234.dkr.ecr.us-east-1.amazonaws.com/random-letter-arm:latest
In the Lambda console, I create the random-letter-arm function and select the option to create the function from a container image.

I enter the function name, browse my ECR repositories to select the random-letter-arm container image, and choose the arm64 architecture.

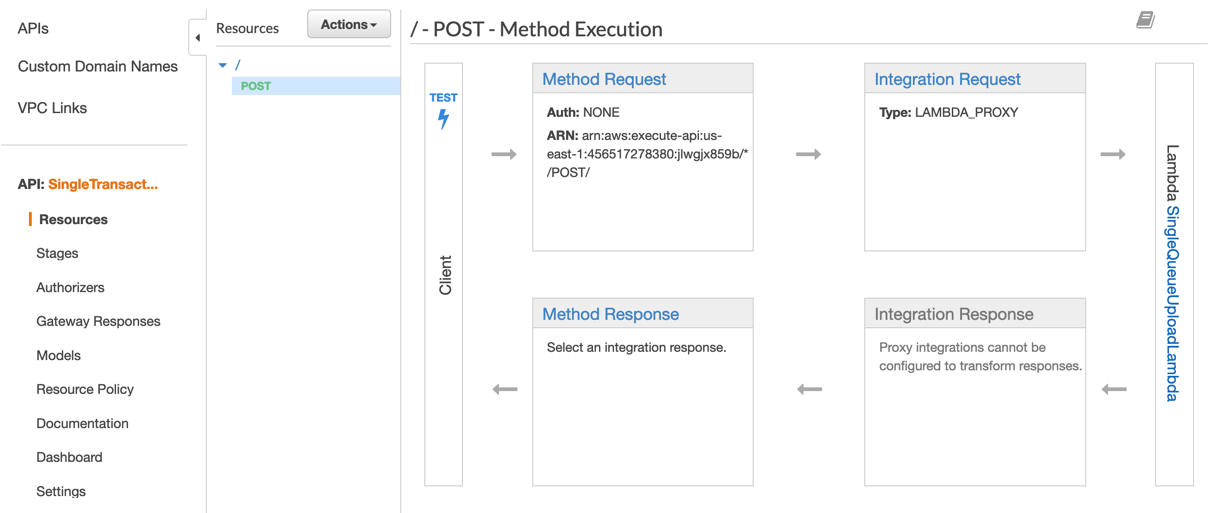
I complete the creation of the function. Then, I add the API Gateway as a trigger. For simplicity, I leave the authentication of the API open.

Now, I click on the API endpoint a few times and download some PDF mails generated with random data:

The migration of this Lambda function to Arm is complete. The process will differ if you have specific dependencies that do not support the target architecture. The ability to test your container image locally helps you find and fix issues early in the process.
Comparing Different Architectures with Function Versions and Aliases
To have a function that makes some meaningful use of the CPU, I use the following Python code. It computes all prime numbers up to a limit passed as a parameter. I am not using the best possible algorithm here, that would be the sieve of Eratosthenes, but it’s a good compromise for an efficient use of memory. To have more visibility, I add the architecture used by the function to the response of the function.
import json
import math
import platform
import timeit

def primes_up_to(n):
    primes = []
    for i in range(2, n+1):
        is_prime = True
        sqrt_i = math.isqrt(i)
        for p in primes:
            if p > sqrt_i:
                break
            if i % p == 0:
                is_prime = False
                break
        if is_prime:
            primes.append(i)
    return primes

def lambda_handler(event, context):
    start_time = timeit.default_timer()
    N = int(event['queryStringParameters']['max'])
    primes = primes_up_to(N)
    stop_time = timeit.default_timer()
    elapsed_time = stop_time - start_time

    response = {
        'machine': platform.machine(),
        'elapsed': elapsed_time,
        'message': 'There are {} prime numbers <= {}'.format(len(primes), N)
    }

    return {
        'statusCode': 200,
        'body': json.dumps(response)
    }
I create two function versions using different architectures.

I use a weighted alias with 50% weight on the x86 version and 50% weight on the Arm version to distribute invocations evenly. When invoking the function through this alias, the two versions running on the two different architectures are executed with the same probability.

I create an API Gateway trigger for the function alias and then generate some load using a few terminals on my laptop. Each invocation computes prime numbers up to one million. You can see in the output how two different architectures are used to run the function.
$ while True
  do
    curl https://<api-id>.execute-api.us-east-1.amazonaws.com/default/prime-numbers\?max\=1000000
  done

{"machine": "aarch64", "elapsed": 1.2595275060011772, "message": "There are 78498 prime numbers <= 1000000"}
{"machine": "aarch64", "elapsed": 1.2591725109996332, "message": "There are 78498 prime numbers <= 1000000"}
{"machine": "x86_64", "elapsed": 1.7200910530000328, "message": "There are 78498 prime numbers <= 1000000"}
{"machine": "x86_64", "elapsed": 1.6874686619994463, "message": "There are 78498 prime numbers <= 1000000"}
{"machine": "x86_64", "elapsed": 1.6865161940004327, "message": "There are 78498 prime numbers <= 1000000"}
{"machine": "aarch64", "elapsed": 1.2583248640003148, "message": "There are 78498 prime numbers <= 1000000"}
...
During these executions, Lambda sends metrics to CloudWatch and the function version (ExecutedVersion) is stored as one of the dimensions.
To better understand what is happening, I create a CloudWatch dashboard to monitor the p99 duration for the two architectures. In this way, I can compare the performance of the two environments for this function and make an informed decision on which architecture to use in production.

For this particular workload, functions are running much faster on the Graviton2 processor, providing a better user experience and much lower costs.
Comparing Different Architectures with Lambda Power Tuning
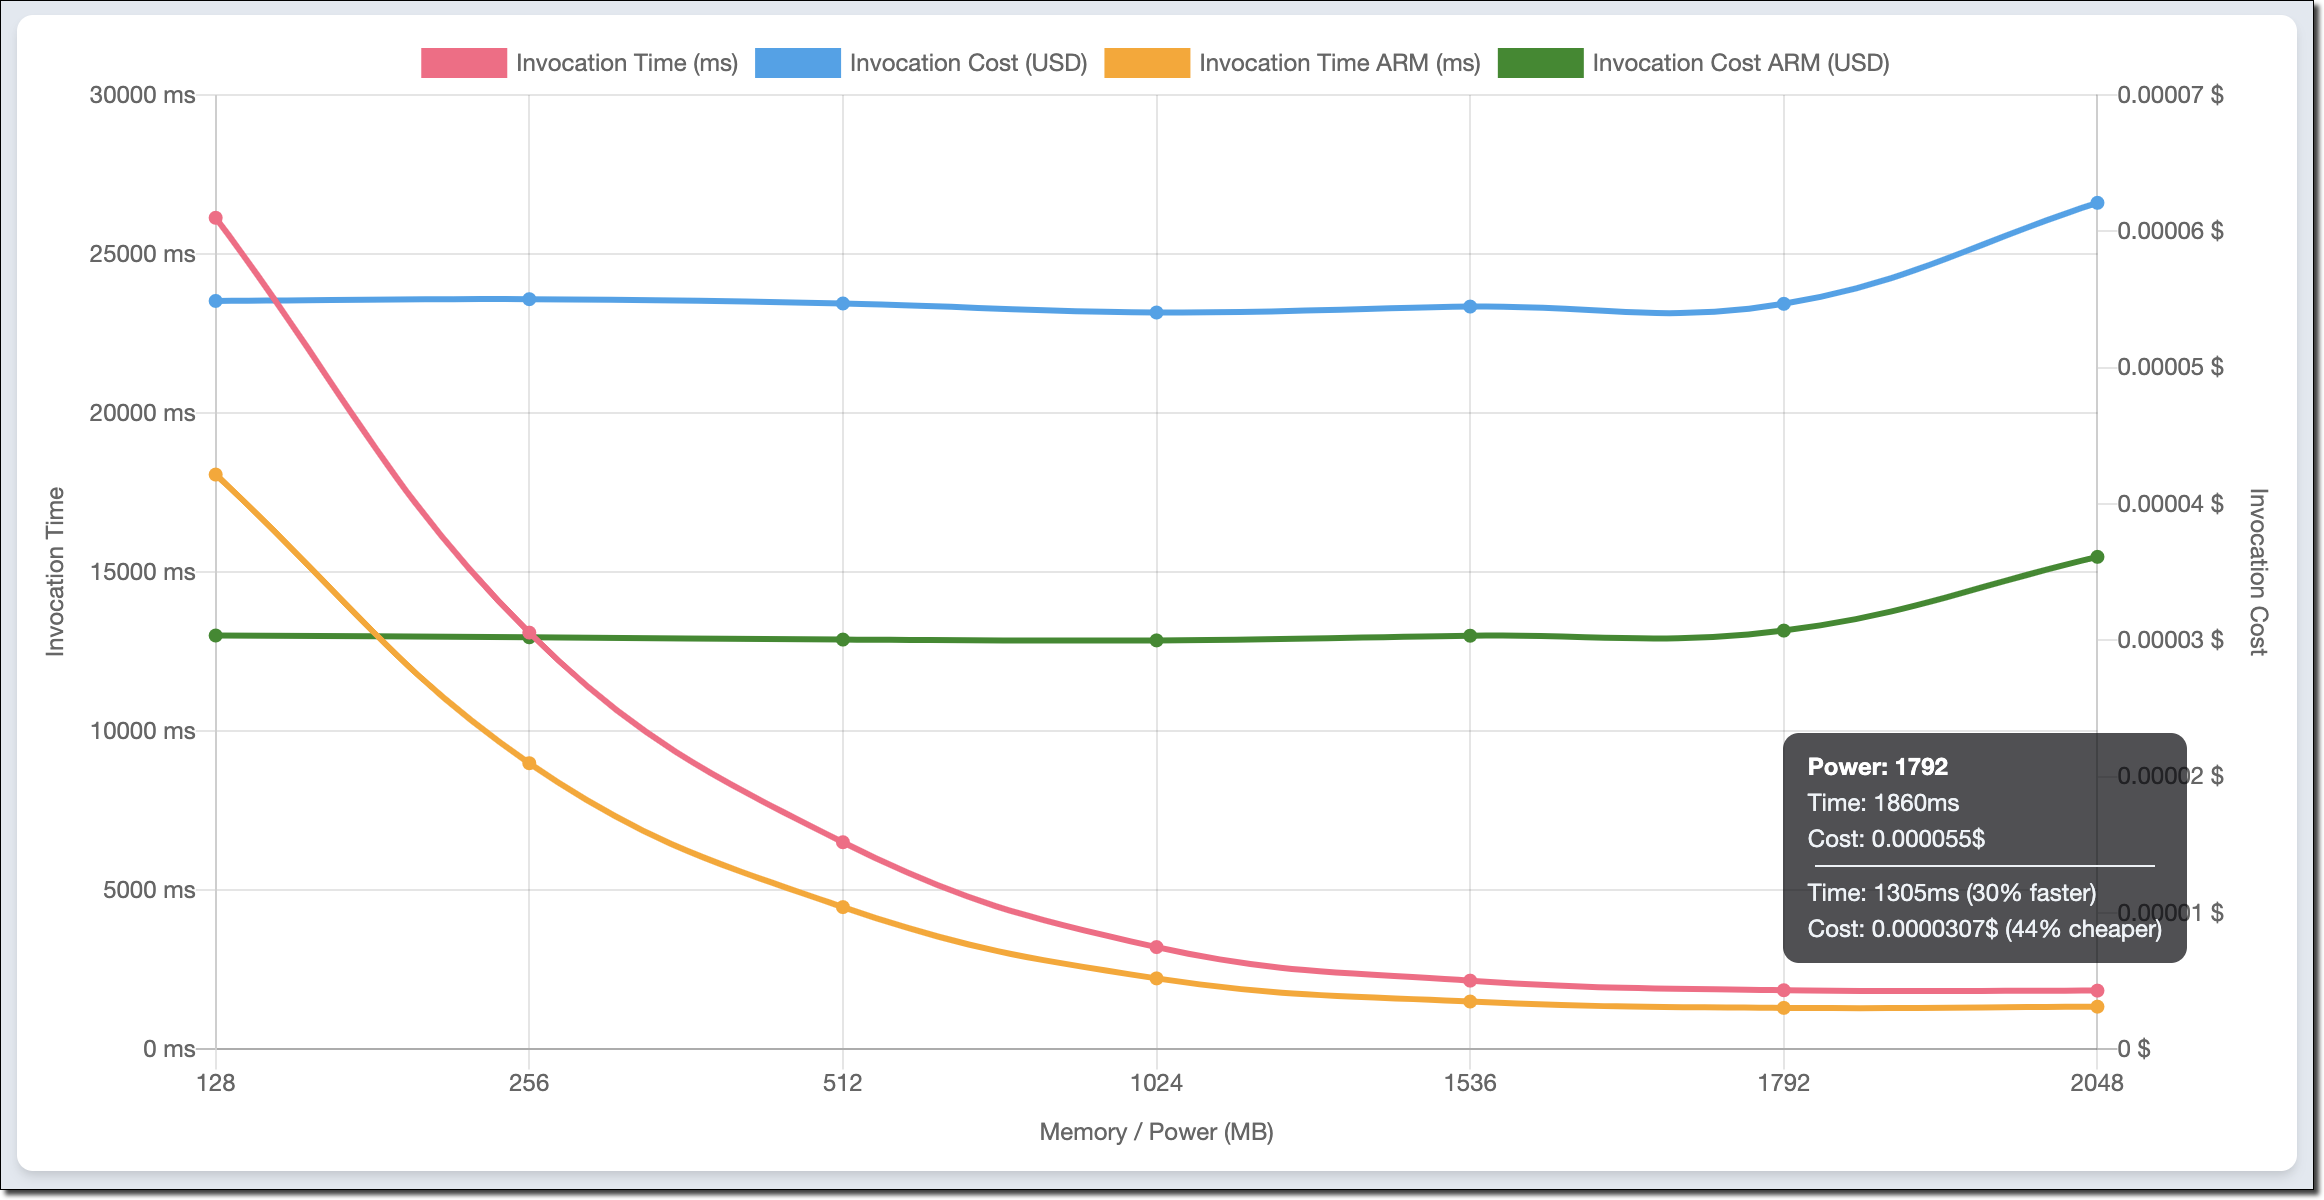
The AWS Lambda Power Tuning open-source project, created by my friend Alex Casalboni, runs your functions using different settings and suggests a configuration to minimize costs and/or maximize performance. The project has recently been updated to let you compare two results on the same chart. This comes in handy to compare two versions of the same function, one using x86 and the other Arm.
For example, this chart compares x86 and Arm/Graviton2 results for the function computing prime numbers I used earlier in the post:

The function is using a single thread. In fact, the lowest duration for both architectures is reported when memory is configured with 1.8 GB. Above that, Lambda functions have access to more than 1 vCPU, but in this case, the function can’t use the additional power. For the same reason, costs are stable with memory up to 1.8 GB. With more memory, costs increase because there are no additional performance benefits for this workload.
I look at the chart and configure the function to use 1.8 GB of memory and the Arm architecture. The Graviton2 processor is clearly providing better performance and lower costs for this compute-intensive function.
Availability and Pricing
You can use Lambda Functions powered by Graviton2 processor today in US East (N. Virginia), US East (Ohio), US West (Oregon), Europe (Frankfurt), Europe (Ireland), EU (London), Asia Pacific (Mumbai), Asia Pacific (Singapore), Asia Pacific (Sydney), Asia Pacific (Tokyo).
The following runtimes running on top of Amazon Linux 2 are supported on Arm:
- Node.js 12 and 14
- Python 3.8 and 3.9
- Java 8 (
java8.al2) and 11
- .NET Core 3.1
- Ruby 2.7
- Custom Runtime (
provided.al2)
You can manage Lambda Functions powered by Graviton2 processor using AWS Serverless Application Model (SAM) and AWS Cloud Development Kit (AWS CDK). Support is also available through many AWS Lambda Partners such as AntStack, Check Point, Cloudwiry, Contino, Coralogix, Datadog, Lumigo, Pulumi, Slalom, Sumo Logic, Thundra, and Xerris.
Lambda functions using the Arm/Graviton2 architecture provide up to 34 percent price performance improvement. The 20 percent reduction in duration costs also applies when using Provisioned Concurrency. You can further reduce your costs by up to 17 percent with Compute Savings Plans. Lambda functions powered by Graviton2 are included in the AWS Free Tier up to the existing limits. For more information, see the AWS Lambda pricing page.
You can find help to optimize your workloads for the AWS Graviton2 processor in the Getting started with AWS Graviton repository.
Start running your Lambda functions on Arm today.
— Danilo


 Note the template parameters:
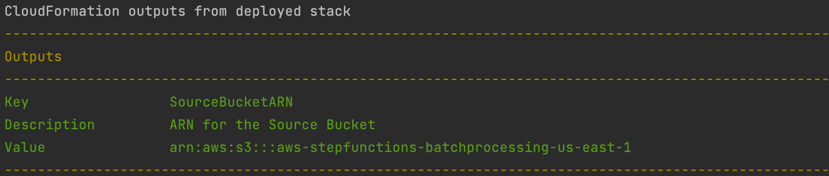
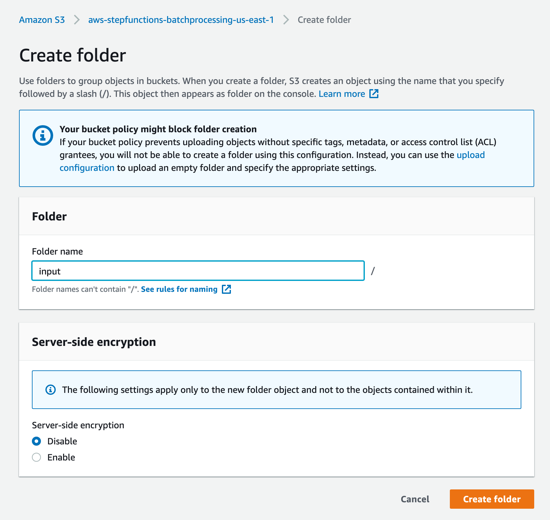
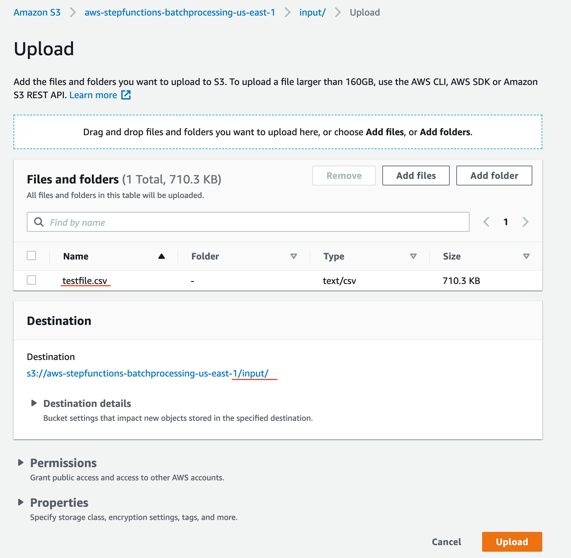


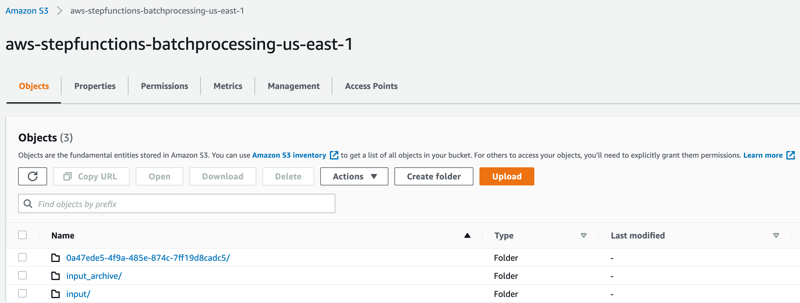
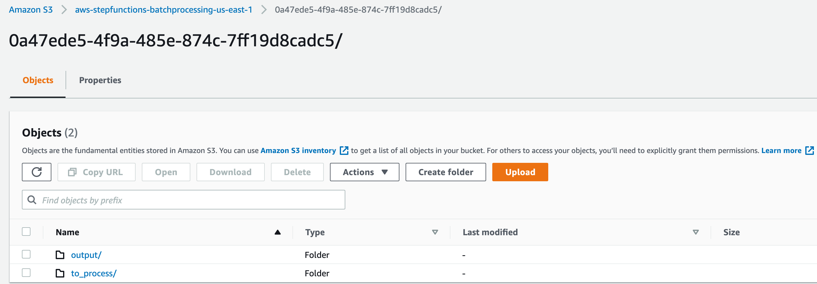
 to_process – This folder contains all the split objects from the original input file.
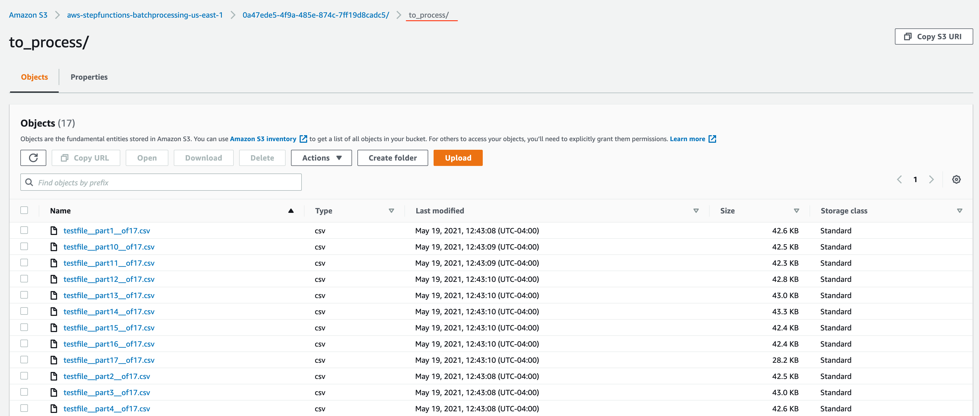


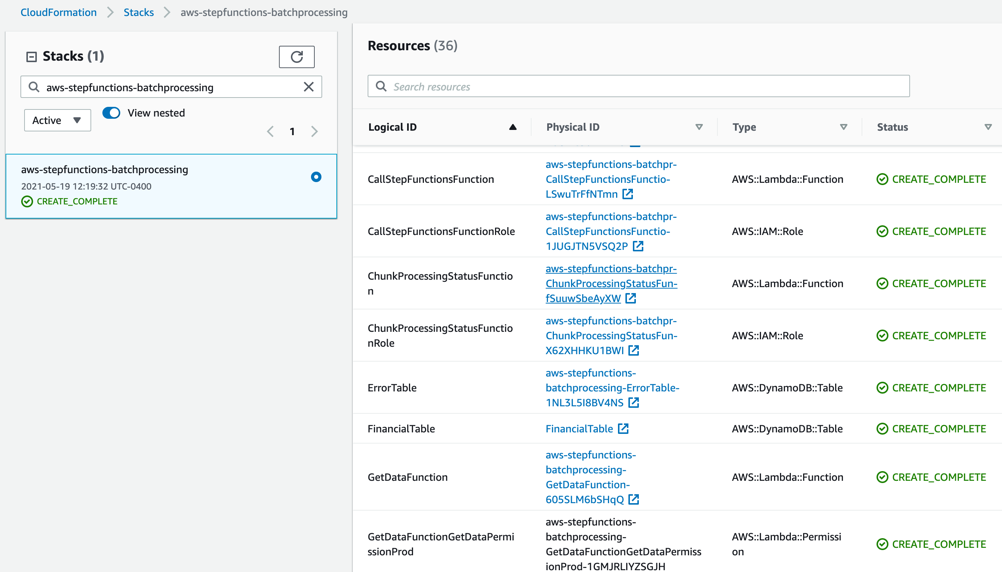
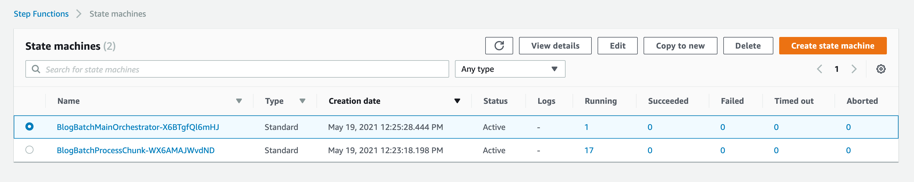
 After stack creation, you see


