Post Syndicated from James Beswick original https://aws.amazon.com/blogs/compute/expanding-cross-region-event-routing-with-amazon-eventbridge/
This post is written by Stephen Liedig, Sr Serverless Specialist SA.
In April 2021, AWS announced a new feature for Amazon EventBridge that allows you to route events from any commercial AWS Region to US East (N. Virginia), US West (Oregon), and Europe (Ireland). From today, you can now route events between any AWS Regions, except AWS GovCloud (US) and China.
EventBridge enables developers to create event-driven applications by routing events between AWS services, integrated software as a service (SaaS) applications, and your own applications. This helps you produce loosely coupled, distributed, and maintainable architectures. With these new capabilities, you can now route events across Regions and accounts using the same model used to route events to existing targets.
Cross-Region event routing with Amazon EventBridge makes it easier for customers to develop multi-Region workloads to:
- Centralize your AWS events into one Region for auditing and monitoring purposes, such as aggregating security events for compliance reasons in a single account.
- Replicate events from source to destinations Regions to help synchronize data in cross-Region data stores.
- Invoke asynchronous workflows in a different Region from a source event. For example, you can load balance from a target Region by routing events to another Region.
A previous post shows how cross-Region routing works. This blog post expands on these concepts and discusses a common use case for cross-Region event delivery – event auditing. This example explores how you can manage resources using AWS CloudFormation and EventBridge resource policies.
Multi-Region event auditing example walkthrough
Compliance is an important part of building event-driven applications and reacting to any potential policy or security violations. Customers use EventBridge to route security events from applications and globally distributed infrastructure into a single account for analysis. In many cases, they share specific AWS CloudTrail events with security teams. Customers also audit events from their custom-built applications to monitor sensitive data usage.
In this scenario, a company has their base of operations located in Asia Pacific (Singapore) with applications distributed across US East (N. Virginia) and Europe (Frankfurt). The applications in US East (N. Virginia) and Europe (Frankfurt) are using EventBridge for their respective applications and services. The security team in Asia Pacific (Singapore) wants to analyze events from the applications and CloudTrail events for specific API calls to monitor infrastructure security.

To create the rules to receive these events:
- Create a new set of rules directly on all the event buses across the global infrastructure. Alternatively, delegate the responsibility of managing security rules to distributed teams that manage the event bus resources.
- Provide the security team with the ability to manage rules centrally, and control the lifecycle of rules on the global infrastructure.
Allowing the security team to manage the resources centrally provides more scalability. It is more consistent with the design principle that event consumers own and manage the rules that define how they process events.
Deploying the example application
The following code snippets are shortened for brevity. The full source code of the solution is in the GitHub repository. The solution uses AWS Serverless Application Model (AWS SAM) for deployment. Clone the repo and navigate to the solution directory:
git clone https://github.com/aws-samples/amazon-eventbridge-resource-policy-samples
cd ./patterns/ cross-region-cross-account-pattern/
To allow the security team to start receiving accounts from any of the cross-Region accounts:
1. Create a security event bus in the Asia Pacific (Singapore) Region with a rule that processes events from the respective event sources.

For simplicity, this example uses an Amazon CloudWatch Logs target to visualize the events arriving from cross-Region accounts:
 SecurityEventBus:
  Type: AWS::Events::EventBus
  Properties:
   Name: !Ref SecurityEventBusName

 # This rule processes events coming in from cross-Region accounts
 SecurityAnalysisRule:
  Type: AWS::Events::Rule
  Properties:
   Name: SecurityAnalysisRule
   Description: Analyze events from cross-Region event buses
   EventBusName: !GetAtt SecurityEventBus.Arn
   EventPattern:
    source:
     - anything-but: com.company.security
   State: ENABLED
   RoleArn: !GetAtt WriteToCwlRole.Arn
   Targets:
    - Id: SendEventToSecurityAnalysisRule
     Arn: !Sub "arn:aws:logs:${AWS::Region}:${AWS::AccountId}:log-group:${SecurityAnalysisRuleTarget}"
In this example, you set the event pattern to process any event from a source that is not from the security team’s own domain. This allows you to process events from any account in any Region. You can filter this further as needed.
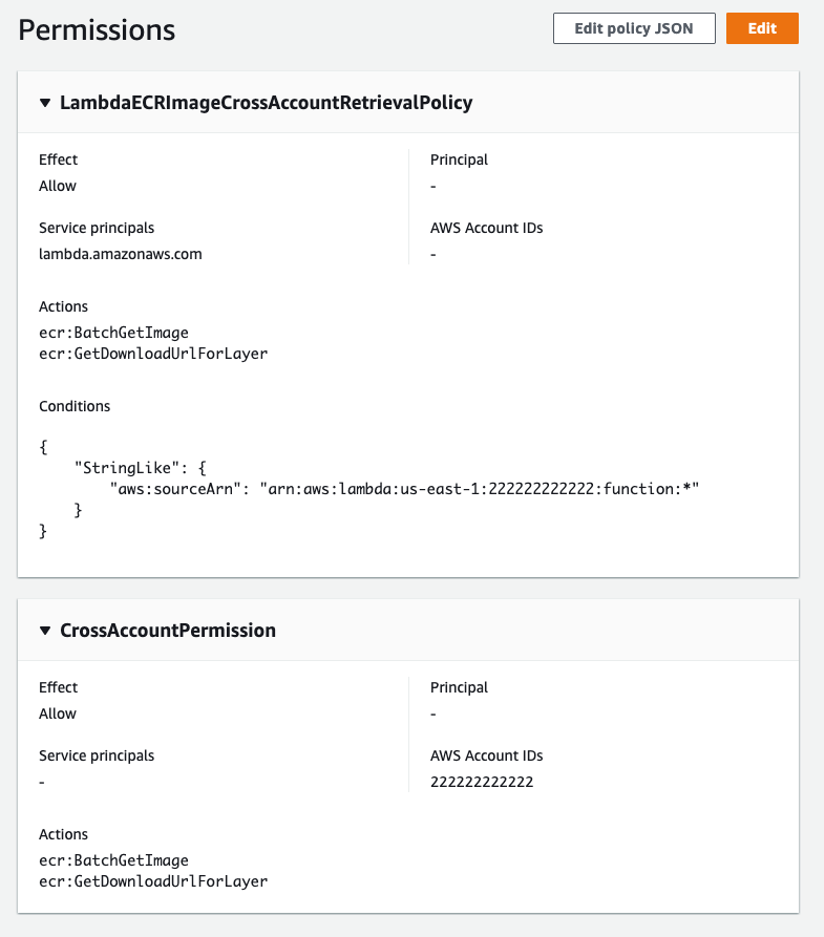
2. Set an event bus policy on each default and custom event bus that the security team must receive events from.
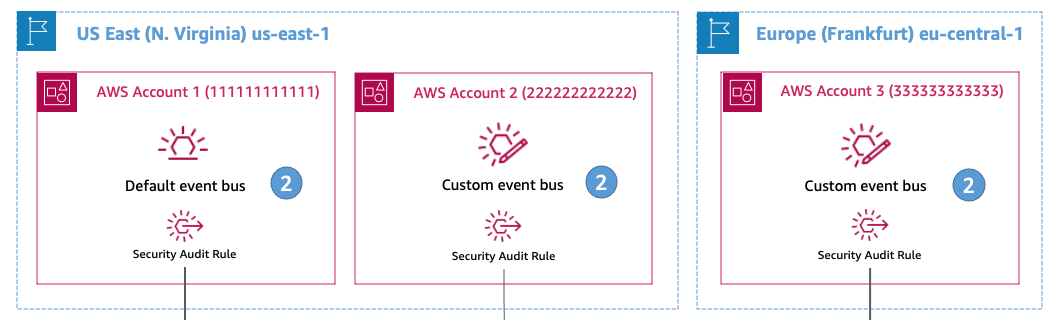
This policy allows the security team to create rules to route events to its own security event bus in the Asia Pacific (Singapore) Region. The following policy defines a custom event bus in Account 2 in US East (N. Virginia) and an AWS::Events::EventBusPolicy that sets the Principal as the security team account.
This allows the security team to manage rules on the CustomEventBus:
 CustomEventBus:
  Type: AWS::Events::EventBus
  Properties:
    Name: !Ref EventBusName

 SecurityServiceRuleCreationStatement:
  Type: AWS::Events::EventBusPolicy
  Properties:
   EventBusName: !Ref CustomEventBus # If you omit this, the default event bus is used.
   StatementId: "AllowCrossRegionRulesForSecurityTeam"
   Statement:
    Effect: "Allow"
    Principal:
     AWS: !Sub "arn:aws:iam::${SecurityAccountNo}:root"
    Action:
     - "events:PutRule"
     - "events:DeleteRule"
     - "events:DescribeRule"
     - "events:DisableRule"
     - "events:EnableRule"
     - "events:PutTargets"
     - "events:RemoveTargets"
    Resource:
     - !Sub 'arn:aws:events:${AWS::Region}:${AWS::AccountId}:rule/${CustomEventBus.Name}/*'
    Condition:
     StringEqualsIfExists:
      "events:creatorAccount": "${aws:PrincipalAccount}"
3. With the policies set on the cross-Region accounts, now create the rules. Because you cannot create CloudFormation resources across Regions, you must define the rules in separate templates. This also gives the ability to expand to other Regions.
Once the template is deployed to the cross-Region accounts, use EventBridge resource policies to propagate rule definitions across accounts in the same Region. The security account must have permission to create CloudFormation resources in the cross-Region accounts to deploy the rule templates.

There are two parts to the rule templates. The first specifies a role that allows EventBridge to assume a role to send events to the target event bus in the security account:
 # This IAM role allows EventBridge to assume the permissions necessary to send events
 # from the source event buses to the destination event bus.
 SourceToDestinationEventBusRole:
  Type: "AWS::IAM::Role"
  Properties:
   AssumeRolePolicyDocument:
    Version: 2012-10-17
    Statement:
     - Effect: Allow
      Principal:
       Service:
        - events.amazonaws.com
      Action:
       - "sts:AssumeRole"
   Path: /
   Policies:
    - PolicyName: PutEventsOnDestinationEventBus
     PolicyDocument:
      Version: 2012-10-17
      Statement:
       - Effect: Allow
        Action: "events:PutEvents"
        Resource:
         - !Ref SecurityEventBusArn
The second is the definition of the rule resource. This requires the Amazon Resource Name (ARN) of the event bus where you want to put the rule, the ARN of the target event bus in the security account, and a reference to the SourceToDestinationEventBusRole role:
 SecurityAuditRule2:
  Type: AWS::Events::Rule
  Properties:
   Name: SecurityAuditRuleAccount2
   Description: Audit rule for the Security team in Singapore
   EventBusName: !Ref EventBusArnAccount2 # ARN of the custom event bus in Account 2
   EventPattern:
    source:
     - com.company.marketing
   State: ENABLED
   Targets:
    - Id: SendEventToSecurityEventBusArn
     Arn: !Ref SecurityEventBusArn
     RoleArn: !GetAtt SourceToDestinationEventBusRole.Arn
You can use the AWS SAM CLI to deploy this:
sam deploy -t us-east-1-rules.yaml \
  --stack-name us-east-1-rules \
  --region us-east-1 \
  --profile default \
  --capabilities=CAPABILITY_IAM \
  --parameter-overrides SecurityEventBusArn="arn:aws:events:ap-southeast-1:111111111111:event-bus/SecurityEventBus" EventBusArnAccount1="arn:aws:events:us-east-1:111111111111:event-bus/default" EventBusArnAccount2="arn:aws:events:us-east-1:222222222222:event-bus/custom-eventbus-account-2"
Testing the example application
With the rules deployed across the Regions, you can test by sending events to the event bus in Account 2:
- Navigate to the applications/account_2 directory. Here you find an events.json file, which you use as input for the put-events API call.
- Run the following command using the AWS CLI. This sends messages to the event bus in us-east-1 which are routed to the security event bus in ap-southeast-1:
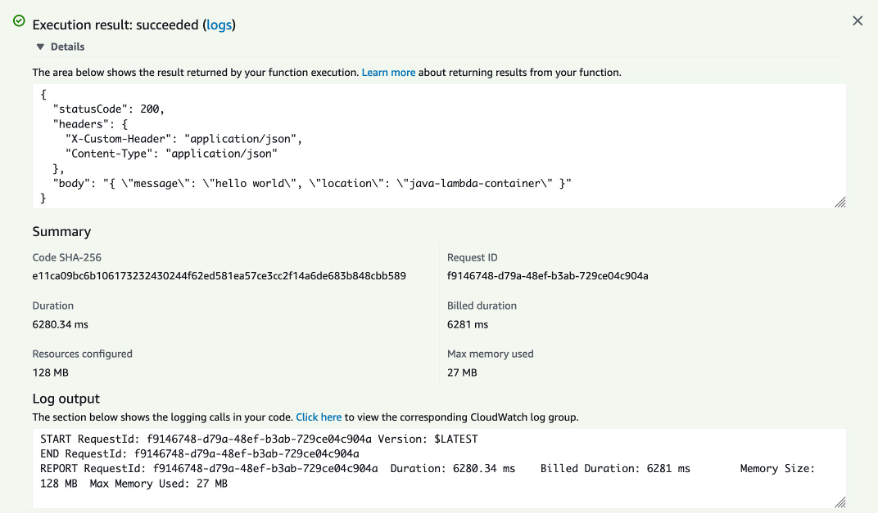
aws events put-events \
 --region us-east-1 \
 --profile [NAMED PROFILE FOR ACCOUNT 2] \
 --entries file://events.json
If you have run this successfully, you see:
Entries:
- EventId: a423b35e-3df0-e5dc-b854-db9c42144fa2
- EventId: 5f22aea8-51ea-371f-7a5f-8300f1c93973
- EventId: 7279fa46-11a6-7495-d7bb-436e391cfcab
- EventId: b1e1ecc1-03f7-e3ef-9aa4-5ac3c8625cc7
- EventId: b68cea94-28e2-bfb9-7b1f-9b2c5089f430
- EventId: fc48a303-a1b2-bda8-8488-32daa5f809d8
FailedEntryCount: 0 - Navigate to the Amazon CloudWatch console to see a collection of log entries with the events you published. The log group is
/aws/events/SecurityAnalysisRule.

Congratulations, you have successfully sent your first events across accounts and Regions!
Conclusion
With cross-Region event routing in EventBridge, you can now route events to and from any AWS Region. This post explains how to manage and configure cross-Region event routing using CloudFormation and EventBridge resource policies to simplify rule propagation across your global event bus infrastructure. Finally, I walk through an example you can deploy to your AWS account.
For more serverless learning resources, visit Serverless Land.