Post Syndicated from The Atlantic original https://www.youtube.com/watch?v=2EXeP7x1Fi0
Yearly Archives: 2024
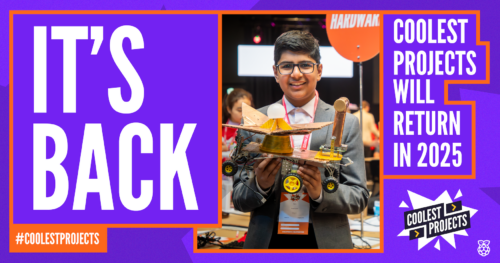
Celebrating Coolest Projects 2024, plus dates for 2025
Post Syndicated from Vicky Fisher original https://www.raspberrypi.org/blog/coolest-projects-2024-impact-2025-dates/
Coolest Projects celebrates young digital creators and the amazing things they make with technology. Today, we’re sharing the impact that taking part in Coolest Projects showcases has on young people’s motivation and confidence, as well as announcing dates for Coolest Projects 2025.
Coolest Projects in 2024
This year, 7197 young people across 4678 projects took part in our global Coolest Projects online showcase, with participants from 43 countries. All of these projects were shared in our online showcase gallery, and we hosted a live-streamed event celebrating the judges’ favourites watched by over 1000 people.

At the 2024 in-person Coolest Projects events in Ireland and the UK, 171 young people shared projects. At these events, the young creators presented their projects to other attendees and our team of judges. They also took part in other activities, including a digital escape room.
We wanted to understand how Coolest Projects impacts young people, and so we collected the following data:
- For the online showcase, mentors and tech creators filled in a survey when they completed their project registration, and we ran focus groups with mentors, who are adults that support the tech creators
- At the UK and Ireland in-person events, creators completed a survey, other event attendees completed feedback cards, and we also interviewed creators.
Online showcase: Impact on skills and confidence
In the survey, mentors and young people told us that taking part in the Coolest Projects online showcase had a positive impact:
- 91% of young people and 87% of mentors agreed or strongly agreed that taking part in Coolest Projects online inspired them or their team to continue to participate in computing and technology
- 89% of young people and 86% of mentors agreed or strongly agreed that taking part in Coolest Projects online increased their or their team’s confidence in coding and digital making
Mentors told us that the community built by the online showcase gallery played an important role in making young people want to participate, and improving their confidence. One mentor said that “[being part of the online showcase] motivates them actually to do something innovative and… [the] global community motivates them to think out of the box.”
They also reported that the online community inspired young people to solve real-world problems. One mentor said, “the wonderful thing is the kids create so many things which are solutions to world problems.” Others told us that young people feel a great deal of pride that their solutions are available for others to see online and that they get ideas from other projects on how to solve problems. One mentor from India told us about a young person who created a boat to clean rivers and then was inspired to learn to program micro:bit devices, having seen similar projects in the gallery.
Focus on ‘growth, not competition’
The phrase ‘growth, not competition’ came from the mentors in the focus group, and we love this description.
“[With] Coolest Projects… the only agenda is to grow. Grow with the coding, nurture your skills, creativity.” – Focus group attendee.
In the focus group, mentors told us they really valued the way the Coolest Projects online showcase allows all young people to participate, including those who were less experienced tech creators. One mentor told us that because everyone’s project is displayed in the gallery the “beauty is that everybody is encouraged individually… regarding the experience. … They can start with very small things. And they have [the] opportunity to upload it on the platform.”
One mentor who supports young people in remote locations in India spoke about the way Coolest Projects offers a level playing field where his students can be included and participate to the same extent as less remote places: “students never feel left behind.”

The in-person events also reflected the diversity of young people’s experience of digital making. Of those creators who answered surveys, 35% said it was their first time making this kind of project, while 37% said they had made similar projects before. This mix of experience was also reflected in the interviews, with some young people creating something for the first time and having only started learning coding recently, while others had been developing their projects for a long time. Many creators told us they felt inspired by the opportunity to show their projects to others, regardless of their experience level.
In-person events: Building a community of digital creators
Attendees at both Coolest Projects UK and Ireland commented on the sense of community and the excitement that was generated by being around other young people. One young person spoke about how much they enjoyed being “surrounded by people who like coding too”. They really valued seeing other creators’ projects and speaking with their peers.

The young people we spoke to reflected on the positive impact of this sense of community and belonging. They told us that seeing others’ projects inspired them to develop their ideas and learn new skills. One young person described how the in-person event allowed them to “get inspired and socialise.” A second said, “that’s why I’m here — to get inspired.”
Another clear theme was how much young people valued the opportunity to show their projects to others. This gave them confidence in their own ability to build things. One creator at Coolest Projects UK spoke about the sense of achievement they felt after building something themselves and then being able to present it to others.

Young people at both events spoke about their plans for what they wanted to do next, talking about trying new technology such as building games, learning Python, and creating mobile apps. At both events, creators described how they wanted to continue to develop and build on their existing ideas with the possibility of showcasing them again.
What we want to learn next
We are continuing to look for ways to improve the Coolest Projects experience for young people and their mentors. As part of this, we are conducting user experience research to understand how we can improve the registration process for the online Coolest Projects showcase.
We were delighted to hear from mentors in this year’s focus group how much they valued the online showcase gallery, and we want to understand the impact of this resource better as part of Coolest Projects 2025. If you want to find out more about Coolest Projects, we highly recommend taking a look at the amazing projects made by young people around the world.
Dates for Coolest Projects 2025
We’re so pleased that so many young people around the world loved taking part in Coolest Projects this year. And we’re very excited that Coolest Projects will be back and bigger than ever before in 2025!
The Coolest Projects online showcase is open to any young person up to age 18, based anywhere in the world. Registration opens 14 January, and we’ll host a celebratory livestream on 25 June.

Coolest Projects in-person events will also be popping up around the world. In-person events are open to everyone up to age 18 in the host country. Family and friends are very welcome to come along too.
Save the date for:
- Coolest Projects Ireland, 1 March 2025
- Coolest Projects USA, 5 April 2025
- Coolest Projects Belgium, 26 April 2025
- Coolest Projects UK, 17 May 2025
- Coolest Projects Ghana, date TBC
- Coolest Projects India, date TBC
- Coolest Projects Malaysia, date TBC
- Coolest Projects South Africa, date TBC
Keep an eye on the Coolest Projects website for more event dates and details coming soon.
It’s never too early to start making and saving digital projects to showcase next year. We can’t wait to see what the world’s young tech creators will make!
The post Celebrating Coolest Projects 2024, plus dates for 2025 appeared first on Raspberry Pi Foundation.
Служебни справки вместо удостоверения
Post Syndicated from Bozho original https://blog.bozho.net/blog/4381
Следваща точка от приоритетите: „9. Отпадане на удостоверенията за липса на задължения и други често изисквани удостоверения и замяната им със служебни справки.“
Докато бях министър, подготвихме законови промени, с които всяко удостоверение трябва да бъде заменено със служебна справка, без да се ползват дежурните оправдания, че „в нашия закон/наредба пише, че трябва удостоверение“ и те бяха приети през 2023 г.
Но това, че нещо е незаконно, не значи, че не се случва. Контролът е в МЕУ, но там, както писах декември, се руши, вместо да се гради, така че поне засега ефект няма.
Именно затова започнах анализа на текущото състояние с искане на данни от НАП за удостоверенията за липса на задължения. 230 хиляди годишно са, но не е ясно на коя администрация са нужни. Поискал съм втора справка от НАП за данните в полето „да послужи пред …“.
Вероятно част от получателите са банките. Те по закон имат право на служебен достъп, но трябва да се внимава а обхвата на данните, одитната следа от проверката и санкциите при злоупотреби.
За почти всички удостоверения има разработени и служебни електронни справки, като преди 2 години и половина възложих вътрешна проверка на това кой ползвател до какви данни има достъп, за да се ограничи обмена на данни до минимално необходимия.
По принцип не би трябвало да е нужна законова промяна, за да се приложи общия ред на служебно електронно събиране на данните, а само прилагане на контролните правомощия на МЕУ. Но почти винаги в такива случаи трябва „методическо указание“.
Същото „упражнение“ ще направя и за други често срещани удостоверения, за да спрат гражданите и бизнесът да са куриери на администрацията.

Материалът Служебни справки вместо удостоверения е публикуван за пръв път на БЛОГодаря.
Фалитът на Физическите лица – ще работи ли новият закон?
Post Syndicated from VassilKendov original https://kendov.com/%D1%84%D0%B0%D0%BB%D0%B8%D1%82%D1%8A%D1%82-%D0%BD%D0%B0-%D1%84%D0%B8%D0%B7%D0%B8%D1%87%D0%B5%D1%81%D0%BA%D0%B8%D1%82%D0%B5-%D0%BB%D0%B8%D1%86%D0%B0-%D1%89%D0%B5-%D1%80%D0%B0%D0%B1%D0%BE%D1%82%D0%B8/
 Новият закон за фалит на физическите лица е мътрво роден и няма да работи.
Напротив – разходите на нередовният платец ще се увеличат.
Вижте защо във видеото


The post Фалитът на Физическите лица – ще работи ли новият закон? appeared first on Kendov.com.
Защо Община Родопи не желае да печели, дори и да може?
Post Syndicated from VassilKendov original https://kendov.com/%D0%B7%D0%B0%D1%89%D0%BE-%D0%BE%D0%B1%D1%89%D0%B8%D0%BD%D0%B0-%D1%80%D0%BE%D0%B4%D0%BE%D0%BF%D0%B8-%D0%BD%D0%B5-%D0%B6%D0%B5%D0%BB%D0%B0%D0%B5-%D0%B4%D0%B0-%D0%BF%D0%B5%D1%87%D0%B5%D0%BB%D0%B8-%D0%B4/
 Защо Община Родопи не желае да печели, дори и да може?
От известно време оставам с впечатлението, че Община Родопи е някакъв семеен бизнес. Или си от семейството и ти отпускаме малко джобни или си живей ако може незабележимо.
Във веки случай обче си длъжен да ръкопляснаш на TikTok изявите на кметовете и да ги венцеславиш при всяка новина, изглеждаща като хубава.
Побратимихме се с италианската община Барчелона Поцо ди Гото – голям праз. Не сме я чували никога, ама не може без снимки и лйкове.
Рожден ден на кмета Михайлов – статия в сайта на Общината и разбира се със снимки
Рехабилитирали улица – веднага статия и снимки, нищо че това ни е работата. Важното е да се знае.
Ей така стоят нещата

А мисленето и визията я оставяме по-натам.
Ето една визия, която споделих с Общинския кмет и друг кмет на населено място, която явно остана неразбрана, ако и да донесе доста приходи на общината за годни напред.
При ремонти и рехабилитации на улици, да се поставя оптичен кабел и да се изграждат трасета за интернет, който да бъдат отдавани под наем години наред, на интернет доставчици и IT компании.
Това би помогнало както на приходите на общината, така и на развитието и в IT сферата. Привличане на индустрия с висока добавена стойност и осигуряване на инфраструктура за хора които работят от вкъщи.
Преди години Пазарджик започнаха да дават разрешителни за обект, само ако се подпише декларация, че ще се остави отворен WiFi за да го ползват безплатно гражданите. така целият град беше опасан с безплатна WIFi мрежа и съответно безплатен интернет.
Разира се това не е съвсем уздържано решение, но като няма риба и ракът е риба.
Сега имаме възможност да го направим както трябва, но не би.
Да ама не. Това ще донесе пари на общината, но няма да донесе пари на кметовете. И без това се занимават с изкупуването и продажбата на земи. Представяте ли си ако пред всеки имот минава оптичен кабел за интернет какви ще са цените на имотите? Не че и сега не са, но има доста още земи за изкупуване.
Ето и примера от вчера
ЕВН копае канал за електрически кабел
(Рехабилитирахме улица)
На пръв поглед много хубава новина – прекарва се инфраструктура и се доставя ток.
(нов асфалт и много важен участък)
Я да видим какво стои от другата страна?
Паднал автомобил в изкопа и неполагане на оптичен кабел въпреки, че общината е дала разрешение за изкопни работи.
(когато решим да отговорим на европейските изисквания за вкарване на кабелите под земята, пак ще разкопаем и ще направим нова обществена поръчка)
(каналът от вчера е факт, както и катастрофиралият автомобил)

А как можеше да бъде?
1. Общината знае и дава разрешение за всеки изкоп, било той на ЕВН, ВиК, БТК, Община…
Први една нормална обществена поръчка (казвам нормална, защото сегашните не са най-нормалните, но за това друг път) и преди закопаването, изпраща екип който да положи кабела на този участък. Нанася го и на карта да се знае.
Между другото – Оптичният кабел е с цена между 0.60 ст, до 67 лева на метър. Сами преценете дали е по-скъпо от последващо разкопаване на улица. А ако смятате, че е скъпо, може само тръба да закопаят. Тя е 1.50 лв на метър. Доставчикът сам ще си изтегли кабела.
2. Общината обявява конкурс за отдаване под наем на изградените трасета. Надали някой интернет доставчик би предочел кабелите му да са по стълбовете и суитчовете му да горят при всеки дъжд. При месечна вноска от около 30 лева за интернет, всеки доставчик би се лишил в полза на общината от 5 лева на месец за наем на трасето при положение, че не би го изграждал той и комуникациите му биха били защитени под земята.
Представете си колко се копае в момента в Община Родопи. Само ако поставяха по една тръба за интернет кабел, половината община вече щеше да е включена с може би най-добрия интернет в държавата. Повярвайте IT фирмите не спят и не биха пропуснали такава възможност.
И все пак това са само мечти. Мечти за реализацията на които се изисква единствено организация и координация от Община Родопи.
Виж за организацията вече стои житейски и професионален опит, креативност, визия…
За каква визия обаче говорим като онлайн сесиите на обинския съвет се излъчват в TWITCH?
The post Защо Община Родопи не желае да печели, дори и да може? appeared first on Kendov.com.
Introducing Zabbix Cloud
Post Syndicated from Arturs Lontons original https://blog.zabbix.com/introducing-zabbix-cloud/24837/
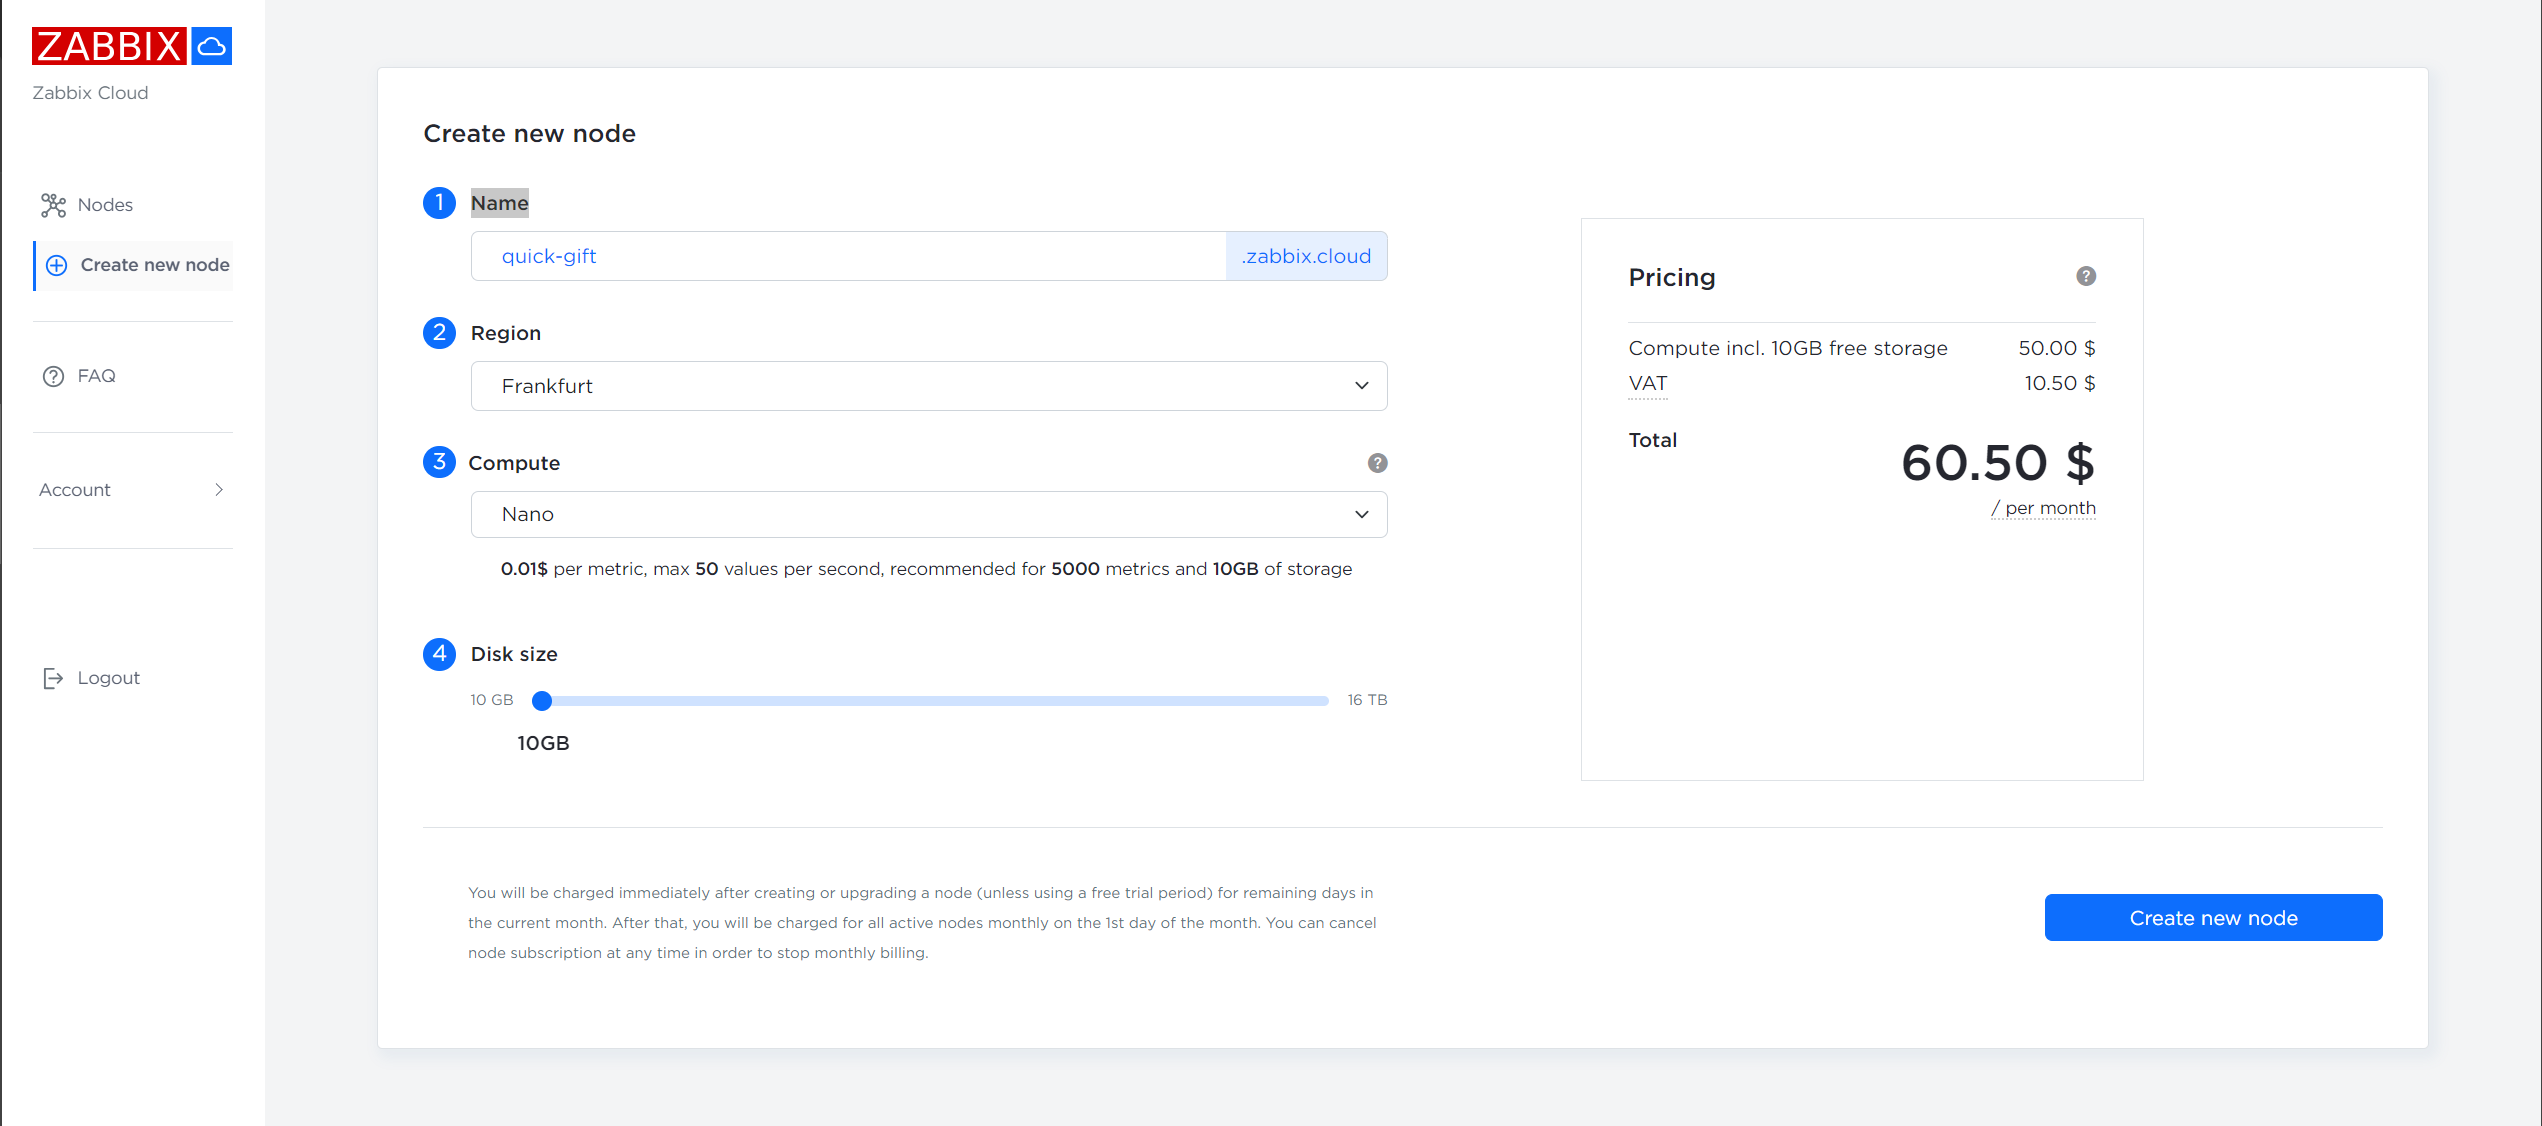
With Zabbix Cloud you can near-instantly deploy a feature-complete Zabbix environment fine-tuned for best possible performance.
Have you ever wanted to deploy a Zabbix instance in just a few clicks without having to worry about creating orchestrations or writing scripts to achieve this task? What about always having the latest stable Zabbix version without having to go through the upgrade procedure yourself? And then there’s scalability – what if we told you that we can offer you a Zabbix instance that can be rescaled at a moment’s notice with the most optimal performance configuration for your monitoring workloads?
No, you’re not dreaming (try pinching yourself) – you’re simply looking at our latest offering – Zabbix Cloud.
Introducing – Zabbix Cloud
With Zabbix Cloud, anyone can deploy their own Zabbix instance with a push of a button. Forget about allocating dedicated hardware, installing packages or configuring docker containers. All you have to do is name your instance, select a compute offering and a region and you’re good to go!
With Zabbix Cloud you will get:
- 7 Compute tiers
- 5 Datacenter regions
- Initial 10GB of storage free of charge
- Full Zabbix feature set
- A Zabbix instance optimized for best possible performance
- Customizable history retention periods
- Ability to define access filters and encrypt Zabbix connections
- Automatic version updates and node backups
Zabbix Cloud does not limit your monitoring in any way – Zabbix Cloud nodes are fully capable of leveraging the same data collection, processing and analysis method as an on-prem Zabbix instance.
But how about instead of us talking about Zabbix Cloud, we give you a chance to deploy a trial Zabbix Cloud node – you know what they say – “Show, don’t tell”. Anyone can sign up for a free 5 day trial and check out Zabbix Cloud for themselves – no billing information required!
Note that Zabbix Cloud is currently in Early access. During the early access period sign-ups for Zabbix Cloud will processed and accepted in batches, which means it may take some time for us to process your Zabbix Cloud sign-up request.
Deploying a Zabbix Cloud node
Deploying a Zabbix Cloud node can be done with just a few clicks. Simply press the “Create new node” button, give your node a name and select your Region, Compute tier and Disk size. Once the node deployment is complete, you can access your Cloud Zabbix instance via its DNS name and the provided login credentials for the Admin account.
In case you forgot to copy or lost the initial password – the initial password can be copied to clipboard, cleared and reset by accessing the Overview tab of the Node configuration section.
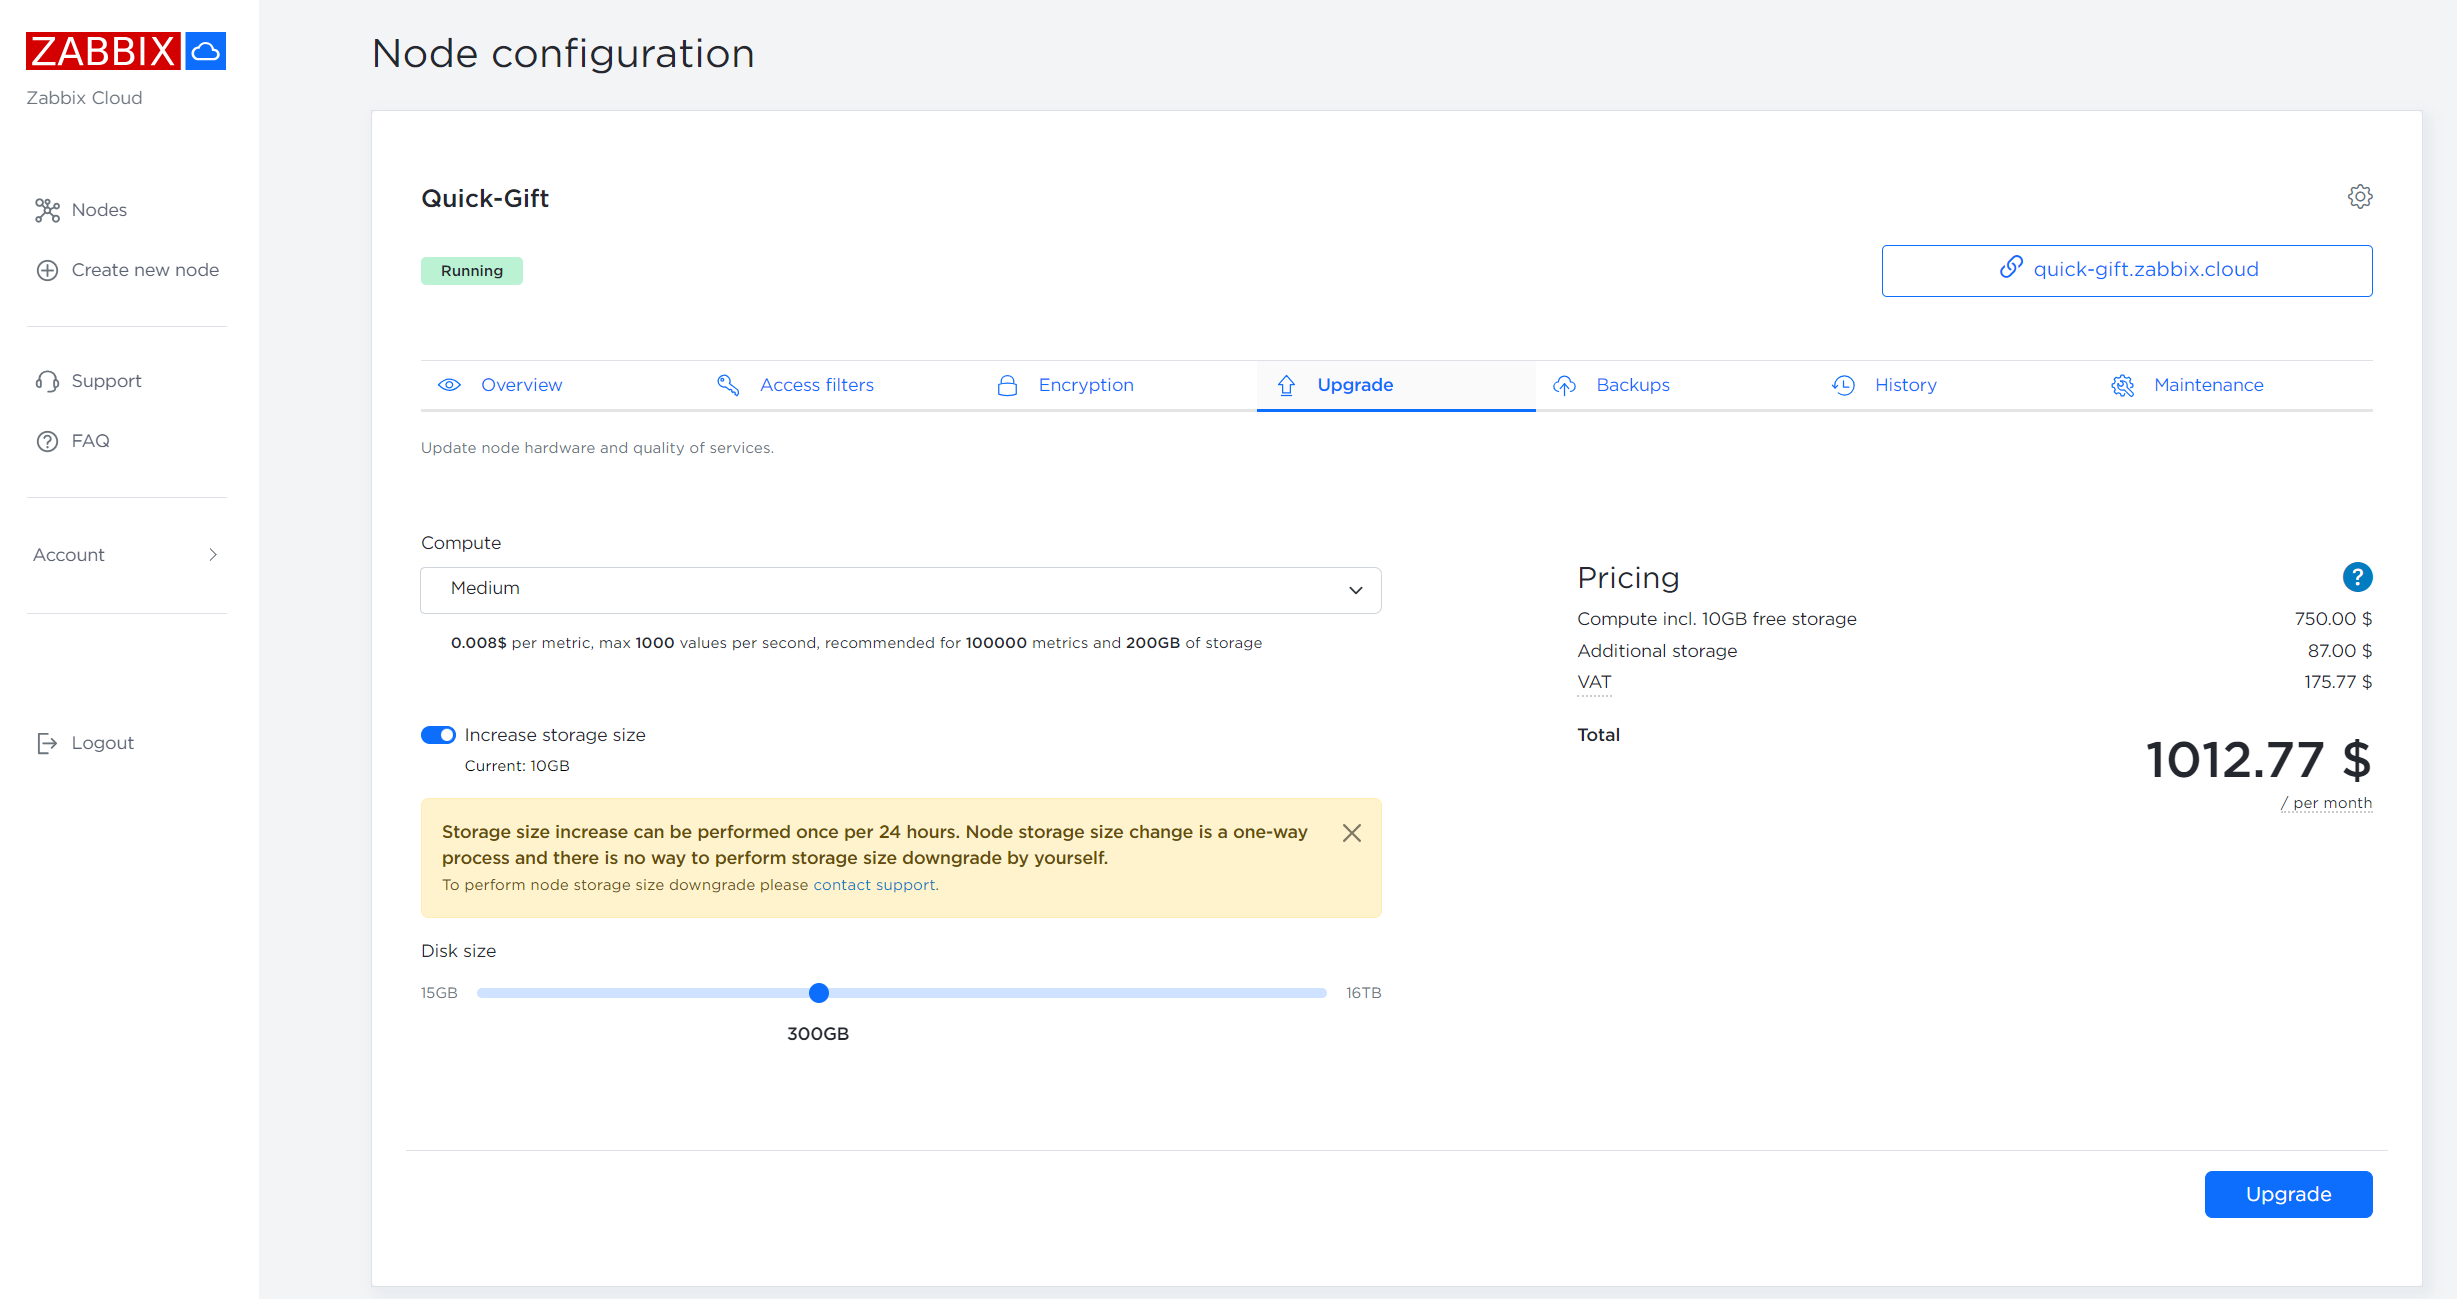
Upgrading Zabbix Cloud node compute tier and storage space
There are only two limiting factors for Zabbix Cloud nodes – the available storage space and the number of maximum supported new values per second for a particular compute tier.
Once a maximum supported number of new values per second (NVPS) for the current compute tier is reached, the values exceeding the limit will be discarded at random. You can either reduce the number of collected metrics to match the compute tier NVPS limitations or upgrade your node to a higher compute tier to support the required number of NVPS. Upgrading to a higher compute tier can be done from the Upgrade tab of the Node Configuration section.
Disk utilization can also be increased from the Upgrade tab of the Node configuration section. Note that once you have increased your Zabbix Cloud node storage you will not be able to decrease it!
In addition, storage space usage can be adjusted by modifying the history retention periods. This can be done in the History tab of the Node configuration section. Here you can adjust storage periods for various types of history, trend and auditlog data. Reducing the storage periods will also reduce the total space usage on the current node.
Automatic upgrades to the latest version
With Zabbix Cloud you don’t have to worry about manually upgrading your Zabbix Cloud nodes to the latest minor or major releases. Once the latest Zabbix release passes the internal testing and QA for Zabbix Cloud deployment, your Zabbix Cloud instance will be automatically upgraded to the latest version during the weekly maintenance periods chosen by you under the Node configuration section.
The upgrade to the latest Zabbix major release can be postponed but it cannot be cancelled. Eventually, your Zabbix cloud node will be automatically upgraded to the latest major version.
This ensures that your Zabbix Cloud nodes will always have all of the latest features, performance improvements and security fixes applied on them after passing a thorough internal QA process.
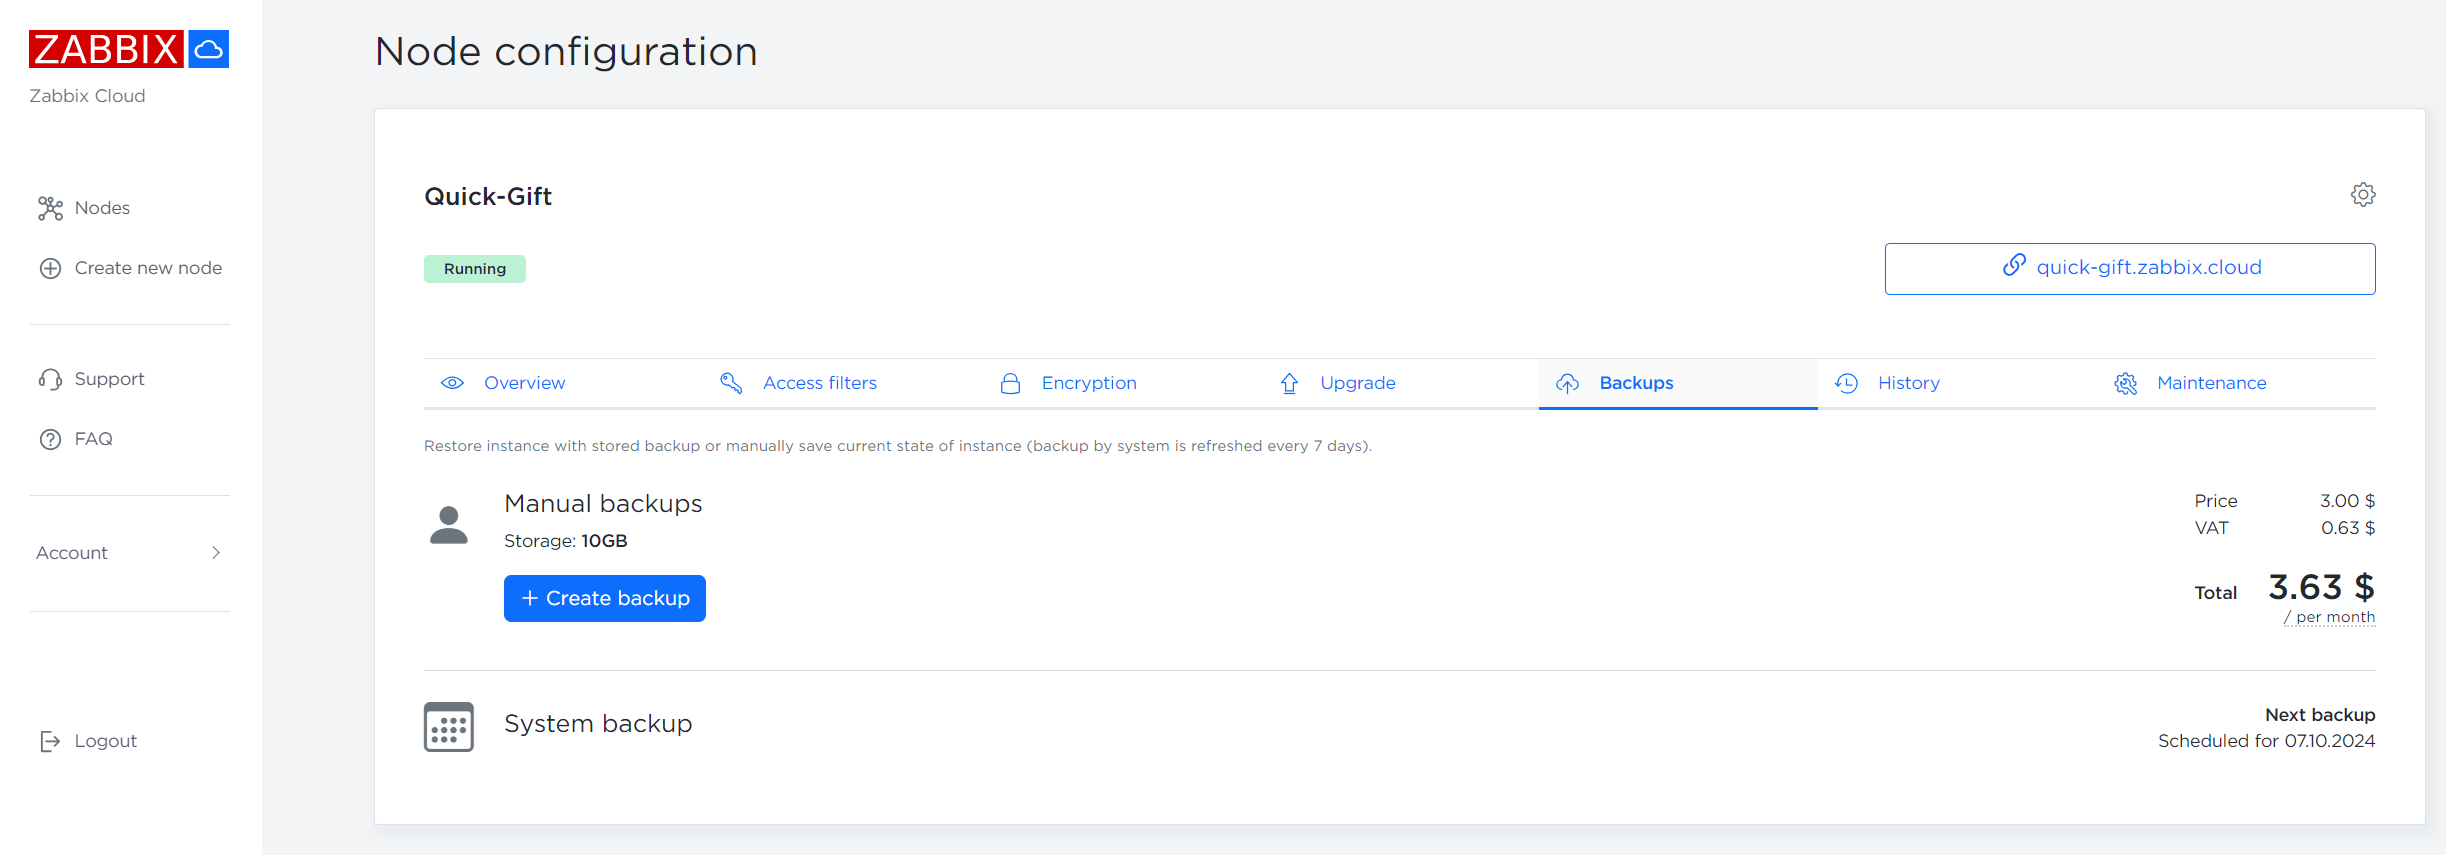
Backing up your Zabbix cloud node
Zabbix Cloud provides two options for performing Zabbix Cloud node backups:
- Free automatic weekly backups
- Manual backups with an attached monthly cost
Manual backups can be performed from the Backups tab of the Node configuration section. Here you can also see the next scheduled automatic backup and restore your Zabbix Cloud node from an existing backup. Currently Zabbix Cloud node backups cannot be exported from Zabbix Cloud and existing Zabbix instances cannot be migrated to Zabbix Cloud.
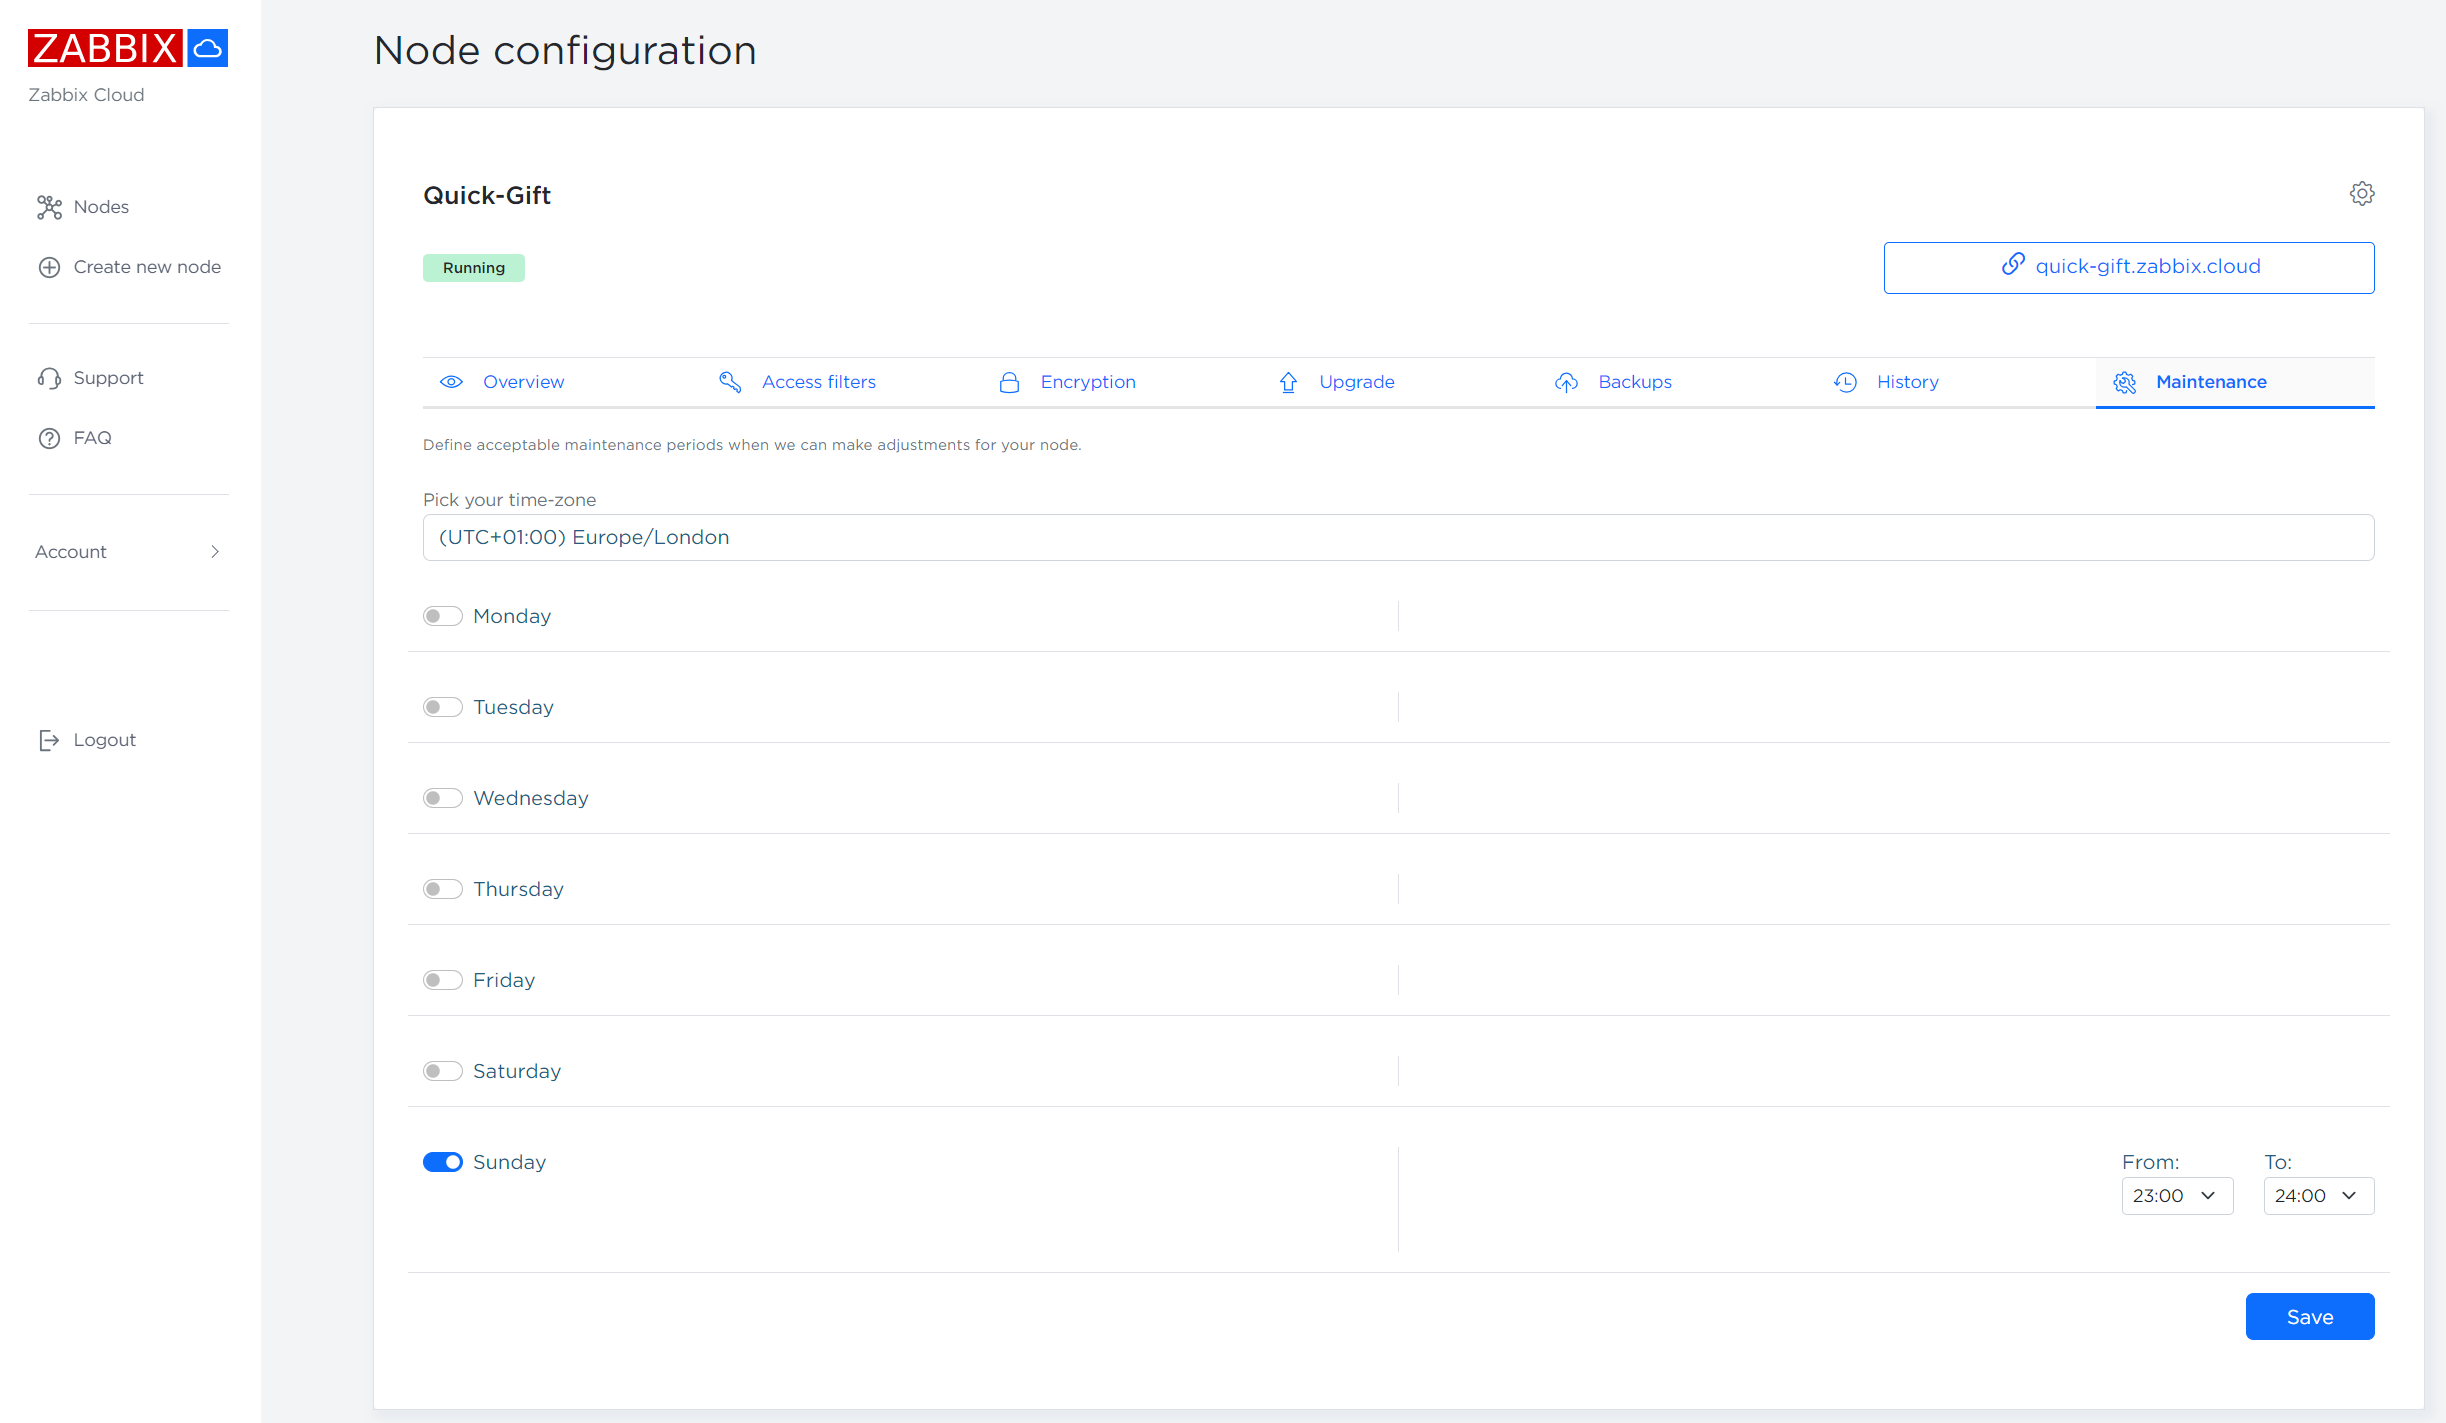
Maintenance windows
Each of your Zabbix Cloud nodes is required to have at least 1 hour long weekly maintenance window defined in the Maintenance tab of the Node configuration section.
During the maintenance the following upgrades might be performed on your Zabbix Cloud node:
- Be upgraded to the latest Zabbix release
- Have the latest security fixes applied on the nodes
- Have the latest platform level upgrades applied on the nodes
- Be optimized for best possible performance
Zabbix nodes may be taken offline during the maintenance period if the maintenance tasks require it.
Conclusion
With Zabbix Cloud, deploying a fully optimized Zabbix instance is easier than ever. Automated upgrades and backups ensure that Zabbix Cloud will position itself as a streamlined, secure and up-to-date product with 24/7 availability and the latest Zabbix features available to everyone, no matter their technical proficiency in managing, tuning and upgrading Zabbix environments.
On top of that, Zabbix provides a large selection of professional services with the goal of helping our users to configure and troubleshoot their monitoring workflows, deliver custom templates, integrate Zabbix nodes with 3rd party solutions and more! Check out the full list of Zabbix professional services and see how we can further enhance your Zabbix experience.
The post Introducing Zabbix Cloud appeared first on Zabbix Blog.
Farewell to the Tyan Server Brand As it is Giving Way to MiTAC Computing
Post Syndicated from Patrick Kennedy original https://www.servethehome.com/farewell-to-the-tyan-server-brand-as-it-is-giving-way-to-mitac-computing/
Farewell to the venerable Tyan server brand as it gives way to the umbrella MiTAC Computing brand for Q4 2024
The post Farewell to the Tyan Server Brand As it is Giving Way to MiTAC Computing appeared first on ServeTheHome.
Comic for 2024.10.01 – Gun To Your Head 3
Post Syndicated from Explosm.net original https://explosm.net/comics/gun-to-your-head-3
New Cyanide and Happiness Comic
Impact of Verizon’s September 30 outage on Internet traffic
Post Syndicated from David Belson original https://blog.cloudflare.com/impact-of-verizons-september-30-outage-on-internet-traffic
On Monday, September 30, customers on Verizon’s mobile network in multiple cities across the United States reported experiencing a loss of connectivity. Impacted phones showed “SOS” instead of the usual bar-based signal strength indicator, and customers complained of an inability to make or receive calls on their mobile devices.
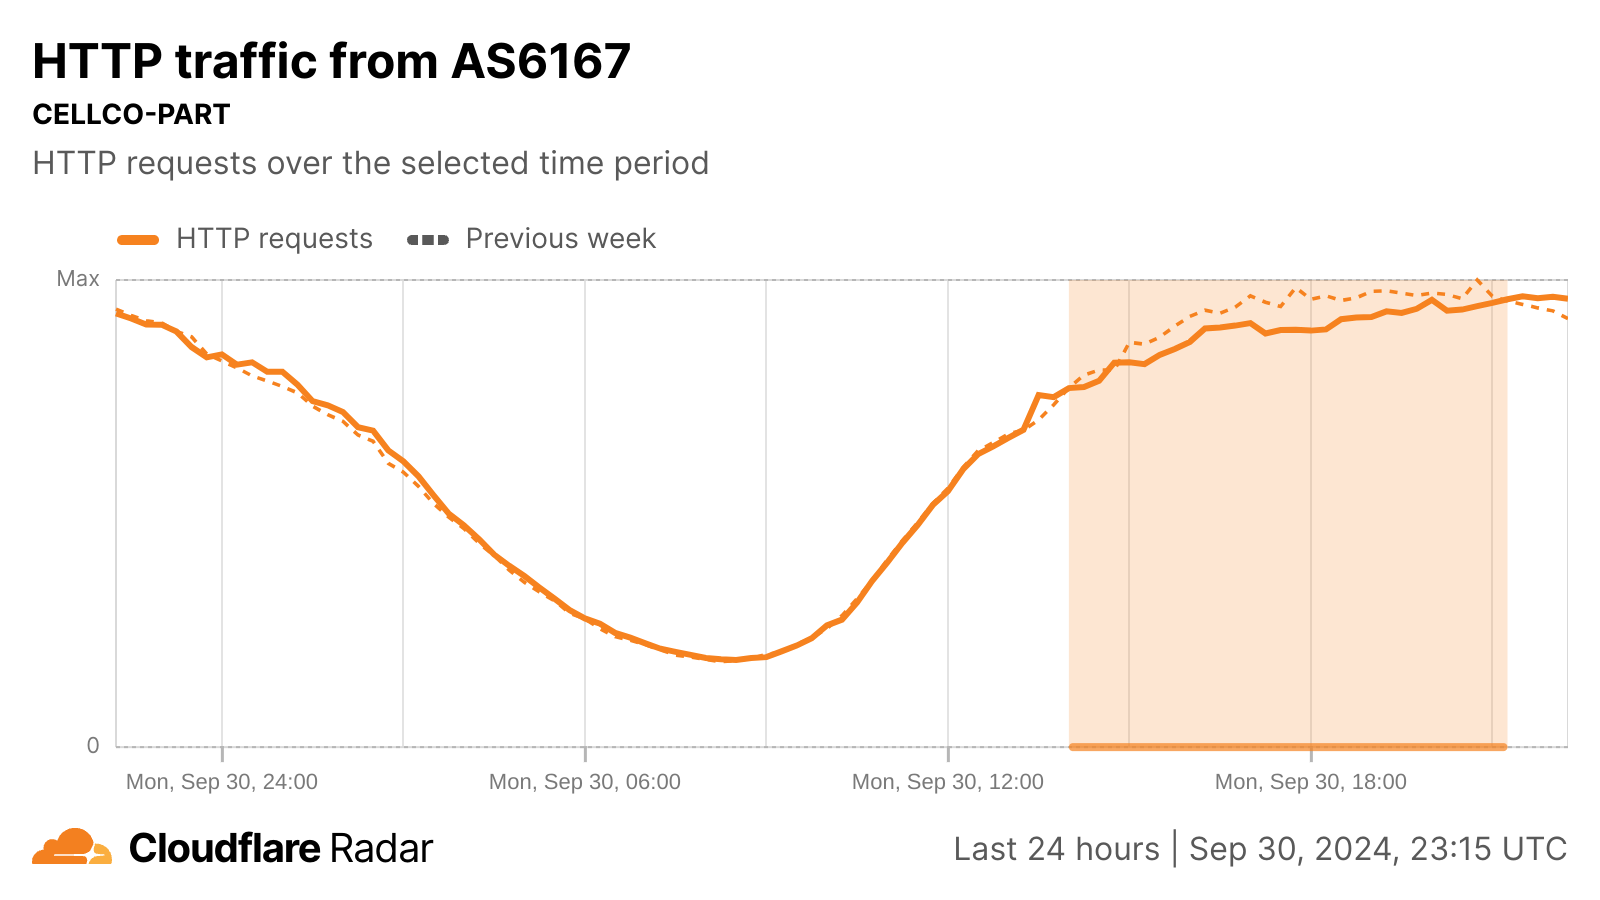
AS6167 (CELLCO) is the autonomous system used by Verizon for its mobile network. To better understand how the outage impacted Internet traffic on Verizon’s network, we took a look at HTTP request volume from AS6167 independent of geography, as well as traffic from AS6167 in various cities that were reported to be the most significantly impacted.
Although initial reports of connectivity problems started around 09:00 ET (13:00 UTC), we didn’t see a noticeable change in request volume at an ASN level until about two hours later. Just before 12:00 ET (16:00 UTC), Verizon published a social media post acknowledging the problem, stating “We are aware of an issue impacting service for some customers. Our engineers are engaged and we are working quickly to identify and solve the issue.”
As the Cloudflare Radar graph below shows, a slight decline (-5%) in HTTP traffic as compared to traffic at the same time a week prior is first visible around 11:00 ET (15:00 UTC). Request volume fell as much as 9% below expected levels at 13:45 ET (17:45 UTC).
Just after 17:00 ET (21:00 UTC), Verizon published a second social media post noting, in part, “Verizon engineers are making progress on our network issue and service has started to be restored.” Request volumes returned to expected levels around the same time, surpassing the previous week’s levels at 17:15 ET (21:15 UTC). At 19:18 ET (23:18 UTC), a social media post from Verizon noted “Verizon engineers have fully restored today’s network disruption that impacted some customers. Service has returned to normal levels.”
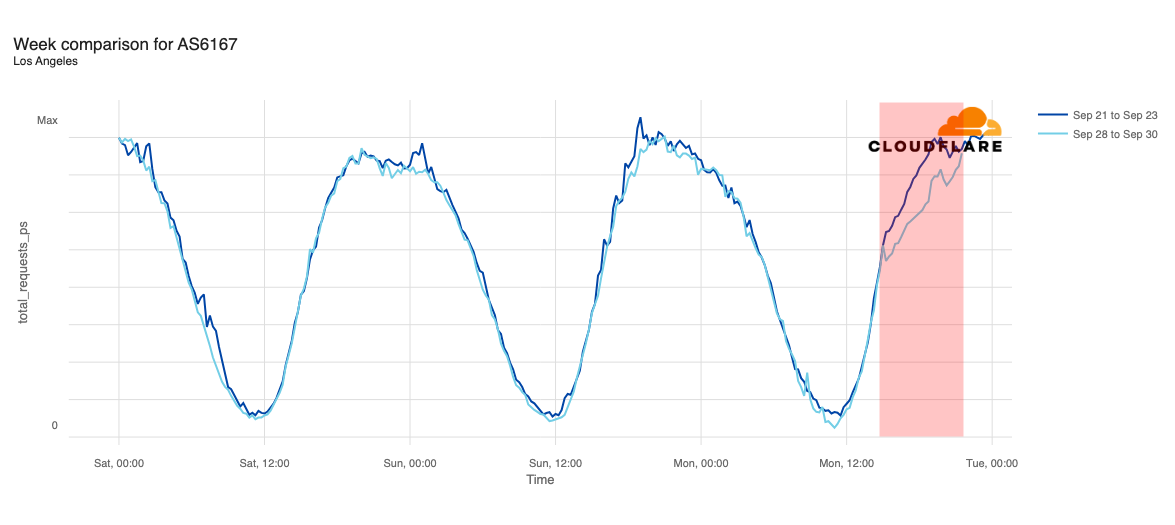
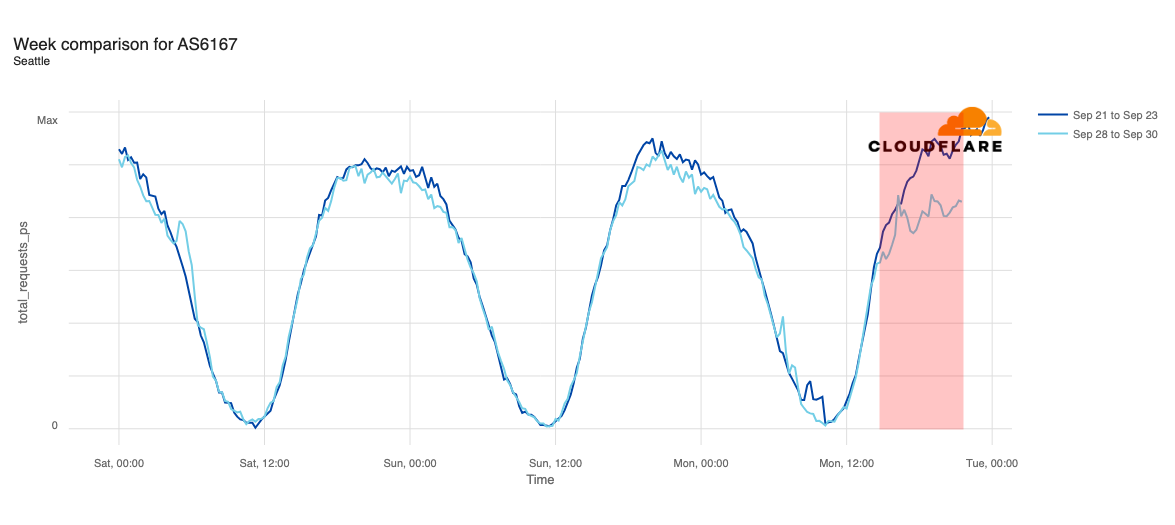
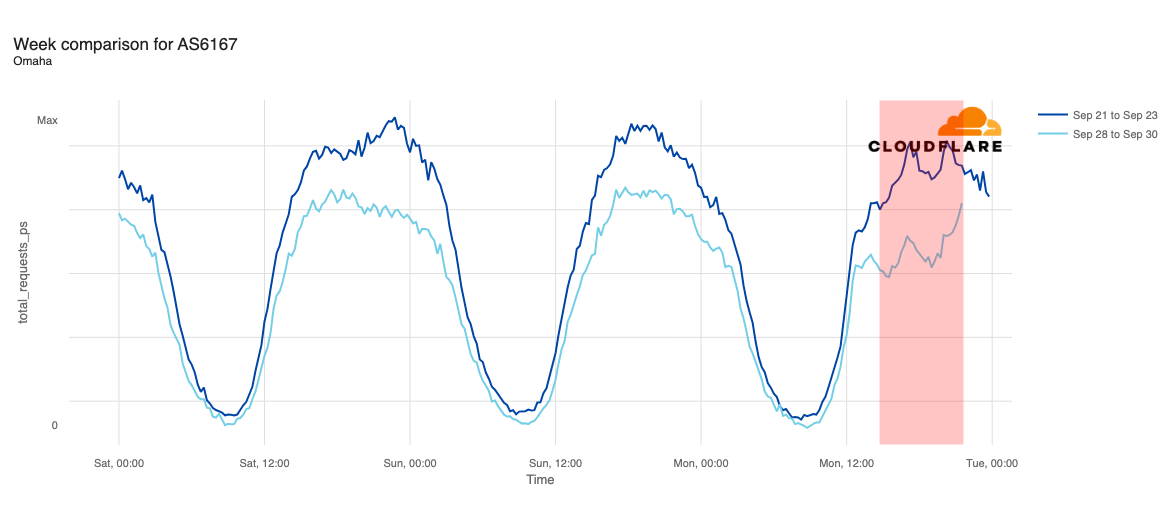
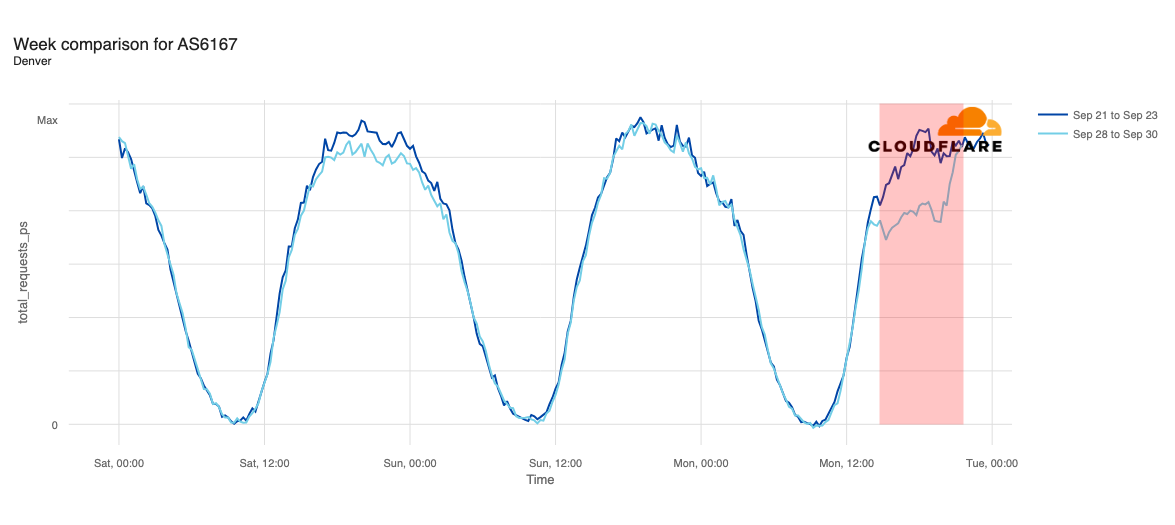
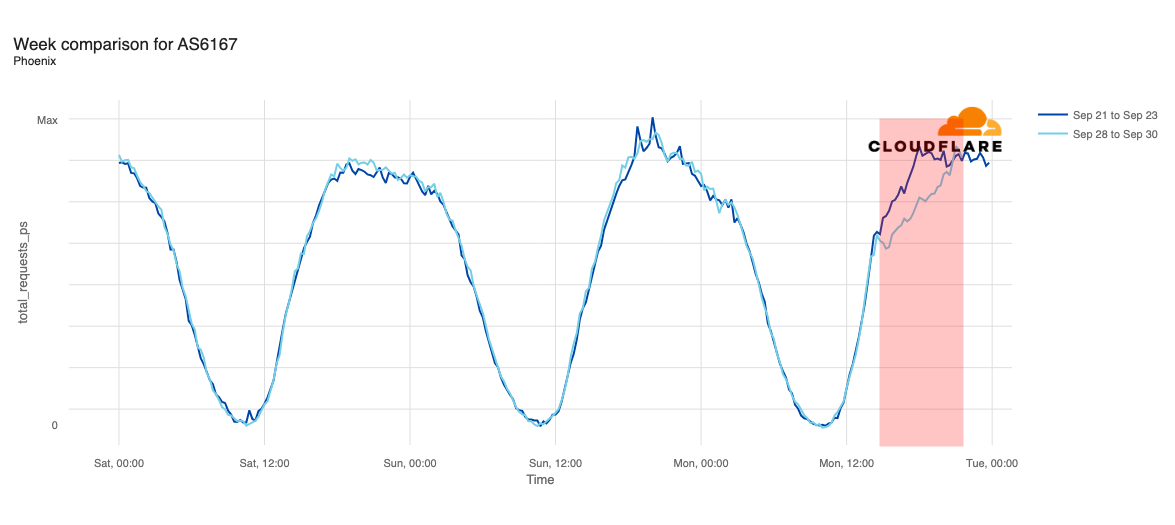
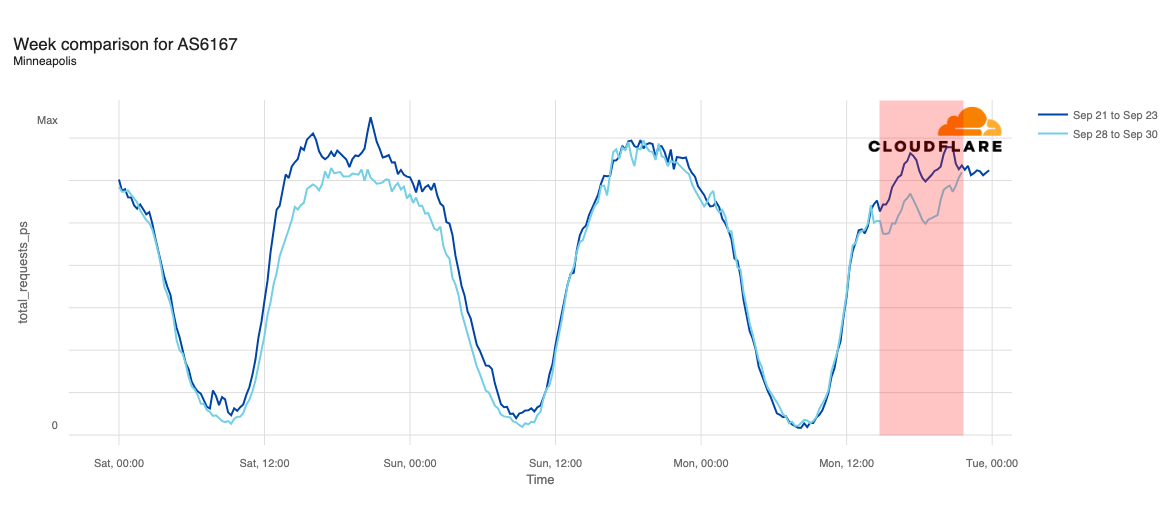
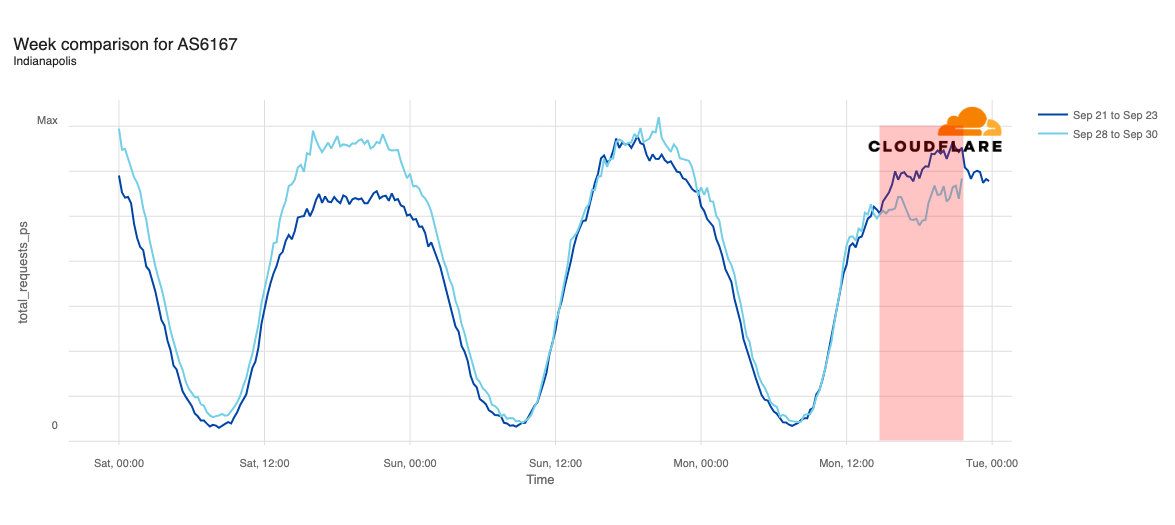
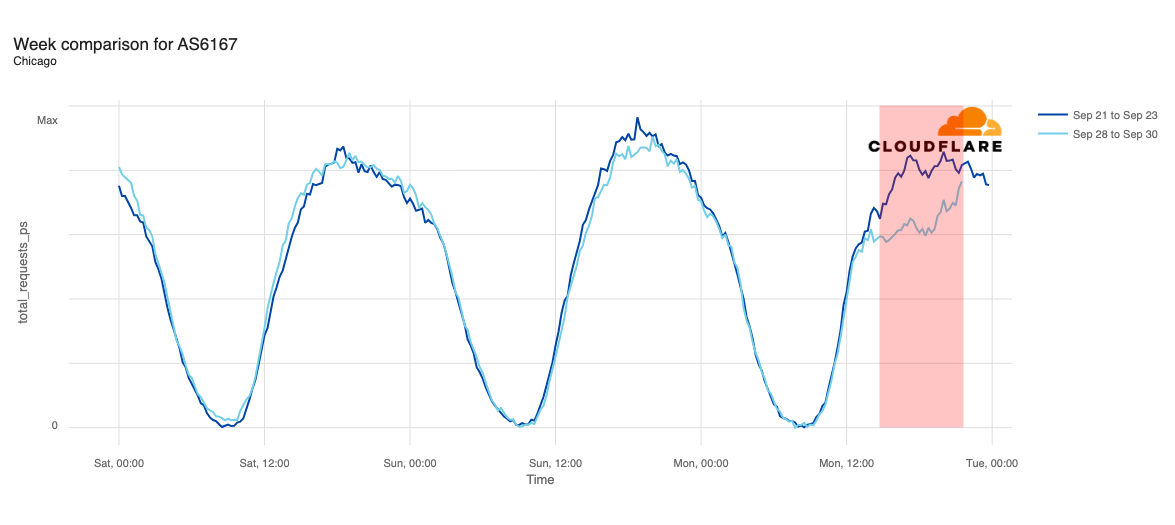
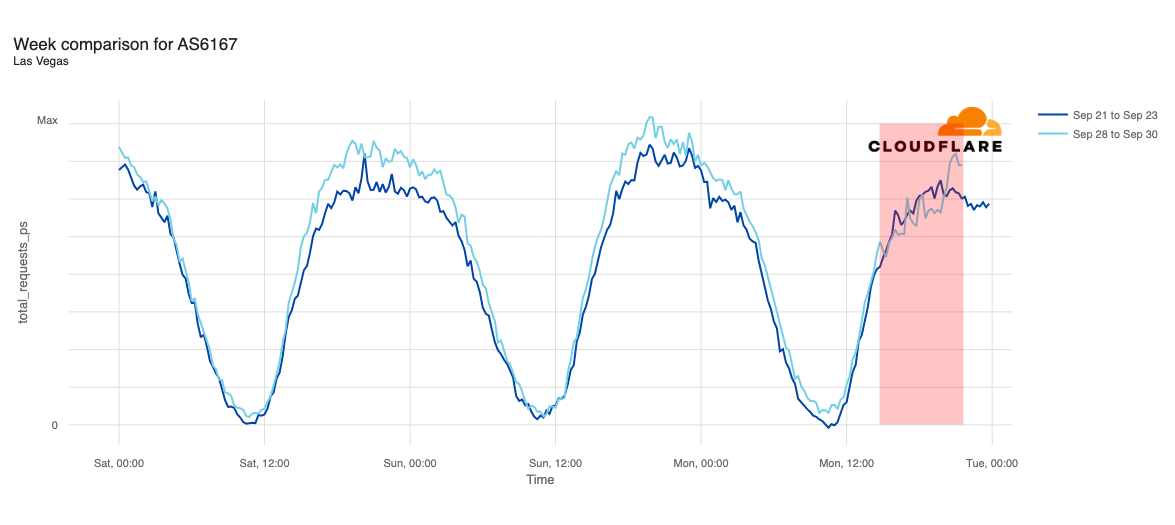
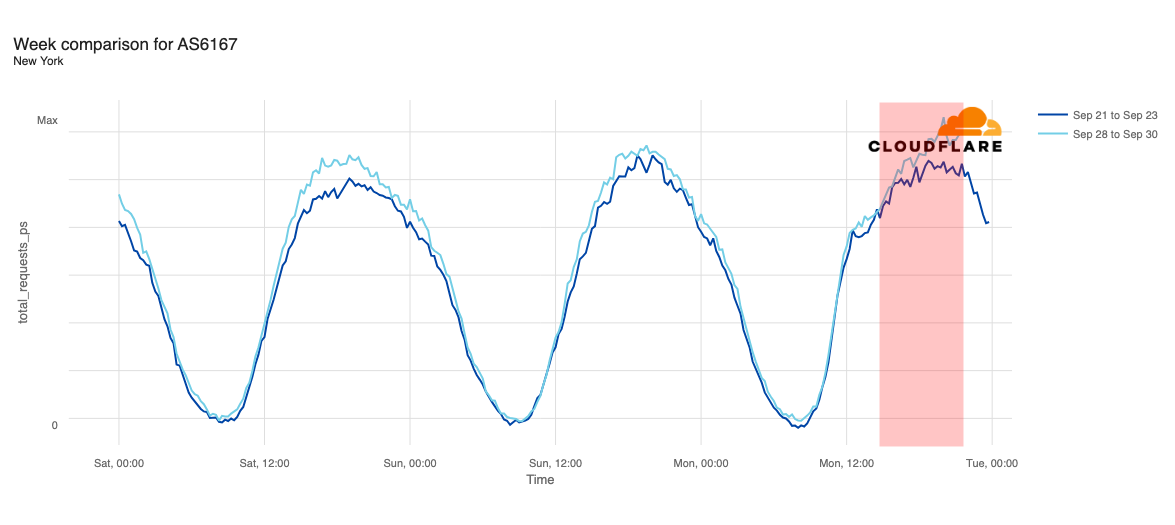
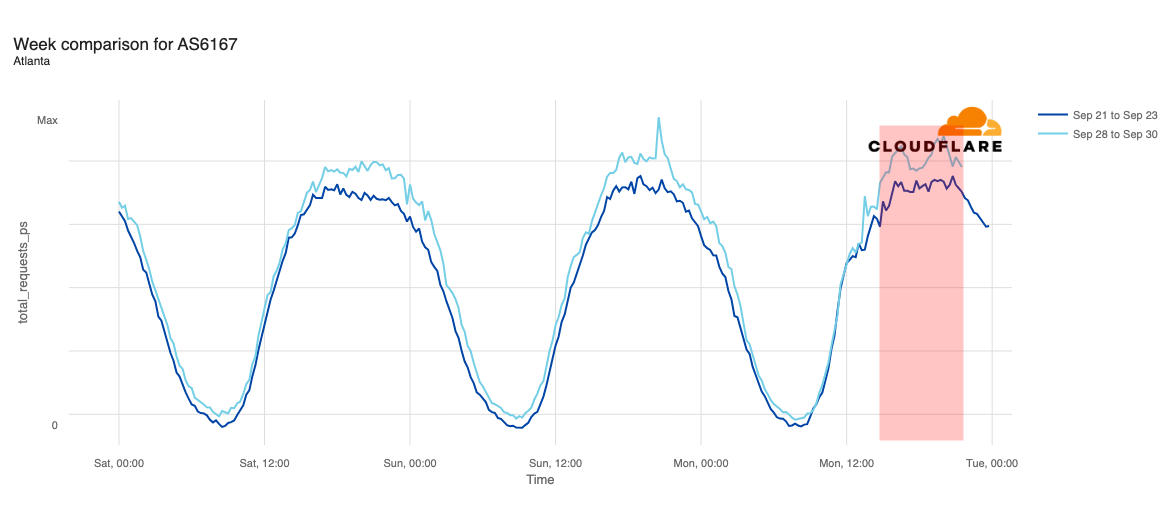
Media reports listed cities including Chicago, Indianapolis, New York City, Atlanta, Cincinnati, Omaha, Phoenix, Denver, Minneapolis, Seattle, Los Angeles, and Las Vegas as being most impacted. In addition to looking at comparative traffic trends across the whole Verizon Wireless network, we also compared request volumes in the listed cities to the same time a week prior (September 23).
Declines in request traffic starting around 11:00 ET (15:00 UTC) are clearly visible in cities including Los Angeles, Seattle, Omaha, Denver, Phoenix, Minneapolis, Indianapolis, and Chicago. In contrast to other cities, Omaha’s request volume was already trending lower than last week heading into today’s outage, but its graph clearly shows the impact of today’s disruption as well. Omaha’s difference in traffic was the most significant, down approximately 30%, while other cities saw declines in the 10-20% range.
Request traffic from Las Vegas initially appeared to exhibit a bit of volatility around 11:00 ET (15:00 UTC), but continues to track fairly closely to last week’s levels before exceeding them starting at 16:00 ET (20:00 UTC). Cincinnati was tracking slightly above last week’s request volume before the outage began, and tracked closely to the prior week during the outage period.
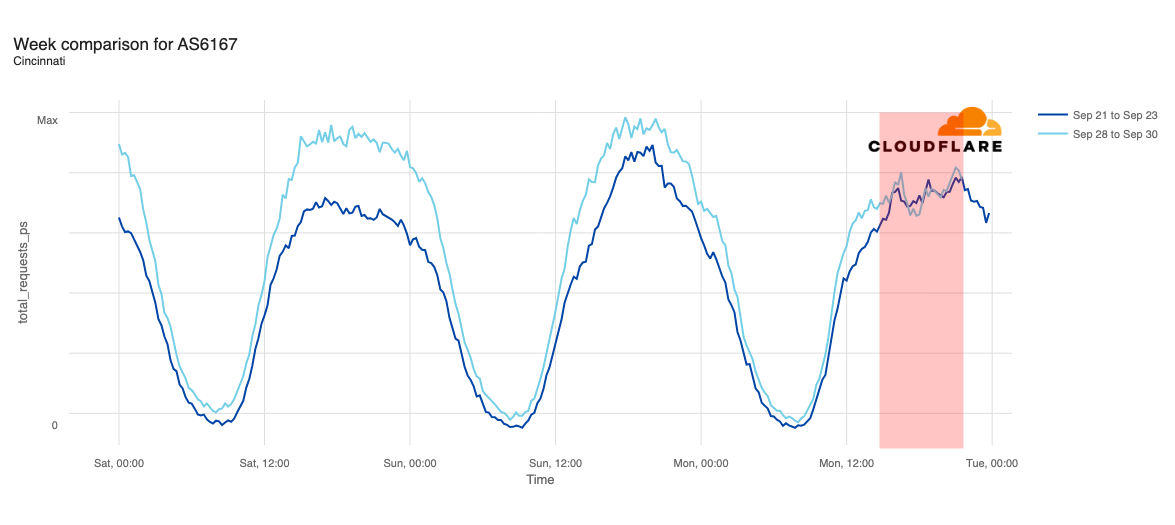
We observed week-over-week traffic increases during the outage period in New York and Atlanta. However, in both cities, traffic was already slightly above last week’s levels, and that trend continued throughout the day.
Based on our observations, it appears that voice services on Verizon’s network may have been more significantly impacted than data services, as we saw some declines in request traffic across impacted cities, but none experienced full outages.
As of this writing (19:15 ET, 23:15 UTC), no specific information has been made available by Verizon regarding the root cause of the network problems.
Evolution of Catwalk: Model serving platform at Grab
Post Syndicated from Grab Tech original https://engineering.grab.com/catwalk-evolution
Introduction
As Southeast Asia’s leading super app, Grab serves millions of users across multiple countries every day. Our services range from ride-hailing and food delivery to digital payments and much more. The backbone of our operations? Machine Learning (ML) models. They power our real-time decision-making capabilities, enabling us to provide a seamless and personalised experience to our users. Whether it’s determining the most efficient route for a ride, suggesting a food outlet based on a user’s preference, or detecting fraudulent transactions, ML models are at the forefront.
However, serving these ML models at Grab’s scale is no small feat. It requires a robust, efficient, and scalable model serving platform, which is where our ML model serving platform, Catwalk, comes in.
Catwalk has evolved over time, adapting to the growing needs of our business and the ever-changing tech landscape. It has been a journey of continuous learning and improvement, with each step bringing new challenges and opportunities.
Evolution of the platform
Phase 0: The need for a model serving platform
Before Catwalk’s debut as our dedicated model serving platform, data scientists across the company employed various ad-hoc approaches to serve ML models. These included:
- Shipping models online using custom solutions.
- Relying on backend engineering teams to deploy and manage trained ML models.
- Embedding ML logic within Go backend services.
These methods, however, led to several challenges, undercovering the need for a unified, company-wide platform for serving machine learning models:
- Operational overhead: Data scientists often lacked the necessary expertise to handle the operational aspects of their models, leading to service outages.
- Resource wastage: There was frequently low resource utilisation (e.g., 1%) for data science services, leading to inefficient use of resources.
- Friction with engineering teams: Differences in release cycles and unclear ownership when code was embedded into backend systems resulted in tension between data scientists and engineers.
- Reinventing the wheel: Multiple teams independently attempted to solve model serving problems, leading to a duplication of effort.
These challenges highlighted the need for a company-wide, centralised platform for serving machine learning models.
Phase 1: No-code, managed platform for TensorFlow Serving models
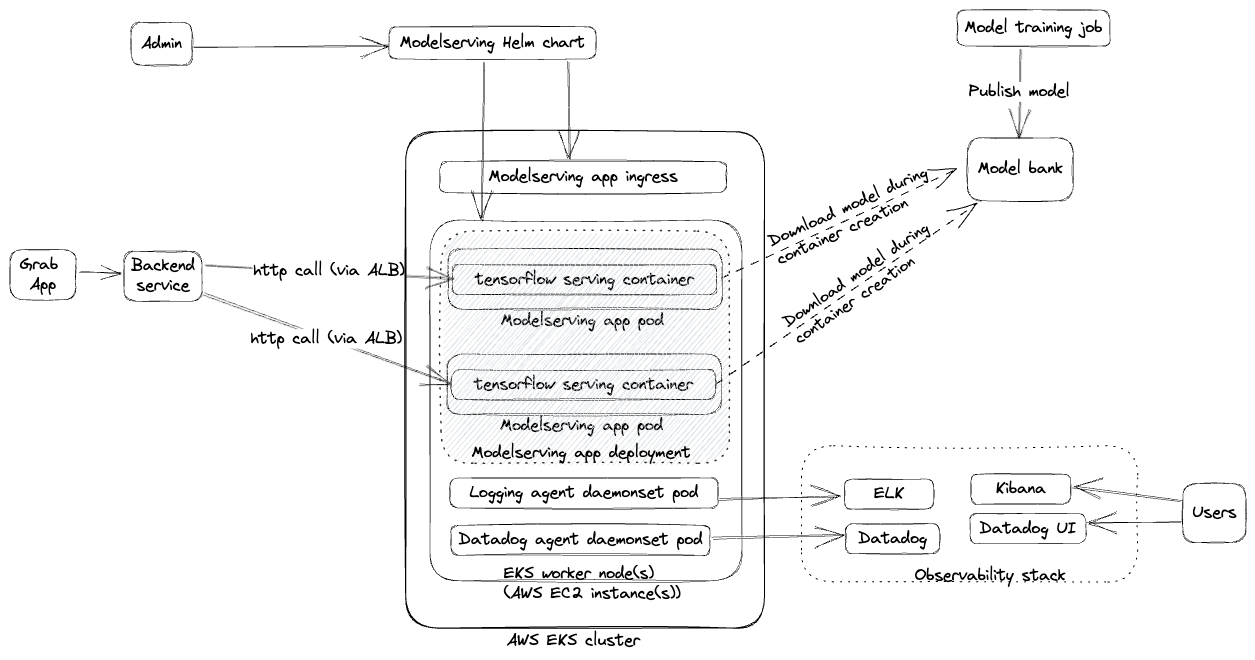
Our initial foray into model serving was centred around creating a managed platform for deploying TensorFlow Serving models. The process involved data scientists submitting their models to the platform’s engineering admin, who could then deploy the model with an endpoint. Infrastructure and networking were managed using Amazon Elastic Kubernetes Service (EKS) and Helm Charts as illustrated below.
This phase of our platform, which we also detailed in our previous article, was beneficial for some users. However, we quickly encountered scalability challenges:
- Codebase maintenance: Applying changes to every TensorFlow Serving (TFS) version was cumbersome and difficult to maintain.
- Limited scalability: The fully managed nature of the platform made it difficult to scale.
- Admin bottleneck: The engineering admin’s limited bandwidth became a bottleneck for onboarding new models.
- Limited serving types: The platform only supported TensorFlow, limiting its usefulness for data scientists using other frameworks like LightGBM, XGBoost, or PyTorch.
After a year of operation, only eight models were onboarded to the platform, highlighting the need for a more scalable and flexible solution.
Phase 2: From models to model serving applications
To address the limitations of Phase 1, we transitioned from deploying individual models to self-contained model serving applications. This “low-code, self-serving” strategy introduced several new components and changes as illustrated in the points and diagram below:
- Support for multiple serving types: Users gained the ability to deploy models trained with a variety of frameworks like Open Neural Network Exchange (ONNX), PyTorch, and TensorFlow.
- Self-served platform through CI/CD pipelines: Data scientists could self-serve and independently manage their model serving applications through CI/CD pipelines.
- New components: We introduced these new components to support the self-serving approach:
- Catwalk proxy, a managed reverse proxy to various serving types.
- Catwalk transformer, a low-code component to transform input and output data.
- Amphawa, a feature fetching component to augment model inputs.
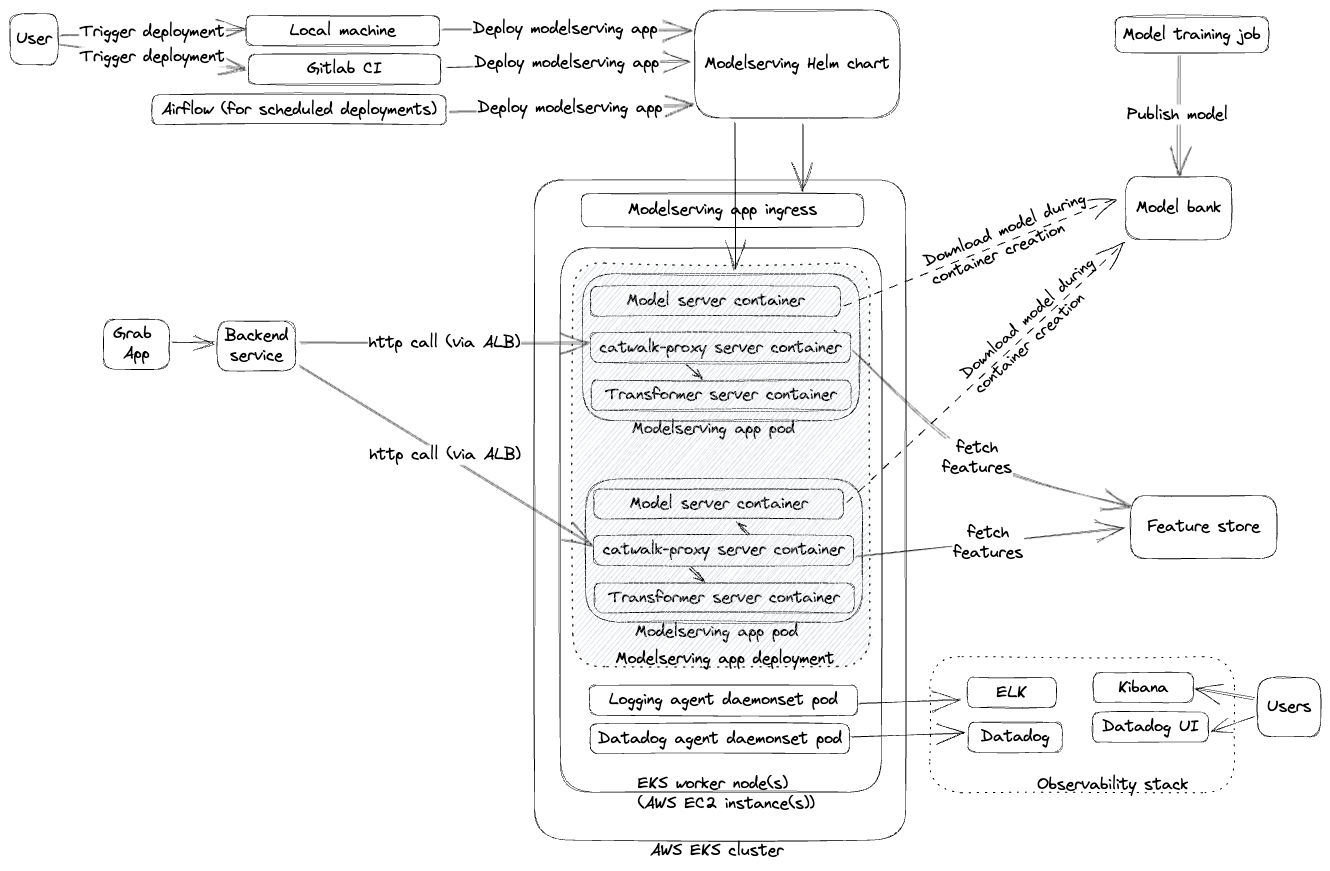
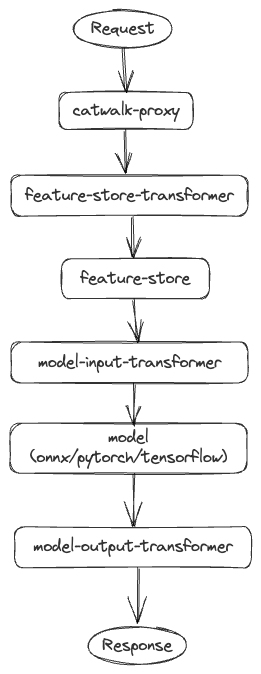
API request flow
The Catwalk proxy acts as the orchestration layer. Clients send requests to Catwalk proxy then it orchestrates calls to different components like transformers, feature-store, and so on. A typical end to end request flow is illustrated below.
Within a year of implementing these changes, the number of models on the platform increased from 8 to 300, demonstrating the success of this approach. However, new challenges emerged:
- Complexity of maintaining Helm chart: As the platform continued to grow with new components and functionalities, maintaining the Helm chart became increasingly complex. The readability and flow control became more challenging, making the helm chart updating process prone to errors.
- Process-level mistakes: The self-serving approach led to errors such as pushing empty or incompatible models to production, setting too few replicas, or allocating insufficient resources, which resulted in service crashes.
We knew that our work was nowhere near done. We had to keep iterating and explore ways to address the new challenges.
Phase 3: Replacing Helm charts with Kubernetes CRDs
To tackle the deployment challenges and gain more control, we made the significant decision to replace Helm charts with Kubernetes Custom Resource Definitions (CRDs). This required substantial engineering effort, but the outcomes have been rewarding. This transition gave us improved control over deployment pipelines, enabling customisations such as:
- Smart defaults for AutoML
- Blue-green deployments
- Capacity management
- Advanced scaling
- Application set groupings
Below is an example of a simple model serving CRD manifest:
apiVersion: ml.catwalk.kubebuilder.io/v1
kind: ModelServing
spec:
  hpa:
    desired: 1
    max: 1
    min: 1
  modelMeta:
    modelName: "my-model"
    modelOwner: john.doe
  proxyLayer:
    enableLogging: true
    logHTTPBody: true
  servingLayer:
    servingType: "tensorflow-serving"
    version: "20"
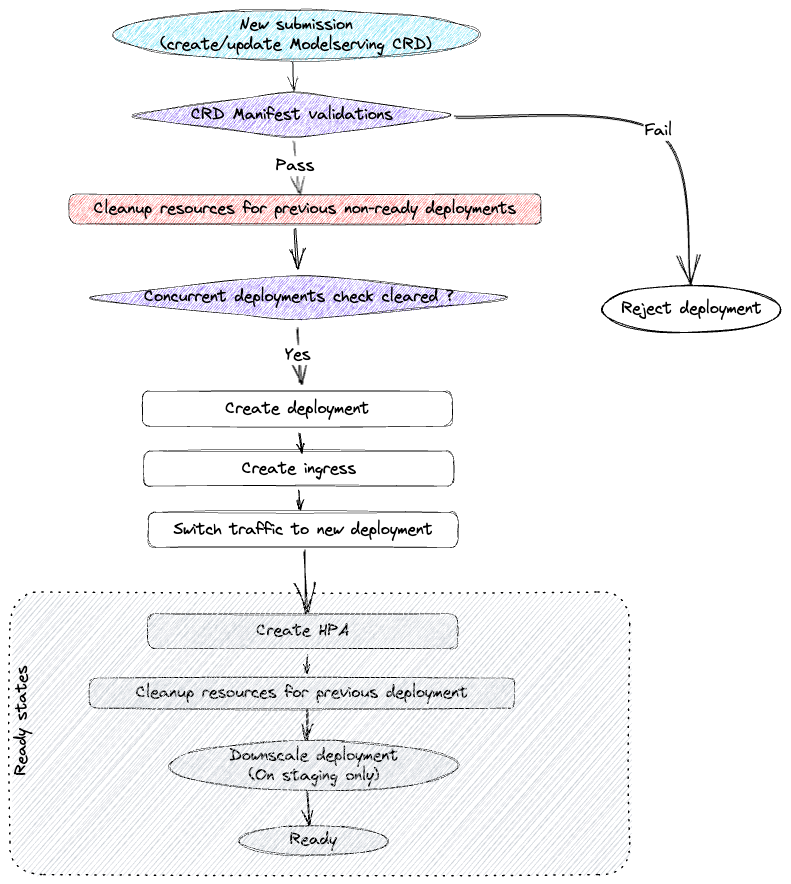
Model serving CRD deployment state machine
Every model serving CRD submission follows a sequence of steps. If there are failures at any step, the controller keeps retrying after small intervals. The major steps on the deployment cycle are described below:
- Validate whether the new CRD specs are acceptable. Along with sanity checks, we also enforce a lot of platform constraints through this step.
- Clean up previous non-ready deployment resources. Sometimes a deployment submission might keep crashing and hence it doesn’t proceed to a ready state. On every submission, it’s important to check and clean up such previous deployments.
- Create resources for the new deployment and ensure that the new deployment is ready.
- Switch traffic from old deployment to the new deployment.
- Clean up resources for old deployment. At this point, traffic is already being served by the new deployment resources. So, we can clean up the old deployment.
Phase 4: Transition to a high-code, self-served, process-managed platform
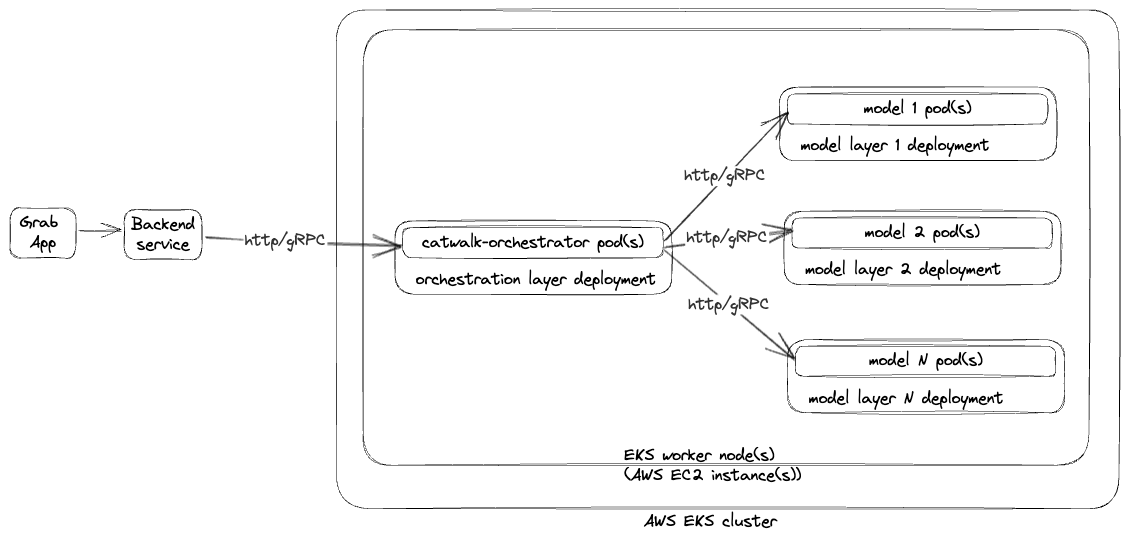
As the number of model serving applications and use cases multiplied, clients sought greater control over orchestrations between different models, experiment executions, traffic shadowing, and responses archiving. To cater to these needs, we introduced several changes and components with the Catwalk Orchestrator, a high code orchestration solution, leading the pack.
Catwalk orchestrator
The Catwalk Orchestrator is a highly abstracted framework for building ML applications that replaced the catwalk-proxy from previous phases. The key difference is that users can now write their own business/orchestration logic. The orchestrator offers a range of utilities, reducing the need for users to write extensive boilerplate code. Key components of the Catwalk Orchestrator include HTTP server, gRPC server, clients for different model serving flavours (TensorFlow, ONNX, PyTorch, etc), client for fetching features from the feature bank, and utilities for logging, metrics, and data lake ingestion.
The Catwalk Orchestrator is designed to streamline the deployment of machine learning models. Here’s a typical user journey:
- Scaffold a model serving application: Users begin by scaffolding a model serving application using a command-line tool.
- Write business logic: Users then write the business logic for the application.
- Deploy to staging: The application is then deployed to a staging environment for testing.
- Complete load testing: Users test the application in the staging environment and complete load testing to ensure it can handle the expected traffic.
- Deploy to production: Once testing is completed, the application is deployed to the production environment.
Bundled deployments
To support multiple ML models as part of a single model serving application, we introduced the concept of bundled deployments. Multiple Kubernetes deployments are bundled together as a single model serving application deployment, allowing each component (e.g., models, catwalk-orchestrator, etc) to have its own Kubernetes deployment and to scale independently.
In addition to the major developments, we implemented other changes to enhance our platform’s efficiency. We made load testing mandatory for all ML application updates to ensure robust performance. This testing process was streamlined with a single command that runs the load test in the staging environment, with the results directly shared with the user.
Furthermore, we boosted deployment transparency by sharing deployment details through Slack and Datadog. This empowered users to diagnose issues independently, reducing the dependency on on-call support. This transparency not only improved our issue resolution times but also enhanced user confidence in our platform.
The results of these changes speak for themselves. The Catwalk Orchestrator has evolved into our flagship product. In just two years, we have deployed 200 Catwalk Orchestrators serving approximately 1,400 ML models.
What’s next?
As we continue to innovate and enhance our model serving platform, we are venturing into new territories:
- Catwalk serverless: We aim to further abstract the model serving experience, making it even more user-friendly and efficient.
- Catwalk data serving: We are looking to extend Catwalk’s capabilities to serve data online, providing a more comprehensive service.
- LLM serving: In line with the trend towards generative AI and large language models (LLMs), we’re pivoting Catwalk to support these developments, ensuring we stay at the forefront of the AI and machine learning field.
Stay tuned as we continue to advance our technology and bring these exciting developments to life.
Join us
Grab is the leading superapp platform in Southeast Asia, providing everyday services that matter to consumers. More than just a ride-hailing and food delivery app, Grab offers a wide range of on-demand services in the region, including mobility, food, package and grocery delivery services, mobile payments, and financial services across 700 cities in eight countries.
Powered by technology and driven by heart, our mission is to drive Southeast Asia forward by creating economic empowerment for everyone. If this mission speaks to you, join our team today!
Cats Were Key
Post Syndicated from The History Guy: History Deserves to Be Remembered original https://www.youtube.com/watch?v=sqleuk5DhFM
What Will Happen to Voyager and Others in the Far Future?
Post Syndicated from Curious Droid original https://www.youtube.com/watch?v=2Er8qPlrbWI
A Reminder That Geekbench 6 is NOT for Big CPUs
Post Syndicated from John Lee original https://www.servethehome.com/a-reminder-that-geekbench-6-is-not-for-big-cpus/
A quick reminder that Geekbench 6 is not designed for big CPUs, espeically the newest generation of server CPUs
The post A Reminder That Geekbench 6 is NOT for Big CPUs appeared first on ServeTheHome.
Exploring Telemetry Events in Amazon Q Developer
Post Syndicated from David Ernst original https://aws.amazon.com/blogs/devops/exploring-telemetry-events-in-amazon-q-developer/
As organizations increasingly adopt Amazon Q Developer, understanding how developers use it is essential. Diving into specific telemetry events and user-level data clarifies how users interact with Amazon Q Developer, offering insights into feature usage and developer behaviors. This granular view, accessible through logs, is vital for identifying trends, optimizing performance, and enhancing the overall developer experience. This blog is intended to give visibility to key telemetry events logged by Amazon Q Developer and how to explore this data to gain insights.
To help you get started, the following sections will walk through several practical examples that showcase how to extract meaningful insights from AWS CloudTrail. By reviewing the logs, organizations can track usage patterns, identify top users, and empower them to train and mentor other developers, ultimately fostering broader adoption and engagement across teams.
Although the examples here focus on Amazon Athena for querying logs, the methods can be adapted to integrate with other tools like Splunk or Datadog for further analysis. Through this exploration, readers will learn how to query the log data to understand better how Amazon Q Developer is used within your organization.
Solution Overview
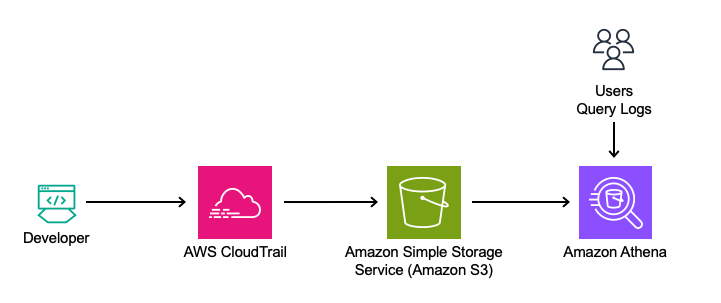
This solution leverages Amazon Q Developer’s logs from the Integrated Development Environment (IDE) and terminal, captured in AWS CloudTrail. The logs will be queried directly using Amazon Athena from Amazon Simple Storage Service (Amazon S3) to analyze feature usage, such as in-line code suggestions, chat interactions, and security scanning events.
Analyzing Telemetry Events in Amazon Q Developer
Amazon Athena is used to query the CloudTrail logs directly to analyze this data. By utilizing Athena, queries can be run on existing CloudTrail records, making it simple to extract insights from the data in its current format.
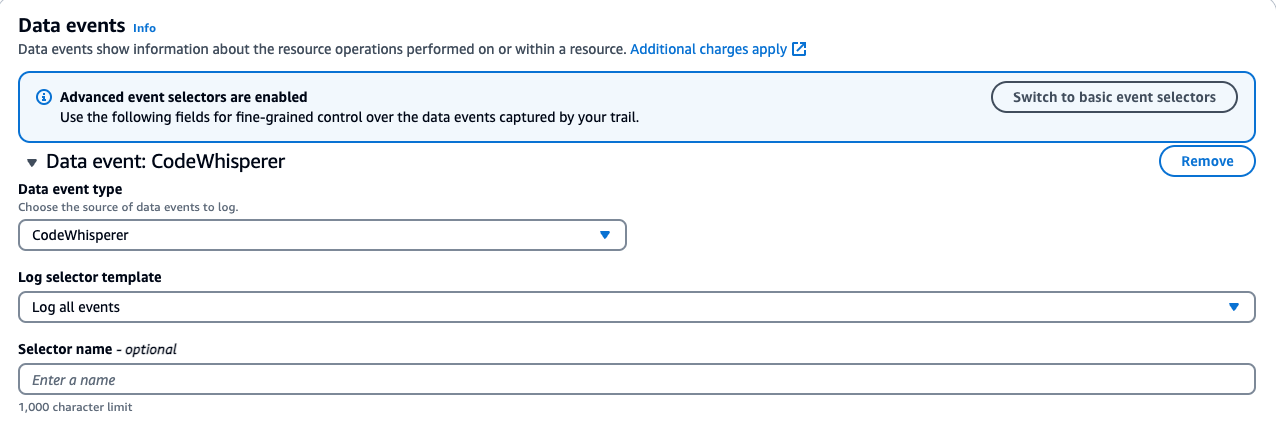
Ensuring CloudTrail is set up to log the data events.
- Navigate to the AWS CloudTrail Console.
- Edit an Existing Trail:
- If you have a trail, verify it is configured to log data events for Amazon CodeWhisperer.
- Note: As of 4/30/24, CodeWhisperer has been renamed to Amazon Q Developer. All the functionality previously provided by CodeWhisperer is now part of Amazon Q Developer. However, for consistency, the original API names have been retained.
- Click on your existing trail in CloudTrail. Find the Data Events section and click edit.
- For CodeWhisperer:
- Data event type: CodeWhisperer
- Log selector template: Log all events
- For CodeWhisperer:
- Save your changes.
- Note your “Trail log location.” This S3 bucket will be used in our Athena setup.
If you don’t have an existing trail, follow the instructions in the AWS CloudTrail User Guide to set up a new trail.
Below is a screenshot of the data events addition:
Steps to Create an Athena Table from CloudTrail Logs: This step aims to turn CloudTrail events into a queryable Athena table.
1. Navigate to the AWS Management Console > Athena > Editor.
2. Click on the plus to create a query tab.
3. Run the following query to create a database and table. Note to update the location to your S3 bucket.
-- Step 1: Create a new database (if it doesn't exist)
CREATE DATABASE IF NOT EXISTS amazon_q_metrics;

-- Step 2: Create the external table explicitly within the new database
CREATE EXTERNAL TABLE amazon_q_metrics.cloudtrail_logs (

    userIdentity STRUCT<
        accountId: STRING,
        onBehalfOf: STRUCT<
            userId: STRING,
            identityStoreArn: STRING
        >
    >,
    eventTime STRING,
    eventSource STRING,
    eventName STRING,
    requestParameters STRING,
    requestId STRING,
    eventId STRING,
    resources ARRAY<STRUCT<
        arn: STRING,
        accountId: STRING,
        type: STRING
    >>,
    recipientAccountId STRING

)
ROW FORMAT SERDE 'org.apache.hive.hcatalog.data.JsonSerDe'
STORED AS INPUTFORMAT 'com.amazon.emr.cloudtrail.CloudTrailInputFormat'
OUTPUTFORMAT 'org.apache.hadoop.hive.ql.io.HiveIgnoreKeyTextOutputFormat'
LOCATION 's3://{Insert Bucket Name from CloudTrail}/'
TBLPROPERTIES ('classification'='cloudtrail');
4. Click Run
5. Run a quick query to view the data.
SELECT
    eventTime,
    userIdentity.onBehalfOf.userId AS user_id,
    eventName,
    requestParameters
FROM
    amazon_q_metrics.cloudtrail_logs AS logs
WHERE
    eventName = 'SendTelemetryEvent'
LIMIT 10;
In this section, the significance of the telemetry events captured in the requestParameters field will be explained. The query begins by displaying key fields and their data, offering insights into how users interact with various features of Amazon Q Developer.
Query Breakdown:
- eventTime: This field captures the time the event was recorded, providing insights into when specific user interactions took place.
- userIdentity.onBehalfOf.userId: This extracts the
userIdof the user. This is critical for attributing interactions to the correct user, which will be covered in more detail later in the blog. - eventName: The query is filtered on
SendTelemetryEvent. Telemetry events are triggered when the user interacts with particular features or when a developer uses the service. - requestParameters: The
requestParametersfield is crucial because it holds the details of the telemetry events. This field contains a rich set of information depending on the type of interaction and feature the developer uses, which programming languages are used, completion types, or code modifications.
In the context of the SendTelemetryEvent, various telemetry events are captured in the requestParameters field of CloudTrail logs. These events provide insights into user interactions, overall usage, and the effectiveness of Amazon Q Developer’s suggestions. Here are the key telemetry events along with their descriptions:
- UserTriggerDecisionEvent
- Description: This event is triggered when a user interacts with a suggestion made by Amazon Q Developer. It captures whether the suggestion was accepted or rejected, along with relevant metadata.
- Key Fields:
- completionType: Whether the completion was a block or a line.
- suggestionState: Whether the user accepted, rejected, or discarded the suggestion.
- programmingLanguage: The programming language associated with the suggestion.
- generatedLine: The number of lines generated by the suggestion.
- CodeScanEvent
- Description: This event is logged when a code scan is performed. It helps track the scope and result of the scan, providing insights into security and code quality checks.
- Key Fields:
- codeAnalysisScope: Whether the scan was performed at the file level or the project level.
- programmingLanguage: The language being scanned.
- CodeScanRemediationsEvent
- Description: This event captures user interactions with Amazon Q Developer’s remediation suggestions, such as applying fixes or viewing issue details.
- Key Fields:
- CodeScanRemediationsEventType: The type of remediation action taken (e.g., viewing details or applying a fix).
- includesFix: A boolean indicating whether the user applied a fix.
- ChatAddMessageEvent
- Description: This event is triggered when a new message is added to an ongoing chat conversation. It captures the user’s intent which refers to the purpose or goal the user is trying to achieve with the chat message. The intent can include various actions, such as suggesting alternate implementations of the code, applying common best practices, improving the quality or performance of the code.
- Key Fields:
- conversationId: The unique identifier for the conversation.
- messageId: The unique identifier for the chat message.
- userIntent: The user’s intent, such as improving code or explaining code.
- programmingLanguage: The language related to the chat message.
- ChatInteractWithMessageEvent
- Description: This event captures when users interact with chat messages, such as copying code snippets, clicking links, or hovering over references.
- Key Fields:
- interactionType: The type of interaction (e.g., copy, hover, click).
- interactionTarget: The target of the interaction (e.g., a code snippet or a link).
- acceptedCharacterCount: The number of characters from the message that were accepted.
- acceptedSnippetHasReference: A boolean indicating if the accepted snippet included a reference.
- TerminalUserInteractionEvent
- Description: This event logs user interactions with terminal commands or completions in the terminal environment.
- Key Fields:
- terminalUserInteractionEventType: The type of interaction (e.g., terminal translation or code completion).
- isCompletionAccepted: A boolean indicating whether the completion was accepted by the user.
- terminal: The terminal environment in which the interaction occurred.
- shell: The shell used for the interaction (e.g., Bash, Zsh).
For a full exploration of all event types and their detailed fields, you can refer to the official schema reference for Amazon Q Developer.
Telemetry events are key to understanding how users engage with Amazon Q Developer. They track interactions such as code completion, security scans, and chat-based suggestions. Analyzing the data in the requestParameters field helps reveal usage patterns and behaviors that offer valuable insights.
By exploring events such as UserTriggerDecisionEvent, ChatAddMessageEvent, TerminalUserInteractionEvent, and others in the schema, organizations can assess the effectiveness of Amazon Q Developer and identify areas for improvement.
Example Queries for Analyzing Developer Engagement
To gain deeper insights into how developers interact with Amazon Q Developer, the following queries can help analyze key telemetry data from CloudTrail logs. These queries track in-line code suggestions, chat interactions, and code-scanning activities. By running these queries, you can uncover valuable metrics such as the frequency of accepted suggestions, the types of chat interactions, and the programming languages most frequently scanned. This analysis helps paint a clear picture of developer engagement and usage patterns, guiding efforts to enhance productivity.
These four examples only cover a sample set of the available telemetry events, but they serve as a starting point for further exploration of Amazon Q Developer’s capabilities.
Query 1: Analyzing Accepted In-Line Code Suggestions
SELECT
    eventTime,
    userIdentity.onBehalfOf.userId AS user_id,
    eventName,
    json_extract_scalar(requestParameters, '$.telemetryEvent.userTriggerDecisionEvent.suggestionState') AS suggestionState,
    json_extract_scalar(requestParameters, '$.telemetryEvent.userTriggerDecisionEvent.completionType') AS completionType
FROM
    amazon_q_metrics.cloudtrail_logs
WHERE
    eventName = 'SendTelemetryEvent'
    AND json_extract(requestParameters, '$.telemetryEvent.userTriggerDecisionEvent') IS NOT NULL
    AND json_extract_scalar(requestParameters, '$.telemetryEvent.userTriggerDecisionEvent.suggestionState') = 'ACCEPT';
Use Case:This use case focuses on how developers interact with in-line code suggestions by analyzing accepted snippets. It helps identify which users are accepting suggestions, the type of snippets being accepted (blocks or lines), and the programming languages involved. Understanding these patterns can reveal how well Amazon Q Developer aligns with the developers’ expectations.
Query Explanation: The query retrieves the event time, user ID, event name, suggestion state (filtered to show only ACCEPT), and completion type. TotalGeneratedLinesBlockAccept and totalGeneratedLinesLineAccept or discarded suggestions are not included, but this gives an idea of the developers using the service for in-line code suggestions and the lines or blocks they have accepted. Additionally, the programming language field can be extracted to see which languages are used during these interactions.
Query 2: Analyzing Chat Interactions
SELECT
    userIdentity.onBehalfOf.userId AS userId,
    json_extract_scalar(requestParameters, '$.telemetryEvent.chatInteractWithMessageEvent.interactionType') AS interactionType,
    COUNT(*) AS eventCount
FROM
    amazon_q_metrics.cloudtrail_logs
WHERE
    eventName = 'SendTelemetryEvent'
    AND json_extract(requestParameters, '$.telemetryEvent.chatInteractWithMessageEvent') IS NOT NULL
GROUP BY
    userIdentity.onBehalfOf.userId,
    json_extract_scalar(requestParameters, '$.telemetryEvent.chatInteractWithMessageEvent.interactionType')
ORDER BY
    eventCount DESC;
Use Case: This use case looks at how developers use chat options like upvoting, downvoting, and copying code snippets. Understanding the chat usage patterns shows which interactions are most used and how developers engage with Amazon Q Developer chat. As an organization, this insight can help support other developers in successfully leveraging this feature.
Query Explanation: The query provides insights into chat interactions within Amazon Q Developer by retrieving user IDs, interaction types, and event counts. This query aggregates data based on the interactionType field within chatInteractWithMessageEvent, showcasing various user actions such as UPVOTE, DOWNVOTE, INSERT_AT_CURSOR, COPY_SNIPPET, COPY, CLICK_LINK, CLICK_BODY_LINK, CLICK_FOLLOW_UP, and HOVER_REFERENCE.
This analysis highlights how users engage with the chat feature and the interactions, offering a view of interaction patterns. By focusing on the interactionType field, you can better understand how developers interact with the chat feature of Amazon Q Developer.
Query 3: Analyzing Code Scanning Jobs Across Programming Languages
SELECT
    userIdentity.onBehalfOf.userId AS userId,
    json_extract_scalar(requestParameters, '$.telemetryEvent.codeScanEvent.programmingLanguage.languageName') AS programmingLanguage,
    COUNT(json_extract_scalar(requestParameters, '$.telemetryEvent.codeScanEvent.codeScanJobId')) AS jobCount
FROM
    amazon_q_metrics.cloudtrail_logs
WHERE
    eventName = 'SendTelemetryEvent'
    AND json_extract(requestParameters, '$.telemetryEvent.codeScanEvent') IS NOT NULL
GROUP BY
    userIdentity.onBehalfOf.userId,
    json_extract_scalar(requestParameters, '$.telemetryEvent.codeScanEvent.programmingLanguage.languageName')
ORDER BY
    jobCount DESC;
Use Case: Amazon Q Developer includes security scanning, and this section helps determine how the security scanning feature is being used across different users and programming languages within the organization. Understanding these trends provides valuable insights into which users actively perform security scans and the specific languages targeted for these scans.
Query Explanation: The query provides insights into the distribution of code scanning jobs across different programming languages in Amazon Q Developer. It retrieves user IDs and the count of code-scanning jobs by programming language. This analysis focuses on the CodeScanEvent, aggregating data to show the total number of jobs executed per language.
By summing up the number of code scanning jobs per programming language, this query helps to understand which languages are most frequently analyzed. It provides a view of how users are leveraging the code-scanning feature. This can be useful for identifying trends in language usage and optimizing code-scanning practices.
Query 4: Analyzing User Activity across features.
SELECT
    userIdentity.onBehalfOf.userId AS user_id,
    COUNT(DISTINCT CASE
        WHEN json_extract(requestParameters, '$.telemetryEvent.userTriggerDecisionEvent') IS NOT NULL
        THEN eventId END) AS inline_suggestions_count,
    COUNT(DISTINCT CASE
        WHEN json_extract(requestParameters, '$.telemetryEvent.chatInteractWithMessageEvent') IS NOT NULL
        THEN eventId END) AS chat_interactions_count,
    COUNT(DISTINCT CASE
        WHEN json_extract(requestParameters, '$.telemetryEvent.codeScanEvent') IS NOT NULL
        THEN eventId END) AS security_scans_count,
    COUNT(DISTINCT CASE
        WHEN json_extract(requestParameters, '$.telemetryEvent.terminalUserInteractionEvent') IS NOT NULL
        THEN eventId END) AS terminal_interactions_count
FROM
    amazon_q_metrics.cloudtrail_logs
WHERE
    eventName = 'SendTelemetryEvent'
GROUP BY
    userIdentity.onBehalfOf.userId
Use Case:This use case looks at how developers use Amazon Q Developer across different features: in-line code suggestions, chat interactions, security scans, and terminal interactions. By tracking usage, organizations can see overall engagement and identify areas where developers may need more support or training. This helps optimize the use of Amazon Q Developer and helps teams get the most out of the tool.
Query Explanation: Let’s take the other events from the prior queries and additional events to get more detail overall and tie it all together. This expanded query provides a comprehensive view of user activity within Amazon Q Developer by tracking the number of in-line code suggestions, chat interactions, security scans, and terminal interactions performed by each user. By analyzing these events, organizations can gain a better understanding of how developers are using these key features.
By summing up the interactions for each feature, this query helps identify which users are most active in each category, offering insights into usage patterns and areas where additional training or support may be needed.
Enhancing Metrics with Display Names and Usernames
The previous queries had userid as a field; however, many customers would prefer to see a user alias (such as username or display name). The following section illustrates enhancing these metrics by augmenting user IDs with display names and usernames from the AWS IAM Identity Center. This will provide more human-readable user names.
In this example, the export is run locally to enhance user metrics with IAM Identity Center for simplicity. This method works well for demonstrating how to access and work with the data, but it provides a static snapshot of the users at the time of export. In a production environment, an automated solution would be preferable to capture newly added users continuously. For the purposes of this blog, this straightforward approach is used to focus on data access.
To proceed, install Python 3.8+ and Boto3, and configure AWS credentials via the CLI. Then, run the following Python script locally to export the data:
import boto3, csv
# replace this with the region of your IDC instance
RegionName='us-east-1'
# client creation
idstoreclient = boto3.client('identitystore', RegionName)
ssoadminclient = boto3.client('sso-admin', RegionName)

Instances= (ssoadminclient.list_instances()).get('Instances')
InstanceARN=Instances[0].get('InstanceArn')
IdentityStoreId=Instances[0].get('IdentityStoreId')

# query
UserDigestList = []
ListUserResponse = idstoreclient.list_users(IdentityStoreId=IdentityStoreId)
UserDigestList.extend([[user['DisplayName'], user['UserName'], user['UserId']] for user in ListUserResponse['Users']])
NextToken = None
if 'NextToken' in ListUserResponse.keys(): NextToken = ListUserResponse['NextToken']
while NextToken is not None:
    ListUserResponse = idstoreclient.list_users(IdentityStoreId=IdentityStoreId, NextToken=NextToken)
    UserDigestList.extend([[user['DisplayName'], user['UserName'], user['UserId']] for user in ListUserResponse['Users']])
    if 'NextToken' in ListUserResponse.keys(): NextToken = ListUserResponse['NextToken']
    else: NextToken = None

# write the query results to IDCUserInfo.csv
with open('IDCUserInfo.csv', 'w') as CSVFile:
    CSVWriter = csv.writer(CSVFile, quoting=csv.QUOTE_ALL)
    HeaderRow = ['DisplayName', 'UserName', 'UserId']
    CSVWriter.writerow(HeaderRow)
    for UserRow in UserDigestList:
        CSVWriter.writerow(UserRow)
This script will query the IAM Identity Center for all users and write the results to a CSV file, including DisplayName, UserName, and UserId. After generating the CSV file, upload it to an S3 bucket. Please make note of this S3 location.
Steps to Create an Athena Table from the above CSV output: Create a table in Athena to join the existing table with the user details.
1. Navigate to the AWS Management Console > Athena > Editor.
2. Click on the plus to create a query tab.
3. Run the following query to create our table. Note to update the location to your S3 bucket.
CREATE EXTERNAL TABLE amazon_q_metrics.user_data (
    DisplayName STRING,
    UserName STRING,
    UserId STRING
)
ROW FORMAT SERDE 'org.apache.hadoop.hive.serde2.OpenCSVSerde'
WITH SERDEPROPERTIES (
   'separatorChar' = ',',
   'quoteChar'     = '"'
)
STORED AS TEXTFILE
LOCATION 's3://{Update to your S3 object location}/'  -- Path containing CSV file
TBLPROPERTIES ('skip.header.line.count'='1');
4. Click Run
5. Now, let’s run a quick query to verify the data in the new table.
SELECT * FROM amazon_q_metrics.user_data limit 10; The first query creates an external table in Athena from user data stored in a CSV file in S3. The user_data table has three fields: DisplayName, UserName, and UserId. To specify the correct parsing of the CSV, separatorChar is specified as a comma and quoteChar as a double quote. Additionally, the TBLPROPERTIES
(‘skip.header.line.count’=’1’) flag skips the header row in the CSV file, ensuring that column names aren’t treated as data.
The user_data table holds key details: DisplayName (full name), UserName (username), and UserId (unique identifier). This table will be joined with the cloudtrail_q_metrics table using the userId field from the onBehalfOf struct, enriching the interaction logs with human-readable user names and display names instead of user IDs.
In the previous analysis of in-line code suggestions, the focus was on retrieving key metrics related to user interactions with Amazon Q Developer. The query below follows a similar structure but now includes a join with the user_data table to enrich insights with additional user details such as DisplayName and Username.
To include a join with the user_data table in the query, it is necessary to define a shared key between the cloudtrail_logs_amazon_q and user_data tables. For this example, user_id will be used.
SELECT
    logs.eventTime,
    user_data.displayname,  -- Additional field from user_data table
    user_data.username,     -- Additional field from user_data table
    json_extract_scalar(logs.requestParameters, '$.telemetryEvent.userTriggerDecisionEvent.suggestionState') AS suggestionState,
    json_extract_scalar(logs.requestParameters, '$.telemetryEvent.userTriggerDecisionEvent.completionType') AS completionType
FROM
    amazon_q_metrics.cloudtrail_logs AS logs  -- Specified database for cloudtrail_logs
JOIN
    amazon_q_metrics.user_data  -- Specified database for user_data
ON
    logs.userIdentity.onBehalfOf.userId = user_data.userid
WHERE
    logs.eventName = 'SendTelemetryEvent'
    AND json_extract_scalar(logs.requestParameters, '$.telemetryEvent.userTriggerDecisionEvent.suggestionState') = 'ACCEPT';
This approach allows for a deeper analysis by integrating user-specific information with the telemetry data, helping you better understand how different user roles interact with the in-line suggestions and other features of Amazon Q Developer.
Cleanup
If you have been following along with this workflow, it is important to clean up the resources to avoid unnecessary charges. You can perform the cleanup by running the following query in the Amazon Athena console:
-- Step 1: Drop the tables
DROP TABLE IF EXISTS amazon_q_metrics.cloudtrail_logs;
DROP TABLE IF EXISTS amazon_q_metrics.user_data;

-- Step 2: Drop the database after the tables are removed
DROP DATABASE IF EXISTS amazon_q_metrics CASCADE;
This query removes both the cloudtrail_logs and user_data tables, followed by the amazon_q_metrics database.
Remove the S3 objects used to store the CloudTrail logs and user data by navigating to the S3 console, selecting the relevant buckets or objects, and choosing “Delete.”
If a new CloudTrail trail was created, consider deleting it to stop further logging. For instructions, see Deleting a Trail. If an existing trail was used, remove the CodeWhisperer data events to prevent continued logging of those events.
Conclusion
By tapping into Amazon Q Developer’s logging capabilities, organizations can unlock detailed insights that drive better decision-making and boost developer productivity. The ability to analyze user-level interactions provides a deeper understanding of how the service is used.
Now that you have these insights, the next step is leveraging them to drive improvements. For example, organizations can use this data to identify opportunities for Proof of Concepts (PoCs) and pilot programs that further demonstrate the value of Amazon Q Developer. By focusing on areas where engagement is high, you can support the most engaged developers as champions to advocate for the tool across the organization, driving broader adoption.
The true potential of these insights lies in the “art of the possible.” With the data provided, it is up to you to explore how to query or visualize it further. Whether you’re examining metrics for in-line code suggestions, interactions, or security scanning, this foundational analysis is just the beginning.
As Amazon Q Developer continues to evolve, staying updated with emerging telemetry events is crucial for maintaining visibility into the available metrics. You can do this by regularly visiting the official Amazon Q Developer documentation and the Amazon Q Developer’s Changelog to stay up-to-date latest information and insights.
About the authors:
Monitoring best practices for event delivery with Amazon EventBridge
Post Syndicated from Chris McPeek original https://aws.amazon.com/blogs/compute/monitoring-best-practices-for-event-delivery-with-amazon-eventbridge/
This post is written by Maximilian Schellhorn, Senior Solutions Architect and Michael Gasch, Senior Product Manager, EventBridge
Amazon EventBridge is a serverless event router that allows you to decouple your applications, using events to communicate important changes between event producers and consumers (targets). With EventBridge, producers publish events through an event bus, where you can configure rules to filter, transform, and route your events to a variety of targets such as AWS Lambda functions, Amazon Kinesis Data Streams, and public HTTPS endpoints (API destinations).
In event-driven architectures, the flow of sending and receiving events is asynchronous. There is no direct feedback to the producer when targets are invoked or if the invocation was successful. Therefore, to make sure business logic executes reliably in event-driven applications, it’s essential to get an understanding of your event delivery behavior with metrics, such as the number of delivery retries, failed delivery attempts, and the time it takes to deliver events. These metrics allow you to monitor the health of your event-driven architectures, and understand and mitigate event delivery issues caused by underperforming, undersized or unresponsive targets.
This post discusses how to monitor event delivery with EventBridge metrics to detect common event delivery issues and increase the reliability of your event-driven architectures on AWS.
Background
EventBridge is a multi-tenant system that handles more than 2.6 trillion events per month as of February 2024. EventBridge maintains fairness and availability under high load using mechanisms to detect and isolate noisy neighbors. As part of the AWS shared responsibility model, you are responsible to monitor and respond to target-related issues for reliable event delivery. For example, an underprovisioned Kinesis data stream or throttled API destination as a target will lead to delivery retries, delays, and failures.
Solution overview
EventBridge provides a variety of metrics to observe, troubleshoot, and optimize event delivery. For example, counter-based metrics such as InvocationAttempts, SuccessfulInvocationAttempts, RetryInvocationAttempts, and FailedInvocations allow you to observe throttling and calculate error rates. Latency-based metrics such as IngestionToInvocationSuccessLatency provide insights into event delivery and delays.
In the following sections, we demonstrate the behavior of these metrics through an example application and discuss best practices for reliable event delivery. The example is composed of three key components, as numbered in the following architecture:
- An HTTP load generator to simulate different load patterns through Amazon API Gateway.
- An EventBridge event bus and a rule with an API destination target, throttled at 50 requests per second to simulate an under-scaled resource.
- A dead-letter queue (DLQ) that makes sure events are retained in case of invocations that fail permanently.

Example application architecture
The load generator creates varying load over multiple phases. To observe the number of incoming events, use the EventBridge metrics MatchedEvents or TriggeredRules on the rule name dimension, as illustrated in the following graph.

Number of incoming events visualized in CloudWatch Metrics
The following use cases focus on monitoring event delivery. Therefore, cases where event producers are not able to publish events due to permission errors or are experiencing throttling quotas on PutEvents are not covered.
Use case 1: Detecting event delivery issues due to target rate limiting
In this use case, event delivery will experience retries due to an under-scaled API destination target. The API processes all requests successfully. The load generator runs in three phases:
- First, it warms up with a low number of requests and slowly increases the load while staying below the API destination rate limit of 50 requests per second
- In the second phase, the load generator increases to 100 requests per second, exceeding the configured invocation rate on the API destination
- Finally, the load generator slows to 50 requests per second, and eventually finishes
The following graph was created via CloudWatch Metrics and illustrates this scenario.

Load pattern of the example application
EventBridge supports new rule name dimensions for selected metrics, making it straightforward to observe invocations (event delivery) per rule. The following metrics are recommended:
- InvocationAttempts – The overall number of times EventBridge attempts to invoke the target, including retries
- SuccessfulInvocationAttempts – The number of invocation attempts that were successful
- RetryInvocationAttempts – The number attempts that originated from retries
The following graph visualizes the metrics within the first phase of the example scenario. In this phase, the load stays below the configured rate limit of the target. When events are delivered successfully without throttling or errors, InvocationAttempts and SuccessfulInvocationAttempts are equivalent and RetryInvocationAttempts is 0 (the metric is only emitted if there are retries).

EventBridge Metrics during the first phase without throttling or errors
In the second phase (06:55), the load generator creates more events than the target can handle, exceeding the API destination invocation rate limit. This is reflected in the graph by InvocationAttempts and MatchedEvents increasing, while SuccessfulInvocationAttempts stays at the configured API destination rate limit. At the beginning of the phase, RetryInvocationAttempts is 0 because retries due to rate limiting from API destinations are not immediately executed, but delayed with exponential backoff. After the delay, RetryInvocationAttempts starts increasing (06:58), as shown in the following graph.

EventBridge Metrics during the ramp-up phase of the load generator
Because InvocationAttempts also includes retries, the overall number of InvocationAttempts is higher than the incoming MatchedEvents.
Lastly, during the cool down period, when the number of incoming events is decreasing significantly (7:03), more retry attempts succeed, and therefore InvocationAttempts and RetryAttempts reduce. Even though there are no more new incoming events (07:05), there are still events being retried that will eventually finish (07:14).

EventBridge Metrics during the cool-down phase of the load generator
Based on the observations during this scenario, we can calculate the overall custom metric SuccessfulInvocationRate. If you consider retries as a first sign of degraded system state, you can calculate this rate as SuccessfulInvocationAttempts/InvocationAttempts. For example, in Amazon CloudWatch, you can use metric math. Depending on your requirements, you can set up CloudWatch alarms to create notifications when a certain threshold is hit.

Custom SuccessfulInvocationRate metric generated with CloudWatch metric math
Although an occasional decrease of SuccessfulInvocationRate due to temporary traffic spikes or invocation errors can be considered normal, a constant mismatch is an indication of a misconfigured target and needs to be addressed as part of the shared responsibility model.
Use case 2: Detecting and handling event delivery failures
By default, EventBridge retries delivering an event for 24 hours and up to 185 times. After all retry attempts are exhausted, the event is dropped or sent to a DLQ. See Using dead-letter queues to process undelivered events in EventBridge for more information on how to configure a DLQ with EventBridge. These events can be visualized through the FailedInvocations or InvocationsSentToDlq metrics. Because FailedInvocations doesn’t consider retries that eventually succeed as failed invocations, this metric wasn’t visible in the previous example.
The following graph represents the same application and load pattern, but the EventBridge rule is configured with a maximum of three retries. During the first phase, there are no failed attempts because the load stays below the throttling limit.

EventBridge Metrics with FailedInvocations after maximum retries exceed
In the second phase, you can observe FailedInvocations starting after the initial retries (three) have been exceeded. Because the example application has a DLQ configured, InvocationsSentToDlq can provide the same insight, and can be used for alerting.
If you’re experiencing a large amount of FailedInvocations or InvocationsSentToDlq, it’s recommended to investigate if the target is properly scaled and able to receive the given traffic. For cases where retries are expected, the retry policy should be configured accordingly.
Use case 3: Detecting event delivery delays
The metrics outlined in the previous scenarios provided an overview of how to monitor your event delivery by the total number of retries or failures during a given time period. However, EventBridge also provides a metric that lets you observe the end-to-end latency (the time it takes from event ingestion to successful delivery to the target).
This can be achieved with the new IngestionToInvocationSuccessLatency metric. This metric surfaces effects from retries and delayed delivery, for example due to timeouts and slow responses from targets. In the following graph, you can observe 50th and 99th percentiles (p50 and p99) for IngestionToInvocationSuccessLatency on the right Y axis. During the second phase of the load generator, where invocations exceed the number of events the target can process, retries occur. Therefore, the overall time until events are delivered successfully to the target increases to almost 10 minutes (597,621ms, p99).

Combination of counter based metrics and latency based metrics
IngestionToInvocationSuccessLatency includes the time the target takes to successfully respond to event delivery. This allows you to monitor the end-to-end latency between EventBridge and your target, and detect performance variations and degradations of targets, even when there is no target throttling or errors. For example, the following graph displays constant successful invocations while the latency increases due to longer response times of the target over a 5-minute period (starting at 09:07).

Visualization of increased target latency without errors or retries
Conclusion
In this post, we explored best practices for observing event delivery with EventBridge. By using key metrics like SuccessfulInvocationAttempts, RetryInvocationAttempts, and FailedInvocations, you can gain visibility and identify issues early. With CloudWatch metric math, you can calculate a SuccessfulInvocationRate metric, allowing you to define thresholds and alerts on a single key metric.
Furthermore, the new IngestionToInvocationSuccessLatency metric provides insights into the end-to-end event delivery latency between EventBridge and your targets, enabling you to detect and respond to performance degradation. It’s recommended to combine these key metrics into a holistic overview, such as using CloudWatch dashboards. By setting up appropriate alarms and taking a proactive approach to observability, you can mitigate event delivery problems and build resilient, scalable, event-driven applications on AWS with EventBridge. Navigate to Monitoring Amazon EventBridge to get an overview of the available metrics and how to get started.
Try these metrics out with your own use case!
To find more serverless patterns, check out Serverless Land.
[$] Coccinelle for Rust
Post Syndicated from daroc original https://lwn.net/Articles/991399/
Tathagata Roy has been working to make the
Coccinelle tool that is used (among other things)
to automate the refactoring of C code work on Rust
code as well. Roy gave a
presentation at Kangrejos about that work,
including the creative approaches necessary to work with Rust’s more complicated
control flow and syntax.
How to implement relationship-based access control with Amazon Verified Permissions and Amazon Neptune
Post Syndicated from Henry Ho original https://aws.amazon.com/blogs/security/how-to-implement-relationship-based-access-control-with-amazon-verified-permissions-and-amazon-neptune/
Externalized authorization for custom applications is a security approach where access control decisions are managed outside of the application logic. Instead of embedding authorization rules within the application’s code, these rules are defined as policies, which are evaluated by a separate system to make an authorization decision. This separation enhances an application’s security posture by aligning with Zero Trust principles of continual real-time authorization, simplifies the management of security policies, and enables consistent policy enforcement across multiple applications. Amazon Verified Permissions is a scalable permissions management and fine-grained authorization service that you can use to externalize application authorization.
Two common access control models that you might consider when implementing your authorization system are role-based access control (RBAC) and attribute-based access control (ABAC). RBAC grants permissions to users based on their assigned roles within an organization, simplifying the management of access by grouping permissions into roles that correspond to job functions. ABAC grants permissions based on a set of attributes associated with users, resources, and the context, allowing for more fine-grained and dynamic authorization decisions. However, as systems become more complex and have more interconnected data—especially in environments like social networks, collaborative environments, and multi-tenant applications—the limitations of RBAC and ABAC become apparent. These models often fail to effectively capture the relationships between entities. Relationship-based access control (ReBAC) offers a more nuanced approach by using the relationships between users and resources to make decisions about permitted actions, thus addressing scenarios more efficiently than other models.
In this blog post, we show you how to implement ReBAC using Verified Permissions and Amazon Neptune, a managed, serverless graph database on AWS.
What is relationship-based access control?
The core principle of ReBAC is that authorization decisions are based on the relationships between the principal requesting access and the resource being accessed. These relationships can be of several types—ownership, collaboration, or membership relationships—that form hierarchical structures. Examples of ReBAC can be found in multiple domains, including social media sites, project management tools, and content management systems. For example, in a social media application, ReBAC can be used to control who can view, comment, or share a post based on the relationships between the poster, their connections, and the content itself.
Conceptually, roles are types of relationships, and relationships are subsets of attributes.
Benefits of ReBAC
In some types of applications, relationships change dynamically. For example, in a collaborative or social media application, relationships such as contributor or co-owner are continually being established between individual users and resources. Compared to traditional access control models, ReBAC offers the following benefits in these use cases.
- Fine-grained access control – ReBAC grants access at the level of an individual resource based on a user’s relationship with that resource. For example, a user can update individual photo albums with which they have a contributor relationship.
- Scalability and adaptability – Relationships can change dynamically. Access permissions are updated automatically when a relationship changes. For example, when the contributor relationship is removed, the user no longer has access.
- Support for hierarchies – ReBAC can handle hierarchical relationships. For example, the contributor relationship can be inherited down through an album hierarchy, permitting the user to update photo albums that are members of the album with which they have the relationship.
Common relationship models in ReBAC
Here are some common relationship models, also shown in Figure 1, for consideration when building the application and its authorization system:
- Resource ownership – Permissions to access or manipulate a resource are granted based on whether a user owns that resource. For example, you can delete a GitHub repository if you are the owner of the repository.
- Resource hierarchies – Permissions to access or manipulate a resource are granted based on the permissions that a principal has for the parent resource. For example, a GitHub repository contributor can close issues that belong to that repository.
- User hierarchies – These are similar to AWS Identity and Access Management (IAM) user groups. Principals that belong to a group will have the permissions granted to that group.

Figure 1: Common relationship models in ReBAC
In a relationship model, direct relationships represent clear, explicit links between users and resources, such as an employee owns their expense reports or a file is a member of a folder. These connections are straightforward and simply definable.
However, relationship models often extend beyond these direct links to include hierarchical structures. These create indirect relationships that are more complex in nature. For example, team managers might have access to all expense reports filed by their subordinates, even though they don’t directly own these reports. Similarly, folder owners might have access to all files within their subfolders, regardless of who created those files.
These indirect relationships are derived from a series of direct relationships. They form a relationship chain that, while not explicitly defined, is implied by the hierarchical structure. Because of their complexity and potential for far-reaching implications, these indirect relationships require careful consideration when designing an authorization system.
In this blog post, we focus on the implementation of the relationship models that use resource ownership and resource hierarchies, and relationship hierarchies in these models.
Example scenario
Consider a video application that allows users to manage and share videos of their pets. Alice and Bob are individual users within the environment and so they only have access permissions to their own directory or videos. Because Alice and Bob directly own their resources, they have direct OWNER relationships to these resources, represented as solid lines in Figure 2. aliceCatVideo.mp4 is a video resource stored in the aliceVideoDirectory directory. There is a MemberOf relationship between these resources.

Figure 2: Alice has direct relationship to resources that she has direct ownership
Charlie has direct OWNER relationship to the root directory petVideosDirectory. Because aliceVideoDirectory is a subdirectory of petVideosDirectory, Charlie inherits an OWNER relationship to aliceVideoDirectory and the video resource aliceCatVideo.mp4 inside. This indirect OWNER relationship is inherited through the MemberOf relationship between resources and is represented as dotted lines in Figure 3.

Figure 3: Charlie has indirect relationship to resources that inherited from the MemberOf relationship
When implementing access control for this scenario, both RBAC and ABAC offer distinct approaches. In RBAC, you might define roles such as OWNER and VIEWER, and grant Charlie full access to each resource through the OWNER role. While initially straightforward, this method can become inflexible as the application grows, potentially leading to role proliferation. For example, you might want to have separate roles to manage different resources (such as photos or videos) for each type of pet (such as cats or dogs). In ABAC, you might assign attributes such as OWNER and VIEWER and grant each user permissions to resources with specific attributes. This approach offers more flexibility, but fine-grained control can be more complex to set up and manage. As the application’s hierarchy becomes more intricate, both models face challenges in maintaining scalability while maintaining proper access control.
ReBAC addresses these limitations by implementing an access control model that uses direct and indirect relationships between principals and resources. In the example scenario, when Charlie requests access to the video resource aliceCatVideo.mp4, the application traverses the relationship graph in Neptune to retrieve the inherited OWNER relationship through the MemberOf relationship and make the authorization decision.
Overview of a ReBAC application
In this solution, relationship data is stored in Neptune. Prior to requesting an authorization decision from Verified Permissions, the application runs a Neptune query that traverses the relationship graph to retrieve the set of principals that have a specific relationship with the resource. The application then constructs an authorization request for Verified Permissions, using the results of this query to populate the entity data in the request.
In the Cedar schema, the resource has an attribute—named for the relationship—that contains the set of principals that have that relationship with the resource. In our sample application, entities of type Video have an attribute called OWNER, which contains the set of users that have an owner relationship, directly or indirectly, with a video. Each potential relationship is represented by a distinct resource attribute and requires a dedicated query to fetch the set of principals that have that relationship.
See the GitHub repository for the step-by-step walkthrough. In this post, we focus on the key concepts of the solution.
Architecture

Figure 4: Solution architecture
The solution architecture, as shown in Figure 4, includes the following:
- The user authenticates with Amazon Cognito and obtains an access token and an ID token.
- The user accesses the application through Amazon API Gateway with the provided token.
- An application AWS Lambda function traverses the relationship graph in Neptune and returns the set of principals that have a specific relationship with the resource.
- The application Lambda function constructs the requests by putting relationship data in the entities field and passes the requests to Verified Permissions. Verified Permissions acts as the policy decision point (PDP) and evaluates the Cedar policies to arrive at an authorization decision.
- The application Lambda function acts as the policy enforcement point (PEP) to enforce the authorization decision returned by Verified Permissions by allowing or denying access to the API.
Data modelling and queries in Neptune
Relationships between entities are created and stored in Neptune as a property graph. A property graph is a set of vertices and edges with respective properties (key-value pairs). The vertices represent entities such as User, Directory, and Video in our example, and the edges represent directional relationships between vertices. Each edge has a label that denotes the type of relationship.
Neptune supports multiple graph query languages, including Gremlin, openCypher, and SPARQL, to access a graph. In this solution, we use Gremlin as the graph query language. For more information about Gremlin, see the documentation from Apache TinkerPop. You can use Neptune graph notebooks to work with a Neptune graph.
You can visualize the relationship graph (Figure 5) using the following query. We use elementMap() to include attributes to represent a vertex or an edge.

Figure 5: Relationship graph in Neptune
The following code snippet shows how to add a vertex for entity and an edge for relationship in a relationship graph. Static attributes such as ownerId, ownerName, and isPublic are defined as properties of a vertex. In our example, we will define two relationships—MEMBEROF and OWNER—to denote the direct relationships between resources-to-resources and resources-to-users respectively.
It’s a best practice to assign universally unique identifiers (UUIDs) for all principal and resource identifiers. Another best practice is to not include personally identifying, confidential, or sensitive information as part of the unique identifier for your principals or resources.
To traverse the relationship graph to obtain the owner vertex of a resource vertex, you can use the following query. This query returns the vertex that has a direct OWNER relationship to the resource vertex aliceCatVideo.mp4.
You can use the following query to discover inherited OWNER relationships through MemberOf relationships between resources. The query traverses the relationship graph starting from a video vertex and return the OWNER vertex of each resource vertex along the path to the root directory petVideosDirectory. It outputs the set of owners after deduplication. This query discovers the inherited OWNER in the file system hierarchy and includes them in the entities list of authorization requests.
Cedar policy design
Verified Permissions uses the Cedar policy language to define fine-grained permissions. The default decision for an authorization response is DENY. The first policy permits a principal to perform actions in the action group OwnerActions on resources in petVideosDirectory only when the same principal is included in the set of resource owners.
// Resource owner and related persons can access the resources
permit (
	principal,
	action in [PetVideosApp::Action::"OwnerActions"],
	resource in PetVideosApp::Directory::<petVideosDirectory_UUID> )
when {
	resource has owner &&
	principal in resource.owner };
The second policy is an ABAC policy that permits a principal to perform actions in the action group PublicActions on resources in petVideosDirectory only when the resource has the static attribute isPublic and its value is true.
// Allow public access to the resources
permit (
	principal,
	action in [PetVideosApp::Action::"PublicActions"],
	resource in PetVideosApp::Directory::<petVideosDirectory_UUID> )
when {
	resource has isPublic &&
	resource.isPublic == true };
Implementing ReBAC using this Cedar design pattern in conjunction with a relationship graph requires the careful construction of queries. Verified Permissions will validate that the Cedar policies are correct, based on the Cedar schema, but cannot validate that the Neptune queries correctly traverse the graph to return the correct set of principals with the referenced relationship.
When designing your policies and queries, take account of the following guidelines.
- Each Cedar policy governs the behaviors of a specific relationship, in this case
OWNER. Use a distinct Cedar policy for each relationship in your use cases. - Define action groups for each relationship in your use cases.
- Each new relationship referenced in a Cedar policy requires its own query, and the application needs to run this query if the relationship is relevant to the authorization request. Policy writers must collaborate closely with the application developer to help ensure that the application fetches all data that’s relevant to the authorization request.
- Indirect relationships can be hard to intuit and prone to errors. The example here of an
OWNERrelationship inherited through theMEMBEROFrelationship is relatively intuitive. However, we recommend avoiding policies that rely on indirect relationships that are derived from multiple different types of direct relationship. - Indirect relationships can be over-permissive when there is no permission boundary defined. In our example, the boundary for inherited relationship is defined at the root level of the directory (
petVideosDirectory). Follow the least privilege principle to limit inherited relationship within a clearly defined permission boundary. - Use
MEMBEROFto denote the parent relationship in your graph to align with Cedar policy terminology. However, remember that Verified Permissions cannot auto-discover the Neptune graph, so your queries will still need to be designed to traverse it correctly.
Authorization request to Verified Permissions
The following example shows the structure of an authorization request made to Verified Permissions. In the example, Amazon Cognito is used as the identity source of the Verified Permissions policy store. Cognito user ID claims are mapped to the user entity PetVideosApp::User. Tokens issued by Cognito are mapped to a principal ID in the format <user pool ID>|<sub> by Verified Permissions.
The following request was made for action ViewVideo to the video resource entity with UUID 878c101a-ca0e-4733-904d-af3f252abf50 (the video ID of aliceCatVideo.mp4) using the ID token of alice. The user IDs for alice and charlie were returned after traversing the relationship graph in Neptune to fetch users with the OWNER relationship and include these in the owner attribute in the entities field. The entities field is an array of attributes that Verified Permissions can examine when evaluating the policies. The resource hierarchy of this video resource was shown by including the parent directories (petVideosDirectory and aliceVideosDirectory) as the parent entities in the authorization request.
With reference to the Cedar policy <Resource owner and related persons can access the resources>, the following authorization request returns an ALLOW decision.
Combining ReBAC policies with ABAC policies
ReBAC policies are a great fit when you want to create access based on a relationship between the principal and the resource. However, there can be cases where an ABAC policy is a more intuitive expression of a business rule. For example, in the sample application, you might want to grant all principals permission to view any public resource.
With ReBAC, you would need to create a vertex public in the relationship graph, create MEMBEROF relationships between all public resources and this vertex, and then create a VIEWER relationship between all principals and the vertex public.
With Cedar, you can create a policy store that is a mix of ReBAC and ABAC policies, enabling you to express this access rule with a single ABAC policy that allows public access to resources, as described in the section Cedar Policy Design. This policy grants broad access on resources with the attribute isPublic set to true.
You can use the following Gremlin query to modify the static property isPublic of the video resource vertex bobDogVideo.mp4 to true.
You can verify the value of property isPublic of bobDogVideo.mp4 with the following Gremlin query.
The following authorization request is made to Verified Permissions using the principal alice after you have set the isPublic property of the video resource bobDogVideo.mp4. In the entities field, there is the attribute isPublic with true as the value.
With reference to the Cedar policy <Allow public access to the resources>, the following authorization request returns ALLOW.
Conclusion
In this post, we showed you what ReBAC is and its benefits and demonstrated the implementation of ReBAC using Amazon Verified Permissions and Amazon Neptune. We also reviewed Cedar policy design patterns and considerations, in addition to the authorization request structure for a ReBAC application. You also saw how to combine ReBAC policies with ABAC policies.
To learn more about this solution and the source code, visit the GitHub repository. For more information, see Cedar Policies, Amazon Verified Permissions, and Amazon Neptune.
If you have feedback about this post, submit comments in the Comments section below. If you have questions about this post, contact AWS Support.
[$] The rest of the 6.12 merge window
Post Syndicated from corbet original https://lwn.net/Articles/991301/
Linus Torvalds released
6.12-rc1 and closed the 6.12 merge window on September 29; at that
point, 11,260 non-merge change sets had been pulled into the mainline for
the 6.12 release. That is the lowest number of merge-window changes since
5.17-rc1 in January 2022, which brought in 11,068 changesets. Nonetheless,
6.12 brings a number of interesting changes, many of which were included in
the roughly 4,500 changes merged since the
summary of the first half of the 6.12 merge window was written.
[$] The WordPress mess
Post Syndicated from jzb original https://lwn.net/Articles/991906/
WordPress is the world’s most
popular open‑source blogging and content‑management platform. In its
20‑plus years of existence, WordPress has been something of a poster
child for open source, similar to Linux and Firefox. It introduced the
concept of open source to millions of bloggers, small‑business owners,
and others who have deployed WordPress to support their web‑publishing
needs. Unfortunately, it is now in the spotlight due to an increasingly
ugly dispute between two companies, Automattic and WP Engine, that has spilled over into
the WordPress community.
AWS Weekly Roundup: Jamba 1.5 family, Llama 3.2, Amazon EC2 C8g and M8g instances and more (Sep 30, 2024)
Post Syndicated from Elizabeth Fuentes original https://aws.amazon.com/blogs/aws/aws-weekly-roundup-jamba-1-5-family-llama-3-2-amazon-ec2-c8g-and-m8g-instances-and-more-sep-30-2024/
Every week, there’s a new Amazon Web Services (AWS) community event where you can network, learn something new, and immerse yourself in the community. When you’re in a community, everyone grows together, and no one is left behind. Last week was no exception. I can highlight the Dutch AWS Community Day where Viktoria Semaan closed with a talk titled How to Create Impactful Content and Build a Strong Personal Brand, and the Peru User Group, who organized two days of talks and learning opportunities: UGCONF & SERVERLESSDAY 2024, featuring Jeff Barr, who spoke about how to Create Your Own Luck. The community events continue, so check them out at Upcoming AWS Community Days.

Last week’s launches
Here are the launches that got my attention.
Jamba 1.5 family of models by AI21 Labs is now available in Amazon Bedrock – The Jamba 1.5 Large and 1.5 Mini models feature a 256k context window, one of the longest on the market, enabling complex tasks like lengthy document analysis. With native support for structured JSON output, function calling, and document processing, they integrate into enterprise workflows for specialized AI solutions. To learn more, read Jamba 1.5 family of models by AI21 Labs is now available in Amazon Bedrock, visit the AI21 Labs in Amazon Bedrock page, and read the documentation.
AWS Lambda now supports Amazon Linux 2023 runtimes in AWS GovCloud (US) Regions – These runtimes offer the latest language features, including Python 3.12, Node.js 20, Java 21, .NET 8, Ruby 3.3, and Amazon Linux 2023. They have smaller deployment footprints, updated libraries, and a new package manager. Additionally, you can also use the container base images to build and deploy functions as a container image.
Amazon SageMaker Studio now supports automatic shutdown of idle applications – You can now enable automatic shutdown of inactive JupyterLab and CodeEditor applications using Amazon SageMaker Distribution image v2.0 or newer. Administrators can set idle shutdown times at domain or user profile levels, with optional user customization. This cost control mechanism helps avoid charges for unused instances and is available across all AWS Regions where SageMaker Studio is offered.
Amazon S3 is implementing a default 128 KB minimum object size for S3 Lifecycle transition rules to any S3 storage class – Reduce transition costs for datasets with many small objects by decreasing transition requests. Users can override the default and customize minimum object sizes. Existing rules remain unchanged, but the new default applies to new or modified configurations.
AWS Lake Formation centralized access control for Amazon Redshift data sharing is now available in 11 additional Regions – Enabling granular permissions management, including table, column, and row-level access to shared Amazon Redshift data. It also supports tag-based access control and trusted identity propagation with AWS IAM Identity Center for improved security and simplified management.
Llama 3.2 generative AI models now available in Amazon Bedrock – The collection includes 90B and 11B parameter multimodal models for sophisticated reasoning tasks, and 3B and 1B text-only models for edge devices. These models support vision tasks, offer improved performance, and are designed for responsible AI innovation across various applications. These models support a 128K context length and multilingual capabilities in eight languages. Learn more about it in Introducing Llama 3.2 models from Meta in Amazon Bedrock.
Share AWS End User Messaging SMS resources across multiple AWS accounts – You can use AWS Resource Access Manager (RAM), to share phone numbers, sender IDs, phone pools, and opt-out lists. Additionally, Amazon SNS now delivers SMS text messages through AWS End User Messaging, offering enhanced features like two-way messaging and granular permissions. These updates provide greater flexibility and control for SMS messaging across AWS services.
AWS Serverless Application Repository now supports AWS PrivateLink – Enabling direct connection from Amazon Virtual Private Cloud (VPC) without internet exposure. This enhances security by keeping communication within the AWS network. Available in all Regions where AWS Serverless Application Repository is offered, it can be set up using the AWS Management Console or AWS Command Line Interface (AWS CLI).
Amazon SageMaker with MLflow now supports AWS PrivateLink for secure traffic routing – Enabling secure data transfer from Amazon Virtual Private Cloud (VPC) to MLflow Tracking Servers within the AWS network. This enhances protection of sensitive information by avoiding public internet exposure. Available in most AWS Regions, it improves security for machine learning (ML) and generative AI experimentation using MLflow.
Introducing Amazon EC2 C8g and M8g Instances – Enhanced performance for compute-intensive and general-purpose workloads. With up to three times more vCPUs, three times more memory, 75 percent more memory bandwidth, and two times more L2 cache, these instances improve data processing, scalability, and cost-efficiency for various applications including high performance computing (HPC), batch processing, and microservices. Read more in Run your compute-
intensive and general purpose workloads sustainably with the new Amazon EC2 C8g, M8g instances.
Llama 3.2 models are now available in Amazon SageMaker JumpStart – These models offer various sizes from 1B to 90B parameters, support multimodal tasks, including image reasoning, and are more efficient for AI workloads. The 1B and 3B models can be fine-tuned, while Llama Guard 3 11B Vision supports responsible innovation and system-level safety. Learn more in Llama 3.2 models from Meta are now available in Amazon SageMaker JumpStart.
For a full list of AWS announcements, be sure to keep an eye on the What’s New at AWS page.
Other AWS news
Here are some additional projects, blog posts, and news items that you might find interesting:
Deploy generative AI agents in your contact center for voice and chat using Amazon Connect, Amazon Lex, and Amazon Bedrock Knowledge Bases – This solution enables low-latency customer interactions, answering queries from a knowledge base. Features include conversation analytics, automated testing, and hallucination detection in a serverless architecture.
How AWS WAF threat intelligence features help protect the player experience for betting and gaming customers – AWS WAF enhances bot protection for betting and gaming. New features include browser fingerprinting, automation detection, and ML models to identify coordinated bots. These tools combat scraping, fraud, distributed denial of service (DDoS) attacks, and cheating, safeguarding player experiences.
How to migrate 3DES keys from a FIPS to a non-FIPS AWS CloudHSM cluster – Learn how to securely transfer Triple Data Encryption Algorithm (3DES) keys from Federal Information Processing Standard (FIPS) hsm1 to non-FIPS hsm2 clusters using RSA-AES wrapping, without backups. This enables using new hsm2.medium instances with FIPS 140-3 Level 3 support, non-FIPS mode, increased key capacity, and mutual TLS (mTLS).
Upcoming AWS events
Check your calendars and sign up for upcoming AWS events:
AWS Summits – Join free online and in-person events that bring the cloud computing community together to connect, collaborate, and learn about AWS. These events offer technical sessions, demonstrations, and workshops delivered by experts. There is only one event left that you can still register for: Ottawa (October 9).
AWS Community Days – Join community-led conferences featuring technical discussions, workshops, and hands-on labs driven by expert AWS users and industry leaders from around the world. Upcoming AWS Community Days are scheduled for October 3 in the Netherlands and Romania, and on October 5 in Jaipur, Mexico, Bolivia, Ecuador, and Panama. I’m happy to share with you that I will be joining the Panama community on October 5.
AWS GenAI Lofts – Collaborative spaces and immersive experiences that showcase AWS’s expertise with the cloud and AI, while providing startups and developers with hands-on access to AI products and services, exclusive sessions with industry leaders, and valuable networking opportunities with investors and peers. Find a GenAI Loft location near you and don’t forget to register. I’ll be in the San Francisco lounge with some demos on October 15 at the Gen AI Developer Day. If you’re attending, feel free to stop by and say hello!
Browse all upcoming AWS led in-person and virtual events and developer-focused events.
That’s all for this week. Check back next Monday for another Weekly Roundup!
Thanks to Dmytro Hlotenko and Diana Alfaro for the photos of their community events.
— Eli
This post is part of our Weekly Roundup series. Check back each week for a quick roundup of interesting news and announcements from AWS!