Post Syndicated from Explosm.net original https://explosm.net/comics/spiders
New Cyanide and Happiness Comic
Post Syndicated from Explosm.net original https://explosm.net/comics/spiders
New Cyanide and Happiness Comic
Post Syndicated from Eric Johnson original https://aws.amazon.com/blogs/compute/introducing-support-for-read-only-management-events-in-amazon-eventbridge/
This post is written by Pawan Puthran, Principal Specialist TAM, Serverless and Heeki Park, Principal Solutions Architect, Serverless
Today, AWS is announcing support for read-only management events in Amazon EventBridge. This feature enables customers to build rich event-driven responses from any action taken on AWS infrastructure to detect security vulnerabilities or identify suspicious activity in near real-time. You can now gain insight into all activity across all your AWS accounts and respond to those events as is appropriate.
EventBridge is a serverless event bus used to decouple event producers and consumers. Event producers publish events onto an event bus, which then uses rules to determine where to send those events. The rules determine the downstream targets that receive and process the events, and EventBridge routes the events accordingly.
EventBridge allows customers to monitor, audit, and react, in near real-time, to changes in their AWS environments through events generated by AWS CloudTrail for AWS API calls. CloudTrail records actions taken by a user, role, or an AWS service as events in a trail. Events include actions taken in the AWS Management Console, AWS Command Line Interface (CLI), and AWS SDKs and APIs.
Previously, only mutating API calls are published from CloudTrail to EventBridge for control plane changes. Events for mutating API calls include those that create, update, or delete resources. Control plane changes are also referred to as management events. EventBridge now supports non-mutating or read-only API calls for management events at no additional cost. These include those that list, get, or describe resources.
CloudTrail events in EventBridge enable you to build rich event-driven responses from any action taken on AWS infrastructure in real time. Previously, customers and partners often used a polling model to iterate over a batch of CloudTrail logs from Amazon S3 buckets to detect issues, making it slower to respond. The launch of read-only management events enables you to detect and remediate issues in near real-time and thus improve the overall security posture.
You can start receiving read-only management events if a CloudTrail is configured in your account and if the event selector for that CloudTrail is configured with ReadWriteType of either All or ReadOnly. This ensures that the read-only management events are logged in the CloudTrail and are then passed to EventBridge.
For example, you can receive an alert if a production account lists resources from an IP address outside of your VPC. Another example could be if an entity, such as a principal (AWS account root user, IAM role, or IAM user), calls the ListInstanceProfilesForRole or DescribeInstances APIs without any prior record of doing so. A malicious actor could use stolen credentials for conducting this reconnaissance to find more valuable credentials or determine the capabilities of the credentials they have.
To enable read-only management events with an EventBridge rule, in addition to the existing mutating events, use the new ENABLED_WITH_ALL_CLOUDTRAIL_MANAGEMENT_EVENTS state when creating the rule.
Resources:
  SampleMgmtRule:
    Type: 'AWS::Events::Rule'
    Properties:
      Description: 'Example for enabling read-only management events'
      State: ENABLED_WITH_ALL_CLOUDTRAIL_MANAGEMENT_EVENTS
      EventPattern:
        source:
          - aws.s3
        detail:
          - AWS API Call via CloudTrail
      Targets:
        - Arn: 'arn:aws:sns:us-east-1:123456789012:notificationTopic'
          Id: 'NotificationTarget'
You can also create a rule on an event bus to specify a particular API action by using the eventName attribute under the detail key:
aws events put-rule --name "SampleTestRule" \
--event-pattern '{"detail": {"eventName": ["ListBuckets"]}}' \
--state ENABLED_WITH_ALL_CLOUDTRAIL_MANAGEMENT_EVENTS --region us-east-1
The following section describes a couple of the scenarios where you can set up EventBridge rules and take actions on non-mutating or read-only management events.
Consider the security team of your organization that wants a notification whenever GetSecretValue API calls for AWS Secrets Manager are made through the CLI. They can then investigate if these calls are made by entities outside their organization or by an unauthorized user and take corrective actions to deny such requests.
When the application calls the GetSecretValue API to retrieve the secrets via a CLI, it generates an event like this:
{
    "version": "0",
    "id": "d3368cc1-e6d6-e4bf-e58e-030f03b6eae3",
    "detail-type": "AWS API Call via CloudTrail",
    "source": "aws.secretsmanager",
    "account": "111111111111",
    "time": "2023-11-08T19:58:38Z",
    "region": "us-east-1",
    "resources": [],
    "detail": {
        "eventVersion": "1.08",
        "userIdentity": {
            "type": "IAMUser",
            "principalId": "AAAAAAAAAAAAA",
            "arn": "arn:aws:iam:: 111111111111:user/USERNAME"
            // ... additional detail fields
        },
        "eventTime": "2023-11-08T19:58:38Z",
        "eventSource": "secretsmanager.amazonaws.com",
        "eventName": "GetSecretValue",
        "awsRegion": "us-east-1",
        "userAgent": "aws-cli/2.13.15 Python/3.11.4 Darwin/22.6.0 exe/x86_64 prompt/off command/secretsmanager.get-secret-value"
        // ... additional detail fields
    }
}
You set the following event pattern on the rule to filter incoming events to specific consumers. This example also uses the recently launched wildcard filter for event matching.
{
    "source": [
        "aws.secretsmanager"
    ],
    "detail-type": [
        "AWS API Call via CloudTrail"
    ],
    "detail": {
        "eventName": [
            "GetSecretValue"
        ],
        "userAgent": [
            {
                "wildcard": "aws-cli/*"
            }
        ]
    }
}
You can create a rule matching a combination of these event properties. In this case, you are matching for aws.secretsmanager as source, AWS API Call via CloudTrail as detail-type, GetSecretValue as detail.eventName and wildcard pattern on detail.userAgent for aws-cli/*. You can filter detail.userAgent with a wildcard to catch events that come from a particular application or user.
You can then route these events to a target like an Amazon CloudWatch Logs stream to record the change. You can also route them to Amazon SNS to get notified via email subscription. You can alternatively route them to an AWS Lambda function in which you perform custom business logic.
aws events put-rule --name "monitor-secretsmanager" \
--event-pattern '{"source": ["aws.secretsmanager"], "detail-type": ["AWS API Call via CloudTrail"], "detail": {"eventName": ["GetSecretValue"], "userAgent": [{ "wildcard": "aws-cli/*"} ]}}' \
--state ENABLED_WITH_ALL_CLOUDTRAIL_MANAGEMENT_EVENTS --region us-east-1
Rule details
aws events put-targets --rule monitor-secretsmanager --targets Id=1,Arn=arn:aws:logs:us-east-1:ACCOUNT_ID:log-group:/aws/events/getsecretvaluelogs --region us-east-1
Target details
You can then use CloudWatch Log Insights to search and analyze log data using the CloudWatch Log Insights query syntax where you can retrieve the user who performed these calls.
Consider the security or data perimeter team who wants to secure data residing in Amazon S3 buckets. The team requires notifications whenever API calls to list S3 buckets or to list S3 objects are made.
When a user or application calls the ListBuckets API to discover the available buckets, it generates the following CloudTrail event:
{
    "version": "0",
    "id": "345ca690-6510-85b2-ff02-090493a33cf1",
    "detail-type": "AWS API Call via CloudTrail",
    "source": "aws.s3",
    "account": "111111111111",
    "time": "2023-11-14T17:25:30Z",
    "region": "us-east-1",
    "resources": [],
    "detail": {
        "eventVersion": "1.09",
        "userIdentity": {
            "type": "IAMUser",
            "principalId": "principal-identity-uuid",
            "arn": "arn:aws:iam::111111111111:user/exploited-user",
            "accountId": "111111111111",
            "accessKeyId": "AAAABBBBCCCCDDDDEEEE",
            "userName": "exploited-user"
        },
        "eventTime": "2023-11-14T17:25:30Z",
        "eventSource": "s3.amazonaws.com",
        "eventName": "ListBuckets",
        "awsRegion": "us-east-1",
        "sourceIPAddress": "11.22.33.44",
        "userAgent": "[aws-cli/2.13.29 Python/3.11.6 Darwin/22.6.0 exe/x86_64 prompt/off command/s3api.list-buckets]",
        "requestParameters": {
            "Host": "s3.us-east-1.amazonaws.com"
        },
        "readOnly": true,
        "eventType": "AwsApiCall",
        "managementEvent": true
        // additional detail fields
    }
}
In this scenario, you can create an EventBridge rule matching for aws.s3 for the source field, and ListBuckets for the eventName.
{
    "source": [
        "aws.s3"
    ],
    "detail-type": [
        "AWS API Call via CloudTrail"
    ],
    "detail": {
        "eventName": [
            "ListBuckets "
        ]
    }
}
However, listing objects alone might only be the beginning of a potential data exfiltration attempt. You may also want to check for ListObjects or ListObjectsV2 as the next action, followed by a large number of GetObject API calls. You can create the following rule to match those actions.
{
    "source": [
        "aws.s3"
    ],
    "detail-type": [
        "AWS API Call via CloudTrail"
    ],
    "detail": {
        "eventName": [
            "ListObjects",
            "ListObjectsV2",
            "GetObject"
        ]
    }
}
You could potentially forward this log information to your central security logging solution or use anomaly detection machine learning models to evaluate these events to determine the appropriate response to these events.
You can also create rules to receive the read-only events to cross account or cross-Region to centralize your AWS events into one Region or one AWS account for auditing and monitoring purposes. For example, capture all workload events from multiple Regions in eu-west-1 for compliance reporting.

Cross Account example for default event bus and custom event bus
To do this, create a rule using the new ENABLED_WITH_ALL_CLOUDTRAIL_MANAGEMENT_EVENTS state on the default bus of the source account or the Region, targeting either default event bus or a custom event bus of the target account or Region. You must also ensure you have a rule configured with ENABLED_WITH_ALL_CLOUDTRAIL_MANAGEMENT_EVENTS to be able to invoke the targets in the destination account or Region.

Cross-Region setup for CloudTrail read-only events
This blog shows how customers can build rich event-driven responses with the newly launched support for read-only events. You can now observe events as potential signals of reconnaissance and data exfiltration activities from any action taken on AWS infrastructure in near real time. You can also use the cross-Region and cross-account functionality to deliver the read-only events to a centralized AWS account or Region, enhancing the capability for auditing and monitoring across all your AWS environments.
For more serverless learning resources, visit Serverless Land.
Post Syndicated from Brian Beach original https://aws.amazon.com/blogs/devops/using-amazon-codecatalyst-with-amazon-virtual-private-cloud/
Amazon CodeCatalyst is an integrated service for software development teams adopting continuous integration and deployment practices into their software development process. CodeCatalyst puts the tools you need all in one place. You can plan work, collaborate on code, and build, test, and deploy applications with continuous integration/continuous delivery (CI/CD) tools. You can also integrate AWS resources with your projects by connecting your AWS accounts to CodeCatalyst spaces.
CodeCatalyst recently announced support for Amazon Virtual Private Cloud (Amazon VPC). Amazon VPC is a logically isolated virtual network that you’ve defined. This virtual network closely resembles a traditional network that you’d operate in your own data center, with the benefits of using the scalable infrastructure of AWS. VPC connectivity from CodeCatalyst allows you to publish a package to an artifact repository in a private subnet, query an Amazon Relational Database Service (Amazon RDS) in a private subnet, deploy an update to Amazon Elastic Kubernetes Service (Amazon EKS) in a private subnet, and much more. In this post I will show you how to deploy changes to an Amazon Aurora database in a private Subnet using CodeCatalyst.
CodeCatalyst now allows you to create a VPC connection associated with an AWS Account. A VPC connection is a CodeCatalyst resource which contains all of the configuration needed to access a VPC. Space administrators can add their own VPC connections in the Amazon CodeCatalyst console on behalf of space members. Once created, members of the space can use the VPC connection in their projects.
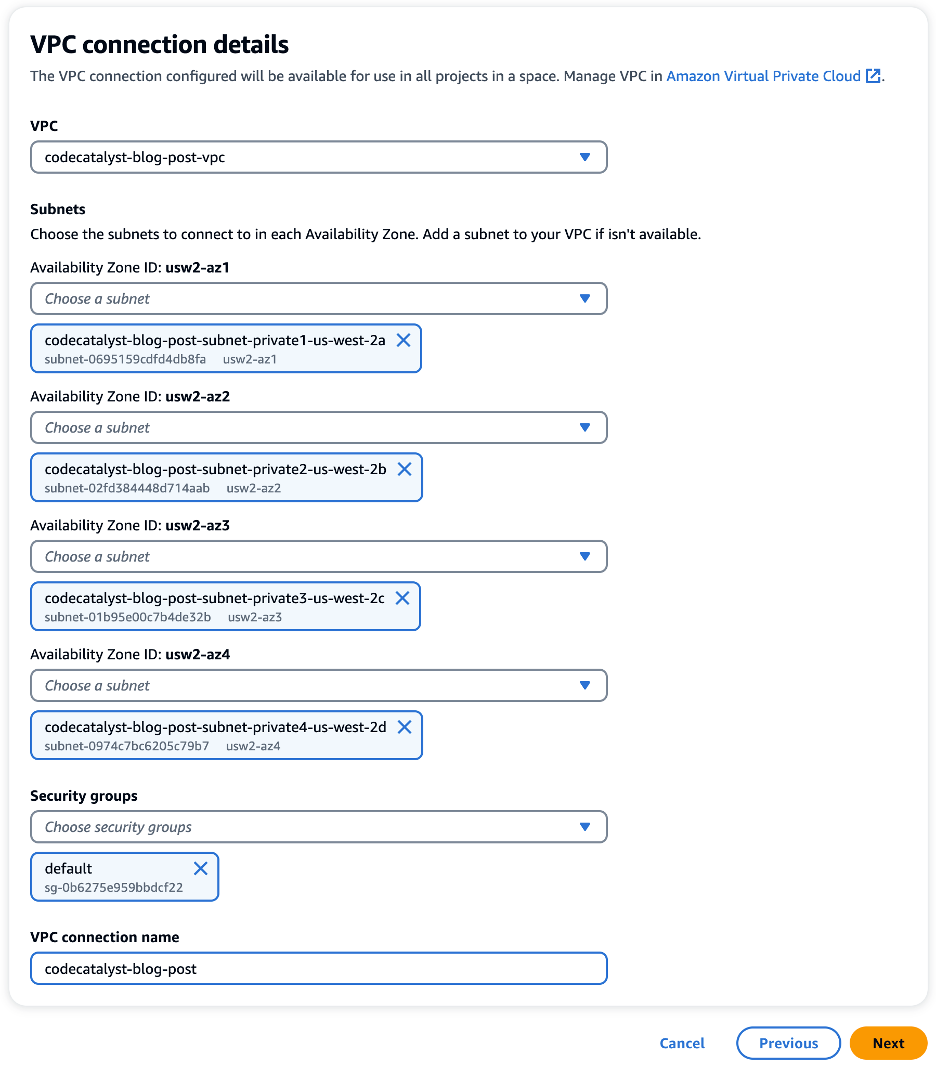
For this walkthrough, I have created a VPC in the us-west-2 region. My VPC has both a private and public subnet in each Availability Zone (AZ) . Next, I created a VPC connection in CodeCatalyst. In the following image, I have configured a VPC connection with a private subnet in each of the four AZs. In addition, I have added a security group that will be associated with resources that use this VPC connection allowing me to controls the traffic that is allowed to reach and leave the resources.
Before we move on, let’s take a moment to discuss how CodeCatalyst VPC connections work. When CodeCatalyst creates a workflow, an elastic network interface (ENI) is added to your VPC as shown in the following image. Note that the image shows two subnets a single availability zone for simplicity. However, as discussed earlier, the VPC used in this walkthrough has eight subnets in four availability zones.
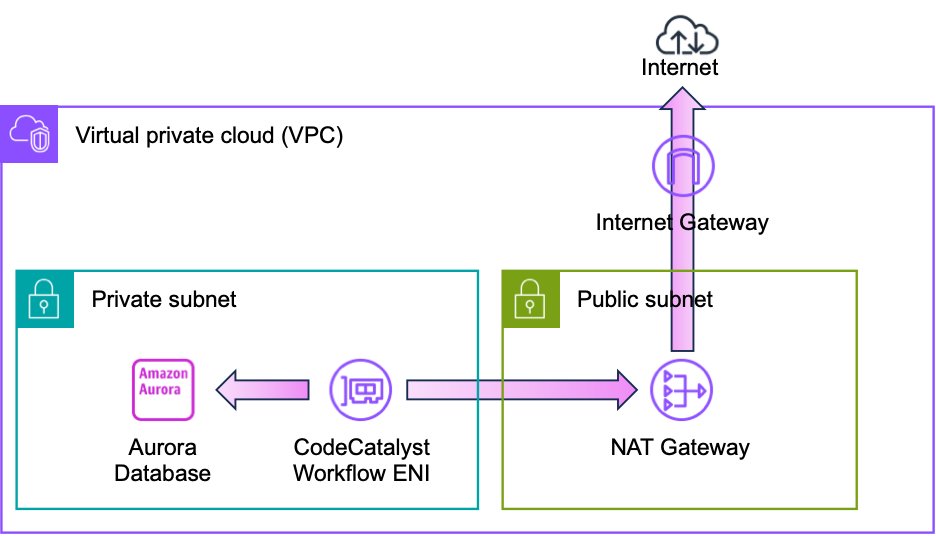
CodeCatalyst can now use this ENI to access private resources in the VPC. For example, an Amazon Aurora database. It is important to note that the ENI does not have a public IP address. Therefore, I have provided a path to the internet. Internet connectivity allows CodeCatalyst to access the APIs as well as publicly available repositories such as GitHub, PyPI, NPM, Docker Hub, et cetera. In this example, I use a NAT gateway for internet access, but I will discuss advanced network topologies later in this post.
With the VPC connection in place, I can also use the VPC connection in a workflow. Amazon CodeCatalyst workflows are continuous integration and continuous delivery (CI/CD) pipelines that enable you to easily build, test and deploy applications. CodeCatalyst Workflows help you reliably deliver high-quality application updates frequently, quickly and securely. CodeCatalyst allows you to quickly assemble and configure actions – including GitHub Actions – to compose workflows that automate your CI/CD pipeline, test reporting, and other manual processes. You can learn more about CodeCatalyst workflows in the CodeCatalyst User Guide.
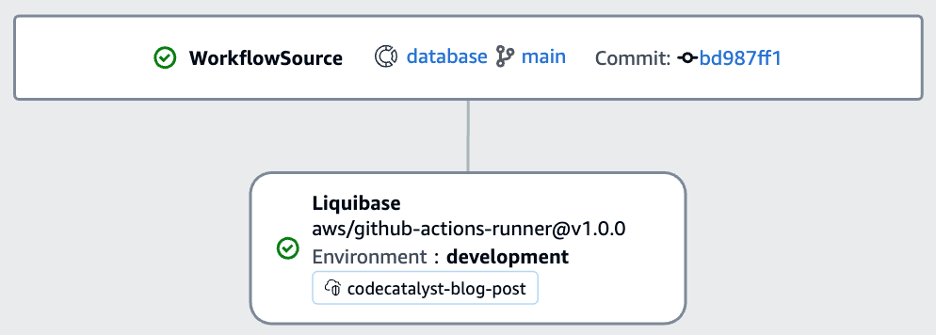
As a database developer, my workflow often needs to update the schema of the Aurora database. For this walkthrough, I will use Liquibase to deploy a schema change to the Aurora PostgreSQL database. If you are not familiar with Liquibase, you can refer to my prior post on Running GitHub Actions in a private Subnet with AWS CodeBuild for an overview. CodeCatalyst allows you to use GitHub Actions alongside native CodeCatalyst actions in a CodeCatalyst workflow. I will use the Liquibase Update GitHub Action as shown in the following image.
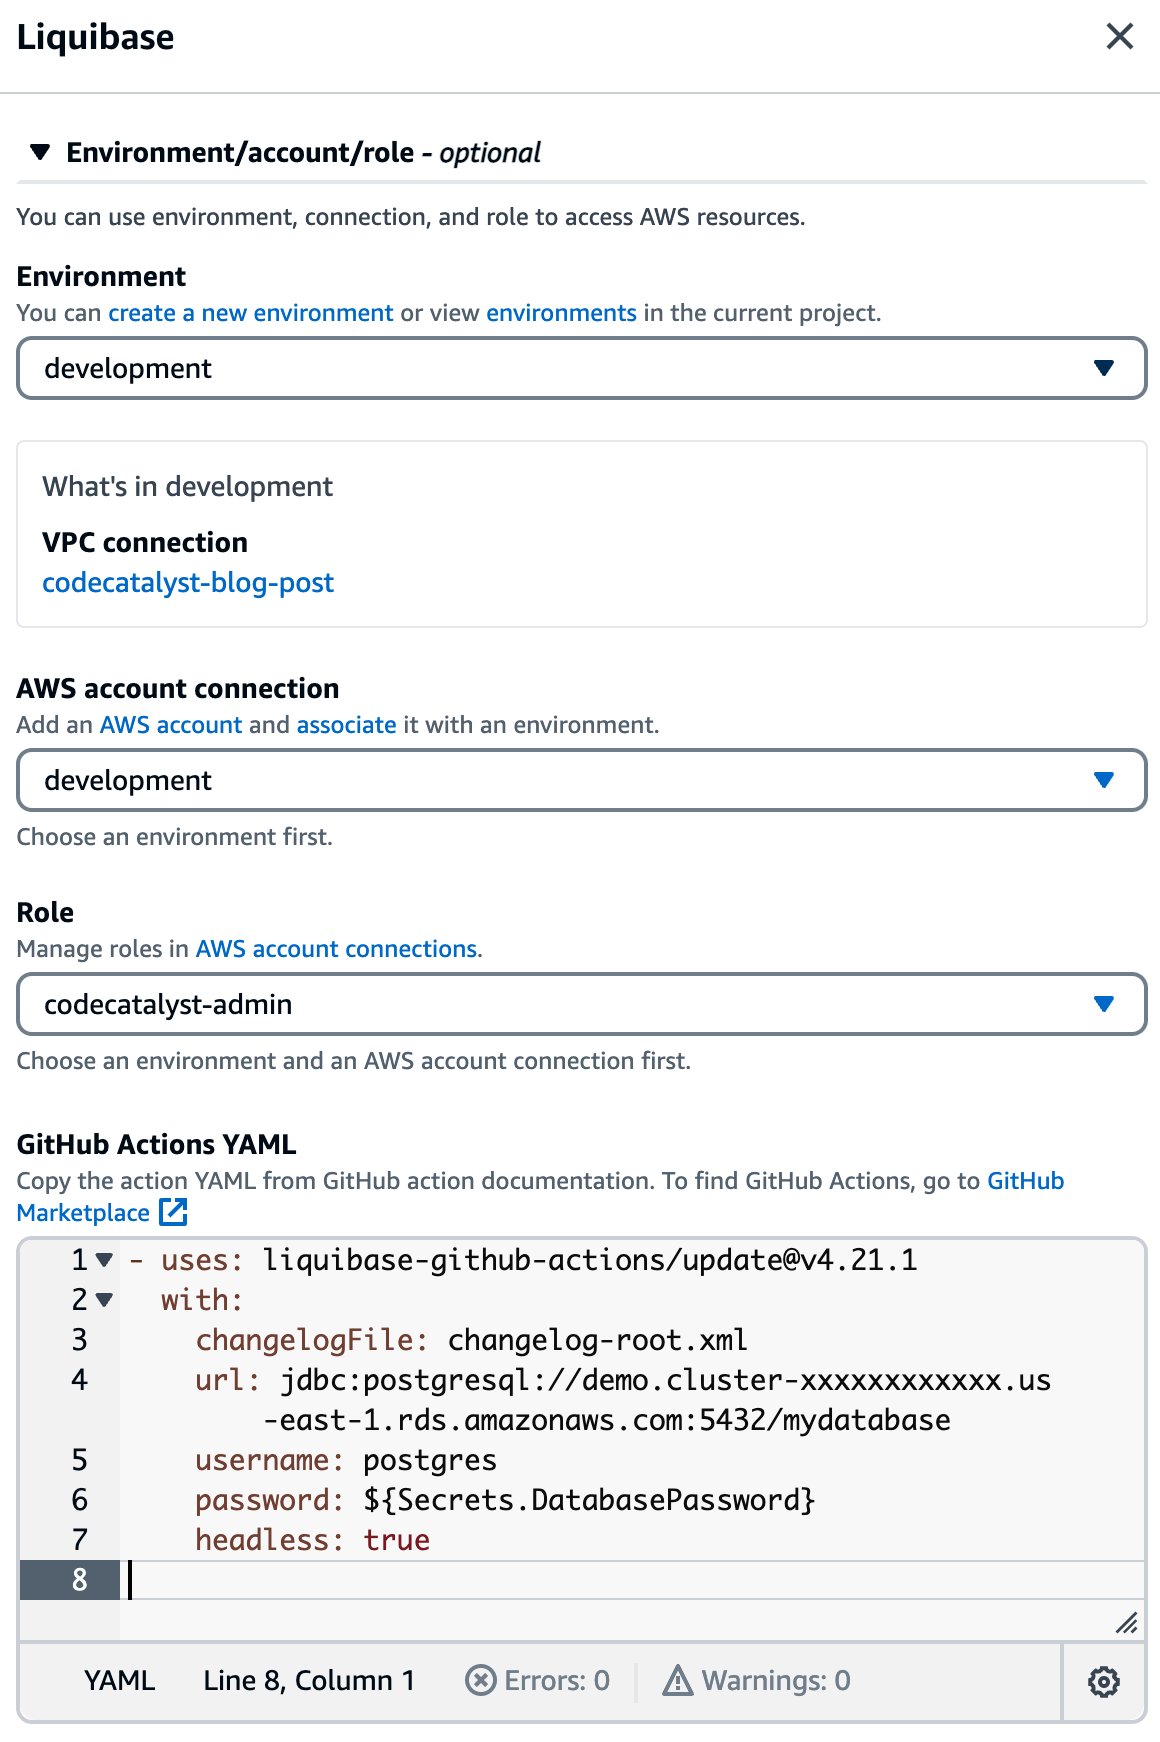
If I edit the Liquibase action, I can see the details of the configuration as shown in the following image. You will notice that I have selected the codecatalyst-blog-post VPC connection in the environment configuration. This will allow the Liquibase action to access private resources in my VPC including the Aurora database. Also notice how easy it is to incorporate a GitHub action in my workflow through the YAML configuration. Finally, notice that I can access CodeCatalyst secrets, such as the password, in my configuration.
When I save the workflow and run it, you can see that the Liquibase action is able to successfully connect to the database. Note that in this example, there were no pending changes, so Liquibase reports “Database is up to date, no changesets to execute.”
####################################################
##   _     _             _ _                      ##
##  | |   (_)           (_) |                     ##
##  | |    _  __ _ _   _ _| |__   __ _ ___  ___   ##
##  | |   | |/ _` | | | | | '_ \ / _` / __|/ _ \  ##
##  | |___| | (_| | |_| | | |_) | (_| \__ \  __/  ##
##  \_____/_|\__, |\__,_|_|_.__/ \__,_|___/\___|  ##
##              | |                               ##
##              |_|                               ##
##                                                ##
##  Get documentation at docs.liquibase.com       ##
##  Get certified courses at learn.liquibase.com  ##
##  Free schema change activity reports at        ##
##      https://hub.liquibase.com                 ##
##                                                ##
####################################################
Starting Liquibase at 13:04:37 (version 4.21.1 #9070)
Liquibase Version: 4.21.1
Liquibase Open Source 4.21.1 by Liquibase
Database is up to date, no changesets to execute

UPDATE SUMMARY
Run:                          0
Previously run:               2
Filtered out:                 0
-------------------------------
Total change sets:            2

Liquibase command 'update' was executed successfully.
Obviously, a database is just one possible example. There are many private resources that I may need to access as a developer. A few more examples include: Amazon Elastic Compute Cloud (Amazon EC2) instances, Amazon Elastic File System (EFS) shares, and Amazon ElastiCache clusters among many others.
At the beginning of this post, I introduced a simple VPC with public and private subnets, and a NAT gateway. However, CodeCatalyst will work with more complex VPC topologies that are common among enterprise customers. For example, imagine that my application is deployed across multiple regions for both improved availability and lower latency. However, I prefer to manage all of CodeCatalyst projects in a single region, us-west-2, close to the developers.
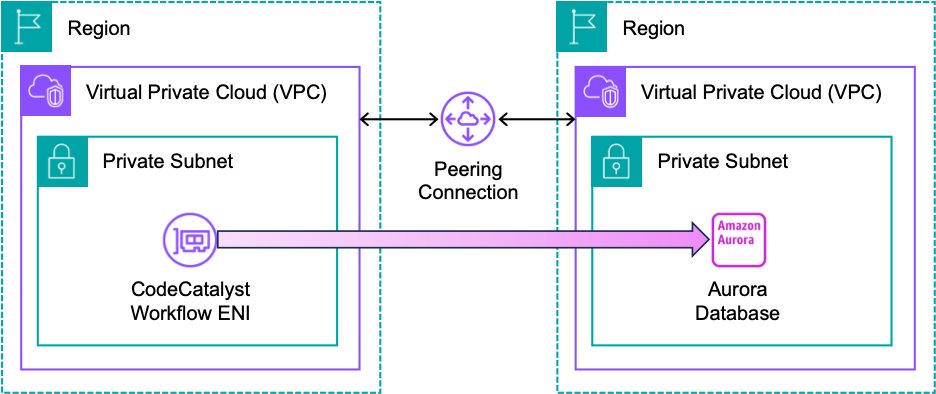
As a result, CodeCatalyst workflows all run in us-west-2. This does not mean that I can only deploy changes to the same region as the CodeCatalyst project. CodeCatalyst can use the full complement of VPC features. For example, in the following architecture, I am using VPC peering to allow CodeCatalyst to update an Aurora database in another region. The workflow is identical to the version I created previously, other than changing the Aurora endpoint, and possibly the username and password. Note that I still have an internet connection which I have omitted from this diagram for simplicity.
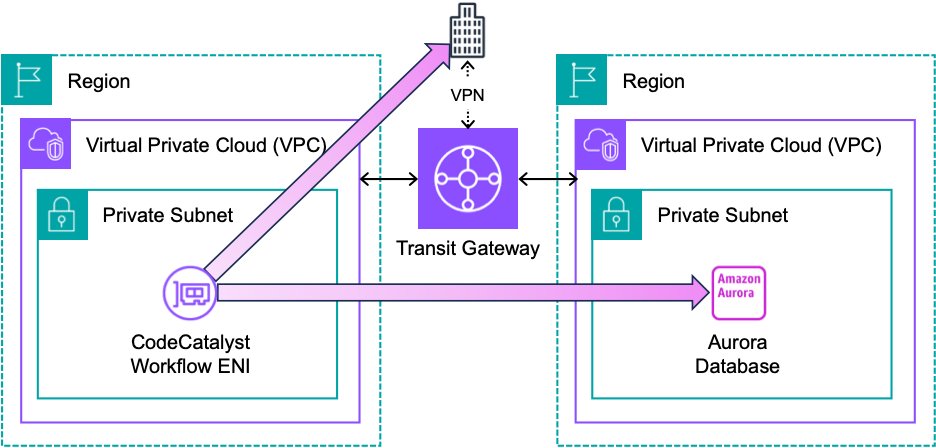
Alternatively, I could use an AWS Transit Gateway (TGW) rather than a peering connection as shown in the following architecture. CodeCatalyst can use the TGW to update resources in another region. Furthermore, CodeCatalyst can leverage a VPN connection associated with the TGW to update resources hosted outside of AWS. For example, I could deploy a change to a database hosted in an on-prem datacenter. Note that I have omitted the internet connection from this diagram for simplicity.
These are just a few examples of the advanced networking topologies that you can use with CodeCatalyst. You can read more about planning your network topology in the Reliability Pillar of the AWS Well-Architected Framework.
Amazon CodeCatalyst VPC connections allow you to access resources in a private subnet from your workflows. In this post, I configured a VPC connection to deploy schema changes using Liquibase. I also discussed some advanced network topologies that allow you to update resources in other regions. You can learn more about CodeCatalyst VPC connections in the CodeCatalyst User Guide
Post Syndicated from Bruce Schneier original https://www.schneier.com/blog/archives/2023/11/friday-squid-blogging-unpatched-vulnerabilities-in-the-squid-caching-proxy.html
In a rare squid/security post, here’s an article about unpatched vulnerabilities in the Squid caching proxy.
As usual, you can also use this squid post to talk about the security stories in the news that I haven’t covered.
Read my blog posting guidelines here.
Post Syndicated from Pablo Pagani original https://aws.amazon.com/blogs/security/download-aws-security-hub-csv-report/
AWS Security Hub provides a comprehensive view of your security posture in Amazon Web Services (AWS) and helps you check your environment against security standards and best practices. In this post, I show you a solution to export Security Hub findings to a .csv file weekly and send an email notification to download the file from Amazon Simple Storage Service (Amazon S3). By using this solution, you can share the report with others without providing access to your AWS account. You can also use it to generate assessment reports and prioritize and build a remediation roadmap.
When you enable Security Hub, it collects and consolidates findings from AWS security services that you’re using, such as threat detection findings from Amazon GuardDuty, vulnerability scans from Amazon Inspector, S3 bucket policy findings from Amazon Macie, publicly accessible and cross-account resources from AWS Identity and Access Management Access Analyzer, and resources missing AWS WAF coverage from AWS Firewall Manager. Security Hub also consolidates findings from integrated AWS Partner Network (APN) security solutions.
Cloud security processes can differ from traditional on-premises security in that security is often decentralized in the cloud. With traditional on-premises security operations, security alerts are typically routed to centralized security teams operating out of security operations centers (SOCs). With cloud security operations, it’s often the application builders or DevOps engineers who are best situated to triage, investigate, and remediate security alerts.
This solution uses the Security Hub API, AWS Lambda, Amazon S3, and Amazon Simple Notification Service (Amazon SNS). Findings are aggregated into a .csv file to help identify common security issues that might require remediation action.
This solution assumes that Security Hub is enabled in your AWS account. If it isn’t enabled, set up the service so that you can start seeing a comprehensive view of security findings across your AWS accounts.
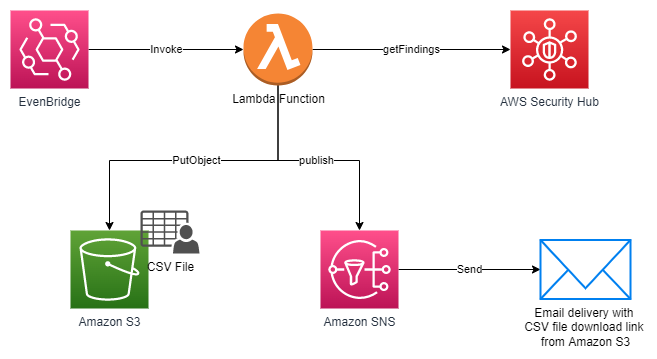
Figure 1: Solution overview, deployed through AWS CloudFormation
Note: You can extend the report by modifying the Lambda function to add fields as needed.
The solution provided with this blog post consists of an AWS CloudFormation template named security-hub-full-report-email.json that deploys the following resources:

Figure 2: SNS topic created by the solution

Figure 3: SNS email subscription

Figure 4: Lambda function created by the solution

Figure 5: Permissions policy for the Lambda function

Figure 6: Example of the EventBridge schedule created by the solution
Use the following steps to deploy this solution in a single AWS account. If you have a Security Hub administrator account or are using Security Hub cross-Region aggregation, the report will get the findings from the linked AWS accounts and Regions.

Figure 7: Create stack with new resources

Figure 8: Specify S3 URL for CloudFormation template

Figure 9: Enter stack name and parameters
You can send a test email after the deployment is complete. To do this, open the Lambda console and locate the SendSecurityHubFullReportEmail Lambda function. Perform a manual invocation with an event payload to receive an email within a few minutes. You can repeat this procedure as many times as you want.
In this post I’ve shown you an approach for rapidly building a solution for sending weekly findings report of the security posture of your AWS account as evaluated by Security Hub. This solution helps you to be diligent in reviewing outstanding findings and to remediate findings in a timely way based on their severity. You can extend the solution in many ways, including:
To learn more about how to set up and customize Security Hub, see these additional blog posts.
If you have feedback about this post, submit comments in the Comments section below. If you have any questions about this post, start a thread on the AWS Security Hub re:Post forum.
Want more AWS Security news? Follow us on Twitter.
Post Syndicated from Darshit Thakkar original https://aws.amazon.com/blogs/big-data/speed-up-queries-with-cost-based-optimizer-in-amazon-athena/
Amazon Athena is a serverless, interactive analytics service built on open source frameworks, supporting open table file formats. Athena provides a simplified, flexible way to analyze petabytes of data where it lives. You can analyze data or build applications from an Amazon Simple Storage Service (Amazon S3) data lake and 30 data sources, including on-premises data sources or other cloud systems using SQL or Python. Athena is built on open source Trino and Presto engines and Apache Spark frameworks, with no provisioning or configuration effort required.
Starting today, the Athena SQL engine uses a cost-based optimizer (CBO), a new feature that uses table and column statistics stored in the AWS Glue Data Catalog as part of the table’s metadata. By using these statistics, CBO improves query run plans and boosts the performance of queries run in Athena. Some of the specific optimizations CBO can employ include join reordering and pushing aggregations down based on the statistics available for each table and column.
TPC-DS benchmarks These benchmarks demonstrate the power of the cost-based optimizer—queries run up to 2x times faster with CBO enabled compared to running the same TPC-DS queries without CBO.
We used the industry-standard TPC-DS 3 TB to represent different customer use cases. These are representative of workloads with 10 times the stated benchmark size. This means a 3 TB benchmark dataset accurately represents customer workloads on 30–50 TB datasets.
In our testing, the dataset was stored in Amazon S3 in non-compressed Parquet format and the AWS Glue Data Catalog was used to store metadata for databases and tables. Fact tables were partitioned on the date column used for join operations, and each fact table consisted of 2,000 partitions. To help illustrate the performance of CBO, we compare the behavior of various queries and highlight the performance differences between running with CBO enabled vs. disabled.
The following graph illustrates the runtime of queries on the engine with and without CBO.

The following graph presents the top 10 queries from the TPC-DS benchmark with the greatest performance improvement.

Let’s discuss some of the cost-based optimization techniques that contributed to improved query performance.
Join reordering, an optimization technique used by cost-based SQL optimizers, analyzes different join sequences to select the order that minimizes query runtime by reducing intermediate data processed at each step, lowering memory and CPU requirements.
Let’s talk about query 82 of the TPC-DS 3TB dataset. The query performs inner joins on four tables: item, inventory, date_dim, and store_sales. The store_sales table has 8.6 billion rows and is partitioned by date. The inventory table has 1 billion rows and is also partitioned by date. The item table contains 360,000 rows, and the date_dim table holds 73,000 rows.
Query 82
Without using CBO, the engine will determine the join order based on the sequence of tables defined in the input query with internal heuristics. The FROM clause of the input query is "from item, inventory, date_dim, store_sales" (all inner joins). After passing through internal heuristics, Athena chose the join order as ((item ⋈ (inventory ⋈ date_dim)) ⋈ store_sales). Despite store_sales being the largest fact table, it’s defined last in the FROM clause and therefore gets joined last. This plan fails to reduce the intermediate join sizes as early as possible, resulting in an increased query runtime. The following diagram shows the join order without CBO and the number of rows flowing through different stages.

When using CBO, the optimizer determines the best join order using a variety of data, including statistics as well as join size estimation, join build side, and join type. In this instance, Athena’s selected join order is ((store_sales ⋈ item) ⋈ (inventory ⋈ date_dim)). The largest fact table, store_sales, without being shuffled, is first joined with the item dimension table. The other partitioned table, inventory, is also first joined in-place with the date_dim dimension table. The join with the dimension table acts as a filter on the fact table, which dramatically reduces the input data size of the join that follows. Note that which side a table resides for a join is significant in Athena, because it’s the table on the right that will be built into memory for the join operation. Therefore, we always want to keep the larger table on the left and the smaller table on the right. CBO chose a plan that the left side was 8.6 billion before, and now it’s 13.6 million.
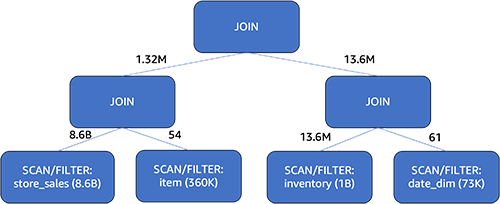
With CBO, the query runtime improved by 25% (from 15 seconds down to 11 seconds) by choosing the optimal join order.
Next, let’s discuss another CBO technique.
Aggregation pushdown is an optimization technique used by query optimizers to improve performance. It involves pushing aggregation operations like SUM, COUNT, and AVG into an earlier stage in the query plan, while maintaining the same query semantics. This reduces the amount of data transferred between the stages. By minimizing data processing, aggregation pushdown decreases memory usage, I/O costs, and network traffic.
However, pushing down aggregation is not always beneficial. It depends on the data distribution. For example, grouping on a column with many rows but few distinct values (like gender) before joins works better. Grouping first means aggregating a large number of records into fewer records (just male, female, for example). Grouping after joining means a large number of records have to participate the join before being aggregated. On the other hand, grouping on a high cardinality column is better done after joins. Doing it before risks unnecessary aggregation overhead because each value is likely unique anyway and that step will not result in an earlier reduction in the amount of data transferred between intermediate stages.
Therefore, whether to push down aggregation should be a cost-based decision. Let’s take example of the query 2 run on a 3TB TPC-DS dataset, showing how the aggregation pushdown’s value depends on data distribution. The web_sales table has 2.1 billion rows and the catalog_sales table has 4.23 billion rows. Both tables are partitioned on the date column.
Query 2
Athena first joins the result of the union all operation on the web_sales table and the catalog_sales table with another table. Only then does it perform aggregation on the joined results. In this example, the amount of data that needed to be joined was huge, resulting in a longer query runtime.

Athena utilizes one of the statistics values, the distinct value count, to evaluate the cost implications of pushing down the aggregation vs. not doing so. When a column has many rows but few distinct values, CBO is more likely to push aggregation down. This shrank the qualified rows from web_sales and catalog_sales tables to 2,590 and 3,590 rows, respectively. These aggregated records were then unioned and used to join with the tables. Comparing to the plan without CBO, the records participating in the join from the two large tables dropped from 6.33 billion rows (2.1 billion + 4.23 billion) to just 6,180 rows (2,590 + 3,590). This significantly decreased query runtime.
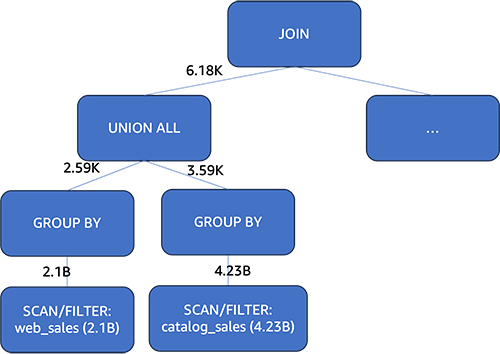
With CBO, the query runtime improved by 50% (from 37 seconds down to 18 seconds). In summary, CBO helped Athena choose an optimal aggregation pushdown plan, cutting the query time in half compared to not using cost-based optimization.
In this post, we discussed how Athena uses a cost-based optimizer (CBO) in its engine v3 to use table statistics for generating more efficient query run plans. Testing on the TPC-DS benchmark showed an 11% improvement in overall query performance when using CBO compared to without it.
Two key optimization employed by CBO are join reordering and aggregate pushdown. Join reordering reduces intermediate data by intelligently picking the order to join tables based on statistics. Aggregate pushdown decreases intermediate data by pushing aggregations earlier in the plan when beneficial.
In summary, Athena’s new cost-based optimizer significantly speeds up queries by choosing superior run plans. CBO optimizes based on table statistics stored in the AWS Glue Data Catalog. This automatic optimization improves productivity for Athena users through more responsive query performance. To take advantage of optimization techniques of CBO, refer to working with column statistics to generate statistics on the tables and columns in the AWS Glue Data Catalog.
 Darshit Thakkar is a Technical Product Manager with AWS and works with the Amazon Athena team based out of Boston, Massachusetts.
 Wei Zheng is a Sr. Software Development Engineer with Amazon Athena. He joined AWS in 2021 and has been working on multiple performance improvements on Athena.
 Chuho Chang is a Software Development Engineer with Amazon Athena. He has been working on query optimizers for over a decade.
 Pathik Shah is a Sr. Analytics Architect on Amazon Athena. He joined AWS in 2015 and has been focusing in the big data analytics space since then, helping customers build scalable and robust solutions using AWS analytics services.
Post Syndicated from Spencer McIntyre original https://blog.rapid7.com/2023/11/17/metasploit-weekly-wrap-up-36/
Metasploit has support for running with a local database, or from a remote web service which can be initialized with msfdb init --component webservice. Future versions of Metasploit Framework may remove the msfdb remote webservice. Users that leverage this functionality are invited to react on an issue currently on GitHub to inform the maintainers that the feature is used.
Authors: UnblvR and whotwagner
Type: Exploit
Pull request: #18434 contributed by whotwagner
Path: unix/webapp/zoneminder_snapshots
Description: This PR adds an exploit module for an unauthenticated remote code execution vulnerability in the video surveillance software Zoneminder (CVE-2023-26035).
modules/payload/android/meterpreter/reverse_tcp.md example to use the correct flags when generating a payload.You can always find more documentation on our docsite at docs.metasploit.com.
As always, you can update to the latest Metasploit Framework with msfupdate
and you can get more details on the changes since the last blog post from
GitHub:
If you are a git user, you can clone the Metasploit Framework repo (master branch) for the latest.
To install fresh without using git, you can use the open-source-only Nightly Installers or the
binary installers (which also include the commercial edition).
Post Syndicated from Bozho original https://blog.bozho.net/blog/4165
Днес участвах на срещата на премиера Денков, МЗ, МЕУ и Информационно обслужване със съсловните организации в сектор „здравеопазване“ на тема „електронна рецепта“.
Предложението на МЗ задължението за изцяло електронни рецепти да се премести за април има своите рискове, но дава възможност за повишаване на доверието в системата.
Аз предложих пет неща на срещата:
1. Мека прогенерична политика чрез промяна на опциите по подразбиране – чрез софтуерите, по подразбиране да се позволява генерично заместване, а ако лекарят смята, че трябва да се отпусне лекарство от конкретен производител (има легитимни причини за това), да трябва да отбележи „забранявам заместване“. По този начин фармацевтите ще могат да отпускат еквивалентни лекарства в повечето случаи, ако няма от предписаното – това беше един от основните проблеми при старта на е-рецептите. С това предложение се оставя решението у лекаря.
2. Ясно дефиниране на изключенията, при които могат да се ползват хартиени рецепти – домашни посещения, лекари, които не могат използват технологии, чуждестранни лекар. Също: срив в системата. Това го предложих миналата година на служебния кабинет, когато отмениха електронната рецепта, но се го възприеха.
3. Въвеждане на стандарт за удобство/потребителско изживяване/UX на софтуерите, с които се изписват рецептите. Според мен немалка част от недоволството в лекарското съсловие е поради по-бавното и по-неудобно изписване чрез софтуер. В стандарта може да се включат конкретни тестове и засичане на време за изписване.
4. В „гратисния период“ да се отстранят всички оставащи технически проблеми, с много оперативен процес между МЗ и Информационно обслужване, като големите болници и ДКЦ-тата да се включат активно в тестовете.
5. При отпускане на лекарства по хартиени рецепти (след април) да има улеснено въвеждане на данните от фармацевтите, напр. автоматично при верификация на лекарството.
Тези предложения могат да бъдат включени в Наредба 4, за да бъдат реализирани до април.
Електронните рецепти намаляват порочните практики в системата. Дават повече видимост и възможност за провеждане на здравни политики. Помагат с преодоляването на проблема с антибиотичната резистентност. Затова тези усилия на всички страни си струват.
Материалът Предложения за електронните рецепти е публикуван за пръв път на БЛОГодаря.
Post Syndicated from Sarat Para original https://aws.amazon.com/blogs/architecture/converting-stateful-application-to-stateless-using-aws-services/
Designing a system to be either stateful or stateless is an important choice with tradeoffs regarding its performance and scalability. In a stateful system, data from one session is carried over to the next. A stateless system doesn’t preserve data between sessions and depends on external entities such as databases or cache to manage state.
Stateful and stateless architectures are both widely adopted.
Figure 1 provides a conceptual comparison of stateful and stateless architectures.

Figure 1. Conceptual diagram for stateful vs stateless architectures
For example, an eCommerce application accessible from web and mobile devices manages several aspects of the customer transaction life cycle. This lifecycle starts with account creation, then moves to placing items in the shopping cart, and proceeds through checkout. Session and user profile data provide session persistence and cart management, which retain the cart’s contents and render the latest updated cart from any device. A stateless architecture is preferable for this application because it decouples user data and offloads the session data. This provides the flexibility to scale each component independently to meet varying workloads and optimize resource utilization.
In this blog, we outline the process and benefits of converting from a stateful to stateless architecture.
This section walks you through the steps for converting stateful to stateless architecture:
Transforming a stateful architecture to a stateless architecture starts with reviewing the overall architecture and source code of the application, and then analyzing dataflow and dependencies.
It’s important to understand how your application accesses and shares data. Pay attention to components that persist state data and retain state information. Examples include user credentials, user profiles, session tokens, and data specific to sessions (such as shopping carts). Identifying how this data is handled serves as the foundation for planning the conversion to a stateless architecture.
Analyze and understand the components that maintain state within the architecture. This helps you assess the potential impact of transitioning to a stateless design.
You can use the following questionnaire to assess the components. Customize the questions according to your application.
Decoupling user data involves separating and managing user data from the core application logic. Delegate responsibilities for user management and secrets, such as application programming interface (API) keys and database credentials, to a separate service that can be resilient and scale independently. For example, you can use:
Offloading session data refers to the practice of storing and managing session related data external to the stateful components of an application. This involves separating the state from business logic. You can offload session data to a database, cache, or external files.
Factors to consider when offloading session data include:
Amazon ElastiCache, Amazon DynamoDB, Amazon Elastic File System (Amazon EFS), and Amazon MemoryDB for Redis are examples of AWS services that you can use to offload session data. The AWS service you choose for offloading session data depends on application requirements.
Stateless architecture gives the flexibility to scale each component independently, allowing the application to meet varying workloads and optimize resource utilization. While planning for scaling, consider using:
After you identify which state and user data need to be persisted, and your storage solution of choice, you can begin designing the stateless architecture. This involves:
The following figure is an example of a stateless architecture on AWS. This architecture separates the user interface, application logic, and data storage into distinct layers, allowing for scalability, modularity, and flexibility in designing and deploying applications. The tiers interact through well-defined interfaces and APIs, ensuring that each component focuses on its specific responsibilities.

Figure 2. Example of a stateless architecture
Benefits of adopting a stateless architecture include:
Converting stateful applications to stateless applications requires careful planning, design, and implementation. Your choice of architecture depends on your application’s specific needs. If an application is simple to develop and debug, then a stateful architecture might be a good choice. However, if an application needs to be scalable and fault tolerant, then a stateless architecture might be a better choice. It’s important to understand the current application thoroughly before embarking on a refactoring journey.
Post Syndicated from Patrick Kennedy original https://www.servethehome.com/giagantic-amd-apu-at-sc23-meet-the-amd-mi300a-and-mi300x/
We saw the AMD Instinct MI300A (giant APU) and MI300X (GPU) at SC23 and learned a few new things about AMD’s new AI and HPC platforms
The post Giagantic AMD APU at SC23 Meet the AMD MI300A and MI300X appeared first on ServeTheHome.
Post Syndicated from Talks at Google original https://www.youtube.com/watch?v=3-vrTcLrL9k
Post Syndicated from Naranjan Goklani original https://aws.amazon.com/blogs/security/2023-canadian-centre-for-cyber-security-assessment-summary-report-available-with-20-additional-services/
At Amazon Web Services (AWS), we are committed to providing continued assurance to our customers through assessments, certifications, and attestations that support the adoption of current and new AWS services and features. We are pleased to announce the availability of the 2023 Canadian Centre for Cyber Security (CCCS) assessment summary report for AWS. With this assessment, a total of 150 AWS services and features are assessed in the Canada (Central) Region, including 20 additional AWS services and features. The assessment report is available for review and download on demand through AWS Artifact.
The full list of services in scope for the CCCS assessment is available on the Services in Scope page. The 20 new services and features are the following:
The CCCS is Canada’s authoritative source of cyber security expert guidance for the Canadian government, industry, and the general public. Public and commercial sector organizations across Canada rely on CCCS’s rigorous Cloud Service Provider (CSP) IT Security (ITS) assessment in their decision to use CSP services. In addition, CCCS’s ITS assessment process is a mandatory requirement for AWS to provide cloud services to Canadian federal government departments and agencies.
The CCCS cloud service provider information technology security assessment process determines if the Government of Canada (GC) ITS requirements for the CCCS Medium cloud security profile (previously referred to as GC’s PROTECTED B/Medium Integrity/Medium Availability [PBMM] profile) are met as described in ITSG-33 (IT security risk management: A lifecycle approach, Annex 3 – Security control catalogue). As of November 2023, 150 AWS services in the Canada (Central) Region have been assessed by CCCS and meet the requirements for the Medium cloud security profile. Meeting the Medium cloud security profile is required to host workloads that are classified up to and including Medium categorization. On a periodic basis, CCCS assesses new or previously unassessed services and re-assesses the AWS services that were previously assessed to verify that they continue to meet the GC’s requirements. CCCS prioritizes the assessment of new AWS services based on their availability in Canada, and customer demand for the AWS services. The full list of AWS services that have been assessed by CCCS is available on our Services in Scope for CCCS Assessment page.
To learn more about the CCCS assessment or our other compliance and security programs, visit AWS Compliance Programs. As always, we value your feedback and questions; reach out to the AWS Compliance team through the Contact Us page.
If you have feedback about this post, submit comments in the Comments section below. If you have questions about this post, contact AWS Support.
Want more AWS Security news? Follow us on Twitter.
Post Syndicated from Bruce Schneier original https://www.schneier.com/blog/archives/2023/11/ransomware-gang-files-sec-complaint.html
A ransomware gang, annoyed at not being paid, filed an SEC complaint against its victim for not disclosing its security breach within the required four days.
This is over the top, but is just another example of the extreme pressure ransomware gangs put on companies after seizing their data. Gangs are now going through the data, looking for particularly important or embarrassing pieces of data to threaten executives with exposing. I have heard stories of executives’ families being threatened, of consensual porn being identified (people regularly mix work and personal email) and exposed, and of victims’ customers and partners being directly contacted. Ransoms are in the millions, and gangs do their best to ensure that the pressure to pay is intense.
Post Syndicated from Antonio Samaniego Jurado original https://aws.amazon.com/blogs/big-data/visualize-amazon-dynamodb-insights-in-amazon-quicksight-using-the-amazon-athena-dynamodb-connector-and-aws-glue/
Amazon DynamoDB is a fully managed, serverless, key-value NoSQL database designed to run high-performance applications at any scale. DynamoDB offers built-in security, continuous backups, automated multi-Region replication, in-memory caching, and data import and export tools. The scalability and flexible data schema of DynamoDB make it well-suited for a variety of use cases. These include internet-scale web and mobile applications, low-latency metadata stores, high-traffic retail websites, Internet of Things (IoT) and time series data, online gaming, and more.
Data stored in DynamoDB is the basis for valuable business intelligence (BI) insights. To make this data accessible to data analysts and other consumers, you can use Amazon Athena. Athena is a serverless, interactive service that allows you to query data from a variety of sources in heterogeneous formats, with no provisioning effort. Athena accesses data stored in DynamoDB via the open source Amazon Athena DynamoDB connector. Table metadata, such as column names and data types, is stored using the AWS Glue Data Catalog.
Finally, to visualize BI insights, you can use Amazon QuickSight, a cloud-powered business analytics service. QuickSight makes it straightforward for organizations to build visualizations, perform ad hoc analysis, and quickly get business insights from their data, anytime, on any device. Its generative BI capabilities enable you to ask questions about your data using natural language, without having to write SQL queries or learn a BI tool.
This post shows how you can use the Athena DynamoDB connector to easily query data in DynamoDB with SQL and visualize insights in QuickSight.
The following diagram illustrates the solution architecture.

This walkthrough uses data from the ProductCatalog table, part of the DynamoDB developer guide sample data files.
Before you get started, you should meet the following prerequisites:
The Athena DynamoDB connector comprises a pre-built, serverless Lambda function provided by AWS that communicates with DynamoDB so you can query your tables with SQL using Athena. The connector is available in the AWS Serverless Application Repository, and is used to create the Athena data source for later use in data analysis and visualization. To set up the connector, complete the following steps:
This will take you to the Lambda applications page on the Lambda console. Do not close the Athena data source creation tab; you will return to it in a later step.
SpillBucket – Specifies the Amazon Simple Storage Service (Amazon S3) bucket name for storing data that exceeds Lambda function response size limits. To create an S3 bucket, refer to Creating a bucket.AthenaCatalogName – A lowercase name for the Lambda function to be created.
Wait for deployment to complete before moving to the next step.

The Athena connector already comes with a built-in inference capability to discover the schema and table properties of your data source. However, this capability is limited. To accurately discover the metadata of your DynamoDB table and centralize schema management as your data evolves over time, the connector integrates with AWS Glue.
To achieve this, an AWS Glue crawler is run to automatically determine the format, schema, and associated properties of the raw data stored in your DynamoDB table, writing the resulting metadata to a Glue database. Glue databases contain tables, which hold metadata from different data stores, independent from the actual location of the data. The Athena connector then references the Glue table and retrieves the corresponding DynamoDB metadata to enable queries.
Complete the following steps to create the Glue database:
dynamo-db-flag. This keyword indicates that the database contains tables that the connector can use for supplemental metadata.Following security best practices, it is also recommended that you enable encryption at rest for your Data Catalog. For details, refer to Encrypting your Data Catalog.
Complete the following steps to create and run the Glue crawler:
Crawler runtimes depend on your DynamoDB table size and properties. You can find crawler run details under Crawler runs.
When your crawler run status shows as Completed, follow the below steps to validate the output metadata:

classification key to dynamodb. This indicates to the Athena connector that the table can be used for supplemental metadata.sourceTableYourDynamoDBTableNamecolumnMappingyourcolumn1=YourColumn1, yourcolumn2=YourColumn2, …After the Athena DynamoDB connector is deployed and the AWS Glue table is populated with supplemental metadata, the DynamoDB table is ready for analysis. The example in this post uses the Athena editor to make SQL queries to the ProductCatalog table. For further options to interact with Athena, see Accessing Athena.
Complete the following steps to test the connector:
<datasource_name>.<database>.<table_name>. Retrieved records are shown under Results.For increased security, refer to Encrypting Athena query results stored in Amazon S3 to encrypt query results at rest.

For this post, we run a SELECT statement to validate the process. You can refer to the SQL reference for Athena to build more complex queries and analyses.
QuickSight allows for building modern interactive dashboards, paginated reports, embedded analytics, and natural language queries through a unified BI solution. In this step, we use QuickSight to generate visual insights from the DynamoDB table by connecting to the Athena data source previously created.
Complete the following steps to grant QuickSight access to resources:
Subsequent instructions assume that the default QuickSight-managed role is being used. If this is not the case, make sure to update the existing role to the same effect.
To create the Athena dataset, complete the following steps:
For additional information on QuickSight query modes, see Importing data into SPICE and Using SQL to customize data.
Once the DynamoDB data is available in QuickSight via the Athena DynamoDB connector, it is ready to be visualized. The QuickSight analysis in the below example shows a vertical stacked bar chart with the average price per product category for the ProductCatalog sample dataset. In addition, it shows a donut chart with the proportion of products by product category, and a tree map containing the count of bicycles per bicycle type.
If you use data imported to SPICE in a QuickSight analysis, the dataset will only be available after the import is complete. For further details, see Using SPICE data in an analysis.

For comprehensive information on how to create and share visualizations in QuickSight, refer to Visualizing data in Amazon QuickSight and Sharing and subscribing to data in Amazon QuickSight.
To avoid incurring continued AWS usage charges, make sure you delete all resources created as part of this walkthrough.
serverlessrepo-AthenaDynamoDBConnector and choose Delete.This post demonstrated how you can use the Athena DynamoDB connector to query data in DynamoDB with SQL and build visualizations in QuickSight.
Learn more about the Athena DynamoDB connector in the Amazon Athena User Guide. Discover more available data source connectors to query and visualize a variety of data sources without setting up or managing any infrastructure while only paying for the queries you run.
For advanced QuickSight capabilities powered by AI, see Gaining insights with machine learning (ML) in Amazon QuickSight and Answering business questions with Amazon QuickSight Q.
 Antonio Samaniego Jurado is a Solutions Architect at Amazon Web Services. With a strong passion for modern technology, Antonio helps customers build state-of-the-art applications on AWS. A creator at heart, he loves community-driven learning and sharing of best practices across the AWS service portfolio to make the best of customers cloud journey.
 Pascal Vogel is a Solutions Architect at Amazon Web Services. Pascal helps startups and enterprises build cloud-native solutions. As a cloud enthusiast, Pascal loves learning new technologies and connecting with like-minded customers who want to make a difference in their cloud journey.
Post Syndicated from Seshadri Senthamaraikannan original https://aws.amazon.com/blogs/big-data/implement-data-warehousing-solution-using-dbt-on-amazon-redshift/
Amazon Redshift is a cloud data warehousing service that provides high-performance analytical processing based on a massively parallel processing (MPP) architecture. Building and maintaining data pipelines is a common challenge for all enterprises. Managing the SQL files, integrating cross-team work, incorporating all software engineering principles, and importing external utilities can be a time-consuming task that requires complex design and lots of preparation.
dbt (DataBuildTool) offers this mechanism by introducing a well-structured framework for data analysis, transformation and orchestration. It also applies general software engineering principles like integrating with git repositories, setting up DRYer code, adding functional test cases, and including external libraries. This mechanism allows developers to focus on preparing the SQL files per the business logic, and the rest is taken care of by dbt.
In this post, we look into an optimal and cost-effective way of incorporating dbt within Amazon Redshift. We use Amazon Elastic Container Registry (Amazon ECR) to store our dbt Docker images and AWS Fargate as an Amazon Elastic Container Service (Amazon ECS) task to run the job.
dbt has an Amazon Redshift adapter module named dbt-redshift that enables it to connect and work with Amazon Redshift. All the connection profiles are configured within the dbt profiles.yml file. In an optimal environment, we store the credentials in AWS Secrets Manager and retrieve them.
The following code shows the contents of profile.yml:
The following diagram illustrates the key components of the dbt framework:

The primary components are as follows:
dbt seed command.dbt test, dbt will tell you if each test in your project passes or fails.These components are stored as .sql files and are run by dbt CLI commands. During the run, dbt creates a Directed Acyclic Graph (DAG) based on the internal reference between the dbt components. It uses the DAG to orchestrate the run sequence accordingly.
Multiple profiles can be created within the profiles.yml file, which dbt can use to target different Redshift environments while running. For more information, refer to Redshift set up.
The following diagram illustrates our solution architecture.
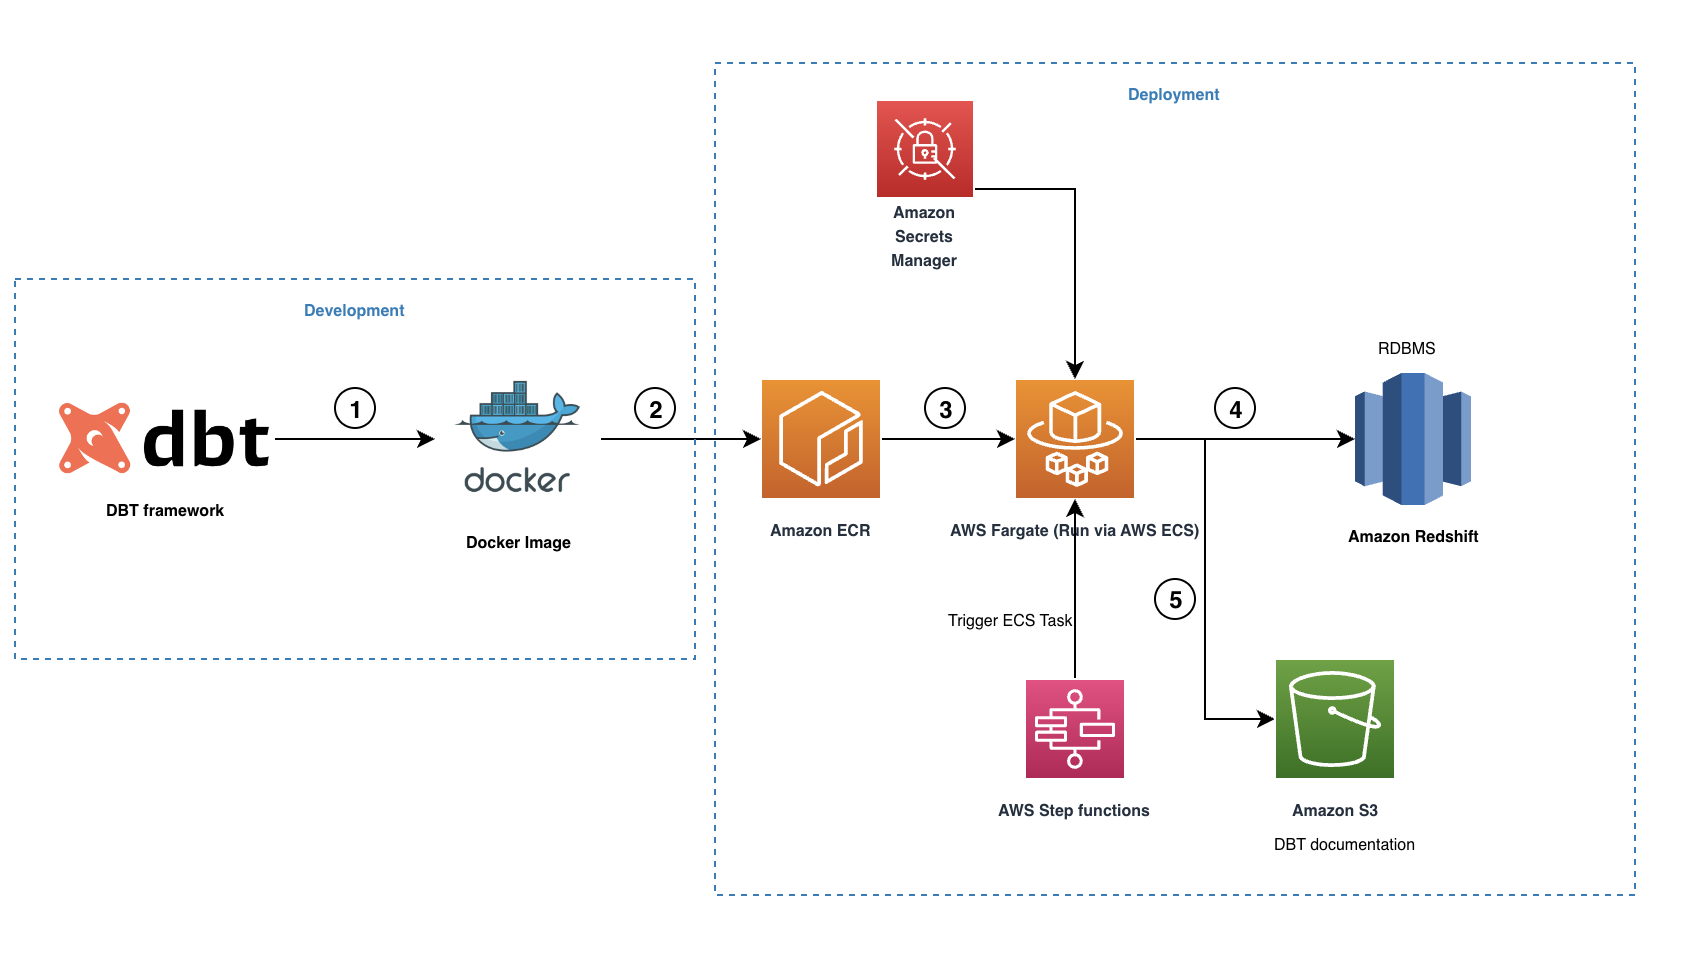
The workflow contains the following steps:
You should have the following prerequisites:
We are using dbt CLI so all commands are run in the command line. Therefore, install pip if not already installed. Refer to installation for more information.
To create a dbt project, complete the following steps:
pip install dbt-redshiftdbt init <project_name> command, which creates all the template folders automatically.In the reference project, we have implemented the following features:
The Python script is prepared to fetch the credentials required from Secrets Manager for accessing Amazon Redshift. Refer to the export_redshift_connection.py file.
run_dbt.sh script to run the dbt pipeline sequentially. This script is placed in the root folder of the dbt project as shown in sample repo.To push the image to the ECR repository, complete the following steps:
This task will trigger the run_dbt.sh pipeline script and run all the dbt commands sequentially. When the script is complete, we can see the results in Amazon Redshift and the documentation files pushed to Amazon S3.
The dbt-redshift-etlpattern repo now has all the code samples required.
Cost for executing dbt jobs in AWS Fargate as an Amazon ECS task with minimal operational requirements would take around $1.5 (cost_link) per month.
Complete the following steps to clean up your resources:
This post covered the basic implementation of using dbt with Amazon Redshift in a cost-efficient way by using Fargate in Amazon ECS. We described the key infrastructure and configuration set-up with a sample project. This architecture can help you take advantage of the benefits of having a dbt framework to manage your data warehouse platform in Amazon Redshift.
For more information about dbt macros and models for Amazon Redshift internal operation and maintenance, refer to the following GitHub repo. In subsequent post, we’ll explore the traditional extract, transform, and load (ETL) patterns that you can implement using the dbt framework in Amazon Redshift. Test this solution in your account and provide feedback or suggestions in the comments.
 Seshadri Senthamaraikannan is a data architect with AWS professional services team based in London, UK. He is well experienced and specialised in Data Analytics and works with customers focusing on building innovative and scalable solutions in AWS Cloud to meet their business goals. In his spare time, he enjoys spending time with his family and play sports.
 Mohamed Hamdy is a Senior Big Data Architect with AWS Professional Services based in London, UK. He has over 15 years of experience architecting, leading, and building data warehouses and big data platforms. He helps customers develop big data and analytics solutions to accelerate their business outcomes through their cloud adoption journey. Outside of work, Mohamed likes travelling, running, swimming and playing squash.
Post Syndicated from corbet original https://lwn.net/Articles/951550/
One of the core constraints when programming in the kernel is the need to
avoid sleeping when running in atomic context. For the most part, the
responsibility for adherence to this rule is placed on the developer’s
shoulders; Rust developers, though, want the compiler to ensure that code
is safe whenever possible. At the 2023 Linux
Plumbers Conference, Gary Guo presented (via a remote link) the klint
tool, which can find
and flag many atomic-context violations before they turn into
user-affecting bugs.
Post Syndicated from Chris Munns original https://aws.amazon.com/blogs/compute/the-attendees-guide-to-the-aws-reinvent-2023-compute-track/
This post by Art Baudo – Principal Product Marketing Manager – AWS EC2, and Pranaya Anshu – Product Marketing Manager – AWS EC2
We are just a few weeks away from AWS re:Invent 2023, AWS’s biggest cloud computing event of the year. This event will be a great opportunity for you to meet other cloud enthusiasts, find productive solutions that can transform your company, and learn new skills through 2000+ learning sessions.
Even if you are not able to join in person, you can catch-up with many of the sessions on-demand and even watch the keynote and innovation sessions live.
If you’re able to join us, just a reminder we offer several types of sessions which can help maximize your learning in a variety of AWS topics. Breakout sessions are lecture-style 60-minute informative sessions presented by AWS experts, customers, or partners. These sessions are recorded and uploaded a few days after to the AWS Events YouTube channel.
re:Invent attendees can also choose to attend chalk-talks, builder sessions, workshops, or code talk sessions. Each of these are live non-recorded interactive sessions.
To start planning your re:Invent week, check-out some of the Compute track sessions below. If you find a session you’re interested in, be sure to reserve your seat for it through the AWS attendee portal.
This year AWS compute services have launched numerous innovations: From the launch of over 100 new Amazon EC2 instances, to the general availability of Amazon EC2 Trn1n instances powered by AWS Trainium and Amazon EC2 Inf2 instances powered by AWS Inferentia2, to a new way to reserve GPU capacity with Amazon EC2 Capacity Blocks for ML. There’s a lot of exciting launches to take in.
Explore some of these latest and greatest innovations in the following sessions:
Machine learning (ML) has been evolving for decades and has an inflection point with generative AI applications capturing widespread attention and imagination. More customers, across a diverse set of industries, choose AWS compared to any other major cloud provider to build, train, and deploy their ML applications. Learn about the generative AI infrastructure at Amazon or get hands-on experience building ML applications through our ML focused sessions, such as the following:
AWS has invested years designing custom silicon optimized for the cloud to deliver the best price performance for a wide range of applications and workloads using AWS services. Learn more about the AWS Nitro System, processors at AWS, and ML chips.
At AWS, we focus on delivering the best possible cost structure for our customers. Frugality is one of our founding leadership principles. Cost effective design continues to shape everything we do, from how we develop products to how we run our operations. Come learn of new ways to optimize your compute costs through AWS services, tools, and optimization strategies in the following sessions:
Amazon EC2 offers the broadest and deepest compute platform to help you best match the needs of your workload. More SAP, high performance computing (HPC), ML, and Windows workloads run on AWS than any other cloud. Join sessions focused around your specific workload to learn about how you can leverage AWS solutions to accelerate your innovations.
AWS serves millions of customers of all sizes across thousands of use cases, every industry, and around the world. Hear customers dive into how AWS compute solutions have helped them transform their businesses.
The AWS Compute team looks forward to seeing you in Las Vegas. Come meet us at the Compute Booth in the Expo. And if you’re looking for more session recommendations, check-out additional re:Invent attendee guides curated by experts.
Post Syndicated from hamzarau original https://aws.amazon.com/blogs/messaging-and-targeting/send-sms-using-the-new-amazon-pinpoint-sms-console/
Amazon Pinpoint is a multichannel communication service that helps application developers engage their customers through communication channels such as SMS or text messaging, email, mobile push, voice, and in-app messaging.
Amazon Pinpoint SMS provides the global scale, resiliency, and flexibility required to deliver SMS and voice messaging in web, mobile, or business applications. SMS messaging is used for use cases like one-time passcode validation, time sensitive alerts, and two-way chat due to its global reach and ubiquity. Today Amazon Pinpoint SMS sends messages to over 240 countries and regions. In this post, we will review how to use the new Pinpoint SMS management console to get your SMS resources setup correctly the first time.
This blog walks through the setup and configuration steps for Pinpoint SMS using the management console. Additionally, all setup and configurations can also be completed using Pinpoint SMS APIs. For more information visit the Pinpoint SMS documentation, or complete the Amazon Pinpoint SMS workshop.
The Pinpoint SMS management console provides control for the existing functionality of the Pinpoint SMS APIs to create, and manage your SMS and voice resources. In addition, the Pinpoint SMS console has a Quick start – SMS setup guide or Request originator flow to guide you through the setup process and for requesting and managing your SMS resources.
If you require additional background on how SMS works using Amazon Pinpoint SMS, refer to How to Manage Global Sending of SMS with Amazon Pinpoint. Below are some important SMS concepts we’ll highlight in this blog post.
Sign-in to the AWS management console and search for Amazon Pinpoint. If you don’t have an existing AWS account, complete the following steps to create one.
In the Amazon Pinpoint console, you can choose between managing Pinpoint SMS and Pinpoint campaign orchestration. Pinpoint SMS is the place where applications developers go to setup and configure their associated resources for SMS sending through any AWS service. Pinpoint campaign orchestration is for builders who want to manage their customer segments and send messages using campaigns, or multi-step journeys. Campaign orchestration utilizes communication channels like Pinpoint SMS or Amazon SES (simple email service) to deliver its messages. In this blog, we will discuss how to configure Pinpoint SMS using its management console.

Once you’ve selected the Amazon Pinpoint SMS console, you will land on the Overview page. On this page, you get a summary of your SMS resources and the Quick start – SMS setup guide. This guide will walk you through creating the appropriate SMS resources to start sending SMS messages. The steps outlined in the Quick start guide are recommended but not required.
A phone pool is a collection of phone numbers and sender IDs that all share the same settings and provide failover if a number becomes unavailable. Phone pools provide the benefit of managing for number resiliency, removes the complexity from sending applications, and provides a logical grouping to manage phone numbers and sender IDs. For example, phone pools can be grouped by use-case such as having a phone pool for OTP (one-time password) messages.
In the navigation pane, under Overview, in the Quick start section, choose Create pool. Under the pool setup section, enter a name for your pool in Pool name. To create a pool, you will need to select an origination identity, either a phone number or sender ID to associate with the pool. Additional origination identities can be added once the pool is created on the Phone pools page. If you don’t have an active phone number or sender ID in your account, we recommend selecting a simulator number, which can be used for testing and does not require any registration. Once you’ve selected an origination identity, you can choose Create phone pool to complete step 1.

A configuration set is a set of rules that are applied when you send a message. For example, a configuration set can specify a destination for events related to a message. When SMS events occur (such as delivery or failure events), they are routed to the destination associated with the configuration set that you specified when you sent the message. You’re not required to use configuration sets when you send messages, but we recommend that you do. We support sending SMS and voice events to Amazon CloudWatch, Amazon Kinesis DataFirehose, and Amazon SNS.
In the navigation pane, under Overview, in the Quick start section, choose Create set. Under the Configuration set details section, enter a name in Configuration set name. For Event Destination setup, choose either the quick start option to create a Cloud formation stack to automatically create and configure CloudWatch, Kinesis DataFirehose, and SNS to log all events or the advanced option to manually select which event destinations you would like to setup. Once you’ve made the selection, choose Create Configuration set to complete step 2.

Send a test message using the SMS simulator. Select an originator to send from, and a destination number to send to. To track the status of your message, add a configuration set to publish SMS events.
In the navigation pane, under Overview, in the Quick start section, choose Test SMS sending. Under the Originator section, select either a phone pool, phone number, or sender ID in your account to send test messages from. Next, under the Destination phone number section, select either a simulator number or active destination number to send test messages to. If your account is in Sandbox, you can only send messages to simulator numbers or verified destination numbers. Once your account is in Production you can send messages to simulator numbers or any active destination number. You can (optionally) select a configuration set to track your SMS events. Next, under the Message body section, enter a sample message and send the test message.
Note – If you are sending from a US simulator number (or using a phone pool that only contains a US simulator number) you can only send messages to US simulator destination numbers. A simulator phone number behaves like any other phone number without sending the SMS message to mobile carriers.

Finally, if your account is in Sandbox there are limits to the amount you can spend and can only send to verified destination phone numbers. Request moving your account from Sandbox to Production to remove these limits. To move to Production, open a case with AWS Support Center.
After following the request for Production access, you’ve completed the recommended steps to get your account configuration setup. You have now tested and configured the following resources in your account:
To request additional originators such as phone numbers or sender IDs, you can follow the Request Originator flow in the management console. If your originator requires registrations and is supported, you can self-service the phone number or sender ID registration in the management console.
Post Syndicated from LGR original https://www.youtube.com/watch?v=RnWZqfUDXp8
Post Syndicated from Barry Conway original https://aws.amazon.com/blogs/security/implement-an-early-feedback-loop-with-aws-developer-tools-to-shift-security-left/
Early-feedback loops exist to provide developers with ongoing feedback through automated checks. This enables developers to take early remedial action while increasing the efficiency of the code review process and, in turn, their productivity.
Early-feedback loops help provide confidence to reviewers that fundamental security and compliance requirements were validated before review. As part of this process, common expectations of code standards and quality can be established, while shifting governance mechanisms to the left.
In this post, we will show you how to use AWS developer tools to implement a shift-left approach to security that empowers your developers with early feedback loops within their development practices. You will use AWS CodeCommit to securely host Git repositories, AWS CodePipeline to automate continuous delivery pipelines, AWS CodeBuild to build and test code, and Amazon CodeGuru Reviewer to detect potential code defects.
Developers today are an integral part of organizations, building and maintaining the most critical customer-facing applications. Developers must have the knowledge, tools, and processes in place to help them identify potential security issues before they release a product to production.
This is why the shift-left approach is important. Shift left is the process of checking for vulnerabilities and issues in the earlier stages of software development. By following the shift-left process (which should be part of a wider application security review and threat modelling process), software teams can help prevent undetected security issues when they build an application. The modern DevSecOps workflow continues to shift left towards the developer and their practices with the aim to achieve the following:
You can use AWS developer tools to help provide this continual early feedback for developers upon each commit of code.
To follow along with this solution, make sure that you have the following prerequisites in place:
Make sure that you have a general working knowledge of the listed services and DevOps practices.
The following diagram illustrates the architecture of the solution.
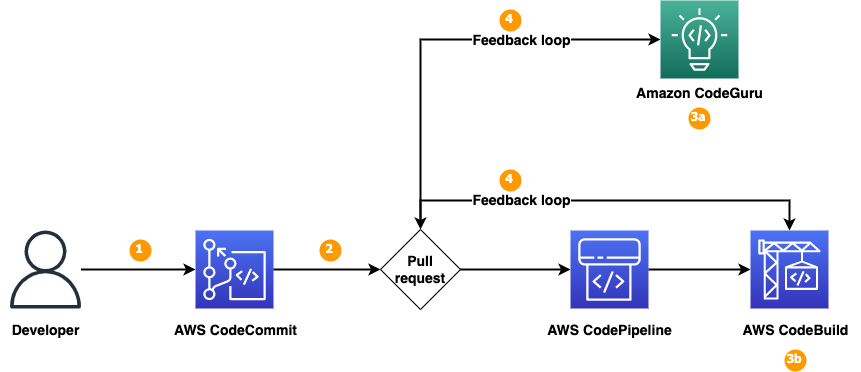
Figure 1: Solution overview
We will show you how to set up a continuous integration and continuous delivery (CI/CD) pipeline by using AWS developer tools—CodeCommit, CodePipeline, CodeBuild, and CodeGuru—that you will integrate with the code repository to detect code security vulnerabilities. As shown in Figure 1, the solution has the following steps:
The following table presents some other tools that you can integrate into the early-feedback toolchain, depending on the type of code or artefacts that you are evaluating:
| Early feedback – security tools | Usage | License |
| cfn-guard , cfn-nag , cfn-lint | Infrastructure linting and validation | cfn-guard license, cfn-nag license, cfn-lint license |
| CodeGuru, Bandit | Python | Bandit license |
| CodeGuru | Java | |
| npm-audit, Dependabot | npm libraries | Dependabot license |
When you deploy the solution in your AWS account, you can review how Bandit for Python has been built into the deployment pipeline by using AWS CodeBuild with a configured buildspec file, as shown in Figure 2. You can implement the other tools in the table by using a similar approach.
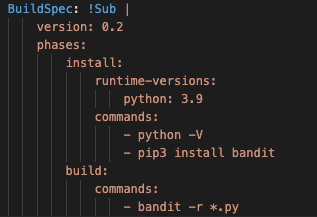
Figure 2: Bandit configured in CodeBuild
To deploy the solution, you will complete the following steps:
The first step is to deploy the required resources into your AWS environment by using CloudFormation.

The solution deploys in the AWS US East (N. Virginia) Region (us-east-1) by default because each service listed in the Prerequisites section is available in this Region. To deploy the solution in a different Region, use the Region selector in the console navigation bar and make sure that the services required for this walkthrough are supported in your newly selected Region. For service availability by Region, see AWS Services by Region.

Figure 3: Cloud9 environments

Figure 4: Cloud9 IDE
The next step is to associate the Python code repository with CodeGuru Reviewer. After you associate the repository, CodeGuru Reviewer analyzes and comments on issues that it finds when you create a pull request.

Figure 5: CodeGuru repository configuration

Figure 6: CodeGuru full analysis pending
The next step is to create a new branch and to push sample code to the repository by creating a pull request so that the code scan can be initiated by CodeGuru Reviewer and the CodeBuild job.

Figure 7: Cloud9 IDE terminal

Figure 8: Cloud9 IDE noncompliant code
Note: if you receive a message to set your name and email address, you can ignore it because Git will automatically set these for you, and the Git commit will complete successfully.

Figure 9: Git push

Figure 10: CodeCommit branch selection

Figure 11: CodeCommit pull request
A notification appears stating that the new code updates can be merged.

Figure 12: Pull request
The creation of this pull request has automatically started two separate code scans. The first is a CodeGuru incremental code review and the second uses CodeBuild, which utilizes Bandit to perform a security code scan of the Python code.
The next step is to review the code scan results to identify security vulnerabilities and the recommendations on how to fix them.

Figure 13: CodeGuru Code review

Figure 14: CodeGuru recommendations

Figure 15: CodeGuru recommendations and CodeBuild logs
This demonstrates how developers can directly link the relevant information relating to security code scans with their code development and associated pull requests, hence shifting to the left the required security awareness for developers.

Figure 16: Cloud9 IDE sample.py

Figure 17: CodeCommit activity history
Clean up the resources created by this solution to avoid incurring future charges.

Figure 18: Delete repository stack

Figure 19: Select CodePipeline S3 bucket

Figure 20: Select CodePipeline S3 objects
In this blog post, we showed you how to implement a solution that enables early feedback on code development through status comments in the CodeCommit pull request activity tab by using Amazon CodeGuru Reviewer and CodeBuild to perform automated code security scans on the creation of a code repository pull request.
We configured CodeBuild with Bandit for Python to demonstrate how you can integrate third-party or open-source tools into the development cycle. You can use this approach to integrate other tools into the workflow.
Shifting security left early in the development cycle can help you identify potential security issues earlier and empower teams to remediate issues earlier, helping to prevent the need to refactor code towards the end of a build.
This solution provides a simple method that you can use to view and understand potential security issues with your newly developed code and thus enhances your awareness of the security requirements within your organization.
It’s simple to get started. Sign up for an AWS account, deploy the provided CloudFormation template through the Launch Stack button, commit your code, and start scanning for vulnerabilities.
If you have feedback about this post, submit comments in the Comments section below. If you have questions about this post, start a new thread on AWS re:Post or contact AWS Support.
Want more AWS Security news? Follow us on Twitter.