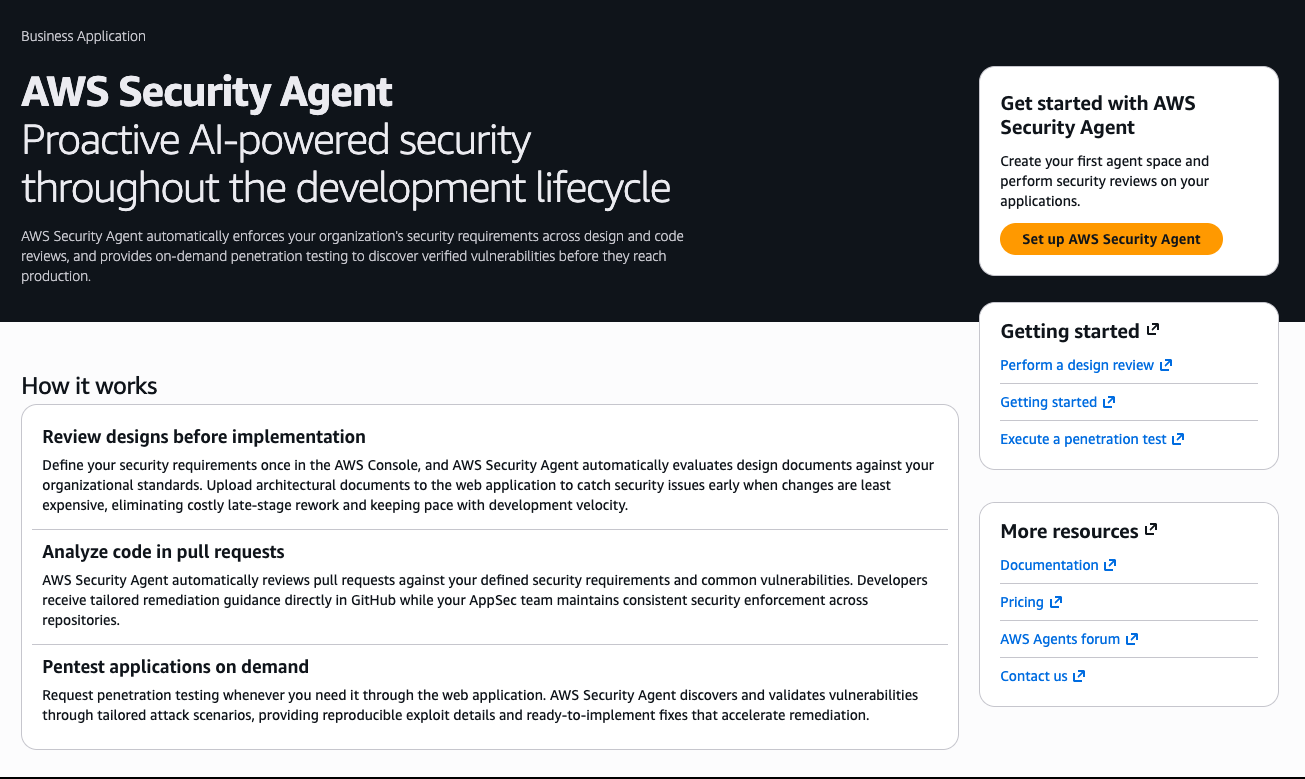
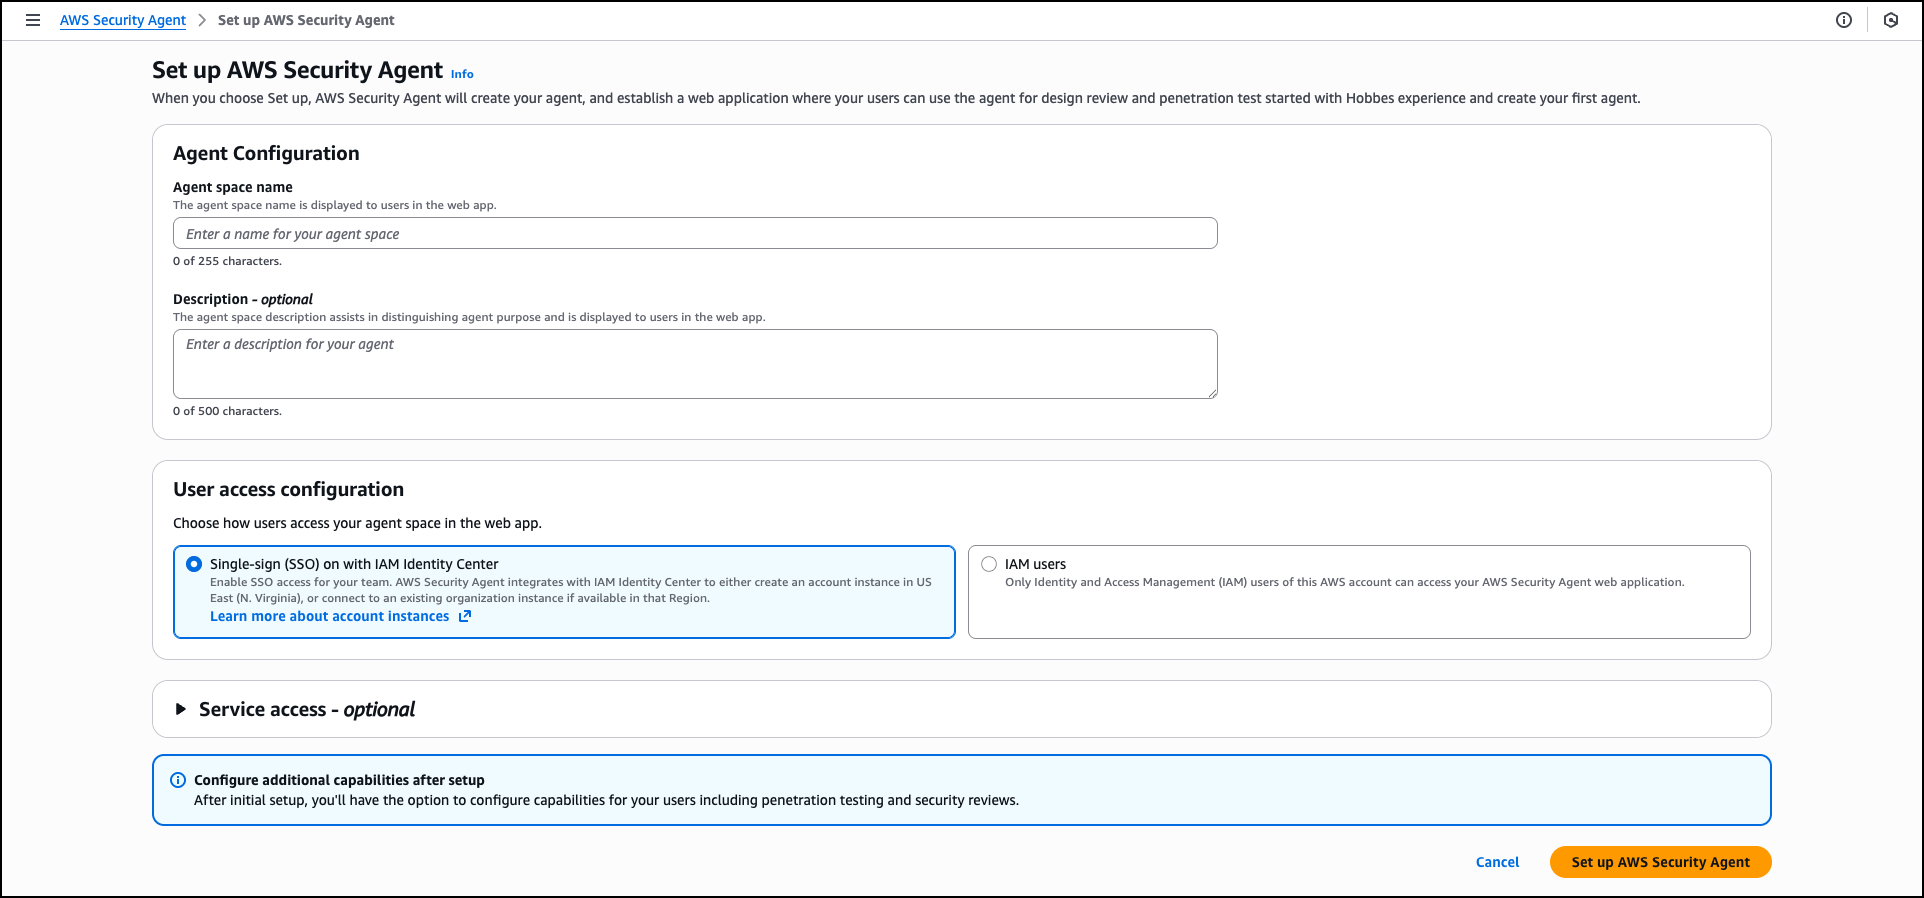
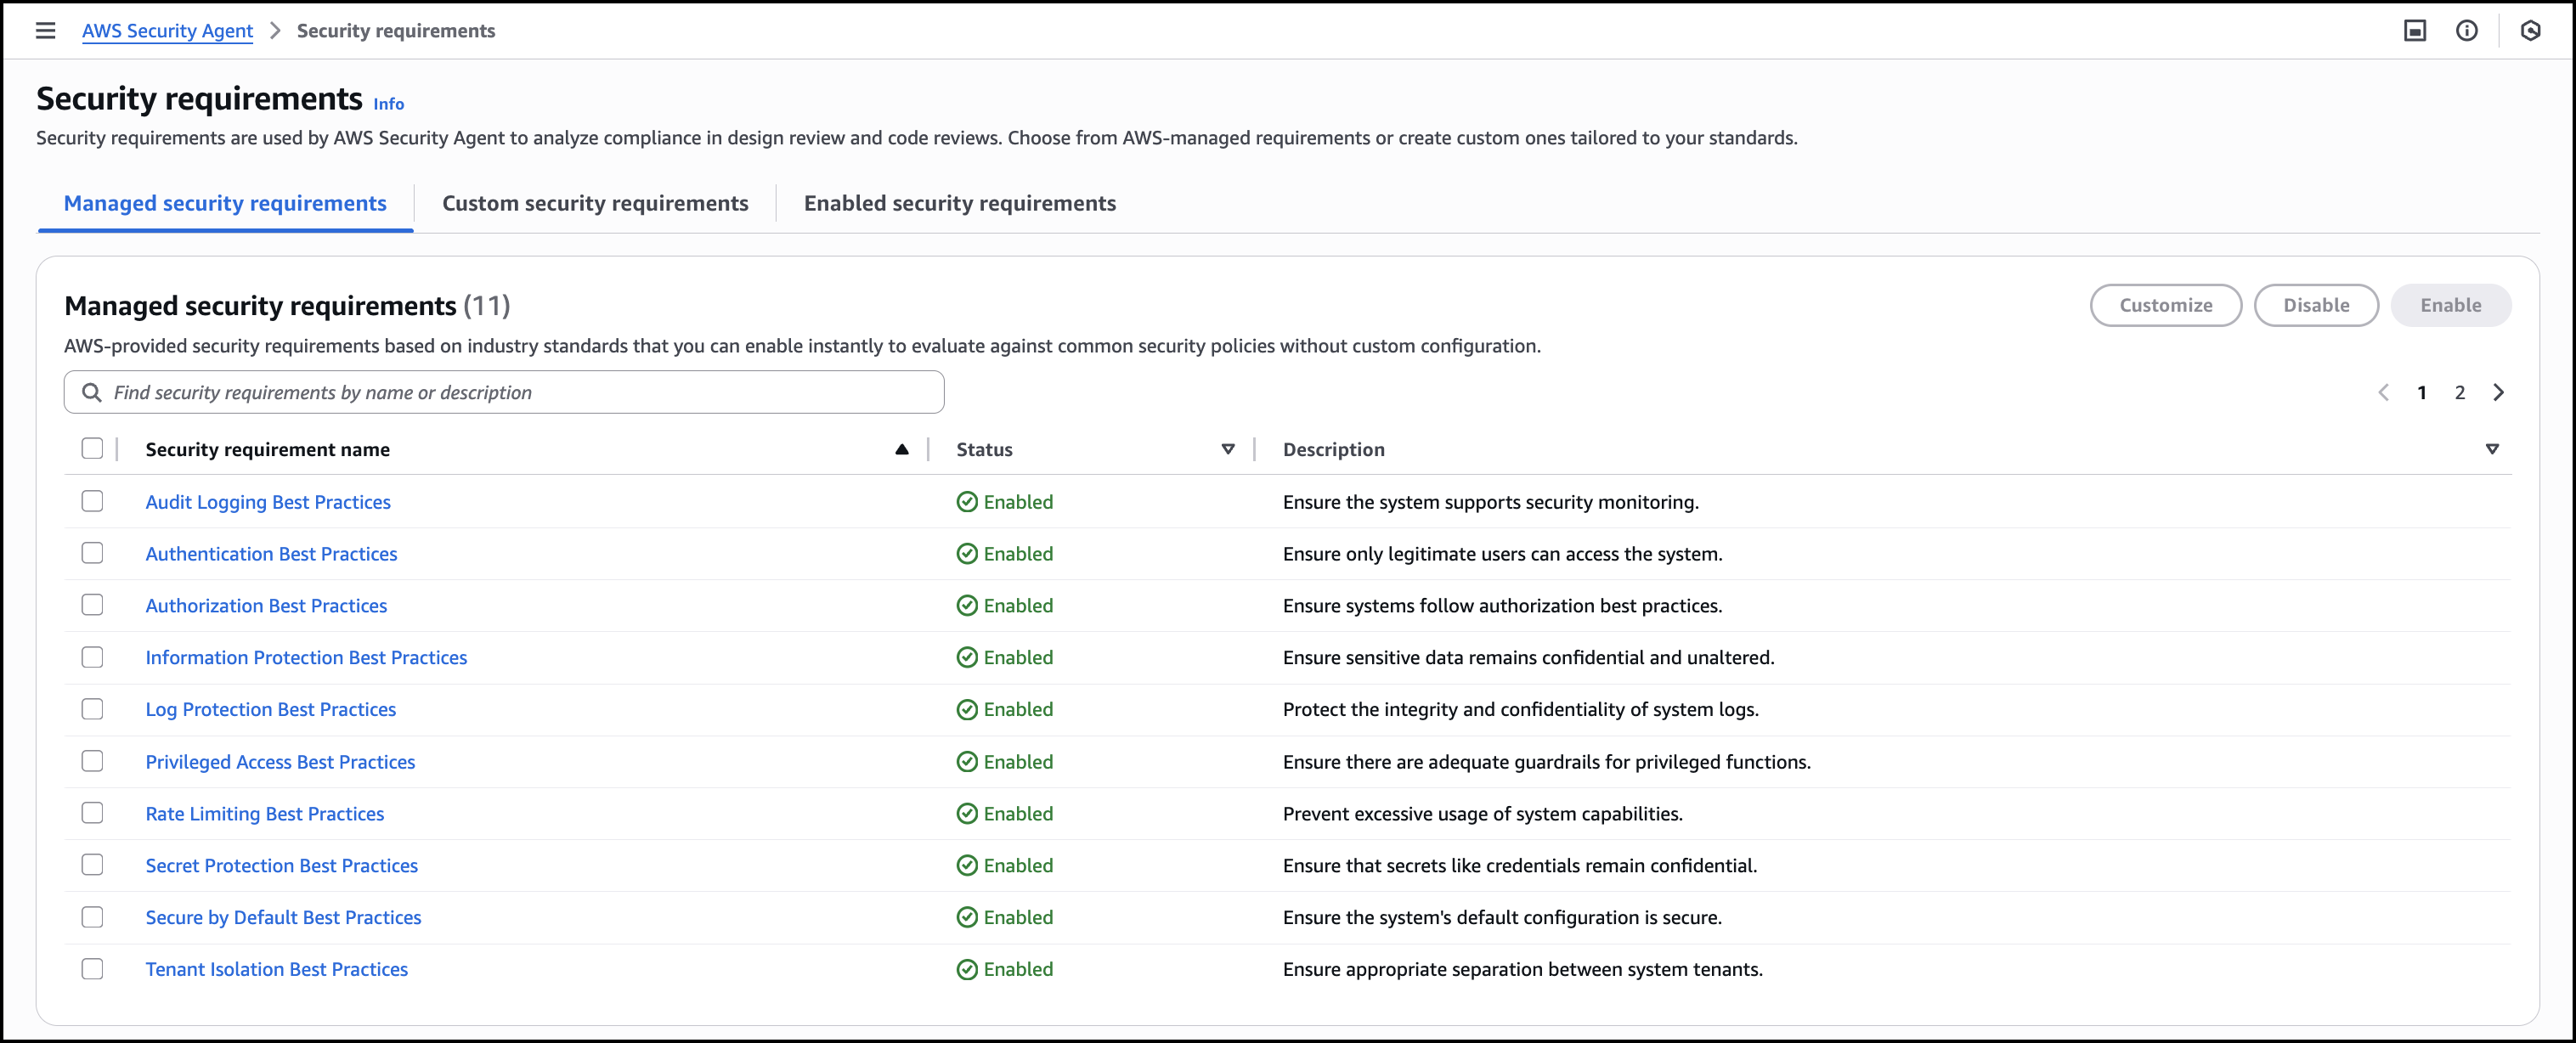
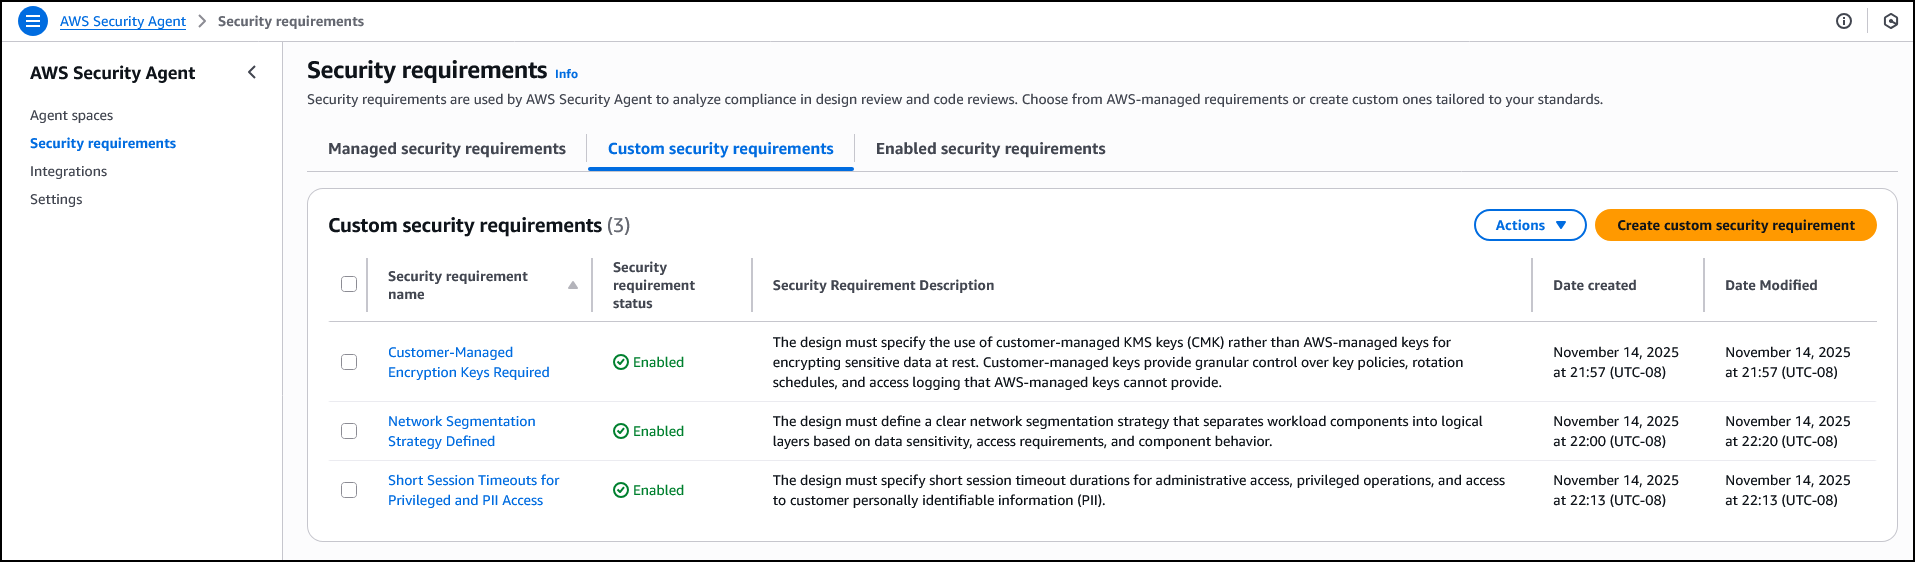
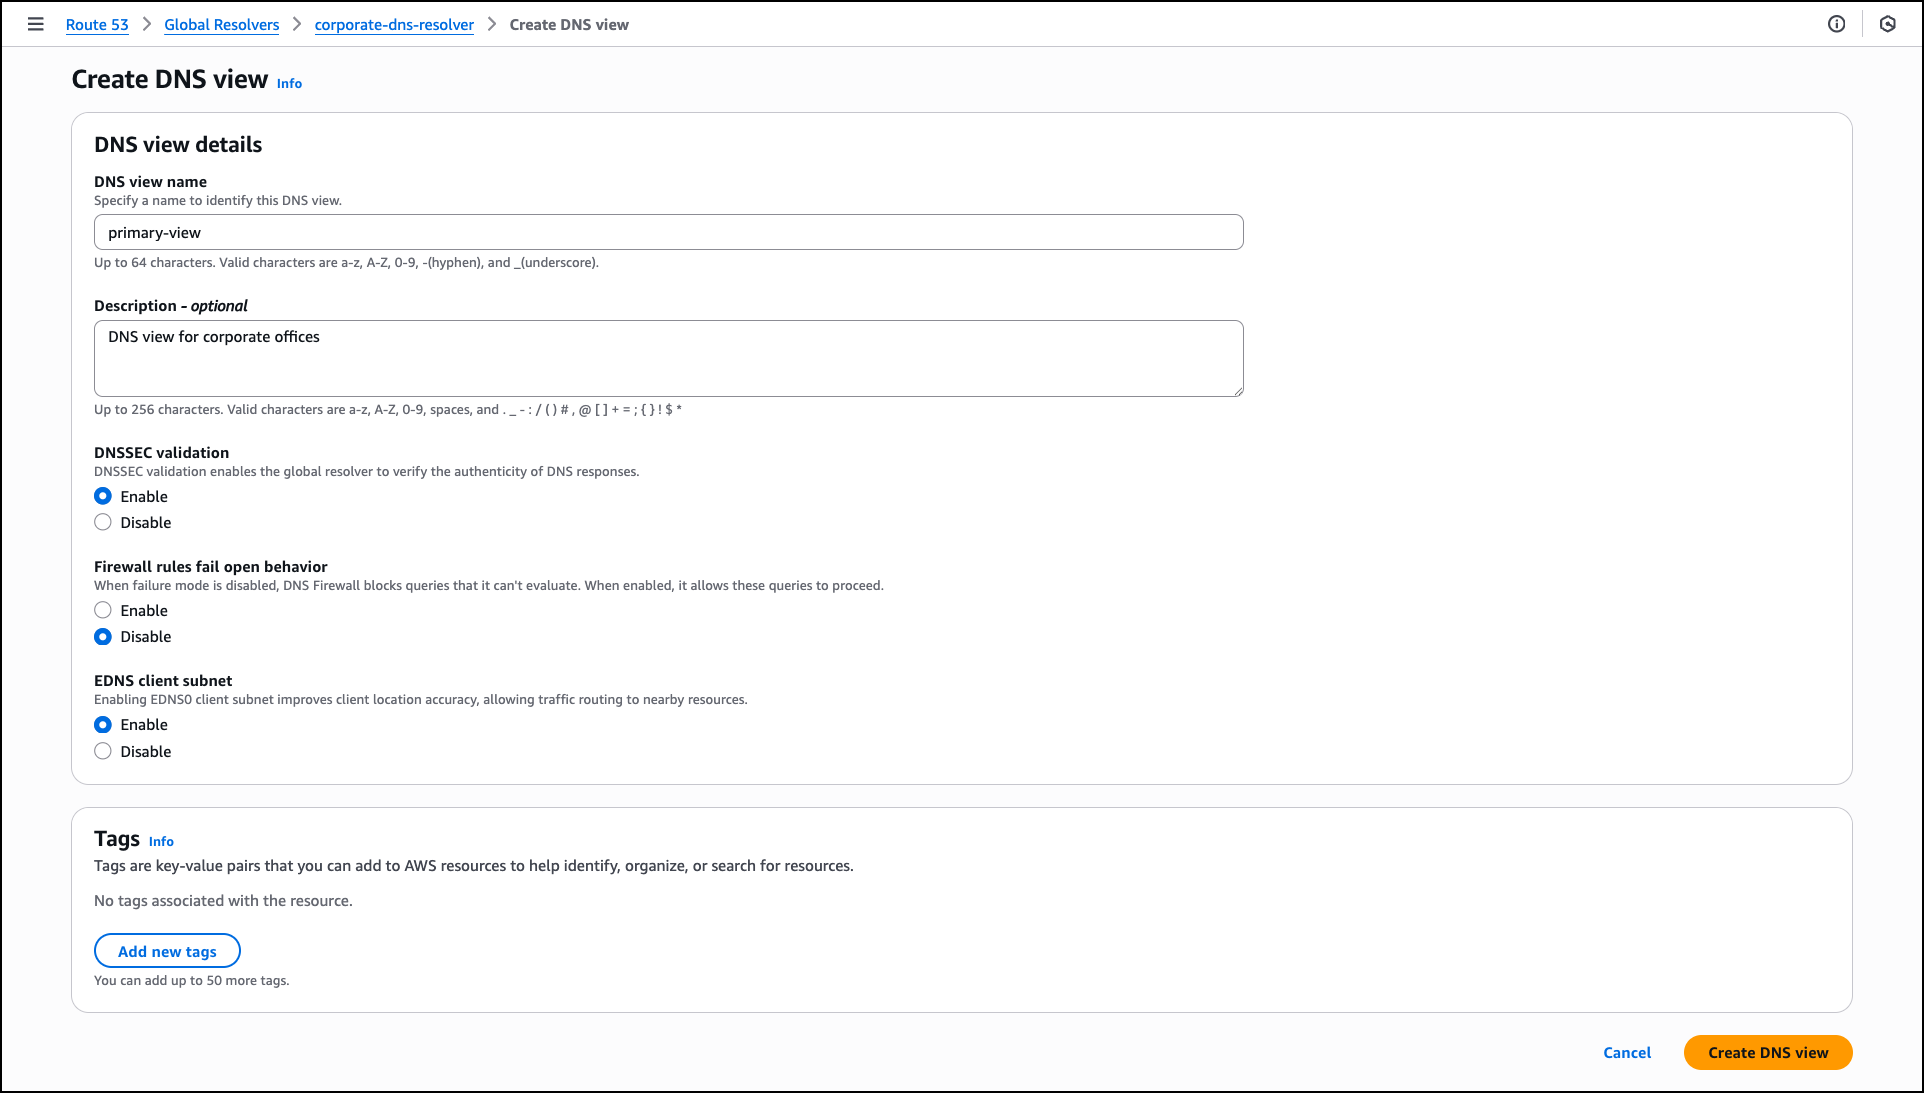
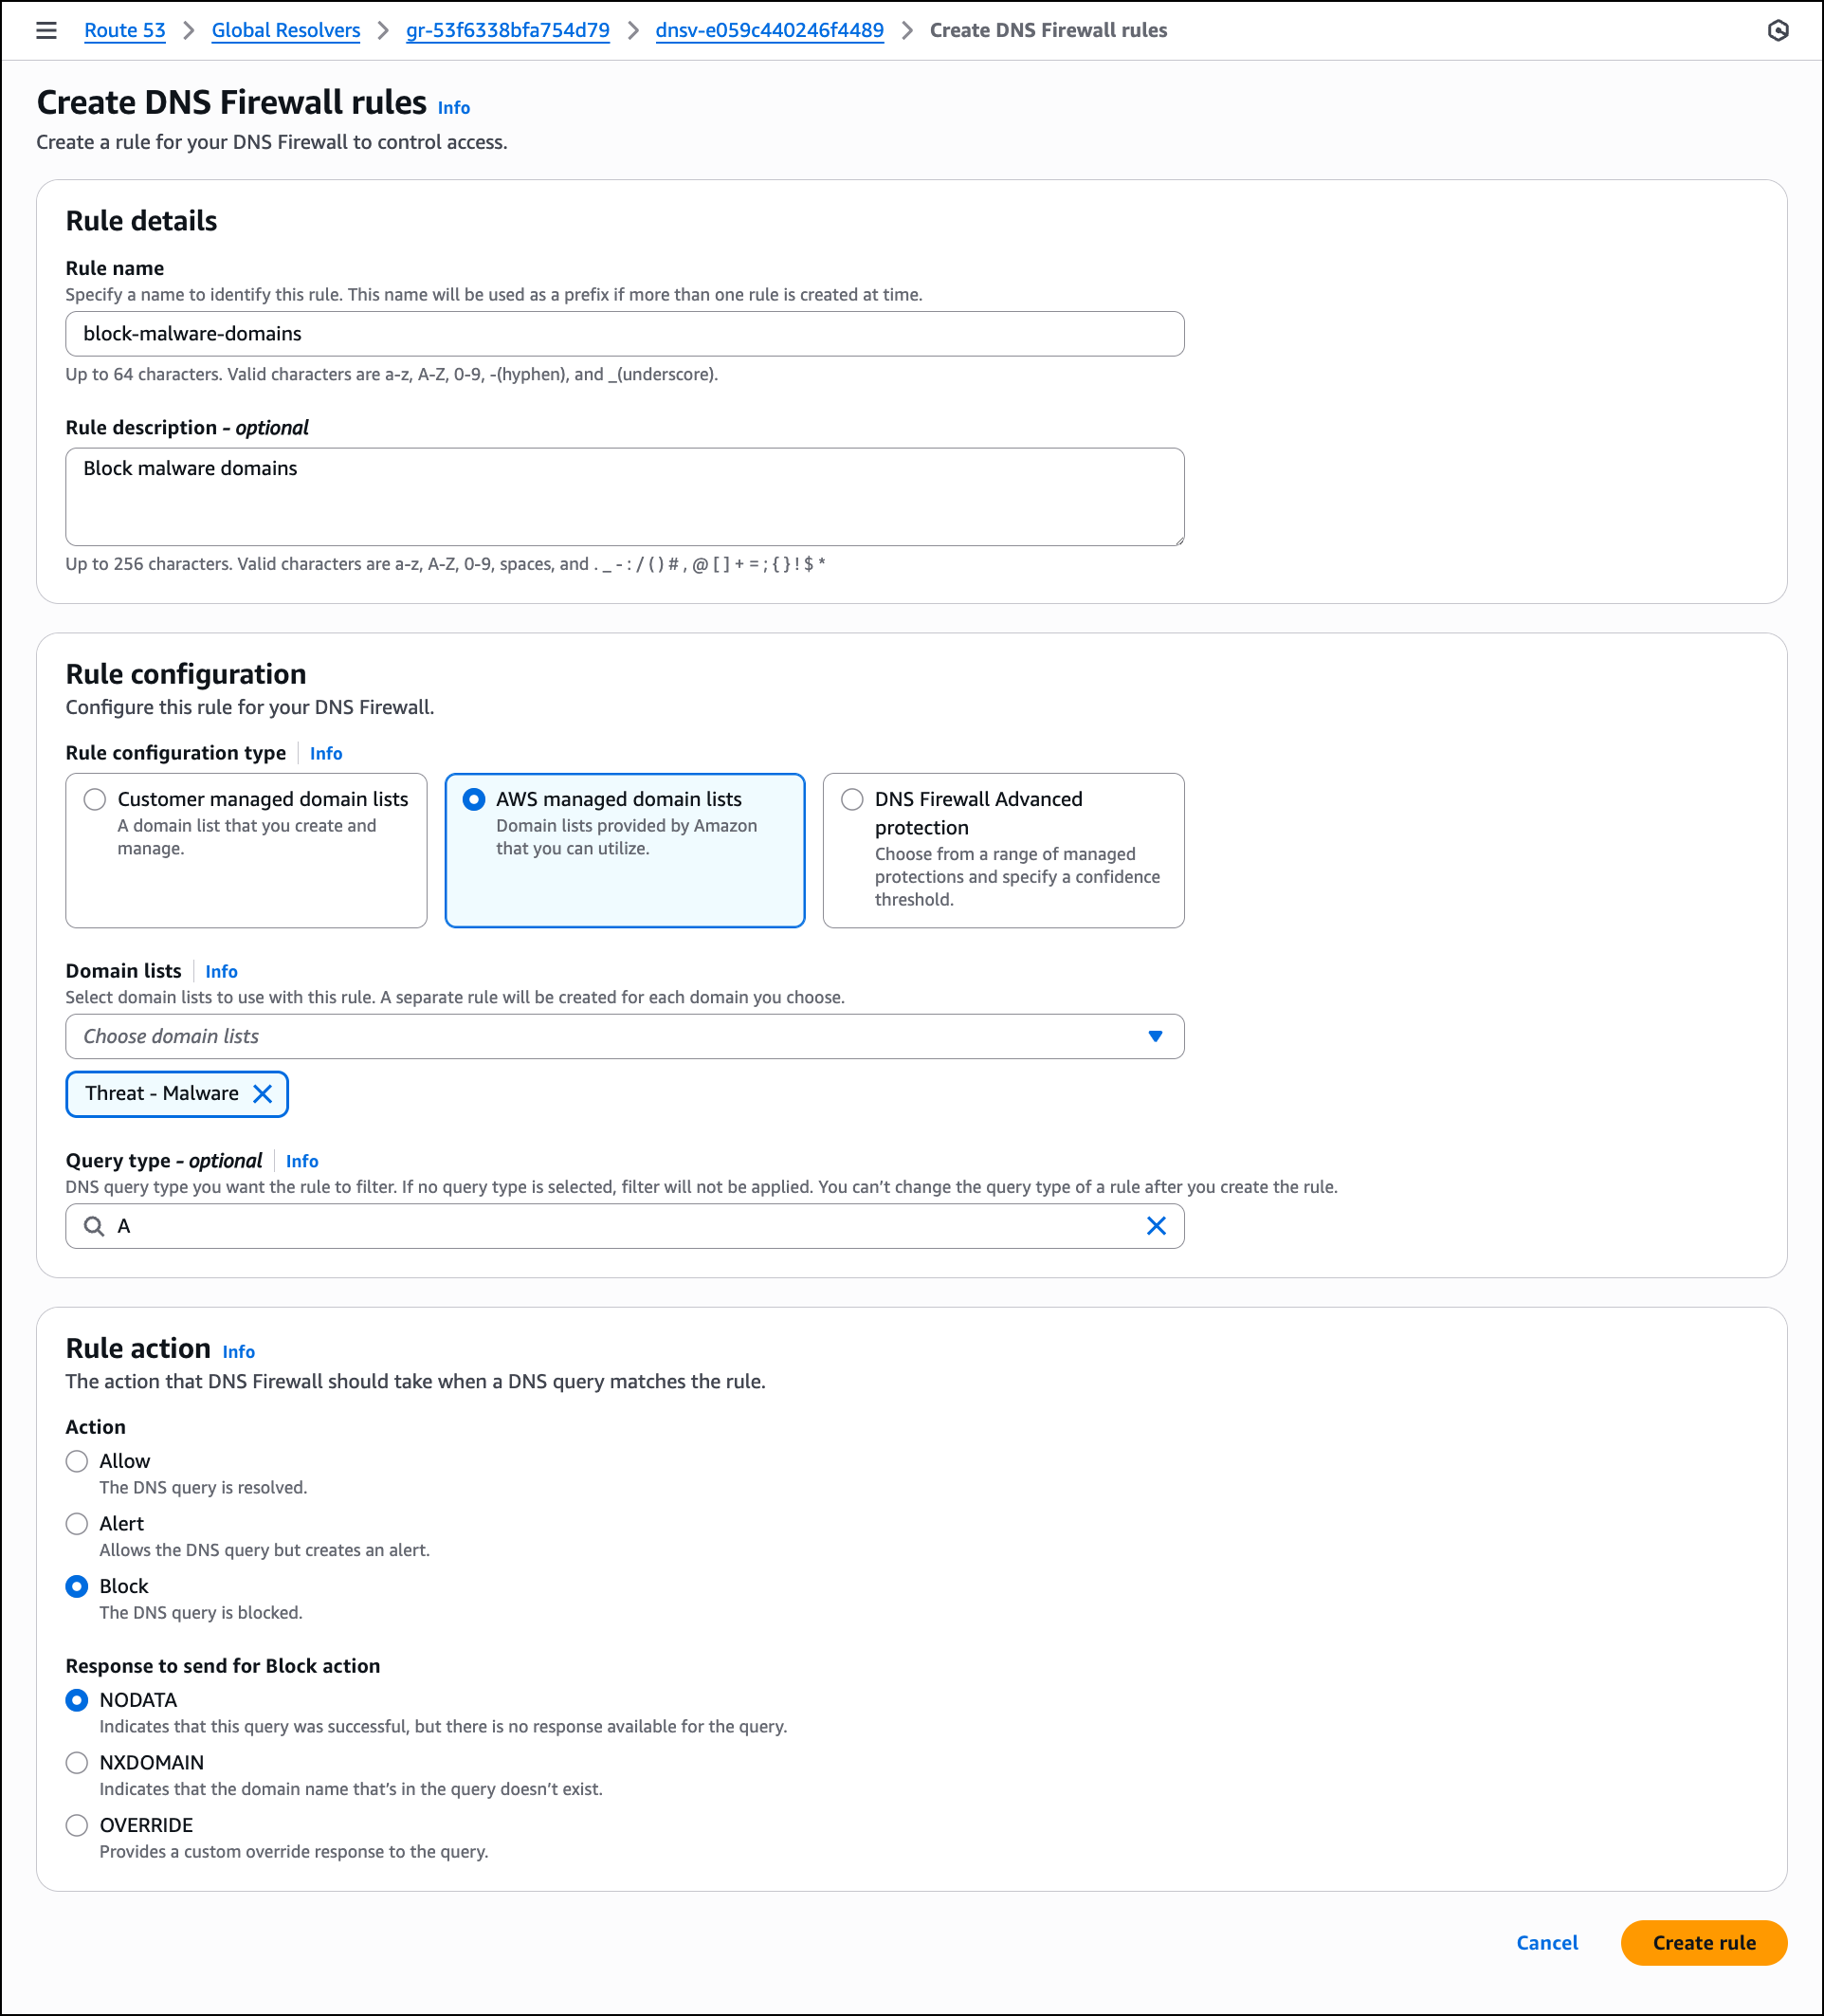
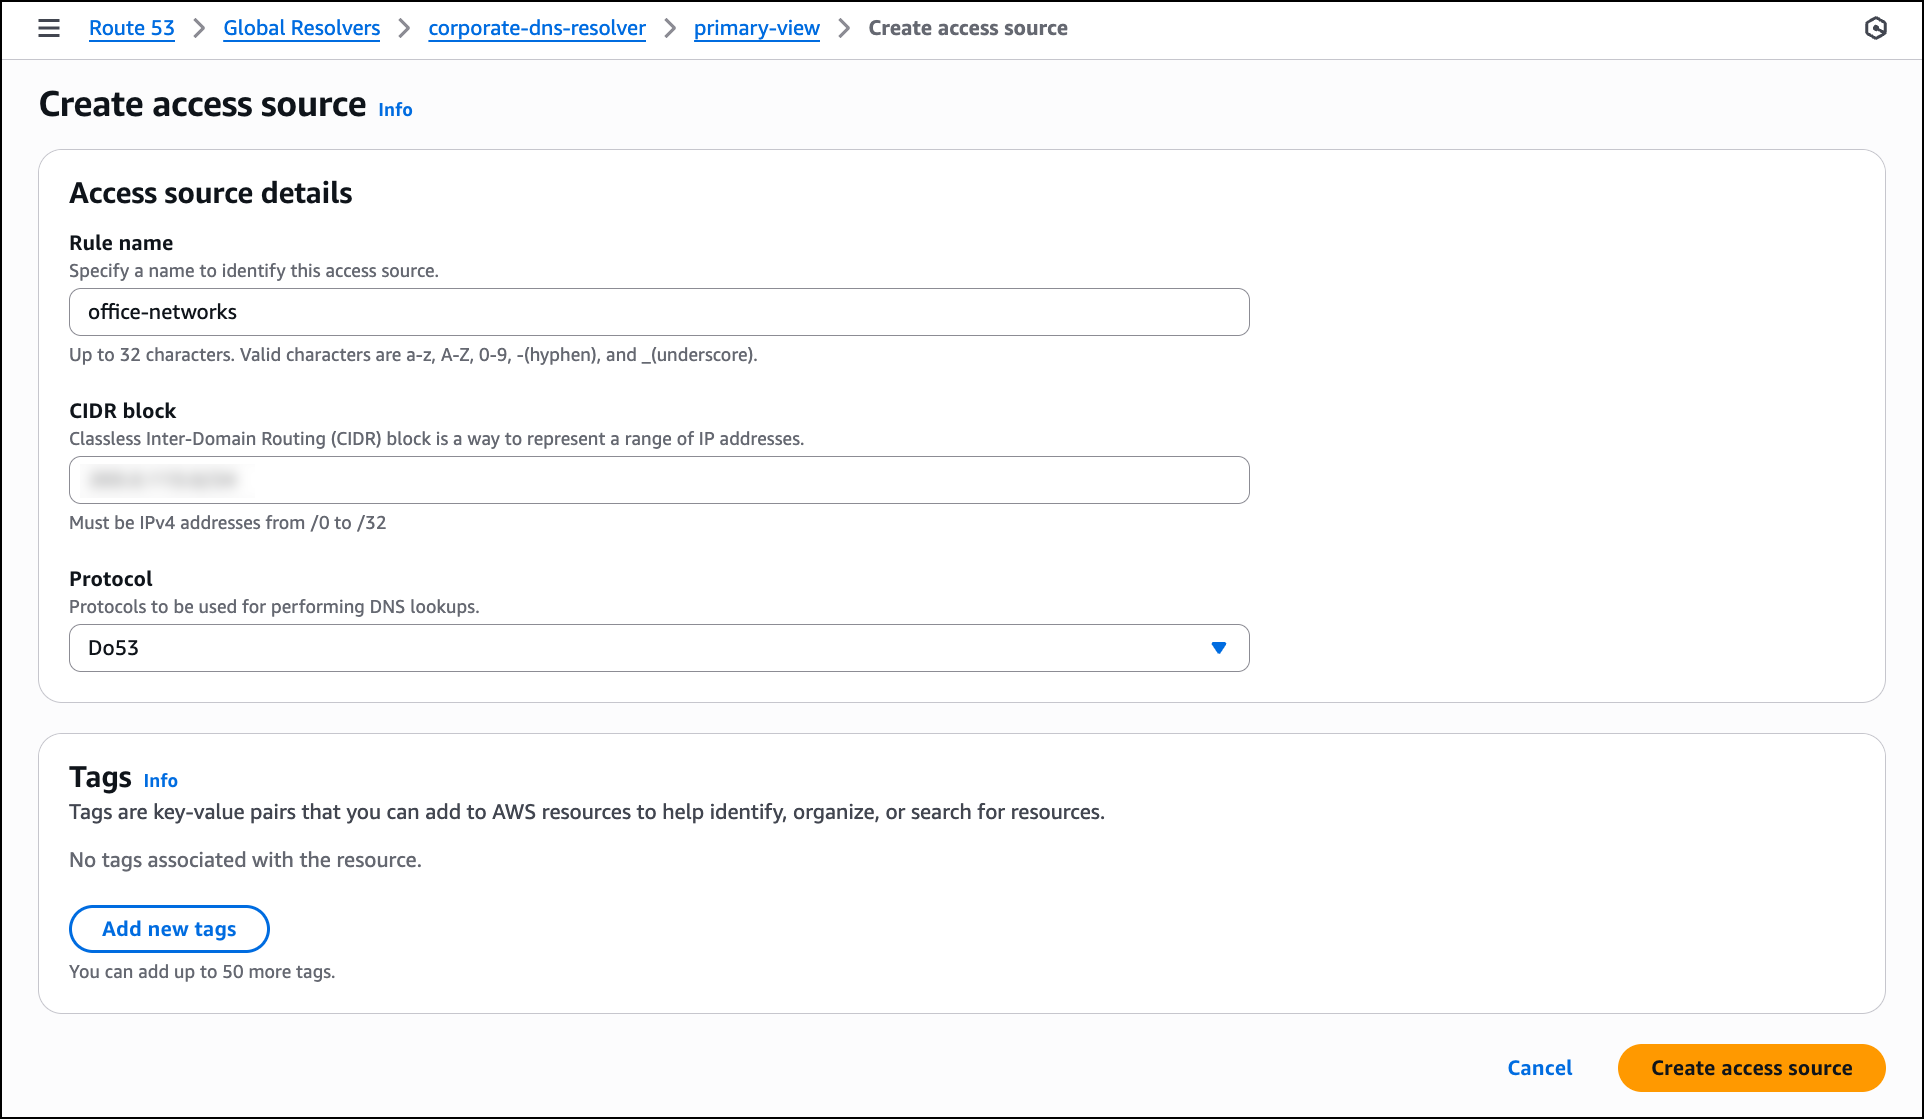
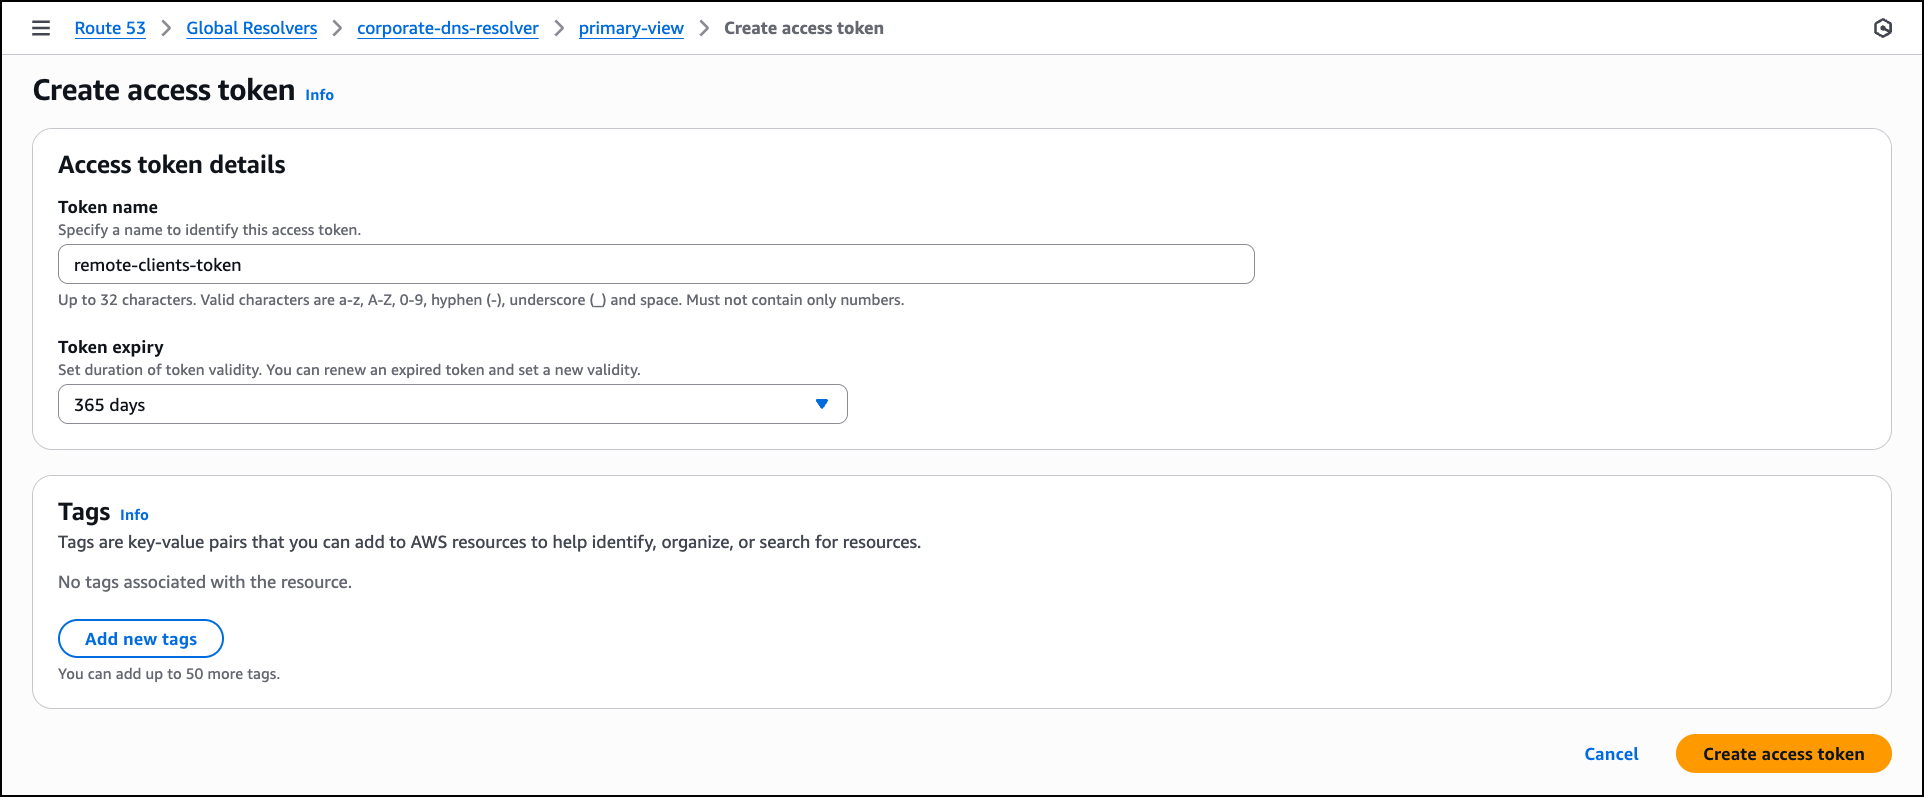
Today, we’re announcing virtual private cloud (VPC) encryption controls, a new capability of Amazon Virtual Private Cloud (Amazon VPC) that helps you audit and enforce encryption in transit for all traffic within and across VPCs in a Region.
Organizations across financial services, healthcare, government, and retail face significant operational complexity in maintaining encryption compliance across their cloud infrastructure. Traditional approaches require piecing together multiple solutions and managing complex public key infrastructure (PKI), while manually tracking encryption across different network paths using spreadsheets—a process prone to human error that becomes increasingly challenging as infrastructure scales.
Although AWS Nitro based instances automatically encrypt traffic at the hardware layer without affecting performance, organizations need simple mechanisms to extend these capabilities across their entire VPC infrastructure. This is particularly important for demonstrating compliance with regulatory frameworks such as Health Insurance Portability and Accountability (HIPAA), Payment Card Industry Data Security Standard (PCI DSS), and Federal Risk and Authorization Management Program (FedRAMP), which require proof of end-to-end encryption across environments. Organizations need centralized visibility and control over their encryption status, without having to manage performance trade-offs or complex key management systems.
VPC encryption controls address these challenges by providing two operational modes: monitor and enforce. In monitor mode, you can audit the encryption status of your traffic flows and identify resources that allow plaintext traffic. The feature adds a new encryption-status field to VPC flow logs, giving you visibility into whether traffic is encrypted using Nitro hardware encryption, application-layer encryption (TLS), or both.
After you’ve identified resources that need modification, you can take steps to implement encryption. AWS services, such as Network Load Balancer, Application Load Balancer, and AWS Fargate tasks, will automatically and transparently migrate your underlying infrastructure to Nitro hardware without any action required from you and with no service interruption. For other resources, such as the previous generation of Amazon Elastic Compute Cloud (Amazon EC2) instances, you will need to switch to modern Nitro basedinstance types or configure TLS encryption at application level.
You can switch to enforce mode after all resources have been migrated to encryption-compliant infrastructure. This migration to encryption-compliant hardware and communication protocols is a prerequisite for enabling enforce mode. You can configure specific exclusions for resources such as internet gateways or NAT gateways, that don’t support encryption (because the traffic flows outside of your VPC or the AWS network).
Other resources must be encryption-compliant and can’t be excluded. After activation, enforce mode provides that all future resources are only created on compatible Nitro instances, and unencrypted traffic is dropped when incorrect protocols or ports are detected.
Let me show you how to get started
For this demo, I started three EC2 instances. I use one as a web server with Nginx installed on port 80, serving a clear text HTML page. The other two are continuously making HTTP GET requests to the server. This generates clear text traffic in my VPC. I use the m7g.medium instance type for the web server and one of the two clients. This instance type uses the underlying Nitro System hardware to automatically encrypt in-transit traffic between instances. I use a t4g.medium instance for the other web client. The network traffic of that instance is not encrypted at the hardware level.
To get started, I enable encryption controls in monitor mode. In the AWS Management Console, I select Your VPCs in the left navigation pane, then I switch to the VPC encryption controls tab. I choose Create encryption control and select the VPC I want to create the control for.
Each VPC can have only one VPC encryption control associated with it, creating a one-to-one relationship between the VPC ID and the VPC encryption control Id. When creating VPC encryption controls, you can add tags to help with resource organization and management. You can also activate VPC encryption control when you create a new VPC.
I enter a Name for this control. I select the VPC I want to control. For existing VPCs, I have to start in Monitor mode, and I can turn on Enforce mode when I’m sure there is no unencrypted traffic. For new VPCs, I can enforce encryption at the time of creation.
Optionally, I can define tags when creating encryption controls for an existing VPC. However, when enabling encryption controls during VPC creation, separate tags can’t be created for VPC encryption controls—because they automatically inherit the same tags as the VPC. When I’m ready, I choose Create encryption control.
After a few minutes, I see this traffic in my logs:
flow-direction traffic-path srcaddr dstaddr srcport dstport encryption-status
ingress - 10.0.133.8 10.0.128.55 43236 80 1 # <-- HTTP between web client and server. Encrypted at hardware-level
egress 1 10.0.128.55 10.0.133.8 80 43236 1
ingress - 10.0.133.8 10.0.128.55 36902 80 1
egress 1 10.0.128.55 10.0.133.8 80 36902 1
ingress - 10.0.130.104 10.0.128.55 55016 80 0 # <-- HTTP between web client and server. Not encrypted at hardware-level
egress 1 10.0.128.55 10.0.130.104 80 55016 0
ingress - 10.0.130.104 10.0.128.55 60276 80 0
egress 1 10.0.128.55 10.0.130.104 80 60276 0
10.0.128.55 is the web server with hardware-encrypted traffic, serving clear text traffic at application level.
10.0.133.8 is the web client with hardware-encrypted traffic.
10.0.130.104 is the web client with no encryption at the hardware level.
The encryption-status field tells me the status of the encryption for the traffic between the source and destination address:
0 means the traffic is in clear text
1 means the traffic is encrypted at the network layer (Level 3) by the Nitro system
2 means the traffic is encrypted at the application layer (Level7, TCP Port 443 and TLS/SSL)
3 means the traffic is encrypted both at the application layer (TLS) and the network layer (Nitro)
“-” means VPC encryption controls are not enabled, or AWS Flow Logs don’t have the status information.
The traffic originating from the web client on the instance that isn’t Nitro based (10.0.130.104), is flagged as 0. The traffic initiated from the web client on the Nitro- ased instance (10.0.133.8) is flagged as 1.
I also use the console to identify resources that need modification. It reports two nonencrypted resources: the internet gateway and the elastic network interface (ENI) of the instance that isn’t based on Nitro.
I can also check for nonencrypted resources using the CLI:
How to modify the resources that are identified as nonencrypted?
All your VPC resources must support traffic encryption, either at the hardware layer or at the application layer. For most resources, you don’t need to take any action.
AWS services accessed through AWS PrivateLink and gateway endpoints automatically enforce encryption at the application layer. These services only accept TLS-encrypted traffic. AWS will automatically drop any traffic that isn’t encrypted at the application layer.
When you enable monitor mode, we automatically and gradually migrate your Network Load Balancers, Application Load Balancers, AWS Fargate clusters, and Amazon Elastic Kubernetes Service (Amazon EKS) clusters to hardware that inherently supports encryption. This migration happens transparently without any action required from you.
If you use newer-generation instances, you likely already have encryption-compliant infrastructure because all recent instance types support encryption. For older-generation instances that don’t support encryption-in transit, you’ll need to upgrade to supported instance types.
Something to know when using AWS Transit Gateway
When creating a Transit Gateway through AWS CloudFormation with VPC encryption enabled, you need two additional AWS Identity and Access Management (IAM) permissions: ec2:ModifyTransitGateway and ec2:ModifyTransitGatewayOptions. These permissions are required because CloudFormation uses a two-step process to create a Transit Gateway. It first creates the Transit Gateway with basic configuration, then calls ModifyTransitGateway to enable encryption support. Without these permissions, your CloudFormation stack will fail during creation when attempting to apply the encryption configuration, even if you’re only performing what appears to be a create operation.
Pricing and availability
You can start using VPC encryption controls today in these AWS Regions: US East (Ohio, N. Virginia), US West (N. California, Oregon), Africa (Cape Town), Asia Pacific (Hong Kong, Hyderabad, Jakarta, Melbourne, Mumbai, Osaka, Singapore, Sydney, Tokyo), Canada (Central), Canada West (Calgary), Europe (Frankfurt, Ireland, London, Milan, Paris, Stockholm, Zurich), Middle East (Bahrain, UAE), and South America (São Paulo).
VPC encryption controls is free of cost until March 1, 2026. The VPC pricing page will be updated with details as we get closer to that date.
To learn more, visit the VPC encryption controls documentation or try it out in your AWS account. I look forward to hearing how you use this feature to strengthen your security posture and help you meet compliance standards.
As organizations scale, managing access permissions for storage resources becomes increasingly complex and time-consuming. As new team members join, existing staff changes roles, and new S3 buckets are created, organizations must constantly update multiple types of access policies to govern access across their S3 buckets. This challenge is especially pronounced in multi-tenant S3 environments where administrators must frequently update these policies to control access across shared datasets and numerous users.
Today we’re introducing attribute-based access control (ABAC) for Amazon Simple Storage Service (S3) general purpose buckets, a new capability you can use to automatically manage permissions for users and roles by controlling data access through tags on S3 general purpose buckets. Instead of managing permissions individually, you can use tag-based IAM or bucket policies to automatically grant or deny access based on tags between users, roles, and S3 general purpose buckets. Tag-based authorization makes it easy to grant S3 access based on project, team, cost center, data classification, or other bucket attributes instead of bucket names, dramatically simplifying permissions management for large organizations.
How ABAC works Here’s a common scenario: as an administrator, I want to give developers access to all S3 buckets meant to be used in development environments.
With ABAC, I can tag my development environment S3 buckets with a key-value pair such as environment:development and then attach an ABAC policy to an AWS Identity and Access Management (IAM) principal that checks for the same environment:development tag. If the bucket tag matches the condition in the policy, the principal is granted access.
Let’s see how this works.
Getting started First, I need to explicitly enable ABAC on each S3 general purpose bucket where I want to use tag-based authorization.
I navigate to the Amazon S3 console, select my general purpose bucket then navigate to Properties where I can find the option to enable ABAC for this bucket.
I can also use the AWS Command Line Interface (AWS CLI) to enable it programmatically by using the new PutBucketAbac API. Here I am enabling ABAC on a bucket called my-demo-development-bucket located in the US East (Ohio) us-east-2 AWS Region.
Alternatively, if you use AWS CloudFormation, you can enable ABAC by setting the AbacStatus property to Enabled in your template.
Next, let’s tag our S3 general purpose bucket. I add an environment:development tag which will become the criteria for my tag-based authorization.
Now that my S3 bucket is tagged, I’ll create an ABAC policy that verifies matching environment:development tags and attach it to an IAM role called dev-env-role. By managing developer access to this role, I can control permissions to all development environment buckets in a single place.
I navigate to the IAM console, choose Policies, and then Create policy. In the Policy editor, I switch to JSON view and create a policy that allows users to read, write and list S3 objects, but only when they have a tag with a key of “environment” attached and its value matches the one declared on the S3 bucket. I give this policy the name of s3-abac-policy and save it.
I then attach this s3-abac-policy to the dev-env-role.
That’s it! Now a user assuming the dev-role can access any ABAC-enabled bucket with the tag environment:development such as my-demo-development-bucket.
Using your existing tags Keep in mind that although you can use your existing tags for ABAC, because these tags will now be used for access control, we recommend reviewing your current tag setup before enabling the feature. This includes reviewing your existing bucket tags and tag-based policies to prevent unintended access, and updating your tagging workflows to use the standard TagResource API (since enabling ABAC on your buckets will block the use of the PutBucketTagging API). You can use AWS Config to check which buckets have ABAC enabled and review your usage of PutBucketTagging API in your application using AWS Cloudtrail management events.
Additionally, the same tags you use for ABAC can also serve as cost allocation tags for your S3 buckets. Activate them as cost allocation tags in the AWS Billing Console or through APIs, and your AWS Cost Explorer and Cost and Usage Reports will automatically organize spending data based on these tags.
Enforcing tags on creation To help standardize access control across your organization, you can now enforce tagging requirements when buckets are created through service control policies (SCPs) or IAM policies using the aws:TagKeys and aws:RequestTag condition keys. Then you can enable ABAC on these buckets to provide consistent access control patterns across your organization. To tag a bucket during creation you can add the tags to your CloudFormation templates or provide them in the request body of your call to the existing S3 CreateBucket API. For example, I could enforce a policy for my developers to create buckets with the tag environment=development so all my buckets are tagged accurately for cost allocation. If I want to use the same tags for access control, I can then enable ABAC for these buckets.
Things to know
With ABAC for Amazon S3, you can now implement scalable, tag-based access control across your S3 buckets. This feature makes writing access control policies simpler, and reduces the need for policy updates as principals and resources come and go. This helps you reduce administrative overhead while maintaining strong security governance as you scale.
Attribute-based access control for Amazon S3 general purpose buckets is available now through the AWS Management Console, API, AWS SDKs, AWS CLI, and AWS CloudFormation at no additional cost. Standard API request rates apply according to Amazon S3 pricing. There’s no additional charge for tag storage on S3 resources.
You can use AWS CloudTrail to audit access requests and understand which policies granted or denied access to your resources.
You can also use ABAC with other S3 resources such as S3 directory bucket, S3 access points and S3 tables buckets and tables. To learn more about ABAC on S3 buckets see the Amazon S3 User Guide.
You can use the same tags you use for access control for cost allocation as well. You can activate them as cost allocation tags through the AWS Billing Console or APIs. Check out the documentation for more details on how to use cost allocation tags.
We’re pleased to announce the availability of the latest sample security baseline from Landing Zone Accelerator on AWS (LZA)—the Universal Configuration. Developed from years of field experience with highly regulated customers including governments across the world, and in consultation with AWS Partners and industry experts, the Universal Configuration was built to help you implement security and compliance at scale for on your regulated workloads. By setting a high bar with the latest AWS security best practices, the Universal Configuration can help address technical control requirements from compliance frameworks across different geographic regions and industry verticals. The Universal Configuration’s multi-account security architecture provides a foundation to host your diverse workload requirements today along with providing the ability to explore the generative AI and agentic AI solutions that will shape your organization in the future. It can also replace months of complex planning and design by deploying a comprehensive security and compliance-driven environment based on AWS Well-Architected principles in a matter of hours.
As organizations grow, they typically pursue or must adhere to new security compliance certifications. LZA and the Universal Configuration help organizations of all sizes and phases in their security and compliance journey. The speed of deployment, step-by-step documentation, and compliance resources can reduce traditional assessment and authorization timelines by months and result in more predictable and successful audit outcomes. This enables more freedom to invest resources to grow the business instead of choosing between security and compliance tradeoffs.
The Universal Configuration helps organizations:
Automate the deployment of a secure multi-account AWS environment
Foundational security controls based on AWS Well-Architected best practices
Apply consistent and predictable security controls post-deployment
Enable and integrate with native AWS security, identity, and compliance services
Implement controls across system layers
Organization-wide security architecture
Perimeter and resource-specific preventative, proactive, and detective controls
Support for multi-AWS Region resilience, disaster recovery, and active failover
Establish a foundation for security and compliance readiness
Built-in AWS security best practices and technical implementation statements
Map LZA capabilities across global and industry-specific compliance frameworks
Deploy hundreds of controls hours instead of months
The LZA Compliance Workbook
The LZA engine has been a trusted tool for quickly deploying secure multi-account AWS environments for over 4 years. It is also cost effective because you pay only for the AWS services used to operate your environment. The Universal Configuration is the first sample configuration accompanied by the LZA Compliance Workbook available on AWS Artifact. It’s a first-of-its-kind resource with detailed control mappings showing how the Universal Configuration can help you address requirements from frameworks including NIST 800-53 Rev5, CMMC/NIST 800-171, ISO-27001, HIPAA, C5:2020, NATO D-32 (Appendix B), and DoD CCI.
The LZA Compliance Workbook is regularly maintained to reflect the latest Universal Configuration baseline and will include additional compliance mappings in future releases. The workbook contains detailed security configuration descriptions based on the Universal Configuration deployment files, along with control requirement mappings and implementation statements that translate its security capabilities into a compliance-friendly format. By combining AWS security best practices with global compliance expertise, the Universal Configuration delivers predicable security outcomes while also helping you meet regional and industry requirements.
Getting started
To get started with the Landing Zone Accelerator on AWS Universal Configuration, the LZA Implementation Guide walks you through the steps, use cases, and considerations when deploying with LZA. You can download the LZA Compliance Workbook from AWS Artifact today and configure notifications to receive emails when future versions are released. You can view the deployment files and additional technical implementation guidance on the GitHub Universal Configuration sample and documentation page. Additionally, visit the AWS Partner Network (APN) for help with audit and advisory initiatives, cloud migrations, deploying the LZA Universal Configuration, and other services. You can visit the AWS Partner Finder tool and search by solution for Landing Zone Accelerator for the latest LZA Partner offerings.
If you have feedback about this post, submit comments in the Comments section below.
Organizations are scaling their data catalogs faster than ever. Maintaining consistent metadata standards across teams remains a challenge. Business glossaries define the language of the enterprise—terms like Customer Profile, Transaction, or Confidential Data—but assets are often published without these classifications, leading to inconsistent metadata and poor discoverability.
To address this, Amazon SageMaker Catalog now supports metadata enforcement rules for glossary terms classification (tagging) at the asset level. With this capability, administrators can require that assets include specific business terms or classifications. Data producers must apply required glossary terms or classifications before an asset can be published. This enforces metadata consistency across the catalog and makes sure assets carry the business context needed for effective discovery and governance.
This capability builds on existing metadata rule features for enforcing required metadata fields during asset publishing. The new addition extends those rules to cover glossary term validation, strengthening the link between business language and technical data assets.
In this post, we show how to enforce business glossary classification rules in SageMaker Catalog.
Why metadata enforcement matters
A common governance challenge is the lack of standardized tagging and classification for assets entering enterprise catalogs. Without enforcement, data producers might publish assets missing required business terms (such as data sensitivity level or product domain), resulting in inconsistent metadata that confuses business users, unreliable search and filtering results, and manual cleanup and downstream compliance risks.
By automatically validating metadata at publish time, SageMaker Catalog validates metadata when assets are published. This offers the following key benefits:
Assets are classified with approved business terms before publication
Validation supports compliance with internal glossary and classification standards
Consistent tagging enhances search accuracy and reduces noise
Incomplete or incorrectly tagged assets don’t reach consumers
How metadata enforcement works
On the Amazon SageMaker Unified Studio console, administrators navigate to Catalog, Governance, Rules and create metadata rules targeting the asset publishing workflow. Rules can specify required glossary terms or classification fields (for example, Business Unit, PII Category, or Data Sensitivity). Rules can apply organization-wide or within specific domains or projects.
When a producer attempts to publish an asset, SageMaker Catalog checks that the asset includes the required glossary terms or classifications. If any required metadata is missing, the publish action fails with a clear error message. After the metadata is added, the asset can be published successfully.
Enforced tagging makes sure published assets can be searched and filtered using consistent business terminology, improving catalog usability for analysts and business users.
Solution overview
For this post, we explore a financial services use case. Our example a financial services company defines a rule requiring all datasets published from the project to have ‘Finance’ glossary associated:
A data producer attempting to publish a new dataset without this tag receives a validation error
After applying the correct classification, the dataset publishes successfully
Analysts can now filter the catalog to find only Finance datasets or join assets consistently tagged with the same glossary term
In the following sections, we walk through the steps to configure this solution. We create a rule that all assets published from a specific project should have a business unit tag called Finance.
Prerequisites
To test this solution, you should have a SageMaker Unified Studio domain set up with a domain owner or domain unit owner privileges. You should also have an existing project to publish assets and catalog assets. For instructions to create these assets, see the Getting started guide.
Complete the following steps to create a new glossary and add terms:
In SageMaker Unified Studio, on the Discover menu, choose Glossaries.
Choose Create glossary.
Provide details for your glossary, including name, owning project, and optional description.
For Glossary restriction, turn on Enabled.
Choose Create.
Create the term Finance in the Business Unit Details glossary.
Create rule to enforce glossary terms
Complete the following steps to create a rule to define glossary terms:
On the Govern menu, choose Domain units.
On the Rules tab, choose Add.
Add a publishing rule for the Finance project to have the Finance tag for all assets published to the catalog.
Choose Add rule. The following screenshot shows the configuration details for your new rule.
Publish asset with enforced rules
Complete the following steps to publish your asset with the enforced rules:
On the financial_analysis project page, go to your asset.
In the Glossary terms section, choose Add terms. If you choose Publish without adding the needed term, you get an error stating the Finance term should be assigned.
Choose Finance to add the required term.
Choose Publish asset.
The following screenshot shows the published asset and the required terms in the glossary.
Conclusion
With metadata enforcement rules for glossary terms, SageMaker Catalog brings stronger control and consistency to how organizations publish and manage their data assets. By requiring approved business classifications before publication, teams can make sure assets adhere to enterprise metadata standards, improving governance, discoverability, and trust in shared catalogs. This capability helps organizations scale their catalog governance without adding manual overhead—embedding compliance and quality directly into the publishing workflow.
Metadata enforcement rules for glossary terms are available in AWS Regions where SageMaker Catalog operates. Get started with this capability, refer to the user guide.
Amazon SageMaker Catalog now supports custom metadata forms and rich text descriptions at the column level, extending existing curation capabilities for business names, descriptions, and glossary term classifications.
With these new features, data stewards can define and capture business-specific metadata directly in individual columns, and authors can use markdown-enabled rich text to provide detailed documentation and business context. Both form fields and formatted descriptions are indexed in real time, making them immediately discoverable through catalog search.
Column-level context is essential for understanding and trusting data. This release helps organizations improve data discoverability, collaboration, and governance by letting metadata stewards document columns using structured and formatted information that aligns with internal standards.
In this post, we show how to enhance data discovery in SageMaker Catalog with custom metadata forms and rich text documentation at the schema level.
Key capabilities
SageMaker Catalog now offers the following key capabilities:
Custom metadata forms – Data stewards can now use custom metadata forms to capture organization-specific metadata fields for columns such as Business Owner, Regulatory Classification, Units of Measure, or Approved Use Case. Each field is stored as a key-value pair and indexed for search, enabling business-level queries like “find columns where sensitivity = confidential.”
Rich text (markdown) descriptions – Each column supports a markdown-enabled description field. Authors can format text with headings, bullet lists, and hyperlinks to add deeper business or operational context—for example, logic definitions, sample values, or data lineage references.
Real-time indexing for search – Custom form values and rich text content are indexed as soon as they are saved. Users can search using a metadata value, keyword, or glossary term across columns.
Solution overview
For this post, we explore a financial services use case. Our example financial services organization defines a column metadata form that includes several fields, as illustrated in the following table.
Field
Example Value
Approved Use Case
Financial revenue modeling
Business Owner
Finance Office
Domain
RF
For a dataset column named revenue, the author adds the following markdown description:
# Business Revenue
- Use for Financial Modeling
- Use only for batch use cases
When analysts search for Domain = RF, this column appears in results with complete business context.
In the following sections, we demonstrate how to use to use metadata forms for columns and add rich text descriptions that is searchable.
Prerequisites
To test this solution, you should have an Amazon SageMaker Unified Studio domain set up with a domain owner or domain unit owner privileges. You should also have an existing project to publish assets and catalog assets. For instructions to create these assets, see the Getting started guide.
Complete the following steps to create a new metadata form:
In SageMaker Unified Studio, go to your project.
Under Project catalog in the navigation pane, choose Metadata entities.
Choose Create metadata form.
Provide an optional display name, a technical name, and an optional description, then choose Create metadata form.
Define the form fields. In this example, we add the fields Domain, Business Owner, and Approved Use Case.
For Requirement Options, select the configuration for each field. For our use case, we select Always required.
Choose Create field.
Turn on Enabled so the form is visible and can be used for assets.
Attach metadata form to column
Complete the following steps to attach the metadata form to a column:
Under Project catalog in the navigation pane, choose Assets.
Search for and select your asset (for this example, we use the asset business_finance).
On the Schema tab, choose View/Edit next to the revenue field.
Choose Add metadata form.
Choose the form you created and choose Add.
Add details for the metadata form fields
Add additional context as formatted text
Next, we enter a rich text description for each column using the markdown editor, including headings, bullet lists, links, and sample values. Complete the following steps:
Choose Edit next to README for the revenue field where you added the metadata form.
Enter details and choose Save.
Choose Preview to view the formatted README at the column level.
Publish and verify search
Now you’re ready to publish the asset. The metadata form values and markdown descriptions become part of the catalog record and are indexed for search. You can also see the history of revisions on the History tab. Other project users can see the metadata form and rich text description for the published assets and subscribe to the data asset. You can create more data products with these assets, and they will also have the column metadata form and README.
In the catalog search UI, data users can now filter on custom form fields (for example, “Domain = RF”) or search in natural language for text that matches the column description.
Best practices
Consider the following best practices when using this feature:
Define metadata forms aligned with your business vocabulary (domains, owners, sensitivity levels) proactively before publishing assets at scale.
Make column descriptions actionable—include business definitions, value ranges, logic, update cadence, and dependencies.
Verify the catalog indexing is timely; publish changes proactively so search results reflect new metadata.
Use governance controls. You can combine column-level metadata with existing asset-level templates and approval workflows to enforce publishing standards.
Monitor search usage and metadata completeness; target high-value datasets for complete column-level documentation first.
Do not store confidential or sensitive information in your metadata forms.
Conclusion
With column-level metadata forms and rich text descriptions, SageMaker Catalog helps organizations deliver higher-quality metadata, stronger governance, and better data discovery. These features make it straightforward for teams to capture complete business context and for analysts to quickly locate and understand the data they need.
Custom metadata forms and rich text descriptions at the column level are now available in AWS Regions where SageMaker is supported.
Today, AWS announced a new tenant isolation mode for AWS Lambda, that allows you to process function invocations in separate execution environments for each application end-user or tenant invoking your Lambda function. This capability simplifies building secure multi-tenant SaaS applications by managing tenant-level compute environment isolation and request routing for you. As a result, you can focus on your core business logic rather than implementing your own tenant-aware compute environment isolation.
Overview
Lambda runs your function code in secure execution environments that leverage Firecracker virtualization to provide isolation. These execution environments never share or reuse virtual resources (such as vCPU, disk, or memory) across functions, or even across different versions of the same function. However, Lambda can reuse execution environments for multiple invocations of the same function version, as these execution environments are fully set-up and can therefore deliver faster request processing for your functions.
Figure 1. Incoming invocations processed by a collection of execution environments that belong to a single function.
Multi-tenant SaaS applications that handle sensitive tenant-specific data or execute code supplied dynamically by tenants may need a higher degree of isolation—at the individual application tenant level rather than at the function level—for secure code execution and to reduce the risk of cross-tenant data access.
Prior to today’s launch, developers would implement custom solutions, such as SDKs or application logic to manage isolation within function code. This approach was bug-prone, required more work from application development teams, and didn’t ensure isolation at the compute environment level.
Alternatively, developers adopted the approach of creating separate functions per application tenant, replicating the same code across hundreds or thousands of tenants. This approach provided stronger compute environment isolation than sharing compute environments across multiple tenants of the same function, but increased implementation overhead and operational complexity as workloads grew to support a larger number of tenants over time.
Figure 2. Using function-per-tenant model, each tenant’s requests are processed by a separate function.
Starting today, AWS Lambda offers a new tenant isolation mode that lets you isolate execution environments used across different tenants of your multi-tenant SaaS applications, even when all of the tenants invoke the same function. When you enable the new tenant isolation mode, you include a tenant identifier with each function invocation. Lambda uses this identifier to route the request to the correct execution environment. As a result, each execution environment is reused only for invocations from the same tenant. This means you still get the performance benefits of warm execution environments, while ensuring that each tenant’s workloads remain isolated.
Figure 3. With the new tenant isolation capability, Lambda creates separate execution environments per tenant for a single function.
For organizations handling sensitive tenant-specific data or running untrusted code supplied dynamically by end-users, Lambda’s new tenant isolation mode provides the security benefits of per-tenant compute environment separation without the operational complexity of managing individual functions or infrastructure for each tenant.
Example scenario
Consider building a multi-tenant serverless SaaS application. To optimize performance, your function handler can retrieve tenant-specific configuration and data, cache it in memory, and reuse it for subsequent invocations from the same tenant. For example, you might cache tenant-specific database location, feature flags, or business rules that are frequently accessed during request processing. You may store this information within the application runtime process as global variables or as files in the /tmp directory. However, if the underlying execution environment is used to serve multiple tenants, this approach can potentially expose data across tenants.
With tenant isolation mode you can address this risk with much simpler architecture and configuration. This built-in capability makes Lambda an excellent choice for multi-tenant SaaS applications needing isolated compute environments for individual tenants.
Getting Started with Lambda Tenant Isolation Mode
Use the new tenancy-config parameter to configure tenant isolation mode when you create your function. You can only apply this configuration at function creation time; it cannot be updated for existing functions. The following snippet creates a function with tenancy config using the AWS CLI.
After the function is created, you must provide the tenant ID parameter with each invocation. Lambda uses this identifier to ensure that the execution environment used for a particular tenant is never reused for other tenants. For subsequent invocations from the same tenant, Lambda may reuse the execution environment to optimize performance. Specify this tenant-id parameter as illustrated below:
The new tenant-id parameter is required for functions using the tenant isolation mode. Function invocations omitting this parameter will fail with an invocation error, as shown below:
aws lambda invoke --function-name multitenant-function out.json
An error occurred (InvalidParameterValueException) when calling the Invoke operation:
The invoked function is enabled with tenancy configuration.
Add a valid tenant ID in your request and try again.
Lambda makes the tenant ID parameter available through your function handler’s context object. This allows you to access tenant-specific information in your code, for example if you wish to implement custom logic based on the tenant identity, as shown below:
exports.handler = async function (event, context) {
const tenantId = context.tenantId;
// Process tenant-specific logic
return {
statusCode: 200,
body: `OK for tenantId=${tenantId}`
};
};
The following table outlines differences between Lambda functions with and without tenant isolation mode enabled:
Feature
Without the new tenant isolation mode
With the new tenant isolation mode
Execution environment isolation
Isolated per function version.
Isolated per end-user or tenant invoking a function version.
Execution environment reuse
Can be reused to process all invocations of a function version.
Can only be reused to process invocations from the same tenant invoking a function version.
Data stored on local disk and in-memory
Potentially accessible across all invocations of a function version.
Potentially accessible across invocations from the same tenant. Not accessible for invocations from other tenants.
Cold starts
Occur when there are no warm execution environments available to process incoming invocation.
Occur when there are no tenant-specific warm execution environments available to process incoming invocation. More cold starts expected due to tenant-specific execution environments.
Integrating with Amazon API Gateway
Amazon API Gateway uses Lambda’s Invoke API to invoke Lambda functions. When using the Invoke API, Lambda expects the tenant ID parameter to be passed using the X-Amz-Tenant-Id HTTP header. You can configure API Gateway to inject this HTTP header into the Lambda invocation request with a value obtained from client request properties such as HTTP header, query parameter, or path parameter. When using Lambda Authorizers, you can obtain the value from authorization context information returned by the authorizer, such as principal ID or JWT claim. See API Gateway documentation to learn how you can return authorization information from Lambda authorizers to be used for the X-Amz-Tenant-Id header value.
Figure 4. Obtaining X-Amz-Tenant-Id header value from authentication sources.
The following screenshot illustrates API Gateway Lambda integration configuration, where the incoming request to API Gateway includes an x-tenant-id header that is mapped to the X-Amz-Tenant-Id request header to invoke a Lambda function using tenant isolation mode.
Figure 5. Mapping client request header to Lambda tenant-id header.
The following code snippet illustrates this configuration implemented with the AWS CDK.
const lambdaIntegration = new ApiGw.LambdaIntegration(fn, {
requestParameters: {
// This configures API Gateway to inject X-Amz-Tenant-Id header
// into downstream requests. The header value is obtained from
// x-tenant-id header in the client request.
'integration.request.header.X-Amz-Tenant-Id': 'method.request.header.x-tenant-id'
}
});
resource.addMethod('GET', lambdaIntegration, {
requestParameters: {
// This enables API Gateway to use the x-tenant-id header value
// obtained from the client request. The header name is arbitrary.
// you can use any other header name.
'method.request.header.x-tenant-id': true
}
});
Tenant-aware observability
For functions using tenant isolation, Lambda automatically includes the tenant ID in function logs when you have JSON logging enabled, making it easier to monitor and debug tenant-specific issues. Note that the tenantId property is available during function invocation, rather than during function initialization. The tenantId property is included for both platform events (like platform.start and platform.report) and custom logs you print in your function code, as shown in the following screenshot:
Figure 6. Lambda function logs with tenantId.
Lambda creates a separate CloudWatch log stream for each execution environment. You can use CloudWatch Log Insights to find log streams that belong to a particular tenant by filtering by tenant Id:
fields @logStream, @message
| filter tenantId=='BlueTenant' or record.tenantId=='BlueTenant'
| stats count() as logCount by @logStream
| sort @timestamp desc
You can also retrieve tenant-specific logs across all log streams:
fields @message
| filter tenantId=='BlueTenant' or record.tenantId=='BlueTenant'
| limit 1000
Each log stream starts with function initialization logs followed by the invocation logs. This structure helps you to debug tenant-specific issues and understand the lifecycle of each tenant’s execution environments.
Considerations
When using the new tenant isolation for Lambda functions, consider the following:
Each tenant’s execution environments are isolated from other tenants so that tenant-specific data stored on disk or in memory remain separated from other tenants invoking the same Lambda function.
All tenants share the function’s execution role. For more fine-grained permissions for individual tenants, consider propagating tenant-scoped credentials from the upstream application components invoking your Lambda function.
Your application may experience higher percentage of cold starts, as Lambda processes requests in separate execution environments for each tenant invoking your functions.
You pay a fee for each new tenant-specific execution environment created, depending on the memory configured for your function. See Lambda pricing page for details.
Best practices
When using the new tenant isolation mode for Lambda functions, AWS recommends the following best practices:
Implement robust tenant ID validation at the application layer to prevent unauthorized access through tenant ID manipulation. Consider using a dedicated service or database to maintain valid tenant IDs.
Monitor and audit tenant access patterns regularly to detect potential security anomalies or unauthorized cross-tenant access attempts.
Be aware of Lambda concurrency quotas when building multi-tenant applications. You might need to request quota increases based on your tenant count and usage patterns.
Sample code
Follow the instructions in this GitHub repository to provision a sample project in your own account and see the new Lambda tenant isolation mode in action. The sample project illustrates how to integrate a function using the new tenant isolation mode with Amazon API Gateway and propagate tenant identity from client requests.
Conclusion
The new tenant isolation mode for Lambda simplifies building serverless multi-tenant SaaS applications on AWS. By automatically managing application tenant-level compute environment isolation, this capability eliminates the need for custom isolation logic or separate tenant functions, allowing you to focus on the core business logic while AWS handles the complexities of tenant-aware compute environment isolation.
Combined with the existing security features in Lambda, rapid scaling, and pay-per-use pricing, tenant isolation mode makes Lambda an even more compelling choice for modern SaaS applications, whether you’re building new solutions or enhancing existing ones.
Amazon API Gateway now provides a fully managed portal feature, Amazon API Gateway Portal, that eliminates the need for static websites, open source solutions, or third-party offerings, which often led to fragmented API lifecycle management and increased costs. API Gateway Portal integrates with the API Gateway service and offers features like API products, interactive “Try it” functionality, and documentation for your API portfolio.
This fully managed solution addresses the need for a seamless way to showcase APIs and help developers quickly find, try, and integrate with them. By providing a managed solution that handles infrastructure, security, and scalability, API providers can focus on creating valuable APIs and delivering a great developer experience.
In this post, we will show how you can use the new portal feature to create customizable portals with enhanced security features in minutes, with APIs from multiple accounts, without managing any infrastructure.
Overview
A developer portal is a web page where API providers can share their APIs and API documentation by grouping them into portal products. Each portal product is a logical grouping of REST APIs and contains the documentation that you create and publish for your API consumers. Product pages within a portal contain the custom documentation at the portal product level. Product REST endpoint pages contain the documentation for each of the REST APIs with the details of the path and method of a REST API and the stage it’s deployed to. The combination of Product pages and Product REST endpoint pages provide the complete documentation for our API consumers on how to start using your REST APIs.
This abstraction allows you to organize endpoints from multiple APIs and stages into coherent product offerings for your consumers. For example, if you operate multiple APIs supporting a pet adoption service, you can create an “AdoptAnimals” portal product that groups dog-related endpoints from one API with cat-related endpoints from another API, while organizing user management functions into a separate “AdoptProcess” portal product.
With this flexibility you can present your APIs in a way that matches your business logic rather than your technical architecture and organize your APIs in ways that make the most sense for your consumers. For large enterprises managing extensive API portfolios, API Gateway Portal offers centralized catalogs of APIs across business groups, reducing duplicate work and improving standardization.
The portal feature automatically creates developer portals that display APIs with documentation, interactive testing capabilities, and integrated consumer analytics. The platform uses AWS Resource Access Manager (RAM) for multi-account API sharing, Amazon Cognito for access control, and Amazon CloudWatch for centralized monitoring.
Key features of API Gateway Portal
The API Gateway Portal provides comprehensive functionality for both API providers and consumers.
The following is a list of the key features that were introduced by the service at launch:
Customizable portal experience: You control your portal’s branding through custom logos and color schemes. You can configure custom domain names with SSL certificates managed by AWS Certificate Manager, or use the default domain structure provided by AWS.
Flexible access control: Access to developer portals can be controlled using Amazon Cognito, you can configure portals to be either publicly accessible or require authentication. Integration with Cognito user pools provides secure and scalable identity and access management that is enterprise-grade, cost-effective, and customizable. For organizations using existing identity systems, Cognito supports federation with SAML and OpenID Connect identity providers.
Cross-account API organization: The portal supports sharing portal products across AWS accounts using AWS RAM, so that organizations can create a unified API catalog while maintaining flexibility for API providers to develop and maintain APIs in their own accounts. When you share a portal product with another account, that account cannot modify any properties of your portal product or product endpoint pages, so API providers maintain control over their APIs while still enabling discovery across the organization. The cross-account sharing capabilities provide significant governance benefits for enterprise customers, including centralized discovery, standardization, reduced duplication, clear ownership, and controlled access.
Documentation: Beyond API reference documentation synchronized from your API definitions, you can add supplemental documentation including guides, use cases, and integration examples.
Search, discovery, and interactive API exploration: Consumers can search across your entire catalog. The portal provides intuitive customizable navigation and organization to help users find the right endpoints for their needs. Using the “Try It” functionality consumers can try APIs directly from the portal. Users can input request parameters, headers, and see live responses, reducing time-to-value for API integrations. This environment includes built-in limits for security and cost control.
Access control and governance
Amazon API Gateway Portal provides security and governance capabilities essential for production deployments.
Identity and access management: Integration with Cognito user pools provides secure and scalable identity and access management that is enterprise-grade, cost-effective, and customizable, including multi-factor authentication, password policies, and user lifecycle management.
API authorization: The portal respects existing authorization mechanisms configured on your APIs, including AWS IAM, Lambda authorizers, and Cognito user pools. Portal access doesn’t bypass your established security controls.
Cross-account governance: When sharing portal products across accounts using AWS RAM, the original API owners retain full control over their endpoints, including authorization strategies, integration configurations, and stage settings. Portal owners can use shared portal products but cannot modify the underlying API configurations.
Audit and monitoring: All portal management activities integrate with AWS CloudTrail for comprehensive audit logging. You can use Amazon CloudWatch RUM to perform real user monitoring to collect and view analytics about API consumers in near real time.
Resource limits: The service includes built-in quotas to prevent abuse, including limits on API testing rate limits, payload sizes, and integration timeouts. With these limits the “Try It” functionality cannot impact your production API performance.
Getting Started
Setting up a portal involves three main steps: creating portal products, configuring the portal, and publishing for consumer access. We will walk through those steps in more detail.
Create portal product
The following procedure shows you how to create a portal product:
Navigate to the API Gateway console and select Portal products from the main navigation.
Choose Create portal product and specify your portal product details including name, description, and visibility settings.
Next, select the endpoints you want to include in this portal product. You can choose entire API stages or specific resources and methods, and even rename endpoints with user-friendly names for better discoverability.
The system automatically imports your API documentation. You can improve the documentation with additional context, use cases, and examples later.
Organize product endpoints into custom categories that reflect your business logic rather than technical implementation details.
Configure the developer portal
The following procedure shows how to create a portal.
Select Developer portals in the API Gateway console navigation.
Specify your portal name, description, and domain configuration.
Choose between adding your prefix to the default AWS domain or configuring a custom domain name with your own SSL certificate.
Configure access control by selecting authentication requirements. For internal portals, you might require Amazon Cognito authentication, while public portals can allow anonymous access to documentation.

Upload your logo and select color themes to match your brand identity.
Add your portal products. You can include products from your account or products shared with you from other accounts through AWS RAM. The portal provides search and filtering capabilities for consumers.
Preview and publish
Before making your portal publicly available, use the preview functionality to review the consumer experience. The preview shows exactly how your portal will appear to users, including navigation, documentation, and available API testing capabilities.
When you’re satisfied with the configuration, choose Publish portal to make it accessible to consumers. The publishing process typically completes within a few minutes, and API Gateway provides the final portal URL for distribution to your consumers.
Conclusion and next steps
The new API Gateway Portal eliminates the complexity of building and maintaining custom API documentation sites. Your developers get a professional, feature-rich experience where they can discover and try your APIs immediately. Plus, since everything stays within AWS, you get built-in security, simplified operations, and comprehensive observability through integration with services like CloudWatch and CloudTrail.
Ready to streamline your API discovery experience? Here’s how to get started:
Today, AWS announced support for response streaming in Amazon API Gateway to significantly improve the responsiveness of your REST APIs by progressively streaming response payloads back to the client. With this new capability, you can use streamed responses to enhance user experience when building LLM-driven applications (such as AI agents and chatbots), improve time-to-first-byte (TTFB) performance for web and mobile applications, stream large files, and perform long-running operations while reporting incremental progress using protocols such as server-sent events (SSE).
In this post you will learn about this new capability, the challenges it addresses, and how to use response streaming to improve the responsiveness of your applications.
Overview
Consider this scenario – you’re running an AI-powered agentic application that uses an Amazon Bedrockfoundation model. Your users interact with the application through an API, asking complex questions that require detailed responses. Before response streaming, users would send their prompts and wait to eventually receive the application response, sometimes for tens of seconds. This awkward pause between questions and responses created a disconnected, unnatural experience.
With the new API Gateway response streaming capability, the interaction through the API becomes much more fluid and natural. As soon as your application starts processing the model response, you can stream it back to your users using the API Gateway.
The following animation illustrates this significant user experience improvement. The prompt on the left is processed using a non-streaming response with user having to wait for several seconds to receive the result. The prompt on the right is using the new API Gateway response streaming, significantly reducing TTFB and improving user experience.
Figure 1. Comparing user experience before (left) and after (right) enabling API Gateway response streaming when returning a response from a Bedrock foundational model.
Your users can now see AI responses appear in real-time, word by word, just like watching someone type. This immediate feedback makes your applications feel more responsive and engaging, keeping users connected throughout the interaction. In addition, you don’t have to worry about response size limits or implement complex workarounds – the streaming happens automatically and efficiently, letting you focus on building great user experiences rather than managing infrastructure constraints.
Understanding response steaming
In the traditional request-response model, responses must be fully computed before being sent to the client. This can negatively impact user experience – the client must wait for the complete response to be generated on the server-side and transmitted over-the-wire. This is especially pronounced in interactive, latency-sensitive cloud applications such as AI agents, chatbots, virtual assistants, or music generators.
Figure 2. Response is returned to the client only after it’s been fully generated, increasing time-to-first-byte latency.
Another important scenario is returning larger response payloads, such as images, large documents, or datasets. In some cases, these payloads may exceed the 10 MB response size limit or default integration timeout limit of 29 seconds of API Gateway. Before the launch of response streaming, developers worked around these limitations by using pre-signedAmazon S3 URLs to download large responses or accepting lower RPS for an increase in timeout. While functional, these workarounds introduced additional latency and architectural complexity.
With response streaming support you can address these challenges. You can now update your REST APIs to return streamed responses, significantly enhancing user experience, improving TTFB performance, supporting response payload sizes to exceed 10 MB, and serving requests that can take up to 15 minutes.
Figure 3. Response streaming reduces time-to-first-byte and improves user experience.
The response streaming capability is already delivering significant performance for organizations:
“Working closely with the AWS teams to enable response streaming was instrumental in advancing our roadmap to deliver the most performant storefront experiences for our largest customers at Salesforce Commerce Cloud. Our collaboration exceeded our Core Web Vital goals; we saw our Total Blocking Time metrics drop by over 98%, which will enable our customers to drive higher revenue and conversion rates.”, says Drew Lau, Senior Director of Product Management at Salesforce.
Response streaming is supported for any HTTP-proxy integration, AWS Lambda functions (using proxy integration mode), and private integrations. To get started, configure your API integration to stream the response from your backend, as described in the following sections, and redeploy your API for changes to take effect.
Getting started with response streaming
To enable response streaming for your REST APIs, update your integration configuration to set the response transfer mode to STREAM. This enables API Gateway to start streaming the response to the client as soon as response bytes become available. When using response streaming, you can configure request timeout up to 15 minutes. For best time to first byte user experience, AWS strongly recommends your backend integration also implements response streaming.
You can enable response streaming in several different ways, as illustrated in the following snippets:
Using the API Gateway console, when creating method integrations, select Stream for the Response transfer mode.
Figure 4. Enabling response streaming in API Gateway Console.
Setting response transfer mode using the Open API spec:
Setting response transfer mode using infrastructure-as-code (IaC) frameworks, such as AWS CloudFormation. Note the /response-streaming-invocations Uri fragment, it tells API Gateway to use the Lambda InvokeWithResponseStreaming endpoint:
When using Lambda functions as a downstream integration endpoint, your Lambda functions must be streaming-enabled. The API Gateway uses the InvokeWithResponseStreaming API to invoke functions, as illustrated in the following diagram, and requires Lambda proxy integration. See the API Gateway documentation for additional guidance.
Figure 5. Using API Gateway response streaming with Lambda functions for interactive AI applications.
When you use response streaming with Lambda functions, API Gateway expects the handler response stream to contain the following components (in order):
JSON response metadata – Must be a valid JSON object and can only contain statusCode, headers, multiValueHeaders, and cookies fields (all optional). Metadata cannot be an empty string; at a minimum it must be an empty JSON object.
The 8-null-byte delimiter – Lambda adds this delimiter automatically when you use the built-in awslambda.HttpResponseStream.from() method, as illustrated below. When not using this method, you’re responsible for adding the delimiter yourself.
Response payload – Can be empty.
The following code snippet illustrates how you can return a streamed response from your Lambda functions so it will be compatible with API Gateway response streaming:
Using response streaming with HTTP Proxy integrations
You can stream HTTP responses from your applications used as downstream integration endpoints, for example web servers running on Amazon Elastic Container Service (Amazon ECS) or Amazon Elastic Kubernetes Service (Amazon EKS). In this case, you must use HTTP_PROXY integration and specify the response transfer mode as STREAM (using the console, AWS CLI, or IaC). Redeploy your API after modifying it.
Figure 6. Using API Gateway response streaming with HTTP server applications.
Once API Gateway receives a streaming response from your application, it will wait until the HTTP headers block transfer is complete. Then, it will send to the client an HTTP response status code and headers, followed by the content from your application as it gets received by the API Gateway service. It will continue streaming response from your application to the client until the stream ends (up to 15 minutes).
Many popular API and web application development frameworks provide response streaming abstractions. The following code snippet illustrates how you can implement HTTP response streaming using FastAPI:
Adding real-time response streaming to your HTTP clients
Different HTTP clients have different ways to process streamed response fragments as they arrive. The following code snippet illustrates how to process a streamed response with a Node.js application:
When using CURL, you can use the –no-buffer argument to print response fragments as they arrive.
curl --no-buffer {URL}
Sample code
Clone this sample project from GitHub to see API Gateway response streaming in action. Follow instructions in the README.md to provision the sample project in your AWS account.
Considerations
Before you enable response streaming, consider:
Response streaming is available for REST APIs and can be used with HTTP_PROXY integrations, Lambda integrations (in proxy mode), and private integrations.
You can use API Gateway response streaming with any endpoint type, such as Regional, Private, and Edge-optimized, with or without custom domain names.
When using response streaming, you can configure response timeouts up to 15 minutes, according to your scenario requirements.
All streaming responses from Regional or Private endpoints are subject to a 5-minute idle timeout. All streaming responses from edge-optimized endpoints are subject to a 30-second idle timeout.
Within each streaming response, the first 10MB of response payload is not subject to any bandwidth restrictions. Response payload data exceeding 10MB is restricted to 2MB/s.
When processing streamed responses, the following features are not supported: response transformation with VTL, integration response caching, and content encoding.
In addition to the existing access logs variables, the following new variables are available:
$content.integration.responseTransferMode – the response transfer mode of your integration. This can be either BUFFERED or STREAMED.
$context.integration.timeToAllHeaders – the time between when API Gateway establishes the integration connection to when it receives all integration response headers from the client.
$context.integration.timeToFirstContent – the time between when API Gateway establishes the integration connection to when it receives the first content bytes.
With this new capability, you continue to pay the same API Invoke rates for streamed responses. Each 10MB of response data, rounded up to the nearest 10MB, is billed as a single request. See API Gateway pricing page for additional details.
Conclusion
The new response streaming capability for Amazon API Gateway enhances how you can build and deliver responsive APIs in the cloud. With immediate streaming of response data as it becomes available, you can significantly improve time-to-first-byte performance and overcome traditional payload size and timeout limitations. This is particularly valuable for AI-powered applications, file transfers, and interactive web experiences that demand real-time responsiveness.
Amazon Web Services has been designated as a critical third-party provider (CTPP) by the European Supervisory Authorities (ESAs) under the European Union’s Digital Operational Resilience Act (DORA).
This designation is a key milestone in the EU’s implementation of DORA, which took effect in January 2025 and aims to strengthen the operational resilience of the EU financial sector. Under this regulation, certain third-party information and communications technology (ICT) service providers identified as playing a critical role for financial entities in the EU are subject to direct joint oversight by the European Banking Authority (EBA), the European Securities and Markets Authority (ESMA), and the European Insurance and Occupational Pensions Authority (EIOPA).
AWS recognizes the significance of this oversight for our financial services customers as they advance their digital transformation and modernization efforts, which remain essential to their long-term resilience and competitiveness.
What the CTPP designation means for customers
Financial institutions that use AWS services should note that AWS is engaged in an active oversight relationship with the ESAs.
AWS will maintain its commitment to operational resilience as part of the oversight activities associated with the designation.
Customers can use AWS security, resilience, and compliance features while maintaining control over their own cloud environments and compliance journeys.
Proven readiness for DORA oversight
AWS has been engaging with EU institutions, national competent authorities, and the broader financial regulatory community for years, helping to build a more resilient and secure financial system.
Our readiness for this oversight process builds on our demonstrated experience in meeting rigorous operational and regulatory standards. AWS has made, and will continue to make, investments in compliance, risk management, operational resilience, and transparency, which are critical pillars of DORA.
Being designated as a CTPP means AWS will now participate in a formal oversight process. We expect that this process will promote a deeper understanding of how AWS and other cloud technologies help enhance the resilience of the financial services industry.
Supporting customers through DORA implementation
Although AWS is now subject to direct oversight under DORA, we remain equally focused on supporting our financial services customers that are subject to the regulation.
Operational resilience is both a compliance requirement for DORA and a business necessity. Our services are designed to help financial institutions achieve high availability, durability, and scalability, while maintaining robust controls and visibility into their operations.
Our dedicated team of security and compliance specialists is ready to assist financial organizations in understanding how AWS security and compliance features can help them fulfill their obligations under DORA and how AWS services help to support their compliance strategies. We offer detailed documentation, whitepapers, and compliance guides tailored to DORA’s key requirements, such as the AWS User Guide to DORA and Amazon Web Services’ Approach to Operational Resilience in the Financial Sector & Beyond. To learn more about our security and compliance resources, visit the AWS Trust Center. Customers can also download our third-party attestations and certifications through AWS Artifact.
If you have feedback about this post, submit comments in the Comments section below.
Multi-tenant applications often require strict isolation when processing tenant-specific code or data. Examples include software-as-a-service (SaaS) platforms for workflow automation or code execution where customers need to ensure that execution environments used for individual tenants or end users remain completely separate from one another. Traditionally, developers have addressed these requirements by deploying separate Lambda functions for each tenant or implementing custom isolation logic within shared functions which increased architectural and operational complexity.
Today, AWS Lambda introduces a new tenant isolation mode that extends the existing isolation capabilities in Lambda. Lambda already provides isolation at the function level, and this new mode extends isolation to the individual tenant or end-user level within a single function. This built-in capability processes function invocations in separate execution environments for each tenant, enabling you to meet strict isolation requirements without additional implementation effort to manage tenant-specific resources within function code.
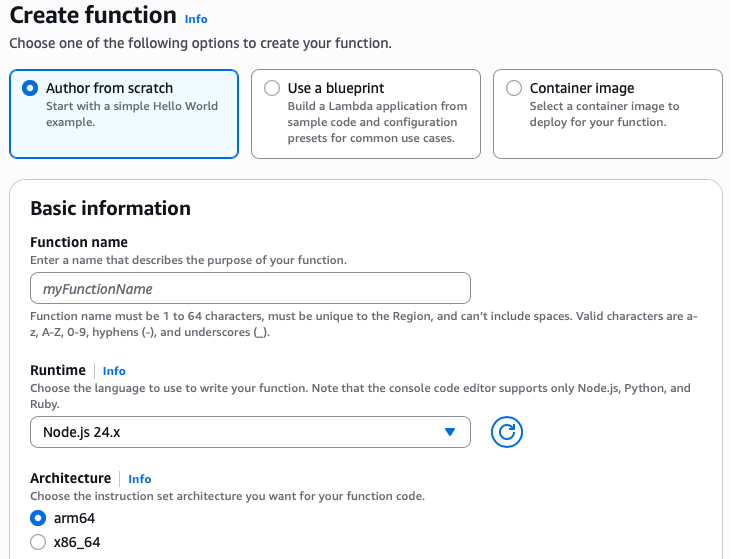
Here’s how you can enable tenant isolation mode in the AWS Lambda console:
When using the new tenant isolation capability, Lambda associates function execution environments with customer-specified tenant identifiers. This means that execution environments for a particular tenant aren’t used to serve invocation requests from other tenants invoking the same Lambda function.
The feature addresses strict security requirements for SaaS providers processing sensitive data or running untrusted tenant code. You maintain the pay-per-use and performance characteristics of AWS Lambda while gaining execution environment isolation. Additionally, this approach delivers the security benefits of per-tenant infrastructure without the operational overhead of managing dedicated Lambda functions for individual tenants, which can quickly grow as customers adopt your application.
Getting started with AWS Lambda tenant isolation Let me walk you through how to configure and use tenant isolation for a multi-tenant application.
First, on the Create function page in the AWS Lambda console, I choose Author from scratch option.
Then, under Additional configurations, I select Enable under Tenant isolation mode. Note that, tenant isolation mode can only be set during function creation and can’t be modified for existing Lambda functions.
Next, I write Python code to demonstrate this capability. I can access the tenant identifier in my function code through the context object. Here’s the full Python code:
import json
import os
from datetime import datetime
def lambda_handler(event, context):
tenant_id = context.tenant_id
file_path = '/tmp/tenant_data.json'
# Read existing data or initialize
if os.path.exists(file_path):
with open(file_path, 'r') as f:
data = json.load(f)
else:
data = {
'tenant_id': tenant_id,
'request_count': 0,
'first_request': datetime.utcnow().isoformat(),
'requests': []
}
# Increment counter and add request info
data['request_count'] += 1
data['requests'].append({
'request_number': data['request_count'],
'timestamp': datetime.utcnow().isoformat()
})
# Write updated data back to file
with open(file_path, 'w') as f:
json.dump(data, f, indent=2)
# Return file contents to show isolation
return {
'statusCode': 200,
'body': json.dumps({
'message': f'File contents for {tenant_id} (isolated per tenant)',
'file_data': data
})
}
When I’m finished, I choose Deploy. Now, I need to test this capability by choosing Test. I can see on the Create new test event panel that there’s a new setting called Tenant ID.
If I try to invoke this function without a tenant ID, I’ll get the following error “Add a valid tenant ID in your request and try again.”
Let me try to test this function with a tenant ID called tenant-A.
I can see the function ran successfully and returned request_count: 1. I’ll invoke this function again to get request_count: 2.
Now, let me try to test this function with a tenant ID called tenant-B.
The last invocation returned request_count: 1 because I never invoked this function with tenant-B. Each tenant’s invocations will use separate execution environments, isolating the cached data, global variables, and any files stored in /tmp.
This capability transforms how I approach multi-tenant serverless architecture. Instead of wrestling with complex isolation patterns or managing hundreds of tenant-specific Lambda functions, I let AWS Lambda automatically handle the isolation. This keeps tenant data isolated across tenants, giving me confidence in the security and separation of my multi-tenant application.
Additional things to know Here’s a list of additional things you need to know:
Performance — Same-tenant invocations can still benefit from warm execution environment reuse for optimal performance.
Pricing — You’re charged when Lambda creates a new tenant-aware execution environment, with the price depending on the amount of memory you allocate to your function and the CPU architecture you use. For more details, view AWS Lambda pricing.
Availability — Available now in all commercial AWS Regions except Asia Pacific (New Zealand), AWS GovCloud (US), and China Regions.
This launch simplifies building multi-tenant applications on AWS Lambda, such as SaaS platforms for workflow automation or code execution. Learn more about how to configure tenant isolation for your next multi-tenant Lambda function in the AWS Lambda Developer Guide.
Organizations are increasingly expanding their Kubernetes footprint by deploying microservices to incrementally innovate and deliver business value faster. This growth places increased reliance on the network, giving platform teams exponentially complex challenges in monitoring network performance and traffic patterns in EKS. As a result, organizations struggle to maintain operational efficiency as their container environments scale, often delaying application delivery and increasing operational costs.
Today, I’m excited to announce Container Network Observability in Amazon Elastic Kubernetes Service (Amazon EKS), a comprehensive set of network observability features in Amazon EKS that you can use to better measure your network performance in your system and dynamically visualize the landscape and behavior of network traffic in EKS.
Here’s a quick look at Container Network Observability in Amazon EKS:
Container Network Observability in EKS addresses observability challenges by providing enhanced visibility of workload traffic. It offers performance insights into network flows within the cluster and those with cluster-external destinations. This makes your EKS cluster network environment more observable while providing built-in capabilities for more precise troubleshooting and investigative efforts.
Getting started with Container Network Observability in EKS
I can enable this new feature for a new or existing EKS cluster. For a new EKS cluster, during the Configure observability setup, I navigate to the Configure network observability section. Here, I select Edit container network observability. I can see there are three included features: Service map, Flow table, and Performance metric endpoint, which are enabled by Amazon CloudWatch Network Flow Monitor.
On the next page, I need to install the AWS Network Flow Monitor Agent.
After it’s enabled, I can navigate to my EKS cluster and select Monitor cluster.
This will bring me to my cluster observability dashboard. Then, I select the Network tab.
Comprehensive observability features Container Network Observability in EKS provides several key features, including performance metrics, service map, and flow table with three views: AWS service view, cluster view, and external view.
With Performance metrics, you can now scrape network-related system metrics for pods and worker nodes directly from the Network Flow Monitor agent and send them to your preferred monitoring destination. Available metrics include ingress/egress flow counts, packet counts, bytes transferred, and various allowance exceeded counters for bandwidth, packets per second, and connection tracking limits. The following screenshot shows an example of how you can use Amazon Managed Grafana to visualize the performance metrics scraped using Prometheus.
With the Service map feature, you can dynamically visualize intercommunication between workloads in your cluster, making it straightforward to understand your application topology with a quick look. The service map helps you quickly identify performance issues by highlighting key metrics such as retransmissions, retransmission timeouts, and data transferred for network flows between communicating pods.
Let me show you how this works with a sample e-commerce application. The service map provides both high-level and detailed views of your microservices architecture. In this e-commerce example, we can see three core microservices working together: the GraphQL service acts as an API gateway, orchestrating requests between the frontend and backend services.
When a customer browses products or places an order, the GraphQL service coordinates communication with both the products service (for catalog data, pricing, and inventory) and the orders service (for order processing and management). This architecture allows each service to scale independently while maintaining clear separation of concerns.
For deeper troubleshooting, you can expand the view to see individual pod instances and their communication patterns. The detailed view reveals the complexity of microservices communication. Here, you can see multiple pod instances for each service and the network of connections between them.
This granular visibility is crucial for identifying issues like uneven load distribution, pod-to-pod communication bottlenecks, or when specific pod instances are experiencing higher latency. For example, if one GraphQL pod is making disproportionately more calls to a particular products pod, you can quickly spot this pattern and investigate potential causes.
Use the Flow table to monitor the top talkers across Kubernetes workloads in your cluster from three different perspectives, each providing unique insights into your network traffic patterns.
Flow table – Monitor the top talkers across Kubernetes workloads in your cluster from three different perspectives, each providing unique insights into your network traffic patterns:
AWS service view shows which workloads generate the most traffic to Amazon Web Services (AWS) services such as Amazon DynamoDB and Amazon Simple Storage Service (Amazon S3), so you can optimize data access patterns and identify potential cost optimization opportunities.
The Cluster view reveals the heaviest communicators within your cluster (east-west traffic), which means you can spot chatty microservices that might benefit from optimization or colocation strategies
External viewidentifies workloads with the highest traffic to destinations outside AWS (internet or on premises), which is useful for security monitoring and bandwidth management.
The flow table provides detailed metrics and filtering capabilities to analyze network traffic patterns. In this example, we can see the flow table displaying cluster view traffic between our e-commerce services. The table shows that the orders pod is communicating with multiple products pods, transferring amounts of data. This pattern suggests the orders service is making frequent product lookups during order processing.
The filtering capabilities are useful for troubleshooting, for example, to focus on traffic from a specific orders pod. This granular filtering helps you quickly isolate communication patterns when investigating performance issues. For instance, if customers are experiencing slow checkout times, you can filter to see if the orders service is making too many calls to the products service, or if there are network bottlenecks between specific pod instances.
Additional things to know Here are key points to note about Container Network Observability in EKS:
Pricing – For network monitoring, you pay standard Amazon CloudWatch Network Flow Monitor pricing.
Availability – Container Network Observability in EKS is available in all commercial AWS regions where Amazon CloudWatch Network Flow Monitor is available.
Export metrics to your preferred monitoring solution – Metrics are available in OpenMetrics format, compatible with Prometheus and Grafana. For configuration details, refer to Network Flow Monitor documentation.
Code migration is a repository-level transformation process that modernizes entire software projects to run on new platforms, frameworks, or runtime environments while preserving their original functionality and structure. Rather than focusing on isolated files or APIs, it operates across the full repository, spanning source code, dependencies, build systems, and configuration files to ensure consistency and correctness at scale. Typical examples include upgrading Java repositories from legacy versions such as Java 8 to modern Long-Term Support releases like Java 17 or 21, migrating .NET Framework repositories to .NET Core, and upgrading AWS Lambda projects in Python or Node.js to the latest runtime versions.
Code migration is a challenging software engineering (SWE) task that involves runtime upgrade, deprecated API replacement, test framework optimization, and syntax modernization. As we build agentic solutions for code migration, the community needs a standardized benchmark dataset and an evaluation framework to measure how well these systems actually perform. To close this gap, we introduce two benchmark datasets: MigrationBench on Java and Poly-MigrationBench as an extension to other programming languages. These datasets are designed not only to benchmark the effectiveness of Large Language Models (LLMs) in repository-level migration, but also to provide the community with a standardized evaluation framework for reproducible experiments.
Solution Overview
MigrationBench: Repository-Level Java Migration
MigrationBench is a comprehensive repository-level benchmark focused on Java upgrades. Specifically, it evaluates the ability of LLMs and other tools to migrate code from Java 8 to newer Long-Term Support (LTS) versions such as Java 17 and Java 21.
The full dataset includes 5,102 open-source Java 8 Maven repositories collected from GitHub, alongside a representative subset of 300 repositories curated for research requiring fewer compute resources. MigrationBench also provides an evaluation framework for validating Java Maven repository upgrades.
Our data collection process follows a carefully designed pipeline with multiple filtering stages to ensure the quality and relevance of the repositories we include. We begin by collecting Java Maven projects, focusing on repositories written in Java that use Maven as their build tool. Next, we apply a license filter, retaining only repositories under MIT or Apache 2.0 licenses to ensure open and permissible usage. We then apply a quality filter, keeping only repositories with at least three GitHub stars to exclude toy or inactive projects. For each repository, we search for the latest buildable commit that is compatible with Java 8, ensuring a valid starting point for migration. We also remove redundant repositories based on their snapshot hashes. Finally, we further exclude repositories without any unit tests or integration tests, which are essential components to validate migration correctness in a robust way. For more details, checkout our paper MigrationBench: Repository-Level Code Migration Benchmark from Java 8 and the GitHub repository.
Poly-MigrationBench: Extending Beyond Java
While MigrationBench focuses exclusively on Java, the real-world code migration problem spans multiple ecosystems. To address this broader scope, we develop Poly-MigrationBench, an extension that introduces additional languages and platforms. We applied a similar data curation process as MigrationBench to additionally collect
100 .NET Framework repositories. They are to be migrated to .NET core.
74 Node.js repositories with version less than Node.js 22. They are to be migrated to Node.js 22.
83 Python repositories with Python version less than 3.13. They are to be migrated to Python 3.13.
Together, these datasets enable researchers to explore cross-language and cross-platform migration challenges at scale.
Use Case 1: Cross-Platform .NET Migration
One pressing migration challenge lies in moving .NET applications from Windows environments running on the legacy .NET Framework to Linux environments powered by .NET Core. This migration is critical for organizations seeking cross-platform compatibility, improved performance, and modern deployment practices such as containerization.
To support research in this area, we curated a benchmark of 100 open-source .NET Framework repositories from GitHub. These projects were carefully selected for diversity and quality, offering a real world foundation for evaluating migration tools and automated systems. The migration goal is clear: transition .NET Framework repositories to .NET Core on Linux while preserving functional equivalence.
Use Case 2: Node.js Upgrade for AWS Lambda Applications
Another timely migration need involves Lambda functions written in Node.js. Node.js 20, currently supported by Lambda, is scheduled for end-of-support in April 2026 (reference). After this deadline, projects running on Node.js 20 will no longer receive critical security patches or bug fixes.
For increased security and to avoid accumulating technical debt, developers building Lambda applications are proactively upgrading to Node.js 22. To evaluate LLMs’ effectiveness in automating this migration, Poly-MigrationBench provides a dataset of 74 open-source Node.js repositories using Node.js versions no later than 20. The task is to upgrade them to Node.js 22 while ensuring functional correctness is preserved.
Use-case 3: AWS Lambda Python Migrations
We also release benchmarks on Lambda Python repositories to the community to facilitate research and evaluation of automated Lambda function migrations in Python code. According to AWS documentation, Python 3.10 and 3.11 are scheduled to reach end of support for Lambda in June 2026. This approaching deadline highlights the urgency of migrating existing Lambda functions to newer runtimes and underscores the critical need for scalable, reliable, and LLM-driven migration solutions. To facilitate evaluation on this task, we collect 83 Python AWS Lambda repositories with Python version no later than 3.12. The objective is to migrate these repositories to Python 3.13.
Get Started
We’ve open-sourced both the datasets and the evaluation framework on Hugging Face and GitHub to make it easy for the community to explore, reproduce, and extend our work. Alongside them, we also released a baseline solution, SD-Feedback, for MigrationBench, while leaving the development of more sophisticated agentic migration systems as a open challenge for the research community.
MigrationBench
To download the MigrationBench dataset, visit our Hugging Face collection. For evaluation, simply clone our GitHub repository and follow the steps in the README.md.
Poly-MigrationBench
To access the Poly-MigrationBench dataset and evaluation commands, clone our GitHub repository.
For a deeper dive into how the benchmarks were curated and how the evaluation framework was designed, check out our paper:
Code migration is an essential but complex task for maintaining long-term software reliability and security. With MigrationBench and Poly-MigrationBench, we aim to provide the community with systematic, large-scale benchmarks that enable reproducible research and practical evaluation of automated migration approaches.
We are delighted to announce an update to the AWS Well-Architected Generative AI Lens. This update features several new sections of the Well-Architected Generative AI Lens, including new best practices, advanced scenario guidance, and improved preambles on responsible AI, data architecture, and agentic workflows.
The AWS Well-Architected Framework provides architectural best practices for designing and operating generative AI workloads on AWS. The Generative AI Lens uses the Well-Architected Framework to outline the steps for performing a Well-Architected Framework review for your generative AI workloads.
The Generative AI Lens provides a consistent approach for customers to evaluate architectures that use large language models (LLMs) to achieve their business goals. This lens addresses common considerations relevant to model selection, prompt engineering, model customization, workload integration, and continuous improvement. Specifically excluded from the Generative AI Lens are best practices associated with model training and advanced model customization techniques. We identify best practices that help you architect your cloud-based applications and workloads according to AWS Well-Architected design principles gathered from supporting thousands of customer implementations.
What has changed in the updated Generative AI Lens?
The updated Generative AI Lens incorporates several new additions for customers to review. These additions keep the lens on-pace with the rapidly growing area of generative AI, helping customers stay up to date with architectural best practices.
Amazon SageMaker HyperPod guidance
The updated lens features additional guidance for users of Amazon SageMaker HyperPod. SageMaker HyperPod is a highly resilient model training and hosting service that you can use to orchestrate complex, long-running generative AI workflows in the cloud. These workflows could be foundation model pre-training or serving model inference at scale.
We are excited to announce additional guidance for customers using SageMaker HyperPod in the Generative AI Lens. This guidance is built into the existing best practices, expanding the guidance for covered services to include SageMaker capabilities. This guidance joins the existing guidance on Amazon Bedrock, Amazon Q Business, Amazon Q Developer, and Amazon SageMaker AI.
Responsible AI preamble
The updated responsible AI preamble now includes a detailed discussion on the eight core dimensions of responsible AI as described by AWS. Customers can now learn more about the eight dimensions of responsibly developed AI systems directly within the lens. This is required reading for customers in all stages of their generative AI journey.
Data architecture preamble
The updated data architecture preamble reviews strategic considerations associated with a modern data architecture supporting generative AI workloads. This section provides customers with a view into the high-level decisions and considerations needed to architect a data system that services generative AI workloads.
Agentic AI preamble
New to the generative AI lens is the agentic AI preamble. Agentic systems, while technically classified as a subset of distributed computing, play an important role in modern generative AI workloads. This preamble introduces customers to a sampling of architecture paradigms common in agentic systems powered by foundation models.
Scenarios
The Generative AI Lens now includes eight architecture scenarios. These scenarios cover a range of common generative AI powered business applications, including autonomous call centers, knowledge worker co-pilots, and multi-tenant generative AI service systems. The scenario section provides specific guidance for applying generative AI technologies to common business problems. The following image is an example of one of the new scenarios now included in the Generative AI Lens.
Who should use the Generative AI Lens?
The Generative AI Lens is useful to many roles. Business leaders can use this lens to acquire a broader appreciation of the end-to-end implementation and benefits of generative AI. Data scientists and engineers can read this lens to understand how to use, secure, and gain insights from their data at scale. Risk and compliance leaders can understand how generative AI is implemented responsibly by providing compliance with regulatory and governance requirements.
Next steps
The updated Well-Architected Generative AI Lens is available now. Use the lens as a framework to verify that your generative AI workloads are architected with operational excellence, security, reliability, performance efficiency, cost optimization, and sustainability in mind.
If you require support on the implementation or assessment of your generative AI workloads, please contact your AWS Solutions Architect or Account Representative.
Special thanks to everyone across the AWS Solution Architecture, AWS Professional Services, and Machine Learning communities who contributed to the updated Generative AI Lens. These contributions encompassed diverse perspectives, expertise, backgrounds, and experiences in developing the new AWS Well-Architected Generative AI Lens.
We are excited to announce the updated AWS Well-Architected Machine Learning Lens, now enhanced with the latest capabilities and best practices for building machine learning (ML) workloads on AWS.
The AWS Well-Architected Framework provides architectural best practices for designing and operating reliable, secure, efficient, cost-effective, and sustainable workloads in the cloud. The Machine Learning Lens uses the Well-Architected Framework to outline the steps for performing a comprehensive review of your ML architectures.
The updated Machine Learning Lens provides a consistent approach for customers to evaluate architectures across ML workloads, from traditional supervised and unsupervised learning to modern AI applications. This lens addresses common considerations relevant to the complete ML lifecycle, including business goal identification, problem framing, data processing, model development, deployment, and monitoring. The lens incorporates the latest AWS ML services and capabilities introduced since 2023, providing access to current best practices and implementation guidance.
The Machine Learning Lens is part of a collection of Well-Architected lenses published under AWS Well-Architected Lenses.
What is the Machine Learning Lens?
The Well-Architected Machine Learning Lens focuses on the six pillars of the Well-Architected Framework across six phases of the ML lifecycle.
The six phases are:
Business goal identification: Establishing clear business objectives and success criteria for your ML initiative.
ML problem framing: Translating business problems into well-defined ML problems with appropriate metrics.
Data processing: Collecting, preparing, and engineering features from your data sources.
Model development: Building, training, tuning, and evaluating ML models with proper experimentation tracking.
Model deployment: Deploying models into production environments with appropriate infrastructure and monitoring.
Model monitoring: Continuously monitoring model performance and maintaining model quality over time.
Unlike the traditional waterfall approach, an iterative approach is required to achieve a working prototype based on the six phases of the ML lifecycle. The lens provides you with a set of established cloud-agnostic best practices in the form of Well-Architected Framework pillars for each ML lifecycle phase.
You can also use the Well-Architected Machine Learning Lens wherever you are on your cloud journey. You can choose to apply this guidance either during the design of your ML workloads or after your workloads have entered production as a part of the continuous improvement process.
Machine Learning Lens components
The lens includes four focus areas:
Well-Architected ML design principles: Ten design principles that frame the presented best practices, including assign ownership, enable reproducibility, optimize resources, and enable continuous improvement.
The ML lifecycle and the Well-Architected Framework pillars: This considers all aspects of the ML lifecycle and reviews design strategies aligned to the pillars of the overall Well-Architected Framework:
Operational excellence: Ability to support ongoing development, run ML workloads effectively, gain insight into operations, and continuously improve processes.
Security: Ability to protect data, models, and ML infrastructure while taking advantage of cloud technologies to improve security posture.
Reliability: Ability of ML workloads to perform their intended function correctly and consistently, with automatic recovery from failure situations.
Performance efficiency: Ability to use computing resources efficiently for ML workloads and maintain efficiency as demand and technologies evolve.
Cost optimization: Ability to run ML systems to deliver business value at the lowest price point through resource optimization and automation.
Sustainability: Addresses the environmental impact of ML workloads, focusing on energy consumption and resource efficiency.
Cloud-agnostic best practices: 100+ comprehensive best practices covering each ML lifecycle phase across the Well-Architected Framework pillars. Each best practice includes:
Implementation guidance: Detailed AWS implementation plans with references to current AWS ML services and capabilities.
Resources: Curated links to AWS documentation, blogs, videos, and code examples supporting the best practices.
Related ML architecture considerations: Discussions on advanced topics including MLOps patterns, data architecture for ML, model governance strategies, and considerations for responsible AI implementation.
What else is discussed in the Machine Learning Lens?
The Machine Learning Lens also discusses the following key topics:
Responsible AI: Comprehensive guidance on implementing fair, explainable, and unbiased ML systems throughout the development lifecycle.
MLOps and automation: Best practices for implementing continuous integration, continuous deployment, and continuous training for ML workloads.
Data architecture for ML: Guidance on building robust data pipelines, feature stores, and data governance practices that support ML workloads at scale.
Model governance and lineage: Strategies for tracking model versions, maintaining audit trails, and ensuring compliance with regulatory requirements.
What’s new in the updated Machine Learning Lens?
The updated Machine Learning Lens incorporates the latest AWS ML capabilities and best practices introduced since 2023, including:
Enhanced data and AI collaborative workflows: Integrated development through Amazon SageMaker Unified Studio – MLOPS02-BP01, MLOPS01-BP01, MLOPS03-BP01, and MLOPS02-BP04.
AI-assisted development lifecycle: Code generation and productivity enhancement using Kiro and Amazon Q Developer – MLCOST01-BP02, MLOPS01-BP01, MLCOST03-BP02, and MLSUS05-BP02.
Distributed training infrastructure: Large-scale foundation model development and fine-tuning with Amazon SageMaker HyperPod – MLCOST04-BP02, MLCOST04-BP07, MLPERF06-BP05, MLSEC03-BP02, MLCOST04-BP06, MLPERF06-BP07, and MLSUS05-BP02.
Model customization capabilities: Knowledge distillation and fine-tuning for domain-specific applications using Amazon Bedrock with Kiro and Amazon Q Developer integration and model hub with Amazon SageMaker Jumpstart – MLCOST01-BP02, MLCOST01-BP01, MLCOST03-BP02, MLSUS04-BP02, MLCOST05-BP01, and MLSUS05-BP02.
No-code ML development: Natural language support for building models using SageMaker Canvas with Amazon Q Developer integration – MLCOST03-BP02, MLCOST03-BP03, MLOPS01-BP01, and MLSUS05-BP02.
Improved bias detection: Enhanced fairness metrics in SageMaker Clarify with Model Monitor for drift detection – MLREL02-BP01, MLREL03-BP04, MLREL02-BP04, MLREL02-BP05, and MLREL02-BP02.
Modular inference architecture: Flexible deployment with SageMaker Inference Components and Multi-Model Endpoints – MLCOST05-BP01, MLREL01-BP01, MLSUS05-BP01, MLCOST05-BP03, and MLREL01-BP02.
Advanced observability: Improved debugging with SageMaker Debugger, Model Monitor, and CloudWatch across the ML lifecycle – MLOPS06-BP02, MLOPS05-BP02, MLOPS06-BP01, and MLOPS02-BP04.
Enhanced cost optimization: Resource management through SageMaker Training Plans, Savings Plans, and Spot Instance support – MLCOST05-BP03, MLOPS05-BP02, MLCOST06-BP01, MLCOST06-BP02, and MLCOST04-BP06.
Who should use the Machine Learning Lens?
The Machine Learning Lens is valuable for many roles across your organization. Business leaders can use this lens to understand the end-to-end implementation and business value of ML initiatives. Data scientists and ML engineers can leverage the lens to understand how to build, deploy, and maintain ML systems at scale. DevOps and platform engineers can learn how to create reliable, secure infrastructure for ML workloads. Risk and compliance leaders can understand how ML systems are implemented responsibly while adhering to regulatory and governance requirements.
Next steps
If you require support on the implementation or assessment of your ML workloads, please contact your AWS Solutions Architect or Account Representative.
Special thanks to everyone across the AWS Solution Architecture, AWS Professional Services, and Machine Learning communities who contributed to the updated Machine Learning Lens. These contributions encompassed diverse perspectives, expertise, backgrounds, and experiences in developing comprehensive guidance for ML workloads on AWS.
At re:Invent 2025, we introduce one new lens and two significant updates to the AWS Well-Architected Lenses specifically focused on AI workloads: the Responsible AI Lens, the Machine Learning (ML) Lens, and the Generative AI Lens. Together, these lenses provide comprehensive guidance for organizations at different stages of their AI journey, whether you’re just starting to experiment with machine learning or already deploying complex AI applications at scale.
The AWS Well-Architected Framework provides the best architectural practices for designing and operating reliable, secure, performance efficient, cost-optimized, and sustainable workloads in the cloud.
The Responsible AI Lens: Embedding trust in AI systems
The Responsible AI Lens offers a structured approach for developers to assess and track their AI workloads against established best practices, identify potential gaps in their AI implementation and receive actionable guidance to improve their AI systems’ quality and alignment with responsible AI principles. By using the Responsible AI Lens you can make informed decisions that balance business and technical requirements, accelerating your path from AI experimentation to production-ready solutions.
Key takeaways from the Responsible AI Lens:
Every AI system has a Responsible AI consideration: Whether intentionally designed or not, AI systems inherently carry Responsible AI implications that need to be actively managed rather than left to chance.
AI systems can be used beyond original intent and may have unintended impacts: Applications often get utilized in ways developers didn’t anticipate, and due to their probabilistic nature, AI systems can produce unexpected outcomes even within intended use cases, making robust Responsible AI decisions essential from the start.
Responsible AI is an enabler to innovation and trust: Rather than being a constraint, Responsible AI practices can accelerate innovation by proactively building stakeholder and customer trust and reducing downstream risks.
The Responsible AI Lens serves as the foundational guidance for AI development activities, providing critical guidelines that inform both the Machine Learning Lens and the Generative AI Lens implementations.
The Machine Learning Lens: Foundation for ML workloads
The Machine Learning Lens provides you with a set of established cloud-agnostic best practices in the form of Well-Architected Framework pillars for each machine learning (ML) lifecycle phase. The updated Machine Learning Lens provides a consistent approach for designing, building, and operating machine learning workloads on AWS. It addresses the full spectrum of ML workloads, from traditional supervised and unsupervised learning to modern AI applications.
The updated Machine Learning Lens incorporates the latest AWS ML capabilities (evolved since their introduction in 2023). What’s new in the updated ML Lens:
Enhanced data and AI collaborative workflows through Amazon SageMaker Unified Studio.
AI-assisted development for code generation and productivity enhancement.
Distributed training infrastructure for foundation model development and fine-tuning with Amazon SageMaker HyperPod.
Model customization capabilities such as knowledge distillation and fine-tuning domain-specific applications using Amazon Bedrock with Kiro and Amazon Q Developer.
No-code ML development using Amazon SageMaker Canvas with Amazon Q integration.
Improved bias detection with enhanced fairness metrics and Responsible AI capabilities in Amazon SageMaker Clarify.
Automated dashboard creation for business insights through Amazon Quick Sight.
Modular inference architecture for flexible model deployment with Inference Components.
Advanced observability with improved debugging and monitoring capabilities across the ML lifecycle.
Enhanced cost optimization for resource management through Amazon SageMaker Training Plans, Savings Plans, and Spot Instance support.
You can use the ML Lens wherever you are on your cloud journey. You can choose to apply this guidance either during the design of your ML workloads or after your workloads have entered production as part of the continuous improvement process. These improvements are powered by key AWS services including Amazon SageMaker Unified Studio, Amazon Q, Amazon SageMaker HyperPod, and Amazon Bedrock.
The Generative AI Lens: Specialized guidance for foundation models
The Generative AI Lens provides a consistent approach for customers to evaluate architectures that use large language models (LLMs) to achieve their business goals. This lens addresses common considerations relevant to model selection, prompt engineering, model customization, workload integration, and continuous improvement. We identify best practices that help you architect your cloud-based applications and workloads according to AWS Well-Architected design principles gathered from supporting thousands of customer implementations. While the Machine Learning (ML) Lens covers the broad spectrum of ML workloads, the Generative AI Lens focuses specifically on foundation models and generative AI applications. The Generative AI Lens provides the best architectural practices for designing and operating generative AI workloads on AWS.
The updated Generative AI Lens includes several new additions:
Amazon SageMaker HyperPod guidance for orchestrating complex, long-running generative AI workflows that includes additional service capabilities.
Enhanced Responsible AI preamble with detailed discussion on the eight core dimensions of Responsible AI as described by AWS.
Updated data architecture preamble with strategic considerations needed to architect a data system for generative AI workloads.
New agentic AI preamble introducing architecture paradigms for agentic systems.
Eight architecture scenarios covering common generative AI-powered business applications such as autonomous call centers, knowledge worker co-pilots, and multi-tenant generative AI service systems.
The Generative AI Lens builds upon the foundation established by the ML Lens, providing specialized guidance for the unique challenges and opportunities presented by foundation models and generative AI applications.
Implementation strategy for Well-Architected AI/ML guidance: A unified approach
The new lenses – Responsible AI Lens, Machine Learning Lens, and Generative AI Lens – work together to provide comprehensive guidance for AI development. The Responsible AI Lens guides safe, fair, and secure AI development. It helps balance business needs with technical requirements, streamlining the transition from experimentation to production. The Machine Learning Lens guides organizations in evaluating workloads across both modern AI and traditional machine learning approaches. Recent updates focus on key areas including enhanced data and AI collaborative workflows, AI-assisted development capabilities, large-scale infrastructure provisioning, and customizable model deployment. The Generative AI Lens helps customers evaluate large language model (LLM) based architectures and its updates include guidance for Amazon SageMaker HyperPod users, new insights on agentic AI, and updated architectural scenarios.
What are the next steps?
The launch of these new lenses at re:Invent 2025 helps organizations build AI systems that are responsible, trustworthy, powerful, and effective. By providing comprehensive guidance across the full spectrum of AI workloads, AWS supports organizations to accelerate their AI initiatives while maintaining the highest standards of responsible AI and technical excellence.
Learn more about the AWS Well-Architected Framework and implement the best practice guidance provided using the GitHub repository. These lenses are practical tools designed to help you build AI systems that deliver real business value while maintaining the highest standards of ethics, security, and operational excellence.
For additional reading, refer to the AWS Well-Architected Framework and pillar whitepapers, or contact your AWS Solutions Architect or Account Representative for support on implementing these lenses in your organization.
AWS CloudFormation makes it easy to model and provision your cloud application infrastructure as code. CloudFormation templates can be written directly in JSON or YAML, or they can be generated by tools like the AWS Cloud Development Kit (CDK). Resources are created and managed by CloudFormation as units called Stacks. Additionally, change set enable you to preview the stack changes before deployment.
CloudFormation now offers powerful new features that transform how you develop and troubleshoot infrastructure as code, pre-deployment validation that catches errors in seconds, enhanced operation tracking, and simplified failure debugging. These capabilities shift-left infrastructure code validation, helping you prevent infrastructure deployment failures that impacts development velocity.
In this blog post, we’ll explore how these new features accelerate development cycles by catching common errors during change set creation and providing precise troubleshooting through operation tracking and failure filtering. Whether you’re a platform engineer managing complex multi-service deployments or a developer iterating on infrastructure templates, we’ll show you how to:
Validate resource properties and detect naming conflicts before deployment
Prevent deployment failures by checking S3 bucket emptiness before deletion operations
Track operations with unique IDs for focused troubleshooting
Quickly identify root causes using the new describe-events API
This comprehensive guide will walk through real-world scenarios demonstrating how these capabilities can reduce infrastructure deployment failures from hours of debugging to seconds of validation, helping you deliver cloud infrastructure faster and more reliably.
Key Capabilities
Pre-deployment Validation: Catch template errors instantly instead of discovering them after resource provisioning attempts. These include pre-deployment validation for resource property syntax errors, resource naming conflicts for existing resources in your account, and S3 bucket emptiness constraint violations on delete operations.
Operation Tracking: Say goodbye to long debugging sessions. Each stack action now comes with a unique Operation ID, transforming the “needle in haystack” troubleshooting experience into precise, targeted problem-solving.
Streamlined Events API for simplified Debugging: Use the new describe-events API and FailedEvents=true filter to instantly pinpoint issues. One command tells you exactly what went wrong, eliminating the need to scroll through endless logs.
Immediate Feedback: Transform your CI/CD pipeline from a potential bottleneck into a rapid iteration engine. Get immediate feedback on common deployment issues, allowing your team to fix and deploy faster than ever before.
How It works
Pre-deployment Validation
The following scenarios show how you can leverage CloudFormation pre-deployment validation to detect property syntax errors, resource naming conflicts, and constraint violations during change set creation.
Understanding Validation Modes CloudFormation pre-deployment validation operates in two modes that determine how validation failures are handled.
FAIL mode prevents change set execution when validation detects errors, ensuring problematic templates cannot proceed to deployment. This applies to property syntax errors and resource naming conflicts.
WARN mode allows change set creation to succeed despite validation failures, providing warnings that developers can review and address before execution. This applies to constraint violations like S3 bucket emptiness that may be resolvable through manual intervention.
Understanding these modes helps you anticipate whether validation issues will block your deployment workflow or simply require attention before execution.
Let’s walk you through practical scenarios:
Scenario 1: Validate Resource Property Syntax
CloudFormation evaluates each resource property definition or value before provisioning begins. The following example illustrates several common resource property errors:
The “AWS::Lambda::Function” Role property requires an ARN pattern.
The “AWS::Lambda::Function” Timeout property expects an integer instead of a string.
The “AWS::Lambda::Function” TracingConfig.Mode nested property ENUM value is invalid.
The “AWS::Lambda::Alias” Name property is required but not defined.
The “AWS::Lambda::Alias” the extra property Description in a nested path RoutingConfig.AdditionalVersionWeights.0 is not supported.
Prior to this launch, these resource configuration errors would be detected at the resource provisioning time only. However, with the pre-deployment validations feature, these errors can be identified ahead of the deployment phase, streamlining the development-test lifecycle efficiency and minimizing rollbacks during deployments.
You can see the status of the change set is failed with a detailed status reason. You can now proceed to review the change set validation results.
Step 3: Review validation results
Console
With the console, you can review multiple validation errors in a single interface. When you click on a validation, CloudFormation pinpoints the location of the invalid property error in your template.
Figure 3: Pre-deployment validations view
Use Case: Invalid ENUM value for nested property Catching invalid configuration values before deployment. This demonstrates validation of nested properties like TracingConfig.Mode. The tool helpfully shows the supported values “Active” & “Pass through” as well as the provided invalid value “DISABLED”.
Figure 4: Validation of Invalid ENUM value for nested property
Use Case: Lambda Function Timeout property type mismatch Preventing type-related deployment failures. Shows how validation catches string values (“30s”) where integers are required, saving developers from runtime errors.
Figure 5: Validation of Lambda Function Timeout property type mismatch
Use Case: Lambda Function Role property pattern mismatch Validating ARN format requirements. Demonstrates pattern validation ensuring Role properties match required ARN format.
Figure 6: Lambda Function Role property pattern mismatch
Use Case: Undefined required Lambda Alias Name property Catching missing required properties. Shows validation detecting absent mandatory fields, preventing incomplete resource definitions from reaching deployment.
Figure 7: Validation of undefined required Lambda Alias Name property
Notice how the validation Path field (e.g., “/Resources/MyLambdaFunction/Properties/TracingConfig/Mode”) pinpoints the exact template location of each error. This eliminates manual searching through hundreds of lines of infrastructure code – a common time sink that can take minutes in complex templates.
Use case: Unsupported property Shows how CloudFormation validation catches unsupported properties. In this example, the AWS::Lambda::Alias resource had an unsupported extra property Description in a nested path RoutingConfig.AdditionalVersionWeights.0.
Figure 8: CloudFormation validation of unsupported resource property
CLI command You can also use the new describe-events API to review the validation responses.
Scenario 2: Resource Name Conflict Validation Resource name conflict validation makes sure that new resources added to a template are not already present in your AWS account or globally (e.g: Amazon S3, Amazon Route 53 DNS), preventing deployment errors caused due to resource name conflicts
After reviewing the property validation exceptions, let’s assume that you resolved all the issues and successfully deployed the stack. Next, the you have decided to include a S3 bucket resource in the template. You name the bucket “dev-thumbnails” but didn’t verify if the bucket with this name already exists. If a bucket with this name already exists, the CreateChangeSet operation will fail, reporting to the developer that the bucket already exists.
Step 2: Review Deployment Validations Use CloudFormation change set console to review validations response or use the new DescribeEvents API in the CLi.
Scenario 3: S3 bucket not empty Since AWS S3 service does not allow customers to delete S3 Buckets when there are objects in them, the new pre-deployment validations will warn you if you try to delete a bucket that is not empty.
Resuming our journey, let’s assume that you fix the name conflict issue by renaming the bucket to “dev-test-tumbnails”, and then updates the stack. After testing the lambda function’s integration with S3, the dev-cycle generated a few thumbnail objects in the S3 bucket.
Later, you decide to fix the bucket name because you notice a typo: “dev-test-tumbnails” should be “dev-test-thumbnails” (missing “h”). When you update the template to use the corrected name, CloudFormation will need to create the new bucket then delete the old one during the clean-up phase.
{
"OperationEvents": [
{
"EventId": "24920e0f-1941-45a5-9177-786bc805b724",
"StackId": "arn:aws:cloudformation:us-west-2:123456789012:stack/dev-lambda-stack/2d2c3240-bb59-11f0-b080-0613dc96740d",
"OperationId": "8fef2b60-b411-4d0e-920e-7ec7c7aa39f2",
"OperationType": "CREATE_CHANGESET",
"OperationStatus": "SUCCEEDED",
"EventType": "STACK_EVENT",
"Timestamp": "2025-11-06T22:52:26.355000+00:00",
"StartTime": "2025-11-06T22:52:21.071000+00:00",
"EndTime": "2025-11-06T22:52:26.355000+00:00"
},
{
"EventId": "c117e02d-a652-4755-9586-6d4ccb0f6504",
"StackId": "arn:aws:cloudformation:us-west-2:123456789012:stack/dev-lambda-stack/2d2c3240-bb59-11f0-b080-0613dc96740d",
"OperationId": "8fef2b60-b411-4d0e-920e-7ec7c7aa39f2",
"OperationType": "CREATE_CHANGESET",
"EventType": "VALIDATION_ERROR",
"LogicalResourceId": "MyDevThumbnailsBucket",
"PhysicalResourceId": "",
"ResourceType": "AWS::S3::Bucket",
"Timestamp": "2025-11-06T22:52:25.960000+00:00",
"ValidationFailureMode": "WARN", "ValidationName": "BUCKET_EMPTINESS_VALIDATION", "ValidationStatus": "FAILED", "ValidationStatusReason": "The bucket 'dev-tumbnails' is not empty. You must either delete all objects and versions or use the deletion policy to retain it, otherwise the delete operation will fail.", "ValidationPath": "/Resources/MyDevThumbnailsBucket"
},
{
"EventId": "6c66ff53-6751-4b4c-96b8-d1a33fc43b4f",
"StackId": "arn:aws:cloudformation:us-west-2:123456789012:stack/dev-lambda-stack/2d2c3240-bb59-11f0-b080-0613dc96740d",
"OperationId": "8fef2b60-b411-4d0e-920e-7ec7c7aa39f2",
"OperationType": "CREATE_CHANGESET",
"OperationStatus": "IN_PROGRESS",
"EventType": "STACK_EVENT",
"Timestamp": "2025-11-06T22:52:21.071000+00:00",
"StartTime": "2025-11-06T22:52:21.071000+00:00"
}
]
}
Bucket emptiness validation uses WARN mode, which allows change set creation to succeed even when the validation check fails. This gives you time to review and empty the bucket before execution. However, if you execute the change set without emptying the bucket, the delete operation will fail.
Notice in the output above:
ValidationStatus: "FAILED" – The emptiness check detected objects in the bucket
ValidationFailureMode: "WARN" – This is a warning, not a blocking error
OperationStatus: "SUCCEEDED" – Change set creation completed successfully despite the warning
This design allows you to review the warning, take corrective action (such as emptying the bucket), and then proceed with execution.
Beyond catching errors early, these capabilities also transform how you troubleshoot failed deployments with enhanced operation tracking and filtering.
New DescribeEvents API with Operation IDs and root cause filtering
The new DescribeEvents API retrieves CloudFormation events based on flexible query criteria. It groups stack operations by operation ID, enabling you to focus specifically on individual stack operations involved during your stack deployment.
Operation: An operation is any action performed on a stack, including stack lifecycle actions (Create, Update, Delete, Rollback), change set creation, nested stack creation, and automatic rollbacks triggered by failures. Each operation has a unique identifier and represents a discrete change attempt on the stack.
Figure 11: Stack Events grouped by Operation Id
Scenario When an update operation on an existing stack fails and results in a rollback, and you want to understand the reason behind the update stack failure. Using the operation ID obtained from the update stack response or from the describe stacks response, you can call describe events to get details on the failure.
The stack description available via describe-stacks API now includes LastOperations information showing recent operation IDs and their types. This enables you to quickly identify which operations occurred and their current status without parsing through event logs.
Figure 11: CloudFormation Stack Info page showing new operation IDs
Step 3: Review operation status with describe events API and operation id Using the operation ID from the previous step, you can now query specific operation events to understand exactly what happened during that operation. This targeted approach eliminates the need to search through all stack events to find relevant information.
Figure 12: New CloudFormation stack operation page
Step 4: Identify failure root cause(s) with FailedEvents filter The new failure root cause filter instantly surfaces only the events that caused the operation to fail. This eliminates the need to manually scan through progress events to identify the root cause of deployment failures.
The FailedEvents=true filter transforms troubleshooting from parsing dozens of progress events to instantly seeing only what matters. This can make diagnosis of issues during an incident much easier..
Real-World Impact These features improve your Infrastructure development experience with CloudFormation:
Template syntax errors: Previously discovered after minutes of provisioning, now caught in seconds
Resource conflicts: No more failed deployments due to existing resources
Debugging complexity: Transform troubleshooting sessions into faster targeted fixes
CI/CD reliability: Reduce pipeline failures and improve deployment confidence
Getting Started
These capabilities are available today in all AWS Regions where CloudFormation is supported. Pre-deployment validation is automatically enabled for all change set operations, no configuration required.
Try it now:
Create any change set from the CloudFormation console or via SDK or CLI with aws cloudformation create-change-set
Use `aws cloudformation describe-events –change-set-name <your-changeset-arn>` to see validation results
Filter failure root causes instantly: via console or CLI with aws cloudformation describe-events –operation-id <id> –filter FailedEvents=true
Best Practices
Always use change sets: Even for simple updates, change sets now provide validation feedback
Leverage Operation IDs: Use the unique identifiers for focused troubleshooting
Filter events strategically: Use –filters FailedEvents=true to focus on problems
Automate validation: Integrate the describe-events API into your CI/CD pipelines
Use Console: CloudFormation console provides a visual experience with error source mapping to the specific line on your template.
Conclusion
Start using these features today in your development workflow. Whether you’re building new infrastructure or maintaining existing stacks, early validation and enhanced troubleshooting will accelerate your deployment cycles and make it easier to manage infrastructure.
Ready to experience faster CloudFormation development? Create your first change set and see validation in action.
Today, we’re announcing the general availability of Amazon Elastic Compute Cloud (Amazon EC2) P6-B300 instances, our next-generation GPU platform accelerated by NVIDIA Blackwell Ultra GPUs. These instances deliver 2 times more networking bandwidth, and 1.5 times more GPU memory compared to previous generation instances, creating a balanced platform for large-scale AI applications.
With these improvements, P6-B300 instances are ideal for training and serving large-scale AI models, particularly those employing sophisticated techniques such as Mixture of Experts (MoE) and multimodal processing. For organizations working with trillion-parameter models and requiring distributed training across thousands of GPUs, these instances provide the perfect balance of compute, memory, and networking capabilities.
Improvements made compared to predecessors The P6-B300 instances deliver 6.4Tbps Elastic Fabric Adapter (EFA) networking bandwidth, supporting efficient communication across large GPU clusters. These instances feature 2.1TB of GPU memory, allowing large models to reside within a single NVLink domain, which significantly reduces model sharding and communication overhead. When combined with EFA networking and the advanced virtualization and security capabilities of AWS Nitro System, these instances provide unprecedented speed, scale, and security for AI workloads.
The specs for the EC2 P6-B300 instances are as follows.
Instance size
VCPUs
System memory
GPUs
GPU memory
GPU-GPU interconnect
EFA network bandwidth
ENA bandwidth
EBS bandwidth
Local storage
P6-B300.48xlarge
192
4TB
8x B300 GPU
2144GB HBM3e
1800 GB/s
6.4 Tbps
300 Gbps
100 Gbps
8x 3.84TB
Good to know In terms of persistent storage, AI workloads primarily use a combination of high performance persistent storage options such as Amazon FSx for Lustre, Amazon S3 Express One Zone, and Amazon Elastic Block Store (Amazon EBS), depending on price performance considerations. For illustration, the dedicated 300Gbps Elastic Network Adapter (ENA) networking on P6-B300 enables high-throughput hot storage access with S3 Express One Zone, supporting large-scale training workloads. If you’re using FSx for Lustre, you can now use EFA with GPUDirect Storage (GDS) to achieve up to 1.2Tbps of throughput to the Lustre file system on the P6-B300 instances to quickly load your models.
Available now The P6-B300 instances are now available through Amazon EC2 Capacity Blocks for ML and Savings Planin the US West (Oregon) AWS Region. For on-demand reservation of P6-B300 instances, please reach out to your account manager. As usual with Amazon EC2, you pay only for what you use. For more information, refer to Amazon EC2 Pricing. Check out the full collection of accelerated computing instances to help you start migrating your applications.
AWS Lambda now supports Python 3.14 as both a managed runtime and container base image. Python is a popular language for building serverless applications. Developers can now take advantage of new features and enhancements when creating serverless applications on Lambda.
The Python 3.14 runtime supports Powertools for AWS Lambda (Python), a developer toolkit that helps you to implement serverless best practices. Powertools includes observability, batch processing, AWS Systems Manager Parameter Store integration, idempotency, feature flags, Amazon CloudWatch metrics, structured logging, and more.
This blog post highlights notable Python language updates, Python Lambda runtime features and support, and how you can use the new Python 3.14 runtime in your serverless applications.
New Python features
Python 3.14 contains the following notable updates.
Template strings literal
Template strings introduce a new mechanism for custom string processing using the t prefix instead of f for f-strings. Unlike f-strings that return a simple string, t-strings return an object representing both static and interpolated parts.
Evaluation of type annotations
With the implementation of PEP 649, Python 3.14 defers type annotation evaluation until required. This reduces import time overhead and resolves forward reference issues.
Improved Error Messages
The interpreter now provides helpful suggestions when it detects typos in Python keywords. These include incorrect control flow structures, misused conditional expressions, string syntax errors, incompatible type usage in dicts/sets, and context manager protocol mismatches.
whille :
Traceback (most recent call last):
File "<stdin>", line 1
whille :
^^^^^^
SyntaxError: invalid syntax. Did you mean 'while'?
Standard library
The standard library includes a new compression.zstd module that provides native support for zstandard compression, offering better compression ratios and faster decompression compared to existing algorithms.
Python 3.14 also includes improved error messages and enhanced asyncio introspection capabilities.
Lambda runtime changes
The Lambda Python runtime contains the following changes.
Python 3.14 features that are not available
Python 3.14 includes some features that are not enabled for the Lambda managed runtime or base images. These features must be enabled when the Python runtime is compiled and cannot be enabled via an execution-time flag. The just-in-time (JIT) compiler is not available in the Lambda runtime because it’s still in an experimental phase. Free-threaded mode, running Python without the global interpreter lock, is supported in Python 3.14, but it is not enabled in the Lambda runtime due to potential performance impact. To use these features in Lambda, you can deploy your own Python runtime build with these features enabled, using a container image or custom runtime.
Amazon Linux 2023
As with the Python 3.12 and Python 3.13 runtimes, the Python 3.14 runtime is based on the provided.al2023 runtime, which is based on the Amazon Linux 2023 minimal container image. The Amazon Linux 2023 minimal image uses microdnf as a package manager, symlinked as dnf. This replaces the yum package manager used in Python 3.11 and earlier AL2-based images. If you deploy your Lambda functions as container images, you must update your Dockerfiles to use dnf instead of yum when upgrading to the Python 3.14 base image from Python 3.11 or earlier base images.
You can use Python 3.14 for your Lambda functions in the AWS Management Console, an AWS Lambda container image, or the AWS Cloud Development Kit (AWS CDK).
AWS Management Console
To use the Python 3.14 runtime to develop your Lambda functions, specify a runtime parameter value of Python 3.14 when creating or updating a function. On the Create Function page of the AWS Lambda console, Python 3.14 is available in the Runtime dropdown menu.
To update an existing Lambda function to Python 3.14, navigate to the function in the Lambda console and choose Edit in the Runtime settingspanel. The new version of Python is available in the Runtime dropdown menu.
Upgrading a function to Python 3.14
To upgrade a function to Python 3.14, check your code and dependencies for compatibility with Python 3.14, run tests, and update as necessary. Consider using generative AI coding assistants like Amazon Q Developer, Amazon Q Developer for CLI, or Kiro to help with upgrades.
AWS Lambda container image
Change the Python base image version by modifying the FROM statement in your Dockerfile:
FROM public.ecr.aws/lambda/python:3.14
# Copy function code
COPY lambda_handler.py ${LAMBDA_TASK_ROOT}
AWS Serverless Application Model (AWS SAM)
In AWS SAM set the Runtime attribute to python3.14 to use this version.
AWSTemplateFormatVersion: '2010-09-09'
Transform: AWS::Serverless-2016-10-31
Description: Simple Lambda Function
MyFunction:
Type: AWS::Serverless::Function
Properties:
Description: My Python Lambda Function
CodeUri: my_function/
Handler: lambda_function.lambda_handler
Runtime: python3.14
AWS SAM supports generating this template with Python 3.14 for new serverless applications using the sam init command. Refer to the AWS SAM documentation.
AWS Cloud Development Kit
In the AWS CDK, set the runtime attribute to lambda.Runtime.PYTHON_3_14 to use this version.
In Python CDK:
from constructs import Construct
from aws_cdk import ( App, Stack, aws_lambda as _lambda )
class SampleLambdaStack(Stack):
def __init__(self, scope: Construct, id: str, **kwargs) -> None:
super().__init__(scope, id, **kwargs)
base_lambda = _lambda.Function(self, 'python314LambdaFunction',
handler='lambda_handler.handler',
runtime=_lambda.Runtime.PYTHON_3_14,
code=_lambda.Code.from_asset('lambda'))
In TypeScript CDK:
import * as cdk from 'aws-cdk-lib';
import * as lambda from 'aws-cdk-lib/aws-lambda'
import * as path from 'path';
import { Construct } from 'constructs';
export class SampleLambdaStack extends cdk.Stack {
constructor(scope: Construct, id: string, props?: cdk.StackProps) {
super(scope, id, props);
// The code that defines your stack goes here
// The python3.14 enabled Lambda Function
const lambdaFunction = new lambda.Function(this, 'python314LambdaFunction', {
runtime: lambda.Runtime.PYTHON_3_14,
memorySize: 512,
code: lambda.Code.fromAsset(path.join(__dirname, '/../lambda')),
handler: 'lambda_handler.handler'
})
}
}
At launch, new Lambda runtimes receive less usage than existing established runtimes. This can result in longer cold start times due to reduced cache residency within internal Lambda sub-systems. Cold start times typically improve in the weeks following launch as usage increases. As a result, AWS recommends not drawing conclusions from side-by-side performance comparisons with other Lambda runtimes until the performance has stabilized. Since performance is highly dependent on workload, customers with performance-sensitive workloads should conduct their own testing instead of relying on generic test benchmarks.
Conclusion
Lambda now supports Python 3.14 as a managed language runtime to help developers build more efficient, powerful, and scalable serverless applications. Python 3.14 language additions include data model improvements, typing changes, and updates to the standard library. The Lambda managed runtime does not include the option to disable the global interpreter lock (GIL) or use the experimental JIT compiler.
You can build and deploy functions using Python 3.14 using the AWS Management Console, AWS CLI, AWS SDK, AWS SAM, AWS CDK, or your choice of infrastructure as code tool. You can also use the Python 3.14 container base image if you prefer to build and deploy your functions using container images.
Try the Python 3.14 runtime in Lambda today and experience the benefits of this updated language version.
Today, AWS announced Amazon Managed Workflows for Apache Airflow (MWAA) Serverless. This is a new deployment option for MWAA that eliminates the operational overhead of managing Apache Airflow environments while optimizing costs through serverless scaling. This new offering addresses key challenges that data engineers and DevOps teams face when orchestrating workflows: operational scalability, cost optimization, and access management.
With MWAA Serverless you can focus on your workflow logic rather than monitoring for provisioned capacity. You can now submit your Airflow workflows for execution on a schedule or on demand, paying only for the actual compute time used during each task’s execution. The service automatically handles all infrastructure scaling so that your workflows run efficiently regardless of load.
Beyond simplified operations, MWAA Serverless introduces an updated security model for granular control through AWS Identity and Access Management (IAM). Each workflow can now have its own IAM permissions, running on a VPC of your choosing so you can implement precise security controls without creating separate Airflow environments. This approach significantly reduces security management overhead while strengthening your security posture.
In this post, we demonstrate how to use MWAA Serverless to build and deploy scalable workflow automation solutions. We walk through practical examples of creating and deploying workflows, setting up observability through Amazon CloudWatch, and converting existing Apache Airflow DAGs (Directed Acyclic Graphs) to the serverless format. We also explore best practices for managing serverless workflows and show you how to implement monitoring and logging.
How does MWAA Serverless work?
MWAA Serverless processes your workflow definitions and executes them efficiently in service-managed Airflow environments, automatically scaling resources based on workflow demands. MWAA Serverless uses the Amazon Elastic Container Service (Amazon ECS) executor to run each individual task on its own ECS Fargate container, on either your VPC or a service-managed VPC. Those containers then communicate back to their assigned Airflow cluster using the Airflow 3 Task API.
Figure 1: Amazon MWAA Architecture
MWAA Serverless uses declarative YAML configuration files based on the popular open source DAG Factory format to enhance security through task isolation. You have two options for creating these workflow definitions:
Write your workflows directly in YAML using AWS managed operators from the Amazon Provider Package
This declarative approach provides two key benefits. First, since MWAA Serverless reads workflow definitions from YAML it can determine task scheduling without running any workflow code. Second, this allows MWAA Serverless to grant execution permissions only when tasks run, rather than requiring broad permissions at the workflow level. The result is a more secure environment where task permissions are precisely scoped and time limited.
Service considerations for MWAA Serverless
MWAA Serverless has the following limitations that you should consider when deciding between serverless and provisioned MWAA deployments:
Operator support
MWAA Serverless only supports operators from the Amazon Provider Package.
To execute custom code or scripts, you’ll need to use AWS services, such as:
Note: Throughout this post, we use example values that you’ll need to replace with your own:
Replace amzn-s3-demo-bucket with your S3 bucket name
Replace 111122223333 with your AWS account number
Replace us-east-2 with your AWS Region. MWAA Serverless is available in multiple AWS Regions. Check the List of AWS Services Available by Region for current availability.
Creating your first serverless workflow
Let’s start by defining a simple workflow that gets a list of S3 objects and writes that list to a file in the same bucket. Create a new file called simple_s3_test.yaml with the following content:
For this workflow to run, you must create an Execution role that has permissions to list and write to the above bucket. The role also needs to be assumable from MWAA Serverless. The following CLI commands create this role and its associated policy:
AWS has published a conversion tool that uses the open-source Airflow DAG processor to serialize Python DAGs into YAML DAG factory format. To install, you run the following:
Note that, because the YAML conversion is done after the DAG parsing, the loop that creates the tasks is run first and the resulting static list of tasks is written to the YAML document with their dependencies.
Migrating an MWAA environment’s DAGs to MWAA Serverless
You can take advantage of a provisioned MWAA environment to develop and test your workflows and then move them to serverless to run efficiently at scale. Further, if your MWAA environment is using compatible MWAA Serverless operators, then you can convert all of the environment’s DAGs at once. The first step is to allow MWAA Serverless to assume the MWAA Execution role via a trust relationship. This is a one-time operation for each MWAA Execution role, and can be performed manually in the IAM console or using an AWS CLI command as follows:
MWAA Serverless workflow execution status is returned via the GetWorkflowRun function. The results from that will return details for that particular run. If there are errors in the workflow definition, they are returned under RunDetail in the ErrorMessage field as in the following example:
MWAA Serverless task logs are stored in the CloudWatch log group /aws/mwaa-serverless/<workflow id>/ (where /<workflow id> is the same string as the unique workflow id in the ARN of the workflow). For specific task log streams, you will need to list the tasks for the workflow run and then get each task’s information. You can combine these operations into a single CLI command.
After completing these steps, verify in the AWS Management Console that all resources have been properly removed. Remember that CloudWatch Logs are retained by default and may need to be deleted separately if you want to remove all traces of your workflow executions.
If you encounter any errors during cleanup, verify you have the necessary permissions and that resources exist before attempting to delete them. Some resources may have dependencies that require them to be deleted in a specific order.
Conclusion
In this post, we explored Amazon MWAA Serverless, a new deployment option that simplifies Apache Airflow workflow management. We demonstrated how to create workflows using YAML definitions, convert existing Python DAGs to the serverless format, and monitor your workflows.
MWAA Serverless offers several key advantages:
No provisioning overhead
Pay-per-use pricing model
Automatic scaling based on workflow demands
Enhanced security through granular IAM permissions
Simplified workflow definitions using YAML
To learn more MWAA Serverless, review the documentation.
The weeks before AWS re:Invent, my team is full steam ahead preparing content for the conference. I can’t wait to meet you at one of my three talks: CMP346 : Supercharge AI/ML on Apple Silicon with EC2 Mac, CMP344: Speed up Apple application builds with CI/CD on EC2 Mac, and DEV416: Develop your AI Agents and MCP Tools in Swift.
Last week, AWS announced three new AWS Heroes. The AWS Heroes program recognizes a vibrant, worldwide group of AWS experts whose enthusiasm for knowledge-sharing has a real impact within the community. Welcome to the community, Dimple, Rola, and Vivek.
We also opened the GenAI Loft in Tel Aviv, Israel. AWS Gen AI Lofts are collaborative spaces and immersive experiences for startups and developers. The Loft content is tailored to address local customer needs – from startups and enterprises to public sector organizations, bringing together developers, investors, and industry experts under one roof.
AWS Network Load Balancer (NLB) now supports QUIC protocol in passthrough mode – This provides ultra-low latency traffic forwarding with session stickiness using QUIC Connection IDs. This capability reduces application latency by 25-30% for mobile-first applications through minimized handshakes and connection resilience. NLB operates in passthrough mode, forwarding QUIC traffic directly to targets while maintaining customer control over TLS certificates and end-to-end encryption. The blog post has the details.
Application Load Balancer (ALB) support client credential flow with JWT verification – This one is important for API developers too. This simplifies the deployment of secure machine-to-machine (M2M) and service-to-service (S2S) communications. This provides ALB with the ability to verify JWTs, reducing architectural complexity and simplifying security implementation.
AWS KMS now supports Edwards-curve Digital Signature Algorithm (EdDSA) – This capability provides 128-bit security equivalent to NIST P-256 with faster signing performance and compact sizes (64-byte signatures, 32-byte public keys). Ed25519 is ideal for IoT devices and blockchain applications requiring small key and signature sizes.
Amazon DCV now supports Amazon EC2 Mac instances – This provides high-performance remote desktop access with 4K resolution and 60 FPS performance. You can connect from Windows, Linux, macOS, or web clients with features including time zone redirection and audio output.
Make your web apps hands-free with Amazon Nova Sonic – Amazon Nova Sonic, a foundation model from AAmazon Bedrock, provides you with the ability to create natural, low-latency, bidirectional speech conversations for applications. This provides users with the ability to collaborate with applications through voice and embedded intelligence, unlocking new interaction patterns and enhancing usability. This blog post demonstrates a reference app, Smart Todo App. It shows how voice can be integrated to provide a hands-free experience for task management.
AWS X-Ray SDKs & Daemon migration to OpenTelemetry – AWS X-Ray is transitioning to OpenTelemetry as its primary instrumentation standard for application tracing. OpenTelemetry-based instrumentation solutions are recommended for producing traces from applications and sending them to AWS X-Ray. X-Ray’s existing console experience and functionality continue to be fully supported and remains unchanged by this transition.
Powering the world’s largest events: How Amazon CloudFront delivers at scale – Amazon CloudFront achieved a record-breaking peak of 268 terabits per second on November 1, 2025, during major game delivery workloads—enough bandwidth to simultaneously stream live sports in HD to approximately 45 million concurrent viewers. This milestone demonstrates the CloudFront massive scale, powered by 750+ edge locations across 440+ cities globally and 1,140+ embedded PoPs within 100+ ISPs, with the latest generation delivering 3x the performance of previous versions.
Upcoming AWS events Check your calendars so that you can sign up for these upcoming events:
AWS Builder Loft – A community tech space in San Francisco where you can learn from expert sessions, join hands-on workshops, explore AI and emerging technologies, and collaborate with other builders to accelerate your ideas. Browse the upcoming sessions and join the events that interest you.
AWS Community Days – Join community-led conferences that feature technical discussions, workshops, and hands-on labs led by experienced AWS users and industry leaders from around the world. I will deliver the opening keynote at the last Community Day of the year in Kinshasa, Democratic Republic of Congo (November 22). The next Community Day will be in Timişoara, România (April 2026). The call for papers is now open.
This post is part of our Weekly Roundup series. Check back each week for a quick roundup of interesting news and announcements from AWS!
The collective thoughts of the interwebz
Manage Consent
To provide the best experiences, we use technologies like cookies to store and/or access device information. Consenting to these technologies will allow us to process data such as browsing behavior or unique IDs on this site. Not consenting or withdrawing consent, may adversely affect certain features and functions.
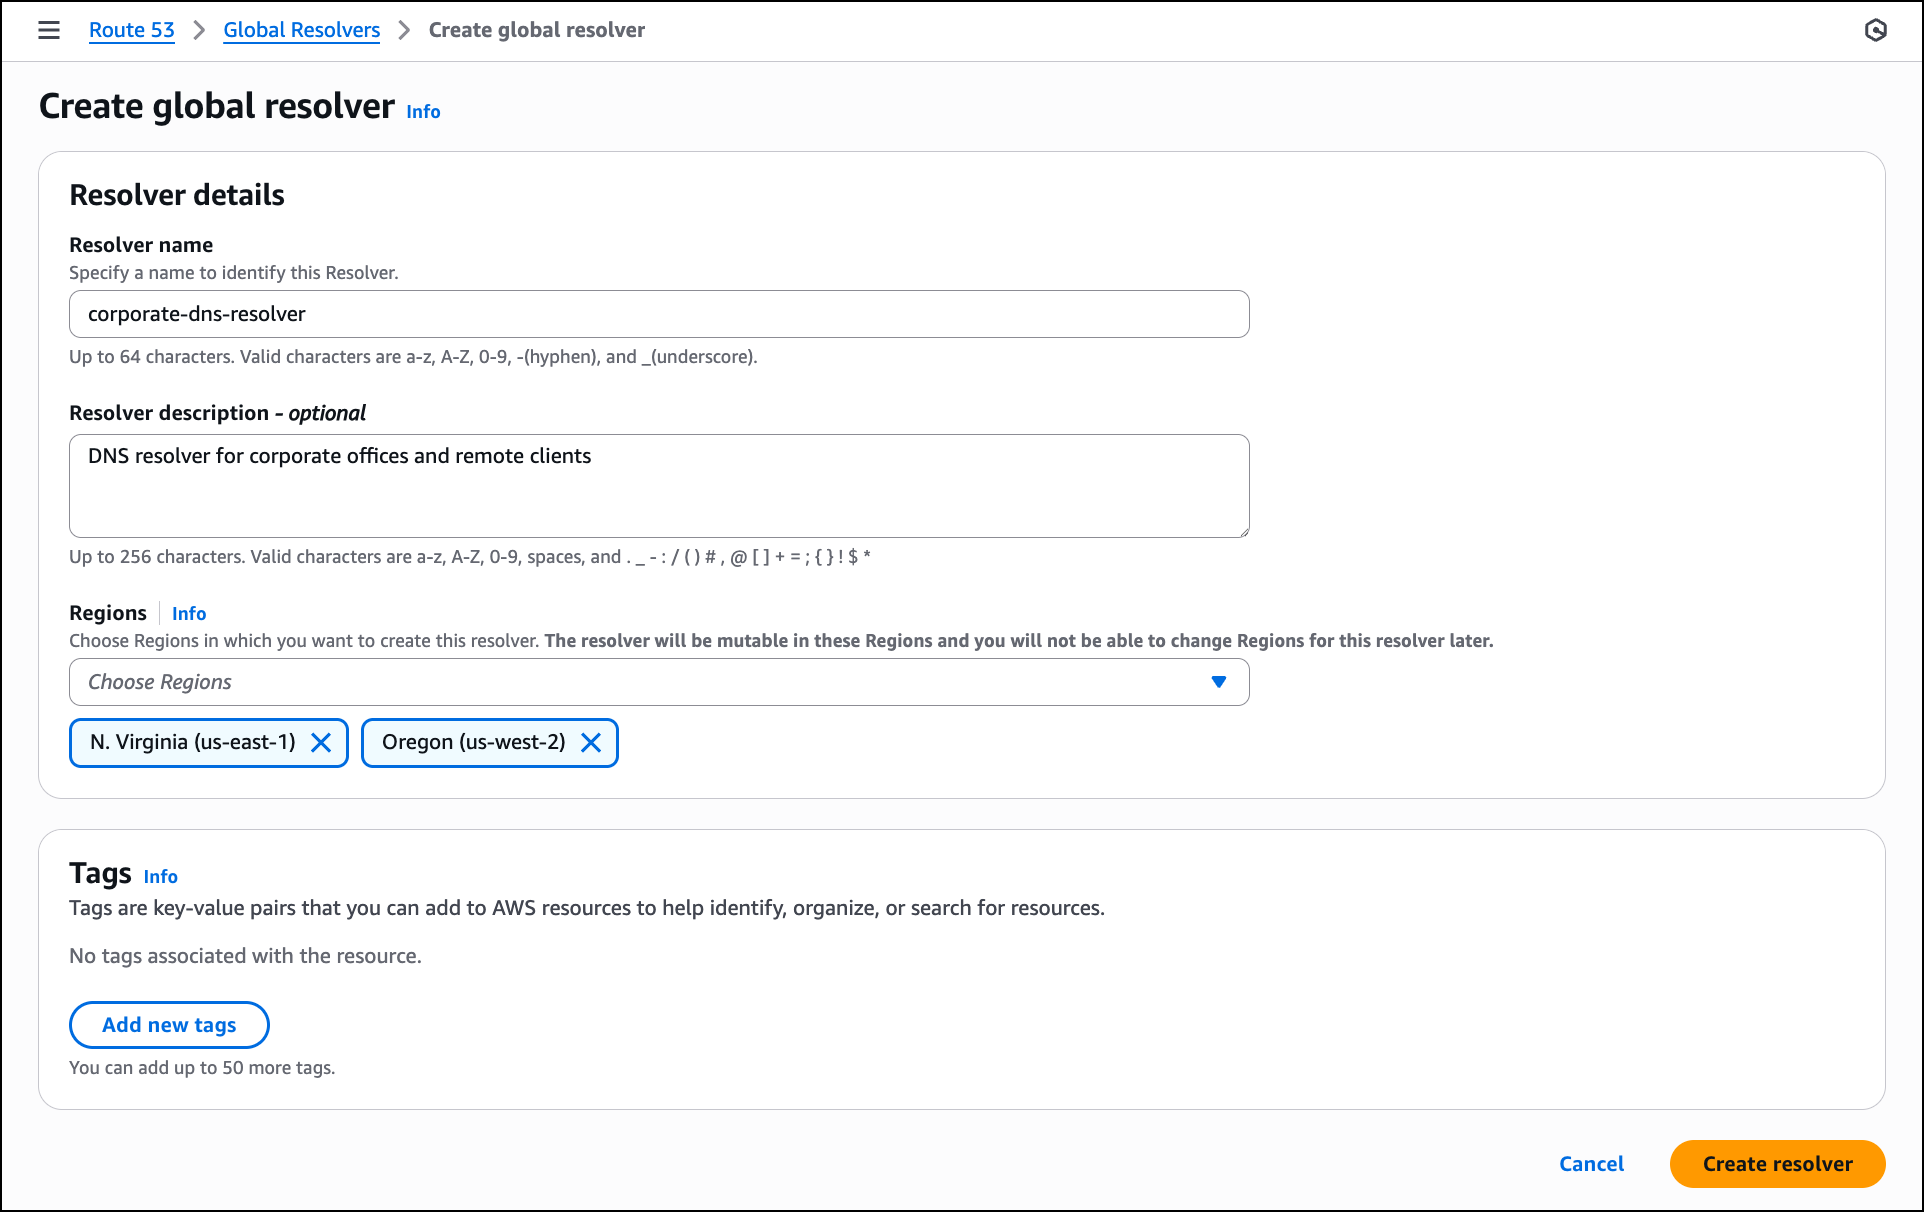
Functional
Always active
The technical storage or access is strictly necessary for the legitimate purpose of enabling the use of a specific service explicitly requested by the subscriber or user, or for the sole purpose of carrying out the transmission of a communication over an electronic communications network.
Preferences
The technical storage or access is necessary for the legitimate purpose of storing preferences that are not requested by the subscriber or user.
Statistics
The technical storage or access that is used exclusively for statistical purposes.The technical storage or access that is used exclusively for anonymous statistical purposes. Without a subpoena, voluntary compliance on the part of your Internet Service Provider, or additional records from a third party, information stored or retrieved for this purpose alone cannot usually be used to identify you.
Marketing
The technical storage or access is required to create user profiles to send advertising, or to track the user on a website or across several websites for similar marketing purposes.