Tag Archives: AWS Lambda

Automated launch of genomics workflows

Post Syndicated from Rostislav Markov original https://aws.amazon.com/blogs/architecture/automated-launch-of-genomics-workflows/

Genomics workflows are high-performance computing workloads. Traditionally, they run on-premises with a collection of scripts. Scientists run and manage these workflows manually, which slows down the product development lifecycle. Scientists spend time to administer workflows and handle errors on a day-to-day basis. They also lack sufficient compute capacity on-premises.

In this blog post, we demonstrate how life sciences companies can use Amazon Web Services (AWS) to remove the traditional heavy lifting associated with genomic studies. We use AWS Step Functions to orchestrate workflow steps, including error handling. With AWS Batch, we horizontally scale-out the analytic tasks for optimal performance. This allows genome scientists to focus on scientific discovery while AWS runs their workflows.

Use case

Workflow systems used for genomic analysis include Cromwell, Nextflow, and regenie. These high-performance computing systems share the following requirements:

  • Fast access to datasets at petabyte scale
  • Parallel task distribution, with horizontal compute scale-out
  • Data processing in batches following a specific sequence of data analysis steps, which vary by use case

We explore the use case of regenie. regenie is a common, open-source utility for whole-genome regression modelling of large genome-wide association studies (GWAS). GWAS compare DNA datasets of individuals with a specific trait or disease. The intent is to associate the identified trait/disease with DNA variants. Among other positive results, this helps identify at-risk patients, plus testing and prevention opportunities.

regenie is a C++ program that runs in two steps:

  1. The first step searches for variants associated with a specific trait in a dataset of individuals with the trait, in order to create a whole-genome regression model that captures the variance.
  2. The second step validates for association with the identified variants against a larger dataset, typically in the scale of petabytes, and launches a sequence of tasks run on data batches.

Solution overview

The entire regenie workflow and associated tasks of attaching and deleting file-share access to sample data, as well as spinning up compute instances for parallel computing, can be orchestrated with Step Functions. We use Amazon FSx for Lustre as a high-performance, transient file system providing file access to the datasets stored in an Amazon Simple Storage Service (Amazon S3) bucket. AWS Batch allows us to programmatically spin up multiple Amazon Elastic Compute Cloud (Amazon EC2) instances on which regenie can distribute parallel computing tasks. We do this with an AWS Lambda function that calculates the number of required batch jobs based on the requested size of samples per batch.

regenie is available as Docker image on GitHub. We push the image to Amazon Elastic Container Registry from which AWS Batch can pull it with the creation of new jobs at launch time. The Step Functions state machine is initiated by a Lambda function, with interactive user input. In the past, scientists have also directly interacted with the Step Functions API via the AWS Management Console or by running start-execution in the AWS Command Line Interface and passing a JSON file with the input parameters.

Amazon CloudWatch provides a consolidated overview of performance metrics, including elapsed time, failed jobs, and error types. You can keep logs of your failed jobs in Amazon CloudWatch Logs (Figure 1). You can set up filters to match specific error types, plus create subscriptions to deliver a real-time stream of your log events to Amazon Kinesis or AWS Lambda for further retry.

Solution overview for automating regenie workflows on AWS

Figure 1. Solution overview for automating regenie workflows on AWS

Alternatively, the Step Functions workflow triggers another Lambda function, which puts failed job logs to Amazon DynamoDB. In the past, we have used this to ease data access and manipulation via the AWS management console. Scientists updated table items and DynamoDB Streams initiated the retry.

Workflow automation

With each invocation, Step Functions initiates a new instance of the state machine. AWS documentation provides an overview of the API quotas. Step Functions allows the modeling of the entire workflow, including custom application error handling. Map state improves performance by parallelizing workflow branches.

The state machine initiates the build of the file system and, once it’s ready, creates a data repository association with the sample data stored on Amazon S3. It waits until the data repository association is complete and proceeds with the calculation of batch jobs, based on a user-defined number of samples to be processed per batch job (Figure 2). This is essential to determine the amount of compute instances required for data processing.

AWS Step Functions workflow for regenie: initialize file access

Figure 2. AWS Step Functions workflow for regenie: initialize file access

Next, the state machine builds the commands to launch the regenie steps, as requested by the user, and submit the jobs for AWS Batch (Figure 3). The workflow checks if a specific version of regenie was requested by the user, otherwise, it defaults to the version of regenie on the container.

Then, we build the commands to initiate the two regenie steps. Step 2 may need to run in multiple iterations on different datasets (more often than Step 1). This is also determined with user input at initiation of the workflow. With Step Functions, we create runner logic to build the set of commands dynamically. This pattern is applicable to other scientific workloads, as well.
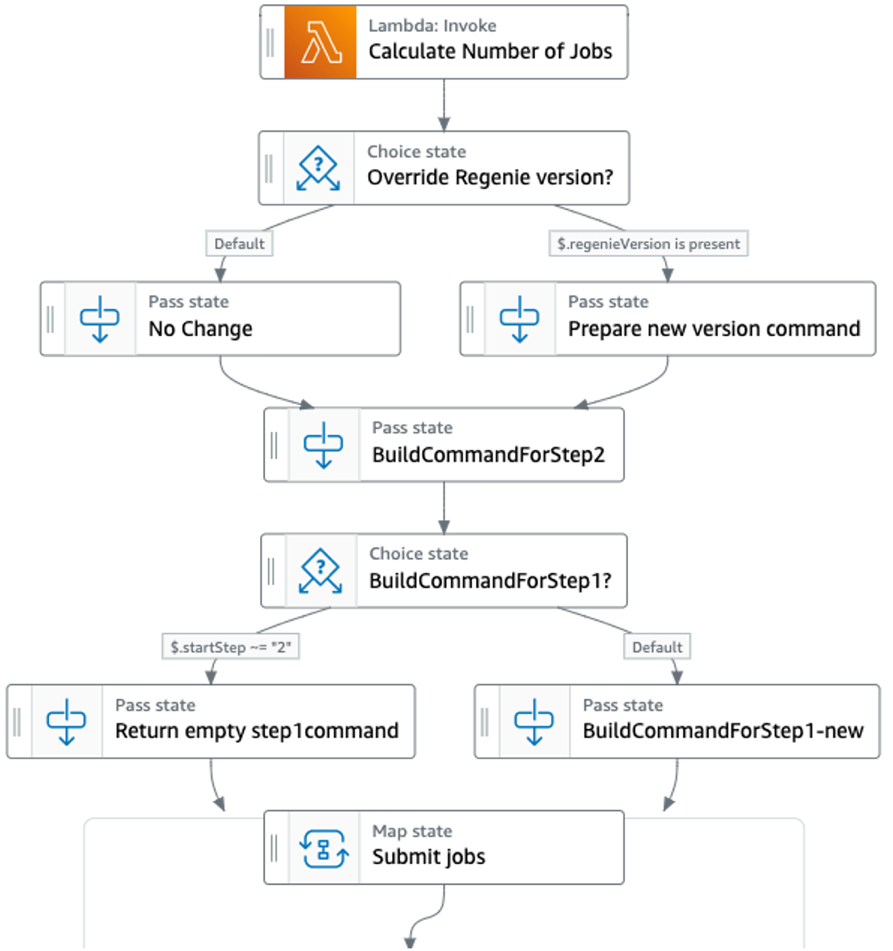
AWS Step Functions workflow for regenie: prepare and submit jobs

Figure 3. AWS Step Functions workflow for regenie: prepare and submit jobs

Once jobs are submitted, the workflow proceeds (by default) with the initiation of Step 1 of regenie; if requested by the user, the workflow will proceed directly to step 2 (Figure 4).

Any errors during batch launch leading to the failure of a job are passed, in this case, to a Lambda function. We configure the Lambda function to write the failed job logs to Amazon DynamoDB or as S3 objects.
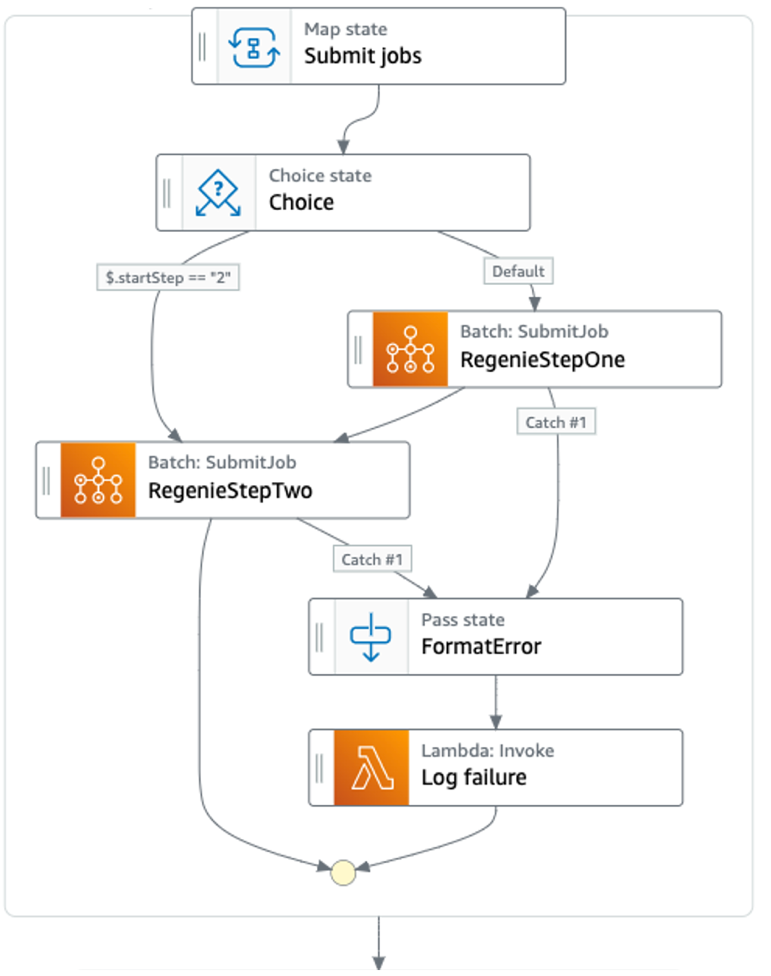
AWS Step Functions workflow for regenie: launch jobs

Figure 4. AWS Step Functions workflow for regenie: launch jobs

Finally, the Step Functions workflow checks for pending errors and confirms that all jobs have finished their initiation. Then, it deletes the file system and data repository association and ends the workflow instance (Figure 5).

AWS Step Functions workflow for regenie: complete error handling and delete file system

Figure 5. AWS Step Functions workflow for regenie: complete error handling and delete file system

As demonstrated, we can automate the entire process, from data access to verifying job completion and cleaning-up transient resources. This removes manual error handling and retry, plus reduces the overall cost of running regenie workflows. We also showed in Figure 3 that you can build commands dynamically for different scientific workloads.

Conclusion

In this blog post, we addressed a common pain point in the daily work of life sciences research teams. Traditionally, they had to run genomics workflows manually on limited compute capacity. Moving those workflows to AWS eliminates the heavy lifting of running scripts manually and expedites computational cycles. This allows research teams to stay focused on scientific discovery.

We recommend a thorough performance testing when setting up your genomics workflows. This includes determining the most suitable EC2 instance size. Some workflows, such as regenie, are single-threaded and benefit from horizontal scale-out of the number of instances but not from vertical scale-out of instance sizes.

Related information

Building serverless .NET applications on AWS Lambda using .NET 7

Post Syndicated from James Beswick original https://aws.amazon.com/blogs/compute/building-serverless-net-applications-on-aws-lambda-using-net-7/

This post is written by James Eastham, Senior Cloud Architect, Beau Gosse, Senior Software Engineer, and Samiullah Mohammed, Senior Software Engineer

Today, AWS is announcing tooling support to enable applications running .NET 7 to be built and deployed on AWS Lambda. This includes applications compiled using .NET 7 native AOT. .NET 7 is the latest version of .NET and brings many performance improvements and optimizations.

Native AOT enables .NET code to be ahead-of-time compiled to native binaries for up to 86% faster cold starts when compared to the .NET 6 managed runtime. The fast execution and lower memory consumption of native AOT can also result in reduced Lambda costs. This post walks through how to get started running .NET 7 applications on AWS Lambda with native AOT.

Overview

Customers can use .NET 7 with Lambda in two ways. First, Lambda has released a base container image for .NET 7, enabling customers to build and deploy .NET 7 functions as container images. Second, you can use Lambda’s custom runtime support to run functions compiled to native code using .NET 7 native AOT. Lambda has not released a managed runtime for .NET 7, since it is not a long-term support (LTS) release.

Native AOT allows .NET applications to be pre-compiled to a single binary, removing the need for JIT (Just In Time compilation) and the .NET runtime. To use this binary in a custom runtime, it needs to include the Lambda runtime client. The runtime client integrates your application code with the Lambda runtime API, which enables your application code to be invoked by Lambda.

The enhanced tooling announced today streamlines the tasks of building .NET applications using .NET 7 native AOT and deploying them to Lambda using a custom runtime. This tooling comprises three tools. The AWS Lambda extension to the ‘dotnet’ CLI (Amazon.Lambda.Tools) contains the commands to build and deploy Lambda functions using .NET. The dotnet CLI can be used directly, and is also used by the AWS Toolkit for Visual Studio, and the AWS Serverless Application Model (AWS SAM), an open-source framework for building serverless applications.

Native AOT compiles code for a specific OS version. If you run the dotnet publish command on your machine, the compiled code only runs on the OS version and processor architecture of your machine. For your application code to run in Lambda using native AOT, the code must be compiled on the Amazon Linux 2 (AL2) OS. The new tooling supports compiling your Lambda functions within an AL2-based Docker image, with the compiled application stored on your local hard drive.

Develop Lambda functions with .NET 7 native AOT

In this section, we’ll discuss how to develop your Lambda function code to be compatible with .NET 7 native AOT. This is the first GA version of native AOT Microsoft has released. It may not suit all workloads, since it does come with trade-offs. For example, dynamic assembly loading and the System.Reflection.Emit library are not available. Native AOT also trims your application code, resulting in a small binary that contains the essential components for your application to run.

Prerequisites

Getting Started

To get started, create a new Lambda function project using a custom runtime from the .NET CLI.

dotnet new lambda.NativeAOT -n LambdaNativeAot
cd ./LambdaNativeAot/src/LambdaNativeAot/
dotnet add package Amazon.Lambda.APIGatewayEvents
dotnet add package AWSSDK.Core

To review the project settings, open the LambdaNativeAot.csproj file. The target framework in this template is set to net7.0. To enable native AOT, add a new property named PublishAot, with value true. This PublishAot flag is an MSBuild property required by the .NET SDK so that the compiler performs native AOT compilation.

When using Lambda with a custom runtime, the Lambda service looks for an executable file named bootstrap within the packaged ZIP file. To enable this, the OutputType is set to exe and the AssemblyName to bootstrap.

The correctly configured LambdaNativeAot.csproj file looks like this:

<Project Sdk="Microsoft.NET.Sdk">
  <PropertyGroup>
    <OutputType>Exe</OutputType>
    <TargetFramework>net7.0</TargetFramework>
    <ImplicitUsings>enable</ImplicitUsings>
    <Nullable>enable</Nullable>
    <AWSProjectType>Lambda</AWSProjectType>
    <AssemblyName>bootstrap</AssemblyName>
    <PublishAot>true</PublishAot>
  </PropertyGroup> 
  …
</Project>

Function code

Running .NET with a custom runtime uses the executable assembly feature of .NET. To do this, your function code must define a static Main method. Within the Main method, you must initialize the Lambda runtime client, and configure the function handler and the JSON serializer to use when processing Lambda events.

The Amazon.Lambda.RuntimeSupport Nuget package is added to the project to enable this runtime initialization. The LambdaBootstrapBuilder.Create() method is used to configure the handler and the ILambdaSerializer implementation to use for (de)serialization.

private static async Task Main(string[] args)
{
    Func<string, ILambdaContext, string> handler = FunctionHandler;
    await LambdaBootstrapBuilder.Create(handler, new DefaultLambdaJsonSerializer())
        .Build()
        .RunAsync();
}

Assembly trimming

Native AOT trims application code to optimize the compiled binary, which can cause two issues. The first is with de/serialization. Common .NET libraries for working with JSON like Newtonsoft.Json and System.Text.Json rely on reflection. The second is with any third party libraries not yet updated to be trim-friendly. The compiler may trim out parts of the library that are required for the library to function. However, there are solutions for both issues.

Working with JSON

Source generated serialization is a language feature introduced in .NET 6. It allows the code required for de/serialization to be generated at compile time instead of relying on reflection at runtime. One drawback of native AOT is that the ability to use System.Relefection.Emit library is lost. Source generated serialization enables developers to work with JSON while also using native AOT.

To use the source generator, you must define a new empty partial class that inherits from System.Text.Json.JsonSerializerContext. On the empty partial class, add the JsonSerializable attribute for any .NET type that your application must de/serialize.

In this example, the Lambda function needs to receive events from API Gateway. Create a new class in the project named HttpApiJsonSerializerContext and copy the code below:

[JsonSerializable(typeof(APIGatewayHttpApiV2ProxyRequest))]
[JsonSerializable(typeof(APIGatewayHttpApiV2ProxyResponse))]
public partial class HttpApiJsonSerializerContext : JsonSerializerContext
{
}

When the application is compiled, static classes, properties, and methods are generated to perform the de/serialization.

This custom serializer must now also be passed in to the Lambda runtime to ensure that event inputs and outputs are serialized and deserialized correctly. To do this, pass a new instance of the serializer context into the runtime when bootstrapped. Here is an example of a Lambda function using API Gateway as a source:

using System.Text.Json.Serialization;
using Amazon.Lambda.APIGatewayEvents;
using Amazon.Lambda.Core;
using Amazon.Lambda.RuntimeSupport;
using Amazon.Lambda.Serialization.SystemTextJson;
namespace LambdaNativeAot;
public class Function
{
    /// <summary>
    /// The main entry point for the custom runtime.
    /// </summary>
    private static async Task Main()
    {
        Func<APIGatewayHttpApiV2ProxyRequest, ILambdaContext, Task<APIGatewayHttpApiV2ProxyResponse>> handler = FunctionHandler;
        await LambdaBootstrapBuilder.Create(handler, new SourceGeneratorLambdaJsonSerializer<HttpApiJsonSerializerContext>())
            .Build()
            .RunAsync();
    }

    public static async Task<APIGatewayHttpApiV2ProxyResponse> FunctionHandler(APIGatewayHttpApiV2ProxyRequest apigProxyEvent, ILambdaContext context)
    {
        // API Handling logic here
        return new APIGatewayHttpApiV2ProxyResponse()
        {
            StatusCode = 200,
            Body = "OK"
        };
    }
}

Third party libraries

The .NET compiler provides the capability to control how applications are trimmed. For native AOT compilation, this enables us to exclude specific assemblies from trimming. For any libraries used in your applications that may not yet be trim-friendly this is a powerful way to still use native AOT. This is important for any of the Lambda event source NuGet packages like Amazon.Lambda.ApiGatewayEvents. Without controlling this, the C# objects for the Amazon API Gateway event sources are trimmed, leading to serialization errors at runtime.

Currently, the AWSSDK.Core library used by all the .NET AWS SDKs must also be excluded from trimming.

To control the assembly trimming, create a new file in the project root named rd.xml. Full details on the rd.xml format are found in the Microsoft documentation. Adding assemblies to the rd.xml file excludes them from trimming.

The following example contains an example of how to exclude the AWSSDK.Core, API Gateway event and function library from trimming:

<Directives xmlns="http://schemas.microsoft.com/netfx/2013/01/metadata">
	<Application>
		<Assembly Name="AWSSDK.Core" Dynamic="Required All"></Assembly>
		<Assembly Name="Amazon.Lambda.APIGatewayEvents" Dynamic="Required All"></Assembly>
		<Assembly Name="bootstrap" Dynamic="Required All"></Assembly>
	</Application>
</Directives>

Once added, the csproj file must be updated to reference the rd.xml file. Edit the csproj file for the Lambda project and add this ItemGroup:

<ItemGroup>
  <RdXmlFile Include="rd.xml" />
</ItemGroup>

When the function is compiled, assembly trimming skips the three libraries specified. If you are using .NET 7 native AOT with Lambda, we recommend excluding both the AWSSDK.Core library and the specific libraries for any event sources your Lambda function uses. If you are using the AWS X-Ray SDK for .NET to trace your serverless application, this must also be excluded.

Deploying .NET 7 native AOT applications

We’ll now explain how to build and deploy .NET 7 native AOT functions on Lambda, using each of the three deployment tools.

Using the dotnet CLI

Prerequisites

  • Docker (if compiling on a non-Amazon Linux 2 based machine)

Build and deploy

To package and deploy your Native AOT compiled Lambda function, run:

dotnet lambda deploy-function

When compiling and packaging your Lambda function code using the Lambda tools CLI, the tooling checks for the PublishAot flag in your project. If set to true, the tooling pulls an AL2-based Docker image and compiles your code inside. It mounts your local file system to the running container, allowing the compiled binary to be stored back to your local file system ready for deployment. As a default, the generated ZIP file is output to the bin/Release directory.

Once the deployment completes, you can execute the below command to invoke the created function, replacing the FUNCTION_NAME option with the name of the function chosen during deployment.

dotnet lambda invoke-function FUNCTION_NAME

Using the Visual Studio Extension

AWS is also announcing support for compiling and deploying native AOT-based Lambda functions from within Visual Studio using the AWS Toolkit for Visual Studio.

Prerequisites

Getting Started

As part of this release, templates are available in Visual Studio 2022 to get started using native AOT with AWS Lambda. From within Visual Studio, select File -> New Project. Search for Lambda .NET 7 native AOT to start a new project pre-configured for native AOT.

Create a new project

Build and deploy

Once the project is created, right-click the project in Visual Studio and choose Publish to AWS Lambda.

Solution Explorer

Complete the steps in the publish wizard and press upload. The log messages created by Docker appear in the publish window as it compiles your function code for native AOT.

Uploading function

You can now invoke the deployed function from within Visual Studio by setting the Example request dropdown to API Gateway AWS Proxy and pressing the Invoke button.

Invoke example

Using the AWS SAM CLI

Prerequisites

  • Docker (If compiling on a non-AL2 based machine)
  • AWS SAM v1.6.4 or later

Getting started

Support for compiling and deploying .NET 7 native AOT is built into the AWS SAM CLI. To get started, initialize a new AWS SAM project:

sam init

In the new project wizard, choose:

  1. What template source would you like to use? 1 – AWS Quick Start Template
  2. Choose an AWS Quick start application template. 1 – Hello World example
  3. Use the most popular runtime and package type? – N
  4. Which runtime would you like to use? aot.dotnet7 (provided.al2)
  5. Enable X-Ray Tracing? N
  6. Choose a project name

The cloned project includes the configuration to deploy to Lambda.

One new AWS SAM metadata property called ‘BuildMethod’ is required in the AWS SAM template:

HelloWorldFunction:
  Type: AWS::Serverless::Function
  Properties:
    Runtime: 'provided.al2' # // Use provided to deploy to AWS Lambda for .NET 7 native AOT
    Architectures:
      - x86_64
  Metadata:
    BuildMethod: 'dotnet7' # // But build with new build method for .NET 7 that calls into Amazon.Lambda.Tools 

Build and deploy

Build and deploy your serverless application, completing the guided deployment steps:

sam build
sam deploy –-guided

The AWS SAM CLI uses the Amazon.Lambda.Tools CLI to pull an AL2-based Docker image and compile your application code inside a container. You can use AWS SAM accelerate to speed up the update of serverless applications during development. It uses direct API calls instead of deploying changes through AWS CloudFormation, automating updates whenever you change your local code base. Learn more in the AWS SAM development documentation.

Conclusion

AWS now supports .NET 7 native AOT on Lambda. Read the Lambda Developer Guide for more getting started information. For more details on the performance improvements from using .NET 7 native AOT on Lambda, see the serverless-dotnet-demo repository on GitHub.

To provide feedback for .NET on AWS Lambda, contact the AWS .NET team on the .NET Lambda GitHub repository.

For more serverless learning resources, visit Serverless Land.

Reducing Your Organization’s Carbon Footprint with Amazon CodeGuru Profiler

Post Syndicated from Isha Dua original https://aws.amazon.com/blogs/devops/reducing-your-organizations-carbon-footprint-with-codeguru-profiler/

It is crucial to examine every functional area when firms reorient their operations toward sustainable practices. Making informed decisions is necessary to reduce the environmental effect of an IT stack when creating, deploying, and maintaining it. To build a sustainable business for our customers and for the world we all share, we have deployed data centers that provide the efficient, resilient service our customers expect while minimizing our environmental footprint—and theirs. While we work to improve the energy efficiency of our datacenters, we also work to help our customers improve their operations on the AWS cloud. This two-pronged approach is based on the concept of the shared responsibility between AWS and AWS’ customers. As shown in the diagram below, AWS focuses on optimizing the sustainability of the cloud, while customers are responsible for sustainability in the cloud, meaning that AWS customers must optimize the workloads they have on the AWS cloud.

Figure 1. Shared responsibility model for sustainability

Figure 1. Shared responsibility model for sustainability

Just by migrating to the cloud, AWS customers become significantly more sustainable in their technology operations. On average, AWS customers use 77% fewer servers, 84% less power, and a 28% cleaner power mix, ultimately reducing their carbon emissions by 88% compared to when they ran workloads in their own data centers. These improvements are attributable to the technological advancements and economies of scale that AWS datacenters bring. However, there are still significant opportunities for AWS customers to make their cloud operations more sustainable. To uncover this, we must first understand how emissions are categorized.

The Greenhouse Gas Protocol organizes carbon emissions into the following scopes, along with relevant emission examples within each scope for a cloud provider such as AWS:

  • Scope 1: All direct emissions from the activities of an organization or under its control. For example, fuel combustion by data center backup generators.
  • Scope 2: Indirect emissions from electricity purchased and used to power data centers and other facilities. For example, emissions from commercial power generation.
  • Scope 3: All other indirect emissions from activities of an organization from sources it doesn’t control. AWS examples include emissions related to data center construction, and the manufacture and transportation of IT hardware deployed in data centers.

From an AWS customer perspective, emissions from customer workloads running on AWS are accounted for as indirect emissions, and part of the customer’s Scope 3 emissions. Each workload deployed generates a fraction of the total AWS emissions from each of the previous scopes. The actual amount varies per workload and depends on several factors including the AWS services used, the energy consumed by those services, the carbon intensity of the electric grids serving the AWS data centers where they run, and the AWS procurement of renewable energy.

At a high level, AWS customers approach optimization initiatives at three levels:

  • Application (Architecture and Design): Using efficient software designs and architectures to minimize the average resources required per unit of work.
  • Resource (Provisioning and Utilization): Monitoring workload activity and modifying the capacity of individual resources to prevent idling due to over-provisioning or under-utilization.
  • Code (Code Optimization): Using code profilers and other tools to identify the areas of code that use up the most time or resources as targets for optimization.

In this blogpost, we will concentrate on code-level sustainability improvements and how they can be realized using Amazon CodeGuru Profiler.

How CodeGuru Profiler improves code sustainability

Amazon CodeGuru Profiler collects runtime performance data from your live applications and provides recommendations that can help you fine-tune your application performance. Using machine learning algorithms, CodeGuru Profiler can help you find your most CPU-intensive lines of code, which contribute the most to your scope 3 emissions. CodeGuru Profiler then suggests ways to improve the code to make it less CPU demanding. CodeGuru Profiler provides different visualizations of profiling data to help you identify what code is running on the CPU, see how much time is consumed, and suggest ways to reduce CPU utilization. Optimizing your code with CodeGuru profiler leads to the following:

  • Improvements in application performance
  • Reduction in cloud cost, and
  • Reduction in the carbon emissions attributable to your cloud workload.

When your code performs the same task with less CPU, your applications run faster, customer experience improves, and your cost reduces alongside your cloud emission. CodeGuru Profiler generates the recommendations that help you make your code faster by using an agent that continuously samples stack traces from your application. The stack traces indicate how much time the CPU spends on each function or method in your code—information that is then transformed into CPU and latency data that is used to detect anomalies. When anomalies are detected, CodeGuru Profiler generates recommendations that clearly outline you should do to remediate the situation. Although CodeGuru Profiler has several visualizations that help you visualize your code, in many cases, customers can implement these recommendations without reviewing the visualizations. Let’s demonstrate this with a simple example.

Demonstration: Using CodeGuru Profiler to optimize a Lambda function

In this demonstration, the inefficiencies in a AWS Lambda function will be identified by CodeGuru Profiler.

Building our Lambda Function (10mins)

To keep this demonstration quick and simple, let’s create a simple lambda function that display’s ‘Hello World’. Before writing the code for this function, let’s review two important concepts. First, when writing Python code that runs on AWS and calls AWS services, two critical steps are required:

The Python code lines (that will be part of our function) that execute these steps listed above are shown below:

import boto3 #this will import AWS SDK library for Python
VariableName = boto3.client('dynamodb’) #this will create the AWS SDK service client

Secondly, functionally, AWS Lambda functions comprise of two sections:

  • Initialization code
  • Handler code

The first time a function is invoked (i.e., a cold start), Lambda downloads the function code, creates the required runtime environment, runs the initialization code, and then runs the handler code. During subsequent invocations (warm starts), to keep execution time low, Lambda bypasses the initialization code and goes straight to the handler code. AWS Lambda is designed such that the SDK service client created during initialization persists into the handler code execution. For this reason, AWS SDK service clients should be created in the initialization code. If the code lines for creating the AWS SDK service client are placed in the handler code, the AWS SDK service client will be recreated every time the Lambda function is invoked, needlessly increasing the duration of the Lambda function during cold and warm starts. This inadvertently increases CPU demand (and cost), which in turn increases the carbon emissions attributable to the customer’s code. Below, you can see the green and brown versions of the same Lambda function.

Now that we understand the importance of structuring our Lambda function code for efficient execution, let’s create a Lambda function that recreates the SDK service client. We will then watch CodeGuru Profiler flag this issue and generate a recommendation.

  1. Open AWS Lambda from the AWS Console and click on Create function.
  2. Select Author from scratch, name the function ‘demo-function’, select Python 3.9 under runtime, select x86_64 under Architecture.
  3. Expand Permissions, then choose whether to create a new execution role or use an existing one.
  4. Expand Advanced settings, and then select Function URL.
  5. For Auth type, choose AWS_IAM or NONE.
  6. Select Configure cross-origin resource sharing (CORS). By selecting this option during function creation, your function URL allows requests from all origins by default. You can edit the CORS settings for your function URL after creating the function.
  7. Choose Create function.
  8. In the code editor tab of the code source window, copy and paste the code below:
#invocation code
import json
import boto3

#handler code
def lambda_handler(event, context):
  client = boto3.client('dynamodb') #create AWS SDK Service client’
  #simple codeblock for demonstration purposes  
  output = ‘Hello World’
  print(output)
  #handler function return

  return output

Ensure that the handler code is properly indented.

  1. Save the code, Deploy, and then Test.
  2. For the first execution of this Lambda function, a test event configuration dialog will appear. On the Configure test event dialog window, leave the selection as the default (Create new event), enter ‘demo-event’ as the Event name, and leave the hello-world template as the Event template.
  3. When you run the code by clicking on Test, the console should return ‘Hello World’.
  4. To simulate actual traffic, let’s run a curl script that will invoke the Lambda function every 0.2 seconds. On a bash terminal, run the following command:
while true; do curl {Lambda Function URL]; sleep 0.06; done

If you do not have git bash installed, you can use AWS Cloud 9 which supports curl commands.

Enabling CodeGuru Profiler for our Lambda function

We will now set up CodeGuru Profiler to monitor our Lambda function. For Lambda functions running on Java 8 (Amazon Corretto), Java 11, and Python 3.8 or 3.9 runtimes, CodeGuru Profiler can be enabled through a single click in the configuration tab in the AWS Lambda console.  Other runtimes can be enabled following a series of steps that can be found in the CodeGuru Profiler documentation for Java and the Python.

Our demo code is written in Python 3.9, so we will enable Profiler from the configuration tab in the AWS Lambda console.

  1. On the AWS Lambda console, select the demo-function that we created.
  2. Navigate to Configuration > Monitoring and operations tools, and click Edit on the right side of the page.

  1.  Scroll down to Amazon CodeGuru Profiler and click the button next to Code profiling to turn it on. After enabling Code profiling, click Save.

Note: CodeGuru Profiler requires 5 minutes of Lambda runtime data to generate results. After your Lambda function provides this runtime data, which may need multiple runs if your lambda has a short runtime, it will display within the Profiling group page in the CodeGuru Profiler console. The profiling group will be given a default name (i.e., aws-lambda-<lambda-function-name>), and it will take approximately 15 minutes after CodeGuru Profiler receives the runtime data for this profiling group to appear. Be patient. Although our function duration is ~33ms, our curl script invokes the application once every 0.06 seconds. This should give profiler sufficient information to profile our function in a couple of hours. After 5 minutes, our profiling group should appear in the list of active profiling groups as shown below.

Depending on how frequently your Lambda function is invoked, it can take up to 15 minutes to aggregate profiles, after which you can see your first visualization in the CodeGuru Profiler console. The granularity of the first visualization depends on how active your function was during those first 5 minutes of profiling—an application that is idle most of the time doesn’t have many data points to plot in the default visualization. However, you can remedy this by looking at a wider time period of profiled data, for example, a day or even up to a week, if your application has very low CPU utilization. For our demo function, a recommendation should appear after about an hour. By this time, the profiling groups list should show that our profiling group now has one recommendation.

Profiler has now flagged the repeated creation of the SDK service client with every invocation.

From the information provided, we can see that our CPU is spending 5x more computing time than expected on the recreation of the SDK service client. The estimated cost impact of this inefficiency is also provided. In production environments, the cost impact of seemingly minor inefficiencies can scale very quickly to several kilograms of CO2 and hundreds of dollars as invocation frequency, and the number of Lambda functions increase.

CodeGuru Profiler integrates with Amazon DevOps Guru, a fully managed service that makes it easy for developers and operators to improve the performance and availability of their applications. Amazon DevOps Guru analyzes operational data and application metrics to identify behaviors that deviate from normal operating patterns. Once these operational anomalies are detected, DevOps Guru presents intelligent recommendations that address current and predicted future operational issues. By integrating with CodeGuru Profiler, customers can now view operational anomalies and code optimization recommendations on the DevOps Guru console. The integration, which is enabled by default, is only applicable to Lambda resources that are supported by CodeGuru Profiler and monitored by both DevOps Guru and CodeGuru.

We can now stop the curl loop (Control+C) so that the Lambda function stops running. Next, we delete the profiling group that was created when we enabled profiling in Lambda, and then delete the Lambda function or repurpose as needed.

Conclusion

Cloud sustainability is a shared responsibility between AWS and our customers. While we work to make our datacenter more sustainable, customers also have to work to make their code, resources, and applications more sustainable, and CodeGuru Profiler can help you improve code sustainability, as demonstrated above. To start Profiling your code today, visit the CodeGuru Profiler documentation page. To start monitoring your applications, head over to the Amazon DevOps Guru documentation page.

About the authors:

Isha Dua

Isha Dua is a Senior Solutions Architect based in San Francisco Bay Area. She helps AWS Enterprise customers grow by understanding their goals and challenges, and guiding them on how they can architect their applications in a cloud native manner while making sure they are resilient and scalable. She’s passionate about machine learning technologies and Environmental Sustainability.

Christian Tomeldan

Christian Tomeldan is a DevOps Engineer turned Solutions Architect. Operating out of San Francisco, he is passionate about technology and conveys that passion to customers ensuring they grow with the right support and best practices. He focuses his technical depth mostly around Containers, Security, and Environmental Sustainability.

Ifeanyi Okafor

Ifeanyi Okafor is a Product Manager with AWS. He enjoys building products that solve customer problems at scale.

Better together: AWS SAM CLI and HashiCorp Terraform

Post Syndicated from Eric Johnson original https://aws.amazon.com/blogs/compute/better-together-aws-sam-cli-and-hashicorp-terraform/

This post is written by Suresh Poopandi, Senior Solutions Architect and Seb Kasprzak, Senior Solutions Architect.

Today, AWS is announcing the public preview of AWS Serverless Application Model CLI (AWS SAM CLI) support for local development, testing, and debugging of serverless applications defined using HashiCorp Terraform configuration.

AWS SAM and Terraform are open-source frameworks for building applications using infrastructure as code (IaC). Both frameworks allow building, changing, and managing cloud infrastructure in a repeatable way by defining resource configurations.

Previously, you could use the AWS SAM CLI to build, test, and debug applications defined by AWS SAM templates or through the AWS Cloud Development Kit (CDK). With this preview release, you can also use AWS SAM CLI to test and debug serverless applications defined using Terraform configurations.

Walkthrough of Terraform support

This blog post contains a sample Terraform template, which shows how developers can use AWS SAM CLI to build locally, test, and debug AWS Lambda functions defined in Terraform. This sample application has a Lambda function that stores a book review score and review text in an Amazon DynamoDB table. An Amazon API Gateway book review API uses Lambda proxy integration to invoke the book review Lambda function.

Demo application architecture

Demo application architecture

Prerequisites

Before running this example:

  • Install the AWS CLI.
    • Configure with valid AWS credentials.
    • Note that AWS CLI now requires Python runtime.
  • Install HashiCorp Terraform.
  • Install the AWS SAM CLI.
  • Install Docker (required to run AWS Lambda function locally).

Since Terraform support is currently in public preview, you must provide a –beta-features flag while executing AWS SAM commands. Alternatively, set this flag in samconfig.toml file by adding beta_features=”true”.

Deploying the example application

This Lambda function interacts with DynamoDB. For the example to work, it requires an existing DynamoDB table in an AWS account. Deploying this creates all the required resources for local testing and debugging of the Lambda function.

To deploy:

  1. Clone the aws-sam-terraform-examples repository locally:
    git clone https://github.com/aws-samples/aws-sam-terraform-examples
  2. Change to the project directory:
    cd aws-sam-terraform-examples/zip_based_lambda_functions/api-lambda-dynamodb-example/

    Terraform must store the state of the infrastructure and configuration it creates. Terraform uses this state to map cloud resources to configuration and track changes. This example uses a local backend to store the state file on the local filesystem.

  3. Open the main.tf file and review its contents. Locate the backend section of the code, updating the region field with the target deployment Region of this sample solution:
    provider “aws” {
        region = “<AWS region>” # e.g. us-east-1
    }
  4. Initialize a working directory containing Terraform configuration files:
    terraform init
  5. Deploy the application using Terraform CLI. When prompted by “Do you want to perform these actions?”, enter Yes.
    terraform apply

Terraform deploys the application, as shown in the terminal output.

Terminal output

Terminal output

After completing the deployment process, the AWS account is ready for use by the Lambda function with all the required resources.

Terraform Configuration for local testing

Lambda functions require application dependencies bundled together with function code as a deployment package (typically a .zip file) to run correctly. Terraform natively does not create the deployment package and a separate build process handles this package creation.

This sample application uses Terraform’s null_resource and local-exec provisioner to trigger a build process script. This installs Python dependencies in a temporary folder and creates a .zip file with dependencies and function code. It contains this logic within the main.tf file of the example application.

To explain each code segment in more detail:

Terraform example

Terraform example

  1. aws_lambda_function: This sample defines a Lambda function resource. It contains properties such as environment variables (in this example, the DynamoDB table_id) and the depends_on argument, which creates the .zip package before deploying the Lambda function.

    Terraform example

    Terraform example

  2. null_resource: When the AWS SAM CLI build command runs, AWS SAM reviews Terraform code for any null_resource starting with sam_metadata_ and uses the information contained within this resource block to gather the location of the Lambda function source code and .zip package. This information allows the AWS SAM CLI to start the local execution of the Lambda function. This special resource should contain the following attributes:
    • resource_name: The Lambda function address as defined in the current module (aws_lambda_function.publish_book_review)
    • resource_type: Packaging type of the Lambda function (ZIP_LAMBDA_FUNCTION)
    • original_source_code: Location of Lambda function code
    • built_output_path: Location of .zip deployment package

Local testing

With the backend services now deployed, run local tests to see if everything is working. The locally running sample Lambda function interacts with the services deployed in the AWS account. Run the sam build to reflect the local sam testing environment with changes after each code update.

  1. Local Build: To create a local build of the Lambda function for testing, use the sam build command:
    sam build --hook-name terraform --beta-features
  2. Local invoke: The first test is to invoke the Lambda function with a mocked event payload from the API Gateway. These events are in the events directory. Run this command, passing in a mocked event:
    AWS_DEFAULT_REGION=<Your Region Name>
    sam local invoke aws_lambda_function.publish_book_review -e events/new-review.json --beta-features

    AWS SAM mounts the Lambda function runtime and code and runs it locally. The function makes a request to the DynamoDB table in the cloud to store the information provided via the API. It returns a 200 response code, signaling the successful completion of the function.

  3. Local invoke from AWS CLI
    Another test is to run a local emulation of the Lambda service using “sam local start-lambda” and invoke the function directly using AWS SDK or the AWS CLI. Start the local emulator with the following command:

    sam local start-lambda
    Terminal output

    Terminal output

    AWS SAM starts the emulator and exposes a local endpoint for the AWS CLI or a software development kit (SDK) to call. With the start-lambda command still running, run the following command to invoke this function locally with the AWS CLI:

    aws lambda invoke --function-name aws_lambda_function.publish_book_review --endpoint-url http://127.0.0.1:3001/ response.json --cli-binary-format raw-in-base64-out --payload file://events/new-review.json

    The AWS CLI invokes the local function and returns a status report of the service to the screen. The response from the function itself is in the response.json file. The window shows the following messages:

    Invocation results

    Invocation results

  4. Debugging the Lambda function

Developers can use AWS SAM with a variety of AWS toolkits and debuggers to test and debug serverless applications locally. For example, developers can perform local step-through debugging of Lambda functions by setting breakpoints, inspecting variables, and running function code one line at a time.

The AWS Toolkit Integrated Development Environment (IDE) plugin provides the ability to perform many common debugging tasks, like setting breakpoints, inspecting variables, and running function code one line at a time. AWS Toolkits make it easier to develop, debug, and deploy serverless applications defined using AWS SAM. They provide an experience for building, testing, debugging, deploying, and invoking Lambda functions integrated into IDE. Refer to this link that lists common IDE/runtime combinations that support step-through debugging of AWS SAM applications.

Visual Studio Code keeps debugging configuration information in a launch.json file in a workspace .vscode folder. Here is a sample launch configuration file to debug Lambda code locally using AWS SAM and Visual Studio Code.

{
    "version": "0.2.0",
    "configurations": [
          {
            "name": "Attach to SAM CLI",
            "type": "python",
            "request": "attach",
            "address": "localhost",
            "port": 9999,
            "localRoot": "${workspaceRoot}/sam-terraform/book-reviews",
            "remoteRoot": "/var/task",
            "protocol": "inspector",
            "stopOnEntry": false
          }
    ]
}

After adding the launch configuration, start a debug session in the Visual Studio Code.

Step 1: Uncomment the following two lines in zip_based_lambda_functions/api-lambda-dynamodb-example/src/index.py

Enable debugging in the Lambda function

Enable debugging in the Lambda function

Step 2: Run the Lambda function in the debug mode and wait for the Visual Studio Code to attach to this debugging session:

sam local invoke aws_lambda_function.publish_book_review -e events/new-review.json -d 9999

Step 3: Select the Run and Debug icon in the Activity Bar on the side of VS Code. In the Run and Debug view, select “Attach to SAM CLI” and choose Run.

For this example, set a breakpoint at the first line of lambda_handler. This breakpoint allows viewing the input data coming into the Lambda function. Also, it helps in debugging code issues before deploying to the AWS Cloud.

Debugging in then IDE

Debugging in then IDE

Lambda Terraform module

A community-supported Terraform module for lambda (terraform-aws-lambda) has added support for SAM metadata null_resource. When using the latest version of this module, AWS SAM CLI will automatically support local invocation of the Lambda function, without additional resource blocks required.

Conclusion

This blog post shows how to use the AWS SAM CLI together with HashiCorp Terraform to develop and test serverless applications in a local environment. With AWS SAM CLI’s support for HashiCorp Terraform, developers can now use the AWS SAM CLI to test their serverless functions locally while choosing their preferred infrastructure as code tooling.

For more information about the features supported by AWS SAM, visit AWS SAM. For more information about the Metadata resource, visit HashiCorp Terraform.

Support for the Terraform configuration is currently in preview, and the team is asking for feedback and feature request submissions. The goal is for both communities to help improve the local development process using AWS SAM CLI. Submit your feedback by creating a GitHub issue here.

For more serverless learning resources, visit Serverless Land.

Introducing the AWS Lambda Telemetry API

Post Syndicated from Julian Wood original https://aws.amazon.com/blogs/compute/introducing-the-aws-lambda-telemetry-api/

This blog post is written by Anton Aleksandrov, Principal Solution Architect and Shridhar Pandey, Senior Product Manager

Today AWS is announcing the AWS Lambda Telemetry API. This provides an easier way to receive enhanced function telemetry directly from the Lambda service and send it to custom destinations. Developers and operators can now more easily monitor and observe their Lambda functions using Lambda extensions from their preferred observability tool providers.

Extensions can use the Lambda Logs API to collect logs generated by the Lambda service and code running in their Lambda function. While the Logs API provides extensions with access to logs, it does not provide a way to collect additional telemetry, such as traces and metrics, which the Lambda service generates during initialization and invocation of your Lambda function.

Previously, observability tools retrieved traces from AWS X-Ray using the AWS X-Ray API or built their own custom tracing libraries to generate traces during Lambda function invocation. Tools required customers to modify AWS Identity and Access Management (IAM) policies to grant access to the traces from X-Ray. This caused additional complexity for tools to collect traces and metrics from multiple sources and introduced latency in seeing Lambda function traces in observability tool dashboards.

The Lambda Telemetry API is a new API that enhances the existing Lambda Logs API functionality. With the new Telemetry API, observability tools can receive function and extension logs, and also events, traces, and metrics directly from within the Lambda service. You do not need to install additional tracing libraries. This reduces latency and simplifies access permissions, as the extension does not require additional access to X-Ray.

Today you can use Telemetry API-enabled extensions to send telemetry data to Coralogix, Datadog, Dynatrace, Lumigo, New Relic, Sedai, Site24x7, Serverless.com, Sumo Logic, Sysdig, Thundra, or your own custom destinations.

Overview

To receive logs, extensions subscribe using the new Lambda Telemetry API.

Lambda Telemetry API

Lambda Telemetry API

The Lambda service then streams the telemetry events directly to the extension. The events include platform events, trace spans, function and extension logs, and additional Lambda platform metrics. The extension can then process, filter, and route them to any preferred destination.

You can add an extension from the tooling provider of your choice to your Lambda function. You can deploy extensions, including ones that use the Telemetry API, as Lambda layers, with the AWS Management Console and AWS Command Line Interface (AWS CLI). You can also use infrastructure as code tools such as AWS CloudFormation, the AWS Serverless Application Model (AWS SAM), Serverless Framework, and Terraform.

Lambda Extensions from the AWS Partner Network (APN) available at launch

Today, you can use Lambda extensions that use Telemetry API from the following Lambda partners:

  • The Coralogix AWS Lambda Telemetry Exporter extension now offers improved monitoring and alerting for Lambda functions by further streamlining collection and correlation of logs, metrics, and traces.
  • The Datadog extension further simplifies how you visualize the impact of cold starts, and monitor and alert on latency, duration, and payload size of your Lambda functions by collecting logs, traces, and real-time metrics from your function in a simple and cost-effective way.
  • Dynatrace now provides a simplified observability configuration for AWS Lambda through a seamless integration. The new solution delivers low-latency telemetry, enables monitoring at scale, and helps reduce monitoring costs for your serverless workloads.
  • The Lumigo lambda-log-shipper extension simplifies aggregating and forwarding Lambda logs to third-party tools. It now also makes it easy for you to detect Lambda function timeouts.
  • The New Relic extension now provides a unified observability view for your Lambda functions with insights that help you better understand and optimize the performance of your functions.
  • Sedai now uses the Telemetry API to help you improve the performance and availability of your Lambda functions by gathering insights about your function and providing recommendations for manual and autonomous remediation in a cost-effective manner.
  • The Site24x7 extension now offers new metrics, which enable you to get deeper insights into the different phases of the Lambda function lifecycle, such as initialization and invocation.
  • Serverless.com now uses the Telemetry API to provide real-time performance details for your Lambda function through the Dev Mode feature of their new Serverless Console V.2 offering, which simplifies debugging in the AWS Cloud.
  • Sumo Logic now makes it easier, faster, and more cost-effective for you to get your mission-critical Lambda function telemetry sent directly to Sumo Logic so you could quickly analyze and remediate errors and exceptions.
  • The Sysdig Monitor extension generates and collects real-time metrics directly from the Lambda platform. The simplified instrumentation offers lower latency, reduced MTTR (mean time to resolution) for critical issues, and cost benefits while monitoring your serverless applications.
  • The Thundra extension enables you to export logs, metrics, and events for Lambda execution environment lifecycle events emitted by the Telemetry API to a destination of your choice such as an S3 bucket, a database, or a monitoring backend.

Seeing example Telemetry API extensions in action

This demo shows an example of using a telemetry extension to receive telemetry, batch, and send it to a desired destination.

To set up the example, visit the GitHub repo for the extension implemented in the language of your choice and follow the instructions in the README.md file.

To configure the batching behavior, which controls when the extension sends the data, set the Lambda environment variable DISPATCH_MIN_BATCH_SIZE. When the extension receives the batch threshold, it POSTs the telemetry events batch to the destination specified in the DISPATCH_POST_URI environment variable.

You can configure an example DISPATCH_POST_URL for the extension to deliver the telemetry data using https://webhook.site/.

Lambda environment variables

Lambda environment variables

Telemetry events for one invoke may be received and processed during the next invocation. Events for the last invoke may be processed during the SHUTDOWN event.

Test and invoke the function from the Lambda console, or AWS CLI. You can see that the webhook receives the telemetry data.

Webhook receiving telemetry data

Webhook receiving telemetry data

You can also view the function and extension logs in CloudWatch Logs. The example extension includes verbose logging to understand the extension lifecycle.

CloudWatch Logs showing extension verbose logging

Sample Telemetry API events

When the extension receives telemetry data, each event contains a JSON dictionary with additional information, such as related metrics or trace spans. The following example shows a function initialization event. You can see that the function initializes with on-demand concurrency. The runtime version is Node.js 14, the initialization is successful, and the initialization duration is 123 milliseconds.

{
  "time": "2022-08-02T12:01:23.521Z",
  "type": "platform.initStart",
  "record": {
    "initializationType": "on-demand",
    "phase":"init",
    "runtimeVersion": "nodejs-14.v3",
    "runtimeVersionArn": "arn"
  }
}

{
  "time": "2022-08-02T12:01:23.521Z",
  "type": "platform.initRuntimeDone",
  "record": {
    "initializationType": "on-demand",
    "status": "success"
  }
}

{
  "time": "2022-08-02T12:01:23.521Z",
  "type": "platform.initReport",
  "record": {
    "initializationType": "on-demand",
    "phase":"init",
    "metrics": {
      "durationMs": 123.0,
    }
  }
}

Function invocation events include the associated requestId and tracing information connecting this invocation with the X-Ray tracing context, and platform spans showing response latency and response duration as well as invocation metrics such as duration in milliseconds.

{
    "time": "2022-08-02T12:01:23.521Z",
    "type": "platform.start",
    "record": {
      "requestId": "e6b761a9-c52d-415d-b040-7ba94b9452f3",
      "version": "$LATEST",
      "tracing": {
        "spanId": "54565fb41ac79632",
        "type": "X-Amzn-Trace-Id",
        "value": "Root=1-62e900b2-710d76f009d6e7785905449a;Parent=0efbd19962d95b05;Sampled=1"
      }
    }
  }
  
  {
    "time": "2022-08-02T12:01:23.521Z",
    "type": "platform.runtimeDone",
    "record": {
      "requestId": "e6b761a9-c52d-415d-b040-7ba94b9452f3",
      "status": "success",
      "tracing": {
        "spanId": "54565fb41ac79632",
        "type": "X-Amzn-Trace-Id",
        "value": "Root=1-62e900b2-710d76f009d6e7785905449a;Parent=0efbd19962d95b05;Sampled=1"
      },
      "spans": [
        {
          "name": "responseLatency", 
          "start": "2022-08-02T12:01:23.521Z",
          "durationMs": 23.02
        },
        {
          "name": "responseDuration", 
          "start": "2022-08-02T12:01:23.521Z",
          "durationMs": 20
        }
      ],
      "metrics": {
        "durationMs": 200.0,
        "producedBytes": 15
      }
    }
  }
  
  {
    "time": "2022-08-02T12:01:23.521Z",
    "type": "platform.report",
    "record": {
      "requestId": "e6b761a9-c52d-415d-b040-7ba94b9452f3",
      "metrics": {
        "durationMs": 220.0,
        "billedDurationMs": 300,
        "memorySizeMB": 128,
        "maxMemoryUsedMB": 90,
        "initDurationMs": 200.0
      },
      "tracing": {
        "spanId": "54565fb41ac79632",
        "type": "X-Amzn-Trace-Id",
        "value": "Root=1-62e900b2-710d76f009d6e7785905449a;Parent=0efbd19962d95b05;Sampled=1"
      }
    }
  }

Building a Telemetry API extension

Lambda extensions run as independent processes in the execution environment and continue to run after the function invocation is fully processed. Because extensions run as separate processes, you can write them in a language different from the function code. We recommend implementing extensions using a compiled language as a self-contained binary. This makes the extension compatible with all the supported runtimes.

Extensions that use the Telemetry API have the following lifecycle.

Telemetry API lifecycle

Telemetry API lifecycle

  1. The extension registers itself using the Lambda Extension API and subscribes to receive INVOKE and SHUTDOWN events. With the Telemetry API, the registration response body contains additional information, such as function name, function version, and account ID.
  2. The extensions start a telemetry listener. This is a local HTTP or TCP endpoint. We recommend using HTTP rather than TCP.
  3. The extensions use the Telemetry API to subscribe to desired telemetry event streams.
  4. The Lambda service POSTs telemetry stream data to your telemetry listener. We recommend batching the telemetry data as it arrives to the listener. You can perform any custom processing on this data and send it on to an S3 bucket, other custom destination, or an external observability service.

See the Telemetry API documentation and sample extensions for additional details.

The Lambda Telemetry API supersedes the Lambda Logs API. While the Logs API remains fully functional, AWS recommends using the Telemetry API. New functionality is only available with the Extensions API. Extensions can only subscribe to either the Logs or Telemetry API. After subscribing to one of them, any attempt to subscribe to the other returns an error.

Mapping Telemetry API schema to OpenTelemetry spans

The Lambda Telemetry API schema is semantically compatible with OpenTelemetry (OTEL). You can use events received from the Telemetry API to build and report OTEL spans. Three Telemetry API lifecycle events represent a single function invocation: start, runtimeDone, and runtimeReport. You should represent this as a single OTEL span. You can add additional details to your spans using information available in runtimeDone events under the event.spans property.

Mapping of Telemetry API events to OTEL spans is described in the Telemetry API documentation.

Metrics and pricing

The Telemetry API introduces new per-invoke metrics to help you understand the impact of extensions on your function’s performance. The metrics are available within the report.runtimeDone event.

  • platform.runtime measures the time taken by the Lambda Runtime to run your function handler code.
  • producedBytes measures the number of bytes returned during the invoke phase.

There are also two new trace spans available within the report.runtimeDone event:

  • responseLatencyMs measures the time taken by the Runtime to send a response.
  • responseDurationMs measures the time taken by the Runtime to finish sending the response from when it starts streaming it.

Extensions using Telemetry API, like other extensions, share the same billing model as Lambda functions. When using Lambda functions with extensions, you pay for requests served, and the combined compute time used to run your code and all extensions, in 1-ms increments. To learn more about the billing for extensions, visit the Lambda pricing page.

Useful links

Conclusion

The Lambda Telemetry API allows you to receive enhanced telemetry data more easily using your preferred monitoring and observability tools. The Telemetry API enhances the functionality of the Logs API to receive logs, metrics, and traces directly from the Lambda service. Developers and operators can send telemetry to destinations without custom libraries, with reduced latency, and simplified permissions.

To see how the Telemetry API works, try the demos in the GitHub repository.

Build your own extensions using the Telemetry API today, or use extensions provided by the Lambda observability partners.

For more serverless learning resources, visit Serverless Land.

Enrich VPC Flow Logs with resource tags and deliver data to Amazon S3 using Amazon Kinesis Data Firehose

Post Syndicated from Chaitanya Shah original https://aws.amazon.com/blogs/big-data/enrich-vpc-flow-logs-with-resource-tags-and-deliver-data-to-amazon-s3-using-amazon-kinesis-data-firehose/

VPC Flow Logs is an AWS feature that captures information about the network traffic flows going to and from network interfaces in Amazon Virtual Private Cloud (Amazon VPC). Visibility to the network traffic flows of your application can help you troubleshoot connectivity issues, architect your application and network for improved performance, and improve security of your application.

Each VPC flow log record contains the source and destination IP address fields for the traffic flows. The records also contain the Amazon Elastic Compute Cloud (Amazon EC2) instance ID that generated the traffic flow, which makes it easier to identify the EC2 instance and its associated VPC, subnet, and Availability Zone from where the traffic originated. However, when you have a large number of EC2 instances running in your environment, it may not be obvious where the traffic is coming from or going to simply based on the EC2 instance IDs or IP addresses contained in the VPC flow log records.

By enriching flow log records with additional metadata such as resource tags associated with the source and destination resources, you can more easily understand and analyze traffic patterns in your environment. For example, customers often tag their resources with resource names and project names. By enriching flow log records with resource tags, you can easily query and view flow log records based on an EC2 instance name, or identify all traffic for a certain project.

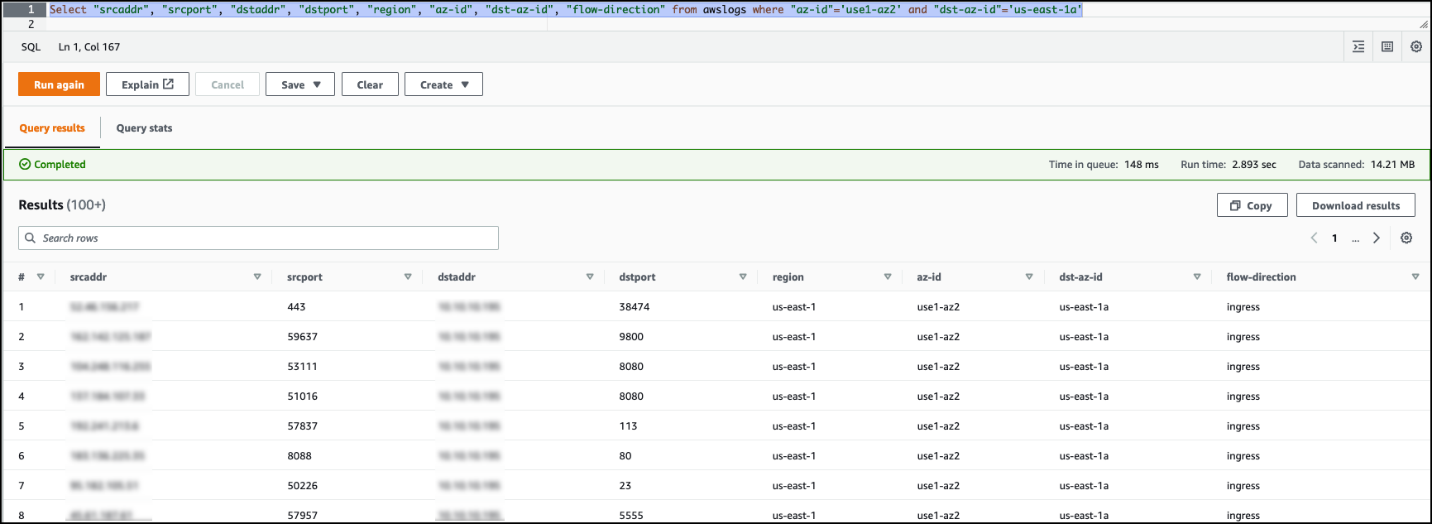
In addition, you can add resource context and metadata about the destination resource such as the destination EC2 instance ID and its associated VPC, subnet, and Availability Zone based on the destination IP in the flow logs. This way, you can easily query your flow logs to identify traffic crossing Availability Zones or VPCs.

In this post, you will learn how to enrich flow logs with tags associated with resources from VPC flow logs in a completely serverless model using Amazon Kinesis Data Firehose and the recently launched Amazon VPC IP Address Manager (IPAM), and also analyze and visualize the flow logs using Amazon Athena and Amazon QuickSight.

Solution overview

In this solution, you enable VPC flow logs and stream them to Kinesis Data Firehose. This solution enriches log records using an AWS Lambda function on Kinesis Data Firehose in a completely serverless manner. The Lambda function fetches resource tags for the instance ID. It also looks up the destination resource from the destination IP using the Amazon EC2 API and IPAM, and adds the associated VPC network context and metadata for the destination resource. It then stores the enriched log records in an Amazon Simple Storage Service (Amazon S3) bucket. After you have enriched your flow logs, you can query, view, and analyze them in a wide variety of services, such as AWS Glue, Athena, QuickSight, Amazon OpenSearch Service, as well as solutions from the AWS Partner Network such as Splunk and Datadog.

The following diagram illustrates the solution architecture.

Architecture

The workflow contains the following steps:

  1. Amazon VPC sends the VPC flow logs to the Kinesis Data Firehose delivery stream.
  2. The delivery stream uses a Lambda function to fetch resource tags for instance IDs from the flow log record and add it to the record. You can also fetch tags for the source and destination IP address and enrich the flow log record.
  3. When the Lambda function finishes processing all the records from the Kinesis Data Firehose buffer with enriched information like resource tags, Kinesis Data Firehose stores the result file in the destination S3 bucket. Any failed records that Kinesis Data Firehose couldn’t process are stored in the destination S3 bucket under the prefix you specify during delivery stream setup.
  4. All the logs for the delivery stream and Lambda function are stored in Amazon CloudWatch log groups.

Prerequisites

As a prerequisite, you need to create the target S3 bucket before creating the Kinesis Data Firehose delivery stream.

If using a Windows computer, you need PowerShell; if using a Mac, you need Terminal to run AWS Command Line Interface (AWS CLI) commands. To install the latest version of the AWS CLI, refer to Installing or updating the latest version of the AWS CLI.

Create a Lambda function

You can download the Lambda function code from the GitHub repo used in this solution. The example in this post assumes you are enabling all the available fields in the VPC flow logs. You can use it as is or customize per your needs. For example, if you intend to use the default fields when enabling the VPC flow logs, you need to modify the Lambda function with the respective fields. Creating this function creates an AWS Identity and Access Management (IAM) Lambda execution role.

To create your Lambda function, complete the following steps:

  1. On the Lambda console, choose Functions in the navigation pane.
  2. Choose Create function.
  3. Select Author from scratch.
  4. For Function name, enter a name.
  5. For Runtime, choose Python 3.8.
  6. For Architecture, select x86_64.
  7. For Execution role, select Create a new role with basic Lambda permissions.
  8. Choose Create function.

Create Lambda Function

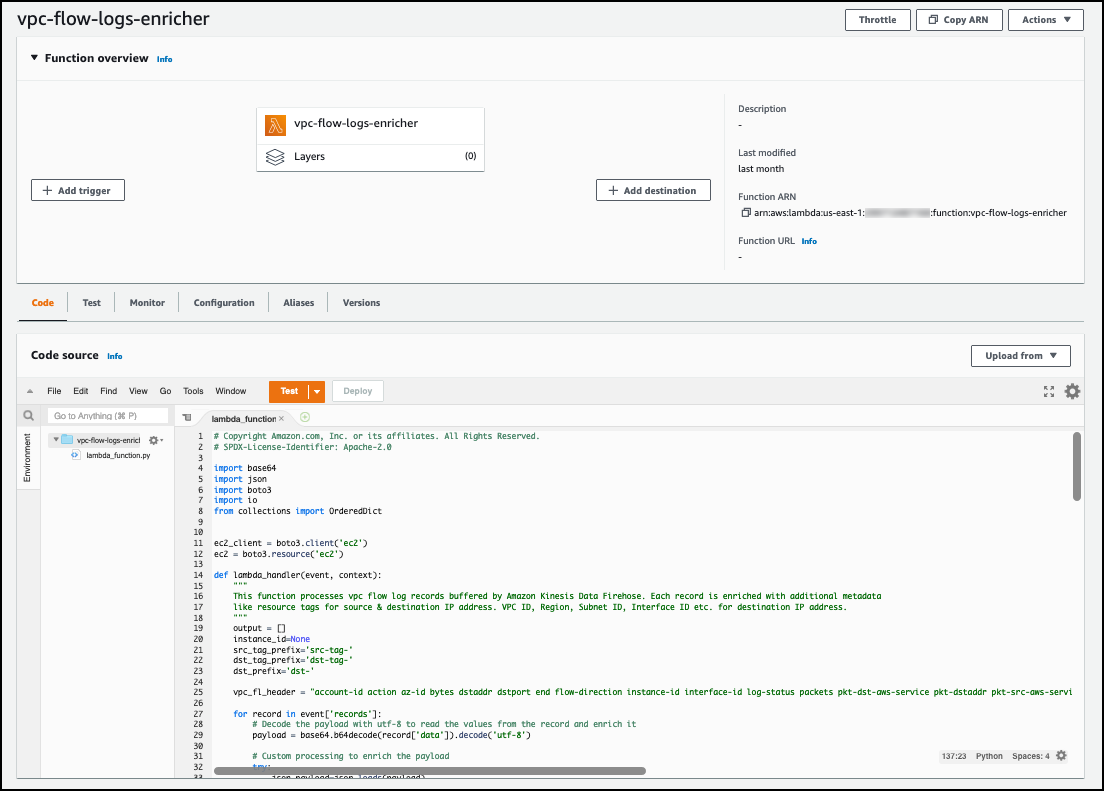
You can then see code source page, as shown in the following screenshot, with the default code in the lambda_function.py file.

  1. Delete the default code and enter the code from the GitHub Lambda function aws-vpc-flowlogs-enricher.py.
  2. Choose Deploy.

VPC Flow Logs Enricher function

To enrich the flow logs with additional tag information, you need to create an additional IAM policy to give Lambda permission to describe tags on resources from the VPC flow logs.

  1. On the IAM console, choose Policies in the navigation pane.
  2. Choose Create policy.
  3. On the JSON tab, enter the JSON code as shown in the following screenshot.

This policy gives the Lambda function permission to retrieve tags for the source and destination IP and retrieve the VPC ID, subnet ID, and other relevant metadata for the destination IP from your VPC flow log record.

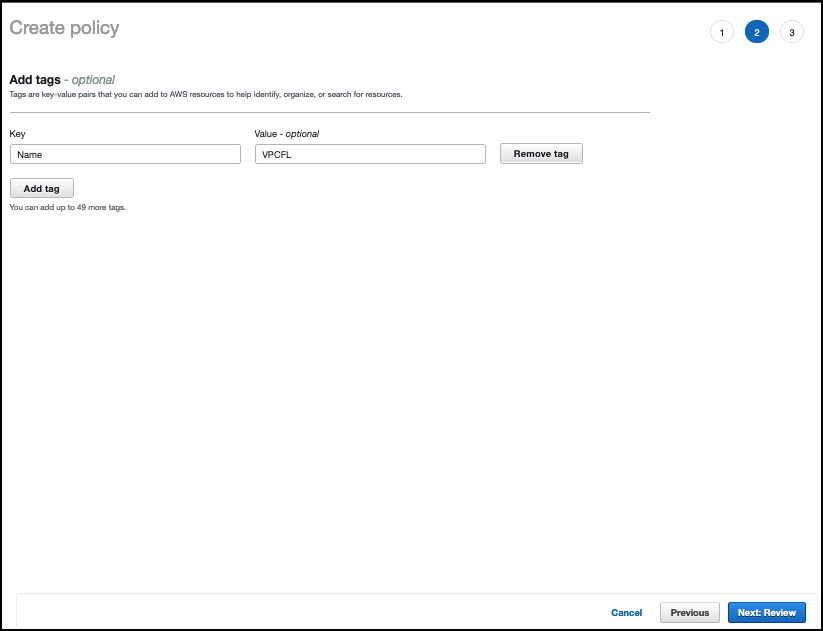
  1. Choose Next: Tags.

Tags

  1. Add any tags and choose Next: Review.

  1. For Name, enter vpcfl-describe-tag-policy.
  2. For Description, enter a description.
  3. Choose Create policy.

Create IAM Policy

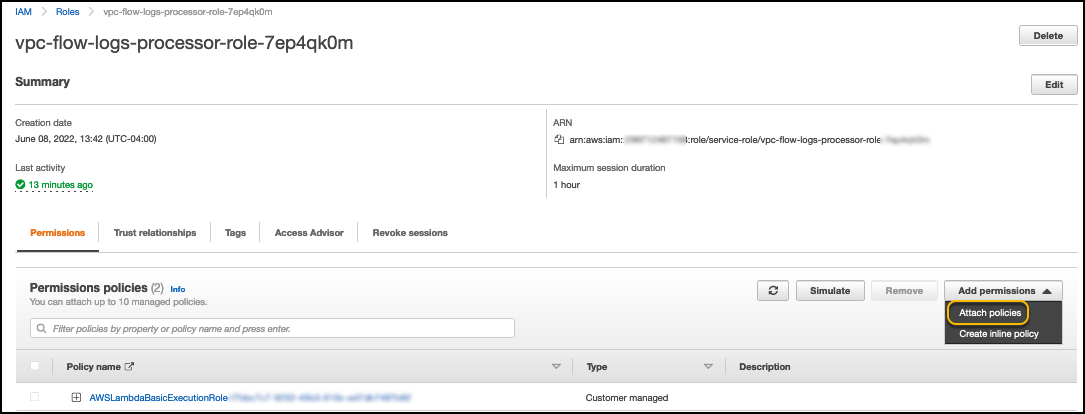
  1. Navigate to the previously created Lambda function and choose Permissions in the navigation pane.
  2. Choose the role that was created by Lambda function.

A page opens in a new tab.

  1. On the Add permissions menu, choose Attach policies.

Add Permissions

  1. Search for the vpcfl-describe-tag-policy you just created.
  2. Select the vpcfl-describe-tag-policy and choose Attach policies.

Create the Kinesis Data Firehose delivery stream

To create your delivery stream, complete the following steps:

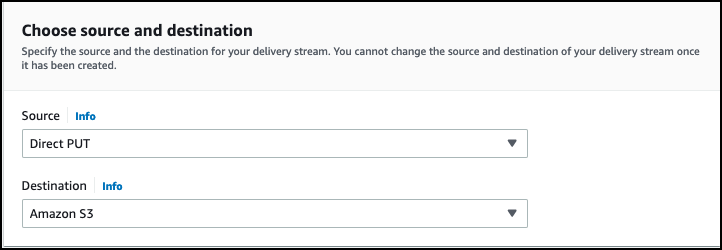
  1. On the Kinesis Data Firehose console, choose Create delivery stream.
  2. For Source, choose Direct PUT.
  3. For Destination, choose Amazon S3.

Kinesis Firehose Stream Source and Destination

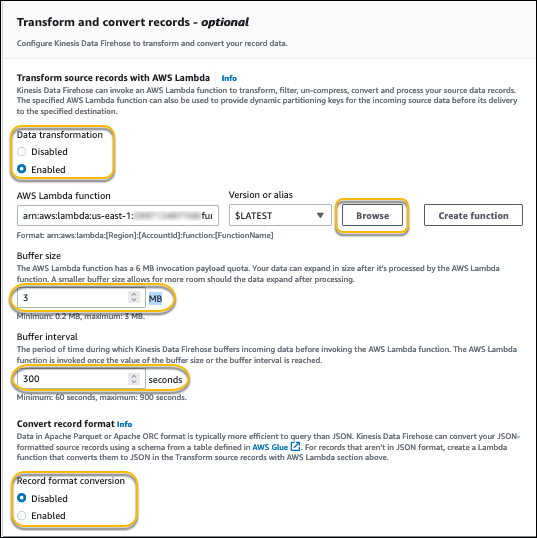
After you choose Amazon S3 for Destination, the Transform and convert records section appears.

  1. For Data transformation, select Enable.
  2. Browse and choose the Lambda function you created earlier.
  3. You can customize the buffer size as needed.

This impacts on how many records the delivery stream will buffer before it flushes it to Amazon S3.

  1. You can also customize the buffer interval as needed.

This impacts how long (in seconds) the delivery stream will buffer the incoming records from the VPC.

  1. Optionally, you can enable Record format conversion.

If you want to query from Athena, it’s recommended to convert it to Apache Parquet or ORC and compress the files with available compression algorithms, such as gzip and snappy. For more performance tips, refer to Top 10 Performance Tuning Tips for Amazon Athena. In this post, record format conversion is disabled.

Transform and Conver records

  1. For S3 bucket, choose Browse and choose the S3 bucket you created as a prerequisite to store the flow logs.
  2. Optionally, you can specify the S3 bucket prefix. The following expression creates a Hive-style partition for year, month, and day:

AWSLogs/year=!{timestamp:YYYY}/month=!{timestamp:MM}/day=!{timestamp:dd}/

  1. Optionally, you can enable dynamic partitioning.

Dynamic partitioning enables you to create targeted datasets by partitioning streaming S3 data based on partitioning keys. The right partitioning can help you to save costs related to the amount of data that is scanned by analytics services like Athena. For more information, see Kinesis Data Firehose now supports dynamic partitioning to Amazon S3.

Note that you can enable dynamic partitioning only when you create a new delivery stream. You can’t enable dynamic partitioning for an existing delivery stream.

Destination Settings

  1. Expand Buffer hints, compression and encryption.
  2. Set the buffer size to 128 and buffer interval to 900 for best performance.
  3. For Compression for data records, select GZIP.

S3 Buffer settings

Create a VPC flow log subscription

Now you create a VPC flow log subscription for the Kinesis Data Firehose delivery stream you created.

Navigate to AWS CloudShell or Terminal/PowerShell for a Mac or Windows computer and run the following AWS CLI command to enable the subscription. Provide your VPC ID for the parameter --resource-ids and delivery stream ARN for the parameter --log-destination.

aws ec2 create-flow-logs \ 
--resource-type VPC \ 
--resource-ids vpc-0000012345f123400d \ 
--traffic-type ALL \ 
--log-destination-type kinesis-data-firehose \ 
--log-destination arn:aws:firehose:us-east-1:123456789101:deliverystream/PUT-Kinesis-Demo-Stream \ 
--max-aggregation-interval 60 \ 
--log-format '${account-id} ${action} ${az-id} ${bytes} ${dstaddr} ${dstport} ${end} ${flow-direction} ${instance-id} ${interface-id} ${log-status} ${packets} ${pkt-dst-aws-service} ${pkt-dstaddr} ${pkt-src-aws-service} ${pkt-srcaddr} ${protocol} ${region} ${srcaddr} ${srcport} ${start} ${sublocation-id} ${sublocation-type} ${subnet-id} ${tcp-flags} ${traffic-path} ${type} ${version} ${vpc-id}'

If you’re running CloudShell for the first time, it will take a few seconds to prepare the environment to run.

After you successfully enable the subscription for your VPC flow logs, it takes a few minutes depending on the intervals mentioned in the setup to create the log record files in the destination S3 folder.

To view those files, navigate to the Amazon S3 console and choose the bucket storing the flow logs. You should see the compressed interval logs, as shown in the following screenshot.

S3 destination bucket

You can download any file from the destination S3 bucket on your computer. Then extract the gzip file and view it in your favorite text editor.

The following is a sample enriched flow log record, with the new fields in bold providing added context and metadata of the source and destination IP addresses:

{'account-id': '123456789101',
 'action': 'ACCEPT',
 'az-id': 'use1-az2',
 'bytes': '7251',
 'dstaddr': '10.10.10.10',
 'dstport': '52942',
 'end': '1661285182',
 'flow-direction': 'ingress',
 'instance-id': 'i-123456789',
 'interface-id': 'eni-0123a456b789d',
 'log-status': 'OK',
 'packets': '25',
 'pkt-dst-aws-service': '-',
 'pkt-dstaddr': '10.10.10.11',
 'pkt-src-aws-service': 'AMAZON',
 'pkt-srcaddr': '52.52.52.152',
 'protocol': '6',
 'region': 'us-east-1',
 'srcaddr': '52.52.52.152',
 'srcport': '443',
 'start': '1661285124',
 'sublocation-id': '-',
 'sublocation-type': '-',
 'subnet-id': 'subnet-01eb23eb4fe5c6bd7',
 'tcp-flags': '19',
 'traffic-path': '-',
 'type': 'IPv4',
 'version': '5',
 'vpc-id': 'vpc-0123a456b789d',
 'src-tag-Name': 'test-traffic-ec2-1', 'src-tag-project': ‘Log Analytics’, 'src-tag-team': 'Engineering', 'dst-tag-Name': 'test-traffic-ec2-1', 'dst-tag-project': ‘Log Analytics’, 'dst-tag-team': 'Engineering', 'dst-vpc-id': 'vpc-0bf974690f763100d', 'dst-az-id': 'us-east-1a', 'dst-subnet-id': 'subnet-01eb23eb4fe5c6bd7', 'dst-interface-id': 'eni-01eb23eb4fe5c6bd7', 'dst-instance-id': 'i-06be6f86af0353293'}

Create an Athena database and AWS Glue crawler

Now that you have enriched the VPC flow logs and stored them in Amazon S3, the next step is to create the Athena database and table to query the data. You first create an AWS Glue crawler to infer the schema from the log files in Amazon S3.

  1. On the AWS Glue console, choose Crawlers in the navigation pane.
  2. Choose Create crawler.

Glue Crawler

  1. For Name¸ enter a name for the crawler.
  2. For Description, enter an optional description.
  3. Choose Next.

Glue Crawler properties

  1. Choose Add a data source.
  2. For Data source¸ choose S3.
  3. For S3 path, provide the path of the flow logs bucket.
  4. Select Crawl all sub-folders.
  5. Choose Add an S3 data source.

Add Data source

  1. Choose Next.

Data source classifiers

  1. Choose Create new IAM role.
  2. Enter a role name.
  3. Choose Next.

Configure security settings

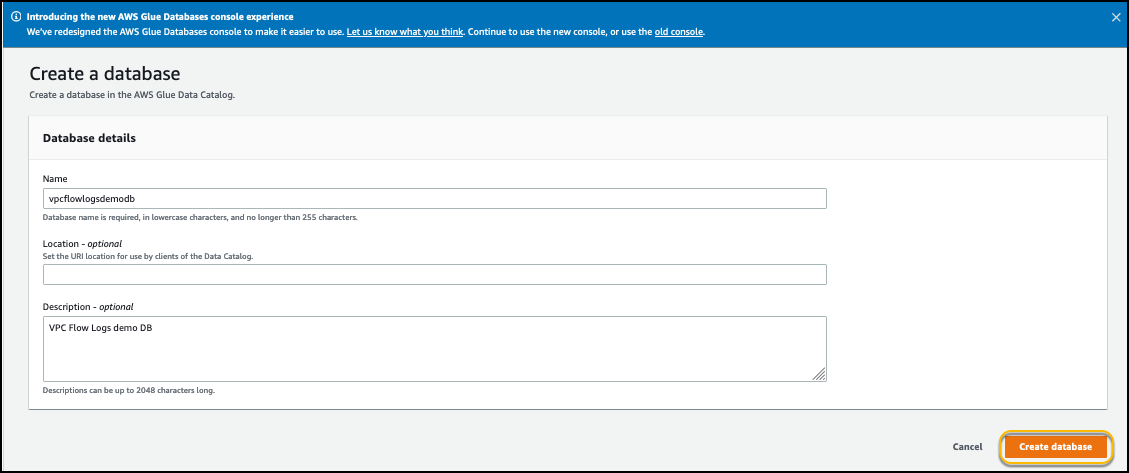
  1. Choose Add database.
  2. For Name, enter a database name.
  3. For Description, enter an optional description.
  4. Choose Create database.

Create Database

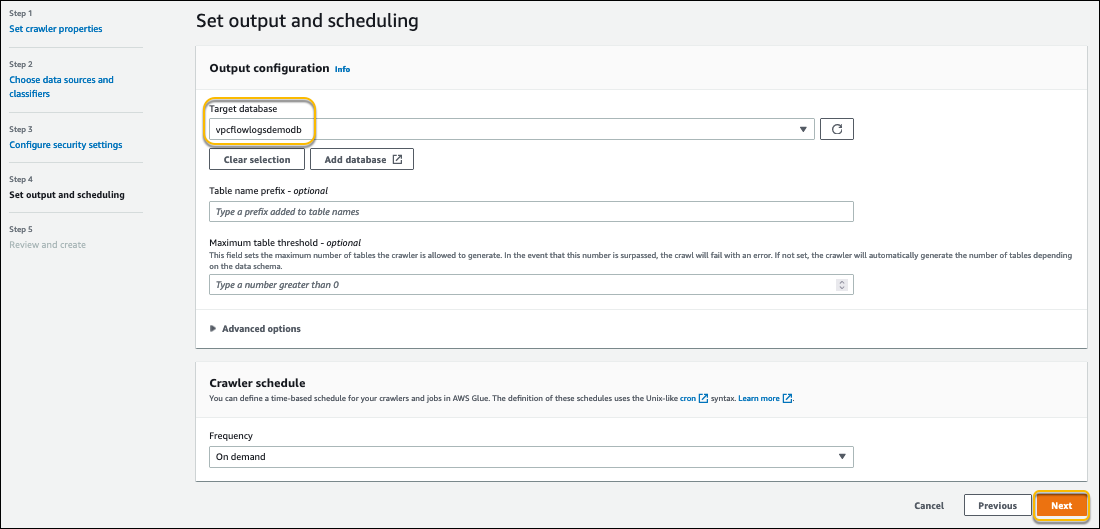
  1. On the previous tab for the AWS Glue crawler setup, for Target database, choose the newly created database.
  2. Choose Next.

Set output and scheduling

  1. Review the configuration and choose Create crawler.

Create crawler

  1. On the Crawlers page, select the crawler you created and choose Run.

Run crawler

You can rerun this crawler when new tags are added to your AWS resources, so that they’re available for you to query from the Athena database.

Run Athena queries

Now you’re ready to query the enriched VPC flow logs from Athena.

  1. On the Athena console, open the query editor.
  2. For Database, choose the database you created.
  3. Enter the query as shown in the following screenshot and choose Run.

Athena query

The following code shows some of the sample queries you can run:

Select * from awslogs where "dst-az-id"='us-east-1a'
Select * from awslogs where "src-tag-project"='Log Analytics' or "dst-tag-team"='Engineering' 
Select "srcaddr", "srcport", "dstaddr", "dstport", "region", "az-id", "dst-az-id", "flow-direction" from awslogs where "az-id"='use1-az2' and "dst-az-id"='us-east-1a'

The following screenshot shows an example query result of the source Availability Zone to the destination Availability Zone traffic.

Athena query result

You can also visualize various charts for the flow logs stored in the S3 bucket via QuickSight. For more information, refer to Analyzing VPC Flow Logs using Amazon Athena, and Amazon QuickSight.

Pricing

For pricing details, refer to Amazon Kinesis Data Firehose pricing.

Clean up

To clean up your resources, complete the following steps:

  1. Delete the Kinesis Data Firehose delivery stream and associated IAM role and policies.
  2. Delete the target S3 bucket.
  3. Delete the VPC flow log subscription.
  4. Delete the Lambda function and associated IAM role and policy.

Conclusion

This post provided a complete serverless solution architecture for enriching VPC flow log records with additional information like resource tags using a Kinesis Data Firehose delivery stream and Lambda function to process logs to enrich with metadata and store in a target S3 file. This solution can help you query, analyze, and visualize VPC flow logs with relevant application metadata because resource tags have been assigned to resources that are available in the logs. This meaningful information associated with each log record wherever the tags are available makes it easy to associate log information to your application.

We encourage you to follow the steps provided in this post to create a delivery stream, integrate with your VPC flow logs, and create a Lambda function to enrich the flow log records with additional metadata to more easily understand and analyze traffic patterns in your environment.


About the Authors

Chaitanya Shah is a Sr. Technical Account Manager with AWS, based out of New York. He has over 22 years of experience working with enterprise customers. He loves to code and actively contributes to AWS solutions labs to help customers solve complex problems. He provides guidance to AWS customers on best practices for their AWS Cloud migrations. He is also specialized in AWS data transfer and in the data and analytics domain.

Vaibhav Katkade is a Senior Product Manager in the Amazon VPC team. He is interested in areas of network security and cloud networking operations. Outside of work, he enjoys cooking and the outdoors.

Server-side rendering micro-frontends – the architecture

Post Syndicated from James Beswick original https://aws.amazon.com/blogs/compute/server-side-rendering-micro-frontends-the-architecture/

This post is written by Luca Mezzalira, Principal Specialist Solutions Architect, Serverless.

Microservices are a common pattern for building distributed systems. As frontend developers have modified their approaches to build architectures at scale, many are building micro-frontends.

This blog series explores how to implement micro-frontends using a server-side rendering (SSR) approach with AWS services. This first article covers the architecture characteristics and building blocks for designing a successful micro-frontends architecture in the AWS Cloud.

What are micro-frontends?

Micro-frontends are the technical representation of a business subdomain. They allow independent teams to work in parallel, reducing external dependencies and increasing delivery throughput. They embody several microservices characteristics such as governance decentralization, design for failure, and evolutionary design.

The main difference between micro-frontends and components is related to the domain ownership present inside a micro-frontend. With components, the domain knowledge is usually delegated to its container, which knows how to use the component’s property based on the context. Owning the domain inside a micro-frontend enables the independence that you expect in a distributed system. This doesn’t mean that micro-frontends cannot communicate or share resources, but the mindset is different compared with components.

If you are using microservices today, you may benefit from micro-frontends for scaling your frontend applications. Before micro-frontends, scaling was based primarily on developers’ expertise. Micro-frontends allow you to modernize frontend applications iteratively like you would with microservices. Every user downloads only the code needed for accomplishing a specific task, increasing the performance and users experience of a web application.

Architecture characteristics

This blog series builds a product details page of an example ecommerce website using micro-frontends with serverless infrastructure.

Page layout

The page is composed of:

  • A template that includes a header. This could include more common parts but uses one in this example.
  • A notifications micro-frontend that is client-side rendered. The notifications system must react to user interactions, so cannot be server-side rendered with the rest of the page.
  • A product details micro-frontend.
  • A reviews micro-frontend.

Every micro-frontend is independent and can be developed by different teams working on the same project. This can reduce external dependencies and potential bugs across the entire application.

The key system characteristics of this project are:

  1. Server-side rendering: The system must be designed with a server-side rendering approach. This provides fast rendering of the page inside modern browsers and reduces the need of client-side JavaScript for rendering the page.
  2. Framework agnostic: The solution must work with a broad variety of JavaScript libraries available and not be bound or optimized to a specific framework.
  3. Use optimizations best practices: Optimization is a key feature for server-side rendering applications. Many industries rely on these characteristics for increasing sales. This example encapsulates core web vitals metrics, progressive hydration, and different levels of caches to speed up the response times of the webpages.
  4. Team independence: Every micro-frontend must be developed with minimum external dependencies. Constant coordination across teams can be a sign of design-time coupling that invalidates the purpose behind a distributed system.
  5. Serverless infrastructure for frontend developers: The serverless paradigm helps developers focus on the business logic instead of infrastructure, using a “pay for value” model, which helps to reduce costs. You can cache micro-frontend responses and reduce the traffic on the origin and the need to scale every part of the system in the same way.

High-level architecture design

This is the high-level design to incorporate these architectural characteristics:

Architectural overview

  1. The application entry point is a content delivery network (CDN) that is used for caching, performance, and security reasons.
  2. The server-side rendering approach requires a place to store all the static files to hydrate the JavaScript code in the browser and for styling components.
  3. Pages requests require a UI composer that retrieves the micro-frontends and stitches them together to provide the page consumed by a browser. It streams the final HTML page to the browser to enhance the largest contentful paint (LCP) metric from the core web vitals.
  4. Decouple micro-frontends from the UI composer relies on two mechanisms: A micro-frontends discovery that acts like a service discovery in a microservice architecture, and an HTML template per page that describes where to inject the micro-frontends inside a page. The templates can live in the same repository where the other static files are present.
  5. The notification micro-frontend reacts to user interactions, providing a notification when a user adds a product in the cart.
  6. The product details micro-frontend has highly cacheable data that doesn’t require many changes over time.
  7. The reviews micro-frontend must retrieve user reviews of a specific product.

The key element for avoiding design-time coupling in this architecture is the micro-frontends discovery. The main advantages of this approach are to provide discoverability to simplify multi-environments strategies, and also to reduce the blast radius thanks to using blue/green deployments or canary releases. This topic will be covered in depth in an upcoming post.

From high-level design into implementation

The framework-agnostic approach helps to enable control over system evolution. It achieves this by using HTML-over-the-wire, where every micro-frontend renders an HTML fragment and returns it to the UI composer.

When the UI composer gathers the HTML fragments, it composes the final page to render using transclusion. Every page is represented by a specific template hosted in static files. The UI composer retrieves the template and then retrieves placeholder references in the template that can be replaced with the micro-frontend fragments.

This is the architecture used:

Architecture diagram

  1. Amazon CloudFront provides a unique entry point to the application. The distribution has two origins: the first for static files and the second for the UI composer.
  2. Static files are hosted in an Amazon S3 bucket. They are consumed by the browser and the UI composer for HTML templates.
  3. The UI composer runs on a containers cluster in AWS Fargate. Using a containerized solution allows you to use streaming capabilities and multithreading rendering if needed.
  4. AWS Systems Manager Parameter Store is used as a basic micro-frontends discovery system. This service is a key-value store used by the UI composer for retrieving the micro-frontends endpoints to consume.
  5. The notifications micro-frontend stores the optimized JavaScript bundle in the S3 bucket. This renders on the client since it must react to user interactions.
  6. The reviews micro-frontend is composed by an AWS Lambda function with the user reviews stored in Amazon DynamoDB. It’s rendered fully server-side and it outputs an HTML fragment.
  7. The product details micro-frontend is a low-code micro-frontend using AWS Step Functions. The Express Workflow can be invoked synchronously and contains the logic for rendering the HTML fragment and a caching layer. This increases performance due to the native integration with over 200 AWS services.

Using this approach, every team developing a micro-frontend is independent to build and evolve their business domain. The main touchpoints with other teams are related to the initial integrations and the communication mechanism between micro-frontends present in the same page. When these points are achieved, every team reduces external dependencies and can embrace the evolutionary nature of micro-frontends.

Conclusion

This first post starts the journey into micro-frontends, a distributed architecture for frontend applications. The next post will explore the UI composer and micro-frontends discovery implementations.

If you are interested in learning more about micro-frontends, see the micro-frontends decisions framework, a mental model created for the initial complexity of approaching micro-frontends design. When used as a north star, the decisions framework simplifies the development of micro-frontends applications.

In the AWS reference architectures section, you can find a complete diagram similar to the application described in this blog series with additional details.

For more serverless learning resources, visit Serverless Land.

Create a Multi-Region Python Package Publishing Pipeline with AWS CDK and CodePipeline

Post Syndicated from Brian Smitches original https://aws.amazon.com/blogs/devops/create-a-multi-region-python-package-publishing-pipeline-with-aws-cdk-and-codepipeline/

Customers can author and store internal software packages in AWS by leveraging the AWS CodeSuite (AWS CodePipeline, AWS CodeBuild, AWS CodeCommit, and AWS CodeArtifact).  As of the publish date of this blog post, there is no native way to replicate your CodeArtifact Packages across regions. This blog addresses how a custom solution built with the AWS Cloud Development Kit and AWS CodePipeline can create a Multi-Region Python Package Publishing Pipeline.

Whether it’s for resiliency or performance improvement, many customers want to deploy their applications across multiple regions. When applications are dependent on custom software packages, the software packages should be replicated to multiple regions as well. This post will walk through how to deploy a custom package publishing pipeline in your own AWS Account. This pipeline connects a Python package source code repository to build and publish pip packages to CodeArtifact Repositories spanning three regions (the primary and two replica regions). While this sample CDK Application is built specifically for pip packages, the underlying architecture can be reused for different software package formats, such as npm, Maven, NuGet, etc.

Solution overview

The following figure demonstrates the solution workflow:

  1. A CodePipeline pipeline orchestrates the building and publishing of the software package
    1. This pipeline is triggered by commits on the main branch of the CodeCommit repository
    2. A CodeBuild job builds the pip packages using twine to be distributed
    3. The publish stage (third column) uses three parallel CodeBuild jobs to publish the distribution package to the two CodeArtifact repositories in separate regions
  1. The first CodeArtifact Repository stores the package contents in the primary region.
  2. The second and third CodeArtifact Repository act as replicas and store the package contents in other regions.
Figure 1. A figure showing the architecture diagram

Figure 1.  Architecture diagram

All of these resources are defined in a single AWS CDK Application. The resources are defined in CDK Stacks that are deployed as AWS CloudFormation Stacks. AWS CDK can deploy the different stacks across separate regions.

Prerequisites

Before getting started, you will need the following:

  1. An AWS account
  2. An instance of the AWS Cloud9 IDE or an alternative local compute environment, such as your personal computer
  3. The following installed on your compute environment:
    1. AWS CDK
    2. AWS Command Line Interface (AWS CLI)
    3. npm
  1. The AWS Accounts must be bootstrapped for CDK in the necessary regions. The default configuration uses us-east-1, us-east-2 and us-west-2  as these three regions support CodeArtifact.

A new AWS Cloud9 IDE is recommended for this tutorial to isolate these actions in this post from your normal compute environment. See the Cloud9 Documentation for Creating an Environment.

Deploy the Python Package Publishing Pipeline into your AWS Account with the CDK

The source code can be found in this GitHub Repository.

  1. Fork the GitHub Repo into your account. This way you can experiment with changes as necessary to fit your workload.
  2. In your local compute environment, clone the GitHub Repository and cd into the project directory:
git clone [email protected]:<YOUR_GITHUB_USERNAME>/multi-region-
python-package-publishing-pipeline.git && cd multi-region-
python-package-publishing-pipeline
  1. Install the necessary node packages:
npm i
  1. (Optional) Override the default configurations for the CodeArtifact domainName, repositoryName, primaryRegion, and replicaRegions.
    1. navigate to ./bin/multiregion_package_publishing.ts and update the relevant fields.
    2. From the project’s root directory (multi-region-python-package-publishing-pipeline), deploy the AWS CDK application. This step may take 5-10 minutes.
cdk deploy --all
  1. When prompted “Do you wish to deploy these changes (y/n)?”, Enter y.

Viewing the deployed CloudFormation stacks

After the deployment of the AWS CDK application completes, you can view the deployed AWS CDK Stacks via CloudFormation. From the AWS Console, search “CloudFormation’ in the search bar and navigate to the service dashboard. In the primary region (us-east-1(N. Virginia)) you should see two stacks: CodeArtifactPrimaryStack-<region> and PackagePublishingPipelineStack.

Screenshot showing the CloudFormation Stacks in the primary region

Figure 2. Screenshot showing the CloudFormation Stacks in the primary region

Switch regions to one of the secondary regions us-west-2 (Oregon) or us-east-2 (Ohio) to see the remaining stacks named CodeArtifactReplicaStack-<region>. These correspond to the three AWS CDK Stacks from the architecture diagram.

Screenshot showing the CloudFormation stacks in a separate region

Figure 3. Screenshot showing the CloudFormation stacks in a separate region

Viewing the CodePipeline Package Publishing Pipeline

From the Console, select the primary region (us-east-1) and navigate to CodePipeline by utilizing the search bar. Select the Pipeline titled packagePipeline and inspect the state of the pipeline. This pipeline triggers after every commit from the CodeCommit repository named PackageSourceCode. If the pipeline is still in process, then wait a few minutes, as this pipeline can take approximately 7–8 minutes to complete all three stages (Source, Build, and Publish). Once it’s complete, the pipeline should reflect the following screenshot:

A screenshot showing the CodePipeline flow

Figure 4. A screenshot showing the CodePipeline flow

Viewing the Published Package in the CodeArtifact Repository

To view the published artifacts, go to the primary or secondary region and navigate to the CodeArtifact dashboard by utilizing the search bar in the Console. You’ll see a repository named package-artifact-repo. Select the repository and you’ll see the sample pip package named mypippackage inside the repository. This package is defined by the source code in the CodeCommit repository named PackageSourceCode in the primary region (us-east-1).

Screenshot of the package repository

Figure 5. Screenshot of the package repository

Create a new package version in CodeCommit and monitor the pipeline release

Navigate to your CodeCommit’s PackageSourceCode (us-east-1 CodeCommit > Repositories > PackageSourceCode. Open the setup.py file and select the Edit button. Make a simple modification, change the version = '1.0.0' to version = '1.1.0' and commit the changes to the Main branch.

A screenshot of the source package's code repository in CodeCommit

Figure 6. A screenshot of the source package’s code repository in CodeCommit

Now navigate back to CodePipeline and watch as the pipeline performs the release automatically. When the pipeline finishes, this new package version will live in each of the three CodeArtifact Repositories.

Install the custom pip package to your local Python Environment

For your development team to connect to this CodeArtifact Repository to download repositories, you must configure the pip tool to look in this repository. From your Cloud9 IDE (or local development environment), let’s test the installation of this package for Python3:

  1. Copy the connection instructions for the pip tool. Navigate to the CodeArtifact repository of your choice and select View connection instructions
    1. Select Copy to copy the snippet to your clipboard
Screenshot showing directions to connect to a code artifact repository

Figure 7. Screenshot showing directions to connect to a code artifact repository

  1. Paste the command from your clipboard
  2. Run pip install mypippackage==1.0.0
Screenshot showing CodeArtifact login

Figure 8. Screenshot showing CodeArtifact login

  1. Test the package works as expected by importing the modules
  2. Start the Python REPL by running python3 in the terminal
Screenshot of the package being imported

Figure 9. Screenshot of the package being imported

Clean up

Destroy all of the AWS CDK Stacks by running cdk destroy --all from the root AWS CDK application directory.

Conclusion

In this post, we walked through how to deploy a CodePipeline pipeline to automate the publishing of Python packages to multiple CodeArtifact repositories in separate regions. Leveraging the AWS CDK simplifies the maintenance and configuration of this multi-region solution by using Infrastructure as Code and predefined Constructs. If you would like to customize this solution to better fit your needs, please read more about the AWS CDK and AWS Developer Tools. Some links we suggest include the CodeArtifact User Guide (with sections covering npm, Python, Maven, and NuGet), the CDK API Reference, CDK Pipelines, and the CodePipeline User Guide.

About the authors:

Andrew Chen

Andrew Chen is a Solutions Architect with an interest in Data Analytics, Machine Learning, and DevOps. Andrew has previous experience in management consulting in which he worked as a technical architect for various cloud migration projects. In his free time, Andrew enjoys fishing, hiking, kayaking, and keeping up with financial markets.

Brian Smitches

Brian Smitches is a Solutions Architect with an interest in Infrastructure as Code and the AWS Cloud Development Kit. Brian currently supports Federal SMB Partners and has previous experience with Full Stack Application Development. In his personal time, Brian enjoys skiing, water sports, and traveling with friends and family.

How to control non-HTTP and non-HTTPS traffic to a DNS domain with AWS Network Firewall and AWS Lambda

Post Syndicated from Tyler Applebaum original https://aws.amazon.com/blogs/security/how-to-control-non-http-and-non-https-traffic-to-a-dns-domain-with-aws-network-firewall-and-aws-lambda/

Security and network administrators can control outbound access from a virtual private cloud (VPC) to specific destinations by using a service like AWS Network Firewall. You can use stateful rule groups to control outbound access to domains for HTTP and HTTPS by default in Network Firewall. In this post, we’ll walk you through how to accomplish this access control for non-HTTP and non-HTTPS traffic, such as SSH (Secure Shell). This solution is extensible to other protocols with static port assignments.

In the example scenario in this post, the network administrator needs to permit outbound SSH access on port 22/tcp to a third-party domain, example.org, from a group of Amazon Elastic Compute Cloud (Amazon EC2) instances that sits inside of a protected VPC that restricts outbound SSH traffic with Network Firewall. Non-HTTP traffic can’t currently be controlled with a domain rule in Network Firewall.

This solution allows administrators to control outbound access to a given domain in a granular way, by resolving the domain name inside of an AWS Lambda function, and updating a Network Firewall rule variable with the results of the DNS query. This solution further restricts specific non-HTTP and non-HTTPS traffic to those allowed domains to only what is explicitly specified by the administrator.

Solution overview

Figure 1 provides an overview of the solution and the resulting traffic flow.

Figure 1: Overview of the solution and the resulting traffic flow

Figure 1: Overview of the solution and the resulting traffic flow

The solution workflow is as follows:

  1. An Amazon EventBridge rule invokes the Lambda function every 10 minutes. You can modify this frequency to meet your needs. You should consider the time-to-live (TTL) record of the DNS record that you are configuring when choosing this interval.
  2. The Lambda function performs the DNS lookup for the provided domain, and updates a variable in an existing Network Firewall rule group. The rule group changes take a few seconds to fully apply to the nodes in your Network Firewall deployment.
  3. The newly created Network Firewall rule group is associated with the Network Firewall policy to control traffic.
  4. Traffic from the instances in your VPC flows through the Network Firewall endpoint, and if allowed, is routed through an internet gateway to the target server.

Prerequisites

This solution has the following prerequisites:

  1. An AWS account. If you don’t have an AWS account, create and activate one.
  2. An existing VPC with default routing to an internet gateway through a network firewall that has a firewall policy attached to it. The example rule included in the solution’s AWS CloudFormation template expects the firewall policy to use the default action order for stateful rule groups. If you don’t have an existing network firewall associated with your VPC, see the AWS Network Firewall Developer Guide to get started. For a walkthrough of the Network Firewall configuration and rules engine, see the blog post Hands-on walkthrough of the AWS Network Firewall flexible rules engine – Part 1.
  3. A DNS domain that you provide, which allows traffic for the protocol and port (or ports) that you plan to allow traffic to. This DNS domain needs to resolve to an IPv4 address or set of addresses; IPv6 is not supported, at this point.

Deploy the solution

We’ve provided a CloudFormation template to deploy this solution, which is located in the GitHub repository that accompanies this blog post.

To deploy the solution

  1. Download the CloudFormation template from our GitHub repository.
  2. Sign in to your AWS account and select the AWS Region where your Network Firewall is deployed.
  3. Navigate to the CloudFormation service.
  4. Choose Stacks > Create Stack > With new resources (standard).
  5. In the Specify template section, choose Upload a template file.
  6. Choose Choose file, navigate to where you saved the CloudFormation template, and upload it. Then choose Next.
  7. Specify a stack name for your CloudFormation stack.
  8. In the Parameters section, for the Domain parameter, specify the name of the domain to which you will control access. The default value is set to example.org; however, note that the actual example.org doesn’t allow SSH traffic.
  9. The remaining parameters have defaults to allow outbound SSH traffic to the specified domain. Adjust the LambdaJobFrequency variable so that it corresponds with the TTL of the DNS record that it will resolve. This allows the Lambda function to keep the IP address of the DNS record up to date, in the event that it changes. After you’ve configured the parameters, choose Next.
    Figure 2: CloudFormation stack parameters

    Figure 2: CloudFormation stack parameters

  10. On the Configure stack options page, specify any further options needed or keep the default options, and then choose Next.
  11. On the Review page, review the stack and parameters and select the check box to acknowledge that this template will create IAM resources. Choose Create Stack.
  12. Check the stack creation status. Upon successful completion, the status shows CREATE_COMPLETE.
    Figure 3: The successful creation of the CloudFormation stack

    Figure 3: The successful creation of the CloudFormation stack

Test the solution

Before you test the newly created rule, make sure that the Lambda function has been invoked at least once from the EventBridge rule.

To verify the Lambda function results

  1. In the AWS Management Console, navigate to the Lambda function Network-Firewall-Resolver-Function, and on the Monitor tab, choose View logs in CloudWatch.
    Figure 4: Navigating to view logs in CloudWatch

    Figure 4: Navigating to view logs in CloudWatch

  2. Select the most recent log stream.
  3. Verify that that a log line contains the entry StatefulRuleGroup updated successfully.
    Figure 5: Examining the CloudWatch logs to verify that the Lambda function ran successfully

    Figure 5: Examining the CloudWatch logs to verify that the Lambda function ran successfully

  4. Associate the stateful rule group that was created by the stack, Lambda-Managed-Stateful-Rule with the existing Network Firewall policy that is attached to your VPC. To do this:
    1. Navigate to VPC > Network Firewall > Firewall Policies and select your existing firewall policy.
    2. In the Stateful rule groups section, for Actions, choose Add unmanaged stateful rule groups.
  5. Select the check box for Lambda-Managed-Stateful-Rule, and then choose Add stateful rule group.
  6. When the newly provisioned Lambda function runs successfully, it will resolve the IPv4 address for the domain (example.org) and associate the address with the stateful rule variable IP_NET. To validate that this has happened, do the following:
    1. Navigate to VPC > Network Firewall > Network Firewall rule groups.
    2. Choose the Lambda-Managed-Stateful-Rule rule group.
    3. Navigate to the rule variable section, and choose IP_NET. If the Lambda function successfully resolved the provided domain name, the variable will contain the IPv4 addresses for the domain you provided, as shown in Figure 6.
      Figure 6: Validating the rule variable details

      Figure 6: Validating the rule variable details

  7. Test the rule by attempting to connect to the domain that you specified in the CloudFormation template. Use an EC2 instance within the VPC that the network firewall rule is associated with, and attempt to establish an SSH connection to the domain that you specified. As shown by the SSH key negotiation in Figure 7, traffic is allowed through the network firewall, as intended.
    Figure 7: SSH connectivity to the domain was successful

    Figure 7: SSH connectivity to the domain was successful

    You can also configure the rule to drop the SSH connection, rather than permit it. To do this:

    1. Navigate to VPC > Network Firewall > Network Firewall rule groups.
    2. Choose the Lambda-Managed-Stateful-Rule rule group. In the Rules section, choose Edit Rules.
    3. Modify the rule to take the Drop action, and save the rule group.

    As shown by the lack of response from the host in Figure 8, the SSH connection cannot be established anymore.

    Figure 8: An SSH connection cannot be established, due to the connection timing out

    Figure 8: An SSH connection cannot be established, due to the connection timing out

Cleanup

Follow the steps in this section to remove the resources created by this solution.

To remove the resources

  1. Sign in to your AWS account where you deployed the CloudFormation stack and navigate to the Network Firewall console.
  2. In the Stateful rule groups section, select the check box for Lambda-Managed-Stateful-Rule. For Actions, choose Disassociate from policy.
    Figure 9: Disassociating the stateful rule from the existing policy

    Figure 9: Disassociating the stateful rule from the existing policy

  3. Navigate to the CloudFormation console, select the stack that you created, and then choose Delete. Upon successful deletion, the resources created by the stack will be deleted.

Conclusion

In this post, we’ve demonstrated how security and network administrators have the ability to permit or restrict non-HTTP and non-HTTPS traffic to a given domain by using Network Firewall. With this solution, administrators can enforce granular port- and protocol-level control to third-party domains. To learn more about rule group configuration in AWS Network Firewall, see Managing your own rule groups in the Developer Guide.

 
If you have feedback about this post, submit comments in the Comments section below. If you have questions about this post, contact AWS Support. You can also start a new thread on AWS Network Firewall re:Post to get answers from the community.

Want more AWS Security news? Follow us on Twitter.

Tyler Applebaum

Tyler Applebaum

Tyler is a Sr. Solutions Architect in the Charlotte, NC area helping customers migrate to AWS and modernize their applications. He has previous experience as a network engineer working in healthcare and finance.

Bhavin Lakhani

Bhavin is a Technical Account Manager in the US West, Northern California, helping customers with their AWS Enterprise Support, Operational, and Architectural needs. He has cloud infrastructure and database platform leadership experience in his previous roles. He loves soccer and is an ardent “Arsenal” fan.

What to consider when modernizing APIs with GraphQL on AWS

Post Syndicated from Lewis Tang original https://aws.amazon.com/blogs/architecture/what-to-consider-when-modernizing-apis-with-graphql-on-aws/

In the next few years, companies will build over 500 million new applications, more than has been developed in the previous 40 years combined (see IDC article). API operations enable innovation. They are the “front door” to applications and microservices, and an integral layer in the application stack. In recent years, GraphQL has emerged as a modern API approach. With GraphQL, companies can improve the performance of their applications and the speed in which development teams can build applications. In this post, we will discuss how GraphQL works and how integrating it with AWS services can help you build modern applications. We will explore the options for running GraphQL on AWS.

How GraphQL works

Imagine you have an API frontend implemented with GraphQL for your ecommerce application. As shown in Figure 1, there are different services in your ecommerce system backend that are accessible via different technologies. For example, user profile data is stored in a highly scalable NoSQL table. Orders are accessed through a REST API. The current inventory stock is checked through an AWS Lambda function. And the pricing information is in an SQL database.

How GraphQL works

Figure 1. How GraphQL works

Without using GraphQL, client applications must make multiple separate calls to each one of these services. Because each service is exposed through different API endpoints, the complexity of accessing data from the client side increases significantly. In order to get the data, you have to make multiple calls. In some cases, you might over fetch data as the data source would send you an entire payload including data you might not need. In some other circumstances, you might under fetch data as a single data source would not have all your required data.

A GraphQL API combines the data from all these different services into a single payload that the client defines based on its needs. For example, a smartphone has a smaller screen than a desktop application. A smartphone application might require less data. The data is retrieved from multiple data sources automatically. The client just sees a single constructed payload. This payload might be receiving user profile data from Amazon DynamoDB, or order details from Amazon API Gateway. Or it could involve the injection of specific fields with inventory availability and price data from AWS Lambda and Amazon Aurora.

When modernizing frontend APIs with GraphQL, you can build applications faster because your frontend developers don’t need to wait for backend service teams to create new APIs for integration. GraphQL simplifies data access by interacting with data from multiple data sources using a single API. This reduces the number of API requests and network traffic, which results in improved application performance. Furthermore, GraphQL subscriptions enable two-way communication between the backend and client. It supports publishing updates to data in real time to subscribed clients. You can create engaging applications in real time with use cases such as updating sports scores, bidding statuses, and more.

Options for running GraphQL on AWS

There are two main options for running GraphQL implementation on AWS, fully managed on AWS using AWS AppSync, and self-managed GraphQL.

I. Fully managed using AWS AppSync

The most straightforward way to run GraphQL is by using AWS AppSync, a fully managed service. AWS AppSync handles the heavy lifting of securely connecting to data sources, such as Amazon DynamoDB, and to develop GraphQL APIs. You can write business logic against these data sources by choosing code templates that implement common GraphQL API patterns. Your APIs can also interact with other AWS AppSync functionality such as caching, to improve performance. Use subscriptions to support real-time updates, and client-side data stores to keep offline devices in sync. AWS AppSync will scale automatically to support varied API request loads. You can find more details from the AWS AppSync features page.

AWS AppSync in an ecommerce system implementation

Figure 2. AWS AppSync in an ecommerce system implementation

Let’s take a closer look at this GraphQL implementation with AWS AppSync in an ecommerce system. In Figure 2, a schema is created to define types and capabilities of the desired GraphQL API. You can tie the schema to a Resolver function. The schema can either be created to mirror existing data sources, or AWS AppSync can create tables automatically based the schema definition. You can also use GraphQL features for data discovery without viewing the backend data sources.

After a schema definition is established, an AWS AppSync client can be configured with an operation request, such as a query operation. The client submits the operation request to GraphQL Proxy along with an identity context and credentials. The GraphQL Proxy passes this request to the Resolver, which maps and initiates the request payload against pre-configured AWS data services. These can be an Amazon DynamoDB table for user profile, an AWS Lambda function for inventory service, and more. The Resolver initiates calls to one or all of these services within a single API call. This minimizes CPU cycles and network bandwidth needs. The Resolver then returns the response to the client. Additionally, the client application can change data requirements in code on demand. The AWS AppSync GraphQL API will dynamically map requests for data accordingly, enabling faster prototyping and development.

II. Self-Managed GraphQL

If you want the flexibility of selecting a particular open-source project, you may choose to run your own GraphQL API layer. Apollo, graphql-ruby, Juniper, gqlgen, and Lacinia are some popular GraphQL implementations. You can leverage AWS Lambda or container services such as Amazon Elastic Container Service (ECS) and Amazon Elastic Kubernetes Services (EKS) to run GraphQL open-source implementations. This gives you the ability to fine-tune the operational characteristics of your API.

When running a GraphQL API layer on AWS Lambda, you can take advantage of the serverless benefits of automatic scaling, paying only for what you use, and not having to manage your servers. You can create a private GraphQL API using Amazon ECS, EKS, or AWS Lambda, which can only be accessed from your Amazon Virtual Private Cloud (VPC). With Apollo GraphQL open-source implementation, you can create a Federated GraphQL that allows you to combine GraphQL APIs from multiple microservices into a single API, illustrated in Figure 3. The Apollo GraphQL Federation with AWS AppSync post shows a concrete example of how to integrate an AWS AppSync API with an Apollo Federation gateway. It uses specification-compliant queries and directives.

Apollo GraphQL implementation on AWS Lambda

Figure 3. Apollo GraphQL implementation on AWS Lambda

When choosing self-managed GraphQL implementation, you have to spend time writing non-business logic code to connect data sources. You must implement authorization, authentication, and integrate other common functionalities. This can be caches to improve performance, subscriptions to support real-time updates, and client-side data stores to keep offline devices in sync. Because of these responsibilities, you have less time to focus on the business logic of application.

Similarly, backend development teams and API operators of an open-source GraphQL implementation must provision and maintain their own GraphQL servers. Remember that even with a serverless model, API developers and operators are still responsible for monitoring, performance tuning, and troubleshooting the API platform service.

Conclusion

Modernizing APIs with GraphQL gives your frontend application the ability to fetch just the data that’s needed from multiple data sources with an API call. You can build modern mobile and web applications faster, because GraphQL simplifies API management. You have flexibility to run an open-source GraphQL implementation most closely aligned with your needs on AWS Lambda, Amazon ECS, and Amazon EKS. With AWS AppSync, you can set up GraphQL quickly and increase your development velocity by reducing the amount of non-business API logic code.

Further reading:

How to Automatically Prevent Email Throttling when Reaching Concurrency Limit

Post Syndicated from Mark Richman original https://aws.amazon.com/blogs/messaging-and-targeting/prevent-email-throttling-concurrency-limit/

Introduction

Many users of Amazon Simple Email Service (Amazon SES) send large email campaigns that target tens of thousands of recipients. Regulating the flow of Amazon SES requests can prevent throttling due to exceeding the AWS service limit on the account.

Amazon SES service quotas include a soft limit on the number of emails sent per second (also known as the “sending rate”). This quota is intended to protect users from accidentally sending unintended volumes of email, or from spending more money than intended. Most Amazon SES customers have this quota increased, but very large campaigns may still exceed that limit. As a result, Amazon SES will throttle email requests. When this happens, your messages will fail to reach their destination.

This blog provides users of Amazon SES a mechanism for regulating the flow of messages that are sent to Amazon SES. Cloud Architects, Engineers, and DevOps Engineers designing new, or improving an existing Amazon SES solution would benefit from reading this post.

Overview

A common solution for regulating the flow of API requests to Amazon SES is achieved using Amazon Simple Queue Service (Amazon SQS). Amazon SQS can send, store, and receive messages at virtually any volume and can serve as part of a solution to buffer and throttle the rate of API calls. It achieves this without the need for other services to be available to process the messages. In this solution, Amazon SQS prevents messages from being lost while waiting for them to be sent as emails.

Fig 1 — High level architecture diagram

But this common solution introduces a new challenge. The mechanism used by the Amazon SQS event source mapping for AWS Lambda invokes a function as soon as messages are visible. Our challenge is to regulate the flow of messages, rather than invoke Amazon SES as messages arrive to the queue.

Fig 2 — Leaky bucket

Developers typically limit the flow of messages in a distributed system by implementing the “leaky bucket” algorithm. This algorithm is an analogy to a bucket which has a hole in the bottom from which water leaks out at a constant rate. Water can be added to the bucket intermittently. If too much water is added at once or at too high a rate, the bucket overflows.

In this solution, we prevent this overflow by using throttling. Throttling can be handled in two ways: either before messages reach Amazon SQS, or after messages are removed from the queue (“dequeued”). Both of these methods pose challenges in handling the throttled messages and reprocessing them. These challenges introduce complexity and lead to the excessive use of resources that may cause a snowball effect and make the throttling worse.

Developers often use the following techniques to help improve the successful processing of feeds and submissions:

  • Submit requests at times other than on the hour or on the half hour. For example, submit requests at 11 minutes after the hour or at 41 minutes after the hour. This can have the effect of limiting competition for system resources with other periodic services.
  • Take advantage of times during the day when traffic is likely to be low, such as early evening or early morning hours.

However, these techniques assume that you have control over the rate of requests, which is usually not the case.

Amazon SQS, acting as a highly scalable buffer, allows you to disregard the incoming message rate and store messages at virtually any volume. Therefore, there is no need to throttle messages before adding them to the queue. As long as you eventually process messages faster than you receive new ones, you will be fine with the inflow that will get processed later on.

Regulating flow of messages from Amazon SQS

The proposed solution in this post regulates the dequeue of messages from one or more SQS queues. This approach can help prevent you from exceeding the per-second quota of Amazon SES, thereby preventing Amazon SES from throttling your API calls.

Available configuration controls

When it comes to regulating outflow from Amazon SQS you have a few options. MaxNumberOfMessages controls the maximum number of messages you can dequeue in a single read request. WaitTimeSeconds defines whether Amazon SQS uses short polling (0 seconds wait) or long polling (more than 0 seconds) while waiting to read messages from a queue. Though these capabilities are helpful in many use cases, they don’t provide full control over outflow rates.

Amazon SQS Event source mapping for Lambda is a built-in mechanism that uses a poller within the Lambda service. The poller polls for visible messages in the queue. Once messages are read, they immediately invoke the configured Lambda function. In order to prevent downstream throttling, this solution implements a custom poller to regulate the rate of messages polled instead of the Amazon SQS Event source mechanism.

Custom poller Lambda

Let’s look at the process of implementing a custom poller Lambda function. Your function should actively regulate the outflow rate without throttling or losing any messages.

First, you have to consider how to invoke the poller Lambda function once every second. Using Amazon EventBridge rules you can schedule Lambda invocations at a rate of once per minute. You also have to consider how to complete processing of Amazon SES invocations as soon as possible. And finally, you have to consider how to send requests to Amazon SES at a rate as close as possible to your per-second quota, without exceeding it.

You can use long polling to meet all of these requirements. Using long polling (by setting the WaitTimeSeconds value to a number greater than zero) means the request queries all of the Amazon SQS servers, or waits until the maximum number of messages you can handle per second (the MaxNumberOfMessages value) are read. By setting the MaxNumberOfMessages equal to your Amazon SES request per-second quota, you prevent your requests from exceeding that limit.

By splitting the looping logic from the poll logic (by using two Lambda functions) the code loops every second (60 times per minute) and asynchronously runs the polling logic.

Fig 3 — Custom poller diagram

You can use the following Python code to create the scheduler loop function:

import os
from time import sleep, time_ns

import boto3

SENDER_FUNCTION_NAME = os.getenv("SENDER_FUNCTION_NAME")
lambda_client = boto3.client("lambda")

def lambda_handler(event, context):
    print(event)

    for _ in range(60):
        prev_ns = time_ns()

        response = lambda_client.invoke_async( 
            FunctionName=SENDER_FUNCTION_NAME, InvokeArgs="{}" 
        ) 
        print(response)

        delta_ns = time_ns() - prev_ns

        if delta_ns < 1_000_000_000: 
            secs = (1_000_000_000.0 - delta_ns) / 1_000_000_000 
            sleep(secs)

This Python code creates a poller function:

import json 
import os

import boto3

UNREGULATED_QUEUE_URL = os.getenv("UNREGULATED_QUEUE_URL") 
MAX_NUMBER_OF_MESSAGES = 3 
WAIT_TIME_SECONDS = 1 
CHARSET = "UTF-8"

ses_client = boto3.client("ses") 
sqs_client = boto3.client("sqs")

def lambda_handler(event, context): 
    response = sqs_client.receive_message( 
        QueueUrl=UNREGULATED_QUEUE_URL, 
        MaxNumberOfMessages=MAX_NUMBER_OF_MESSAGES, 
        WaitTimeSeconds=WAIT_TIME_SECONDS, 
    )

    try: 
        messages = response["Messages"] 
    except KeyError: 
        print("No messages in queue") 
        return

    for message in messages: 
        message_body = json.loads(message["Body"]) 
        to_address = message_body["to_address"] 
        from_address = message_body["from_address"] 
        subject = message_body["subject"] 
        body = message_body["body"]

        print(f"Sending email to {to_address}")

        ses_client.send_email( 
            Destination={ 
                "ToAddresses": [ 
                    to_address, 
                ], 
            }, 
            Message={ 
                "Body": { 
                    "Text": { 
                        "Charset": CHARSET, 
                        "Data": body, 
                    } 
                }, 
                "Subject": { 
                    "Charset": CHARSET, 
                    "Data": subject, 
                }, 
            }, 
            Source=from_address, 
        )

        sqs_client.delete_message( 
            QueueUrl=UNREGULATED_QUEUE_URL, ReceiptHandle=message["ReceiptHandle"] 
        )

Regulating flow of prioritized messages from Amazon SQS

In the use case above, you may be serving a very large marketing campaign (“campaign1”) that takes hours to process. At the same time, you may want to process another, much smaller campaign (“campaign2″), which won’t be able to run until campaign1 is complete.

Obvious solution is to prioritize the campaigns by processing both campaigns in parallel. For example, allocate 90% of the Amazon SES per-second capacity limit to process the larger campaign1, while allowing the smaller campaign2 to take 10% of the available capacity under the limit. Amazon SQS does not provide message priority functionalities out-of-the-box. Instead, create two separate queues and poll each queue according to your desired frequency.

Fig 4 — Prioritize campaigns by queue diagram

This solution works fine if you have consistent flow of incoming messages to both queues. Unfortunately, once you finish processing campaign2 you will keep processing campaign1, using only 90% of the limit capacity per second.

Handling unbalanced flow

For handling unbalanced flow of messages merge both of your poller Lambdas. Implement one Lambda that polls both queues for MaxNumberOfMessages (that equals 100% of the limits of both). In this implementation send from your poller Lambda 90% of campaign1 messages and 10% of campaign2 messages. When campaign2 no longer has messages to process, keep processing 100% of the capacity from campaign1’s queue.

Do not delete unsent messages from the queues. These messages will become visible after their queue’s visibility timeout is reached.

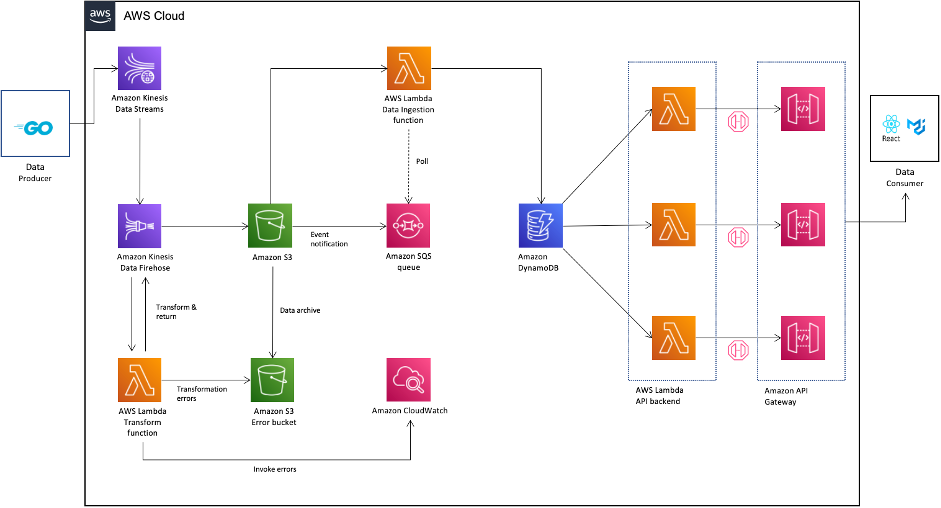
To further improve on the previous implementations, introduce a third FIFO Queue to aggregate all messages from both queues and regulate dequeuing from that third FIFO queue. This will allow you to use all available capacity under your SES limit, while interweaving messages from both campaigns at a 1:10 ratio.

Fig 5 — Adding FIFO merge queue diagram

Processing 100% of the available capacity limit of the large campaign1 and 10% of the capacity limit of the small campaign2 allows you to make sure campign2 messages will not wait until campaign1 messages were all processed. Once campain2 messages are all processed, campign1 messages will continue to be processed using 100% of the capacity limit.

You can find here instructions for Configuring Amazon SQS queues.

Conclusion

In this blog post, we have shown you how to regulate the dequeue of Amazon SQS queue messages. This will prevent you from exceeding your Amazon SES per second limit. This will also remove the need to deal with throttled requests. We explained how to combine Amazon SQS, AWS Lambda, Amazon EventBridge to create a custom serverless regulating queue poller. Finally, we described how to regulate the flow of Amazon SES requests when using multiple priority queues. These technics can reduce implementation time for reprocessing throttled requests, optimize utilization of SES request limit, and reduce costs.

About the Authors

This blog post was written by Guy Loewy and Mark Richman, AWS Senior Solutions Architects for SMB.

How USAA built an Amazon S3 malware scanning solution

Post Syndicated from Jonathan Nguyen original https://aws.amazon.com/blogs/architecture/how-usaa-built-an-amazon-s3-malware-scanning-solution/

United Services Automobile Association (USAA) is a San Antonio-based insurance, financial services, banking, and FinTech company supporting millions of military members and their families. USAA has partnered with Amazon Web Services (AWS) to digitally transform and build multiple USAA solutions that help keep members safe and save members money and time.

Why build a S3 malware scanning solution?

As complex companies’ businesses continue to grow, there may be an increased need for collaboration and interactions with outside vendors. Prior to developing an Amazon Simple Storage Solution (Amazon S3) scanning solution, a security review and approval process for application teams to ingest data into an AWS Organization from external vendors’ AWS accounts may be warranted, to ensure additional threats are not being introduced. This could result in a lengthy review and exception process, and subsequently, could hinder the velocity of application teams’ collaboration with external vendors.

USAA security standards, like those of most companies, require all data from external vendors to be treated as untrusted, and therefore must be scanned by an antivirus or antimalware solution prior to being ingested by downstream processes within the AWS environment. Companies looking to automate the scanning process may want to consider a solution where all incoming external data flow through a demilitarized drop zone to be scanned, and subsequently released to downstream processes if malware and viruses are not detected.

S3 malware scanning solution overview

Dedicated AWS accounts should be provisioned for specific data classifications and used as a demilitarized zone (DMZ) for an untrusted staging area. The solution discussed in this blog uses a dedicated staging AWS account that controls the release of Amazon S3 objects to other AWS accounts within an AWS Organization. AWS accounts within an AWS Organization should follow security best practices in terms of infrastructure, networking, logging, and security. External vendors should explicitly be given limited permissions to appropriate resources in their respective staging S3 bucket.

A staging S3 bucket should have specific resource policies restricting which applications and identity and access management (IAM) principals can interact with S3 objects using object attributes, such as object tags, to determine whether an object has been scanned, and what the results of that scan are. Additional guardrails are implemented using Service Control Policies (SCP) to restrict authorized IAM principals to create or modify S3 object attributes (Figure 1).

Amazon S3 antivirus and antimalware scanning architecture workflow

Figure 1. Amazon S3 antivirus and antimalware scanning architecture workflow

  1. The external vendor copies an object to the staging S3 bucket.
  2. The staging S3 bucket has event notifications configured and generates an event.
  3. The S3 PutObject event is sent to an Object Created Amazon Simple Queue Service (Amazon SQS) queue topic.
  4. An Amazon Elastic Compute Cloud (Amazon EC2) Auto Scaling group is configured to scale based on messages in the Object Created SQS queue.
  5. An antivirus and antimalware scanning service application on the Amazon EC2 instances takes the following actions on objects within the Object Created Amazon SQS queue:
    a. Tag the S3 object with an “In Progress” status.
    b. Get the object from the Staging S3 bucket and stores it in a local ephemeral file system.
    c. Scan the copied object using antivirus or antimalware tool.
    d. Based on the antivirus or antimalware scan results, tag the S3 object with the scan results (for example, No_Malware_Detected vs. Malware_Detected).
    e. Create and publish a payload to the Object Scanned Amazon Simple Notification Service (Amazon SNS) topic, allowing application team filtering.
    f. Delete the message from the Object Created SQS queue.
  6. Application teams are subscribed to the Object Scanned SNS topic with a filter for their application.
  7. For any objects where a virus or malware is detected, a company can use its cyber threat response team to conduct a thorough analysis and take appropriate actions.

USAA built a custom anti-virus and anti-malware scanning application using EC2 instances, using a private, hardened Amazon Machine Image (AMI). For cost-efficacy purposes, the EC2 automatic scaling event can be configured based on Object Created SQS queue depth and Service Level Objective (SLO). A serverless version of an anti-virus and anti-malware solution can be used instead of an EC2 application, depending on your specific use-case and other factors. Some important factors include antivirus and antimalware tool serverless support, resource tuning and configuration requirements, and additional AWS services to manage that could possibly result in a bottleneck. If your enterprise is going with a serverless approach, you can use open-source tools such as ClamAV using Lambda functions.

In the event of an infected object, proper guardrails and response mechanisms need to be in place. USAA teams have developed playbooks to monitor the health and performance of S3 scanning solution, as well as responding to detected virus or malware.

This cloud native, event-driven solution has benefited multiple USAA application teams who have previously requested the ability to ingest data into AWS workloads from teams outside of USAA’s AWS Organization, and allowed additional capabilities and functionality to better serve their members. To enhance this solution even further, USAA’s security team plans to incorporate additional mechanisms to find specific objects that either failed or required additional processing, without having to scan all objects in the buckets. This can be accomplished by including an additional AWS Lambda function and Amazon DynamoDB table to track object metadata as objects get added to the Object Created SQS queue for processing. The metadata could possibly include information such as S3 bucket origin, S3 object key, version ID, scan status, and the original S3 event payload to replay the event into the Object Created SQS queue. The Lambda function primarily ensures the DynamoDB table is kept up to date as objects are processed, as well as handling issues for objects that may need to be reprocessed. The DynamoDB table also has time-to-live (TTL) configured to clear records as they expire from the Staging S3 bucket.

Conclusion

In this post, we reviewed how USAA’s Public Cloud Security team facilitated collaboration and interactions with external vendors and AWS workloads securely by creating a scalable solution to scan S3 objects for virus and malware prior to releasing objects downstream. The solution uses native AWS services and can be utilized for any use-cases requiring antivirus or antimalware capabilities. Because the S3 object scanning solution uses EC2 instances, you can use your existing antivirus or antimalware enterprise tool.

How a blockchain startup built a prototype solution to solve the need of analytics for decentralized applications with AWS Data Lab

Post Syndicated from Dr. Quan Hoang Nguyen original https://aws.amazon.com/blogs/big-data/how-a-blockchain-startup-built-a-prototype-solution-to-solve-the-need-of-analytics-for-decentralized-applications-with-aws-data-lab/

This post is co-written with Dr. Quan Hoang Nguyen, CTO at Fantom Foundation.

Here at Fantom Foundation (Fantom), we have developed a high performance, highly scalable, and secure smart contract platform. It’s designed to overcome limitations of the previous generation of blockchain platforms. The Fantom platform is permissionless, decentralized, and open source. The majority of decentralized applications (dApps) hosted on the Fantom platform lack an analytics page that provides information to the users. Therefore, we would like to build a data platform that supports a web interface that will be made public. This will allow users to search for a smart contract address. The application then displays key metrics for that smart contract. Such an analytics platform can give insights and trends for applications deployed on the platform to the users, while the developers can continue to focus on improving their dApps.

AWS Data Lab offers accelerated, joint-engineering engagements between customers and AWS technical resources to create tangible deliverables that accelerate data and analytics modernization initiatives. Data Lab has three offerings: the Build Lab, the Design Lab, and a Resident Architect. The Build Lab is a 2–5 day intensive build with a technical customer team. The Design Lab is a half-day to 2-day engagement for customers who need a real-world architecture recommendation based on AWS expertise, but aren’t yet ready to build. Both engagements are hosted either online or at an in-person AWS Data Lab hub. The Resident Architect provides AWS customers with technical and strategic guidance in refining, implementing, and accelerating their data strategy and solutions over a 6-month engagement.

In this post, we share the experience of our engagement with AWS Data Lab to accelerate the initiative of developing a data pipeline from an idea to a solution. Over 4 weeks, we conducted technical design sessions, reviewed architecture options, and built the proof of concept data pipeline.

Use case review

The process started with us engaging with our AWS Account team to submit a nomination for the data lab. This followed by a call with the AWS Data Lab team to assess the suitability of requirements against the program. After the Build Lab was scheduled, an AWS Data Lab Architect engaged with us to conduct a series of pre-lab calls to finalize the scope, architecture, goals, and success criteria for the lab. The scope was to design a data pipeline that would ingest and store historical and real-time on-chain transactions data, and build a data pipeline to generate key metrics. Once ingested, data should be transformed, stored, and exposed via REST-based APIs and consumed by a web UI to display key metrics. For this Build Lab, we choose to ingest data for Spooky, which is a decentralized exchange (DEX) deployed on the Fantom platform and had the largest Total Value Locked (TVL) at that time. Key metrics such number of wallets that have interacted with the dApp over time, number of tokens and their value exchanged for the dApp over time, and number of transactions for the dApp over time were selected to visualize through a web-based UI.

We explored several architecture options and picked one for the lab that aligned closely with our end goal. The total historical data for the selected smart contract was approximately 1 GB since deployment of dApp on the Fantom platform. We used FTMScan, which allows us to explore and search on the Fantom platform for transactions, to estimate the rate of transfer transactions to be approximately three to four per minute. This allowed us to design an architecture for the lab that can handle this data ingestion rate. We agreed to use an existing application known as the data producer that was developed internally by the Fantom team to ingest on-chain transactions in real time. On checking transactions’ payload size, it was found to not exceed 100 kb for each transaction, which gave us the measure of number of files that will be created once ingested through the data producer application. A decision was made to ingest the past 45 days of historic transactions to populate the platform with enough data to visualize key metrics. Because the feature of backdating exists within the data producer application, we agreed to use that. The Data Lab Architect also advised us to consider using AWS Database Migration Service (AWS DMS) to ingest historic transactions data post lab. As a last step, we decided to build a React-based webpage with Material-UI that allows users to enter a smart contract address and choose the time interval, and the app fetches the necessary data to show the metrics value.

Solution overview

We collectively agreed to incorporate the following design principles for the data lab architecture:

  • Simplified data pipelines
  • Decentralized data architecture
  • Minimize latency as much as possible

The following diagram illustrates the architecture that we built in the lab.

We collectively defined the following success criteria for the Build Lab:

  • End-to-end data streaming pipeline to ingest on-chain transactions
  • Historical data ingestion of the selected smart contract
  • Data storage and processing of on-chain transactions
  • REST-based APIs to provide time-based metrics for the three defined use cases
  • A sample web UI to display aggregated metrics for the smart contract

Prior to the Build Lab

As a prerequisite for the lab, we configured the data producer application to use the AWS Software Development Kit (AWS SDK) and PUTRecords API operation to send transactions data to an Amazon Simple Storage Service (Amazon S3) bucket. For the Build Lab, we built additional logic within the application to ingest historic transactions data together with real-time transactions data. As a last step, we verified that transactions data was captured and ingested into a test S3 bucket.

AWS services used in the lab

We used the following AWS services as part of the lab:

  • AWS Identity and Access Management (IAM) – We created multiple IAM roles with appropriate trust relationships and necessary permissions that can be used by multiple services to read and write on-chain transactions data and generated logs.
  • Amazon S3 – We created an S3 bucket to store the incoming transactions data as JSON-based files. We created a separate S3 bucket to store incoming transaction data that failed to be transformed and will be reprocessed later.
  • Amazon Kinesis Data Streams – We created a new Kinesis data stream in on-demand mode, which automatically scales based on data ingestion patterns and provides hands-free capacity management. This stream was used by the data producer application to ingest historical and real-time on-chain transactions. We discussed having the ability to manage and predict cost, and therefore were advised to use the provisioned mode when reliable estimates were available for throughput requirements. We were also advised to continue to use on-demand mode until the data traffic patterns were unpredictable.
  • Amazon Kinesis Data Firehose – We created a Firehose delivery stream to transform the incoming data and writes it to the S3 bucket. To minimize latency, we set the delivery stream buffer size to 1 MiB and buffer interval to 60 seconds. This would ensure a file is written to the S3 bucket when either of the two conditions are satisfied regardless of the order. Transactions data written to the S3 bucket was in JSON Lines format.
  • Amazon Simple Queue Service (Amazon SQS) – We set up an SQS queue of the type Standard and an access policy for that SQS queue to allow incoming messages generated from S3 bucket event notifications.
  • Amazon DynamoDB – In order to pick a data store for on-chain transactions, we needed a service that can store transactions payload of unstructured data with varying schemas, provides the ability to cache query results, and is a managed service. We picked DynamoDB for those reasons. We created a single DynamoDB table that holds the incoming transactions data. After analyzing the access query patterns, we decided to use the address field of the smart contract as the partition key and the timestamp field as the sort key. The table was created with auto scaling of read and write capacity modes because the actual usage requirements would be hard to predict at that time.
  • AWS Lambda – We created the following functions:
    • A Python-based Lambda function to perform transformations on the incoming data from the data producer application to flatten the JSON structure, convert the Unix-based epoch timestamp to a date/time value, and convert hex-based string values to a decimal value representing the number of tokens.
    • A second Lambda function to parse incoming SQS queue messages. This message contained values for bucket_name and object_key, which holds the reference to a newly created object within the S3 bucket. The Lambda function logic included parsing of this value to obtain the reference to the S3 object, get the contents of the object, read it into a data frame object using the AWS SDK for pandas (awswrangler) library, convert it into a Pandas data frame object, and use the put_df API call to write a Pandas data frame object as an item into a DynamoDB table. We choose to use Pandas due to familiarity with the library and functions required to perform data transform operations.
    • Three separate Lambda functions that contains the logic to query the DynamoDB table and retrieve items to aggregate and calculate metrics values. This calculated metrics value within the Lambda function was formatted as an HTTP response to expose as REST-based APIs.
  • Amazon API Gateway – We created a REST based API endpoint that uses Lambda proxy integration to pass a smart contract address and time-based interval in minutes as a query string parameter to the backend Lambda function. The response from the Lambda function was a metrics value. We also enabled cross-origin resource sharing (CORS) support within API Gateway to successfully query from the web UI that resides in a different domain.
  • Amazon CloudWatch – We used a Lambda function in-built mechanism to send function metrics to CloudWatch. Lambda functions come with a CloudWatch Logs log group and a log stream for each instance of your function. The Lambda runtime environment sends details of each invocation to the log stream, and relays logs and other output from your function’s code.

Iterative development approach

Across 4 days of the Build Lab, we undertook iterative development. We started by developing the foundational layer and iteratively added extra features through testing and data validation. This allowed us to develop confidence of the solution being built as we tested the output of the metrics through a web-based UI and verified with the actual data. As errors got discovered, we deleted the entire dataset and reran all the jobs to verify results and resolve those errors.

Lab outcomes

In 4 days, we built an end-to-end streaming pipeline ingesting 45 days of historical data and real-time on-chain transactions data for the selected Spooky smart contract. We also developed three REST-based APIs for the selected metrics and a sample web UI that allows users to insert a smart contract address, choose a time frequency, and visualize the metrics values. In a follow-up call, our AWS Data Lab Architect shared post-lab guidance around the next steps required to productionize the solution:

  • Scaling of the proof of concept to handle larger data volumes
  • Security best practices to protect the data while at rest and in transit
  • Best practices for data modeling and storage
  • Building an automated resilience technique to handle failed processing of the transactions data
  • Incorporating high availability and disaster recovery solutions to handle incoming data requests, including adding of the caching layer

Conclusion

Through a short engagement and small team, we accelerated this project from an idea to a solution. This experience gave us the opportunity to explore AWS services and their analytical capabilities in-depth. As a next step, we will continue to take advantage of AWS teams to enhance the solution built during this lab to make it ready for the production deployment.

Learn more about how the AWS Data Lab can help your data and analytics on the cloud journey.


About the Authors

Dr. Quan Hoang Nguyen is currently a CTO at Fantom Foundation. His interests include DLT, blockchain technologies, visual analytics, compiler optimization, and transactional memory. He has experience in R&D at the University of Sydney, IBM, Capital Markets CRC, Smarts – NASDAQ, and National ICT Australia (NICTA).

Ankit Patira is a Data Lab Architect at AWS based in Melbourne, Australia.

AWS Week in Review – October 24, 2022

Post Syndicated from Channy Yun original https://aws.amazon.com/blogs/aws/aws-week-in-review-october-24-2022/

Last week, we announced plans to launch the AWS Asia Pacific (Bangkok) Region, which will become our third AWS Region in Southeast Asia. This Region will have three Availability Zones and will give AWS customers in Thailand the ability to run workloads and store data that must remain in-country.

In the Works – AWS Region in Thailand
With this big news, AWS announced a 190 billion baht (US 5 billion dollars) investment to drive Thailand’s digital future over the next 15 years. It includes capital expenditures on the construction of data centers, operational expenses related to ongoing utilities and facility costs, and the purchase of goods and services from Regional businesses.

Since we first opened an office in Bangkok in 2015, AWS has launched 10 Amazon CloudFront edge locations, a highly secure and programmable content delivery network (CDN) in Bangkok. In 2020, we launched AWS Outposts, a family of fully managed solutions delivering AWS infrastructure and services to virtually any on-premises or edge location for a truly consistent hybrid experience in Thailand. This year, we also plan the upcoming launch of an AWS Local Zone in Bangkok, which will enable customers to deliver applications that require single-digit millisecond latency to end users in Thailand.

Photo courtesy of Conor McNamara, Managing Director, ASEAN at AWS

The new AWS Region in Thailand is also part of our broader, multifaceted investment in the country, covering our local team, partners, skills, and the localization of services, including Amazon Transcribe, Amazon Translate, and Amazon Connect.

Many Thailand customers have chosen AWS to run their workloads to accelerate innovation, increase agility, and drive cost savings, such as 2C2P, CP All Plc., Digital Economy Promotion Agency, Energy Response Co. Ltd. (ENRES), PTT Global Public Company Limited (PTT), Siam Cement Group (SCG), Sukhothai Thammathirat Open University, The Stock Exchange of Thailand, Papyrus Studio, and more.

For example, Dr. Werner Vogels, CTO of Amazon.com, introduced the story of Papyrus Studio, a large film studio and one of the first customers in Thailand.

“Customer stories like Papyrus Studio inspire us at AWS. The cloud can allow a small company to rapidly scale and compete globally. It also provides new opportunities to create, innovate, and identify business opportunities that just aren’t possible with conventional infrastructure.”

For more information on how to enable AWS and get support in Thailand, contact our AWS Thailand team.

Last Week’s Launches
My favorite news of last week was to launch dark mode as a beta feature in the AWS Management Console. In Unified Settings, you can choose between three settings for visual mode: Browser default, Light, and Dark. Browser default applies the default dark or light setting of the browser, dark applies the new built-in dark mode, and light maintains the current look and feel of the AWS console. Choose your favorite!

Here are some launches that caught my eye for web, mobile, and IoT application developers:

New AWS Amplify Library for Swift – We announce the general availability of Amplify Library for Swift (previously Amplify iOS). Developers can use Amplify Library for Swift via the Swift Package Manager to build apps for iOS and macOS (currently in beta) platforms with Auth, Storage, Geo, and more features.

The Amplify Library for Swift is open source on GitHub, and we deeply appreciate the feedback we have gotten from the community. To learn more, see Introducing the AWS Amplify Library for Swift in the AWS Front-End Web & Mobile Blog or Amplify Library for Swift documentation.

New Amazon IVS Chat SDKs – Amazon Interactive Video Service (Amazon IVS) now provides SDKs for stream chat with support for web, Android, and iOS. The Amazon IVS stream chat SDKs support common functions for chat room resource management, sending and receiving messages, and managing chat room participants.

Amazon IVS is a managed, live-video streaming service using the broadcast SDKs or standard streaming software such as Open Broadcaster Software (OBS). The service provides cross-platform player SDKs for playback of Amazon IVS streams you need to make low-latency live video available to any viewer around the world. Also, it offers Chat Client Messaging SDK. For more information, see Getting Started with Amazon IVS Chat in the AWS documentation.

New AWS Parameters and Secrets Lambda Extension – This is new extension for AWS Lambda developers to retrieve parameters from AWS Systems Manager Parameter Store and secrets from AWS Secrets Manager. Lambda function developers can leverage this extension to improve their application performance as it decreases the latency and the cost of retrieving parameters and secrets.

Previously, you had to initialize either the core library of a service or the entire service SDK inside a Lambda function for retrieving secrets and parameters. Now you can simply use the extension. To learn more, see AWS Systems Manager Parameter Store documentation and AWS Secrets Manager documentation.

New FreeRTOS Long Term Support Version – We announce the second release of FreeRTOS Long Term Support (LTS) – FreeRTOS 202210.00 LTS. FreeRTOS LTS offers a more stable foundation than standard releases as manufacturers deploy and later update devices in the field. This release includes new and upgraded libraries such as AWS IoT Fleet Provisioning, Cellular LTE-M Interface, coreMQTT, and FreeRTOS-Plus-TCP.

All libraries included in this FreeRTOS LTS version will receive security and critical bug fixes until October 2024. With an LTS release, you can continue to maintain your existing FreeRTOS code base and avoid any potential disruptions resulting from FreeRTOS version upgrades. To learn more, see the FreeRTOS announcement.

Here is some news on performance improvement and increasing capacity:

Up to 10X Improving Amazon Aurora Snapshot Exporting Speed – Amazon Aurora MySQL-Compatible Edition for MySQL 5.7 and 8.0 now speed up to 10x faster snapshot exports to Amazon S3. The performance improvement is automatically applied to all types of database snapshot exports, including manual snapshots, automated system snapshots, and snapshots created by the AWS Backup service. For more information, see Exporting DB cluster snapshot data to Amazon S3 in the Amazon Aurora documentation.

3X Increasing Amazon RDS Read Capacity – Amazon Relational Database Service (RDS) for MySQL, MariaDB, and PostgreSQL now supports 15 read replicas per instance, including up to 5 cross-Region read replicas, delivering up to 3x the previous read capacity. For more information, see Working with read replicas in the Amazon RDS documentation.

2X Increasing AWS Snowball Edge Compute Capacity – The AWS Snowball Edge Compute Optimized device doubled the compute capacity up to 104 vCPUs, doubled the memory capacity up to 416GB RAM, and is now fully SSD with 28TB NVMe storage. The updated device is ideal when you need dense compute resources to run complex workloads such as machine learning inference or video analytics at the rugged, mobile edge such as trucks, aircraft or ships.  You can get started by ordering a Snowball Edge device on the AWS Snow Family console.

2X Increasing Amazon SQS FIFO Default Quota – Amazon Simple Queue Service (SQS) announces the increase of default quota up to 6,000 transactions per second per API action. It is double the previous 3,000 throughput quota for a high throughput mode for FIFO (first in, first out) queues in all AWS Regions where Amazon SQS FIFO queue is available. For a detailed breakdown of default throughput quotas per Region, see Quotas related to messages in the Amazon SQS documentation.

For a full list of AWS announcements, be sure to keep an eye on the What’s New at AWS page.

Other AWS News
Here are some other news items that you may find interesting:

22 New or Updated Open Datasets on AWS – We released 22 new or updated datasets, including Amazonia-1 imagery, Bitcoin and Ethereum data, and elevation data over the Arctic and Antarctica. The full list of publicly available datasets is on the Registry of Open Data on AWS and is now also discoverable on AWS Data Exchange.

Sustainability with AWS Partners (ft. AWS On Air) – This episode covers a broad discipline of environmental, social, and governance (ESG) issues across all regions, organization types, and industries. AWS Sustainability & Climate Tech provides a comprehensive portfolio of AWS Partner solutions built on AWS that address climate change events and the United Nation’s Sustainable Development Goals (SDG).

AWS Open Source News and Updates #131 – This newsletter covers latest open-source projects such as Amazon EMR Toolkit for VS Code, a VS Code Extension to make it easier to develop Spark jobs on EMR and AWS CDK For Discourse, sample codes that demonstrates how to create a full environment for Discourse, etc. Remember to check out the Open source at AWS keep up to date with all our activity in open source by following us on @AWSOpen.

Upcoming AWS Events
Check your calendars and sign up for these AWS events:

AWS re:Invent 2022 Attendee Guide – Browse re:Invent 2022 attendee guides, curated by AWS Heroes, AWS industry teams, and AWS Partners. Each guide contains recommended sessions, tips and tricks for building your agenda, and other useful resources. Also, seat reservations for all sessions are now open for all re:Invent attendees. You can still register for AWS re:Invent either offline or online.

AWS AI/ML Innovation Day on October 25 – Join us for this year’s AWS AI/ML Innovation Day, where you’ll hear from Bratin Saha and other leaders in the field about the great strides AI/ML has made in the past and the promises awaiting us in the future.

AWS Container Day at Kubecon 2022 on October 25–28 – Come join us at KubeCon + CloudNativeCon North America 2022, where we’ll be hosting AWS Container Day Featuring Kubernetes on October 25 and educational sessions at our booth on October 26–28. Throughout the event, our sessions focus on security, cost optimization, GitOps/multi-cluster management, hybrid and edge compute, and more.

You can browse all upcoming in-person, and virtual events.

That’s all for this week. Check back next Monday for another Week in Review!

— Channy

This post is part of our Week in Review series. Check back each week for a quick roundup of interesting news and announcements from AWS!

Adding approval notifications to EC2 Image Builder before sharing AMIs

Post Syndicated from Sheila Busser original https://aws.amazon.com/blogs/compute/adding-approval-notifications-to-ec2-image-builder-before-sharing-amis-2/

­­­­­This blog post is written by, Glenn Chia Jin Wee, Associate Cloud Architect, and Randall Han, Professional Services.

You may be required to manually validate the Amazon Machine Image (AMI) built from an Amazon Elastic Compute Cloud (Amazon EC2) Image Builder pipeline before sharing this AMI to other AWS accounts or to an AWS organization. Currently, Image Builder provides an end-to-end pipeline that automatically shares AMIs after they’ve been built.

In this post, we will walk through the steps to enable approval notifications before AMIs are shared with other AWS accounts. Image Builder supports automated image testing using test components. The recommended best practice is to automate test steps, however situations can arise where test steps become either challenging to automate or internal compliance policies mandate manual checks be conducted prior to distributing images. In such situations, having a manual approval step is useful if you would like to verify the AMI configuration before it is shared to other AWS accounts or an AWS Organization. A manual approval step reduces the potential for sharing an incorrectly configured AMI with other teams which can lead to downstream issues. This solution sends an email with a link to approve or reject the AMI. Users approve the AMI after they’ve verified that it is built according to specifications. Upon approving the AMI, the solution automatically shares it with the specified AWS accounts.

OverviewArchitecture Diagram

  1. In this solution, an Image Builder Pipeline is run that builds a Golden AMI in Account A. After the AMI is built, Image Builder publishes data about the AMI to an Amazon Simple Notification Service (Amazon SNS)
  2. The SNS Topic passes the data to an AWS Lambda function that subscribes to it.
  3. The Lambda function that subscribes to this topic retrieves the data, formats it, and then starts an SSM Automation, passing it the AMI Name and ID.
  4. The first step of the SSM Automation is a manual approval step. The SSM Automation first publishes to an SNS Topic that has an email subscription with the Approver’s email. The approver will receive the email with a URL that they can click to approve the step.
  5. The approval step defines a specific AWS Identity and Access Management (IAM) Role as an approver. This role has the minimum required permissions to approve the manual approval step. After performing manual tests on the Golden AMI, the Approver principal will assume this role.
  6. After assuming this role, the approver will click on the approval link that was sent via email. After approving the step, an AWS Lambda Function is triggered.
  7. This Lambda Function shares the Golden AMI with Account B and sends an email notifying the Target Account Recipients that the AMI has been shared.

Prerequisites

For this walkthrough, you will need the following:

  • Two AWS accounts – one to host the solution resources, and the second which receives the shared Golden AMI.
    • In the account that hosts the solution, prepare an AWS Identity and Access Management (IAM) principal with the sts:AssumeRole permission. This principal must assume the IAM Role that is listed as an approver in the Systems Manager approval step. The ARN of this IAM principal is used in the AWS CloudFormation Approver parameter, This ARN is added to the trust policy of approval IAM Role.
    • In addition, in the account hosting the solution, ensure that the IAM principal deploying the CloudFormation template has the required permissions to create the resources in the stack.
  • A new Amazon Virtual Private Cloud (Amazon VPC) will be created from the stack. Make sure that you have fewer than five VPCs in the selected Region.

Walkthrough

In this section, we will guide you through the steps required to deploy the Image Builder solution. The solution is deployed with CloudFormation.

In this scenario, we deploy the solution within the approver’s account. The approval email will be sent to a predefined email address for manual approval, before the newly created AMI is shared to target accounts.

The approver first assumes the approval IAM Role and then selects the approval link. This leads to the Systems Manager approval page. Upon approval, an email notification will be sent to the predefined target account email address, notifying the relevant stakeholders that the AMI has been successfully shared.

The high-level steps we will follow are:

  1. In Account A, deploy the provided AWS CloudFormation template. This includes an example Image Builder Pipeline, Amazon SNS topics, Lambda functions, and an SSM Automation Document.
  2. Approve the SNS subscription from your supplied email address.
  3. Run the pipeline from the Amazon EC2 Image Builder Console.
  4. [Optional] To conduct manual tests, launch an Amazon EC2 instance from the built AMI after the pipeline runs.
  5. An email will be sent to you with options to approve or reject the step. Ensure that you have assumed the IAM Role that is the approver before clicking the approval link that leads to the SSM console approval page.
  6. Upon approving the step, an AWS Lambda function shares the AMI to the Account B and also sends an email to the target account email recipients notifying them that the AMI has been shared.
  7. Log in to Account B and verify that the AMI has been shared.

Step 1: Deploy the AWS CloudFormation template

1. The CloudFormation template, template.yaml that deploys the solution can also found at this GitHub repository. Follow the instructions at the repository to deploy the stack.

Step 2: Verify your email address

  1. After running the deployment, you will receive an email prompting you to confirm the Subscription at the approver email address. Choose Confirm subscription.

SNS Topic Subscription confirmation email

  1. This leads to the following screen, which shows that your subscription is confirmed.

subscription-confirmation

  1. Repeat the previous 2 steps for the target email address.

Step 3: Run the pipeline from the Image Builder console

  1. In the Image Builder console, under Image pipelines, select the checkbox next to the Pipeline created, choose Actions, and select Run pipeline.

run-image-builder-pipeline

Note: The pipeline takes approximately 20 – 30 minutes to complete.

Step 4: [Optional] Launch an Amazon EC2 instance from the built AMI

If you have a requirement to manually validate the AMI before sharing it with other accounts or to the AWS organization an approver will launch an Amazon EC2 instance from the built AMI and conduct manual tests on the EC2 instance to make sure it is functional.

  1. In the Amazon EC2 console, under Images, choose AMIs. Validate that the AMI is created.

ami-in-account-a

  1. Follow AWS docs: Launching an EC2 instances from a custom AMI for steps on how to launch an Amazon EC2 instance from the AMI.

Step 5: Select the approval URL in the email sent

  1. When the pipeline is run successfully, you will receive another email with a URL to approve the AMI.

approval-email

  1. Before clicking on the Approve link, you must assume the IAM Role that is set as an approver for the Systems Manager step.
  2. In the CloudFormation console, choose the stack that was deployed.

cloudformation-stack

4. Choose Outputs and copy the IAM Role name.

ssm-approval-role-output

5. While logged in as the IAM Principal that has permissions to assume the approval IAM Role, follow the instructions at AWS IAM documentation for switching a role using the console to assume the approval role.
In the Switch Role page, in Role paste the name of the IAM Role that you copied in the previous step.

Note: This IAM Role was deployed with minimum permissions. Hence, seeing warning messages in the console is expected after assuming this role.

switch-role

6. Now in the approval email, select the Approve URL. This leads to the Systems Manager console. Choose Submit.

approve-console

7. After approving the manual step, the second step is executed, which shares the AMI to the target account.

automation-step-success

Step 6: Verify that the AMI is shared to Account B

  1. Log in to Account B.
  2. In the Amazon EC2 console, under Images, choose AMIs. Then, in the dropdown, choose Private images. Validate that the AMI is shared.

verify-ami-in-account-b

  1. Verify that a success email notification was sent to the target account email address provided.

target-email

Clean up

This section provides the necessary information for deleting various resources created as part of this post.

  1. Deregister the AMIs that were created and shared.
    1. Log in to Account A and follow the steps at AWS documentation: Deregister your Linux AMI.
  2. Delete the CloudFormation stack. For instructions, refer to Deleting a stack on the AWS CloudFormation console.

Conclusion

In this post, we explained how to enable approval notifications for an Image Builder pipeline before AMIs are shared to other accounts. This solution can be extended to share to more than one AWS account or even to an AWS organization. With this solution, you will be notified when new golden images are created, allowing you to verify the accuracy of their configuration before sharing them to for wider use. This reduces the possibility of sharing AMIs with misconfigurations that the written tests may not have identified.

We invite you to experiment with different AMIs created using Image Builder, and with different Image Builder components. Check out this GitHub repository for various examples that use Image Builder. Also check out this blog on Image builder integrations with EC2 Auto Scaling Instance Refresh. Let us know your questions and findings in the comments, and have fun!

AWS Week in Review – October 10, 2022

Post Syndicated from Marcia Villalba original https://aws.amazon.com/blogs/aws/aws-week-in-review-october-10-2022/

This post is part of our Week in Review series. Check back each week for a quick roundup of interesting news and announcements from AWS!

I had an amazing start to the week last week as I was speaking at the AWS Community Day NL. This event had 500 attendees and over 70 speakers, and Dr. Werner Vogels, Amazon CTO, delivered the keynote. AWS Community Days are community-led conferences organized by local communities, with a variety of workshops and sessions. I recommend checking your region for any of these events.

Community Day NL

Last Week’s Launches
Here are some launches that got my attention during the previous week.

Amazon S3 Object Lambda now supports using your own code to change the results of HEAD and LIST requests, besides GET (which we launched last year). This feature now enables more capabilities for what you can do with S3 Object Lambda. Danilo made a Twitter thread with lots of use cases for this new launch.

Amazon SageMaker Clarify now can provide near real-time explanations for ML predictions. SageMaker Clarify is a service that provides explainability by ML models individual predictions. These explanations are important for developers to get visibility into their training data and models to identify potential bias.

AWS Storage Gateway now supports 15 TiB tapes. It increased the maximum supported virtual tape size on Tape Gateway from 5 TiB to 15 TiB, so you can store more data on a single virtual tape, and you can reduce the number of tapes you need to manage.

Amazon Aurora Serverless v2 now supports AWS CloudFormation. Early this year, we announced the general availability of Aurora Serverless v2, and now you can use AWS CloudFormation Templates to deploy and change the database along with the rest of your infrastructure.

AWS Config now supports 15 new resource types, including AWS DataSync, Amazon GuardDuty, Amazon Simple Email Service (Amazon SES), AWS AppSync, AWS Cloud Map, Amazon EC2, and AWS AppConfig. With this launch, you can use AWS Config to monitor configuration data for the supported resource types in your AWS account, and you can see how the configuration changes.

For a full list of AWS announcements, be sure to keep an eye on the What’s New at AWS page.

Other AWS News
Some other updates and news that you may have missed:

This week an article about how AWS is leading a pilot project to turn the Greek island of Naxos into a smart island caught my attention. The project introduces smart solutions for mobility, primary healthcare, and the transport of goods. The solution has been built based on four pillars that were important for the island: sustainability, telehealth, leisure, and digital skills. Check out the whole article to learn what they are doing.

Podcast Charlas Técnicas de AWS – If you understand Spanish, this podcast is for you. Podcast Charlas Técnicas is one of the official AWS podcasts in Spanish, and every other week there is a new episode. The podcast is meant for builders, and it shares stories about how customers implemented and learned AWS services, how to architect applications, and how to use new services. You can listen to all the episodes directly from your favorite podcast app or at AWS Podcasts en español.

AWS open-source news and updates – This is a newsletter curated by my colleague Ricardo to bring you the latest open-source projects, posts, events, and more.

Upcoming AWS Events
Check your calendars and sign up for these AWS events:

AWS re:Invent reserved seating opens on October 11. If you are planning to attend, book a spot in advance for your favorite sessions. AWS re:Invent is our biggest conference of the year, it happens in Las Vegas from November 28 to December 2, and registrations are open. Many writers of this blog have sessions at re:Invent, and you can search the event agenda using our names.

I started the post talking about AWS Community Days, and there is one in Warsaw, Poland, on October 14. If you are around Warsaw during this week, you can first check out the AWS Pop-up Hub in Warsaw that runs October 10-14 and then join for the Community Day.

On October 20, there is a virtual event for modernizing .NET workloads with Windows containers on AWS, You can register for free.

That’s all for this week. Check back next Monday for another Week in Review!

— Marcia

Use IAM Access Analyzer policy generation to grant fine-grained permissions for your AWS CloudFormation service roles

Post Syndicated from Joel Knight original https://aws.amazon.com/blogs/security/use-iam-access-analyzer-policy-generation-to-grant-fine-grained-permissions-for-your-aws-cloudformation-service-roles/

AWS Identity and Access Management (IAM) Access Analyzer provides tools to simplify permissions management by making it simpler for you to set, verify, and refine permissions. One such tool is IAM Access Analyzer policy generation, which creates fine-grained policies based on your AWS CloudTrail access activity—for example, the actions you use with Amazon Elastic Compute Cloud (Amazon EC2), AWS Lambda, and Amazon Simple Storage Service (Amazon S3). AWS has expanded policy generation capabilities to support the identification of actions used from over 140 services. New additions include services such as AWS CloudFormation, Amazon DynamoDB, and Amazon Simple Queue Service (Amazon SQS). When you request a policy, IAM Access Analyzer generates a policy by analyzing your CloudTrail logs to identify actions used from this group of over 140 services. The generated policy makes it efficient to grant only the required permissions for your workloads. For other services, Access Analyzer helps you by identifying the services used and guides you to add the necessary actions.

In this post, we will show how you can use Access Analyzer to generate an IAM permissions policy that restricts CloudFormation permissions to only those actions that are necessary to deploy a given template, in order to follow the principle of least privilege.

Permissions for AWS CloudFormation

AWS CloudFormation lets you create a collection of related AWS and third-party resources and provision them in a consistent and repeatable fashion. A common access management pattern is to grant developers permission to use CloudFormation to provision resources in the production environment and limit their ability to do so directly. This directs developers to make infrastructure changes in production through CloudFormation, using infrastructure-as-code patterns to manage the changes.

CloudFormation can create, update, and delete resources on the developer’s behalf by assuming an IAM role that has sufficient permissions. Cloud administrators often grant this IAM role broad permissions–in excess of what’s necessary to just create, update, and delete the resources from the developer’s template–because it’s not clear what the minimum permissions are for the template. As a result, the developer could use CloudFormation to create or modify resources outside of what’s required for their workload.

The best practice for CloudFormation is to acquire permissions by using the credentials from an IAM role you pass to CloudFormation. When you attach a least-privilege permissions policy to the role, the actions CloudFormation is allowed to perform can be scoped to only those that are necessary to manage the resources in the template. In this way, you can avoid anti-patterns such as assigning the AdministratorAccess or PowerUserAccess policies—both of which grant excessive permissions—to the role.

The following section will describe how to set up your account and grant these permissions.

Prepare your development account

Within your development account, you will configure the same method for deploying infrastructure as you use in production: passing a role to CloudFormation when you launch a stack. First, you will verify that you have the necessary permissions, and then you will create the role and the role’s permissions policy.

Get permissions to use CloudFormation and IAM Access Analyzer

You will need the following minimal permissions in your development account:

  • Permission to use CloudFormation, in particular to create, update, and delete stacks
  • Permission to pass an IAM role to CloudFormation
  • Permission to create IAM roles and policies
  • Permission to use Access Analyzer, specifically the GetGeneratedPolicy, ListPolicyGenerations, and StartPolicyGeneration actions

The following IAM permissions policy can be used to grant your identity these permissions.

{
    "Version": "2012-10-17",
    "Statement": [
        {
            "Sid": "DeveloperPermissions”,
            "Effect": "Allow",
            "Action": [
                "access-analyzer:GetGeneratedPolicy",
                "access-analyzer:ListPolicyGenerations",
                "access-analyzer:StartPolicyGeneration",
                "cloudformation:*",
                "iam:AttachRolePolicy",
                "iam:CreatePolicy",
                "iam:CreatePolicyVersion",
                "iam:CreateRole",
                "iam:DeletePolicyVersion",
                "iam:DeleteRolePolicy",
                "iam:DetachRolePolicy",
                "iam:GetPolicy",
                "iam:GetPolicyVersion",
                "iam:GetRole",
                "iam:GetRolePolicy",
                "iam:ListPolicies",
                "iam:ListPolicyTags",
                "iam:ListPolicyVersions",
                "iam:ListRolePolicies",
                "iam:ListRoleTags",
                "iam:ListRoles",
                "iam:PutRolePolicy",
                "iam:UpdateAssumeRolePolicy"
            ],
            "Resource": "*"
        },
        {
            "Sid": "AllowPassCloudFormationRole”,
            "Effect": "Allow",
            "Action": [
                "iam:PassRole"
            ]
            "Resource": "*",
            "Condition": {
                "StringEquals": {
                    "iam:PassedToService": "cloudformation.amazonaws.com"
                }
            }
        }
    ]
}

Note: If your identity already has these permissions through existing permissions policies, there is no need to apply the preceding policy to your identity.

Create a role for CloudFormation

Creating a service role for CloudFormation in the development account makes it less challenging to generate the least-privilege policy, because it becomes simpler to identify the actions CloudFormation is taking as it creates and deletes resources defined in the template. By identifying the actions CloudFormation has taken, you can create a permissions policy to match.

To create an IAM role in your development account for CloudFormation

  1. Open the IAM console and choose Roles, then choose Create role.
  2. For the trusted entity, choose AWS service. From the list of services, choose CloudFormation.
  3. Choose Next: Permissions.
  4. Select one or more permissions policies that align with the types of resources your stack will create. For example, if your stack creates a Lambda function and an IAM role, choose the AWSLambda_FullAccess and IAMFullAccess policies.

    Note: Because you have not yet created the least-privilege permissions policy, the role is granted broader permissions than required. You will use this role to launch your stack and evaluate the resulting actions that CloudFormation takes, in order to build a lower-privilege policy.

  5. Choose Next: Tags to proceed.
  6. Enter one or more optional tags, and then choose Next: Review.
  7. Enter a name for the role, such as CloudFormationDevExecRole.
  8. Choose Create role.

Create and destroy the stack

To have CloudFormation exercise the actions required by the stack, you will need to create and destroy the stack.

To create and destroy the stack

  1. Navigate to CloudFormation in the console, expand the menu in the left-hand pane, and choose Stacks.
  2. On the Stacks page, choose Create Stack, and then choose With new resources.
  3. Choose Template is ready, choose Upload a template file, and then select the file for your template. Choose Next.
  4. Enter a Stack name, and then choose Next.
  5. For IAM execution role name, select the name of the role you created in the previous section (CloudFormationDevExecRole). Choose Next.
  6. Review the stack configuration. If present, select the check box(es) in the Capabilities section, and then choose Create stack.
  7. Wait for the stack to reach the CREATE_COMPLETE state before continuing.
  8. From the list of stacks, select the stack you just created, choose Delete, and then choose Delete stack.
  9. Wait until the stack reaches the DELETE_COMPLETE state (at which time it will also disappear from the list of active stacks).

Note: It’s recommended that you also modify the CloudFormation template and update the stack to initiate updates to the deployed resources. This will allow Access Analyzer to capture actions that update the stack’s resources, in addition to create and delete actions. You should also review the API documentation for the resources that are being used in your stack and identify any additional actions that may be required.

Now that the development environment is ready, you can create the least-privilege permissions policy for the CloudFormation role.

Use Access Analyzer to generate a fine-grained identity policy

Access Analyzer reviews the access history in AWS CloudTrail to identify the actions an IAM role has used. Because CloudTrail delivers logs within an average of about 15 minutes of an API call, you should wait at least that long after you delete the stack before you attempt to generate the policy, in order to properly capture all of the actions.

Note: CloudTrail must be enabled in your AWS account in order for policy generation to work. To learn how create a CloudTrail trail, see Creating a trail for your AWS account in the AWS CloudTrail User Guide.

To generate a permissions policy by using Access Analyzer

  1. Open the IAM console and choose Roles. In the search box, enter CloudFormationDevExecRole and select the role name in the list.
  2. On the Permissions tab, scroll down and choose Generate policy based on CloudTrail events to expand this section. Choose Generate policy.
  3. Select the time period of the CloudTrail logs you want analyzed.
  4. Select the AWS Region where you created and deleted the stack, and then select the CloudTrail trail name in the drop-down list.
  5. If this is your first time generating a policy, choose Create and use a new service role to have an IAM role automatically created for you. You can view the permissions policy the role will receive by choosing View permission details. Otherwise, choose Use an existing service role and select a role in the drop-down list.

    The policy generation options are shown in Figure 1.

    Figure 1: Policy generation options

    Figure 1: Policy generation options

  6. Choose Generate policy.

You will be redirected back to the page that shows the CloudFormationDevExecRole role. The Status in the Generate policy based on CloudTrail events section will show In progress. Wait for the policy to be generated, at which time the status will change to Success.

Review the generated policy

You must review and save the generated policy before it can be applied to the role.

To review the generated policy

  1. While you are still viewing the CloudFormationDevExecRole role in the IAM console, under Generate policy based on CloudTrail events, choose View generated policy.
  2. The Generated policy page will open. The Actions included in the generated policy section will show a list of services and one or more actions that were found in the CloudTrail log. Review the list for omissions. Refer to the IAM documentation for a list of AWS services for which an action-level policy can be generated. An example list of services and actions for a CloudFormation template that creates a Lambda function is shown in Figure 2.
    Figure 2: Actions included in the generated policy

    Figure 2: Actions included in the generated policy

  3. Use the drop-down menus in the Add actions for services used section to add any necessary additional actions to the policy for the services that were identified by using CloudTrail. This might be needed if an action isn’t recorded in CloudTrail or if action-level information isn’t supported for a service.

    Note: The iam:PassRole action will not show up in CloudTrail and should be added manually if your CloudFormation template assigns an IAM role to a service (for example, when creating a Lambda function). A good rule of thumb is: If you see iam:CreateRole in the actions, you likely need to also allow iam:PassRole. An example of this is shown in Figure 3.

    Figure 3: Adding PassRole as an IAM action

    Figure 3: Adding PassRole as an IAM action

  4. When you’ve finished adding additional actions, choose Next.

Generated policies contain placeholders that need to be filled in with resource names, AWS Region names, and other variable data. The actual values for these placeholders should be determined based on the content of your CloudFormation template and the Region or Regions you plan to deploy the template to.

To replace placeholders with real values

  • In the generated policy, identify each of the Resource properties that use placeholders in the value, such as ${RoleNameWithPath} or ${Region}. Use your knowledge of the resources that your CloudFormation template creates to properly fill these in with real values.
    • ${RoleNameWithPath} is an example of a placeholder that reflects the name of a resource from your CloudFormation template. Replace the placeholder with the actual name of the resource.
    • ${Region} is an example of a placeholder that reflects where the resource is being deployed, which in this case is the AWS Region. Replace this with either the Region name (for example, us-east-1), or a wildcard character (*), depending on whether you want to restrict the policy to a specific Region or to all Regions, respectively.

For example, a statement from the policy generated earlier is shown following.

{
    "Effect": "Allow",
    "Action": [
        "lambda:CreateFunction",
        "lambda:DeleteFunction",
        "lambda:GetFunction",
        "lambda:GetFunctionCodeSigningConfig"
    ],
    "Resource": "arn:aws:lambda:${Region}:${Account}:function:${FunctionName}"
},

After substituting real values for the placeholders in Resource, it looks like the following.

{
    "Effect": "Allow",
    "Action": [
        "lambda:CreateFunction",
        "lambda:DeleteFunction",
        "lambda:GetFunction",
        "lambda:GetFunctionCodeSigningConfig"
    ],
    "Resource": "arn:aws:lambda:*:123456789012:function:MyLambdaFunction"
},

This statement allows the Lambda actions to be performed on a function named MyLambdaFunction in AWS account 123456789012 in any Region (*). Substitute the correct values for Region, Account, and FunctionName in your policy.

The IAM policy editor window will automatically identify security or other issues in the generated policy. Review and remediate the issues identified in the Security, Errors, Warnings, and Suggestions tabs across the bottom of the window.

To review and remediate policy issues

  1. Use the Errors tab at the bottom of the IAM policy editor window (powered by IAM Access Analyzer policy validation) to help identify any placeholders that still need to be replaced. Access Analyzer policy validation reviews the policy and provides findings that include security warnings, errors, general warnings, and suggestions for your policy. To find more information about the different checks, see Access Analyzer policy validation. An example of policy errors caused by placeholders still being present in the policy is shown in Figure 4.
    Figure 4: Errors identified in the generated policy

    Figure 4: Errors identified in the generated policy

  2. Use the Security tab at the bottom of the editor window to review any security warnings, such as passing a wildcard (*) resource with the iam:PassRole permission. Choose the Learn more link beside each warning for information about remediation. An example of a security warning related to PassRole is shown in Figure 5.
    Figure 5: Security warnings identified in the generated policy

    Figure 5: Security warnings identified in the generated policy

Remediate the PassRole With Star In Resource warning by modifying Resource in the iam:PassRole statement to list the Amazon Resource Name (ARN) of any roles that CloudFormation needs to pass to other services. Additionally, add a condition to restrict which service the role can be passed to. For example, to allow passing a role named MyLambdaRole to the Lambda service, the statement would look like the following.

        {
            "Effect": "Allow",
            "Action": [
                "iam:PassRole"
            ],
            "Resource": [
                "arn:aws:iam::123456789012:role/MyLambdaRole"
            ],
            "Condition": {
                "StringEquals": {
                    "iam:PassedToService": [
                        "lambda.amazonaws.com"
                    ]
                }
            }
        }

The generated policy can now be saved as an IAM policy.

To save the generated policy

  1. In the IAM policy editor window, choose Next.
  2. Enter a name for the policy and an optional description.
  3. Review the Summary section with the list of permissions in the policy.
  4. Enter optional tags in the Tags section.
  5. Choose Create and attach policy.

Test this policy by replacing the existing role policy with this newly generated policy. Then create and destroy the stack again so that the necessary permissions are granted. If the stack fails during creation or deletion, follow the steps to generate the policy again and make sure that the correct values are being used for any iam:PassRole statements.

Deploy the CloudFormation role and policy

Now that you have the least-privilege policy created, you can give this policy to the cloud administrator so that they can deploy the policy and CloudFormation service role into production.

To create a CloudFormation template that the cloud administrator can use

  1. Open the IAM console, choose Policies, and then use the search box to search for the policy you created. Select the policy name in the list.
  2. On the Permissions tab, make sure that the {}JSON button is activated. Select the policy document by highlighting from line 1 all the way to the last line in the policy, as shown in Figure 6.
    Figure 6: Highlighting the generated policy

    Figure 6: Highlighting the generated policy

  3. With the policy still highlighted, use your keyboard to copy the policy into the clipboard (Ctrl-C on Linux or Windows, Option-C on macOS).
  4. Paste the permissions policy JSON object into the following CloudFormation template, replacing the <POLICY-JSON-GOES-HERE> marker. Be sure to indent the left-most curly braces of the JSON object so that they are to the right of the PolicyDocument keyword.
    AWSTemplateFormatVersion: '2010-09-09'
    
    Parameters:
      PolicyName:
        Type: String
        Description: The name of the IAM policy that will be created
    
      RoleName:
        Type: String
        Description: The name of the IAM role that will be created
    
    Resources:
      CfnPolicy:
        Type: AWS::IAM::ManagedPolicy
        Properties:
          ManagedPolicyName: !Ref PolicyName
          Path: /
          PolicyDocument: >
            <POLICY-JSON-GOES-HERE>
    
      CfnRole:
        Type: AWS::IAM::Role
        Properties:
          RoleName: !Ref RoleName
          AssumeRolePolicyDocument:
            Version: '2012-10-17'
            Statement:
              - Action:
                - sts:AssumeRole
                Effect: Allow
                Principal:
                  Service:
                    - cloudformation.amazonaws.com
          ManagedPolicyArns:
            - !Ref CfnPolicy
          Path: /

    For example, after pasting the policy, the CfnPolicy resource in the template will look like the following.

    CfnPolicy:
        Type: AWS::IAM::ManagedPolicy
        Properties:
          ManagedPolicyName: !Ref PolicyName
          Path: /
          PolicyDocument: >
            {
                "Version": "2012-10-17",
                "Statement": [
                    {
                        "Effect": "Allow",
                        "Action": "ec2:DescribeNetworkInterfaces",
                        "Resource": [
                            "*"
                        ]
                    },
                    {
                        "Effect": "Allow",
                        "Action": [
                            "iam:AttachRolePolicy",
                            "iam:CreateRole",
                            "iam:DeleteRole",
                            "iam:DetachRolePolicy",
                            "iam:GetRole"
                        ],
                        "Resource": [
                            "arn:aws:iam::123456789012:role/MyLambdaRole"
                        ]
                    },
                    {
                        "Effect": "Allow",
                        "Action": [
                            "lambda:CreateFunction",
                            "lambda:DeleteFunction",
                            "lambda:GetFunction",
                            "lambda:GetFunctionCodeSigningConfig"
                        ],
                        "Resource": [
                            "arn:aws:lambda:*:123456789012:function:MyLambdaFunction"
                        ]
                    },
                    {
                        "Effect": "Allow",
                        "Action": [
                            "iam:PassRole"
                        ],
                        "Resource": [
                            "arn:aws:iam::123456789012:role/MyLambdaRole"
                        ],
                        "Condition": {
                            "StringEquals": {
                                "iam:PassedToService": [
                                    "lambda.amazonaws.com"
                                ]
                            }
                        }
                    }
                ]
            }

  5. Save the CloudFormation template and share it with the cloud administrator. They can use this template to create an IAM role and permissions policy that CloudFormation can use to deploy resources in the production account.

Note: Verify that in addition to having the necessary permissions to work with CloudFormation, your production identity also has permission to perform the iam:PassRole action with CloudFormation for the role that the preceding template creates.

As you continue to develop your stack, you will need to repeat the steps in the Use Access Analyzer to create a permissions policy and Deploy the CloudFormation role and policy sections of this post in order to make sure that the permissions policy remains up-to-date with the permissions required to deploy your stack.

Considerations

If your CloudFormation template uses custom resources that are backed by AWS Lambda, you should also run Access Analyzer on the IAM role that is created for the Lambda function in order to build an appropriate permissions policy for that role.

To generate a permissions policy for a Lambda service role

  1. Launch the stack in your development AWS account to create the Lamba function’s role.
  2. Make a note of the name of the role that was created.
  3. Destroy the stack in your development AWS account.
  4. Follow the instructions from the Use Access Analyzer to generate a fine-grained identity policy and Review the generated policy sections of this post to create the least-privilege policy for the role, substituting the Lambda function’s role name for CloudFormationDevExecRole.
  5. Build the resulting least-privilege policy into the CloudFormation template as the Lambda function’s permission policy.

Conclusion

IAM Access Analyzer helps generate fine-grained identity policies that you can use to grant CloudFormation the permissions it needs to create, update, and delete resources in your stack. By granting CloudFormation only the necessary permissions, you can incorporate the principle of least privilege, developers can deploy their stacks in production using reduced permissions, and cloud administrators can create guardrails for developers in production settings.

For additional information on applying the principle of least privilege to AWS CloudFormation, see How to implement the principle of least privilege with CloudFormation StackSets.

If you have feedback about this blog post, submit comments in the Comments section below. You can also start a new thread on AWS Identity and Access Management re:Post to get answers from the community.

Want more AWS Security news? Follow us on Twitter.

Author

Joel Knight

Joel is a Senior Consultant, Infrastructure Architecture, with AWS and is based in Calgary, Canada. When not wrangling infrastructure-as-code templates, Joel likes to spend time with his family and dabble in home automation.

Mathangi Ramesh

Mathangi Ramesh

Mathangi is the product manager for AWS Identity and Access Management. She enjoys talking to customers and working with data to solve problems. Outside of work, Mathangi is a fitness enthusiast and a Bharatanatyam dancer. She holds an MBA degree from Carnegie Mellon University.

IAM Access Analyzer makes it simpler to author and validate role trust policies

Post Syndicated from Mathangi Ramesh original https://aws.amazon.com/blogs/security/iam-access-analyzer-makes-it-simpler-to-author-and-validate-role-trust-policies/

AWS Identity and Access Management (IAM) Access Analyzer provides many tools to help you set, verify, and refine permissions. One part of IAM Access Analyzer—policy validation—helps you author secure and functional policies that grant the intended permissions. Now, I’m excited to announce that AWS has updated the IAM console experience for role trust policies to make it simpler for you to author and validate the policy that controls who can assume a role. In this post, I’ll describe the new capabilities and show you how to use them as you author a role trust policy in the IAM console.

Overview of changes

A role trust policy is a JSON policy document in which you define the principals that you trust to assume the role. The principals that you can specify in the trust policy include users, roles, accounts, and services. The new IAM console experience provides the following features to help you set the right permissions in the trust policy:

  • An interactive policy editor prompts you to add the right policy elements, such as the principal and the allowed actions, and offers context-specific documentation.
  • As you author the policy, IAM Access Analyzer runs over 100 checks against your policy and highlights issues to fix. This includes new policy checks specific to role trust policies, such as a check to make sure that you’ve formatted your identity provider correctly. These new checks are also available through the IAM Access Analyzer policy validation API.
  • Before saving the policy, you can preview findings for the external access granted by your trust policy. This helps you review external access, such as access granted to a federated identity provider, and confirm that you grant only the intended access when you create the policy. This functionality was previously available through the APIs, but now it’s also available in the IAM console.

In the following sections, I’ll walk you through how to use these new features.

Example scenario

For the walkthrough, consider the following example, which is illustrated in Figure 1. You are a developer for Example Corp., and you are working on a web application. You want to grant the application hosted in one account—the ApplicationHost account—access to data in another account—the BusinessData account. To do this, you can use an IAM role in the BusinessData account to grant temporary access to the application through a role trust policy. You will grant a role in the ApplicationHost account—the PaymentApplication role—to access the BusinessData account through a role—the ApplicationAccess role. In this example, you create the ApplicationAccess role and grant cross-account permissions through the trust policy by using the new IAM console experience that helps you set the right permissions.

Figure 1: Visual explanation of the scenario

Figure 1: Visual explanation of the scenario

Create the role and grant permissions through a role trust policy with the policy editor

In this section, I will show you how to create a role trust policy for the ApplicationAccess role to grant the application access to the data in your account through the policy editor in the IAM console.

To create a role and grant access

  1. In the BusinessData account, open the IAM console, and in the left navigation pane, choose Roles.
  2. Choose Create role, and then select Custom trust policy, as shown in Figure 2.
    Figure 2: Select "Custom trust policy" when creating a role

    Figure 2: Select “Custom trust policy” when creating a role

  3. In the Custom trust policy section, for 1. Add actions for STS, select the actions that you need for your policy. For example, to add the action sts:AssumeRole, choose AssumeRole.
    Figure 3: JSON role trust policy

    Figure 3: JSON role trust policy

  4. For 2. Add a principal, choose Add to add a principal.
  5. In the Add principal box, for Principal type, select IAM roles. This populates the ARN field with the format of the role ARN that you need to add to the policy, as shown in Figure 4.
    Figure 4: Add a principal to your role trust policy

    Figure 4: Add a principal to your role trust policy

  6. Update the role ARN template with the actual account and role information, and then choose Add principal. In our example, the account is ApplicationHost with an AWS account number of 111122223333, and the role is PaymentApplication role. Therefore, the role ARN is arn:aws:iam:: 111122223333: role/PaymentApplication. Figure 5 shows the role trust policy with the action and principal added.
    Figure 5: Sample role trust policy

    Figure 5: Sample role trust policy

  7. (Optional) To add a condition, for 3. Add a condition, choose Add, and then complete the Add condition box according to your needs.

Author secure policies by reviewing policy validation findings

As you author the policy, you can see errors or warnings related to your policy in the policy validation window, which is located below the policy editor in the console. With this launch, policy validation in IAM Access Analyzer includes 13 new checks focused on the trust relationship for the role. The following are a few examples of these checks and how to address them:

  • Role trust policy unsupported wildcard in principal – you can’t use a * in your role trust policy.
  • Invalid federated principal syntax in role trust policy – you need to fix the format of the identity provider.
  • Missing action for condition key – you need to add the right action for a given condition, such as the sts:TagSession when there are session tag conditions.

For a complete list of checks, see Access Analyzer policy check reference.

To review and fix policy validation findings

  1. In the policy validation window, do the following:
    • Choose the Security tab to check if your policy is overly permissive.
    • Choose the Errors tab to review any errors associated with the policy.
    • Choose the Warnings tab to review if aspects of the policy don’t align with AWS best practices.
    • Choose the Suggestions tab to get recommendations on how to improve the quality of your policy.
    Figure 6: Policy validation window in IAM Access Analyzer with a finding for your policy

    Figure 6: Policy validation window in IAM Access Analyzer with a finding for your policy

  2. For each finding, choose Learn more to review the documentation associated with the finding and take steps to fix it. For example, Figure 6 shows the error Mismatched Action For Principal. To fix the error, remove the action sts:AssumeRoleWithWebIdentity.

Preview external access by reviewing cross-account access findings

IAM Access Analyzer also generates findings to help you assess if a policy grants access to external entities. You can review the findings before you create the policy to make sure that the policy grants only intended access. To preview the findings, you create an analyzer and then review the findings.

To preview findings for external access

  1. Below the policy editor, in the Preview external access section, choose Go to Access Analyzer, as shown in Figure 7.

    Note: IAM Access Analyzer is a regional service, and you can create a new analyzer in each AWS Region where you operate. In this situation, IAM Access Analyzer looks for an analyzer in the Region where you landed on the IAM console. If IAM Access Analyzer doesn’t find an analyzer there, it asks you to create an analyzer.

    Figure 7: Preview external access widget without an analyzer

    Figure 7: Preview external access widget without an analyzer

  2. On the Create analyzer page, do the following to create an analyzer:
    • For Name, enter a name for your analyzer.
    • For Zone of trust, select the correct account.
    • Choose Create analyzer.
    Figure 8: Create an analyzer to preview findings

    Figure 8: Create an analyzer to preview findings

  3. After you create the analyzer, navigate back to the role trust policy for your role to review the external access granted by this policy. The following figure shows that external access is granted to PaymentApplication.
    Figure 9: Preview finding

    Figure 9: Preview finding

  4. If the access is intended, you don’t need to take any action. In this example, I want the PaymentApplication role in the ApplicationHost account to assume the role that I’m creating.
  5. If the access is unintended, resolve the finding by updating the role ARN information.
  6. Select Next and grant the required IAM permissions for the role.
  7. Name the role ApplicationAccess, and then choose Save to save the role.

Now the application can use this role to access the BusinessData account.

Conclusion

By using the new IAM console experience for role trust policies, you can confidently author policies that grant the intended access. IAM Access Analyzer helps you in your least-privilege journey by evaluating the policy for potential issues to make it simpler for you to author secure policies. IAM Access Analyzer also helps you preview external access granted through the trust policy to help ensure that the granted access is intended. To learn more about how to preview IAM Access Analyzer cross-account findings, see Preview access in the documentation. To learn more about IAM Access Analyzer policy validation checks, see Access Analyzer policy validation. These features are also available through APIs.

If you have feedback about this post, submit comments in the Comments section below. If you have questions about this post, start a new thread at AWS IAM re:Post or contact AWS Support.

Mathangi Ramesh

Mathangi Ramesh

Mathangi is the product manager for AWS Identity and Access Management. She enjoys talking to customers and working with data to solve problems. Outside of work, Mathangi is a fitness enthusiast and a Bharatanatyam dancer. She holds an MBA degree from Carnegie Mellon University.

AWS Week in Review – October 3, 2022

Post Syndicated from Danilo Poccia original https://aws.amazon.com/blogs/aws/aws-week-in-review-october-3-2022/

This post is part of our Week in Review series. Check back each week for a quick roundup of interesting news and announcements from AWS!

A new week and a new month just started. Curious which were the most significant AWS news from the previous seven days? I got you covered with this post.

Last Week’s Launches
Here are the launches that got my attention last week:

Amazon File Cache – A high performance cache on AWS that accelerates and simplifies demanding cloud bursting and hybrid workflows by giving access to files using a fast and familiar POSIX interface, no matter if the original files live on premises on any file system that can be accessed through NFS v3 or on S3.

Amazon Data Lifecycle Manager – You can now automatically archive Amazon EBS snapshots to save up to 75 percent on storage costs for those EBS snapshots that you intend to retain for more than 90 days and rarely access.

AWS App Runner – You can now build and run web applications and APIs from source code using the new Node.js 16 managed runtime.

AWS Copilot – The CLI for containerized apps adds IAM permission boundaries, support for FIFO SNS/SQS for the Copilot worker-service pattern, and using Amazon CloudFront for low-latency content delivery and fast TLS-termination for public load-balanced web services.

Bottlerocket – The Linux-based operating system purpose-built to run container workloads is now supported by Amazon Inspector. Amazon Inspector can now recommend an update of Bottlerocket if it finds a vulnerability.

Amazon SageMaker Canvas – Now supports mathematical functions and operators for richer data exploration and to understand the relationships between variables in your data.

AWS Compute Optimizer – Now provides cost and performance optimization recommendations for 37 new EC2 instance types, including bare metal instances (m6g.metal) and compute optimized instances (c7g.2xlarge, hpc6a.48xlarge), and new memory metrics for Windows instances.

AWS Budgets – Use a simplified 1-click workflow for common budgeting scenarios with step-by-step tutorials on how to use each template.

Amazon Connect – Now provides an updated flow designer UI that makes it easier and faster to build personalized and automated end-customer experiences, as well as a queue dashboard to view and compare real-time queue performance through time series graphs.

Amazon WorkSpaces – You can now provision Ubuntu desktops and use virtual desktops for new categories of workloads, such as for your developers, engineers, and data scientists.

Amazon WorkSpaces Core – A fully managed infrastructure-only solution for third-party Virtual Desktop Infrastructure (VDI) management software that simplifies VDI migration and combines your current VDI software with the security and reliability of AWS. Read more about it in this Desktop and Application Streaming blog post.

For a full list of AWS announcements, be sure to keep an eye on the What’s New at AWS page.

Other AWS News
A few more blog posts you might have missed:

Introducing new language extensions in AWS CloudFormation – In this Cloud Operations & Migrations blog post, we introduce the new language transform that enhances CloudFormation core language with intrinsic functions that simplify handling JSON strings (Fn::ToJsonString), array lengths (Fn::Length), and update and deletion policies.

Building a GraphQL API with Java and AWS Lambda – This blog shows different options for resolving GraphQL queries using serverless technologies on AWS.

For AWS open-source news and updates, here’s the latest newsletter curated by Ricardo to bring you the most recent updates on open-source projects, posts, events, and more.

Upcoming AWS Events
As usual, there are many opportunities to meet:

AWS Summits– Connect, collaborate, and learn about AWS at these free in-person events: Bogotá (October 4), and Singapore (October 6).

AWS Community Days – AWS Community Day events are community-led conferences to share and learn together. Join us in Amersfoort, Netherlands (on October 3, today), Warsaw, Poland (October 14), and Dresden, Germany (October 19).

That’s all from me for this week. Come back next Monday for another Week in Review!

— Danilo

Amazon Personalize customer outreach on your ecommerce platform

Post Syndicated from Sridhar Chevendra original https://aws.amazon.com/blogs/architecture/amazon-personalize-customer-outreach-on-your-ecommerce-platform/

In the past, brick-and-mortar retailers leveraged native marketing and advertisement channels to engage with consumers. They have promoted their products and services through TV commercials, and magazine and newspaper ads. Many of them have started using social media and digital advertisements. Although marketing approaches are beginning to modernize and expand to digital channels, businesses still depend on expensive marketing agencies and inefficient manual processes to measure campaign effectiveness and understand buyer behavior. The recent pandemic has forced many retailers to take their businesses online. Those who are ready to embrace these changes have embarked on a technological and digital transformation to connect to their customers. As a result, they have begun to see greater business success compared to their peers.

Digitizing a business can be a daunting task, due to lack of expertise and high infrastructure costs. By using Amazon Web Services (AWS), retailers are able to quickly deploy their products and services online with minimal overhead. They don’t have to manage their own infrastructure. With AWS, retailers have no upfront costs, have minimal operational overhead, and have access to enterprise-level capabilities that scale elastically, based on their customers’ demands. Retailers can gain a greater understanding of customers’ shopping behaviors and personal preferences. Then, they are able to conduct effective marketing and advertisement campaigns, and develop and measure customer outreach. This results in increased satisfaction, higher retention, and greater customer loyalty. With AWS you can manage your supply chain and directly influence your bottom line.

Building a personalized shopping experience

Let’s dive into the components involved in building this experience. The first step in a retailer’s digital transformation journey is to create an ecommerce platform for their customers. This platform enables the organization to capture their customers’ actions, also referred to as ‘events’. Some examples of events are clicking on the shopping site to browse product categories, searching for a particular product, adding an item to the shopping cart, and purchasing a product. Each of these events gives the organization information about their customer’s intent, which is invaluable in creating a personalized experience for that customer. For instance, if a customer is browsing the “baby products” category, it indicates their interest in that category even if a purchase is not made. These insights are typically difficult to capture in an in-store experience. Online shopping makes gaining this knowledge much more straightforward and scalable.

The proposed solution outlines the use of AWS services to create a digital experience for a retailer and consumers. The three key areas are: 1) capturing customer interactions, 2) making real-time recommendations using AWS managed Artificial Intelligence/Machine Learning (AI/ML) services, and 3) creating an analytics platform to detect patterns and adjust customer outreach campaigns. Figure 1 illustrates the solution architecture.

Digital shopping experience architecture

Figure 1. Digital shopping experience architecture

For this use case, let’s assume that you are the owner of a local pizzeria, and you manage deliveries through an ecommerce platform like Shopify or WooCommerce. We will walk you through how to best serve your customer with a personalized experience based on their preferences.

The proposed solution consists of the following components:

  1. Data collection
  2. Promotion campaigns
  3. Recommendation engine
  4. Data analytics
  5. Customer reachability

Let’s explore each of these components separately.

Data collection with Amazon Kinesis Data Streams

When a customer uses your web/mobile application to order a pizza, the application captures their activity as click-stream ‘events’. These events provide valuable insights about your customers’ behavior. You can use these insights to understand the trends and browsing pattern of prospects who visited your web/mobile app, and use the data collected for creating promotion campaigns. As your business scales, you’ll need a durable system to preserve these events against system failures, and scale based on unpredictable traffic on your platform.

Amazon Kinesis is a Multi-AZ, managed streaming service that provides resiliency, scalability, and durability to capture an unlimited number of events without any additional operational overhead. Using Kinesis producers (Kinesis Agent, Kinesis Producer Library, and the Kinesis API), you can configure applications to capture your customer activity. You can ingest these events from the frontend, and then publish them to Amazon Kinesis Data Streams.

Let us start by setting up Amazon Kinesis Data Streams to capture the real-time sales transactions from the online channels like a portal or mobile app. For this blog post, we have used the Kaggle’s public data set as a reference. Figure 2 illustrates a snapshot of sample data to build personalized recommendations for a customer.

Sample sales transaction data

Figure 2. Sample sales transaction data

Promotion campaigns with AWS Lambda

One way to increase customer conversion is by offering discounts. When the customer adds a pizza to their cart, you want to make sure they are receiving the best deal. Let’s assume that by adding an additional item, your customer will receive the best possible discount. Just by knowing the total cost of added items to the cart, you can provide these relevant promotions to this customer.

For this scenario, the AWS Lambda service polls the Amazon Kinesis Data Streams to read all the events in the stream. It then matches the events based on your criteria of items in the cart. In turn, these events will be processed by the Lambda function. The Lambda function will read your up-to-date promotions stored in Amazon DynamoDB. As an option, caching recent or most popular promotions will improve your application response time, as well as improve the customer experience on your platform. Amazon DynamoDB DAX is an integrated caching for DynamoDB that caches the most recent or popular promotions or items.

For example, when the customer added the items to their shopping cart, Lambda will send promotion details to them based on the purchase amount. This can be for free shipping or discount of a certain percentage. Figure 3 illustrates the snapshot of sample promotions.

Promotions table in DynamoDB

Figure 3. Promotions table in DynamoDB

Recommendations engine with Amazon Personalize

In addition to sharing these promotions with your customer, you may also want to share the recommended add-ons. In order to understand your customer preferences, you must gather historical datasets to determine patterns and generate relevant recommendations. Since web activity consists of millions of events, this would be a daunting task for humans to review, determine the patterns, and make recommendations. And since user preferences change, you need a system that can use all this volume of data and provide accurate predictions.

Amazon Personalize is a managed AI/ML service that will help you to train an ML model based on datasets. It provides an inference point for real-time recommendations prior to having ML experience. Based on the datasets, Amazon Personalize also provides recipes to generate recommendations. As your customers interact on the ecommerce platform, your frontend application calls Amazon Personalize inference endpoints. It then retrieves a set of personalized recommendations based on your customer preferences.

Here is the sample Python code to display the list of available recommenders, and associated recommendations.

import boto3
import json
client = boto3.client('personalize')

# Connect to the personalize runtime for the customer recommendations

recomm_endpoint = boto3.client('personalize-runtime')
response = recomm_endpoint.get_recommendations(itemId='79323P',
  recommenderArn='arn:aws:personalize:us-east-1::recommender/my-items',
  numResults=5)

print(json.dumps(response['itemList'], indent=2))

[
  {
    "itemId": "79323W"
  },
  {
    "itemId": "79323GR"
  },
  {
    "itemId": "79323LP"
  },
  {
  "itemId": "79323B"
  },
  {
    "itemId": "79323G"
  }
]

You can use Amazon Kinesis Data Firehose to read the data near real time from the Amazon Kinesis Data Streams collected the data from the front-end applications. Then you can store this data in Amazon Simple Storage Service (S3). Amazon S3 is peta-byte scale storage help you scale and acts as a repository and single source of truth. We use S3 data as seed data to build a personalized recommendation engine using Amazon Personalize. As your customers interact on the ecommerce platform, call the Amazon Personalize inference endpoint to make personalized recommendations based on user preferences.

Customer reachability with Amazon Pinpoint

If a customer adds products to their cart but never checks out, you may want to send them a reminder. You can set up an email to suggest they re-order after a period of time after their first order. Or you may want to send them promotions based on their preferences. And as your customers’ behavior changes, you probably want to adapt your messaging accordingly.

Your customer may have a communication preference, such as phone, email, SMS, or in-app notifications. If an order has an issue, you can inform the customer as soon as possible using their preferred method of communication, and perhaps follow it up with a discount.

Amazon Pinpoint is a flexible and scalable outbound and inbound marketing communications service. You can add users to Audience Segments, create reusable content templates integrated with Amazon Personalize, and run scheduled campaigns. With Amazon Pinpoint journeys, you can send action or time-based notifications to your users.

The following workflow shown in Figure 4, illustrates customer communication workflow for promotion. A journey is created for a cohort of college students: a “Free Drink” promotion is offered with a new order. You can send this promotion over email. If the student opens the email, you can immediately send them a push notification reminding them to place an order. But if they didn’t open this email, you could wait three days, and follow up with a text message.

Promotion workflow in Amazon Pinpoint

Figure 4. Promotion workflow in Amazon Pinpoint

Data analytics with Amazon Athena and Amazon QuickSight

To understand the effectiveness of your campaigns, you can use S3 data as a source for Amazon Athena. Athena is an interactive query service that analyzes data in Amazon S3 using standard SQL. Athena is serverless, so there is no infrastructure to manage, and you pay only for the queries that you run.

There are different ways to create visualizations in Amazon QuickSight. For instance, you can use Amazon S3 as a data lake. One option is to import your data into SPICE (Super-fast, Parallel, In-memory Calculation Engine) to provide high performance and concurrency. You can also create a direct connection to the underlying data source. For this use case, we choose to import to SPICE, which provides faster visualization in a production setup. Schedule consistent refreshes to help ensure that dashboards are referring to the most current data.

Once your data is imported to your SPICE, review QuickSight’s visualization dashboard. Here, you’ll be able to choose from a wide variety of charts and tables, while adding interactive features like drill downs and filters.

The process following illustrates how to create a customer outreach strategy using ZIP codes, and allocate budgets to the marketing campaigns accordingly. First, we use this sample SQL command that we ran in Athena to query for top 10 pizza providers. The results are shown in Figure 5.

SELECT name, count(*) as total_count FROM "analyticsdemodb"."fooddatauswest2"
group by name
order by total_count desc
limit 10

Athena query results for top 10 pizza providers

Figure 5. Athena query results for top 10 pizza providers

Second, here is the sample SQL command that we ran in Athena to find Total pizza counts by postal code (ZIP code). Figure 6 shows a visualization to help create customer outreach strategy per ZIP codes and budget the marketing campaigns accordingly.

SELECT postalcode, count(*) as total_count FROM "analyticsdemodb"."fooddatauswest2"
where postalcode is not null
group by postalcode
order by total_count desc limit 50;

QuickSight visualization showing pizza orders by zip codes

Figure 6. QuickSight visualization showing pizza orders by zip codes

Conclusion

AWS enables you to build an ecommerce platform and scale your existing business with minimal operational overhead and no upfront costs. You can augment your ecommerce platform by building personalized recommendations and effective marketing campaigns based on your customer needs. The solution approach provided in the blog will help organizations build re-usable architecture pattern and personalization using AWS managed services.