Tag Archives: AWS Lambda

Enabling load-balancing of non-HTTP(s) traffic on AWS Wavelength

Post Syndicated from Sheila Busser original https://aws.amazon.com/blogs/compute/enabling-load-balancing-of-non-https-traffic-on-aws-wavelength/

This blog post is written by Jack Chen, Telco Solutions Architect, and Robert Belson, Developer Advocate.

AWS Wavelength embeds AWS compute and storage services within 5G networks, providing mobile edge computing infrastructure for developing, deploying, and scaling ultra-low-latency applications. AWS recently introduced support for Application Load Balancer (ALB) in AWS Wavelength zones. Although ALB addresses Layer-7 load balancing use cases, some low latency applications that get deployed in AWS Wavelength Zones rely on UDP-based protocols, such as QUIC, WebRTC, and SRT, which can’t be load-balanced by Layer-7 Load Balancers. In this post, we’ll review popular load-balancing patterns on AWS Wavelength, including a proposed architecture demonstrating how DNS-based load balancing can address customer requirements for load-balancing non-HTTP(s) traffic across multiple Amazon Elastic Compute Cloud (Amazon EC2) instances. This solution also builds a foundation for automatic scale-up and scale-down capabilities for workloads running in an AWS Wavelength Zone.

Load balancing use cases in AWS Wavelength

In the AWS Regions, customers looking to deploy highly-available edge applications often consider Amazon Elastic Load Balancing (Amazon ELB) as an approach to automatically distribute incoming application traffic across multiple targets in one or more Availability Zones (AZs). However, at the time of this publication, AWS-managed Network Load Balancer (NLB) isn’t supported in AWS Wavelength Zones and ALB is being rolled out to all AWS Wavelength Zones globally. As a result, this post will seek to document general architectural guidance for load balancing solutions on AWS Wavelength.

As one of the most prominent AWS Wavelength use cases, highly-immersive video streaming over UDP using protocols such as WebRTC at scale often require a load balancing solution to accommodate surges in traffic, either due to live events or general customer access patterns. These use cases, relying on Layer-4 traffic, can’t be load-balanced from a Layer-7 ALB. Instead, Layer-4 load balancing is needed.

To date, two infrastructure deployments involving Layer-4 load balancers are most often seen:

  • Amazon EC2-based deployments: Often the environment of choice for earlier-stage enterprises and ISVs, a fleet of EC2 instances will leverage a load balancer for high-throughput use cases, such as video streaming, data analytics, or Industrial IoT (IIoT) applications
  • Amazon EKS deployments: Customers looking to optimize performance and cost efficiency of their infrastructure can leverage containerized deployments at the edge to manage their AWS Wavelength Zone applications. In turn, external load balancers could be configured to point to exposed services via NodePort objects. Furthermore, a more popular choice might be to leverage the AWS Load Balancer Controller to provision an ALB when you create a Kubernetes Ingress.

Regardless of deployment type, the following design constraints must be considered:

  • Target registration: For load balancing solutions not managed by AWS, seamless solutions to load balancer target registration must be managed by the customer. As one potential solution, visit a recent HAProxyConf presentation, Practical Advice for Load Balancing at the Network Edge.
  • Edge Discovery: Although DNS records can be populated into Amazon Route 53 for each carrier-facing endpoint, DNS won’t deterministically route mobile clients to the most optimal mobile endpoint. When available, edge discovery services are required to most effectively route mobile clients to the lowest latency endpoint.
  • Cross-zone load balancing: Given the hub-and-spoke design of AWS Wavelength, customer-managed load balancers should proxy traffic only to that AWS Wavelength Zone.

Solution overview – Amazon EC2

In this solution, we’ll present a solution for a highly-available load balancing solution in a single AWS Wavelength Zone for an Amazon EC2-based deployment. In a separate post, we’ll cover the needed configurations for the AWS Load Balancer Controller in AWS Wavelength for Amazon Elastic Kubernetes Service (Amazon EKS) clusters.

The proposed solution introduces DNS-based load balancing, a technique to abstract away the complexity of intelligent load-balancing software and allow your Domain Name System (DNS) resolvers to distribute traffic (equally, or in a weighted distribution) to your set of endpoints.

Our solution leverages the weighted routing policy in Route 53 to resolve inbound DNS queries to multiple EC2 instances running within an AWS Wavelength zone. As EC2 instances for a given workload get deployed in an AWS Wavelength zone, Carrier IP addresses can be assigned to the network interfaces at launch.

Through this solution, Carrier IP addresses attached to AWS Wavelength instances are automatically added as DNS records for the customer-provided public hosted zone.

To determine how Route 53 responds to queries, given an arbitrary number of records of a public hosted zone, Route53 offers numerous routing policies:

Simple routing policy – In the event that you must route traffic to a single resource in an AWS Wavelength Zone, simple routing can be used. A single record can contain multiple IP addresses, but Route 53 returns the values in a random order to the client.

Weighted routing policy – To route traffic more deterministically using a set of proportions that you specify, this policy can be selected. For example, if you would like Carrier IP A to receive 50% of the traffic and Carrier IP B to receive 50% of the traffic, we’ll create two individual A records (one for each Carrier IP) with a weight of 50 and 50, respectively. Learn more about Route 53 routing policies by visiting the Route 53 Developer Guide.

The proposed solution leverages weighted routing policy in Route 53 DNS to route traffic to multiple EC2 instances running within an AWS Wavelength zone.

Reference architecture

The following diagram illustrates the load-balancing component of the solution, where EC2 instances in an AWS Wavelength zone are assigned Carrier IP addresses. A weighted DNS record for a host (e.g., www.example.com) is updated with Carrier IP addresses.

DNS-based load balancing

When a device makes a DNS query, it will be returned to one of the Carrier IP addresses associated with the given domain name. With a large number of devices, we expect a fair distribution of load across all EC2 instances in the resource pool. Given the highly ephemeral mobile edge environments, it’s likely that Carrier IPs could frequently be allocated to accommodate a workload and released shortly thereafter. However, this unpredictable behavior could yield stale DNS records, resulting in a “blackhole” – routes to endpoints that no longer exist.

Time-To-Live (TTL) is a DNS attribute that specifies the amount of time, in seconds, that you want DNS recursive resolvers to cache information about this record.

In our example, we should set to 30 seconds to force DNS resolvers to retrieve the latest records from the authoritative nameservers and minimize stale DNS responses. However, a lower TTL has a direct impact on cost, as a result of increased number of calls from recursive resolvers to Route53 to constantly retrieve the latest records.

The core components of the solution are as follows:

Alongside the services above in the AWS Wavelength Zone, the following services are also leveraged in the AWS Region:

  • AWS Lambda – a serverless event-driven function that makes API calls to the Route 53 service to update DNS records.
  • Amazon EventBridge– a serverless event bus that reacts to EC2 instance lifecycle events and invokes the Lambda function to make DNS updates.
  • Route 53– cloud DNS service with a domain record pointing to AWS Wavelength-hosted resources.

In this post, we intentionally leave the specific load balancing software solution up to the customer. Customers can leverage various popular load balancers available on the AWS Marketplace, such as HAProxy and NGINX. To focus our solution on the auto-registration of DNS records to create functional load balancing, this solution is designed to support stateless workloads only. To support stateful workloads, sticky sessions – a process in which routes requests to the same target in a target group – must be configured by the underlying load balancer solution and are outside of the scope of what DNS can provide natively.

Automation overview

Using the aforementioned components, we can implement the following workflow automation:
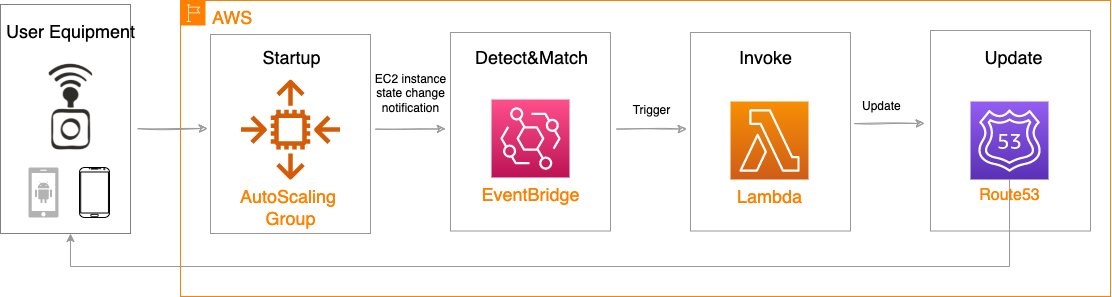
Event-driven Auto Scaling Workflow

Amazon CloudWatch alarm can trigger the Auto Scaling group Scale out or Scale in event by adding or removing EC2 instances. Eventbridge will detect the EC2 instance state change event and invoke the Lambda function. This function will update the DNS record in Route53 by either adding (scale out) or deleting (scale in) a weighted A record associated with the EC2 instance changing state.

Configuration of the automatic auto scaling policy is out of the scope of this post. There are many auto scaling triggers that you can consider using, based on predefined and custom metrics such as memory utilization. For the demo purposes, we will be leveraging manual auto scaling.

In addition to the core components that were already described, our solution also utilizes AWS Identity and Access Management (IAM) policies and CloudWatch. Both services are key components to building AWS Well-Architected solutions on AWS. We also use AWS Systems Manager Parameter Store to keep track of user input parameters. The deployment of the solution is automated via AWS CloudFormation templates. The Lambda function provided should be uploaded to an AWS Simple Storage Service (Amazon S3) bucket.

Amazon Virtual Private Cloud (Amazon VPC), subnets, Carrier Gateway, and Route Tables are foundational building blocks for AWS-based networking infrastructure. In our deployment, we are creating a new VPC, one subnet in an AWS Wavelength zone of your choice, a Carrier Gateway, and updating the route table for this subnet to point the default route to the Carrier Gateway.

Wavelength VPC architecture.

Deployment prerequisites

The following are prerequisites to deploy the described solution in your account:

  • Access to an AWS Wavelength zone. If your account is not allow-listed to use AWS Wavelength zones, then opt-in to AWS Wavelength zones here.
  • Public DNS Hosted Zone hosted in Route 53. You must have access to a registered public domain to deploy this solution. The zone for this domain should be hosted in the same account where you plan to deploy AWS Wavelength workloads.
    If you don’t have a public domain, then you can register a new one. Note that there will be a service charge for the domain registration.
  • Amazon S3 bucket. For the Lambda function that updates DNS records in Route 53, store the source code as a .zip file in an Amazon S3 bucket.
  • Amazon EC2 Key pair. You can use an existing Key pair for the deployment. If you don’t have a KeyPair in the region where you plan to deploy this solution, then create one by following these instructions.
  • 4G or 5G-connected device. Although the infrastructure can be deployed independent of the underlying connected devices, testing the connectivity will require a mobile device on one of the Wavelength partner’s networks. View the complete list of Telecommunications providers and Wavelength Zone locations to learn more.

Conclusion

In this post, we demonstrated how to implement DNS-based load balancing for workloads running in an AWS Wavelength zone. We deployed the solution that used the EventBridge Rule and the Lambda function to update DNS records hosted by Route53. If you want to learn more about AWS Wavelength, subscribe to AWS Compute Blog channel here.

Genomics workflows, Part 3: automated workflow manager

Post Syndicated from Rostislav Markov original https://aws.amazon.com/blogs/architecture/genomics-workflows-part-3-automated-workflow-manager/

Genomics workflows are high-performance computing workloads. Life-science research teams make use of various genomics workflows. With each invocation, they specify custom sets of data and processing steps, and translate them into commands. Furthermore, team members stay to monitor progress and troubleshoot errors, which can be cumbersome, non-differentiated, administrative work.

In Part 3 of this series, we describe the architecture of a workflow manager that simplifies the administration of bioinformatics data pipelines. The workflow manager dynamically generates the launch commands based on user input and keeps track of the workflow status. This workflow manager can be adapted to many scientific workloads—effectively becoming a bring-your-own-workflow-manager for each project.

Use case

In Part 1, we demonstrated how life-science research teams can use Amazon Web Services to remove the heavy lifting of conducting genomic studies, and our design pattern was built on AWS Step Functions with AWS Batch. We mentioned that we’ve worked with life-science research teams to put failed job logs onto Amazon DynamoDB. Some teams prefer to use command-line interface tools, such as the AWS Command Line Interface; other interfaces, such as PyBDA with Apache Spark, or CWL experimental grammar in combination with the Amazon Simple Storage Service (Amazon S3) API, are also used when access to the AWS Management Console is prohibited. In our use case, scientists used the console to easily update table items, plus initiate retry via DynamoDB streams.

In this blog post, we extend this idea to a new frontend layer in our design pattern. This layer automates command generation and monitors the invocations of a variety of workflows—becoming a workflow manager. Life-science research teams use multiple workflows for different datasets and use cases, each with different syntax and commands. The workflow manager we create removes the administrative burden of formulating workflow-specific commands and tracking their launches.

Solution overview

We allow scientists to upload their requested workflow configuration as objects in Amazon S3. We use S3 Event Notifications on PUT requests to invoke an AWS Lambda function. The function parses the uploaded S3 object and registers the new launch request as a DynamoDB item using the PutItem operation. Each item corresponds with a distinct launch request, stored as key-value pair. Item values store the:

  • S3 data path containing genomic datasets
  • Workflow endpoint
  • Preferred compute service (optional)

Another Lambda function monitors for change data captures in the DynamoDB Stream (Figure 1). With each PutItem operation, the Lambda function prepares a workflow invocation, which includes translating the user input into the syntax and launch commands of the respective workflow.

In the case of Snakemake (discussed in Part 2), the function creates a Snakefile that declares processing steps and commands. The function spins up an AWS Fargate task that builds the computational tasks, distributes them with AWS Batch, and monitors for completion. An AWS Step Functions state machine orchestrates job processing, for example, initiated by Tibanna.

Amazon CloudWatch provides a consolidated overview of performance metrics, like time elapsed, failed jobs, and error types. We store log data, including status updates and errors, in Amazon CloudWatch Logs. A third Lambda function parses those logs and updates the status of each workflow launch request in the corresponding DynamoDB item (Figure 1).

Workflow manager for genomics workflows

Figure 1. Workflow manager for genomics workflows

Implementation considerations

In this section, we describe some of our past implementation considerations.

Register new workflow requests

DynamoDB items are key-value pairs. We use launch IDs as key, and the value includes the workflow type, compute engine, S3 data path, the S3 object path to the user-defined configuration file and workflow status. Our Lambda function parses the configuration file and generates all commands plus ancillary artifacts, such as Snakefiles.

Launch workflows

Launch requests are picked by a Lambda function from the DynamoDB stream. The function has the following required parameters:

  • Launch ID: unique identifier of each workflow launch request
  • Configuration file: the Amazon S3 path to the configuration sheet with launch details (in s3://bucket/object format)
  • Compute service (optional): our workflow manager allows to select a particular service on which to run computational tasks, such as Amazon Elastic Compute Cloud (Amazon EC2) or AWS ParallelCluster with Slurm Workload Manager. The default is the pre-defined compute engine.

These points assume that the configuration sheet is already uploaded into an accessible location in an S3 bucket. This will issue a new Snakemake Fargate launch task. If either of the parameters is not provided or access fails, the workflow manager returns MissingRequiredParametersError.

Log workflow launches

Logs are written to CloudWatch Logs automatically. We write the location of the CloudWatch log group and log stream into the DynamoDB table. To send logs to Amazon CloudWatch, specify the awslogs driver in the Fargate task definition settings in your provisioning template.

Our Lambda function writes Fargate task launch logs from CloudWatch Logs to our DynamoDB table. For example, OutOfMemoryError can occur if the process utilizes more memory than the container is allocated.

AWS Batch job state logs are written to the following log group in CloudWatch Logs: /aws/batch/job. Our Lambda function writes status updates to the DynamoDB table. AWS Batch jobs may encounter errors, such as being stuck in RUNNABLE state.

Manage state transitions

We manage the status of each job in DynamoDB. Whenever a Fargate task changes state, it is picked up by a CloudWatch rule that references the Fargate compute cluster. This CloudWatch rule invokes a notifier Lambda function that updates the workflow status in DynamoDB.

Conclusion

In this blog post, we demonstrated how life-science research teams can simplify genomic analysis across an array of workflows. These workflows usually have their own command syntax and workflow management system, such as Snakemake. The presented workflow manager removes the administrative burden of preparing and formulating workflow launches, increasing reliability.

The pattern is broadly reusable with any scientific workflow and related high-performance computing systems. The workflow manager provides persistence to enable historical analysis and comparison, which enables us to automatically benchmark workflow launches for cost and performance.

Stay tuned for Part 4 of this series, in which we explore how to enable our workflows to process archival data stored in Amazon Simple Storage Service Glacier storage classes.

Related information

Organize your AWS Serverless code to prevent merge conflicts

Post Syndicated from Mark Curtis original https://aws.amazon.com/blogs/devops/organize-your-aws-serverless-code-to-prevent-merge-conflicts/

How do you prevent the most common merge conflicts when your team is working on a Serverless application? How do you make sure that your team stays productive and avoids large merge issues while trying to update the same crucial files simultaneously? –The answer to both questions is code organization! You can use cfn-include and swagger-cli to organize, collaborate, and maintain a large serverless application as well as support a large or decentralized development team.

Real life inspiration

WRAP Technologies Inc. (WRAP) creates advanced technologies for the protection and security of public safety. Their WRAP Reality product allows law enforcement agencies to train their officers using virtual reality-based scenarios.

Too many cooks in the kitchen

When multiple developers collaborate on a serverless architecture built with AWS CloudFormation, and its extensions such as the AWS Serverless Application Model (SAM), the nature of specifying resources in both the template.yaml and the optional OpenAPI.yaml specification for Amazon API Gateway leads to merge conflicts, such as the one demonstrated in the following figure  where two developers are adding different API endpoints at the same time. These conflicts detract from the developer’s time and agility. Furthermore, navigating and maintaining the long template files required for a larger serverless architecture slows development  as the developer scans large files to find a particular resource definition.

Figure 1. The frustrating merge conflicts.

Figure 1. The frustrating merge conflicts.

By refactoring and organizing the CloudFormation and OpenAPI files, your development team can realize several benefits:

  • Improve developer efficiency by decomposing large, hard-to-manage files into a series of well-organized and single-purpose files.
  • Enhance developer productivity by allowing each developer to have ownership of their own code, thereby reducing the need to coordinate merges with teammates.
  • Eliminate potential merge issues for files that generate the most conflicts during the development of a typical Serverless API application.

Rapid development

WRAP partnered with AWS to develop and host the backend for their new officer training management platform. This entirely new platform was developed, completed, and available for use in a matter of months. Moreover, it’s a collaboration of developers spread across multiple teams worldwide, all contributing to the same code base. By instituting the norms and techniques of this post, WRAP created a large and maintainable serverless application with minimal developer code collisions.

Development of the WRAP Reality training management system was accomplished using CloudFormation for defining Infrastructure as Code (IaC), and an Amazon API Gateway OpenAPI specification for defining API contracts. The development team for the WRAP Reality training management service leveraged agile development for expediency, including the GitHub Flow branching strategy. However, since project contributors were not co-located, several considerations were put in place to make sure of consistency and speed of code development:

  • The API specifications and contracts were defined in OpenAPI (Swagger) specifications early in the development process, clearly defining the project structure up front, and allowing developers to independently build infrastructure components.
  • The two code assets central to the entire project – the CloudFormation template and the OpenAPI Specification – were decomposed into small, easily manageable components. This enabled components to be organized in a way that enhanced development productivity and practically eliminated the inevitable merge conflicts that come with large source code files that are being modified on a daily basis.

The development process was accelerated by utilizing OpenAPI integrations with AWS Services, as well as techniques for managing the OpenAPI specification and Cloudformation Template files.

Sample project

To demonstrate these techniques, we’ll explore the following sample project comprised of API endpoints for “widget” management, available on GitHub. This project provides the following end points:

  • /widget PUT: Creation of a new widget
  • /widget GET: Retrieval of a new widget
  • /reports/color GET: Retrieval of a set of widgets based on the widget color
  • /reports/filterpage GET: Retrieval of widgets based on specified filters

The overall architecture of the application is shown in the following diagram:

Figure 2. Architecture Diagram

Figure 2. Architecture Diagram

The application comprises:

  • Amazon API Gateway is a fully-managed service that makes it easy for developers to create, publish, maintain, monitor, and secure APIs at any scale. In this example, API Gateway serves as the web service for the API endpoints. The mapping of data to and from the API endpoints to the Lambda functions is formally defined by an OpenAPI specification file.
  • AWS Lambda is a serverless compute service that lets you run code without provisioning or managing servers, creating workload-aware cluster scaling logic, maintaining event integrations, or managing runtimes. In this example, four Lambda functions are used to service each of the four API calls.
  • Amazon DynamoDB is a key-value and document database that delivers single-digit millisecond performance at any scale. DynamoDB is used as a persistent data store for widgets and associated properties.

OpenAPI and AWS service integration

When using API Gateway, developers have the option of using proxy Lambda integrations, or formally defining the API interface in an OpenAPI yaml file. The OpenAPI specification can be leveraged to document the API prior to development, and the example/mock features of the OpenAPI specification facilitates concurrent development by quickly establishing a working infrastructure to build upon. Furthermore, API documentation can be automatically generated from the OpenAPI specification.

As the number of endpoints increases, the OpenAPI specification file can grow in size, reaching thousands of lines of code that must be updated and maintained regularly by multiple developers. To aid in management and usability, the OpenAPI file can be decomposed into separate files for endpoints, responses, fields, and schemas.

Start with a “skeleton” file as an entry point for the OpenAPI definition, and then add a separate file for the definition of each endpoint or construct. For example, the sample project entry point is api/apiSkeleton.yaml, which contains the global definitions and effectively defines a simple list of endpoints and the reference ($ref) file path to each endpoint’s definition.

The application comprises:

/reports/color:
    $ref: './paths/reports/reportsColor.yaml'

  /reports/filterpage:
    $ref: './paths/reports/reportsFilterPage.yaml'

Diving into a file referenced by an endpoint, we see that it contains all of the specification details for that endpoint. Looking at the reportsColor.yaml file reveals the full endpoint specification for /reports/color:

get:
  description: Get widgets by color
  parameters:
    - in: path
      $ref: '../../requestParameters/color.yaml'
  responses:
    200:
      description: Get All the Widgets of a color
      content:
        application/json:
          schema:
            $ref: '../../schemas/widgetList.yaml'
    . . .

In turn, this endpoint specification can include further references to yaml files defining common parameters, schemas, and even full gateway responses. For example, color.yaml defines the color path variable:

  type: string
    description: "The widget's color"
    example: "Red"

To paraphrase a common catch phrase, “With a great many files, comes a great responsibility for organization.” To this end, we offer the following organizational structure as a start. Place all of the related API specifications in an “api” subfolder of your project. Have child subfolders for field, metadata, and gateway response definition files. Then, create child subfolder trees for each branch of your endpoints that mirror the endpoint paths. This will result in a highly-organized directory structure, as seen in the sample project:

├── api
│   ├── apiSkeleton.yaml
│   ├── fields
│   │   ├── color.yaml
│   │   ├── metadata
│   │   │   ├── count.yaml
│   │   │   ├── message.yaml
│   │   └── widgetname.yaml
│   ├── gatewayResponses
│   │   ├── error.yaml
│   │   └── notFound.yaml
│   ├── paths
│   │   ├── reports
│   │   │   ├── reportsColor.yaml
│   │   │   └── reportsFilterPage.yaml
│   │   └── widget
│   │       ├── widgetPut.yaml
│   │       └── widgetWidgetnameGet.yaml

We still need a consolidated single OpenAPI file to provide to CloudFormation during deployment to AWS. Therefore, the multiple files are combined and validated using the swagger-cli bundle command, resulting in a single file for deployment. The bundle command must be executed before a CloudFormation build. This command can also be included as a shortcut in the Makefile as the “buildOpenApi” command:

swagger-cli bundle -o api/api.yaml --dereference --t yaml  api/apiSkeleton.yaml

or

make buildOpenApi

Once compiled, api/api.yaml is then used normally for API Gateway integrations and as a Postman  API Collection import. As api/api.yaml is dynamically compiled, it’s included in .gitignore and not checked in to AWS CodeCommit.

cfn-include and nested stacks

The CloudFormation template that defines the infrastructure for even a simple service can grow to considerable length, perhaps thousands of lines. This presents challenges from a support and continued development perspective, as specific code locations become difficult to find and merge conflicts become commonplace.

CloudFormation Nested Stacks are a method of breaking a large CloudFormation template into separate templates. When there are clear delineations between groups of resources in a stack breaking it into separate nested stacks makes sense. There is also a 500 resource limit in a single CloudFormation stack and in order to go above that nested or separate stacks are necessary. Depending on the complexity of the architecture and frequency of updates however, the Nested Stacks can also become large. Furthermore, in a serverless architecture, the logical separation of architecture layers into separate stacks may not be direct, for example when a Lambda function is triggered by an event sent to an EventBridge event bus, then that Lambda function sends a different event back to the same event bus.

In these cases, CloudFormation templates can be decomposed to further leverage cfn-include . With this technique, the top-level CloudFormation template becomes a skeleton file which contains the stack parameters, global specifications, a list of resource names without properties, and the outputs. The properties of each resource are contained in separate files, referenced by an ‘include’ directive.
CloudFormation template organization

To organize your CloudFormation template, deconstruct the template into one-file-per-resource, with one main “skeleton” file as the main entry point. This skeleton file contains the full parameters, global section, conditions, and output specification. The resources are specified by resource name in this skeleton file, and then an ‘include’ directive points to the file that contains the body of the resource declaration. See the following example of the main skeleton file with two resources:

AWSTemplateFormatVersion: '2010-09-09'
Transform: AWS::Serverless-2016-10-31
Description: >
  Widget API Service
Globals:
  Function:
    Handler: app.lambda_handler
    Runtime: python3.8
Resources:

    WidgetApi:
        !Include ./resources/apigw/widgetApiGW.yaml

    WidgetDdbTable:
        !Include ./resources/dynamodb/widgetDdbTable.yaml

Then, the resource files contain the properties of that specific resource. For example, widgetApiGW.yaml defines an API Gateway:

Type: AWS::Serverless::Api
    Properties:
      DefinitionBody:
        Fn::Transform:
          Name: AWS::Include
          Parameters:
            Location: api/api.yaml
      EndpointConfiguration:
        Type: REGIONAL
      StageName: prod
      TracingEnabled: true

This approach has the benefit of breaking the CloudFormation template into multiple small files, while still maintaining a top-level holistic view. The resource definitions, which normally comprise the majority of the content and can cause merge conflicts, are moved out of the main template.

For organization, you can create a directory in your project to contain the CloudFormation scripts. This directory also contains the entry-point skeleton file. Create further sub-folders for resources, and then further folders by resource type and architecture. We found that placing applicable AWS Identity and Access Management (IAM) role resource definitions in the same folder with the applied resource facilitated easier navigation. For example:

├── cloudformation
│   ├── resources
│   │   ├── apigw
│   │   │   └── widgetApiGW.yaml
│   │   ├── dynamodb
│   │   │   └── widgetDdbTable.yaml
│   │   └── lambda
│   │       ├── layers
│   │       │   └── lambdaDDBEnv.yaml
│   │       ├── reports
│   │       │   ├── reportsColorLambda.yaml
│   │       │   └── reportsColorLambdaRole.yaml
│   │       └── widget
│   │           ├── widgetGetLambda.yaml
│   │           └── widgetGetLambdaRole.yaml
│   └── templateSkeleton.yaml

The files must be reconstituted to a single template.yaml for CloudFormation build and deployment. This is accomplished with the cfn-include command. A convenience command can optionally be included in the Makefile.

cfn-include --yaml  cloudFormation/templateSkeleton.yaml > template.yaml

or

make buildTemplate

As the final template.yaml file is dynamically compiled, it’s included in .gitignore and not checked in to CodeCommit.

Conclusion

This post demonstrates techniques used by WRAP and AWS to rapidly develop and maintain key files in an Serverless architecture. The techniques discussed in this post allowed the WRAP and AWS team to do the following:

  • Improve developer efficiency by decomposing large, hard-to-manage files into a series of well-organized and single purpose files.
  • Enhance developer productivity by allowing each developer to have ownership of their own piece of the code without having to coordinate with teammates.
  • Eliminate potential merge issues on the files that typically generate the most conflicts during the development of a typical Serverless API application.

Applying these techniques was one of the key factors in the rapid development of the WRAP Reality training framework.

About the Authors:

 Tom Romano

Tom Romano is a Solutions Architect from Tampa, FL. Tom is a member the Service Creation team for the World Wide Public Sector, who assists GovTech and EdTech customers as they create new solutions that are cloud-native, event-driven, and serverless. He is an enthusiastic Python programmer for both application development and data analytics. In his free time, Tom flies remote control model airplanes and enjoys vacationing around Florida.

Robert Maefs

Robert Maefs is a lead technologist currently working with Wrap, Inc. developing innovative Virtual Reality training simulations for law enforcement and corrections. He is a repeat entrepreneur with expertise bringing mature technologies to under-served industries. In his personal life, Robert nerds out with board games and 3D printing.

Mark Curtis

Mark Curtis is a Senior Solutions Architect at AWS. At AWS he helps EdTech and GovTech customers architect and modernize their applications using cloud native serverless services. Prior to joining AWS, he spent 18 years developing scalable applications for both EdTech and Government customers.

Juan Peredo

Juan Peredo is a Cloud Application Architect at AWS Professional Services. He enjoys working with customers to design, migrate, and optimize cloud native applications. He is a problem solver at heart who likes using emerging technologies to solve interesting problems.

Configuration driven dynamic multi-account CI/CD solution on AWS

Post Syndicated from Anshul Saxena original https://aws.amazon.com/blogs/devops/configuration-driven-dynamic-multi-account-ci-cd-solution-on-aws/

Many organizations require durable automated code delivery for their applications. They leverage multi-account continuous integration/continuous deployment (CI/CD) pipelines to deploy code and run automated tests in multiple environments before deploying to Production. In cases where the testing strategy is release specific, you must update the pipeline before every release. Traditional pipeline stages are predefined and static in nature, and once the pipeline stages are defined it’s hard to update them. In this post, we present a configuration driven dynamic CI/CD solution per repository. The pipeline state is maintained and governed by configurations stored in Amazon DynamoDB. This gives you the advantage of automatically customizing the pipeline for every release based on the testing requirements.

By following this post, you will set up a dynamic multi-account CI/CD solution. Your pipeline will deploy and test a sample pet store API application. Refer to Automating your API testing with AWS CodeBuild, AWS CodePipeline, and Postman for more details on this application. New code deployments will be delivered with custom pipeline stages based on the pipeline configuration that you create. This solution uses services such as AWS Cloud Development Kit (AWS CDK), AWS CloudFormation, Amazon DynamoDB, AWS Lambda, and AWS Step Functions.

Solution overview

The following diagram illustrates the solution architecture:

The image represents the solution workflow, highlighting the integration of the AWS components involved.

Figure 1: Architecture Diagram

  1. Users insert/update/delete entry in the DynamoDB table.
  2. The Step Function Trigger Lambda is invoked on all modifications.
  3. The Step Function Trigger Lambda evaluates the incoming event and does the following:
    1. On insert and update, triggers the Step Function.
    2. On delete, finds the appropriate CloudFormation stack and deletes it.
  4. Steps in the Step Function are as follows:
    1. Collect Information (Pass State) – Filters the relevant information from the event, such as repositoryName and referenceName.
    2. Get Mapping Information (Backed by CodeCommit event filter Lambda) – Retrieves the mapping information from the Pipeline config stored in the DynamoDB.
    3. Deployment Configuration Exist? (Choice State) – If the StatusCode == 200, then the DynamoDB entry is found, and Initiate CloudFormation Stack step is invoked, or else StepFunction exits with Successful.
    4. Initiate CloudFormation Stack (Backed by stack create Lambda) – Constructs the CloudFormation parameters and creates/updates the dynamic pipeline based on the configuration stored in the DynamoDB via CloudFormation.

Code deliverables

The code deliverables include the following:

  1. AWS CDK app – The AWS CDK app contains the code for all the Lambdas, Step Functions, and CloudFormation templates.
  2. sample-application-repo – This directory contains the sample application repository used for deployment.
  3. automated-tests-repo– This directory contains the sample automated tests repository for testing the sample repo.

Deploying the CI/CD solution

  1. Clone this repository to your local machine.
  2. Follow the README to deploy the solution to your main CI/CD account. Upon successful deployment, the following resources should be created in the CI/CD account:
    1. A DynamoDB table
    2. Step Function
    3. Lambda Functions
  3. Navigate to the Amazon Simple Storage Service (Amazon S3) console in your main CI/CD account and search for a bucket with the name: cloudformation-template-bucket-<AWS_ACCOUNT_ID>. You should see two CloudFormation templates (templates/codepipeline.yaml and templates/childaccount.yaml) uploaded to this bucket.
  4. Run the childaccount.yaml in every target CI/CD account (Alpha, Beta, Gamma, and Prod) by going to the CloudFormation Console. Provide the main CI/CD account number as the “CentralAwsAccountId” parameter, and execute.
  5. Upon successful creation of Stack, two roles will be created in the Child Accounts:
    1. ChildAccountFormationRole
    2. ChildAccountDeployerRole

Pipeline configuration

Make an entry into devops-pipeline-table-info for the Repository name and branch combination. A sample entry can be found in sample-entry.json.

The pipeline is highly configurable, and everything can be configured through the DynamoDB entry.

The following are the top-level keys:

RepoName: Name of the repository for which AWS CodePipeline is configured.
RepoTag: Name of the branch used in CodePipeline.
BuildImage: Build image used for application AWS CodeBuild project.
BuildSpecFile: Buildspec file used in the application CodeBuild project.
DeploymentConfigurations: This key holds the deployment configurations for the pipeline. Under this key are the environment specific configurations. In our case, we’ve named our environments Alpha, Beta, Gamma, and Prod. You can configure to any name you like, but make sure that the entries in json are the same as in the codepipeline.yaml CloudFormation template. This is because there is a 1:1 mapping between them. Sub-level keys under DeploymentConfigurations are as follows:

  • EnvironmentName. This is the top-level key for environment specific configuration. In our case, it’s Alpha, Beta, Gamma, and Prod. Sub level keys under this are:
    • <Env>AwsAccountId: AWS account ID of the target environment.
    • Deploy<Env>: A key specifying whether or not the artifact should be deployed to this environment. Based on its value, the CodePipeline will have a deployment stage to this environment.
    • ManualApproval<Env>: Key representing whether or not manual approval is required before deployment. Enter your email or set to false.
    • Tests: Once again, this is a top-level key with sub-level keys. This key holds the test related information to be run on specific environments. Each test based on whether or not it will be run will add an additional step to the CodePipeline. The tests’ related information is also configurable with the ability to specify the test repository, branch name, buildspec file, and build image for testing the CodeBuild project.

Execute

  1. Make an entry into the devops-pipeline-table-info DynamoDB table in the main CI/CD account. A sample entry can be found in sample-entry.json. Make sure to replace the configuration values with appropriate values for your environment. An explanation of the values can be found in the Pipeline Configuration section above.
  2. After the entry is made in the DynamoDB table, you should see a CloudFormation stack being created. This CloudFormation stack will deploy the CodePipeline in the main CI/CD account by reading and using the entry in the DynamoDB table.

Customize the solution for different combinations such as deploying to an environment while skipping for others by updating the pipeline configurations stored in the devops-pipeline-table-info DynamoDB table. The following is the pipeline configured for the sample-application repository’s main branch.

The image represents the dynamic CI/CD pipeline deployed in your account.

The image represents the dynamic CI/CD pipeline deployed in your account.

The image represents the dynamic CI/CD pipeline deployed in your account.

The image represents the dynamic CI/CD pipeline deployed in your account.

Figure 2: Dynamic Multi-Account CI/CD Pipeline

Clean up your dynamic multi-account CI/CD solution and related resources

To avoid ongoing charges for the resources that you created following this post, you should delete the following:

  1. The pipeline configuration stored in the DynamoDB
  2. The CloudFormation stacks deployed in the target CI/CD accounts
  3. The AWS CDK app deployed in the main CI/CD account
  4. Empty and delete the retained S3 buckets.

Conclusion

This configuration-driven CI/CD solution provides the ability to dynamically create and configure your pipelines in DynamoDB. IDEMIA, a global leader in identity technologies, adopted this approach for deploying their microservices based application across environments. This solution created by AWS Professional Services allowed them to dynamically create and configure their pipelines per repository per release. As Kunal Bajaj, Tech Lead of IDEMIA, states, “We worked with AWS pro-serve team to create a dynamic CI/CD solution using lambdas, step functions, SQS, and other native AWS services to conduct cross-account deployments to our different environments while providing us the flexibility to add tests and approvals as needed by the business.”

About the authors:

Anshul Saxena

Anshul is a Cloud Application Architect at AWS Professional Services and works with customers helping them in their cloud adoption journey. His expertise lies in DevOps, serverless architectures, and architecting and implementing cloud native solutions aligning with best practices.

Libin Roy

Libin is a Cloud Infrastructure Architect at AWS Professional Services. He enjoys working with customers to design and build cloud native solutions to accelerate their cloud journey. Outside of work, he enjoys traveling, cooking, playing sports and weight training.

Genomics workflows, Part 2: simplify Snakemake launches

Post Syndicated from Rostislav Markov original https://aws.amazon.com/blogs/architecture/genomics-workflows-part-2-simplify-snakemake-launches/

Genomics workflows are high-performance computing workloads. In Part 1 of this series, we demonstrated how life-science research teams can focus on scientific discovery without the associated heavy lifting. We used regenie for large genome-wide association studies. Our design pattern built on AWS Step Functions with AWS Batch and Amazon FSx for Lustre.

In Part 2, we explore genomics workloads with built-in workflow logic. Historically, running bioinformatics data pipelines was a manual and error-prone task. Over the last years, multiple workflow management systems have emerged. An example of these is the Snakemake workflow management system with Tibanna orchestration. We discuss the solution design and how you can fully automate the launch with Amazon Web Services (AWS).

Use case

We focus on the use case of Snakemake, an open-source utility for whole genome sequence mapping in directed acyclic graph (DAG) format. Snakemake uses Snakefiles to declare workflow steps and commands. A Snakefile extends Python syntax to declare workflow steps such as mapping data sets to DAG structure and identifying variants. Consult the Snakemake tutorial for further information on workflow rules.

Snakefiles provide an exception from the general design pattern and an alternative to granular modeling workflow logic in Amazon States Language. In our real-life use case, we used Tibanna to orchestrate Snakemake. Tibanna is an open-source, AWS-native software that runs bioinformatics data pipelines. It supports Snakefile syntax, plus other workflow languages, including Common Workflow Language and Workflow Description Language (WDL).

We recommend using Amazon Genomics CLI, if Tibanna is not needed for your use case, and Amazon Omics, if your workflow definitions are compliant with the supported WDL and Nextflow specifications.

Solution overview

Snakemake is available as Docker image on GitHub. We push the image to Amazon Elastic Container Registry. Tibanna is also available as Docker image on GitHub—it comes with Snakemake. Consult the Tibanna installation guide for more information.

We store Snakefiles on Amazon Simple Storage Service (Amazon S3). We configure S3 Event Notifications on PUT request operations. The event notification triggers an AWS Lambda function. The Lambda function launches an AWS Fargate task, which overrides the task definition command with the appropriate Snakemake start command and arguments.

The launched AWS Fargate task pulls the Snakefiles at launch time for each job and prepares the Snakemake initiation commands. Once the Snakefiles are downloaded on the Fargate task, the Snakemake head initiation command is invoked to begin launching jobs using Tibanna. Tibanna invokes a Step Functions state machine which orchestrates the launch of Snakemake on Amazon Elastic Compute Cloud (Amazon EC2).

Amazon CloudWatch provides a consolidated overview of performance metrics, including elapsed time, failed jobs, and error types. You can keep logs of your failed jobs in CloudWatch Logs (Figure 1). You can set up filters to match specific error types, plus create subscriptions to deliver a real-time stream of your log events to Amazon Kinesis or Lambda for further retry.

Solution architecture for Snakemake with Tibanna on AWS

Figure 1. Solution architecture for Snakemake with Tibanna on AWS

Implementation considerations

Here, we describe some of the implementation considerations.

Creating Snakefiles

The launching point for the initiation depends on a Snakefile. Each Snakefile may contain one or more samples to be launched. The sheet resides in an S3 bucket. This adds flexibility and the ability to purge any sensitive or restrictive information after the job has been processed.

Invoking Tibanna

In order to launch Snakemake DAGs using Tibanna, we will need to set up a new Tibanna Unicorn. A Tibanna Unicorn is an Step Functions state machine and a corresponding Lambda function for provisioning EC2 instances.

The state machine runs the following sequence:

  1. Create EC2 instance
  2. Check EC2 status
  3. Exit

After the Tibanna Unicorn has been created, we can start a Snakemake DAG using the following sample commands inside of the Fargate task.

$ export TIBANNA_DEFAULT_STEP_FUNCTION_NAME=YOUR_UNICORN_PROJECT
$ snakemake --tibanna --tibanna-config spot_instance=true --default-remote-prefix=YOUR_S3_BUCKET/BUCKET_PREFIX --retries 3.

The Snakemake command is used with the --tibanna flag to send launch requests to the Step Functions state machine in order to provision EC2 instances and run DAG tasks.

We recommend deploying the solution with AWS Serverless Application Model or the AWS Cloud Development Kit, both of which launch AWS CloudFormation.

Logging and troubleshooting

With this solution, each launch will automatically capture and retain start logs in a centralized location in Amazon CloudWatch Logs for tracing and auditing.

If there are issues during the launch of the Tibanna Step Function state machine, such as Amazon EC2 capacity limits, logs will be available in the S3 bucket that was specified during the Tibanna Unicorn creation process. There will be a file available in the format of <EXECUTION_ID>.log inside of the S3 bucket. This information is easily accessible via the command line interface. Use the following command to display specific log results or error messages.

tibanna log -j <EXECUTION_ID> -T 

Retries and EC2 Spot Instances

We advise to use Amazon EC2 Spot Instances, if possible, for additional cost savings. This option is available in the --tibanna-config arguments with the setting spot_instance=true.

This is optional, and you need to create retry logic in the event a Spot Instance gets reclaimed. You can include --retries=3 in your Tibanna launch command. This would ensure all rules are retried three times. You can also specify the number of retries for individual rules when defining the Snakemake DAG definition; for example:

rule a:
    output:
        "test.txt"
    retries: 3
    shell:
        "curl https://some.unreliable.server/test.txt > {output}"

If EC2 Spot Instance capacity is hit, you can automatically switch to using EC2 On-Demand Instances instead. Add the behavior_on_capacity_limit argument and set retry_without_spot=true.

Adding services

The presented solution can be adapted to use other compute services supported by Snakemake. These include Amazon Elastic Kubernetes Service and AWS ParallelCluster with Slurm Workload Manager plus Amazon FSx for Lustre volumes attached to the head node and cluster nodes.

To initiate jobs on ParallelCluster, install the AWS Systems Manager agent on the head node. This is the launching point into the cluster and used for submitting jobs to the initiation queue. Systems Manager is a secure way to remotely invoke commands on an EC2 instance without the need for SSH access. You can restrict access to your EC2 instance through IAM policies.

Conclusion

In this blog post, we demonstrated how life-science research teams can simplify the launch of Snakemake using AWS. We used Snakefiles and Tibanna to orchestrate workflow steps. Snakefiles provide an exception from the general design pattern and an alternative to Amazon States Language. File uploads to Amazon S3 served as our launching point for workflow initiations.

Stay tuned for Part 3 of this series, in which we create a job manager that administrates multiple workflows.

Related information

Let’s Architect! Optimizing the cost of your architecture

Post Syndicated from Luca Mezzalira original https://aws.amazon.com/blogs/architecture/lets-architect-optimizing-the-cost-of-your-architecture/

Written in collaboration with Ben Moses, AWS Senior Solutions Architect, and Michael Holtby, AWS Senior Manager Solutions Architecture


Designing an architecture is not a simple task. There are many dimensions and characteristics of a solution to consider, such as the availability, performance, or resilience.

In this Let’s Architect!, we explore cost optimization and ideas on how to rethink your AWS workloads, providing suggestions that span from compute to data transfer.

Migrating AWS Lambda functions to Arm-based AWS Graviton2 processors

AWS Graviton processors are custom silicon from Amazon’s Annapurna Labs. Based on the Arm processor architecture, they are optimized for performance and cost, which allows customers to get up to 34% better price performance.

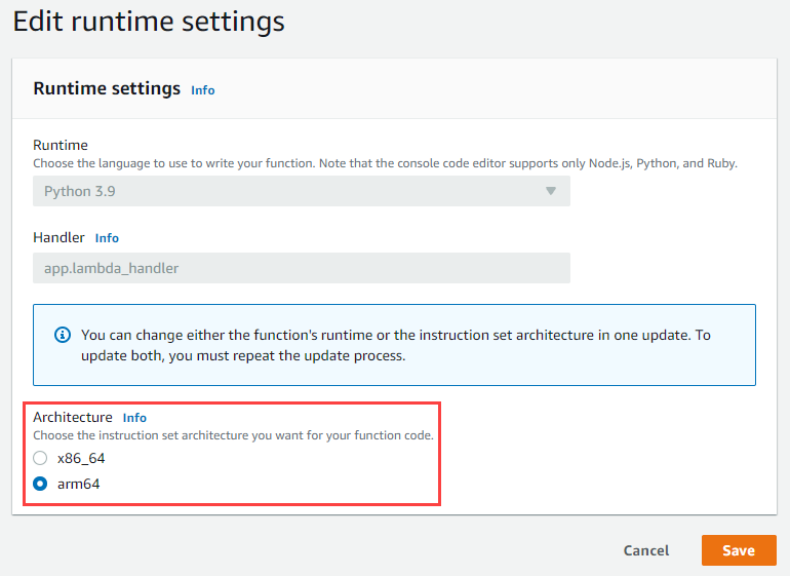
This AWS Compute Blog post discusses some of the differences between the x86 and Arm architectures, as well as methods for developing Lambda functions on Graviton2, including performance benchmarking.

Many serverless workloads can benefit from Graviton2, especially when they are not using a library that requires an x86 architecture to run.

Take me to this Compute post!

Choosing Graviton2 for AWS Lambda function in the AWS console

Choosing Graviton2 for AWS Lambda function in the AWS console

Key considerations in moving to Graviton2 for Amazon RDS and Amazon Aurora databases

Amazon Relational Database Service (Amazon RDS) and Amazon Aurora support a multitude of instance types to scale database workloads based on needs. Both services now support Arm-based AWS Graviton2 instances, which provide up to 52% price/performance improvement for Amazon RDS open-source databases, depending on database engine, version, and workload. They also provide up to 35% price/performance improvement for Amazon Aurora, depending on database size.

This AWS Database Blog post showcases strategies for updating RDS DB instances to make use of Graviton2 with minimal changes.

Take me to this Database post!

Choose your instance class that leverages Graviton2, such as db.r6g.large (the “g” stands for Graviton2)

Choose your instance class that leverages Graviton2, such as db.r6g.large (the “g” stands for Graviton2)

Overview of Data Transfer Costs for Common Architectures

Data transfer charges are often overlooked while architecting an AWS solution. Considering data transfer charges while making architectural decisions can save costs. This AWS Architecture Blog post describes the different flows of traffic within a typical cloud architecture, showing where costs do and do not apply. For areas where cost applies, it shows best-practice strategies to minimize these expenses while retaining a healthy security posture.

Take me to this Architecture post!

Accessing AWS services in different Regions

Accessing AWS services in different Regions

Improve cost visibility and re-architect for cost optimization

This Architecture Blog post is a collection of best practices for cost management in AWS, including the relevant tools; plus, it is part of a series on cost optimization using an e-commerce example.

AWS Cost Explorer is used to first identify opportunities for optimizations, including data transfer, storage in Amazon Simple Storage Service and Amazon Elastic Block Store, idle resources, and the use of Graviton2 (Amazon’s Arm-based custom silicon). The post discusses establishing a FinOps culture and making use of Service Control Policies (SCPs) to control ongoing costs and guide deployment decisions, such as instance-type selection.

Take me to this Architecture post!

Applying SCPs on different environments for cost control

Applying SCPs on different environments for cost control

See you next time!

Thanks for joining us to discuss optimizing costs while architecting! This is the last Let’s Architect! post of 2022. We will see you again in 2023, when we explore even more architecture topics together.

Wishing you a happy holiday season and joyous new year!

Can’t get enough of Let’s Architect!?

Visit the Let’s Architect! page of the AWS Architecture Blog for access to the whole series.

Looking for more architecture content?

AWS Architecture Center provides reference architecture diagrams, vetted architecture solutions, Well-Architected best practices, patterns, icons, and more!

Securing Lambda Function URLs using Amazon Cognito, Amazon CloudFront and AWS WAF

Post Syndicated from Marcia Villalba original https://aws.amazon.com/blogs/compute/securing-lambda-function-urls-using-amazon-cognito-amazon-cloudfront-and-aws-waf/

This post is written by Madhu Singh (Solutions Architect), and Krupanidhi Jay (Solutions Architect).

Lambda function URLs is a dedicated HTTPs endpoint for a AWS Lambda function. You can configure a function URL to have two methods of authentication: IAM and NONE. IAM authentication means that you are restricting access to the function URL (and in-turn access to invoke the Lambda function) to certain AWS principals (such as roles or users). Authentication type of NONE means that the Lambda function URL has no authentication and is open for anyone to invoke the function.

This blog shows how to use Lambda function URLs with an authentication type of NONE and use custom authorization logic as part of the function code, and to only allow requests that present valid Amazon Cognito credentials when invoking the function. You also learn ways to protect Lambda function URL against common security threats like DDoS using AWS WAF and Amazon CloudFront.

Lambda function URLs provides a simpler way to invoke your function using HTTP calls. However, it is not a replacement for Amazon API Gateway, which provides advanced features like request validation and rate throttling.

Solution overview

There are four core components in the example.

1. A Lambda function with function URLs enabled

At the core of the example is a Lambda function with the function URLs feature enabled with the authentication type of NONE. This function responds with a success message if a valid authorization code is passed during invocation. If not, it responds with a failure message.

2. Amazon Cognito User Pool

Amazon Cognito user pools enable user authentication on websites and mobile apps. You can also enable publicly accessible Login and Sign-Up pages in your applications using Amazon Cognito user pools’ feature called the hosted UI.

In this example, you use a user pool and the associated Hosted UI to enable user login and sign-up on the website used as entry point. This Lambda function validates the authorization code against this Amazon Cognito user pool.

3. CloudFront distribution using AWS WAF

CloudFront is a content delivery network (CDN) service that helps deliver content to end users with low latency, while also improving the security posture for your applications.

AWS WAF is a web application firewall that helps protect your web applications or APIs against common web exploits and bots and AWS Shield is a managed distributed denial of service (DDoS) protection service that safeguards applications running on AWS. AWS WAF inspects the incoming request according to the configured Web Access Control List (web ACL) rules.

Adding CloudFront in front of your Lambda function URL helps to cache content closer to the viewer, and activating AWS WAF and AWS Shield helps in increasing security posture against multiple types of attacks, including network and application layer DDoS attacks.

4. Public website that invokes the Lambda function

The example also creates a public website built on React JS and hosted in AWS Amplify as the entry point for the demo. This website works both in authenticated mode and in guest mode. For authentication, the website uses Amazon Cognito user pools hosted UI.

Solution architecture

This shows the architecture of the example and the information flow for user requests.

In the request flow:

  1. The entry point is the website hosted in AWS Amplify. In the home page, when you choose “sign in”, you are redirected to the Amazon Cognito hosted UI for the user pool.
  2. Upon successful login, Amazon Cognito returns the authorization code, which is stored as a cookie with the name “code”. The user is redirected back to the website, which has an “execute Lambda” button.
  3. When the user choose “execute Lambda”, the value from the “code” cookie is passed in the request body to the CloudFront distribution endpoint.
  4. The AWS WAF web ACL rules are configured to determine whether the request is originating from the US or Canada IP addresses and to determine if the request should be allowed to invoke Lambda function URL origin.
  5. Allowed requests are forwarded to the CloudFront distribution endpoint.
  6. CloudFront is configured to allow CORS headers and has the origin set to the Lambda function URL. The request that CloudFront receives is passed to the function URL.
  7. This invokes the Lambda function associated with the function URL, which validates the token.
  8. The function code does the following in order:
    1. Exchange the authorization code in the request body (passed as the event object to Lambda function) to access_token using Amazon Cognito’s token endpoint (check the documentation for more details).
      1. Amazon Cognito user pool’s attributes like user pool URL, Client ID and Secret are retrieved from AWS Systems Manager Parameter Store (SSM Parameters).
      2. These values are stored in SSM Parameter Store at the time these resources are deployed via AWS CDK (see “how to deploy” section)
    2. The access token is then verified to determine its authenticity.
    3. If valid, the Lambda function returns a message stating user is authenticated as <username> and execution was successful.
    4. If either the authorization code was not present, for example, the user was in “guest mode” on the website, or the code is invalid or expired, the Lambda function returns a message stating that the user is not authorized to execute the function.
  9. The webpage displays the Lambda function return message as an alert.

Getting started

Pre-requisites:

Before deploying the solution, please follow the README from the GitHub repository and take the necessary steps to fulfill the pre-requisites.

Deploy the sample solution

1. From the code directory, download the dependencies:

$ npm install

2. Start the deployment of the AWS resources required for the solution:

$ cdk deploy

Note:

  • optionally pass in the –profile argument if needed
  • The deployment can take up to 15 minutes

3. Once the deployment completes, the output looks similar to this:

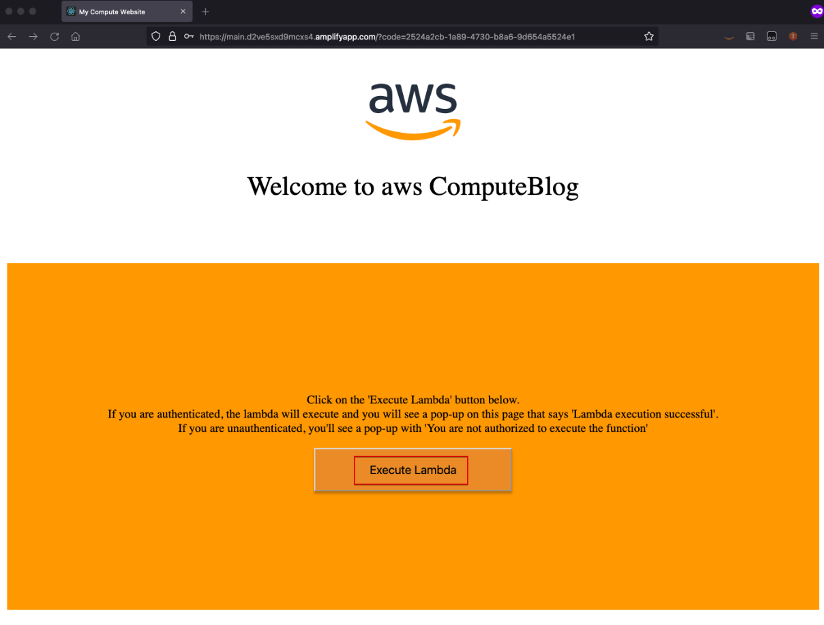
Open the amplifyAppUrl from the output in your browser. This is the URL for the demo website. If you don’t see the “Welcome to Compute Blog” page, the Amplify app is still building, and the website is not available yet. Retry in a few minutes. This website works either in an authenticated or unauthenticated state.

Test the authenticated flow

  1. To test the authenticated flow, choose “Sign In”.

2. In the sign-in page, choose on sign-up (for the first time) and create a user name and password.

3. To use an existing an user name and password, enter those credentials and choose login.

4. Upon successful sign-in or sign up, you are redirected back to the webpage with “Execute Lambda” button.

5. Choose this button. In a few seconds, an alert pop-up shows the logged in user and that the Lambda execution is successful.

Testing the unauthenticated flow

1. To test the unauthenticated flow, from the Home page, choose “Continue”.

2. Choose “Execute Lambda” and in a few seconds, you see a message that you are not authorized to execute the Lambda function.

Testing the geo-block feature of AWS WAF

1. Access the website from a Region other than US or Canada. If you are physically in the US or Canada, you may use a VPN service to connect to a Region other than US or Canada.

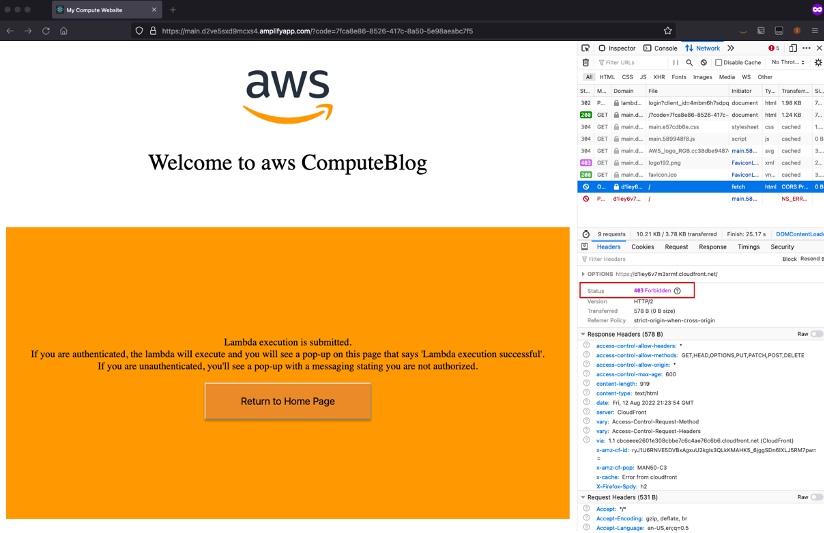
2. Choose the “Execute Lambda” button. In the Network trace of browser, you can see the call to invoke Lambda function was blocked with Forbidden response.

3. To try either the authenticated or unauthenticated flow again, choose “Return to Home Page” to go back to the home page with “Sign In” and “Continue” buttons.

Cleaning up

To delete the resources provisioned, run the cdk destroy command from the AWS CDK CLI.

Conclusion

In this blog, you create a Lambda function with function URLs enabled with NONE as the authentication type. You then implemented a custom authentication mechanism as part of your Lambda function code. You also increased the security of your Lambda function URL by setting it as Origin for the CloudFront distribution and using AWS WAF Geo and IP limiting rules for protection against common web threats, like DDoS.

For more serverless learning resources, visit Serverless Land.

Email delta cost usage report in a multi-account organization using AWS Lambda

Post Syndicated from Ashutosh Dubey original https://aws.amazon.com/blogs/architecture/email-delta-cost-usage-report-in-a-multi-account-organization-using-aws-lambda/

Overview of solution

AWS Organizations gives customers the ability to consolidate their billing across accounts. This reduces billing complexity and centralizes cost reporting to a single account. These reports and cost information are available only to users with billing access to the primary AWS account.

In many cases, there are members of senior leadership or finance decision makers who don’t have access to AWS accounts, and therefore depend on individuals or additional custom processes to share billing information. This task becomes specifically complicated when there is a complex account organization structure in place.

In such cases, you can email cost reports periodically and automatically to these groups or individuals using AWS Lambda. In this blog post, you’ll learn how to send automated emails for AWS billing usage and consumption drifts from previous days.

Solution architecture

Account structure and architecture diagram

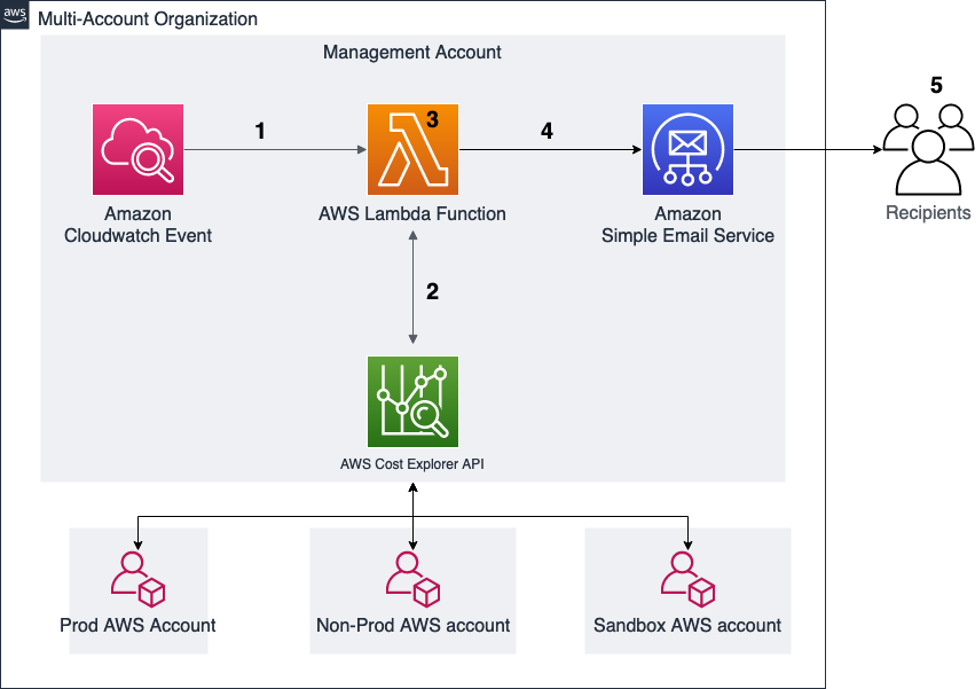
Figure 1. Account structure and architecture diagram

AWS provides the Cost Explorer API to enable you to programmatically query data for cost and usage of AWS services. This solution uses a Lambda function to query aggregated data from the API, format that data and send it to a defined list of recipients.

  1. Amazon EventBridge (Amazon CloudWatch Events) is configured to cue the Lambda function at a specific time.
  2. The function uses the AWS Cost Explorer API to fetch the cost details for each account.
  3. The Lambda function calculates the change in cost over time and formats the information to be sent in an email.
  4. The formatted information is passed to Amazon Simple Email Service (Amazon SES).
  5. The report is emailed to the recipients configured in the environment variables of the function.

Prerequisites

For this walkthrough, you should have the following prerequisites:

Walkthrough

  • Download the AWS CloudFormation template from this link: AWS CloudFormation template
  • Once downloaded, open the template in your favorite text editor
  • Update account-specific variables in the template. You need to update the tuple, dictionary, display list, and display list monthly sections of the script for all the accounts which you want to appear in the daily report email. Refer to Figure 2 for an example of some dummy account IDs and email IDs.
A screenshot showing account IDs in AWS Lambda

Figure 2. Account IDs in AWS Lambda

  • Optionally, locate “def send_report_email” in the template. The subject variable controls the subject line of the email. This can be modified to something meaningful to the recipients.

After these changes are made according to your requirements, you can deploy the CloudFormation template:

  1. Log in to the Cloud Formation console.
  2. Choose Create Stack. From the dropdown, choose With new resources (standard).
  3. On the next screen under Specify Template, choose Upload a template file.
  4. Click Choose file. Choose the local template you modified earlier, then choose Next.
  5. Fill out the parameter fields with valid email address. For SchduleExpression, use a valid Cron expression for when you would like the report sent. Choose Next.
    Here is an example for a cron schedule:  18 11 * * ? *
    (This example cron expression sets the schedule to send every day at 11:18 UTC time.)
    This creates the Lambda function and needed AWS Identity and Access Management (AWS IAM) roles.

You will now need to make a few modifications to the created resources.

  1. Log in to the IAM console.
  2. Choose Roles.
  3. Locate the role created by the CloudFormation template called “daily-services-usage-lambdarole”
  4. Under the Permissions tab, choose Add Permissions. From the dropdown., choose Attach Policy.
  5. In the search bar, search for “Billing”.
  6. Select the check box next to the AWS Managed Billing Policy and then choose Attach Policy.
  7. Log in to the AWS Lambda console.
  8. Choose the DailyServicesUsage function.
  9. Choose the Configuration tab.
  10. In the options that appear, choose General Configuration.
  11. Choose the Edit button.
  12. Change the timeout option to 10 seconds, because the default of three seconds may not be enough time to run the function to retrieve the cost details from multiple accounts.
  13. Choose Save.
  14. Still under the General Configuration tab, choose the Permissions option and validate the execution role.
    The edited IAM execution role should display the Resource details for which the access has been gained. Figure 3 shows that the allow actions to aws-portal for Billing, Usage, PaymentMethods, and ViewBilling are enabled. If the Resource summary does not show these permissions, the IAM role is likely not correct. Go back to the IAM console and confirm that you updated the correct role with billing access.
A screenshot of the AWS Lambda console showing Lambda role permissions

Figure 3. Lambda role permissions

  • Optionally, in the left navigation pane, choose Environment variables. Here you will see the email recipients you configured in the Cloud Formation template. If changes are needed to the list in the future, you can add or remove recipients by editing the environment variables. You can skip this step if you’re satisfied with the parameters you specified earlier.

Next, you will create a few Amazon SES identities for the email addresses that were provided as environment variables for the sender and recipients:

  1. Log in to the SES console.
  2. Under Configuration, choose Verified Identities.
  3. Choose Create Identity.
  4. Choose the identity type Email Address, fill out the Email address field with the sender email, and choose Create Identify.
  5. Repeat this step for all receiver emails.

The email IDs included will receive an email for the confirmation. Once confirmed, the status shows as verified in the Verified Identities tab of the SES console. The verified email IDs will start receiving the email with the cost reports.

Amazon EventBridge (CloudWatch) event configuration

To configure events:

    1. Go to the Amazon EventBridge console.
    2. Choose Create rule.
    3. Fill out the rule details with meaningful descriptions.
    4. Under Rule Type, choose Schedule.
    5. Schedule the cron pattern from when you would like the report to run.

Figure 4 shows that the highlighted rule is configured to run the Lambda function every 24 hours.

A screenshot of the Amazon EventBridge console showing an EventBridge rule

Figure 4. EventBridge rule

An example AWS Daily Cost Report email

From: [email protected] (the email ID mentioned as “sender”)
Sent: Tuesday, April 12, 2022 1:43 PM
To: [email protected] (the email ID mentioned as “receiver”)
Subject: AWS Daily Cost Report for Selected Accounts (the subject of email as set in the Lambda function)

Figure 5 shows the first part of the cost report. It provides the cost summary and delta of the cost variance percentage compare to the previous day. You can also see the trend based on the last seven days from the same table. This helps in understanding a pattern around cost and usage.

This summary is broken down per account, and then totaled, in order to help you understand the accounts contributing to the cost changes. The daily change percentages are also color coded to highlight significant variations.

AWS Daily Cost Report email body part 1

Figure 5. AWS Daily Cost Report email body part 1

The second part of the report in the email provides the service-related cost breakup for each account configured in the Account dictionary section of the function. This is a further drilldown report; you will get these for all configured accounts.

AWS Daily Cost Report email body part 2

Figure 6. AWS Daily Cost Report email body part 2

Cleanup

  • Delete the Amazon CloudFormation stack.
  • Delete the identities on Amazon SES.
  • Delete the Amazon EventBridge (CloudWatch) event rule.

Conclusion

The blog demonstrates how you can automatically and seamlessly share your AWS accounts’ billing and change information with your leadership and finance teams daily (or on any schedule you choose). While the solution was designed for accounts that are part of an organization in the service AWS organizations, it could also be deployed in a standalone account without making any changes. This allows information sharing without the need to provide account access to the recipients, and avoids any dependency on other manual processes. As a next step, you can also store these reports in Amazon Simple Storage Service (Amazon S3), generate a historical trend summary for consumption, and continue making informed decisions.

Additional reading

AWS Local Zones and AWS Outposts, choosing the right technology for your edge workload

Post Syndicated from Sheila Busser original https://aws.amazon.com/blogs/compute/aws-local-zones-and-aws-outposts-choosing-the-right-technology-for-your-edge-workload/

This blog post is written by Joe Sacco, Senior Technical Account Manager.

The AWS Global Cloud Infrastructure includes 30 Launched Regions, 96 Availability Zones (AZs), 410+ Points of Presence with 400+ Edge Locations, and 13 Regional Edge Caches.  With over 200 AWS services, most customer workloads can run in the AWS Regions. However, for some location-sensitive workloads with low-latency or data residency requirements, and when an AWS Region isn’t close enough, AWS offers two additional infrastructure options: AWS Local Zones and AWS Outposts. Although Local Zones and Outposts solve for similar problems, we’ll review use cases as well as the services and features available that can help you decide which offering best suits your needs.

Let’s start with an overview of Local Zones and Outposts.

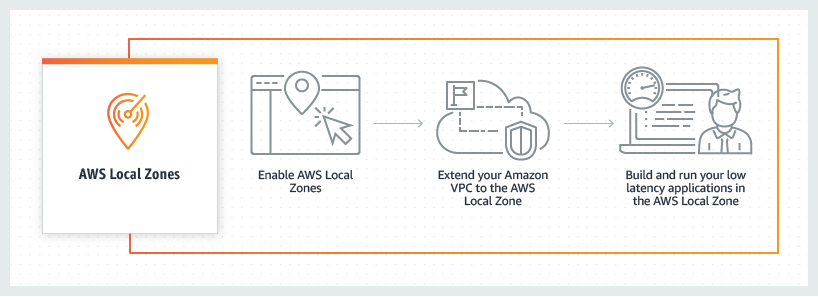
What are Local Zones?

Local Zones are a new type of infrastructure deployment that places AWS compute, storage, database, and other select AWS services in large metropolitan areas closer to end users. This gives you access to single-digit millisecond latency with the use of AWS Direct Connect and the ability to meet data residency requirements. Local Zones are also connected to their parent Region via AWS’s redundant and high bandwidth private network. This gives applications running in Local Zones fast, secure, and seamless access to a complete list of services in the parent Region.

Unlike Outposts, which you deploy within your datacenter or a co-location of your choice, Local Zones are owned, managed, and operated by AWS. Local Zones eliminate the need for you to manage power, connectivity, and capacity. Furthermore, you can provision workloads on a Local Zone from your AWS Management Console just as you would for AZs and Regions today.

AWS Local Zones how it worksWhat is Outposts?

Outposts is a family of fully managed solutions delivering AWS infrastructure and services to virtually any on-premises or edge location for a truly consistent hybrid experience. Outposts lets you run some AWS services locally and connect to a broad range of services available in the local AWS Region. Outposts comes in two types of offerings: Outposts rack and Outposts servers, with which you can run applications and workloads on-premises using the same AWS infrastructure, services, tools, and APIs as in AWS Regions.

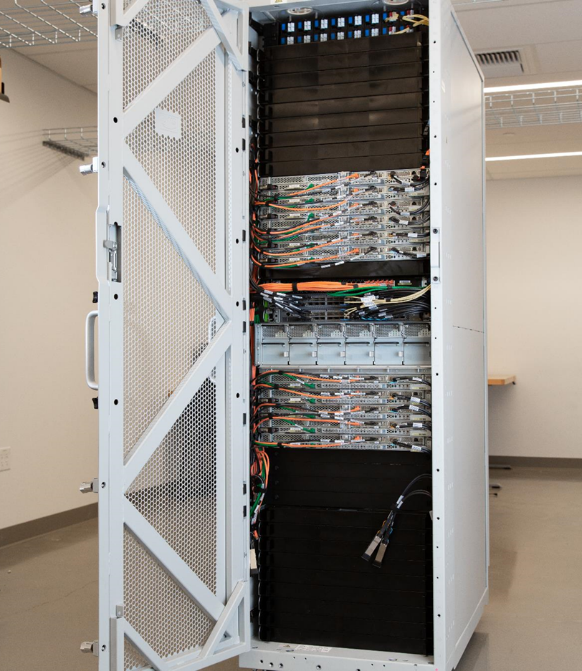
The Outposts rack is available as an industry standard 42U form factor. It provides the same AWS infrastructure, services, tools, and APIs to your data center or co-location space  that you would find in an AWS Region.

Outposts Rack

The Outposts servers come in a 1U or 2U form factor and are designed for locations that have limited space or smaller capacity requirements. Both support different compute instances, as detailed in the Outposts servers feature page.

Outposts ServersCustomer use cases

Now that we have an overview of both Local Zones and Outposts service offerings, let’s dive into use cases, the differences between them, and how your business can leverage each to accomplish your workloads requirements.

Low latency

Customers today require low latency computing for workloads, such as medical imaging, transaction processing for Enterprise Resource Planning (ERP) applications, enterprise migration with hybrid architecture, real-time multiplayer gaming, telco network function virtualization, and regulated gaming workloads.

Outposts can meet ultra-low latency requirements. This is accomplished by bringing AWS services on premises and to the edge at Outpost Sites. An Outpost site is the physical location where your Outpost operates, and it can be local within one of your data centers or at a co-location facility of your choice.

When accessing from within the same metro, Local Zones will provide you with a low, single millisecond latency experience when communicating with your applications. Latency between Local Zones and AWS Regions or Local Zones and on-premises environments varies, and these will depend on how close the nearest Local Zone is as well as the type of modality used for the connection (Public Internet, VPN, and AWS Direct Connect). You should always choose the closest Local Zone location to achieve the lowest possible latency. For use cases such as mobile gaming, you can utilize Local Zones by deploying your applications to a Local Zone location nearest to your end users. Local Zones are generally available in 17 metros across the US, 4 outside the US, and we are continuing to launch Local Zones in 30 cities across 25 countries. Check out updates for more general availability of Local Zones.

Data residency

On occasion, data must remain in a specific geographic region for regulatory or information security reasons. Healthcare and other regulated industries, such as financial services or Oil & Gas, have specific data residency requirements.

Outposts helps meet a customer’s data residency requirements because it’s installed on premises and essentially brings AWS to where the data currently resides. This allows you to pick and control where your workloads run, and where your data will stay. Check out the full list of countries and territories where Outposts is available on the FAQs page of Outposts rack and the FAQs page of Outposts servers.

Local Zones bring AWS closer or within a customer’s geographic boundary in a fully AWS owned and operated mode. Although Local Zones can help meet data residency use cases in some scenarios, data residency requirements vary depending on the jurisdictions. Therefore, you should work closely with your compliance and information security teams when choosing the Local Zone location in which to deploy your regulated workloads.

Migration and modernization

When trying to migrate to the cloud and modernize your stack, some workloads can be challenging. Often there are on-premises applications which are difficult to move into Regions due to latency-sensitive system intermittencies between their various components. As dependencies arise, you may choose to segment these migrations into smaller pieces. Then this will require latency-sensitive connectivity between the various parts of the application.

Outposts and Local Zones both allow for a gradual migration and modernization of your stack. You can choose to migrate parts of their workloads while still maintaining latency-sensitive connectivity between components until the entirety is ready to move.

Factors in selecting Local Zones or Outposts

Choosing between Local Zones and Outposts will depend on the following factors, and you should examine all of them together when selecting a service for your use case.

  1. Latency requirements

Local Zones can achieve low single millisecond latency when accessing within the same metro. On the other hand, Outposts can achieve ultra-low latency requirements when deployed within your datacenter or at a co-location facility of your choice. When selecting one over the other, you must work backward from your goal and workload requirements.

If you’re conducting a migration and modernization strategy which requires ultra-low latency between a workloads application and database tiers that are difficult to migrate to the AWS Regions, then Outposts would be the right solution for you.

Alternatively, if your workload involves streaming live broadcasts to end users which requires low single millisecond latency, but your end users are located where an AWS Region isn’t available, then Local Zones distributed across various metros would work best to serve your content.

  1. Availability of services needed to support your workload

Local Zones and Outposts differ with their list of supported AWS services, and you must review your workload’s service requirements when determining the best fit for you. For example, if a customer has a computer vision workload that requires storing and retrieving large volumes of images locally using Amazon Simple Storage Service (Amazon S3), then Outposts and certain Local Zones meet this requirement while other Local Zones don’t. Learn how you can use Amazon S3 on Outposts for computer vision workloads.

Outposts rack and servers support different sets of AWS services locally. You can view comparisons between them, or visit the Outposts servers and Outposts rack feature sites for more details.

Local Zones’ features vary depending on the location in which you choose to deploy. You can view more details and a full list of supported features and services per location on our Local Zones features page.

  1. Investment and management of infrastructure on-premises

Management of the infrastructure and prerequisites are another factor when considering which AWS service best suits your needs.

Outposts is ordered through AWS, and it requires installation in a customer’s on-premises datacenter or co-location provider of their choice. Outposts rack installation is handled by AWS, while Outposts servers installation is done by the customer or a third-party of their choosing. There are power and redundant networking requirements for the Outpost Site, as well as a required subscription to AWS Enterprise Support or On-Ramp Support.

Local Zones infrastructure is fully-managed by AWS, including the power, networking, and capacity. This reduces operational management as well as the overhead cost for customers. An Enterprise support agreement isn’t required to utilize Local Zones.

You should always choose Regions or Local Zones if your use case allows, and use Outposts when a Region or Local Zone isn’t a good fit. If both Outposts and Local Zones fit a customer’s use case and requirements, then Local Zones will be the preferred choice.

  1. Regulations, compliance, and information security

If a Local Zone is either unavailable or unable to meet your residency requirements within your geographic boundary consider Outposts, which can be deployed to a data center or co-location facility of your choice. Data residency requirements can be a factor based on your industry and the regulations to which your workload must adhere. Furthermore, you should work closely with your compliance and information security teams when choosing between Local Zones or Outposts.

Conclusion

Whether you’re dealing with latency-sensitive applications, data residency requirements, or a migration and modernization strategy, AWS provides options and flexibility for you to leverage the same AWS infrastructure, services, APIs, and tools to metro areas and on-premises locations with Local Zones and Outposts.

The decision of which technology to use will depend on several factors that we discussed above. You must work across teams within your organization to make sure that the latency requirements (low single millisecond latency within a metro for Local Zones vs the ultra low latency of Outposts when deployed close to or within your datacenter), data reseidency needs, installation prerequisites, and availability of services to support your workload are met.

Once these factors are taken into account, and you have made a choice, visit our product pages for Outposts and Local Zones with information on how you can get started.

Step Functions Distributed Map – A Serverless Solution for Large-Scale Parallel Data Processing

Post Syndicated from Sébastien Stormacq original https://aws.amazon.com/blogs/aws/step-functions-distributed-map-a-serverless-solution-for-large-scale-parallel-data-processing/

I am excited to announce the availability of a distributed map for AWS Step Functions. This flow extends support for orchestrating large-scale parallel workloads such as the on-demand processing of semi-structured data.

Step Function’s map state executes the same processing steps for multiple entries in a dataset. The existing map state is limited to 40 parallel iterations at a time. This limit makes it challenging to scale data processing workloads to process thousands of items (or even more) in parallel. In order to achieve higher parallel processing prior to today, you had to implement complex workarounds to the existing map state component.

The new distributed map state allows you to write Step Functions to coordinate large-scale parallel workloads within your serverless applications. You can now iterate over millions of objects such as logs, images, or .csv files stored in Amazon Simple Storage Service (Amazon S3). The new distributed map state can launch up to ten thousand parallel workflows to process data.

You can process data by composing any service API supported by Step Functions, but typically, you will invoke Lambda functions to process the data with code written in your favorite programming language.

Step Functions distributed map supports a maximum concurrency of up to 10,000 executions in parallel, which is well above the concurrency supported by many other AWS services. You can use the maximum concurrency feature of the distributed map to ensure that you do not exceed the concurrency of a downstream service. There are two factors to consider when working with other services. First, the maximum concurrency supported by the service for your account. Second, the burst and ramping rates, which determine how quickly you can achieve the maximum concurrency.

Let’s use Lambda as an example. Your functions’ concurrency is the number of instances that serve requests at a given time. The default maximum concurrency quota for Lambda is 1,000 per AWS Region. You can ask for an increase at any time. For an initial burst of traffic, your functions’ cumulative concurrency in a Region can reach an initial level of between 500 and 3000, which varies per Region. The burst concurrency quota applies to all your functions in the Region.

When using a distributed map, be sure to verify the quota on downstream services. Limit the distributed map maximum concurrency during your development, and plan for service quota increases accordingly.

To compare the new distributed map with the original map state flow, I created this table.

Original map state flow New distributed map flow
Sub workflows
  • Runs a sub-workflow for each item in an array. The array must be passed from the previous state.
  • Each iteration of the sub-workflow is called a map iteration, and its events are added to the state machine’s execution history.
  • Runs a sub-workflow for each item in an array or Amazon S3 dataset.
  • Each sub-workflow is run as a totally separate child execution, with its own event history.
Parallel branches Map iterations run in parallel, with an effective maximum concurrency of around 40 at a time. Can pass millions of items to multiple child executions, with concurrency of up to 10,000 executions at a time.
Input source Accepts only a JSON array as input. Accepts input as Amazon S3 object list, JSON arrays or files, csv files, or Amazon S3 inventory.
Payload 256 KB Each iteration receives a reference to a file (Amazon S3) or a single record from a file (state input). Actual file processing capability is limited by Lambda storage and memory.
Execution history 25,000 events Each iteration of the map state is a child execution, with up to 25,000 events each (express mode has no limit on execution history).

Sub-workflows within a distributed map work with both Standard workflows and the low-latency, short-duration Express Workflows.

This new capability is optimized to work with S3. I can configure the bucket and prefix where my data are stored directly from the distributed map configuration. The distributed map stops reading after 100 million items and supports JSON or csv files of up to 10GB.

When processing large files, think about downstream service capabilities. Let’s take Lambda again as an example. Each input—a file on S3, for example—must fit within the Lambda function execution environment in terms of temporary storage and memory. To make it easier to handle large files, Lambda Powertools for Python introduced a new streaming feature to fetch, transform, and process S3 objects with minimal memory footprint. This allows your Lambda functions to handle files larger than the size of their execution environment. To learn more about this new capability, check the Lambda Powertools documentation.

Let’s See It in Action
For this demo, I will create a workflow that processes one thousand dog images stored on S3. The images are already stored on S3.

➜  ~ aws s3 ls awsnewsblog-distributed-map/images/
2022-11-08 15:03:36      27034 n02085620_10074.jpg
2022-11-08 15:03:36      34458 n02085620_10131.jpg
2022-11-08 15:03:36      12883 n02085620_10621.jpg
2022-11-08 15:03:36      34910 n02085620_1073.jpg
...

➜  ~ aws s3 ls awsnewsblog-distributed-map/images/ | wc -l
    1000

The workflow and the S3 bucket must be in the same Region.

To get started, I navigate to the Step Functions page of the AWS Management Console and select Create state machine. On the next page, I choose to design my workflow using the visual editor. The distributed map works with Standard workflows, and I keep the default selection as-is. I select Next to enter the visual editor.

Distributed Map - create a workflowIn the visual editor, I search and select the Map component on the left-side pane, and I drag it to the workflow area. On the right side, I configure the component. I choose Distributed as Processing mode and Amazon S3 as Item Source.

Distributed maps are natively integrated with S3. I enter the name of the bucket (awsnewsblog-distributed-map) and the prefix (images) where my images are stored.

On the Runtime Settings section, I choose Express for Child workflow type. I also may decide to restrict the Concurrency limit. It helps to ensure we operate within the concurrency quotas of the downstream services (Lambda in this demo) for a particular account or Region.

By default, the output of my sub-workflows will be aggregated as state output, up to 256KB. To process larger outputs, I may choose to Export map state results to Amazon S3.

Distributed Map - add a Lambda invocation

Finally, I define what to do for each file. In this demo, I want to invoke a Lambda function for each file in the S3 bucket. The function exists already. I search for and select the Lambda invocation action on the left-side pane. I drag it to the distributed map component. Then, I use the right-side configuration panel to select the actual Lambda function to invoke: AWSNewsBlogDistributedMap in this example.

Distributed Map - add a Lambda invocation

When I am done, I select Next. I select Next again on the Review generated code page (not shown here).

On the Specify state machine settings page, I enter a Name for my state machine and the IAM Permissions to run. Then, I select Create state machine.

Create State Machine - Final ScreenNow I am ready to start the execution. On the State machine page, I select the new workflow and select Start execution. I can optionally enter a JSON document to pass to the workflow. In this demo, the workflow does not handle the input data. I leave it as-is, and I select Start execution.

Start workflow execution Start workflow execution - pass input data

During the execution of the workflow, I can monitor the progress. I observe the number of iterations, and the number of items successfully processed or in error.

I can drill down on one specific execution to see the details.

Distributed Map - monitor execution details

With just a few clicks, I created a large-scale and heavily parallel workflow able to handle a very large quantity of data.

Which AWS Service Should I Use
As often happens on AWS, you might observe an overlap between this new capability and existing services such as AWS Glue, Amazon EMR, or Amazon S3 Batch Operations. Let’s try to differentiate the use cases.

In my mental model, data scientists and data engineers use AWS Glue and EMR to process large amounts of data. On the other hand, application developers will use Step Functions to add serverless data processing into their applications. Step Functions is able to scale from zero quickly, which makes it a good fit for interactive workloads where customers may be waiting for the results. Finally, system administrators and IT operation teams are likely to use Amazon S3 Batch Operations for single-step IT automation operations such as copying, tagging, or changing permissions on billions of S3 objects.

Pricing and Availability
AWS Step Functions’ distributed map is generally available in the following ten AWS Regions: US East (Ohio, N. Virginia), US West (Oregon), Asia Pacific (Singapore, Sydney, Tokyo), Canada (Central), and Europe (Frankfurt, Ireland, Stockholm).

The pricing model for the existing inline map state does not change. For the new distributed map state, we charge one state transition per iteration. Pricing varies between Regions, and it starts at $0.025 per 1,000 state transitions. When you process your data using express workflows, you are also charged based on the number of requests for your workflow and its duration. Again, prices vary between Regions, but they start at $1.00 per 1 million requests and $0.06 per GB-hour (prorated to 100ms).

For the same amount of iterations, you will observe a cost reduction when using the combination of the distributed map and standard workflows compared to the existing inline map. When you use express workflows, expect the costs to stay the same for more value with the distributed map.

I am really excited to discover what you will build using this new capability and how it will unlock innovation. Go start to build highly parallel serverless data processing workflows today!

— seb

Introducing VPC Lattice – Simplify Networking for Service-to-Service Communication (Preview)

Post Syndicated from Danilo Poccia original https://aws.amazon.com/blogs/aws/introducing-vpc-lattice-simplify-networking-for-service-to-service-communication-preview/

Modern applications are built using modular and distributed components. Each component is a service that implements its own subset of functionalities. To make these services communicate with each other, you need a way to let them discover where they are, authorize access, and route traffic. When troubleshooting issues, you need to keep communication configurations under control so that you can quickly understand what is happening at the application, service, and network levels. This can take a lot of your time.

Today, we are making available in preview Amazon VPC Lattice, a new capability of Amazon Virtual Private Cloud (Amazon VPC) that gives you a consistent way to connect, secure, and monitor communication between your services. With VPC Lattice, you can define policies for traffic management, network access, and monitoring so you can connect applications in a simple and consistent way across AWS compute services (instances, containers, and serverless functions). VPC Lattice automatically handles network connectivity between VPCs and accounts and network address translation between IPv4, IPv6, and overlapping IP addresses. VPC Lattice integrates with AWS Identity and Access Management (IAM) to give you the same authentication and authorization capabilities you are familiar with when interacting with AWS services today, but for your own service-to-service communication. With VPC Lattice, you have common controls to route traffic based on request characteristics and weighted routing for blue/green and canary-style deployments. For example, VPC Lattice allows you to mix and match compute types for a given service, which helps you modernize a monolith application architecture to microservices.

VPC Lattice is designed to be noninvasive, allowing teams across your organization to incrementally opt in over time. In this way, you are able to deliver applications faster by focusing on your application logic, while VPC Lattice handles service-to-service networking, security, and monitoring requirements.

How Amazon VPC Lattice Works
With VPC Lattice, you create a logical application layer network, called a service network, that connects clients and services across different VPCs and accounts, abstracting network complexity. A service network is a logical boundary that is used to automatically implement service discovery and connectivity as well as apply access and observability policies to a collection of services. It offers inter-application connectivity over HTTP/HTTPS and gRPC protocols within a VPC.

Once a VPC has been enabled for a service network, clients in the VPC will automatically be able to discover the services in the service network through DNS and will direct all inter-application traffic through VPC Lattice. You can use AWS Resource Access Manager (RAM) to control which accounts, VPCs, and applications can establish communication via VPC Lattice.

A service is an independently deployable unit of software that delivers a specific task or function. In VPC Lattice, a service is a logical component that can live in any VPC or account and can run on a mixture of compute types (virtual machines, containers, and serverless functions). A service configuration consists of:

  • One or two listeners that define the port and protocol that the service is expecting traffic on. Supported protocols are HTTP/1.1, HTTP/2, and gRPC, including HTTPS for TLS-enabled services.
  • Listeners have rules that consist of a priority, which specifies the order in which rules should be processed, one or more conditions that define when to apply the rule, and actions that forward traffic to target groups. Each listener has a default rule that takes effect when no additional rules are configured, or no conditions are met.
  • A target group is a collection of targets, or compute resources, that are running a specific workload you are trying to route toward. Targets can be Amazon Elastic Compute Cloud (Amazon EC2) instances, IP addresses, and Lambda functions. For Kubernetes workloads, VPC Lattice can target services and pods via the AWS Gateway Controller for Kubernetes. To have access to the AWS Gateway Controller for Kubernetes, you can join the preview.

VPC Lattice logical architecture.

To configure service access controls, you can use access policies. An access policy is an IAM resource policy that can be associated with a service network and individual services. With access policies, you can use the “PARC” (principal, action, resource, and condition) model to enforce context-specific access controls for services. For example, you can use an access policy to define which services can access a service you own. If you use AWS Organizations, you can limit access to a service network to a specific organization.

VPC Lattice also provides a service directory, a centralized view of the services that you own or have been shared with you via AWS RAM.

Using Amazon VPC Lattice
We expect people with different roles can use VPC Lattice. For example:

  • The service network administrator can:
    • Create and manage a service network.
    • Define access and monitoring for the service network.
    • Associate client and services.
    • Share the service network with other AWS accounts.
  • The service owner can:
    • Create and manage a service, including access and monitoring.
    • Define routing, for example, configuring listeners and rules that point to the target groups where the service is running.
    • Associate a service to service networks.

Let’s see how this works in practice. In this quick walkthrough, I am covering both roles.

Creating Two Backend Services
There is nothing specific to VPC Lattice in this section. I am just creating a couple of services, one running on Amazon EC2 and one on AWS Lambda, that I’ll use later when I configure networking with VPC Lattice.

In an Amazon Linux EC2 instance, I create a web app that replies “Hello from the instance” to HTTP requests. To allow access to the instance from clients coming via VPC Lattice, I add an inbound rule to the security group to allow TCP traffic on port 8080 from the VPC Lattice AWS-managed prefix list.

Here’s the app.py file. I am using Python and Flask for this app, but you don’t need to know them to follow along with the post.

from flask import Flask

app = Flask(__name__)

@app.route('/')
def index():
  return 'Hello from the instance'

@app.route('/<path>')
def somePath(path):
  return 'Hello from the instance at path "{}"'.format(path)

app.run(host='0.0.0.0', port=8080)

Here’s the requirements.txt file with the Python dependencies. There’s only one line because the only module I need is flask:

flask

I install the dependencies:

pip3 install -r requirements.txt

Then, I start the web app using the nohup command to keep it running in case I log out of the instance:

nohup flask run --host=0.0.0.0 --port 8080 &

On the EC2 instance, the web service is now listening to HTTP traffic on port 8080.

In the Lambda console, I create a simple function using the Node.js 18.x runtime that replies “Hello from the function” to all invocations.

exports.handler = async (event) => {
    const response = {
        statusCode: 200,
        body: JSON.stringify('Hello from the function'),
    };
    return response;
};

The two services are now both ready. Let’s use VPC Lattice to configure networking.

Creating VPC Lattice Target Groups
I start by creating two target groups, one for the EC2 instance and one for the Lambda function. In the VPC console, there is a new VPC Lattice section in the navigation pane. There, I choose Target groups and then Create target group.

For the first target group, I choose the Instances target type and enter a name.

Console screenshot.

I choose the protocol (HTTP) and port (8080) used by the web app running on the instance. I select the VPC where the instance is running and the protocol version (HTTP1).

Console screenshot.

Now I can configure the health check that will be used to test the target status. In this case, I use the default values proposed by the console.

Console screenshot.

In the next step, I can register the targets. I select the instance on which the web app is running from the list and choose to include it.

Console screenshot.

I review the selected targets (one instance in this case) and choose Submit.

In a similar way, I create a target group for the Lambda function. This time, I select the function from the list. I can choose which function version or function alias to use. For simplicity, I use the $LATEST version.

Console screenshot.

Creating VPC Lattice Services
Now that the target groups are ready, I choose Services in the navigation pane and then Create service. I enter a name and a description.

Console screenshot.

Now, I can choose the authentication type. If I choose None, the service network does not authenticate or authorize client access, and the auth policy, if present, is not used. I select AWS IAM and then, from the Apply policy template dropdown, the template that allows both authenticated and unauthenticated access.

Console screenshot.

In the Monitoring section, I turn on Access logs. As the destination for the access logs, I use an Amazon CloudWatch Log group that I created before. I also have the option to use an Amazon Simple Storage Service (Amazon S3) bucket or a Amazon Kinesis Data Firehose delivery stream.

Console screenshot.

In the next step, I define routing for the service. I choose Add listener. For the protocol, I configure the service to listen using HTTPS. In the default action, I choose to send two-thirds (Weight 20) of the requests to the instance target group and one-third (Weight 10) to the function target group.

Console screenshot.

Then, I add two additional rules. The first rule (Priority 10) sends all requests where the path is /to-instance to the instance target group.

Console screenshot.

The second rule (Priority 20) sends all traffic where the path is /to-function to the function target group.

Console screenshot.

In the next step, I am asked to associate the service with one or more service networks. I didn’t create a service network yet, so I skip this step for now and choose Next. I review the configuration and create the service.

Creating VPC Lattice Service Networks
Now, I create the service network so that I can associate the service and the VPCs I want to use. I choose Service network from the navigation pane and then Create service network. I enter a name and a description for the service network.

Console screenshot.

In the Associate services, I select the service I just created.

Console screenshot.

In the VPC associations, I select the VPC used by the instance where the web app runs. This can help in the future because it allows the web app to call other services associated with the service network.

Console screenshot.

Then, I select a second VPC where I have another EC2 instance that I want to use to run some tests.

Console screenshot.

For simplicity, in the Access section, I select the None auth type.

Console screenshot.

In the Monitoring section, I choose to send the access logs for the whole service network to an S3 bucket.

Console screenshot.

I review the summary of the configuration and create the service network. After a few seconds all service and VPC associations are active, and I can start using the service.

I write down the domain name of the service from the list of service associations.

Console screenshot.

Testing Access to the Service Using VPC Lattice
I look at the Routing tab of the service to find a nice recap of how the listener is handling routing towards the different target groups.

Console screenshot.

Then, I log into the EC2 instance in my second VPC and use curl to call the service domain name. As expected, I get about two-thirds of the responses from the instance and one-third from the function.

curl https://my-service-03e92ee54968d87ca.7d67968.vpc-lattice-svcs.us-west-2.on.aws
Hello from the instance

curl https://my-service-03e92ee54968d87ca.7d67968.vpc-lattice-svcs.us-west-2.on.aws
Hello from the instance

curl https://my-service-03e92ee54968d87ca.7d67968.vpc-lattice-svcs.us-west-2.on.aws
"Hello from the function"

When I call the /to-instance and /to-function paths, the additional rules forward the requests to the instance and the function, respectively.

curl https://my-service-03e92ee54968d87ca.7d67968.vpc-lattice-svcs.us-west-2.on.aws/to-instance
Hello from the instance "to-instance" path

curl https://my-service-03e92ee54968d87ca.7d67968.vpc-lattice-svcs.us-west-2.on.aws/to-function
"Hello from the function"

I can now review access to my service using the access log subscriptions I configured before.

For the service, I look in the CloudWatch Log group. There, I find a log stream containing detailed access information about the service.

Console screenshot.

The access log for all services associated with the service network is on the S3 bucket. I have only one service for now, but more are coming.

Console screenshot.

Available in Preview
Amazon VPC Lattice is available in preview in the US West (Oregon) Region.

VPC Lattice provides deployment consistency across AWS compute types so that you can connect your services across instances, containers, and serverless functions. You can use VPC Lattice to apply granular and rich traffic controls, such as policy-based routing and weighted targets to support blue/green and canary-style deployments.

VPC Lattice allows monitoring and troubleshooting service-to-service communication with detailed access logs and metrics that capture request type, volume of traffic, error rates, response time, and more. In this blog post, I only scratched the surface of what you can do with VPC Lattice.

Simplify the way you connect, secure, and monitor service-to-service communication with Amazon VPC Lattice.

Reducing Java cold starts on AWS Lambda functions with SnapStart

Post Syndicated from Eric Johnson original https://aws.amazon.com/blogs/compute/reducing-java-cold-starts-on-aws-lambda-functions-with-snapstart/

Written by Mark Sailes, Senior Serverless Solutions Architect, AWS.

At AWS re:Invent 2022, AWS announced SnapStart for AWS Lambda functions running on Java Corretto 11. This feature enables customers to achieve up to 10x faster function startup performance for Java functions, at no additional cost, and typically with minimal or no code changes.

Overview

Today, for Lambda’s function invocations, the largest contributor to startup latency is the time spent initializing a function. This includes loading the function’s code and initializing dependencies. For interactive workloads that are sensitive to start-up latencies, this can cause suboptimal end user experience.

To address this challenge, customers either provision resources ahead of time, or spend effort building relatively complex performance optimizations, such as compiling with GraalVM native-image. Although these workarounds help reduce the startup latency, users must spend time on some heavy lifting instead of focusing on delivering business value. SnapStart addresses this concern directly for Java-based Lambda functions.

How SnapStart works

With SnapStart, when a customer publishes a function version, the Lambda service initializes the function’s code. It takes an encrypted snapshot of the initialized execution environment, and persists the snapshot in a tiered cache for low latency access.

When the function is first invoked and then scaled, Lambda resumes the execution environment from the persisted snapshot instead of initializing from scratch. This results in a lower startup latency.

Lambda function lifecycle

Lambda function lifecycle

A function version activated with SnapStart transitions to an inactive state if it remains idle for 14 days, after which Lambda deletes the snapshot. When you try to invoke a function version that is inactive, the invocation fails. Lambda sends a SnapStartNotReadyException and begins initializing a new snapshot in the background, during which the function version remains in Pending state. Wait until the function reaches the Active state, and then invoke it again. To learn more about this process and the function states, read the documentation.

Using SnapStart

Application frameworks such as Spring give developers an enormous productivity gain by reducing the amount of boilerplate code they write to accomplish common tasks. When first created, frameworks didn’t have to consider startup time because they run on application servers, which run for long periods of time. The startup time is minimal compared to the running duration. You often only restart them when there is an application version change.

If the functionality that these frameworks bring is implemented at runtime, then they often contribute to latency in startup time. SnapStart allows you to use frameworks like Spring and not compromise tail latency.

To demonstrate SnapStart, I use a sample application that saves records into Amazon DynamoDB. This Spring Boot application (TODO Link) uses a REST controller to handle CRUD requests. This sample includes infrastructure as code to deploy the application using the AWS Serverless Application Model (AWS SAM). You must install the AWS SAM CLI to deploy this example.

To deploy:

  1. Clone the git repository and change to project directory:
    git clone https://github.com/aws-samples/serverless-patterns.git
    cd serverless-patterns/apigw-lambda-snapstart
  2. Use the AWS SAM CLI to build the application:
    sam build
  3. Use the AWS SAM CLI to deploy the resources to your AWS account:
    sam deploy -g

This project deploys with SnapStart already enabled. To enable or disable this functionality in the AWS Management Console:

  1. Navigate to your Lambda function.
  2. Select the Configuration tab.
  3. Choose Edit and change the SnapStart attribute to PublishedVersions.
  4. Choose Save.

    Lambda Console confoguration

    Lambda Console confoguration

  5. Select the Versions tab and choose Publish new.
  6. Choose Publish.

Once you’ve enabled SnapStart, Lambda publishes all subsequent versions with snapshots. The time to run your publish version depends on your init code. You can run init up to 15 minutes with this feature.

Considerations

Stale credentials

Using SnapStart and restoring from a snapshot often changes how you create functions. With on-demand functions, you might access one time data in the init phase, and then reuse it during future invokes. If this data is ephemeral, a database password for example, then there might be a time between fetching the secret and using it, that the password has changed leading to an error. You must write code to handle this error case.

With SnapStart, if you follow the same approach, your database password is persisted in an encrypted snapshot. All future execution environments have the same state. This can be days, weeks, or longer after the snapshot is taken. This makes it more likely that your function has the incorrect password stored. To improve this, you could move the functionality to fetch the password to the post-snapshot hook. With each approach, it is important to understand your application’s needs and handle errors when they occur.

Demo application architecture

Demo application architecture

A second challenge in sharing the initial state is with randomness and uniqueness. If random seeds are stored in the snapshot during the initialization phase, then it may cause random numbers to be predictable.

Cryptography

AWS has changed the managed runtime to help customers handle the effects of uniqueness and randomness when restoring functions.

Lambda has already incorporated updates to Amazon Linux 2 and one of the commonly used cryptographic libraries, OpenSSL (1.0.2), to make them resilient to snapshot operations. AWS has also validated that Java runtime’s built-in RNG java.security.SecureRandom maintains uniqueness when resuming from a snapshot.

Software that always gets random numbers from the operating system (for example, from /dev/random or /dev/urandom) is already resilient to snapshot operations. It does not need updates to restore uniqueness. However, customers who prefer to implement uniqueness using custom code for their Lambda functions must verify that their code restores uniqueness when using SnapStart.

For more details, read Starting up faster with AWS Lambda SnapStart and refer to Lambda documentation on SnapStart uniqueness.

Runtime hooks

These pre- and post-hooks give developers a way to react to the snapshotting process.

For example, a function that must always preload large amounts of data from Amazon S3 should do this before Lambda takes the snapshot. This embeds the data in the snapshot so that it does not need fetching repeatedly. However, in some cases, you may not want to keep ephemeral data. A password to a database may be rotated frequently and cause unnecessary errors. I discuss this in greater detail in a later section.

The Java managed runtime uses the open-source Coordinated Restore at Checkpoint (CRaC) project to provide hook support. The managed Java runtime contains a customized CRaC context implementation that calls your Lambda function’s runtime hooks before completing snapshot creation and after restoring the execution environment from a snapshot.

The following function example shows how you can create a function handler with runtime hooks. The handler implements the CRaC Resource and the Lambda RequestHandler interface.

...
import org.crac.Resource;
import org.crac.Core;
...

public class HelloHandler implements RequestHandler<String, String>, Resource {

    public HelloHandler() {
        Core.getGlobalContext().register(this);
    }

    public String handleRequest(String name, Context context) throws IOException {
        System.out.println("Handler execution");
        return "Hello " + name;
    }

    @Override
    public void beforeCheckpoint(org.crac.Context<? extends Resource> context) throws Exception {
        System.out.println("Before Checkpoint");
    }

    @Override
    public void afterRestore(org.crac.Context<? extends Resource> context) throws Exception {
        System.out.println("After Restore");
    }
}

For the classes required to write runtime hooks, add the following dependency to your project:

Maven

<dependency>
  <groupId>io.github.crac</groupId>
  <artifactId>org-crac</artifactId>
  <version>0.1.3</version>
</dependency>

Gradle

implementation 'io.github.crac:org-crac:0.1.3'

Priming

SnapStart and runtime hooks give you new ways to build your Lambda functions for low startup latency. You can use the pre-snapshot hook to make your Java application as ready as possible for the first invoke. Do as much as possible within your function before the snapshot is taken. This is called priming.

When you upload your zip file of Java code to Lambda, the zip contains .class files of bytecode. This can be run on any machine with a JVM. When the JVM executes your bytecode, it is initially interpreted, then compiled into native machine code. This compilation stage is relatively CPU intensive and happens just in time (JIT Compiler).

You can use the before snapshot hook to run code paths before the snapshot is taken. The JVM compiles these code paths and the optimization is kept for future restores. For example, if you have a function that integrates with DynamoDB, you can make a read operation in your before snapshot hook.

This means that your function code, the AWS SDK for Java, and any other libraries used in that action are compiled and kept within the snapshot. The JVM then won’t need to compile this code when your function is invoked, meaning your latency is less the first time an execution environment is invoked.

Priming requires that you understand your application code and the consequences of executing it. The sample application includes a before snapshot hook, which primes the application by making a read operation from DynamoDB. (TODO Link)

Metrics

The following chart reflects invoking the sample application Lambda function 100 times per second for 10 minutes. This test is based on this function, both with and without SnapStart.


p50 p99.9
On-demand 7.87ms 5,114ms
SnapStart 7.87ms 488ms

Conclusion

This blog shows how SnapStart reduces startup (cold-start) latencies times for Java-based Lambda functions. You can configure SnapStart using AWS SDK, AWS CloudFormation, AWS SAM, and CDK.

To learn more, see Configuring function options in the AWS documentation. This functionality may require some minimal code changes. In most cases, the existing code is already compatible with SnapStart. You can now bring your latency-sensitive Java-based workloads to Lambda and run with improved tail latencies.

This feature allows developers to use the on-demand model in Lambda with low-latency response times, without incurring extra cost. To read more about how to use SnapStart with partner frameworks, find out more from Quarkus and Micronaut. To read more about this and other features, visit Serverless Land.

Starting up faster with AWS Lambda SnapStart

Post Syndicated from Eric Johnson original https://aws.amazon.com/blogs/compute/starting-up-faster-with-aws-lambda-snapstart/

This blog written by Tarun Rai Madan, Sr. Product Manager, AWS Lambda, and Mike Danilov, Sr. Principal Engineer, AWS Lambda.

AWS Lambda SnapStart is a new performance optimization developed by AWS that can significantly improve the startup time for applications. Announced at AWS re:Invent 2022, the first capability to feature SnapStart is Lambda SnapStart for Java. This feature delivers up to 10x faster function startup times for latency-sensitive Java applications at no extra cost, and with minimal or no code changes.

Overview

When applications start up, whether it’s an app on your phone, or a serverless Lambda function, they go through initialization. The initialization process can vary based on the application and the programming language, but even the smallest applications written in the most efficient programming languages require some kind of initialization before they can do anything useful. For a Lambda function, the initialization phase involves downloading the function’s code, starting the runtime and any external dependencies, and running the function’s initialization code. Ordinarily, for a Lambda function, this initialization happens every time your application scales up to create a new execution environment.

With SnapStart, the function’s initialization is done ahead of time when you publish a function version. Lambda takes a Firecracker microVM snapshot of the memory and disk state of the initialized execution environment, encrypts the snapshot, and caches it for low-latency access. When your application starts up and scales to handle traffic, Lambda resumes new execution environments from the cached snapshot instead of initializing them from scratch, improving startup performance.

The following diagram compares a cold start request lifecycle for a non-SnapStart function and a SnapStart function. The time it takes to initialize the function, which is the predominant contributor to high startup latency, is replaced by a faster resume phase with SnapStart.

Diagram of a non-SnapStart function versus a SnapStart function

Diagram of a non-SnapStart function versus a SnapStart function

Request lifecycle for a non-SnapStart function versus a SnapStart function

Front loading the initialization phase can significantly improve the startup performance for latency-sensitive Lambda functions, such as synchronous microservices that are sensitive to initialization time. Because Java is a dynamic language with its own runtime and garbage collector, Lambda functions written in Java can be amongst the slowest to initialize. For applications that require frequent scaling, the delay introduced by initialization, commonly referred to as a cold start, can lead to a suboptimal experience for end users. Such applications can now start up faster with SnapStart.

AWS’ work in Firecracker makes it simple to use SnapStart. Because SnapStart uses micro Virtual Machine (microVM) snapshots to checkpoint and restore full applications, the approach is adaptable and general purpose. It can be used to speed up many kinds of application starts. While microVMs have long been used for strong secure isolation between applications and environments, the ability to front-load initialization with SnapStart means that microVMs can also augment performance savings at scale.

SnapStart and uniqueness

Lambda SnapStart speeds up applications by re-using a single initialized snapshot to resume multiple execution environments. As a result, unique content included in the snapshot during initialization is reused across execution environments, and so may no longer remain unique. A class of applications where uniqueness of state is a key consideration is cryptographic software, which assumes that the random numbers are truly random (both random and unpredictable). If content such as a random seed is saved in the snapshot during initialization, it is re-used when multiple execution environments resume and may produce predictable random sequences.

To maintain uniqueness, you must verify before using SnapStart that any unique content previously generated during the initialization now gets generated after that initialization. This includes unique IDs, unique secrets, and entropy used to generate pseudo-randomness.

Multiple execution environments resumed from a shared snapshot

SnapStart life cycle

SnapStart life cycle

However, we have implemented a few things to make it easier for customers to maintain uniqueness.

First, it is not common or a best practice for applications to generate these unique items directly. Still, it’s worth confirming that your application handles uniqueness correctly. That’s usually a matter of checking for any unique IDs, keys, timestamps, or “homemade” entropy in the initializer methods for your function.

Lambda offers a SnapStart scanning tool that checks for certain categories of code that assume uniqueness, so customers can make changes as required. The SnapStart scanning tool is an open-source SpotBugs plugin that runs static analysis against a set of rules and reports “potential SnapStart bugs”. We are committed to engaging with the community to expand these set of rules against which the scanning tool checks the code.

As an example, the following Lambda function creates a unique log stream for each execution environment during initialization. This unique value is re-used across execution environments when they re-use a snapshot.

public class LambdaUsingUUID {

    private AWSLogsClient logs;
    private final UUID sandboxId;

    public LambdaUsingUUID() {
       sandboxId = UUID.randomUUID(); // <-- unique content created
       logs = new AWSLogsClient();
    }
    @Override
    public String handleRequest(Map<String,String> event, Context context) {
       CreateLogStreamRequest request = new CreateLogStreamRequest(
         "myLogGroup", sandboxId + ".log9.txt");
         logs.createLogStream(request);     
         return "Hello world!";
    }
} 

When you run the scanning tool on the previous code, the following message helps identify a potential implementation that assumes uniqueness. One way to address such cases is to move the generation of the unique ID inside your function’s handler method.

H C SNAP_START: Detected a potential SnapStart bug in Lambda function initialization code. At LambdaUsingUUID.java: [line 7]

A best practice used by many applications is to rely on the system libraries and kernel for uniqueness. These have long-handled other cases where keys and IDs may be inadvertently duplicated, such as when forking or cloning processes. AWS has worked with upstream kernel maintainers and open source developers so that the existing protection mechanisms use the open standard VM Generation ID (vmgenid) that SnapStart supports. vmgenid is an emulated device, which exposes a 128-bit, cryptographically random integer value identifier to the kernel, and is statistically unique across all resumed microVMs.

Lambda’s included versions of Amazon Linux 2, OpenSSL (1.0.2), and java.security.SecureRandom all automatically re-initialize their randomness and secrets after a SnapStart. Software that always gets random numbers from the operating system (for example, from /dev/random or /dev/urandom) does not need any updates to maintain randomness. Because Lambda always reseeds /dev/random and /dev/urandom when restoring a snapshot, random numbers are not repeated even when multiple execution environments resume from the same snapshot.

Lambda’s request IDs are already unique for each invocation and are available using the getAwsRequestId() method of the Lambda request object. Most Lambda functions should require no modification to run with SnapStart enabled. It’s generally recommended that for SnapStart, you do not include unique state in the function’s initialization code, and use cryptographically secure random number generators (CSPRNGs) when needed.

Second, if you do want to create unique data directly in a Lambda function initialization phase, Lambda supports two new runtime hooks. Runtime hooks are available as part of the open-source Coordinated Restore at Checkpoint (CRaC) project. You can use the beforeCheckpoint hook to run code immediately before a snapshot is taken, and use the afterRestore hook to run code immediately after restoring a snapshot. This helps you delete any unique content before the snapshot is created, and restore any unique content after the snapshot is restored. For an example of how to use CRaC with a reference application, see the CRaC GitHub repository.

Conclusion

This blog describes how SnapStart optimizes startup performance under the hood, and outlines considerations around uniqueness. We also introduce the new interfaces that AWS Lambda provides (via scanning tool and runtime hooks) to customers to maintain uniqueness for their SnapStart functions.

SnapStart is made possible by several pieces of open-source work, including Firecracker, Linux, CraC, OpenSSL and more. AWS is grateful to the maintainers and developers who have made this possible. With this work, we’re excited to launch Lambda SnapStart for Java as what we hope is the first amongst many other capabilities to benefit from the performance savings and enhanced security that SnapStart microVMs provide.

For more serverless learning resources, visit Serverless Land.

New – Accelerate Your Lambda Functions with Lambda SnapStart

Post Syndicated from Jeff Barr original https://aws.amazon.com/blogs/aws/new-accelerate-your-lambda-functions-with-lambda-snapstart/

Our customers tell me that they love AWS Lambda for many reasons. On the development side they appreciate the simple programming model and ease with which their functions can make use of other AWS services. On the operations side they benefit from the ability to build powerful applications that can respond quickly to changing usage patterns.

As you might know if you are already using Lambda, your functions are run inside of a secure and isolated execution environment. The lifecycle of each environment consists of three main phases: Init, Invoke, and Shutdown. Among other things, the Init phase bootstraps the runtime for the function and runs the function’s static code. In many cases, these operations are completed within milliseconds and do not lengthen the phase in any appreciable way. In the remaining cases, they can take a considerable amount of time, for several reasons. First, initializing the runtime for some languages can be expensive. For example, the Init phase for a Lambda function that uses one of the Java runtimes in conjunction with a framework such as Spring Boot, Quarkus, or Micronaut can sometimes take as long as ten seconds (this includes dependency injection, compilation of the code for the function, and classpath component scanning). Second, the static code might download some machine learning models, pre-compute some reference data, or establish network connections to other AWS services.

Introducing Lambda SnapStart
In order to allow you to put Lambda to use in even more ways, we are introducing Lambda SnapStart today.

After you enable Lambda SnapStart for a particular Lambda function, publishing a new version of the function will trigger an optimization process. The process launches your function and runs it through the entire Init phase. Then it takes an immutable, encrypted snapshot of the memory and disk state, and caches it for reuse. When the function is subsequently invoked, the state is retrieved from the cache in chunks on an as-needed basis and used to populate the execution environment. This optimization makes invocation time faster and more predictable, since creating a fresh execution environment no longer requires a dedicated Init phase.

We are launching with support for Java functions that make use of the Corretto (java11) runtime, and expect to see Lambda SnapStart put to use right away for applications that make use of Spring Boot, Quarkus, Micronaut, and other Java frameworks. Enabling Lambda SnapStart for Java functions can make them start up to 10x faster, at no extra cost.

Using Lambda SnapStart
Because my last actual encounter with Java took place in the last century, I used the Serverless Spring Boot 2 example from the AWS Labs repo as a starting point. I installed the AWS SAM CLI and did a test build & deploy to establish a baseline. I invoked the function and saw that the Init duration was slightly more than 6 seconds:

Then I added two lines to template.yml to configure the SnapStart property:

I rebuilt and redeployed, published a fresh version of the function to set up SnapStart, and ran another test:

With SnapStart, the initialization phase (represented by the Init duration that I showed you earlier) happens when I publish a new version of the function. When I invoke a function that has SnapStart enabled, Lambda restores the snapshot (represented by the Restore duration) before invoking the function handler. As a result, the total cold invoke with SnapStart is now Restore duration + Duration. SnapStart has reduced the cold start duration from over 6 seconds to less than 200 ms.

Becoming Snap-Resilient
Lambda SnapStart speeds up applications by reusing a single initialized snapshot to resume multiple execution environments. This has a few interesting implications for your code:

Uniqueness – When using SnapStart, any unique content that used to be generated during the initialization must now be generated after initialization in order to maintain uniqueness. If you (or a library that you reference) uses a pseudo-random number generator, it should not be based on a seed that is obtained during the Init phase. We have updated OpenSSL’s RAND_Bytes to ensure randomness when used in conjunction with SnapStart, and we have verified that java.security.SecureRandom is already snap-resilient. Amazon Linux’s /dev/random and /dev/urandom are also snap-resilient.

Network Connections -If your code creates long-term connections to network services during the Init phase and uses them during the Invoke phase, make sure that it can re-establish the connection if necessary. The AWS SDKs have already been updated to do this.

Ephemeral Data – This is effectively a more general form of the above items. If your code downloads or computes reference information during the Init phase, consider doing a quick check to make sure that it has not gone stale during the caching period.

Lambda provides a pair of runtime hooks to help you to maintain uniqueness, as well as a scanning tool to help detect possible issues.

Things to Know
Here are a couple of other things to know about Lambda SnapStart:

Caching – Cached snapshots are removed after 14 days of inactivity. Lambda will automatically refresh the cache if a snapshot depends on a runtime that has been updated or patched.

Pricing – There is no extra charge for the use of Lambda SnapStart.

Feature Compatibility – You cannot use Lambda SnapStart with larger ephemeral storage, Elastic File Systems, Provisioned Concurrency, or Graviton2. In general, we recommend using SnapStart for your general-purpose Lambda functions and Provisioned Concurrency for the subset of those functions that are exceptionally sensitive to latency.

Firecracker – This feature makes use of Firecracker Snapshotting.

Regions – Lambda SnapStart is available in the US East (Ohio, N. Virginia), US West (Oregon), Asia Pacific (Singapore, Sydney, Tokyo), and Europe (Frankfurt, Ireland, Stockholm) Regions.

— Jeff;

Amazon Inspector Now Scans AWS Lambda Functions for Vulnerabilities

Post Syndicated from Marcia Villalba original https://aws.amazon.com/blogs/aws/amazon-inspector-now-scans-aws-lambda-functions-for-vulnerabilities/

Amazon Inspector is a vulnerability management service that continually scans workloads across Amazon Elastic Compute Cloud (Amazon EC2) instances, container images living in Amazon Elastic Container Registry (Amazon ECR), and, starting today, AWS Lambda functions and Lambda layers.

Until today, customers that wanted to analyze their mixed workloads (including EC2 instances, container images, and Lambda functions) against common vulnerabilities needed to use AWS and third-party tools. This increased the complexity of keeping all their workloads secure.

In addition, the log4j vulnerability a few months ago was a great example that scanning your functions for vulnerabilities only before deployment is not enough. Because new vulnerabilities can appear at any time, it is very important for the security of your applications that the workloads are continuously monitored and rescanned in near real-time as new vulnerabilities are published.

Getting started
The first step to getting started with Amazon Inspector is to enable it for your account or your entire AWS Organizations. Once activated, Amazon Inspector automatically scans the functions in the selected accounts. Amazon Inspector is a native AWS service; this means that you don’t need to install a library or agent in your functions or layers for this to work.

Amazon Inspector is available starting today for functions and layers written in Java, NodeJS, and Python. By default, it continually scans all the functions inside your account, but if you want to exclude a particular Lambda function, you can attach the tag with the key InspectorExclusion and the value LambdaStandardScanning.

Amazon Inspector scans functions and layers initially upon deployment and automatically rescans them when there are changes in the workloads, for example, when a Lambda function is updated or when a new vulnerability (CVE) is published.

Summary for Amazon Inspector findings

In addition to functions, Amazon Inspector scans your Lambda layers; however, it only scans the specific layer version that is used in a function. If a layer or layer version is not used by any function, then it won’t get analyzed. If you are using third-party layers, Amazon Inspector also scans them for vulnerabilities.

You can see the findings for the different functions in the Amazon Inspector Findings console filtered By Lambda function. When Amazon Inspector finds something, all the findings are routed to AWS Security Hub and to Amazon EventBridge so you can build automation workflows, like sending notifications to the developers or system administrators.

Findings by function

Available Now
Amazon Inspector support for AWS Lambda functions and layers is generally available today in US East (Ohio), US East (N. Virginia), US West (N. California), US West (Oregon), Asia Pacific (Hong Kong), Asia Pacific (Mumbai), Asia Pacific (Seoul), Asia Pacific (Singapore), Asia Pacific (Sydney), Asia Pacific (Tokyo), Canada (Central), Europe (Frankfurt), Europe (Ireland), Europe (London), Europe (Milan), Europe (Paris), Europe (Stockholm), Middle East (Bahrain), and South America (Sao Paulo).

If you want to try this new feature, there is a 15-day free trial for you. Visit the service page to read more about the service and the free trial.

— Marcia

AWS Week in Review – November 21, 2022

Post Syndicated from Danilo Poccia original https://aws.amazon.com/blogs/aws/aws-week-in-review-november-21-2022/

This post is part of our Week in Review series. Check back each week for a quick roundup of interesting news and announcements from AWS!

A new week starts, and the News Blog team is getting ready for AWS re:Invent! Many of us will be there next week and it would be great to meet in person. If you’re coming, do you know about PeerTalk? It’s an onsite networking program for re:Invent attendees available through the AWS Events mobile app (which you can get on Google Play or Apple App Store) to help facilitate connections among the re:Invent community.

If you’re not coming to re:Invent, no worries, you can get a free online pass to watch keynotes and leadership sessions.

Last Week’s Launches
It was a busy week for our service teams! Here are the launches that got my attention:

AWS Region in Spain – The AWS Region in Aragón, Spain, is now open. The official name is Europe (Spain), and the API name is eu-south-2.

Amazon Athena – You can now apply AWS Lake Formation fine-grained access control policies with all table and file format supported by Amazon Athena to centrally manage permissions and access data catalog resources in your Amazon Simple Storage Service (Amazon S3) data lake. With fine-grained access control, you can restrict access to data in query results using data filters to achieve column-level, row-level, and cell-level security.

Amazon EventBridge – With these additional filtering capabilities, you can now filter events by suffix, ignore case, and match if at least one condition is true. This makes it easier to write complex rules when building event-driven applications.

AWS Controllers for Kubernetes (ACK) – The ACK for Amazon Elastic Compute Cloud (Amazon EC2) is now generally available and lets you provision and manage EC2 networking resources, such as VPCs, security groups and internet gateways using the Kubernetes API. Also, the ACK for Amazon EMR on EKS is now generally available to allow you to declaratively define and manage EMR on EKS resources such as virtual clusters and job runs as Kubernetes custom resources. Learn more about ACK for Amazon EMR on EKS in this blog post.

Amazon HealthLake – New analytics capabilities make it easier to query, visualize, and build machine learning (ML) models. Now HealthLake transforms customer data into an analytics-ready format in near real-time so that you can query, and use the resulting data to build visualizations or ML models. Also new is Amazon HealthLake Imaging (preview), a new HIPAA-eligible capability that enables you to easily store, access, and analyze medical images at any scale. More on HealthLake Imaging can be found in this blog post.

Amazon RDS – You can now transfer files between Amazon Relational Database Service (RDS) for Oracle and an Amazon Elastic File System (Amazon EFS) file system. You can use this integration to stage files like Oracle Data Pump export files when you import them. You can also use EFS to share a file system between an application and one or more RDS Oracle DB instances to address specific application needs.

Amazon ECS and Amazon EKS – We added centralized logging support for Windows containers to help you easily process and forward container logs to various AWS and third-party destinations such as Amazon CloudWatch, S3, Amazon Kinesis Data Firehose, Datadog, and Splunk. See these blog posts for how to use this new capability with ECS and with EKS.

AWS SAM CLI – You can now use the Serverless Application Model CLI to locally test and debug an AWS Lambda function defined in a Terraform application. You can see a walkthrough in this blog post.

AWS Lambda – Now supports Node.js 18 as both a managed runtime and a container base image, which you can learn more about in this blog post. Also check out this interesting article on why and how you should use AWS SDK for JavaScript V3 with Node.js 18. And last but not least, there is new tooling support to build and deploy native AOT compiled .NET 7 applications to AWS Lambda. With this tooling, you can enable faster application starts and benefit from reduced costs through the faster initialization times and lower memory consumption of native AOT applications. Learn more in this blog post.

AWS Step Functions – Now supports cross-account access for more than 220 AWS services to process data, automate IT and business processes, and build applications across multiple accounts. Learn more in this blog post.

AWS Fargate – Adds the ability to monitor the utilization of the ephemeral storage attached to an Amazon ECS task. You can track the storage utilization with Amazon CloudWatch Container Insights and ECS Task Metadata endpoint.

AWS Proton – Now has a centralized dashboard for all resources deployed and managed by AWS Proton, which you can learn more about in this blog post. You can now also specify custom commands to provision infrastructure from templates. In this way, you can manage templates defined using the AWS Cloud Development Kit (AWS CDK) and other templating and provisioning tools. More on CDK support and AWS CodeBuild provisioning can be found in this blog post.

AWS IAM – You can now use more than one multi-factor authentication (MFA) device for root account users and IAM users in your AWS accounts. More information is available in this post.

Amazon ElastiCache – You can now use IAM authentication to access Redis clusters. With this new capability, IAM users and roles can be associated with ElastiCache for Redis users to manage their cluster access.

Amazon WorkSpaces – You can now use version 2.0 of the WorkSpaces Streaming Protocol (WSP) host agent that offers significant streaming quality and performance improvements, and you can learn more in this blog post. Also, with Amazon WorkSpaces Multi-Region Resilience, you can implement business continuity solutions that keep users online and productive with less than 30-minute recovery time objective (RTO) in another AWS Region during disruptive events. More on multi-region resilience is available in this post.

Amazon CloudWatch RUM – You can now send custom events (in addition to predefined events) for better troubleshooting and application specific monitoring. In this way, you can monitor specific functions of your application and troubleshoot end user impacting issues unique to the application components.

AWS AppSync – You can now define GraphQL API resolvers using JavaScript. You can also mix functions written in JavaScript and Velocity Template Language (VTL) inside a single pipeline resolver. To simplify local development of resolvers, AppSync released two new NPM libraries and a new API command. More info can be found in this blog post.

AWS SDK for SAP ABAP – This new SDK makes it easier for ABAP developers to modernize and transform SAP-based business processes and connect to AWS services natively using the SAP ABAP language. Learn more in this blog post.

AWS CloudFormation – CloudFormation can now send event notifications via Amazon EventBridge when you create, update, or delete a stack set.

AWS Console – With the new Applications widget on the Console home, you have one-click access to applications in AWS Systems Manager Application Manager and their resources, code, and related data. From Application Manager, you can view the resources that power your application and your costs using AWS Cost Explorer.

AWS Amplify – Expands Flutter support (developer preview) to Web and Desktop for the API, Analytics, and Storage use cases. You can now build cross-platform Flutter apps with Amplify that target iOS, Android, Web, and Desktop (macOS, Windows, Linux) using a single codebase. Learn more on Flutter Web and Desktop support for AWS Amplify in this post. Amplify Hosting now supports fully managed CI/CD deployments and hosting for server-side rendered (SSR) apps built using Next.js 12 and 13. Learn more in this blog post and see how to deploy a NextJS 13 app with the AWS CDK here.

Amazon SQS – With attribute-based access control (ABAC), you can define permissions based on tags attached to users and AWS resources. With this release, you can now use tags to configure access permissions and policies for SQS queues. More details can be found in this blog.

AWS Well-Architected Framework – The latest version of the Data Analytics Lens is now available. The Data Analytics Lens is a collection of design principles, best practices, and prescriptive guidance to help you running analytics on AWS.

AWS Organizations – You can now manage accounts, organizational units (OUs), and policies within your organization using CloudFormation templates.

For a full list of AWS announcements, be sure to keep an eye on the What’s New at AWS page.

Other AWS News
A few more stuff you might have missed:

Introducing our final AWS Heroes of the year – As the end of 2022 approaches, we are recognizing individuals whose enthusiasm for knowledge-sharing has a real impact with the AWS community. Please meet them here!

The Distributed Computing Manifesto – Werner Vogles, VP & CTO at Amazon.com, shared the Distributed Computing Manifesto, a canonical document from the early days of Amazon that transformed the way we built architectures and highlights the challenges faced at the end of the 20th century.

AWS re:Post – To make this community more accessible globally, we expanded the user experience to support five additional languages. You can now interact with AWS re:Post also using Traditional Chinese, Simplified Chinese, French, Japanese, and Korean.

For AWS open-source news and updates, here’s the latest newsletter curated by Ricardo to bring you the most recent updates on open-source projects, posts, events, and more.

Upcoming AWS Events
As usual, there are many opportunities to meet:

AWS re:Invent – Our yearly event is next week from November 28 to December 2. If you can’t be there in person, get your free online pass to watch live the keynotes and the leadership sessions.

AWS Community Days – AWS Community Day events are community-led conferences to share and learn together. Join us in Sri Lanka (on December 6-7), Dubai, UAE (December 10), Pune, India (December 10), and Ahmedabad, India (December 17).

That’s all from me for this week. Next week we’ll focus on re:Invent, and then we’ll take a short break. We’ll be back with the next Week in Review on December 12!

— Danilo

ICYMI: Serverless pre:Invent 2022

Post Syndicated from Benjamin Smith original https://aws.amazon.com/blogs/compute/icymi-serverless-preinvent-2022/

During the last few weeks, the AWS serverless team has been releasing a wave of new features in the build-up to AWS re:Invent 2022. This post recaps some of the most important releases for serverless developers building event-driven applications.

AWS Lambda

Lambda Support for Node.js 18

You can now develop Lambda functions using the Node.js 18 runtime. This version is in active LTS status and considered ready for general use. When creating or updating functions, specify a runtime parameter value of nodejs18.x or use the appropriate container base image to use this new runtime. Lambda’s Node.js runtimes include the AWS SDK for JavaScript.

This enables customers to use the AWS SDK to connect to other AWS services from their function code, without having to include the AWS SDK in their function deployment. This is especially useful when creating functions in the AWS Management Console. It’s also useful for Lambda functions deployed as inline code in CloudFormation templates. This blog post explains the major changes available with the Node.js 18 runtime in Lambda.

Lambda Telemetry API

The AWS Lambda team launched Lambda Telemetry API to provide an easier way to receive enhanced function telemetry directly from the Lambda service and send it to custom destinations. This makes it easier for developers and operators using third-party observability extensions to monitor and observe their Lambda functions.

The Lambda Telemetry API is an enhanced version of Logs API, which enables extensions to receive platform events, traces, and metrics directly from Lambda in addition to logs. This enables tooling vendors to collect enriched telemetry from their extensions, and send to any destination.

To see how the Telemetry API works, try the demos in the GitHub repository. Build your own extensions using the Telemetry API today, or use extensions provided by the Lambda observability partners.

.NET tooling

Lambda launched tooling support to enable applications running .NET 7 to be built and deployed on AWS Lambda. This includes applications compiled using .NET 7 native AOT. .NET 7 is the latest version of .NET and brings many performance improvements and optimizations. Customers can use .NET 7 with Lambda in two ways. First, Lambda has released a base container image for .NET 7, enabling customers to build and deploy .NET 7 functions as container images. Second, you can use Lambda’s custom runtime support to run functions compiled to native code using .NET 7 native AOT.

The new AWS Parameters and Secrets Lambda Extension provides a convenient method for Lambda users to retrieve parameters from AWS Systems Manager Parameter Store and secrets from AWS Secrets Manager. Use the extension to improve application performance by reducing latency and cost of retrieving parameters and secrets. The extension caches parameters and secrets, and persists them throughout the lifecycle of the Lambda function.

Amazon EventBridge

Amazon EventBridge Scheduler

Amazon EventBridge announced Amazon EventBridge Scheduler, a new capability that allows you to create, run, and manage scheduled tasks at scale. With EventBridge Scheduler, you can schedule one-time or recurrently tens of millions of tasks across many AWS services without provisioning or managing underlying infrastructure.

With EventBridge Scheduler, you can create schedules that trigger over 200 services with more than 6,000 APIs. EventBridge Scheduler allows you to configure schedules with a minimum granularity of one minute. It is priced per one million invocations, and the service is included in the AWS Free Tier. See the pricing page for more information. Visit the launch blog post to get started with EventBridge scheduler.

EventBridge now supports enhanced filtering capabilities including the ability to match against characters at the end of a value (suffix filtering), to ignore case sensitivity (equals-ignore-case), and to have a single EventBridge rule match if any conditions across multiple separate fields are true (OR matching). The bounds supported for numeric values has also been increased from -5e9 to 5e9 from -1e9 to 1e9. The new filtering capabilities further reduce the need to write and manage custom filtering code in downstream services.

AWS Step Functions

Intrinsic Functions

We have added 14 new intrinsic functions to AWS Step Functions. These are Amazon States Language (ASL) functions that perform basic data transformations. Intrinsic functions allow you to reduce the use of other services, such as AWS Lambda or AWS Fargate to perform basic data manipulation. This helps to reduce the amount of code and maintenance in your application. Intrinsics can also help reduce the cost of running your workflows by decreasing the number of states, number of transitions, and total workflow duration.

Standard Workflows, Express Workflows, and synchronous Express Workflows all support the new intrinsic functions, which can be grouped into six categories:

The intrinsic functions documentation contains the complete list of intrinsics.

Cross-account access capabilities

Now, customers can take advantage of identity-based policies in Step Functions so your workflow can directly invoke resources in other AWS accounts, allowing cross-account service API integrations. The compute blog post demonstrates how to use cross-account capability using two AWS accounts.

New executions experience for Express Workflows

Step Functions now provides a new console experience for viewing and debugging your Express Workflow executions that makes it easier to trace and root cause issues in your executions.

You can opt in to the new console experience of Step Functions, which allows you to inspect executions using three different views: graph, table, and event view, and add many new features to enhance the navigation and analysis of the executions. You can search and filter your executions and the events in your executions using unique attributes such as state name and error type. Errors are now easier to root cause as the experience highlights the reason for failure in a workflow execution.

The new execution experience for Express Workflows is now available in all Regions where AWS Step Functions is available. For a complete list of Regions and service offerings, see AWS Regions.

Step Functions Workflows Collection

The AWS Serverless Developer Advocate team created the Step Functions Workflows Collection, a fresh experience that makes it easier to discover, deploy, and share Step Functions workflows. Use the Step Functions workflows collection to find simple “building blocks”, reusable patterns, and example applications to help build your serverless applications with Step Functions. All Step Functions builders are invited to contribute to the collection. This is done by submitting a pull request to the Step Functions Workflows Collection GitHub repository. Each submission is reviewed by the Serverless Developer advocate team for quality and relevancy before publishing.

AWS Serverless Application Model (AWS SAM)

AWS SAM Connector

Speed up serverless development while maintaining secure best practices using new AWS SAM connector. AWS SAM Connector allows builders to focus on the relationships between components without expert knowledge of AWS Identity and Access Management (IAM) or direct creation of custom policies. AWS SAM connector supports AWS Step Functions, Amazon DynamoDB, AWS Lambda, Amazon SQS, Amazon SNS, Amazon API Gateway, Amazon EventBridge and Amazon S3, with more resources planned in the future.

Connectors are best for those getting started and who want to focus on modeling the flow of data and events within their applications. Connectors will take the desired relationship model and create the permissions for the relationship to exist and function as intended.

View the Developer Guide to find out more about AWS SAM connectors.

SAM CLI Pipelines now supports Open ID Connect Protocol

SAM Pipelines make it easier to create continuous integration and deployment (CI/CD) pipelines for serverless applications with Jenkins, GitLab, GitHub Actions, Atlassian Bitbucket Pipelines, and AWS CodePipeline. With this launch, SAM Pipelines can be configured to support OIDC authentication from providers supporting OIDC, such as GitHub Actions, GitLab and BitBucket. SAM Pipelines will use the OIDC tokens to configure the AWS Identity and Access Management (IAM) identity providers, simplifying the setup process.

AWS SAM CLI Terraform support

You can now use AWS SAM CLI to test and debug serverless applications defined using Terraform configurations. This public preview allows you to build locally, test, and debug Lambda functions defined in Terraform. Support for the Terraform configuration is currently in preview, and the team is asking for feedback and feature request submissions. The goal is for both communities to help improve the local development process using AWS SAM CLI. Submit your feedback by creating a GitHub issue here.
­­­­­Still looking for more?

Get your free online pass to watch all the biggest AWS news and updates from this year’s re:Invent.

For more learning resources, visit Serverless Land.

Building event-driven architectures with IoT sensor data

Post Syndicated from Raghavarao Sodabathina original https://aws.amazon.com/blogs/architecture/building-event-driven-architectures-with-iot-sensor-data/

The Internet of Things (IoT) brings sensors, cloud computing, analytics, and people together to improve productivity and efficiency. It empowers customers with the intelligence they need to build new services and business models, improve products and services over time, understand their customers’ needs to provide better services, and improve customer experiences. Business operations become more efficient by making intelligent decisions more quickly and over time develop a data-driven discipline leading to revenue growth and greater operational efficiency.

In this post, we showcase how to build an event-driven architecture by using AWS IoT services and AWS purpose-built data services. We also discuss key considerations and best practices while building event-driven application architectures with IoT sensor data.

Deriving insights from IoT sensor data

Organizations create value by making decisions from their IoT sensor data in near real time. Some common use cases and solutions that fit under event-driven architecture using IoT sensor data include:

  • Medical device data collection for personalized patient health monitoring, adverse event prediction, and avoidance.
  • Industrial IoT use cases to monitor equipment quality and determine actions like adjusting machine settings, using different sources of raw materials, or performing additional worker training to improve the quality of the factory output.
  • Connected vehicle use cases, such as voice interaction, navigation, location-based services, remote vehicle diagnostics, predictive maintenance, media streaming, and vehicle safety, that are based on in-vehicle computing and near real-time predictive analytics in the cloud.
  • Sustainability and waste reduction solutions, which provide access to dashboards, monitoring systems, data collection, and summarization tools that use machine learning (ML) algorithms to meet sustainability goals. Meeting sustainability goals is paramount for customers in the travel and hospitality industries.

Event-driven reference architecture with IoT sensor data

Figure 1 illustrates how to architect an event-driven architecture with IoT sensor data for near real-time predictive analytics and recommendations.

Building event-driven architecture with IoT sensor data

Figure 1. Building event-driven architecture with IoT sensor data

Architecture flow:

  1. Data originates in IoT devices such as medical devices, car sensors, industrial IoT sensors.This telemetry data is collected using AWS IoT Greengrass, an open-source IoT edge runtime and cloud service that helps your devices collect and analyze data closer to where the data is generated.When an event arrives, AWS IoT Greengrass reacts autonomously to local events, filters and aggregates device data, then communicates securely with the cloud and other local devices in your network to send the data.
  2. Event data is ingested into the cloud using edge-to-cloud interface services such as AWS IoT Core, a managed cloud platform that connects, manages, and scales devices easily and securely.AWS IoT Core interacts with cloud applications and other devices. You can also use AWS IoT SiteWise, a managed service that helps you collect, model, analyze, and visualize data from industrial equipment at scale.
  3. AWS IoT Core can directly stream ingested data into Amazon Kinesis Data Streams. The ingested data gets transformed and analyzed in near real time using Amazon Kinesis Data Analytics with Apache Flink and Apache Beam frameworks.Stream data can further be enriched using lookup data hosted in a data warehouse such as Amazon Redshift. Amazon Kinesis Data Analytics can persist SQL results to Amazon Redshift after the customer’s integration and stream aggregation (for example, one minute or five minutes).The results in Amazon Redshift can be used for further downstream business intelligence (BI) reporting services, such as Amazon QuickSight.
  4. Amazon Kinesis Data Analytics can also write to an AWS Lambda function, which can invoke Amazon SageMaker models. Amazon SageMaker is a the most complete, end-to-end service for machine learning.
  5. Once the ML model is trained and deployed in SageMaker, inferences are invoked in a micro batch using AWS Lambda. Inferenced data is sent to Amazon OpenSearch Service to create personalized monitoring dashboards using Amazon OpenSearch Service dashboards.The transformed IoT sensor data can be stored in Amazon DynamoDB. Customers can use AWS AppSync to provide near real-time data queries to API services for downstream applications. These enterprise applications can be mobile apps or business applications to track and monitor the IoT sensor data in near real-time.Amazon Kinesis Data Analytics can write to an Amazon Kinesis Data Firehose stream, which is a fully managed service for delivering near real-time streaming data to destinations like Amazon Simple Storage Service (Amazon S3), Amazon Redshift, Amazon OpenSearch Service, Splunk, and any custom HTTP endpoints or endpoints owned by supported third-party service providers, including Datadog, Dynatrace, LogicMonitor, MongoDB, New Relic, and Sumo Logic.

    In this example, data from Amazon Kinesis Data Analytics is written to Amazon Kinesis Data Firehose, which micro-batch streams data into an Amazon S3 data lake. The Amazon S3 data lake stores telemetry data for future batch analytics.

Key considerations and best practices

Keep the following best practices in mind:

  • Define the business value from IoT sensor data through interactive discovery sessions with various stakeholders within your organization.
  • Identify the type of IoT sensor data you want to collect and analyze for predictive analytics.
  • Choose the right tools for the job, depending upon your business use case and your data consumers. Please refer to step 5 earlier in this post, where different purpose-built data services were used based on user personas.
  • Consider the event-driven architecture as three key components: event producers, event routers, and event consumers. A producer publishes an event to the router, which filters and pushes the events to consumers. Producer and consumer services are decoupled, which allows them to be scaled, updated, and deployed independently.
  • In this architecture, IoT sensors are event producers. Amazon IoT Greengrass, Amazon IoT Core, Amazon Kinesis Data Streams, and Amazon Kinesis Data Analytics work together as the router from which multiple consumers can consume IoT sensor-generated data. These consumers include Amazon S3 data lakes for telemetry data analysis, Amazon OpenSearch Service for personalized dashboards, and Amazon DynamoDB or AWS AppSync for the downstream enterprise application’s consumption.

Conclusion

In this post, we demonstrated how to build an event-driven architecture with IoT sensor data using AWS IoT services and AWS purpose-built data services. You can now build your own event-driven applications using this post with your IoT sensor data and integrate with your business applications as needed.

Further reading

Using the AWS Parameter and Secrets Lambda extension to cache parameters and secrets

Post Syndicated from James Beswick original https://aws.amazon.com/blogs/compute/using-the-aws-parameter-and-secrets-lambda-extension-to-cache-parameters-and-secrets/

This post is written by Pal Patel, Solutions Architect, and Saud ul Khalid, Sr. Cloud Support Engineer.

Serverless applications often rely on AWS Systems Manager Parameter Store or AWS Secrets Manager to store configuration data, encrypted passwords, or connection details for a database or API service.

Previously, you had to make runtime API calls to AWS Parameter Store or AWS Secrets Manager every time you wanted to retrieve a parameter or a secret inside the execution environment of an AWS Lambda function. This involved configuring and initializing the AWS SDK client and managing when to store values in memory to optimize the function duration, and avoid unnecessary latency and cost.

The new AWS Parameters and Secrets Lambda extension provides a managed parameters and secrets cache for Lambda functions. The extension is distributed as a Lambda layer that provides an in-memory cache for parameters and secrets. It allows functions to persist values through the Lambda execution lifecycle, and provides a configurable time-to-live (TTL) setting.

When you request a parameter or secret in your Lambda function code, the extension retrieves the data from the local in-memory cache, if it is available. If the data is not in the cache or it is stale, the extension fetches the requested parameter or secret from the respective service. This helps to reduce external API calls, which can improve application performance and reduce cost. This blog post shows how to use the extension.

Overview

The following diagram provides a high-level view of the components involved.

High-level architecture showing how parameters or secrets are retrieved when using the Lambda extension

The extension can be added to new or existing Lambda. It works by exposing a local HTTP endpoint to the Lambda environment, which provides the in-memory cache for parameters and secrets. When retrieving a parameter or secret, the extension first queries the cache for a relevant entry. If an entry exists, the query checks how much time has elapsed since the entry was first put into the cache, and returns the entry if the elapsed time is less than the configured cache TTL. If the entry is stale, it is invalidated, and fresh data is retrieved from either Parameter Store or Secrets Manager.

The extension uses the same Lambda IAM execution role permissions to access Parameter Store and Secrets Manager, so you must ensure that the IAM policy is configured with the appropriate access. Permissions may also be required for AWS Key Management Service (AWS KMS) if you are using this service. You can find an example policy in the example’s AWS SAM template.

Example walkthrough

Consider a basic serverless application with a Lambda function connecting to an Amazon Relational Database Service (Amazon RDS) database. The application loads a configuration stored in Parameter Store and connects to the database. The database connection string (including user name and password) is stored in Secrets Manager.

This example walkthrough is composed of:

  • A Lambda function.
  • An Amazon Virtual Private Cloud (VPC).
  • Multi-AZ Amazon RDS Instance running MySQL.
  • AWS Secrets Manager database secret that holds database connection.
  • AWS Systems Manager Parameter Store parameter that holds the application configuration.
  • An AWS Identity and Access Management (IAM) role that the Lambda function uses.

Lambda function

This Python code shows how to retrieve the secrets and parameters using the extension. 

import pymysql
import urllib3
import os
import json

### Load in Lambda environment variables
port = os.environ['PARAMETERS_SECRETS_EXTENSION_HTTP_PORT']
aws_session_token = os.environ['AWS_SESSION_TOKEN']
env = os.environ['ENV']
app_config_path = os.environ['APP_CONFIG_PATH']
creds_path = os.environ['CREDS_PATH']
full_config_path = '/' + env + '/' + app_config_path

### Define function to retrieve values from extension local HTTP server cachce
def retrieve_extension_value(url): 
    http = urllib3.PoolManager()
    url = ('http://localhost:' + port + url)
    headers = { "X-Aws-Parameters-Secrets-Token": os.environ.get('AWS_SESSION_TOKEN') }
    response = http.request("GET", url, headers=headers)
    response = json.loads(response.data)   
    return response  

def lambda_handler(event, context):
       
    ### Load Parameter Store values from extension
    print("Loading AWS Systems Manager Parameter Store values from " + full_config_path)
    parameter_url = ('/systemsmanager/parameters/get/?name=' + full_config_path)
    config_values = retrieve_extension_value(parameter_url)['Parameter']['Value']
    print("Found config values: " + json.dumps(config_values))

    ### Load Secrets Manager values from extension
    print("Loading AWS Secrets Manager values from " + creds_path)
    secrets_url = ('/secretsmanager/get?secretId=' + creds_path)
    secret_string = json.loads(retrieve_extension_value(secrets_url)['SecretString'])
    #print("Found secret values: " + json.dumps(secret_string))

    rds_host =  secret_string['host']
    rds_db_name = secret_string['dbname']
    rds_username = secret_string['username']
    rds_password = secret_string['password']
    
    
    ### Connect to RDS MySQL database
    try:
        conn = pymysql.connect(host=rds_host, user=rds_username, passwd=rds_password, db=rds_db_name, connect_timeout=5)
    except:
        raise Exception("An error occurred when connecting to the database!")

    return "DemoApp sucessfully loaded config " + config_values + " and connected to RDS database " + rds_db_name + "!"

In the global scope the environment variable PARAMETERS_SECRETS_EXTENSION_HTTP_PORT is retrieved, which defines the port the extension HTTP server is running on. This defaults to 2773.

The retrieve_extension_value function calls the extension’s local HTTP server, passing in the X-Aws-Parameters-Secrets-Token as a header. This is a required header that uses the AWS_SESSION_TOKEN value, which is present in the Lambda execution environment by default.

The Lambda handler code uses the extension cache on every Lambda invoke to obtain configuration data from Parameter Store and secret data from Secrets Manager. This data is used to make a connection to the RDS MySQL database.

Prerequisites

  1. Git installed
  2. AWS SAM CLI version 1.58.0 or greater.

Deploying the resources

  1. Clone the repository and navigate to the solution directory:
    git clone https://github.com/aws-samples/parameters-secrets-lambda-extension-
    sample.git


  2. Build and deploy the application using following command:
    sam build
    sam deploy --guided

This template takes the following parameters:

  • pVpcCIDR — IP range (CIDR notation) for the VPC. The default is 172.31.0.0/16.
  • pPublicSubnetCIDR — IP range (CIDR notation) for the public subnet. The default is 172.31.3.0/24.
  • pPrivateSubnetACIDR — IP range (CIDR notation) for the private subnet A. The default is 172.31.2.0/24.
  • pPrivateSubnetBCIDR — IP range (CIDR notation) for the private subnet B, which defaults to 172.31.1.0/24
  • pDatabaseName — Database name for DEV environment, defaults to devDB
  • pDatabaseUsername — Database user name for DEV environment, defaults to myadmin
  • pDBEngineVersion — The version number of the SQL database engine to use (the default is 5.7).

Adding the Parameter Store and Secrets Manager Lambda extension

To add the extension:

  1. Navigate to the Lambda console, and open the Lambda function you created.
  2. In the Function Overview pane. select Layers, and then select Add a layer.
  3. In the Choose a layer pane, keep the default selection of AWS layers and in the dropdown choose AWS Parameters and Secrets Lambda Extension
  4. Select the latest version available and choose Add.

The extension supports several configurable options that can be set up as Lambda environment variables.

This example explicitly sets an extension port and TTL value:

Lambda environment variables from the Lambda console

Testing the example application

To test:

  1. Navigate to the function created in the Lambda console and select the Test tab.
  2. Give the test event a name, keep the default values and then choose Create.
  3. Choose Test. The function runs successfully:

Lambda execution results visible from Lambda console after successful invocation.

To evaluate the performance benefits of the Lambda extension cache, three tests were run using the open source tool Artillery to load test the Lambda function. This can use the Lambda URL to invoke the function. The Artillery configuration snippet shows the duration and requests per second for the test:

config:
  target: "https://lambda.us-east-1.amazonaws.com"
  phases:
    -
      duration: 60
      arrivalRate: 10
      rampTo: 40

scenarios:
  -
    flow:
      -
        post:
          url: "https://abcdefghijjklmnopqrst.lambda-url.us-east-1.on.aws/"
  • Test 1: The extension cache is disabled by setting the TTL environment variable to 0. This results in 1650 GetParameter API calls to Parameter Store over 60 seconds.
  • Test 2: The extension cache is enabled with a TTL of 1 second. This results in 106 GetParameter API calls over 60 seconds.
  • Test 3: The extension is enabled with a TTL value of 300 seconds. This results in only 18 GetParameter API calls over 60 seconds.

In test 3, the TTL value is longer than the test duration. The 18 GetParameter calls correspond to the number of Lambda execution environments created by Lambda to run requests in parallel. Each execution environment has its own in-memory cache and so each one needs to make the GetParameter API call.

In this test, using the extension has reduced API calls by ~98%. Reduced API calls results in reduced function execution time, and therefore reduced cost.

Cleanup

After you test this example, delete the resources created by the template, using following commands from the same project directory to avoid continuing charges to your account.

sam delete

Conclusion

Caching data retrieved from external services is an effective way to improve the performance of your Lambda function and reduce costs. Implementing a caching layer has been made simpler with this AWS-managed Lambda extension.

For more information on the Parameter Store, Secrets Manager, and Lambda extensions, refer to:

For more serverless learning resources, visit Serverless Land.

Node.js 18.x runtime now available in AWS Lambda

Post Syndicated from James Beswick original https://aws.amazon.com/blogs/compute/node-js-18-x-runtime-now-available-in-aws-lambda/

This post is written by Suraj Tripathi, Cloud Consultant, AppDev.

You can now develop AWS Lambda functions using the Node.js 18 runtime. This version is in active LTS status and considered ready for general use. When creating or updating functions, specify a runtime parameter value of nodejs18.x or use the appropriate container base image to use this new runtime.

This runtime version is supported by functions running on either Arm-based AWS Graviton2 processors or x86-based processors. Using the Graviton2 processor architecture option allows you to get up to 34% better price performance.

This blog post explains the major changes available with the Node.js 18 runtime in Lambda.

AWS SDK for JavaScript upgrade to v3

Lambda’s Node.js runtimes include the AWS SDK for JavaScript. This enables customers to use the AWS SDK to connect to other AWS services from their function code, without having to include the AWS SDK in their function deployment. This is especially useful when creating functions in the AWS Management Console. It’s also useful for Lambda functions deployed as inline code in CloudFormation templates.

Up until Node.js 16, Lambda’s Node.js runtimes have included the AWS SDK for JavaScript version 2. This has since been superseded by the AWS SDK for JavaScript version 3, which was released in December 2020. With this release, Lambda has upgraded the version of the AWS SDK for JavaScript included with the runtime from v2 to v3.

If your existing Lambda functions are using the included SDK v2, then you must update your function code to use the SDK v3 when upgrading to the Node.js 18 runtime. This is the recommended approach when upgrading existing functions to Node.js 18. Alternatively, you can use the Node.js 18 runtime without updating your existing code if you deploy the SDK v2 together with your function code.

Version 3 of the SDK for JavaScript offers many benefits over version 2. Most importantly, it is modular, so your code only loads the modules it needs. Modularity also reduces your function size if you choose to deploy the SDK with your function code rather than using the version built into the Lambda runtime. Learn more about optimizing Node.js dependencies in Lambda here.

For example, for a function interacting with Amazon S3 using the v2 SDK, you import the entire SDK, even though you don’t use most of it:

const AWS = require("aws-sdk");

With the v3 SDK, you only import the modules you need, such as ListBucketsCommand, and a service client like S3Client.

import { S3Client, ListBucketsCommand } from "@aws-sdk/client-s3";

Another difference between SDK v2 and SDK v3 is the default settings for TCP connection re-use. In the SDK v2, connection re-use is disabled by default. In SDK v3, it is enabled by default. In most cases, enabling connection re-use improves function performance. To stop TCP connection reuse, set the AWS_NODEJS_CONNECTION_REUSE_ENABLED environment variable to false. You can also stop keeping the connections alive on a per-service client basis.

For more information, see Why and how you should use AWS SDK for JavaScript (v3) on Node.js 18.

Support for ES module resolution using NODE_PATH

Another change in the Node.js 18 runtime is added support for ES module resolution via the NODE_PATH environment variable.

ES modules are supported by Lambda’s Node.js 14 and Node.js 16 runtimes. They enable top-level await, which can lower cold start latency when used with Provisioned Concurrency. However, by default Node.js does not search the folders in the NODE_PATH environment variable when importing ES modules. This makes it difficult to import ES modules from folders outside of the /var/task/ folder in which the function code is deployed. For example, to load the AWS SDK included in the runtime as an ES module, or to load ES modules from Lambda layers.

The Node.js 18.x runtime for Lambda searches the folders listed in NODE_PATH when loading ES modules. This makes it easier to include the AWS SDK as an ES module or load ES modules from Lambda layers.

Node.js 18 language updates

The Lambda Node.js 18 runtime also enables you to take advantage of new Node.js 18 language features. This includes improved performance for class fields and private class methods, JSON import assertions, and experimental features such as the Fetch API, Test Runner module, and Web Streams API.

JSON import assertion

The import assertions feature allows module import statements to include additional information alongside the module specifier. Now the following code is valid:

// index.mjs

// static import
import fooData from './foo.json' assert { type: 'json' };

// dynamic import
const { default: barData } = await import('./bar.json', { assert: { type: 'json' } });

export const handler = async(event) => {

    console.log(fooData)
    // logs data in foo.json file
    console.log(barData)
    // logs data in bar.json file

    const response = {
        statusCode: 200,
        body: JSON.stringify('Hello from Lambda!'),
    };
    return response;
};

foo.json

{
  "foo1" : "1234",
  "foo2" : "4678"
}

bar.json

{
  "bar1" : "0001",
  "bar2" : "0002"
}

Experimental features

While still experimental, the global fetch API is available by default in Node.js 18. The API includes a fetch function, making fetch polyfills and third-party HTTP packages redundant.

// index.mjs 

export const handler = async(event) => {
    
    const res = await fetch('https://nodejs.org/api/documentation.json');
    if (res.ok) {
      const data = await res.json();
      console.log(data);
    }

    const response = {
        statusCode: 200,
        body: JSON.stringify('Hello from Lambda!'),
    };
    return response;
};

Experimental features in Node.js can be enabled/disabled via the NODE_OPTIONS environment variable. For example, to stop the experimental fetch API you can create a Lambda environment variable NODE_OPTIONS and set the value to --no-experimental-fetch.

With this change, if you run the previous code for the fetch API in your Lambda function, it throws a reference error because the experimental fetch API is now disabled.

Conclusion

Node.js 18 is now supported by Lambda. When building your Lambda functions using the zip archive packaging style, use a runtime parameter value of nodejs18.x to get started building with Node.js 18.

You can also build Lambda functions in Node.js 18 by deploying your function code as a container image using the Node.js 18 AWS base image for Lambda. You may learn more about writing functions in Node.js 18 by reading about the Node.js programming model in the Lambda documentation.

For existing Node.js functions, review your code for compatibility with Node.js 18, including deprecations, then migrate to the new runtime by changing the function’s runtime configuration to nodejs18.x.

For more serverless learning resources, visit Serverless Land.