At Amazon Web Services (AWS), we move fast and continually iterate to meet the evolving needs of our customers. We design services that can help our customers meet even the most stringent security and compliance requirements. Additionally, our service teams work closely with our AWS Security Guardians program to coordinate security efforts and to maintain a high quality bar. We also have internal compliance teams that continually monitor security control requirements from all over the world and engage with external auditors to achieve third-party validation of our services against these requirements.
In this post, I’ll cover some key strategies and best practices that we use to scale security and compliance while maintaining a culture of innovation.
Security as the foundation
At AWS, security is our top priority. Although compliance might be challenging, treating security as an integral part of everything we do at AWS makes it possible for us to adhere to a broad range of compliance programs, to document our compliance, and to successfully demonstrate our compliance status to our auditors and customers.
Over time, as the auditors get deeper into what we’re doing, we can also help improve and refine their approach, as well. This increases the depth and quality of the reports that we provide directly to our customers.
The challenge of scaling securely
Many customers struggle with balancing security, compliance, and production. These customers have applications that they want to quickly make available to their own customer base. They might need to audit these applications. The traditional process can include writing the application, putting it into production, and then having the audit team take a look to make sure it meets compliance standards. This approach can cause issues, because retroactively adding compliance requirements can result in rework and churn for the development team.
Enforcing compliance requirements in this way doesn’t scale and eventually causes more complexity and friction between teams. So how do you scale quickly and securely?
Speak their language
The first way to earn trust with development teams is to speak their language. It’s critical to use terms and references that developers use, and to know what tools they are using to develop, deploy, and secure code. It’s not efficient or realistic to ask the engineering teams to do the translation of diverse (and often vague) compliance requirements into engineering specs. The compliance teams must do the hard work of translating what is required into what specifically must be done, using language that engineers are familiar with.
Another strategy to scale is to embed compliance requirements into the way developers do their daily work. It’s important that compliance teams enable developers to do their work just as they normally do, without compliance needing to intervene. If you’re successful at that strategy—and the compliant path becomes the simplest and most natural path—then that approach can lead to a very scalable compliance program that fosters understanding between teams and increased collaboration. This approach has helped break down the barriers between the developer and audit/compliance organizations.
Treat auditors and regulators as partners
I believe that you should treat auditors and regulators as true business partners. An independent auditor or regulator understands how a wide range of customers will use the security assurance artifacts that you are producing, and therefore will have valuable insights into how your reports can best be used. I think people can fall into the trap of treating regulators as adversaries. The best approach is to communicate openly with regulators, helping them understand your business and the value you bring to your customers, and getting them ramped up on your technology and processes.
At AWS, we help auditors and regulators get ramped up in various ways. For example, we have the Digital Audit Symposium, which contains presentations on how we control and operate particular services in terms of security and compliance. We also offer the Cloud Audit Academy, a learning path that provides both cloud-agnostic and AWS-specific training to help existing and prospective auditing, risk, and compliance professionals understand how to audit regulated cloud workloads. We’ve learned that being a partner with auditors and regulators is key in scaling compliance.
Conclusion
Having security as a foundation is essential to driving and scaling compliance efforts. Speaking the language of developers helps them continue to work without disruption, and makes the simple path the compliant path. Although some barriers still exist, especially for organizations in highly regulated industries such as financial services and healthcare, treating auditors like partners is a positive strategic shift in perspective. The more proactive you are in helping them accomplish what they need, the faster you will realize the value they bring to your business.
If you have feedback about this post, submit comments in the Comments section below. If you have questions about this post, contact AWS Support.
Want more AWS Security news? Follow us on Twitter.
With AWS Secrets Manager, you can securely store, manage, retrieve, and rotate the secrets required for your applications and services running on AWS. A secret can be a password, API key, OAuth token, or other type of credential used for authentication purposes. You can control access to secrets in Secrets Manager by using AWS Identity and Access Management (IAM) permission policies. In this blog post, I will show you how to use principles of attribute-based access control (ABAC) to define dynamic IAM permission policies in AWS IAM Identity Center (successor to AWS Single Sign-On) by using user attributes from an external identity provider (IdP) and resource tags in Secrets Manager.
What is ABAC and why use it?
Attribute-based access control (ABAC) is an authorization strategy that defines permissions based on attributes or characteristics of the user, the data, or the environment, such as the department, business unit, or other factors that could affect the authorization outcome. In the AWS Cloud, these attributes are called tags. By assigning user attributes as principal tags, you can simplify the process of creating fine-grained permissions on AWS.
With ABAC, you can use attributes to build more dynamic policies that provide access based on matching attribute conditions. ABAC rules are evaluated dynamically at runtime, which means that the users’ access to applications and data and the type of allowed operations automatically change based on the contextual factors in the policy. For example, if a user changes department, access is automatically adjusted without the need to update permissions or request new roles. You can use ABAC in conjunction with role-based access control (RBAC) to combine the ease of policy administration with flexible policy specification and dynamic decision-making capability to enforce least privilege.
AWS IAM Identity Center (successor to AWS Single Sign-On) expands the capabilities of IAM to provide a central place that brings together the administration of users and their access to AWS accounts and cloud applications. With IAM Identity Center, you can define user permissions and manage access to accounts and applications in your AWS Organizations organization centrally. You can also create ABAC permission policies in a central place. ABAC will work with attributes from a supported identity source in IAM Identity Center. For a list of supported external IdPs for identity synchronization through the System for Cross-domain Identity Management (SCIM) and Security Assertion Markup Language (SAML) 2.0, see Supported identity providers.
The following are key benefits of using ABAC with IAM Identity Center and Secrets Manager:
Fewer permission sets — With ABAC, multiple users who use the same IAM Identity Center permission set and the same IAM role can still get unique permissions, because permissions are now based on user attributes. Administrators can author IAM policies that grant users access only to secrets that have matching attributes. This helps reduce the number of distinct permissions that you need to create and manage in IAM Identity Center and, in turn, reduces your permission management complexity.
Teams can change and grow quickly — When you create new secrets, you can apply the appropriate tags, which will automatically grant access without requiring you to update the permission policies.
Use employee attributes from your corporate directory to define access — You can use existing employee attributes from a supported identity source configured in IAM Identity Center to make access control decisions on AWS.
Figure 1 shows a framework to control access to Secrets Manager secrets using IAM Identity Center and ABAC principles.
Figure 1: ABAC framework to control access to secrets using IAM Identity Center
The following is a brief introduction to the basic components of the framework:
User attribute source or identity source — This is where your users and groups are administered. You can configure a supported identity source with IAM Identity Center. You can then define and manage supported user attributes in the identity source.
Policy management — You can create and maintain policy definitions (permission sets) centrally in IAM Identity Center. You can assign access to a user or group to one or more accounts in IAM Identity Center with these permission sets. You can then use attributes defined in your identity source to build ABAC policies for managing access to secrets.
Policy evaluation — When you assign a permission set, IAM Identity Center creates corresponding IAM Identity Center-controlled IAM roles in each account, and attaches the policies specified in the permission set to those roles. IAM Identity Center manages the role, and allows the authorized users that you’ve defined to assume the role. When users try to access a secret, IAM dynamically evaluates ABAC policies on the target account to determine access based on the attributes assigned to the user and resource tags assigned to that secret.
How to configure ABAC with IAM Identity Center
To configure ABAC with IAM Identity Center, you need to complete the following high-level steps. I will walk you through these steps in detail later in this post.
Identify and set up identities that are created and managed in the identity source with user attributes, such as project, team, AppID or department.
In IAM Identity Center, enable Attributes for access control and configure select attributes (such as department) to use for access control. For a list of supported attributes, see Supported external identity provider attributes.
If you are using an external IdP and choose to use custom attributes from your IdP for access controls, configure your IdP to send the attributes through SAML assertions to IAM Identity Center.
Assign appropriate tags to secrets in Secrets Manager.
Create permission sets based on attributes added to identities and resource tags.
Define guardrails to enforce access using ABAC.
ABAC enforcement and governance
Because an ABAC authorization model is based on tags, you must have a tagging strategy for your resources. To help prevent unintended access, you need to make sure that tagging is enforced and that a governance model is in place to protect the tags from unauthorized updates. By using service control policies (SCPs) and AWS Organizations tag policies, you can enforce tagging and tag governance on resources.
When you implement ABAC for your secrets, consider the following guidance for establishing a tagging strategy:
During secret creation, secrets must have an ABAC tag applied (tag-on-create).
During secret creation, the provided ABAC tag key must be the same case as the principal’s ABAC tag key.
After secret creation, the ABAC tag cannot be modified or deleted.
Only authorized principals can do tagging operations on secrets.
You enforce the permissions that give access to secrets through tags.
For more information on tag strategy, enforcement, and governance, see the following resources:
In this post, I will walk you through the steps to enable the IdP that is supported by IAM Identity Center.
Figure 2: Sample solution implementation
In the sample architecture shown in Figure 2, Arnav and Ana are users who each have the attributes department and AppID. These attributes are created and updated in the external directory—Okta in this case. The attribute department is automatically synchronized between IAM Identity Center and Okta using SCIM. The attribute AppID is a custom attribute configured on Okta, and is passed to AWS as a SAML assertion. Both users are configured to use the same IAM Identity Center permission set that allows them to retrieve the value of secrets stored in Secrets Manager. However, access is granted based on the tags associated with the secret and the attributes assigned to the user.
For example, user Arnav can only retrieve the value of the RDS_Master_Secret_AppAlpha secret. Although both users work in the same department, Arnav can’t retrieve the value of the RDS_Master_Secret_AppBeta secret in this sample architecture.
Prerequisites
Before you implement the solution in this blog post, make sure that you have the following prerequisites in place:
You have IAM Identity Center enabled for your organization and connected to an external IdP using SAML 2.0 identity federation.
You have IAM Identity Center configured for automatic provisioning with an external IdP using the SCIM v2.0 standard. SCIM keeps your IAM Identity Center identities in sync with identities from the external IdP.
Solution implementation
In this section, you will learn how to enable access to Secrets Manager using ABAC by completing the following steps:
Configure ABAC in IAM Identity Center
Define custom attributes in Okta
Update configuration for the IAM Identity Center application on Okta
Make sure that required tags are assigned to secrets in Secrets Manager
Create and assign a permission set with an ABAC policy in IAM Identity Center
Define guardrails to enforce access using ABAC
Step 1: Configure ABAC in IAM Identity Center
The first step is to set up attributes for your ABAC configuration in IAM Identity Center. This is where you will be mapping the attribute coming from your identity source to an attribute that IAM Identity Center passes as a session tag. The Key represents the name that you are giving to the attribute for use in the permission set policies. You need to specify the exact name in the policies that you author for access control. For the example in this post, you will create a new attribute with Key of department and Value of ${path:enterprise.department}. For supported external IdP attributes, see Attribute mappings.
To configure ABAC in IAM Identity Center (console)
Open the IAM Identity Center console.
In the Settings menu, enable Attributes for access control.
Choose the Attributes for access control tab, select Add attribute, and then enter the Key and Value details as follows.
The sample architecture in this post uses a custom attribute (AppID) on an external IdP for access control. In this step, you will create a custom attribute in Okta.
To define custom attributes in Okta (console)
Open the Okta console.
Navigate to Directory and then select Profile Editor.
On the Profile Editor page, choose Okta User (default).
Select Add Attribute and create a new custom attribute with the following parameters.
For Data type, enter string
For Display name, enter AppID
For Variable name, enter user.AppID
For Attribute length, select Less Than from the dropdown and enter a value.
For User permission, enter Read Only
Navigate to Directory, select People, choose in-scope users, and enter a value for Department and AppID attributes. The following shows these values for the users in our example.
Step 3: Update SAML configuration for IAM Identity Center application on Okta
Automatic provisioning (through the SCIM v2.0 standard) of user and group information from Okta into IAM Identity Center supports a set of defined attributes. A custom attribute that you create on Okta won’t be automatically synchronized to IAM Identity Center through SCIM. You can, however, define the attribute in the SAML configuration so that it is inserted into the SAML assertions.
To update the SAML configuration in Okta (console)
Open the Okta console and navigate to Applications.
On the Applications page, select the app that you defined for IAM Identity Center.
Under the Sign On tab, choose Edit.
Under SAML 2.0, expand the Attributes (Optional) section, and add an attribute statement with the following values, as shown in Figure 3:
Figure 3: Sample SAML configuration with custom attributes
To check that the newly added attribute is reflected in the SAML assertion, choose Preview SAML, review the information, and then choose Save.
Step 4: Make sure that required tags are assigned to secrets in Secrets Manager
The next step is to make sure that the required tags are assigned to secrets in Secrets Manager. You will review the required tags from the Secrets Manager console.
To verify required tags on secrets (console)
Open the Secrets Manager console in the target AWS account and then choose Secrets.
Verify that the required tags are assigned to the secrets in scope for this solution, as shown in Figure 4. In our example, the tags are as follows:
Key: department
Value: Digital
Key: AppID
Value: Alpha or Beta
Figure 4: Sample secret configuration with required tags
Step 5a: Create a permission set in IAM Identity Center using ABAC policy
In this step, you will create a new permission set that allows access to secrets based on the principal attributes and resource tags.
When you enable ABAC and specify attributes, IAM Identity Center passes the attribute value of the authenticated user to AWS Security Token Service (AWS STS) as session tags when an IAM role is assumed. You can use access control attributes in your permission sets by using the aws:PrincipalTag condition key to create access control rules.
To create a permission set (console)
Open the IAM Identity Center console and navigate to Multi-account permissions.
Choose Permission sets, and then select Create permission set.
On the Specify policies and permissions boundary page, choose Inline policy.
For Inline policy, paste the following sample policy document and then choose Next. This policy allows users to retrieve the value of only those secrets that have resource tags that match the required user attributes (department and AppID in our example).
Configure the session duration, and optionally provide a description and tags for the permission set.
Review and create the permission set.
Step 5b: Assign permission set to users in IAM Identity Center
Now that you have created a permission set with ABAC policy, complete the configuration by assigning the permission set to users to grant them access to secrets in one or more accounts in your organization.
To assign a permission set (console)
Open the IAM Identity Center console and navigate to Multi-account permissions.
Choose AWS accounts and select one or more accounts to which you want to assign access.
Choose Assign users or groups.
On the Assign users and groups page, select the users, groups, or both to which you want to assign access. For this example, I select both Arnav and Ana.
On the Assign permission sets page, select the permission set that you created in the previous section.
Review your changes, as shown in Figure 5, and then select Submit.
Figure 5: Sample permission set assignment
Step 6: Define guardrails to enforce access using ABAC
To govern access to secrets to your workforce users only through ABAC and to help prevent unauthorized access, you can define guardrails. In this section, I will show you some sample service control policies (SCPs) that you can use in your organization.
Note: Before you use these sample SCPs, you should carefully review, customize, and test them for your unique requirements. For additional instructions on how to attach an SCP, see Attaching and detaching service control policies.
Guardrail 1 – Enforce ABAC to access secrets
The following sample SCP requires the use of ABAC to access secrets in Secrets Manager. In this example, users and secrets must have matching values for the attributes department and AppID. Access is denied if those attributes don’t exist or if they don’t have matching values. Also, this example SCP allows only the admin role to access secrets without matching tags. Replace <arn:aws:iam::*:role/secrets-manager-admin-role> with your own information.
The following sample SCP denies the creation of new secrets that don’t have the required tag key-value pairs. In this example, the SCP denies creation of a new secret if it doesn’t include department and AppID tag keys. It also denies access if the tag department doesn’t have the value Digital and the tag AppID doesn’t have either Alpha or Beta assigned to it. Also, this example SCP allows only the admin role to create secrets without matching tags. Replace <arn:aws:iam::*:role/secrets-manager-admin-role> with your own information.
The following sample SCP denies the ability to delete the tags used for ABAC. In this example, only the admin role can delete the tags department and AppID after they are attached to a secret. Replace <arn:aws:iam::*:role/secrets-manager-admin-role> with your own information.
Guardrail 4 – Restrict modification of ABAC tags
The following sample SCP denies the ability to modify required tags for ABAC after they are attached to a secret. In this example, only the admin role can modify the tags department and AppID after they are attached to a secret. Replace <arn:aws:iam::*:role/secrets-manager-admin-role> with your own information.
In this section, you will test the solution by retrieving a secret using the Secrets Manager console. Your attempt to retrieve the secret value will be successful only when the required resource and principal tags exist, and have matching values (AppID and department in our example).
Test scenario 1: Retrieve and view the value of an authorized secret
In this test, you will verify whether you can successfully retrieve the value of a secret that belongs to your application.
To test the scenario
Sign in to IAM Identity Center and log in with your external IdP user. For this example, I log in as Arnav.
On the IAM Identity Center dashboard, select the target account.
From the list of available roles that the user has access to, choose the role that you created in Step 5a and select Management console, as shown in Figure 6. For this example, I select the SecretsManagerABACTest permission set.
Figure 6: Sample IAM Identity Center dashboard
Open the Secrets Manager console and select a secret that belongs to your application. For this example, I select RDS_Master_Secret_AppAlpha.
Because the AppID and department tags exist on both the secret and the user, the ABAC policy allowed the user to describe the secret, as shown in Figure 7.
Figure 7: Sample secret that was described successfully
In the Secret value section, select Retrieve secret value.
Because the value of the resource tags, AppID and department, matches the value of the corresponding user attributes (in other words, the principal tags), the ABAC policy allows the user to retrieve the secret value, as shown in Figure 8.
Figure 8: Sample secret value that was retrieved successfully
Test scenario 2: Retrieve and view the value of an unauthorized secret
In this test, you will verify whether you can retrieve the value of a secret that belongs to a different application.
Open the Secrets Manager console and select a secret that belongs to a different application. For this example, I select RDS_Master_Secret_AppBeta.
Because the value of the resource tag AppID doesn’t match the value of the corresponding user attribute (principal tag), the ABAC policy denies access to describe the secret, as shown in Figure 9.
Figure 9: Sample error when describing an unauthorized secret
Conclusion
In this post, you learned how to implement an ABAC strategy using attributes and to build dynamic policies that can simplify access management to Secrets Manager using IAM Identity Center configured with an external IdP. You also learned how to govern resource tags used for ABAC and establish guardrails to enforce access to secrets using ABAC. To learn more about ABAC and Secrets Manager, see Attribute-Based Access Control (ABAC) for AWS and the Secrets Manager documentation.
If you have feedback about this blog post, submit comments in the Comments section below. If you have questions about this blog post, start a new thread on AWS Secrets Manager re:Post.
Want more AWS Security news? Follow us on Twitter.
This blog post is written by Vincent Wang, GCR EC2 Specialist SA, Compute.
Streaming games from the cloud to mobile devices is an emerging technology that allows less powerful and less expensive devices to play high-quality games with lower battery consumption and less storage capacity. This technology enables a wider audience to enjoy high-end gaming experiences from their existing devices, such as smartphones, tablets, and smart TVs.
To load games for streaming on AWS, it’s necessary to use Android environments that can utilize GPU acceleration for graphics rendering and optimize for network latency. Cloud-native products, such as the Anbox Cloud Appliance or Genymotion available on the AWS Marketplace, can provide a cost-effective containerized solution for game streaming workloads on Amazon Elastic Compute Cloud (Amazon EC2).
For example, Anbox Cloud’s virtual device infrastructure can run games with low latency and high frame rates. When combined with the AWS Graviton-based Amazon EC2 G5g instances, which offer a cost reduction of up to 30% per-game stream per-hour compared to x86-based GPU instances, it enables companies to serve millions of customers in a cost-efficient manner.
In this post, we chose the Anbox Cloud Appliance to demonstrate how you can use it to stream a resource-demanding game called Genshin Impact. We use a G5g instance along with a mobile phone to run the streamed game inside of a Firefox browser application.
Overview
Graviton-based instances utilize fewer compute resources than x86-based instances due to the 64-bit architecture of Arm processors used in AWS Graviton servers. As shown in the following diagram, Graviton instances eliminate the need for cross-compilation or Android emulation. This simplifies development efforts and reduces time-to-market, thereby lowering the cost-per-stream. With G5g instances, customers can now run their Android games natively, encode CPU or GPU-rendered graphics, and stream the game over the network to multiple mobile devices.
Figure 1: Architecture difference when running Android on X86-based instance and Graviton-based instance.
Real-time ray-traced rendering is required for most modern games to deliver photorealistic objects and environments with physically accurate shadows, reflections, and refractions. The G5g instance, which is powered by AWS Graviton2 processors and NVIDIA T4G Tensor Core GPUs, provides a cost-effective solution for running these resource-intensive games.
Architecture
Figure 2: Architecture of Android Streaming Game.
When streaming games from a mobile device, only input data (touchscreen, audio, etc.) is sent over the network to the game streaming server hosted on a G5g instance. Then, the input is directed to the appropriate Android container designated for that particular client. The game application running in the container processes the input and updates the game state accordingly. Then, the resulting rendered image frames are sent back to the mobile device for display on the screen. In certain games, such as multiplayer games, the streaming server must communicate with external game servers to reflect the full game state. In these cases, additional data is transferred to and from game servers and back to the mobile client. The communication between clients and the streaming server is performed using the WebRTC network protocol to minimize latency and make sure that users’ gaming experience isn’t affected.
The Graviton processor handles compute-intensive tasks, such as the Android runtime and I/O transactions on the streaming server. However, for resource-demanding games, the Nvidia GPU is utilized for graphics rendering. To scale effortlessly, the Anbox Cloud software can be utilized to manage and execute several game sessions on the same instance.
Prerequisites
First, you need an Ubuntu single sign-on (SSO) account. If you don’t have one yet, you may create one from Ubuntu One website. Then you need an Android mobile phone with Firefox or Chrome browser installed to play the streaming games.
Setup
We can install Anbox Cloud Appliance in the AWS Marketplace. Select the Arm variant so that it works on Graviton-based instances. If the subscription doesn’t work on the first try, then you receive an email which guides you to a page where you can try again.
Figure 3: Subscribe Anbox Cloud Appliance in AWS Marketplace.
In this demonstration, we select G5g.xlarge in the Instance type section and leave all settings with default values, except the storage as per the following:
For the Genshin Impact demo, we recommend a specific amount of storage. However, when deploying your Android applications, you must select an appropriate storage size based on the package size. Additionally, you should choose an instance size based on the resources that you plan to utilize for your gaming sessions, such as CPU, memory, and networking. In our demo, we launched only one session from a single mobile device.
Launch the instance and wait until it reaches running status. Then you can secure shell (SSH) to the instance to configure the Android environment.
Install Anbox cloud
To make sure of the security and reliability of some of the package repositories used, we update the CUDA Linux GPG Repository Key. View this Nvidia blog post for more details on this procedure.
As the Android in Anbox Cloud Appliance is running in an LXD container environment, upgrade LXD to the latest version.
$ sudo snap refresh –channel=5.0/stable lxd
Install the Anbox Cloud Appliance software using the following command and selecting the default answers:
$ sudo anbox-cloud-appliance init
Watch the status page at https://$(ec2_public_DNS_name) for progress information.
Figure 4: The status of deploying Anbox Cloud.
The initialization process takes approximately 20 minutes. After it’s complete, register the Ubuntu SSO account previously created, then follow the instructions provided to finalize the process.
$ cd cloud-gaming-demo/ui && flutter build web && cd ..
$ mkdir -p backend/service/static
$ cp -av ui/build/web/* backend/service/static
Then build the backend service which processes requests and interacts with the Anbox Stream Gateway to create instances of game applications. Start by preparing the environment:
$ sudo apt-get install python3-pip
$ sudo pip3 install virtualenv
$ cd backend && virtualenv venv
Create the configuration file for the backend service so that it can access the Anbox Stream Gateway. There are two parameters to set: gateway-URL and gateway-token. The gateway token can be obtained from the following command:
Create a file called config.yaml that contains the two values:
gateway-url: https:// <EC2 public DNS name>
gateway-token: <gateway_token>
Add the following line to the activate hook in the backend/venv/bin/ directory so that the backend service can read config.yaml on its startup:
$ export CONFIG_PATH=<path_to_config_yaml>
Now we can launch the backend service which will be served by default on TCP port 8002.
$./run.sh
In the next steps, we download a game and build it via Anbox Cloud. We need an Android APK and a configuration file. Create a folder under the HOME directory and create a manifest.yaml file in the folder. In this example, we must add the following details in the file. You can refer to the Anbox Cloud documentation for more information on the format.
name: genshin
instance-type: g10.3
resources:
cpus: 10
memory: 25GB
disk-size: 50GB
gpu-slots: 15
features: [“enable_virtual_keyboard”]
Select an APK for the arm64-v8a architecture which is natively supported on Graviton. In this example, we download Genshin Impact, an action role-playing game developed and published by miHoYo. You must supply your own Android APK if you want to try these steps. Download the APK into the folder and rename it to app.apk. Overall, the final layout of the game folder should look as follows:
.
├── app.apk
└── manifest.yaml
Run the following command from the folder to create the application:
$ amc application create .
Wait until the application status changes to ready. You can monitor the status with the following command:
$ amc application ls
Edit the following:
Update the gameids variable defined in the ui/lib/homepage.dart file to include the name of the game (as declared in the manifest file).
Insert a new key/value pair to the static appNameMap and appDesMap variables defined in the lib/api/application.dart file.
Provide a screenshot of the game (in jpeg format), rename it to <game-name>.jpeg, and put it into the ui/lib/assets directory.
Then, re-build the web UI, copy the contents from the ui/build/web folder to the backend/service/static directory, and refresh the webpage.
Test the game
Using your mobile phone, open the Firefox browser or another browser that supports WebRTC. Type the public DNS name of the G5g instance with the 8002 TCP port, and you should see something similar to the following:
Figure 5: The webpage of the Android streaming game portal.
Select the Play now button, wait a moment for the application to be setup on the server side, and then enjoy the game.
Figure 6: The screen capture of playing Android streaming game.
In this post, we demonstrated how a resource-intensive Android game runs natively on a Graviton-based G5g instance and is streamed to an Arm-based mobile device. The benefits include better price-performance, reduced development effort, and faster time-to-market. One way to run your games efficiently on the cloud is through software available on the AWS Marketplace, such as the Anbox Cloud Appliance, which was showcased as an example method.
In this post, we demonstrate how to automatically keep your base or standard images current, incorporating patches and any other changes using EC2 Image Builder pipelines. We also demonstrate how to keep workload-specific images current using Cascading Pipelines, a feature of EC2 Image Builder.
Dependency updates
You can use the Dependency update feature of EC2 Image Builder pipelines to automatically update your standard image based on changes to your build components.
When you create an EC2 Image Builder pipeline, you can choose to run the pipeline on a schedule, either using a schedule builder or a CRON expression (a method of defining minute, hour, day and month for scheduling). Furthermore, you can choose to only run the pipeline if a component in the pipeline or the source image has changed. This is referred to as a dependency update as shown in the following image.
Figure 1: An example EC2 Image Builder pipeline schedule with dependency update settings
When you select “Run pipeline at the scheduled time if there are dependency updates,” your pipeline only executes if the Base AMI or any Build or Test components have changed. The version of your components must be updated for this capability to work. Amazon-provided components include versioning out of the box. Here is an example of three versions of an Amazon-provided Build component that apply Security Technical Implementation Guide (STIG) baselines to Linux images.
Figure 2: Different versions of one Amazon-managed Build component
When a new STIG baseline build component is released, the component’s version is incremented. If a pipeline includes this type of versioned Build component and utilizes the dependency updates capability, then the pipeline automatically runs at the next scheduled interval after the component is updated. Pipelines utilizing this capability will run when the base AMI changes or when a Build or Test component changes.
Notifications
To receive notifications about the pipeline execution, you can enable an Amazon Simple Notification Service (Amazon SNS) topic from within EC2 Image Builder. Under the Infrastructure Configuration section of the EC2 Image Builder pipeline, identify an SNS topic as shown in the following image.
Figure 3: An example SNS topic for sending pipeline execution notifications
The SNS topic receives a notification if a pipeline runs and completes with a status of AVAILABLE or FAILED. This occurs even when a pipeline execution is triggered by a component change that you didn’t directly initiate, such as when a new version of an Amazon-managed build component is released.
Even if no other aspects of the infrastructure configuration are used in the pipeline (instance type, security group, subnet, etc.), the SNS topic capability can be used to send a notification when the pipeline executes. With this in mind, you can leverage Amazon SNS to make sure that you’re always notified of any pipeline executions as well as trigger AWS Lambda functions for automation.
Cascading pipelines
Cascading Pipelines are a feature of EC2 Image Builder that you can use to create workload-specific images from a standard secured image (aka “gold image”) of an organization. The following image shows how you can use Cascading Pipelines to keep workload specific images updated.
Figure 4: An example workflow for a EC2 Image Builder Cascading Pipelines
You create a gold image pipeline for a hardened base operating system (OS) using the steps outlined in Automate OS Image Build Pipelines with EC2 Image Builder. This pipeline could include a base OS, OS patches, Build components to harden the OS (such as STIG or CIS baselines), as well as any additional software required by the organization (agents, etc.). Do not include application- or workload-specific software in the pipeline. Infrastructure or distribution components may not be included in the pipeline to maintain flexibility for using the gold image. For example, you typically wouldn’t want to include VPC configurations in your golden AMI build because that would constrain the AMI to a particular VPC.
To create a Cascading Pipeline that uses the gold image for applications or workloads, in the Base Image section of the EC2 Image Builder console, choose Select Managed Images.
Figure 5: Selecting the base image of a pipeline
Then, select “Images Owned by Me” and under Image Name, select the EC2 Image Builder pipeline used to create the gold image. Moreover, select “Use Latest Available OS Version” under Auto-versioning options to make sure that the Cascading Pipeline is executed any time there is a change to the base image.
Figure 6: Choosing the base golden image from a previous pipeline execution
Use this configuration to maintain images for each application or workload which utilizes the gold image. Any time that an update is made to the gold image, application pipelines execute, thus providing updated images. To send notifications, SNS topics are enabled on each workload-specific pipeline.
In this post, we demonstrated how to automatically update images for any changes using EC2 Image Builder pipelines. We also demonstrated how to keep workload specific images using Cascading Pipelines. Using these features, you can make sure that your organization stays up-to-date on the latest OS patches and dependency changes, without requiring human intervention. For more information on EC2 Image Builder, see the official documentation.
AWS Network Firewall is a managed service that provides a convenient way to deploy essential network protections for your virtual private clouds (VPCs). In this blog, we are going to cover how to leverage the TLS inspection configuration with AWS Network Firewall and perform Deep Packet Inspection for encrypted traffic. We shall also discuss key considerations and possible architectures.
Today, the majority of internet traffic is SSL/TLS encrypted to maintain privacy and secure communications between applications. Deep packet inspection (DPI) refers to the method of examining the full content of data packets as they traverse a network perimeter firewall. However, the lack of visibility into encrypted traffic presents a challenge to organizations that do not have the resources to decrypt and inspect network traffic. TLS encryption can hide malware, conceal data theft, or mask data leakage of sensitive information such as credit card numbers or passwords. Additionally, TLS decryption is compute-intensive and cryptographic standards are constantly evolving. Organizations that want to decrypt and inspect network traffic typically use a combination of hardware and software solutions from multiple vendors, which adds operational complexity and implementation challenges around capacity planning, scaling issues, and latency concerns. This forces some organizations to make adverse decisions to reduce the complexity of inspecting their network traffic such as blocking access to popular websites to mitigate performance problems.
There are multiple options you can use to perform DPI for encrypted traffic in your AWS environment, based on the use case. These include using AWS WAF or implementing third-party security appliances (next generation firewalls). The addition of new services like Gateway Load Balancer gives you more flexibility in designing your firewall architectures and the ability to perform DPI on AWS.
With this release, Network Firewall also becomes an option to support Deep Packet Inspection on encrypted payloads.
Considerations for deep packet inspection
The following are some key factors to consider when you enable TLS decryption functionality on Network Firewall.
DPI and performance. DPI is processor-intensive, because it not only looks into individual packets, but it also looks into traffic flows (a flow is a collection of related packets). This is combined with the fact that inspection needs to be done in real time with minimal impact to latency. Also, because many firewalls perform other advanced functions (for example, stateful packet inspection, NAT, virtual private network (VPN), and malware threat prevention), adding DPI increases the complexity of the entire system and impacts performance. However, because Network Firewall is an AWS managed service, the bandwidth performance of 100 gigabits per second (Gbps) per firewall endpoint is not impacted, even after you enable TLS inspection configuration. Single digit millisecond latency is expected at initial connection due to the TCP and TLS handshake before data can flow to the firewall. We recommend that you conduct your own testing for the rule sets to verify that the service meets your performance expectations.
DPI and encryption. Encryption has particularly been a challenge to DPI. Effective decisions can’t be made if the contents of the packets aren’t known. As more applications and websites use encryption, it is important that you implement the right TLS decryption technique. With Network Firewall, you can chose which traffic to decrypt by using your available certificates in AWS Certificate Manager (ACM). You can then apply the TLS configurations across the stateful rule groups, thereby authorizing Network Firewall to act as a go-between. For more information on how AWS Network Firewall handles privacy, please read the Network Firewall documentation.
AWS Network Firewall deployment architectures
There are three main architecture patterns for Network Firewall deployments. You can refer to the Deployment models for AWS Network Firewall blog post, which provides details on these, as well as key considerations. The three main models are as follows:
Distributed deployment model — Network Firewall is deployed into each individual VPC.
Centralized deployment model — Network Firewall is deployed into a centralized VPC for East-West (VPC-to-VPC) or North-South (inbound and outbound from internet, on-premises) traffic. We refer to this VPC as the inspection VPC throughout this blog post.
Combined deployment model — Network Firewall is deployed into a centralized inspection VPC for East-West (VPC-to-VPC) and a subset of North-South (on-premises, egress) traffic. Internet ingress is distributed to VPCs that require dedicated inbound access from the internet, and Network Firewall is deployed accordingly.
Each of these architectures is still valid for TLS inspection functionality. Today, AWS Network Firewall supports TLS inspection only for the ingress (inbound) traffic coming into the VPC.
In this section, we will highlight a deployment architecture with AWS Network Firewall and the process for deep packet inspection.
AWS Network Firewall – prior to TLS inspection configuration
Below figure 1 shows how Network Firewall performs inspection when the TLS inspection feature isn’t enabled. The workflow is as follows:
The ingress traffic enters the VPC. Ingress routing enables the internet traffic to be inspected by AWS Network Firewall.
The traffic from the firewall endpoint to the Network Firewall:
Network Firewall inspects the packet first through a stateless engine. Network Firewall makes a drop/pass decision by applying the rules that are present in the stateless engine.
If there is no match on the set of stateless rules present, the traffic is then forwarded to the stateful engine. Again, a drop/pass decision is made by applying the set of stateful rules.
If the decision is to pass traffic, then the firewall endpoint present in the firewall subnet sends the traffic to the customer subnet through the routes present in the VPC subnet route table.
AWS Network Firewall — after TLS inspection configuration
After you enable the TLS inspection capability in Network Firewall, the traffic flow changes slightly, as shown in Figure 2. Because the ingress data you want to inspect is encrypted, it first needs to be decrypted before it is sent to the firewall stateful engine.
In Figure 2, you can see the ingress traffic flow, which has the following steps:
The ingress traffic enters the VPC. Ingress routing enables the internet traffic to be inspected by AWS Network Firewall.
The traffic from the firewall endpoint to the Network Firewall:
Network Firewall inspects the packet first through a stateless engine. Network Firewall makes a drop/pass decision by applying the rules present in the stateless engine.
If there is no match on the set of stateless rules present, the traffic is then forwarded to the stateful engine. However, before the traffic passes to the stateful engine, if there is no match and the traffic is in the scope of the TLS encryption configuration, the traffic is forwarded for the decrypt operation.
After decryption, the traffic is then forwarded to the firewall stateful engine for inspection. Again, Network Firewall makes a drop/pass decision by applying the set of stateful rules.
If the decision is to pass traffic, then the firewall endpoint present in the firewall subnet sends the traffic to the customer subnet through the routes present in the VPC subnet route table.
Note: Customers must trust this certificate for the TLS inspection configuration to function properly.
Let’s look at how to implement TLS inspection when you create a new network firewall in AWS Network Firewall. A TLS inspection configuration contains one or more references to a valid AWS Certificate Manager (ACM) SSL/TLS certificate that Network Firewall uses to decrypt ingress (inbound) traffic. Network Firewall supports a variety of certificate types supported in addition to wildcard certificates. You can optionally define a scope (5-tuple based) to decrypt traffic by source and destination IP or port. To follow this procedure, you must have at least one valid certificate type supported by Network Firewall in ACM that’s accessible by your AWS account.
To create a TLS inspection configuration (console)
In the navigation pane, under Network Firewall, choose TLS inspection configurations.
Choose Create TLS inspection configuration.
Figure 3: TLS inspection configuration for AWS Network Firewall
On the Associate SSL/TLS certificates page, in the search box, select the ACM certificate to use in the TLS inspection configuration, and then choose Add certificate. You can use as many as 10 certificates for a single configuration.
Figure 4: SSL/TLS certificate as part of Network Firewall inspection configuration
Choose Next to go to the TLS inspection configuration’s Describe TLS inspection configuration page.
For Name, enter a name to identify this TLS inspection configuration, and optionally enter a description for the TLS inspection configuration.
Choose Next to go to the TLS inspection configuration’s Define scope page.
Figure 5: Description for Network Firewall inspection configuration
Note that you can’t change the name after you create the TLS inspection configuration.
In the Scope configuration pane, you can optionally define one or more 5-tuple scopes for the domains that you want Network Firewall to decrypt. Network Firewall uses the corresponding SSL/TLS certificates in your TLS inspection configuration to decrypt the SSL/TLS traffic that matches the scope criteria.
Figure 6: Define scope for Network Firewall to decrypt
For Protocol, choose the protocol to decrypt and inspect for. Network Firewall currently supports only TCP.
For Source, choose the source IP addresses and ranges to decrypt and inspect for. You can inspect for either Custom IP addresses or Any IPv4 address. (IPv6 is currently not supported.)
For Source port, choose the source ports and source port ranges to decrypt and inspect for. You can inspect for either Custom port ranges or Any port.
For Destination, choose the destination IP addresses and ranges to decrypt and inspect for. You can inspect for either Custom IP addresses or Any IPv4 address.
For Destination port, choose the destination ports and destination port ranges to decrypt and inspect for. You can inspect for either Custom port ranges or Any port.
After you’ve set the scope criteria, choose Add scope configuration, and then choose Next.
On the next page, Select encryption options, determine whether you want to use the AWS managed key or customize encryption settings (advanced). Here we use the default key that AWS owns and manages on your behalf, choose Next.
Figure 7: Select the encryption options
On the Add tags page, choose Next. Tags are optional but are recommended as a best practice. Tags help you organize and manage your AWS resources. For more information about tagging your resources, see Tagging AWS Network Firewall resources.
On the Review and confirm page, check the TLS inspection configuration settings. Choose Create TLS inspection configuration. Your TLS inspection configuration is now ready for use.
Figure 8: Validate the TLS inspection configuration
Update an existing network firewall with TLS inspection configuration
There are two methods that you can use modify an existing firewall configuration for TLS inspection, depending on your scenario.
Scenario 1: Add TLS inspection to an existing network firewall. In this scenario, you only need to consider the scope that TLS inspection applies to. After you have followed steps 1 through 12 outlined in the procedure in this post, and created the TLS inspection configuration, ingress (inbound) traffic will be decrypted and then sent to the stateful engine for inspection that uses your existing firewall policies.
Scenario 2: Modify an existing firewall with TLS inspection configured. In this scenario, where TLS configuration has already been added and you just need to modify the configuration, you can use the following steps. Note that you can’t change the name of a TLS inspection configuration after creation, but you can change other details.
AWS Network Firewall lets you inspect traffic at scale in a variety of use cases. In this blog post, we looked into the recently launched TLS inspection configuration for ingress inspection architectures and discussed considerations for enabling this feature. We showed how you can enable and update the TLS inspection feature on Network Firewall. To learn more about the TLS inspection feature, check out the AWS Network Firewall Developer Guide. We hope this post is helpful and look forward to hearing about how you use the latest feature.
If you have feedback about this post, submit comments in the Comments section below. If you have questions about this post, contact AWS Support.
Want more AWS Security news? Follow us on Twitter.
Effective security incident response depends on adequate logging, as described in the AWS Security Incident Response Guide. If you have the proper logs and the ability to query them, you can respond more rapidly and effectively to security events. If a security event occurs, you can use various log sources to validate what occurred and understand the scope. Then, you can use the results of your analysis to take remediation actions. To learn more about logging best practices, see Configure service and application logging and Analyze logs, findings, and metrics centrally.
In this blog post, we will show you how to achieve an effective strategy for logging for security incident response. We will share logging options across the typical cloud application stack, log analysis options, and sample queries. AWS offers managed services, such as Amazon GuardDuty for threat detection and Amazon Detective for incident analysis. If you want to collect additional logs or perform custom analysis, then you should consider the options described in this blog post.
Selection of logs
To select the appropriate logs for security incident response, you should start with the common cloud application stack, which consists of the components and layers of your application deployed on AWS. For each component, we will describe the logging sources that you have. For each log source, we will describe why you should log it for security incident response, how to enable the logs, and what your log storage options are.
To select the logs for security incident response, first consider the following questions:
What are your compliance and regulatory requirements for logging?
Note: Make sure that you comply with the log retention requirements of compliance standards relevant to your organization, as well as your organization’s incident response strategy.
What AWS services do you commonly use?
What AWS services have access to or contain sensitive data?
What threats are most relevant to you?
Note: Performing a threat model of your cloud architectures can help you answer this question. For more information, see How to approach threat modelling.
Considering these questions can help you develop requirements for logging that will guide your selection of the following log sources.
AWS account logs
An AWS account is the first, fundamental component of an application deployed on AWS. The account is a container for your AWS resources. You create and manage your AWS resources in this account, and the account provides administrative capabilities for access and billing.
AWS CloudTrail
Within an account, each action performed is an API call. From a console sign-in to the deployment of each resource in an AWS CloudFormation stack, events are generated to provide transparency on what has occurred in the account. With AWS CloudTrail, you can log, continuously monitor, and retain account activity related to actions across supported AWS services. CloudTrail provides the event history of your account activity, including actions taken through the AWS Management Console, AWS SDKs, command line tools, and other AWS services. CloudTrail logs API calls as three types of events:
Management events(also known as control plane operations) show management operations that are performed on resources in your account. This includes actions like creating an Amazon Simple Storage Service (Amazon S3) bucket and setting up logging.
Data events(also known as data plane operations) show the resource operations performed on or within resources in your account. These operations are often high-volume activities, such as Amazon S3 object-level API activity (for example, GetObject, DeleteObject, and PutObject API operations) and AWS Lambda function invocation activity.
Insights events capture unusual API call rate or error rate activity in your account. You must enable these events on a trail in order to capture them, and they are logged to a different folder prefix in the destination S3 bucket for your trail. Insights events provide you with information such as the type of event, the incident time period, the associated API, the error code, and statistics to help you understand and respond effectively to unusual activity.
For security investigations, CloudTrail provides context on the creation, modification, and deletion of AWS resources. Therefore, CloudTrail is one of your most important log sources for security incident response in an AWS environment. You have three primary ways to set up CloudTrail:
CloudTrail Event history — CloudTrail is enabled by default with 90-day retention of management events that you can retrieve through the CloudTrail Event history facility using the console, AWS Command line Interface (AWS CLI), or AWS SDK. You don’t need to take any action to get started using the Event history feature.
CloudTrail trail — For longer retention and visibility of data events, you need to create a CloudTrail trail and associate it with an S3 bucket and optionally with an Amazon CloudWatch log group. If you use AWS Organizations, you can create an organization trail that will log events for each account in the organization. By default, trails are multi-Region, so you don’t need to enable CloudTrail logs in each AWS Region.
AWS CloudTrail Lake — You can create a CloudTrail lake, which retains CloudTrail logs for up to seven years and provides a SQL-based querying facility. You don’t need to have a trail configured in your account to use CloudTrail Lake.
Amazon Security Lake — You can use Security Lake to ingest CloudTrail events, which include management and data events. You can further analyze these events with Amazon QuickSight or another other third-party security information and event management (SIEM) tool.
AWS Config
Creating and modifying resources is an integral part of your account use. Tracking resource configuration changes made by calling the AWS API helps you review changes throughout the resource lifecycle. AWS Config provides a detailed view of the configuration of AWS resources in your account, examines the resource configurations periodically, and tracks configuration changes that were not initiated by the API. This includes how the resources are related to one another and how they were configured in the past so that you can see how configurations and relationships change over time.
You should enable AWS Config in each Region where you have resources deployed, and you should configure an S3 bucket to receive configuration history and configuration snapshot files, which contain details on the resources that AWS Config records. You can then review configuration compliance and analyze activities performed before, during, and after an event using the configuration history in S3. You should centralize AWS Config resource tracking across multiple accounts in the same organization by setting up an aggregator. You can use AWS Control Tower to automate the setup.
During a security investigation, you might want to understand how a resource configuration has changed over time. For example, you might want to investigate the changes to an S3 bucket policy before and after a security event that involves an S3 bucket. AWS Config provides a configuration history for resources that can help you track activities performed during a security event.
Operating system and application logs
To record interactions with applications, you must capture operating system (OS) and application logs, especially custom logs generated by the application development framework. OS and local application logs are relevant for security events that involve an Amazon Elastic Compute Cloud (Amazon EC2) instance. These instances could be standalone, in an auto scaling group behind a load balancer, or compute workloads for Amazon Elastic Container Service (Amazon ECS) or an Amazon Elastic Kubernetes Service (Amazon EKS) cluster. OS logs track privileged use, processes, login events, access to directory services, and file system activity on a server. To analyze a potential compromise to an EC2 instance, you will want to review the security event logs for Windows OS and the system logs for Linux-based OS.
With the unified CloudWatch agent, you can collect metrics and logs from EC2 instances and on-premises servers. The CloudWatch agent aggregates log data into CloudWatch logs, which can then be exported to Amazon S3 for long-term retention and analyzed with a SIEM tool of your choice or Amazon Athena, as shown in Figure 1.
Figure 1: Aggregate OS and application logs using CloudWatch Logs
Database logs
With SQL databases, you can log transactions to help track modifications to the databases, such as additions or deletions. After an engine or system failure, you will need transaction logs to restore a database to a consistent state. Transaction logs are designed to be secure, and they require additional processing to access valuable information. It’s important that you understand data interactions during a security investigation, especially if your databases hold personally identifiable information (PII), financial and payments information, or other information subject to regulatory controls.
The goal of logging network activity is to gain insight into the communications that traverse your network. You might need this data for a variety of reasons, such as network troubleshooting or for use in a forensic investigation of suspected malware activity within your network.
In the AWS Cloud, you can log network activity by creating a proxy that logs network traffic or by using Traffic Mirroring to send a copy of network traffic to a logging server. You can adopt cloud-native approaches to capture this type of data using Amazon Route 53 DNS query logs and Amazon VPC Flow Logs.
There are also a variety of third-party networking solutions available like Palo Alto Networks and Fortinet, so you can continue to use the network logging mechanisms that you might have used in an on-premises environment.
Route 53 DNS query logs
You can configure Amazon Route 53 to log Domain Name System (DNS) queries. These logs are categorized into two groups:
Public DNS query logging
Resolver query logging
Logging public DNS queries against domains that you have hosted in Route 53 provides query information, such as the domain or subdomain requested, date and time stamp of the request, DNS record type, Route 53 edge location that responded, and response code.
You can configure VPC Flow Logs for a VPC in your account to capture traffic that enters and moves around your VPC network, without the addition of instances or products. From these logs, you can review information, such as source and destination IP, ports, timestamps, protocol, account ID, and whether the traffic was accepted or rejected. For a complete list of the fields available for flow log records, see Available fields. You can create a flow log for a VPC, a subnet, or a network interface. If you create a flow log for a subnet or VPC, IP traffic going to and from each network interface in that subnet or VPC will be logged. For more details on VPC Flow Logs, see Logging IP traffic using VPC Flow Logs.
You can forward flow logs to Amazon CloudWatch Logs to create CloudWatch alarms based on metric filters. You can also forward flow logs to an S3 bucket for long-term retention and further analysis. Figure 2 demonstrates these configurations.
Figure 2: Sending VPC Flow logs to CloudWatch Logs and S3
Access logs
To identify access patterns for accessible endpoints, especially public endpoints, you should use access logs. Access logs capture detailed information about requests sent to your load balancer. Each log contains information such as the time the request was received, the client’s IP address, latencies, request paths, and server responses. With services built in layers behind a load balancer, unless you track the X-Forwarded-For request header, the requestor’s context is lost. Access logs help bridge that gap during investigations and analysis.
Amazon S3 server access logs
Access logs are critical to track object level access when using S3 buckets to store confidential or sensitive data. You can also turn on CloudTrail to capture S3 data events. You can store access logs in S3 buckets for long-term storage for compliance purposes and to run analyses during and after an event.
Load balancing logs
Elastic Load Balancing provides access logs that capture detailed information about requests sent to load balancers. Each log contains information such as the time the request was received, the client’s IP address, latencies, request paths, and server responses. You can use this log to analyze traffic patterns and to troubleshoot issues.
Access logs is an optional feature of Elastic Load Balancing that is turned off by default. To enable access logs for load balancers, see Access logs for your Application Load Balancer.
If you implement your own reverse proxy for load balancing needs, make sure that you capture the reverse proxy access logs. You can use the unified CloudWatch agent to forward the logs to CloudWatch. As with OS logs, you can export CloudWatch logs to an S3 bucket for long-term retention and analysis.
If you use an Amazon CloudFront distribution as the public endpoint for end users with load balancers as the custom origin, then load balancing access logs will represent the CloudFront distribution as the requestor, rather than the actual end user. If this information doesn’t add value to your incident handling process, then you can use CloudFront access logs as the log source that provides end user request details.
CloudFront access logs
You should enable standard logs, also known as access logs, when using CloudFront. Specify an S3 bucket where you want CloudFront to save the files.
CloudFront access logs are delivered on a best-effort basis. For information about requests made to a distribution in real time, use real-time logs that are delivered within seconds of receiving the requests. You should use real-time logs to monitor, analyze, and take action based on content delivery performance. For more details on the fields available from these logs, see the CloudFront standard log file format.
AWS WAF logs
When associated with a supported resource like a CloudFront distribution, Amazon API Gateway REST API, Application Load Balancer, AWS AppSync GraphQL API, Amazon Cognito user pool, or AWS App Runner, AWS WAF can help you monitor HTTP and HTTPS requests that are forwarded to the resource. You should configure web access control lists (ACLs) to gain fine-grained control over the requests, and enable logging for such ACLs to get detailed information about traffic that is analyzed by AWS WAF. Log information includes time of the request being received by AWS WAF from the AWS resource, details about the request, and the AWS WAF rules that the request matched. You can use this log information to monitor access patterns of public endpoints and configure rules to inspect requests in detail. For more information about AWS WAF logging, see Logging web ACL traffic.
Serverless logs
Serverless computing has become increasingly popular in the cloud-computing space. It provides on-demand compute power in a relatively short burst, meaning that cloud-based instances don’t need to be provisioned and kept around, idle, when there are no tasks to be completed. Although more and more compute tasks are being moved to serverless solutions, the need to log has not changed, but how the logs are generated has. In a serverless environment, security investigations not only benefit from logs that demonstrate the interactions and changes made by the code deployed, but that also document changes to the deployed code itself and access permissions of the Lambda execution role that is granting privileged access.
AWS Lambda
The logging of Lambda functions involves two components: how the function itself is operating, and what is happening inside the function (what your code is actually doing).
The logging of a Lambda function itself occurs through data events captured by CloudTrail. As noted earlier in this post, you must configure data events on a trail created in CloudTrail. During configuration, you will need to specify the function from which logs will be captured by your trail, and the destination S3 bucket where they will be stored. These logs contain details on the invocation of the function and help identify the IAM principals that called the Invoke API for Lambda.
AWS Lambda automatically monitors Lambda functions on your behalf and sends logs to CloudWatch. Your Lambda function comes with a CloudWatch Logs log group and a log stream for each instance of your function. The Lambda runtime environment sends details about each invocation to the log stream, and relays logs and other output from your function’s code. For more details on how to monitor Lambda functions, see Accessing Amazon CloudWatch logs for AWS Lambda.
Log analysis
For incident response, you need to be able to analyze and query your logs to validate what occurred and to understand the scope.
To begin, you can aggregate logs from various sources in S3 buckets for long-term storage, and you can integrate that data with query tools for further investigation. Logs can be exported and either parsed through directly, or ingested by another tool to help with the analysis. The following are some options that you can use to query these logs:
Amazon Athena — You can directly query CloudTrail events stored in S3 with Athena using SQL commands, specifying the LOCATION of the log files. You would generally use this approach if you have advanced queries to run, and you don’t have a SIEM. To set up Athena to query logs, you can use this open-source solution from AWS.
Amazon OpenSearch Service — OpenSearch is a distributed search and log analytics suite. Because it’s open source, it can ingest logs from more than just AWS log sources. To set this up, you can use this open-source SIEM solution from AWS.
CloudTrail Event History — Either from the console, or programmatically, you can query CloudTrail management events from the last 90-day period. This is ideal for when you have simple queries to make within the last 90 days, and you don’t need stored logs or more complex queries.
AWS CloudTrail Lake — Either from the console, or programmatically, you can query stored events in your configured CloudTrail Lake from the time of its configuration, up until the maximum storage duration of 2,557 days (7 years) from the time that you make your query. This approach allows for SQL-based queries, and it is ideal for when you need to make more complex queries against events, but don’t require the additional features of a SIEM solution.
Parse through raw JSON using CLI — This is achieved programmatically and parsed through terminal commands. It’s more a legacy method of parsing through logs. You might choose to use this approach for analysis if another service or solution isn’t feasible (for example, if you can’t use the service due to your corporate security policy).
Third-party SIEM — A third-party SIEM might be ideal if you already have a SIEM solution on AWS or elsewhere, and you don’t need a duplicated solution elsewhere. Typically, SIEM solutions will import logs from an S3 bucket and process and index events for analysis. To learn more about SIEM options, see the SIEM solutions in the AWS Marketplace, or the AWS Security Competency Partners for a partner local to you with threat detection and incident response (TDIR) expertise.
Sample queries
In this section, we provide samples of SQL queries. Both Athena and CloudTrail Lake accept SQL queries, but the following samples have been tested for use in Athena only. This is because some samples are for VPC Flow Logs, which you can’t query from CloudTrail Lake. To query CloudTrail logs in Athena, you must first create a table definition that points to the location of your logs stored in S3. You can do this from the CloudTrail Events console by using a hyperlinked suggestion, or from the Athena console directly. Alternatively, for Athena, you can use the AWS Security Analytics Bootstrap.
For each of these queries, you might need to modify some of the fields, such as the time frame that you are investigating, the IAM entity involved, and the account and Region in scope. For example, you might want to modify the time frame based on the current time and when you believe the security event began. This often involves expanding the time frame after running additional queries and learning more about the scope and timeline.
By using partitions for tables, you can restrict the amount of data scanned by each Athena query, helping to improve performance and reduce cost. For example, you can partition your CloudTrail Athena table manually or by using partition projection. You can include the partition column (for example, the timestamp) in your queries to limit the amount of data scanned.
Unauthorized attempts
When a security event occurs, you might want to review API calls that were attempted but failed due to the IAM principal not having access to perform the action on that resource. To discover this activity, run the following query (be sure to modify the time window first):
SELECT *
FROM cloudtrail
WHERE errorcode IN ('Client.UnauthorizedOperation','Client.InvalidPermission.NotFound','Client.OperationNotPermitted','AccessDenied')
AND useridentity.arn LIKE '%iam%'
AND eventtime >= '2023-01-01T00:00:00Z'
AND eventtime < '2023-03-01T00:00:00Z'
ORDER BY eventtime desc
This sample query can help you identify whether certain IAM principals have a significant amount of unauthorized API calls, which can indicate that an IAM principal is compromised.
Rejected TCP connections
During a security event, the unauthorized user that is interacting with the resources in your account is probably trying to establish persistence through the network layer. To get a list of rejected TCP connections and extract from it the day that these events occurred, run the following query:
SELECT day_of_week(date) AS
day,date,interface_id,srcaddr,action,protocol
FROM vpc_flow_logs
WHERE action = 'REJECT' AND protocol = 6
LIMIT 100;
Connections over older TLS versions
You might want to see how many calls to AWS APIs were made using older versions of the TLS protocol, as part of a forensic follow-up or a discovery job after a risk analysis. You can get this data by querying CloudTrail logs.
SELECT eventSource
COUNT(*) AS numOutdatedTlsCalls FROM cloudtrail WHERE tlsDetails.tlsVersion IN ('TLSv1', 'TLSv1.1') AND eventTime > '2023-01-01 00:00:00' GROUP BY eventSource ORDER BY numOutdatedTlsCalls DESC
Filter connections from an IP
With an IP address that you’d like to investigate, as a part of your forensic analysis, you might want to see the connections made to resources in a VPC. You can obtain this information by querying VPC Flow Logs. As with the server access logs, if you’re using Athena, you will first need to create a new table.
SELECT day_of_week(date) AS
day, date, srcaddr, dstaddr, action, protocol
FROM vpc_flow_logs
WHERE day >= '2023/01/01' AND day < '2023/03/01' AND srcaddr LIKE '172.50.%'
ORDER BY day DESC
LIMIT 100
Investigate user actions
If you have identified a user who has been compromised, or that you suspect has been compromised, you might want to know the API calls that they made over a specific time period. Understanding the activity of a user can help you understand the scope of impact during an incident, as well as the reach of user permissions when you design your access management strategy.
SELECT eventID, eventName, eventSource, eventTime, userIdentity.arn
AS user
FROM cloudtrail
WHERE userIdentity.arn = '%<username>%' AND eventTime > '2022-12-05 00:00:00' AND eventTime < '2022-12-08 00:00:00'
Conclusion
It is essential that you capture logs from various layers within your application architecture, so that you can effectively respond to a security event at various layers of the application stack. If a security event occurs, logs can help provide a clear picture of what happened and the scope of the affected resources. This post helps you build a logging strategy for security incident response by understanding what logs you want to analyze, where you want to store those logs, and how you will analyze them.
Designing a scalable, global, real-time, distributed system to process millions of messages from a variety of critical devices can complicate architectures. Collecting large data streams or image recognition from the edge also requires scalable solutions.
AWS IoT Core is designed to handle large numbers of Internet of things (IoT) devices sending a few messages per second. However, when IoT devices send large numbers of messages per second and processing occurs at the edge, managing large data streams is challenging. Further, data that is buffered or processed at the edge can increase latency.
This post describes how to create a scalable IoT architecture with AWS IoT Greengrass stream manager that can handle thousands of critical messages per second from a variety of IoT devices.
Relaying critical messages from high-throughput IoT devices
Let’s explore an example. Consider the architecture in Figure 1, where you have two types of IoT devices sending messages to AWS IoT Core. One set of IoT devices sends thousands of messages per second while the other set of devices sends tens of messages per second.
The IoT devices that are sending thousands of messages per second contain critical data that cannot be lost and must be processed at the edge. The IoT devices sending tens of messages per second are of less importance.
Figure 1. IoT devices sending messages to AWS IoT Core
In considering this architecture, the critical IoT devices sending thousands of messages per second take the following path:
IoT devices send data to an AWS IoT Greengrass component for processing with a Quality of Service (QoS) of 0.
In contrast, the IoT devices that send a few messages per second take the following path:
IoT devices send data to the AWS IoT Greengrass message broker.
The AWS IoT Greengrass message broker relays the data to AWS IoT Core.
AWS IoT Core sends the data to Kinesis Data Streams for further processing.
Due to the critical nature of the messages being sent, the AWS IoT Greengrass message broker is configured to send messages to the AWS IoT Core with a QoS of 1. However, when you configure QoS to 1, the AWS IoT Greengrass message broker has to wait for an acknowledgement (ACK) before sending more data.
As you add more IoT devices, many choose to batch the messages before sending them to AWS IoT Core. This can be a good strategy when you are dealing with many IoT devices that send a small number of messages per second. But when you are adding IoT devices that send thousands of messages per second, the time waiting for an ACK can add latency and cause inconsistencies when reporting the data downstream.
This is because the AWS IoT Greengrass message broker is capable of sending 100 messages to AWS IoT Core before waiting for an ACK when QoS is set to 1. As a result, scaling this architecture to handle additional IoT devices can become challenging.
AWS IoT Greengrass stream manager for speed and reliability
To scale this type of architecture, you can use a pre-built AWS IoT Greengrass component called AWS IoT Greengrass stream manager to bypass the Greengrass message broker and AWS IoT Core to send your data directly to AWS IoT Analytics, AWS IoT SiteWise, Amazon Kinesis, or Amazon Simple Storage Service (Amazon S3).
For example, consider the earlier scenario where one set of IoT devices is sending thousands of critical messages per second and another set is sending data of less importance.
Instead, you can use AWS IoT Greengrass stream manager to create an architecture that can easily and reliably send large amounts of data from the edge directly to Kinesis, as in Figure 2.
Figure 2. AWS IoT Greengrass stream manager sending data directly to Kinesis
As opposed to the Figure 1 configuration, the critical IoT devices that send thousands of messages per second can now take the following path:
Critical IoT devices send data to an AWS IoT Greengrass component for processing.
The AWS IoT Greengrass component processes the data and sends it to AWS IoT Core stream manager.
AWS IoT Greengrass stream manager sends the data directly Amazon Kinesis Data Streams.
Note that the IoT devices sending a few messages per second can also be sent to AWS IoT Greengrass stream manager at a lower priority. You are still using AWS IoT Core, but it is no longer the main data path. By continuing to use AWS IoT Core, you can benefit from its control plane features such as managing updates, certificates, and policies. However, AWS IoT Core’s data plane features—like Rules Engine—are no longer used in this architecture, which can help reduce costs. If you choose to bypass the AWS IoT Greengrass message broker and use AWS IoT Core stream manager, any components that you have built must be moved so that processing occurs at the edge.
In the architecture in Figure 2, AWS IoT Greengrass stream manager is being used to bypass the main data path away from the AWS IoT Greengrass message broker and AWS IoT Core. Bypassing these services reduces the latency in Figure 1 caused by the AWS IoT Greengrass message broker waiting for an ACK from AWS IoT Core.
AWS IoT Greengrass stream manager can handle thousands of messages per second so you can:
Reliably scale your architecture
Create multiple data paths to send both critical and non-critical data to AWS IoT Core stream manager while still leveraging AWS IoT Core control plane features
Prioritize your critical data paths to have specific IoT devices take higher priority
Create configurations to handle situations where you have IoT devices with limited or intermittent connectivity. (For example, you can create configurations to use local storage or memory to cache your data when internet connectivity is lost, and then flush data when an ACK is received from the destination.)
All of these features can help you reduce latency, costs, data inconsistencies, and the potential loss of critical data. They also provide a mechanism to scale the number of devices that your architecture can reliably handle.
In this blog post, we discussed how to create a scalable IoT architecture that can handle thousands of critical messages per second from a variety of IoT devices. Incorporating AWS IoT Greengrass stream manager into your architecture can help reduce latency, data inconsistencies, and the potential loss of critical data by providing a way to bypass AWS IoT Core and send large amounts of data efficiently and reliably.
AWS CodeBuild is a fully managed continuous integration service that compiles source code, runs tests, and produces ready-to-deploy software packages. With CodeBuild, you don’t need to provision, manage, and scale your own build servers. You just specify the location of your source code and choose your build settings, and CodeBuild will run your build scripts for compiling, testing, and packaging your code.
CodeBuild uses simple pay-as-you-go pricing. There are no upfront costs or minimum fees. You pay only for the resources you use. You are charged for compute resources based on the duration it takes for your build to execute.
There are three main factors that contribute to build costs with CodeBuild:
Build duration
Compute types
Additional services
Understanding how to balance these factors is key to optimizing costs on AWS and this blog post will take a look at each.
Compute Types
CodeBuild offers three compute instance types with different amounts of memory and CPU, for example the Linux GPU Large compute type has 255GB of memory and 32 vCPUs and enables you to execute CI/CD workflow for deep learning purpose (ML/AI) with AWS CodePipeline. Incremental changes in your code, data, and ML models can now be tested for accuracy, before the changes are released through your pipeline.
The Linux 2XLarge instance type is another instance type with 145GB of memory and 72 vCPUs and is suitable for building large and complex applications that require high memory and CPU resources. It can help reduce build time, speed up delivery, and support multiple build environments.
The GPU and 2XLarge compute types are powerful but are also the most expensive compute types per minute. For most build tasks the small, medium or large instance compute types are more than adequate. Using the pricing listed in US East (Ohio) we can see the price variance between the small, medium and large Linux instance types in Figure 1 below.
Figure 1. AWS CodeBuild small, medium and large compute types vs cost per minute
Analyzing the CodeBuild compute costs leads us to a number of cost optimization considerations.
Right Sizing AWS CodeBuild Compute Types to Match Workloads
Right sizing is the process of matching instance types and sizes to your workload performance and capacity requirements at the lowest possible cost. It’s also the process of looking at deployed instances and identifying opportunities to eliminate or downsize without compromising capacity or other requirements, which results in lower costs.
Right sizing is a key mechanism for optimizing AWS costs, but it is often ignored by organizations when they first move to the AWS Cloud. They lift and shift their environments and expect to right size later. Speed and performance are often prioritized over cost, which results in oversized instances and a lot of wasted spend on unused resources.
CodeBuild monitors build resource utilization on your behalf and reports metrics through Amazon CloudWatch. These include metrics such as
CPU
Memory
Disk I/O
These metrics can be seen within the CodeBuild console, for an example see Figure 2 below:
Figure 2. Resource utilization metrics
Leveraging observability to measuring build resource usage is key to understanding how to rightsize and CodeBuild makes this easy with CloudWatch metrics readily available through the CodeBuild console.
Consider ARM / Graviton
If we compare the costs of arm1.small and general1.small over a ten minute period we can see that the arm based compute type is 32% less expensive.
Figure 3. Comparison of small arm and general compute types
But cost per minute while building is not the only benefit here, ARM processors are known for their energy efficiency and high performance. Compiling code directly on an ARM processor can potentially lead to faster execution times and improved overall system performance.
AWS Graviton processors are custom built by Amazon Web Services using 64-bit Arm Neoverse cores to deliver the best price performance for your cloud workloads. The AWS Graviton Fast Start program helps you quickly and easily move your workloads to AWS Graviton in as little as four hours for applications such as serverless, containerized, database, and caching.
Consider migrating Windows workloads to Linux
If we compare the cost of a general1.medium Windows vs Linux compute type we can see that the Linux Compute type is 43% less expensive over ten minutes:
Figure 4. Build times on Windows compared to Linux
Migrating to Linux is one strategy to not only reduce the costs of building and testing code in CodeBuild but also the cost of running in production.
The effort required to re-platform from Windows to Linux varies depending on how the application was implemented. The key is to identify and target workloads with the right characteristics, balancing strategic importance and implementation effort.
For example, older .Net applications may be able to be migrated to later versions of .NET (previously named .Net Core) first before deploying to Linux. AWS have a Porting Assistant for .NET that is an analysis tool that scans .NET Framework applications and generates a cross-platform compatibility assessment, helping you port your applications to Linux faster.
One of the dimensions of the CodeBuild pricing is the duration of each build. This is calculated in minutes, from the time you submit your build until your build is terminated, rounded up to the nearest minute. For example: if your build takes a total of 35 seconds using one arm1.small Linux instance on US East (Ohio), each build will cost the price of the full minute, which is $0.0034 in that case. Similarly, if your build takes a total of 5 minutes and 20 seconds, you’ll be charged for 6 minutes.
When you define your CodeBuild project, within a buildspec file, you can specify some of the phases of your builds. The phases you can specify are install, pre-build, build, and post-build. See the documentation to learn more about what each of those phases represent. Besides that, you can define how and where to upload reports and artifacts each build generates. It means that on each of those steps, you should do only what is necessary for the task you want to achieve. Installing dependencies that you won’t need, running commands that aren’t related to your task, or performing tests that aren’t necessary will affect your build time and unnecessarily increase your costs. Packaging and uploading target artifacts with unnecessary large files would cause a similar result.
On top of the CodeBuild phases and steps that you are directly in control, each time you start a build, it takes additional time to queue the task, provision the environment, download the source code (if applicable), and finalize. See Figure 5 below a breakdown of a succeeded build:
Figure 5. AWS CodeBuild Phase details
In the above example, for each build, it takes approximately 42 seconds on top of what is specified in the buildspec file. Considering this overhead, having several smaller builds instead of fewer larger builds can potentially increase your costs. With this in mind, you have to keep your builds as short as possible, by doing only what is necessary, so that you can minimize the costs. Furthermore, you have to find a good balance between the duration and the frequency of your builds, so that the overhead doesn’t take a large proportion of your build time. Let’s explore some approaches you can factor in to find this balance.
Build caching
A common way to save time and cost on your CodeBuild builds is with build caching. With build caching, you are able to store reusable pieces of your build environment, so that you can save time next time you start a new build. There are two types of caching:
Amazon S3 — Stores the cache in an Amazon S3 bucket that is available across multiple build hosts. If you have build artifacts that are more expensive to build than to download, this is a good option for you. For large build artifacts, this may not be the best option, because it can take longer to transfer over your network.
Local caching — Stores a cache locally on a build host that is available to that build host only. When you choose this option, the cache is immediately available on the build host, making it a good option for large build artifacts that would take long network transfer time. If you choose local caching, there are multiple cache modes you can choose including source cache mode, docker layer cache mode and custom cache mode.
Docker specific optimizations
Another strategy to optimize your build time and reduce your costs is using custom Docker images. When you specify your CodeBuild project, you can either use one of the default Docker images provided by CodeBuild, or use your own build environment packaged as a Docker image. When you create your own build environment as a Docker image, you can pre-package it with all the tools, test assets, and required dependencies. This can potentially save a significant amount of time, because on the install phase you won’t need to download packages from the internet, and on the build phase, when applicable, you won’t need to download e.g., large static test datasets.
To achieve that, you must specify the image value on the environment configuration when creating or updating your CodeBuild project. See Docker in custom image sample for CodeBuild to learn more about how to configure that. Keep in mind that larger Docker images can negatively affect your build time, therefore you should aim to keep your custom build environment as lean as possible, with only the mandatory contents. Another aspect to consider is to use Amazon Elastic Container Registry (ECR) to store your Docker images. Downloading the image from within the AWS network will be, in most of the cases, faster than downloading it from the public internet and can avoid bottlenecks from public repositories.
Consider which tests to run on the feature branch
If you are using a feature-branch approach, consider carefully which build steps and tests you are going to run on your branches. Running unit tests is a good example of what you should run on the feature branches, but unless you have very specific requirements, you probably don’t need penetration or integration tests at this point. Usually the feature branch changes often, hence running all types of tests all the time is a potential waste. Prefer to have your complex, long-running tests at a later stage of your CI/CD pipeline, as you build confidence on the version that you are to release.
Build once, deploy everywhere
It’s widely considered a best practice to avoid environment-specific code builds, therefore consider a build once, deploy everywhere strategy. There are many benefits to separating environment configuration from the build including reducing build costs, improve maintainability, scalability, and reduce the risk of errors.
Build once, deploy everywhere can be seen in the AWS Deployment Pipeline Reference Architecture where the Beta, Gamma and Prod stages are created from a single artifact created in the Build Stage:
Amazon CloudWatch can be used to monitor your builds, report when something goes wrong, take automatic actions when appropriate or simply keep logs of your builds.
CloudWatch metrics show the behavior of your builds over time. For example, you can monitor:
How many builds were attempted in a build project or an AWS account over time.
How many builds were successful in a build project or an AWS account over time.
How many builds failed in a build project or an AWS account over time.
How much time CodeBuild spent running builds in a build project or an AWS account over time.
Build resource utilization for a build or an entire build project. Build resource utilization metrics include metrics such as CPU, memory, and storage utilization.
However, you may incur charges from Amazon CloudWatch Logs for build log streams. For more information, see Monitoring AWS Codebuild in the CodeBuild User Guide and the CloudWatch pricing page.
Storage Costs
You can create an CodeBuild build project with a set of output artifacts and publish then to S3 buckets. Using S3 as a repository for your artifacts, you only pay for what you use. Check the S3 pricing page.
Encryption
Cloud security at AWS is the highest priority and encryption is an important part of CodeBuild security. Some encryption, such as for data in-transit, is provided by default and does not require you to do anything. Other encryption, such as for data at-rest, you can configure when you create your project or build. Codebuild uses Amazon KMS to encrypt the data at-rest.
Build artifacts, such as a cache, logs, exported raw test report data files, and build results, are encrypted by default using AWS managed keys and are free of charge. Consider using these keys if you don’t need to create your own key.
If you do not want to use these KMS keys, you can create and configure a customer managed key. For more information, see the documentation on creating KMS Keys and AWS Key Management Service concepts in the AWS Key Management Service User Guide.
You may incur additional charges if your builds transfer data, for example:
Avoid routing traffic over the internet when connecting to AWS services from within AWS by using VPC endpoints
Traffic that crosses an Availability Zone boundary typically incurs a data transfer charge. Use resources from the local Availability Zone whenever possible.
Traffic that crosses a Regional boundary will typically incur a data transfer charge. Avoid cross-Region data transfer unless your business case requires it
Use the AWS Pricing Calculator to help estimate the data transfer costs for your solution.
Use a dashboard to better visualize data transfer charges – this workshop will show how.
In this blog post we discussed how compute types; build duration and use of additional services contribute to build costs with AWS CodeBuild.
We highlighted how right sizing compute types is an important practice for teams that want to reduce their build costs while still achieving optimal performance. The key to optimizing is by measuring and observing the workload and selecting the most appropriate compute instance based on requirements.
Further compute type cost optimizations can be found by targeting AWS Graviton processors and Linux environments. AWS Graviton Processors in particular offer several advantages over traditional x86-based instances and are designed by AWS to deliver the best price performance for your cloud workloads.
Did you know you can use CloudFormation to manage third-party resources? The AWS CloudFormation Public Registry provides a searchable collection of CloudFormation extensions and makes it easy to discover and provision them in CloudFormation templates and AWS Cloud Development Kit (CDK) applications. In the past three months, we’ve added a number of new, exciting partners to the Public Registry, including GitLab, Okta, and PagerDuty.
The extensions available on the registry are wide-ranging and include third-party resources from partners such as MongoDB; hooks, which are preventative controls that add safeguards to provisioning; and modules, which are re-usable components that take into account best practices and opinionated definitions of resources. AWS Partner Network (APN), third parties, and the developer community contribute these extensions to the Public Registry. Using extensions, customers no longer need to create and maintain custom provisioning logic for resource types from third-party vendors.
Over last few months, AWS collaborated with partners to develop and publish over 80 new resources across 14 providers to Public Registry for CloudFormation. Below is a summary of the new resource type additions.
Manage components in MongoDB Atlas. Add, edit, or delete administrative objects within Atlas, including projects, users, and database deployments
Note: You cannot read or write data to Atlas Clusters with Atlas Admin APIs and AWS CloudFormation resources. To read and write data in Atlas, you must use the Atlas Data API
Manage the users and groups in an organization, set up a new project with the right users, groups, and access token, tag a project automatically for every active CI/CD deployment
Create a new Dashboard with custom Pages, Widgets and Layout, add tags to your data to help improve data organization and findability, workloads-related tasks
Here are some of the benefits for extension builders and consumers when publishing extensions to the public registry:
Discoverability – Publishing your extensions in the public registry will make them discoverable by 1M+ active CloudFormation and CDK customers.
CDK Support – We’re seeing rapid growth in the adoption of the CDK amongst the developer population. Upon publishing to the registry, L1 CDK Constructs will automatically be created for your third party resources making them compatible with the CDK with no added work required. These constructs will also be listed on Construct Hub and aids discoverability discoverable by customers. Note: Automated L1 CDK construct generation is currently an experimental feature.
Drift detection – Third-party resource types in the public registry also integrate with drift detection. After creating a resource from a third-party resource type, CloudFormation will detect changes to the third-party resource from its template configuration, known as configuration drift, just as it would with AWS resources.
AWS Config – You can also use AWS Config to manage compliance for third-party resources consumed from the registry. The resource types are automatically tracked as Configuration Items when you have configured AWS Config to record them, and used CloudFormation to create, update, and delete them. Whether the resource types you use are third-party or AWS resources, you can view configuration history for them, in addition to being able to write AWS Config rules to verify configuration best practices.
Abstraction of Best Practices with Modules – Browse and use modules from the registry when creating your CloudFormation templates to ensure you’re provisioning resources while adhering to best practices.
AWS Cloud Control API – The AWS Cloud Control API allows AWS partners and customers to interface with your resource type through API calls using Create, Read, Update, Delete, and List (CRUD-L) operations. Resources in the registry will be automatically integrated with our AWS Cloud Control API and expands your third party resource compatibility to even more AWS services and IaC tools.
We’ve seen great momentum from our partners and developer community over the past year. We are looking forward to continued investment and innovation in the Public Registry.
How to Get Started
For Resource Type Users: Explore and Activate Third Party Resource Types
Third party resource types must first be activated before they can be used. You do this by logging into your AWS Console > Navigate to CloudFormation > Registry > Public extensions > Set the Publisher to Third Party. This will show you a list of available third-party resources in your region (note that different regions may have a different set of third-party resource types). Select the radio box next to the resource types you want to activate and click the activate button at the top of the list.
Figure 1:
Don’t see the extension you need in the registry?
You can submit requests for new third-party extensions through our Community Registry Extensions Github repo issue tracker! Click the New Issue button and describe the third-party extension along with information about your use case.
For Developers and Publishers: Join the CloudFormation Developer Community and Start Building
You can see several of the community-built registry extensions in the AWS CloudFormation Community Registry Extensions repository and even contribute yourself. You can also read about the experiences and lessons learned from publishing to the Registry through this blog written by Cloudsoft.
For developers looking to create new resource types to add to the public Registry, follow this creating resource types walkthrough help you get started. If you need assistance creating, publishing resources, or just want to join the discussion, you can join the conversation today in our CloudFormation Discord Channel. We’d love to hear about your experiences and use cases in developing innovations with registry extensions.
Amazon Redshift Serverless makes it simple to run and scale analytics without having to manage your data warehouse infrastructure. Developers, data scientists, and analysts can work across databases, data warehouses, and data lakes to build reporting and dashboarding applications, perform real-time analytics, share and collaborate on data, and even build and train machine learning (ML) models with Redshift Serverless.
Tags allows you to assign metadata to your AWS resources. You can define your own key and value for your resource tag, so that you can easily manage and filter your resources. Tags can also improve transparency and map costs to specific teams, products, or applications. This way, you can raise cost awareness and also make teams and users accountable for their own cost and usage.
You can now use tagging in Redshift Serverless to categorize the following resources based on your grouping needs:
Namespace – A collection of database objects and users
Workgroup – A collection of compute resources
Snapshot – Point-in-time backups of a cluster
Recovery point – Recovery points in Redshift Serverless are created every 30 minutes and saved for 24 hours
When using Redshift Serverless, you may have to manage data across many business departments, environments, and billing groups. In doing so, you’re usually faced with one of the following tasks:
Cost allocation and financial management – You want to know what you’re spending on AWS for a given project, line of business, or environment
Operations support and incident management – You want to send issues to the right teams and users
Access control – You want to constrain user access to certain resources
Security risk management – You want to group resources based on their level of security or data sensitivity and make sure proper controls are in place
In this post, we focus on tagging Redshift Serverless resources for cost allocation and reporting purposes. Knowing where you have incurred costs at the resource, workload, team, and organization level enhances your ability to budget and manage cost.
Solution overview
Let’s say that your company has two departments: marketing and finance. Each department has multiple cost centers and environments, as illustrated in the following figure. In AWS Cost Explorer, you want to create cost reports for Redshift Serverless by department, environment, and cost center.
We start with creating and applying user-defined tags to Amazon Serverless workgroups for respective departments, environments, and cost centers. You can use both the AWS Command Line Interface (AWS CLI) and Redshift Serverless console to tag serverless resources.
For Filter by resource type, you can filter by Workgroup, Namespace, Snapshot, and Recovery Point.
Optionally, you can search for resources by an existing tag by entering values for Tag key or Tag value. For this post, we don’t include any tag filters, so we can view all the resources across our account.
Select your resource from the search results and choose Manage tags to customize the tag key and value parameters.
Here, you can add new tags, remove tags, save changes, and cancel your changes if needed.
Because we want to allocate cost across the various departments, we add a new key called department and a new value called marketing.
If you already have resources such as workgroups (listed on the Workgroup configuration page) or snapshots (listed on the Data backup page), you can create new tags or edit existing tags on the given resource. In the following example, we manage tags on an existing workgroup.
On the Amazon Redshift console, choose Workgroup configuration in the navigation pane.
Select your workgroup and on the Actions menu, choose Manage tags.
Now we can remove existing tags or add new tags. For our use case, let’s assume that the marketing department is no longer using the default workgroup, so we want to remove the current tag.
Choose Remove next to the marketing tag.
We are given the option to choose Undo if needed.
Choose Save changes and then Apply the changes to confirm.
After we apply the tags, we can view the full list of resources. The number of tags applied to each resource is found in the Tags column.
Set up cost allocation tags
After you create and apply the user-defined tags to your Redshift Serverless workgroups, it can take up to 24 hours for the tags to appear on your cost allocation tags page for activation. You can activate tags by using the AWS Billing console for cost allocation tracking with the following steps:
On the AWS Billing console, choose Cost allocation tags in the navigation pane.
Under User-defined cost allocation tags¸ select the tags you created and applied (for this example, cost-center).
Choose Activate.
After we activate all the tags we created, we can view the full list by choosing Active on the drop-down menu.
Create cost reports
After you activate the cost allocation tags, they appear on your cost allocation reports in Cost Explorer.
Cost Explorer helps you manage your AWS costs by giving you detailed insights into the line items in your bill. In Cost Explorer, you can visualize daily, monthly, and forecasted spend by combining an array of available filters. Filters allow you to narrow down costs according to AWS service type, linked accounts, and tags.
The following screenshot shows the preconfigured reports in Cost Explorer.
To create custom reports for your cost and usage data, complete the following steps:
On the AWS Cost Management console, choose Reports in the navigation pane.
Choose Create new report.
Select the report type you want to create (for this example, we select Cost and usage).
Choose Create Report.
To view weekly Redshift Serverless cost by cost center, choose the applicable settings in the Report parameters pane. For this post, we group data by the cost-center tag and filter data by the department tag.
Save the report for later use by choosing Save to report library.
Enter a name for your report, then choose Save report.
The following screenshot shows a sample report for daily Redshift Serverless cost by department.
The following screenshot shows an example report of weekly Redshift Serverless cost by environment.
Conclusion
Tagging resources in Amazon Redshift helps you maintain a central place to organize and view resources across the service for billing management. This feature saves you hours of manual work you would spend in grouping your Amazon Redshift resources via a spreadsheet or other manual alternatives.
Sandeep Bajwa is a Sr. Analytics Specialist based out of Northern Virginia, specialized in the design and implementation of analytics and data lake solutions.
Michael Yitayew is a Product Manager for Amazon Redshift based out of New York. He works with customers and engineering teams to build new features that enable data engineers and data analysts to more easily load data, manage data warehouse resources, and query their data. He has supported AWS customers for over 3 years in both product marketing and product management roles.
External vendor APIs can help organizations streamline operations, reduce costs, and provide better services to their customers. But many challenges exist in integrating with third-party services such as security, reliability, and cost.
Organizations must ensure their systems can handle performance issues or downtime. In some cases, calling an external API may have associated costs such as licensing fees. If a contract exists with the external API vendor to adhere to maximum Requests Per Second (RPS), the system needs to adapt accordingly.
In this blog post, we show you how to build an architecture to invoke an external vendor API using AWS Step Functions, with specific guidance on reliability.
This orchestration is applicable to any industry that relies on technology and data benefitting from external vendor API integration. Examples include e-commerce applications for online retailers integrating with third-party payment gateways, shipping carriers, or applications in the healthcare and banking sectors.
Invoking asynchronous external APIs overview
This solution outlines the use of AWS services to build an orchestrator controlling the invocation rate of third-party services that implement the service callback pattern to process long-running jobs. This architecture is also available in the AWS Reference Architecture Diagrams section of the AWS Architecture Center.
As in Figure 1, the architecture gives you the control to feed your calls to an external service according to its maximum RPS contract using Step Functions capabilities. Step Functions pauses main request workflows until you receive a callback from the external system indicating job completion.
Set up Step Functions to handle the lifecycle of long-running requests to the third party. Inside the workflow, add a request step that pauses it using waitForTaskToken as a callback to continue. Set a timeout to throw a timeout error if a callback isn’t received.
Send the task token and request payload to an Amazon Simple Queue Service (Amazon SQS) queue. Use Amazon CloudWatch to monitor its length. Consider adjusting the contract with the third-party service if the queue length grows beyond a soft limit determined on the maximum RPS with the third party.
Optionally, add dynamic delay inside Lambda controlled by AWS AppConfig if the system still needs a lower invocation rate to comply with the contracted RPS.
Step Functions invokes an Amazon API Gateway HTTP proxy API configured with rate limit to comply with the contracted RPS. API Gateway is a safeguard proxy to make sure your system is not breaking the RPS contract while dynamically adjusting the invocation rate parameters.
Invoke the external third-party asynchronous service API sending the payload consumed from the requests queue and receiving the jobID from the service. Send failed requests to the Dead Letter Queue (DLQ) using Amazon SQS.
Store the main workflow’s task token and jobID from the third-party service in an Amazon DynamoDB table. This is used as a mapping to correlate the jobID with the task token.
When the external service completes, receive the completed jobID in a callback webhook endpoint implemented with API Gateway.
Transform the external callbacks with API Gateway mapping templates, add the payload and jobID to an Amazon SQS queue, and respond immediately to the caller.
Use Lambda to poll the callback Amazon SQS queue, then query the token stored. Use the token to unblock the waiting workflow by calling SendTaskSuccess and the callback DLQ to store failed messages.
On the main workflow, pass the jobID to the next step and invoke a Step Functions processor to fetch the third-party results. Finally, process the external service’s results.
Controlling external API invocation rates
To comply with third-party RPS contracts, adopt a mechanism to control your system’s invocation rate. The rate of polling the messages from the request Amazon SQS (or step 3 in the architecture) directly impacts your invocation rate.
Different parameters can be used to control the invocation rate for Lambda with Amazon SQS as its trigger “event source,” such as:
Batch size: The number of records to send to the function in each batch. For a standard queue, this can be up to 10,000 records. For a first-in, first-out (FIFO) queue, the maximum is 10. Using batch size on its own will not limit the invocation rate. It should be used in conjunction with other parameters such as reserved concurrency or maximum concurrency.
Batch window: The maximum amount of time to gather records before invoking the function, in seconds. This applies only to standard queues.
Maximum concurrency: Sets limits on the number of concurrent instances of the function that an Amazon SQS event source can invoke. Maximum concurrency is an event source-level setting.
Trigger configuration is shown in Figure 2.
Figure 2. Configuration parameters for triggering Lambda
Other Lambda configuration parameters can also be used to control the invocation rate, such as:
Reserved concurrency: Guarantees the maximum number of concurrent instances for the function. When a function has reserved concurrency, no other function can use that concurrency. This can be used to limit and reduce the invocation rate.
Provisioned concurrency: Initializes a requested number of execution environments so that they are prepared to respond immediately to your function’s invocations. Note that configuring provisioned concurrency incurs charges to your AWS account.
These additional Lambda configuration parameters are shown here in Figure 3.
Figure 3. Lambda concurrency configuration options – Reserved and Provisioned
Maximizing your external API architecture
During this architecture implementation, consider some use cases to ensure that you are building a mature orchestrator.
Let’s explore some examples:
If the external system fails to respond to the API request in step 8, a timeout exception will occur at step 1. A sensible timeout should be configured in the main state machine in step 1. The timeout value should consider the maximum response time of the external system.
Dynamic delay inside the Lambda function—as mentioned in step 4—should only be used temporarily for burst traffic. If the external party has a very low RPS contract, consider other alternatives to introduce delay.
For example, Amazon EventBridge Scheduler can be used to trigger the Lambda function at regular intervals to consume the messages from Amazon SQS. This avoids costs for the idle/waiting state of your Lambda functions.
Conclusion
This blog post discusses how to build end-to-end orchestration to manage a request’s lifecycle, five different parameters to control invocation rate of third-party services, and throttle calls to external service API per maximum RPS contract.
We also consider use cases on using error handling capabilities in Step Functions and monitor systems with CloudWatch. In addition, this architecture adopts fully managed AWS Serverless services, removing the undifferentiated heavy lifting in building highly available, reliable, secure, and cost-effective systems in AWS.
Customers who require private keys for their TLS certificates to be stored in FIPS 140-2 Level 3 certified hardware security modules (HSMs) can use AWS CloudHSM to store their keys for websites hosted in the cloud. In this blog post, we will show you how to automate the deployment of a web application using NGINX in AWS Fargate, with full integration with CloudHSM. You will also use AWS CodeDeploy to manage the deployment of changes to your Amazon Elastic Container Service (Amazon ECS) service.
CloudHSM offers FIPS 140-2 Level 3 HSMs that you can integrate with NGINX or Apache HTTP Server through the OpenSSL Dynamic Engine. The CloudHSM Client SDK 5 includes the OpenSSL Dynamic Engine to allow your web server to use a private key stored in the HSM with TLS versions 1.2 and 1.3 to support applications that are required to use FIPS 140-2 Level 3 validated HSMs.
CloudHSM uses the private key in the HSM as part of the server verification step of the TLS handshake that occurs every time that a new HTTPS connection is established between the client and server. Using the exchanged symmetric key, OpenSSL software performs the key exchange and bulk encryption. For more information about this process and how CloudHSM fits in, see How SSL/TLS offload with AWS CloudHSM works.
Solution overview
This blog post uses the AWS Cloud Development Kit (AWS CDK) to deploy the solution infrastructure. The AWS CDK allows you to define your cloud application resources using familiar programming languages.
Figure 1 shows an overview of the overall architecture deployed in this blog. This solution contains three CDK stacks: The TlsOffloadContainerBuildStack CDK stack deploys the CodeCommit, CodeBuild, and AmazonECR resources. The TlsOffloadEcsServiceStack CDK stack deploys the ECS Fargate service along with the required VPC resources. The TlsOffloadPipelineStack CDK stack deploys the CodePipeline resources to automate deployments of changes to the service configuration.
Figure 1: Overall architecture
At a high level, here’s how the solution in Figure 1 works:
Clients make an HTTPS request to the public IP address exposed by Network Load Balancer to connect to the web server and establish a secure connection that uses TLS.
Network Load Balancer routes the request to one of the ECS hosts running in private virtual private cloud (VPC) subnets, which are connected to the CloudHSM cluster.
The NGINX web server that is running on ECS containers performs a TLS handshake by using the private key stored in the HSM to establish a secure connection with the requestor.
Note: Although we don’t focus on perimeter protection in this post, AWS has a number of services that help provide layered perimeter protection for your internet-facing applications, such as AWS Shield and AWS WAF.
Figure 2 shows an overview of the automation infrastructure that is deployed by the TlsOffloadContainerBuildStack and TlsOffloadPipelineStack CDK stacks.
Figure 2: Deployment pipeline
At a high level, here’s how the solution in Figure 2 works:
A developer makes changes to the service configuration and commits the changes to the AWS CodeCommit repository.
An RSA private key in the HSM with a corresponding fake PEM file and certificate signed by a trusted Certificate Authority for the web server. Fake PEM files are PEM-encoded key files that store a reference to the key on the HSM instead of storing the private key information. For instructions on how to generate this file, see Generate or import a private key and SSL/TLS certificate.
An environment configured with AWS CDK to deploy the CDK stacks with the relevant resources. For instructions on how to set up this environment, see Getting started with the AWS CDK.
Step 1: Store secrets in Secrets Manager
As with other container projects, you need to decide what to build statically into the container (for example, libraries, code, or packages) and what to set as runtime parameters, to be pulled from a parameter store. In this walkthrough, we use Secrets Manager to store sensitive parameters and use the integration of Amazon ECS with Secrets Manager to securely retrieve them when the container is launched.
Important: You need to store the following information in Secrets Manager as plaintext, not as key/value pairs.
The web server certificate – In this example, the name of the secret for the web server certificate is tls/servercert. It will look similar to the following:
Figure 4: Store the web server certificate
The fake PEM file for the private key stored in the HSM that you generated in the Prerequisites section. In this example, the name of the secret for the fake PEM file is tls/fakepem.
Figure 5: Store the fake PEM
The HSM pin used to authenticate with the HSMs in your cluster. In this example, the name of the secret for the HSM pin is tls/pin.
Figure 6: Store the HSM pin
After you’ve stored your secrets, you should see output similar to the following:
Figure 7: List of required secrets
Step 2: Download and configure the CDK app
This post uses the AWS CDK to deploy the solution infrastructure. In this section, you will download the CDK app and configure it.
Run the following command to build the CDK stacks from the root of the project directory.
npm run build
To view the stacks that are available to deploy, run the following command from the root of the project directory.
cdk ls
You should see the following stacks available to deploy:
TlsOffloadContainerBuildStack — Deploys the CodeCommit, CodeBuild, and ECR repository that builds the ECS container image.
TlsOffloadEcsServiceStack — Deploys the ECS Fargate service along with the required VPC resources.
TlsOffloadPipelineStack — Deploys the CodePipeline that automates the deployment of updates to the service.
Step 3: Deploy the container build stack
In this step, you will deploy the container build stack, and then create a build and verify that the image was built successfully.
To deploy the container build stack
Deploy the TlsOffloadContainerBuildStack stack that we described in Figure 2 to your AWS account. In your CDK environment, run the following command:
cdk deploy TlsOffloadContainerBuildStack
The command line interface (CLI) will prompt you to approve the changes. After you approve them, you will see the following resources deployed to your newly created CodeCommit repository.
Dockerfile — This file provides a containerized environment for each of the Fargate containers to run. It downloads and installs necessary dependencies to run the NGINX web server with CloudHSM.
nginx.conf — This file provides NGINX with the configuration settings to run an HTTPS web server with CloudHSM configured as the SSL engine that performs the TLS handshake. The following nginx.conf values have already been configured in the file; if you want to make changes, update the file before deployment:
ssl_engine is set to cloudhsm
the environment variable is env CLOUDHSM_PIN
error_log is set to stderr so that the Fargate container can capture the logs in CloudWatch
the server section is set up to listen on port 443
ssl_ciphers are configured for a server with an RSA private key
run.sh — This script configures the CloudHSM OpenSSL Dynamic Engine on the Fargate task before the NGINX server is started.
nginx.service — This file specifies the configuration settings that systemd uses to run the NGINX service. Included in this file is a reference to the file that contains the environment variables for the NGINX service. This provides the HSM pin to the OpenSSL Engine.
index.html — This file is a sample HTML file that is displayed when you navigate to the HTTPS endpoint of the load balancer in your browser.
dhparam.pem — This file provides sample Diffie-Hellman parameters for demonstration purposes, but AWS recommends that you generate your own. You can generate your own Diffie-Hellman parameters by running the following command with the OpenSSL CLI. These parameters are not required for TLS but are recommended to provide perfect forward secrecy in your encrypted messages.
openssl dhparam -out ./dhparam.pem 2048
Your repository should look like the following:
Figure 8: CodeCommit repository
Before you deploy the Amazon ECS service, you need to build your first Docker image to populate the ECR repository. To successfully deploy the service, you need to have at least one image already present in the repository.
To create a build and verify the image was built successfully
Find the CodeBuild project that was created by the CDK deployment and select it.
Choose Start Build to initiate a new build.
Wait for the build to complete successfully, and then open the Amazon ECR console.
Select the repository that the CDK deployment created.
You should now see an image in your repository, similar to the following:
Figure 9: ECR repository
Step 4: Deploy the Amazon ECS service
Now that you have successfully built an ECR image, you can deploy the Amazon ECS service. This step deploys the following resources to your account:
VPC endpoints for the required AWS services that your ECS task needs to communicate with, including the following:
Amazon ECR
Secrets Manager
CloudWatch
CloudHSM
Network Load Balancer, which load balances HTTPS traffic to your ECS tasks.
A CloudWatch Logs log group to host the logs for the ECS tasks.
An ECS cluster with ECS tasks using your previously built Docker image that hosts the NGINX service.
To deploy the Amazon ECS service with the CDK
In your CDK environment, run the following command:
cdk deploy TlsOffloadEcsServiceStack
The CLI will prompt you to approve the changes. After you approve them, you will see these resources deploy to your account.
Checkpoint
At this point, you should have a working service. To confirm that you do, in your browser, navigate using HTTPS to the public address associated with the Network Load Balancer. While not covered in this blog, you can additionally configure DNS routing using Amazon Route53 to setup a custom domain name for your web service. You should see a screen similar to the following.
Figure 10: The sample website
Step 5: Use CodePipeline to automate the deployment of changes to the web server
Now that you have deployed a preliminary version of the application, you can take a few steps to automate further releases of the web server. As you maintain this application in production, you might need to update one or more of the following items:
Your website HTML source and other required libraries (for example, CSS or JavaScript)
Your Docker environment, such as the OpenSSL libraries, operating system and CloudHSM packages, and NGINX version.
Re-deploy the service after rotating your web server private key and certificate in Secrets Manager
Next, you will set up a CodePipeline project that orchestrates the end-to-end deployment of a change to the application—from an update to the code in our CodeCommit repo to the deployment of updated container images and the redirection of user traffic by the load balancer to the updated application.
This step deploys to your account a deployment pipeline that connects your CodeCommit, CodeBuild, and Amazon ECS services.
Deploy the CodePipeline stack with CDK
In your CDK environment, run the following command:
cdk deploy TlsOffloadPipelineStack
The CLI will prompt you to approve the changes. After you approve them, you will see the resources deploy to your account.
Start a deployment
To verify that your automation is working correctly, start a new deployment in your CodePipeline by making a change to your source repository. If everything works, the CodeBuild project will build the latest version of the Dockerfile located in your CodeCommit repository and push it to Amazon ECR. Then, the CodeDeploy application will create a new version of the ECS task definition and deploy new tasks while spinning down the existing tasks.
View your website
Now that the deployment is complete, you should again be able to view your website in your browser by navigating to the website for your application. If you made changes to the source code, such as changes to your index.html file, you should see these changes now.
Verify that the web server is properly configured by checking that the website’s certificate matches the one that you created in the Prerequisites section. Figure 11 shows an example of a certificate.
Figure 11: Certificate for the application
To verify that your NGINX service is using your CloudHSM cluster to offload the TLS handshake, you can view the CloudHSM client logs for this application in CloudWatch in the log group that you specified when you configured the ECS task definition.
Select the log group corresponding to your CloudHSM cluster. The log group has the following format: /aws/cloudhsm/<cluster-id>.
You can see entries similar to the following, which indicates that the NGINX application is connecting and logging in to the HSM to perform cryptographic operations.
Time: 02/04/23 17:45:40.333033, usecs:1675532740333033
Version No : 1.0
Sequence No : 0x2
Reboot counter : 0x8
Opcode : CN_LOGIN (0xd)
Command Type(hex) : CN_MGMT_CMD (0x0)
User id : 3
Session Handle : 0x15010002
Response : 0x0:HSM Return: SUCCESS
Log type : USER_AUTH_LOG (2)
User Name : crypto_user
User Type : CN_CRYPTO_USER (1)
Conclusion
In this post, you learned how to set up a NGINX web server on Fargate in a secure, private subnet that offloads the TLS termination to a FIPS 140-2 Level 3 HSM environment that uses the CloudHSM OpenSSL Dynamic Engine. You also learned how to set up a deployment pipeline to automate the Fargate deployments when updates are made.
You can expand this solution to fit your individual use case. For example, you can use the NGINX web server as a reverse proxy for additional servers in your internal network, and set up mutual TLS between these internal servers.
If you have feedback about this post, submit comments in the Comments section below. If you have questions about this post, start a new thread on the AWS CloudHSM re:Post or contact AWS Support.
Want more AWS Security news? Follow us on Twitter.
When building serverless event-driven applications using AWS Lambda, it is best practice to validate individual components. Unit testing can quickly identify and isolate issues in AWS Lambda function code. The techniques outlined in this blog demonstrates unit test techniques for Python-based AWS Lambda functions and interactions with AWS Services.
The full code for this blog is available in the GitHub project as a demonstrative example.
Example use case
Let’s consider unit testing a serverless application which provides an API endpoint to generate a document. When the API endpoint is called with a customer identifier and document type, the Lambda function retrieves the customer’s name from DynamoDB, then retrieves the document text from DynamoDB for the given document type, finally generating and writing the resulting document to S3.
Figure 1. Example application architecture
Amazon API Gateway provides an endpoint to request the generation of a document for a given customer. A document type and customer identifier are provided in this API call.
The endpoint invokes an AWS Lambda function that generates a document using the customer identifier and the document type provided.
An Amazon DynamoDB table stores the contents of the documents and the users name, which are retrieved by the Lambda function.
The resulting text document is stored to Amazon S3.
Our testing goal is to determine if an isolated “unit” of code works as intended. In this blog, we will be writing tests to provide confidence that the logic written in the above AWS Lambda function behaves as we expect. We will mock the service integrations to Amazon DynamoDB and S3 to isolate and focus our tests on the Lambda function code, and not on the behavior of the AWS Services.
Define the AWS Service resources in the Lambda function
Before writing our first unit test, let’s look at the Lambda function that contains the behavior we wish to test. The full code for the Lambda function is available in the GitHub repository as src/sample_lambda/app.py.
As part of our Best practices for working AWS Lambda functions, we recommend initializing AWS service resource connections outside of the handler function and in the global scope. Additionally, we can retrieve any relevant environment variables in the global scope so that subsequent invocations of the Lambda function do not repeatedly need to retrieve them. For organization, we can put the resource and variables in a dictionary:
However, globally scoped code and global variables are challenging to test in Python, as global statements are executed on import, and outside of the controlled test flow. To facilitate testing, we define classes for supporting AWS resource connections that we can override (patch) during testing. These classes will accept a dictionary containing the boto3 resource and relevant environment variables.
For example, we create a DynamoDB resource class with a parameter “boto3_dynamodb_resource” that accepts a boto3 resource connected to DynamoDB:
The Lambda function handler is the method in the AWS Lambda function code that processes events. When the function is invoked, Lambda runs the handler method. When the handler exits or returns a response, it becomes available to process another event.
To facilitate unit test of the handler function, move as much of logic as possible to other functions that are then called by the Lambda hander entry point. Also, pass the AWS resource global variables to these subsequent function calls. This approach enables us to mock and intercept all resources and calls during test.
In our example, the handler references the global variables, and instantiates the resource classes to setup the connections to specific AWS resources. (We will be able to override and mock these connections during unit test.)
Then the handler calls the create_letter_in_s3 function to perform the steps of creating the document, passing the resource classes. This downstream function avoids directly referencing the global context or any AWS resource connections directly.
Our Lambda function code has now been written and is ready to be tested, let’s take a look at the unit test code! The full code for the unit test is available in the GitHub repository as tests/unit/src/test_sample_lambda.py.
In production, our Lambda function code will directly access the AWS resources we defined in our function handler; however, in our unit tests we want to isolate our code and replace the AWS resources with simulations. This isolation facilitates running unit tests in an isolated environment to prevent accidental access to actual cloud resources.
Moto is a python library for Mocking AWS Services that we will be using to simulate AWS resource our tests. Moto supports many AWS resources, and it allows you to test your code with little or no modification by emulating functionality of these services.
Moto uses decorators to intercept and simulate responses to and from AWS resources. By adding a decorator for a given AWS service, subsequent calls from the module to that service will be re-directed to the mock.
@moto.mock_dynamodb
@moto.mock_s3
Configure Test Setup and Tear-down
The mocked AWS resources will be used during the unit test suite. Using the setUp() method allows you to define and configure the mocked global AWS Resources before the tests are run.
We define the test class and a setUp() method and initialize the mock AWS resource. This includes configuring the resource to prepare it for testing, such as defining a mock DynamoDB table or creating a mock S3 Bucket.
After creating the mocked resources, the setup function creates resource class object referencing those mocked resources, which will be used during testing.
Test #1: Verify the code writes the document to S3
Our first test will validate our Lambda function writes the customer letter to an S3 bucket in the correct manner. We will follow the standard test format of arrange, act, assert when writing this unit test.
Arrange the data we need in the DynamoDB table:
def test_create_letter_in_s3(self) -> None:

    self.mocked_dynamodb_class.table.put_item(Item={"PK":"D#UnitTestDoc",
                                                        "data":"Unit Test Doc Corpi"})
    self.mocked_dynamodb_class.table.put_item(Item={"PK":"C#UnitTestCust",
                                                        "data":"Unit Test Customer"})
Act by calling the create_letter_in_s3 function. During these act calls, the test passes the AWS resources as created in the setUp().
Assert by reading the data written to the mock S3 bucket, and testing conformity to what we are expecting:
bucket_key = "UnitTestCust/UnitTestDoc.txt"
    body = self.mocked_s3_class.bucket.Object(bucket_key).get()['Body'].read()

    self.assertEqual(test_return_value["statusCode"], 200)
    self.assertIn("UnitTestCust/UnitTestDoc.txt", test_return_value["body"])
    self.assertEqual(body.decode('ascii'),"Dear Unit Test Customer;\nUnit Test Doc Corpi")
Tests #2 and #3: Data not found error conditions
We can also test error conditions and handling, such as keys not found in the database. For example, if a customer identifier is submitted, but does not exist in the database lookup, does the logic handle this and return a “Not Found” code of 404?
To test this in test #2, we add data to the mocked DynamoDB table, but then submit a customer identifier that is not in the database.
As the application logic resides in independently tested functions, the Lambda handler function provides only interface validation and function call orchestration. Therefore, the test for the handler validates that the event is parsed correctly, any functions are invoked as expected, and the return value is passed back.
To emulate the global resource variables and other functions, patch both the global resource classes and logic functions.
We need to provide event data when invoking the Lambda handler. A good practice is to save test events as separate JSON files, rather than placing them inline as code. In the example project, test events are located in the folder “tests/events/”. During test execution, the event object is created from the JSON file using the utility function named load_sample_event_from_file.
Assert by ensuring the create_letter_in_s3 function is called with the expected parameters based on the event, and a create_letter_in_s3 function return value is passed back to the caller. In our example, this value is simply passed with no alterations.
The tearDown() method is called immediately after the test method has been run and the result is recorded. In our example tearDown() method, we clean up any data or state created so the next test won’t be impacted.
Running the unit tests
The unittest Unit testing framework can be run using the Python pytest utility. To ensure network isolation and verify the unit tests are not accidently connecting to AWS resources, the pytest-socket project provides the ability to disable network communication during a test.
pytest -v --disable-socket -s tests/unit/src/
The pytest command results in a PASSED or FAILED status for each test. A PASSED status verifies that your unit tests, as written, did not encounter errors or issues,
Conclusion
Unit testing is a software development process in which different parts of an application, called units, are individually and independently tested. Tests validate the quality of the code and confirm that it functions as expected. Other developers can gain familiarity with your code base by consulting the tests. Unit tests reduce future refactoring time, help engineers get up to speed on your code base more quickly, and provide confidence in the expected behaviour.
We’ve seen in this blog how to unit test AWS Lambda functions and mock AWS Services to isolate and test individual logic within our code.
AWS Lambda Powertools for Python has been used in the project to validate hander events. Powertools provide a suite of utilities for AWS Lambda functions to ease adopting best practices such as tracing, structured logging, custom metrics, idempotency, batching, and more.
Over the past three years, AWS CIRT has supported customers with security events in their AWS accounts. These include the unauthorized use of AWS Identity and Access Management (IAM) credentials, ransomware, and data deletion in an AWS account.
In this post, I will walk you through key AWS services and features that provide backup and recovery solutions to restore your data based upon the lessons our team has learned when supporting customers experiencing security events.
Backup and recovery configuration are a part of the customer’s side of the shared responsibility model. AWS doesn’t have the ability to recover a deleted resource. It doesn’t matter how quickly the event is reported to AWS. The inability to recover resources includes actions by the AWS account root user or an IAM principal in the account.
Customers are also responsible for managing their data (including encryption options), classifying their assets, and using IAM tools to apply the appropriate permissions. AWS strives to make it simple for customers to back up and restore their data. We recommend that you compare the risk and costs associated with losing data to the available solutions to make the best decision for your data and business use cases.
Why do you need backups?
The National Institute of Technology (NIST) Computer Security Incident Handling Guide SP 800-61 Rev. 2 defines a computer security incident as “a violation or imminent threat of violation of computer security policies, acceptable use policies, or standard security practices.” AWS recently updated the AWS Security Incident Response Guide as a resource to help customers throughout the incident response life cycle.
Backup and restore processes help you restore data to a point in time before unauthorized actions. Unauthorized actions can be accidental or part of a security event. Implementing backup and restore processes can help you reduce costs by limiting the number of resources that need backups, associated storage, and overall timelines associated with acceptable Recovery Time Objectives (RTOs) and Recovery Point Objectives (RPOs). For additional guidance on backup solutions and programs, see Top 10 security best practices for securing backups in AWS
How does AWS help?
AWS provides several solutions for backups to integrate with your operational and security incident recovery procedures which I describe in more detail in this section. For additional information, see AWS Backup & Restore.
Amazon EC2
Amazon EC2 provides scalable computing capacity in the AWS Cloud. Using Amazon EC2 can help eliminate your need to invest in hardware up front, helping you to develop and deploy applications faster.
EBS volumes are the primary persistent storage option for Amazon EC2. Use this block storage for structured data, such as databases, or unstructured data, such as files in a file system on a volume. An EBS snapshot takes a copy of the EBS volume and places it in Amazon S3, where it is stored redundantly in multiple Availability Zones.
Create a golden image by preloading needed software and configuration on an EC2 instance, and then creating an image of that. Then, use the resulting image to launch new instances, with updates needed only for the period after image creation.
Amazon FSx for Windows File Server provides fully-managed Microsoft Windows file servers, backed by a fully native Windows file system. To help ensure file system consistency, Amazon FSx uses the Volume Shadow Copy Service (VSS) in Microsoft Windows. Each FSx for Windows File Server backup contains the information that is needed to create a new file system from the backup, effectively restoring a point-in-time snapshot of the file system. For more information, see Amazon FSx: Working with backups.
Amazon EC2 Recycle Bin is a data recovery feature that enables you to restore Amazon EBS snapshots and EBS-backed AMIs that were accidentally deleted. If your resources are deleted, they are retained in the Recycle Bin for a period that you specify, before they are permanently deleted.
Transactional databases
In cloud computing, the ideal scenario is to keep persistent transactional states in databases so that those resources are the only things that actively require backups. When used in conjunction with AWS compute services, this minimizes the volume of data that you need to back up. Everything else is restored from a golden image or equivalent through auto scaling or a continuous integration and continuous delivery (CI/CD) pipeline. To estimate costs associated with service usage and the use of backup storage, use the AWS Pricing Calculator. Work backwards from your critical data that requires backups to help limit costs associated with your overall backup solution.
Amazon Aurora backups are continuous and incremental so that you can quickly restore to any point within the backup retention period. You can specify a backup retention period of 1 to 35 days when you create or modify a database cluster. Aurora backups are stored in Amazon S3.
Amazon DynamoDB allows you to back up your table data continuously by using point-in-time recovery (PITR). When you use PITR, DynamoDB backs up your table data automatically with per-second granularity to restore to any second in the preceding 35 days. For more information, see DynamoDB PITR.
Amazon Neptune is a fast, reliable, fully managed graph database service. The core of Neptune is a purpose-built, high-performance graph database engine. Neptune backups are continuous and incremental so that you can quickly restore to any point within the backup retention period. You can specify a backup retention period, from 1 to 35 days, when you create or modify a DB cluster.
Amazon Relational Database Service (Amazon RDS) creates and saves automated backups of your DB instance during the backup window of your DB instance. Amazon RDS creates a storage volume snapshot of your DB instance, backing up the entire DB instance and not just individual databases. Amazon RDS saves the automated backups of your DB instance according to the backup retention period that you specify between 0 and 35 days. If necessary, you can recover your database to any point in time during the backup retention period.
Amazon Elastic File System
Amazon Elastic File System (Amazon EFS) provides serverless, fully elastic file storage to help you share file data without provisioning or managing storage capacity and performance. The service manages the file storage infrastructure for you to avoid the complexity of deploying, patching, and maintaining complex file system configurations.
The EFS-to-EFS Backup solution is suitable for Amazon EFS file systems in each AWS Region. It includes an AWS CloudFormation template that launches, configures, and runs the AWS services required to deploy the solution. This solution follows AWS best practices for security and availability.
If you need a backup strategy for multiple services or to manage backups from a single solution, consider using AWS Backup. AWS Backup is a fully-managed service that makes it simple to centralize and automate data protection across AWS services in the cloud, and on premises. For a list of supported services and resource feature availability, see the AWS Backup Developer Guide.
AWS Backup provides for centralized, policy-based data protection. Your backup data is encrypted using encryption keys managed by AWS Key Management Service (KMS), reducing your need to build and maintain a key management infrastructure. With AWS Backup, you can do the following:
Set backup retention policies that automatically retain and expire backups, minimizing backup storage costs.
Copy backups across different AWS Regions and accounts from a central console to help you meet your compliance and disaster recovery needs.
Create data protection policies and use AWS Organizations to enforce the protection policies throughout the accounts in that organization.
Set resource-based access policies on backup vaults. Use resource-based access policies to control access to backups in a backup vault across users, rather than having to define permissions for each user.
AWS Backup can help you align with your data protection needs with real-time analytics and insights, as follows:
You can audit and report on the compliance of your data protection policies to help meet your business and regulatory needs with AWS Backup Audit Manager.
AWS Backup supports legal hold, which is used when an organization must retain certain data either for preservation, auditing, or as evidence in legal proceedings and e-Discovery.
You can choose your controls. For information on the available controls, their customizable parameters, and their AWS Config recording resource types, see Choosing your controls. Every control requires the recording resource type AWS Config: resource compliance because this type records your compliance status with either the AWS Backup Framework or a custom framework that you define.
How much will this cost?
To estimate costs for individual services and features, use the AWS Pricing Calculator. For additional cost information, see the feature page for each service at AWS Cloud Products.
Conclusion
In this blog post, you learned about several AWS services and features to help you back up and restore your data. By analyzing and configuring backup and restore capabilities, you can enable resilience from an accidental deletion or security event.
Many organizations have adopted DevOps practices to streamline and automate software delivery and IT operations. A DevOps model can be adopted without sacrificing security by using automated compliance policies, fine-grained controls, and configuration management techniques. However, one of the key challenges customers face is analyzing code and detecting any vulnerabilities in the code pipeline due to a lack of access to the right tool. Amazon CodeGuru addresses this challenge by using machine learning and automated reasoning to identify critical issues and hard-to-find bugs during application development and deployment, thus improving code quality.
Amazon CodeGuru Reviewer helps you improve code security and provides recommendations based on common vulnerabilities (OWASP Top 10) and AWS security best practices. CodeGuru analyzes Java and Python code and provides recommendations for remediation. CodeGuru Reviewer detects a deviation from best practices when using AWS APIs and SDKs, and also identifies concurrency issues, resource leaks, security vulnerabilities and validates input parameters. For every workflow run, CodeGuru Reviewer’s GitHub Action copies your code and build artifacts into an S3 bucket and calls CodeGuru Reviewer APIs to analyze the artifacts and provide recommendations. Refer to the code detector library here for more information about CodeGuru Reviewer’s security and code quality detectors.
With GitHub Actions, developers can easily integrate CodeGuru Reviewer into their CI workflows, conducting code quality and security analysis. They can view CodeGuru Reviewer recommendations directly within the GitHub user interface to quickly identify and fix code issues and security vulnerabilities. Any pull request or push to the master branch will trigger a scan of the changed lines of code, and scheduled pipeline runs will trigger a full scan of the entire repository, ensuring comprehensive analysis and continuous improvement.
Solution overview
The solution comprises of the following components:
GitHub Actions – Workflow Orchestration tool that will host the Pipeline.
AWS CodeDeploy – AWS service to manage deployment on Amazon EC2 Autoscaling Group.
AWS Auto Scaling – AWS service to help maintain application availability and elasticity by automatically adding or removing Amazon EC2 instances.
Amazon EC2 – Destination Compute server for the application deployment.
Amazon CodeGuru – AWS Service to detect security vulnerabilities and automate code reviews.
AWS CloudFormation – AWS infrastructure as code (IaC) service used to orchestrate the infrastructure creation on AWS.
The following diagram illustrates the architecture:
Figure 1. Architecture Diagram of the proposed solution in the blog
Developer commits code changes from their local repository to the GitHub repository. In this post, the GitHub action is triggered manually, but this can be automated.
GitHub action triggers the build stage.
GitHub’s Open ID Connector (OIDC) uses the tokens to authenticate to AWS and access resources.
GitHub action uploads the deployment artifacts to Amazon S3.
GitHub action invokes Amazon CodeGuru.
The source code gets uploaded into an S3 bucket when the CodeGuru scan starts.
GitHub action invokes CodeDeploy.
CodeDeploy triggers the deployment to Amazon EC2 instances in an Autoscaling group.
CodeDeploy downloads the artifacts from Amazon S3 and deploys to Amazon EC2 instances.
After completing the steps, you should have a local repository with the below directory structure, and one completed Actions run.
Figure 2. Directory structure
To enable automated deployment upon git push, you will need to make a change to your .github/workflow/deploy.yml file. Specifically, you can activate the automation by modifying the following line of code in the deploy.yml file:
From:
workflow_dispatch: {}
To:
  #workflow_dispatch: {}
  push:
    branches: [ main ]
  pull_request:
Solution walkthrough
The following steps provide a high-level overview of the walkthrough:
Create an S3 bucket for the Amazon CodeGuru Reviewer.
Update the IAM role to include permissions for Amazon CodeGuru.
Associate the repository in Amazon CodeGuru.
Add Vulnerable code.
Update GitHub Actions Job to run the Amazon CodeGuru Scan.
Push the code to the repository.
Verify the pipeline.
Check the Amazon CodeGuru recommendations in the GitHub user interface.
1. Create an S3 bucket for the Amazon CodeGuru Reviewer
When you run a CodeGuru scan, your code is first uploaded to an S3 bucket in your AWS account.
Note that CodeGuru Reviewer expects the S3 bucket name to begin with codeguru-reviewer-.
You can create this bucket using the bucket policy outlined in this CloudFormation template (JSON or YAML) or by following these instructions.
2. Update the IAM role to add permissions for Amazon CodeGuru
Locate the role created in the pre-requisite section, named “CodeDeployRoleforGitHub”.
Next, create an inline policy by following these steps. Give it a name, such as “codegurupolicy” and add the following permissions to the policy.
At this point, you will have completed your initial full analysis run. However, since this is a simple “helloWorld” program, you may not receive any recommendations. In the following steps, you will incorporate vulnerable code and trigger the analysis again, allowing CodeGuru to identify and provide recommendations for potential issues.
4. Add Vulnerable code
Create a file application.conf at /aws-codedeploy-github-actions-deployment/spring-boot-hello-world-example
Add the following content in application.conf file.
5. Update GitHub Actions Job to run Amazon CodeGuru Scan
You will need to add a new job definition in the GitHub Actions’ yaml file. This new section should be inserted between the Build and Deploy sections for optimal workflow.
Additionally, you will need to adjust the dependency in the deploy section to reflect the new flow: Build -> CodeScan -> Deploy.
Review sample GitHub actions code for running security scan on Amazon CodeGuru Reviewer.
Refer to the complete file provided below for your reference. It is important to note that you will need to replace the following environment variables with your specific values.
Your code has been pushed to the repository and will trigger the workflow as per the configuration in GitHub Actions.
7. Verify the pipeline
Your pipeline is set up to fail upon the detection of a critical vulnerability. You can also suppress recommendations from CodeGuru Reviewer if you think it is not relevant for setup. In this example, as there are two critical vulnerabilities, the pipeline will not proceed to the next step.
To view the status of the pipeline, navigate to the Actions tab on your GitHub console. You can refer to the following image for guidance.
Figure 4. GitHub Actions pipeline
To view the details of the error, you can expand the “codescan” job in the GitHub Actions console. This will provide you with more information about the specific vulnerabilities that caused the pipeline to fail and help you to address them accordingly.
Figure 5. Codescan actions logs
8. Check the Amazon CodeGuru recommendations in the GitHub user interface
Once you have run the CodeGuru Reviewer Action, any security findings and recommendations will be displayed on the Security tab within the GitHub user interface. This will provide you with a clear and convenient way to view and address any issues that were identified during the analysis.
Figure 6. Security tab with results
Clean up
To avoid incurring future charges, you should clean up the resources that you created.
Empty the Amazon S3 bucket.
Delete the CloudFormation stack (CodeDeployStack) from the AWS console.
Amazon CodeGuru is a valuable tool for software development teams looking to improve the quality and efficiency of their code. With its advanced AI capabilities, CodeGuru automates the manual parts of code review and helps identify performance, cost, security, and maintainability issues. CodeGuru also integrates with popular development tools and provides customizable recommendations, making it easy to use within existing workflows. By using Amazon CodeGuru, teams can improve code quality, increase development speed, lower costs, and enhance security, ultimately leading to better software and a more successful overall development process.
In this post, we explained how to integrate Amazon CodeGuru Reviewer into your code build pipeline using GitHub actions. This integration serves as a quality gate by performing code analysis and identifying challenges in your code. Now you can access the CodeGuru Reviewer recommendations directly within the GitHub user interface for guidance on resolving identified issues.
AWS Network Firewall is a stateful, managed, network firewall and intrusion detection and prevention service for your Amazon VPC. With Network Firewall, you can filter inbound and outbound traffic to or from internet gateways; AWS Direct Connect gateways; AWS PrivateLink, AWS Site-to-Site VPN, and AWS Client VPN gateways; NAT gateways; and even between other attached VPCs and subnets.
You can use Network Firewall to help prevent your VPC from accessing unauthorized domains, to block IP addresses, and to perform deep packet inspection or protocol filtering. However, it can be time consuming to update your firewall’s rule groups to add, remove, or modify the list of IP addresses across multiple Network Firewall instances that can be deployed in distributed, centralized, or combined deployment models.
With prefix lists, you can group one or more CIDR blocks into a single object. Therefore, you can group IP addresses that you frequently use in a prefix list, and reference this list in Network Firewall rule groups. With this approach, you don’t need to update individual firewall rules when scaling the network to add new IP addresses, and the Network Firewall rule groups that reference the prefix list are automatically updated.
In this post, we will show you how to build an example configuration in your test environment that uses customer-managed prefix lists in a Network Firewall rule group.
In this post, we will show you how to create a simple architecture in a VPC to create three different VPC prefix lists for private and public subnets and provide protection by restricting traffic flow to the firewall subnet. Then you will create a stateful Network Firewall rule group to include IP set references that are mapped to VPC prefix lists. Figure 1 illustrates the architecture of a protected VPC.
Figure 1: Simple architecture of a protected VPC
In this example, the following three subnets are in the protected VPC:
Firewall subnet: 10.1.0.0/28 This subnet is dedicated for use by Network Firewall. The Network Firewall endpoint is deployed into a dedicated subnet of the VPC.
Public subnet (protected subnet): 10.1.2.0/28 The resources are designed to be internet-facing, so this subnet needs to communicate with the internet gateway. The NAT gateway and load balancer are also hosted on this subnet.
Private subnet (protected workload subnet): 10.1.3.0/28 This is the subnet where you host your private workload that doesn’t accept incoming traffic from the internet (in our example, this is the webservers). The private workload can send requests to the internet through the NAT gateway.
Deploy the CloudFormation template
The following AWS CloudFormation template deploys a network firewall and related resources in a distributed architecture across two Availability Zones. In production, AWS recommends that you use multiple Availability Zones to help ensure high availability and improve fault tolerance. To simplify the instructions, we will focus on a single Availability Zone for this blog post.
To deploy the CloudFormation template
Choose the following Launch Stack button.
Launch the CloudFormation template in the Region of your choice. Make sure that the Region that you choose supports Network Firewall. Select the Availability Zone or Zones to be used for this deployment, and leave the rest of the options as default.
Create the VPC prefix lists
In this section, we will show you how to define your requirements and implement them within Network Firewall to only enable Secure Shell (SSH) traffic from a trusted IP range (an authorized public subnet on the protected VPC) to the private subnet. We will also show you how to block Internet Control Message Protocol (ICMP) traffic from another IP range (with CIDR 10.0.1.0/24).
You will create the following VPC prefix lists:
Public-ip-list — includes the protected subnet: 10.1.2.0/28
Private-deny-list — includes a CIDR block from the other VPC: 10.0.1.0/24
Private-allow-list — includes the protected workload subnet: 10.1.3.0/28
Choose Create prefix list, and then do the following, as shown in Figure 2:
For Prefix list name, enter a name for the prefix list. In our example, the name is Public-ip-list.
For Max entries, enter the maximum number of entries for the prefix list. In our example, this number is 10.
For Address family, select the prefix list that supports IPv4 entries.
Note: Network Firewall currently supports only references to IPv4 prefix lists.
For Prefix list entries, choose Add new entry, and then enter the CIDR block and a description for the entry. In our example, the CIDR block is 10.1.2.0/28.
Choose Create prefix list.
Figure 2: Example of managed prefix lists
Repeat the preceding steps for the two remaining prefix lists: Private-deny-list and Private-allow-list.
When you’ve finished creating the prefix lists, you can view them under Managed prefix lists, as shown in Figure 3.
Figure 3: Example of VPC prefix lists
Create a Network Firewall rule group
The next step is to create a Network Firewall rule group. A Network Firewall rule group is a reusable set of criteria for inspecting and handling network traffic. As part of this configuration, we will take advantage of customer-managed VPC prefix lists as a variable to simplify the management of the rules.
To create a Network Firewall rule group
In the Amazon VPC console, in the left navigation pane, choose Network Firewall rule groups.
From the Rule groups tab, select Create Network Firewall rule group, and then do the following, as shown in Figure 4:
For Rule group type, select Stateful rule group.
For Name, enter your network firewall rule group.
For Capacity, enter 25 or another appropriate value.
For Stateful rule group options, select 5-tuple.
Under Stateful rule order, select Default.
Figure 4: Network Firewall rule group
In the IP set references section, do the following, as shown in Figure 5:
For IP set preference variable name, enter new variable names for each of your VPC prefix lists.
From the IP set resource ID dropdown, select an IP set.
In this example, you are creating three IP set references that are mapped to the VPC prefix lists that you configured in the previous sections, as shown in the following table.
IP set references variable name
Mapped VPC prefix list name to IP set references
CIDR block
IP_list_Allow_ssh_subnets
public-ip-list
10.1.2.0/28
IP_list_Private_Deny
private-deny-list
10.0.1.0/24
IP_list_private_subnets
private-allow-list
10.1.3.0/28
Figure 5: Example of IP set references
In the Add rule section, do the following, as shown in Figure 6:
Select the protocol.
For Source, select Custom and then enter the IP set reference variable name for the source IP address with the following format: <@Your_ip_set_reference_name>. In our example, the name is @IP_list_Allow_ssh_subnets.
For Source port, select Custom and enter the appropriate port number.
For Destination, choose Custom and then enter the IP set reference variable name for the destination IP address with the following format: <@Your_ip_set_reference_name>. In our example, the name is @IP_list_Private_subnets.
For Destination port, choose Custom and enter the appropriate port number.
For Traffic direction, select Any.
For Action, select Pass.
Choose Add rule.
Figure 6: Example of a Network Firewall rule group with custom IP set references
For the next set of rules, repeat the preceding steps and choose the appropriate protocol, source, destination, traffic direction, and action, as shown in the following table.
Protocol
Source
Destination
Source port
Destination port
Direction
Action
SSH
@IP_list_Allow_ssh_subnets
@IP_list_private_subnets
22
22
Forward
Pass
SSH
Any
@IP_list_private_subnets
Any
22
Forward
Drop
ICMP
@IP_list_Private_Deny
Any
Any
Any
Forward
Drop
After completion, you will have a set of stateful rules, as shown in Figure 7.
Figure 7: Example list of Network Firewall rules
Congratulations! You have configured Network Firewall rule groups by using VPC prefix lists for a simplified management to allow SSH traffic only from authorized subnets and to deny ICMP traffic from unauthorized subnets.
For the next steps, you can test your configuration by trying to use protocols such as SSH or ICMP from unauthorized subnets to your private subnets and reviewing the behavior. You can also test your configuration by doing the same from authorized subnets and comparing the results. Furthermore, you can create logging and monitoring solutions in Network Firewall to review the dropped or allowed packets from your Network Firewall log groups in CloudWatch Logs or use contributor insights to analyze Network Firewall logs.
Clean up the resources
To clean up the resources that you created for this walkthrough, do the following:
In this post, you learned how to use Amazon VPC managed prefix lists to simplify management of IP addresses within Network Firewall rule groups. IP set preferences that are mapped to your VPC prefix lists are a great tool to help simplify your firewall rules and reduce operational overhead and administration as you scale your network.
This post was co-written by Mahesh Pasupuleti and Gaurav Shah from Poshmark.
Poshmark is a leading social marketplace for new and secondhand styles for women, men, kids, pets, home, and more. By combining the human connection of physical shopping with the scale, ease, and selection benefits of Ecommerce, Poshmark makes buying and selling simple, social, and sustainable. Its community of more than 80 million registered users across the US, Canada, Australia, and India is driving a more sustainable future for the fashion industry.
An important goal to achieve for any organization is to grow the top line revenue. Top line revenue refers to the total value of sales of an organization’s services or products. The two main approaches organizations employ to increase revenue are to expand geographically to enter new markets and to increase market share within a market by improving customer experience (CX).
Improving CX is a well-known guideline to attract and retain customers and thereby increase the market share. In this post, we share how Poshmark improved CX and accelerated revenue growth by using a real-time analytics solution. We discuss how to create such a solution using Amazon Kinesis Data Streams, Amazon Managed Streaming for Kafka (Amazon MSK), Amazon Kinesis Data Analytics for Apache Flink; the design decisions that went into the architecture; and the observed business benefits by Poshmark.
High-level challenge: The need for real-time analytics
Previous efforts at Poshmark for improving CX through analytics were based on batch processing of analytics data and using it on a daily basis to improve CX. Although these batch analytics-based efforts were successful to some extent, they saw opportunities to improve the customer experience with real-time personalization and security guidance during the customer’s interaction with the Poshmark app. The customer insights gathered from the batch analytics couldn’t be paired with the current customer activities in real time due to the latencies involved in enriching the current activities with the knowledge gained through batch processes. Therefore, the opportunity to provide tailored offers or showcase products based on customers’ preference and behaviors in near-real time, which contributes to a much better customer experience, was missing. Similarly, the opportunity to catch fraud within a second, before checkout, was also missing.
To improve the customer experience, Poshmark decided to invest in building a real-time analytics platform to enable real-time capabilities, as explained further in this post. Poshmark engineers worked closely with AWS architects through the AWS Data Lab program. The AWS Data Lab offers accelerated, joint engineering engagements between customers and AWS technical resources to create tangible deliverables that accelerate data and analytics modernization initiatives. The Design Lab is one half to two day engagement with customer team offering prescriptive guidance to arrive at the optimal solution architecture design before you embark on building the platform.
Designing the solution architecture through the AWS Data Lab process
The business and technical stakeholders from Poshmark and the AWS Data Lab architects discussed near-to-long-term business requirements along with the functional and non-functional capabilities required to decide on the architecture approach. They reviewed the current state architecture and constraints to understand data flow and technical integration points. The joint team discussed the pros and cons of various AWS services that already exist in Poshmark’s current architecture, as well as other AWS services that can meet the requirements.
Poshmark wanted to address the following business use cases via the real-time analytics platform:
Sessionization – Poshmark captures both server-side application events and client-side tracking events. They wanted to use these events to identify and analyze user sessions to track behavior.
Illegitimate sign-up and sign-in prevention – Poshmark wanted to detect and ban illegitimate sign-up or sign-in events from bots or non-human traffic in real time on the Poshmark application.
IP translation – The IP addresses present in events will be translated to city, state, and zip, and enriched with other information to implement near-real-time, location-aware services encompassing security-related functions as well as personalization functions.
Anonymization – Poshmark wanted to anonymize events and make the data available for internal users for querying in near-real time.
Personalized recommendations – User behavior based on clickstream events can be captured up to the last second before enriching it for personalization and sending it to the model to predict the recommendations.
Other use cases – Additional use cases relating to aggregations and machine learning (ML) inference use cases such as authorization to operate, listing spam detection, and avoiding account takeovers (ATOs), among others.
One common pattern identified for these use cases was the need for a central data enrichment pipeline to enrich incoming raw events before event data can be utilized for actual business processing. In the Design Lab, we focused on design for data enrichment pipelines aimed at enriching events with data from static files, dynamic data stores such as databases, APIs, or within the same event stream for the aforementioned streaming use cases. Later in this post, we cover the salient points discussed during the lab around design and architecture.
Batch analytics solution architecture
The following diagram shows the previous architecture at Poshmark. For brevity, only the flow pertaining to the real-time analytics platform is explained.
User interactions on Poshmark web and mobile applications generate server-side events. These events include add to cart, orders, transactions, and more on application servers, and the page view, clicks, and more on tracking servers. Fluentd with an Amazon Kinesis plugin is set up on both the application and tracking servers to send these events to Amazon Kinesis Data Streams. The Fluentd Kinesis plugin aggregates events before sending to Kinesis Data Streams. A single Kinesis data stream is currently set up to capture these events. A random partition key is configured in Fluentd for the events to allow even distribution of events across shards. The event data format is nested JSON. Poshmark maintains the same schema grammar at the first level of JSON for both server-side and client-side server events. The attributes at nested level can differ between server-side and client-side events.
Poshmark receives around 1 billion events per day (100 million per hour during peak hours, 10 million per hour during non-peak hours). The average size of the event record is 1.2 KB.
The data from the Kinesis data stream is consumed by two applications:
A Spark streaming application on Amazon EMR is used to write data from the Kinesis data stream to a data lake hosted on Amazon Simple Storage Service (Amazon S3) in a partitioned way. The data from the S3 data lake is used for batch processing and analytics through Amazon EMR and Amazon Redshift.
Druid hosted on Amazon Elastic Compute Cloud (Amazon EC2) integrates with the Kinesis data stream for streaming ingestion and allows users to run slice-and-dice OLAP queries. Operational dashboards are hosted on Grafana integrated with Druid.
Desired enhancements to the initial solution
The use cases discussed during the architecture sessions fall into one or more combinations of the following stream processing requirements:
Stateless event processing – For example, near-real-time anonymization.
External lookup – Looking up a value from external stores. For example, IP address, city, zip, state, or ID.
Stateful data processing – Accessing past events or aggregations or ML inferences.
To meet these requirements, the streaming platform is divided into two layers:
Central data enrichment – This layer runs enrichments commonly required by downstream streaming applications. This will help avoid replication of the same enrichment logic in each application and enable better operational maintenance. The enrichment should strive for per-record processing in most cases.
Specific streaming applications – This layer will house specific streaming applications with respect to use cases and utilize enriched data from the central data enrichment pipeline.
For central data enrichment, we made the following enhancements to the platform:
The total latency including ingestion and data enrichment was super critical and should be in the range of double-digit millisecond latency based on the overall latency budget of Poshmark to achieve real-time ML responses to events. The absolute lowest ingestion latency was achieved by Kafka, and the team decided to go with the managed version of Kafka, Amazon MSK.
Similarly, low-latency processing of data is also required, and appropriate framework should be considered accordingly.
Exactly-once delivery guarantees were required to avoid data duplication resulting in wrong calculations.
The enrichment source could be any source such as static files, databases, and APIs and latencies can vary between them. A number of server-side and client-side events are generated when a user interacts with a Poshmark application. As a result, the same information from the enrichment source is required to enrich each event. This frequently accessed information cached in a centralized cache will optimize fetch time.
Design decisions for the new solution
Poshmark made the following design decisions for central data enrichment:
Kafka can support double-digit millisecond latency from producer to consumer with appropriate performance tuning. Kafka can provide exactly-once semantics both at producers and consumer applications. AWS provides Kafka as part of its Amazon MSK offering, eliminating the operational overhead of maintaining and running Kafka cluster infrastructure on AWS, thereby allowing you to focus on developing and running Kafka-based applications. Poshmark decided to use Amazon MSK for their streaming ingestion and storage requirements.
We also decided to use Flink for streaming data enrichment applications for the following reasons:
Flink can provide low-latency processing even at higher throughput with exactly-once guarantees. Spark Structured Streaming on the other hand can provide low latency with low throughput due to microbatch-based processing. Spark Structured Streaming continuous processing is an experimental feature and provides at-least once guarantees.
The enrichment requests call to an external store if modeled in a map function (Spark’s map API or Flink’s MapFunction API) will make synchronous calls to the external store. The call will wait for a response from the external store before processing the next event, adding to delays and reducing overall throughput. The asynchronous interaction will allow sending requests and receiving responses concurrently from external stores. This will reduce wait time and improve overall throughput. Flink supports async I/O operators natively, allowing users to use asynchronous request clients with data streams. The API handles the integration with data streams, well as handling order, event time, fault tolerance, and more. Spark Structured Streaming doesn’t provide any such support natively and leaves it to users for custom implementation.
Poshmark selected Kinesis Data Analytics for Apache Flink to run the data enrichment application. Kinesis Data Analytics for Apache Flink provides the underlying infrastructure for your Apache Flink applications. It handles core capabilities like provisioning compute resources, parallel computation, automatic scaling, and application backups (implemented as checkpoints and snapshots).
An enrichment microservice accompanying Amazon ElastiCache for Redis was set up to abstract access from data enrichment applications. The AsyncFunction in the Flink async I/O operator isn’t multi-threaded and won’t work in a truly asynchronous way if the call is blocked or waiting for a response. The enrichment microservice handles requests and responses asynchronously coming from Flink async I/O operators. The data is also cached in ElastiCache for Redis to improve the latency of the microservice.
The Poshmark ML applications are the consumers of this enriched data. The team has built and deployed different ML models over time. These models include a learning to rank algorithm, fraud detection, personalization and recommendations, and online spam filtering. Previously, for deploying each model into production, the Poshmark team had to go through a series of infrastructure setup steps that involved data extraction from real-time sources, building real-time aggregate features from streaming data, storing these features in a low-latency database (Redis) for sub-millisecond inferences, and finally performing inferences via Amazon SageMaker hosted endpoints.
We also designed an ML feature storage pipeline that consumes data from the enriched streaming sources (Kinesis or Kafka), generate single-level and aggregated-level features, and ingest these generated features into a feature store repository with a very low latency of less than 80 milliseconds.
The ML models are now able to extract the needed features with latency less than 10 milliseconds from the feature repository and perform real-time model inferencing.
Real-time analytics solution architecture
The following diagram illustrates the solution architecture for real-time analytics with Amazon MSK and Kinesis Data Analytics for Apache Flink.
The workflow is as follows:
Users interact on Poshmark’s web or mobile application.
Server-side events are captured on application servers and client-side events are captured on tracking servers. These events are written in the downstream MSK cluster.
The raw events will be ingested into the MSK cluster using the Fluentd plugin to produce data for Kafka.
The enrichment microservice consists of reactive (asynchronous) enrichment lookup APIs fetching data from persistent data stores. ElastiCache for Redis caches frequently accessed data, reducing fetch time for enrichment lookup APIs.
The Flink application running on Kinesis Data Analytics for Apache Flink consumes raw events from Amazon MSK and runs data enrichment on a per-record basis. The Flink data enrichment application uses Flink’s async I/O to read external data from the enrichment lookup store for enriching stream events.
Enriched events are written in the MSK cluster under different enriched events topics.
The existing Spark streaming application consumes from the enriched events topic (or raw events topic) in Amazon MSK and writes the data into an S3 data lake.
Druid streaming ingestion now reads from the enriched events topic or raw events topic in Amazon MSK depending on the requirements.
Enrichment of the captured event data
In this section, we discuss the different steps to enrich the captured event data.
Enrichment processing
Kinesis Data Analytics for Apache Flink provides the underlying infrastructure for the Apache Flink applications. It handles core capabilities like provisioning compute resources, parallel computation, automatic scaling, and application backups (implemented as checkpoints and snapshots). You can use the high-level Flink programming features (such as operators, functions, sources, and sinks) in the same way that you use them when hosting the Flink infrastructure yourself.
Flink on Amazon EMR gives the flexibility to choose your Flink version, installation, configuration, instances, and storage. However, you also have to take care of cluster management and operational requirements such as scaling, application backup, and provisioning.
Enrichment lookup store
The AsyncFunction in the Flink async I/O operator isn’t multi-threaded and won’t work in a truly asynchronous way if the call is blocked or waiting for a response. The enrichment lookup API should handle requests and responses asynchronously coming from Flink async I/O operators. The enrichment lookup API can be hosted on Amazon EC2 or containers such as Amazon Elastic Container Service (Amazon ECS) or Amazon Elastic Kubernetes Service (Amazon EKS).
A number of server-side and client-side events are generated when a user interacts with a Poshmark application. As a result, the same information is required to enrich each event. This frequently accessed information cached in a centralized cache can optimize fetch time. The latency to the centralized cache can be further reduced by hosting the client (enrichment lookup API) and cache server in the same Availability Zone.
Reconciliation in case of pipeline errors
The event enrichment can fail in data enrichment applications for various reasons, such as the external store timing out or missing information in the store. The enriched fields may or may not be critical for downstream streaming applications. You should build your downstream streaming applications considering that these failures can occur and implement a fallback mechanism, for example retrying on-demand enrichment from the application. The failure handling will also be governed by latency tolerance of the application.
The processing of data is based on event time. In some situations, data can arrive late in the platform. Both Flink and Spark allow lateness and watermarks for users to handle late-arriving data by defining thresholds. Late-arriving data beyond the threshold is discarded from processing. It’s possible to get this discarded too-late data in Flink using a side output. There is no such provision in Spark Structured Streaming.
A few streaming applications require their batch counterpart to reconcile data hourly or daily to handle data mismatch or data discrepancy due to late-arriving data or missing data.
Improved customer experience
The new real-time architecture offered the following benefits for an improved customer experience:
Anonymization – Poshmark is now able to provide and utilize real-time anonymized data for multiple functions both internally and externally because anonymization happens in real time.
Fraud mitigation – Poshmark was previously able to detect and prevent 45% of ATOs with the batch-based solution. With the real-time system, Poshmark is able to prevent 80% of ATOs.
Personalization – By providing personalized search results, Poshmark achieved an 8% improvement on clickthrough rates for search. This is a significant increase in the top of the funnel, increasing overall search conversions.
Improvement in these three factors helped end-customers gain confidence in the Poshmark app and website, which in turn enabled customers to increase their interaction with the app and helped accelerate customer engagement and growth.
Conclusion
In this post, we discussed the ingestion of real-time clickstream and log event data into Amazon MSK. We showed how enrichment of the captured data can be performed through Kinesis Data Analytics for Apache Flink. We broke up the enrichment processing into multiple components, such as Kinesis Data Analytics for Apache Flink, the enrichment microservices and the enrichment lookup store, and an enrichment cache. We discussed the downstream applications that used this enriched customer information to perform real-time security checks and offer personalized recommendations to end-users. We also discussed some of the areas that may need attention in case there are failures in the pipeline. Lastly, we showed how Poshmark improved their customer experience and gained market share by implementing this real-time analytics pipeline.
About the authors
Mahesh Pasupuleti is a VP of Data & Machine Learning Engineering at Poshmark. He has helped several startups succeed in different domains, including media streaming, healthcare, the financial sector, and marketplaces. He loves software engineering, building high performance teams, and strategy, and enjoys gardening and playing badminton in his free time.
Gaurav Shah is Director of Data Engineering and ML at Poshmark. He and his team help build data-driven solutions to drive growth at Poshmark.
Raghu Mannam is a Sr. Solutions Architect at AWS in San Francisco. He works closely with late-stage startups, many of which have had recent IPOs. His focus is end-to-end solutioning including security, DevOps automation, resilience, analytics, machine learning, and workload optimization in the cloud.
Deepesh Malviya is Solutions Architect Manager on the AWS Data Lab team. He and his team help customers architect and build data, analytics, and machine learning solutions to accelerate their key initiatives as part of the AWS Data Lab.
This blog post was written by Abeer Naffa’, Sr. Solutions Architect, Solutions Builder AWS, David Filiatrault, Principal Security Consultant, AWS and Jared Thompson, Hybrid Edge SA Specialist, AWS.
In this post, we will explore how organizations can use AWS Control Tower landing zone and AWS Organizations custom guardrails to enable compliance with data residency requirements on AWS Outposts rack. We will discuss how custom guardrails can be leveraged to limit the ability to store, process, and access data and remain isolated in specific geographic locations, how they can be used to enforce security and compliance controls, as well as, which prerequisites organizations should consider before implementing these guardrails.
Data residency is a critical consideration for organizations that collect and store sensitive information, such as Personal Identifiable Information (PII), financial, and healthcare data. With the rise of cloud computing and the global nature of the internet, it can be challenging for organizations to make sure that their data is being stored and processed in compliance with local laws and regulations.
One potential solution for addressing data residency challenges with AWS is to use Outposts rack, which allows organizations to run AWS infrastructure on premises and in their own data centers. This lets organizations store and process data in a location of their choosing. An Outpost is seamlessly connected to an AWS Region where it has access to the full suite of AWS services managed from a single plane of glass, the AWS Management Console or the AWS Command Line Interface (AWS CLI). Outposts rack can be configured to utilize landing zone to further adhere to data residency requirements.
The landing zones are a set of tools and best practices that help organizations establish a secure and compliant multi-account structure within a cloud provider. A landing zone can also include Organizations to set policies – guardrails – at the root level, known as Service Control Policies (SCPs) across all member accounts. This can be configured to enforce certain data residency requirements.
When leveraging Outposts rack to meet data residency requirements, it is crucial to have control over the in-scope data movement from the Outposts. This can be accomplished by implementing landing zone best practices and the suggested guardrails. The main focus of this blog post is on the custom policies that restrict data snapshots, prohibit data creation within the Region, and limit data transfer to the Region.
Prerequisites
Landing zone best practices and custom guardrails can help when data needs to remain in a specific locality where the Outposts rack is also located. This can be completed by defining and enforcing policies for data storage and usage within the landing zone organization that you set up. The following prerequisites should be considered before implementing the suggested guardrails:
1. AWS Outposts rack
AWS has installed your Outpost and handed off to you. An Outpost may comprise of one or more racks connected together at the site. This means that you can start using AWS services on the Outpost, and you can manage the Outposts rack using the same tools and interfaces that you use in AWS Regions.
2. Landing Zone Accelerator on AWS
We recommend using Landing Zone Accelerator on AWS (LZA) to deploy a landing zone for your organization. Make sure that the accelerator is configured for the appropriate Region and industry. To do this, you must meet the following prerequisites:
A clear understanding of your organization’s compliance requirements, including the specific Region and industry rules in which you operate.
Knowledge of the different LZAs available and their capabilities, such as the compliance frameworks with which you align.
Have the necessary permissions to deploy the LZAs and configure it for your organization’s specific requirements.
Note that LZAs are designed to help organizations quickly set up a secure, compliant multi-account environment. However, it’s not a one-size-fits-all solution, and you must align it with your organization’s specific requirements.
3. Set up the data residency guardrails
Using Organizations, you must make sure that the Outpost is ordered within a workload account in the landing zone.
Figure 1: Landing Zone Accelerator – Outposts workload on AWS high level Architecture
Utilizing Outposts rack for regulated components
When local regulations require regulated workloads to stay within a specific boundary, or when an AWS Region or AWS Local Zone isn’t available in your jurisdiction, you can still choose to host your regulated workloads on Outposts rack for a consistent cloud experience. When opting for Outposts rack, note that, as part of the shared responsibility model, customers are responsible for attesting to physical security, access controls, and compliance validation regarding the Outposts, as well as, environmental requirements for the facility, networking, and power. Utilizing Outposts rack requires that you procure and manage the data center within the city, state, province, or country boundary for your applications’ regulated components, as required by local regulations.
Procuring two or more racks in the diverse data centers can help with the high availability for your workloads. This is because it provides redundancy in case of a single rack or server failure. Additionally, having redundant network paths between Outposts rack and the parent Region can help make sure that your application remains connected and continue to operate even if one network path fails.
However, for regulated workloads with strict service level agreements (SLA), you may choose to spread Outposts racks across two or more isolated data centers within regulated boundaries. This helps make sure that your data remains within the designated geographical location and meets local data residency requirements.
In this post, we consider a scenario with one data center, but consider the specific requirements of your workloads and the regulations that apply to determine the most appropriate high availability configurations for your case.
Outposts rack workload data residency guardrails
Organizations provide central governance and management for multiple accounts. Central security administrators use SCPs with Organizations to establish controls to which all AWS Identity and Access Management (IAM) principals (users and roles) adhere.
Now, you can use SCPs to set permission guardrails. A suggested preventative controls for data residency on Outposts rack that leverage the implementation of SCPs are shown as follows. SCPs enable you to set permission guardrails by defining the maximum available permissions for IAM entities in an account. If an SCP denies an action for an account, then none of the entities in the account can take that action, even if their IAM permissions let them. The guardrails set in SCPs apply to all IAM entities in the account, which include all users, roles, and the account root user.
Upon finalizing these prerequisites, you can create the guardrails for the Outposts Organization Unit (OU).
Note that while the following guidelines serve as helpful guardrails – SCPs – for data residency, you should consult internally with legal and security teams for specific organizational requirements.
To exercise better control over workloads in the Outposts rack and prevent data transfer from Outposts to the Region or data storage outside the Outposts, consider implementing the following guardrails. Additionally, local regulations may dictate that you set up these additional guardrails.
When your data residency requirements require restricting data transfer/saving to the Region, consider the following guardrails:
If your data residency requirements mandate restrictions on data storage in the Region, consider implementing this guardrail to prevent the use of S3 in the Region.
c. If your data residency requirements mandate restrictions on data storage in the Region, consider implementing “DenyDirectTransferToRegion” guardrail.
Out of Scope is metadata such as tags, or operational data such as KMS keys.
If your data residency requirements require limitations on data storage in the Region, consider implementing this guardrail “DenySnapshotsToRegion” and “DenySnapshotsNotOutposts” to restrict the use of snapshots in the Region.
a. Deny creating snapshots of your Outpost data in the Region “DenySnapshotsToRegion”
Make sure to update the Outposts “<outpost_arn_pattern>”.
b. Deny copying or modifying Outposts Snapshots “DenySnapshotsNotOutposts”
Make sure to update the Outposts “<outpost_arn_pattern>”.
Note: “<outpost_arn_pattern>” default is arn:aws:outposts:*:*:outpost/*
This guardrail helps to prevent the launch of Amazon EC2 instances or creation of network interfaces in non-Outposts subnets. It is advisable to keep data residency workloads within the Outposts rather than the Region to ensure better control over regulated workloads. This approach can help your organization achieve better control over data residency workloads and improve governance over your AWS Organization.
Make sure to update the Outposts subnets “<outpost_subnet_arns>”.
When implementing data residency guardrails on Outposts rack, consider backup and disaster recovery strategies to make sure that your data is protected in the event of an outage or other unexpected events. This may include creating regular backups of your data, implementing disaster recovery plans and procedures, and using redundancy and failover systems to minimize the impact of any potential disruptions. Additionally, you should make sure that your backup and disaster recovery systems are compliant with any relevant data residency regulations and requirements. You should also test your backup and disaster recovery systems regularly to make sure that they are functioning as intended.
Additionally, the provided SCPs for Outposts rack in the above example do not block the “logs:PutLogEvents”. Therefore, even if you implemented data residency guardrails on Outpost, the application may log data to CloudWatch logs in the Region.
Highlights
By default, application-level logs on Outposts rack are not automatically sent to Amazon CloudWatch Logs in the Region. You can configure CloudWatch logs agent on Outposts rack to collect and send your application-level logs to CloudWatch logs.
logs: PutLogEvents does transmit data to the Region, but it is not blocked by the provided SCPs, as it’s expected that most use cases will still want to be able to use this logging API. However, if blocking is desired, then add the action to the first recommended guardrail. If you want specific roles to be allowed, then combine with the ArnNotLike condition example referenced in the previous highlight.
Conclusion
The combined use of Outposts rack and the suggested guardrails via AWS Organizations policies enables you to exercise better control over the movement of the data. By creating a landing zone for your organization, you can apply SCPs to your Outposts racks that will help make sure that your data remains within a specific geographic location, as required by the data residency regulations.
Note that, while custom guardrails can help you manage data residency on Outposts rack, it’s critical to thoroughly review your policies, procedures, and configurations to make sure that they are compliant with all relevant data residency regulations and requirements. Regularly testing and monitoring your systems can help make sure that your data is protected and your organization stays compliant.
Welcome to the third post of a multi-part series that addresses disaster recovery (DR) strategies with the use of AWS-managed services to align with customer requirements of performance, cost, and compliance. In part two of this series, we introduced a DR concept that utilizes managed services through a backup and restore strategy with multiple Regions. The post also introduces a multi-site active/passive approach.
The multi-site active/passive approach is best for customers who have business-critical workloads with higher availability requirements over other active/passive environments. A warm-standby strategy (as in Figure 1) is more costly than other active/passive strategies, but provides good protection from downtime and data loss outside of an active/active (A/A) environment.
Figure 1. Warm standby
Implementing the multi-site active/passive strategy
By replicating across multiple Availability Zones in same Region, your workloads become resilient to the failure of an entire data center. Using multiple Regions provides the most resilient option to deploy workloads, which safeguards against the risk of failure of multiple data centers.
Let’s explore an application that processes payment transactions and is modernized to utilize managed services in the AWS Cloud, as in Figure 2.
Figure 2. Warm standby with managed services
Let’s cover each of the components of this application, as well as how managed services behave in a multisite environment.
1. Amazon Route53 – Active/Passive Failover: This configuration consists of primary resources to be available, and secondary resources on standby in the case of failure of the primary environment. You would just need to create the records and specify failover for the routing policy. When responding to queries, Amazon Route 53 includes only the healthy primary resources. If the primary record configured in the Route 53 health check shows as unhealthy, Route 53 responds to DNS queries using the secondary record.
2.Amazon EKS control plane: Amazon Elastic Kubernetes Service (Amazon EKS) control plane nodes run in an account managed by AWS. Each EKS cluster control plane is single-tenant and unique, and runs on its own set of Amazon Elastic Compute Cloud (Amazon EC2) instances. Amazon EKS is also a Regional service, so each cluster is confined to the Region where it is deployed, with each cluster being a standalone entity.
3. Amazon EKS data plane: Operating highly available and resilient applications requires a highly available and resilient data plane. It’s best practice to create worker nodes using Amazon EC2 Auto Scaling groups instead of creating individual Amazon EC2 instances and joining them to the cluster.
Figure 2 shows three nodes in the primary Region while there will only be a single node in the secondary. In case of failover, the data plane scales up to meet the workload requirements. This strategy deploys a functional stack to the secondary Region to test Region readiness before failover. You can use Velero with Portworx to manage snapshots of persistent volumes. These snapshots can be stored in an Amazon Simple Storage Service (Amazon S3) bucket in the primary Region, which is replicated to an Amazon S3 bucket in another Region using Amazon S3 cross-Region replication.
During an outage in the primary Region, Velero restores volumes from the latest snapshots in the standby cluster.
4. Amazon OpenSearch Service: With cross-cluster replication in Amazon OpenSearch Service, you can replicate indexes, mappings, and metadata from one OpenSearch Service domain to another. The domain follows an active-passive replication model where the follower index (where the data is replicated) pulls data from the leader index. Using cross-cluster replication helps to ensure recovery from disaster events and allows you to replicate data across geographically distant data centers to reduce latency.
If you are using any versions prior to Elasticsearch 7.10 or OpenSearch 1.1, refer to part two of our blog series for guidance on using APIs for cross-Region replication.
5. Amazon RDS for PostgreSQL: One of the managed service offerings of Amazon Relational Database Service (Amazon RDS) for PostgreSQL is cross-Region read replicas. Cross-Region read replicas enable you to have a DR solution scaling read database workloads, and cross-Region migration.
Amazon RDS for PostgreSQL supports the ability to create read replicas of a source database (DB). Amazon RDS uses an asynchronous replication method of the DB engine to update the read replica whenever there is a change made on the source DB instance. Although read replicas operate as a DB instance that allows only read-only connections, they can be used to implement a DR solution for your production DB environment. If the source DB instance fails, you can promote your Read Replica to a standalone source server.
Using a cross-Region read replica helps ensure that you get back up and running if you experience a Regional availability issue. For more information on PostgreSQL cross-Region read replicas, visit the Best Practices for Amazon RDS for PostgreSQL Cross-Region Read Replicas blog post.
6. Amazon ElastiCache: AWS provides a native solution called Global Datastore that enables cross-Region replication. By using the Global Datastore for Redis feature, you can work with fully managed, fast, reliable, and secure replication across AWS Regions. This feature helps create cross-Region read replica clusters for ElastiCache for Redis to enable low-latency reads and DR across AWS Regions. Each global datastore is a collection of one or more clusters that replicate to one another. When you create a global datastore in Amazon ElastiCache, ElastiCache for Redis automatically replicates your data from the primary cluster to the secondary cluster. ElastiCache then sets up and manages automatic, asynchronous replication of data between the two clusters.
7. Amazon Redshift: With Amazon Redshift, there are only two ways of deploying a true DR approach: backup and restore, and an (A/A) solution. We’ll use the A/A solution as this provides a better recovery time objective (RTO) for the overall approach. The recovery point objective (RPO) is dependent upon the configured schedule of AWS Lambda functions. The application within the primary Region sends data to both Amazon Simple Notification Service (Amazon SNS) and Amazon S3, and the data is distributed to the Redshift clusters in both Regions through Lambda functions.
Amazon EKS uploads data to an Amazon S3 bucket and publishes a message to an Amazon SNS topic with a reference to the stored S3 object. S3 acts as an intermediate data store for messages beyond the maximum output limit of Amazon SNS. Amazon SNS is configured with primary and secondary Region Amazon Simple Queue Service (Amazon SQS) endpoint subscriptions. Amazon SNS supports the cross-Region delivery of notifications to Amazon SQS queues. Lambda functions deployed in the primary and secondary Region are used to poll the Amazon SQS queue in respective Regions to read the message. The Lambda functions then use the Amazon SQS Extended Client Library for Java to retrieve the Amazon S3 object referenced in the message. Once the Amazon S3 object is retrieved, the Lambda functions upload the data into Amazon Redshift.
This active/passive approach covers how you can build a creative DR solution using a mix of native and non-native cross-Region replication methods. By using managed services, this strategy becomes simpler through automation of service updates, deployment using Infrastructure as a Code (IaaC), and general management of the two environments.
Related information
Want to learn more? Explore the following resources within this series and beyond!
Companies that store and process data on Amazon Web Services (AWS) want to prevent transfers of that data to or from locations outside of their company’s control. This is to support security strategies, such as data loss prevention, or to comply with the terms and conditions set forth by various regulatory and privacy agreements. On AWS, a resource perimeter is a set of AWS Identity and Access Management (IAM) features and capabilities that you can use to build your defense-in-depth protection against unintended data transfers. In this third blog post of the Establishing a data perimeter on AWS series, we review the benefits and implementation considerations when you define your resource perimeter.
The resource perimeter is one of the three perimeters in the data perimeter framework on AWS and has the following two control objectives:
My identities can access only trusted resources – This helps to ensure that IAM principals that belong to your AWS Organizations organization can access only the resources that you trust.
Only trusted resources can be accessed from my network – This helps to ensure that only resources that you trust can be accessed through expected networks, regardless of the principal that is making the API call.
Trusted resources are the AWS resources, such as Amazon Simple Storage Service (Amazon S3) buckets and objects or Amazon Simple Notification Service (Amazon SNS) topics, that are owned by your organization and in which you store and process your data. Additionally, there are resources outside your organization that your identities or AWS services acting on your behalf might need to access. You will need to consider these access patterns when you define your resource perimeter.
Security risks addressed by the resource perimeter
The resource perimeter helps address three main security risks.
Unintended data disclosure through use of corporate credentials — Your developers might have a personal AWS account that is not part of your organization. In that account, they could configure a resource with a resource-based policy that allows their corporate credentials to interact with the resource. For example, they could write an S3 bucket policy that allows them to upload objects by using their corporate credentials. This could allow the intentional or unintentional transfer of data from your corporate environment — your on-premises network or virtual private cloud (VPC) — to their personal account. While you advance through your least privilege journey, you should make sure that access to untrusted resources is prohibited, regardless of the permissions granted by identity-based policies that are attached to your IAM principals. Figure 1 illustrates an unintended access pattern where your employee uses an identity from your organization to move data from your on-premises or AWS environment to an S3 bucket in a non-corporate AWS account.
Figure 1: Unintended data transfer to an S3 bucket outside of your organization by your identities
Unintended data disclosure through non-corporate credentials usage — There is a risk that developers could introduce personal IAM credentials to your corporate network and attempt to move company data to personal AWS resources. We discussed this security risk in a previous blog post: Establishing a data perimeter on AWS: Allow only trusted identities to access company data. In that post, we described how to use the aws:PrincipalOrgID condition key to prevent the use of non-corporate credentials to move data into an untrusted location. In the current post, we will show you how to implement resource perimeter controls as a defense-in-depth approach to mitigate this risk.
Unintended data infiltration — There are situations where your developers might start the solution development process using commercial datasets, tooling, or software and decide to copy them from repositories, such as those hosted on public S3 buckets. This could introduce malicious components into your corporate environment, your on-premises network, or VPCs. Establishing the resource perimeter to only allow access to trusted resources from your network can help mitigate this risk. Figure 2 illustrates the access pattern where an employee with corporate credentials downloads assets from an S3 bucket outside of your organization.
Figure 2: Unintended data infiltration
Implement the resource perimeter
To achieve the resource perimeter control objectives, you can implement guardrails in your AWS environment by using the following AWS policy types:
Service control policies (SCPs) – Organization policies that are used to centrally manage and set the maximum available permissions for your IAM principals. SCPs help you ensure that your accounts stay within your organization’s access control guidelines. In the context of the resource perimeter, you will use SCPs to help prevent access to untrusted resources from AWS principals that belong to your organization.
VPC endpoint policy – An IAM resource-based policy that is attached to a VPC endpoint to control which principals, actions, and resources can be accessed through a VPC endpoint. In the context of the resource perimeter, VPC endpoint policies are used to validate that the resource the principal is trying to access belongs to your organization.
The condition key used to constrain access to resources in your organization is aws:ResourceOrgID. You can set this key in an SCP or VPC endpoint policy. The following table summarizes the relationship between the control objectives and the AWS capabilities used to implement the resource perimeter.
Control objective
Implemented by using
Primary IAM capability
My identities can access only trusted resources
SCPs
aws:ResourceOrgID
Only trusted resources can be accessed from my network
VPC endpoint policies
aws:ResourceOrgID
In the next section, you will learn how to use the IAM capabilities listed in the preceding table to implement each control objective of the resource perimeter.
My identities can access only trusted resources
The following is an example of an SCP that limits all actions to only the resources that belong to your organization. Replace <MY-ORG-ID> with your information.
In this policy, notice the use of the negated condition key StringNotEqualsIfExists. This means that this condition will evaluate to true and the policy will deny API calls if the organization identifier of the resource that is being accessed differs from the one specified in the policy. It also means that this policy will deny API calls if the resource being accessed belongs to a standalone account, which isn’t part of an organization. The negated condition operators in the Deny statement mean that the condition still evaluates to true if the key is not present in the request; however, as a best practice, I added IfExists to the end of the StringNotEquals operator to clearly express the intent in the policy.
Note that for a permission to be allowed for a specific account, a statement that allows access must exist at every level of the hierarchy of your organization.
Only trusted resources can be accessed from my network
You can achieve this objective by combining the SCP we just reviewed with the use of aws:PrincipalOrgID in your VPC endpoint policies, as shown in the Establishing a data perimeter on AWS: Allow only trusted identities to access company data blog post. However, as a defense in depth, you can also apply resource perimeter controls on your networks by using aws:ResourceOrgID in your VPC endpoint policies.
The following is an example of a VPC endpoint policy that allows access to all actions but limits access to only trusted resources and identities that belong to your organization. Replace <MY-ORG-ID> with your information.
The preceding VPC endpoint policy uses the StringEquals condition operator. To invoke the Allow effect, the principal making the API call and the resource they are trying to access both need to belong to your organization. Compared to the SCP example that we reviewed earlier, your intent for this policy is different — you want to make sure that the Allow condition evaluates to true only if the specified key exists in the request. Additionally, VPC endpoint policies apply to principals, as long as their request flows through the VPC endpoint.
In VPC endpoint policies, you do not grant permissions; rather, you define the maximum allowed access through the network. Therefore, this policy uses an Allow effect.
Extend your resource perimeter
The previous two policies help you ensure that your identities and networks can only be used to access AWS resources that belong to your organization. However, your company might require that you extend your resource perimeter to also include AWS owned resources — resources that do not belong to your organization and that are accessed by your principals or by AWS services acting on your behalf. For example, if you use the AWS Service Catalog in your environment, the service creates and uses Amazon S3 buckets that are owned by the service to store products. To allow your developers to successfully provision AWS Service Catalog products, your resource perimeter needs to account for this access pattern. The following statement shows how to account for the service catalog access pattern. Replace <MY-ORG-ID> with your information.
Note that the EnforceResourcePerimeter statement in the SCP was modified to exclude s3:GetObject, s3:PutObject, and s3:PutObjectAcl actions from its effect (NotAction element). This is because these actions are performed by the Service Catalog to access service-owned S3 buckets. These actions are then restricted in the ExtendResourcePerimeter statement, which includes two negated condition keys. The second statement denies the previously mentioned S3 actions unless the resource that is being accessed belongs to your organization (StringNotEqualsIfExists with aws:ResourceOrgID), or the actions are performed by Service Catalog on your behalf (ForAllValues:StringNotEquals with aws:CalledVia). The aws:CalledVia condition key compares the services specified in the policy with the services that made requests on behalf of the IAM principal by using that principal’s credentials. In the case of the Service Catalog, the credentials of a principal who launches a product are used to access S3 buckets that are owned by the Service Catalog.
It is important to highlight that we are purposely not using the aws:ViaAWSService condition key in the preceding policy. This is because when you extend your resource perimeter, we recommend that you restrict access to only calls to buckets that are accessed by the service you are using.
You might also need to extend your resource perimeter to include the third-party resources of your partners. For example, you could be working with business partners that require your principals to upload or download data to or from S3 buckets that belong to their account. In this case, you can use the aws:ResourceAccount condition key in your resource perimeter policy to specify resources that belong to the trusted third-party account.
The following is an example of an SCP that accounts for access to the Service Catalog and third-party partner resources. Replace <MY-ORG-ID> and <THIRD-PARTY-ACCOUNT> with your information.
To account for access to trusted third-party account resources, the condition StringNotEqualsIfExists in the ExtendResourcePerimeter statement now also contains the condition key aws:ResourceAccount. Now, the second statement denies the previously mentioned S3 actions unless the resource that is being accessed belongs to your organization (StringNotEqualsIfExists with aws:ResourceOrgID), to a trusted third-party account (StringNotEqualsIfExists with aws:ResourceAccount), or the actions are performed by Service Catalog on your behalf (ForAllValues:StringNotEquals with aws:CalledVia).
The next policy example demonstrates how to extend your resource perimeter to permit access to resources that are owned by your trusted third parties through the networks that you control. This is required if applications running in your VPC or on-premises need to be able to access a dataset that is created and maintained in your business partner AWS account. Similar to the SCP example, you can use the aws:ResourceAccount condition key in your VPC endpoint policy to account for this access pattern. Replace <MY-ORG-ID>, <THIRD-PARTY-ACCOUNT>, and <THIRD-PARTY-RESOURCE-ARN> with your information.
The second statement, AllowRequestsByOrgsIdentitiesToThirdPartyResources, in the updated VPC endpoint policy allows s3:GetObject, s3:PutObject, and s3:PutObjectAcl actions on trusted third-party resources (StringEquals with aws:ResourceAccount) by principals that belong to your organization (StringEquals with aws:PrincipalOrgID).
Note that you do not need to modify your VPC endpoint policy to support the previously discussed Service Catalog operations. This is because calls to Amazon S3 made by Service Catalog on your behalf originate from the Service Catalog service network and do not traverse your VPC endpoint. However, you should consider access patterns that are similar to the Service Catalog example when defining your trusted resources. To learn about services with similar access patterns, see the IAM policy samples section later in this post.
Our GitHub repository contains policy examples that illustrate how to implement perimeter controls for a variety of AWS services. The policy examples in the repository are for reference only. You will need to tailor them to suit the specific needs of your AWS environment.
Conclusion
In this blog post, you learned about the resource perimeter, the control objectives achieved by the perimeter, and how to write SCPs and VPC endpoint policies that help achieve these objectives for your organization. You also learned how to extend your perimeter to include AWS service-owned resources and your third-party partner-owned resources.
For additional learning opportunities, see the Data perimeters on AWS page. This information resource provides additional materials such as a data perimeter workshop, blog posts, whitepapers, and webinar sessions.
If you have questions, comments, or concerns, contact AWS Support or browse AWS re:Post. If you have feedback about this post, submit comments in the Comments section below.
Want more AWS Security news? Follow us on Twitter.
The collective thoughts of the interwebz
Manage Consent
To provide the best experiences, we use technologies like cookies to store and/or access device information. Consenting to these technologies will allow us to process data such as browsing behavior or unique IDs on this site. Not consenting or withdrawing consent, may adversely affect certain features and functions.
Functional
Always active
The technical storage or access is strictly necessary for the legitimate purpose of enabling the use of a specific service explicitly requested by the subscriber or user, or for the sole purpose of carrying out the transmission of a communication over an electronic communications network.
Preferences
The technical storage or access is necessary for the legitimate purpose of storing preferences that are not requested by the subscriber or user.
Statistics
The technical storage or access that is used exclusively for statistical purposes.The technical storage or access that is used exclusively for anonymous statistical purposes. Without a subpoena, voluntary compliance on the part of your Internet Service Provider, or additional records from a third party, information stored or retrieved for this purpose alone cannot usually be used to identify you.
Marketing
The technical storage or access is required to create user profiles to send advertising, or to track the user on a website or across several websites for similar marketing purposes.
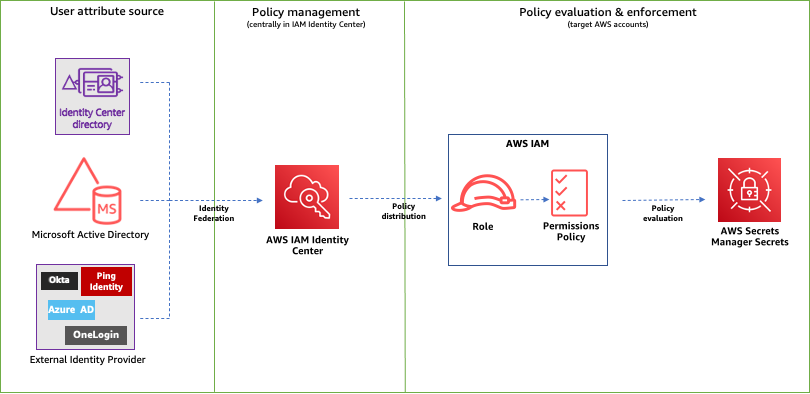
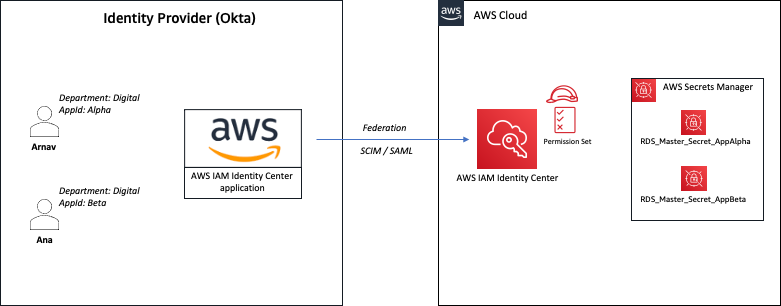


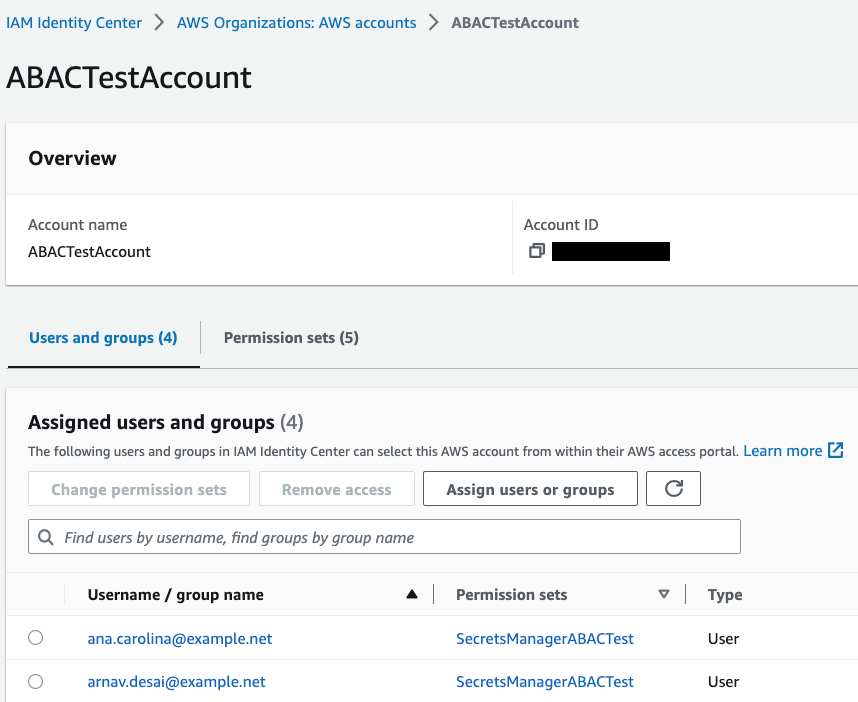


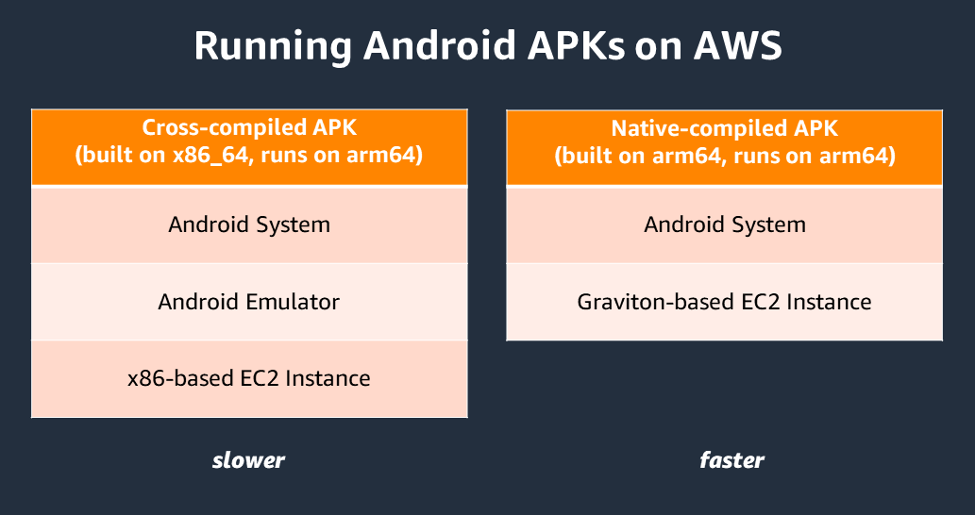


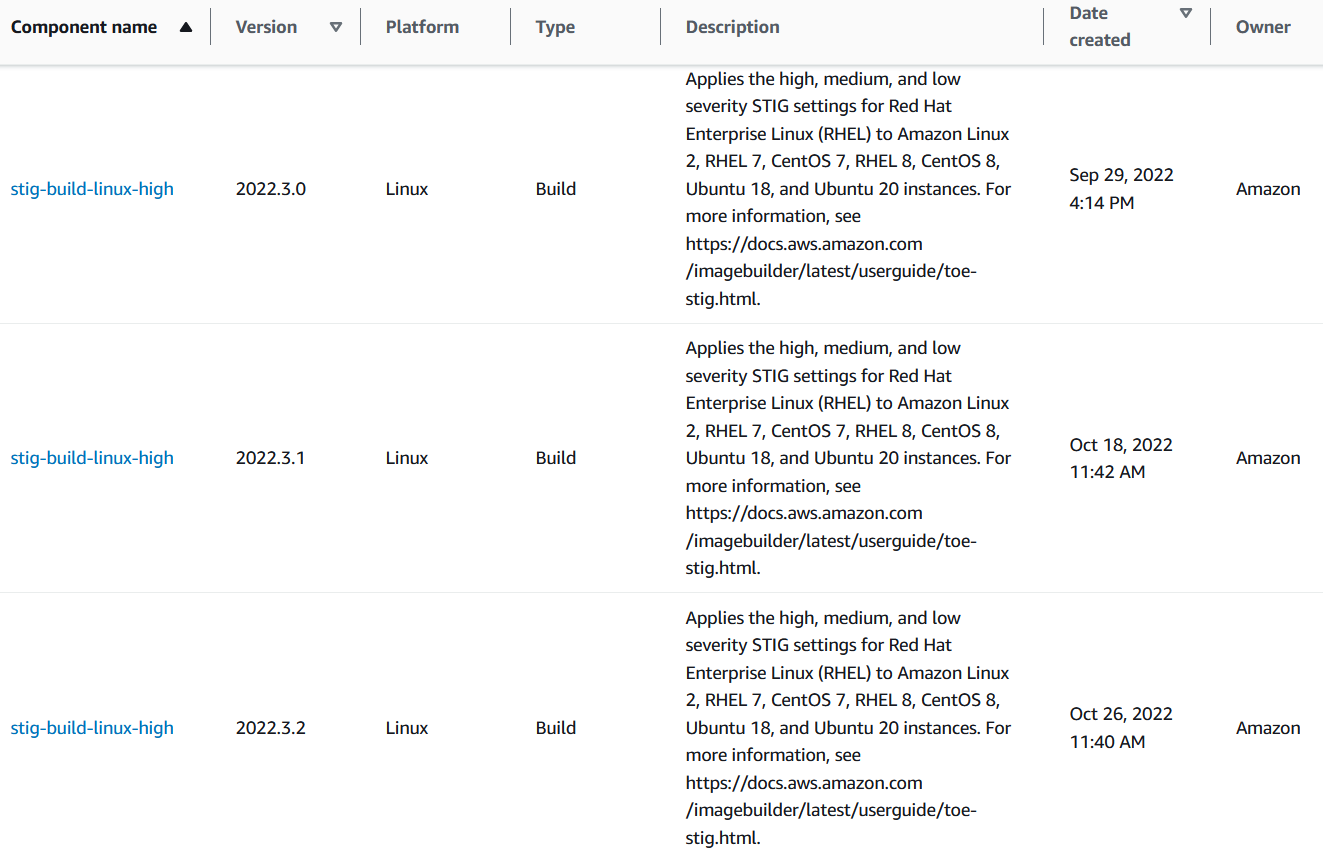
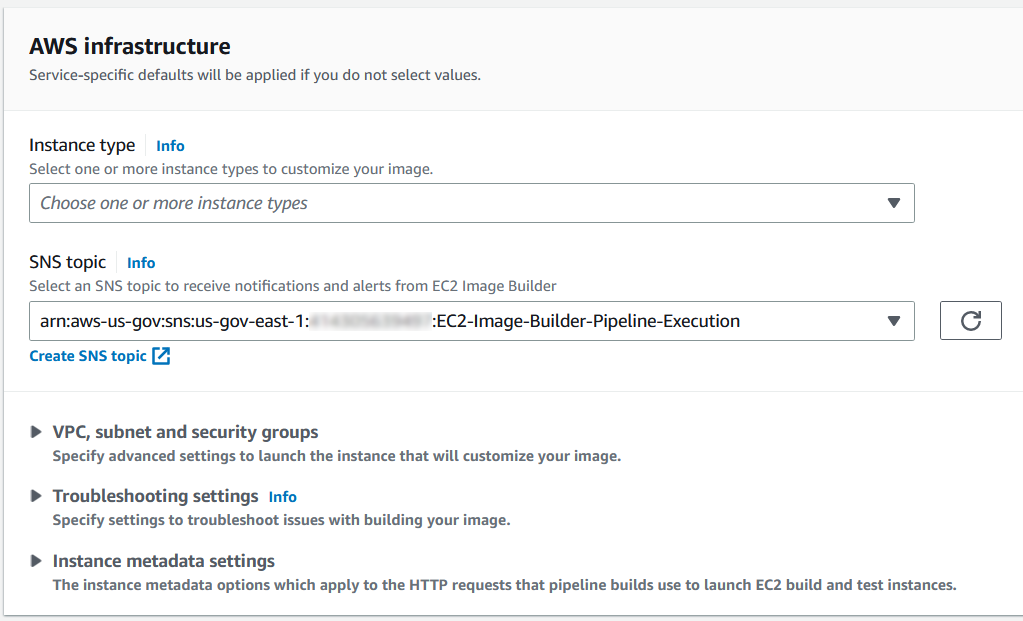
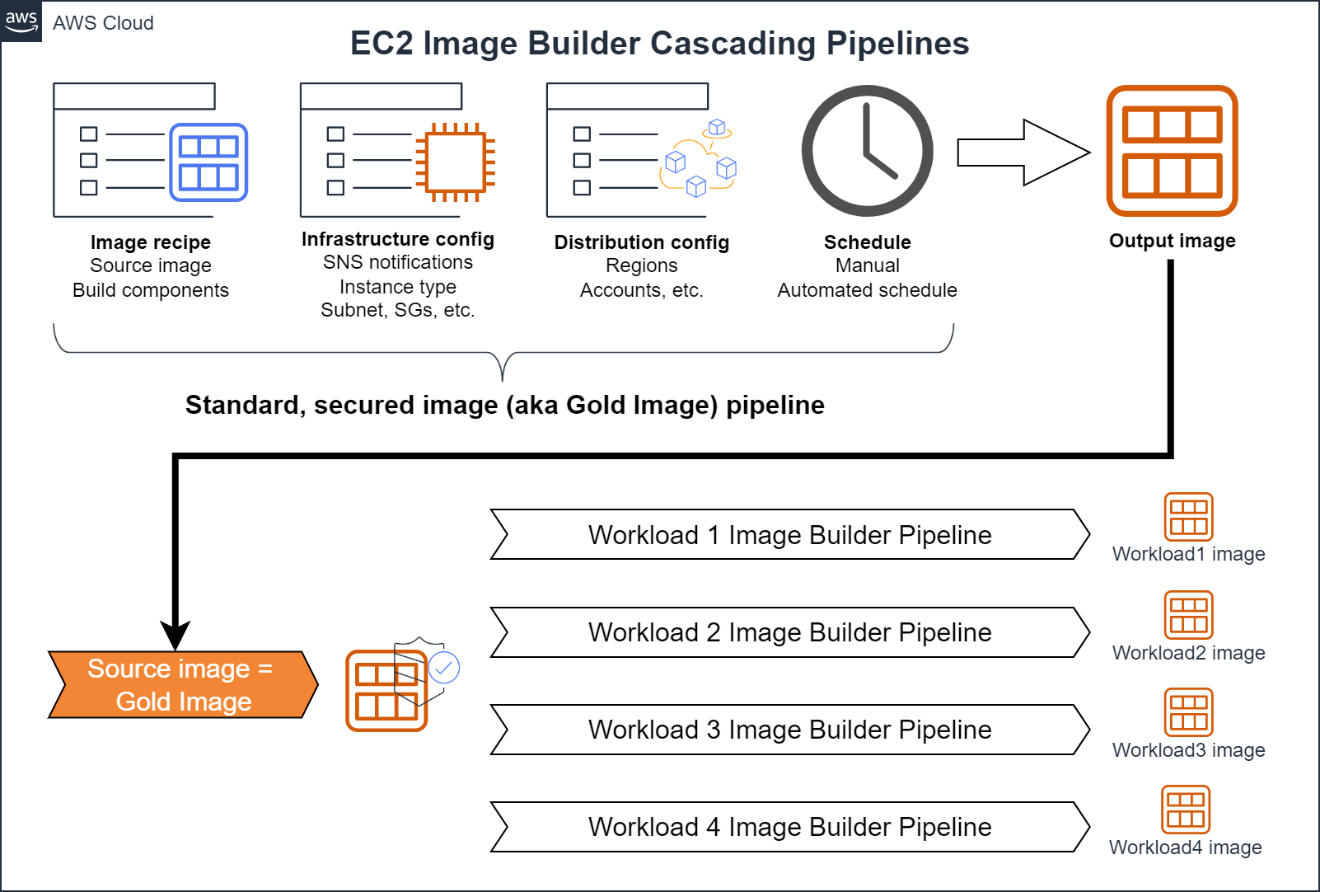

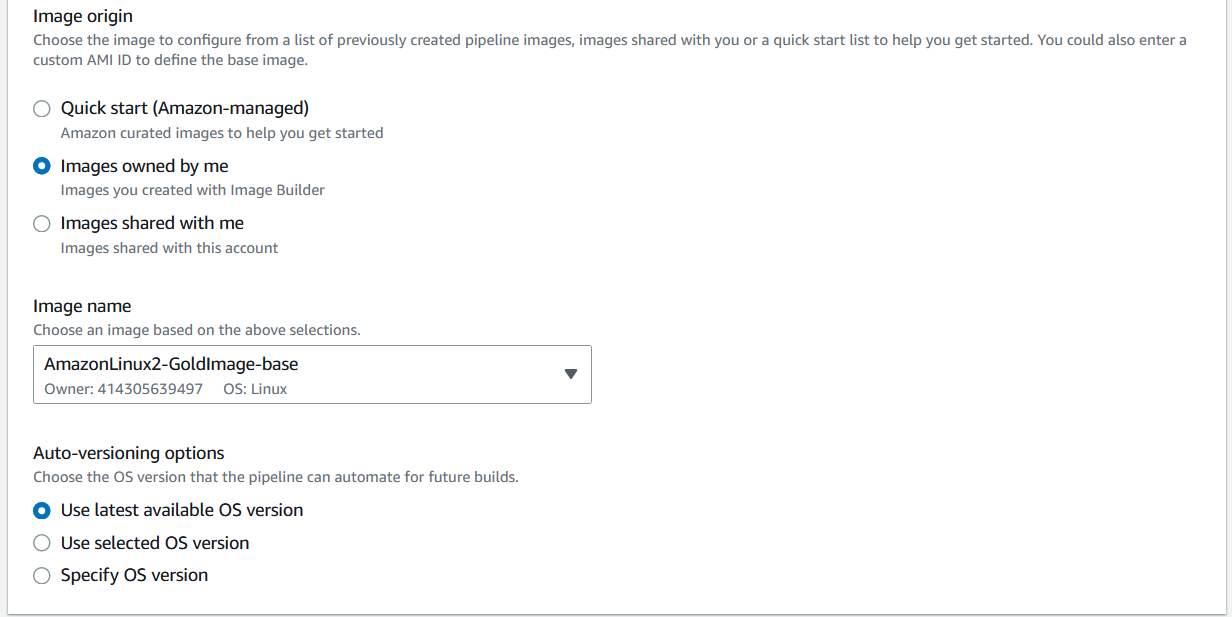


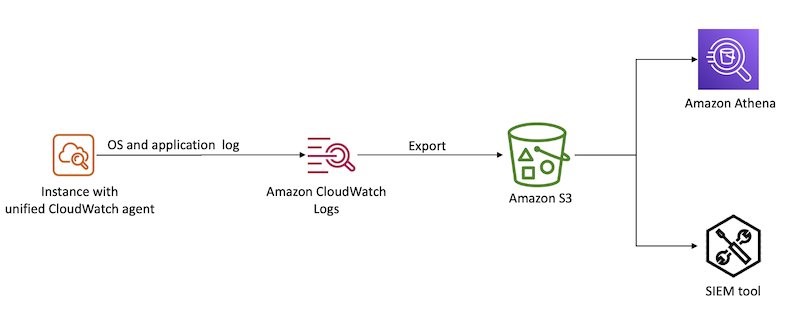
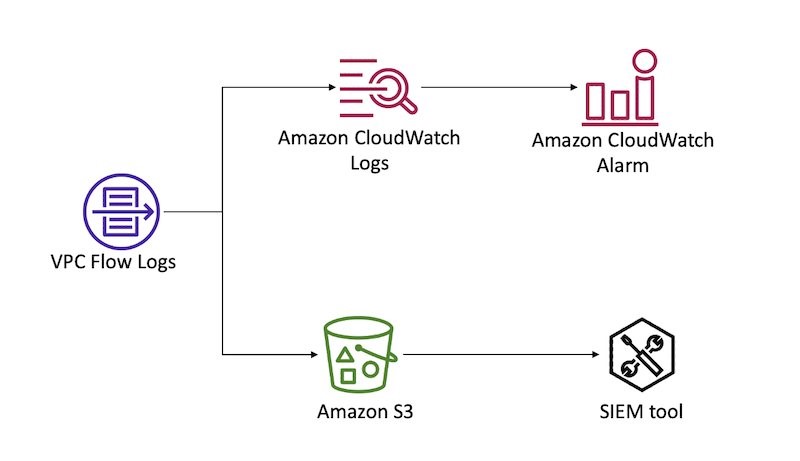


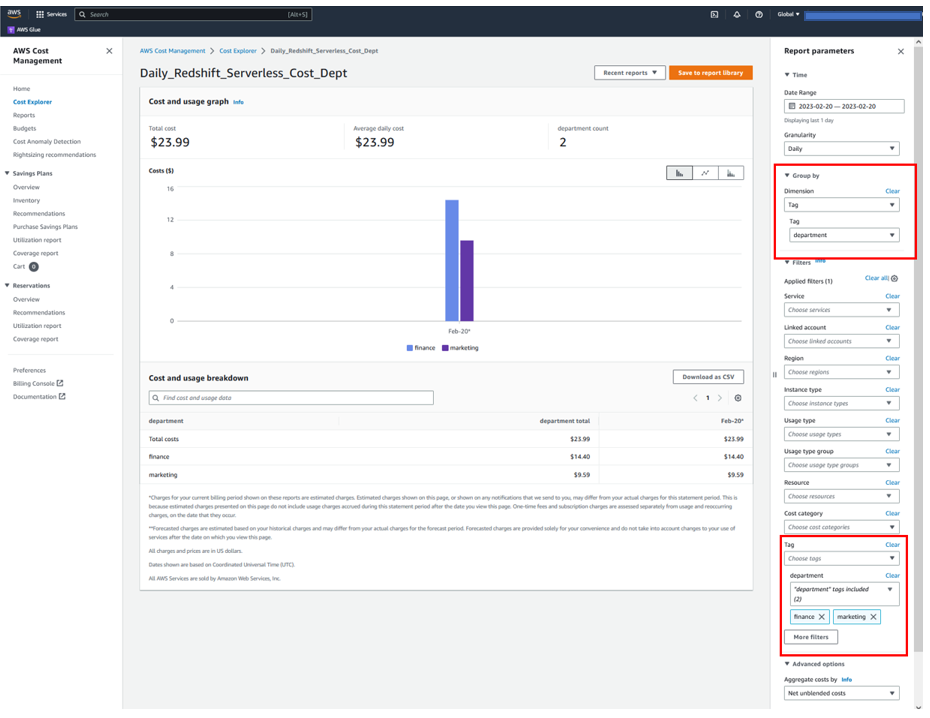
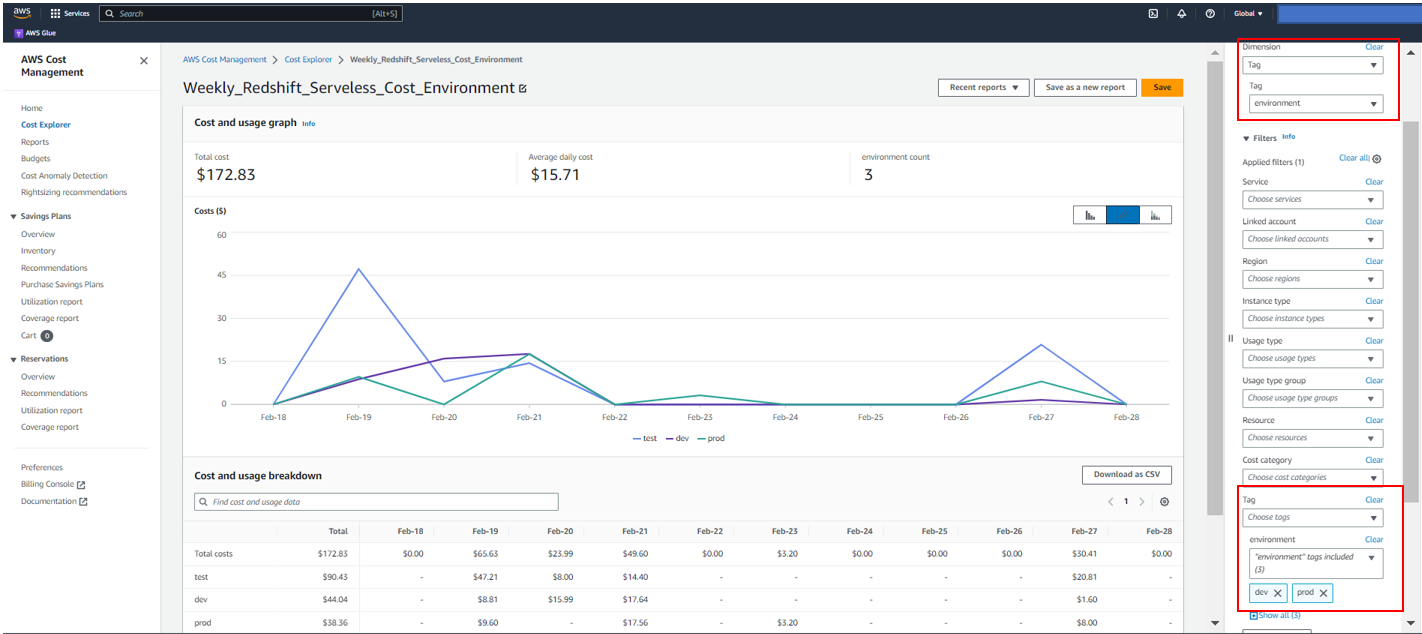
 Sandeep Bajwa is a Sr. Analytics Specialist based out of Northern Virginia, specialized in the design and implementation of analytics and data lake solutions.
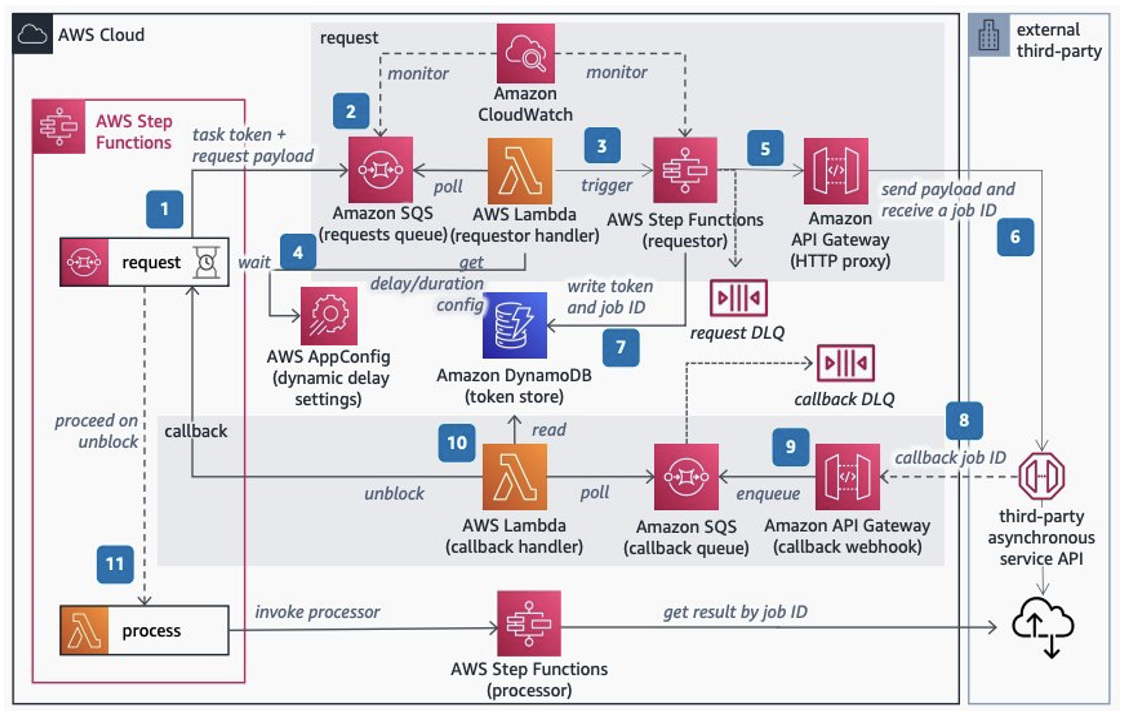


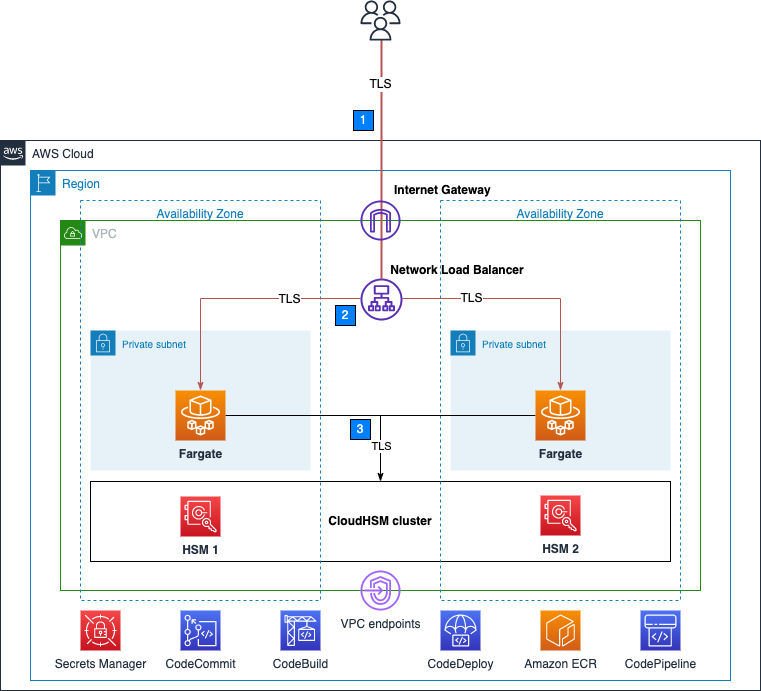


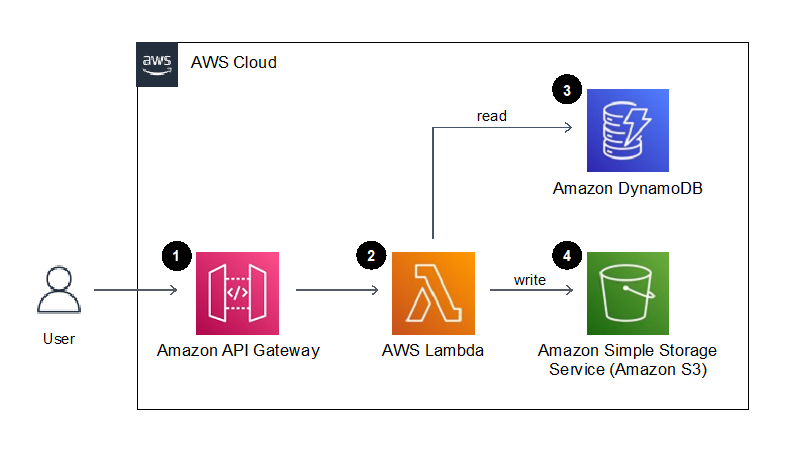


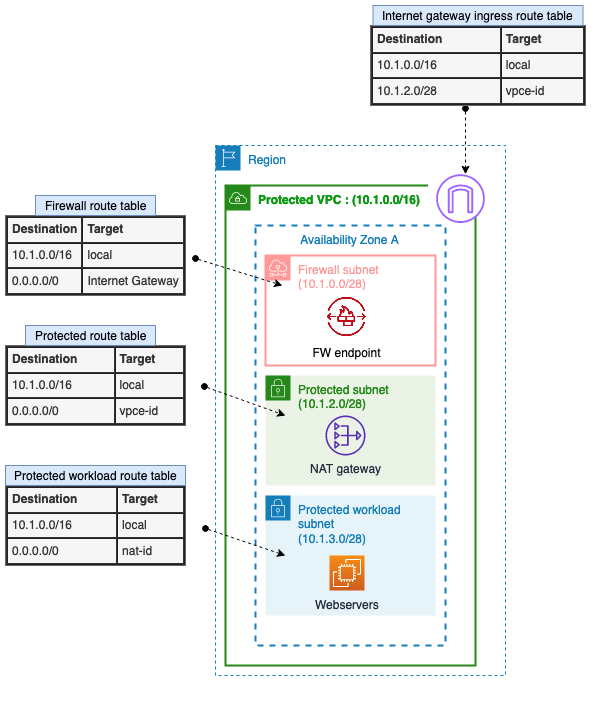

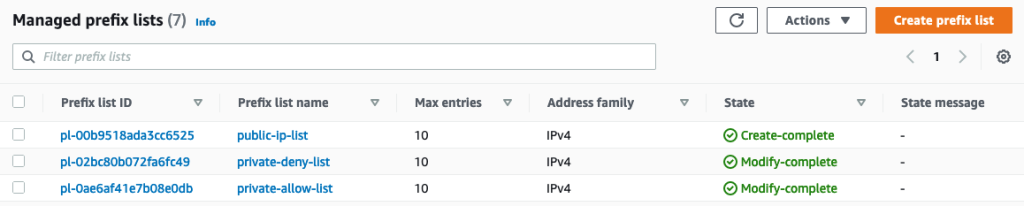


 Mahesh Pasupuleti is a VP of Data & Machine Learning Engineering at Poshmark. He has helped several startups succeed in different domains, including media streaming, healthcare, the financial sector, and marketplaces. He loves software engineering, building high performance teams, and strategy, and enjoys gardening and playing badminton in his free time.
 Gaurav Shah is Director of Data Engineering and ML at Poshmark. He and his team help build data-driven solutions to drive growth at Poshmark.
 Raghu Mannam is a Sr. Solutions Architect at AWS in San Francisco. He works closely with late-stage startups, many of which have had recent IPOs. His focus is end-to-end solutioning including security, DevOps automation, resilience, analytics, machine learning, and workload optimization in the cloud.
 Deepesh Malviya is Solutions Architect Manager on the AWS Data Lab team. He and his team help customers architect and build data, analytics, and machine learning solutions to accelerate their key initiatives as part of the AWS Data Lab.