Tag Archives: Best practices

Understanding Amazon Machine Images for Red Hat Enterprise Linux with Microsoft SQL Server

Post Syndicated from Emma White original https://aws.amazon.com/blogs/compute/understanding-amazon-machine-images-for-red-hat-enterprise-linux-with-microsoft-sql-server/

This post is written by Kumar Abhinav, Sr. Product Manager EC2, and David Duncan, Principal Solution Architect. 

Customers now have access to AWS license-included Amazon Machine Images (AMI) for hosting their SQL Server workloads with Red Hat Enterprise Linux (RHEL). With these AMIs, customers can easily build highly available, reliable, and performant Microsoft SQL Server 2017 and 2019 clusters with RHEL 7 and 8, with a simple pay-as-you-go pricing model that doesn’t require long-term commitments or upfront costs. By switching from Windows Server to RHEL to run SQL Server workloads, customers can reduce their operating system licensing costs and further lower total cost of ownership. This blog post provides a deep dive into how to deploy SQL Server on RHEL using these new AMIs, how to tune instances for performance, and how to reduce licensing costs with RHEL.

Overview

The RHEL AMIs with SQL Server are customized for the following editions of SQL Server 2019 or SQL Server 2017:

  • Express/Web Edition is an entry-level database for small web and mobile apps.
  • Standard Edition is a full-featured database designed for medium-sized applications and data marts.
  • Enterprise Edition is a mission-critical database built for high-performing, intelligent apps.

To maintain high availability (HA), you can bring the same HA configuration from an on-premises Enterprise Edition to AWS by combining SQL Server Availability Groups with the Red Hat Enterprise Linux HA add-on. The HA add-on provides a light-weight cluster management portfolio that runs across multiple AWS Availability Zones to eliminate single point of failure and deliver timely recovery when there is need.

These AMIs include all the software packages required to run SQL Server on RHEL along with the most recent updates and security patches. By removing some of the heavy lifting around deployment, you can deploy SQL Server instances faster to accommodate growth and service events.

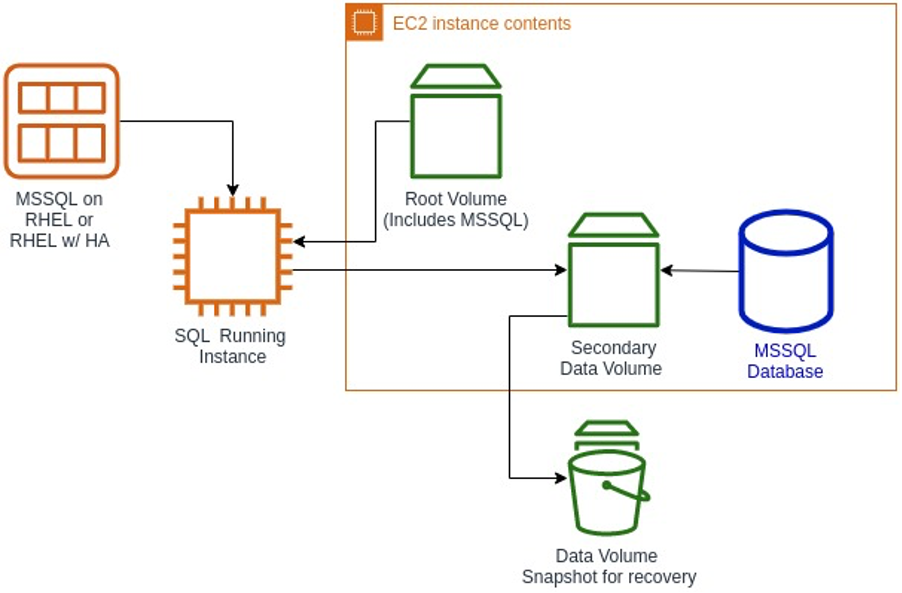
The following architecture diagram shows the necessary building blocks for SQL Server Enterprise HA configuration on RHEL.

instance configuration

To build the RHEL 7 and RHEL 8 AMIs, we focused on requirements from the Red Hat community of practice for SQL Server, which includes code, documentation, playbooks, and other artifacts relating to deployment of SQL Server on RHEL. We used Amazon EC2 Image Builder for installing and updating Microsoft SQL Server. For custom configuration or for installing any additional software, you can use the base machine image and extend it using EC2 Image Builder. If you have different, requirements, you can build your own images using the Red Hat Image Builder.

Tuning for virtual performance and compatibility with storage options

It is a common practice to apply pre-built performance profiles for SQL Server deployments when running on-premises. However, you do not need to apply the operating system performance tuning profiles for SQL Server to optimize the performance on Amazon EC2. The AMIs include the virtual-guest tuning from Red Hat along with additional optimizations for the EC2 environment. For example, the images include the timeout for NVMe IO operations set to the maximum possible value for an experience that is more consistent with the way EBS volumes are managed. Database administrators can further configure workload specific tuning parameters such as paging, swapping, and memory pressure using the Microsoft SQL Server performance best practices guidelines.

SQL Server availability groups help achieve HA and improve the read performance of your database cluster. However, this approach only improves availability at the database layer. RHEL with HA further improves the availability of a SQL Server cluster by providing service failover capabilities at the operating system layer. You can easily build a highly available database cluster as shown in the following figure by using the RHEL with SQL Server and HA add-on AMI on an instance of their choice in multiple Availability Zones.


High availability SQL Cluster built on top of RHEL HA

When it comes to storage, AWS offers many different choices. Amazon Elastic Block Storage (EBS) offers Provisioned IOPS volumes for specific performance requirements, where you know you need a specific level of performance required for the database operations. Provisioned IOPS are an excellent option when the general-purpose volume doesn’t meet your requirements of levels of I/O operations necessary for your production database. EBS volumes add the flexibility you need to increase your volume storage space size and performance through API calls. With Amazon EBS, you can also use additional data volumes directly attached to your instance or leverage multiple instance store volumes for performance targets. Volume IOPS are optimized to be sustainable even if they climb into the thousands, and your maximum IOPS does not decrease.

Storing data on secondary volumes improves performance of your database

Provisioning only one large root EBS volume for the database storage and sharing that with the operating system and any logging, management tools, or monitoring processes is not a well-architected solution. That shared activity reduces the bandwidth and operational performance of the database workloads. On the other hand, using practices like separating the database workloads onto separate EBS volumes or leveraging instance store volumes work well for use cases like storing a large number of temp tables. By separating the volumes by specialized activities, the performance of each component is independently manageable. Profile your utilization to choose the right combination of EBS and instance storage options for your workload.

Lower Total Cost of Ownership

Another benefit of using RHEL AMIs with SQL Server is cost savings. When you move from Windows Server to RHEL to run SQL Server, you can reduce the operating system licensing costs. Windows Server virtual machines are priced per core and hence you pay more for virtual machines with large numbers of cores. In other words, the more virtual machine cores you have, the more you pay in software license fees. On the other hand, RHEL has just two pricing tiers. One is for virtual machines with fewer than four cores and the other is for virtual machines with four cores or more. You pay the same operating system software subscription fees whether you choose a virtual machine with two or three virtual cores. Similarly, for larger workloads, your operating system software subscription costs are the same no matter whether you choose a virtual machine with eight or 16 virtual cores.

In addition, with the elasticity of EC2, you can save costs by sizing your starting workloads accordingly and later resizing your instances to prevent over provisioning compute resources when workloads experience uneven usage patterns, such as month end business reporting and batch programs. You can choose to use On-Demand Instances or use Savings Plans to build flexible pricing for long-term compute costs effectively. With AWS, you have the flexibility to right-size your instances and save costs without compromising business agility.

Conclusion

These new RHEL with SQL Server AMIs on Amazon EC2 are pre-configured and optimized to reduce undifferentiated heavy lifting. Customers can easily build highly available, reliable, and performant database clusters using RHEL with SQL Server along with the HA add-on and Provisioned IOPS EBS volumes. To get started, search for RHEL with SQL Server in the Amazon EC2 Console or find it in the AWS Marketplace. To learn more about Red Hat Enterprise Linux on EC2, check out the frequently asked questions page.


Deploy data lake ETL jobs using CDK Pipelines

Post Syndicated from Ravi Itha original https://aws.amazon.com/blogs/devops/deploying-data-lake-etl-jobs-using-cdk-pipelines/

Many organizations are building data lakes on AWS, which provides the most secure, scalable, comprehensive, and cost-effective portfolio of services. Like any application development project, a data lake must answer a fundamental question: “What is the DevOps strategy?” Defining a DevOps strategy for a data lake requires extensive planning and multiple teams. This typically requires multiple development and test cycles before maturing enough to support a data lake in a production environment. If an organization doesn’t have the right people, resources, and processes in place, this can quickly become daunting.

What if your data engineering team uses basic building blocks to encapsulate data lake infrastructure and data processing jobs? This is where CDK Pipelines brings the full benefit of infrastructure as code (IaC). CDK Pipelines is a high-level construct library within the AWS Cloud Development Kit (AWS CDK) that makes it easy to set up a continuous deployment pipeline for your AWS CDK applications. The AWS CDK provides essential automation for your release pipelines so that your development and operations team remain agile and focus on developing and delivering applications on the data lake.

In this post, we discuss a centralized deployment solution utilizing CDK Pipelines for data lakes. This implements a DevOps-driven data lake that delivers benefits such as continuous delivery of data lake infrastructure, data processing, and analytical jobs through a configuration-driven multi-account deployment strategy. Let’s dive in!

Data lakes on AWS

A data lake is a centralized repository where you can store all of your structured and unstructured data at any scale. Store your data as is, without having to first structure it, and run different types of analytics—from dashboards and visualizations to big data processing, real-time analytics, and machine learning in order to guide better decisions. To further explore data lakes, refer to What is a data lake?

We design a data lake with the following elements:

  • Secure data storage
  • Data cataloging in a central repository
  • Data movement
  • Data analysis

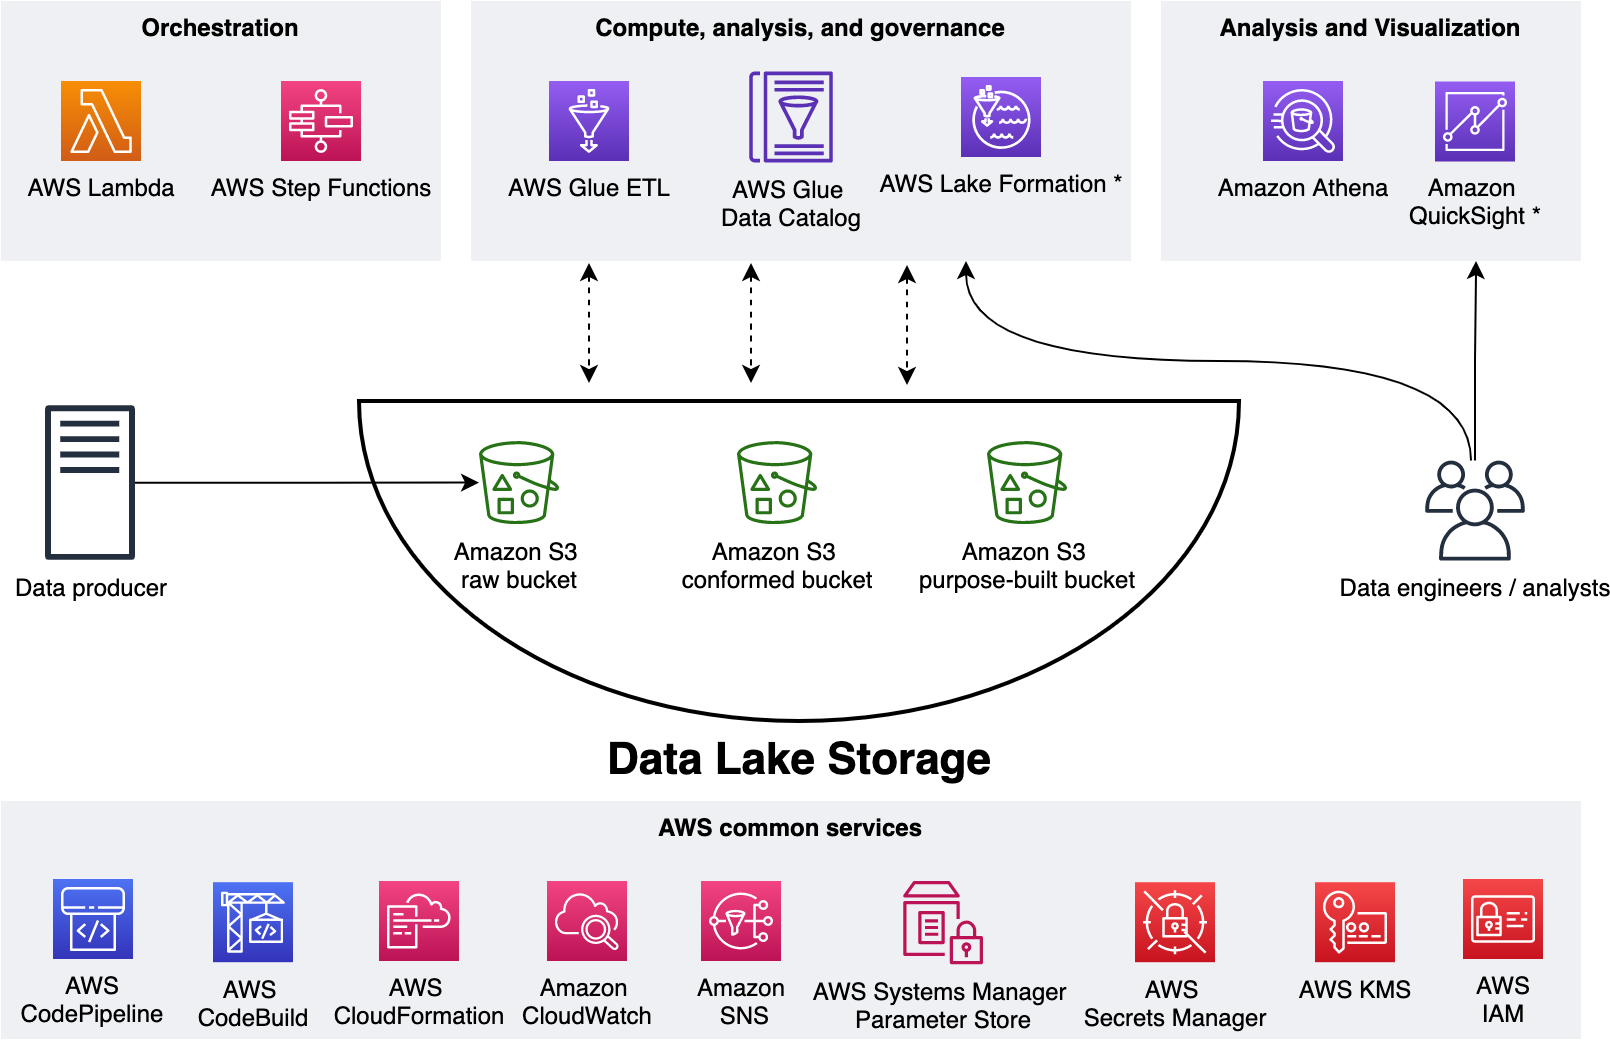
The following figure represents our data lake.

Data Lake on AWS

We use three Amazon Simple Storage Service (Amazon S3) buckets:

  • raw – Stores the input data in its original format
  • conformed – Stores the data that meets the data lake quality requirements
  • purpose-built – Stores the data that is ready for consumption by applications or data lake consumers

The data lake has a producer where we ingest data into the raw bucket at periodic intervals. We utilize the following tools: AWS Glue processes and analyzes the data. AWS Glue Data Catalog persists metadata in a central repository. AWS Lambda and AWS Step Functions schedule and orchestrate AWS Glue extract, transform, and load (ETL) jobs. Amazon Athena is used for interactive queries and analysis. Finally, we engage various AWS services for logging, monitoring, security, authentication, authorization, alerting, and notification.

A common data lake practice is to have multiple environments such as dev, test, and production. Applying the IaC principle for data lakes brings the benefit of consistent and repeatable runs across multiple environments, self-documenting infrastructure, and greater flexibility with resource management. The AWS CDK offers high-level constructs for use with all of our data lake resources. This simplifies usage and streamlines implementation.

Before exploring the implementation, let’s gain further scope of how we utilize our data lake.

The solution

Our goal is to implement a CI/CD solution that automates the provisioning of data lake infrastructure resources and deploys ETL jobs interactively. We accomplish this as follows: 1) applying separation of concerns (SoC) design principle to data lake infrastructure and ETL jobs via dedicated source code repositories, 2) a centralized deployment model utilizing CDK pipelines, and 3) AWS CDK enabled ETL pipelines from the start.

Data lake infrastructure

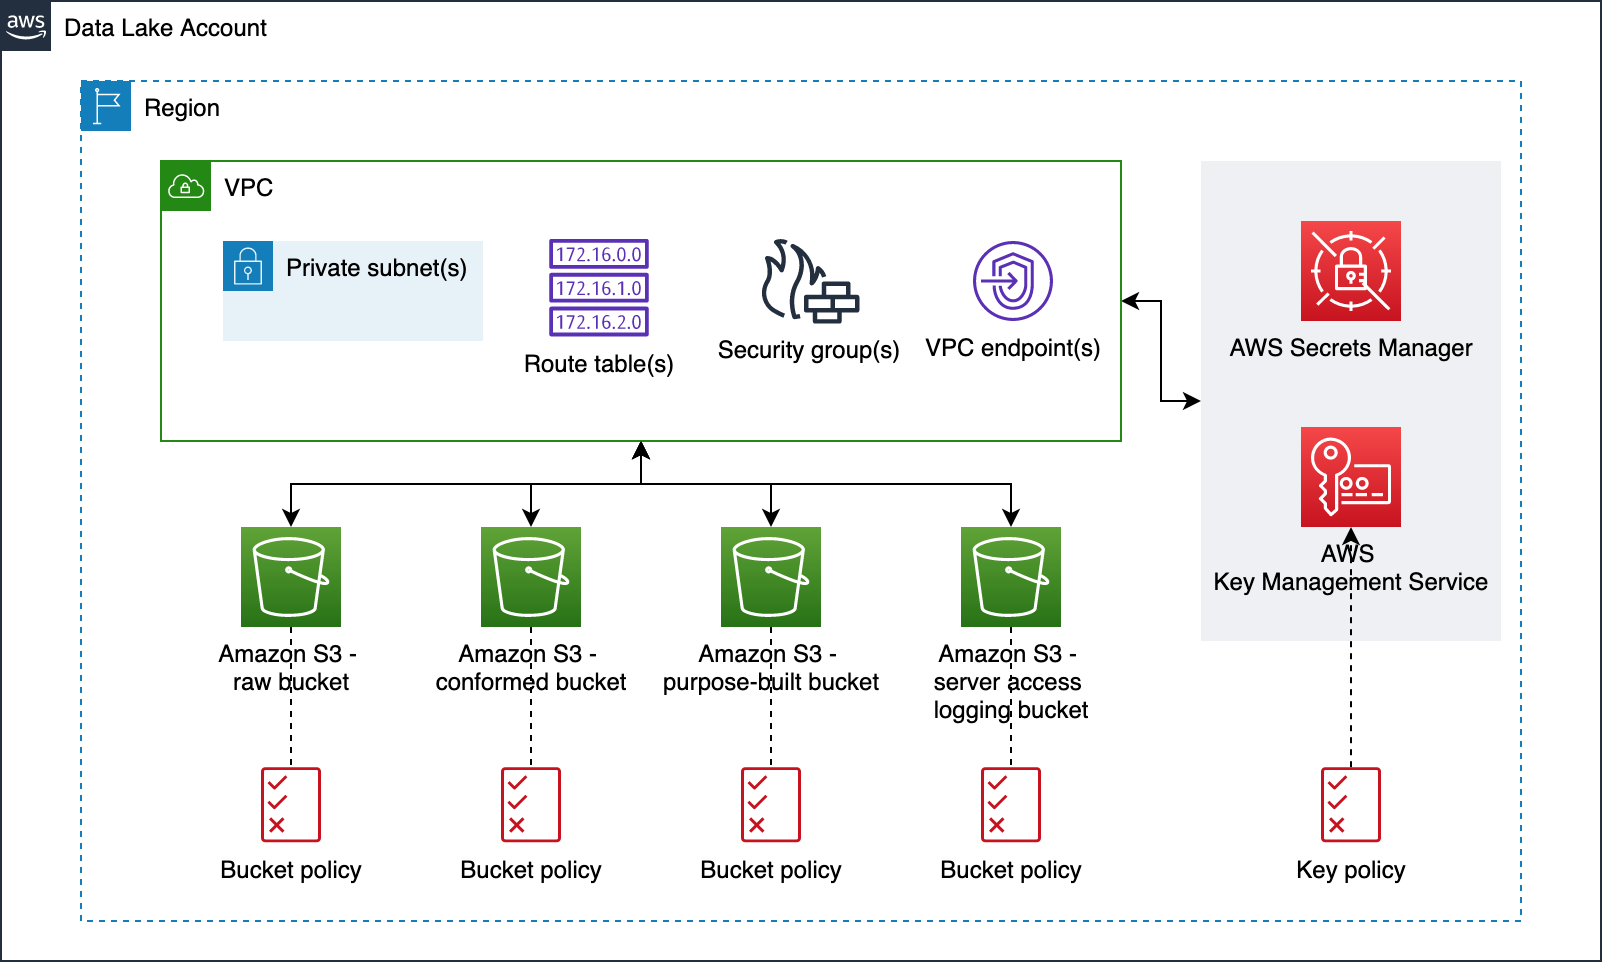
Our data lake infrastructure provisioning includes Amazon S3 buckets, S3 bucket policies, AWS Key Management Service (KMS) encryption keys, Amazon Virtual Private Cloud (Amazon VPC), subnets, route tables, security groups, VPC endpoints, and secrets in AWS Secrets Manager. The following diagram illustrates this.

Data Lake Infrastructure

Data lake ETL jobs

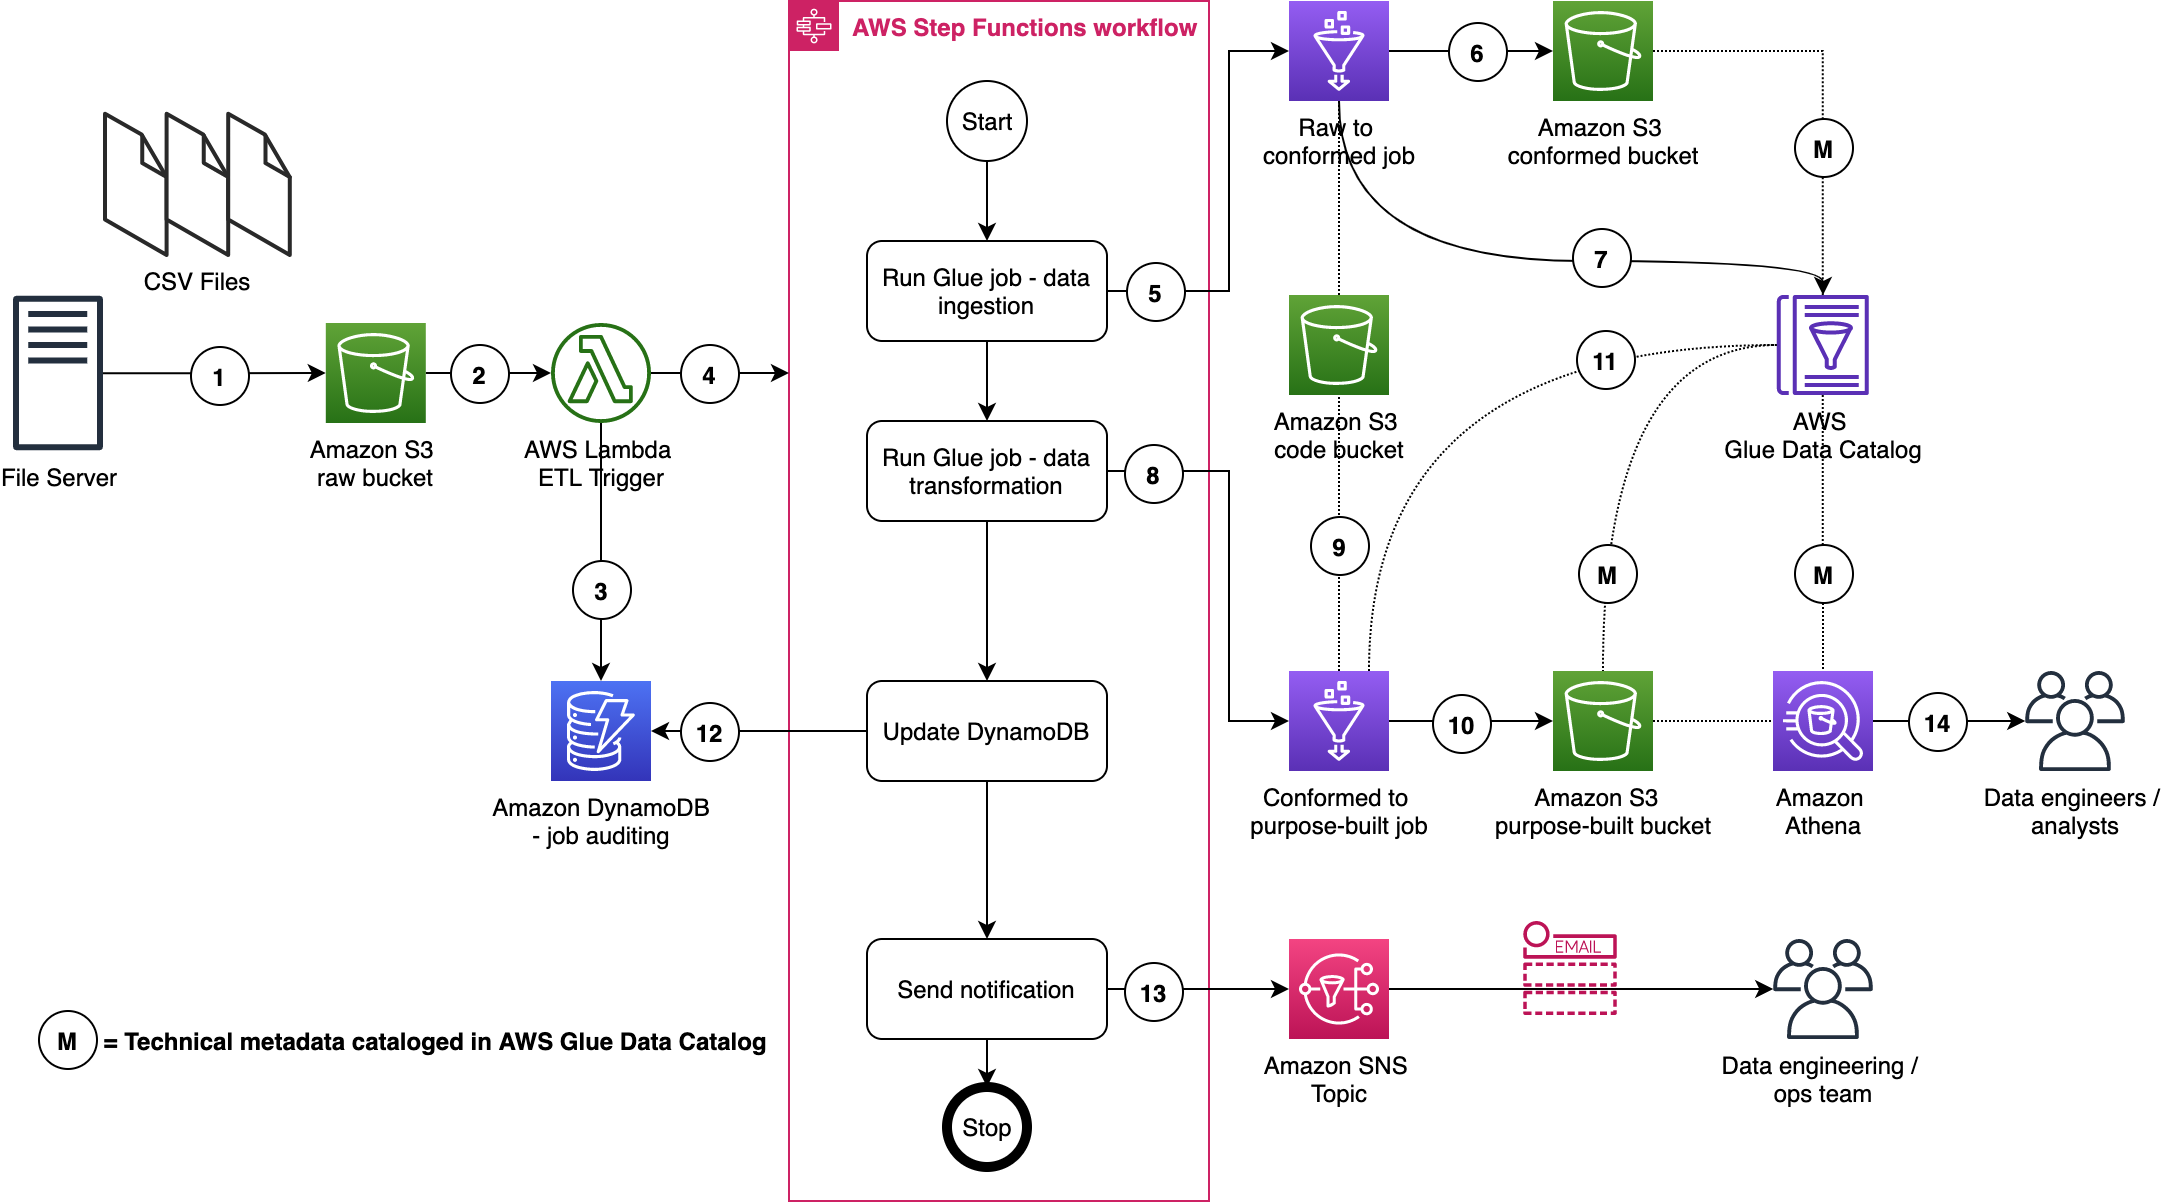
For our ETL jobs, we process New York City TLC Trip Record Data. The following figure displays our ETL process, wherein we run two ETL jobs within a Step Functions state machine.

AWS Glue ETL Jobs

Here are a few important details:

  1. A file server uploads files to the S3 raw bucket of the data lake. The file server is a data producer and source for the data lake. We assume that the data is pushed to the raw bucket.
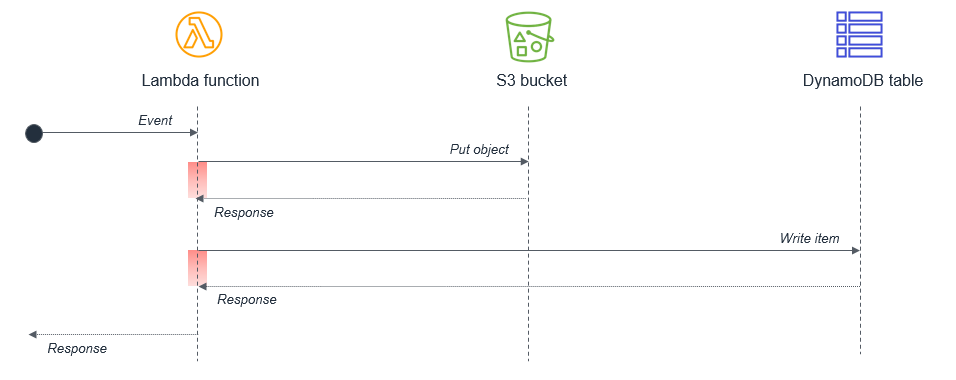
  2. Amazon S3 triggers an event notification to the Lambda function.
  3. The function inserts an item in the Amazon DynamoDB table in order to track the file processing state. The first state written indicates the AWS Step Function start.
  4. The function starts the state machine.
  5. The state machine runs an AWS Glue job (Apache Spark).
  6. The job processes input data from the raw zone to the data lake conformed zone. The job also converts CSV input data to Parquet formatted data.
  7. The job updates the Data Catalog table with the metadata of the conformed Parquet file.
  8. A second AWS Glue job (Apache Spark) processes the input data from the conformed zone to the purpose-built zone of the data lake.
  9. The job fetches ETL transformation rules from the Amazon S3 code bucket and transforms the input data.
  10. The job stores the result in Parquet format in the purpose-built zone.
  11. The job updates the Data Catalog table with the metadata of the purpose-built Parquet file.
  12. The job updates the DynamoDB table and updates the job status to completed.
  13. An Amazon Simple Notification Service (Amazon SNS) notification is sent to subscribers that states the job is complete.
  14. Data engineers or analysts can now analyze data via Athena.

We will discuss data formats, Glue jobs, ETL transformation logics, data cataloging, auditing, notification, orchestration, and data analysis in more detail in AWS CDK Pipelines for Data Lake ETL Deployment GitHub repository. This will be discussed in the subsequent section.

Centralized deployment

Now that we have data lake infrastructure and ETL jobs ready, let’s define our deployment model. This model is based on the following design principles:

  • A dedicated AWS account to run CDK pipelines.
  • One or more AWS accounts into which the data lake is deployed.
  • The data lake infrastructure has a dedicated source code repository. Typically, data lake infrastructure is a one-time deployment and rarely evolves. Therefore, a dedicated code repository provides a landing zone for your data lake.
  • Each ETL job has a dedicated source code repository. Each ETL job may have unique AWS service, orchestration, and configuration requirements. Therefore, a dedicated source code repository will help you more flexibly build, deploy, and maintain ETL jobs.

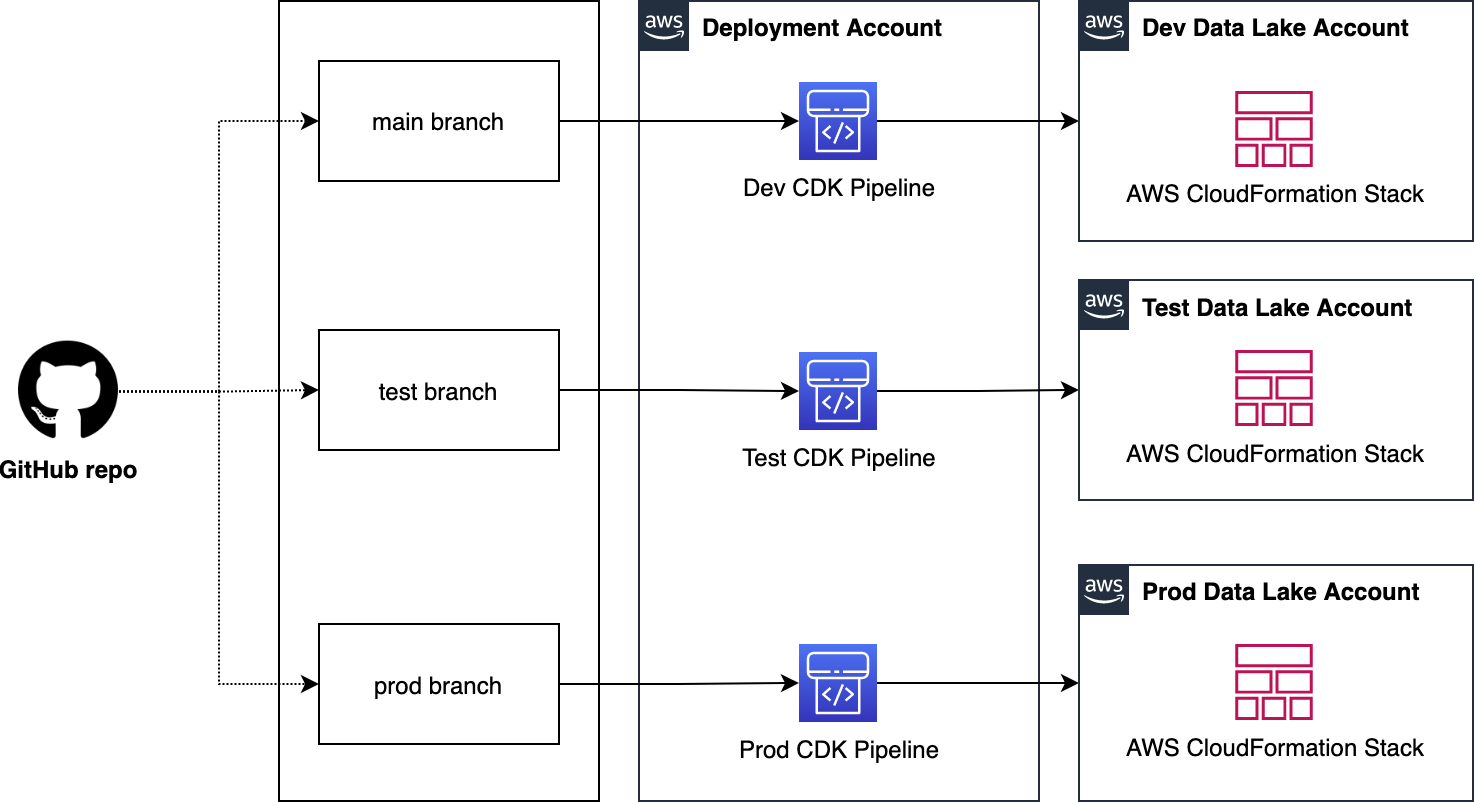
We organize our source code repo into three branches: dev (main), test, and prod. In the deployment account, we manage three separate CDK Pipelines and each pipeline is sourced from a dedicated branch. Here we choose a branch-based software development method in order to demonstrate the strategy in more complex scenarios where integration testing and validation layers require human intervention. As well, these may not immediately follow with a corresponding release or deployment due to their manual nature. This facilitates the propagation of changes through environments without blocking independent development priorities. We accomplish this by isolating resources across environments in the central deployment account, allowing for the independent management of each environment, and avoiding cross-contamination during each pipeline’s self-mutating updates. The following diagram illustrates this method.

Centralized deployment


Note: This centralized deployment strategy can be adopted for trunk-based software development with minimal solution modification.

Deploying data lake ETL jobs

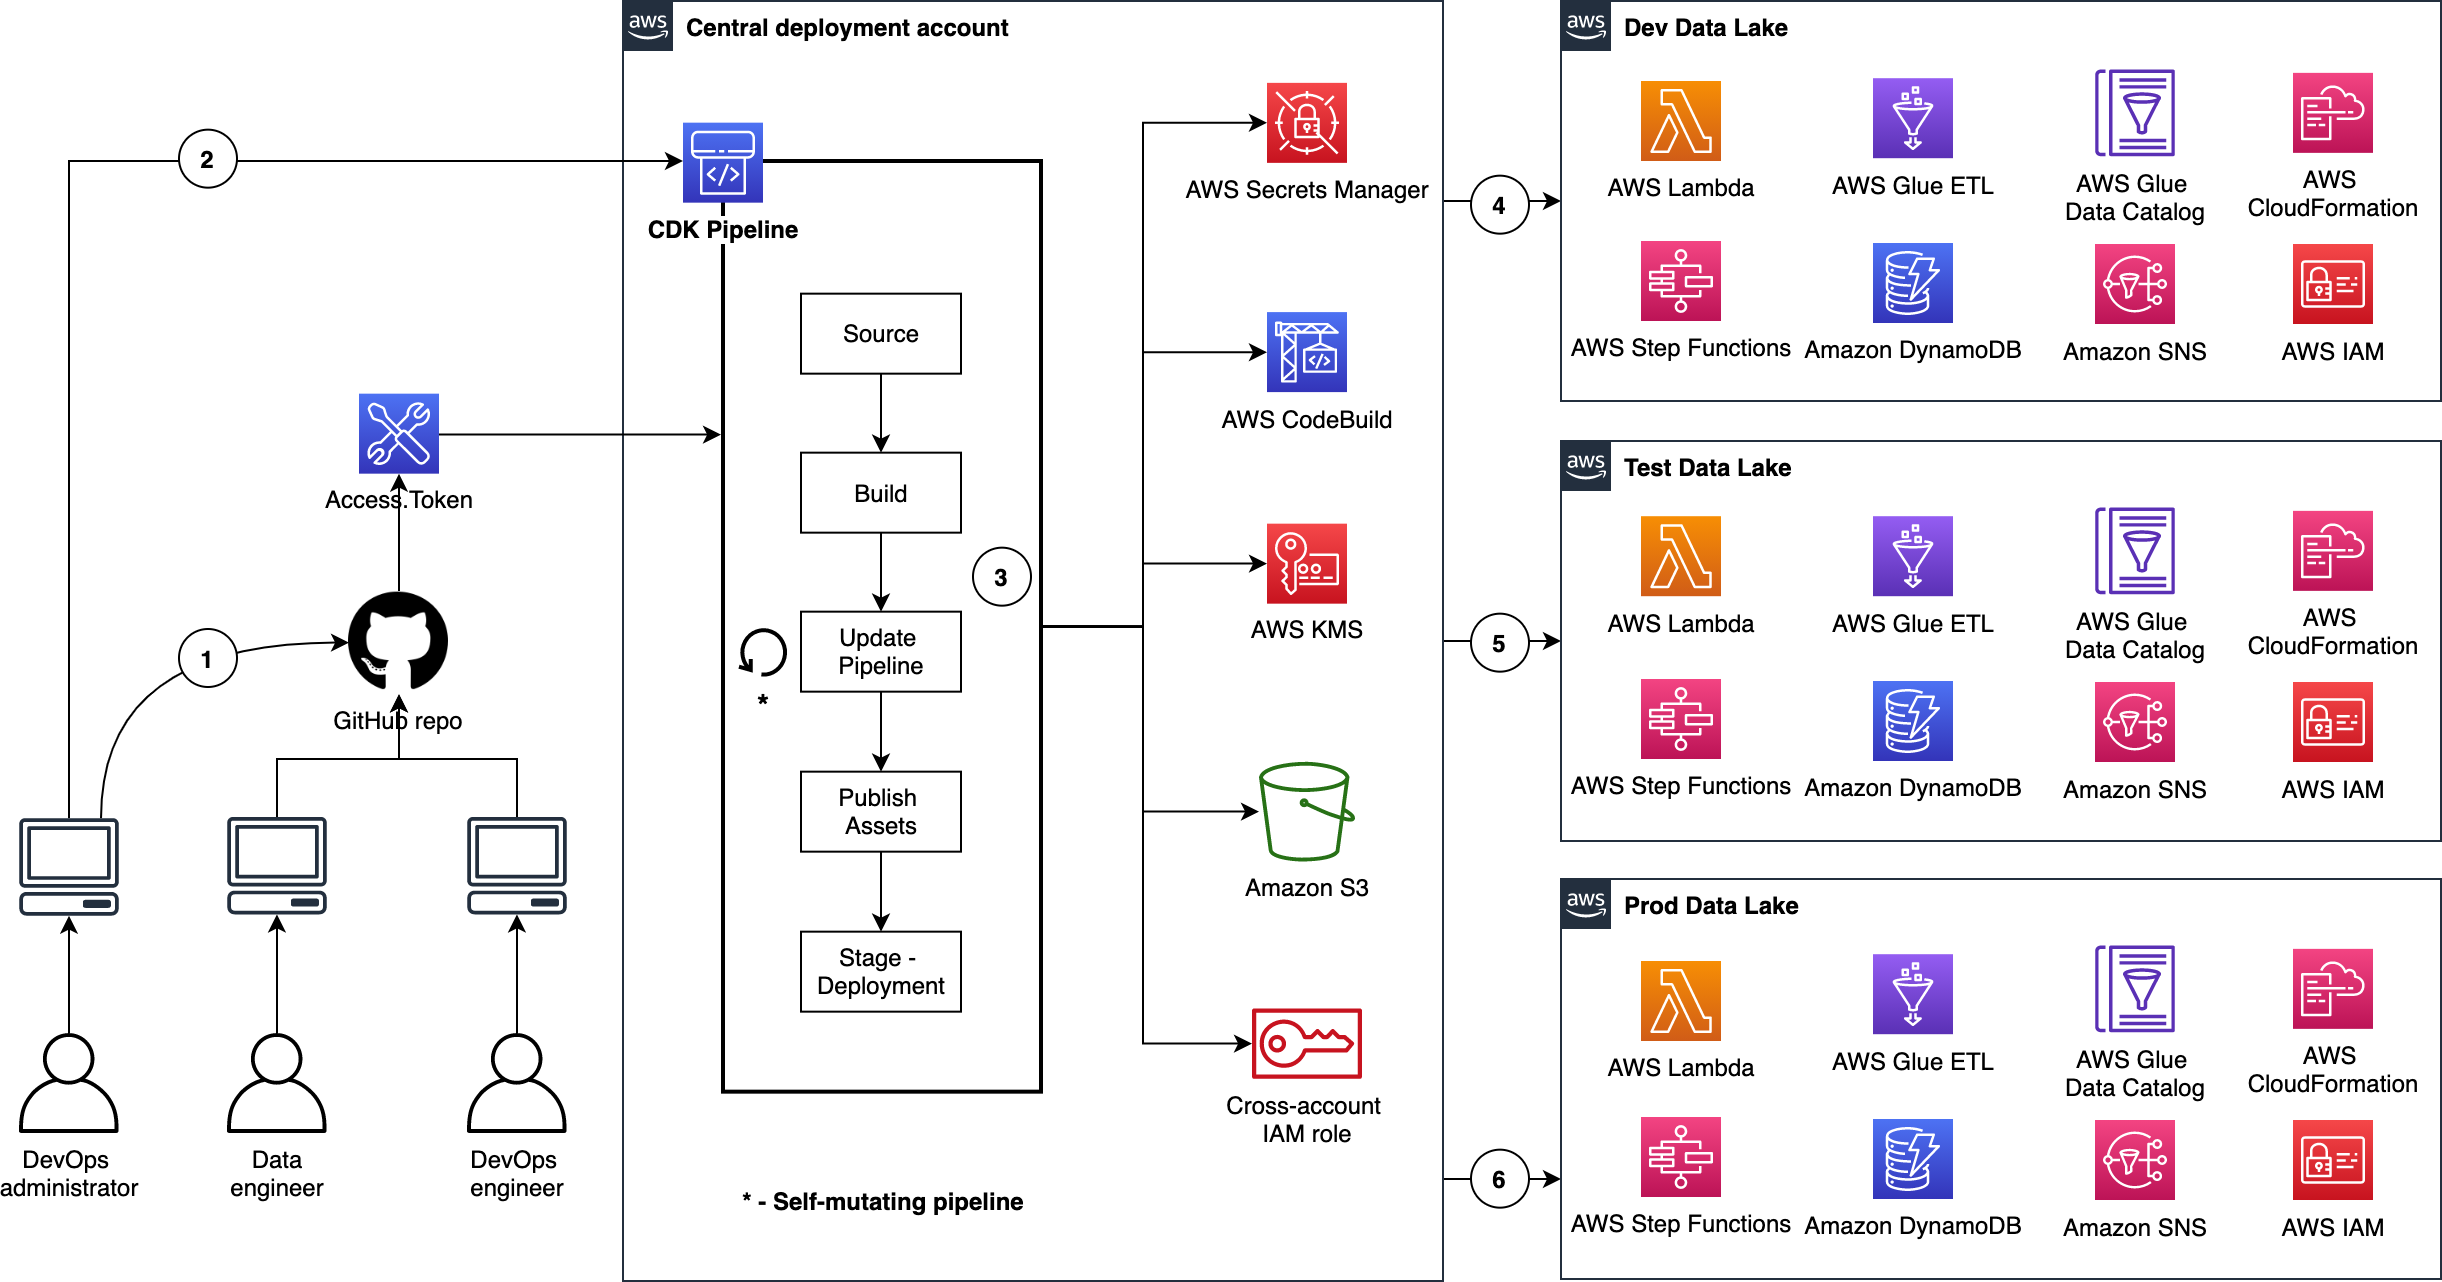
The following figure illustrates how we utilize CDK Pipelines to deploy data lake infrastructure and ETL jobs from a central deployment account. This model follows standard nomenclature from the AWS CDK. Each repository represents a cloud infrastructure code definition. This includes the pipelines construct definition. Pipelines have one or more actions, such as cloning the source code (source action) and synthesizing the stack into an AWS CloudFormation template (synth action). Each pipeline has one or more stages, such as testing and deploying. In an AWS CDK app context, the pipelines construct is a stack like any other stack. Therefore, when the AWS CDK app is deployed, a new pipeline is created in AWS CodePipeline.

This provides incredible flexibility regarding DevOps. In other words, as a developer with an understanding of AWS CDK APIs, you can harness the power and scalability of AWS services such as CodePipeline, AWS CodeBuild, and AWS CloudFormation.

Deploying data lake ETL jobs using CDK Pipelines

Here are a few important details:

  1. The DevOps administrator checks in the code to the repository.
  2. The DevOps administrator (with elevated access) facilitates a one-time manual deployment on a target environment. Elevated access includes administrative privileges on the central deployment account and target AWS environments.
  3. CodePipeline periodically listens to commit events on the source code repositories. This is the self-mutating nature of CodePipeline. It’s configured to work with and can update itself according to the provided definition.
  4. Code changes made to the main repo branch are automatically deployed to the data lake dev environment.
  5. Code changes to the repo test branch are automatically deployed to the test environment.
  6. Code changes to the repo prod branch are automatically deployed to the prod environment.

CDK Pipelines starter kits for data lakes

Want to get going quickly with CDK Pipelines for your data lake? Start by cloning our two GitHub repositories. Here is a summary:

AWS CDK Pipelines for Data Lake Infrastructure Deployment

This repository contains the following reusable resources:

  • CDK Application
  • CDK Pipelines stack
  • CDK Pipelines deploy stage
  • Amazon VPC stack
  • Amazon S3 stack

It also contains the following automation scripts:

  • AWS environments configuration
  • Deployment account bootstrapping
  • Target account bootstrapping
  • Account secrets configuration (e.g., GitHub access tokens)

AWS CDK Pipelines for Data Lake ETL Deployment

This repository contains the following reusable resources:

  • CDK Application
  • CDK Pipelines stack
  • CDK Pipelines deploy stage
  • Amazon DynamoDB stack
  • AWS Glue stack
  • AWS Step Functions stack

It also contains the following:

  • AWS Lambda scripts
  • AWS Glue scripts
  • AWS Step Functions State machine script

Advantages

This section summarizes some of the advantages offered by this solution.

Scalable and centralized deployment model

We utilize a scalable and centralized deployment model to deliver end-to-end automation. This allows DevOps and data engineers to use the single responsibility principal while maintaining precise control over the deployment strategy and code quality. The model can readily be expanded to more accounts, and the pipelines are responsive to custom controls within each environment, such as a production approval layer.

Configuration-driven deployment

Configuration in the source code and AWS Secrets Manager allow deployments to utilize targeted values that are declared globally in a single location. This provides consistent management of global configurations and dependencies such as resource names, AWS account Ids, Regions, and VPC CIDR ranges. Similarly, the CDK Pipelines export outputs from CloudFormation stacks for later consumption via other resources.

Repeatable and consistent deployment of new ETL jobs

Continuous integration and continuous delivery (CI/CD) pipelines allow teams to deploy to production more frequently. Code changes can be safely and securely propagated through environments and released for deployment. This allows rapid iteration on data processing jobs, and these jobs can be changed in isolation from pipeline changes, resulting in reliable workflows.

Cleaning up

You may delete the resources provisioned by utilizing the starter kits. You can do this by running the cdk destroy command using AWS CDK Toolkit. For detailed instructions, refer to the Clean up sections in the starter kit README files.

Conclusion

In this post, we showed how to utilize CDK Pipelines to deploy infrastructure and data processing ETL jobs of your data lake in dev, test, and production AWS environments. We provided two GitHub repositories for you to test and realize the full benefits of this solution first hand. We encourage you to fork the repositories, bring your ETL scripts, bootstrap your accounts, configure account parameters, and continuously delivery your data lake ETL jobs.

Let’s stay in touch via the GitHub—AWS CDK Pipelines for Data Lake Infrastructure Deployment and AWS CDK Pipelines for Data Lake ETL Deployment.


About the authors

Ravi Itha

Ravi Itha is a Sr. Data Architect at AWS. He works with customers to design and implement Data Lakes, Analytics, and Microservices on AWS. He is an open-source committer and has published more than a dozen solutions using AWS CDK, AWS Glue, AWS Lambda, AWS Step Functions, Amazon ECS, Amazon MQ, Amazon SQS, Amazon Kinesis Data Streams, and Amazon Kinesis Data Analytics for Apache Flink. His solutions can be found at his GitHub handle. Outside of work, he is passionate about books, cooking, movies, and yoga.


Isaiah Grant

Isaiah Grant is a Cloud Consultant at 2nd Watch. His primary function is to design architectures and build cloud-based applications and services. He leads customer engagements and helps customers with enterprise cloud adoptions. In his free time, he is engaged in local community initiatives and enjoys being outdoors with his family.


Zahid Ali

Zahid Ali is a Data Architect at AWS. He helps customers design, develop, and implement data warehouse and Data Lake solutions on AWS. Outside of work he enjoys playing tennis, spending time outdoors, and traveling.


Advanced Amazon Pinpoint Templates using Message Template Helpers

Post Syndicated from davelem original https://aws.amazon.com/blogs/messaging-and-targeting/advanced-amazon-pinpoint-templates-using-message-template-helpers/

Personalization of customer messages is a proven way to increase engagement of promotional and transactional communications. In order to make these communications repeatable and scalable, building personalization through templates is often required.

Using the Advanced Template Capabilities feature of Amazon Pinpoint, it’s now possible to create highly customized templates used for email, SMS, and Push Notifications.

Pinpoint templates are personalized using Handlebars.js. The new message template helpers are an expansion on the default Handlebars.js features. Please refer to handlebarsjs.com for more information on the default functionality of Handlebars.js

In this blog we will build an Order Confirmation template that will demonstrate a few helpers from each of the following categories:

Prerequisites

Before creating a template, you need to have an existing Amazon Pinpoint Project with the email channel enabled. The following will walk you through creating a project if you don’t already have one: Create and configure a Pinpoint Project

Architecture Overview

Step 1: Create a CSV file with sample Endpoint and Imported Segment

In Amazon Pinpoint, an endpoint represents a specific method of contacting a customer. This could be their email address (for email messages) or their phone number (for SMS messages) or a custom endpoint type. Endpoints can also contain custom attributes, and you can associate multiple endpoints with a single user. In this step, we create a simple CSV file which we will use to create a Segment in Pinpoint.

The data below contains the sample Order and Product data we will use in our Order Confirmation Email.

  1. Create a .CSV file named AdvancedTemplatesSegment.csv with the following data:
    ChannelType,Address,Id,Attributes.FirstName,Attributes.LastName,Attributes.OrderDate,Attributes.OrderNumber,Attributes.ProductNumber,Attributes.ProductNumber,Attributes.ProductNumber,Attributes.ProductNumber,Attributes.ProductNumber,Attributes.ProductName,Attributes.ProductName,Attributes.ProductName,Attributes.ProductName,Attributes.ProductName,Attributes.Amount,Attributes.Amount,Attributes.Amount,Attributes.Amount,Attributes.Amount,Attributes.ItemCount,Attributes.ItemCount,Attributes.ItemCount,Attributes.ItemCount,Attributes.ItemCount,Attributes.CLVTier,User.UserId,Metrics.Age
    EMAIL,[email protected],287b3858-3097-40e3-9af4-19bd4509a8f2,Mary,Smith,2021-01-15T18:07:13Z,460-ITS-2320,DWG8799598,XTC5517773,XRO7471152,EAT5122843,LNP9056489,non lectus aliquam,sapien placerat ante,semper sapien a libero nam dui,vitae consectetuer eget rutrum,nisl ut volutpat sapien arcu,68.88,32.89,53.19,45.38,47.31,20,76,33,15,53,High,66af7a81-77f2-485f-b115-d8c3a00f7077,84
    EMAIL,[email protected],b42e6c5f-3e15-4fdd-b61c-499508271082,,,2021-01-30T22:33:22Z,296-OZA-6579,VMC0637283,RGM6575767,BTM9430068,XCV9343127,GVU2858284,a libero nam dui,sit amet consectetuer adipiscing,at ipsum,ut dolor morbi,nullam molestie,74.86,83.18,15.42,97.03,37.42,13,94,50,54,84,Low,dadc1be9-daf4-46ce-9069-13565e03eaa0,61

    NOTE: The file above has a few attributes that are the key to personalizing our email and including multiple items in our Order Confirmation table:

    • Attributes.FirstName – This will allow us to personalize with a salutation if available.
    • Attributes.CLVTier – This is an attribute that could be specified from a Machine Learning model to determine the customers CLV Tier. We will be using it to provide coupons specific to a given CLV Tier. See Predictive Segmentation Using Amazon Pinpoint and Amazon SageMaker for an example solution that demonstrates using Machine Learning to analyze information in Pinpoint.
    • Attributes.ProductNumber – Note that we have multiple columns that repeat for the product information in the order.  Pinpoint attributes are actually stored as a list, so if you pass multiple columns with the same name it will add items to the attribute list.This is the key to how we are able to display a table of information, but note that it does require making sure the attributes are aligned in the proper columns. For example, Attributes.ProductNumber[0] needs to align with Attributes.ProductName[0]See Using variables with message template helpers for more details.
  2. Search for [email protected] above and replace with two valid email addresses. Note that if your account is still in the sandbox these will need to be verified email addresses. If you only have access to a single email address you can use labels by adding a plus sign (+) followed by a string of text after the local part of the address and before the at (@) sign. For example: [email protected] and [email protected]
  3. Create a Pinpoint Segment
    1. Open the Amazon Pinpoint console at http://console.aws.amazon.com/pinpoint, and then choose the project that you created as part of the Prerequisites.
    2. In the navigation pane, choose Segments, and then choose Create a segment.
    3. Select Import a Segment.
    4. Browse to or Drag and Drop the .CSV file you created in the previous step.
    5. Use the default Segment Name and select Create Segment.

Step 2: Build The Message Template

  1. Open the Amazon Pinpoint console at http://console.aws.amazon.com/pinpoint.
  2. In the navigation pane, choose Message templates, and then choose Create template.
  3. Select Email as the Channel.
  4. For Template name use: AdvancedTemplateExample.
  5. For Subject use: AdvancedTemplateExample.
  6. Paste the following code into the HTML Editor. We will take some time later on to dig into the specific Handlebars helpers:
    {{#* inline "salutation"}}
        {{#if Attributes.FirstName.[0]}}
            Dear {{Attributes.FirstName.[0]}},<br />
        {{else}}
            Dear Valued Customer,<br />
        {{/if}}
    {{/inline}}
    
    {{#* inline "clvcoupon"}}
        {{#if Attributes.CLVTier.[0]}}
            {{#eq Attributes.CLVTier.[0] "High"}}
                As a thank-you for your continued support, please use this coupon code for <strong>30%</strong> off your next order: <strong>WELOVEYOU30</strong>
            {{/eq}}
        {{/if}}
    {{/inline}}
    
    {{#* inline "footer"}}
        <hr />	
        Accent Athletics - 1234 Anywhere Ave, Anywhere USA, 12345 - <a href="https://www.example.com/preferences/index.html?pid={{ApplicationId}}&uid={{User.UserId}}&h={{sha256 (join User.UserId "d67c37ed538b751d850de18" "+" prefix="" suffix="")}}">Manage Preferences</a>
        <hr />
    {{/inline}}
    
    
    <!DOCTYPE html>
        <html lang="en">
        <head>
        <meta http-equiv="Content-Type" content="text/html; charset=utf-8" />
    </head>
    <body>
      {{> salutation}}
      Thank-you for your order! {{> clvcoupon}}<br /><br />
      Order Date: {{now format="d MMM yyyy HH:mm:ss" tz=America/Los_Angeles}}<br /><br />
      <table>
      <thead>
        <tr style="background-color: #f2f2f2;">
          <th style="text-align:left; width:75px">
            Product #
          </th>
          <th style="text-align:left; width:200px;">
            Name
          </th>
          <th style="text-align:center; width:75px;">
            Count
          </th>
          <th style="text-align:center; width:75px;">
            Amount
          </th>
        </tr>
      </thead>
      <tbody>
      {{#each Attributes.ProductNumber}}
        {{#eq (modulo @index 2) "1.0"}}
            <tr style="background-color: #f2f2f2;">
        {{else}}
            <tr>
        {{/eq}}
          <td style="text-align:left;">{{this}}</td>
          <td style="text-align:left;">{{#with (lookup ../Attributes.ProductName @index)}}{{this}}{{/with}}</td>
          <td style="text-align:center;">{{#with (lookup ../Attributes.ItemCount @index)}}{{this}}{{/with}}</td>
          <td style="text-align:center;">${{#with (lookup ../Attributes.Amount @index)}}{{this}}{{/with}}</td>
        </tr>
      {{else}}
        <tr>
          <td style="text-align:left;">{{Attributes.ProductNumber}}</td>
          <td style="text-align:center;">{{Attributes.ProductName}}</td>
          <td style="text-align:center;">{{Attributes.ItemCount}}</td>
          <td style="text-align:center;">{{Attributes.Amount}}</td>
        </tr>
      {{/each}}
      </tbody>
      </table>
      {{> footer}}
    </body>
    </html>

  7. Click Create to finish creating your template

Step 3: Create an Amazon Pinpoint Campaign

By sending a campaign, we can verify that our Amazon Pinpoint project is configured correctly, and that we created the segment and template correctly.

To create the segment and campaign:

  1. Open the Amazon Pinpoint console at http://console.aws.amazon.com/pinpoint, and then choose the project that you created in step 1.
  2. In the navigation pane, choose Campaigns, and then choose Create a campaign.
  3. Name the campaign “AdvancedTemplateTest.” Under Choose a channel for this campaign, choose Email, and then choose Next.
  4. On the Choose a segment page, choose the “AdvancedTemplateExample” segment that you just created, and then choose Next.
  5. In Create your message, choose the template we just created, ‘AdvancedTemplateExample. Note: You will see an Alert with: “This template contains a reference to an attribute from another project…” This is expected as Pinpoint is scanning the template for attributes allowing you to specify default values in case the endpoint doesn’t contain a value for the attribute. In this blog post we are using the {{#if}} conditional helper to handle any missing data, i.e. {{#if Attributes.FirstName.[0]}}
  6. On the Choose when to send the campaign page, keep all of the default values, and then choose Next.
  7. On the Review and launch page, choose Launch campaign.

Within a few seconds, you should receive an email:

So what just happened?

Let’s take a deeper dive at each of helpers we included in the template:

{{#* inline "salutation"}}
    {{#if Attributes.FirstName.[0]}}
        Dear {{Attributes.FirstName.[0]}},<br /><br />
    {{else}}
        Dear Valued Customer,<br /><br />
    {{/if}}
{{/inline}}

First you will notice that we are making use of Inline Partials. Using Inline Partials allows you to build a library of frequently used snippets of content. In this case we frequently use a salutation in our communications. You can build and maintain your own frequently used snippets and include them at the beginning of the template.

Later in the message we can simply include: {{> salutation}} to include a salutation in our email.

In this example we also see the {{#if}} helper which is used to evaluate if a first name is available on the endpoint. If the name is found, a greeting is returned that passes the user’s first name in the response. Otherwise, the else statement returns an alternative greeting.

{{#* inline "clvcoupon"}}
    {{#if Attributes.CLVTier.[0]}}
        {{#eq Attributes.CLVTier.[0] "High"}}
            As a thank-you for your continued support, please use this coupon code for <strong>30%</strong> off your next order: <strong>WELOVEYOU30</strong>
        {{/eq}}
    {{/if}}
{{/inline}}

Again, we are using Inline Partials to organize our code. Additionally we are using {{#if}} to see if the user has a CLVTier attribute and if so, we use the {{#eq}} conditional helper to see if their CLVTier is “High” as we only want this coupon to display for customers that fall into that tier.

Note that CLVTier is an attribute that is populated along with the Endpoint when we created the Segment above. You could also use a solution such as Predictive Segmentation using Amazon Pinpoint and Amazon SageMaker to incorporate Machine Learning to classify your existing users.

{{#* inline "footer"}}
    <hr />
    Accent Athletics - 1234 Anywhere Ave, Anywhere USA, 12345 - <a href="https://www.example.com/preferences/index.html?pid={{ApplicationId}}&uid={{User.UserId}}&h={{sha256 (join User.UserId "d67c37ed538b751d850de18" "+" prefix="" suffix="")}}">Manage Preferences</a>
    <hr />
{{/inline}}

In the example above we are using the {{sha256}} and {{join}} helpers to create a secure link to the Preference Center deployed as part of the Amazon Pinpoint Preference Center solution.

{{> salutation}}
Thank-you for your order! {{> clvcoupon}}<br /><br /><hr />
Order Date: {{now format="d MMM yyyy HH:mm:ss" tz=America/Los_Angeles}}<br /><br />

This is where all of our hard work implementing Inline Partials really starts to pay off. To include our salutation and coupon we simply need to specify: {{> salutation}} and {{> clvcoupon}}

The {{now}} string helper allows us to display the current date and time in the format of our choosing. Please reference the following for more details on the date pattern and available timezones:

<tbody>
{{#each Attributes.ProductNumber}}
{{#eq (modulo @index 2) "1.0"}}
    		<tr style="background-color: #f2f2f2;">
{{else}}
    		<tr>
{{/eq}}
    	<td style="text-align:left;">{{this}}</td>
    	<td style="text-align:left;">{{#with (lookup ../Attributes.ProductName @index)}}{{this}}{{/with}}</td>
    	<td style="text-align:center;">{{#with (lookup ../Attributes.ItemCount @index)}}{{this}}{{/with}}</td>
    	<td style="text-align:center;">${{#with (lookup ../Attributes.Amount @index)}}{{this}}{{/with}}</td>
</tr>
{{else}}
<tr>
    		<td style="text-align:left;">{{Attributes.ProductNumber}}</td>
    		<td style="text-align:center;">{{Attributes.ProductName}}</td>
    		<td style="text-align:center;">{{Attributes.ItemCount}}</td>
    		<td style="text-align:center;">{{Attributes.Amount}}</td>
</tr>
{{/each}}
</tbody>

This particular section has a lot going on. We will break each part down for further explanation:

  • {{#each}} – Allows us to loop through each of the values in our attribute. In this case our ProductNumber attribute will contain: [“order#1”, “order#2”,”order#3, etc.]
    Note that if you only have one item in the attribute array. Pinpoint will simplify that into a single string attribute. That is why we have the {{each}} part of the {{#else}} statement. This allows us to reference the attribute as a single string in case we don’t have a collection of values in the attribute.
  • {{#eq (modulo @index 2) “1.0”}} – In order to alternate our background color for even/odd rows, we are making use of the {{modulo}} operator from the Math and encoding helpers which will return the remainder of two given numbers allowing us to determine if this is an odd or even row.
    @index is a native Handlebars.js property that contains the current index we are on in the loop.
  • {{this}} – When iterating through a collection using {{#each}}, {{this}} allows you to reference the current item in the collection
  • {{#with (lookup ../Attributes.ProductName @index)}}{{this}}{{/with}}Lookup is a built-in handlebars helper that allows us to find values in another collection. We are using the index combined with lookup to find the Product Name that goes along with the Product Number we are currently on. The same pattern is used for the remaining columns of the table.The ability to lookup values in another attribute collection is the key to how we are able to display a table of information, but note that it does require making sure the attributes are aligned in the proper columns. For example, Attributes.ProductNumber[0] needs to align with Attributes.ProductName[0]See Using variables with message template helpers for more details.
{{> footer}}

And just to wrap things up, let’s pull in the footer we defined with Inline Partials.

Next Steps

Using the techniques above, you can create sophisticated and personalized communications using Amazon Pinpoint.

Think about your existing communications to see if you can use personalization to increase customer engagement for your promotional and transactional messages.

Amazon Pinpoint is a flexible and scalable outbound and inbound marketing communications service. Learn more here: https://aws.amazon.com/pinpoint/

Optimizing EC2 Workloads with Amazon CloudWatch

Post Syndicated from Emma White original https://aws.amazon.com/blogs/compute/optimizing-ec2-workloads-with-amazon-cloudwatch/

This post is written by David (Dudu) Twizer, Principal Solutions Architect, and Andy Ward, Senior AWS Solutions Architect – Microsoft Tech.

In December 2020, AWS announced the availability of gp3, the next-generation General Purpose SSD volumes for Amazon Elastic Block Store (Amazon EBS), which allow customers to provision performance independent of storage capacity and provide up to a 20% lower price-point per GB than existing volumes.

This new release provides an excellent opportunity to right-size your storage layer by leveraging AWS’ built-in monitoring capabilities. This is especially important with SQL workloads as there are many instance types and storage configurations you can select for your SQL Server on AWS.

Many customers ask for our advice on choosing the ‘best’ or the ‘right’ storage and instance configuration, but there is no one solution that fits all circumstances. This blog post covers the critical techniques to right-size your workloads. We focus on right-sizing a SQL Server as our example workload, but the techniques we will demonstrate apply equally to any Amazon EC2 instance running any operating system or workload.

We create and use an Amazon CloudWatch dashboard to highlight any limits and bottlenecks within our example instance. Using our dashboard, we can ensure that we are using the right instance type and size, and the right storage volume configuration. The dimensions we look into are EC2 Network throughput, Amazon EBS throughput and IOPS, and the relationship between instance size and Amazon EBS performance.


The Dashboard

It can be challenging to locate every relevant resource limit and configure appropriate monitoring. To simplify this task, we wrote a simple Python script that creates a CloudWatch Dashboard with the relevant metrics pre-selected.

The script takes an instance-id list as input, and it creates a dashboard with all of the relevant metrics. The script also creates horizontal annotations on each graph to indicate the maximums for the configured metric. For example, for an Amazon EBS IOPS metric, the annotation shows the Maximum IOPS. This helps us identify bottlenecks.

Please take a moment now to run the script using either of the following methods described. Then, we run through the created dashboard and each widget, and guide you through the optimization steps that will allow you to increase performance and decrease cost for your workload.


Creating the Dashboard with CloudShell

First, we log in to the AWS Management Console and load AWS CloudShell.

Once we have logged in to CloudShell, we must set up our environment using the following command:

# Download the script locally
wget -L https://raw.githubusercontent.com/aws-samples/amazon-ec2-mssql-workshop/master/resources/code/Monitoring/create-cw-dashboard.py

# Prerequisites (venv and boto3)
python3 -m venv env # Optional
source env/bin/activate  # Optional
pip3 install boto3 # Required

The commands preceding download the script and configure the CloudShell environment with the correct Python settings to run our script. Run the following command to create the CloudWatch Dashboard.

# Execute
python3 create-cw-dashboard.py --InstanceList i-example1 i-example2 --region eu-west-1

At its most basic, you just must specify the list of instances you are interested in (i-example1 and i-example2 in the preceding example), and the Region within which those instances are running (eu-west1 in the preceding example). For detailed usage instructions see the README file here. A link to the CloudWatch Dashboard is provided in the output from the command.


Creating the Dashboard Directly from your Local Machine

If you’re familiar with running the AWS CLI locally, and have Python and the other pre-requisites installed, then you can run the same commands as in the preceding CloudShell example, but from your local environment. For detailed usage instructions see the README file here. If you run into any issues, we recommend running the script from CloudShell as described prior.


Examining Our Metrics


Once the script has run, navigate to the CloudWatch Dashboard that has been created. A direct link to the CloudWatch Dashboard is provided as an output of the script. Alternatively, you can navigate to CloudWatch within the AWS Management Console, and select the Dashboards menu item to access the newly created CloudWatch Dashboard.

The Network Layer

The first widget of the CloudWatch Dashboard is the EC2 Network throughput:

The automatic annotation creates a red line that indicates the maximum throughput your Instance can provide in Mbps (Megabits per second). This metric is important when running workloads with high network throughput requirements. For our SQL Server example, this has additional relevance when considering adding replica Instances for SQL Server, which place an additional burden on the Instance’s network.


In general, if your Instance is frequently reaching 80% of this maximum, you should consider choosing an Instance with greater network throughput. For our SQL example, we could consider changing our architecture to minimize network usage. For example, if we were using an “Always On Availability Group” spread across multiple Availability Zones and/or Regions, then we could consider using an “Always On Distributed Availability Group” to reduce the amount of replication traffic. Before making a change of this nature, take some time to consider any SQL licensing implications.


If your Instance generally doesn’t pass 10% network utilization, the metric is indicating that networking is not a bottleneck. For SQL, if you have low network utilization coupled with high Amazon EBS throughput utilization, you should consider optimizing the Instance’s storage usage by offloading some Amazon EBS usage onto networking – for example by implementing SQL as a Failover Cluster Instance with shared storage on Amazon FSx for Windows File Server, or by moving SQL backup storage on to Amazon FSx.

The Storage Layer

The second widget of the CloudWatch Dashboard is the overall EC2 to Amazon EBS throughput, which means the sum of all the attached EBS volumes’ throughput.

Each Instance type and size has a different Amazon EBS Throughput, and the script automatically annotates the graph based on the specs of your instance. You might notice that this metric is heavily utilized when analyzing SQL workloads, which are usually considered to be storage-heavy workloads.

If you find data points that reach the maximum, such as in the preceding screenshot, this indicates that your workload has a bottleneck in the storage layer. Let’s see if we can find the EBS volume that is using all this throughput in our next series of widgets, which focus on individual EBS volumes.

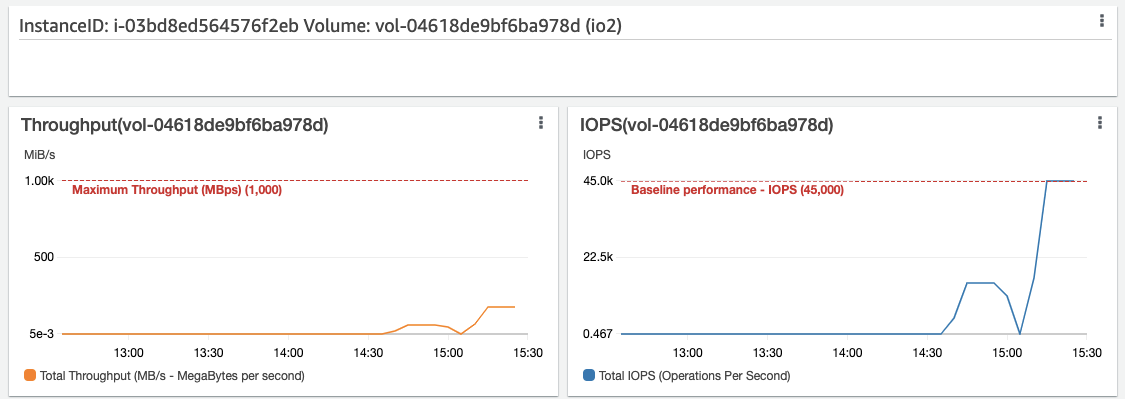
And here is the culprit. From the widget, we can see the volume ID and type, and the performance maximum for this volume. Each graph represents one of the two dimensions of the EBS volume: throughput and IOPS. The automatic annotation gives you visibility into the limits of the specific volume in use. In this case, we are using a gp3 volume, configured with a 750-MBps throughput maximum and 3000 IOPS.

Looking at the widget, we can see that the throughput reaches certain peaks, but they are less than the configured maximum. Considering the preceding screenshot, which shows that the overall instance Amazon EBS throughput is reaching maximum, we can conclude that the gp3 volume here is unable to reach its maximum performance. This is because the Instance we are using does not have sufficient overall throughput.

Let’s change the Instance size so that we can see if that fixes our issue. When changing Instance or volume types and sizes, remember to re-run the dashboard creation script to update the thresholds. We recommend using the same script parameters, as re-running the script with the same parameters overwrites the initial dashboard and updates the threshold annotations – the metrics data will be preserved.  Running the script with a different dashboard name parameter creates a new dashboard and leaves the original dashboard in place. However, the thresholds in the original dashboard won’t be updated, which can lead to confusion.

Here is the widget for our EBS volume after we increased the size of the Instance:

We can see that the EBS volume is now able to reach its configured maximums without issue. Let’s look at the overall Amazon EBS throughput for our larger Instance as well:

We can see that the Instance now has sufficient Amazon EBS throughput to support our gp3 volume’s configured performance, and we have some headroom.

Now, let’s swap our Instance back to its original size, and swap our gp3 volume for a Provisioned IOPS io2 volume with 45,000 IOPS, and re-run our script to update the dashboard. Running an IOPS intensive task on the volume results in the following:

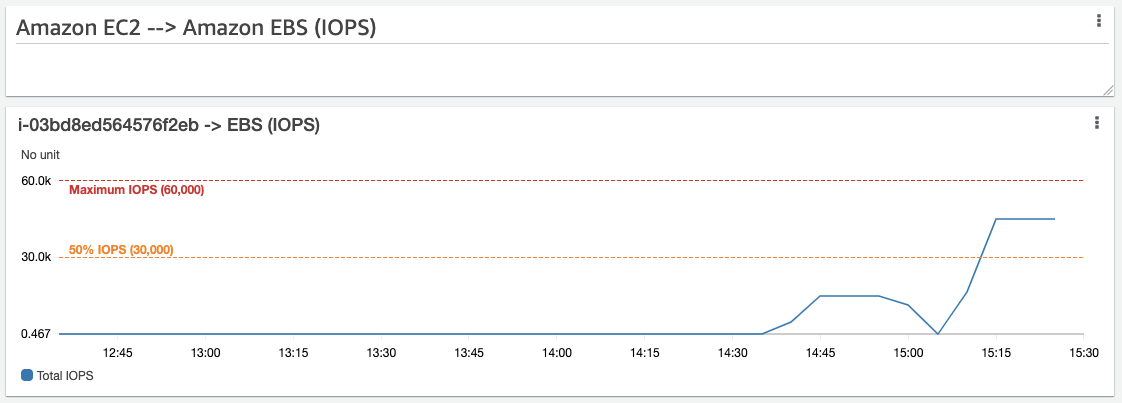
As you can see, despite having 45,000 IOPS configured, it seems to be capping at about 15,000 IOPS. Looking at the instance level statistics, we can see the answer:

Much like with our throughput testing earlier, we can see that our io2 volume performance is being restricted by the Instance size. Let’s increase the size of our Instance again, and see how the volume performs when the Instance has been correctly sized to support it:

We are now reaching the configured limits of our io2 volume, which is exactly what we wanted and expected to see. The instance level IOPS limit is no longer restricting the performance of the io2 volume:

Using the preceding steps, we can identify where storage bottlenecks are, and we can identify if we are using the right type of EBS volume for the workload. In our examples, we sought bottlenecks and scaled upwards to resolve them. This process should be used to identify where resources have been over-provisioned and under-provisioned.

If we see a volume that never reaches the maximums that it has been configured for, and that is not subject to any other bottlenecks, we usually conclude that the volume in question can be right-sized to a more appropriate volume that costs less, and better fits the workload.

We can, for example, change an Amazon EBS gp2 volume to an EBS gp3 volume with the correct IOPS and throughput. EBS gp3 provides up to 1000-MBps throughput per volume and costs $0.08/GB (versus $0.10/GB for gp2). Additionally, unlike with gp2, gp3 volumes allow you to specify provisioned IOPS independently of size and throughput. By using the process described above, we could identify that a gp2, io1, or io2 volume could be swapped out with a more cost-effective gp3 volume.

If during our analysis we observe an SSD-based volume with relatively high throughput usage, but low IOPS usage, we should investigate further. A lower-cost HDD-based volume, such as an st1 or sc1 volume, might be more cost-effective while maintaining the required level of performance. Amazon EBS st1 volumes provide up to 500 MBps throughput and cost $0.045 per GB-month, and are often an ideal volume-type to use for SQL backups, for example.

Additional storage optimization you can implement

Move the TempDB to Instance Store NVMe storage – The data on an SSD instance store volume persists only for the life of its associated instance. This is perfect for TempDB storage, as when the instance stops and starts, SQL Server saves the data to an EBS volume. Placing the TempDB on the local instance store frees the associated Amazon EBS throughput while providing better performance as it is locally attached to the instance.

Consider Amazon FSx for Windows File Server as a shared storage solutionAs described here, Amazon FSx can be used to store a SQL database on a shared location, enabling the use of a SQL Server Failover Cluster Instance.


The Compute Layer

After you finish optimizing your storage layer, wait a few days and re-examine the metrics for both Amazon EBS and networking. Use these metrics in conjunction with CPU metrics and Memory metrics to select the right Instance type to meet your workload requirements.

AWS offers nearly 400 instance types in different sizes. From a SQL perspective, it’s essential to choose instances with high single-thread performance, such as the z1d instance, due to SQL’s license-per-core model. z1d instances also provide instance store storage for the TempDB.

You might also want to check out the AWS Compute Optimizer, which helps you by automatically recommending instance types by using machine learning to analyze historical utilization metrics. More details can be found here.

We strongly advise you to thoroughly test your applications after making any configuration changes.


Conclusion

This blog post covers some simple and useful techniques to gain visibility into important instance metrics, and provides a script that greatly simplifies the process. Any workload running on EC2 can benefit from these techniques. We have found them especially effective at identifying actionable optimizations for SQL Servers, where small changes can have beneficial cost, licensing and performance implications.


Frictionless hosting of containerized ASP.NET web apps using Amazon Lightsail

Post Syndicated from Emma White original https://aws.amazon.com/blogs/compute/frictionless-hosting-of-containerized-asp-net-web-apps-using-amazon-lightsail/

This post is written by Fahad Mustafa, Cloud Application Architect, AWS Professional Services

There are many ways to deploy ASP.NET web apps to AWS. Each with its own use cases and differing pricing models. But what if you have a small website and database that you must deploy rapidly, manage, and scale? What if you want a cost-effective simple monthly plan? In these cases, Amazon Lightsail is a great choice. This post shows you how to take a containerized ASP.NET web application that connects to a PostgreSQL database and deploy it to Lightsail. So that you can get your ASP.NET web app up and running.

Product Overview

Amazon Lightsail is an easy way to get started on AWS. It gives you building blocks to deploy an application or website and provision a database at an affordable, monthly price.

Lightsail is perfect for students, small businesses, and startups to get their website or application up and running in the cloud. By providing a secure, highly available, and managed environment Lightsail does all the heavy lifting like setting up IAM roles and policies.

Lightsail can also run containers! By pointing Lightsail to a public image on Amazon ECR or Docker Hub, or uploading an image from your local machine, you can easily run the container, scale it, monitor it and use a custom domain.

Overview of solution

To deploy an ASP.NET app that connects to a PostgreSQL database, you create a Lightsail container service and PostgreSQL database through the AWS Management Console. Create your app and container image. Push the image to Lightsail and finally create the Lightsail deployment to run the container.

solution diagram

Overview of steps

In this post, you create a sample ASP.NET web app through the .NET CLI. Alternatively, you can use Visual Studio to create the app.

This is the sequence of steps I review in this post:

  • Create a PostgreSQL database
  • Create a Lightsail container service
  • Create an ASP.NET web app
  • Create a Dockerfile and build image
  • Upload the image to Lightsail
  • Deploy and run the image

Prerequisites

For this walkthrough, you should have the following prerequisites:

Walkthrough

Create a PostgreSQL database

In this step, you create a PostgreSQL database through the Lightsail console.

Create the database

  1. Sign in to the Lightsail console.
  2. On the Lightsail home page, choose the Database
  3. Choose Create database.
  4. Choose the Database location by changing the AWS Region and Availability Zone.
  5. Choose the database engine. In this example, select PostgreSQL 12.6.
  6. Optional – Specify login credentials. If not changed, AWS generates a default secure password.
  7. Optional – Specify the master database name. If not changed, AWS will use “dbmaster” as the default.
  8. Choose the database plan. Compare the plan’s memory, CPU, storage, and transfer quota to decide which best fits your needs. The smallest database plan is Free Tier eligible.
  9. Identify your database by giving it a unique name.
  10. Choose Create database.

Creating and configuring the database can take a few minutes. Once ready, the status changes to Available. For more information and options on creating a database in Lightsail, see Creating a database in Amazon Lightsail.

available database

Now you are ready to connect to the database and create a table. To connect, see Connecting to your PostgreSQL database in Amazon Lightsail. This sample uses a database named aspnetlightsaildb and a table named Person that you can create by running the following script using PgAdmin. Note that the Owner value is dbmasteruser. This is the default username AWS generates. If you changed the default, then use the username you specified in step 6.

-- Database: aspnetlightsaildb
CREATE DATABASE aspnetlightsaildb
    WITH 
    OWNER = dbmasteruser
    ENCODING = 'UTF8'
    LC_COLLATE = 'en_US.UTF-8'
    LC_CTYPE = 'en_US.UTF-8'
    TABLESPACE = pg_default
    CONNECTION LIMIT = -1;	
-- Table: public.Person
CREATE TABLE IF NOT EXISTS public."Person"
(
    "Id" integer NOT NULL GENERATED ALWAYS AS IDENTITY ( INCREMENT 1 START 1 MINVALUE 1 MAXVALUE 2147483647 CACHE 1 ),
    "Name" text COLLATE pg_catalog."default",
    "DateOfBirth" date,
    "Address" text COLLATE pg_catalog."default",
    CONSTRAINT "Person_pkey" PRIMARY KEY ("Id")
)
TABLESPACE pg_default;
ALTER TABLE public."Person"
    OWNER to dbmasteruser;

Now your database and table is created and you can create a container service.

Create a Lightsail container service

In this step, you create a Lightsail container service that is ready to accept your container images.

Create the container service

  1. Sign in to the Lightsail console.
  2. On the Lightsail home page, choose the Containers Tab
  3. Choose Create container service.
  4. In the Create a container service page, choose Change AWS Region, then choose an AWS Region for your container service.
  5. Choose a capacity for your container service. For more information, see Container service capacity (scale and power).
  6. Skip the Set up your first deployment step as you’ll create the deployment after creating the container image on your dev machine.
  7. Enter a name for your container service. Take note of this name, you’ll need it later to deploy the container to Lightsail.
  8. Click Create container service.

After a few minutes, your container service status changes from Pending to Ready. This indicates you can now deploy images. If this is the first time you created a service, it can take 10–15 minutes for the status to become Ready.

container service

Create an ASP.NET web app

Using the .NET CLI, you’ll create a sample ASP.NET web app. In an empty directory run the following command:

dotnet new webapp --name HelloWorldLightsail

The “webapp” segment of the commands specifies the project template to use. In this case, it’s a default ASP.NET web app. The “name” parameter is the name of the ASP.NET project.

To connect to your PostgreSQL Db from ASP.NET, you must install the “Npgsql” Nuget package. In the root directory of the project run the following command in the terminal:

dotnet add package Npgsql.EntityFrameworkCore.PostgreSQL –-version 5.0.6

Once installed, you create a Model class to represent the data and a DbContext class to connect and query the database.

public class Person
    {
        public int Id { get; set; }

        public string Name { get; set; }

        public DateTime DateOfBirth { get; set; }

        public string Address { get; set; }
    }

public class PostgreSqlContext : DbContext
    {
        public PostgreSqlContext(DbContextOptions<PostgreSqlContext> options) : base(options)
        {
        }

        public DbSet<Person> Person { get; set; }
    }

The next step is to add the connection string to appSettings.json. In the root of the settings file add a new ConnectionStrings property as shown below. The following properties are required:

  • lightsail-endpoint: The database endpoint as shown in the Lightsail console.
  • db-name: The name of the database you want to connect to.
  • db-username: The username as shown in the Lightsail console.
  • db-password: The password as shown in the Lightsail console.
"ConnectionStrings": {
    "AspnetLightsailDb": "Server=<lightsail-endpoint>;Port=5432;Database=<db-name>;User Id=<db-username>;Password=<db-password>;"
  }

Next step is to tell ASP.NET where to find the connection string and which DbContext class to use. This is done by configuring the DbContext in Startup.cs. Under the ConfigureServices method add the following line of code:

  services.AddDbContext<PostgreSqlContext>(options => options.UseNpgsql(Configuration.GetConnectionString("AspnetLightsailDb")));


Now, you are ready to perform operations against the database. This is done by performing operations against the Person property of the PostgreSqlContext instance.

For example to fetch all records form the Person table:

public IList<Person> Person { get;set; }

        public async Task OnGetAsync()
        {
            Person = await _context.Person.ToListAsync();
        }

You now have an ASP.NET web application that can query the “Person” table against the PostgreSQL database.

Create a Dockerfile and build image

In order to containerize the web app, you must create a Dockerfile. This file provides instructions to Docker on how to build the container image.

To create a Dockerfile and build image

  1. In the root directory of the project, you created (where the .csproj file lives) create an empty file named “Dockerfile”. Note this file does not have an extension.
  2. Open the file with a text editor or IDE and insert the following:
# https://hub.docker.com/_/microsoft-dotnet
FROM mcr.microsoft.com/dotnet/sdk:5.0 AS build
WORKDIR /source

# copy csproj and restore as distinct layers
COPY *.csproj .
RUN dotnet restore

# copy everything else and build app
COPY . .
RUN dotnet publish -c release -o /app --no-restore

# final stage/image
FROM mcr.microsoft.com/dotnet/aspnet:5.0
WORKDIR /app
COPY --from=build /app ./
ENTRYPOINT ["dotnet", "HelloWorldLightsail.dll"]
  1. To build the image, open a terminal in the same directory as the Dockerfile. Run the following command to build the image.
    docker build -t helloworldlightsail .
    The “-t” parameter is a human readable tag you give the image to make it easy to identify.
  2. After the command completes, you can verify that the image exists by running
    docker images
    You should see the newly created image.newly created image

Upload the image to Lightsail

In this step, you upload the newly built image to the Lightsail container service that you created earlier.

To upload the image to Lightsail

  1. Ensure you have configured the AWS CLI to access AWS.
  2. In a terminal enter the following command:
    aws lightsail push-container-image --region ap-southeast-2 --service-name aspnet-helloworld --label helloworldlightsail --image helloworldlightsail:latest
    The –-region and –-service-name parameters should match the container service you created through the AWS Management Console. The –-label parameter is a descriptive name you give the image when it’s stored in the container service. This will help you track the different versions of the image. The –-image parameter consists of the image name and tag on your local machine that you want to push to Lightsail. Read more about how to push images to Lightsail.
  3. After the command runs successfully browse your container service in the Lightsail console and click the “Images” tab. You should see the uploaded image.

3. After the command runs successfully browse your container service in the Lightsail console and click the “Images” tab

Deploy and run the image

Now that your image is uploaded to the container service it’s time to create a deployment to run the app.

To create a deployment

  1. Go to the Deployments tab in the Lightsail console.
  2. Click on Create your first deployment.
  3. Enter the Container name.
  4. Click Choose stored image and select the image you uploaded in the previous step.
  5. Click on Add open ports to add a port mapping to the container. This allows Lightsail to forward web traffic to your ASP.NET web app. By default ASP.NET web server will listen to port 80.
  6. Under the Public endpoint section, select the container from the drop-down. This specifies which container Lightsail will forward traffic to since a single deployment can have more than one container.
  7. Click Save and deploy

Your configuration should looks like this. Read more about creating container services deployments in Lightsail.

configuration overview

After the deployment is complete, you can navigate to the Public domain of your container service. You will see your ASP.NET web app in action!

public domain

Conclusion

In this post, I demonstrated how easy it is to create a PostgreSQL DB and deploy an ASP.NET web app to Amazon Lightsail. Going from a container on your dev machine to a publicly accessible, scalable, and secure cloud environment within minutes.

You can now add a custom domain to your web app through the Lightsail console. Additionally, you can increase the scale of your container to keep up with demand based on the useful CPU and memory metrics provided in the console.

If you have more advanced needs for your web app, you have the whole robust ecosystem of AWS at your disposal. You can deploy your ASP.NET web app to Amazon Elastic Container Service (Amazon ECS) or even decide to go completely serverless and utilize AWS Lambda and API Gateway.

Visit the Amazon Lightsail homepage to get started with your next idea and read the docs for more details about container services on Amazon Lightsail.


Choosing a Well-Architected CI/CD approach: Open-source software and AWS Services

Post Syndicated from Brian Carlson original https://aws.amazon.com/blogs/devops/choosing-well-architected-ci-cd-open-source-software-aws-services/

This series of posts discusses making informed decisions when choosing to implement open-source tools on AWS services, adopt managed AWS services to satisfy the same needs, or use a combination of both.

We look at key considerations for evaluating open-source software and AWS services using the perspectives of a startup company and a mature company as examples. You can use these two different points of view to compare to your own organization. To make this investigation easier we will use Continuous Integration (CI) and Continuous Delivery (CD) capabilities as the target of our investigation.

Startup Company rocket and Mature Company rocket

In two related posts, we follow two AWS customers, Iponweb and BigHat Biosciences, as they share their CI/CD journeys, their perspectives, the decisions they made, and why. To end the series, we explore an example reference architecture showing the benefits AWS provides regardless of your emphasis on open-source tools or managed AWS services.

Why CI/CD?

Until your creations are in the hands of your customers, investment in development has provided no return. The faster valuable changes enter production, the greater positive impact you can have on your customer. In today’s highly competitive world, the ability to frequently and consistently deliver value is a competitive advantage. The Operational Excellence (OE) pillar of the AWS Well-Architected Framework recognizes this impact and focuses on the capabilities of CI/CD in two dedicated sections.

The concepts in CI/CD originate from software engineering but apply equally to any form of content. The goal is to support development, integration, testing, deployment, and delivery to production. For example, making changes to an application, updating your machine learning (ML) models, changing your multimedia assets, or referring to the AWS Well-Architected Framework.

Adopting CI/CD and the best practices from the Operational Excellence pillar can help you address risks in your environment, and limit errors from manual processes. More importantly, they help free your teams from the related manual processes, so they can focus on satisfying customer needs, differentiating your organization, and accelerating the flow of valuable changes into production.

A red question mark sits on a field of chaotically arranged black question marks.

How do you decide what you need?

The first question in the Operational Excellence pillar is about understanding needs and making informed decisions. To help you frame your own decision-making process, we explore key considerations from the perspective of a fictional startup company and a fictional mature company. In our two related posts, we explore these same considerations with Iponweb and BigHat.

The key considerations include:

  • Functional requirements – Providing specific features and capabilities that deliver value to your customers.
  • Non-functional requirements – Enabling the safe, effective, and efficient delivery of the functional requirements. Non-functional requirements include security, reliability, performance, and cost requirements.
    • Without security, you can’t earn customer trust. If your customers can’t trust you, you won’t have customers.
    • Without reliability you aren’t available to serve your customers. If you can’t serve your customers, you won’t have customers.
    • Performance is focused on timely and efficient delivery of value, not delivering as fast as possible.
    • Cost is focused on optimizing the value received for the resources spent (for example, money, time, or effort), not minimizing expense.
  • Operational requirements – Enabling you to effectively and efficiently support, maintain, sustain, and improve the delivery of value to your customers. When you “Design with Ops in Mind,” you’re enabling effective and efficient support for your business outcomes.

These non-feature-related key considerations are why Operational Excellence, Security, Reliability, Performance Efficiency, and Cost Optimization are the five pillars of the AWS Well-Architected Framework.

The startup company

Any startup begins as a small team of inspired people working together to realize the unique solution they believe solves an unsolved problem.

For our fictional small team, everyone knows each other personally and all speak frequently. We share processes and procedures in discussions, and everyone know what needs to be done. Our team members bring their expertise and dedicate it, and the majority of their work time, to delivering our solution. The results of our efforts inform changes we make to support our next iteration.

However, our manual activities are error-prone and inconsistencies exist in the way we do them. Performing these tasks takes time away from delivering our solution. When errors occur, they have the potential to disrupt everyone’s progress.

We have capital available to make some investments. We would prefer to bring in more team members who can contribute directly to developing our solution. We need to iterate faster if we are to achieve a broadly viable product in time to qualify for our next round of funding. We need to decide what investments to make.

  • Goals – Reach the next milestone and secure funding to continue development
  • Needs – Reduce or eliminate the manual processes and associated errors
  • Priority – Rapid iteration
  • CI/CD emphasis – Baseline CI/CD capabilities and non-functional requirements are emphasized over a rich feature set

The mature company

Our second fictional company is a large and mature organization operating in a mature market segment. We’re focused on consistent, quality customer experiences to serve and retain our customers.

Our size limits the personal relationships between our service and development teams. The process to make requests, and the interfaces between teams and their systems, are well documented and understood.

However, the systems we have implemented over time, as needs were identified and addressed, aren’t well documented. Our existing tool chain includes some in-house scripting and both supported and unsupported versions of open-source tools. There are limited opportunities for us to acquire new customers.

When conditions change and new features are desired, we want to be able to rapidly implement and deploy those features as fast as possible. If we can differentiate our services, however briefly, we may be able to win customers away from our competitors. Our other path to improved profitability is to evolve our processes, maximizing integration and efficiencies, and capturing cost reductions.

  • Goals – Differentiate ourselves in the marketplace with desired new features
  • Needs – Address the risks of poorly documented systems and unsupported software
  • Priority – Evolve efficiency
  • CI/CD emphasis – Rich feature set and integrations are emphasized over improving the existing non-functional capabilities

Open-source tools on AWS vs. AWS services

The choice of open-source tools or AWS service is not binary. You can select the combination of solutions that provides the greatest value. You can implement open-source tools for their specific benefits where they outweigh the costs and operational burden, using underlying AWS services like Amazon Elastic Compute Cloud (Amazon EC2) to host them. You can then use AWS managed services, like AWS CodeBuild, for the undifferentiated features you need, without additional cost or operational burden.

A group of people sit around a table discussing the pieces of a puzzle and their ideas.

Feature Set

Our fictional organizations both want to accelerate the flow of beneficial changes into production and are evaluating CI/CD alternatives to support that outcome. Our startup company wants a working solution—basic capabilities, author/code, build, and deploy, so that they can focus on development. Our mature company is seeking every advantage—a rich feature set, extensive opportunities for customization, integration capabilities, and fine-grained control.

Open-source tools

Open-source tools often excel at meeting functional requirements. When a new functionality, capability, or integration is desired, any developer can implement it for themselves, and then contribute their code back to the project. As the user community for an open-source project expands the number of use cases and the features identified grows, so does the number of potential solutions and potential contributors. Developers are using these tools to support their efforts and implement new features that provide value to them.

However, features may be released in unsupported versions and then later added to the supported feature set. Non-functional requirements take time and are less appealing because they don’t typically bring immediate value to the product. Non-functional capabilities may lag behind the feature set.

Consider the following:

  • Open-source tools may have more features and existing integrations to other tools
  • The pace of feature set delivery may be extremely rapid
  • The features delivered are those desired and created by the active members of the community
  • You are free to implement the features your company desires
  • There is no commitment to long-term support for the project or any given feature
  • You can implement open-source tools on multiple cloud providers or on premises
  • If the project is abandoned, you’re responsible for maintaining your implementation

AWS services

AWS services are driven by customer needs. Services and features are supported by dedicated teams. These customer-obsessed teams focus on all customer needs, with security being their top priority. Both functional and non-functional requirements are addressed with an emphasis on enabling customer outcomes while minimizing the effort they expend to achieve them.

Consider the following:

  • The pace of delivery of feature sets is consistent
  • The feature roadmap is driven by customer need and customer requests
  • The AWS service team is dedicated to support of the service
  • AWS services are available on the AWS Cloud and on premises through AWS Outposts

Picture showing symbol of dollar

Cost Optimization

Why are we discussing cost after the feature set? Security and reliability are fundamentally more important. Leadership naturally gravitates to following the operational excellence best practice of evaluating trade-offs. Having looked at the potential benefits from the feature set, the next question is typically, “What is this going to cost?” Leadership defines the priorities and allocates the resources necessary (capital, time, effort). We review cost optimization second so that leadership can make a comparison of the expected benefits between CI/CD investments, and investments in other efforts, so they can make an informed decision.

Our organizations are both cost conscious. Our startup is working with finite capital and time. In contrast, our mature company can plan to make investments over time and budget for the needed capital. Early investment in a robust and feature-rich CI/CD tool chain could provide significant advantages towards the startup’s long-term success, but if the startup fails early, the value of that investment will never be realized. The mature company can afford to realize the value of their investment over time and can make targeted investments to address specific short-term needs.

Open-source tools

Open-source software doesn’t have to be purchased, but there are costs to adopt. Open-source tools require appropriate skills in order to be implemented, and to perform management and maintenance activities. Those skills must be gained through dedicated training of team members, team member self-study, or by hiring new team members with the existing skills. The availability of skilled practitioners of open-source tools varies with how popular a tool is and how long it has had an active community. Loss of skilled team members includes the loss of their institutional knowledge and intimacy with the implementation. Skills must be maintained with changes to the tools and as team members join or leave. Time is required from skilled team members to support management and maintenance activities. If commercial support for the tool is desired, it may be available through third-parties at an additional cost.

The time to value of an open-source implementation includes the time to implement and configure the resources and software. Additional value may be realized through investment of time configuring or implementing desired integrations and capabilities. There may be existing community-supported integrations or capabilities that reduce the level of effort to achieve these.

Consider the following:

  • No cost to acquire the software.
  • The availability of skill practitioners of open-source tools may be lower. Cost (capital and time) to acquire, establish, or maintain skill set may be higher.
  • There is an ongoing cost to maintain the team member skills necessary to support the open-source tools.
  • There is an ongoing cost of time for team members to perform management and maintenance activities.
  • Additional commercial support for open-source tools may be available at additional cost
  • Time to value includes implementation and configuration of resources and the open-source software. There may be more predefined community integrations.

AWS services

AWS services are provided pay-as-you-go with no required upfront costs. As of August 2020, more than 400,000 individuals hold active AWS Certifications, a number that grew more than 85% between August 2019 and August 2020.

Time to value for AWS services is extremely short and limited to the time to instantiate or configure the service for your use. Additional value may be realized through the investment of time configuring or implementing desired integrations. Predefined integrations for AWS services are added as part of the service development roadmap. However, there may be fewer existing integrations to reduce your level of effort.

Consider the following:

  • No cost to acquire the software; AWS services are pay-as-you-go for use.
  • AWS skill sets are broadly available. Cost (capital and time) to acquire, establish, or maintain skill sets may be lower.
  • AWS services are fully managed, and service teams are responsible for the operation of the services.
  • Time to value is limited to the time to instantiate or configure the service. There may be fewer predefined integrations.
  • Additional support for AWS services is available through AWS Support. Cost for support varies based on level of support and your AWS utilization.

Open-source tools on AWS services

Open-source tools on AWS services don’t impact these cost considerations. Migration off of either of these solutions is similarly not differentiated. In either case, you have to invest time in replacing the integrations and customizations you wish to maintain.

Picture showing a checkmark put on security

Security

Both organizations are concerned about reputation and customer trust. They both want to act to protect their information systems and are focusing on confidentiality and integrity of data. They both take security very seriously. Our startup wants to be secure by default and wants to trust the vendor to address vulnerabilities within the service. Our mature company has dedicated resources that focus on security, and the company practices defense in depth across internal organizations.

The startup and the mature company both want to know whether a choice is safe, secure, and can validate the security of their choice. They also want to understand their responsibilities and the shared responsibility model that applies.

Open-source tools

Open-source tools are the product of the contributors and may contain flaws or vulnerabilities. The entire community has access to the code to test and validate. There are frequently many eyes evaluating the security of the tools. A company or individual may perform a validation for themselves. However, there may be limited guidance on secure configurations. Controls in the implementer’s environment may reduce potential risk.

Consider the following:

  • You’re responsible for the security of the open-source software you implement
  • You control the security of your data within your open-source implementation
  • You can validate the security of the code and act as desired

AWS services

AWS service teams make security their highest priority and are able to respond rapidly when flaws are identified. There is robust guidance provided to support configuring AWS services securely.

Consider the following:

  • AWS is responsible for the security of the cloud and the underlying services
  • You are responsible for the security of your data in the cloud and how you configure AWS services
  • You must rely on the AWS service team to validate the security of the code

Open-source tools on AWS services

Open-source tools on AWS services combine these considerations; the customer is responsible for the open-source implementation and the configuration of the AWS services it consumes. AWS is responsible for the security of the AWS Cloud and the managed AWS services.

Picture showing global distribution for redundancy to depict reliability

Reliability

Everyone wants reliable capabilities. What varies between companies is their appetite for risk, and how much they can tolerate the impact of non-availability. The startup emphasized the need for their systems to be available to support their rapid iterations. The mature company is operating with some existing reliability risks, including unsupported open-source tools and in-house scripts.

The startup and the mature company both want to understand the expected reliability of a choice, meaning what percentage of the time it is expected to be available. They both want to know if a choice is designed for high availability and will remain available even if a portion of the systems fails or is in a degraded state. They both want to understand the durability of their data, how to perform backups of their data, and how to perform recovery in the event of a failure.

Both companies need to determine what is an acceptable outage duration, commonly referred to as a Recovery Time Objective (RTO), and for what quantity of elapsed time it is acceptable to lose transactions (including committing changes), commonly referred to as Recovery Point Objective (RPO). They need to evaluate if they can achieve their RTO and RPO objectives with each of the choices they are considering.

Open-source tools

Open-source reliability is dependent upon the effectiveness of the company’s implementation, the underlying resources supporting the implementation, and the reliability of the open-source software. Open-source tools are the product of the contributors and may or may not incorporate high availability features. Depending on the implementation and tool, there may be a requirement for downtime for specific management or maintenance activities. The ability to support RTO and RPO depends on the teams supporting the company system, the implementation, and the mechanisms implemented for backup and recovery.

Consider the following:

  • You are responsible for implementing your open-source software to satisfy your reliability needs and high availability needs
  • Open-source tools may have downtime requirements to support specific management or maintenance activities
  • You are responsible for defining, implementing, and testing the backup and recovery mechanisms and procedures
  • You are responsible for the satisfaction of your RTO and RPO in the event of a failure of your open-source system

AWS services

AWS services are designed to support customer availability needs. As managed services, the service teams are responsible for maintaining the health of the services.

Consider the following:

Open-source tools on AWS services

Open-source tools on AWS services combine these considerations; the customer is responsible for the open-source implementation (including data durability, backup, and recovery) and the configuration of the AWS services it consumes. AWS is responsible for the health of the AWS Cloud and the managed services.

Picture showing a graph depicting performance measurement

Performance

What defines timely and efficient delivery of value varies between our two companies. Each is looking for results before an engineer becomes idled by having to wait for results. The startup iterates rapidly based on the results of each prior iteration. There is limited other activity for our startup engineer to perform before they have to wait on actionable results. Our mature company is more likely to have an outstanding backlog or improvements that can be acted upon while changes moves through the pipeline.

Open-source tools

Open-source performance is defined by the resources upon which it is deployed. Open-source tools that can scale out can dynamically improve their performance when resource constrained. Performance can also be improved by scaling up, which is required when performance is constrained by resources and scaling out isn’t supported. The performance of open-source tools may be constrained by characteristics of how they were implemented in code or the libraries they use. If this is the case, the code is available for community or implementer-created improvements to address the limitation.

Consider the following:

  • You are responsible for managing the performance of your open-source tools
  • The performance of open-source tools may be constrained by the resources they are implemented upon; the code and libraries used; their system, resource, and software configuration; and the code and libraries present within the tools

AWS services

AWS services are designed to be highly scalable. CodeCommit has a highly scalable architecture, and CodeBuild scales up and down dynamically to meet your build volume. CodePipeline allows you to run actions in parallel in order to increase your workflow speeds.

Consider the following:

  • AWS services are fully managed, and service teams are responsible for the performance of the services.
  • AWS services are designed to scale automatically.
  • Your configuration of the services you consume can affect the performance of those services.
  • AWS services quotas exist to prevent unexpected costs. You can make changes to service quotas that may affect performance and costs.

Open-source tools on AWS services

Open-source tools on AWS services combine these considerations; the customer is responsible for the open-source implementation (including the selection and configuration of the AWS Cloud resources) and the configuration of the AWS services it consumes. AWS is responsible for the performance of the AWS Cloud and the managed AWS services.

Picture showing cart-wheels in motion, depicting operations

Operations

Our startup company wants to limit its operations burden as much as possible in order to focus on development efforts. Our mature company has an established and robust operations capability. In both cases, they perform the management and maintenance activities necessary to support their needs.

Open-source tools

Open-source tools are supported by their volunteer communities. That support is voluntary, without any obligation or commitment from the users. If either company adopts open-source tools, they’re responsible for the management and maintenance of the system. If they want additional support with an obligation and commitment to support their implementation, third parties may provide commercial support at additional cost.

Consider the following:

  • You are responsible for supporting your implementation.
  • The open-source community may provide volunteer support for the software.
  • There is no commitment to support the software by the open-source community.
  • There may be less documentation, or accepted best practices, available to support open-source tools.
  • Early adoption of open-source tools, or the use of development builds, includes the chance of encountering unidentified edge cases and unanticipated issues.
  • The complexity of an implementation and its integrations may increase the difficulty to support open-source tools. The time to identify contributing factors may be extended by the complexity during an incident. Maintaining a set of skilled team members with deep understanding of your implementation may help mitigate this risk.
  • You may be able to acquire commercial support through a third party.

AWS services

AWS services are committed to providing long-term support for their customers.

Consider the following:

  • There is long-term commitment from AWS to support the service
  • As a managed service, the service team maintains current documentation
  • Additional levels of support are available through AWS Support
  • Support for AWS is available through partners and third parties

Open-source tools on AWS services

Open-source tools on AWS services combine these considerations. The company is responsible for operating the open-source tools (for example, software configuration changes, updates, patching, and responding to faults). AWS is responsible for the operation of the AWS Cloud and the managed AWS services.

Conclusion

In this post, we discussed how to make informed decisions when choosing to implement open-source tools on AWS services, adopt managed AWS services, or use a combination of both. To do so, you must examine your organization and evaluate the benefits and risks.

A magnifying glass is focused on the single red figure in a group of otherwise blue paper figures standing on a white surface.

Examine your organization

You can make an informed decision about the capabilities you adopt. The insight you need can be gained by examining your organization to identify your goals, needs, and priorities, and discovering what your current emphasis is. Ask the following questions:

  • What is your organization trying to accomplish and why?
  • How large is your organization and how is it structured?
  • How are roles and responsibilities distributed across teams?
  • How well defined and understood are your processes and procedures?
  • How do you manage development, testing, delivery, and deployment today?
  • What are the major challenges your organization faces?
  • What are the challenges you face managing development?
  • What problems are you trying to solve with CI/CD tools?
  • What do you want to achieve with CI/CD tools?

Evaluate benefits and risk

Armed with that knowledge, the next step is to explore the trade-offs between open-source options and managed AWS services. Then evaluate the benefits and risks in terms of the key considerations:

  • Features
  • Cost
  • Security
  • Reliability
  • Performance
  • Operations

When asked “What is the correct answer?” the answer should never be “It depends.” We need to change the question to “What is our use case and what are our needs?” The answer will emerge from there.

Make an informed decision

A Well-Architected solution can include open-source tools, AWS Services, or any combination of both! A Well-Architected choice is an informed decision that evaluates trade-offs, balances benefits and risks, satisfies your requirements, and most importantly supports the achievement of your business outcomes.

Read the other posts in this series and take this journey with BigHat Biosciences and Iponweb as they share their perspectives, the decisions they made, and why.

Resources

Want to learn more? Check out the following CI/CD and developer tools on AWS:

Continuous integration (CI)
Continuous delivery (CD)
AWS Developer Tools

For more information about the AWS Well-Architected Framework, refer to the following whitepapers:

AWS Well-Architected Framework
AWS Well-Architected Operational Excellence pillar
AWS Well-Architected Security pillar
AWS Well-Architected Reliability pillar
AWS Well-Architected Performance Efficiency pillar
AWS Well-Architected Cost Optimization pillar

The 3 hexagons of the well architected logo appear to the right of the words AWS Well-Architected.

Author bio

portrait photo of Brian Carlson Brian is the global Operational Excellence lead for the AWS Well-Architected program. Formerly the technical lead for an international network, Brian works with customers and partners researching the operations best practices with the greatest positive impact and produces guidance to help you achieve your goals.


Using the EC2 Serial Console to access the Microsoft Server boot manager to fix and debug boot failures

Post Syndicated from Emma White original https://aws.amazon.com/blogs/compute/using-the-ec2-serial-console-to-access-the-microsoft-server-boot-manager-to-fix-and-debug-boot-failures/

This post is written by Pallavi Ravishankar a Senior Product Manager and Jason Nicholls an Enterprise Solutions Architect.

Failure management is a key part of the reliability pillar within the AWS Well-Architected Framework. But things fail, and operating systems are no exception. An operating system update, application update, a misconfiguration, missing driver, or incorrect security permissions can prevent systems from starting up correctly.

In a previous post, we demonstrated how you can access the GNU GRand Unified Boot-loader (GRUB) using EC2 Serial console to fix a failed Linux kernel load. In this blog post, we show you how you can use EC2 Serial Console to debug and fix your Amazon EC2 Windows Instances.

Configuration changes or software updates are two examples that could result in an Amazon EC2 Windows Instance start-up failure. In this post, you simulate a network failure caused by a misconfiguration of your Amazon EC2 Windows Instance. Then use the Microsoft Windows Special Administration Console (SAC) to debug and fix your EC2 Windows Instance.

Before you simulate the network failure, you must configure SAC to read and write from the instance’s virtual serial port.


Configuring SAC

The SAC interface lets you interact with the Microsoft Windows Operating System, providing administrative access even if network connectivity is not functional. SAC is not enabled by default and must be configured.

You can configure SAC via the Windows’ Command shell or PowerShell. Or you can set up SAC during your instance creation by using EC2 user data. User data is a feature of EC2 that allows you to specify parameters for configuring your instance, or include a simple script. The simple script is carried out at launch.

To launch an EC2 instance running Windows Server, choose an instance family that is built on the AWS Nitro System. The EC2 Serial Console access is only available for EC2 instances based on the AWS Nitro System. Configure the user data to set up SAC access with the following script:

<script>

bcdedit /ems {current} on

bcdedit /emssettings EMSPORT:1 EMSBAUDRATE:115200

bcdedit /set {bootmgr} displaybootmenu yes

bcdedit /set {bootmgr} timeout 15

bcdedit /set {bootmgr} bootems yes

</script>

Ensure that the operating system is Windows Server 2019, the user data is set, and the instance family is correct before launching your instance.

Once your instance is initialized, retrieve the Windows password from the EC2 console or AWS Command Line Interface (CLI). You have now successfully configured SAC access via the instance’s virtual serial port.

Accessing the SAC Menu

EC2 Serial Console can be used to access the EC2 instance’s virtual serial port. EC2 Serial Console access is not permitted by default at the account level. Enabling EC2 Serial Console requires that your user has permission to call EC2 API EnableSerialConsoleAccess. You can enable or disable EC2 Serial Console from the EC2 Console screen or via the CLI.

Enabling or disabling EC2 Serial Console applies to all instances in your account. Service Control Policies can be used to control access to EC2 Serial Console at an organization level. AWS Identity and Access Management (IAM) permissions control access at an instance level. You can exercise more granular controls at the instance level by setting a resource group or tag-based IAM policy. For more information about allowing access to EC2 Serial Console, see documentation section “Configure access to the EC2 Serial Console.”

Simulating a failed networking configuration

Previously, if an EC2 instance became unresponsive, the only available recourse was to shut it down, and mount the disk on a secondary EC2 instance. You could then use the secondary instance to fix the issue. Today, you can use EC2 Serial Console to debug the problem.

Let’s simulate a complete network failure on your newly created EC2 instance by shutting down the Ethernet service. Use Remote Desktop to connect to your EC2 instance. Once you’re connected, open a Windows command shell in administrative mode and run the following command:

netsh interface show interface

The command should show a list of network interfaces available. If you are using an AWS Windows Amazon Machine Image (AMI), the interface “Ethernet 3” should show as enabled. An example of what you should see is depicted in the following image.

Figure 1 Available Network Interfaces

Run the following netsh command to disable the network interface:

netsh interface set interface name=”Ethernet 3” admin=DISABLED

The network interface is disabled the moment you press enter and your Remote Desktop connection should shut down, as shown in the following screenshot.

Figure 2 Connection to EC2 Instance lost

Even if you reboot the instance, you will see that the connection to the instance fails. This is because the network interface has been disabled.


Fixing the network connection

EC2 Serial Console provides a Secure Shell (SSH) to securely access SAC via your Windows EC2 instance’s virtual serial port. Connection to the virtual serial port does not require instance network connectivity. Therefore, you can use EC2 Serial Console to fix the networking misconfiguration.

The SSH session is authorized using an SSH key pair. You can access the EC2 Serial Console using the:

  • Amazon EC2 Console with a single click connection (browser based)
  • AWS CLI
  • Any SSH Client of your choice – openSSH, PuTTY, AWS CloudShell

In order to connect to EC2 Serial Console, you must generate a one-time SSH key locally on your client. To do this, use the AWS CLI to push the public key to the EC2 Serial Console service and use SSH to connect to the EC2 Serial Console endpoint. The Amazon EC2 Console combines all these steps into a single-click access. Detailed instructions of this process are available here.

For this blog post, we use AWS CloudShell. AWS CloudShell is a browser-based shell that makes it easy to securely manage, explore, and interact with your AWS resources. AWS CloudShell is pre-authenticated with your console credentials. You can launch AWS CloudShell directly from the AWS Management Console.

    1. From the AWS Management Console, choose the AWS CloudShell console by pressing the CloudShell icon:SSH icon in AWS Management Console
    2. Generate a one-time SSH key pair using ssh-keygen.
      ssh-keygen -t rsa -f my_rsa_key
    3. Push your public key to EC2 Serial Console using the AWS CLI installed on AWS CloudShell.
      aws ec2-instance-connect send-serial-console-ssh-public-key \
      --instance-id i-00123EXAMPLE \
      --serial-port 0 \
      --ssh-public-key file://my_rsa_key.pub
      --region $REGION
    4. Start an SSH session to EC2 Serial Console.ssh -i my_rsa_key [email protected].{region}.aws

Once you’re connected, press enter to see the SAC prompt. You can then run ch to see a list of available channels. To start a command shell channel, type cmd. You can then use ch -si 1 to access the newly created command shell channel. An example of the procedure is depicted in the following screenshot.

Figure 3 SAC access and the initialization of a command shell channel

The console then presents you with the channel information screen after selecting the command shell channel, similar to the following image.

Figure 4 Channel information screen

Press the enter key to be dropped into the channel.

The channel requests a username, domain, and password. The username is Administrator, the domain is empty, and the password is the password you retrieved earlier.

Now that you are authenticated, use the command shell to fix the problem.

Run the netsh command:

netsh interface show interface

After running the preceding commands, the command shell shows that we disabled the network interface. An example of this is illustrated in the following image.

Figure 5 Status showing the network interface has been disabled.

Let’s undo our misconfiguration by running the netsh command:

netsh interface set interface name=”Ethernet 3” admin=ENABLED

You can now use Remote Desktop to access the instance again.

Without closing the EC2 Serial Console, reboot the instance by running the following command:

shutdown -r -t 0

Your instance then reboots, which you can see via EC2 Serial Console. First, it drops back to the SAC menu to inform you of a reboot. Notice that the Microsoft Windows boot manager menu on reboot as seen in the following image.

Figure 6 Windows boot manager

The advanced boot options screen presented in the following image let you start Windows in advanced troubleshooting modes. These modes include repairing the instance, rolling back to a previous configuration, debugging your instance, or starting up in safe mode. To access the advanced boot options, press Esc + 8 on the Windows Server [EMS Enabled] menu option.

Figure 7 Advanced boot mode menu

By following this post, you setup SAC to read and write to the virtual serial port. You then disabled ethernet access. After confirming that you could no longer access your instance you used EC2 Serial Console to regain access and revert the changes.


Clean up

After you’ve finished with the instance you created for this post, you should clean up by deleting the instance. This will prevent you from incurring any additional costs. To delete the instance:

      1. In the navigation pane, choose Instances. In the list of instances, select the instance.
      2. Choose Instance state, Terminate instance.
      3. Choose Terminate when prompted for confirmation.

Amazon EC2 shuts down and deletes your instance. After your instance is deleted, it remains visible on the console for a short while, and then the entry is automatically deleted. You cannot remove the deleted instance from the console display yourself.


Conclusion

EC2 Serial Console offers virtual serial port access to a Microsoft Windows EC2 Instance running on the AWS Nitro System. EC2 Serial Console facilitates the interaction with Special Administration Console to fix and debug instance issues. You can also use EC2 Serial Console to access the Microsoft boot menu to launch an instance in safe mode. You can also connect to the EC2 Serial Console of your Linux instances, which we covered in previous blog post. To learn more regarding EC2 Serial Console, see AWS Documentation or follow this Qwiklabs hands-on lab.


Choosing a CI/CD approach: Open Source on AWS, an Iponweb story

Post Syndicated from Mikhail Vasilyev original https://aws.amazon.com/blogs/devops/choosing-a-ci-cd-approach-open-source-on-aws-an-iponweb-story/

Iponweb is a global leader in building programmatic and real-time advertising technology and infrastructure for some of the world’s biggest digital media buyers and sellers. The company develops client-facing products and internal development tools that must be platform agnostic to support spanning across multiple cloud services.

In this post, we explore how Iponweb applied key considerations when choosing a continuous integration, continuous deployment (CI/CD), what they determined to be the right CI/CD approach for them, and review some considerations that may apply to your own business needs. And in the next post, we will dive even deeper into these key considerations.

How did Iponweb decide what they needed?

The first and most important question in designing a Well-Architected approach is: “How do you determine your priorities?” AWS Well-Architected defines the first two best practices to do that as: ”evaluate external customer needs” (Iponweb’s clients) and “evaluate internal customer needs” (Iponweb’s team).

Iponweb started with these two considerations while selecting the strategic toolset. After evaluating their customers’ requirements, the next step was to look at the needs of the Iponweb team. Their priorities included the products and features required, the cost, and the ability to build multi-cloud solutions.

Iponweb is dedicated to operating securely with the reliability and performance to support their customers. Solutions had to satisfy their fundamental requirements in these areas to be considered in their evaluation.

Feature set

Iponweb evaluated available options for the CI tool chain and found that, for their needs, GitLab was the clear winner, differentiated by delivering the greatest number of required features at the best price while being platform agnostic.

AWS had the complete set of tools, services, and best practices to support Iponweb’s goal to establish an open-source, self-hosted CI environment using GitLab. Upon completing their thorough evaluation process, Iponweb selected AWS to implement its CI environment.

Cost

Iponweb understood the investment they would be making within their team to leverage and support all the desired features of GitLab. Iponweb evaluated the expertise of its internal teams and factored in ease of integration with supporting services.

They adopted several AWS services that satisfied their undifferentiated needs, which allowed them to remove the operational burden and cost of maintaining their own implementations of various capabilities and features.

Furthermore, the availability of Amazon Elastic Compute Cloud (Amazon EC2) Spot Instances provided the opportunity to further manage costs for their CI resource needs and usage patterns.

Security

Iponweb leveraged their existing security control implementations and integration with AWS to support adopting additional AWS services. AWS was responsible for the security of the cloud, including the underlying AWS services. Iponweb was able to focus on secure and effective configurations of those services and secure and effective configuration of their GitLab implementation. This ensured the security of their open-source, self-hosted CI environment.

When setting priorities for the design of a Well-Architected approach, it’s imperative to “manage benefits and risks,” which emphasizes making informed decisions when adopting open source or any tools. Iponweb achieved their best value solution by applying Well-Architected practices in Operational Excellence, Cost Optimization, and Security pillars by leveraging AWS products and services.

Overview of solution

Continuous integration consists of three key processes, each of which AWS supports:

  • Code stage – Iponweb built the centralized Git repository on the GitLab platform on EC2 servers, providing the UI and API to store and manage the code.
  • Test and build stage – They used GitLab as the application layer to manage build and test flows through GitLab Runners (compute workers for CI jobs). This layer is implanted via GitLab in containers, and is deployed and managed by Amazon Elastic Kubernetes Service (Amazon EKS).
  • Publish stageAmazon Elastic Container Registry (Amazon ECR) stores the infrastructure containers for the runners and product containers.

The following diagram illustrates this architecture:

At the core of Iponweb’s CI platform architecture is the open-source GitLab Community Edition.

Implementing the solution

CI jobs are either run regularly or triggered by events such as merge requests. The jobs are described as code in YAML files and are stored and versioned along with the product code itself. Runner versions are published into Amazon ECR and launched as Docker containers in Amazon EKS.

Runner code is stored as Helm charts that help Iponweb package up and manage their large-scale Kubernetes deployments. In addition, Amazon EKS has support for Helm and many other plugins for Kubernetes.

Iponweb developers innovate at a very fast pace, and customize Iponweb’s client solutions in rapid iterations. To address uncertain container registry requirements, Iponweb decided to use Amazon ECR. As a managed service, Amazon ECR eliminates concerns about scaling capacity and management. Integration of GitLab with Amazon EKS and Amazon ECR is provided out of the box through a UI and predefined scripts, with no additional overhead to develop and deploy code or plugins.

Iponweb was able to implement the Well-Architected design principle: “stop continuously estimating its capacity needs.” Enabling them to focus on more strategic development activities. They performed a thorough analysis of each component, looking at the total cost of ownership, including operations and management. In doing so, they implemented the best practice from the Cost Optimization pillar: “How do you evaluate cost when you select services?”

In the Cost Optimization pillar, a key question is “How do you use pricing models to reduce costs?” Iponweb deployed runners in Amazon EKS for precise, granular, and on-demand compute scaling for each CI job. These tasks have short-term capacity needs, so Iponweb benefited from configuring Amazon EKS on Spot Instances, achieving factor price reduction. The EC2 Spot pricing model is most appropriate for their CI resource needs and usage patterns.

To protect their data at rest, Iponweb followed a best practice from the Security pillar: “Implement secure key management.” They used AWS Key Management Service (AWS KMS) to manage secrets for the runners.

To protect the code and artifacts, and to ensure these valuable assets don’t leave the CI environment inappropriately, Iponweb followed best practices in Infrastructure Protection from the Security pillar question, “How do you protect your networks?” Iponweb scrupulously defined the network protection requirements, limiting their exposure by controlling traffic at all layers, and implementing security groups to prevent inappropriate access into and out of their VPC.

Michael Benuhis, CTO at Iponweb, says:

“Iponweb was able to get the best of open-source software and public cloud services by building the continuous integration platform on Amazon Web Services. Open-source tools provided Iponweb platform agnosticism for serving our diverse customer base, while managed Amazon EKS on EC2 Spot Instances eliminated the operational burden of managing our own Kubernetes infrastructure, and with greater cost efficiency.”

Conclusion

Iponweb has satisfied their current needs and aren’t looking for improvement in the short term. They will stay on the free version of GitLab, satisfied for the moment with what they have achieved. They have custom automations in place to synchronize with GitLab and integrate with their existing tools. They like the features provided by the paid version of GitLab, but there isn’t a business case to support an informed decision to upgrade at this time.

They have achieved their goal of using Amazon EKS and Spot under GitLab CI/CD integrated with their existing systems and satisfying their needs.

Create a serverless feedback collector application using Amazon Pinpoint’s two-way SMS functionality

Post Syndicated from Murat Balkan original https://aws.amazon.com/blogs/messaging-and-targeting/create-a-serverless-feedback-collector-application-by-using-amazon-pinpoints-two-way-sms-functionality/

Introduction

Two-way SMS communication is used by many companies to create interactive engagements with their customers. Traditional SMS notifications are one-way. While this is valid for many different use cases like one-time passwords (OTP) notifications and security notifications or reminders, some other use-cases may benefit from collecting information from the same channel. Two-way SMS allows customers to create this feedback mechanism and enhance business interactions and overall customer experience.

SMS is chosen for its simplicity and availability across different sets of devices. By combining the two-way SMS mechanism with the vast breadth of services Amazon Web Services (AWS) offers, companies can create effective architectures to better interact and serve their customers.

This blog post shows you how a serverless online appointment application can use Amazon Pinpoint’s two-way SMS functionality to collect customer feedback for completed appointments. You will learn how Amazon Pinpoint interacts with other AWS serverless services with its out-of-the-box integrations to create a scalable messaging application.

Architecture

By completing the steps in this post, you can create a system that uses the architecture illustrated in the following image:

The architecture of a feedback collector application that is composed of serverless AWS services

The flow of events starts when a Amazon DynamoDB table item, representing an online appointment, changes its status to COMPLETED. An AWS Lambda function which is subscribed to these changes over DynamoDB Streams detects this change and sends an SMS to the customer by using Amazon Pinpoint API’s sendMessages operation.

Amazon Pinpoint delivers the SMS to the recipient and generates a unique message ID to the AWS Lambda function. The Lambda function then adds this message ID to a DynamoDB table called “message-lookup”. This table is used for tracking different feedback requests sent during a multi-step conversation and associate them with the appointment ids. At this stage, the Lambda function also populates another table “feedbacks” which will hold the feedback responses that will be sent as SMS reply messages.

Each time a recipient replies to an SMS, Amazon Pinpoint publishes this reply event to an Amazon SNS topic which is subscribed by an Amazon SQS queue. Amazon Pinpoint will also add a messageId to this event which allows you to bind it to a sendMessages operation call.

A second AWS Lambda function polls these reply events from the Amazon SQS queue. It checks whether the reply is in the correct format (i.e. a number) and also associated with a previous request. If all conditions are met, the AWS Lambda function checks the ConversationStage attribute’s value from its message-lookup table. According to the current stage and the SMS answer received, AWS Lambda function will determine the next step.

For example, if the feedback score received is less than 5, a follow-up SMS is sent to the user asking if they’ll be happy to receive a call from the customer support team.

All SMS replies from the users are reflected to “feedbacks” table for further analysis.

Deploying the Sample Application

  1. Clone this GitHub repository to your local machine and install and configure AWS SAM with a test AWS IAM user.

You will use AWS SAM to deploy the remaining parts of this serverless architecture.

The AWS SAM template creates the following resources:

    • An Amazon DynamoDB table (appointments) that contains information about appointments, customers and their appointment status.
    • An Amazon DynamoDB table (feedbacks) that holds the received feedbacks from customers.
    • An Amazon DynamoDB table (message-lookup) that holds the Amazon Pinpoint message ids and associate them to appointments to track a multi-step conversation.
    • Two AWS Lambda functions (FeedbackSender and FeedbackReceiver)
    • An Amazon SNS topic that collects state change events from Amazon Pinpoint.
    • An Amazon SQS queue that queues the incoming messages.
    • An Amazon Pinpoint Application with an associated SMS channel.

This architecture consists of two Lambda functions, which are represented as two different apps in the AWS SAM template. These functions are named FeedbackSender and FeedbackReceiver. The FeedbackSender function listens the Amazon DynamoDB Stream associated with the appointments table and sends the SMS message requesting a feedback. Second Lambda function, FeedbackReceiver, polls the Amazon SQS queue and updates the feedbacks table in Amazon DynamoDB. (pinpoint-two-way-sms)

          Note: You’ll incur some costs by deploying this stack into your account.

  1. To start the SAM deployment, navigate to the root directory of the repository you downloaded and where the template.yaml AWS SAM template resides. AWS SAM also requires you to specify an Amazon Simple Storage Service (Amazon S3) bucket to hold the deployment artifacts. If you haven’t already created a bucket for this purpose, create one now. The bucket should have read and write access by an AWS Identity and Access Management (IAM) user.

At the command line, enter the following command to package the application:

sam package --template template.yaml --output-template-file output_template.yaml --s3-bucket BUCKET_NAME_HERE

In the preceding command, replace BUCKET_NAME_HERE with the name of the Amazon S3 bucket that should hold the deployment artifacts.

AWS SAM packages the application and copies it into this Amazon S3 bucket.

When the AWS SAM package command finishes running, enter the following command to deploy the package:

sam deploy --template-file output_template.yaml --stack-name BlogStackPinpoint --capabilities CAPABILITY_IAM

When you run this command, AWS SAM shows the progress of the deployment. When the deployment finishes, navigate to the Amazon Pinpoint console and choose the project named “BlogApplication”. This example uses “BlogStackPinpoint” as the stack name, you can change this to any other name you want.

  1. From the left navigation, choose Settings, SMS and voice. On the SMS and voice settings page, choose the Request phone number button under Number settings

Screenshot of request phone number screen

  1. Choose a target country. Set the Default message type as Transactional, and click on the Request long codes button to buy a long code.

Note: In United States, you can also request a Toll Free Number(TFN)

Screenshot showing long code additio

A long code will be added to the Number settings list.

  1. Choose the newly added number to reach the SMS Settings page and enable the option Enable two-way-SMS. At the Incoming messages destination, select Choose an existing SNS topic, and from the drop down select the Amazon SNS topic that was created by the BlogStackPinpoint stack.

Choose Save to save your SMS settings.


Testing the Sample Application

Now that the application is deployed and configured, test it by creating sample records in the Amazon DynamoDB table. Navigate to Amazon DynamoDB console and reach the tables view. Inspect the tables that were created by the AWS SAM application.

Here, appointments table is the table where the appointments and their statuses are kept. It tracks the appointment lifecycle events with items identified by unique ids. In this sample scenario, we are assuming that an appointment application creates a record with ‘CREATED’ status when a new appointment is planned. After the appointment is finished, same application updates the status to ‘COMPLETED’ which will trigger the feedback collection process. Feedback results are collected in the feedbacks table. Amazon Pinpoint message id’s, conversation stage and appointment id’s are kept in the message-lookup table.

  1. To start testing the end-to-end flow, choose the appointments table to open table overview page.
  2. Next, select the Items tab and choose the Create item From the dropdown, select Text. Add the following and choose Save to create your first appointment object. While adding the following object, replace CustomerPhone attribute’s value with a phone number you own. The feedback request messages will be delivered to that number. Note: This number should match the country number for the long code you provisioned.

{

"CustomerName": "Customer A",

"CustomerPhone": "+12345678900",

"AppointmentStatus":"CREATED",

"id": "1"

}

  1. To trigger sending the feedback SMS, you need to set an existing item’s status to “COMPLETED” To do this, select the item and click Edit from the Actions menu.

Replace the item’s current JSON with the following.

{

"AppointmentStatus": "COMPLETED",

"CustomerName": "Customer A",

"CustomerPhone": "+12345678900",

"id": "1"

}

  1. Before choosing the Save button, double check that you have set CustomerPhone attribute’s value to a valid phone number.

After the change, you should receive an SMS message asking for a feedback. Provide a numeric reply of that is less than five to this message. This will trigger a follow up question asking for a consent to receive an in-person callback.


During your SMS conversation with the application, inspect the feedbacks table. The feedback you have given over this two-way SMS channel should have been reflected into the table.

If you want to repeat the process, make sure to increment the AppointmentId field for any additional appointment records.

Cleanup

To clean up the resources you used in your account, simply navigate to AWS Cloudformation console and delete the stack named “BlogStackPinpoint”.

After the stack is deleted, you also need to delete the Long code from the Pinpoint Console by choosing the number and pressing Remove phone number button. You can also delete the Amazon S3 bucket you used for packaging and deploying the AWS SAM application.

Conclusion

This architecture shows how Amazon Pinpoint can be used to make two-way SMS communication with your customers. You can implement Two-way SMS functionality in other use cases such as appointment reminders, polls, Q&A services, and more.

To learn more about Pinpoint and it’s two-way SMS mechanism, you can visit the Pinpoint documentation.


Supporting AWS Graviton2 and x86 instance types in the same Auto Scaling group

Post Syndicated from Emma White original https://aws.amazon.com/blogs/compute/supporting-aws-graviton2-and-x86-instance-types-in-the-same-auto-scaling-group/

This post is written by Tyler Lynch, Sr. Solutions Architect – EdTech, and Praneeth Tekula, Technical Account Manager.

As customers seek performance improvements and to cost optimize their workloads, they are evaluating and adopting AWS Graviton2 based instances. This post provides instructions on how to configure your Amazon EC2 Auto Scaling group (ASG) to use both Graviton2 and x86 based Amazon EC2 Instances in the same Auto Scaling group with different AMIs. This allows you to introduce Graviton2 based instances as part of a multiple instance type strategy.

For example, a customer may want to use the same Auto Scaling group definition across multiple Regions, but an instance type might not available in that region yet. Implementing instance and architecture diversity allow those Auto Scaling group definitions to be portable.

Solution Overview

The Amazon EC2 Auto Scaling console currently doesn’t support the selection of multiple launch templates, so I use the AWS Command Line Interface (AWS CLI) throughout this post. First, you create your launch templates that specify AMIs for use on x86 and arm64 based instances. Then you create your Auto Scaling group using a mixed instance policy with instance level overrides to specify the launch template to use for that instance.

Finally, you extend the launch templates to use architecture-specific EC2 user data to download architecture-specific binaries. Putting it all together, here are the high-level steps to follow:

  1. Create the launch templates:
    1. Launch template for x86– Creates a launch template for x86 instances, specifying the AMI but not the instance sizes.
    2. Launch template for arm64– Creates a launch template for arm64 instances, specifying the AMI but not the instance sizes.
  2. Create the Auto Scaling group that references the launch templates in a mixed instance policy override.
  3. Create a sample Node.js application.
  4. Create the architecture-specific user data scripts.
  5. Modify the launch templates to use architecture-specific user data scripts.

Prerequisites

The prerequisites for this solution are as follows:

  • The AWS CLI installed locally. I use AWS CLI version 2 for this post.
    • For AWS CLI v2, you must use 2.1.3+
    • For AWS CLI v1, you must use 1.18.182+
  • The correct AWS Identity and Access Management(IAM) role permissions for your account allowing for the creation and execution of the launch templates, Auto Scaling groups, and launching EC2 instances.
  • A source control service such as AWS CodeCommit or GitHub that your user data script can interact with to git clone the Hello World Node.js application.
  • The source code repository initialized and cloned locally.

Create the Launch Templates

You start with creating the launch template for x86 instances, and then the launch template for arm64 instances. These are simple launch templates where you only specify the AMI for Amazon Linux 2 in US-EAST-1 (architecture dependent). You use the AWS CLI cli-input-json feature to make things more readable and repeatable.

You first must add the lt-x86-cli-input.json file to your local working for reference by the AWS CLI.

  1. In your preferred text editor, add a new file, and copy paste the following JSON into the file.

{
    "LaunchTemplateName": "lt-x86",
    "VersionDescription": "LaunchTemplate for x86 instance types using Amazon Linux 2 x86 AMI in US-EAST-1",
    "LaunchTemplateData": {
        "ImageId": "ami-04bf6dcdc9ab498ca"
    }
}
  1. Save the file in your local working directory and name it lt-x86-cli-input.json.

Now, add the lt-arm64-cli-input.json file into your local working directory.

  1. In a text editor, add a new file, and copy paste the following JSON into the file.

{
    "LaunchTemplateName": "lt-arm64",
    "VersionDescription": "LaunchTemplate for Graviton2 instance types using Amazon Linux 2 Arm64 AMI in US-EAST-1",
    "LaunchTemplateData": {
        "ImageId": "ami-09e7aedfda734b173"
    }
}
  1. Save the file in your local working directory and name it lt-arm64-cli-input.json.

Now that your CLI input files are ready, create your launch templates using the CLI.

From your terminal, run the following commands:


aws ec2 create-launch-template \
            --cli-input-json file://./lt-x86-cli-input.json \
            --region us-east-1

aws ec2 create-launch-template \
            --cli-input-json file://./lt-arm64-cli-input.json \
            --region us-east-1

After you run each command, you should see the command output similar to this:


{
	"LaunchTemplate": {
		"LaunchTemplateId": "lt-07ab8c76f8e021b0c",
		"LaunchTemplateName": "lt-x86",
		"CreateTime": "2020-11-20T16:08:08+00:00",
		"CreatedBy": "arn:aws:sts::111111111111:assumed-role/Admin/myusername",
		"DefaultVersionNumber": 1,
		"LatestVersionNumber": 1
	}
}

{
	"LaunchTemplate": {
		"LaunchTemplateId": "lt-0c65656a2c75c0f76",
		"LaunchTemplateName": "lt-arm64",
		"CreateTime": "2020-11-20T16:08:37+00:00",
		"CreatedBy": "arn:aws:sts::111111111111:assumed-role/Admin/myusername",
		"DefaultVersionNumber": 1,
		"LatestVersionNumber": 1
	}
}

Create the Auto Scaling Group

Moving on to creating your Auto Scaling group, start with creating another JSON file to use the cli-input-json feature. Then, create the Auto Scaling group via the CLI.

I want to call special attention to the LaunchTemplateSpecification under the MixedInstancePolicy Overrides property. This Auto Scaling group is being created with a default launch template, the one you created for arm64 based instances. You override that at the instance level for x86 instances.

Now, add the asg-mixed-arch-cli-input.json file into your local working directory.

  1. In a text editor, add a new file, and copy paste the following JSON into the file.
  2. You need to change the subnet IDs specified in the VPCZoneIdentifier to your own subnet IDs.

{
    "AutoScalingGroupName": "asg-mixed-arch",
    "MixedInstancesPolicy": {
        "LaunchTemplate": {
            "LaunchTemplateSpecification": {
                "LaunchTemplateName": "lt-arm64",
                "Version": "$Default"
            },
            "Overrides": [
                {
                    "InstanceType": "t4g.micro"
                },
                {
                    "InstanceType": "t3.micro",
                    "LaunchTemplateSpecification": {
                        "LaunchTemplateName": "lt-x86",
                        "Version": "$Default"
                    }
                },
                {
                    "InstanceType": "t3a.micro",
                    "LaunchTemplateSpecification": {
                        "LaunchTemplateName": "lt-x86",
                        "Version": "$Default"
                    }
                }
            ]
        }
    },    
    "MinSize": 1,
    "MaxSize": 5,
    "DesiredCapacity": 3,
    "VPCZoneIdentifier": "subnet-e92485b6, subnet-07fe637b44fd23c31, subnet-828622e4, subnet-9bd6a2d6"
}
  1. Save the file in your local working directory and name it asg-mixed-arch-cli-input.json.

Now that your CLI input file is ready, create your Auto Scaling group using the CLI.

  1. From your terminal, run the following command:

aws autoscaling create-auto-scaling-group \
            --cli-input-json file://./asg-mixed-arch-cli-input.json \
            --region us-east-1

After you run the command, there isn’t any immediate output. Describe the Auto Scaling group to review the configuration.

  1. From your terminal, run the following command:

aws autoscaling describe-auto-scaling-groups \
            --auto-scaling-group-names asg-mixed-arch \
            --region us-east-1

Let’s evaluate the output. I removed some of the output for brevity. It shows that you have an Auto Scaling group with a mixed instance policy, which specifies a default launch template named lt-arm64. In the Overrides property, you can see the instances types that you specified and the values that define the lt-x86 launch template to be used for specific instance types (t3.micro, t3a.micro).


{
    "AutoScalingGroups": [
        {
            "AutoScalingGroupName": "asg-mixed-arch",
            "AutoScalingGroupARN": "arn:aws:autoscaling:us-east-1:111111111111:autoScalingGroup:a1a1a1a1-a1a1-a1a1-a1a1-a1a1a1a1a1a1:autoScalingGroupName/asg-mixed-arch",
            "MixedInstancesPolicy": {
                "LaunchTemplate": {
                    "LaunchTemplateSpecification": {
                        "LaunchTemplateId": "lt-0cc7dae79a397d663",
                        "LaunchTemplateName": "lt-arm64",
                        "Version": "$Default"
                    },
                    "Overrides": [
                        {
                            "InstanceType": "t4g.micro"
                        },
                        {
                            "InstanceType": "t3.micro",
                            "LaunchTemplateSpecification": {
                                "LaunchTemplateId": "lt-04b525bfbde0dcebb",
                                "LaunchTemplateName": "lt-x86",
                                "Version": "$Default"
                            }
                        },
                        {
                            "InstanceType": "t3a.micro",
                            "LaunchTemplateSpecification": {
                                "LaunchTemplateId": "lt-04b525bfbde0dcebb",
                                "LaunchTemplateName": "lt-x86",
                                "Version": "$Default"
                            }
                        }
                    ]
                },
                ...
            },
            ...
            "Instances": [
                {
                    "InstanceId": "i-00377a23630a5e107",
                    "InstanceType": "t4g.micro",
                    "AvailabilityZone": "us-east-1b",
                    "LifecycleState": "InService",
                    "HealthStatus": "Healthy",
                    "LaunchTemplate": {
                        "LaunchTemplateId": "lt-0cc7dae79a397d663",
                        "LaunchTemplateName": "lt-arm64",
                        "Version": "1"
                    },
                    "ProtectedFromScaleIn": false
                },
                {
                    "InstanceId": "i-07c2d4f875f1f457e",
                    "InstanceType": "t4g.micro",
                    "AvailabilityZone": "us-east-1a",
                    "LifecycleState": "InService",
                    "HealthStatus": "Healthy",
                    "LaunchTemplate": {
                        "LaunchTemplateId": "lt-0cc7dae79a397d663",
                        "LaunchTemplateName": "lt-arm64",
                        "Version": "1"
                    },
                    "ProtectedFromScaleIn": false
                },
                {
                    "InstanceId": "i-09e61e95cdf705ade",
                    "InstanceType": "t4g.micro",
                    "AvailabilityZone": "us-east-1c",
                    "LifecycleState": "InService",
                    "HealthStatus": "Healthy",
                    "LaunchTemplate": {
                        "LaunchTemplateId": "lt-0cc7dae79a397d663",
                        "LaunchTemplateName": "lt-arm64",
                        "Version": "1"
                    },
                    "ProtectedFromScaleIn": false
                }
            ],
            ...
        }
    ]
}

Create Hello World Node.js App

Now that you have created the launch templates and the Auto Scaling group you are ready to create the “hello world” application that self-reports the processor architecture. You work in the local directory that is cloned from your source repository as specified in the prerequisites. This doesn’t have to be the local working directory where you are creating architecture-specific files.

  1. In a text editor, add a new file with the following Node.js code:

// Hello World sample app.
const http = require('http');

const port = 3000;

const server = http.createServer((req, res) => {
  res.statusCode = 200;
  res.setHeader('Content-Type', 'text/plain');
  res.end(`Hello World. This processor architecture is ${process.arch}`);
});

server.listen(port, () => {
  console.log(`Server running on processor architecture ${process.arch}`);
});
  1. Save the file in the root of your source repository and name it app.js.
  2. Commit the changes to Git and push the changes to your source repository. See the following commands:

git add .
git commit -m "Adding Node.js sample application."
git push

Create user data scripts

Moving on to your creating architecture-specific user data scripts that will define the version of Node.js and the distribution that matches the processor architecture. It will download and extract the binary and add the binary path to the environment PATH. Then it will clone the Hello World app, and then run that app with the binary of Node.js that was installed.

Now, you must add the ud-x86-cli-input.txt file to your local working directory.

  1. In your text editor, add a new file, and copy paste the following text into the file.
  2. Update the git clone command to use the repo URL where you created the Hello World app previously.
  3. Update the cd command to use the repo name.

sudo yum update -y
sudo yum install git -y
VERSION=v14.15.3
DISTRO=linux-x64
wget https://nodejs.org/dist/$VERSION/node-$VERSION-$DISTRO.tar.xz
sudo mkdir -p /usr/local/lib/nodejs
sudo tar -xJvf node-$VERSION-$DISTRO.tar.xz -C /usr/local/lib/nodejs 
export PATH=/usr/local/lib/nodejs/node-$VERSION-$DISTRO/bin:$PATH
git clone https://github.com/<<githubuser>>/<<repo>>.git
cd <<repo>>
node app.js
  1. Save the file in your local working directory and name it ud-x86-cli-input.txt.

Now, add the ud-arm64-cli-input.txt file into your local working directory.

  1. In a text editor, add a new file, and copy paste the following text into the file.
  2. Update the git clone command to use the repo URL where you created the Hello World app previously.
  3. Update the cd command to use the repo name.

sudo yum update -y
sudo yum install git -y
VERSION=v14.15.3
DISTRO=linux-arm64
wget https://nodejs.org/dist/$VERSION/node-$VERSION-$DISTRO.tar.xz
sudo mkdir -p /usr/local/lib/nodejs
sudo tar -xJvf node-$VERSION-$DISTRO.tar.xz -C /usr/local/lib/nodejs 
export PATH=/usr/local/lib/nodejs/node-$VERSION-$DISTRO/bin:$PATH
git clone https://github.com/<<githubuser>>/<<repo>>.git
cd <<repo>>
node app.js
  1. Save the file in your local working directory and name it ud-arm64-cli-input.txt.

Now that your user data scripts are ready, you need to base64 encode them as the AWS CLI does not perform base64-encoding of the user data for you.

  • On a Linux computer, from your terminal use the base64 command to encode the user data scripts.

base64 ud-x86-cli-input.txt > ud-x86-cli-input-base64.txt
base64 ud-arm64-cli-input.txt > ud-arm64-cli-input-base64.txt
  • On a Windows computer, from your command line use the certutil command to encode the user data. Before you can use this file with the AWS CLI, you must remove the first (BEGIN CERTIFICATE) and last (END CERTIFICATE) lines.

certutil -encode ud-x86-cli-input.txt ud-x86-cli-input-base64.txt
certutil -encode ud-arm64-cli-input.txt ud-arm64-cli-input-base64.txt
notepad ud-x86-cli-input-base64.txt
notepad ud-arm64-cli-input-base64.txt

Modify the Launch Templates

Now, you modify the launch templates to use architecture-specific user data scripts.

Please note that the contents of your ud-x86-cli-input-base64.txt and ud-arm64-cli-input-base64.txt files are different from the samples here because you referenced your own GitHub repository. These base64 encoded user data scripts below will not work as is, they contain placeholder references for the git clone and cd commands.

Next, update the lt-x86-cli-input.json file to include your base64 encoded user data script for x86 based instances.

  1. In your preferred text editor, open the ud-x86-cli-input-base64.txt file.
  2. Open the lt-x86-cli-input.json file, and add in the text from the ud-x86-cli-input-base64.txt file into the UserData property of the LaunchTemplateData object. It should look similar to this:

{
    "LaunchTemplateName": "lt-x86",
    "VersionDescription": "LaunchTemplate for x86 instance types using Amazon Linux 2 x86 AMI in US-EAST-1",
    "LaunchTemplateData": {
        "ImageId": "ami-04bf6dcdc9ab498ca",
        "UserData": "IyEvYmluL2Jhc2gKeXVtIHVwZGF0ZSAteQoKVkVSU0lPTj12MTQuMTUuMwpESVNUUk89bGludXgteDY0CndnZXQgaHR0cHM6Ly9ub2RlanMub3JnL2Rpc3QvJFZFUlNJT04vbm9kZS0kVkVSU0lPTi0kRElTVFJPLnRhci54egpzdWRvIG1rZGlyIC1wIC91c3IvbG9jYWwvbGliL25vZGVqcwpzdWRvIHRhciAteEp2ZiBub2RlLSRWRVJTSU9OLSRESVNUUk8udGFyLnh6IC1DIC91c3IvbG9jYWwvbGliL25vZGVqcyAKZXhwb3J0IFBBVEg9L3Vzci9sb2NhbC9saWIvbm9kZWpzL25vZGUtJFZFUlNJT04tJERJU1RSTy9iaW46JFBBVEgKZ2l0IGNsb25lIGh0dHBzOi8vZ2l0aHViLmNvbS88PGdpdGh1YnVzZXI+Pi88PHJlcG8+Pi5naXQKY2QgPDxyZXBvPj4Kbm9kZSBhcHAuanMK"
    }
}
  1. Save the file.

Next, update the lt-arm64-cli-input.json file to include your base64 encoded user data script for arm64 based instances.

  1. In your text editor, open the ud-arm64-cli-input-base64.txt file.
  2. Open the lt-arm64-cli-input.json file, and add in the text from the ud-arm64-cli-input-base64.txt file into the UserData property of the LaunchTemplateData It should look similar to this:

{
    "LaunchTemplateName": "lt-arm64",
    "VersionDescription": "LaunchTemplate for Graviton2 instance types using Amazon Linux 2 Arm64 AMI in US-EAST-1",
    "LaunchTemplateData": {
        "ImageId": "ami-09e7aedfda734b173",
        "UserData": "IyEvYmluL2Jhc2gKeXVtIHVwZGF0ZSAteQoKVkVSU0lPTj12MTQuMTUuMwpESVNUUk89bGludXgtYXJtNjQKd2dldCBodHRwczovL25vZGVqcy5vcmcvZGlzdC8kVkVSU0lPTi9ub2RlLSRWRVJTSU9OLSRESVNUUk8udGFyLnh6CnN1ZG8gbWtkaXIgLXAgL3Vzci9sb2NhbC9saWIvbm9kZWpzCnN1ZG8gdGFyIC14SnZmIG5vZGUtJFZFUlNJT04tJERJU1RSTy50YXIueHogLUMgL3Vzci9sb2NhbC9saWIvbm9kZWpzIApleHBvcnQgUEFUSD0vdXNyL2xvY2FsL2xpYi9ub2RlanMvbm9kZS0kVkVSU0lPTi0kRElTVFJPL2JpbjokUEFUSApnaXQgY2xvbmUgaHR0cHM6Ly9naXRodWIuY29tLzw8Z2l0aHVidXNlcj4+Lzw8cmVwbz4+LmdpdApjZCA8PHJlcG8+Pgpub2RlIGFwcC5qcwoKCg=="
    }
}
  1. Save the file.

Now, your CLI input files are ready. Next, create a new version of your launch templates and then set the newest version as the default.

From your terminal, run the following commands:


aws ec2 create-launch-template-version \
            --cli-input-json file://./lt-x86-cli-input.json \
            --region us-east-1

aws ec2 create-launch-template-version \
            --cli-input-json file://./lt-arm64-cli-input.json \
            --region us-east-1

aws ec2 modify-launch-template \
            --launch-template-name lt-x86 \
            --default-version 2
			
aws ec2 modify-launch-template \
            --launch-template-name lt-arm64 \
            --default-version 2

After you run each command, you should see the command output similar to this:


{
    "LaunchTemplate": {
        "LaunchTemplateId": "lt-08ff3d03d4cf0038d",
        "LaunchTemplateName": "lt-x86",
        "CreateTime": "1970-01-01T00:00:00+00:00",
        "CreatedBy": "arn:aws:sts::111111111111:assumed-role/Admin/myusername",
        "DefaultVersionNumber": 2,
        "LatestVersionNumber": 2
    }
}

{
    "LaunchTemplate": {
        "LaunchTemplateId": "lt-0c5e1eb862a02f8e0",
        "LaunchTemplateName": "lt-arm64",
        "CreateTime": "1970-01-01T00:00:00+00:00",
        "CreatedBy": "arn:aws:sts::111111111111:assumed-role/Admin/myusername",
        "DefaultVersionNumber": 2,
        "LatestVersionNumber": 2
    }
}

Now, refresh the instances in the Auto Scaling group so that the newest version of the launch template is used.

From your terminal, run the following command:


aws autoscaling start-instance-refresh \
            --auto-scaling-group-name asg-mixed-arch

Verify Instances

The sample Node.js application self reports the process architecture in two ways: when the application is started, and when the application receives a HTTP request on port 3000. Retrieve the last five lines of the instance console output via the AWS CLI.

First, you need to get an instance ID from the autoscaling group.

  1. From your terminal, run the following commands:

aws autoscaling describe-auto-scaling-groups \
            --auto-scaling-group-name asg-mixed-arch \
            --region us-east-1
  1. Evaluate the output. I removed some of the output for brevity. You need to use the InstanceID from the output.

{
    "AutoScalingGroups": [
        {
            "AutoScalingGroupName": "asg-mixed-arch",
            "AutoScalingGroupARN": "arn:aws:autoscaling:us-east-1:111111111111:autoScalingGroup:a1a1a1a1-a1a1-a1a1-a1a1-a1a1a1a1a1a1:autoScalingGroupName/asg-mixed-arch",
            "MixedInstancesPolicy": {
                ...
            },
            ...
            "Instances": [
                {
                    "InstanceId": "i-0eeadb140405cc09b",
                    "InstanceType": "t4g.micro",
                    "AvailabilityZone": "us-east-1a",
                    "LifecycleState": "InService",
                    "HealthStatus": "Healthy",
                    "LaunchTemplate": {
                        "LaunchTemplateId": "lt-0c5e1eb862a02f8e0",
                        "LaunchTemplateName": "lt-arm64",
                        "Version": "2"
                    },
                    "ProtectedFromScaleIn": false
                }
            ],
          ....
        }
    ]
}

Now, retrieve the last five lines of console output from the instance.

From your terminal, run the following command:


aws ec2 get-console-output –instance-id d i-0eeadb140405cc09b \
            --output text | tail -n 5

Evaluate the output, you should see Server running on processor architecture arm64. This confirms that you have successfully utilized an architecture-specific user data script.


[  58.798184] cloud-init[1257]: node-v14.15.3-linux-arm64/share/systemtap/tapset/node.stp
[  58.798293] cloud-init[1257]: node-v14.15.3-linux-arm64/LICENSE
[  58.798402] cloud-init[1257]: Cloning into 'node-helloworld'...
[  58.798510] cloud-init[1257]: Server running on processor architecture arm64
2021-01-14T21:14:32+00:00

Cleaning Up

Delete the Auto Scaling group and use the force-delete option. The force-delete option specifies that the group is to be deleted along with all instances associated with the group, without waiting for all instances to be terminated.


aws autoscaling delete-auto-scaling-group \
            --auto-scaling-group-name asg-mixed-arch --force-delete \
            --region us-east-1

Now, delete your launch templates.


aws ec2 delete-launch-template --launch-template-name lt-x86
aws ec2 delete-launch-template --launch-template-name lt-arm64

Conclusion

You walked through creating and using architecture-specific user data scripts that were processor architecture-specific. This same method could be applied to fleets where you have different configurations needed for different instance types. Variability such as disk sizes, networking configurations, placement groups, and tagging can now be accomplished in the same Auto Scaling group.
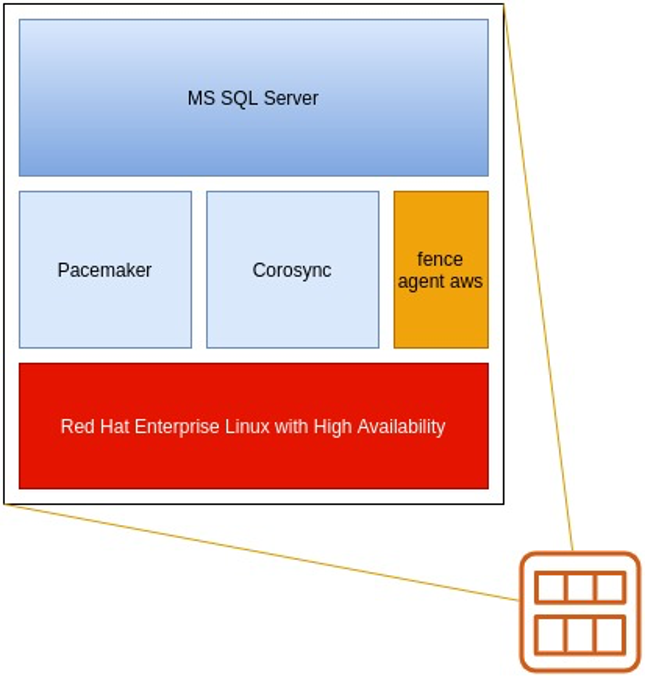
Essential security for everyone: Building a secure AWS foundation

Post Syndicated from Byron Pogson original https://aws.amazon.com/blogs/security/essential-security-for-everyone-building-a-secure-aws-foundation/

In this post, I will show you how teams of all sizes can gain access to world-class security in the cloud without a dedicated security person in your organization. I look at how small teams can build securely on Amazon Web Services (AWS) in a way that’s cost effective and time efficient. I show you the key elements to create a foundation with good security controls, and how you can then use that foundation as a base to build a secure workload upon. In this post, I will also share a lab guide to get you started today. It may look like a lot of work but I ran this as a day-long workshop across Australia in 2019 reaching many start-ups and small businesses. The majority of them implemented the guide by mid-afternoon.

Many large organizations run their regulated workloads on AWS and customers of all sizes have the same security controls available to them. These large organizations have gone through a rigorous process to ensure that the right security controls are available to them. If you go to the AWS Startups Blog, you can read the story of two Australian customers and their journeys to set up a secure foundation on AWS: Tic:Toc, an Australian scaleup in the financial services industry and FYI, a start-up with their document and process management system for accounting practices.

The Well-Architected Framework has been developed to help cloud architects build secure, high performance, resilient, and efficient infrastructure for their applications. Based on five pillars—operational excellence, security, reliability, performance efficiency, and cost optimization—the Framework provides a consistent approach for customers and partners to evaluate architectures and implement designs that will scale over time. In this post, I will discuss the key areas from the security pillar to help you build a secure foundation. These areas are:

  • Security foundations. You can use an AWS account as a coarse boundary for isolating resources and use cross-account roles to share common infrastructure. Protect your AWS accounts and use tools like AWS Control Tower to help you get started quickly.
  • Identity and access management. Be deliberate about who has access to what.
  • Detection. Start with the implementation of baseline logging and monitoring. Do this in a way that’s implemented automatically so it is scalable. When incidents occur, this will help to ensure that basic log data is in place to aid your investigations. Configure alerts for key events and define your response plan so you are prepared to take action.
  • Infrastructure and data protection. Apply defense in depth, starting with the features that AWS provides you, to help build a secure application.
  • Incidence response. Ensure your team is prepared to respond to incidents by educating your team, creating a response plan, simulating scenarios so your team knows what to do before it happens and iterating to improve your plan.

Small teams want to move fast and deliver value. To support that, you want to build a secure foundation. This post focuses on the key initial steps to help you achieve that. To help guide you through the content in this post and implement your foundation faster, we have a Quick Steps to Security Success quest in our Well-Architected Labs.

Security Foundations

With a strong foundation in place to support your workload, you can look at how to build securely on top of it. Security is part of every feature, not a separate feature to be implemented later. Teams need to be comfortable with the idea that a feature isn’t complete just when it’s tested and in production. Adjust your culture to think of complete as meaning tested and secure in production.

An AWS account is a boundary within which resources are deployed. You can open multiple AWS accounts for different purposes. For example, to separate different applications you operate by splitting different workloads across multiple environments in different accounts, to provide developer sandbox accounts or to isolated resources such as a security account. A workload is a collection of systems and applications to meet a specific business objective and could be a useful guide for determining what needs to be deployed into separate accounts. From a security point of view, being able to use an AWS account as a boundary helps isolate different parts of your workloads. The account boundary acts as a coarse isolation boundary and you have to be deliberate about how you allow access to resources in it. For human access, this can form a basis for providing least privilege access – an IAM best practice for ensuring that users only have permissions required to fulfil their tasks.

A best practice is to keep users away from data – least privilege could start with not providing access to the production environment. One way to achieve this is to create a separate account for your production workload and ensure that all regular operations are performed at a distance through tools such as pipelines or ticketing systems. Where human access is essential, only grant temporary human access for a fixed period of time. In addition to limited IAM policies, you can give people access only to AWS accounts containing the workload they need access to. For machine-to-machine access you can apply the same concepts and use cross-account access.

At a minimum, it’s a best practice to have a separate organizational management account that’s only used to establish controls across your set of accounts and for configuring identity and access management within your organization. The same identity configuration is then used across accounts. Also, set up a dedicated account for logging to more securely store data such as audit logs. To increase security, create an audit account that has read-only access to the logs and other accounts used by your security team. Then create different accounts for different environments and workloads.

The easiest way to get started creating and organizing accounts is to use AWS Control Tower, which will set up a separated logging and audit account, an AWS Single Sign-On (AWS SSO) directory—which supports identity federation with SAML 2.0—as well as a few basic guardrails. AWS SSO can also give users a single view of all the accounts and roles within those accounts that they have access to. AWS Control Tower also includes a basic account-creation tool—the Account Factory—that you can use to create additional accounts within your AWS account structure.

Guardrails are an important mechanism that customers can implement to help maintain security in the cloud. AWS Control Tower provides two types of guardrails: preventive and detective.

Preventive guardrails are designed to prevent users from performing certain actions; for example, preventing a user from disabling security logging. You can implement preventative guardrails through AWS Control Tower, which provides a feature of AWS Organizations called Service Control Policies (SCP) that you can use to set the maximum boundary for what is allowed in an account. These guardrails are either enforced or disabled.

Detective guardrails look at the state of resources in an account using AWS Config rules and indicate if resources are compliant to those rules or not. For example, looking for Amazon Simple Storage Service (Amazon S3) buckets that are publicly accessible. If you need to have data publicly available, be deliberate about how you do it.

AWS Control Tower has a number of mandatory guardrails that are necessary for the operation of AWS Control Tower as well as a number of strongly recommended and elective guardrails. The strongly recommended and elective guardrails help to ensure that you’re building a strong security posture as soon as you enable them.

There is no additional charge to use AWS Control Tower. However, when you set up AWS Control Tower, you will begin to incur costs for AWS services configured to set up your landing zone and mandatory guardrails. For further details see the AWS Control Tower pricing.

Identity and access management

Identity forms the basis of validating that users are who they say they are and how you give them permission to operate in your environment.

When you sign up for an AWS account, the first login you receive is the root user credentials. The root user credentials are very powerful and allows full access to all resources in the account. It’s critical that you protect your root account from unauthorized access, starting with multi-factor authentication. Multi-factor authentication uses a password (something you know) plus something you have (such as a one-time key or a hardware token) to create a more secure login. After you set up multi-factor authentication, both factors are required to access the root account. After that, use the root account only in emergencies, not in day-to-day operations. Moving from using the root account to using centralized identities allows you to manage your identities centrally and tie every action taken in your environment back an individual. The most effective way to enable connecting all actions to individual users is through federation.

Federation lets you reuse your existing identities, such as those you have in your organization’s identity directory. When a user joins your organization, the first thing you’re likely to do is to give them an identity (so they can do things like access your email systems) and when they leave, you would remove that identity and therefore the access. By federating your AWS accounts with your existing identity directory, you can use the same mechanisms that are tied to your business processes to provide AWS access. Using tools like AWS Single Sign-On (AWS SSO) enables you to quickly federate access for your users and maintain a mapping of the AWS IAM roles (an identity with specific permissions that can be assigned to or assumed by other identities) they have access to across accounts in your organization. If you don’t have an existing identity store you can still achieve a central identity store by using the built-in provider in AWS SSO. When you are assigning permissions, be deliberate with what access you give different users. Ensure that you’re creating and assigning roles based on least privilege—giving only as much access as users need to perform their tasks.

IAM is a feature of your AWS account provided at no additional charge and AWS SSO is offered at no extra charge. Implementing SSO is a low effort way to build a strong identity foundation. If you’ve been operating for a while on AWS, you should perform an audit of your existing AWS Identity and Access Management (IAM) users with a goal to move to a centralized model. An audit of your IAM resources (and centralized identities) will help you to understand who has access to your AWS environment, clear unused credentials, and check that users are assigned permissions that are relevant for their role. IAM access advisor will allow you to see when services were last accessed. Tools such as the IAM Access Analyzer will help you identify the resources in your organization and accounts, such as Amazon S3 buckets or IAM roles, that are shared with an external entity. At the same time, make sure that your account contacts are up to date so that you don’t miss any important information from AWS. You can update these details under AWS billing and management in the console.

Detection

After some baseline controls are in place, you need to add controls to ensure that you are aware of what is happening in the environment and that actions are logged. To help you with governance, compliance and auditing your AWS environment you can configure AWS CloudTrail. A CloudTrail log shows you who attempted to take what actions against resources in your AWS account and if the action was allowed or denied. Having a secure store of these logs provides you with an audit history of who did what in your environment. AWS Control Tower configures a secure log store for you in the logging account.

Amazon GuardDuty is a security service that uses intelligent threat detection to alert you to unusual activity in your environment. GuardDuty uses CloudTrail logs to alert you to malicious activity and unauthorized behavior in addition to DNS logs and VPC Flow Logs—which are similar to network flow logs—to analyze the behavior of your workload. GuardDuty builds a baseline over time of activity in your account and alerts you when behavior that strays from the baseline is detected. For example, GuardDuty sends an alert when a user tries to escalate their privilege. These events can be configured in Amazon CloudWatch Events for alerting and triggering automatic actions—for example by triggering an AWS Lambda function to disable the user trying to escalate their privilege until you can contact them.

Implementing manual dashboards though Amazon CloudWatch or those provided with detective tools such as Amazon GuardDuty can give you a clear idea of what’s happening in your environment, but you should also configure alerting for key events. An initial, temporary way of achieving this could be by creating an Amazon CloudWatch Rule with an Amazon SNS topic as the destination and have your team subscribe their email to the SNS topic. As part of setting up alerts, ensure that there’s a remediation process defined for each alert that includes what action to take when an alert is triggered. In the longer term, as your cloud skills mature, you can evolve this to filter out alerts appropriately and iterate your response and remediation processes.

Having a single view of what’s happening in your infrastructure across all accounts and relevant regions gives you a clear picture of the overall state of your environment. Consider using AWS Security Hub to bring together alerts from GuardDuty, other AWS services such as AWS Inspector (for network availability and common vulnerabilities and exposures analysis), and partner products. Security Hub lets you consolidate findings from multiple sources and normalize them so they are comparable. This allows you to have a single view of where you need to take action and what high priority actions are required. Security Hub also allows you to enable compliance checks on your AWS infrastructure to help you adhere to best practices. A great starting point is AWS Foundational Security Best Practices standard.

Both GuardDuty and Security Hub include a free trial period and scale with usage after you turn them on. You can use the trial period to estimate what they will cost to use in all your AWS accounts.

Infrastructure and data protection

Build protection in layers and be aware of what features are available in the services that you’re using. Many AWS services include a specific section on security as part of their developer documentation. Before you add an AWS service, read the security section of the documentation and understand what options are available to you. Make sure that you are understand the cloud-native AWS security services that integrate with the services you use. AWS Key Management Service integrates with many AWS services to enable encryption at rest. For example, you can enable default encryption for all EBS volumes in a region. AWS Certificate Manager provides public certificates which integrate with Elastic Load Balancing and Amazon CloudFront to encrypt data in transit. Public SSL/TLS certificates provisioned through AWS Certificate Manager are free. You pay only for the AWS resources you create to run your application. You can implement AWS WAF (web application firewall) and AWS Shield to protect your HTTPS endpoints. Where implement services that manage resources, such as Amazon RDS, AWS Lambda, and Amazon ECS, to reduce your security maintenance tasks as part of the shared responsibility model.

Incident response

Once you have your baseline security controls in place your team needs to be prepared to respond effectively during an incident. This includes designing your incident response goals, educating your team and preparing to respond. Simulating events helps the team to learn your processes and tools. Always iterate to improve the process for the future. As a start, consider using the GuardDuty finding types as the basis for what you should be able to respond to. Have a look through the finding types, identify which findings are most applicable and write a runbook outlining the steps on how you would respond. For each finding type, test your response process. In doing so your team will ensure they have the right tools available, the right emergency access, and know who they need to escalate to and collaborate with. By simulating your response process, your team becomes practiced in how to respond and will reduce the time to recovery if an incident should occur.

When comfortable with the process, automate it. For example, create a Lambda function to perform remediation without you having to wake up in the middle of the night to take action. This can be built up over time as you build a baseline of events. Spending some time thinking through priority events for your environment will help you develop a playbook to respond to them. When you’re comfortable with what incident responses you need, you can automate those responses so remediation is triggered when an event occurs, though you may also want a human to verify before triggering a potentially impactful response.

For example, one of the GuardDuty finding types identifies when an EC2 instance is querying an IP address that is associated with cryptocurrency-related activity. The suggested remediation is to investigate the instance, create a snapshot, consider stopping and starting a new instance and raise a support case. Your runbook could outline how to do each of those steps or you could use CloudWatch to trigger a Lambda function which will place the instance in an isolated security group with no internet access for investigation later. Further examples of automation can be found in the Getting Hands on with Amazon GuardDuty labs.

Conclusion

In this post, I’ve shown you some of the techniques and services that can be used to build a secure foundation. Build a strong security foundation and have a multi-account strategy that allows you to isolate different workloads within your organization. A strong identity foundation ensures that you know who is doing what in your environment. Logging and monitoring ensures that you are ready to take action. Building security in layers and using the service features available as you build ensures that you’re using the security controls available to all customers on the platform. Be prepared to respond to incidents and regularly practice your response process so your team is ready if an incident should occur.

A secure foundation is just the start. Remember that security is not a separate feature and new features are not complete until they’re tested and securely in production. Build a security culture of continuous improvement, and take action to ensure that you remain secure as you build out your workloads. Iterate to continue to reduce risk. Use the AWS Well-Architected Tool which allows you and your team to review your workload against best practices which can be paired with the Well-Architected labs for hands on learning. As mentioned above, a lab to help you implement the content in this blog post yourself can be found in the Quick Steps to Security Success lab. Don’t forget that you can also read stories from two AWS customers—Tic:Toc and FYI—on the AWS Startups Blog.

If you have feedback about this post, submit comments in the Comments section below. If you have questions about this post, start a new thread on one of the AWS Security, Identity, and Compliance forums or contact AWS Support.

Want more AWS Security how-to content, news, and feature announcements? Follow us on Twitter.

Author

Byron Pogson

Byron helps organizations use technology to solve their biggest problems. With Amazon Web Services he works with teams across West and South Australia to help refine their technology strategies in this fast-changing environment. You can often find him talking about security best practices to help organizations of all sizes to move fast and stay secure.

Operating Lambda: Building a solid security foundation – Part 2

Post Syndicated from James Beswick original https://aws.amazon.com/blogs/compute/operating-lambda-building-a-solid-security-foundation-part-2/

In the Operating Lambda series, I cover important topics for developers, architects, and systems administrators who are managing AWS Lambda-based applications. This two-part series discusses core security concepts for Lambda-based applications.

Part 1 explains the Lambda execution environment and how to apply the principles of least privilege to your workload. This post covers securing workloads with public endpoints, encrypting data, and using AWS CloudTrail for governance, compliance, and operational auditing.

Securing workloads with public endpoints

For workloads that are accessible publicly, AWS provides a number of features and services that can help mitigate certain risks. This section covers authentication and authorization of application users and protecting API endpoints.

Authentication and authorization

Authentication relates to identity and authorization refers to actions. Use authentication to control who can invoke a Lambda function, and then use authorization to control what they can do. For many applications, AWS Identity & Access Management (IAM) is sufficient for managing both control mechanisms.

For applications with external users, such as web or mobile applications, it is common to use JSON Web Tokens (JWTs) to manage authentication and authorization. Unlike traditional, server-based password management, JWTs are passed from the client on every request. They are a cryptographically secure way to verify identity and claims using data passed from the client. For Lambda-based applications, this allows you to secure APIs for each microservice independently, without relying on a central server for authentication.

You can implement JWTs with Amazon Cognito, which is a user directory service that can handle registration, authentication, account recovery, and other common account management operations. For frontend development, Amplify Framework provides libraries to simplify integrating Cognito into your frontend application. You can also use third-party partner services like Auth0.

Given the critical security role of an identity provider service, it’s important to use professional tooling to safeguard your application. It’s not recommended that you write your own services to handle authentication or authorization. Any vulnerabilities in custom libraries may have significant implications for the security of your workload and its data.

Protecting API endpoints

For serverless applications, the preferred way to serve a backend application publicly is to use Amazon API Gateway. This can help you protect an API from malicious users or spikes in traffic.

For authenticated API routes, API Gateway offers both REST APIs and HTTP APIs for serverless developers. Both types support authorization using AWS Lambda, IAM or Amazon Cognito. When using IAM or Amazon Cognito, incoming requests are evaluated and if they are missing a required token or contain invalid authentication, the request is rejected. You are not charged for these requests and they do not count towards any throttling quotas.

Unauthenticated API routes may be accessed by anyone on the public internet so it’s recommended that you limit their use. If you must use unauthenticated APIs, it’s important to protect these against common risks, such as denial-of-service (DoS) attacks. Applying AWS WAF to these APIs can help protect your application from SQL injection and cross-site scripting (XSS) attacks. API Gateway also implements throttling at the AWS account-level and per-client level when API keys are used.

In some cases, the functionality provided by an unauthenticated API can be achieved with an alternative approach. For example, a web application may provide a list of customer retail stores from an Amazon DynamoDB table to users who are not logged in. This request may originate from a frontend web application or from any other source that calls the URL endpoint. This diagram compares three solutions:

Solutions for an unauthenticated API

  1. The unauthenticated API can be called by anyone on the internet. In a denial of service attack, it’s possible to exhaust API throttling limits, Lambda concurrency, or DynamoDB provisioned read capacity on an underlying table.
  2. An Amazon CloudFront distribution in front of the API endpoint with an appropriate time-to-live (TTL) configuration may help absorb traffic in a DoS attack, without changing the underlying solution for fetching the data.
  3. Alternatively, for static data that rarely changes, the CloudFront distribution could serve the data from an S3 bucket.

The AWS Well-Architected Tool provides a Serverless Lens that analyzes the security posture of serverless workloads.

Encrypting data in Lambda-based applications

Managing secrets

For applications handling sensitive data, AWS services provide a range of encryption options for data in transit and at rest. It’s important to identity and classify sensitive data in your workload, and minimize the storage of sensitive data to only what is necessary.

When protecting data at rest, use AWS services for key management and encryption of stored data, secrets and environment variables. Both the AWS Key Management Service and AWS Secrets Manager provide a robust approach to storing and managing secrets used in Lambda functions.

Do not store plaintext secrets or API keys in Lambda environment variables. Instead, use KMS to encrypt environment variables. Also ensure you do not embed secrets directly in function code, or commit these secrets to code repositories.

Using HTTPS securely

HTTPS is encrypted HTTP, using TLS (SSL) to encrypt the request and response, including headers and query parameters. While query parameters are encrypted, URLs may be logged by different services in plaintext, so you should not use these to store sensitive data such as credit card numbers.

AWS services make it easier to use HTTPS throughout your application and it is provided by default in services like API Gateway. Where you need an SSL/TLS certificate in your application, to support features like custom domain names, it’s recommended that you use AWS Certificate Manager (ACM). This provides free public certificates for ACM-integrated services and managed certificate renewal.

Governance controls with AWS CloudTrail

For compliance and operational auditing of application usage, AWS CloudTrail logs activity related to your AWS account usage. It tracks resource changes and usage, and provides analysis and troubleshooting tools. Enabling CloudTrail does not have any negative performance implications for your Lambda-based application, since the logging occurs asynchronously.

Separate from application logging (see chapter 4), CloudTrail captures two types of events:

  • Control plane: These events apply to management operations performed on any AWS resources. Individual trails can be configured to capture read or write events, or both.
  • Data plane: Events performed on the resources, such as when a Lambda function is invoked or an S3 object is downloaded.

For Lambda, you can log who creates and invokes functions, together with any changes to IAM roles. You can configure CloudTrail to log every single activity by user, role, service, and API within an AWS account. The service is critical for understanding the history of changes made to your account and also detecting any unintended changes or suspicious activity.

To research which AWS user interacted with a Lambda function, CloudTrail provides an audit log to find this information. For example, when a new permission is added to a Lambda function, it creates an AddPermission record. You can interpret the meaning of individual attributes in the JSON message by referring to the CloudTrail Record Contents documentation.

CloudTrail Record Contents documentation

CloudTrail data is considered sensitive so it’s recommended that you protect it with KMS encryption. For any service processing encrypted CloudTrail data, it must use an IAM policy with kms:Decrypt permission.

By integrating CloudTrail with Amazon EventBridge, you can create alerts in response to certain activities and respond accordingly. With these two services, you can quickly implement an automated detection and response pattern, enabling you to develop mechanisms to mitigate security risks. With EventBridge, you can analyze data in real-time, using event rules to filter events and forward to targets like Lambda functions or Amazon Kinesis streams.

CloudTrail can deliver data to Amazon CloudWatch Logs, which allows you to process multi-Region data in real time from one location. You can also deliver CloudTrail to Amazon S3 buckets, where you can create event source mappings to start data processing pipelines, run queries with Amazon Athena, or analyze activity with Amazon Macie.

If you use multiple AWS accounts, you can use AWS Organizations to manage and govern individual member accounts centrally. You can set an existing trail as an organization-level trail in a primary account that can collect events from all other member accounts. This can simplify applying consistent auditing rules across a large set of existing accounts, or automatically apply rules to new accounts. To learn more about this feature, see Creating a Trail for an Organization.

Conclusion

In this blog post, I explain how to secure workloads with public endpoints and the different authentication and authorization options available. I also show different approaches to exposing APIs publicly.

CloudTrail can provide compliance and operational auditing for Lambda usage. It provides logs for both the control plane and data plane. You can integrate CloudTrail with EventBridge to create alerts in response to certain activities. Customers with multiple AWS accounts can use AWS Organizations to manage trails centrally.

For more serverless learning resources, visit Serverless Land.

Operating Lambda: Building a solid security foundation – Part 1

Post Syndicated from James Beswick original https://aws.amazon.com/blogs/compute/operating-lambda-building-a-solid-security-foundation-part-1/

In the Operating Lambda series, I cover important topics for developers, architects, and systems administrators who are managing AWS Lambda-based applications. This two-part series discusses core security concepts for Lambda-based applications.

In the AWS Cloud, the most important foundational security principle is the shared responsibility model. This broadly shares security responsibilities between AWS and our customers. AWS is responsible for “security of the cloud”, such as the underlying physical infrastructure and facilities providing the services. Customers are responsible for “security in the cloud”, which includes applying security best practices, controlling access, and taking measures to protect data.

One of the main reasons for the popularity of Lambda-based applications is that AWS manages even more of the security operations compared with traditional cloud-based compute. For example, Lambda customers using zip file deployments do not need to patch underlying operating systems or apply security patches – these tasks are managed automatically by the Lambda service.

This post explains the Lambda execution environment and mechanisms used by the service to protect customer data. It also covers applying the principles of least privilege to your application and what this means in terms of permissions and Lambda function scope.

Understanding the Lambda execution environment

When your functions are invoked, the Lambda service runs your code inside an execution environment. Lambda scrubs the memory before it is assigned to an execution environment. Execution environments are run on hardware virtualized virtual machines (MicroVMs) which are dedicated to a single AWS account. Execution environments are never shared across functions and MicroVMs are never shared across AWS accounts. This is the isolation model for the Lambda service:

Isolation model for the Lambda service

A single execution environment may be reused by subsequent function invocations. This helps improve performance since it reduces the time taken to prepare and environment. Within your code, you can take advantage of this behavior to improve performance further, by caching locally within the function or reusing long-lived connections. All of these invocations are handled by a single process, so any process-wide state (such as static state in Java) is available across all invocations within the same execution environment.

There is also a local file system available at /tmp for all Lambda functions. This is local to each function but shared across invocations within the same execution environment. If your function must access large libraries or files, these can be downloaded here first and then used by all subsequent invocations. This mechanism provides a way to amortize the cost and time of downloading this data across multiple invocations.

While data is never shared across AWS customers, it is possible for data from one Lambda function to be shared with another invocation of the same function instance. This can be useful for caching common values or sharing libraries. However, if you have information only intended for a single invocation, you should:

  • Ensure that data is only used in a local variable scope.
  • Delete any /tmp files before exiting, and use a UUID name to prevent different instances from accessing the same temporary files.
  • Ensure that any callbacks are complete before exiting.

For applications requiring the highest levels of security, you may also implement your own memory encryption and wiping process before a function exits. At the function level, the Lambda service does not inspect or scan your code. Many of the best practices in security for software development continue to apply in serverless software development.

The security posture of an application is determined by the use-case but developers should always take precautions against common risks such as misconfiguration, injection flaws, and handling user input. Developers should be familiar with common security concepts and security risks, such as those listed in the OWASP Top 10 Web Application Security Risks and the OWASP Serverless Top 10. The use of static code analysis tools, unit tests, and regression tests are still valid in a serverless compute environment.

To learn more, read “Amazon Web Services: Overview of Security Processes”, “Compliance validation for AWS Lambda”, and “Security Overview of AWS Lambda”.

Applying the principles of least privilege

AWS Identity and Access Management (IAM) is the service used to manage access to AWS services. Before using IAM, it’s important to review security best practices that apply across AWS, to ensure that your user accounts are secured appropriately.

Lambda is fully integrated with IAM, allowing you to control precisely what each Lambda function can do within the AWS Cloud. There are two important policies that define the scope of permissions in Lambda functions. The event source uses a resource policy that grants permission to invoke the Lambda function, whereas the Lambda service uses an execution role to constrain what the function is allowed to do. In many cases, the console configures both of these policies with default settings.

As you start to build Lambda-based applications with frameworks such as AWS SAM, you describe both policies in the application’s template.

Resource and execution role policy

By default, when you create a new Lambda function, a specific IAM role is created for only that function.

IAM role for a Lambda function

This role has permissions to create an Amazon CloudWatch log group in the current Region and AWS account, and create log streams and put events to those streams. The policy follows the principle of least privilege by scoping precise permissions to specific resources, AWS services, and accounts.

Developing least privilege IAM roles

As you develop a Lambda function, you expand the scope of this policy to enable access to other resources. For example, for a function that processes objects put into an Amazon S3 bucket, it requires read access to objects stored in that bucket. Do not grant the function broader permissions to write or delete data, or operate in other buckets.

Determining the exact permissions can be challenging, since IAM permissions are granular and they control access to both the data plane and control plane. The following references are useful for developing IAM policies:

One of the fastest ways to scope permissions appropriately is to use AWS SAM policy templates. You can reference these templates directly in the AWS SAM template for your application, providing custom parameters as required:

SAM policy templates

In this example, the S3CrudPolicy template provides full create, read, update, and delete permissions to one bucket, and the S3ReadPolicy template provides only read access to another bucket. AWS SAM named templates expand into more verbose AWS CloudFormation policy definitions that show how the principle of least privilege is applied. The S3ReadPolicy is defined as:

        "Statement": [
          {
            "Effect": "Allow",
            "Action": [
              "s3:GetObject",
              "s3:ListBucket",
              "s3:GetBucketLocation",
              "s3:GetObjectVersion",
              "s3:GetLifecycleConfiguration"
            ],
            "Resource": [
              {
                "Fn::Sub": [
                  "arn:${AWS::Partition}:s3:::${bucketName}",
                  {
                    "bucketName": {
                      "Ref": "BucketName"
                    }
                  }
                ]
              },
              {
                "Fn::Sub": [
                  "arn:${AWS::Partition}:s3:::${bucketName}/*",
                  {
                    "bucketName": {
                      "Ref": "BucketName"
                    }
                  }
                ]
              }
            ]
          }
        ]

It includes the necessary, minimal permissions to retrieve the S3 object, including getting the bucket location, object version, and lifecycle configuration.

Access to CloudWatch Logs

To log output, Lambda roles must provide access to CloudWatch Logs. If you are building a policy manually, ensure that it includes:

{
    "Version": "2012-10-17",
    "Statement": [
        {
            "Effect": "Allow",
            "Action": "logs:CreateLogGroup",
            "Resource": "arn:aws:logs:region:accountID:*"
        },
        {
            "Effect": "Allow",
            "Action": [
                "logs:CreateLogStream",
                "logs:PutLogEvents"
            ],
            "Resource": [
                "arn:aws:logs:region:accountID:log-group:/aws/lambda/functionname:*"
            ]
        }
    ]
}

If the role is missing these permissions, the function still runs but it is unable to log any output to the CloudWatch service.

Avoiding wildcard permissions in IAM policies

The granularity of IAM permissions means that developers may choose to use overly broad permissions when they are testing or developing code.

IAM supports the “*” wildcard in both the resources and actions attributes, making it easier to select multiple matching items automatically. These may be useful when developing and testing functions in specific development AWS accounts with no access to production data. However, you should ensure that “star permissions” are never used in production environments.

Wildcard permissions grant broad permissions, often for many permissions or resources. Many AWS managed policies, such as AdministratorAccess, provide broad access intended only for user roles. Do not apply these policies to Lambda functions, since they do not specify individual resources.

In Application design and Service Quotas – Part 1, the section Using multiple AWS accounts for managing quotas shows a multiple account example. This approach provisions a separate AWS account for each developer in a team, and separates accounts for beta and production. This can help prevent developers from unintentionally transferring overly broad permissions to beta or production accounts.

For developers using the Serverless Framework, the Safeguards plugin is a policy-as-code framework to check deployed templates for compliance with security.

Specialized Lambda functions compared with all-purpose functions

In the post on Lambda design principles, I discuss architectural decisions in choosing between specialized functions and all-purpose functions. From a security perspective, it can be more difficult to apply the principles of least privilege to all-purpose functions. This is partly because of the broad capabilities of these functions and also because developers may grant overly broad permissions to these functions.

When building smaller, specialized functions with single tasks, it’s often easier to identify the specific resources and access requirements, and grant only those permissions. Additionally, since new features are usually implemented by new functions in this architectural design, you can specifically grant permissions in new IAM roles for these functions.

Avoid sharing IAM roles with multiple Lambda functions. As permissions are added to the role, these are shared across all functions using this role. By using one dedicated IAM role per function, you can control permissions more intentionally. Every Lambda function should have a 1:1 relationship with an IAM role. Even if some functions have the same policy initially, always separate the IAM roles to ensure least privilege policies.

To learn more, the series of posts for “Building well-architected serverless applications: Controlling serverless API access” – part 1, part 2, and part 3.

Conclusion

This post explains the Lambda execution environment and how the service protects customer data. It covers important steps you should take to prevent data leakage between invocations and provides additional security resources to review.

The principles of least privilege also apply to Lambda-based applications. I show how you can develop IAM policies and practices to ensure that IAM roles are scoped appropriately, and why you should avoid wildcard permissions. Finally, I explain why using smaller, specialized Lambda functions can help maintain least privilege.

Part 2 will discuss security workloads with public endpoints and how to use AWS CloudTrail for governance, compliance, and operational auditing of Lambda usage.

For more serverless learning resources, visit Serverless Land.

Operating Lambda: Application design – Part 3

Post Syndicated from James Beswick original https://aws.amazon.com/blogs/compute/operating-lambda-application-design-part-3/

In the Operating Lambda series, I cover important topics for developers, architects, and systems administrators who are managing AWS Lambda-based applications. This three-part series discusses application design for Lambda-based applications.

Part 1 shows how to work with Service Quotas, when to request increases, and architecting with quotas in mind. Part 2 covers scaling and concurrency and the different behaviors of on-demand and Provisioned Concurrency. This post discusses choosing and managing runtimes, networking and VPC configurations, and different invocation modes.

Choosing and managing runtimes in Lambda functions

Lambda natively supports a variety of common runtimes, including Python, Node.js, Java, .NET, and others. If you prefer to use any other runtime, such as PHP or Perl, you can use a custom runtime. There are lists of community-maintained runtimes for a wide range of programming languages or you can build your own. As a result, Lambda customers can run Erlang, COBOL, Haskell, and almost any other runtime needed to support their workloads.

Regardless of compute platform, developers must take action if their preferred runtime version is no longer supported by the maintaining organization. Lambda has a documented runtime support policy for languages and frameworks that explains the process for runtime deprecation. Deprecation dates are driven by each runtime’s maintaining organization. Generally, AWS allows you to continue running functions on runtime versions for a period of time after the official runtime deprecation. You will receive emails from AWS if you have functions affected by an upcoming deprecation.

Runtimes and performance

Your choice of runtime is likely determined by a variety of factors. These include the skills available in your development team and the runtimes used in existing projects, especially in migrations. This choice may also be influenced by IT policy in your organization and other external factors. Lambda is agnostic to the choice of runtime, so you are free to choose without sacrificing capabilities within the service.

Different runtimes have different performance profiles in on-demand compute services like Lambda. For example, both Python and Node.js are fast to initialize and offer reasonable overall performance. Java is much slower to initialize but can be fast once running. The programming language Go can be extremely performant for both start-up and runtime. If performance is critical to your application, then profiling and comparing runtime performance is an important step before coding applications.

Multiple runtimes in single applications

Serverless applications usually consist of multiple Lambda functions. Each Lambda function can use only one runtime but you can use multiple runtimes across multiple functions. This enables you to choose the most appropriate runtime for the task performed by the function. Unlike traditional applications that tend to use a single language runtime, serverless applications allow you to mix-and-match runtimes as needed.

For example, in a Lambda function that transforms JSON between services, you could choose Node.js for your business logic. In another function handling data processing, you may choose Python. Both can co-exist in a single serverless application.

Managing AWS SDKs in Lambda functions

The Lambda service also provides AWS SDKs for your chosen runtime. These enable you to interact with AWS services using familiar code constructs. SDK versions change frequently as AWS adds new features and services, and the Lambda service periodically updates the bundled SDKs. Consequently, if you are using the bundled SDK version, you will notice the version changes in your function even if your function code has not changed.

The bundled SDK is provided as a convenience for developers building simpler functions or using the Lambda console for development. In these cases, SDK version changes typically do not impact the functionality or performance. To lock an SDK version and make it immutable, it’s recommended that you create a Lambda layer with a specific version of an SDK and include this in your deployment package.

To learn more, see the “Creating a layer containing the AWS SDK” section at https://aws.amazon.com/blogs/compute/using-lambda-layers-to-simplify-your-development-process.

Networking and VPC configurations

Lambda functions always run inside VPCs owned by the Lambda service. As with customer-owned VPCs, this allows the service to apply network access and security rules to everything within the VPC. These VPCs are not visible to customers, the configurations are maintained automatically, and monitoring is managed by the service.

When you use some AWS services, they create resources that are only accessible from within your customer VPC. To access these resources with Lambda, your Lambda function must also be configured for access to the same VPC. Importantly, unless you are accessing services with resources in a customer VPC, there is no additional benefit to add a VPC configuration.

By default, Lambda functions have access to the public internet. This is not the case after they have been configured with access to one of your VPCs. If you continue to need access to resources on the internet, set up a NAT instance or Amazon NAT Gateway. Alternatively, you can also use VPC endpoints to enable private communications between your VPC and supported AWS services.

The high availability of the Lambda service depends upon access to multiple Availability Zones within the Region where your code runs. When you create a Lambda function without a VPC configuration, it’s automatically available in all Availability Zones within the Region. When you set up VPC access, you choose which Availability Zones the Lambda function can use. As a result, to provide continued high availability, ensure that the function has access to at least two Availability Zones.

The Lambda service uses a Network Function Virtualization platform to provide NAT capabilities from the Lambda VPC to customer VPCs. This configures the required elastic network interfaces (ENIs) at the point where Lambda functions are created or updated. It also enables ENIs from your account to be shared across multiple execution environments, which allows Lambda to make more efficient use of a limited network resource when functions scale.

Since ENIs are an exhaustible resource and there is a soft limit of 350 ENIs per Region, you should monitor elastic network interface usage if you are configuring Lambda functions for VPC access. Generally, if you increase concurrency limits in Lambda, you should evaluate if you need an elastic network interface increase. If the limit is reached, this causes invocations of VPC-enabled Lambda functions to be throttled.

Most serverless services can be used without further VPC configuration, while most instance-based services require VPC configuration:

AWS services accessible by default AWS services requiring VPC configuration
Amazon API Gateway
Amazon CloudFront
Amazon CloudWatch
Amazon Comprehend
Amazon DynamoDB
Amazon EventBridge
Amazon Kinesis
Amazon Lex
Amazon Polly
Amazon Rekognition
Amazon S3
Amazon SNS
Amazon SQS
AWS Step Functions
Amazon Textract
Amazon Transcribe
Amazon Translate
Amazon ECS
Amazon EFS
Amazon ElastiCache
Amazon Elasticsearch Service
Amazon MSK
Amazon MQ
Amazon RDS
Amazon Redshift

To learn more, read about how VPC networking works with Lambda functions.

Comparing Lambda invocation modes

Lambda functions can be invoked either synchronously or asynchronously, depending upon the trigger. In synchronous invocations, the caller waits for the function to complete execution and the function can return a value. In asynchronous operation, the caller places the event on an internal queue, which is then processed by the Lambda function.

Synchronous invocation Asynchronous invocation Polling invocation
AWS CLI
Elastic Load Balancing (Application Load Balancer)
Amazon Cognito
Amazon Lex
Amazon Alexa
Amazon API Gateway
Amazon CloudFront via Lambda@Edge
Amazon Kinesis Data Firehose
Amazon S3 Batch
Amazon S3
Amazon SNS
Amazon Simple Email Service
AWS CloudFormation
Amazon CloudWatch Logs
Amazon CloudWatch Events
AWS CodeCommit
AWS Config
AWS IoT
AWS IoT Events
AWS CodePipeline
Amazon DynamoDB
Amazon Kinesis
Amazon Managed Streaming for Apache Kafka (Amazon MSK)
Amazon SQS

Synchronous invocations are well suited for short-lived Lambda functions. Although Lambda functions can run for up to 15 minutes, synchronous callers may have shorter timeouts. For example, API Gateway has a 29-second integration timeout, so a Lambda function running for more than 29 seconds will not return a value successfully. In synchronous invocations, if the Lambda function fails, retries are the responsibility of the trigger.

In asynchronous invocations, the caller continues with other work and cannot receive a return value from the Lambda function. The function can send the result to a destination, configurable based on success or failure. The internal queue between the caller and the function ensures that messages are stored durably. The Lambda service scales up the concurrency of the processing function as this internal queue grows. If an error occurs in the Lambda function, the retry behavior is determined by the Lambda service.

AWS service Invocation type Retry behavior
Amazon API Gateway Synchronous None – returns error to the client
Amazon S3 Asynchronous Retries with exponential backoff
Amazon SNS Asynchronous Retries with exponential backoff
Amazon DynamoDB Streams Synchronous from poller Retries until data expiration (24 hours)
Amazon Kinesis Synchronous from poller Retries until data expiration (24 hours to 7 days)
AWS CLI Synchronous/Asynchronous Configured by CLI call
AWS SDK Synchronous/Asynchronous Application-specific
Amazon SQS Synchronous from poller Retries until Message Retention Period expires or is sent to a dead-letter queue

To learn more, read “Invoking AWS Lambda functions” and “Introducing AWS Lambda Destinations”.

Conclusion

This post discusses choosing and managing runtimes, the effect on performance, and how you can use multiple runtimes within a single serverless application. It explains the networking model and whether a Lambda function must have access to a customer VPC or can run with the default VPC configuration. It also compares the different invocation modes for Lambda functions.

For more serverless learning resources, visit Serverless Land.

Improving AWS Java applications with Amazon CodeGuru Reviewer

Post Syndicated from Rajdeep Mukherjee original https://aws.amazon.com/blogs/devops/improving-aws-java-applications-with-amazon-codeguru-reviewer/

Amazon CodeGuru Reviewer is a machine learning (ML)-based AWS service for providing automated code reviews comments on your Java and Python applications. Powered by program analysis and ML, CodeGuru Reviewer detects hard-to-find bugs and inefficiencies in your code and leverages best practices learned from across millions of lines of open-source and Amazon code. You can start analyzing your code through pull requests and full repository analysis (for more information, see Automating code reviews and application profiling with Amazon CodeGuru).

The recommendations generated by CodeGuru Reviewer for Java fall into the following categories:

  • AWS best practices
  • Concurrency
  • Security
  • Resource leaks
  • Other specialized categories such as sensitive information leaks, input validation, and code clones
  • General best practices on data structures, control flow, exception handling, and more

We expect the recommendations to benefit beginners as well as expert Java programmers.

In this post, we showcase CodeGuru Reviewer recommendations related to using the AWS SDK for Java. For in-depth discussion of other specialized topics, see our posts on concurrency, security, and resource leaks. For Python applications, see Raising Python code quality using Amazon CodeGuru.

The AWS SDK for Java simplifies the use of AWS services by providing a set of features that are consistent and familiar for Java developers. The SDK has more than 250 AWS service clients, which are available on GitHub. Service clients include services like Amazon Simple Storage Service (Amazon S3), Amazon DynamoDB, Amazon Kinesis, Amazon Elastic Compute Cloud (Amazon EC2), AWS IoT, and Amazon SageMaker. These services constitute more than 6,000 operations, which you can use to access AWS services. With such rich and diverse services and APIs, developers may not always be aware of the nuances of AWS API usage. These nuances may not be important at the beginning, but become critical as the scale increases and the application evolves or becomes diverse. This is why CodeGuru Reviewer has a category of recommendations: AWS best practices. This category of recommendations enables you to become aware of certain features of AWS APIs so your code can be more correct and performant.

The first part of this post focuses on the key features of the AWS SDK for Java as well as API patterns in AWS services. The second part of this post demonstrates using CodeGuru Reviewer to improve code quality for Java applications that use the AWS SDK for Java.

AWS SDK for Java

The AWS SDK for Java supports higher-level abstractions for simplified development and provides support for cross-cutting concerns such as credential management, retries, data marshaling, and serialization. In this section, we describe a few key features that are supported in the AWS SDK for Java. Additionally, we discuss some key API patterns such as batching, and pagination, in AWS services.

The AWS SDK for Java has the following features:

  • Waiters Waiters are utility methods that make it easy to wait for a resource to transition into a desired state. Waiters makes it easier to abstract out the polling logic into a simple API call. The waiters interface provides a custom delay strategy to control the sleep time between retries, as well as a custom condition on whether polling of a resource should be retried. The AWS SDK for Java also offer an async variant of waiters.
  • Exceptions The AWS SDK for Java uses runtime (or unchecked) exceptions instead of checked exceptions in order to give you fine-grained control over the errors you want to handle and to prevent scalability issues inherent with checked exceptions in large applications. Broadly, the AWS SDK for Java has two types of exceptions:
    • AmazonClientException – Indicates that a problem occurred inside the Java client code, either while trying to send a request to AWS or while trying to parse a response from AWS. For example, the AWS SDK for Java throws an AmazonClientException if no network connection is available when you try to call an operation on one of the clients.
    • AmazonServiceException – Represents an error response from an AWS service. For example, if you try to end an EC2 instance that doesn’t exist, Amazon EC2 returns an error response, and all the details of that response are included in the AmazonServiceException that’s thrown. For some cases, a subclass of AmazonServiceException is thrown to allow you fine-grained control over handling error cases through catch blocks.

The API has the following patterns:

  • Batching – A batch operation provides you with the ability to perform a single CRUD operation (create, read, update, delete) on multiple resources. Some typical use cases include the following:
  • Pagination – Many AWS operations return paginated results when the response object is too large to return in a single response. To enable you to perform pagination, the request and response objects for many service clients in the SDK provide a continuation token (typically named NextToken) to indicate additional results.

AWS best practices

Now that we have summarized the SDK-specific features and API patterns, let’s look at the CodeGuru Reviewer recommendations on AWS API use.

The CodeGuru Reviewer recommendations for the AWS SDK for Java range from detecting outdated or deprecated APIs to warning about API misuse, missing pagination, authentication and exception scenarios, and using efficient API alternatives. In this section, we discuss a few examples patterned after real code.

Handling pagination

Over 1,000 APIs from more than 150 AWS services have pagination operations. The pagination best practice rule in CodeGuru covers all the pagination operations. In particular, the pagination rule checks if the Java application correctly fetches all the results of the pagination operation.

The response of a pagination operation in AWS SDK for Java 1.0 contains a token that has to be used to retrieve the next page of results. In the following code snippet, you make a call to listTables(), a DynamoDB ListTables operation, which can only return up to 100 table names per page. This code might not produce complete results because the operation returns paginated results instead of all results.

public void getDynamoDbTable() {
        AmazonDynamoDBClient client = new AmazonDynamoDBClient();
        List<String> tables = dynamoDbClient.listTables().getTableNames();
        System.out.println(tables)
}

CodeGuru Reviewer detects the missing pagination in the code snippet and makes the following recommendation to add another call to check for additional results.

Screenshot of recommendations for introducing pagination checks

You can accept the recommendation and add the logic to get the next page of table names by checking if a token (LastEvaluatedTableName in ListTablesResponse) is included in each response page. If such a token is present, it’s used in a subsequent request to fetch the next page of results. See the following code:

public void getDynamoDbTable() {
        AmazonDynamoDBClient client = new AmazonDynamoDBClient();
        ListTablesRequest listTablesRequest = ListTablesRequest.builder().build();
        boolean done = false;
        while (!done) {
            ListTablesResponse listTablesResponse = client.listTables(listTablesRequest);
	    System.out.println(listTablesResponse.tableNames());
            if (listTablesResponse.lastEvaluatedTableName() == null) {
                done = true;
            }
            listTablesRequest = listTablesRequest.toBuilder()
                    .exclusiveStartTableName(listTablesResponse.lastEvaluatedTableName())
                    .build();
        }
}

Handling failures in batch operation calls

Batch operations are common with many AWS services that process bulk requests. Batch operations can succeed without throwing exceptions even if some items in the request fail. Therefore, a recommended practice is to explicitly check for any failures in the result of the batch APIs. Over 40 APIs from more than 20 AWS services have batch operations. The best practice rule in CodeGuru Reviewer covers all the batch operations. In the following code snippet, you make a call to sendMessageBatch, a batch operation from Amazon SQS, but it doesn’t handle any errors returned by that batch operation:

public void flush(final String sqsEndPoint,
                     final List<SendMessageBatchRequestEntry> batch) {
    AwsSqsClientBuilder awsSqsClientBuilder;
    AmazonSQS sqsClient = awsSqsClientBuilder.build();
    if (batch.isEmpty()) {
        return;
    }
    sqsClient.sendMessageBatch(sqsEndPoint, batch);
}

CodeGuru Reviewer detects this issue and makes the following recommendation to check the return value for failures.

Screenshot of recommendations for batch operations

You can accept this recommendation and add logging for the complete list of messages that failed to send, in addition to throwing an SQSUpdateException. See the following code:

public void flush(final String sqsEndPoint,
                     final List<SendMessageBatchRequestEntry> batch) {
    AwsSqsClientBuilder awsSqsClientBuilder;
    AmazonSQS sqsClient = awsSqsClientBuilder.build();
    if (batch.isEmpty()) {
        return;
    }
    SendMessageBatchResult result = sqsClient.sendMessageBatch(sqsEndPoint, batch);
    final List<BatchResultErrorEntry> failed = result.getFailed();
    if (!failed.isEmpty()) {
           final String failedMessage = failed.stream()
                         .map(batchResultErrorEntry -> 
                            String.format("…", batchResultErrorEntry.getId(), 
                            batchResultErrorEntry.getMessage()))
                         .collect(Collectors.joining(","));
           throw new SQSUpdateException("Error occurred while sending 
                                        messages to SQS::" + failedMessage);
    }
}

Exception handling best practices

Amazon S3 is one of the most popular AWS services with our customers. A frequent operation with this service is to upload a stream-based object through an Amazon S3 client. Stream-based uploads might encounter occasional network connectivity or timeout issues, and the best practice to address such a scenario is to properly handle the corresponding ResetException error. ResetException extends SdkClientException, which subsequently extends AmazonClientException. Consider the following code snippet, which lacks such exception handling:

private void uploadInputStreamToS3(String bucketName, 
                                   InputStream input, 
                                   String key, ObjectMetadata metadata) 
                         throws SdkClientException {
    final AmazonS3Client amazonS3Client;
    PutObjectRequest putObjectRequest =
          new PutObjectRequest(bucketName, key, input, metadata);
    amazonS3Client.putObject(putObjectRequest);
}

In this case, CodeGuru Reviewer correctly detects the missing handling of the ResetException error and suggests possible solutions.

Screenshot of recommendations for handling exceptions

This recommendation is rich in that it provides alternatives to suit different use cases. The most common handling uses File or FileInputStream objects, but in other cases explicit handling of mark and reset operations are necessary to reliably avoid a ResetException.

You can fix the code by explicitly setting a predefined read limit using the setReadLimit method of RequestClientOptions. Its default value is 128 KB. Setting the read limit value to one byte greater than the size of stream reliably avoids a ResetException.

For example, if the maximum expected size of a stream is 100,000 bytes, set the read limit to 100,001 (100,000 + 1) bytes. The mark and reset always work for 100,000 bytes or less. However, this might cause some streams to buffer that number of bytes into memory.

The fix reliably avoids ResetException when uploading an object of type InputStream to Amazon S3:

private void uploadInputStreamToS3(String bucketName, InputStream input, 
                                   String key, ObjectMetadata metadata) 
                             throws SdkClientException {
        final AmazonS3Client amazonS3Client;
        final Integer READ_LIMIT = 10000;
        PutObjectRequest putObjectRequest =
   			new PutObjectRequest(bucketName, key, input, metadata);  
        putObjectRequest.getRequestClientOptions().setReadLimit(READ_LIMIT);
        amazonS3Client.putObject(putObjectRequest);
}

Replacing custom polling with waiters

A common activity when you’re working with services that are eventually consistent (such as DynamoDB) or have a lead time for creating resources (such as Amazon EC2) is to wait for a resource to transition into a desired state. The AWS SDK provides the Waiters API, a convenient and efficient feature for waiting that abstracts out the polling logic into a simple API call. If you’re not aware of this feature, you might come up with a custom, and potentially inefficient polling logic to determine whether a particular resource had transitioned into a desired state.

The following code appears to be waiting for the status of EC2 instances to change to shutting-down or terminated inside a while (true) loop:

private boolean terminateInstance(final String instanceId, final AmazonEC2 ec2Client)
    throws InterruptedException {
    long start = System.currentTimeMillis();
    while (true) {
        try {
            DescribeInstanceStatusResult describeInstanceStatusResult = 
                            ec2Client.describeInstanceStatus(new DescribeInstanceStatusRequest()
                            .withInstanceIds(instanceId).withIncludeAllInstances(true));
            List<InstanceStatus> instanceStatusList = 
                       describeInstanceStatusResult.getInstanceStatuses();
            long finish = System.currentTimeMillis();
            long timeElapsed = finish - start;
            if (timeElapsed > INSTANCE_TERMINATION_TIMEOUT) {
                break;
            }
            if (instanceStatusList.size() < 1) {
                Thread.sleep(WAIT_FOR_TRANSITION_INTERVAL);
                continue;
            }
            currentState = instanceStatusList.get(0).getInstanceState().getName();
            if ("shutting-down".equals(currentState) || "terminated".equals(currentState)) {
                return true;
             } else {
                 Thread.sleep(WAIT_FOR_TRANSITION_INTERVAL);
             }
        } catch (AmazonServiceException ex) {
            throw ex;
        }
        …
 }

CodeGuru Reviewer detects the polling scenario and recommends you use the waiters feature to help improve efficiency of such programs.

Screenshot of recommendations for introducing waiters feature

Based on the recommendation, the following code uses the waiters function that is available in the AWS SDK for Java. The polling logic is replaced with the waiters() function, which is then run with the call to waiters.run(…), which accepts custom provided parameters, including the request and optional custom polling strategy. The run function polls synchronously until it’s determined that the resource transitioned into the desired state or not. The SDK throws a WaiterTimedOutException if the resource doesn’t transition into the desired state even after a certain number of retries. The fixed code is more efficient, simple, and abstracts the polling logic to determine whether a particular resource had transitioned into a desired state into a simple API call:

public void terminateInstance(final String instanceId, final AmazonEC2 ec2Client)
    throws InterruptedException {
    Waiter<DescribeInstancesRequest> waiter = ec2Client.waiters().instanceTerminated();
    ec2Client.terminateInstances(new TerminateInstancesRequest().withInstanceIds(instanceId));
    try {
        waiter.run(new WaiterParameters()
              .withRequest(new DescribeInstancesRequest()
              .withInstanceIds(instanceId))
              .withPollingStrategy(new PollingStrategy(new MaxAttemptsRetryStrategy(60), 
                    new FixedDelayStrategy(5))));
    } catch (WaiterTimedOutException e) {
        List<InstanceStatus> instanceStatusList = ec2Client.describeInstanceStatus(
               new DescribeInstanceStatusRequest()
                        .withInstanceIds(instanceId)
                        .withIncludeAllInstances(true))
                        .getInstanceStatuses();
        String state;
        if (instanceStatusList != null && instanceStatusList.size() > 0) {
            state = instanceStatusList.get(0).getInstanceState().getName();
        }
    }
}

Service-specific best practice recommendations

In addition to the SDK operation-specific recommendations in the AWS SDK for Java we discussed, there are various AWS service-specific best practice recommendations pertaining to service APIs for services such as Amazon S3, Amazon EC2, DynamoDB, and more, where CodeGuru Reviewer can help to improve Java applications that use AWS service clients. For example, CodeGuru can detect the following:

  • Resource leaks in Java applications that use high-level libraries, such as the Amazon S3 TransferManager
  • Deprecated methods in various AWS services
  • Missing null checks on the response of the GetItem API call in DynamoDB
  • Missing error handling in the output of the PutRecords API call in Kinesis
  • Anti-patterns such as binding the SNS subscribe or createTopic operation with Publish operation

Conclusion

This post introduced how to use CodeGuru Reviewer to improve the use of the AWS SDK in Java applications. CodeGuru is now available for you to try. For pricing information, see Amazon CodeGuru pricing.

Operating Lambda: Application design – Scaling and concurrency: Part 2

Post Syndicated from James Beswick original https://aws.amazon.com/blogs/compute/operating-lambda-application-design-scaling-and-concurrency-part-2/

In the Operating Lambda series, I cover important topics for developers, architects, and systems administrators who are managing AWS Lambda-based applications. This three-part series discusses application design for Lambda-based applications.

Part 1 shows how to work with Service Quotas, when to request increases, and architecting with quotas in mind. This post covers scaling and concurrency and the different behaviors of on-demand and Provisioned Concurrency.

Scaling and concurrency in Lambda

Lambda is engineered to provide managed scaling in a way that does not rely upon threading or any custom engineering in your code. As traffic increases, Lambda increases the number of concurrent executions of your functions.

When a function is first invoked, the Lambda service creates an instance of the function and runs the handler method to process the event. After completion, the function remains available for a period of time to process subsequent events. If other events arrive while the function is busy, Lambda creates more instances of the function to handle these requests concurrently.

For an initial burst of traffic, your cumulative concurrency in a Region can reach between 500 and 3000 per minute, depending upon the Region. After this initial burst, functions can scale by an additional 500 instances per minute. If requests arrive faster than a function can scale, or if a function reaches maximum capacity, additional requests fail with a throttling error (status code 429).

All AWS accounts start with a default concurrent limit of 1000 per Region. This is a soft limit that you can increase by submitting a request in the AWS Support Center.

On-demand scaling example

In this example, a Lambda receives 10,000 synchronous requests from Amazon API Gateway. The concurrency limit for the account is 10,000. The following shows four scenarios:

On-demand scaling example

In each case, all of the requests arrive at the same time in the minute they are scheduled:

  1. All requests arrive immediately: 3000 requests are handled by new execution environments; 7000 are throttled.
  2. Requests arrive over 2 minutes: 3000 requests are handled by new execution environments in the first minute; the remaining 2000 are throttled. In minute 2, another 500 environments are created and the 3000 original environments are reused; 1500 are throttled.
  3. Requests arrive over 3 minutes: 3000 requests are handled by new execution environments in the first minute; the remaining 333 are throttled. In minute 2, another 500 environments are created and the 3000 original environments are reused; all requests are served. In minute 3, the remaining 3334 requests are served by warm environments.
  4. Requests arrive over 4 minutes: In minute 1, 2500 requests are handled by new execution environment; the same environments are reused in subsequent minutes to serve all requests.

Provisioned Concurrency scaling example

The majority of Lambda workloads are asynchronous so the default scaling behavior provides a reasonable trade-off between throughput and configuration management overhead. However, for synchronous invocations from interactive workloads, such as web or mobile applications, there are times when you need more control over how many concurrent function instances are ready to receive traffic.

Provisioned Concurrency is a Lambda feature that prepares concurrent execution environments in advance of invocations. Consequently, this can be used to address two issues. First, if expected traffic arrives more quickly than the default burst capacity, Provisioned Concurrency can ensure that your function is available to meet the demand. Second, if you have latency-sensitive workloads that require predictable double-digit millisecond latency, Provisioned Concurrency solves the typical cold start issues associated with default scaling.

Provisioned Concurrency is a configuration available for a specific published version or alias of a Lambda function. It does not rely on any custom code or changes to a function’s logic, and it’s compatible with features such as VPC configuration, Lambda layers. For more information on how Provisioned Concurrency optimizes performance for Lambda-based applications, watch this Tech Talk video.

Using the same scenarios with 10,000 requests, the function is configured with a Provisioned Concurrency of 7,000:

Provisioned Concurrency scaling example

  1. In case #1, 7,000 requests are handled by the provisioned environments with no cold start. The remaining 3,000 requests are handled by new, on-demand execution environments.
  2. In cases #2-4, all requests are handled by provisioned environments in the minute when they arrive.

Using service integrations and asynchronous processing

Synchronous requests from services like API Gateway require immediate responses. In many cases, these workloads can be rearchitected as asynchronous workloads. In this case, API Gateway uses a service integration to persist messages in an Amazon SQS queue durably. A Lambda function consumes these messages from the queue, and updates the status in an Amazon DynamoDB table. Another API endpoint provides the status of the request by querying the DynamoDB table:

Async with polling example

API Gateway has a default throttle limit of 10,000 requests per second, which can be raised upon request. SQS standard queues support a virtually unlimited throughput of API actions such as SendMessage.

The Lambda function consuming the messages from SQS can control the speed of processing through a combination of two factors. The first is BatchSize, which is the number of messages received by each invocation of the function, and the second is concurrency. Provided there is still concurrency available in your account, the Lambda function is not throttled while processing messages from an SQS queue.

In asynchronous workflows, it’s not possible to pass the result of the function back through the invocation path. The original API Gateway call receives an acknowledgment that the message has been stored in SQS, which is returned back to the caller. There are multiple mechanisms for returning the result back to the caller. One uses a DynamoDB table, as shown, to store a transaction ID and status, which is then polled by the caller via another API Gateway endpoint until the work is finished. Alternatively, you can use webhooks via Amazon SNS or WebSockets via AWS IoT Core to return the result.

Using this asynchronous approach can make it much easier to handle unpredictable traffic with significant volumes. While it is not suitable for every use case, it can simplify scalability operations.

Reserved concurrency

Lambda functions in a single AWS account in one Region share the concurrency limit. If one function exceeds the concurrent limit, this prevents other functions from being invoked by the Lambda service. You can set reserved capacity for Lambda functions to ensure that they can be invoked even if the overall capacity has been exhausted. Reserved capacity has two effects on a Lambda function:

  1. The reserved capacity is deducted from the overall capacity for the AWS account in a given Region. The Lambda function always has the reserved capacity available exclusively for its own invocations.
  2. The reserved capacity restricts the maximum number of concurrency invocations for that function. Synchronous requests arriving in excess of the reserved capacity limit fail with a throttling error.

You can also use reserved capacity to throttle the rate of requests processed by your workload. For Lambda functions that are invoked asynchronously or using an internal poller, such as for S3, SQS, or DynamoDB integrations, reserved capacity limits how many requests are processed simultaneously. In this case, events are stored durably in internal queues until the Lambda function is available. This can help create a smoothing effect for handling spiky levels of traffic.

For example, a Lambda function receives messages from an SQS queue and writes to a DynamoDB table. It has a reserved concurrency of 10 with a batch size of 10 items. The SQS queue rapidly receives 1,000 messages. The Lambda function scales up to 10 concurrent instances, each processing 10 messages from the queue. While it takes longer to process the entire queue, this results in a consistent rate of write capacity units (WCUs) consumed by the DynamoDB table.

Reserved concurrency for throttling example

To learn more, read “Managing AWS Lambda Function Concurrency” and “Managing concurrency for a Lambda function”.

Conclusion

This post explains scaling and concurrency in Lambda and the different behaviors of on-demand and Provisioned Concurrency. It also shows how to use service integrations and asynchronous patterns in Lambda-based applications. Finally, I discuss how reserved concurrency works and how to use it in your application design.

Part 3 will discuss choosing and managing runtimes, networking and VPC configurations, and different invocation modes.

For more serverless learning resources, visit Serverless Land.

Operating Lambda: Application design and Service Quotas – Part 1

Post Syndicated from James Beswick original https://aws.amazon.com/blogs/compute/operating-lambda-application-design-and-service-quotas-part-1/

In the Operating Lambda series, I cover important topics for developers, architects, and systems administrators who are managing AWS Lambda-based applications. This three-part series discusses application design for Lambda-based applications.

A well-architected event-driven application uses a combination of AWS services and custom code to process and manage requests and data. This series on Lambda-specific topics in application design, and how Lambda interacts with other services. There are many important considerations for serverless architects when designing applications for busy production systems.

Part 1 shows how to work with Service Quotas, when to request increases, and architecting with quotas in mind. It also explains how to control traffic for downstream server-based resources.

Understanding quotas

The Lambda service is designed for short-lived compute tasks that do not retain or rely upon state between invocations. The Lambda service invokes your custom code on demand in response to events from other AWS services, or requests via the AWS CLI or AWS SDKs. Code can run for up to 15 minutes in a single invocation and a single function can use up to 10,240 MB of memory.

Lambda is designed to scale rapidly to meet demand, allowing your functions to scale up to serve traffic in your application. Other AWS services frequently used in serverless applications, such as Amazon API Gateway, Amazon SNS, and AWS Step Functions, also scale up in response to increased load. This has enabled our largest customers to build applications that scale to millions of requests quickly without having to manage underlying infrastructure.

However, before you scale an application to these levels, it’s important to understand the guardrails that are put in place to protect your account and the workloads of other customers. Service Quotas exist in all AWS services and consist of hard limits, which you cannot change, and soft limits, which you can request increases for.

By default, all new accounts are assigned a quota profile that allows exploration of the services. However, the values may need to be raised to support medium-to-large application workloads. Typically, customers request increases for their accounts as they start to expand usage of their applications. This allows the quotas to grow with usage, and help protect the account from unexpected costs caused by unintended usage.

Different AWS services have different quotas. These quotas may apply at the Region level, or account level, and may also include time-interval restrictions, such as requests per second. For example, the maximum number of IAM roles is an account-based quota, whereas the maximum number of concurrent Lambda executions is a per-Region quota.

To see the quotas that apply to your account, navigate to the Service Quotas dashboard. This allows you to view your Service Quotas, request a service quota increase, and view current utilization. From here, you can drill down to a specific AWS service, such as Lambda:

Service Quotas for AWS Lambda

In this example, sorted by the Adjustable column, this shows that Concurrent executions, Elastic network interfaces per VPC, and Function and layer storage are all adjustable limits. You could request a quota increase for any of these via the AWS Support Center. The other items provide a useful reference for other limits applying to the service.

Architecting with Service Quotas

Most serverless applications use multiple AWS services, and different services have different quotas for different features. Once you have a serverless architecture designed and know which services your application uses, you can compare the different quotas across services and find any potential issues.

Example serverless application architecture

In this example, API Gateway has a default throttle limit of 10,000 requests per second. Many applications use API Gateway endpoints to invoke Lambda functions. Lambda has a default concurrency limit of 1,000. Since API Gateway to Lambda is a synchronous invocation, it’s possible to have more incoming requests than could be handled simultaneously by a Lambda function, when using the default limits. This can be resolved by requesting to have the Lambda concurrency limit raised for this account to match the expected level of traffic.

Another common challenge is handling payload sizes in different services. Consider an application moving a payload from API Gateway to Lambda to Amazon SQS. API Gateway supports payloads up to 10 Mb, while Lambda’s payload limit is 6 Mb and the SQS message size limit is 256 Kb. In this example, you could instead store the payload in an Amazon S3 bucket instead of uploading to API Gateway, and pass a reference token across the services. The token size is much smaller than any payload limit and may provide a more efficient design for your workload, depending upon the use-case.

Load testing your serverless application also allows you to monitor the performance of an application before it is deployed to production. Serverless applications can be relatively simple to load test, thanks to the automatic scaling built into many of the services. During a load test, you can identify any quotas that may act as a limiting factor for the traffic levels you expect and take action accordingly.

There are several tools available for serverless developers to perform this task. One of the most popular is Artillery Community Edition, which is an open-source tool for testing serverless APIs. You configure the number of requests per second and overall test duration and it uses a headless Chromium browser to run tests. Other popular tools include Nordstrom’s Serverless-Artillery and Gatling.

Using multiple AWS accounts for managing quotas

Many customers have multiple workloads running in the AWS Cloud but many quotas are set at the account level. This means that as you add more serverless workloads, some quotas are shared across more workloads, reducing the quotas available for each workload. Additionally, if you have development resources in the same account as production workloads, quotas are shared across both. It’s possible for development activity to exhaust resources unintentionally that you may want to reserve only for production.

An effective way to solve this issue is to use multiple AWS accounts, dedicating workloads to their own specific account. This prevents quotas from being shared with other workloads or non-production resources. Using AWS Organizations, you can centrally manage the billing, compliance, and security of these accounts. You can attach policies to groups of accounts to avoid custom scripts and manual processes.

One common approach is to provide each developer with an AWS account, and then use separate accounts for a beta deployment stage and production:

Multiple AWS account by environment

The developer accounts can contain copies of production resources and provide the developer with admin-level permissions to these resources. Each developer has their own set of limits for the account, so their usage does not impact your production environment. Individual developers can deploy AWS CloudFormation stacks and AWS Serverless Application Model (AWS SAM) templates into these accounts with minimal risk to production assets.

This approach allows developers to test Lambda functions locally on their development machines against live cloud resources in their individual accounts. It can help create a robust unit testing process, and developers can then push code to a repository like AWS CodeCommit when ready.

By integrating with AWS Secrets Manager, you can store different sets of secrets in each environment and replace any need for credentials stored in code. As code is promoted from developer account through to the beta and production accounts, the correct set of credentials is automatically used. You do not need to share environment-level credentials with individual developers.

To learn more, read “Best practices for organizing larger serverless applications”.

Controlling traffic flow for server-based resources

While Lambda can scale up quickly in response to traffic, many non-serverless services cannot. If your Lambda functions interact with those services downstream, it’s possible to overwhelm those services with data or connection requests.

Amazon RDS is one of the most common Lambda integrations that relies on a server-based resource. However, relational databases are connection-based, so they are intended to work with a few long-lived clients, such as web servers. By contrast, Lambda functions are ephemeral and short-lived, so their database connections are numerous and brief. If Lambda scales up to hundreds or thousands of instances, you may overwhelm downstream relational databases with connection requests. This is typically only an issue for moderately busy applications. If you are using a Lambda function for low-volume tasks, such as running daily SQL reports, you do not experience this behavior.

The Amazon RDS Proxy service is built to solve the high-volume use-case. It pools the connections between the Lambda service and the downstream Amazon RDS database. This means that a scaling Lambda function is able to reuse connections via the proxy. As a result, the relational database is not overwhelmed with connections requests from individual Lambda functions. This does not require code changes in many cases. You only need to replace the database endpoint with the proxy endpoint in your Lambda function.

For other downstream server-based resources, APIs, or third-party services, it’s important to know the limits around connections, transactions, and data transfer. If your serverless workload has the capacity to overwhelm those resources, use an SQS queue to decouple the Lambda function from the target. This allows the server-based resource to process messages from the queue at a steady rate. The queue also durably stores the requests if the downstream resource becomes unavailable.

Conclusion

Lambda works with other AWS services to process and manage requests and data. This post explains how to understand and manage Service Quotas, when to request increases, and architecting with quotas in mind. It also explains how to control traffic for downstream server-based resources.

Part 2 of this series will discuss scaling and concurrency in Lambda and the different behaviors of on-demand and Provisioned Concurrency.

For more guidance, see the Operating Lambda: Understanding event-driven architectures series.

For more serverless learning resources, visit Serverless Land.

Running cost optimized Spark workloads on Kubernetes using EC2 Spot Instances

Post Syndicated from Emma White original https://aws.amazon.com/blogs/compute/running-cost-optimized-spark-workloads-on-kubernetes-using-ec2-spot-instances/

This post is written by Kinnar Sen, Senior Solutions Architect, EC2 Spot 

Apache Spark is an open-source, distributed processing system used for big data workloads. It provides API operations to perform multiple tasks such as streaming, extract transform load (ETL), query, machine learning (ML), and graph processing. Spark supports four different types of cluster managers (Spark standalone, Apache Mesos, Hadoop YARN, and Kubernetes), which are responsible for scheduling and allocation of resources in the cluster. Spark can run with native Kubernetes support since 2018 (Spark 2.3). AWS customers that have already chosen Kubernetes as their container orchestration tool can also choose to run Spark applications in Kubernetes, increasing the effectiveness of their operations and compute resources.

In this post, I illustrate the deployment of scalable, resilient, and cost optimized Spark application using Kubernetes via Amazon Elastic Kubernetes Service (Amazon EKS) and Amazon EC2 Spot Instances. Learn how to save money on big data workloads by implementing this solution.

Overview

Amazon EC2 Spot Instances

Amazon EC2 Spot Instances let you take advantage of unused EC2 capacity in the AWS Cloud. Spot Instances are available at up to a 90% discount compared to On-Demand Instance prices. Capacity pools are a group of EC2 instances that belong to particular instance family, size, and Availability Zone (AZ). If EC2 needs capacity back for On-Demand Instance usage, Spot Instances can be interrupted by EC2 with a two-minute notification. There are many graceful ways to handle the interruption to ensure that the application is well architected for resilience and fault tolerance. This can be automated via the application and/or infrastructure deployments. Spot Instances are ideal for stateless, fault tolerant, loosely coupled and flexible workloads that can handle interruptions.

Amazon Elastic Kubernetes Service

Amazon EKS is a fully managed Kubernetes service that makes it easy for you to run Kubernetes on AWS without needing to install, operate, and maintain your own Kubernetes control plane. It provides a highly available and scalable managed control plane. It also provides managed worker nodes, which let you create, update, or terminate shut down worker nodes for your cluster with a single command. It is a great choice for deploying flexible and fault tolerant containerized applications. Amazon EKS supports creating and managing Amazon EC2 Spot Instances using Amazon EKS-managed node groups following Spot best practices. This enables you to take advantage of the steep savings and scale that Spot Instances provide for interruptible workloads running in your Kubernetes cluster. Using EKS-managed node groups with Spot Instances requires less operational effort compared to using self-managed nodes. In addition to launching Spot Instances in managed node groups, it is possible to specify multiple instance types in EKS managed node groups. You can find more in this blog.

Apache Spark and Kubernetes

When a spark application is submitted to the Kubernetes cluster the following happens:

  • A Spark driver is created.
  • The driver and the run within pods.
  • The Spark driver then requests for executors, which are scheduled to run within pods. The executors are managed by the driver.
  • The application is launched and once it completes, the executor pods are cleaned up. The driver pod persists the logs and remains in a completed state until the pod is cleared by garbage collection or manually removed. The driver in a completed stage does not consume any memory or compute resources.

Spark Deployment on Kubernetes Cluster

When a spark application runs on clusters managed by Kubernetes, the native Kubernetes scheduler is used. It is possible to schedule the driver/executor pods on a subset of available nodes. The applications can be launched either by a vanilla ‘spark submit’, a workflow orchestrator like Apache Airflow or the spark operator. I use vanilla ‘spark submit’ in this blog. is also able to schedule Spark applications on EKS clusters as described in this launch blog, but Amazon EMR on EKS is out of scope for this post.

Cost optimization

For any organization running big data workloads there are three key requirements: scalability, performance, and low cost. As the size of data increases, there is demand for more compute capacity and the total cost of ownership increases. It is critical to optimize the cost of big data applications. Big Data frameworks (in this case, Spark) are distributed to manage and process high volumes of data. These frameworks are designed for failure, can run on machines with different configurations, and are inherently resilient and flexible.

If Spark deploys on Kubernetes, the executor pods can be scheduled on EC2 Spot Instances and driver pods on On-Demand Instances. This reduces the overall cost of deployment – Spot Instances can save up to 90% over On-Demand Instance prices. This also enables faster results by scaling out executors running on Spot Instances. Spot Instances, by design, can be interrupted when EC2 needs the capacity back. If a driver pod is running on a Spot Instance, which is interrupted then the application fails and the application must be re-submitted. To avoid this situation, the driver pod can be scheduled on On-Demand Instances only. This adds a layer of resiliency to the Spark application running on Kubernetes. To cost optimize the deployment, all the executor pods are scheduled on Spot Instances as that’s where the bulk of compute happens. Spark’s inherent resiliency has the driver launch new executors to replace the ones that fail due to Spot interruptions.

There are a couple of key points to note here.

  • The idea is to start with minimum number of nodes for both On-Demand and Spot Instances (one each) and then auto-scale usingCluster Autoscaler and EC2 Auto Scaling  Cluster Autoscaler for AWS provides integration with Auto Scaling groups. If there are not sufficient resources, the driver and executor pods go into pending state. The Cluster Autoscaler detects pods in pending state and scales worker nodes within the identified Auto Scaling group in the cluster using EC2 Auto Scaling.
  • The scaling for On-Demand and Spot nodes is exclusive of one another. So, if multiple applications are launched the driver and executor pods can be scheduled in different node groups independently per the resource requirements. This helps reduce job failures due to lack of resources for the driver, thus adding to the overall resiliency of the system.
  • Using EKS Managed node groups
    • This requires significantly less operational effort compared to using self-managed nodegroup and enables:
      • Auto enforcement of Spot best practices like Capacity Optimized allocation strategy, Capacity Rebalancing and use multiple instances types.
      • Proactive replacement of Spot nodes using rebalance notifications.
      • Managed draining of Spot nodes via re-balance recommendations.
    • The nodes are auto-labeled so that the pods can be scheduled with NodeAffinity.
      • eks.amazonaws.com/capacityType: SPOT
      • eks.amazonaws.com/capacityType: ON_DEMAND

Now that you understand the products and best practices of used in this tutorial, let’s get started.

Tutorial: running Spark in EKS managed node groups with Spot Instances

In this tutorial, I review steps, which help you launch cost optimized and resilient Spark jobs inside Kubernetes clusters running on EKS. I launch a word-count application counting the words from an Amazon Customer Review dataset and write the output to an Amazon S3 folder. To run the Spark workload on Kubernetes, make sure you have eksctl and kubectl installed on your computer or on an AWS Cloud9 environment. You can run this by using an AWS IAM user or role that has the AdministratorAccess policy attached to it, or check the minimum required permissions for using eksctl. The spot node groups in the Amazon EKS cluster can be launched both in a managed or a self-managed way, in this post I use the former. The config files for this tutorial can be found here. The job is finally launched in cluster mode.

Create Amazon S3 Access Policy

First, I must create an Amazon S3 access policy to allow the Spark application to read/write from Amazon S3. Amazon S3 Access is provisioned by attaching the policy by ARN to the node groups. This associates Amazon S3 access to the NodeInstanceRole and, hence, the node groups then have access to Amazon S3. Download the Amazon S3 policy file from here and modify the <<output folder>> to an Amazon S3 bucket you created. Run the following to create the policy. Note the ARN.

aws iam create-policy --policy-name spark-s3-policy --policy-document file://spark-s3.json

Cluster and node groups deployment

Create an EKS cluster using the following command:

eksctl create cluster –name= sparkonk8 --node-private-networking  --without-nodegroup --asg-access –region=<<AWS Region>>

The cluster takes approximately 15 minutes to launch.

Create the nodegroup using the nodeGroup config file. Replace the <<Policy ARN>> string using the ARN string from the previous step.

eksctl create nodegroup -f managedNodeGroups.yml

Scheduling driver/executor pods

The driver and executor pods can be assigned to nodes using affinity. PodTemplates can be used to configure the detail, which is not supported by Spark launch configuration by default. This feature is available from Spark 3.0.0, requiredDuringScheduling node affinity is used to schedule the driver and executor jobs. Sample podTemplates have been uploaded here.

Launching a Spark application

Create a service account. The spark driver pod uses the service account to create and watch executor pods using Kubernetes API server.

kubectl create serviceaccount spark
kubectl create clusterrolebinding spark-role --clusterrole='edit'  --serviceaccount=default:spark --namespace=default

Download the Cluster Autoscaler and edit it to add the cluster-name. 

curl -LO https://raw.githubusercontent.com/kubernetes/autoscaler/master/cluster-autoscaler/cloudprovider/aws/examples/cluster-autoscaler-autodiscover.yaml

Install the Cluster AutoScaler using the following command:

kubectl apply -f cluster-autoscaler-autodiscover.yaml

Get the details of Kubernetes master to get the head URL.

kubectl cluster-info 

command output

Use the following instructions to build the docker image.

Download the application file (script.py) from here and upload into the Amazon S3 bucket created.

Download the pod template files from here. Submit the application.

bin/spark-submit \
--master k8s://<<MASTER URL>> \
--deploy-mode cluster \
--name 'Job Name' \
--conf spark.eventLog.dir=s3a:// <<S3 BUCKET>>/logs \
--conf spark.eventLog.enabled=true \
--conf spark.history.fs.inProgressOptimization.enabled=true \
--conf spark.history.fs.update.interval=5s \
--conf spark.kubernetes.container.image=<<ECR Spark Docker Image>> \
--conf spark.kubernetes.container.image.pullPolicy=IfNotPresent \
--conf spark.kubernetes.driver.podTemplateFile='../driver_pod_template.yml' \
--conf spark.kubernetes.executor.podTemplateFile='../executor_pod_template.yml' \
--conf spark.kubernetes.authenticate.driver.serviceAccountName=spark \
--conf spark.dynamicAllocation.enabled=true \
--conf spark.dynamicAllocation.shuffleTracking.enabled=true \
--conf spark.dynamicAllocation.maxExecutors=100 \
--conf spark.dynamicAllocation.executorAllocationRatio=0.33 \
--conf spark.dynamicAllocation.sustainedSchedulerBacklogTimeout=30 \
--conf spark.dynamicAllocation.executorIdleTimeout=60s \
--conf spark.driver.memory=8g \
--conf spark.kubernetes.driver.request.cores=2 \
--conf spark.kubernetes.driver.limit.cores=4 \
--conf spark.executor.memory=8g \
--conf spark.kubernetes.executor.request.cores=2 \
--conf spark.kubernetes.executor.limit.cores=4 \
--conf spark.hadoop.fs.s3a.impl=org.apache.hadoop.fs.s3a.S3AFileSystem \
--conf spark.hadoop.fs.s3a.connection.ssl.enabled=false \
--conf spark.hadoop.fs.s3a.fast.upload=true \
s3a://<<S3 BUCKET>>/script.py \
s3a://<<S3 BUCKET>>/output 

A couple of key points to note here

  • podTemplateFile is used here, which enables scheduling of the driver pods to On-Demand Instances and executor pods to Spot Instances.
  • Spark provides a mechanism to allocate dynamically resources dynamically based on workloads. In the latest release of Spark (3.0.0), dynamicAllocation can be used with Kubernetes cluster manager. The executors that do not store, active, shuffled files can be removed to free up the resources. DynamicAllocation works well in tandem with Cluster Autoscaler for resource allocation and optimizes resource for jobs. We are using dynamicAllocation here to enable optimized resource sharing.
  • The application file and output are both in Amazon S3.

Output Files in S3

  • Spark Event logs are redirected to Amazon S3. Spark on Kubernetes creates local temporary files for logs and removes them once the application completes. The logs are redirected to Amazon S3 and Spark History Server can be used to analyze the logs. Note, you can create more instrumentation using tools like Prometheus and Grafana to monitor and manage the cluster.

Spark History Server + Dynamic Allocation

Observations

EC2 Spot Interruptions

The following diagram and log screenshot details from Spark History server showcases the behavior of a Spark application in case of an EC2 Spot interruption.

Four Spark applications launched in parallel in a cluster and one of the Spot nodes was interrupted. A couple of executor pods were terminated shut down in three of the four applications, but due to the resilient nature of Spark new executors were launched and the applications finished almost around the same time.
The Spark Driver identified the shut down executors, which handled the shuffle files and relaunched the tasks running on those executors.
Spark jobs

The Spark Driver identified the shut down executors, which handled the shuffle files and relaunched the tasks running on those executors.

Dynamic Allocation

Dynamic Allocation works with the caveat that it is an experimental feature.

dynamic allocation

Cost Optimization

Cost Optimization is achieved in several different ways from this tutorial.

  • Use of 100% Spot Instances for the Spark executors
  • Use of dynamicAllocation along with cluster autoscaler does make optimized use of resources and hence save cost
  • With the deployment of one driver and executor nodes to begin with and then scaling up on demand reduces the waste of a continuously running cluster

Cluster Autoscaling

Cluster Autoscaling is triggered as it is designed when there are pending (Spark executor) pods.

The Cluster Autoscaler logs can be fetched by:

kubectl logs -f deployment/cluster-autoscaler -n kube-system —tail=10  

Cluster Autoscaler Logs 

Cleanup

If you are trying out the tutorial, run the following steps to make sure that you don’t encounter unwanted costs.

Delete the EKS cluster and the nodegroups with the following command:

eksctl delete cluster --name sparkonk8

Delete the Amazon S3 Access Policy with the following command:

aws iam delete-policy --policy-arn <<POLICY ARN>>

Delete the Amazon S3 Output Bucket with the following command:

aws s3 rb --force s3://<<S3_BUCKET>>

Conclusion

In this blog, I demonstrated how you can run Spark workloads on a Kubernetes Cluster using Spot Instances, achieving scalability, resilience, and cost optimization. To cost optimize your Spark based big data workloads, consider running spark application using Kubernetes and EC2 Spot Instances.


Operating Lambda: Anti-patterns in event-driven architectures – Part 3

Post Syndicated from James Beswick original https://aws.amazon.com/blogs/compute/operating-lambda-anti-patterns-in-event-driven-architectures-part-3/

In the Operating Lambda series, I cover important topics for developers, architects, and systems administrators who are managing AWS Lambda-based applications. This three-part section discusses event-driven architectures and how these relate to Lambda-based applications.

Part 1 covers the benefits of the event-driven paradigm and how it can improve throughput, scale, and extensibility. Part 2 explains some of the design principles and best practices that can help developers gain the benefits of building Lambda-based applications. This post explores anti-patterns in event-driven architectures.

Lambda is not a prescriptive service and provides broad functionality for you to build applications as needed. While this flexibility is important to customers, there are some designs that are technically functional but suboptimal from an architecture standpoint.

The Lambda monolith

In many applications migrated from traditional servers, Amazon EC2 instances or AWS Elastic Beanstalk applications, developers “lift and shift” existing code. Frequently, this results in a single Lambda function that contains all of the application logic that is triggered for all events. For a basic web application, for example, a monolithic Lambda function handles all Amazon API Gateway routes and integrates with all necessary downstream resources:

Monolithic Lambda application

This approach has several drawbacks:

  • Package size: The Lambda function may be much larger because it contains all possible code for all paths, which makes it slower for the Lambda service to download and run.
  • Harder to enforce least privilege: The function’s IAM role must grant permissions for all resources needed for all paths, making the permissions very broad. Many paths in the functional monolith do not need all the permissions that have been granted.
  • Harder to upgrade: In a production system, any upgrades to the single function are more risky and could cause the entire application to stop working. Upgrading a single path in the Lambda function is an upgrade to the entire function.
  • Harder to maintain: It’s more difficult to have multiple developers working on the service since it’s a monolithic code repository. It also increases the cognitive burden on developers and makes it harder to create appropriate test coverage for code.
  • Harder to reuse code: Typically, it can be harder to separate libraries from monoliths, making code reuse more difficult. As you develop and support more projects, this can make it harder to support the code and scale your team’s velocity.
  • Harder to test: As the lines of code increase, it becomes harder to unit all the possible combinations of inputs and entry points in the code base. It’s generally easier to implement unit testing for smaller services with less code.

The preferred alternative is to decompose the monolithic Lambda function into individual microservices, mapping a single Lambda function to a single, well-defined task. In this example web application with a few API endpoints, the resulting microservice-based architecture is based on the API routes.

Microservice architecture

The process of decomposing a monolith depends upon the complexity of your workload. Using strategies like the strangler pattern, you can migrate code from larger code bases to microservices. There are many potential benefits to running a Lambda-based application this way:

  • Package sizes can be optimized for only the code needed for a single task, which helps make the function more performant, and may reduce running cost.
  • IAM roles can be scoped to precisely the access needed by the microservice, making it easier to enforce the principles of least privilege. In controlling the blast radius, using IAM roles this way can give your application a stronger security posture.
  • Easier to upgrade: you can apply upgrades at a microservice level without impacting the entire workload. Upgrades occur at the functional level, not at the application level, and you can implement canary releases to control the rollout.
  • Easier to maintain: adding new features is usually easier when working with a single small service than a monolithic with significant coupling. Frequently, you implement features by adding new Lambda functions without modifying existing code.
  • Easier to reuse code: when you have specialized functions that perform a single task, it’s often easier to copy these across multiple projects. Building a library of generic specialized functions can help accelerate development in future projects.
  • Easier to test: unit testing is easier when there are few lines of code and the range of potential inputs for a function is smaller.
  • Lower cognitive load for developers since each development team has a smaller surface area of the application to understand. This can help accelerate onboarding for new developers.

To learn more, read “Decomposing the Monolith with Event Storming”.

Lambda as orchestrator

Many business workflows result in complex workflow logic, where the flow of operations depends on multiple factors. In an ecommerce example, a payments service is an example of a complex workflow:

  • A payment type may be cash, check, or credit card, all of which have different processes.
  • A credit card payment has many possible states, from successful to declined.
  • The service may need to issue refunds or credits for a portion or the entire amount.
  • A third-party service that processes credit cards may be unavailable due to an outage.
  • Some payments may take multiple days to process.

Implementing this logic in a Lambda function can result in ‘spaghetti code’ that’s different to read, understand, and maintain. It can also become fragile in production systems. The complexity is compounded if you must handle error handling, retry logic, and inputs and outputs processing. These types of orchestration functions are an anti-pattern in Lambda-based applications.

Instead, use AWS Step Functions to orchestrate these workflows using a versionable, JSON-defined state machine. State machines can handle nested workflow logic, errors, and retries. A workflow can also run for up to 1 year, and the service can maintain different versions of workflows, allowing you to upgrade production systems in place. Using this approach also results in less custom code, making an application easier to test and maintain.

While Step Functions is generally best-suited for workflows within a bounded context or microservice, to coordinate state changes across multiple services, instead use Amazon EventBridge. This is a serverless event bus that routes events based upon rules, and simplifies orchestration between microservices.

Recursive patterns that cause invocation loops

AWS services generate events that invoke Lambda functions, and Lambda functions can send messages to AWS services. Generally, the service or resource that invokes a Lambda function should be different to the service or resource that the function outputs to. Failure to manage this can result in invocation loops.

For example, a Lambda function writes an object to an Amazon S3 object, which in turn invokes the same Lambda function via a put event. The invocation causes a second object to be written to the bucket, which invokes the same Lambda function:

Event loops in Lambda-based applications

While the potential for infinite loops exists in most programming languages, this anti-pattern has the potential to consume more resources in serverless applications. Both Lambda and S3 automatically scale based upon traffic, so the loop may cause Lambda to scale to consume all available concurrency and S3 to continue to write objects and generate more events for Lambda. In this situation, you can press the “Throttle” button in the Lambda console to scale the function concurrency down to zero and break the recursion cycle.

This example uses S3 but the risk of recursive loops also exists in Amazon SNS, Amazon SQS, Amazon DynamoDB, and other services. In most cases, it is safer to separate the resources that produce and consume events from Lambda. However, if you need a Lambda function to write data back to the same resource that invoked the function, ensure that you:

  • Use a positive trigger: For example, an S3 object trigger may use a naming convention or meta tag that is only triggered on the first invocation. This prevents objects written from the Lambda function from invoking the same Lambda function again. See the S3-to-Lambda translation application for an example of this mechanism.
  • Use reserved concurrency: Setting the function’s reserved concurrency to a lower limit prevents the function from scaling concurrently beyond that limit. It does not prevent the recursion, but limits the resources consumed as a safety mechanism. This can be useful during the development and test phases.
  • Use Amazon CloudWatch monitoring and alarming: By setting an alarm on a function’s concurrency metric, you can receive alerts if the concurrency suddenly spikes and take appropriate action.

Lambda functions calling Lambda functions

Functions enable encapsulation and code reuse. Most programming languages support the concept of code synchronously calling functions within a code base. In this case, the caller waits until the function returns a response. This model does not generally adapt well to serverless development.

For example, consider a simple ecommerce application consisting of three Lambda functions that process an order:

Ecommerce example with three functions

In this case, the Create order function calls the Process payment function, which in turn calls the Create invoice function. While this synchronous flow may work within a single application on a server, it introduces several avoidable problems in a distributed serverless architecture:

  • Cost: With Lambda, you pay for the duration of an invocation. In this example, while the Create invoice functions runs, two other functions are also running in a wait state, shown in red on the diagram.
  • Error handling: In nested invocations, error handling can become more complex. Either errors are thrown to parent functions to handle at the top-level function, or functions require custom handling. For example, an error in Create invoice might require the Process payment function to reverse the charge, or it may instead retry the Create invoice process.
  • Tight coupling: Processing a payment typically takes longer than creating an invoice. In this model, the availability of the entire workflow is limited by the slowest function.
  • Scaling: The concurrency of all three functions must be equal. In a busy system, this uses more concurrency than would otherwise be needed.

In serverless applications, there are two common approaches to avoid this pattern. First, use an SQS queue between Lambda functions. If a downstream process is slower than an upstream process, the queue durably persists messages and decouples the two functions. In this example, the Create order function publishes a message to an SQS queue, and the Process payment function consumes messages from the queue.

The second approach is to use AWS Step Functions. For complex processes with multiple types of failure and retry logic, Step Functions can help reduce the amount of custom code needed to orchestrate the workflow. As a result, Step Functions orchestrates the work and robustly handles errors and retries, and the Lambda functions contain only business logic.

Synchronous waiting within a single Lambda function

Within a single Lambda, ensure that any potentially concurrent activities are not scheduled synchronously. For example, a Lambda function might write to an S3 bucket and then write to a DynamoDB table:

The wait states, shown in red in the diagram, are compounded because the activities are sequential. If the tasks are independent, they can be run in parallel, which results in the total wait time being set by the longest-running task.

Parallel tasks in Lambda functions

In cases where the second task depends on the completion of the first task, you may be able to reduce the total waiting time and the cost of execution by splitting the Lambda functions:

Splitting tasks over two functions

In this design, the first Lambda function responds immediately after putting the object to the S3 bucket. The S3 service invokes the second Lambda function, which then writes data to the DynamoDB table. This approach minimizes the total wait time in the Lambda function executions.

To learn more, read the “Serverless Applications Lens” from the AWS Well-Architected Framework.

Conclusion

This post discusses anti-patterns in event-driven architectures using Lambda. I show some of the issues when using monolithic Lambda functions or custom code to orchestrate workflows. I explain how to avoid recursive architectures that may cause invocation loops and why you should avoid calling functions from functions. I also explain different approaches to handling waiting in functions to minimize cost.

For more serverless learning resources, visit Serverless Land.

How to monitor Windows and Linux servers and get internal performance metrics

Post Syndicated from Emma White original https://aws.amazon.com/blogs/compute/how-to-monitor-windows-and-linux-servers-and-get-internal-performance-metrics/

This post was written by Dean Suzuki, Senior Solutions Architect.

Customers who run Windows or Linux instances on AWS frequently ask, “How do I know if my disks are almost full?” or “How do I know if my application is using all the available memory and is paging to disk?” This blog helps answer these questions by walking you through how to set up monitoring to capture these internal performance metrics.

Solution overview

If you open the Amazon EC2 console, select a running Amazon EC2 instance, and select the Monitoring tab  you can see Amazon CloudWatch metrics for that instance. Amazon CloudWatch is an AWS monitoring service. The Monitoring tab (shown in the following image) shows the metrics that can be measured external to the instance (for example, CPU utilization, network bytes in/out). However, to understand what percentage of the disk is being used or what percentage of the memory is being used, these metrics require an internal operating system view of the instance. AWS places an extra safeguard on gathering data inside a customer’s instance so this capability is not enabled by default.

EC2 console showing Monitoring tab

To capture the server’s internal performance metrics, a CloudWatch agent must be installed on the instance. For Windows, the CloudWatch agent can capture any of the Windows performance monitor counters. For Linux, the CloudWatch agent can capture system-level metrics. For more details, please see Metrics Collected by the CloudWatch Agent. The agent can also capture logs from the server. The agent then sends this information to Amazon CloudWatch, where rules can be created to alert on certain conditions (for example, low free disk space) and automated responses can be set up (for example, perform backup to clear transaction logs). Also, dashboards can be created to view the health of your Windows servers.

There are four steps to implement internal monitoring:

  1. Install the CloudWatch agent onto your servers. AWS provides a service called AWS Systems Manager Run Command, which enables you to do this agent installation across all your servers.
  2. Run the CloudWatch agent configuration wizard, which captures what you want to monitor. These items could be performance counters and logs on the server. This configuration is then stored in AWS System Manager Parameter Store
  3. Configure CloudWatch agents to use agent configuration stored in Parameter Store using the Run Command.
  4. Validate that the CloudWatch agents are sending their monitoring data to CloudWatch.

The following image shows the flow of these four steps.

Process to install and configure the CloudWatch agent

In this blog, I walk through these steps so that you can follow along. Note that you are responsible for the cost of running the environment outlined in this blog. So, once you are finished with the steps in the blog, I recommend deleting the resources if you no longer need them. For the cost of running these servers, see Amazon EC2 On-Demand Pricing. For CloudWatch pricing, see Amazon CloudWatch pricing.

If you want a video overview of this process, please see this Monitoring Amazon EC2 Windows Instances using Unified CloudWatch Agent video.

Deploy the CloudWatch agent

The first step is to deploy the Amazon CloudWatch agent. There are multiple ways to deploy the CloudWatch agent (see this documentation on Installing the CloudWatch Agent). In this blog, I walk through how to use the AWS Systems Manager Run Command to deploy the agent. AWS Systems Manager uses the Systems Manager agent, which is installed by default on each AWS instance. This AWS Systems Manager agent must be given the appropriate permissions to connect to AWS Systems Manager, and to write the configuration data to the AWS Systems Manager Parameter Store. These access rights are controlled through the use of IAM roles.

Create two IAM roles

IAM roles are identity objects that you attach IAM policies. IAM policies define what access is allowed to AWS services. You can have users, services, or applications assume the IAM roles and get the assigned rights defined in the permissions policies.

To use System Manager, you typically create two IAM roles. The first role has permissions to write the CloudWatch agent configuration information to System Manager Parameter Store. This role is called CloudWatchAgentAdminRole.

The second role only has permissions to read the CloudWatch agent configuration from the System Manager Parameter Store. This role is called CloudWatchAgentServerRole.

For more details on creating these roles, please see the documentation on Create IAM Roles and Users for Use with the CloudWatch Agent.

Attach the IAM roles to the EC2 instances

Once you create the roles, you attach them to your Amazon EC2 instances. By attaching the IAM roles to the EC2 instances, you provide the processes running on the EC2 instance the permissions defined in the IAM role. In this blog, you create two Amazon EC2 instances. Attach the CloudWatchAgentAdminRole to the first instance that is used to create the CloudWatch agent configuration. Attach CloudWatchAgentServerRole to the second instance and any other instances that you want to monitor. For details on how to attach or assign roles to EC2 instances, please see the documentation on How do I assign an existing IAM role to an EC2 instance?.

Install the CloudWatch agent

Now that you have setup the permissions, you can install the CloudWatch agent onto the servers that you want to monitor. For details on installing the CloudWatch agent using Systems Manager, please see the documentation on Download and Configure the CloudWatch Agent.

Create the CloudWatch agent configuration

Now that you installed the CloudWatch agent on your server, run the CloudAgent configuration wizard to create the agent configuration. For instructions on how to run the CloudWatch Agent configuration wizard, please see this documentation on Create the CloudWatch Agent Configuration File with the Wizard. To establish a command shell on the server, you can use AWS Systems Manager Session Manager to establish a session to the server and then run the CloudWatch agent configuration wizard. If you want to monitor both Linux and Windows servers, you must run the CloudWatch agent configuration on a Linux instance and on a Windows instance to create a configuration file per OS type. The configuration is unique to the OS type.

To run the Agent configuration wizard on Linux instances, run the following command:

sudo /opt/aws/amazon-cloudwatch-agent/bin/amazon-cloudwatch-agent-config-wizard

To run the Agent configuration wizard on Windows instances, run the following commands:

cd "C:\Program Files\Amazon\AmazonCloudWatchAgent"

amazon-cloudwatch-agent-config-wizard.exe

Note for Linux instances: do not select to collect the collectd metrics in the agent configuration wizard unless you have collectd installed on your Linux servers. Otherwise, you may encounter an error.

Review the Agent configuration

The CloudWatch agent configuration generated from the wizard is stored in Systems Manager Parameter Store. You can review and modify this configuration if you need to capture extra metrics. To review the agent configuration, perform the following steps:

  1. Go to the console for the System Manager service.
  2. Click Parameter store on the left hand navigation.
  3. You should see the parameter that was created by the CloudWatch agent configuration program. For Linux servers, the configuration is stored in: AmazonCloudWatch-linux and for Windows servers, the configuration is stored in:  AmazonCloudWatch-windows.

System Manager Parameter Store: Parameters created by CloudWatch agent configuration wizard

  1. Click on the parameter’s hyperlink (for example, AmazonCloudWatch-linux) to see all the configuration parameters that you specified in the configuration program.

In the following steps, I walk through an example of modifying the Windows configuration parameter (AmazonCloudWatch-windows) to add an additional metric (“Available Mbytes”) to monitor.

  1. Click the AmazonCloudWatch-windows
  2. In the parameter overview, scroll down to the “metrics” section and under “metrics_collected”, you can see the Windows performance monitor counters that will be gathered by the CloudWatch agent. If you want to add an additional perfmon counter, then you can edit and add the counter here.
  3. Press Edit at the top right of the AmazonCloudWatch-windows Parameter Store page.
  4. Scroll down in the Value section and look for “Memory.”
  5. After the “% Committed Bytes In Use”, put a comma “,” and then press Enter to add a blank line. Then, put on that line “Available Mbytes” The following screenshot demonstrates what this configuration should look like.

AmazonCloudWatch-windows parameter contents and how to add a new metric to monitor

  1. Press Save Changes.

To modify the Linux configuration parameter (AmazonCloudWatch-linux), you perform similar steps except you click on the AmazonCloudWatch-linux parameter. Here is additional documentation on creating the CloudWatch agent configuration and modifying the configuration file.

Start the CloudWatch agent and use the configuration

In this step, start the CloudWatch agent and instruct it to use your agent configuration stored in System Manager Parameter Store.

  1. Open another tab in your web browser and go to System Manager console.
  2. Specify Run Command in the left hand navigation of the System Manager console.
  3. Press Run Command
  4. In the search bar,
    • Select Document name prefix
    • Select Equal
    • Specify AmazonCloudWatch (Note the field is case sensitive)
    • Press enter

System Manager Run Command's command document entry field

  1. Select AmazonCloudWatch-ManageAgent. This is the command that configures the CloudWatch agent.
  2. In the command parameters section,
    • For Action, select Configure
    • For Mode, select ec2
    • For Optional Configuration Source, select ssm
    • For optional configuration location, specify the Parameter Store name. For Windows instances, you would specify AmazonCloudWatch-windows for Windows instances or AmazonCloudWatch-linux for Linux instances. Note the field is case sensitive. This tells the command to read the Parameter Store for the parameter specified here.
    • For optional restart, leave yes
  3. For Targets, choose your target servers that you wish to monitor.
  4. Scroll down and press Run. The Run Command may take a couple minutes to complete. Press the refresh button. The Run Command configures the CloudWatch agent by reading the Parameter Store for the configuration and configure the agent using those settings.

For more details on installing the CloudWatch agent using your agent configuration, please see this Installing the CloudWatch Agent on EC2 Instances Using Your Agent Configuration.

Review the data collected by the CloudWatch agents

In this step, I walk through how to review the data collected by the CloudWatch agents.

  1. In the AWS Management console, go to CloudWatch.
  2. Click Metrics on the left-hand navigation.
  3. You should see a custom namespace for CWAgent. Click on the CWAgent Please note that this might take a couple minutes to appear. Refresh the page periodically until it appears.
  4. Then click the ImageId, Instanceid hyperlinks to see the counters under that section.

CloudWatch Metrics: Showing counters under CWAgent

  1. Review the metrics captured by the CloudWatch agent. Notice the metrics that are only observable from inside the instance (for example, LogicalDisk % Free Space). These types of metrics would not be observable without installing the CloudWatch agent on the instance. From these metrics, you could create a CloudWatch Alarm to alert you if they go beyond a certain threshold. You can also add them to a CloudWatch Dashboard to review. To learn more about the metrics collected by the CloudWatch agent, see the documentation Metrics Collected by the CloudWatch Agent.

Conclusion

In this blog, you learned how to deploy and configure the CloudWatch agent to capture the metrics on either Linux or Windows instances. If you are done with this blog, we recommend deleting the System Manager Parameter Store entry, the CloudWatch data and  then the EC2 instances to avoid further charges. If you would like a video tutorial of this process, please see this Monitoring Amazon EC2 Windows Instances using Unified CloudWatch Agent video.