I can recall countless late nights as a student spent building out ideas that felt like breakthroughs. My own thesis had significant costs associated with the tools and computational resources I needed. The reality for students is that turning ideas into working applications often requires production-grade tools, and having to pay for them can stop a great project before it even starts. We don’t think that cost should stand in the way of building out your ideas.
Cloudflare’s Developer Platform already makes it easy for anyone to go from idea to launch. It gives you all the tools you need in one place to work on that class project, build out your portfolio, and create full-stack applications. We want students to be able to use these tools without worrying about the cost, so starting today, students at least 18 years old in the United States with a verified .edu email can receive 12 months of free access to Cloudflare’s developer features. This is the first step for Cloudflare for Students, and we plan to continue expanding our support for the next generation of builders.
What’s included
12 months of our paid developer features plan at no upfront cost
Eligible student accounts will receive increased usage allotments for our developer features compared to our free plan. That includes Workers, Pages Functions, KV, Containers, Vectorize, Hyperdrive, Durable Objects, Workers Logpush, and Queues. With these, you can build everything from APIs and full-stack apps to data pipelines and websites.
After 12 months, you can easily renew your subscription by upgrading to our Workers Paid plan. If you choose not to, your account will automatically revert to the free plan, and you won’t be charged.
Here’s a look at the increased usage allotments students can receive today. Above those free allotments, our standard usage rates will apply.
You’ll also have access to a dedicated Discord channel just for students. We want to see what you’re building! This is a place to connect with peers, get support, and share ideas in a community of student developers.
What others have built with Cloudflare’s Developer Platform
Curious about what’s possible with Cloudflare’s developer features? Here are some projects from our community:
Adventure is a text-based adventure game running on Cloudflare Workers that uses Workers AI to generate the stories with the @cf/google/gemma-3-12b-it model.
The project’s developer chose Workers AI with the OpenNext adapter because it made deployment simple and handled scaling automatically. It uses the Workers Paid plan mainly to enable Workers Logpush and get access to detailed logs for better monitoring and analysis.
When a new game starts, the server gives the AI a custom prompt to set the scene and explain how the adventure should work. From there, each time the player makes a choice, their story history is sent back to the server, which asks the AI to continue the narrative, allowing the story to evolve dynamically based on the player’s choices.
The code below shows how this logic is implemented:
"use server";
import { getCloudflareContext } from "@opennextjs/cloudflare";

async function prime(env: CloudflareEnv) {
  const id = Math.floor(Math.random() * 1000000);//unique ID for each game run
  const messages = [
    {
      role: "user",
      content:
        `The user is playing a text-based adventure game. Each game is different, this is game ${id}. Your first job is to create a short background story in 3-4 sentences. Scenarios may include interesting locations such as jungles, deserts, caves.
        After the first message, each of your messages will be responses to the user interaction. State three short options (A, B, C). The user responses will be the chosen action. Your responses should end by asking the user about their choice.
        Your message will be shown to the user directly, so avoid "Certainly", "Great", "Let's get started", and other filler content, and avoid bringing up technical details such as "this is game #id".
        The games should have a win condition that is actually feasible given the story, and if the player loses, the message should end with "Try again.".
        `,
    },
  ];
  //Call Workers AI to generate the first response (story intro)
  const { response } = await env.AI.run("@cf/google/gemma-3-12b-it", { messages });

  return [
    ...messages,
    { role: "assistant", content: response }
  ];
}

/**
 * Main server action for the adventure game.
 * If no input yet, it primes the game with the opening story
 * If there is input, it continues the story based on the full history
 * Uses getCloudflareContext from @opennextjs/cloudflare to access env.
 */
export async function adventureAction(input: any[]) {
  let { env } = await getCloudflareContext({ async: true });

  return input.length === 0
  ? await prime(env)
  : [...input,
      { role: "assistant", content: (await env.AI.run("@cf/google/gemma-3-12b-it", { messages: input })).response }
  ];
}
DNS over Discord is a bot that lets you run DNS lookups right inside Discord. Instead of switching to a terminal or online tool, you can use simple slash commands to check records like A, AAAA, MX, TXT, and more.
The developer behind the project chose Cloudflare Workers because it’s a great platform for running small JavaScript apps that handle requests, which made it a good fit for Discord’s slash commands. Since every command translates into a request and the bot sees a lot of traffic, the free tier wasn’t enough, so it now runs on Workers Paid to keep up reliably without hitting request limits.
In this project, the Worker checks if the request is a Discord interaction, and if so, it sends it to the right command (e.g., /dig, /multi-dig, etc.), using a handler that calls out to a custom framework for Discord slash commands. If it’s not from Discord, it can also serve routes like the privacy page or terms of service.
Here’s what that looks like in code:
export default {
  // Process all requests to the Worker
  fetch: async (request, env, ctx) => {
    try {
      // Include the env in the context we pass to the handler
      ctx.env = env;

      // Check if it's a Discord interaction (or a health check)
      const resp = await handler(request, ctx);
      if (resp) return resp;

      // Otherwise, process the request
      const url = new URL(request.url);

      if (request.method === 'GET' && url.pathname === '/privacy')
        return new textResponse(Privacy);

      if (request.method === 'GET' && url.pathname === '/terms')
        return new textResponse(Terms);

      // Fallback if nothing matches
      return new textResponse(null, { status: 404 });
    } catch (err) {
      // Log any errors
      captureException(err);

      // Re-throw the error
      throw err;
    }
  },
};
placeholders.dev is a service that generates placeholder images, making it easy for developers to prototype and scaffold websites without dealing with hosting or asset management. Users can generate placeholders instantly with a simple URL, such as: https://images.placeholders.dev/350x150
Since placeholders are typically used in early development, speed and consistency matter, and images need to load instantly so the workflow isn’t interrupted. Running on Cloudflare Workers makes the service fast and consistent no matter where developers are.
This project uses the Workers Paid plan because it regularly exceeds the free-tier limits on requests and compute time. The Worker below shows the core of how the service works. When a request comes in, it looks at the URL path (like /300x150) to determine the size of the placeholder, applies some defaults for style, and then returns an SVG image on the fly.
Check out Built With Workers to see what other developers are building with our developer platform.
How do I get started?
This offering is available to United States students at least 18 years old with a verified .edu billing email address.
Based on when your account was created, you can redeem this offer either by signing up for a free Cloudflare account with your .edu email or by filling out a form to request access for your existing .edu account. Just make sure your verified .edu email address is your billing email address.
Fill out our form and a member of our team will help you get access
Note: in order to receive the credit, your verified .edu email address needs to be your billing email address
Expanding Cloudflare for Students coverage
While our first offering is primarily for institutions in the US, we’re working on expanding support for our students in other countries and plan to add additional higher education domain names after launch. If you’re at an educational institution outside of the United States, please reach out to us and apply for your educational/academic domain to be added. We’ll let you know as soon as it becomes available in your region. Check our Cloudflare for Students page for updates and keep an eye out for emails if you have an account with a newly supported domain.
Whether you’re gearing up for your first hackathon, launching a side project, or looking to build the next big thing, you can get started today with free access and join a global developer community already building on Cloudflare.
Cloudflare’s offices bring together builders in some of the world’s most popular technology hubs. We have a long history of using those spaces for one-off events and meet ups over the last fifteen years, but we want to do more. Starting in 2026, we plan to open the doors of our offices routinely to startups and builders from outside of our team who need the space to collaborate, meet new people, or just type away at a keyboard in a new (and beautiful) location.
What are our offices meant to be?
Prior to 2020, we expected essentially every team member of Cloudflare to be present in one of our offices five days a week. That worked well for us and helped facilitate the launch of dozens of technologies as well as a community and culture that defined who we are.
Like every other team on the planet, the COVID pandemic forced us to revisit that approach. We used the time to think about what our offices could be, in a world where not every team member showed up every day of the week. While we decided we would be open to remote and hybrid work, we still felt like some of our best work was done in person together. The goal became building spaces that encouraged team members to be present.
Several hard hats and a few leases later, we’ve created a network of offices around the world designed to evolve with the way people work. These spaces aren’t just places to sit — they’re environments that empower people to do their best work — whether that means quiet focus, creative problem-solving, or lively collaboration. From a library tucked into a quiet zone in our waterfront Lisbon office, to the high-ceilinged collaboration areas in the heart of Austin, each office reflects our belief that great spaces support diverse working styles and help teams thrive together.
Our offices are meant to connect our teams, and we believe that by opening our doors to the wider community, we can foster even more innovation and help new companies collaborate better. Cloudflare has always been a hub for builders, and now we’re making that commitment official by welcoming startups into our physical spaces.
Why make them even more open to the community?
Our spaces have served as hosts to community events since the earliest days of Cloudflare. We have brought together just about every group from hackathons to language meet-ups to university orientation sessions. Cloudflare exists to help build a better Internet and in many cases a better digital environment starts with relationships built in a real life environment.
One of the most common pieces of feedback we have received in the last few years after hosting these events is “I really miss connecting with people like this.” And we hear that most often from small teams in the earliest stages of their journey. In the last few years as the start-ups we support with our platform increasingly begin remote-first and only open dedicated spaces in later stages of their growth.
We know that building a company can be a lonely path. We have helped over the last several years by providing a robust free plan and a comprehensive start-up program, but we think we can do more.
Cloudflare’s network supports a significant percentage of the Internet and, as you would expect, the Internet follows the sun. More people use it during the daytime than at night, meaning our data center utilization peaks in specific times of the day. We take advantage of that pattern to run services that are less latency-sensitive in regions overnight.
Our physical locations follow a similar pattern. Utilization resembles a bell curve with Tuesdays, Wednesdays, and Thursdays seeing a lot of traffic while Mondays and Fridays tend to be quieter. Like our CPUs at night, we think we can use that excess capacity to help build a better Internet by giving builders a space to congregate and helping our team connect with more of our users.
How will this work?
Beginning in January of 2026, we plan to make our office locations available to a capped number of external visitors as all-day coworking spaces on select days of each week. We will provide a registration process (more on that below) and set some ground rules. To start, we plan to expand this offering to San Francisco, Austin, London, and Lisbon.
When external visitors arrive, they’ll have access to our common spaces to bring together their teams or just get some work done by themselves. No mandatory talks or obligations. Just fantastic working spaces available to use at no cost.
How can you participate?
We will provide more details in the next few weeks, but the general structure will be based on the following steps.
Enroll in the Cloudflare for Startups Program. Bonus if you are a Workers Launchpad participant or alumni.
Sit tight for now. We will email participating Startup Program customers first to participate with a form requesting office access.
Once the form is filled out, a member of our team will reach out after. If you want to get a head start, fill out the form here.
We plan to roll this out on a cohort basis. Once approved and all requirements are met, register your visit (and that of any additional team members) at least three business days prior to the date requested.
Respect our working spaces as you would your own.
What’s next?
We hope to expand to other locations in the future. Want to get to the front of the line? Sign up for our Startup program here today and we will reach out to Startup Program participants before we roll out the program.
We’re making it easier to run your Node.js applications on Cloudflare Workers by adding support for the node:http client and server APIs. This significant addition brings familiar Node.js HTTP interfaces to the edge, enabling you to deploy existing Express.js, Koa, and other Node.js applications globally with zero cold starts, automatic scaling, and significantly lower latency for your users — all without rewriting your codebase. Whether you’re looking to migrate legacy applications to a modern serverless platform or build new ones using the APIs you already know, you can now leverage Workers’ global network while maintaining your existing development patterns and frameworks.
The Challenge: Node.js-style HTTP in a Serverless Environment
Cloudflare Workers operate in a unique serverless environment where direct tcp connection isn’t available. Instead, all networking operations are fully managed by specialized services outside the Workers runtime itself — systems like our Open Egress Router (OER) and Pingora that handle connection pooling, keeping connections warm, managing egress IPs, and all the complex networking details. This means as a developer, you don’t need to worry about TLS negotiation, connection management, or network optimization — it’s all handled for you automatically.
This fully-managed approach is actually why we can’t support certain Node.js APIs — these networking decisions are handled at the system level for performance and security. While this makes Workers different from traditional Node.js environments, it also makes them better for serverless computing — you get enterprise-grade networking without the complexity.
This fundamental difference required us to rethink how HTTP APIs work at the edge while maintaining compatibility with existing Node.js code patterns.
Our Solution: we’ve implemented the core `node:http` APIs by building on top of the web-standard technologies that Workers already excel at. Here’s how it works:
HTTP Client APIs
The node:http client implementation includes the essential APIs you’re familiar with:
http.get() – For simple GET requests
http.request() – For full control over HTTP requests
Our implementations of these APIs are built on top of the standard fetch() API that Workers use natively, providing excellent performance while maintaining Node.js compatibility.
TLS-specific options are not supported (Workers handle TLS automatically).
HTTP Server APIs
The server-side implementation is where things get particularly interesting. Since Workers can’t create traditional TCP servers listening on specific ports, we’ve created a bridge system that connects Node.js-style servers to the Workers request handling model.
When you create an HTTP server and call listen(port), instead of opening a TCP socket, the server is registered in an internal table within your Worker. This internal table acts as a bridge between http.createServer executions and the incoming fetch requests using the port number as the identifier.
You then use one of two methods to bridge incoming Worker requests to your Node.js-style server.
Manual Integration with handleAsNodeRequest
This approach gives you the flexibility to integrate Node.js HTTP servers with other Worker features, and allows you to have multiple handlers in your default entrypoint such as fetch, scheduled, queue, etc.
import { handleAsNodeRequest } from 'cloudflare:node';
import { createServer } from 'node:http';

// Create a traditional Node.js HTTP server
const server = createServer((req, res) => {
  res.writeHead(200, { 'Content-Type': 'text/plain' });
  res.end('Hello from Node.js HTTP server!');
});

// Register the server (doesn't actually bind to port 8080)
server.listen(8080);

// Bridge from Workers fetch handler to Node.js server
export default {
  async fetch(request) {
    // You can add custom logic here before forwarding
    if (request.url.includes('/admin')) {
      return new Response('Admin access', { status: 403 });
    }

    // Forward to the Node.js server
    return handleAsNodeRequest(8080, request);
  },
  async queue(batch, env, ctx) {
    for (const msg of batch.messages) {
      msg.retry();
    }
  },
  async scheduled(controller, env, ctx) {
    ctx.waitUntil(doSomeTaskOnSchedule(controller));
  },
};
Handle some routes differently while delegating others to the Node.js server
Apply custom middleware or request processing
Automatic Integration with httpServerHandler
For use cases where you want to integrate a Node.js HTTP server without any additional features or complexity, you can use the `httpServerHandler` function. This function automatically handles the integration for you. This solution is ideal for applications that don’t need Workers-specific features.
import { httpServerHandler } from 'cloudflare:node';
import { createServer } from 'node:http';

// Create your Node.js HTTP server
const server = createServer((req, res) => {
  if (req.url === '/') {
    res.writeHead(200, { 'Content-Type': 'text/html' });
    res.end('<h1>Welcome to my Node.js app on Workers!</h1>');
  } else if (req.url === '/api/status') {
    res.writeHead(200, { 'Content-Type': 'application/json' });
    res.end(JSON.stringify({ status: 'ok', timestamp: Date.now() }));
  } else {
    res.writeHead(404, { 'Content-Type': 'text/plain' });
    res.end('Not Found');
  }
});

server.listen(8080);

// Export the server as a Workers handler
export default httpServerHandler({ port: 8080 });
// Or you can simply pass the http.Server instance directly:
// export default httpServerHandler(server);
These HTTP APIs open the door to running popular Node.js frameworks like Express.js on Workers. If any of the middlewares for these frameworks don’t work as expected, please open an issue to Cloudflare Workers repository.
import { httpServerHandler } from 'cloudflare:node';
import express from 'express';

const app = express();

app.get('/', (req, res) => {
  res.json({ message: 'Express.js running on Cloudflare Workers!' });
});

app.get('/api/users/:id', (req, res) => {
  res.json({
    id: req.params.id,
    name: 'User ' + req.params.id
  });
});

app.listen(3000);
export default httpServerHandler({ port: 3000 });
// Or you can simply pass the http.Server instance directly:
// export default httpServerHandler(app.listen(3000));
Getting started with serverless Node.js applications
The node:http and node:https APIs are available in Workers with Node.js compatibility enabled using the nodejs_compat compatibility flag with a compatibility date later than 08-15-2025.
The addition of node:http support brings us closer to our goal of making Cloudflare Workers the best platform for running JavaScript at the edge, whether you’re building new applications or migrating existing ones.
Last week, we wrote about face cropping for Images, which runs an open-source face detection model in Workers AI to automatically crop images of people at scale.
It wasn’t too long ago when deploying AI workloads was prohibitively complex. Real-time inference previously required specialized (and costly) hardware, and we didn’t always have standard abstractions for deployment. We also didn’t always have Workers AI to enable developers — including ourselves — to ship AI features without this additional overhead.
And whether you’re skeptical or celebratory of AI, you’ve likely seen its explosive progression. New benchmark-breaking computational models are released every week. We now expect a fairly high degree of accuracy — the more important differentiators are how well a model fits within a product’s infrastructure and what developers do with its predictions.
This week, we’re introducing background removal for Images. This feature runs a dichotomous image segmentation model on Workers AI to isolate subjects in an image from their backgrounds. We took a controlled, deliberate approach to testing models for efficiency and accuracy.
Here’s how we evaluated various image segmentation models to develop background removal.
A primer on image segmentation
In computer vision, image segmentation is the process of splitting an image into meaningful parts.
Segmentation models produce a mask that assigns each pixel to a specific category. This differs from detection models, which don’t classify every pixel but instead mark regions of interest. A face detection model, such as the one that informs face cropping, draws bounding boxes based on where it thinks there are faces. (If you’re curious, our post on face cropping discusses how we use these bounding boxes to perform crop and zoom operations.)
Salient object detection is a type of segmentation that highlights the parts of an image that most stand out. Most salient detection models create a binary mask that categorizes the most prominent (or salient) pixels as the “foreground” and all other pixels as the “background”. In contrast, a multi-class mask considers the broader context and labels each pixel as one of several possible classes, like “dog” or “chair”. These multi-class masks are the basis of content analysis models, which distinguish which pixels belong to specific objects or types of objects.
In this photograph of my dog, a detection model predicts that a bounding box contains a dog; a segmentation model predicts that some pixels belong to a dog, while all other pixels don’t.
For our use case, we needed a model that could produce a soft saliency mask, which predicts how strongly each pixel belongs to either the foreground (objects of interest) or the background. That is, each pixel is assigned a value on a scale of 0–255, where 0 is completely transparent and 255 is fully opaque. Most background pixels are labeled at (or near) 0; foreground pixels may vary in opacity, depending on its degree of saliency.
In principle, a background removal feature must be able to accurately predict saliency across a broad range of contexts. For example, e-commerce and retail vendors want to display all products on a uniform, white background; in creative and image editing applications, developers want to enable users to create stickers and cutouts from uploaded content, including images of people or avatars.
In our research, we focused primarily on the following four image segmentation models:
U2-Net (U Square Net): Trained on the largest saliency dataset (DUST-TR) of 10,553 images, which were then horizontally flipped to reach a total of 21,106 training images.
IS-Net (Intermediate Supervision Network): A novel, two-step approach from the same authors of U2-Net; this model produces cleaner boundaries for images with noisy, cluttered backgrounds.
BiRefNet (Bilateral Reference Network): Specifically designed to segment complex and high-resolution images with accuracy by checking that the small details match the big picture.
Different scales of information allow computational models to build a holistic view of an image. Global context considers the overall shape of objects and how areas of pixels relate to the entire image, while local context traces fine details like edges, corners, and textures. If local context focuses on the trees and their leaves, then global context represents the entire forest.
U2-Net extracts information using a multi-scale approach, where it analyzes an image at different zoom levels, then combines its predictions in a single step. The model analyzes global and local context at the same time, so it works well on images with multiple objects of varying sizes.
IS-Net introduces a new, two-step strategy called intermediate supervision. First, the model separates the foreground from the background, identifying potential areas that likely belong to objects of interest — all other pixels are labeled as the background. Second, it refines the boundaries of the highlighted objects to produce a final pixel-level mask.
The initial suppression of the background results in cleaner, more precise edges, as the segmentation focuses only on the highlighted objects of interest and is less likely to mistakenly include background pixels in the final mask. This model especially excels when dealing with complex images with cluttered backgrounds.
Both models output their predictions in a single direction for scale. U2-Net interprets the global and local context in one pass, while Is-Net begins with the global context, then focuses on the local context.
In contrast, BiRefNet refines its predictions over multiple passes, moving in both contextual directions. Like Is-Net, it initially creates a map that roughly highlights the salient object, then traces the finer details. However, BiRefNet moves from global to local context, then from local context back to global. In other words, after refining the edges of the object, it feeds the output back to the large-scale view. This way, the model can check that the small-scale details align with the broader image structure, providing higher accuracy on high-resolution images.
U2-Net, IS-Net, and BiRefNet are exclusively saliency detection models, producing masks that distinguish foreground pixels from background pixels. However, SAM was designed to be more extensible and general; its primary goal is to segment any object based on specified inputs, not only salient objects. This means that the model can also be used to create multi-class masks that label various objects within an image, even if they aren’t the primary focus of an image.
How we measure segmentation accuracy
In most saliency datasets, the actual location of the object is known as the ground-truth area. These regions are typically defined by human annotators, who manually trace objects of interest in each image. This provides a reliable reference to evaluate model predictions.
Each model outputs a predicted area (where it thinks the foreground pixels are), which can be compared against the ground-truth area (where the foreground pixels actually are).
Models are evaluated for segmentation accuracy based on common metrics like Intersection over Union, Dice coefficient, and pixel accuracy. Each score takes a slightly different approach to quantify the alignment between the predicted and ground-truth areas (“P” and “G”, respectively, in the formulas below).
Intersection over Union
Intersection over Union (IoU), also called the Jaccard index, measures how well the predicted area matches the true object. That is, it counts the number of foreground pixels that are shared in both the predicted and ground-truth masks. Mathematically, IoU is written as:
Jaccard formula
The formula divides the intersection (P∩G), or the pixels where the predicted and ground-truth areas overlap, by the union (P∪G), or the total area of pixels that belong to either area, counting the overlapping pixels only once.
IoU produces a score between 0 and 1. A higher value indicates a closer overlap between the predicted and ground-truth areas. A perfect match, although rare, would score 1, while a smaller overlapping area brings the score closer to 0.
Dice coefficient
The Dice coefficient, also called the Sørensen–Dice index, similarly compares how well the model’s prediction matches reality, but is much more forgiving than the IoU score. It gives more weight to the shared pixels between the predicted and actual foreground, even if the areas differ in size. Mathematically, the Dice coefficient is written as:
Sørensen–Dice formula
The formula divides twice the intersection (P∩G) by the sum of pixels in both predicted and ground-truth areas (P+G), counting any overlapping pixels twice.
Like IoU, the Dice coefficient also produces a value between 0 and 1, indicating a more accurate match as it approaches 1.
Pixel accuracy
Pixel accuracy measures the percentage of pixels that were correctly labeled as either the foreground or the background. Mathematically, pixel accuracy is written as:
Pixel accuracy formula
The formula divides the number of correctly predicted pixels by the total number of pixels in the image.
The total area of correctly predicted pixels is the sum of foreground and background pixels that accurately match the ground-truth areas.
The correctly predicted foreground is the intersection of the predicted and ground-truth areas (P∩G). The inverse of the predicted area (P’, or 1–P) represents the pixels that the model identifies as the background; the inverse of the ground-truth area (G’, or 1–G) represents the actual boundaries of the background. When these two inverted areas overlap (P’∩G’, or (1–P)∩(1–G)), this intersection is the correctly predicted background.
Interpreting the metrics
Of the three metrics, IoU is the most conservative measure of segmentation accuracy. Small mistakes, such as including extra background pixels in the predicted foreground, reduce the score noticeably. This metric is most valuable for applications that require precise boundaries, such as autonomous driving systems.
Meanwhile, the Dice coefficient rewards the overlapping pixels more heavily, and subsequently tends to be higher than the IoU score for the same prediction. In model evaluations, this metric is favored over IoU when it’s more important to capture the object than to penalize mistakes. For example, in medical imaging, the risk of missing a true positive substantially outweighs the inconvenience of flagging a false positive.
In the context of background removal, we biased toward the IoU score and Dice coefficient over pixel accuracy. Pixel accuracy can be misleading, especially when processing an image where background pixels comprise the majority of pixels.
For example, consider an image with 900 background pixels and 100 foreground pixels. A model that correctly predicts only 5 foreground pixels — 5% of all foreground pixels — will score deceptively high in pixel accuracy. Intuitively, we’d likely say that this model performed poorly. However, assuming all 900 background pixels were correctly predicted, the model maintains 90.5% pixel accuracy, despite missing the subject almost entirely.
Pixels, predictions, and patterns
To determine the most suitable model for the Images API, we performed a series of tests using the open-source rembg library, which combines all relevant models in a single interface.
Each model was tasked with outputting a prediction mask to label foreground versus background pixels. We pulled images from two saliency datasets: Humans contains over 7,000 images of people with varying skin tones, clothing, and hairstyles, while DIS5K (version 1.5) spans a vast range of objects and scenes. If a model contained variants that were pre-trained on specific types of segmentation (e.g. clothes, humans), then we repeated the tests for the generalized model and each variant.
Our experiments were executed on a GPU with 23 GB VRAM to mirror realistic hardware constraints, similar to the environment where we already run a face detection model. We also replicated the same tests on a larger GPU instance with 94 GB VRAM; this served as an upper-bound reference point to benchmark potential speed gains if additional compute were available. Cloudflare typically reserves larger GPUs for more compute-intensive AI workloads — we viewed these tests more as an exploration for comparison than as a production scenario.
During our analysis, we started to see key trends emerge:
On the smaller GPU, inference times were generally faster for lightweight models like U2-Net (176 MB) and Is-Net (179 MB). The average speed across both datasets were 307 milliseconds for U2-Net and 351 milliseconds for Is-Net. On the opposite end, BiRefNet (973 MB) had noticeably slower output times, averaging 821 milliseconds across its two generalized variants.
BiRefNet ran 2.4 times faster on the larger GPU, reducing its average inference time to 351 milliseconds — comparable to the other models, despite its larger size. In contrast, the lighter models did not show any notable speed gain with additional compute, suggesting that scaling hardware configurations primarily benefits heavier models. In Appendix 1 (“Inference Time in Milliseconds”), we compare speed across models and GPU instances.
We also observed distinct patterns when comparing model performance across the two saliency datasets. Most notably, all models ran faster on the Humans dataset, where images of people tend to be single-subject and relatively uniform. The DIS5K dataset, in contrast, includes images with higher complexity — that is, images with more objects, cluttered backgrounds, or multiple objects of varying scales.
Slower predictions suggest a relationship between visual complexity and the computation needed to identify the important parts of an image. In other words, datasets with simpler, well-separated objects can be analyzed more quickly, while complex scenes require more computation to generate accurate masks.
Similarly, complexity challenges accuracy as much as it does efficiency. In our tests, all models demonstrated higher segmentation accuracy with the Humans dataset. In Appendix 2 (“Measures of Model Accuracy”), we present our results for segmentation accuracy across both datasets.
Specialized variants scored slightly higher in accuracy compared to their generalized counterparts. But in broad, practical applications, selecting a specialized model for every input isn’t realistic, at least for our initial beta version. We favored general-purpose models that can produce accurate predictions without prior classification. For this reason, we excluded SAM — while powerful in its intended use cases, SAM is designed to work with additional inputs. On unprompted segmentation tasks, it produced lower accuracy scores (and much higher inference times) amongst the models we tested.
All BiRefNet variants showed greater accuracy compared to other models. The generalized variants (-general and -dis) were just as accurate as its more specialized variants like -portrait. The birefnet-general variant, in particular, achieved a high IoU score of 0.87 and Dice coefficient of 0.92, averaged across both datasets.
In contrast, the generalized U2-Net model showed high accuracy on the Humans dataset, reaching an IoU score of 0.89 and a Dice coefficient of 0.94, but received a low IoU score of 0.39 and Dice coefficient of 0.52 on the DIS5K dataset. The isnet-general-use model performed substantially better, obtaining an average IoU score of 0.82 and Dice coefficient of 0.89 across both datasets.
We observed whether models could interpret both the global and local context of an image. In some scenarios, the U2-Net and Is-Net models captured the overall gist of an image, but couldn’t accurately trace fine edges. We designed one test around measuring how well each model could isolate bicycle wheels; for variety, we included images across both interior and exterior backgrounds. Lower scoring models, while correctly labeling the area surrounding the wheel, struggled with the pixels between the thin spokes and produced prediction masks that included these background pixels.
In other scenarios, the models showed the opposite limitation: they produced masks with clean edges, but failed to identify the focus of the image. We ran another test using a photograph of a gray T-shirt against black gym flooring. Both generalized U2-Net and Is-Net models labeled only the logo as the salient object, creating a mask that omitted the rest of the shirt entirely.
Meanwhile, the BiRefNet model achieved high accuracy across both types of tests. Its architecture passes information bidirectionally, allowing details at the pixel level to be informed by the larger scene (and vice versa). In practice, this means that BiRefNet interprets how fine-grained edges fit into the broader object. For our beta version, we opted to use the BiRefNet model to drive decisions for background removal.
Unlike lower scoring models, the BiRefNet model understood that the entire shirt is the true subject of the image.
Use the segment parameter when optimizing an image through a specially-formatted Images URL or a worker, and Cloudflare will isolate the subject of your image and convert the background into transparent pixels. This can be combined with other optimization operations, as shown in the transformation URL below:
You can also use background removal when overlaying images through the draw() command, like in the image below. Here, we isolate the subjects of multiple images, then overlay them on a background image.
Background removal is another step in our ongoing effort to enable developers to build interactive and imaginative products. These features are an iterative process, and we’ll continue to refine our approach even further. We’re looking forward to sharing our progress with you.
Read more about applying background removal in our documentation.
When we first launched Workers AI, we made a bet that AI models would get faster and smaller. We built our infrastructure around this hypothesis, adding specialized GPUs to our datacenters around the world that can serve inference to users as fast as possible. We created our platform to be as general as possible, but we also identified niche use cases that fit our infrastructure well, such as low-latency image generation or real-time audio voice agents. To lean in on those use cases, we’re bringing on some new models that will help make it easier to develop for these applications.
Today, we’re excited to announce that we are expanding our model catalog to include closed-source partner models that fit this use case. We’ve partnered with Leonardo.Ai and Deepgram to bring their latest and greatest models to Workers AI, hosted on Cloudflare’s infrastructure. Leonardo and Deepgram both have models with a great speed-to-performance ratio that suit the infrastructure of Workers AI. We’re starting off with these great partners — but expect to expand our catalog to other partner models as well.
The benefits of using these models on Workers AI is that we don’t only have a standalone inference service, we also have an entire suite of Developer products that allow you to build whole applications around AI. If you’re building an image generation platform, you could use Workers to host the application logic, Workers AI to generate the images, R2 for storage, and Images for serving and transforming media. If you’re building Realtime voice agents, we offer WebRTC and WebSocket support via Workers, speech-to-text, text-to-speech, and turn detection models via Workers AI, and an orchestration layer via Cloudflare Realtime. All in all, we want to lean into use cases that we think Cloudflare has a unique advantage in, with developer tools to back it up, and make it all available so that you can build the best AI applications on top of our holistic Developer Platform.
Leonardo Models
Leonardo.Ai is a generative AI media lab that trains their own models and hosts a platform for customers to create generative media. The Workers AI team has been working with Leonardo for a while now and have experienced the magic of their image generation models firsthand. We’re excited to bring on two image generation models from Leonardo: @cf/leonardo/phoenix-1.0 and @cf/leonardo/lucid-origin.
“We’re excited to enable Cloudflare customers a new avenue to extend and use our image generation technology in creative ways such as creating character images for gaming, generating personalized images for websites, and a host of other uses… all through the Workers AI and the Cloudflare Developer Platform.” – Peter Runham, CTO, Leonardo.Ai
The Phoenix model is trained from the ground up by Leonardo, excelling at things like text rendering and prompt coherence. The full image generation request took 4.89s end-to-end for a 25 step, 1024×1024 image.
curl --request POST \
  --url https://api.cloudflare.com/client/v4/accounts/{ACCOUNT_ID}/ai/run/@cf/leonardo/draco-1.0 \
  --header 'Authorization: Bearer {TOKEN}' \
  --header 'Content-Type: application/json' \
  --data '{
    "prompt": "A 1950s-style neon diner sign glowing at night that reads '\''OPEN 24 HOURS'\'' with chrome details and vintage typography.",
    "width":1024,
    "height":1024,
    "steps": 25,
    "seed":1,
    "guidance": 4,
    "negative_prompt": "bad image, low quality, signature, overexposed, jpeg artifacts, undefined, unclear, Noisy, grainy, oversaturated, overcontrasted"
}'
The Lucid Origin model is a recent addition to Leonardo’s family of models and is great at generating photorealistic images. The image took 4.38s to generate end-to-end at 25 steps and a 1024×1024 image size.
curl --request POST \
  --url https://api.cloudflare.com/client/v4/accounts/{ACCOUNT_ID}/ai/run/@cf/leonardo/lucid-origin \
  --header 'Authorization: Bearer {TOKEN}' \
  --header 'Content-Type: application/json' \
  --data '{
    "prompt": "A 1950s-style neon diner sign glowing at night that reads '\''OPEN 24 HOURS'\'' with chrome details and vintage typography.",
    "width":1024,
    "height":1024,
    "steps": 25,
    "seed":1,
    "guidance": 4,
    "negative_prompt": "bad image, low quality, signature, overexposed, jpeg artifacts, undefined, unclear, Noisy, grainy, oversaturated, overcontrasted"
}'
Deepgram Models
Deepgram is a voice AI company that develops their own audio models, allowing users to interact with AI through a natural interface for humans: voice. Voice is an exciting interface because it carries higher bandwidth than text, because it has other speech signals like pacing, intonation, and more. The Deepgram models that we’re bringing on our platform are audio models which perform extremely fast speech-to-text and text-to-speech inference. Combined with the Workers AI infrastructure, the models showcase our unique infrastructure so customers can build low-latency voice agents and more.
“By hosting our voice models on Cloudflare’s Workers AI, we’re enabling developers to create real-time, expressive voice agents with ultra-low latency. Cloudflare’s global network brings AI compute closer to users everywhere, so customers can now deliver lightning-fast conversational AI experiences without worrying about complex infrastructure.” – Adam Sypniewski, CTO, Deepgram
@cf/deepgram/nova-3 is a speech-to-text model that can quickly transcribe audio with high accuracy. @cf/deepgram/aura-1 is a text-to-speech model that is context aware and can apply natural pacing and expressiveness based on the input text. The newer Aura 2 model will be available on Workers AI soon. We’ve also improved the experience of sending binary mp3 files to Workers AI, so you don’t have to convert it into an Uint8 array like you had to previously. Along with our Realtime announcements (coming soon!), these audio models are the key to enabling customers to build voice agents directly on Cloudflare.
With the AI binding, a call to the Nova 3 speech-to-text model would look like this:
As well, we’ve added WebSocket support to the Deepgram models, which you can use to keep a connection to the inference server live and use it for bi-directional input and output. To use the Nova model with WebSocket support, it would look like this:
As well, we’ve added WebSocket support to the Deepgram models, which you can use to keep a connection to the inference server live and use it for bi-directional input and output. To use the Nova model with WebSocket support, check out our Developer Docs.
All the pieces work together so that you can:
Capture audio with Cloudflare Realtime from any WebRTC source
Pipe it via WebSocket to your processing pipeline
Transcribe with audio ML models Deepgram running on Workers AI
Process with your LLM of choice through a model hosted on Workers AI or proxied via AI Gateway
Orchestrate everything with Realtime Agents
Try these models out today
Check out our developer docs for more details, pricing and how to get started with the newest partner models available on Workers AI.
During Developer Week 2024, we introduced AI face cropping in private beta. This feature automatically crops images around detected faces, and marks the first release in our upcoming suite of AI image manipulation capabilities.
AI face cropping is now available in Images for everyone. To bring this feature to general availability, we moved our CPU-based prototype to a GPU-based implementation in Workers AI, enabling us to address a number of technical challenges, including memory leaks that could hamper large-scale use.
We developed face cropping with two particular use cases in mind:
Social media platforms and AI chatbots. We observed a lot of traffic from customers who use Images to turn unedited images of people into smaller profile pictures in neat, fixed shapes.
E-commerce platforms. The same product photo might appear in a grid of thumbnails on a gallery page, then again on an individual product page with a larger view. The following example illustrates how cropping can change the emphasis from the model’s shirt to their sunglasses.
When handling high volumes of media content, preparing images for production can be tedious. With Images, you don’t need to manually generate and store multiple versions of the same image. Instead, we serve copies of each image, each optimized to your specifications, while you continue to store only the original image.
Crop everything, everywhere, all at once
Cloudflare provides a library of parameters to manipulate how an image is served to the end user. For example, you can crop an image to a square by setting its width and height dimensions to 100×100.
By default, images are cropped toward the center coordinates of the original image. The gravity parameter can affect how an image gets cropped by changing its focal point. You can specify coordinates to use as the focal point of an image or allow Cloudflare to automatically determine a new focal point.
The gravity=auto option uses a saliency algorithm to pick the most optimal focal point of an image. Saliency detection identifies the parts of an image that are most visually important; the cropping operation is then applied toward this region of interest. Our algorithm analyzes images using visual cues such as color, luminance, and texture, but doesn’t consider context within an image. While this setting works well on images with inanimate objects like plants and skyscrapers, it doesn’t reliably account for subjects as contextually meaningful as people’s faces.
And yet, images of people comprise the majority of bandwidth usage for many applications, such as an AI chatbot platform that uses Images to serve over 45 million unique transformations each month. This presented an opportunity for us to improve how developers can optimize images of people.
AI face cropping can be performed by using the gravity=face option, which automatically detects which pixels represent the face (or faces) and uses this information to crop the image. You can also affect how closely the image is cropped toward the face; the zoom parameter controls the threshold for how much of the surrounding area around the face will be included in the image.
We carefully designed our model pipeline with privacy and confidentiality top of mind. This feature doesn’t support facial identification or recognition. In other words, when you optimize with Cloudflare, we’ll never know that two different images depict the same person, or identify the specific people in a given image. Instead, AI face cropping with Images is intentionally limited to face detection, or identifying the pixels that represent a human face.
From pixels to people
Our first step was to select an open-source model that met our requirements. Behind the scenes, our AI face cropping uses RetinaFace, a convolutional neural network model that classifies images with human faces.
A neural network is a type of machine learning process that loosely resembles how the human brain works. A basic neural network has three parts: an input layer, one or more hidden layers, and an output layer. Nodes in each layer form an interconnected network to transmit and process data, where each input node is connected to nodes in the next layer.
A fully connected layer passes data from one layer to the next.
Data enters through the input layer, where it is analyzed before being passed to the first hidden layer. All of the computation is done in the hidden layers, where a result is eventually delivered through the output layer.
A convolutional neural network (CNN) mirrors how humans look at things. When we look at other people, we start with abstract features, like the outline of their body, before we process specific features, like the color of their eyes or the shape of their lips.
Similarly, a CNN processes an image piece-by-piece before delivering the final result. Earlier layers look for abstract features like edges and colors and lines; subsequent layers become more complex and are each responsible for identifying the various features that comprise a human face. The last fully connected layer combines all categorized features to produce one final classification of the entire image. In other words, if an image contains all of the individual features that define a human face (e.g. eyes, nose), then the CNN concludes that the image contains a human face.
We needed a model that could determine whether an image depicts a person (image classification), as well as exactly where they are in the image (object detection). When selecting a model, some factors we considered were:
Performance on the WIDERFACE dataset. This is the state-of-the-art face detection benchmark dataset, which contains 32,203 images of 393,703 labeled faces with a high degree of variability in scale, pose, and occlusion.
Speed (in frames per second). Most of our image optimization requests occur on delivery (rather than before an image gets uploaded to storage), so we prioritized performance for end-user delivery.
Model size. Smaller model sizes run more efficiently.
Quality. The performance boost from smaller models often gets traded for the quality—the key is balancing speed with results.
Our initial test sample contained 500 images with varying factors like the number of faces in the image, face size, lighting, sharpness, and angle. We tested various models, including BlazeFast, R-CNN (and its successors Fast R-CNN and Faster R-CNN), RetinaFace, and YOLO (You Only Look Once).
Two-stage detectors like BlazeFast and R-CNN propose potential object locations in an image, then identify objects in those regions of interest. One-stage detectors like RetinaFace and YOLO predict object locations and classes in a single pass. In our research, we observed that two-stage detector methods provided higher accuracy, but performed too slowly to be practical for real traffic. On the other hand, one-stage detector methods were efficient and performant while still highly accurate.
Ultimately, we selected RetinaFace, which showed the highest precision of 99.4% and performed faster than other models with comparable values. We found that RetinaFace delivered strong results even with images containing multiple blurry faces:
Inference—the process of using training models to make decisions—can be computationally demanding, especially with very large images. To maintain efficiency, we set a maximum size limit of 1024×1024 pixels when sending images to the model.
We pass images within these dimensions directly to the model for analysis. But if either width or height dimension exceeds 1024 pixels, then we instead create an inference image to send to the model; this is a smaller copy that retains the same aspect ratio as the original image and does not exceed 1024 pixels in either dimension. For example, a 125×2000 image will be downscaled to 64×1024. Creating this resized, temporary version reduces the amount of data that the model needs to analyze, enabling faster processing.
The model draws all of the bounding boxes, or the regions within an image that define the detected faces. From there, we construct a new, outer bounding box that encompasses all of the individual boxes, calculating its top-left and bottom-right points based on the boxes that are closest to the top, left, bottom, and right edges of the image.
The top-left point uses the x coordinate from the left-most box and the y coordinate from the top-most box. Similarly, the bottom-right point uses the x coordinate from the right-most box and the y coordinate from the bottom-most box. These coordinates can be taken from the same bounding boxes; if a single box is closest to both the top and left edges, then we would use its top-left corner as the top-left point of the outer bounding box.
AI face cropping identifies regions that represent faces, then determines an outer bounding box and focal point based on the top-most, left-most, right-most, and bottom-most bounding boxes.
Once we define the outer bounding box, we use its center coordinates as the focal point when cropping the image. From our experiments, we found that this produced better and more balanced results for images with multiple faces compared to other methods, like establishing the new focal point around the largest detected face.
The cropped image area is calculated based on the dimensions of the outer bounding box (“d”) and a specified zoom level (“z”) in the formula (1 ÷ z) × d. The zoom parameter accepts floating points between 0 and 1, where we crop the image to the bounding box when zoom=1 and include more of the area around the box as zoom trends toward 0.
Consider an original image that is 2048×2048. First, we create an inference image that is 1024×1024 to meet our size limits for face detection. Second, we define the outer bounding box using the model’s predictions—we’ll use 100×500 for this example. At zoom=0.5, our formula generates a crop area that is twice as large as the bounding box, with new width (“w”) and height (“h”) dimensions of 200×1000:
We also apply a min function that chooses the smaller number between the input dimensions and the calculated dimensions, ensuring that the new width and height never exceed the dimensions of the image itself. In other words, if you try to zoom out too much, then we use the full width or height of the image instead of defining a crop area that will extend beyond the edge of the image. For example, at zoom=0.25, our formula yields an initial crop area of 400×2000. Here, since the calculated height (2000) is larger than the input height (1024), we use the input height to set the crop area to 400×1024.
Finally, we need to scale the crop area back to the size of the original image. This applies only when a smaller inference image is created.
We initially downscaled the original 2048×2048 image by a factor of 2 to create the 1024×1024 inference image. This means that we need to multiply the dimensions of the crop area—400×1024 in our latest example—by 2 to produce our final result: a cropped image that is 800×2048.
The architecture behind the earliest build
In the beta version, we rewrote the model using TensorFlow Rust to make it compatible with our existing Rust-based stack. All of the computations for inference—where the model classifies and locates human faces—were executed on CPUs within our network.
Initially, this worked well and we saw near-realtime results.
However, the underlying limitations of our implementation became apparent when we started receiving consistent alerts that our underlying Images service was nearing its limits for memory usage. The increased memory usage didn’t line up with any recent deployments around this time, but a hunch led us to discover that the face cropping compute time graph had an uptick that matched the uptick in memory usage. Further tracing confirmed that AI face cropping was at the root of the problem.
When a service runs out of memory, it terminates its processes to free up memory and prevent the system from crashing. Since CPU-based implementations share RAM with other processes, this can potentially cause errors for other image optimization operations. In response, we switched our memory allocator from glibc malloc to jemalloc. This allowed us to use less memory at runtime, saving about 20 TiB of RAM globally. We also started culling the number of face cropping requests to limit CPU usage.
At this point, AI face cropping was already limited to our own internal uses and a small number of beta customers. These steps only temporarily reduced our memory consumption. They weren’t sufficient for handling global traffic, so we looked toward a more scalable design for long-term use.
Doing more with less (memory)
With memory usage alerts looming in the distance, it became clear that we needed to move to a GPU-based approach.
Unlike with CPUs, a GPU-based implementation avoids contention with other processes because memory access is typically dedicated and managed more tightly. We partnered with the Workers AI team, who created a framework for internal teams to integrate payloads into their model catalog for GPU access.
Some Workers AI models have their own standalone containers; this isn’t practical for every model, as routing traffic to multiple containers can be expensive. When using a GPU through Workers AI, the data needs to travel over the network, which can introduce latency. This is where model size is especially relevant, as network transport overhead becomes more noticeable with larger models.
To address this, Workers AI wraps smaller models in a single container and utilizes a latency-sensitive routing algorithm to identify the best instance to serve each payload. This means that models can be offloaded when there is no traffic.
A scheduler is used to optimize how—and when—models in the same container interact with GPUs.
RetinaFace runs on 1 GB of VRAM on the smallest GPU; it’s small enough that it can be hot swapped at runtime alongside similarly sized models. If there is a call for the RetinaFace model, then the Python code will be loaded into the environment and executed.
As expected, we saw a significant drop in memory usage after we moved the feature to Workers AI. Now, each instance of our Images service consumes about 150 MiB of memory.
With this new approach, memory leaks pose less concern to the overall availability of our service. Workers AI executes models within containers, so they can be terminated and restarted as needed without impacting other processes. Since face cropping runs separately from our Images service, restarting it won’t halt our other image optimization operations.
Applying AI face cropping to our blog
As part of our beta launch, we updated the Cloudflare blog to apply AI face cropping on author images.
Authors can submit their own images, which appear as circular profile pictures in both the main blog feed and individual blog posts. By default, CSS centers images within their containers, making off-centered head positions more obvious. When two profile pictures include different amounts of negative space, this can also lead to a visual imbalance where authors’ faces appear at different scales:
AI face cropping makes posts with multiple authors appear more balanced.
In the example above, Austin’s original image is cropped tightly around his face. On the other hand, Taylor’s original image includes his torso and a larger margin of the background. As a result, Austin’s face appears larger and closer to the center than Taylor’s does. After we applied AI face cropping to profile pictures on the blog, their faces appear more similar in size, creating more balance and cohesion on their co-authored post.
A new era of image editing, now in Images
Many developers already use Images to build scalable media pipelines. Our goal is to accelerate image workflows by automating rote, manual tasks.
For the Images team, this is only the beginning. We plan to release new AI capabilities, including features like background removal and generative upscale. You can try AI face cropping for free by enabling transformations in the Images dashboard.
The AI landscape is evolving at an incredible pace, and with it, the tools and platforms available to developers are becoming more powerful and interconnected than ever. Here at Cloudflare, we’re genuinely passionate about empowering you to build the next generation of applications, and that absolutely includes intelligent agents that can reason, act, and interact with the world.
When we talk about “Agents SDKs“, it can sometimes feel a bit… fuzzy. Some SDKs (software development kits) described as ‘agent’ SDKs are really about providing frameworks for tool calling and interacting with models. They’re fantastic for defining an agent’s “brain” – its intelligence, its ability to reason, and how it uses external tools. Here’s the thing: all these agents need a place to actually run. Then there’s what we offer at Cloudflare: an SDK purpose-built to provide a seamless execution layer for agents. While orchestration frameworks define how agents think, our SDK focuses on where they run, abstracting away infrastructure to enable persistent, scalable execution across our global network.
Think of it as the ultimate shell, the place where any agent, defined by any agent SDK (like the powerful new OpenAI Agents SDK), can truly live, persist, and run at global scale.
We’ve chosen OpenAI’s Agents SDK for this example, but the infrastructure is not specific to it. The execution layer is designed to integrate with any agent runtime.
That’s what this post is about: what we built, what we learned, and the design patterns that emerged from fusing these two pieces together.
Why use two SDKs?
OpenAI’s Agents SDK gives you the agent: a reasoning loop, tool definitions, and memory abstraction. But it assumes you bring your own runtime and state.
Cloudflare’s Agents SDK gives you the environment: a persistent object on our network with identity, state, and built-in concurrency control. But it doesn’t tell you how your agent should behave.
By combining them, we get a clear split:
OpenAI: cognition, planning, tool orchestration
Cloudflare: location, identity, memory, execution
This separation of concerns let us stay focused on logic, not glue code.
What you can build with persistent agents
Cloudflare Durable Objects let agents go beyond simple, stateless functions. They can persist memory, coordinate across workflows, and respond in real time. Combined with the OpenAI Agents SDK, this enables systems that reason, remember, and adapt over time.
Here are three architectural patterns that show how agents can be composed, guided, and connected:
Multi-agent systems: Divide responsibilities across specialized agents that collaborate on tasks.
Human-in-the-loop: Let agents plan independently but wait for human input at key decision points.
Addressable agents: Make agents reachable through real-world interfaces like phone calls or WebSockets.
Multi-agent systems
Multi-agent systems let you break down a task into specialized agents that handle distinct responsibilities. In the example below, a triage agent routes questions to either a history or math tutor based on the query. Each agent has its own memory, logic, and instructions. With Cloudflare Durable Objects, these agents persist across sessions and can coordinate responses, making it easy to build systems that feel modular but work together intelligently.
export class MyAgent extends Agent {
  async onRequest() {
    const historyTutorAgent = new Agent({
      instructions:
        "You provide assistance with historical queries. Explain important events and context clearly.",
      name: "History Tutor",
    });

    const mathTutorAgent = new Agent({
      instructions:
        "You provide help with math problems. Explain your reasoning at each step and include examples",
      name: "Math Tutor",
    });

    const triageAgent = new Agent({
      handoffs: [historyTutorAgent, mathTutorAgent],
      instructions:
        "You determine which agent to use based on the user's homework question",
      name: "Triage Agent",
    });

    const result = await run(triageAgent, "What is the capital of France?");
    return Response.json(result.finalOutput);
  }
}
Human-in-the-loop
We implemented ahuman-in-the-loop agent example using these two SDKs together. The goal: run an OpenAI agent with a planning loop, allow human decisions to intercept the plan, and preserve state across invocations via Durable Objects.
The architecture looked like this:
An OpenAI Agent instance runs inside a Durable Object
User submits a prompt
The agent plans multiple steps
After each step, it yields control and waits for a human to approve or intervene
State (including memory and intermediate steps) is persisted in this.state
This design lets us intercept the agent’s plan at every step and store it. The client could then:
Fetch the pending step via another route
Review or modify it
Send approval or rejection back to the agent to resume execution
This is only possible because the agent lives inside a Durable Object. It has persistent memory and identity, allowing multi-turn interaction even across sessions
Addressable agents: “Call my Agent”
One of the most interesting takeaways from this pattern is that agents are not just HTTP endpoints. Yes, you can fetch() them via Durable Objects, but conceptually, agents are addressable entities — and there’s no reason those addresses have to be tied to URLs.
You could imagine agents reachable by phone call, by email, or via pub/sub systems. Durable Objects give each agent a global identity that can be referenced however you want.
In this design:
External sources of input connect to the Cloudflare network; via email, HTTP, or any network interface. In this demo, we use Twilio to route a phone call to a WebSocket input on the Agent.
The call is routed through Cloudflare’s infrastructure, so latency is low and identity is preserved.
We also store the real-time state updates within the agent, so we can view it on a website (served by the agent itself). This is great for use cases like customer service and education.
export class MyAgent extends Agent {
  // receive phone calls via websocket
  async onConnect(connection: Connection, ctx: ConnectionContext) {
    if (ctx.request.url.includes("media-stream")) {
      const agent = new RealtimeAgent({
        instructions:
          "You are a helpful assistant that starts every conversation with a creative greeting.",
        name: "Triage Agent",
      });

      connection.send(`Welcome! You are connected with ID: ${connection.id}`);

      const twilioTransportLayer = new TwilioRealtimeTransportLayer({
        twilioWebSocket: connection,
      });

      const session = new RealtimeSession(agent, {
        transport: twilioTransportLayer,
      });

      await session.connect({
        apiKey: process.env.OPENAI_API_KEY as string,
      });

      session.on("history_updated", (history) => {
        this.setState({ history });
      });
    }
  }
}
This lets an agent become truly multimodal, accepting and outputting data as audio, video, text, email. This pattern opened up exciting possibilities for modular agents and long-running workflows where each agent focuses on a specific domain.
What we learned (and what you should know)
1. OpenAI assumes you bring your own state — Cloudflare gives you one
OpenAI’s SDK is stateless by default. You can attach memory abstractions, but the SDK doesn’t tell you where or how to persist it. Cloudflare’s Durable Objects, by contrast, are persistent — that’s the whole point. Every instance has a unique identity and storage API (this.ctx.storage). This means we can:
Store long-term memory across invocations
Hydrate the agent’s memory before run()
Save any updates after run() completes
2. Durable Object routing isn’t just routing — it’s your agent factory
At first glance, routeAgentRequest looks like a simple dispatcher: map a request to a Durable Object based on a URL. But it plays a deeper role — it defines the identity boundary for your agents. We realized this while trying to scope agent instances per user and per task.
In Durable Objects, identity is tied to an ID. When you call idFromName(), you get a stable, name-based ID that always maps to the same object. This means repeated calls with the same name return the same agent instance — along with its memory and state. In contrast, calling .newUniqueId() creates a new, isolated object each time.
This is where routing becomes critical: it’s where you decide how long an agent should live, and what it should remember.
This lets us:
Spin up multiple agents per user (e.g. one per session or task)
Co-locate memory and logic
Avoid unintended memory sharing between conversations
Gotcha: If you forget to use idFromName() and just call .newUniqueId(), you’ll get a new agent each time, and your memory will never persist. This is a common early bug that silently kills statefulness.
3. Agents are composable — and that’s powerful
Agents can invoke each other using Durable Object routing, forming workflows where each agent owns its own memory and logic. This enables composition — building systems from specialized parts that cooperate.
This makes agent architecture more like microservices — composable, stateful, and distributed.
Final thoughts: building agents that think and live
This pattern — OpenAI cognition + Cloudflare execution — worked better than we expected. It let us:
Write agents with full planning and memory
Pause and resume them asynchronously
Avoid building orchestration from scratch
Compose multiple agents into larger systems
The hardest parts:
Correctly scoping agent architecture
Persisting only valid state
Debugging with good observability
At Cloudflare, we are incredibly excited to see what you build with this powerful combination. The future of AI agents is intelligent, distributed, and incredibly capable. Get started today by exploring the OpenAI Agents SDK and diving into the Cloudflare Agents SDK documentation (which leverages Cloudflare Workers and Durable Objects).
We’re just getting started, and we love to see all that you build. Please join our Discord, ask questions, and tell us what you’re building.
We’re excited to announce that Cloudflare Containers are now available in beta for all users on paid plans.
You can now run new kinds of applications alongside your Workers. From media and data processing at the edge, to backend services in any language, to CLI tools in batch workloads — Containers open up a world of possibilities.
Containers are tightly integrated with Workers and the rest of the developer platform, which means that:
Your workflow stays simple: just define a Container in a few lines of code, and run wrangler deploy, just like you would with a Worker.
Containers are global: as with Workers, you just deploy to Region:Earth. No need to manage configs across 5 different regions for a global app.
You can use the right tool for the job: routing requests between Workers and Containers is easy. Use a Worker when you need to be ultra light-weight and scalable. Use a Container when you need more power and flexibility.
Containers are programmable: container instances are spun up on-demand and controlled by Workers code. If you need custom logic, just write some JavaScript instead of spending time chaining together API calls or writing Kubernetes operators.
Want to try it today? Deploy your first Container-enabled Worker:
A tour of Containers
Let’s take a deeper look at Containers, using an example use case: code sandboxing.
Let’s imagine that you want to run user-generated (or AI-generated) code as part of a platform you’re building. To do this, you want to spin up containers on demand. Each user needs their own isolated container, the users are distributed globally, and you need to start each container quickly so the users aren’t waiting.
You can set this up easily on Cloudflare Containers.
Configuring a Container
In your Worker, use the Container class and wrangler.jsonc to declare some basic configuration, such as your Container’s default port, a sleep timeout, and which image to use, then route to it via the Worker.
For each unique ID passed to the Container’s binding, Cloudflare will spin up a new Container instance and route requests to it. When a new instance is requested, Cloudflare picks the best location across our global network where we’ve pre-provisioned a ready-to-go container. This means that you can deploy a container close to an end user no matter where they are. And the initial container start takes just a few seconds. You don’t have to worry about routing, provisioning, or scaling.
This example Worker will route requests to a unique container instance for each sandbox ID given at the path /sandbox/ID and will be handled by standard Worker JavaScript otherwise:
export class MyContainer extends Container {
  defaultPort = 8080; // The default port for the container to listen on
  sleepAfter = '5m'; // Sleep the container if no requests are made in this timeframe
}

export default {
  async fetch(request, env) {
    const pathname = new URL(request.url).pathname;

    // handle request with an on-demand container instance
    if (pathname.startsWith('/sandbox/')) {
      const sessionId = pathname.split("/")[2]
      const containerInstance = getContainer(env.CONTAINER_SANDBOX, sessionId)
      return await containerInstance.fetch(request);
    }

    // handle request with my Worker code otherwise
    return myWorkerRequestHandler(request);
  },
};
Familiar and easy development workflow with wrangler dev
To configure which container image to use, you can provide an image URL in wrangler config or a path to a local Dockerfile.
This config tells wrangler to use a locally defined image:
When developing your application, you just run wrangler dev and the container image will be automatically built and routable via your local Worker. This makes it easy to iterate on container code while making changes to your Worker at the same time. When you want to rebuild your image, just press “R” on your keyboard from your terminal running wrangler dev, and the Container is rebuilt and restarted.
Shipping your Container-enabled Worker to production with wrangler deploy
When it’s time to deploy, just run wrangler deploy. Wrangler will push your image to your account, then it will be provisioned in various locations across Cloudflare’s global network.
You don’t have to worry about “artifact management”, or distribution, or auth, or jump through hoops to integrate your container with Workers. You just write your code and deploy it.
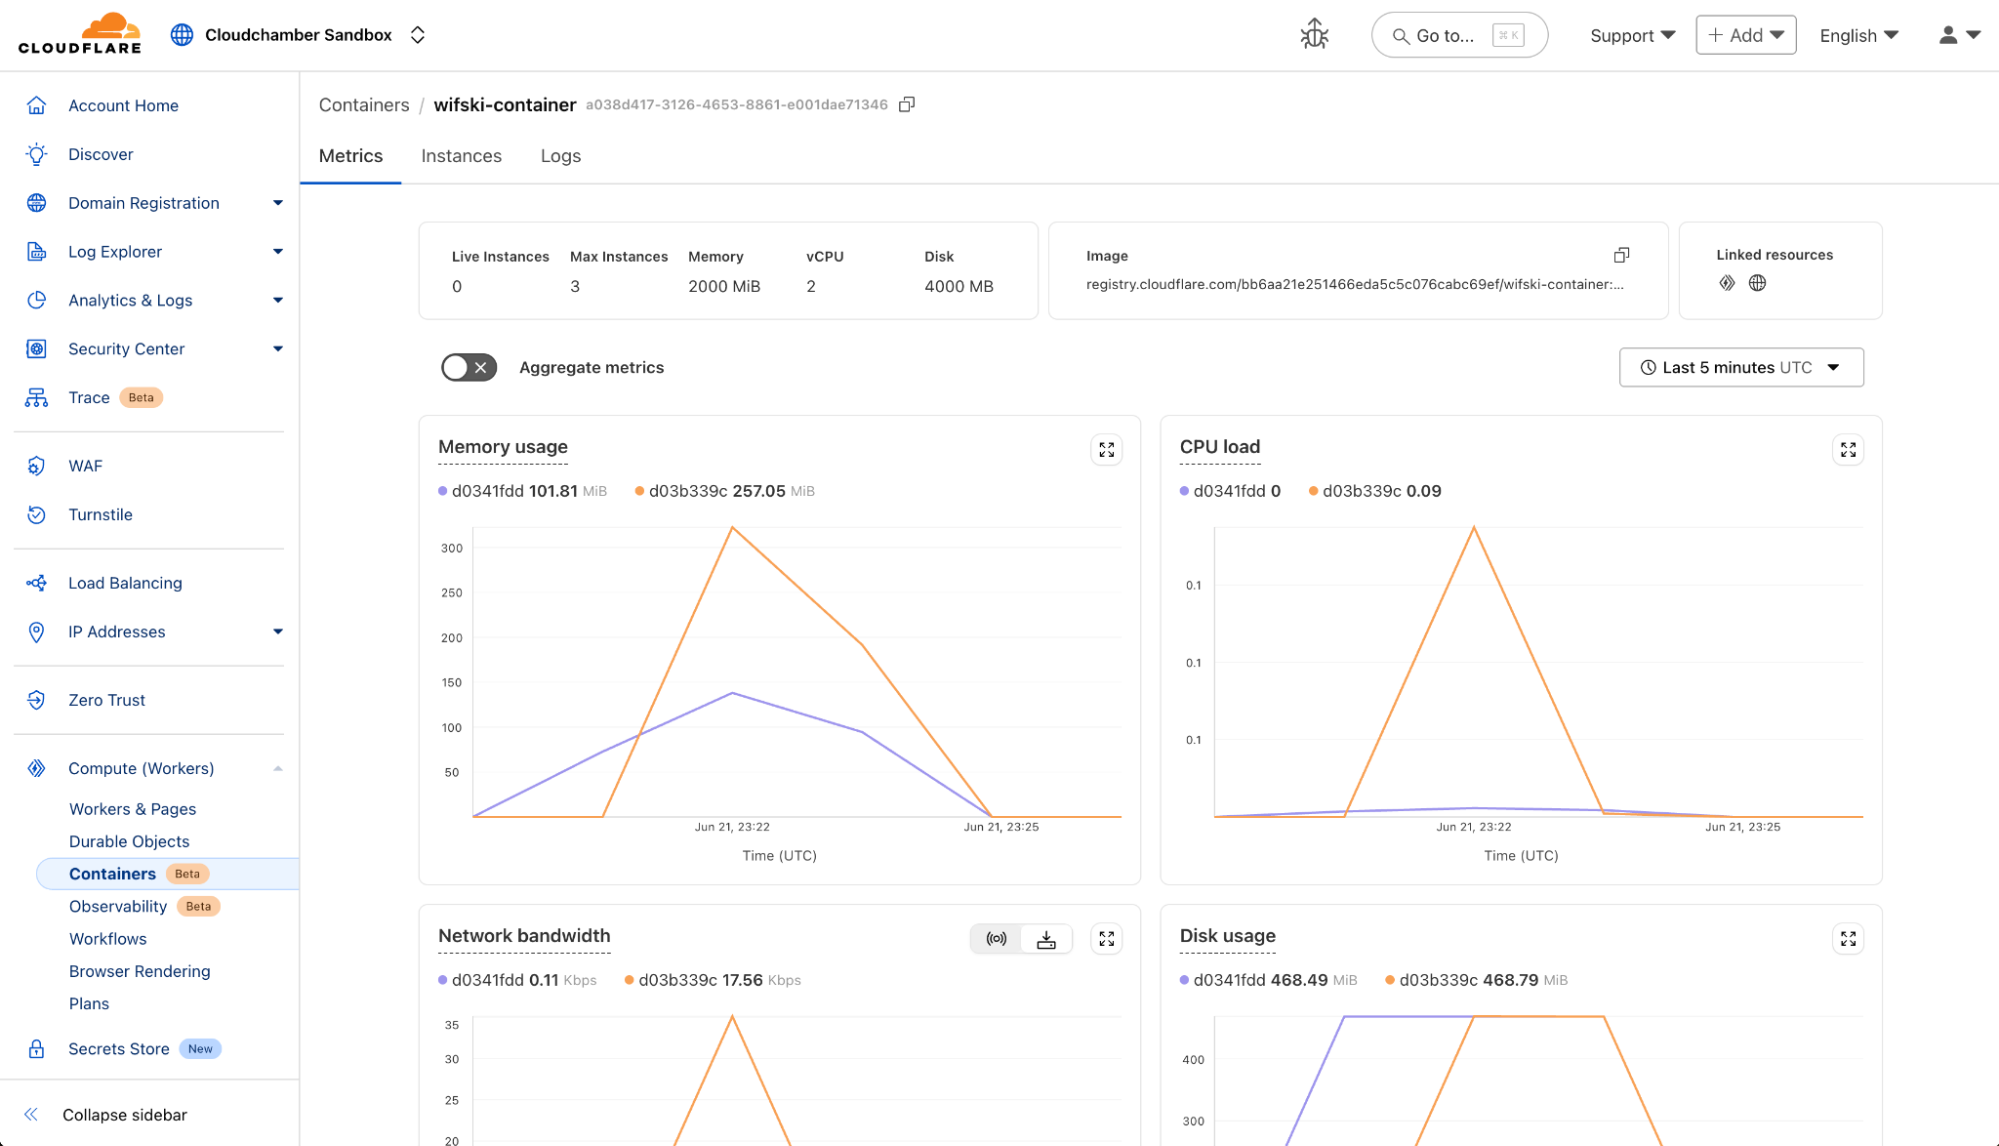
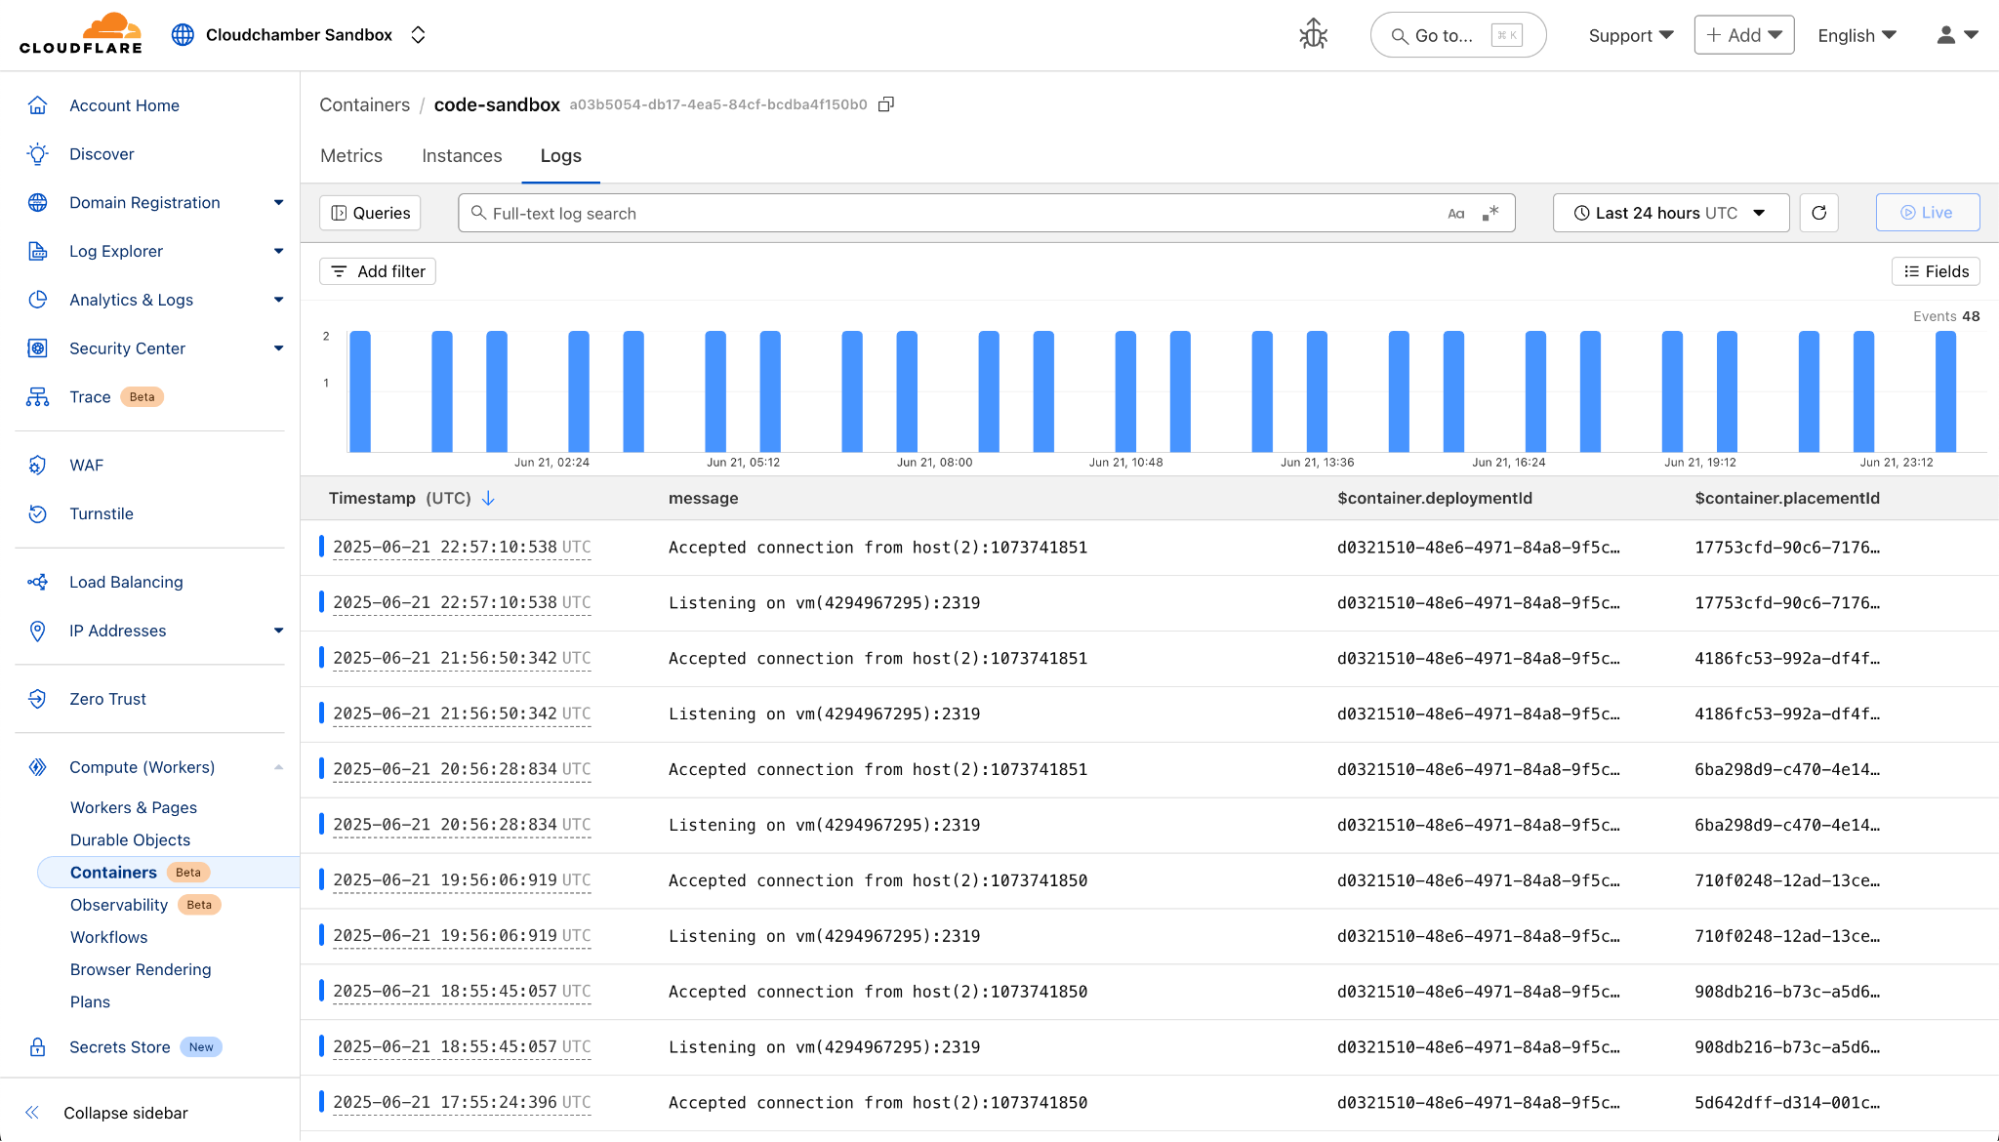
Observability is built-in
Once your Container is in production, you have the visibility you need into how things are going, with end-to-end observability.
From the Cloudflare dashboard, you can easily track status and resource usage across Container instances with built-in metrics:
And if you need to dive deeper, you can dig into logs, which will be retained in the Cloudflare UI for seven days or pushed to an external sink of your choice:
Or better yet, if you have an image sitting around that you’ve been dying to deploy to Cloudflare, you can get started with our docs here.
A world of possibilities
We’re excited about all the new types of applications that are now possible to build on Workers. We’ve heard many of you tell us over the years that you would love to run your entire application on Cloudflare, if only you could deploy this one piece that needs to run in a container.
As with the rest of our Cloudflare developer products, we wanted to apply the same principles to our developer platform with transparent pricing that scales up and down with your usage.
Today, you can select from the following instances at launch (and yes, we plan to add larger instances over time):
Name
Memory
CPU
Disk
dev
256 MiB
1/16 vCPU
2 GB
basic
1 GiB
1/4 vCPU
4 GB
standard
4 GiB
1/2 vCPU
4 GB
You only pay for what you use — charges start when a request is sent to the container or when it is manually started. Charges stop after the container instance goes to sleep, which can happen automatically after a timeout. This makes it easy to scale to zero, and allows you to get high utilization even with bursty traffic.
Containers are billed for every 10ms that they are actively running at the following rates, with monthly amounts included in Workers Standard:
Memory: $0.0000025 per GiB-second, with 25 GiB-hours included
CPU: $0.000020 per vCPU-second, with 375 vCPU-minutes included
Disk $0.00000007 per GB-second, with 200 GB-hours included
Egress from Containers is priced at the following rates, with monthly amounts included in Workers Standard:
North America and Europe: $0.025 per GB with 1 TB included
Australia, New Zealand, Taiwan, and Korea: $0.050 per GB with 500 GB included
Everywhere else: $0.040 per GB with 500 GB included
With today’s release, we’ve only just begun to scratch the surface of what Containers will do on Workers. This is the first step of many towards our vision of a simple, global, and highly programmable Container platform.
We’re already thinking about what’s next, and wanted to give you a preview:
Higher limits and larger instances – We currently limit your concurrent instances to 40 total GiB of memory and 40 total vCPU. This is enough for some workloads, but many users will want to go higher — a lot higher. Select customers are already scaling well into the thousands of concurrent containers, and we want to bring this ability to more users. We will be raising our limits over the coming months to allow for more total containers and larger instance sizes.
Global autoscaling and latency-aware routing – Currently, containers are addressed by ID and started on-demand. For many use cases, users want to route to one of many stateless container instances deployed across the globe, then autoscale live instances automatically. Autoscaling will be activated with a single line of code, and will enable easy routing to the nearest ready instance.
class MyBackend extends Container {
  defaultPort = 8080;
  autoscale = true; // global autoscaling on - new instances spin up when memory or CPU utilization is high
}

// routes requests to the nearest ready container and load balance globally
async fetch(request, env) {
  return getContainer(env.MY_BACKEND).fetch(request);
}
More ways to communicate between Containers and Workers – We will be adding more ways for your Worker to communicate with your container and vice versa. We will add an exec command to run shell commands in your instance and handlers for HTTP requests from the container to Workers. This will allow you to more easily extend your containers with functionality from the entire developer platform, reach out to other containers, and programmatically set up each container instance.
class MyContainer extends Container {
  // sets up container-to-worker communication with handlers
  handlers = {
    "example.cf": "handleRequestFromContainer"
  };

  handleRequestFromContainer(req) {
    return new Response("You are responding from Workers to a Container request to a specific hostname")
  }

  // use exec to run commands in your container instance
  async cloneRepo(repoUrl) {
    let command = this.exec(`git clone ${repoUrl}`)
    await command.print()
  }
}
Further integrations with the Developer Platform – We will continue to integrate with the developer platform with first-party APIs for our various services. We want it to be dead simple to mount R2 buckets, reach Hyperdrive, access KV, and more.
And we are just getting started. Stay tuned for more updates this summer and over the course of the entire year.
Try Containers today
The first step is to deploy your own container. Run npm create cloudflare@latest -- --template=cloudflare/templates/containers-template or click the button below to deploy your first Container to Workers.
We’re excited to see all the ways you will use Containers. From new languages and tools, to simplified Cloudflare-only architectures, to advanced programmatic control over container creation, you now have the ability to do even more on the Developer Platform. It is just a wrangler deploy away.
This will get you started with a remote MCP server that supports the latest MCP standards and is the reason why thousands of remote MCP servers have been deployed on Cloudflare, including ones from companies like Atlassian, Linear, PayPal, and more.
But deploying servers is only half of the equation — we also wanted to make it just as easy to build and deploy remote MCP clients that can connect to these servers to enable new AI-powered service integrations. That’s why we built use-mcp, a React library for connecting to remote MCP servers, and we’re excited to contribute it to the MCP ecosystem to enable more developers to build remote MCP clients.
Today, we’re open-sourcing two tools that make it easy to build and deploy MCP clients:
use-mcp — A React library that connects to any remote MCP server in just 3 lines of code, with transport, authentication, and session management automatically handled. We’re excited to contribute this library to the MCP ecosystem to enable more developers to build remote MCP clients.
The AI Playground — Cloudflare’s AI chat interface platform that uses a number of LLM models to interact with remote MCP servers, with support for the latest MCP standard, which you can now deploy yourself.
Whether you’re building an AI-powered chat bot, a support agent, or an internal company interface, you can leverage these tools to connect your AI agents and applications to external services via MCP.
Ready to get started? Click on the button below to deploy your own instance of Cloudflare’s AI Playground to see it in action.
use-mcp: a React library for building remote MCP clients
use-mcp is a React library that abstracts away all the complexity of building MCP clients. Add the useMCP() hook into any React application to connect to remote MCP servers that users can interact with.
Here’s all the code you need to add to connect to a remote MCP server:
mport { useMcp } from 'use-mcp/react'
function MyComponent() {
  const { state, tools, callTool } = useMcp({
    url: 'https://mcp-server.example.com'
  })
  return <div>Your actual UI code</div>
}
Just specify the URL, and you’re instantly connected.
Behind the scenes, use-mcp handles the transport protocols (both Streamable HTTP and Server-Sent Events), authentication flows, and session management. It also includes a number of features to help you build reliable, scalable, and production-ready MCP clients.
Connection management
Network reliability shouldn’t impact user experience. use-mcp manages connection retries and reconnections with a backoff schedule to ensure your client can recover the connection during a network issue and continue where it left off. The hook exposes real-time connection states (“connecting”, “ready”, “failed”), allowing you to build responsive UIs that keep users informed without requiring you to write any custom connection handling logic.
const { state } = useMcp({ url: 'https://mcp-server.example.com' })

if (state === 'connecting') {
  return <div>Establishing connection...</div>
}
if (state === 'ready') {
  return <div>Connected and ready!</div>
}
if (state === 'failed') {
  return <div>Connection failed</div>
}
Authentication & authorization
Many MCP servers require some form of authentication in order to make tool calls. use-mcp supports OAuth 2.1 and handles the entire OAuth flow. It redirects users to the login page, allows them to grant access, securely stores the access token returned by the OAuth provider, and uses it for all subsequent requests to the server. The library also provides methods for users to revoke access and clear stored credentials. This gives you a complete authentication system that allows you to securely connect to remote MCP servers, without writing any of the logic.
const { clearStorage } = useMcp({ url: 'https://mcp-server.example.com' })

// Revoke access and clear stored credentials
const handleLogout = () => {
  clearStorage() // Removes all stored tokens, client info, and auth state
}
Dynamic tool discovery
When you connect to an MCP server, use-mcp fetches the tools it exposes. If the server adds new capabilities, your app will see them without any code changes. Each tool provides type-safe metadata about its required inputs and functionality, so your client can automatically validate user input and make the right tool calls.
Debugging & monitoring capabilities
To help you troubleshoot MCP integrations, use-mcp exposes a log array containing structured messages at debug, info, warn, and error levels, with timestamps for each one. You can enable detailed logging with the debug option to track tool calls, authentication flows, connection state changes, and errors. This real-time visibility makes it easier to diagnose issues during development and production.
Future-proofed & backwards compatible
MCP is evolving rapidly, with recent updates to transport mechanisms and upcoming changes to authorization. use-mcp supports both Server-Sent Events (SSE) and the newer Streamable HTTP transport, automatically detecting and upgrading to newer protocols, when supported by the MCP server.
As the MCP specification continues to evolve, we’ll keep the library updated with the latest standards, while maintaining backwards compatibility. We are also excited to contribute use-mcp to the MCP project, so it can grow with help from the wider community.
MCP Inspector, built with use-mcp
In use-mcp’s examples directory, you’ll see a minimal MCP Inspector that was built with the use-mcp hook. . Enter any MCP server URL to test connections, see available tools, and monitor interactions through the debug logs. It’s a great starting point for building your own MCP clients or something you can use to debug connections to your MCP server.
Open-sourcing the AI Playground
We initially built the AI Playground to give users a chat interface for testing different AI models supported by Workers AI. We then added MCP support, so it could be used as a remote MCP client to connect to and test MCP servers. Today, we’re open-sourcing the playground, giving you the complete chat interface with the MCP client built in, so you can deploy it yourself and customize it to fit your needs.
The playground comes with built-in support for the latest MCP standards, including both Streamable HTTP and Server-Sent Events transport methods, OAuth authentication flows that allow users to sign-in and grant permissions, as well as support for bearer token authentication for direct MCP server connections.
How the AI Playground works
The AI Playground is built on Workers AI, giving you access to a full catalog of large language models (LLMs) running on Cloudflare’s network, combined with the Agents SDK and use-mcp library for MCP server connections.
The AI Playground uses the use-mcp library to manage connections to remote MCP servers. When the playground starts up, it initializes the MCP connection system with const{tools: mcpTools} = useMcp(), which provides access to all tools from connected servers. At first, this list is empty because it’s not connected to any MCP servers, but once a connection to a remote MCP server is established, the tools are automatically discovered and populated into the list.
Once connected, the playground immediately has access to any tools that the MCP server exposes. The use-mcp library handles all the protocol communication and tool discovery, and maintains the connection state. If the MCP server requires authentication, the playground handles OAuth flows through a dedicated callback page that uses onMcpAuthorization from use-mcp to complete the authentication process.
When a user sends a chat message, the playground takes the mcpTools from the use-mcp hook and passes them directly to Workers AI, enabling the model to understand what capabilities are available and invoke them as needed.
To monitor and debug connections to MCP servers, we’ve added a Debug Log interface to the playground. This displays real-time information about the MCP server connections, including connection status, authentication state, and any connection errors.
During the chat interactions, the debug interface will show the raw message exchanged between the playground and the MCP server, including the tool invocation and its result. This allows you to monitor the JSON payload being sent to the MCP server, the raw response returned, and track whether the tool call succeeded or failed. This is especially helpful for anyone building remote MCP servers, as it allows you to see how your tools are behaving when integrated with different language models.
Contributing to the MCP ecosystem
One of the reasons why MCP has evolved so quickly is that it’s an open source project, powered by the community. We’re excited to contribute the use-mcp library to the MCP ecosystem to enable more developers to build remote MCP clients.
If you’re looking for examples of MCP clients or MCP servers to get started with, check out theCloudflare AI GitHub repository for working examples you can deploy and modify. This includes the complete AI Playground source code, a number of remote MCP servers that use different authentication & authorization providers, and the MCP Inspector.
We’re also building the Cloudflare MCP servers in public and welcome contributions to help make them better.
Whether you’re building your first MCP server, integrating MCP into an existing application, or contributing to the broader ecosystem, we’d love to hear from you. If you have any questions, feedback, or ideas for collaboration, you can reach us via email at [email protected].
We’ve recently added support for the FinalizationRegistry API in Cloudflare Workers. This API allows developers to request a callback when a JavaScript object is garbage-collected, a feature that can be particularly relevant for managing external resources, such as memory allocated by WebAssembly (Wasm). However, despite its availability, our general advice is: avoid using it directly in most scenarios.
Our decision to add FinalizationRegistry — while still cautioning against using it — opens up a bigger conversation: how memory management works when JavaScript and WebAssembly share the same runtime. This is becoming more common in high-performance web apps, and getting it wrong can lead to memory leaks, out-of-memory errors, and performance issues, especially in resource-constrained environments like Cloudflare Workers.
In this post, we’ll look at how JavaScript and Wasm handle memory differently, why that difference matters, and what FinalizationRegistry is actually useful for. We’ll also explain its limitations, particularly around timing and predictability, walk through why we decided to support it, and how we’ve made it safer to use. Finally, we’ll talk about how newer JavaScript language features offer a more reliable and structured approach to solving these problems.
Memory management 101
JavaScript
JavaScript relies on automatic memory management through a process called garbage collection. This means developers do not need to worry about freeing allocated memory, or lifetimes. The garbage collector identifies and reclaims memory occupied by objects that are no longer needed by the program (that is, garbage). This helps prevent memory leaks and simplifies memory management for developers.
function greet() {
  let name = "Alice";         // String is allocated in memory
  console.log("Hello, " + name);
}                             // 'name' goes out of scope

greet();
// JavaScript automatically frees allocated memory at some point in future
WebAssembly
WebAssembly (Wasm) is an assembly-like instruction format designed to run high-performance applications on the web. While it initially gained prominence in web browsers, Wasm is also highly effective on the server side. At Cloudflare, we leverage Wasm to enable users to run code written in a variety of programming languages, such as Rust and Python, directly within our V8 isolates, offering both performance and versatility.
Wasm runtimes are designed to be simple stack machines, and lack built-in garbage collectors. This necessitates manual memory management (allocation and deallocation of memory used by Wasm code), making it an ideal compilation target for languages like Rust and C++ that handle their own memory.
Wasm modules operate on linear memory: a resizable block of raw bytes, which JavaScript views as an ArrayBuffer. This memory is organized in 64 KB pages, and its initial size is defined when the module is compiled or loaded. Wasm code interacts with this memory using 32-bit offsets — integer values functioning as direct pointers that specify a byte offset from the start of its linear memory. This direct memory access model is crucial for Wasm’s high performance. The host environment (which in Cloudflare Workers is JavaScript) also shares this ArrayBuffer, reading and writing (often via TypedArrays) to enable vital data exchange between Wasm and JavaScript.
A core Wasm design is its secure sandbox. This confines Wasm code strictly to its own linear memory and explicitly declared imports from the host, preventing unauthorized memory access or system calls. Direct interaction with JavaScript objects is blocked; communication occurs through numeric values, function references, or operations on the shared ArrayBuffer. This strong isolation is vital for security, ensuring Wasm modules don’t interfere with the host or other application components, which is especially important in multi-tenant environments like Cloudflare Workers.
Bridging WebAssembly memory with JavaScript often involves writing low-level “glue” code to convert raw byte arrays from Wasm into usable JavaScript types. Doing this manually for every function or data structure is both tedious and error-prone. Fortunately, tools like wasm-bindgen and Emscripten (Embind) handle this interop automatically, generating the binding code needed to pass data cleanly between the two environments. We use these same tools under the hood — wasm-bindgen for Rust-based workers-rs projects, and Emscripten for Python Workers — to simplify integration and let developers focus on application logic rather than memory translation.
Interoperability
High-performance web apps often use JavaScript for interactive UIs and data fetching, while WebAssembly handles demanding operations like media processing and complex calculations for significant performance gains, allowing developers to maximize efficiency. Given the difference in memory management models, developers need to be careful when using WebAssembly memory in JavaScript.
For this example, we’ll use Rust to compile a WebAssembly module manually. Rust is a popular choice for WebAssembly because it offers precise control over memory and easy Wasm compilation using standard toolchains.
Rust
Here we have two simple functions. make_buffer creates a string and returns a raw pointer back to JavaScript. The function intentionally “forgets” the memory allocated so that it doesn’t get cleaned up after the function returns. free_buffer, on the other hand, expects the initial string reference handed back and frees the memory.
// Allocate a fresh byte buffer and hand the raw pointer + length to JS.
// *We intentionally “forget” the Vec so Rust will not free it right away;
//   JS now owns it and must call `free_buffer` later.*
#[no_mangle]
pub extern "C" fn make_buffer(out_len: *mut usize) -> *mut u8 {
    let mut data = b"Hello from Rust".to_vec();
    let ptr = data.as_mut_ptr();
    let len  = data.len();

    unsafe { *out_len = len };

    std::mem::forget(data);
    return ptr;
}

/// Counterpart that **must** be called by JS to avoid a leak.
#[no_mangle]
pub unsafe extern "C" fn free_buffer(ptr: *mut u8, len: usize) {
    let _ = Vec::from_raw_parts(ptr, len, len);
}
JavaScript
Back in JavaScript land, we’ll call these Wasm functions and output them using console.log. This is a common pattern in Wasm-based applications since WebAssembly doesn’t have direct access to Web APIs, and rely on a JavaScript “glue” to interface with the outer world in order to do anything useful.
const { instance } = await WebAssembly.instantiate(WasmBytes, {});

const { memory, make_buffer, free_buffer } = instance.exports;

//  Use the Rust functions
const lenPtr = 0;                 // scratch word in Wasm memory
const ptr = make_buffer(lenPtr);

const len = new DataView(memory.buffer).getUint32(lenPtr, true);
const data = new Uint8Array(memory.buffer, ptr, len);

console.log(new TextDecoder().decode(data)); // “Hello from Rust”

free_buffer(ptr, len); // free_buffer must be called to prevent memory leaks
You can find all code samples along with setup instructions here.
As you can see, working with Wasm memory from JavaScript requires care, as it introduces the risk of memory leaks if allocated memory isn’t properly released. JavaScript developers are often unfamiliar with manual memory management, and it’s easy to forget returning memory to WebAssembly after use. This can become especially tricky when Wasm-allocated data is passed into JavaScript libraries, making ownership and lifetime harder to track.
While occasional leaks may not cause immediate issues, over time they can lead to increased memory usage and degrade performance, particularly in memory-constrained environments like Cloudflare Workers.
FinalizationRegistry
FinalizationRegistry, introduced as part of the TC-39 WeakRef proposal, is a JavaScript API which lets you run “finalizers” (aka cleanup callbacks) when an object gets garbage-collected. Let’s look at a simple example to demonstrate the API:
const my_registry = new FinalizationRegistry((obj) => { console.log("Cleaned up: " + obj); });

{
  let temporary = { key: "value" };
  // Register this object in our FinalizationRegistry -- the second argument,
  // "temporary", will be passed to our callback as its obj parameter
  my_registry.register(temporary, "temporary");
}

// At some point in the future when temporary object gets garbage collected, we'll see "Cleaned up: temporary" in our logs.
Let’s see how we can use this API in our Wasm-based application:
const { instance } = await WebAssembly.instantiate(WasmBytes, {});

const { memory, make_buffer, free_buffer } = instance.exports;

// FinalizationRegistry would be responsible for returning memory back to Wasm
const cleanupFr = new FinalizationRegistry(({ ptr, len }) => {
  free_buffer(ptr, len);
});

//  Use the Rust functions
const lenPtr = 0;                 // scratch word in Wasm memory
const ptr = make_buffer(lenPtr);

const len = new DataView(memory.buffer).getUint32(lenPtr, true);
const data = new Uint8Array(memory.buffer, ptr, len);

// Register the data buffer in our FinalizationRegistry so that it gets cleaned up automatically
cleanupFr.register(data, { ptr, len });

console.log(new TextDecoder().decode(data));   // → “Hello from Rust”

// No need to manually call free_buffer, FinalizationRegistry will do this for us
We can use a FinalizationRegistry to manage any object borrowed from WebAssembly by registering it with a finalizer that calls the appropriate free function. This is the same approach used by wasm-bindgen. It shifts the burden of manual cleanup away from the JavaScript developer and delegates it to the JavaScript garbage collector. However, in practice, things aren’t quite that simple.
Inherent issues with FinalizationRegistry
There is a fundamental issue with FinalizationRegistry: garbage collection is non-deterministic, and may clean up your unused memory at some arbitrary point in the future. In some cases, garbage collection might not even run and your “finalizers” will never be triggered.
“A conforming JavaScript implementation, even one that does garbage collection, is not required to call cleanup callbacks. When and whether it does so is entirely down to the implementation of the JavaScript engine. When a registered object is reclaimed, any cleanup callbacks for it may be called then, or some time later, or not at all.”
Even Emscripten mentions this in their documentation: “… finalizers are not guaranteed to be called, and even if they are, there are no guarantees about their timing or order of execution, which makes them unsuitable for general RAII-style resource management.”
Given their non-deterministic nature, developers seldom use finalizers for any essential program logic. Treat them as a last-ditch safety net, not as a primary cleanup mechanism — explicit, deterministic teardown logic is almost always safer, faster, and easier to reason about.
Enabling FinalizationRegistry in Workers
Given its non-deterministic nature and limited early adoption, we initially disabled the FinalizationRegistry API in our runtime. However, as usage of Wasm-based Workers grew — particularly among high-traffic customers — we began to see new demands emerge. One such customer was running an extremely high requests per second (RPS) workload using WebAssembly, and needed tight control over memory to sustain massive traffic spikes without degradation. This highlighted a gap in our memory management capabilities, especially in cases where manual cleanup wasn’t always feasible or reliable. As a result, we re-evaluated our stance and began exploring the challenges and trade-offs of enabling FinalizationRegistry within the Workers environment, despite its known limitations.
Preventing footguns with safe defaults
Because this API could be misused and cause unpredictable results for our customers, we’ve added a few safeguards. Most importantly, cleanup callbacks are run without an active async context, which means they cannot perform any I/O. This includes sending events to a tail Worker, logging metrics, or making fetch requests.
While this might sound limiting, it’s very intentional. Finalization callbacks are meant for cleanup — especially for releasing WebAssembly memory — not for triggering side effects. If we allowed I/O here, developers might (accidentally) rely on finalizers to perform critical logic that depends on when garbage collection happens. That timing is non-deterministic and outside your control, which could lead to flaky, hard-to-debug behavior.
We don’t have full control over when V8’s garbage collector performs cleanup, but V8 does let us nudge the timing of finalizer execution. Like Node and Deno, Workers queue FinalizationRegistry jobs only after the microtask queue has drained, so each cleanup batch slips into the quiet slots between I/O phases of the event loop.
Security concerns
The Cloudflare Workers runtime is specifically engineered to prevent side-channel attacks in a multi-tenant environment. Prior to enabling the FinalizationRegistry API, we did a thorough analysis to assess its impact on our security model and determine the necessity of additional safeguards. The non-deterministic nature of FinalizationRegistry raised concerns about potential information leaks leading to Spectre-like vulnerabilities, particularly regarding the possibility of exploiting the garbage collector (GC) as a confused deputy or using it to create a timer.
GC as confused deputy
One concern was whether the garbage collector (GC) could act as a confused deputy — a security antipattern where a privileged component is tricked into misusing its authority on behalf of untrusted code. In theory, a clever attacker could try to exploit the GC’s ability to access internal object lifetimes and memory behavior in order to infer or manipulate sensitive information across isolation boundaries.
However, our analysis indicated that the V8 GC is effectively contained and not exposed to confused deputy risks within the runtime. This is attributed to our existing threat models and security measures, such as the isolation of user code, where the V8 Isolate serves as the primary security boundary. Furthermore, even though FinalizationRegistry involves some internal GC mechanics, the callbacks themselves execute in the same isolate that registered them — never across isolates — ensuring isolation remains intact.
GC as timer
We also evaluated the possibility of using FinalizationRegistry as a high-resolution timing mechanism — a common vector in side-channel attacks like Spectre. The concern here is that an attacker could schedule object finalization in a way that indirectly leaks information via the timing of callbacks.
In practice, though, the resolution of such a “GC timer” is low and highly variable, offering poor reliability for side-channel attacks. Additionally, we control when finalizer callbacks are scheduled — delaying them until after the microtask queue has drained — giving us an extra layer of control to limit timing precision and reduce risk.
Following a review with our security research team, we determined that our existing security model is sufficient to support this API.
Predictable cleanups?
JavaScript’s Explicit Resource Management proposal introduces a deterministic approach to handle resources needing manual cleanup, such as file handles, network connections, or database sessions. Drawing inspiration from constructs like C#’s using and Python’s with, this proposal introduces the using and await using syntax. This new syntax guarantees that objects adhering to a specific cleanup protocol are automatically disposed of when they are no longer within their scope.
Let’s look at a simple example to understand it a bit better.
class MyResource {
  [Symbol.dispose]() {
    console.log("Resource cleaned up!");
  }

  use() {
    console.log("Using the resource...");
  }
}

{
  using res = new MyResource();
  res.use();
} // When this block ends, Symbol.dispose is called automatically (and deterministically).
The proposal also includes additional features that offer finer control over when dispose methods are called. But at a high level, it provides a much-needed, deterministic way to manage resource cleanup. Let’s now update our earlier WebAssembly-based example to take advantage of this new mechanism instead of relying on FinalizationRegistry:
const { instance } = await WebAssembly.instantiate(WasmBytes, {});
const { memory, make_buffer, free_buffer } = instance.exports;

class WasmBuffer {
  constructor(ptr, len) {
    this.ptr = ptr;
    this.len = len;
  }

  [Symbol.dispose]() {
    free_buffer(this.ptr, this.len);
  }
}

{
  const lenPtr = 0;
  const ptr = make_buffer(lenPtr);
  const len = new DataView(memory.buffer).getUint32(lenPtr, true);

  using buf = new WasmBuffer(ptr, len);

  const data = new Uint8Array(memory.buffer, ptr, len);
  console.log(new TextDecoder().decode(data));  // → “Hello from Rust”
} // Symbol.dispose or free_buffer gets called deterministically here
Explicit Resource Management provides a more dependable way to clean up resources than FinalizationRegistry, as it runs cleanup logic — such as calling free_buffer in WasmBuffer via [Symbol.dispose]() and the using syntax — deterministically, rather than relying on the garbage collector’s unpredictable timing. This makes it a more reliable choice for managing critical resources, especially memory.
Future
Emscripten already makes use of Explicit Resource Management for handling Wasm memory, using FinalizationRegistry as a last resort, while wasm-bindgen supports it in experimental mode. The proposal has seen growing adoption across the ecosystem and was recently conditionally advanced to Stage 4 in the TC39 process, meaning it’ll soon officially be part of the JavaScript language standard. This reflects a broader shift toward more predictable and structured memory cleanup in WebAssembly applications.
We recently added support for this feature in Cloudflare Workers as well, enabling developers to take advantage of deterministic resource cleanup in edge environments. As support for the feature matures, it’s likely to become a standard practice for managing linear memory safely and reliably.
FinalizationRegistry: still not dead yet?
Explicit Resource Management brings much-needed structure and predictability to resource cleanup in WebAssembly and JavaScript interop applications, but it doesn’t make FinalizationRegistry obsolete. There are still important use cases, particularly when a Wasm-allocated object’s lifecycle is out of your hands or when explicit disposal isn’t practical. In scenarios involving third-party libraries, dynamic lifecycles, or integration layers that don’t follow using patterns, FinalizationRegistry remains a valuable fallback to prevent memory leaks.
Looking ahead, a hybrid approach will likely become the standard in Wasm-JavaScript applications. Developers can use ERM for deterministic cleanup of Wasm memory and other resources, while relying on FinalizationRegistry as a safety net when full control isn’t possible. Together, they offer a more reliable and flexible foundation for managing memory across the JavaScript and WebAssembly boundary.
There’s a lot of talk right now about building AI agents, but not a lot out there about what it takes to make those agents truly useful.
An Agent is an autonomous system designed to make decisions and perform actions to achieve a specific goal or set of goals, without human input.
No matter how good your agent is at making decisions, you will need a person to provide guidance or input on the agent’s path towards its goal. After all, an agent that cannot interact or respond to the outside world and the systems that govern it will be limited in the problems it can solve.
That’s where the “human-in-the-loop” interaction pattern comes in. You’re bringing a human into the agent’s loop and requiring an input from that human before the agent can continue on its task.
In this blog post, we’ll useKnock and the CloudflareAgents SDK to build an AI Agent for a virtual card issuing workflow that requires human approval when a new card is requested.
Knock is messaging infrastructure you can use to send multi-channel messages across in-app, email, SMS, push, and Slack, without writing any integration code.
With Knock, you gain complete visibility into the messages being sent to your users while also handling reliable delivery, user notification preferences, and more.
You can use Knock to power human-in-the-loop flows for your agents using Knock’sAgent Toolkit, which is a set of tools that expose Knock’s APIs and messaging capabilities to your AI agents.
Using the Agent SDK as the foundation of our AI Agent
The Agents SDK provides an abstraction for building stateful, real-time agents on top of Durable Objects that are globally addressable and persist state using an embedded, zero-latency SQLite database.
Building an AI agent outside of using the Agents SDK and the Cloudflare platform means we need to consider WebSocket servers, state persistence, and how to scale our service horizontally. Because a Durable Object backs the Agents SDK, we receive these benefits for free, while having a globally addressable piece of compute with built-in storage, that’s completely serverless and scales to zero.
In the example, we’ll use these features to build an agent that users interact with in real-time via chat, and that can be paused and resumed as needed. The Agents SDK is the ideal platform for powering asynchronous agentic workflows, such as those required in human-in-the-loop interactions.
Setting up our Knock messaging workflow
Within Knock, we design our approval workflow using the visual workflow builder to create the cross-channel messaging logic. We then make the notification templates associated with each channel to which we want to send messages.
Knock will automatically apply theuser’s preferences as part of the workflow execution, ensuring that your user’s notification settings are respected.
You can find an example workflow that we’ve already created for this demo in the repository. You can use this workflow template via theKnock CLI to import it into your account.
Building our chat UI
We’ve built the AI Agent as a chat interface on top of the AIChatAgent abstraction from Cloudflare’s Agents SDK (docs). The Agents SDK here takes care of the bulk of the complexity, and we’re left to implement our LLM calling code with our system prompt.
// src/index.ts

import { AIChatAgent } from "agents/ai-chat-agent";
import { openai } from "@ai-sdk/openai";
import { createDataStreamResponse, streamText } from "ai";

export class AIAgent extends AIChatAgent {
  async onChatMessage(onFinish) {
    return createDataStreamResponse({
      execute: async (dataStream) => {
        try {
          const stream = streamText({
            model: openai("gpt-4o-mini"),
            system: `You are a helpful assistant for a financial services company. You help customers with credit card issuing.`,
            messages: this.messages,
            onFinish,
            maxSteps: 5,
          });

          stream.mergeIntoDataStream(dataStream);
        } catch (error) {
          console.error(error);
        }
      },
    });
  }
}
On the client side, we’re using the useAgentChat hook from the agents/ai-react package to power the real-time user-to-agent chat.
We’ve modeled our agent as a chat per user, which we set up using the useAgent hook by specifying the name of the process as the userId.
This means we have an agent process, and therefore a durable object, per-user. For our human-in-the-loop use case, this becomes important later on as we talk about resuming our deferred tool call.
Deferring the tool call to Knock
We give the agent our card issuing capability through exposing an issueCard tool. However, instead of writing the approval flow and cross-channel logic ourselves, we delegate it entirely to Knock by wrapping the issue card tool in our requireHumanInput method.
Now when the user asks to request a new card, we make a call out to Knock to initiate our card request, which will notify the appropriate admins in the organization to request an approval.
To set this up, we need to use Knock’s Agent Toolkit, which exposes methods to work with Knock in our AI agent and power cross-channel messaging.
import { createKnockToolkit } from "@knocklabs/agent-toolkit/ai-sdk";
import { tool } from "ai";
import { z } from "zod";

import { AIAgent } from "./index";
import { issueCard } from "./api";
import { BASE_URL } from "./constants";

async function initializeToolkit(agent: AIAgent) {
  const toolkit = await createKnockToolkit({ serviceToken: agent.env.KNOCK_SERVICE_TOKEN });

  const issueCardTool = tool({
    description: "Issue a new credit card to a customer.",
    parameters: z.object({
      customerId: z.string(),
    }),
    execute: async ({ customerId }) => {
      return await issueCard(customerId);
    },
  });

  const { issueCard } = toolkit.requireHumanInput(
    { issueCard: issueCardTool },
    {
      workflow: "approve-issued-card",
      actor: agent.name,
      recipients: ["admin_user_1"],
      metadata: {
        approve_url: `${BASE_URL}/card-issued/approve`,
        reject_url: `${BASE_URL}/card-issued/reject`,
      },
    }
  );

  return { toolkit, tools: { issueCard } };
}
There’s a lot going on here, so let’s walk through the key parts:
We wrap our issueCard tool in the requireHumanInput method, exposed from the Knock Agent Toolkit
We want the messaging workflow to be invoked to be our approve-issued-card workflow
We pass the agent.name as the actor of the request, which translates to the user ID
We set the recipient of this workflow to be the user admin_user_1
We pass the approve and reject URLs so that they can be used in our message templates
The wrapped tool is then returned as issueCard
Under the hood, these options are passed to theKnock workflow trigger API to invoke a workflow per-recipient. The set of the recipients listed here could be dynamic, or go to a group of users throughKnock’s subscriptions API.
We can then pass the wrapped issue card tool to our LLM call in the onChatMessage method on the agent so that the tool call can be called as part of the interaction with the agent.
export class AIAgent extends AIChatAgent {
  // ... other methods

  async onChatMessage(onFinish) {
    const { tools } = await initializeToolkit(this);

    return createDataStreamResponse({
      execute: async (dataStream) => {
        const stream = streamText({
          model: openai("gpt-4o-mini"),
          system: "You are a helpful assistant for a financial services company. You help customers with credit card issuing.",
          messages: this.messages,
          onFinish,
          tools,
          maxSteps: 5,
        });

        stream.mergeIntoDataStream(dataStream);
      },
    });
  }
}
Now when the agent calls the issueCardTool, we invoke Knock to send our approval notifications, deferring the tool call to issue the card until we receive an approval. Knock’s workflows take care of sending out the message to the set of recipient’s specified, generating and delivering messages according to each user’s preferences.
Using Knockworkflows for our approval message makes it easy to build cross-channel messaging to reach the user according to their communicationpreferences. We can also leveragedelays,throttles,batching, andconditions to orchestrate more complex messaging.
Handling the approval
Once the message has been sent to our approvers, the next step is to handle the approval coming back, bringing the human into the agent’s loop.
The approval request is asynchronous, meaning that the response can come at any point in the future. Fortunately, Knock takes care of the heavy lifting here for you, routing the event to the agent worker via awebhook that tracks the interaction with the underlying message. In our case, that’s a click to the “approve” or “reject” button.
First, we set up a message.interacted webhook handler within the Knock dashboard to forward the interactions to our worker, and ultimately to our agent process.
In our example here, we route the approval click back to the worker to handle, appending a Knock message ID to the end of the approve_url and reject_url to track engagement against the specific message sent. We do this via liquid inside of our message templates in Knock: {{ data.approve_url }}?messageId={{ current_message.id }} . One caveat here is that if this were a production application, we’re likely going to handle our approval click in a different application than this agent is running. We co-located it here for the purposes of this demo only.
Once the link is clicked, we have a handler in our worker to mark the message as interacted using Knock’smessage interaction API, passing through the status as metadata so that it can be used later.
import Knock from '@knocklabs/node';
import { Hono } from "hono";

const app = new Hono();
const client = new Knock();

app.get("/card-issued/approve", async (c) => {
  const { messageId } = c.req.query();

  if (!messageId) return c.text("No message ID found", { status: 400 });

  await client.messages.markAsInteracted(messageId, {
    status: "approved",
  });

  return c.text("Approved");
});
The message interaction will flow from Knock to our worker via the webhook we set up, ensuring that the process is fully asynchronous. The payload of the webhook includes the full message, including metadata about the user that generated the original request, and keeps details about the request itself, which in our case contains the tool call.
import { getAgentByName, routeAgentRequest } from "agents";
import { Hono } from "hono";

const app = new Hono();

app.post("/incoming/knock/webhook", async (c) => {
  const body = await c.req.json();
  const env = c.env as Env;

  // Find the user ID from the tool call for the calling user
  const userId = body?.data?.actors[0];

  if (!userId) {
    return c.text("No user ID found", { status: 400 });
  }

  // Find the agent DO for the user
  const existingAgent = await getAgentByName(env.AIAgent, userId);

  if (existingAgent) {
    // Route the request to the agent DO to process
    const result = await existingAgent.handleIncomingWebhook(body);

    return c.json(result);
  } else {
    return c.text("Not found", { status: 404 });
  }
});
We leverage the agent’s ability to be addressed by a named identifier to route the request from the worker to the agent. In our case, that’s the userId. Because the agent is backed by a durable object, this process of going from incoming worker request to finding and resuming the agent is trivial.
Resuming the deferred tool call
We then use the context about the original tool call, passed through to Knock and round tripped back to the agent, to resume the tool execution and issue the card.
export class AIAgent extends AIChatAgent {
  // ... other methods

  async handleIncomingWebhook(body: any) {
    const { toolkit } = await initializeToolkit(this);

    const deferredToolCall = toolkit.handleMessageInteraction(body);

    if (!deferredToolCall) {
      return { error: "No deferred tool call given" };
    }

    // If we received an "approved" status then we know the call was approved
    // so we can resume the deferred tool call execution
    if (result.interaction.status === "approved") {
      const toolCallResult =
	      await toolkit.resumeToolExecution(result.toolCall);

      const { response } = await generateText({
        model: openai("gpt-4o-mini"),
        prompt: `You were asked to issue a card for a customer. The card is now approved. The result was: ${JSON.stringify(toolCallResult)}.`,
      });

      const message = responseToAssistantMessage(
        response.messages[0],
        result.toolCall,
        toolCallResult
      );

      // Save the message so that it's displayed to the user
      this.persistMessages([...this.messages, message]);
    }

    return { status: "success" };
  }
}
Again, there’s a lot going on here, so let’s step through the important parts:
We attempt to transform the body, which is the webhook payload from Knock, into a deferred tool call via the handleMessageInteraction method
If the metadata status we passed through to the interaction call earlier has an “approved” status then we resume the tool call via the resumeToolExecution method
Finally, we generate a message from the LLM and persist it, ensuring that the user is informed of the approved card
With this last piece in place, we can now request a new card be issued, have an approval request be dispatched from the agent, send the approval messages, and route those approvals back to our agent to be processed. The agent will asynchronously process our card issue request and the deferred tool call will be resumed for us, with very little code.
Protecting against duplicate approvals
One issue with the above implementation is that we’re prone to issuing multiple cards if someone clicks on the approve button more than once. To rectify this, we want to keep track of the tool calls being issued, and ensure that the call is processed at most once.
To power this we leverage theagent’s built-in state, which can be used to persist information without reaching for another persistence store like a database or Redis, although we could absolutely do so if we wished. We can track the tool calls by their ID and capture their current status, right inside the agent process.
Here, we create the initial state for the tool calls as an empty object. We also add a quick setter helper method to make interactions easier.
Next up, we need to record the tool call being made. To do so, we can use the onAfterCallKnock option in the requireHumanInput helper to capture that the tool call has been requested for the user.
const { issueCard }  = toolkit.requireHumanInput(
  { issueCard: issueCardTool },
  {
    // Keep track of the tool call state once it's been sent to Knock
    onAfterCallKnock: async (toolCall) =>
      agent.setToolCallStatus(toolCall.id, "requested"),
    // ... as before
  }
);
Finally, we then need to check the state when we’re processing the incoming webhook, and mark the tool call as approved (some code omitted for brevity).
export class AIAgent extends AIChatAgent {
  async handleIncomingWebhook(body: any) {
    const { toolkit } = await initializeToolkit(this);
    const deferredToolCall = toolkit.handleMessageInteraction(body);
    const toolCallId = result.toolCall.id;

    // Make sure this is a tool call that can be processed
    if (this.state.toolCalls[toolCallId] !== "requested") {
      return { error: "Tool call is not requested" };
    }

    if (result.interaction.status === "approved") {
      const toolCallResult = await toolkit.resumeToolExecution(result.toolCall);
      this.setToolCallStatus(toolCallId, "approved");
      // ... rest as before
    }
  }
}
Conclusion
Using the Agents SDK and Knock, it’s easy to build advanced human-in-the-loop experiences that defer tool calls.
Knock’s workflow builder and notification engine gives you building blocks to create sophisticated cross-channel messaging for your agents. You can easily create escalation flows that send messages through SMS, push, email, or Slack that respect the notification preferences of your users. Knock also gives you complete visibility into the messages your users are receiving.
The Durable Object abstraction underneath the Agents SDK means that we get a globally addressable agent process that’s easy to yield and resume back to. The persistent storage in the Durable Object means we can retain the complete chat history per-user, and any other state that’s required in the agent process to resume the agent with (like our tool calls). Finally, the serverless nature of the underlying Durable Object means we’re able to horizontally scale to support a large number of users with no effort.
If you’re looking to build your own AI Agent chat experience with a multiplayer human-in-the-loop experience, you’ll find the complete code from this guideavailable in GitHub.
Cloudflare Workers Builds is our CI/CD product that makes it easy to build and deploy Workers applications every time code is pushed to GitHub or GitLab. What makes Workers Builds special is that projects can be built and deployed with minimal configuration.Just hook up your project and let us take care of the rest!
But what happens when things go wrong, such as failing to install tools or dependencies? What usually happens is that we don’t fix the problem until a customer contacts us about it, at which point many other customers have likely faced the same issue. This can be a frustrating experience for both us and our customers because of the lag time between issues occurring and us fixing them.
We want Workers Builds to be reliable, fast, and easy to use so that developers can focus on building, not dealing with our bugs. That’s why we recently started building an error detection system that can detect, categorize, and surface all build issues occurring on Workers Builds, enabling us to proactively fix issues and add missing features.
In this post, we will dive into how we used the Cloudflare Developer Platform to check for issues across more than 1 million Durable Objects.
Background: Workers Builds architecture
Back in October 2024, we wrote abouthow we built Workers Builds entirely on the Workers platform. To recap, Builds is built using Workers, Durable Objects, Workers KV, R2, Queues, Hyperdrive, and a Postgres database. Some of these things were not present when launched back in October (for example, Queues and KV). But the core of the architecture is the same.
A client Worker receives GitHub/GitLab webhooks and stores build metadata in Postgres (via Hyperdrive). A build management Worker uses two Durable Object classes: a Scheduler class to find builds in Postgres that need scheduling, and a class called BuildBuddy to manage the lifecycle of a build. When a build needs to be started, Scheduler creates a new BuildBuddy instance which is responsible for creating a container for the build (usingCloudflare Containers), monitoring the container with health checks, and receiving build logs so that they can be viewed in the Cloudflare Dashboard.
In addition to this core scheduling logic, we have several Workers Queues for background work such as sending PR comments to GitHub/GitLab.
The problem: builds are failing
While this architecture has worked well for us so far, we found ourselves with a problem: compared toCloudflare Pages, a concerning percentage of builds were failing. We needed to dig deeper and figure out what was wrong, and understand how we could improve Workers Builds so that developers can focus more on shipping instead of build failures.
Types of build failures
Not all build failures are the same. We have several categories of failures that we monitor:
Initialization failures: when the container fails to start.
Clone failures: failing to clone the repository from GitHub/GitLab.
Build timeouts: builds that ran past the limit and were terminated by BuildBuddy.
Builds failing health checks: the container stopped responding to health checks, e.g. the container crashed for an unknown reason.
Failure to install tools or dependencies.
Failed user build/deploy commands.
The first few failure types were straightforward, and we’ve been able to track down and fix issues in our build system and control plane to improve what we call “build completion rate”. We define build completion as the following:
We successfully started the build.
We attempted to install tools/dependencies (considering failures as “user error”).
We attempted to run the user-defined build/deploy commands (again, considering failures as “user error”).
We successfully marked the build as stopped in our database.
For example, we had a bug where builds for a deleted Worker would attempt to run and continuously fail, which affected our build completion rate metric.
User error
We’ve made a lot of progress improving the reliability of build and container orchestration, but we had a significant percentage of build failures in the “user error” metric. We started asking ourselves “is this actually user error? Or is there a problem with the product itself?”
This presented a challenge because questions like “did the build command fail due to a bug in the build system, or user error?” are a lot harder to answer than pass/fail issues like failing to create a container for the build. To answer these questions, we had to build something new, something smarter.
Build logs
The most obvious way to determine why a build failed is to look at its logs. When spot-checking build failures, we can typically identify what went wrong. For example, some builds fail to install dependencies because of an out of date lockfile (e.g. package-lock.json out of date with package.json). But looking through build failures one by one doesn’t scale. We didn’t want engineers looking through customer build logs without at least suspecting that there was an issue with our build system that we could fix.
Automating error detection
At this point, next steps were clear: we needed an automated way to identify why a build failed based on build logs, and provide a way for engineers to see what the top issues were while ensuring privacy (e.g. removing account-specific identifiers and file paths from the aggregate data).
Detecting errors in build logs using Workers Queues
The first thing we needed was a way to categorize build errors after a build fails. To do this, we created a queue named BuildErrorsQueue to process builds and look for errors. After a build fails, BuildBuddy will send the build ID to BuildErrorsQueue which fetches the logs, checks for issues, and saves results to Postgres.
We started out with a few static patterns to match things like Wrangler errors in log lines:
It wouldn’t be useful if all Wrangler errors were grouped under a single generic “wrangler_error” code, so we further grouped them by normalizing the log lines into groups:
function getWranglerLogGroupFromLogLine(
  logLine: LogLine,
  regexMatchers: RegexMatcher[]
): string {
  const original = logLine[2].trim().replaceAll(/[\t\n\r]+/g, ' ')
  let message = original
  let group = original
  for (const { mustMatch, patterns, stopOnMatch, name, useNameAsGroup } of regexMatchers) {
    if (mustMatch !== undefined) {
      const matched = matchLineToRegexes(message, mustMatch)
      if (!matched) continue
    }
    if (patterns) {
      for (const [pattern, mask] of patterns) {
        message = message.replaceAll(pattern, mask)
      }
    }
    if (useNameAsGroup === true) {
      group = name
    } else {
      group = message
    }
    if (Boolean(stopOnMatch) && message !== original) break
  }
  return group
}

const wranglerRegexMatchers: RegexMatcher[] = [
  {
    name: 'could_not_resolve',
    // ✘ [ERROR] Could not resolve "./balance"
    // ✘ [ERROR] Could not resolve "node:string_decoder" (originally "string_decoder/")
    mustMatch: [/^✘ \[ERROR\] Could not resolve "[@\w :/\\.-]*"/i],
    stopOnMatch: true,
    patterns: [
      [/(?<=^✘ \[ERROR\] Could not resolve ")[@\w :/\\.-]*(?=")/gi, '<MODULE>'],
      [/(?<=\(originally ")[@\w :/\\.-]*(?=")/gi, '<MODULE>'],
    ],
  },
  {
    name: 'no_matching_export_for_import',
    // ✘ [ERROR] No matching export in "src/db/schemas/index.ts" for import "someCoolTable"
    mustMatch: [/^✘ \[ERROR\] No matching export in "/i],
    stopOnMatch: true,
    patterns: [
      [/(?<=^✘ \[ERROR\] No matching export in ")[@~\w:/\\.-]*(?=")/gi, '<MODULE>'],
      [/(?<=" for import ")[\w-]*(?=")/gi, '<IMPORT>'],
    ],
  },
  // ...many more added over time
]
Once we had our error detection matchers and normalizing logic in place, implementing the BuildErrorsQueue consumer was easy:
Here, we’re fetching logs from each build’s BuildBuddy Durable Object, detecting why it failed using the matchers we wrote, and saving errors to the Postgres DB. We also delete any existing errors for when we improve our error detection patterns to prevent subsequent runs from adding duplicate data to our database.
What about historical builds?
The BuildErrorsQueue was great for new builds, but this meant we still didn’t know why all the previous build failures happened other than “user error”. We considered only tracking errors in new builds, but this was unacceptable because it would significantly slow down our ability to improve our error detection system because each iteration would require us to wait days to identify issues we need to prioritize.
Problem: logs are stored across one million+ Durable Objects
Remember how every build has an associated BuildBuddy DO to store logs? This is a great design for ensuring our logging pipeline scales with our customers, but it presented a challenge when trying to aggregate issues based on logs because something would need to go through all historical builds (>1 million at the time) to fetch logs and detect why they failed.
If we were using Go and Kubernetes, we might solve this using a long-running container that goes through all builds and runs our error detection. But how do we solve this in Workers?
How do we backfill errors for historical builds?
At this point, we already had the Queue to process new builds. If we could somehow send all of the old build IDs to the queue, it could scan them all quickly usingQueues concurrent consumers to quickly work through all builds. We thought about hacking together a local script to fetch all of the log IDs and sending them to an API to put them on a queue. But we wanted something more secure and easier to use so that running a new backfill was as simple as an API call.
That’s when an idea hit us: what if we used a Durable Object with alarms to fetch a range of builds and send them to BuildErrorsQueue? At first, it seemed far-fetched, given that Durable Object alarms have a limited amount of work they can do per invocation. But wait, ifAI Agents built on Durable Objects can manage background tasks, why can’t we fetch millions of build IDs and forward them to queues?
Building a Build Errors Agent with Durable Objects
The idea was simple: create a Durable Object class named BuildErrorsAgent and run a single instance that loops through the specified range of builds in the database and sends them to BuildErrorsQueue.
The first thing we did was set up an RPC method to start a backfill and save the parameters inDurable Object KV storage so that it can be read each time the alarm executes:
async start({
  min_build_id,
  max_build_id,
}: {
  min_build_id: BuildRecord['build_id']
  max_build_id: BuildRecord['build_id']
}): Promise<void> {
  logger.setTags({ handler: 'start', environment: this.env.ENVIRONMENT })
  try {
    if (min_build_id < 0) throw new Error('min_build_id cannot be negative')
    if (max_build_id < min_build_id) {
      throw new Error('max_build_id cannot be less than min_build_id')
    }
    const [started_on, stopped_on] = await Promise.all([
      this.kv.get('started_on'),
      this.kv.get('stopped_on'),
    ])
    await match({ started_on, stopped_on })
      .with({ started_on: P.not(null), stopped_on: P.nullish }, () => {
        throw new Error('BuildErrorsAgent is already running')
      })
      .otherwise(async () => {
        // delete all existing data and start queueing failed builds
        await this.state.storage.deleteAlarm()
        await this.state.storage.deleteAll()
        this.kv.put('started_on', new Date())
        this.kv.put('config', { min_build_id, max_build_id })
        void this.state.storage.setAlarm(this.getNextAlarmDate())
      })
  } catch (e) {
    this.sentry.captureException(e)
    throw e
  }
}
The most important part of the implementation is the alarm that runs every second until the job is complete. Each alarm invocation has the following steps:
Set a new alarm (always first to ensure an error doesn’t cause it to stop).
Retrieve state from KV.
Validate that the agent is supposed to be running:
Ensure the agent is supposed to be running.
Ensure we haven’t reached the max build ID set in the config.
Finally, queue up another batch of builds by querying Postgres and sending to the BuildErrorsQueue.
async alarm(): Promise<void> {
  logger.setTags({ handler: 'alarm', environment: this.env.ENVIRONMENT })
  try {
    void this.state.storage.setAlarm(Date.now() + 1000)
    const kvState = await this.getKVState()
    this.sentry.setContext('BuildErrorsAgent', kvState)
    const ctxLogger = logger.withFields({ state: JSON.stringify(kvState) })

    await match(kvState)
      .with({ started_on: P.nullish }, async () => {
        ctxLogger.info('BuildErrorsAgent is not started, cancelling alarm')
        await this.state.storage.deleteAlarm()
      })
      .with({ stopped_on: P.not(null) }, async () => {
        ctxLogger.info('BuildErrorsAgent is stopped, cancelling alarm')
        await this.state.storage.deleteAlarm()
      })
      .with(
        // we should never have started_on set without config set, but just in case
        { started_on: P.not(null), config: P.nullish },
        async () => {
          const msg =
            'BuildErrorsAgent started but config is empty, stopping and cancelling alarm'
          ctxLogger.error(msg)
          this.sentry.captureException(new Error(msg))
          this.kv.put('stopped_on', new Date())
          await this.state.storage.deleteAlarm()
        }
      )
      .when(
        // make sure there are still builds to enqueue
        (s) =>
          s.latest_build_id !== null &&
          s.config !== null &&
          s.latest_build_id >= s.config.max_build_id,
        async () => {
          ctxLogger.info('BuildErrorsAgent job complete, cancelling alarm')
          this.kv.put('stopped_on', new Date())
          await this.state.storage.deleteAlarm()
        }
      )
      .with(
        {
          started_on: P.not(null),
          stopped_on: P.nullish,
          config: P.not(null),
          latest_build_id: P.any,
        },
        async ({ config, latest_build_id }) => {
          // 1. select batch of ~1000 builds
          // 2. send them to Queues 100 at a time, updating
          //    latest_build_id after each batch is sent
          const failedBuilds = await this.store.builds.selectFailedBuilds({
            min_build_id: latest_build_id !== null ? latest_build_id + 1 : config.min_build_id,
            max_build_id: config.max_build_id,
            limit: 1000,
          })
          if (failedBuilds.length === 0) {
            ctxLogger.info(`BuildErrorsAgent: ran out of builds, stopping and cancelling alarm`)
            this.kv.put('stopped_on', new Date())
            await this.state.storage.deleteAlarm()
          }

          for (
            let i = 0;
            i < BUILDS_PER_ALARM_RUN && i < failedBuilds.length;
            i += QUEUES_BATCH_SIZE
          ) {
            const batch = failedBuilds
              .slice(i, QUEUES_BATCH_SIZE)
              .map((build) => ({ body: build }))

            if (batch.length === 0) {
              ctxLogger.info(`BuildErrorsAgent: ran out of builds in current batch`)
              break
            }
            ctxLogger.info(
              `BuildErrorsAgent: sending ${batch.length} builds to build errors queue`
            )
            await this.env.BUILD_ERRORS_QUEUE.sendBatch(batch)
            this.kv.put(
              'latest_build_id',
              Math.max(...batch.map((m) => m.body.build_id).concat(latest_build_id ?? 0))
            )

            this.kv.put(
              'total_builds_processed',
              ((await this.kv.get('total_builds_processed')) ?? 0) + batch.length
            )
          }
        }
      )
      .otherwise(() => {
        const msg = 'BuildErrorsAgent has nothing to do - this should never happen'
        this.sentry.captureException(msg)
        ctxLogger.info(msg)
      })
  } catch (e) {
    this.sentry.captureException(e)
    throw e
  }
}
Using pattern matching with ts-pattern made it much easier to understand what states we were expecting and what will happen compared to procedural code. We considered using a more powerful library like XState, but decided on ts-pattern due to its simplicity.
Running the backfill
Once everything rolled out, we were able to trigger an errors backfill for over a million failed builds in a couple of hours with a single API call, categorizing 80% of failed builds on the first run. With a fast backfill process, we were able to iterate on our regex matchers to further refine our error detection and improve error grouping. Here’s what the error list looks like in our staging environment:
Fixes and improvements
Having a better understanding of what’s going wrong has already enabled us to make several improvements:
Fixed multiple edge-cases where the wrong package manager was used in TypeScript/JavaScript projects.
Added support for bun.lock (previously only checked for bun.lockb).
Fixed several edge cases where build caching did not work in monorepos.
Projects that use a runtime.txt file to specify a Python version no longer fail.
….and more!
We’re still working on fixing other bugs we’ve found, but we’re making steady progress. Reliability is a feature we’re striving for in Workers Builds, and this project has helped us make meaningful progress towards that goal. Instead of waiting for people to contact support for issues, we’re able to proactively identify and fix issues (and catch regressions more easily).
One of the great things about building on the Developer Platform is how easy it is to ship things. The core of this error detection pipeline (the Queue and Durable Object) only took two days to build, which meant we could spend more time working on improving Workers Builds instead of spending weeks on the error detection pipeline itself.
What’s next?
In addition to continuing to improve build reliability and speed, we’ve also started thinking about other ways to help developers build their applications on Workers. For example, we built aBuilds MCP server that allows users to debug builds directly in Cursor/Claude/etc. We’re also thinking about ways we can expose these detected issues in the Cloudflare Dashboard so that users can identify issues more easily without scrolling through hundreds of logs.
Ready to get started?
Building applications on Workers has never been easier! Try deploying a Durable Object-backed chat application with Workers Builds:
Quickly identify any security misconfigurations for SaaS applications to safeguard applications, users, and data
… all through a natural language interface!
Today, we also announced our collaboration with Anthropic to bring remote MCP to Claude users, and showcased how other leading companies such as Atlassian, PayPal, Sentry, and Webflow have built remote MCP servers on Cloudflare to extend their service to their users. We’ve also been using the same infrastructure and tooling to build out our own suite of remote servers, and today we’re excited to show customers what’s ready for use and share what we’ve learned along the way.
Cloudflare’s MCP servers available today:
These MCP servers allow your MCP Client to read configurations from your account, process information, make suggestions based on data, and even make those suggested changes for you. All of these actions can happen across Cloudflare’s many services including application development, security, and performance.
Cloudflare Documentation Server: Get up to date reference information on Cloudflare
Our Cloudflare Documentation server enables any MCP Client to access up-to-date documentation in real-time, rather than relying on potentially outdated information from the model’s training data. If you’re new to building with Cloudflare, this server synthesizes information right from our documentation and exposes it to your MCP Client, so you can get reliable, up-to-date responses to any complex question like “Search Cloudflare for the best way to build an AI Agent”.
Workers Bindings server: Build with developer resources
Connecting to the Bindings MCP server lets you leverage application development primitives like D1 databases, R2 object storage and Key Value stores on the fly as you build out a Workers application. If you’re leveraging your MCP Client to generate code, the bindings server provides access to read existing resources from your account or create fresh resources to implement in your application. In combination with our base prompt designed to help you build robust Workers applications, you can add the Bindings MCP server to give your client all it needs to start generating full stack applications from natural language.
Full example output using the Workers Bindings MCP server can be found here.
Workers Observability server: Debug your application
The Workers Observability MCP server integrates with Workers Logs to browse invocation logs and errors, compute statistics across invocations, and find specific invocations matching specific criteria. By querying logs across all of your Workers, this MCP server can help isolate errors and trends quickly. The telemetry data that the MCP server returns can also be used to create new visualizations and improve observability.
Container server: Spin up a development environment
The Container MCP server provides any MCP client with access to a secure, isolated execution environment running on Cloudflare’s network where it can run and test code if your MCP client does not have a built in development environment (e.g. claude.ai). When building and generating application code, this lets the AI run its own commands and validate its assumptions in real time.
Browser Rendering server: Fetch and convert web pages, take screenshots
The Browser Rendering MCP server provides AI friendly tools from our RESTful interface for common browser actions such as capturing screenshots, extracting HTML content, and converting pages to Markdown. These are particularly useful when building agents that require interacting with a web browser.
Radar server: Ask questions about how we see the Internet and Scan URLs
Logpush server: Get quick summaries for Logpush job health
Logpush jobs deliver comprehensive logs to your destination of choice, allowing near real-time information processing. The Logpush MCP server can help you analyze your Logpush job results and understand your job health at a high level, allowing you to filter and narrow down for jobs or scenarios you care about. For example, you can ask “provide me with a list of recently failed jobs.” Now, you can quickly find out which jobs are failing with which error message and when, summarized in a human-readable format.
AI Gateway server: Check out your AI Gateway logs
Use this MCP server to inspect your AI Gateway logs and get details about the data from your prompts and the AI models responses. In this example we ask our agent “What is my average latency for my AI Gateway logs in the Cloudflare Radar account?”
AutoRAG server: List and search documents on your AutoRAGs
Having AutoRAG RAGs available to query as MCP tools greatly expands the typical static one-shot retrieval and opens doors to use cases where the agent can dynamically decide if and when to retrieve information from one or more RAGs, combine them with other tools and APIs, cross-check information and generate a much more rich and complete final answer.
Here we have a RAG that has a few blog posts that talk about retrocomputers. If we ask “tell me about restoring an amiga 1000 using the blog-celso autorag” the agent will go into a sequence of reasoning steps:
“Now that I have some information about Amiga 1000 restoration from blog-celso, let me search for more specific details.”
“Let me get more specific information about hardware upgrades and fixes for the Amiga 1000.”
“Let me get more information about the DiagROM and other tools used in the restoration.”
“Let me search for information about GBA1000 and other expansions mentioned in the blog.”
And finally, “Based on the comprehensive information I’ve gathered from the blog-celso AutoRAG, I can now provide you with a detailed guide on restoring an Amiga 1000.”
And at the end, it generates a very detailed answer based on all of the data from all of the queries:
Audit Logs server: Query audit logs and generate reports for review
Audit Logs record detailed information about actions and events within a system, providing a transparent history of all activity. However, because these logs can be large and complex, it may take effort to query and reconstruct a clear sequence of events. The Audit Logs MCP server helps by allowing you to query audit logs and generate reports. Common queries include if anything notable happened in a Cloudflare account under a user around a particular time of the day, or identifying whether any users used API keys to perform actions on the account. For example, you can ask “Were there any suspicious changes made to my Cloudflare account yesterday around lunch time?” and obtain the following response:
DNS Analytics server: Optimize DNS performance and debug issues based on current set up
Cloudflare’s DNS Analytics provides detailed insights into DNS traffic, which helps you monitor, analyze, and troubleshoot DNS performance and security across your domains. With Cloudflare’s DNS Analytics MCP server, you can review DNS configurations across all domains in your account, access comprehensive DNS performance reports, and receive recommendations for performance improvements. By leveraging documentation, the MCP server can help identify opportunities for improving performance.
Digital Experience Monitoring server: Get quick insight on critical applications for your organization
Cloudflare Digital Experience Monitoring (DEM) was built to help network professionals understand the performance and availability of their critical applications from self-hosted applications like Jira and Bitbucket to SaaS applications like Figma or Salesforce. The Digital Experience Monitoring MCP server fetches DEM test results to surface performance and availability trends within your Cloudflare One deployment, providing quick insights on users, applications, and the networks they are connected to. You can ask questions like: Which users had the worst experience? What times of the day were applications most and least performant? When do I see the most HTTP status errors? When do I see the shortest, longest, or most instability in the network path?
CASB server: Insights from SaaS Integrations
Cloudflare CASB provides the ability to integrate with your organization’s SaaS and cloud applications to discover assets and surface any security misconfigurations that may be present. A core task is helping security teams understand information about users, files, and other assets they care about that transcends any one SaaS application. The CASB MCP server can explore across users, files, and the many other asset categories to help understand relationships from data that can exist across many different integrations. A common query may include “Tell me about “Frank Meszaros” and what SaaS tools they appear to have accessed”.
Get started with our MCP servers
You can start using our Cloudflare MCP servers today! If you’d like to read more about specific tools available in each server, you can find them in our public GitHub repository. Each server is deployed to a server URL, such as
https://observability.mcp.cloudflare.com/sse.
If your MCP client has first class support for remote MCP servers, the client will provide a way to accept the server URL directly within its interface. For example, if you are using claude.ai, you can:
Navigate to your settings and add a new “Integration” by entering the URL of your MCP server
Authenticate with Cloudflare
Select the tools you’d like claude.ai to be able to call
If your client does not yet support remote MCP servers, you will need to set up its respective configuration file (mcp_config.json) using mcp-remote to specify which servers your client can access.
While we’re launching with these initial 13 MCP servers, we are just getting started! We want to hear your feedback as we shape existing and build out more Cloudflare MCP servers that unlock the most value for your teams leveraging AI in their daily workflows. If you’d like to provide feedback, request a new MCP server, or report bugs, please raise an issue on our GitHub repository.
Building your own MCP server?
If you’re interested in building your own servers, we’ve discovered valuable best practices that we’re excited to share with you as we’ve been building ours. While MCP is really starting to gain momentum and many organizations are just beginning to build their own servers, these principals should help guide you as you start building out MCP servers for your customers.
An MCP server is not our entire API schema: Our goal isn’t to build a large wrapper around all of Cloudflare’s API schema, but instead focus on optimizing for specific jobs to be done and reliability of the outcome. This means while one tool from our MCP server may map to one API, another tool may map to many. We’ve found that fewer but more powerful tools may be better for the agent with smaller context windows, less costs, a faster output, and likely more valid answers from LLMs. Our MCP servers were created directly by the product teams who are responsible for each of these areas of Cloudflare – application development, security and performance – and are designed with user stories in mind. This is a pattern you will continue to see us use as we build out more Cloudflare servers.
Specialize permissions with multiple servers: We built out several specialized servers rather than one for a critical reason: security through precise permission scoping. Each MCP server operates with exactly the permissions needed for its specific task – nothing more. By separating capabilities across multiple servers, each with its own authentication scope, we prevent the common security pitfall of over-privileged access.
Add robust server descriptions within parameters: Tool descriptions were core to providing helpful context to the agent. We’ve found that more detailed descriptions help the agent understand not just the expected data type, but also the parameter’s purpose, acceptable value ranges, and impact on server behavior. This context allows agents to make intelligent decisions about parameter values rather than providing arbitrary and potentially problematic inputs, allowing your natural language to go further with the agent.
Using evals at each iteration: For each server, we implemented evaluation tests or “evals” to assess the model’s ability to follow instructions, select appropriate tools, and provide correct arguments to those tools. This gave us a programmatic way to understand if any regressions occurred through each iteration, especially when tweaking tool descriptions.
Ready to start building? Click the button below to deploy your first remote MCP server to production:
Or check out our documentation to learn more! If you have any questions or feedback for us, you can reach us via email at [email protected] or join the chatter in the Cloudflare Developers Discord.
Today, we’re excited to collaborate with Anthropic, Asana, Atlassian, Block, Intercom, Linear, PayPal, Sentry, Stripe, and Webflow to bring a whole new set of remote MCP servers, all built on Cloudflare, to enable Claude users to manage projects, generate invoices, query databases, and even deploy full stack applications — without ever leaving the chat interface.
Since Anthropic’s introduction of the Model Context Protocol (MCP) in November, there’s been more and more excitement about it, and it seems like a new MCP server is being released nearly every day. And for good reason! MCP has been the missing piece to make AI agents a reality, and helped define how AI agents interact with tools to take actions and get additional context.
But to date, end-users have had to install MCP servers on their local machine to use them. Today, with Anthropic’s announcement of Integrations, you can access an MCP server the same way you would a website: type a URL and go.
At Cloudflare, we’ve been focused on building out the tooling that simplifies the development of remote MCP servers, so that our customers’ engineering teams can focus their time on building out the MCP tools for their application, rather than managing the complexities of the protocol. And if you’re wondering just how easy is it to deploy a remote MCP server on Cloudflare, we’re happy to tell you that it only takes one click to get an MCP server — pre-built with support for the latest MCP standards — deployed.
But you don’t have to take our word for it, see it for yourself! Industry leaders are taking advantage of the ease of use to deliver new AI-powered experiences to their users by building their MCP servers on Cloudflare and now, you can do the same — just click “Deploy to Cloudflare” to get started.
Keep reading to learn more about the new capabilities that these companies are unlocking for their users and how they were able to deliver them. Or, see it in action by joining us for Demo Day on May 1 (today) at 10:00 AM PST.
We’re also making Cloudflare’s remote MCP servers available to customers today and sharing what we learned from building them out.
MCP: Powering the next generation of applications
It wasn’t always the expectation that every service, whether a store, real estate agent, or service would have a website. But as more people gained access to an Internet connection, that quickly became the case.
We’re in the midst of a similar transition now to every web user having access to AI tools, turning to them for many tasks. If you’re a developer, it’s likely the case that the first place you turn when you go to write code now is to a tool like Claude. It seems reasonable then, that if Claude helped you write the code, it would also help you deploy it.
Or if you’re not a developer, if Claude helped you come up with a recipe, that it would also help you order the required groceries.
With remote MCP, all of these scenarios are now possible. And just like the first businesses built on the web had a first mover advantage, the first businesses to be built in an MCP-forward way are likely to reap the benefits.
The faster a user can experience the value of your product, the more likely they will be to succeed, upgrade, and continue to use your product. By connecting services to agents through MCP, users can simply ask for what they need and the agent will handle the rest, getting them to that “aha” moment faster.
Making your service AI-first with MCP
Businesses that adopt MCP will quickly see the impact:
Lower the barrier to entry
Not every user has the time to learn your dashboard or read through documentation to understand your product. With MCP, they don’t need to. They just describe what they want, and the agent figures out the rest.
Create personalized experiences
MCP can keep track of a user’s requests and interactions, so future tool calls can be adapted to their usage patterns and preferences. This makes it easy to deliver more personalized, relevant experiences based on how each person actually uses your product.
Drive upgrades naturally
Rather than relying on feature comparison tables, the AI agent can explain how a higher-tier plan helps a specific user accomplish their goals.
Ship new features and integrations
You don’t need to build every integration or experience in-house. By exposing your tools via MCP, you let users connect your product to the rest of their stack. Agents can combine tools across providers, enabling integrations without requiring you to support every third-party service directly.
We’re continuing to ship updates regularly — adding support for the latest changes to the MCP standard and making it even easier to get your server to production:
Supporting the new Streamable HTTP transport: Your MCP servers can now use the latest Streamable HTTP transport alongside SSE, ensuring compatibility with the latest standards. We’ve updated the AI Playground and mcp-remote proxy as well, giving you a remote MCP client to easily test the new transport.
Python support for MCP servers: You can now build MCP servers on Cloudflare using Python, not just JavaScript/TypeScript.
Improved docs, starter templates, and deploy flows: We’ve added new quickstart templates, expanded our documentation to cover the new transport method, and shared best practices for building MCP servers based on our learnings.
But rather than telling you, we thought it would be better to show you what our customers have built and why they chose Cloudflare for their MCP deployment.
Remote MCP servers you can connect to today
Asana
Today, work lives across many different apps and services. By investing in MCP, Asana can meet users where they are, enabling agent-driven interoperability across tools and workflows. Users can interact with the Asana Work Graph using natural language to get project updates, search for tasks, manage projects, send comments, and update deadlines from an MCP client.
Users will be able to orchestrate and integrate different pieces of work seamlessly — for example, turning a project plan or meeting notes from another app into a fully assigned set of tasks in Asana, or pulling Asana tasks directly into an MCP-enabled IDE for implementation. This flexibility makes managing work across systems easier, faster, and more natural than ever before.
To accelerate the launch of our first-party MCP server, Asana built on Cloudflare’s tooling, taking advantage of the foundational infrastructure to move quickly and reliably in this fast-evolving space.
“At Asana, we’ve always focused on helping teams coordinate work effortlessly. MCP connects our Work Graph directly to AI tools like Claude.ai, enabling AI to become a true teammate in work management. Our integration transforms natural language into structured work – creating projects from meeting notes or pulling updates into AI. Building on Cloudflare’s infrastructure allowed us to deploy quickly, handling authentication and scaling while we focused on creating the best experience for our users.” – Prashant Pandey, Chief Technology Officer, Asana
Jira and Confluence Cloud customers can now securely interact with their data directly from Anthropic’s Claude app via the Atlassian Remote MCP Server in beta. Hosted on Cloudflare infrastructure, users can summarize work, create issues or pages, and perform multi-step actions, all while keeping data secure and within permissioned boundaries.
Users can access information from Jira and Confluence wherever they use Claude to:
Summarize Jira work items or Confluence pages
Create Jira work items or Confluence pages directly from Claude
Get the model to take multiple actions in one go, like creating issues or pages in bulk
Enrich Jira work items with context from many different sources to which Claude has access
And so much more!
“AI is not one-size-fits-all and we believe that it needs to be embedded within a team’s jobs to be done. That’s why we’re so excited to invest in MCP and meet teams in more places where they already work. Hosting on Cloudflare infrastructure means we can bring this powerful integration to our customers faster and empower them to do more than ever with Jira and Confluence, all while keeping their enterprise data secure. Cloudflare provided everything from OAuth to out-of-the-box remote MCP support so we could quickly build, secure, and scale a fully operational setup.” — Taroon Mandhana, Head of Product Engineering, Atlassian
At Intercom, the transformative power of AI is becoming increasingly clear. Fin, Intercom’s AI Agent, is now autonomously resolving over 50% of customer support conversations for leading companies such as Anthropic. With MCP, connecting AI to internal tools and systems is easier than ever, enabling greater business value.
Customer conversations, for instance, offer valuable insights into how products are being used and the experiences customers are having. However, this data is often locked within the support platform. The Intercom MCP server unlocks this rich source of customer data, making it accessible to anyone in the organization using AI tools. Engineers, for example, can leverage conversation history and user data from Intercom in tools like Cursor or Claude Code to diagnose and resolve issues more efficiently.
“The momentum behind MCP is exciting. It’s making it easier and easier to connect assistants like Claude.ai and agents like Fin to your systems and get real work done. Cloudflare’s toolkit is accelerating that movement even faster. Their clear documentation, purpose-built tools, and developer-first platform helped Intercom go from concept to production in under a day, making the Intercom MCP server launch effortless. We’ll be encouraging our customers to leverage Cloudflare to build and deploy their own MCP servers to securely and reliably connect their internal systems to Fin and other clients.” — Jordan Neill, SVP Engineering, Intercom
Linear
The Linear MCP server allows users to bring the context of their issues and product development process directly into AI assistants when it’s needed. Whether that is refining a product spec in Claude, collaborating on fixing a bug with Cursor, or creating issues on the fly from an email.
“We’re building on Cloudflare to take advantage of their frameworks in this fast-moving space and flexible, fast, compute at the edge. With MCP, we’re bringing Linear’s issue tracking and product development workflows directly into their AI tools of choice, eliminating context switching for teams. Our goal is simple: let developers and product teams access their work where they already are—whether refining specs in Claude, debugging in Cursor, or creating issues from conversations. This seamless integration helps our customers stay in flow and focused on building great products” — Tom Moor, Head of US Engineering, Linear
“MCPs represent a new paradigm for software development. With PayPal’s remote MCP server on Cloudflare, now developers can delegate to an agent with natural language to seamlessly integrate with PayPal’s portfolio of commerce capabilities. Whether it’s managing inventory, processing payments, tracking shipping, handling refunds, AI agents via MCP can tap into these capabilities to autonomously execute and optimize commerce workflows. This is a revolutionary development for commerce, and the best part is, developers can begin integrating with our MCP server on Cloudflare today.” – Prakhar Mehrotra, SVP of Artificial Intelligence, PayPal
With the Sentry MCP server, developers are able to query Sentry’s context right from their IDE, or an assistant like Claude, to get errors and issue information across projects or even for individual files.
Developers can also use the MCP to create projects, capture setup information, and query project and organization information – and use the information to set up their applications for Sentry. As we continue to build out the MCP further, we’ll allow teams to bring in root cause analysis and solution information from Seer, our Agent, and also look at simplifying instrumentation for sentry functionality like traces, and exception handling.
Hosting this on Cloudflare and using Remote MCP, we were able to sidestep a number of the complications of trying to run locally, like scaling or authentication. Remote MCP lets us leverage Sentry’s own OAuth configuration directly. Durable Object support also lets us maintain state within the MCP, which is important when you’re not running locally.
“Sentry’s commitment has always been to the developer, and making it easier to keep production software running stable, and that’s going to be even more true in the AI era. Developers are utilizing tools like MCP to integrate their stack with AI models and data sources. We chose to build our MCP on Cloudflare because we share a vision of making it easier for developers to ship software, and are both invested in ensuring teams can build and safely run the next generation of AI agents. Debugging the complex interactions arising from these integrations is increasingly vital, and Sentry provides the essential visibility needed to rapidly diagnose and resolve issues. MCP integrates this crucial Sentry context directly into the developer workflow, empowering teams to consistently build and deploy reliable applications.” — David Cramer, CPO and Co-Founder, Sentry
Square’s APIs are a comprehensive set of tools that help sellers take payments, create and track orders, manage inventory, organize customers, and more. Now, with a dedicated Square MCP server, sellers can enlist the help of an AI agent to build their business on Square’s entire suite of API resources and endpoints. By integrating with AI agents like Claude and codename goose, sellers can craft sophisticated, customized use cases that fully utilize Square’s capabilities, at a lower technical barrier.
“MCP is emerging as a new AI interface. In the near-future, MCP may become the default way, or in some cases the only way, people, businesses, and code discover and interact with services. With Stripe’s agent toolkit and Cloudflare’s Agent SDK, developers can now monetize their MCPs with just a few lines of code.” — Jeff Weinstein, Product Lead at Stripe
Webflow
The Webflow MCP server supports CMS management, auditing and improving SEO, content localization, site publishing, and more. This enables users to manage and improve their site directly from their AI agent.
“We see MCP as a new way to interact with Webflow that aligns well with our mission of bringing development superpowers to everyone. MCP is not just a different surface over our APIs, instead we’re thinking of it in terms of the actions it supports: publish a website, create a CMS collection, update content, and more. MCP lets us expose those actions in a way that’s discoverable, secure, and deeply contextual. It opens the door to new workflows where AI and humans can work side-by-side, without needing to cobble together solutions or handle low-level API details. Cloudflare supports this aim by offering the reliability, performance, and developer tooling we need to build modern web infrastructure. Their support for remote MCP servers is mature and well-integrated, and their approach to authentication and durability aligns with how we think about the scale and security of these offerings.” — Utkarsh Sengar, VP of Engineering, Webflow
If you’re looking to build a remote MCP server for your service, get started with our documentation, watch the tutorial below, or use the button below to get a starter remote MCP server deployed to production. Once the remote MCP server is deployed, it can be used from Claude, Cloudflare’s AI playground, or any remote MCP client.
In addition, we launched a new YouTube video walking you through building MCP servers, using two of our MCP templates.
If you have any questions or feedback for us, you can reach us via email at [email protected].
Streamable HTTP Transport: The Agents SDK now supports the new Streamable HTTP transport, allowing you to future-proof your MCP server. Our implementation allows your MCP server to simultaneously handle both the new Streamable HTTP transport and the existing SSE transport, maintaining backward compatibility with all remote MCP clients.
Deploy MCP servers written in Python: In 2024, we introduced first-class Python language support in Cloudflare Workers, and now you can build MCP servers on Cloudflare that are entirely written in Python.
Click “Deploy to Cloudflare” to get started with a remote MCP server that supports the new Streamable HTTP transport method, with backwards compatibility with the SSE transport.
Streamable HTTP: A simpler way for AI agents to communicate with services via MCP
The MCP spec was updated on March 26 to introduce a new transport mechanism for remote MCP, called Streamable HTTP. The new transport simplifies how AI agents can interact with services by using a single HTTP endpoint for sending and receiving responses between the client and the server, replacing the need to implement separate endpoints for initializing the connection and for sending messages.
Upgrading your MCP server to use the new transport method
If you’ve already built a remote MCP server on Cloudflare using the Cloudflare Agents SDK, then adding support for Streamable HTTP is straightforward. The SDK has been updated to support both the existing Server-Sent Events (SSE) transport and the new Streamable HTTP transport concurrently.
Here’s how you can configure your server to handle both transports:
Use MyMcpAgent.serveSSE('/sse') for the existing SSE transport. Previously, this would have been MyMcpAgent.mount('/sse'), which has been kept as an alias.
Add a new path with MyMcpAgent.serve('/mcp') to support the new Streamable HTTP transport
That’s it! With these few lines of code, your MCP server will support both transport methods, making it compatible with both existing and new clients.
Using Streamable HTTP from an MCP client
While most MCP clients haven’t yet adopted the new Streamable HTTP transport, you can start testing it today using mcp-remote, an adapter that lets MCP clients like Claude Desktop that otherwise only support local connections work with remote MCP servers. This tool allows any MCP client to connect to remote MCP servers via either SSE or Streamable HTTP, even if the client doesn’t natively support remote connections or the new transport method.
So, what’s new with Streamable HTTP?
Initially, remote MCP communication between AI agents and services used a single connection but required interactions with two different endpoints: one endpoint (/sse) to establish a persistent Server-Sent Events (SSE) connection that the client keeps open for receiving responses and updates from the server, and another endpoint (/sse/messages) where the client sends requests for tool calls.
While this works, it’s like having a conversation with two phones, one for listening and one for speaking. This adds complexity to the setup, makes it harder to scale, and requires connections to be kept open for long periods of time. This is because SSE operates as a persistent one-way channel where servers push updates to clients. If this connection closes prematurely, clients will miss responses or updates sent from the MCP server during long-running operations.
The new Streamable HTTP transport addresses these challenges by enabling:
Communication through a single endpoint: All MCP interactions now flow through one endpoint, eliminating the need to manage separate endpoints for requests and responses, reducing complexity.
Bi-directional communication: Servers can send notifications and requests back to clients on the same connection, enabling the server to prompt for additional information or provide real-time updates.
Automatic connection upgrades: Connections start as standard HTTP requests, but can dynamically upgrade to SSE (Server-Sent Events) to stream responses during long-running tasks.
Now, when an AI agent wants to call a tool on a remote MCP server, it can do so with a single POST request to one endpoint (/mcp). Depending on the tool call, the server will either respond immediately or decide to upgrade the connection to use SSE to stream responses or notifications as they become available — all over the same request.
Our current implementation of Streamable HTTP provides feature parity with the previous SSE transport. We’re actively working to implement the full capabilities defined in the specification, including resumability, cancellability, and session management to enable more complex, reliable, and scalable agent-to-agent interactions.
What’s coming next?
The MCP specification is rapidly evolving, and we’re committed to bringing these changes to the Agents SDK to keep your MCP server compatible with all clients. We’re actively tracking developments across both transport and authorization, adding support as they land, and maintaining backward compatibility to prevent breaking changes as adoption grows. Our goal is to handle the complexity behind the scenes, so you can stay focused on building great agent experiences.
On the transport side, here are some of the improvements coming soon to the Agents SDK:
Resumability: If a connection drops during a long-running operation, clients will be able to resume exactly where they left off without missing any responses. This eliminates the need to keep connections open continuously, making it ideal for AI agents that run for hours.
Cancellability: Clients will have explicit mechanisms to cancel operations, enabling cleaner termination of long-running processes.
Session management: We’re implementing secure session handling with unique session IDs that maintain state across multiple connections, helping build more sophisticated agent-to-agent communication patterns.
Deploying Python MCP Servers on Cloudflare
In 2024, we introduced Python Workers, which lets you write Cloudflare Workers entirely in Python. Now, you can use them to build and deploy remote MCP servers powered by the Python MCP SDK — a library for defining tools and resources using regular Python functions.
You can deploy a Python MCP server to your Cloudflare account with the button below, or read the code here.
Here’s how you can define tools and resources in the MCP server:
class FastMCPServer(DurableObject):
    def __init__(self, ctx, env):
        self.ctx = ctx
        self.env = env
        from mcp.server.fastmcp import FastMCP
        self.mcp = FastMCP("Demo")

        @mcp.tool()
        def calculate_bmi(weight_kg: float, height_m: float) -> float:
            """Calculate BMI given weight in kg and height in meters"""
            return weight_kg / (height_m**2)

        @mcp.resource("greeting://{name}")
        def get_greeting(name: str) -> str:
            """Get a personalized greeting"""
            return f"Hello, {name}!"

        self.app = mcp.sse_app()

    async def call(self, request):
        import asgi
        return await asgi.fetch(self.app, request, self.env, self.ctx)


async def on_fetch(request, env):
    id = env.ns.idFromName("example")
    obj = env.ns.get(id)
    return await obj.call(request)
If you’re already building APIs withFastAPI, a popular Python package for quickly building high performance API servers, you can use FastAPI-MCP to expose your existing endpoints as MCP tools. It handles the protocol boilerplate for you, making it easy to bring FastAPI-based services into the agent ecosystem.
On Cloudflare, you can start building today. We’re ready for you, and ready to help build with you. Email us at [email protected], and we’ll help get you going. There’s lots more to come with MCP, and we’re excited to see what you build.
During Cloudflare’s Birthday Week in September 2024, we introduced a revamped Startup Program designed to make it easier for startups to adopt Cloudflare through a new credits system. This update focused on better aligning the program with how startups and developers actually consume Cloudflare, by providing them with clearer insight into their projected usage, especially as they approach graduation from the program.
Today, we’re excited to announce an expansion to that program: new credit tiers that better match startups at every stage of their journey. But before we dive into what’s new, let’s take a quick look at what the Startup Program is and why it exists.
A refresher: what is the Startup Program?
Cloudflare for Startups provides credits to help early-stage companies build the next big idea on our platform. Startups accepted into the program receive credits valid for one year or until they’re fully used, whichever comes first.
Beyond credits, the program includes access to up to three domains with enterprise-level services, giving startups the same advanced tools we provide to large companies to protect and accelerate their most critical applications.
We know that building a startup is expensive, and Cloudflare is uniquely positioned to support the full-stack needs of modern applications. Our goal is simple: ensure that you have access to the best of Cloudflare’s global network, without the barriers of cost or availability.
Since launching the revamped credits system in September, we’ve learned a lot from the startups in our program, including what they’re building, what they need, and where they need more flexibility. One of the most common requests was more credit tier options.
That’s why we’re introducing new tiers that provide even more options to startups as they scale.
Introducing additional credit tiers
The Cloudflare for Startups Program now offers four credit tiers:
Credit Amount
$5,000
$25,000
$100,000
$250,000
Stage
Bootstrapped, stealth startups
Up-and-coming startups
Seed-funded startups
Tier 1 startups
Description
For startups who are just getting started. This tier is great for building, testing, and iterating your product.
For startups with early adopters and proving product market fit.
For startups that have raised capital, and are experiencing high growth.
For scaling startups that belong to our Tier 1 VC and accelerator network, are building a mission-critical AI application, or are participating in our Workers Launchpad Program.
Criteria
Building a software-based product or service
Founded in the last 5 years
Valid and matching email address
$5,000 criteria plus:
Active LinkedIn
Funded up to $1M
$25,000 criteria plus:
Funded between $1M and $5M
Belong to any of our 250+ approved VC or Accelerator partners
$100,000 criteria plus:
High growth / AI companies, OR
Tier 1 VC & Accelerators
These tiers are designed to offer simplicity and clarity by aligning with where you are in your growth journey. (You can check out eligibility criteria and apply to the Startup Program here). These tiers are still subject to the same Cloudflare for Startups Terms of Service. Credits are valid for up to one year or when all credits are consumed (whichever comes first).
Why are we adding additional credit tiers?
We understand that each startup may have different needs depending on where they’re at in their journey. Some are just getting off the ground, others are scaling rapidly, and each has unique infrastructure needs. With this expansion, we’re reaffirming Cloudflare’s commitment to startups of all sizes, making it easier for you to access the right level of support and resources, exactly when you need them.
Whether you’re launching your MVP or preparing for your next funding round, Cloudflare is here to help you grow.
What can I use the credit tiers for?
The vast majority of Cloudflare products (including all products found on the pay-as-you-go plans) can be used on the Startup Program. Beyond going to the website to see what products are included, below are a few examples of what you can use your credits for:
Build AI applications
Store your training data in R2, build AI-powered agents (via Agents SDK) that autonomously perform tasks with Durable Objects and Workers, or use one of over 50 models to run inference tasks on Cloudflare’s global network.
Create immersive realtime experiences
Deliver live audio and video via our Realtime Kit, enhance the experience with an AI-powered chatbot running on Workers AI to transcribe the call, broadcast to large audiences with Stream.
Build durable multi-step applications
Design and run long-lived, multi-step processes like onboarding flows, document processing, or order fulfillment. Use Workflows to coordinate logic across Workers, Durable Objects, Queues, and AI tasks. Easily handle retries, timeouts, and state management without complex orchestration infrastructure.
What are startups saying about Cloudflare?
Webstudio’s no-code platform is powered by Cloudflare’s Developer Platform
“From a modern design tool, you’d expect real-time collaborative features and would like to have resources as close to users as possible. Since betting on the Developer Platform architecture, Cloudflare has done more for us than any other vendor out there!” – Oleg Isonen (Founder & CEO)
GrackerAI’s cybersecurity research engine runs on Cloudflare’s AI and serverless architecture
“Cloudflare’s fusion of edge computing and AI empowers developers to deploy and utilize AI models with unprecedented efficiency and scale, marking a significant leap forward in how we build and interact with intelligent systems.” – Deepak Gupta (Co-founder & CEO)
Render Better powers faster ecommerce experiences with Cloudflare Workers
“Each month Render Better optimizes billions of monthly requests for ecommerce visitors, delivering faster loading sites that make top brands millions more in revenue. We’re able to scale up with Cloudflare’s serverless workers, handling every request at the network edge within milliseconds, thanks to the rock solid, DX-friendly scope of the Developer Platform.” – James Koshigoe (Co-founder & CEO)
What will you build on Cloudflare?
We can’t wait to see what you will build on Cloudflare. Apply here to take advantage of the Cloudflare for Startups Program.
Today, we’re sharing a preview of a new feature that makes it easier to build cross-cloud apps: Workers VPC.
Workers VPC is our take on the traditional virtual private cloud (VPC), modernized for a network and compute that isn’t tied to a single cloud region. And we’re complementing it with Workers VPC Private Links to make building across clouds easier. Together, they introduce two new capabilities to Workers:
A way to group your apps’ resources on Cloudflare into isolated environments, where only resources within a Workers VPC can access one another, allowing you to secure and segment app-to-app traffic (a “Workers VPC”).
A way to connect a Workers VPC to a legacy VPC in a public or private cloud, enabling your Cloudflare resources to access your resources in private networks and vice versa, as if they were in a single VPC (the “Workers VPC Private Link”).
Workers VPC and Workers VPC Private Link enable bidirectional connectivity between Cloudflare and external clouds
When linked to an external VPC, Workers VPC makes the underlying resources directly addressable, so that application developers can think at the application layer, without dropping down to the network layer. Think of this like a unified VPC across clouds, with built-in service discovery.
We’re actively building Workers VPC on the foundation of our existing private networking products and expect to roll it out later in 2025. We wanted to share a preview of it early to get feedback and learn more about what you need.
Building private cross-cloud apps is hard
Developers are increasingly choosing Workers as their platform of choice, building rich, stateful applications on it. We’re way past Workers’ original edge use-cases: you’re modernizing more of your stack and moving more business logic on to Workers. You’re choosing Workers to build real-time collaboration applications that access your external databases, large scale applications that use your secured APIs, and Model Context Protocol (MCP) servers that expose your business logic to agents as close to your end users as possible.
Now, you’re running into the final barrier holding you back in external clouds: the VPC. Virtual private clouds provide you with peace of mind and security, but they’ve been cleverly designed to deliberately add mile-high barriers to building your apps on Workers. That’s the unspoken, vested interest behind getting you to use more legacy VPCs:it’s yet another way that captivity cloudshold your data and apps hostage and lock you in.
In conversation after conversation, you’ve told us “VPCs are a blocker”. We get it: your company policies mandate the VPC, and with good reason! So, to access private resources from Workers, you have to either 1) create new public APIs that perform authentication to provide secure access, or 2) set up and scale Cloudflare Tunnels and Zero Trust for each resource that you want to access. That’s a lot of hoops to jump through before you can even start building.
While we have the storage and compute options for you to build fully on Workers, we also understand that you won’t be moving your applications or your data overnight! But we think you should at least be free to choose Workers today to build modern applications, AI agents, and real-time global applications with your existing private APIs and databases. That’s why we’re building Workers VPC.
We’ve witnessed the pain of building around VPCs first hand. In 2024, we shipped support for private databases for Hyperdrive. This made it possible for you to connect to databases in an external VPC from Cloudflare Workers, using Cloudflare Tunnels as the underlying network solution. As a point-to-point solution, it’s been working great! But this solution has its limitations: managing and scaling a Cloudflare Tunnel for each resource in your external cloud isn’t sustainable for large, complex architectures.
We want to provide a dead-simple solution for you to unlock access to external cloud resources, in a manner that scales as you modernize more of your workloads with Workers. And we’re leveraging the experience we have in building Magic WAN and Magic Cloud Networking to make that possible.
So, we’re taking VPCs global with Workers VPC. And we’re letting you connect them to your legacy private networks with Workers VPC Private Links. Because we think you should be free to build secure, global, cross-cloud apps on Workers.
Global cross-cloud apps need a global VPC
Private networks are complex to set up, they span across many layers of abstraction, and entire teams are needed to manage them. There are few things as complex as managing architectures that have outgrown their original point-to-point network! So we knew we needed to provide a simple solution for isolated environments on our platform.
Workers VPCs are, by definition, virtual private clouds. That means that they allow you to define isolated environments of Workers and Developer Platform resources like R2, Workers KV, and D1 that have secure access to one another. Other resources in your Cloudflare account won’t have access to these — VPCs allow you to specify certain sets of resources that are associated with certain apps and ensure no cross-application access of resources happens.
Workers VPCs are the equivalent of the legacy VPC, re-envisioned for the Cloudflare Developer Platform. The main difference is how Workers VPCs are implemented under the hood: instead of being built on top of regional, IP-based networking, Workers VPCs are built for global scale with the Cloudflare network performing isolation of resources across all of its datacenters.
And as you would expect from traditional VPCs, Workers VPCs have networking capabilities that allow them to seamlessly integrate with traditional networks, enabling you to build cross-cloud apps that never leave the networks you trust. That’s where Workers VPC Private Links comes in.
Like AWS PrivateLink and other VPC-to-VPC approaches, Workers VPC Private Links connect your Workers VPC to your external cloud using either standard tunnels over IPsec or Cloudflare Network Interconnect. When a Private Link is established, resources from either side can access one another directly, with nothing exposed over the public Internet, as if they were a single, connected VPC.
Workers VPC Private Link automatically provisions a gateway for IPsec tunnels or Cloudflare Network Interconnect and configures DNS for routing to Cloudflare resources
To make this possible, Workers VPC and Private Links work together to automatically provision and manage the resources in your external cloud. This establishes the connection between both networks and configures the resources required to make bidirectional routing possible. And, because we know some teams will want to maintain full responsibility over resource provisioning, Workers VPC Private Link can automatically provide you with Terraform scripts to provision external cloud resources that you can run yourself.
After the connection is made, Workers VPC will automatically detect the resources in your external VPC and make them available as bindings with unique IDs. Requests made through the Workers VPC resource binding will automatically be routed to your external VPC, where DNS resolution will occur (if you’re using hostname-accessed resources) and will be routed to the expected resource.
For example, connecting from Cloudflare Workers to a private API in an external VPC is just a matter of calling fetch() on a binding to a named Workers VPC resource:
Similarly, Cloudflare resources are accessible via a standardized URL that has been configured within a private DNS resource in your external cloud by Workers VPC Private Link. If you were attempting to access R2 objects from an API in your VPC, you would be able to make the request to the expected URL:
Best of all, since Workers VPC is built on our existing platform, it takes full advantage of our networking and routing capabilities to reduce egress fees and let you build global apps.
First, by supporting Cloudflare Network Interconnect as the underlying connection method, Workers VPC Private Links can help you lower your bandwidth costs by taking advantage of discounted external cloud egress pricing. Second, since Workers VPC is global by nature, your Workers and resources can be placed wherever needed to ensure optimal performance. For instance, with Workers’ Smart Placement, you can ensure that your Workers are automatically placed in a region closest to your external, regional VPC to maximize app performance.
An end-to-end connectivity cloud
Workers VPC unlocks huge swaths of your workloads that are currently locked into external clouds, without requiring you to expose those private resources to the public Internet to build on Workers. Here are real examples of applications that you’ve told us you’re looking forward to build on Workers with Workers VPC:
Sample architecture of real-time canvas application built on Workers and Durable Objects accessing a private database and container in an external VPC
Let’s say you’re trying to build a new feature for your application on Workers. You also want to add real-time collaboration to your app using Durable Objects. And you’re using Containers as well because you need to access FFmpeg for live video processing. In each scenario, you need a way to persist the state updates in your existing traditional database and access your existing APIs.
While in the past, you might have had to create a separate API just to handle update operations from Workers and Durable Objects, you can now directly access the traditional database and update the value directly with Workers VPC.
Same thing goes for Model Context Protocol (MCP) servers! If you’re building an MCP server on Workers, you may want to expose certain functionality that isn’t immediately available as a public API, especially if time to market is important. With Workers VPC, you can create new functionality directly in your MCP server that builds upon your private APIs or databases, enabling you to ship quickly and securely.
Sample architecture of external cloud resources accessing data from R2, D1, KV
Lots of development teams are landing more and more data on the Cloudflare Developer Platform, whether it is storing AI training data on R2 due to its zero-egress cost efficiency, application data in D1 with its horizontal sharding model, or configuration data in KV for its global single-digit millisecond read latencies.
Now, you need to provide a way to use the training data in R2 from your compute in your external cloud to train or fine-tune LLM models. Since you’re accessing user data, you need to use a private network because it’s mandated by your security teams. Likewise, you need to access user data and configuration data in D1 and KV for certain administrative or analytical tasks and you want to do so while avoiding the public Internet. Workers VPC enables direct, private routing from your external VPC to Cloudflare resources, with easily accessible hostnames from the automatically configured private DNS.
Finally, let’s use an AI agents example — it’s Developer Week 2025 after all! This AI agent is built on Workers, and uses retrieval augmented generation (RAG) to improve the results of its generated text while minimizing the context window.
You’re using PostgreSQL and Elasticsearch in your external cloud because that’s where your data currently resides and you’re a fan of pgvector. You’ve decided to use Workers because you want to get to market quickly, and now you need to access your database. Your database is, once again, placed in a private network and is inaccessible from the public Internet.
While you could provision a new Hyperdrive and Cloudflare Tunnel in a container, since your Workers VPC is already set up and linked, you can access the database directly using either Workers or Hyperdrive.
And what if new documents get added to your object storage in your external cloud? You might want to kick off a workflow to process the new document, chunk it, get embeddings for it, and update the state of your application in consequence, all while providing real-time updates to your end users about the status of the workflow?
Well, in that case, you can use Workflows, triggered by a serverless function in the external cloud. The Workflow will then fetch the new document in object storage, process it as needed, use your preferred embedding provider (whether Workers AI or another provider) in order to process and update the vector stores in Postgres, and then update the state of your application.
These are just some of the workloads that we know will benefit from Workers VPC on day 1. We’re excited to see what you build and are looking forward to working with you to make global VPCs real.
A new era for virtual private clouds
We’re incredibly excited for you to be able to build more on Workers with Workers VPC. We believe that private access to your APIs and databases in your private networks will redefine what you can build on Workers. Workers VPCs unlock access to your private resources to let your ship faster, more performant apps on Workers. And we’re obviously going to ensure that Containers integrate natively with Workers VPC.
We’re actively building Workers VPC on the networking primitives and on-ramps we’ve been using to connect customer networks at scale, and our goal is to ship an early preview later in 2025.
We’re planning to tackle connectivity from Workers to external clouds first, enabling you to modernize more apps that need access to private APIs and databases with Workers, before expanding to support full-directional traffic flows and multiple Workers VPC networks. If you want to shape the vision of Workers VPC and have workloads trapped in a legacy cloud, express interest here.
With quick access to flexible infrastructure and innovative AI tools, startups are able to deploy production-ready applications with speed and efficiency. Cloudflare plays a pivotal role for countless applications, empowering founders and engineering teams to build, scale, and accelerate their innovations with ease — and without the burden of technical overhead. And when applicable, initiatives like our Startup Program and Workers Launchpad offer the tooling and resources that further fuel these ambitious projects.
Cloudflare recently announcedAI agents, allowing developers to leverage Cloudflare to deploy agents to complete autonomous tasks. We’re already seeing some great examples of startups leveraging Cloudflare as their platform of choice to invest in building their agent infrastructure. Read on to see how a few up-and-coming startups are building their AI agent platforms, powered by Cloudflare.
Lamatic AI built a scalable AI agent platform using Workers for Platform
Founded in 2023, Lamatic.ai empowers SaaS startups to seamlessly integrate intelligent AI agents into their products. Lamatic.ai simplifies the deployment of AI agents by offering a fully managed lifecycle with scalability and security in mind. SaaS providers have been leveraging Lamatic to replatform their AI workflows via a no-code visual builder to reduce technical debt and ship products faster. Designed for high availability, scalability, and low latency, Lamatic’s architecture enables developers to build AI-driven applications that remain performant under heavy load. After acquiring a high amount of users in a short amount of time on Product Hunt, Lamatic identified there was real interest to solve complex problems with AI Agents, and the team knew they needed to build a solution with scalability and performance in mind.
Cloudflare plays a key role in supporting Lamatic’s growth. Powered by Cloudflare Workers, Lamatic ensures requests process closer to end users, minimizing latency while offloading computational strain from centralized servers. In just a few months, Lamatic.ai has efficiently scaled to over three million serverless requests per month, supporting over 1,000 customers — all managed by a lean three-person team.
Customers design their Agent Flows through a no-code visual builder, which generates an interoperable YAML configuration. Sensitive credentials such as API keys and model access tokens are securely encrypted and stored in Workers KV, ensuring they are only decrypted at runtime for enhanced security. All YAML configurations are then compiled into a Workers-compatible JavaScript bundle. When a project is deployed, Lamatic orchestrates critical components like sync jobs for scheduled data ETL operations and incoming webhooks to handle event-driven workflows via Cloudflare Queues. Once deployed, the project is fully operational as a Cloudflare Worker with an exposed API endpoint, allowing customers to integrate AI-powered automation directly into their applications with minimal friction.
To scale out their platform, Lamatic.ai built their architecture isolating serverless and AI logic on a per-customer basis. Rather than batching requests into a centralized cluster, Lamatic.ai distributes workloads across Cloudflare’s global network, ensuring each customer and endpoint is served by its own Worker executing dedicated logic. This per-customer deployment model — enabled by Workers for Platforms— allows Lamatic.ai to deliver customer-specific serverless functions at scale, and reduces technical overhead as they onboard additional customers. Each customer gets a dedicated Worker whose request and rate limits are enabled based on their level of subscription.
Beyond request processing, Lamatic uses Cloudflare Workers KV as a distributed config store to ensure high availability and security. All values are encrypted at rest with AES-256-GCM and decrypted only at runtime, keeping operations both secure and low-latency. Tokens and user credentials are encrypted and stored in the database and KV.
To further enhance performance, Cloudflare Queues plays a key role in orchestrating task completion. Lamatic uses Queues to offload work from Workers requests, and handle tasks such as webhooks and coordinating distributed processes, both essential for maintaining system consistency and reliability at scale. While Workers handle sync requests at point of execution, longer running jobs process via Queues. For example, during a scheduled ETL sync, new data records generated are stored as a message queue on Cloudflare Pub/Sub. A consumer Worker collects these messages and makes an API request to the pod using the Workers Queue. The consumer Worker consumes more messages as each queue is finished processing.
Another example of where this has been optimal is for managing AI workflows. Many AI workflows involve concurrent requests to multiple data sources, Queues streamlines data processing and efficiently feeds information into customers’ Retrieval Augmented Generation (RAG) workflows. This approach smooths out workload spikes, reduces bottlenecks, and ensures that AI agents can reliably aggregate and process data without delays.
Beyond this, Lamatic.ai offers Workers AI as one of the support inference providers that customers can use across their platform. Customers can choose to run one of the many open source models hosted on Workers AI, depending on their use case (chatbot, image generation, voice, etc.). Together, these layers solve the challenges of scaling AI agents by handling high volumes of data, maintaining low-latency responses, and ensuring robust security. With Cloudflare’s infrastructure as its backbone, Lamatic.ai has built a resilient and high-performing platform that meets the rigorous demands of modern AI applications, making it an ideal choice for startups embedding AI-driven features into their products.
Skyward AI automates compliance using AI agents with Durable Objects and agents
Skyward AI is transforming compliance operations by leveraging Cloudflare’s serverless computing capabilities to build AI-driven compliance agents that streamline critical tasks like evidence collection, real-time risk analysis, and policy updates. Compliance teams in fintech, supply chain, and other highly regulated industries use these AI Agents to extract and organize evidence, provide real-time recommendations, and orchestrate policy and procedural updates automatically. By handling document parsing, risk monitoring, and policy enforcement, these AI Agents reduce the risk of human error while allowing compliance professionals to focus on high-value tasks.
Skyward has built an AI agents platform designed with a serverless-first approach, avoiding the constraints of centralized cloud computing. To achieve this, the company leverages Cloudflare’s Developer Platform to create and maintain a highly responsive and scalable infrastructure. Workers handle incoming requests like chat inputs, compliance checks, or authentication, and route them efficiently across multiple geographies. Skyward initially built their AI agents infrastructure using Durable Objects,Workflows and JavaScript-native RPC for AI coordination, but has recently transitioned to Cloudflare’s new AI agents framework. Given that agents provides a framework for building and orchestrating AI agents, the migration has helped Skyward abstract the need to manage Durable Objects manually, significantly reducing time spent on managing these tools. While this release is fairly recent, the transition has helped simplify the way that agents communicate, but it also preserved the benefits of their original design like data privacy, isolation, and concurrency management. This has also made it easier to provide real-time feedback and responses to their end users.
Skyward optimizes real-time compliance automation by achieving sub-100 ms response times for AI agent queries. Workloads are structured to minimize unnecessary network round-trips, and a sync-engine approach proactively preloads and pushes data to clients, delivering a highly responsive user experience. To proxy AI inference, Skyward uses AI Gateway to provide observability into usage, performance, and costs across multiple vendors, improving their AI operational efficiency. Leveraging Cloudflare’s serverless Developer Platform has allowed Skyward to simplify their architecture while supporting global availability, avoiding the need for Kubernetes clusters or complex locking mechanisms. The team also avoids the burden of managing regional deployments, as Cloudflare’s multi-region support ensures consistent performance worldwide without added operational complexity.
State management is a critical component to execute agentic workflows. Each compliance session runs within a dedicated Durable Object, which keeps relevant data close to the execution layer. This setup minimizes database round-trips and ensures that tasks like Anti-Money Laundering (AML) checks, Know Your Business (KYB) validation, and document processing remain efficient. Once a compliance session is complete, the system summarizes and stores the relevant information in Postgres and R2, optimizing memory usage without requiring persistent cloud infrastructure.
To balance low-latency operations with long-term storage, Skyward employs a multi-layered data management strategy. The Skyward team, using Hyperdrive, has been able to reduce query latency by nearly 50%, allowing compliance teams to receive immediate feedback. At the company’s core, Skyward’s goal is to offer a platform that is “streamlined for compliance teams”. The team maintains that a speedy feedback loop ensures end customers get the data and responses needed to act. Whether there’s one agent or hundreds of agents processing tasks in parallel, Hyperdrive ensures that database requests to assets like extensive company documentation (i.e. regulations, policies, procedures, internal documents), complex regulatory knowledge graphs, and on-demand context information for conversational workflows are all as performant as possible.
Durable Objects facilitate real-time session state, ensuring AI agents function smoothly without complex locking mechanisms. For larger compliance-related documents, such as legal PDFs and archived data, Cloudflare R2 provides long-term storage, ensuring only frequently accessed information remains readily available. This approach enhances performance while keeping storage management efficient and cost-effective.
Security and scalability remain priorities for compliance-focused AI applications. Skyward enforces strict access controls, ensuring that only authorized users can access development and production environments. Each AI session maintains an auditable log of key events, user actions, and approvals, supporting the ability to export these insights for compliance and legal requirements. Because each agent is deployed in its own instance and has its own database, Skyward ensures that there is a detailed record of every required user, agent interaction, and auditing requirements. On top of this, the ability to deploy and scale globally with Cloudflare’s network has allowed Skyward to maintain consistent, high-performance operations across multiple regions without extensive infrastructure overhead.
Looking ahead, Skyward plans to further enhance AI agent responsiveness by running select models directly on Cloudflare Workers AI, reducing reliance on external inference providers. The team plans to further integrate Workers for Platforms in an effort to better isolate customer data and workflows, giving end users greater control over their compliance automation. As Cloudflare continues to evolve its AI capabilities, Skyward aims to push the boundaries of distributed AI compliance solutions, making regulatory adherence more automated, scalable, and secure.
Building on Cloudflare
We’re inspired by how startups like Lamatic AI and Skyward AI are building their AI agent platforms on Cloudflare. This kind of innovation is why we’re proud to see so many startups trust Cloudflare for a scalable, reliable, and efficient foundation.
We’re also thrilled to share that both Lamatic AI and Skyward AI have been invited to join Cloudflare’s upcoming Workers Launchpad Cohort #5. Speaking of Workers Launchpad, it’s been a few months since our last update — let’s take a look at what’s new.
Thank you to Workers Launchpad Cohort #4, and a warm welcome to Cohort #5
The Workers Launchpad team is blown away by what customers are demonstrating on the Developer Platform. Members of Cohort #4 presented at our bi-annual Demo Day. We had customers demonstrate what they’re building across a multitude of industries, including (of course) AI / ML, developer tools, 3D design, cloud infrastructure, adtech, media, and beyond. It’s incredibly encouraging to see what all these amazing companies are building on the Cloudflare network, and we look forward to continuing to partner with them throughout their startup journey.
Following the Demo Day for Workers Launchpad Cohort #4, we’ve seen the largest influx of applications from startups across the globe eager to join Cohort #5. This next wave of founders is pushing the boundaries of what’s possible, building in areas like AI agents, developer tooling, MCP, media, and beyond. With each new cohort, we’re continually inspired by the caliber of founding teams, the bold ideas they bring to life, and the real-world problems they’re tackling with technology.
Help us give some love and a warm welcome to the participants of Cohort #5:
We can’t wait to share more about what Cohort #5 achieves. Be sure to follow @CloudflareDev on X and join our Developer Discord server to hear updates on the cohorts.
If you’re developing your application on our Developer Platform, we’d love to learn how Cloudflare is powering your journey. Please share more about what you’re building, and our team will be sure to review your submission. And if you’re a startup and interested in joining Workers Launchpad, feel free to apply for Cohort 6 — applications are now open!
It is almost the end of Developer Week and we haven’t talked about containers: until now. As some of you may know, we’ve been working on a container platform behind the scenes for some time.
In late June, we plan to release Containers in open beta, and today we’ll give you a sneak peek at what makes it unique.
Workers are the simplest way to ship software around the world with little overhead. But sometimes you need to do more. You might want to:
Run user-generated code in any language
Execute a CLI tool that needs a full Linux environment
Use several gigabytes of memory or multiple CPU cores
Port an existing application from AWS, GCP, or Azure without a major rewrite
Cloudflare Containers let you do all of that while being simple, scalable, and global.
Through a deep integration with Workers and an architecture built on Durable Objects, Workers can be your:
API Gateway: Letting you control routing, authentication, caching, and rate-limiting before requests reach a container
Service Mesh: Creating private connections between containers with a programmable routing layer
Orchestrator: Allowing you to write custom scheduling, scaling, and health checking logic for your containers
Instead of having to deploy new services, write custom Kubernetes operators, or wade through control plane configuration to extend the platform, you just write code.
Let’s see what it looks like.
Deploying different application types
A stateful workload: executing AI-generated code
First, let’s take a look at a stateful example.
Imagine you are building a platform where end-users can run code generated by an LLM. This code is untrusted, so each user needs their own secure sandbox. Additionally, you want users to be able to run multiple requests in sequence, potentially writing to local files or saving in-memory state.
To do this, you need to create a container on-demand for each user session, then route subsequent requests to that container. Here’s how you can accomplish this:
First, you write some basic Wrangler config, then you route requests to containers via your Worker:
import { Container } from "cloudflare:workers";

export default {
  async fetch(request, env) {
    const url = new URL(request.url);

    if (url.pathname.startsWith("/execute-code")) {
      const { sessionId, messages } = await request.json();
      // pass in prompt to get the code from Llama 4
      const codeToExecute = await env.AI.run("@cf/meta/llama-4-scout-17b-16e-instruct", { messages });

// get a different container for each user session
      const id = env.CODE_EXECUTOR.idFromName(sessionId);
      const sandbox = env.CODE_EXECUTOR.get(id);

// execute a request on the container
      return sandbox.fetch("/execute-code", { method: "POST", body: codeToExecute });
    }

    // ... rest of Worker ...
  },
};

// define your container using the Container class from cloudflare:workers
export class CodeExecutor extends Container {
defaultPort = 8080;
sleepAfter = "1m";
}
Then, deploy your code with a single command: wrangler deploy. This builds your container image, pushes it to Cloudflare’s registry, readies containers to boot quickly across the globe, and deploys your Worker.
$ wrangler deploy
That’s it.
How does it work?
Your Worker creates and starts up containers on-demand. Each time you call env.CODE_EXECUTOR.get(id) with a unique ID, it sends requests to a unique container instance. The container will automatically boot on the first fetch, then put itself to sleep after a configurable timeout, in this case 1 minute. You only pay for the time that the container is actively running.
When you request a new container, we boot one in a Cloudflare location near the incoming request. This means that low-latency workloads are well-served no matter the region. Cloudflare takes care of all the pre-warming and caching so you don’t have to think about it.
This allows each user to run code in their own secure environment.
Stateless and global: FFmpeg everywhere
Stateless and autoscaling applications work equally well on Cloudflare Containers.
Imagine you want to run a container that takes a video file and turns it into an animated GIF using FFmpeg. Unlike the previous example, any container can serve any request, but you still don’t want to send bytes across an ocean and back unnecessarily. So, ideally the app can be deployed everywhere.
To do this, you declare a container in Wrangler config and turn on autoscaling. This specific configuration ensures that one instance is always running and if CPU usage increases beyond 75% of capacity, additional instances are added:
To route requests, you just call env.GIF_MAKER.fetch and requests are automatically sent to the closest container:
import { Container } from "cloudflare:workers";

export class GifMaker extends Container {
  defaultPort: 1337,
}

export default {
  async fetch(request, env) {
    const url = new URL(request.url);

    if (url.pathname === "/make-gif") {
      return env.GIF_MAKER.fetch(request)
    }

    // ... rest of Worker ...
  },
};
Going beyond the basics
From the examples above, you can see that getting a basic container service running on Workers just takes a few lines of config and a little Workers code. There’s no need to worry about capacity, artifact registries, regions, or scaling.
For more advanced use, we’ve designed Cloudflare Containers to run on top of Durable Objects and work in tandem with Workers. Let’s take a look at the underlying architecture and see some of the advanced use cases it enables.
Durable Objects as programmable sidecars
Routing to containers is enabled using Durable Objects under the hood. In the examples above, the Container class from cloudflare:workers just wraps a container-enabled Durable Object and provides helper methods for common patterns. In the rest of this post, we’ll look at examples using Durable Objects directly, as this should shed light on the platform’s underlying design.
Each Durable Object acts as a programmable sidecar that can proxy requests to the container and manages its lifecycle. This allows you to control and extend your containers in ways that are hard on other platforms.
You can manually start, stop, and execute commands on a specific container by calling RPC methods on its Durable Object, which now has a new object at this.ctx.container:
class MyContainer extends DurableObject {
	// these RPC methods are callable from a Worker
        async customBoot(entrypoint, envVars) {
	            this.ctx.container.start({ entrypoint, env: envVars });
        }

       async stopContainer() {
                   const SIGTERM = 15;
	           this.ctx.container.signal(SIGTERM);
        }

        async startBackupScript() {
	            await this.ctx.container.exec(["./backup"]);
        }
}
You can also monitor your container and run hooks in response to Container status changes.
For instance, say you have a CI job that runs builds in a Container. You want to post a message to a Queue based on the exit status. You can easily program this behavior:
And lastly, if you have state that needs to be loaded into a container each time it runs, you can use status hooks to persist state from the container before it sleeps and to reload state into the container after it starts:
import { startAndWaitForPort } from "./helpers"

class MyContainer extends DurableObject {
  constructor(ctx, env) {
    super(ctx, env)
    this.ctx.blockConcurrencyWhile(async () => {
      this.ctx.storage.sql.exec('CREATE TABLE IF NOT EXISTS state (value TEXT)');
      this.ctx.storage.sql.exec('INSERT INTO state (value) SELECT '' WHERE NOT EXISTS (SELECT * FROM state)');
      await startAndWaitForPort(this.ctx.container, 8080);
      await this.setupContainer();
      this.ctx.container.monitor().then(this.onContainerExit);
    });
  }

  async setupContainer() {
    const initialState = this.ctx.storage.sql.exec('SELECT * FROM state LIMIT 1').one().value;
    return this.ctx.container
      .getTcpPort(8080)
      .fetch("http://container/state", { body: initialState, method: 'POST' });
  }

  async onContainerExit() {
    const response = await this.ctx.container
      .getTcpPort(8080)
      .fetch('http://container/state');
    const newState = await response.text();
    this.ctx.storage.sql.exec('UPDATE state SET value = ?', newState);
  }
}
Building around your Containers with Workers
Not only do Durable Objects allow you to have fine-grained control over the Container lifecycle, the whole Workers platform allows you to extend routing and scheduling behavior as you see fit.
Using Workers as an API gateway
Workers provide programmable ingress logic from over 300 locations around the world. In this sense, they provide similar functionality to an API gateway.
For instance, let’s say you want to route requests to a different version of a container based on information in a header. This is accomplished in a few lines of code:
Or you want to rate limit and authenticate requests to the container:
async fetch(request, env) {
  const url = new URL(request.url);

  if (url.pathname.startsWith('/api/')) {
    const token = request.headers.get("token");

    const isAuthenticated = await authenticateRequest(token);
    if (!isAuthenticated) {
      return new Response("Not authenticated", { status: 401 });
    }

    const { withinRateLimit } = await env.MY_RATE_LIMITER.limit({ key: token });
    if (!withinRateLimit) {
      return new Response("Rate limit exceeded for token", { status: 429 });
    }

    return env.MY_APP.fetch(request);
  }
  // ...
}
Using Workers as a service mesh
By default, Containers are private and can only be accessed via Workers, which can connect to one of many container ports. From within the container, you can expose a plain HTTP port, but requests will still be encrypted from the end user to the moment we send the data to the container’s TCP port in the host. Due to the communication being relayed through the Cloudflare network, the container does not need to set up TLS certificates to have secure connections in its open ports.
You can connect to the container through a WebSocket from the client too. See this repository for a full example of using Websockets.
Just as the Durable Object can act as proxy to the container, it can act as a proxy from the container as well. When setting up a container, you can toggle Internet access off and ensure that outgoing requests pass through Workers.
// ... when starting the container...
this.ctx.container.start({
  workersAddress: '10.0.0.2:8080',
  enableInternet: false, // 'enableInternet' is false by default
});

// ... container requests to '10.0.0.2:8080' securely route to a different service...
override async onContainerRequest(request: Request) {
 const containerId = this.env.SUB_SERVICE.idFromName(request.headers['X-Account-Id']);
 return this.env.SUB_SERVICE.get(containerId).fetch(request);
}
You can ensure all traffic in and out of your container is secured and encrypted end to end without having to deal with networking yourself.
This allows you to protect and connect containers within Cloudflare’s network… or even when connecting to external private networks.
Using Workers as an orchestrator
You might require custom scheduling and scaling logic that goes beyond what Cloudflare provides out of the box.
We don’t want you having to manage complex chains of API calls or writing an operator to get the logic you need. Just write some Worker code.
For instance, imagine your containers have a long startup period that involves loading data from an external source. You need to pre-warm containers manually, and need control over the specific region to prewarm. Additionally, you need to set up manual health checks that are accessible via Workers. You’re able to achieve this fairly simply with Workers and Durable Objects.
import { Container, DurableObject } from "cloudflare:workers";

// A singleton Durable Object to manage and scale containers

class ContainerManager extends DurableObject {
  scale(region, instanceCount) {
    for (let i = 0; i < instanceCount; i++) {
      const containerId = env.CONTAINER.idFromName(`instance-${region}-${i}`);
      // spawns a new container with a location hint
      await env.CONTAINER.get(containerId, { locationHint: region }).start();
    }
  }

  async setHealthy(containerId, isHealthy) {
    await this.ctx.storage.put(containerId, isHealthy);
  }
}

// A Container class for the underlying compute

class MyContainer extends Container {
  defaultPort = 8080;

  async onContainerStart() {
    // run healthcheck every 500ms
    await this.scheduleEvery(0.5, 'healthcheck');
  }

  async healthcheck() {
    const manager = this.env.MANAGER.get(
      this.env.MANAGER.idFromName("manager")
    );
    const id = this.ctx.id.toString();

    await this.container.fetch("/_health")
      .then(() => manager.setHealthy(id, true))
      .catch(() => manager.setHealthy(id, false));
  }
}
The ContainerManager Durable Object exposes the scale RPC call, which you can call as needed with a region and instanceCount which scales up the number of active Container instances in a given region using a location hint. The this.schedule code executes a manually defined healthcheck method on the Container and tracks its state in the Manager for use by other logic in your system.
These building blocks let users handle complex scheduling logic themselves. For a more detailed example using standard Durable Objects, see this repository.
We are excited to see the patterns you come up with when orchestrating complex applications built with containers, and trust that between Workers and Durable Objects, you’ll have the tools you need.
Integrating with more of Cloudflare’s Developer Platform
Let’s finish up by taking a quick look at how you can integrate Containers with these two tools.
Running a short-lived job with Workflows & R2
You need to download a large file from R2, compress it, and upload it. You want to ensure that this succeeds, but don’t want to write retry logic and error handling yourself. Additionally, you don’t want to deal with rotating R2 API tokens or worry about network connections — it should be secure by default.
This is a perfect opportunity for a Workflow using Containers. The container can do the heavy lifting of compressing files, Workers can stream the data to and from R2, and the Workflow can ensure durable execution.
Lastly, imagine you have an AI agent that needs to spin up cloud infrastructure (you like to live dangerously). To do this, you want to use Terraform, but since it’s run from the command line, you can’t run it on Workers.
By defining a tool, you can enable your Agent to run the shell commands from a container:
// Make tools that call to a container from an agent

const createExternalResources = tool({
  description: "runs Terraform in a container to create resources",
  parameters: z.object({ sessionId: z.number(), config: z.string() }),
  execute: async ({ sessionId, config }) => {
    return this.env.TERRAFORM_RUNNER.get(sessionId).applyConfig(config);
  },
});

// Expose RPC Methods that call to the container

class TerraformRunner extends DurableObject {
  async applyConfig(config) {
    await this.ctx.container.getTcpPort(8080).fetch(APPLY_URL, {
      method: 'POST',
      body: JSON.stringify({ config }),
    });
  }

  // ...rest of DO...
}
Containers are so much more powerful when combined with other tools. Workers make it easy to do so in a secure and simple way.
Pay for what you use and use the right tool
The deep integration between Workers and Containers also makes it easy to pick the right tool for the job with regards to cost.
With Cloudflare Containers, you only pay for what you use. Charges start when a request is sent to the container or it is manually started. Charges stop after the container goes to sleep, which can happen automatically after a configurable timeout. This makes it easy to scale to zero, and allows you to get high utilization even with highly-variable traffic.
Containers are billed for every 10ms that they are actively running at the following rates:
Memory: $0.0000025 per GB-second
CPU: $0.000020 per vCPU-second
Disk $0.00000007 per GB-second
After 1 TB of free data transfer per month, egress from a Container will be priced per-region. We’ll be working out the details between now and the beta, and will be launching with clear, transparent pricing across all dimensions so you know where you stand.
Workers are lighter weight than containers and save you money by not charging when waiting on I/O. This means that if you can, running on a Worker helps you save on cost. Luckily, on Cloudflare it is easy to route requests to the right tool.
Cost comparison
Comparing containers and functions services on paper is always going to be an apples to oranges exercise, and results can vary so much depending on use case. But to share a real example of our own, a year ago when Cloudflare acquired Baselime, Baselime was a heavy user of AWS Lambda. By moving to Cloudflare, they lowered their cloud compute bill by 80%.
Below we wanted to share one representative example that compares costs for an application that uses both containers and serverless functions together. It’d be easy for us to come up with a contrived example that uses containers sub-optimally on another platform, for the wrong types of workloads. We won’t do that here. We know that navigating cloud costs can be challenging, and that cost is a critical part of deciding what type of compute to use for which pieces of your application.
In the example below, we’ll compare Cloudflare Containers + Workers against Google Cloud Run, a very well-regarded container platform that we’ve been impressed by.
Example application
Imagine that you run an application that serves 50 million requests per month, and each request consumes an average 500 ms of wall-time. Requests to this application are not all the same though — half the requests require a container, and the other half can be served just using serverless functions.
Requests per month
Wall-time (duration)
Compute required
Cloudflare
Google Cloud
25 million
500ms
Container + serverless functions
Containers + Workers
Google Cloud Run + Google Cloud Run Functions
25 million
500ms
Serverless functions
Workers
Google Cloud Run Functions
Container pricing
On both Cloud Run and Cloudflare Containers, a container can serve multiple requests. On some platforms, such as AWS Lambda, each container instance is limited to a single request, pushing cost up significantly as request count grows. In this scenario, 50 requests can run simultaneously on a container with 4 GB memory and half of a vCPU. This means that to serve 25 million requests of 500ms each, we need 625,000 seconds worth of compute
In this example, traffic is bursty and we want to avoid paying for idle-time, so we’ll use Cloud Run’s request-based pricing.
Price per vCPU second
Price per GB-second of memory
Price per 1m requests
Monthly Price for Compute + Requests
Cloudflare Containers
$0.000020
$0.0000025
$0.30
$20.00
Google Cloud Run
$0.000024
$0.0000025
$0.40
$23.75
* Comparison does not include free tiers for either provider and uses a single Tier 1 GCP region
Compute pricing for both platforms are comparable. But as we showed earlier in this post, Containers on Cloudflare run anywhere, on-demand, without configuring and managing regions. Each container has a programmable sidecar with its own database, backed by Durable Objects. It’s the depth of integration with the rest of the platform that makes containers on Cloudflare uniquely programmable.
Function pricing
The other requests can be served with less compute, and code written in JavaScript, TypeScript, Python or Rust, so we’ll use Workers and Cloud Run Functions.
These 25 million requests also run for 500 ms each, and each request spends 480 ms waiting on I/O. This means that Workers will only charge for 20 ms of “CPU-time”, the time that the Worker actually spends using compute. This ratio of low CPU time to high wall time is extremely common when building AI apps that make inference requests, or even when just building REST APIs and other business logic. Most time is spent waiting on I/O. Based on our data, we typically see Workers use less than 5 ms of CPU time per request vs seconds of wall time (waiting on APIs or I/O).
The Cloud Run Function will use an instance with 0.083 vCPU and 128 MB memory and charge on both CPU-s and GiB-s for the full 500 ms of wall-time.
Total Price for “wall-time”
Total Price for “CPU-time”
Total Price for Compute + Requests
Cloudflare Workers
N/A
$0.83
$8.33
Google Cloud Run Functions
$1.44
N/A
$11.44
* Comparison does not include free tiers and uses a single Tier 1 GCP region.
This comparison assumes you have configured Google Cloud Run Functions with a max of 20 concurrent requests per instance. On Google Cloud Run Functions, the maximum number of concurrent requests an instance can handle varies based on the efficiency of your function, and your own tolerance for tail latency that can be introduced by traffic spikes.
Workers automatically scale horizontally, don’t require you to configure concurrency settings (and hope to get it right), and can run in over 300 locations.
A holistic view of costs
The most important cost metric is the total cost of developing and running an application. And the only way to get the best results is to use the right compute for the job. So the question boils down to friction and integration. How easily can you integrate the ideal building blocks together?
As more and more software makes use of generative AI, and makes inference requests to LLMs, modern applications must communicate and integrate with a myriad of services. Most systems are increasingly real-time and chatty, often holding open long-lived connections, performing tasks in parallel. Running an instance of an application in a VM or container and calling it a day might have worked 10 years ago, but when we talk to developers in 2025, they are most often bringing many forms of compute to the table for particular use cases.
This shows the importance of picking a platform where you can seamlessly shift traffic from one source of compute to another. If you want to rate-limit, serve server-side rendered pages, API responses and static assets, handle authentication and authorization, make inference requests to AI models, run core business logic via Workflows, or ingest streaming data, just handle the request in Workers. Save the heavier compute only for where it is actually the only option. With Cloudflare Workers and Containers, this is as simple as an if-else statement in your Worker. This makes it easy to pick the right tool for the job.
Coming June 2025
We are collecting feedback and putting the finishing touches on our APIs now, and will release the open beta to the public in late June 2025.
From day one of building Cloudflare Workers, it’s been our goal to build an integrated platform, where Cloudflare products work together as a system, rather than just as a collection of separate products. We’ve taken this same approach with Containers, and aim to make Cloudflare not only the best place to deploy containers across the globe, but the best place to deploy the types of complete applications that developers are building, that use containers in tandem with serverless functions, Workflows, Agents, and much more.
We’re excited to get this into your hands soon. Stay on the lookout this summer.
Any public certification authority (CA) can issue a certificate for any website on the Internet to allow a webserver to authenticate itself to connecting clients. Take a moment to scroll through the list of trusted CAs for your web browser (e.g., Chrome). You may recognize (and even trust) some of the names on that list, but it should make you uncomfortable that any CA on that list could issue a certificate for any website, and your browser would trust it. It’s a castle with 150 doors.
Certificate Transparency (CT) plays a vital role in the Web Public Key Infrastructure (WebPKI), the set of systems, policies, and procedures that help to establish trust on the Internet. CT ensures that all website certificates are publicly visible and auditable, helping to protect website operators from certificate mis-issuance by dishonest CAs, and helping honest CAs to detect key compromise and other failures.
In this post, we’ll discuss the history, evolution, and future of the CT ecosystem. We’ll cover some of the challenges we and others have faced in operating CT logs, and how the new static CT API log design lowers the bar for operators, helping to ensure that this critical infrastructure keeps up with the fast growth and changing landscape of the Internet and WebPKI. We’re excited to open source our Rust implementation of the new log design, built for deployment on Cloudflare’s Developer Platform, and to announce test logs deployed using this infrastructure.
What is Certificate Transparency?
In 2011, the Dutch CA DigiNotar was hacked, allowing attackers to forge a certificate for *.google.com and use it to impersonate Gmail to targeted Iranian users in an attempt to compromise personal information. Google caught this because they used certificate pinning, but that technique doesn’t scale well for the web. This, among other similar attacks, led a team at Google in 2013 to develop Certificate Transparency (CT) as a mechanism to catch mis-issued certificates. CT creates a public audit trail of all certificates issued by public CAs, helping to protect users and website owners by holding CAs accountable for the certificates they issue (even unwittingly, in the event of key compromise or software bugs). CT has been a great success: since 2013, over 17 billion certificates have been logged, and CT was awarded the prestigious Levchin Prize in 2024 for its role as a critical safety mechanism for the Internet.
Let’s take a brief look at the entities involved in the CT ecosystem. Cloudflare itself operates the Nimbus CT logs and the CT monitor powering the Merkle Towndashboard.
Certification Authorities (CAs) are organizations entrusted to issue certificates on behalf of website operators, which in turn can use those certificates to authenticate themselves to connecting clients.
CT-enforcing clients like the Chrome, Safari, and Firefox browsers are web clients that only accept certificates compliant with their CT policies. For example, a policy might require that a certificate includes proof that it has been submitted to at least two independently-operated public CT logs.
Log operators run CT logs, which are public, append-only lists of certificates. CAs and other clients can submit a certificate to a CT log to obtain a “promise” from the CT log that it will incorporate the entry into the append-only log within some grace period. CT logs periodically (every few seconds, typically) update their log state to incorporate batches of new entries, and publish a signed checkpoint that attests to the new state.
Monitors are third parties that continuously crawl CT logs and check that their behavior is correct. For instance, they verify that a log is self-consistent and append-only by ensuring that when new entries are added to the log, no previous entries are deleted or modified. Monitors may also examine logged certificates to help website operators detect mis-issuance.
Challenges in operating a CT log
Despite the success of CT, it is a less than perfect system. Eric Rescorla has an excellent writeup on the many compromises made to make CT deployable on the Internet of 2013. We’ll focus on the operational complexities of running a CT log.
Let’s look at the requirements for running a CT log from Chrome’s CT log policy (which are more or less mirrored by those of Safari and Firefox), and what can go wrong. The requirements center around integrity and availability.
To be considered a trusted auditing source, CT logs necessarily have stringent integrity requirements. Anything the log produces must be correct and self-consistent, meaning that a CT log cannot present two different views of the log to different clients, and must present a consistent history for its entire lifetime. Similarly, when a CT log accepts a certificate and promises to incorporate it by returning a Signed Certificate Timestamp (SCT) to the client, it must eventually incorporate that certificate into its append-only log.
The integrity requirements are unforgiving. A single bit-flip due to a hardware failure or cosmic ray can (andhas) caused logs to produce incorrect results and thus be disqualified by CT programs. Even software updates to running logs can be fatal, as a change that causes a correctness violation cannot simply be rolled back. Perhaps the greatest risk to individual log integrity is failing to incorporate certificates for which they issued SCTs, for example if they fail to commit those pending certificates to durable storage. See Andrew Ayer’s great synopsis for more examples of CT log failures (up to 2021).
A CT log must also meet certain availability requirements to effectively provide its core functionality as a publicly auditable log. Clients must be able to reliably retrieve log data — Chrome’s policy requires a minimum of 99% average uptime over a 90-day rolling period for each API endpoint — and any entries for which an SCT has been issued must be incorporated into the log within the grace period, called the Maximum Merge Delay (MMD), 24 hours in Chrome’s policy.
The design of the current CT log read APIs puts strain on the ability of log operators to meet uptime requirements. The API endpoints are dynamic and not easily cacheable without bespoke caching rules that are aware of the CT API. For instance, the get-entries endpoint allows a client to request arbitrary ranges of entries from a log, and the get-proof-by-hash requires the server to construct inclusion proofs for any certificate requested by the client. To serve these requests, CT log servers need to be backed by databases easily 5-10TB in size capable of serving tens of millions of requests per day. This increases operator complexity and expense, not to mention the high cost of bandwidth of serving these requests.
MMD violations are unfortunately not uncommon. Cloudflare’s own Nimbus logs have experienced prolonged outages in the past, most recently in November 2023 due to complete power loss in the datacenter running the logs. During normal log operation, if the log accepts entries more quickly than it incorporates them, the backlog can grow to exceed the MMD. Log operators can remedy this by rate-limiting or temporarily disabling the write APIs, but this can in turn contribute to violations of the uptime requirements.
The high bar for log operation has limited the organizations operating CT logs to only Cloudflare and five others! Losing one or two logs is enough to compromise the stability of the CT ecosystem. Clearly, a change is needed.
A next-generation CT log design
In May 2024, Let’s Encrypt announcedSunlight, an implementation of a next-generation CT log designed for the modern WebPKI, incorporating a decade of lessons learned from running CT and similar transparency systems. The new CT log design, called the static CT API, is partially based on the Go checksum database, and organizes log data as a series of tiles that are easy to cache and serve. The new design provides efficiency improvements that cut operation costs, help logs to meet availability requirements, and reduce the risk of integrity violations.
The static CT API is split into two parts, the monitoring APIs (so named because CT monitors are the primary clients), and the submission APIs for adding new certificates to the log.
The monitoring APIs replace the dynamic read APIs of RFC 6962, and organize log data into static, cacheable tiles. (See Russ Cox’s blog post for an in-depth explanation of tiled logs.) CT log operators can efficiently serve static tiles from S3-compatible object storage buckets and cache them using CDN infrastructure, without needing dedicated API servers. Clients can then download the necessary tiles to retrieve specific log entries or reconstruct arbitrary proofs.
The static CT API introduces another efficiency by deduplicating intermediate and root “issuer” certificates in a log entry’s certificate chain. The number of publicly-trusted issuer certificates is small (in the low thousands), so instead of storing them repeatedly for each log entry, only the issuer hash is stored. Clients can look up issuer certificates by hash from a separate endpoint.
The submission APIs remain backwards-compatible with RFC 6962, meaning that TLS clients and CAs can submit to them without any changes. However, there is one notable addition: the static CT specification requires logs to hold on to requests as it batches and sequences them, and responds with an SCT only after entries have been incorporated into the log. The specification defines a required SCT extension indicating the entry’s index in the log. At the cost of slightly delayed SCT issuance (on the order of seconds), this change eliminates one of the major pain points of operating a CT log (the Merge Delay).
Having the log index of a certificate available in an SCT enables further efficiencies. SCT auditing refers to the process by which TLS clients or monitors can check if a log has fulfilled its promise to incorporate a certificate for which it has issued an SCT. In the RFC 6962 API, checking if a certificate is present in a log when you don’t already know the index requires using the get-proof-by-hash endpoint to look up the entry by the certificate hash (and the server needs to maintain a mapping from hash to index to efficiently serve these requests). Instead, with the index immediately available in the SCT, clients can directly retrieve the specific log data tile covering that index, even with efficient privacy-preserving techniques.
Since it was announced, the static CT API has taken the CT ecosystem by storm. Aside from Sunlight and our brand new Azul (discussed below), there are at least two other independent implementations, Itko and Trillian Tessera. Several CT monitors (including crt.sh, certspotter, Censys, and our own Merkle Town) have added support for the new log format, and as of April 1, 2025, Chrome has begun accepting submissions for static CT API logs into their CT log program.
A static CT API implementation on Workers
This section discusses how we designed and built our static CT log implementation, Azul (short for azulejos, the colorful Portuguese and Spanish ceramic tiles). For curious readers and prospective CT log operators, we encourage you to follow the instructions in the repo to quickly set up your own static CT log. Questions and feedback in the form of GitHub issues are welcome!
The advent of the static CT API gave us the perfect opportunity to rethink how we run our CT logs. There were a few design decisions we made early on to shape the project.
First and foremost, we wanted to run our CT logs on our distributed global network. Especially after the painful November 2023 control plane outage, there’s been a push to deploy services on our highly available and resilient network instead of running in centralized datacenters.
Second, with Cloudflare’s deeply engrained culture of dogfooding (building Cloudflare on top of Cloudflare), we decided to implement the CT log on top of Cloudflare’s Developer Platform and Workers.
Dogfooding gives us an opportunity to find pain points in our product offerings, and to provide feedback to our development teams to improve the developer experience for everyone. We restricted ourselves to only features and default limits generally available to customers, so that we could have the same experience as an external Cloudflare developer, and would produce an implementation that anyone could deploy.
Another major design decision was to implement the CT log in Rust, a modern systems programming language with static typing and built-in memory safety that is heavily used across Cloudflare, and which already has mature (if sometimes lacking full feature parity) Workers bindings that we have used to build several production services. This also provided us with an opportunity to produce Rust crates porting Go implementations of various C2SP specifications that can be reused across other projects.
For the new logs to be deployable, they needed to be at least as performant as existing CT logs. As a point of reference, the Nimbus2025 log currently handles just over 33 million requests per day (~380/s) across the read APIs, and about 6 million per day (~70/s) across the write APIs.
Implementation
We based Azul heavily on Sunlight, a Go application built for deployment as a standalone server. As such, this section serves as a reference for translating a traditional server to Cloudflare’s serverless platform.
To start, let’s briefly review the Sunlight architecture (described in more detail in the README and original design doc). A Sunlight instance is a single Go process, serving one or multiple CT logs. It is backed by three different storage locations with different properties:
A “lock backend” which stores the current checkpoint for each log. This datastore needs to be strongly consistent, but only stores trivial amounts of data.
A per-log object storage bucket from which to serve tiles, checkpoints, and issuers to CT clients. This datastore needs to be strongly consistent, and to handle multiple terabytes of data.
A per-log deduplication cache, to return SCTs for previously-submitted (pre-)certificates. This datastore is best-effort (as duplicate entries are not fatal to log operation), and stores tens to hundreds of gigabytes of data.
Two major components handle the bulk of the CT log application logic:
A frontend HTTP server handles incoming requests to the submission APIs to add new certificates to the log, validates them, checks the deduplication cache, adds the certificate to a pool of entries to be sequenced, and waits for sequencing to complete before responding to the client.
The sequencer periodically (every 1s, by default) sequences the pool of pending entries, writes new tiles to the object backend, persists the latest checkpoint covering the new log state to the lock and object backends, and signals to waiting requests that the pool has been sequenced.
A static CT API log running on a traditional server using the Sunlight implementation.
Next, let’s look at how we can translate these components into ones suitable for deployment on Workers.
Making it work
Let’s start with the easy choices. The static CT monitoring APIs are designed to serve static, cacheable, compressible assets from object storage. The API should be highly available and have the capacity to serve any number of CT clients. The natural choice is Cloudflare R2, which provides globally consistent storage with capacity for large data volumes, customizability to configure caching and compression, and unbounded read operations.
A static CT API log running on Workers using a preliminary version of the Azul implementation which ran into performance limitations.
The static CT submission APIs are where the real challenge lies. In particular, they allow CT clients to submit certificate chains to be incorporated into the append-only log. We used Workers as the frontend for the CT log application. Workers run in data centers close to the client, scaling on demand to handle request load, making them the ideal place to run the majority of the heavyweight request handling logic, including validating requests, checking the deduplication cache (discussed below), and submitting the entry to be sequenced.
The next question was where and how we’d run the backend to handle the CT log sequencing logic, which needs to be stateful and tightly coordinated. We chose Durable Objects (DOs), a special type of stateful Cloudflare Worker where each instance has persistent storage and a unique name which can be used to route requests to it from anywhere in the world. DOs are designed to scale effortlessly for applications that can be easily broken up into self-contained units that do not need a lot of coordination across units. For example, a chat application can use one DO to control each chat room. In our model, then, each CT log is controlled by a single DO. This architecture allows us to easily run multiple CT logs within a single Workers application, but as we’ll see, the limitations of individual single-threaded DOs can easily become a bottleneck. More on this later.
With the CT log backend as a Durable Object, several other components fell into place: Durable Objects’ strongly-consistent transactional storage neatly fit the requirements for the “lock backend” to persist the log’s latest checkpoint, and we can use an alarm to trigger the log sequencing every second. We can also use location hints to place CT logs in locations geographically close to clients for reduced latency, similar to Google’s Argon and Xenon logs.
The choice of datastore for the deduplication cache proved to be non-obvious. The cache is best-effort, and intended to avoid re-sequencing entries that are already present in the log. The cache key is computed by hashing certain fields of the add-[pre-]chain request, and the cache value consists of the entry’s index in the log and the timestamp at which it was sequenced. At current log submission rates, the deduplication cache could grow in excess of 50 GB for 6 months of log data. In the Sunlight implementation, the deduplication cache is implemented as a local SQLite database, where checks against it are tightly coupled with sequencing, which ensures that duplicates from in-flight requests are correctly accounted for. However, this architecture did not translate well to Cloudflare’s architecture. The data size doesn’t comfortably fit within Durable Object Storage or single-database D1 limits, and it was too slow to directly read and write to remote storage from within the sequencing loop. Ultimately, we split the deduplication cache into two components: a local fixed-size in-memory cache for fast deduplication over short periods of time (on the order of minutes), and the other a long-term deduplication cache built on Cloudflare Workers KV a global, low-latency, eventually-consistent key-value store without storage limitations.
With this architecture, it was relatively straightforward to port the Go code to Rust, and to bring up a functional static CT log up on Workers. We’re done then, right? Not quite. Performance tests showed that the log was only capable of sequencing 20-30 new entries per second, well under the 70 per second target of existing logs. We could work around this by simply running more logs, but that puts strain on other parts of the CT ecosystem — namely on TLS clients and monitors, which need to keep state for each log. Additionally, the alarm used to trigger sequencing would often be delayed by multiple seconds, meaning that the log was failing to produce new tree heads at consistent intervals. Time to go back to the drawing board.
Making it fast
In the design thus far, we’re asking a single-threaded Durable Object instance to do a lot of multi-tasking. The DO processes incoming requests from the Frontend Worker to add entries to the sequencing pool, and must periodically sequence the pool and write state to the various storage backends. A log handling 100 requests per second needs to switch between 101 running tasks (the extra one for the sequencing), plus any async tasks like writing to remote storage — usually 10+ writes to object storage and one write to the long-term deduplication cache per sequenced entry. No wonder the sequencing task was getting delayed!
A static CT API log running on Workers using the Azul implementation with batching to improve performance.
We were able to work around these issues by adding an additional layer of DOs between the Frontend Worker and the Sequencer, which we call Batchers. The Frontend Worker uses consistent hashing on the cache key to determine which of several Batchers to submit the entry to, and the Batcher helps to reduce the number of requests to the Sequencer by buffering requests and sending them together in batches. When the batch is sequenced, the Batcher distributes the responses back to the Frontend Workers that submitted the request. The Batcher also handles writing updates to the deduplication cache, further freeing up resources for the Sequencer.
By limiting the scope of the critical block of code that needed to be run synchronously in a single DO, and leaning on the strengths of DOs by scaling horizontally where the workload allows it, we were able to drastically improve application performance. With this new architecture, the CT log application can handle upwards of 500 requests per second to the submission APIs to add new log entries, while maintaining a consistent sequencing tempo to keep per-request latency low (typically 1-2 seconds).
Developing a Workers application in Rust
One of the reasons I was excited to work on this project is that it gave me an opportunity to implement a Workers application in Rust, which I’d never done from scratch before. Not everything was smooth, but overall I would recommend the experience.
To be clear, these rough edges are expected! The Workers platform is continuously gaining new features, and it’s natural that the Rust bindings would fall behind. As more developers rely on (and contribute to, hint hint) the Rust bindings, the developer experience will continue to improve.
What is next for Certificate Transparency
The WebPKI is constantly evolving and growing, and upcoming changes, in particular shorter certificate lifetimes and larger post-quantum certificates, are going to place significantly more load on the CT ecosystem.
The CA/Browser Forum defines a set of Baseline Requirements for publicly-trusted TLS server certificates. As of 2020, the maximum certificate lifetime for publicly-trusted certificates is 398 days. However, there is a ballot measure to reduce that period to as low as 47 days by March 2029. Let’s Encrypt is going even further, and at the end of 2024 announced that they will be offering short-lived certificates with a lifetime of only six days by the end of 2025. Based on some back-of-the-envelope calculations using statistics from Merkle Town, these changes could increase the number of logged entries in the CT ecosystem by 16-20x.
If you’ve been keeping up with this blog, you’ll also know that post-quantum certificates are on the horizon, bringing with them larger signature and public key sizes. Today, a certificate with an P-256 ECDSA public key and issuer signature can be less than 1kB. Dropping in a ML-DSA44 public key and signature brings the same certificate size to 4.6 kB, assuming the SCTs use 96-byte UOVls-pkc signatures. With these choices, post-quantum certificates could require CT logs to store 4x the amount of data per log entry.
The static CT API design helps to ensure that CT logs are much better equipped to handle this increased load, especially if the load is distributed across multiple logs per operator. Our new implementation makes it easy for log operators to run CT logs on top of Cloudflare’s infrastructure, adding more operational diversity and robustness to the CT ecosystem. We welcome feedback on the design and implementation as GitHub issues, and encourage CAs and other interested parties to start submitting to and consuming from our test logs.
The collective thoughts of the interwebz
Manage Consent
To provide the best experiences, we use technologies like cookies to store and/or access device information. Consenting to these technologies will allow us to process data such as browsing behavior or unique IDs on this site. Not consenting or withdrawing consent, may adversely affect certain features and functions.
Functional
Always active
The technical storage or access is strictly necessary for the legitimate purpose of enabling the use of a specific service explicitly requested by the subscriber or user, or for the sole purpose of carrying out the transmission of a communication over an electronic communications network.
Preferences
The technical storage or access is necessary for the legitimate purpose of storing preferences that are not requested by the subscriber or user.
Statistics
The technical storage or access that is used exclusively for statistical purposes.The technical storage or access that is used exclusively for anonymous statistical purposes. Without a subpoena, voluntary compliance on the part of your Internet Service Provider, or additional records from a third party, information stored or retrieved for this purpose alone cannot usually be used to identify you.
Marketing
The technical storage or access is required to create user profiles to send advertising, or to track the user on a website or across several websites for similar marketing purposes.