Tag Archives: Cloudflare Workers

Vectorize: a vector database for shipping AI-powered applications to production, fast

Post Syndicated from Matt Silverlock original http://blog.cloudflare.com/vectorize-vector-database-open-beta/

Vectorize: a vector database for shipping AI-powered applications to production, fast

Vectorize: a vector database for shipping AI-powered applications to production, fast

Vectorize is our brand-new vector database offering, designed to let you build full-stack, AI-powered applications entirely on Cloudflare’s global network: and you can start building with it right away. Vectorize is in open beta, and is available to any developer using Cloudflare Workers.

You can use Vectorize with Workers AI to power semantic search, classification, recommendation and anomaly detection use-cases directly with Workers, improve the accuracy and context of answers from LLMs (Large Language Models), and/or bring-your-own embeddings from popular platforms, including OpenAI and Cohere.

Visit Vectorize’s developer documentation to get started, or read on if you want to better understand what vector databases do and how Vectorize is different.

Why do I need a vector database?

Machine learning models can’t remember anything: only what they were trained on.

Vector databases are designed to solve this, by capturing how an ML model represents data — including structured and unstructured text, images and audio — and storing it in a way that allows you to compare against future inputs. This allows us to leverage the power of existing machine-learning models and LLMs (Large Language Models) for content they haven’t been trained on: which, given the tremendous cost of training models, turns out to be extremely powerful.

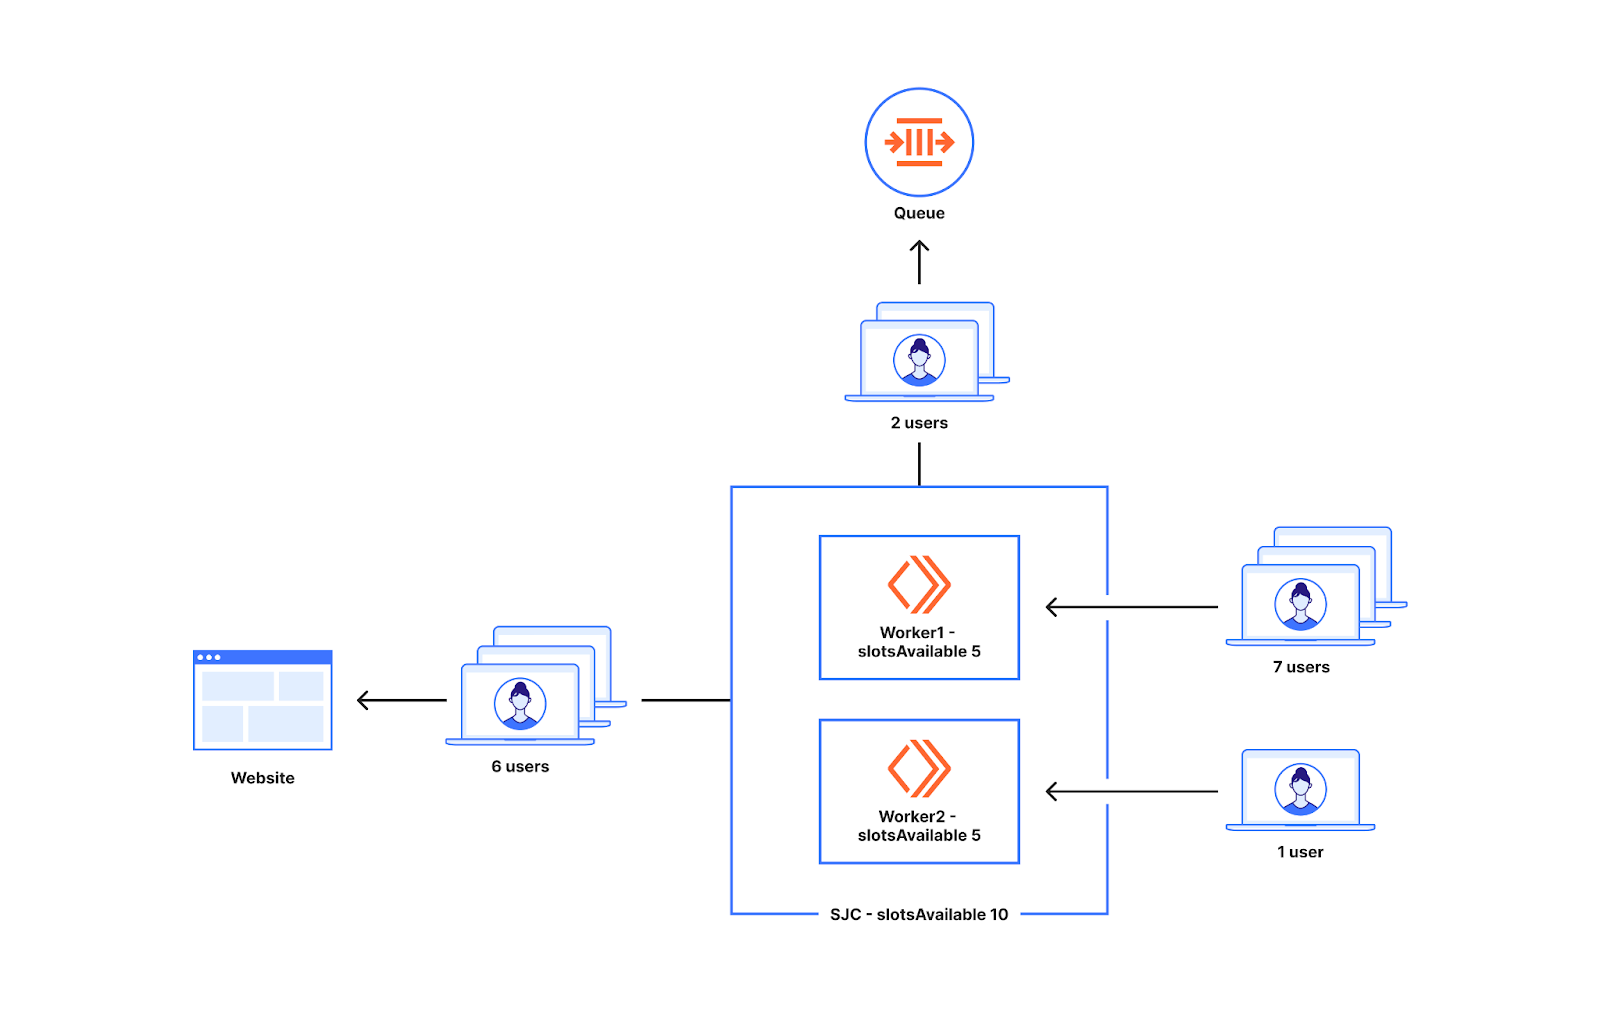
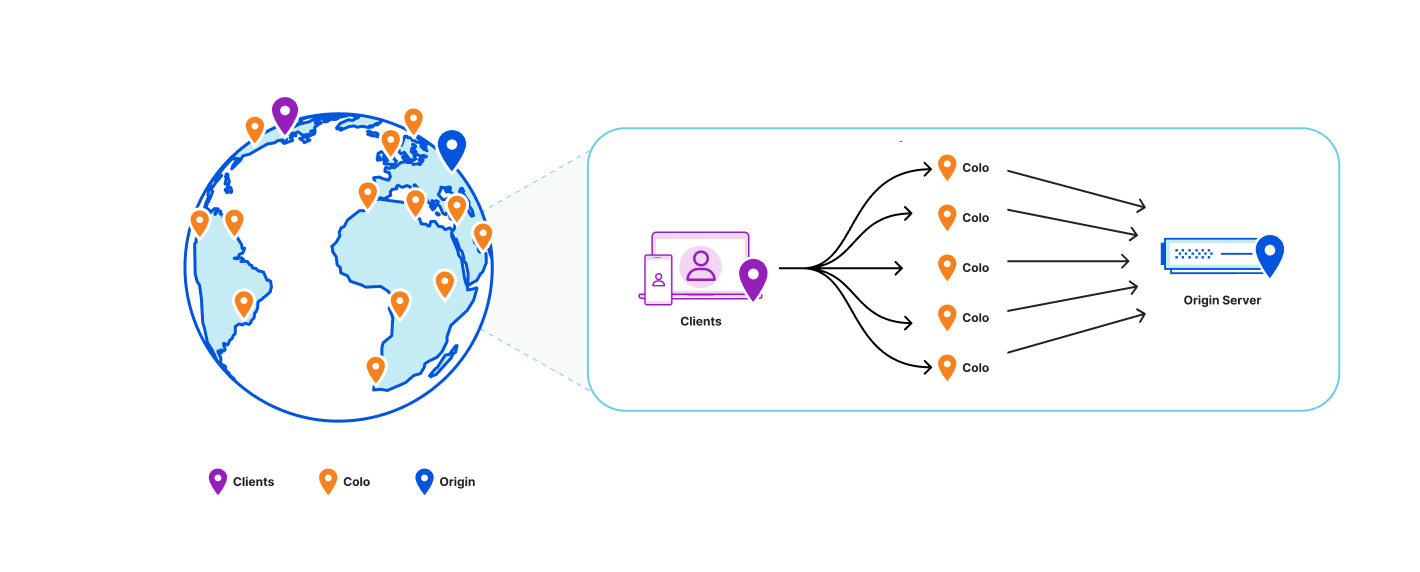
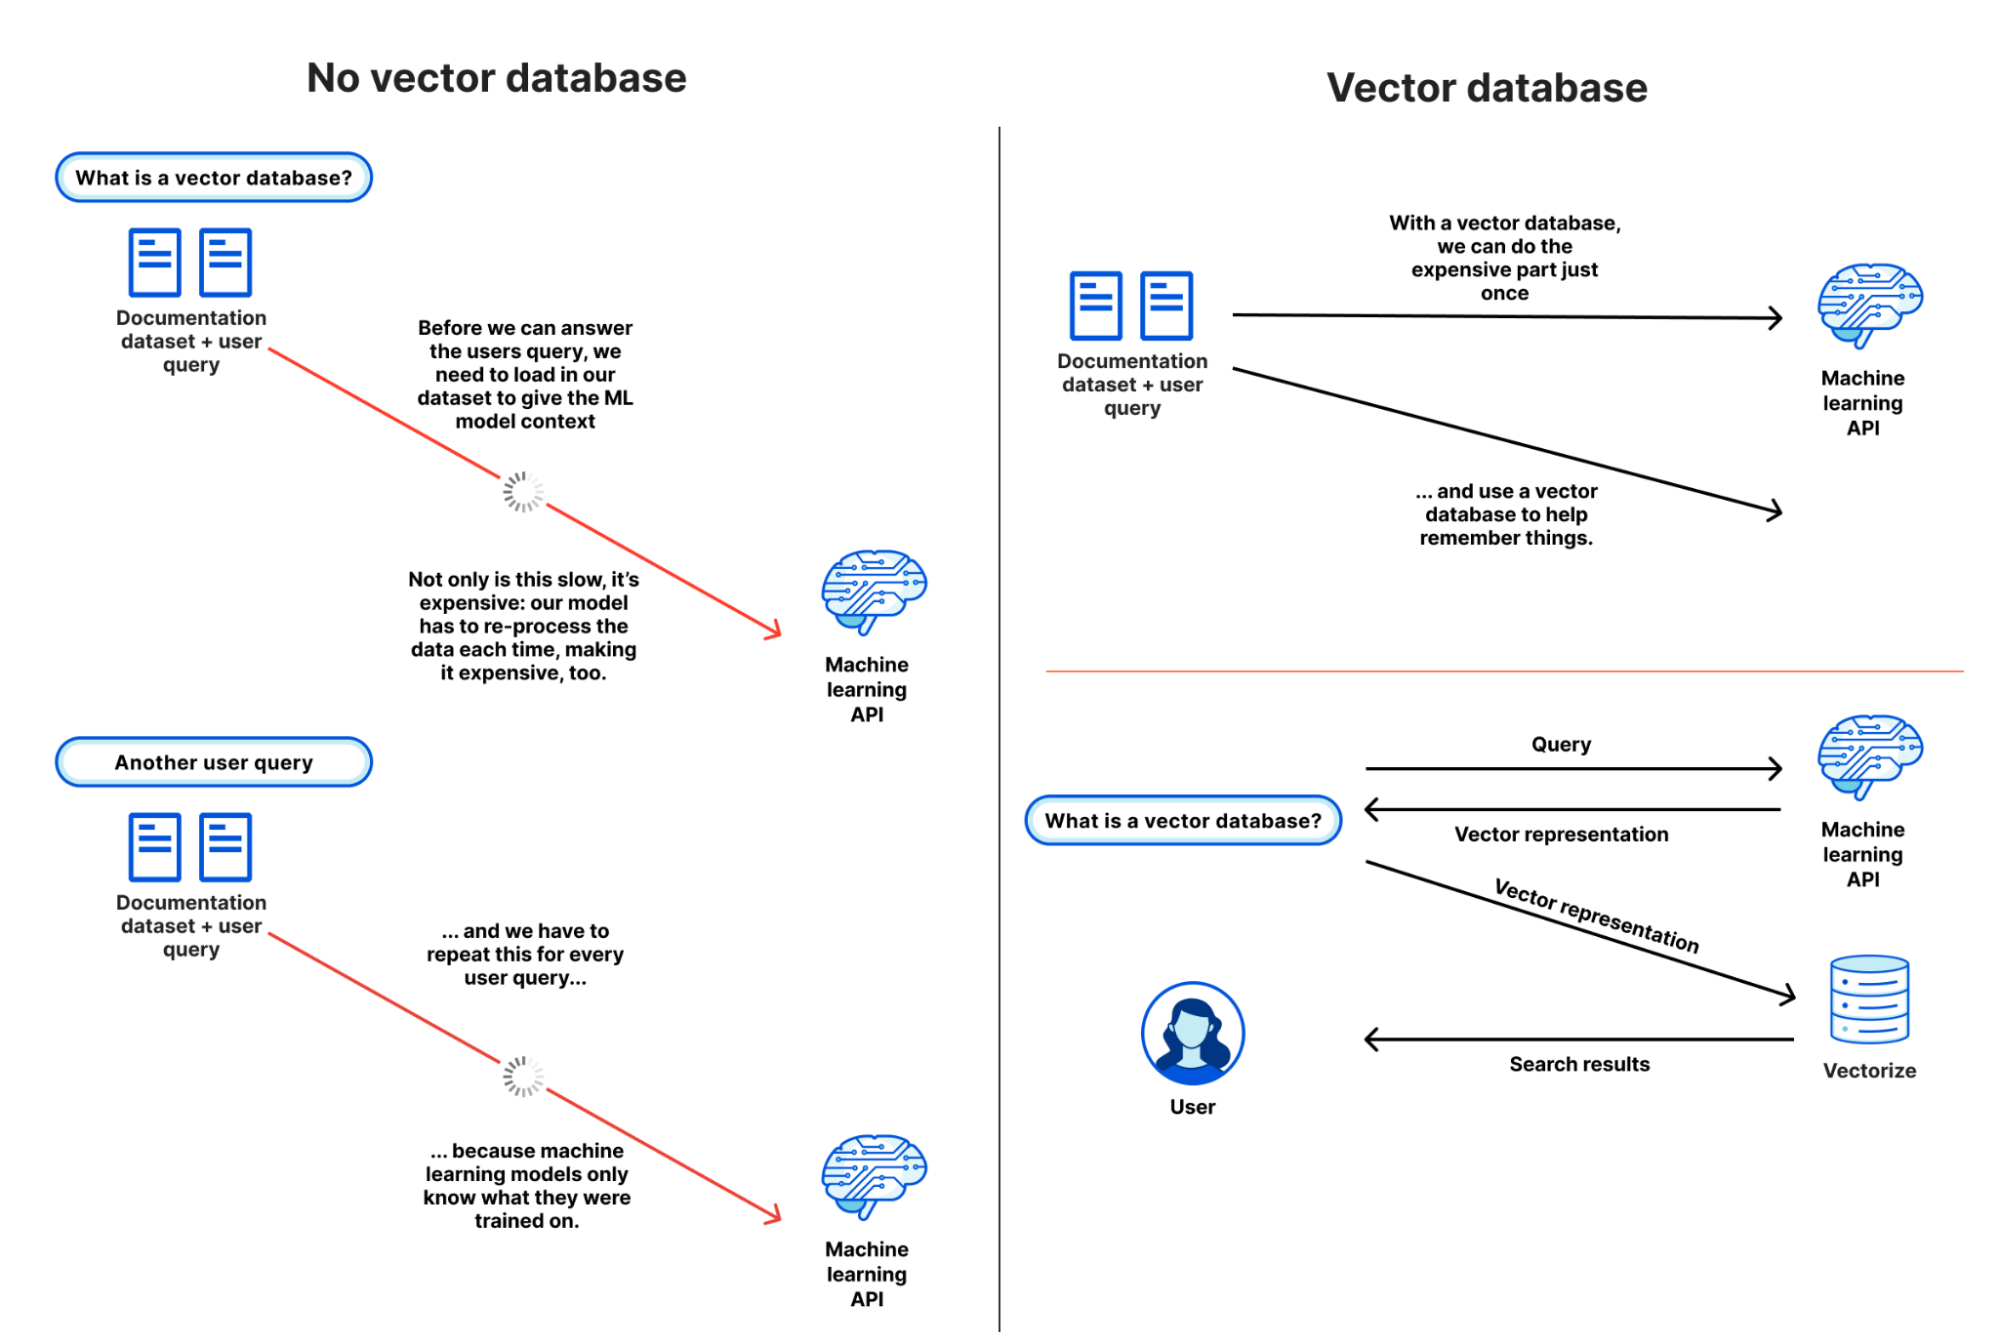
To better illustrate why a vector database like Vectorize is useful, let’s pretend they don’t exist, and see how painful it is to give context to an ML model or LLM for a semantic search or recommendation task. Our goal is to understand what content is similar to our query and return it: based on our own dataset.

  1. Our user query comes in: they’re searching for “how to write to R2 from Cloudflare Workers”
  2. We load up our entire documentation dataset — a thankfully “small” dataset at about 65,000 sentences, or 2.1 GB — and provide it alongside the query from our user. This allows the model to have the context it needs, based on our data.
  3. We wait.
  4. (A long time)
  5. We get our similarity scores back, with the sentences most similar to the user’s query, and then work to map those back to URLs before we return our search results.

… and then another query comes in, and we have to start this all over again.

In practice, this isn’t really possible: we can’t pass that much context in an API call (prompt) to most machine learning models, and even if we could, it’d take tremendous amounts of memory and time to process our dataset over-and-over again.

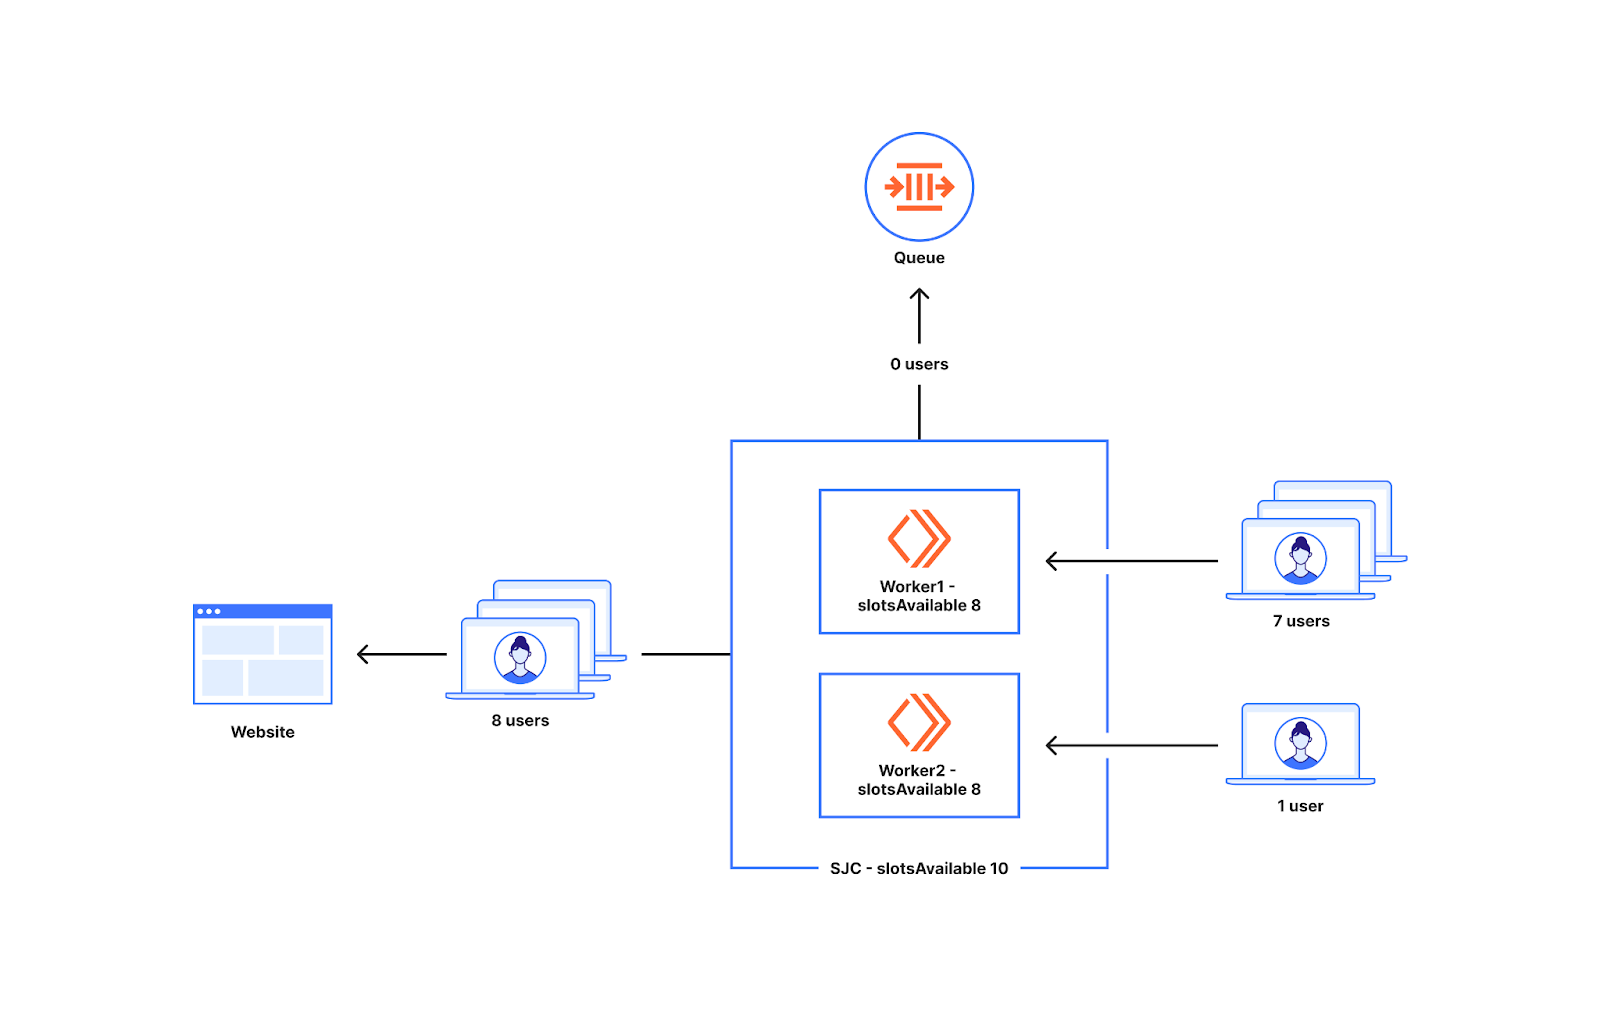
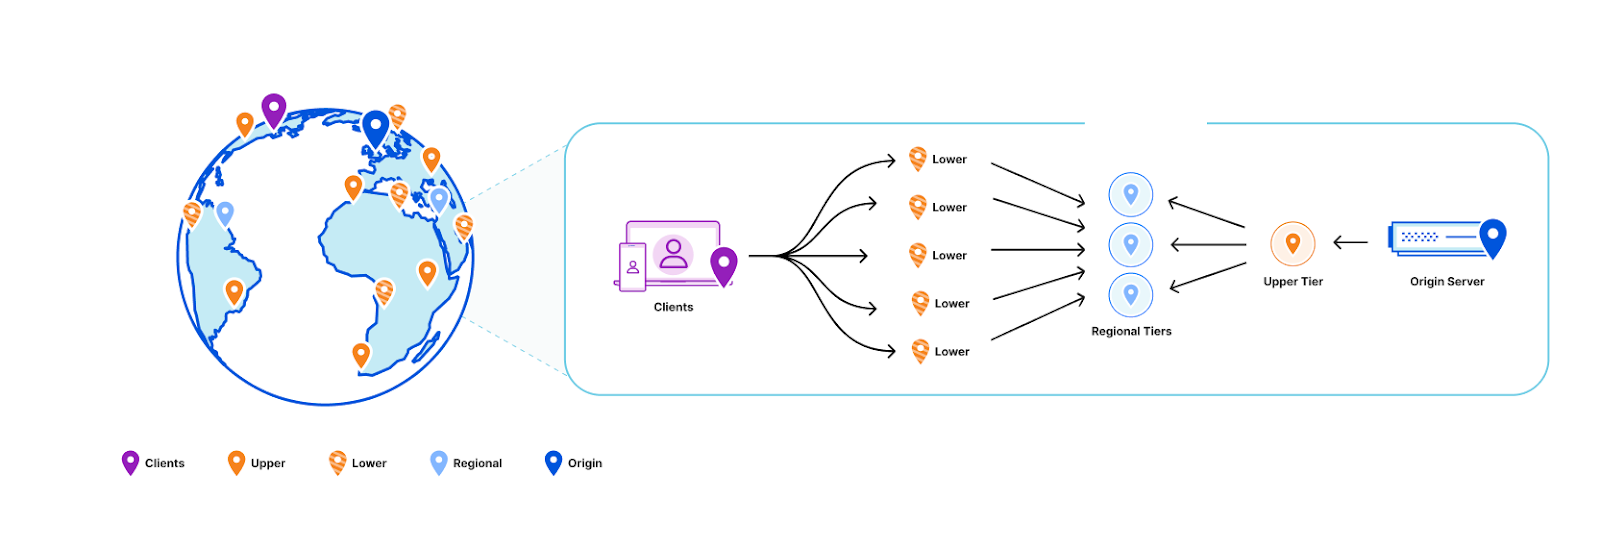
With a vector database, we don’t have to repeat step 2: we perform it once, or as our dataset updates, and use our vector database to provide a form of long-term memory for our machine learning model. Our workflow looks a little more like this:

  1. We load up our entire documentation dataset, run it through our model, and store the resulting vector embeddings in our vector database (just once).
  2. For each user query (and only the query) we ask the same model and retrieve a vector representation.
  3. We query our vector database with that query vector, which returns the vectors closest to our query vector.

If we looked at these two flows side by side, we can quickly see how inefficient and impractical it is to use our own dataset with an existing model without a vector database:

Vectorize: a vector database for shipping AI-powered applications to production, fast
Using a vector database to help machine learning models remember.

From this simple example, it’s probably starting to make some sense: but you might also be wondering why you need a vector database instead of just a regular database.

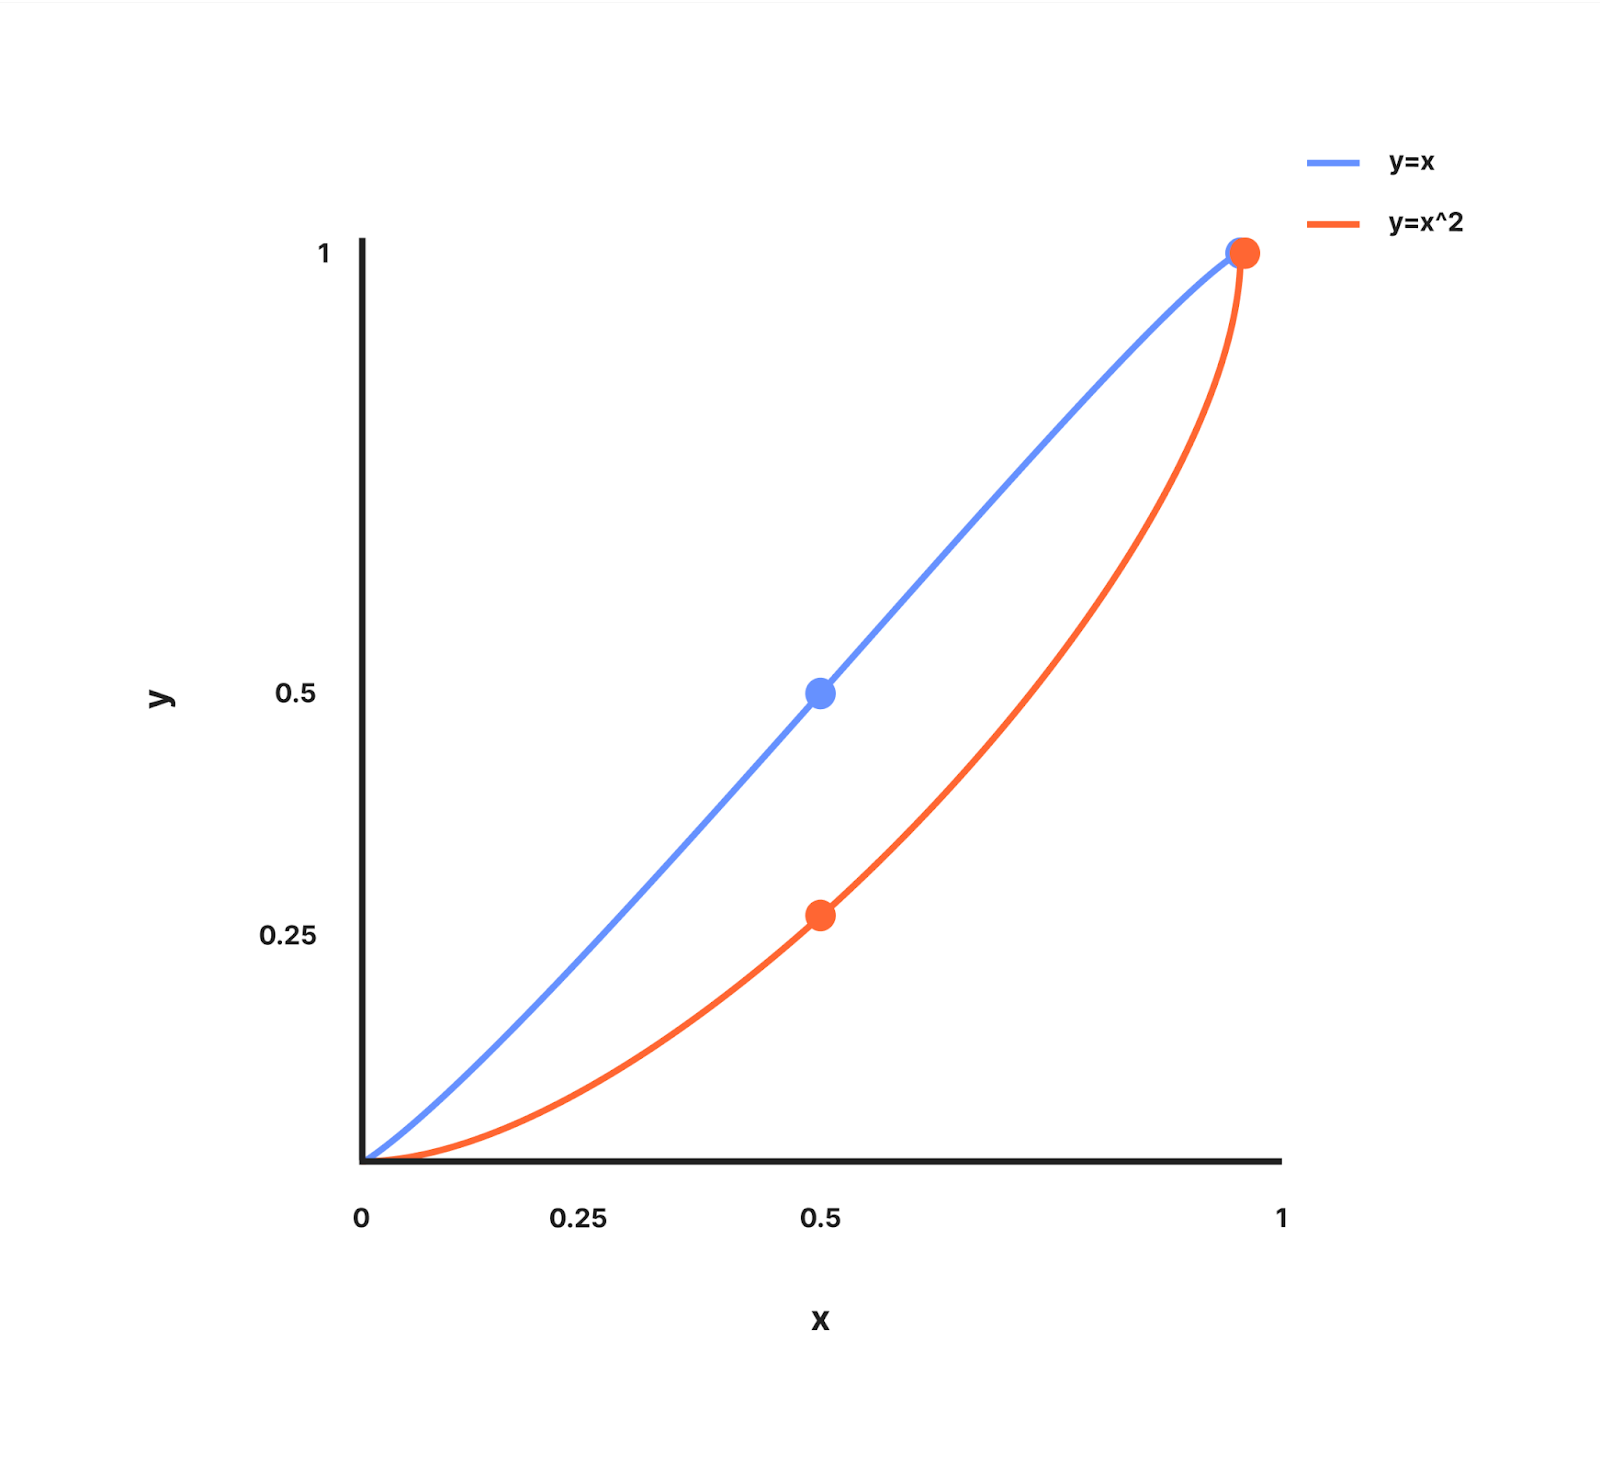
Vectors are the model’s representation of an input: how it maps that input to its internal structure, or “features”. Broadly, the more similar vectors are, the more similar the model believes those inputs to be based on how it extracts features from an input.

This is seemingly easy when we look at example vectors of only a handful of dimensions. But with real-world outputs, searching across 10,000 to 250,000 vectors, each potentially 1,536 dimensions wide, is non-trivial. This is where vector databases come in: to make search work at scale, vector databases use a specific class of algorithm, such as k-nearest neighbors (kNN) or other approximate nearest neighbor (ANN) algorithms to determine vector similarity.

And although vector databases are extremely useful when building AI and machine learning powered applications, they’re not only useful in those use-cases: they can be used for a multitude of classification and anomaly detection tasks. Knowing whether a query input is similar — or potentially dissimilar — from other inputs can power content moderation (does this match known-bad content?) and security alerting (have I seen this before?) tasks as well.

We built Vectorize to be a powerful partner to Workers AI: enabling you to run vector search tasks as close to users as possible, and without having to think about how to scale it for production.

We’re going to take a real world example — building a (product) recommendation engine for an e-commerce store — and simplify a few things.

Our goal is to show a list of “relevant products” on each product listing page: a perfect use-case for vector search. Our input vectors in the example are placeholders, but in a real world application we would generate them based on product descriptions and/or cart data by passing them through a sentence similarity model (such as Worker’s AI’s text embedding model)

Each vector represents a product across our store, and we associate the URL of the product with it. We could also set the ID of each vector to the product ID: both approaches are valid. Our query — vector search — represents the product description and content for the product user is currently viewing.

Let’s step through what this looks like in code: this example is pulled straight from our developer documentation:

export interface Env {
	// This makes our vector index methods available on env.MY_VECTOR_INDEX.*
	// e.g. env.MY_VECTOR_INDEX.insert() or .query()
	TUTORIAL_INDEX: VectorizeIndex;
}

// Sample vectors: 3 dimensions wide.
//
// Vectors from a machine-learning model are typically ~100 to 1536 dimensions
// wide (or wider still).
const sampleVectors: Array<VectorizeVector> = [
	{ id: '1', values: [32.4, 74.1, 3.2], metadata: { url: '/products/sku/13913913' } },
	{ id: '2', values: [15.1, 19.2, 15.8], metadata: { url: '/products/sku/10148191' } },
	{ id: '3', values: [0.16, 1.2, 3.8], metadata: { url: '/products/sku/97913813' } },
	{ id: '4', values: [75.1, 67.1, 29.9], metadata: { url: '/products/sku/418313' } },
	{ id: '5', values: [58.8, 6.7, 3.4], metadata: { url: '/products/sku/55519183' } },
];

export default {
	async fetch(request: Request, env: Env, ctx: ExecutionContext): Promise<Response> {
		if (new URL(request.url).pathname !== '/') {
			return new Response('', { status: 404 });
		}
		// Insert some sample vectors into our index
		// In a real application, these vectors would be the output of a machine learning (ML) model,
		// such as Workers AI, OpenAI, or Cohere.
		let inserted = await env.TUTORIAL_INDEX.insert(sampleVectors);

		// Log the number of IDs we successfully inserted
		console.info(`inserted ${inserted.count} vectors into the index`);

		// In a real application, we would take a user query - e.g. "durable
		// objects" - and transform it into a vector emebedding first.
		//
		// In our example, we're going to construct a simple vector that should
		// match vector id #5
		let queryVector: Array<number> = [54.8, 5.5, 3.1];

		// Query our index and return the three (topK = 3) most similar vector
		// IDs with their similarity score.
		//
		// By default, vector values are not returned, as in many cases the
		// vectorId and scores are sufficient to map the vector back to the
		// original content it represents.
		let matches = await env.TUTORIAL_INDEX.query(queryVector, { topK: 3, returnVectors: true });

		// We map over our results to find the most similar vector result.
		//
		// Since our index uses the 'cosine' distance metric, scores will range
		// from 1 to -1.  A value of '1' means the vector is the same; the
		// closer to 1, the more similar. Values of -1 (least similar) and 0 (no
		// match).
		// let closestScore = 0;
		// let mostSimilarId = '';
		// matches.matches.map((match) => {
		// 	if (match.score > closestScore) {
		// 		closestScore = match.score;
		// 		mostSimilarId = match.vectorId;
		// 	}
		// });

		return Response.json({
			// This will return the closest vectors: we'll see that the vector
			// with id = 5 has the highest score (closest to 1.0) as the
			// distance between it and our query vector is the smallest.
			// Return the full set of matches so we can see the possible scores.
			matches: matches,
		});
	},
};

The code above is intentionally simple, but illustrates vector search at its core: we insert vectors into our database, and query it for vectors with the smallest distance to our query vector.

Here are the results, with the values included, so we visually observe that our query vector [54.8, 5.5, 3.1] is similar to our highest scoring match: [58.799, 6.699, 3.400] returned from our search. This index uses cosine similarity to calculate the distance between vectors, which means that the closer the score to 1, the more similar a match is to our query vector.

{
  "matches": {
    "count": 3,
    "matches": [
      {
        "score": 0.999909,
        "vectorId": "5",
        "vector": {
          "id": "5",
          "values": [
            58.79999923706055,
            6.699999809265137,
            3.4000000953674316
          ],
          "metadata": {
            "url": "/products/sku/55519183"
          }
        }
      },
      {
        "score": 0.789848,
        "vectorId": "4",
        "vector": {
          "id": "4",
          "values": [
            75.0999984741211,
            67.0999984741211,
            29.899999618530273
          ],
          "metadata": {
            "url": "/products/sku/418313"
          }
        }
      },
      {
        "score": 0.611976,
        "vectorId": "2",
        "vector": {
          "id": "2",
          "values": [
            15.100000381469727,
            19.200000762939453,
            15.800000190734863
          ],
          "metadata": {
            "url": "/products/sku/10148191"
          }
        }
      }
    ]
  }
}

In a real application, we could now quickly return product recommendation URLs based on the most similar products, sorting them by their score (highest to lowest), and increasing the topK value if we want to show more. The metadata stored alongside each vector could also embed a path to an R2 object, a UUID for a row in a D1 database, or a key-value pair from Workers KV.

Workers AI + Vectorize: full stack vector search on Cloudflare

In a real application, we need a machine learning model that can both generate vector embeddings from our original dataset (to seed our database) and quickly turn user queries into vector embeddings too. These need to be from the same model, as each model represents features differently.

Here’s a compact example building an entire end-to-end vector search pipeline on Cloudflare:

import { Ai } from '@cloudflare/ai';
export interface Env {
	TEXT_EMBEDDINGS: VectorizeIndex;
	AI: any;
}
interface EmbeddingResponse {
	shape: number[];
	data: number[][];
}

export default {
	async fetch(request: Request, env: Env, ctx: ExecutionContext): Promise<Response> {
		const ai = new Ai(env.AI);
		let path = new URL(request.url).pathname;
		if (path.startsWith('/favicon')) {
			return new Response('', { status: 404 });
		}

		// We only need to generate vector embeddings just the once (or as our
		// data changes), not on every request
		if (path === '/insert') {
			// In a real-world application, we could read in content from R2 or
			// a SQL database (like D1) and pass it to Workers AI
			const stories = ['This is a story about an orange cloud', 'This is a story about a llama', 'This is a story about a hugging emoji'];
			const modelResp: EmbeddingResponse = await ai.run('@cf/baai/bge-base-en-v1.5', {
				text: stories,
			});

			// We need to convert the vector embeddings into a format Vectorize can accept.
			// Each vector needs an id, a value (the vector) and optional metadata.
			// In a real app, our ID would typicaly be bound to the ID of the source
			// document.
			let vectors: VectorizeVector[] = [];
			let id = 1;
			modelResp.data.forEach((vector) => {
				vectors.push({ id: `${id}`, values: vector });
				id++;
			});

			await env.TEXT_EMBEDDINGS.upsert(vectors);
		}

		// Our query: we expect this to match vector id: 1 in this simple example
		let userQuery = 'orange cloud';
		const queryVector: EmbeddingResponse = await ai.run('@cf/baai/bge-base-en-v1.5', {
			text: [userQuery],
		});

		let matches = await env.TEXT_EMBEDDINGS.query(queryVector.data[0], { topK: 1 });
		return Response.json({
			// We expect vector id: 1 to be our top match with a score of
			// ~0.896888444
			// We are using a cosine distance metric, where the closer to one,
			// the more similar.
			matches: matches,
		});
	},
};

The code above does four things:

  1. It passes the three sentences to Workers AI’s text embedding model (@cf/baai/bge-base-en-v1.5) and retrieves their vector embeddings.
  2. It inserts those vectors into our Vectorize index.
  3. Takes the user query and transforms it into a vector embedding via the same Workers AI model.
  4. Queries our Vectorize index for matches.

This example might look “too” simple, but in a production application, we’d only have to change two things: just insert our vectors once (or periodically via Cron Triggers), and replace our three example sentences with real data stored in R2, a D1 database, or another storage provider.

In fact, this is incredibly similar to how we run Cursor, the AI assistant that can answer questions about Cloudflare Worker: we migrated Cursor to run on Workers AI and Vectorize. We generate text embeddings from our developer documentation using its built-in text embedding model, insert them into a Vectorize index, and transform user queries on the fly via that same model.

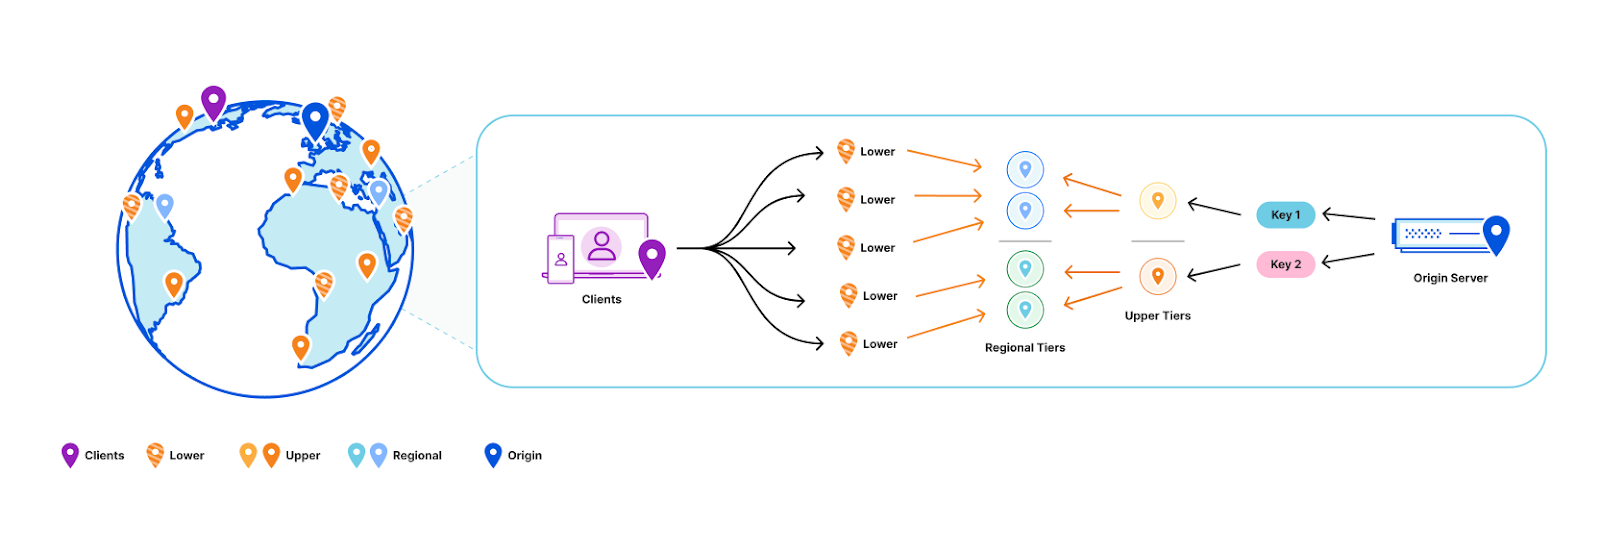
BYO embeddings from your favorite AI API

Vectorize isn’t just limited to Workers AI, though: it’s a fully-fledged, standalone vector database.

If you’re already using OpenAI’s Embedding API, Cohere’s multilingual model, or any other embedding API, then you can easily bring-your-own (BYO) vectors to Vectorize.

It works just the same: generate your embeddings, insert them into Vectorize, and pass your queries through the model before you query your index. Vectorize includes a few shortcuts for some of the most popular embedding models.

# Vectorize has ready-to-go presets that set the dimensions and distance metric for popular embeddings models
$ wrangler vectorize create openai-index-example --preset=openai-text-embedding-ada-002

This can be particularly useful if you already have an existing workflow around an existing embeddings API, and/or have validated a specific multimodal or multilingual embeddings model for your use-case.

Making the cost of AI predictable

There’s a tremendous amount of excitement around AI and ML, but there’s also one big concern: that it’s too expensive to experiment with, and hard to predict at scale.

With Vectorize, we wanted to bring a simpler pricing model to vector databases. Have an idea for a proof-of-concept at work? That should fit into our free-tier limits. Scaling up and optimizing your embedding dimensions for performance vs. accuracy? It shouldn’t break the bank.

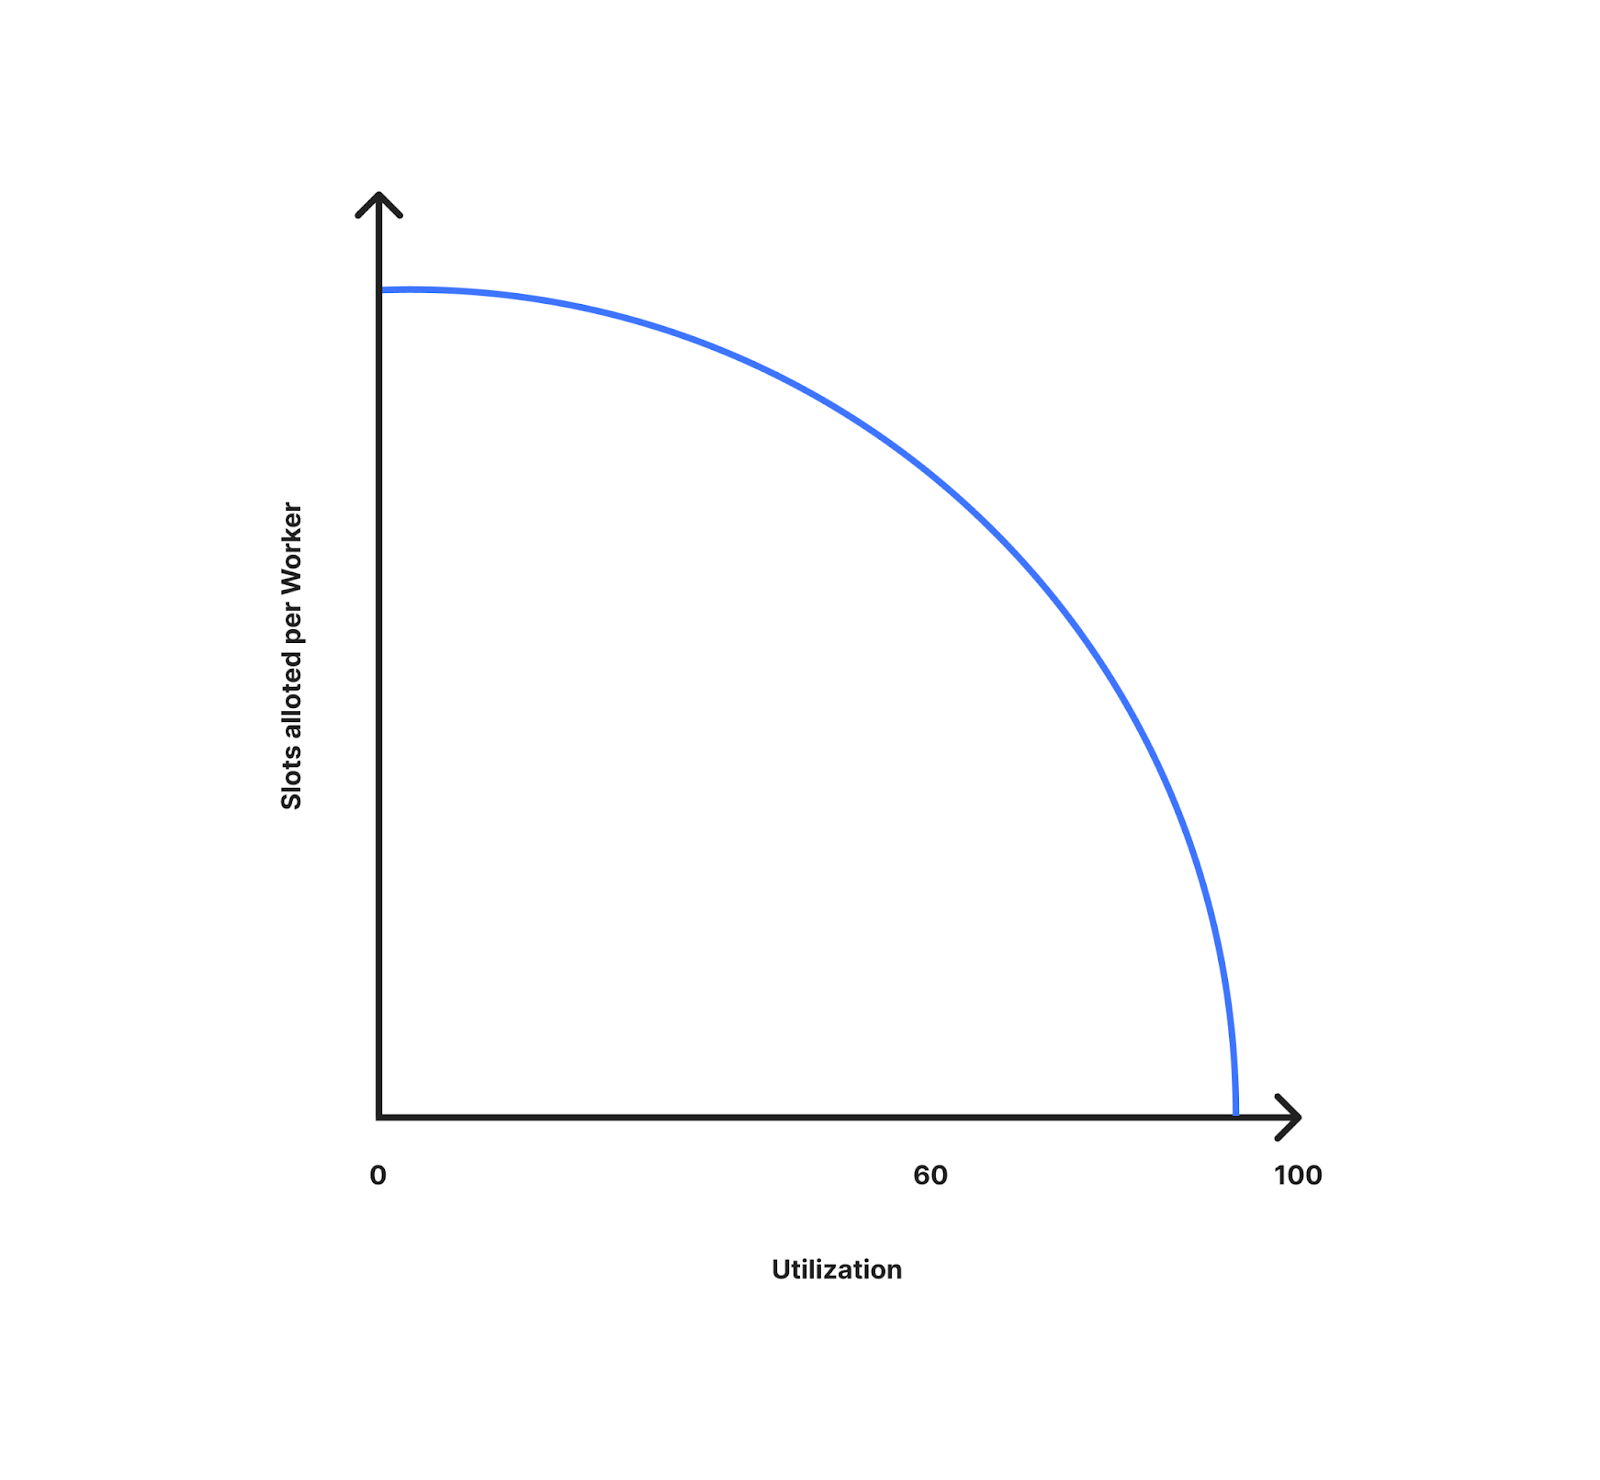
Importantly, Vectorize aims to be predictable: you don’t need to estimate CPU and memory consumption, which can be hard when you’re just starting out, and made even harder when trying to plan for your peak vs. off-peak hours in production for a brand new use-case. Instead, you’re charged based on the total number of vector dimensions you store, and the number of queries against them each month. It’s our job to take care of scaling up to meet your query patterns.

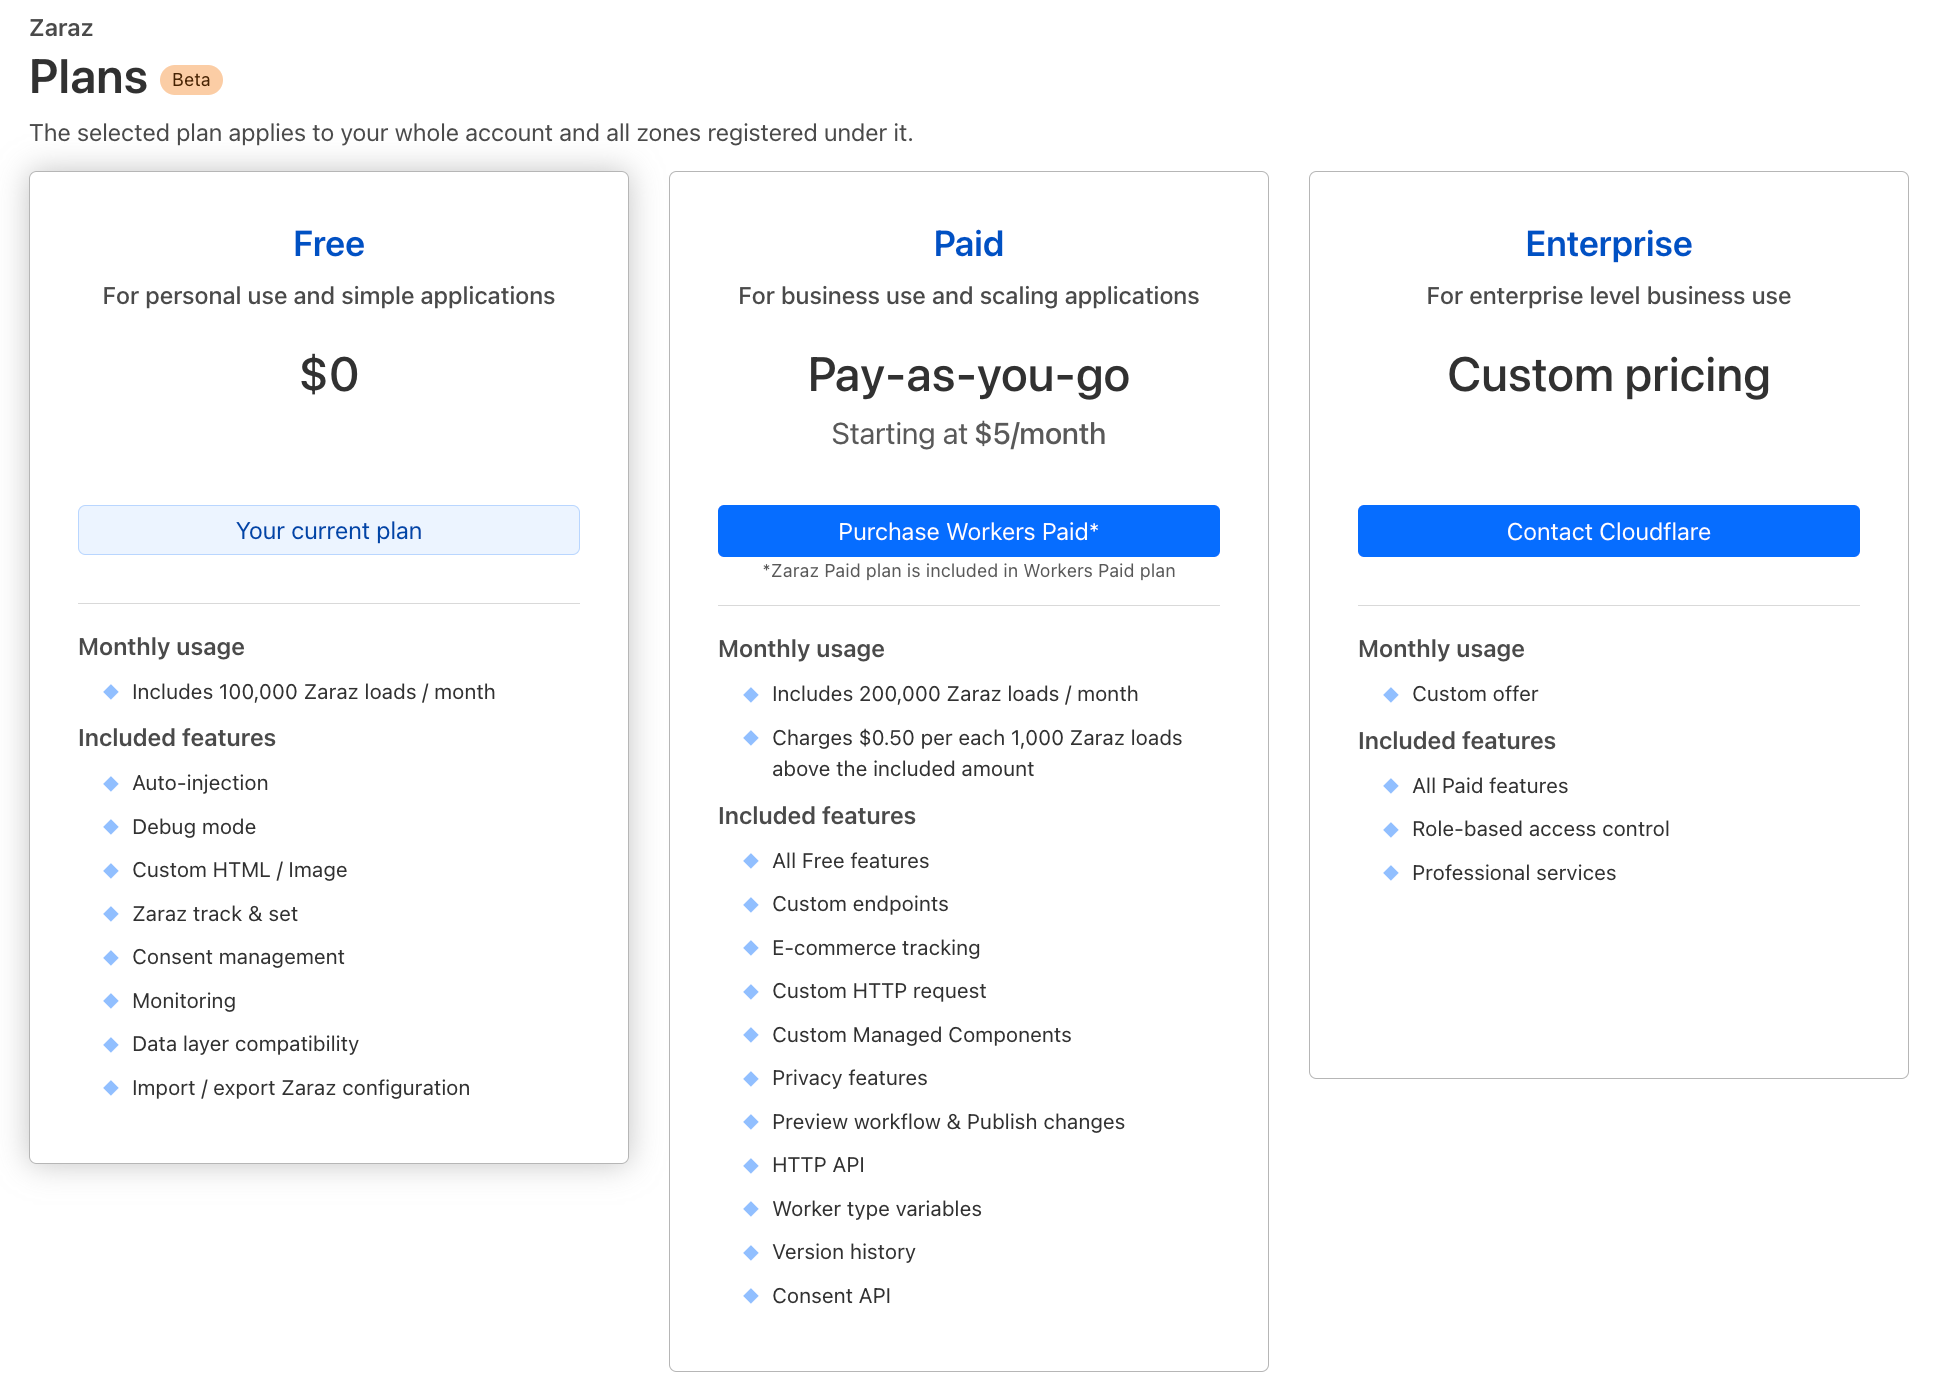
Here’s the pricing for Vectorize — and if you have a Workers paid plan now, Vectorize is entirely free to use until 2024:

Workers Free (coming soon) Workers Paid ($5/month)
Queried vector dimensions included 30M total queried dimensions / month 50M total queried dimensions / month
Stored vector dimensions included 5M stored dimensions / month 10M stored dimensions / month
Additional cost $0.04 / 1M vector dimensions queried or stored $0.04 / 1M vector dimensions queried or stored

Pricing is based entirely on what you store and query: (total vector dimensions queried + stored) * dimensions_per_vector * price. Query more? Easy to predict. Optimizing for smaller dimensions per vector to improve speed and reduce overall latency? Cost goes down. Have a few indexes for prototyping or experimenting with new use-cases? We don’t charge per-index.

Vectorize: a vector database for shipping AI-powered applications to production, fast
Create as many as you need indexes to prototype new ideas and/or separate production from dev.

As an example: if you load 10,000 Workers AI vectors (384 dimensions each) and make 5,000 queries against your index each day, it’d result in 49 million total vector dimensions queried and still fit into what we include in the Workers Paid plan ($5/month). Better still: we don’t delete your indexes due to inactivity.

Note that while this pricing isn’t final, we expect few changes going forward. We want to avoid the element of surprise: there’s nothing worse than starting to build on a platform and realizing the pricing is untenable after you’ve invested the time writing code, tests and learning the nuances of a technology.

Vectorize!

Every Workers developer on a paid plan can start using Vectorize immediately: the open beta is available right now, and you can visit our developer documentation to get started.

This is also just the beginning of the vector database story for us at Cloudflare. Over the next few weeks and months, we intend to land a new query engine that should further improve query performance, support even larger indexes, introduce sub-index filtering capabilities, increased metadata limits, and per-index analytics.

If you’re looking for inspiration on what to build, see the semantic search tutorial that combines Workers AI and Vectorize for document search, running entirely on Cloudflare. Or an example of how to combine OpenAI and Vectorize to give an LLM more context and dramatically improve the accuracy of its answers.

And if you have questions about how to use Vectorize for our product & engineering teams, or just want to bounce an idea off of other developers building on Workers AI, join the #vectorize and #workers-ai channels on our Developer Discord.

Vectorize: a vector database for shipping AI-powered applications to production, fast

What AI companies are building with Cloudflare

Post Syndicated from Veronica Marin original http://blog.cloudflare.com/ai-companies-building-cloudflare/

What AI companies are building with Cloudflare

What AI companies are building with Cloudflare

What AI applications can you build with Cloudflare? Instead of us telling you we reached out to a small handful of the numerous AI companies using Cloudflare to learn a bit about what they’re building and how Cloudflare is helping them on their journey.

We heard common themes from these companies about the challenges they face in bringing new products to market in the ever-changing world of AI ranging from training and deploying models, the ethical and moral judgements of AI, gaining the trust of users, and the regulatory landscape.  One area that is not a challenge is trusting their AI application infrastructure to Cloudflare.

Azule.ai

What AI companies are building with Cloudflare

Azule, based in Calgary, Canada, was founded to apply the power of AI to streamline and improve ecommerce customer service. It’s an exciting moment that, for the first time ever, we can now dynamically generate, deploy, and test code to meet specific user needs or integrations. This kind of flexibility is crucial to create a tool like Azule that is designed to meet this demand, offering a platform that can handle complex requirements and provide flexible integration options with other tools.

The AI space is evolving quickly and that applies to the rapid evolution of AI agent design patterns. These are essentially frameworks built upon LLM APIs, and they're showing immense potential. Azule effectively allows users to create AI agents which interact with their customers on behalf of their business. It's not just about addressing customer service queries anymore – AI agents can perform significant, ongoing tasks across various industries.

Azule is built entirely on Cloudflare, except for API calls to OpenAI.

The application relies on multiple Developer Platform and Cloudflare products and services.  Durable Objects and websockets are used for live chat.

“Durable Objects enabled us to build our MVP faster than we could have on any other platform, thanks to Cloudflare's thoughtful product design.” – Logan Grasby

Other products used by Azule:

  • Queues for data processing.
  • R2 for all data storage, including vector storage. Instead of using a vector database service, Azule relies entirely on Cloudflare's R2 and cache API for on-disk vector search.
  • Workers KV for storing frequently accessed configuration data.
  • D1 was implemented for their user database.
  • Constellation (now Workers AI) for various labeling and summarization tasks.
  • Workers for Platforms allows Azule AI to write and deploy custom features for the users.
  • Pages for hosting our landing page and marketing content.

Other valuable features used include API shield, email workers, the mail channels integration for email, log push, outbound workers, among others!

“I firmly believe that AI agents are at home on the web. Everything Cloudflare builds has web optimization in mind and so it only makes sense to invest in the platform. By building on Cloudflare, we've made significant cost reductions, particularly by moving all our search solutions to R2. For example, many of our users want to store large datasets on Azule and make them searchable through their agents. Our previous search solutions, based on Pinecone and Milisearch, would have cost thousands of dollars per month to store and search through just one customer's data. With Cloudflare's R2 and cache API, we can now enable our customer's AI agent to comb through large datasets in less than 900ms, at a fraction of the cost.” – Logan Grasby

42able.ai

42able, headquartered in Wales, UK, is at the forefront of AI-driven solutions, dedicated to revolutionizing engagement with business documents. Through cutting-edge technology and innovative strategies, the company seeks to streamline, enhance, and redefine the way businesses interact with their documents.

The modern business landscape is inundated with vast volumes of documents, from contracts and reports to invoices and internal communications. Navigating, understanding, and extracting value from these documents can be time-consuming, error-prone, and often requires significant manual effort.

42able envisions a future where business documents are not just static pieces of information but dynamic assets that businesses can engage with interactively, efficiently, and intelligently.

“Launching an AI product has come with many unique challenges and uncertainties. Users expect AI to be perfect or near-perfect, and are much less forgiving of an AI making an error compared to a human making the same mistake. Decisions about how AI systems should act often involve moral or ethical judgments, which might not be straightforward and can be subject to societal debates. Training and deploying AI models is challenging. Cloudflare's solutions are making it much easier, than managing all the individual parts ourselves.” – James Finney

42able chose Cloudflare for fantastic performance in comparison to other cloud providers, in part due to the no cold boot times, competitive pricing, ease of use, fantastic local development features, and brilliant support. Their development times have decreased through the use of:

  • Workers for all the APIs and re-occurring cron scripts.
  • Pages for all application/platform front-end hosting
  • KV for Angular apps.
  • R2 to store cached personal user data R2.
  • General DNS zone management
  • DDOS protection
  • DNS management
  • Turnstile
  • Zero Trust to secure login pages

They are starting to test with Constellation (now Workers AI) to host some of their models and D1 to support their database needs.

UseChat

What AI companies are building with Cloudflare

UseChat.ai, based in London, UK, supercharges customer support with a ChatGPT powered chatbot that knows your website and everything on it. With a custom ChatGPT chatbot, customers can get instant answers to the most common questions. When a customer needs more support, UseChat.ai will seamlessly hand over from AI to human live chat.

The fully real-time platform was built to take advantage of Workers and Durable Objects from day one. Workers & Durable Objects power the real-time chatbot, integrated with OpenAI ChatGPT API, Queues manages website content crawling, and KV stores crawled website content.

“It wouldn’t have been possible to build and scale our real-time platform as quickly as we did without Workers & Durable Objects. Knowing that a customer can embed our chatbot on their website with millions of visitors, and it will just work lets me sleep sound at night.” – Damien Tanner

Eclipse AI

What AI companies are building with Cloudflare

Eclipse’s mission is to revolutionise the way businesses approach customer feedback. Based in Melbourne, Australia, Eclipse empowers users to make data-driven decisions by leveraging AI for comprehensive customer understanding. If your goals are to; reduce churn, drive growth or improve your customer experience, Eclipse puts the data at your fingertips and provides you actionable insights to drive your business.

Eclipse allows you to unify your Voice of Customer channels (i.e. phone, video calls, emails, support tickets, public reviews and surveys), the platform analyses it at scale and utilises Generative AI to provide key actions specific to your business. Focused on democratising data driven decision-making, Eclipse AI has launched a Freemium model, leveling the playing field for businesses of all sizes to utilise this tech.

“We believe the future of the internet is on the edge and Cloudflare is at the forefront of this revolution with a growing network that covers most major cities around the world. As a startup with limited resources, the Cloudflare developer platform has enabled our dev team to focus on building our product and not be burdened with managing infrastructure. Best of all, it scales automagically with a pay-as-you-go pricing model.” – Saad Irfani

Eclipse AI uses:

  • Cloudflare Workers for the backend API.
  • Cloudflare Pages for the frontend to deliver content across hundreds of cities worldwide.
  • Cloudflare Images to serve cascaded versions of each asset
  • Cloudflare R2 as the object store.

“As a platform that transcribes video/audio call recordings for VoC analytics, choosing a reliable object-store was an important decision. After the launch of R2 we switched from S3 and noticed a staggering 70% reduction in cost. Overall, we are believers in Cloudflare’s vision and are eagerly awaiting the release of D1 so that our entire stack can be powered by the edge.” – Saad Irfani

Embley

What AI companies are building with Cloudflare

Embley, based in Sierre, Switzerland, is a Marketplace Automation Platform that powers the future of marketplace commerce by enabling businesses to scale better and faster.

The platform combines the most advanced technologies such as Artificial Intelligence and Process Mining to strengthen a fast end-to-end business process automation with products tailored to marketplaces businesses.

Cloudflare powers Embley’s frontend through Cloudflare Pages that serves what they call the “control center” to the users at the edge. The control center is the core of the back-office tools that users use to manage their marketplace operations.  The backend is powered by Workers, providing a serverless execution environment, connected to the frontend through the Cloudflare API Gateway.

“The primary reasons for choosing Cloudflare are the powerful serverless products that enable us to run an entire tech stack without having to care about infrastructure. Also, the scalability of Cloudflare’s global network is appealing. Finally, security is embedded into Cloudflare through the Zero Trust platform that enable us to secure both production but also the lower environments including the secured access to internal systems and apps.” – Laurent Christen

Chainfuse

What AI companies are building with Cloudflare

ChainFuse, based in San Francisco, CA, is a multichannel AI platform that assists organizations in collecting and analyzing user feedback on a large scale. Their AI-powered community tool aids support, community, and product teams in garnering valuable insights, facilitating more informed product decisions.

“We have used Google Cloud and AWS, but our experience with Cloudflare has particularly stood out. Since 2016, we have consistently chosen Cloudflare for our projects due to their excellent product range and reliable performance. Saying "it just works" is an understatement.” – Victor Sanchez

ChainFuse relies on Workers for the core of their backend infrastructure and a range of our security solutions to secure their applications and employees. WAF and its vast adaptability is a major defense, blocking an average of 48% of all incoming traffic, effectively weeding out known malicious traffic. Additionally, it employs rate limiting to prevent abuse. API Shield, used in conjunction with WAF, intercepts an average of 1.32% of the incoming traffic that manages to bypass WAF. The Zero Trust Gateway not only secures their employees but also is integrated into their product to prevent end users from exploiting the platform for malicious purposes.

ai.moda

ai.moda, headquartered in Grand Cayman, Cayman Islands, is building multiple AI tools with a focus on helping bridge humans, developers, and machines together. They’re currently building several ChatGPT plugins (such as CVEs and S3 storage), YourCrowd (MTurk compatible API for humans and bots), and Valkyrie (an automated zero-trust hardening for Linux applications and cloud workloads).

Plugins like CVEs by ai.moda bring real-time vulnerability information into ChatGPT.

What AI companies are building with Cloudflare

“By using Workers, we’re able to create SaaS services at a scale and cost that just wouldn’t be possible without. If you want a new ChatGPT plugin, let us know on Friday, and by Monday we can have it developed and shipped in production! The rapid development allowed by Workers is a huge advantage for us.”- David Manouchehri

They chose Cloudflare mainly because of the Workers platform. Being able to deploy new code rapidly globally with a single command has greatly simplified their DevOps needs, and they no longer need to worry about whether they have enough resources to scale up.

ai.moda is a heavy user of Cloudflare Workers, Email Workers, Pages, R2, Durable Objects, Constellation (now Workers AI), Cache API, DMARC management, Access, WAF, logpush, DNS, Health Checks, Zaraz, and D1.

We share the opinion of many of these companies that witnessing the incredible breadth and versatility of AI technology and the impact it has on organizations and people is astonishing, and we can’t wait to see where this technology takes people. If you’re inspired by reading these stories and want to start building, check out the Startup program and our Cloudflare for AI solutions.

If you want to share your story about what you’ve built, reach out to us or join the Developers Discord.

What AI companies are building with Cloudflare

***
Since launching the Launchpad program in 2022, we have showcased a number of exciting startups looking to build the next big application. Whether innovative website designs, content delivery or AI-based features, the internet is waiting for the next big thing.

With that said, we are proud to announce our revamped Built With Workers site, an opportunity to showcase your projects with the developer community. Built With Workers will serve as a public facing repository of full-stack applications running on the Developer Platform to demonstrate how Cloudflare is helping developers build amazing applications.

Whether you're using R2 object storage to store web data, utilizing Workers to manage your application functionality or designing the next big web application UI with Pages, we love seeing what our customers are building!

To showcase your latest and greatest projects featured on Built with Workers, complete and submit our quick form to share your projects or business with us. Share how you're using Cloudflare products to build the application of your dreams or help expand developer knowledge with our developer community.

How Waiting Room makes queueing decisions on Cloudflare’s highly distributed network

Post Syndicated from George Thomas original http://blog.cloudflare.com/how-waiting-room-queues/

How Waiting Room makes queueing decisions on Cloudflare's highly distributed network

How Waiting Room makes queueing decisions on Cloudflare's highly distributed network

Almost three years ago, we launched Cloudflare Waiting Room to protect our customers’ sites from overwhelming spikes in legitimate traffic that could bring down their sites. Waiting Room gives customers control over user experience even in times of high traffic by placing excess traffic in a customizable, on-brand waiting room, dynamically admitting users as spots become available on their sites. Since the launch of Waiting Room, we’ve continued to expand its functionality based on customer feedback with features like mobile app support, analytics, Waiting Room bypass rules, and more.

We love announcing new features and solving problems for our customers by expanding the capabilities of Waiting Room. But, today, we want to give you a behind the scenes look at how we have evolved the core mechanism of our product–namely, exactly how it kicks in to queue traffic in response to spikes.

How was the Waiting Room built, and what are the challenges?

The diagram below shows a quick overview of where the Waiting room sits when a customer enables it for their website.

How Waiting Room makes queueing decisions on Cloudflare's highly distributed network

Waiting Room is built on Workers that runs across a global network of Cloudflare data centers. The requests to a customer’s website can go to many different Cloudflare data centers. To optimize for minimal latency and enhanced performance, these requests are routed to the data center with the most geographical proximity. When a new user makes a request to the host/path covered by the Waiting room, the waiting room worker decides whether to send the user to the origin or the waiting room. This decision is made by making use of the waiting room state which gives an idea of how many users are on the origin.

The waiting room state changes continuously based on the traffic around the world. This information can be stored in a central location or changes can get propagated around the world eventually. Storing this information in a central location can add significant latency to each request as the central location can be really far from where the request is originating from. So every data center works with its own waiting room state which is a snapshot of the traffic pattern for the website around the world available at that point in time. Before letting a user into the website, we do not want to wait for information from everywhere else in the world as that adds significant latency to the request. This is the reason why we chose not to have a central location but have a pipeline where changes in traffic get propagated eventually around the world.

This pipeline which aggregates the waiting room state in the background is built on Cloudflare Durable Objects. In 2021, we wrote a blog talking about how the aggregation pipeline works and the different design decisions we took there if you are interested. This pipeline ensures that every data center gets updated information about changes in traffic within a few seconds.

The Waiting room has to make a decision whether to send users to the website or queue them based on the state that it currently sees. This has to be done while making sure we queue at the right time so that the customer's website does not get overloaded. We also have to make sure we do not queue too early as we might be queueing for a falsely suspected spike in traffic. Being in a queue could cause some users to abandon going to the website. Waiting Room runs on every server in Cloudflare’s network, which spans over 300 cities in more than 100 countries. We want to make sure, for every new user, the decision whether to go to the website or the queue is made with minimal latency. This is what makes the decision of when to queue a hard question for the waiting room. In this blog, we will cover how we approached that tradeoff. Our algorithm has evolved to decrease the false positives while continuing to respect the customer’s set limits.

How a waiting room decides when to queue users

The most important factor that determines when your waiting room will start queuing is how you configured the traffic settings. There are two traffic limits that you will set when configuring a waiting room–total active users and new users per minute.The total active users is a target threshold for how many simultaneous users you want to allow on the pages covered by your waiting room. New users per minute defines the target threshold for the maximum rate of user influx to your website per minute. A sharp spike in either of these values might result in queuing. Another configuration that affects how we calculate the total active users is session duration. A user is considered active for session duration minutes since the request is made to any page covered by a waiting room.

The graph below is from one of our internal monitoring tools for a customer and shows a customer's traffic pattern for 2 days. This customer has set their limits, new users per minute and total active users to 200 and 200 respectively.

How Waiting Room makes queueing decisions on Cloudflare's highly distributed network

If you look at their traffic you can see that users were queued on September 11th around 11:45. At that point in time, the total active users was around 200. As the total active users ramped down (around 12:30), the queued users progressed to 0. The queueing started again on September 11th around 15:00 when total active users got to 200. The users that were queued around this time ensured that the traffic going to the website is around the limits set by the customer.

Once a user gets access to the website, we give them an encrypted cookie which indicates they have already gained access. The contents of the cookie can look like this.

{  
  "bucketId": "Mon, 11 Sep 2023 11:45:00 GMT",
  "lastCheckInTime": "Mon, 11 Sep 2023 11:45:54 GMT",
  "acceptedAt": "Mon, 11 Sep 2023 11:45:54 GMT"
}

The cookie is like a ticket which indicates entry to the waiting room.The bucketId indicates which cluster of users this user is part of. The acceptedAt time and lastCheckInTime indicate when the last interaction with the workers was. This information can ensure if the ticket is valid for entry or not when we compare it with the session duration value that the customer sets while configuring the waiting room. If the cookie is valid, we let the user through which ensures users who are on the website continue to be able to browse the website. If the cookie is invalid, we create a new cookie treating the user as a new user and if there is queueing happening on the website they get to the back of the queue. In the next section let us see how we decide when to queue those users.

To understand this further, let's see what the contents of the waiting room state are. For the customer we discussed above, at the time "Mon, 11 Sep 2023 11:45:54 GMT", the state could look like this.

{  
  "activeUsers": 50,
}

As mentioned above the customer’s configuration has new users per minute and total active users equal to 200 and 200 respectively.

So the state indicates that there is space for the new users as there are only 50 active users when it's possible to have 200. So there is space for another 150 users to go in. Let's assume those 50 users could have come from two data centers San Jose (20 users) and London (30 users). We also keep track of the number of workers that are active across the globe as well as the number of workers active at the data center in which the state is calculated. The state key below could be the one calculated at San Jose.

{  
  "activeUsers": 50,
  "globalWorkersActive": 10,
  "dataCenterWorkersActive": 3,
  "trafficHistory": {
    "Mon, 11 Sep 2023 11:44:00 GMT": {
       San Jose: 20/200, // 10%
       London: 30/200, // 15%
       Anywhere: 150/200 // 75%
    }
  }
}

Imagine at the time "Mon, 11 Sep 2023 11:45:54 GMT", we get a request to that waiting room at a datacenter in San Jose.

To see if the user that reached San Jose can go to the origin we first check the traffic history in the past minute to see the distribution of traffic at that time. This is because a lot of websites are popular in certain parts of the world. For a lot of these websites the traffic tends to come from the same data centers.

Looking at the traffic history for the minute "Mon, 11 Sep 2023 11:44:00 GMT" we see San Jose has 20 users out of 200 users going there (10%) at that time. For the current time "Mon, 11 Sep 2023 11:45:54 GMT" we divide the slots available at the website at the same ratio as the traffic history in the past minute. So we can send 10% of 150 slots available from San Jose which is 15 users. We also know that there are three active workers as "dataCenterWorkersActive" is 3.

The number of slots available for the data center is divided evenly among the workers in the data center. So every worker in San Jose can send 15/3 users to the website. If the worker that received the traffic has not sent any users to the origin for the current minute they can send up to five users (15/3).

At the same time ("Mon, 11 Sep 2023 11:45:54 GMT"), imagine a request goes to a data center in Delhi. The worker at the data center in Delhi checks the trafficHistory and sees that there are no slots allotted for it. For traffic like this we have reserved the Anywhere slots as we are really far away from the limit.

{  
  "activeUsers":50,
  "globalWorkersActive": 10,
  "dataCenterWorkersActive": 1,
  "trafficHistory": {
    "Mon, 11 Sep 2023 11:44:00 GMT": {
       San Jose: 20/200, // 10%
       London: 30/200, // 15%
       Anywhere: 150/200 // 75%
    }
  }
}

The Anywhere slots are divided among all the active workers in the globe as any worker around the world can take a part of this pie. 75% of the remaining 150 slots which is 113.

The state key also keeps track of the number of workers (globalWorkersActive) that have spawned around the world. The Anywhere slots allotted are divided among all the active workers in the world if available. globalWorkersActive is 10 when we look at the waiting room state. So every active worker can send as many as 113/10 which is approximately 11 users. So the first 11 users that come to a worker in the minute Mon, 11 Sep 2023 11:45:00 GMT gets admitted to the origin. The extra users get queued. The extra reserved slots (5) in San Jose for minute  Mon, 11 Sep 2023 11:45:00 GMT discussed before ensures that we can admit up to 16(5 + 11) users from a worker from San Jose to the website.

Queuing at the worker level can cause users to get queued before the slots available for the data center

As we can see from the example above, we decide whether to queue or not at the worker level. The number of new users that go to workers around the world can be non-uniform. To understand what can happen when there is non-uniform distribution of traffic to two workers, let us look at the diagram below.

How Waiting Room makes queueing decisions on Cloudflare's highly distributed network

Imagine the slots available for a data center in San Jose are ten. There are two workers running in San Jose. Seven users go to worker1 and one user goes to worker2. In this situation worker1 will let in five out of the seven workers to the website and two of them get queued as worker1 only has five slots available. The one user that shows up at worker2 also gets to go to the origin. So we queue two users, when in reality ten users can get sent from the datacenter San Jose when only eight users show up.

This issue while dividing slots evenly among workers results in queueing before a waiting room’s configured traffic limits, typically within 20-30% of the limits set. This approach has advantages which we will discuss next. We have made changes to the approach to decrease the frequency with which queuing occurs outside that 20-30% range, queuing as close to limits as possible, while still ensuring Waiting Room is prepared to catch spikes. Later in this blog, we will cover how we achieved this by updating how we allocate and count slots.

What is the advantage of workers making these decisions?

The example above talked about how a worker in San Jose and Delhi makes decisions to let users through to the origin. The advantage of making decisions at the worker level is that we can make decisions without any significant latency added to the request. This is because to make the decision, there is no need to leave the data center to get information about the waiting room as we are always working with the state that is currently available in the data center. The queueing starts when the slots run out within the worker. The lack of additional latency added enables the customers to turn on the waiting room all the time without worrying about extra latency to their users.

Waiting Room’s number one priority is to ensure that customer’s sites remain up and running at all times, even in the face of unexpected and overwhelming traffic surges. To that end, it is critical that a waiting room prioritizes staying near or below traffic limits set by the customer for that room. When a spike happens at one data center around the world, say at San Jose, the local state at the data center will take a few seconds to get to Delhi.

Splitting the slots among workers ensures that working with slightly outdated data does not cause the overall limit to be exceeded by an impactful amount. For example, the activeUsers value can be 26 in the San Jose data center and 100 in the other data center where the spike is happening. At that point in time, sending extra users from Delhi may not overshoot the overall limit by much as they only have a part of the pie to start with in Delhi. Therefore, queueing before overall limits are reached is part of the design to make sure your overall limits are respected. In the next section we will cover the approaches we implemented to queue as close to limits as possible without increasing the risk of exceeding traffic limits.

Allocating more slots when traffic is low relative to waiting room limits

The first case we wanted to address was queuing that occurs when traffic is far from limits. While rare and typically lasting for one refresh interval (20s) for the end users who are queued, this was our first priority when updating our queuing algorithm. To solve this, while allocating slots we looked at the utilization (how far you are from traffic limits) and allotted more slots when traffic is really far away from the limits. The idea behind this was to prevent the queueing that happens at lower limits while still being able to readjust slots available per worker when there are more users on the origin.

To understand this let's revisit the example where there is non-uniform distribution of traffic to two workers. So two workers similar to the one we discussed before are shown below. In this case the utilization is low (10%). This means we are far from the limits. So the slots allocated(8) are closer to the slotsAvailable for the datacenter San Jose which is 10. As you can see in the diagram below, all the eight users that go to either worker get to reach the website with this modified slot allocation as we are providing more slots per worker at lower utilization levels.

How Waiting Room makes queueing decisions on Cloudflare's highly distributed network

The diagram below shows how the slots allocated per worker changes with utilization (how far you are away from limits). As you can see here, we are allocating more slots per worker at lower utilization. As the utilization increases, the slots allocated per worker decrease as it’s getting closer to the limits, and we are better prepared for spikes in traffic. At 10% utilization every worker gets close to the slots available for the data center. As the utilization is close to 100% it becomes close to the slots available divided by worker count in the data center.

How Waiting Room makes queueing decisions on Cloudflare's highly distributed network

How do we achieve more slots at lower utilization?

This section delves into the mathematics which helps us get there. If you are not interested in these details, meet us at the “Risk of over provisioning” section.

To understand this further, let's revisit the previous example where requests come to the Delhi data center. The activeUsers value is 50, so utilization is 50/200 which is around 25%.

{
  "activeUsers": 50,
  "globalWorkersActive": 10,
  "dataCenterWorkersActive": 1,
  "trafficHistory": {
    "Mon, 11 Sep 2023 11:44:00 GMT": {
       San Jose: 20/200, // 10%
       London: 30/200, // 15%
       Anywhere: 150/200 // 75%
    }
  }
}

The idea is to allocate more slots at lower utilization levels. This ensures that customers do not see unexpected queueing behaviors when traffic is far away from limits. At time Mon, 11 Sep 2023 11:45:54 GMT requests to Delhi are at 25% utilization based on the local state key.

To allocate more slots to be available at lower utilization we added a workerMultiplier which moves proportionally to the utilization. At lower utilization the multiplier is lower and at higher utilization it is close to one.

workerMultiplier = (utilization)^curveFactor
adaptedWorkerCount = actualWorkerCount * workerMultiplier

utilization – how far away from the limits you are.

curveFactor – is the exponent which can be adjusted which decides how aggressive we are with the distribution of extra budgets at lower worker counts. To understand this let's look at the graph of how y = x and y = x^2 looks between values 0 and 1.

How Waiting Room makes queueing decisions on Cloudflare's highly distributed network

The graph for y=x is a straight line passing through (0, 0) and (1, 1).

The graph for y=x^2 is a curved line where y increases slower than x when x < 1 and passes through (0, 0) and (1, 1)

Using the concept of how the curves work, we derived the formula for workerCountMultiplier where y=workerCountMultiplier, x=utilization and curveFactor is the power which can be adjusted which decides how aggressive we are with the distribution of extra budgets at lower worker counts. When curveFactor is 1, the workerMultiplier is equal to the utilization.

Let's come back to the example we discussed before and see what the value of the curve factor will be. At time Mon, 11 Sep 2023 11:45:54 GMT requests to Delhi are at 25% utilization based on the local state key. The Anywhere slots are divided among all the active workers in the globe as any worker around the world can take a part of this pie. i.e. 75% of the remaining 150 slots (113).

globalWorkersActive is 10 when we look at the waiting room state. In this case we do not divide the 113 slots by 10 but instead divide by the adapted worker count which is globalWorkersActive * workerMultiplier. If curveFactor is 1, the workerMultiplier is equal to the utilization which is at 25% or 0.25.

So effective workerCount = 10 * 0.25 = 2.5

So, every active worker can send as many as 113/2.5 which is approximately 45 users. The first 45 users that come to a worker in the minute Mon, 11 Sep 2023 11:45:00 GMT gets admitted to the origin. The extra users get queued.

Therefore, at lower utilization (when traffic is farther from the limits) each worker gets more slots. But, if the sum of slots are added up, there is a higher chance of exceeding the overall limit.

Risk of over provisioning

The method of giving more slots at lower limits decreases the chances of queuing when traffic is low relative to traffic limits. However, at lower utilization levels a uniform spike happening around the world could cause more users to go into the origin than expected. The diagram below shows the case where this can be an issue. As you can see the slots available are ten for the data center. At 10% utilization we discussed before, each worker can have eight slots each. If eight users show up at one worker and seven show up at another, we will be sending fifteen users to the website when only ten are the maximum available slots for the data center.

How Waiting Room makes queueing decisions on Cloudflare's highly distributed network

With the range of customers and types of traffic we have, we were able to see cases where this became a problem. A traffic spike from low utilization levels could cause overshooting of the global limits. This is because we are over provisioned at lower limits and this increases the risk of significantly exceeding traffic limits. We needed to implement a safer approach which would not cause limits to be exceeded while also decreasing the chance of queueing when traffic is low relative to traffic limits.

Taking a step back and thinking about our approach, one of the assumptions we had was that the traffic in a data center directly correlates to the worker count that is found in a data center. In practice what we found is that this was not true for all customers. Even if the traffic correlates to the worker count, the new users going to the workers in the data centers may not correlate. This is because the slots we allocate are for new users but the traffic that a data center sees consists of both users who are already on the website and new users trying to go to the website.

In the next section we are talking about an approach where worker counts do not get used and instead workers communicate with other workers in the data center. For that we introduced a new service which is a durable object counter.

Decrease the number of times we divide the slots by introducing Data Center Counters

From the example above, we can see that overprovisioning at the worker level has the risk of using up more slots than what is allotted for a data center. If we do not over provision at low levels we have the risk of queuing users way before their configured limits are reached which we discussed first. So there has to be a solution which can achieve both these things.

The overprovisioning was done so that the workers do not run out of slots quickly when an uneven number of new users reach a bunch of workers. If there is a way to communicate between two workers in a data center, we do not need to divide slots among workers in the data center based on worker count. For that communication to take place, we introduced counters. Counters are a bunch of small durable object instances that do counting for a set of workers in the data center.

To understand how it helps with avoiding usage of worker counts, let's check the diagram below. There are two workers talking to a Data Center Counter below. Just as we discussed before, the workers let users through to the website based on the waiting room state. The count of the number of users let through was stored in the memory of the worker before. By introducing counters, it is done in the Data Center Counter. Whenever a new user makes a request to the worker, the worker talks to the counter to know the current value of the counter. In the example below for the first new request to the worker the counter value received is 9. When a data center has 10 slots available, that will mean the user can go to the website. If the next worker receives a new user and makes a request just after that, it will get a value 10 and based on the slots available for the worker, the user will get queued.

How Waiting Room makes queueing decisions on Cloudflare's highly distributed network

The Data Center Counter acts as a point of synchronization for the workers in the waiting room. Essentially, this enables the workers to talk to each other without really talking to each other directly. This is similar to how a ticketing counter works. Whenever one worker lets someone in, they request tickets from the counter, so another worker requesting the tickets from the counter will not get the same ticket number. If the ticket value is valid, the new user gets to go to the website. So when different numbers of new users show up at workers, we will not over allocate or under allocate slots for the worker as the number of slots used is calculated by the counter which is for the data center.

The diagram below shows the behavior when an uneven number of new users reach the workers, one gets seven new users and the other worker gets one new user. All eight users that show up at the workers in the diagram below get to the website as the slots available for the data center is ten which is below ten.

How Waiting Room makes queueing decisions on Cloudflare's highly distributed network

This also does not cause excess users to get sent to the website as we do not send extra users when the counter value equals the slotsAvailable for the data center. Out of the fifteen users that show up at the workers in the diagram below ten will get to the website and five will get queued which is what we would expect.

How Waiting Room makes queueing decisions on Cloudflare's highly distributed network

Risk of over provisioning at lower utilization also does not exist as counters help workers to communicate with each other.

To understand this further, let's look at the previous example we talked about and see how it works with the actual waiting room state.

The waiting room state for the customer is as follows.

{  
  "activeUsers": 50,
  "globalWorkersActive": 10,
  "dataCenterWorkersActive": 3,
  "trafficHistory": {
    "Mon, 11 Sep 2023 11:44:00 GMT": {
       San Jose: 20/200, // 10%
       London: 30/200, // 15%
       Anywhere: 150/200 // 75%
    }
  }
}

The objective is to not divide the slots among workers so that we don’t need to use that information from the state. At time Mon, 11 Sep 2023 11:45:54 GMT requests come to San Jose. So, we can send 10% of 150 slots available from San Jose which is 15.

The durable object counter at San Jose keeps returning the counter value it is at right now for every new user that reaches the data center. It will increment the value by 1 after it returns to a worker. So the first 15 new users that come to the worker get a unique counter value. If the value received for a user is less than 15 they get to use the slots at the data center.

Once the slots available for the data center runs out, the users can make use of the slots allocated for Anywhere data-centers as these are not reserved for any particular data center. Once a worker in San Jose gets a ticket value that says 15, it realizes that it's not possible to go to the website using the slots from San Jose.

The Anywhere slots are available for all the active workers in the globe i.e. 75% of the remaining 150 slots (113). The Anywhere slots are handled by a durable object that workers from different data centers can talk to when they want to use Anywhere slots. Even if 128 (113 + 15) users end up going to the same worker for this customer we will not queue them. This increases the ability of Waiting Room to handle an uneven number of new users going to workers around the world which in turn helps the customers to queue close to the configured limits.

Why do counters work well for us?

When we built the Waiting Room, we wanted the decisions for entry into the website to be made at the worker level itself without talking to other services when the request is in flight to the website. We made that choice to avoid adding latency to user requests. By introducing a synchronization point at a durable object counter, we are deviating from that by introducing a call to a durable object counter.

However, the durable object for the data center stays within the same data center. This leads to minimal additional latency which is usually less than 10 ms. For the calls to the durable object that handles Anywhere data centers, the worker may have to cross oceans and long distances. This could cause the latency to be around 60 or 70 ms in those cases. The 95th percentile values shown below are higher because of calls that go to farther data centers.

How Waiting Room makes queueing decisions on Cloudflare's highly distributed network

The design decision to add counters adds a slight extra latency for new users going to the website. We deemed the trade-off acceptable because this reduces the number of users that get queued before limits are reached. In addition, the counters are only required when new users try to go into the website. Once new users get to the origin, they get entry directly from workers as the proof of entry is available in the cookies that the customers come with, and we can let them in based on that.

Counters are really simple services which do simple counting and do nothing else. This keeps the memory and CPU footprint of the counters minimal. Moreover, we have a lot of counters around the world handling the coordination between a subset of workers.This helps counters to successfully handle the load for the synchronization requirements from the workers. These factors add up to make counters a viable solution for our use case.

Summary

Waiting Room was designed with our number one priority in mind–to ensure that our customers’ sites remain up and running, no matter the volume or ramp up of legitimate traffic. Waiting Room runs on every server in Cloudflare’s network, which spans over 300 cities in more than 100 countries. We want to make sure, for every new user, the decision whether to go to the website or the queue is made with minimal latency and is done at the right time. This decision is a hard one as queuing too early at a data center can cause us to queue earlier than the customer set limits. Queuing too late can cause us to overshoot the customer set limits.

With our initial approach where we divide slots among our workers evenly we were sometimes queuing too early but were pretty good at respecting customer set limits. Our next approach of giving more slots at low utilization (low traffic levels compared to customer limits) ensured that we did better at the cases where we queued earlier than the customer set limits as every worker has more slots to work with at each worker. But as we have seen, this made us more likely to overshoot when a sudden spike in traffic occurred after a period of low utilization.

With counters we are able to get the best of both worlds as we avoid the division of slots by worker counts. Using counters we are able to ensure that we do not queue too early or too late based on the customer set limits. This comes at the cost of a little bit of latency to every request from a new user which we have found to be negligible and creates a better user experience than getting queued early.

We keep iterating on our approach to make sure we are always queuing people at the right time and above all protecting your website. As more and more customers are using the waiting room, we are learning more about different types of traffic and that is helping the product be better for everyone.

Improving Worker Tail scalability

Post Syndicated from Joshua Johnson original http://blog.cloudflare.com/improving-worker-tail-scalability/

Improving Worker Tail scalability

Improving Worker Tail scalability

Being able to get real-time information from applications in production is extremely important. Many times software passes local testing and automation, but then users report that something isn’t working correctly. Being able to quickly see what is happening, and how often, is critical to debugging.

This is why we originally developed the Workers Tail feature – to allow developers the ability to view requests, exceptions, and information for their Workers and to provide a window into what’s happening in real time. When we developed it, we also took the opportunity to build it on top of our own Workers technology using products like Trace Workers and Durable Objects. Over the last couple of years, we’ve continued to iterate on this feature – allowing users to quickly access logs from the Dashboard and via Wrangler CLI.

Today, we’re excited to announce that tail can now be enabled for Workers at any size and scale! In addition to telling you about the new and improved scalability, we wanted to share how we built it, and the changes we made to enable it to scale better.

Why Tail was limited

Tail leverages Durable Objects to handle coordination between the Worker producing messages and consumers like wrangler and the Cloudflare dashboard, and Durable Objects are a great choice for handling real-time communication like this. However, when a single Durable Object instance starts to receive a very high volume of traffic – like the kind that can come with tailing live Workers – it can see some performance issues.

As a result, Workers with a high volume of traffic could not be supported by the original Tail infrastructure. Tail had to be limited to Workers receiving 100 requests/second (RPS) or less. This was a significant limitation that resulted in many users with large, high-traffic Workers having to turn to their own tooling to get proper observability in production.

Believing that every feature we provide should scale with users during their development journey, we set out to improve Tail's performance at high loads.

Updating the way filters work

The first improvement was to the existing filtering feature. When starting a Tail with wrangler tail (and now with the Cloudflare dashboard) users have the ability to filter out messages based on information in the requests or logs.
Previously, this filtering was handled within the Durable Object, which meant that even if a user was filtering out the majority of their traffic, the Durable Object would still have to handle every message. Often users with high traffic Tails were using many filters to better interpret their logs, but wouldn’t be able to start a Tail due to the 100 RPS limit.

We moved filtering out of the Durable Object and into the Tail message producer, preventing any filtered messages from reaching the Tail Durable Object, and thereby reducing the load on the Tail Durable Object. Moving the filtering out of the Durable Object was the first step in improving Tail’s performance at scale.

Sampling logs to keep Tails within Durable Object limits

After moving log filtering outside of the Durable Object, there was still the issue of determining when Tails could be started since there was no way to determine to what degree filters would reduce traffic for a given Tail, and simply starting a Durable Object back up would mean that it more than likely hit the 100 RPS limit immediately.

The solution for this was to add a safety mechanism for the Durable Object while the Tail was running.

We created a simple controller to track the RPS hitting a Durable Object and sample messages until the desired volume of 100 RPS is reached. As shown below, sampling keeps the Tail Durable Object RPS below the target of 100.

Improving Worker Tail scalability

When messages are sampled, the following message appears every five seconds to let the user know that they are in sampling mode:

Improving Worker Tail scalability

This message goes away once the Tail is stopped or filters are applied that drop the RPS below 100.

A final failsafe

Finally as a last resort a failsafe mechanism was added in the case the Durable Object gets fully overloaded. Since RPS tracking is done within the Durable Object, if the Durable Object is overloaded due to an extremely large amount of traffic, the sampling mechanism will fail.

In the case that an overload is detected, all messages forwarded to the Durable Object are stopped periodically to prevent any issues with Workers infrastructure.

Improving Worker Tail scalability

Here we can see a user who had a large amount of traffic that started to become sampled. As the traffic increased, the number of sampled messages grew. Since the traffic was too fast for the sampling mechanism to handle, the Durable Object got overloaded. However, soon excess messages were blocked and the overload stopped.

Try it out

These new improvements are in place currently and available to all users 🎉

To Tail Workers via the Dashboard, log in, navigate to your Worker, and click on the Logs tab. You can then start a log stream via the default view.

Improving Worker Tail scalability

If you’re using the Wrangler CLI, you can start a new Tail by running wrangler tail.

Beyond Worker tail

While we're excited for tail to be able to reach new limits and scale, we also recognize users may want to go beyond the live logs provided by Tail.

For example, if you’d like to push log events to additional destinations for a historical view of your application’s performance, we offer Logpush. If you’d like more insight into and control over log messages and events themselves, we offer Tail Workers.

These products, and others, can be read about in our Logs documentation. All of them are available for use today.

Wasm core dumps and debugging Rust in Cloudflare Workers

Post Syndicated from Sven Sauleau original http://blog.cloudflare.com/wasm-coredumps/

Wasm core dumps and debugging Rust in Cloudflare Workers

Wasm core dumps and debugging Rust in Cloudflare Workers

A clear sign of maturing for any new programming language or environment is how easy and efficient debugging them is. Programming, like any other complex task, involves various challenges and potential pitfalls. Logic errors, off-by-ones, null pointer dereferences, and memory leaks are some examples of things that can make software developers desperate if they can't pinpoint and fix these issues quickly as part of their workflows and tools.

WebAssembly (Wasm) is a binary instruction format designed to be a portable and efficient target for the compilation of high-level languages like Rust, C, C++, and others. In recent years, it has gained significant traction for building high-performance applications in web and serverless environments.

Cloudflare Workers has had first-party support for Rust and Wasm for quite some time. We've been using this powerful combination to bootstrap and build some of our most recent services, like D1, Constellation, and Signed Exchanges, to name a few.

Using tools like Wrangler, our command-line tool for building with Cloudflare developer products, makes streaming real-time logs from our applications running remotely easy. Still, to be honest, debugging Rust and Wasm with Cloudflare Workers involves a lot of the good old time-consuming and nerve-wracking printf'ing strategy.

What if there’s a better way? This blog is about enabling and using Wasm core dumps and how you can easily debug Rust in Cloudflare Workers.

What are core dumps?

In computing, a core dump consists of the recorded state of the working memory of a computer program at a specific time, generally when the program has crashed or otherwise terminated abnormally. They also add things like the processor registers, stack pointer, program counter, and other information that may be relevant to fully understanding why the program crashed.

In most cases, depending on the system’s configuration, core dumps are usually initiated by the operating system in response to a program crash. You can then use a debugger like gdb to examine what happened and hopefully determine the cause of a crash. gdb allows you to run the executable to try to replicate the crash in a more controlled environment, inspecting the variables, and much more. The Windows' equivalent of a core dump is a minidump. Other mature languages that are interpreted, like Python, or languages that run inside a virtual machine, like Java, also have their ways of generating core dumps for post-mortem analysis.

Core dumps are particularly useful for post-mortem debugging, determining the conditions that lead to a failure after it has occurred.

WebAssembly core dumps

WebAssembly has had a proposal for implementing core dumps in discussion for a while. It's a work-in-progress experimental specification, but it provides basic support for the main ideas of post-mortem debugging, including using the DWARF (debugging with attributed record formats) debug format, the same that Linux and gdb use. Some of the most popular Wasm runtimes, like Wasmtime and Wasmer, have experimental flags that you can enable and start playing with Wasm core dumps today.

If you run Wasmtime or Wasmer with the flag:

--coredump-on-trap=/path/to/coredump/file

The core dump file will be emitted at that location path if a crash happens. You can then use tools like wasmgdb to inspect the file and debug the crash.

But let's dig into how the core dumps are generated in WebAssembly, and what’s inside them.

How are Wasm core dumps generated

(and what’s inside them)

When WebAssembly terminates execution due to abnormal behavior, we say that it entered a trap. With Rust, examples of operations that can trap are accessing out-of-bounds addresses or a division by zero arithmetic call. You can read about the security model of WebAssembly to learn more about traps.

The core dump specification plugs into the trap workflow. When WebAssembly crashes and enters a trap, core dumping support kicks in and starts unwinding the call stack gathering debugging information. For each frame in the stack, it collects the function parameters and the values stored in locals and in the stack, along with binary offsets that help us map to exact locations in the source code. Finally, it snapshots the memory and captures information like the tables and the global variables.

DWARF is used by many mature languages like C, C++, Rust, Java, or Go. By emitting DWARF information into the binary at compile time a debugger can provide information such as the source name and the line number where the exception occurred, function and argument names, and more. Without DWARF, the core dumps would be just pure assembly code without any contextual information or metadata related to the source code that generated it before compilation, and they would be much harder to debug.

WebAssembly uses a (lighter) version of DWARF that maps functions, or a module and local variables, to their names in the source code (you can read about the WebAssembly name section for more information), and naturally core dumps use this information.

All this information for debugging is then bundled together and saved to the file, the core dump file.

The core dump structure has multiple sections, but the most important are:

  • General information about the process;
  • The threads and their stack frames (note that WebAssembly is single threaded in Cloudflare Workers);
  • A snapshot of the WebAssembly linear memory or only the relevant regions;
  • Optionally, other sections like globals, data, or table.

Here’s the thread definition from the core dump specification:

corestack   ::= customsec(thread-info vec(frame))
thread-info ::= 0x0 thread-name:name ...
frame       ::= 0x0 ... funcidx:u32 codeoffset:u32 locals:vec(value)
                stack:vec(value)

A thread is a custom section called corestack. A corestack section contains the thread name and a vector (or array) of frames. Each frame contains the function index in the WebAssembly module (funcidx), the code offset relative to the function's start (codeoffset), the list of locals, and the list of values in the stack.

Values are defined as follows:

value ::= 0x01       => ∅
        | 0x7F n:i32 => n
        | 0x7E n:i64 => n
        | 0x7D n:f32 => n
        | 0x7C n:f64 => n

At the time of this writing these are the possible numbers types in a value. Again, we wanted to describe the basics; you should track the full specification to get more detail or find information about future changes. WebAssembly core dump support is in its early stages of specification and implementation, things will get better, things might change.

This is all great news. Unfortunately, however, the Cloudflare Workers runtime doesn’t support WebAssembly core dumps yet. There is no technical impediment to adding this feature to workerd; after all, it's based on V8, but since it powers a critical part of our production infrastructure and products, we tend to be conservative when it comes to adding specifications or standards that are still considered experimental and still going through the definitions phase.

So, how do we get core Wasm dumps in Cloudflare Workers today?

Polyfilling

Polyfilling means using userland code to provide modern functionality in older environments that do not natively support it. Polyfills are widely popular in the JavaScript community and the browser environment; they've been used extensively to address issues where browser vendors still didn't catch up with the latest standards, or when they implement the same features in different ways, or address cases where old browsers can never support a new standard.

Meet wasm-coredump-rewriter, a tool that you can use to rewrite a Wasm module and inject the core dump runtime functionality in the binary. This runtime code will catch most traps (exceptions in host functions are not yet catched and memory violation not by default) and generate a standard core dump file. To some degree, this is similar to how Binaryen's Asyncify works.

Let’s look at code and see how this works. He’s some simple pseudo code:

export function entry(v1, v2) {
    return addTwo(v1, v2)
}

function addTwo(v1, v2) {
  res = v1 + v2;
  throw "something went wrong";

  return res
}

An imaginary compiler could take that source and generate the following Wasm binary code:

  (func $entry (param i32 i32) (result i32)
    (local.get 0)
    (local.get 1)
    (call $addTwo)
  )

  (func $addTwo (param i32 i32) (result i32)
    (local.get 0)
    (local.get 1)
    (i32.add)
    (unreachable) ;; something went wrong
  )

  (export "entry" (func $entry))

“;;” is used to denote a comment.

entry() is the Wasm function exported to the host. In an environment like the browser, JavaScript (being the host) can call entry().

Irrelevant parts of the code have been snipped for brevity, but this is what the Wasm code will look like after wasm-coredump-rewriter rewrites it:

  (func $entry (type 0) (param i32 i32) (result i32)
    ...
    local.get 0
    local.get 1
    call $addTwo ;; see the addTwo function bellow
    global.get 2 ;; is unwinding?
    if  ;; label = @1
      i32.const x ;; code offset
      i32.const 0 ;; function index
      i32.const 2 ;; local_count
      call $coredump/start_frame
      local.get 0
      call $coredump/add_i32_local
      local.get 1
      call $coredump/add_i32_local
      ...
      call $coredump/write_coredump
      unreachable
    end)

  (func $addTwo (type 0) (param i32 i32) (result i32)
    local.get 0
    local.get 1
    i32.add
    ;; the unreachable instruction was here before
    call $coredump/unreachable_shim
    i32.const 1 ;; funcidx
    i32.const 2 ;; local_count
    call $coredump/start_frame
    local.get 0
    call $coredump/add_i32_local
    local.get 1
    call $coredump/add_i32_local
    ...
    return)

  (export "entry" (func $entry))

As you can see, a few things changed:

  1. The (unreachable) instruction in addTwo() was replaced by a call to $coredump/unreachable_shim which starts the unwinding process. Then, the location and debugging data is captured, and the function returns normally to the entry() caller.
  2. Code has been added after the addTwo() call instruction in entry() that detects if we have an unwinding process in progress or not. If we do, then it also captures the local debugging data, writes the core dump file and then, finally, moves to the unconditional trap unreachable.

In short, we unwind until the host function entry() gets destroyed by calling unreachable.

Let’s go over the runtime functions that we inject for more clarity, stay with us:

  • $coredump/start_frame(funcidx, local_count) starts a new frame in the coredump.
  • $coredump/add_*_local(value) captures the values of function arguments and in locals (currently capturing values from the stack isn’t implemented.)
  • $coredump/write_coredump is used at the end and writes the core dump in memory. We take advantage of the first 1 KiB of the Wasm linear memory, which is unused, to store our core dump.

A diagram is worth a thousand words:

Wasm core dumps and debugging Rust in Cloudflare Workers

Wait, what’s this about the first 1 KiB of the memory being unused, you ask? Well, it turns out that most WebAssembly linters and tools, including Emscripten and WebAssembly’s LLVM don’t use the first 1 KiB of memory. Rust and Zig also use LLVM, but they changed the default. This isn’t pretty, but the hugely popular Asyncify polyfill relies on the same trick, so there’s reasonable support until we find a better way.

But we digress, let’s continue. After the crash, the host, typically JavaScript in the browser, can now catch the exception and extract the core dump from the Wasm instance’s memory:

try {
    wasmInstance.exports.someExportedFunction();
} catch(err) {
    const image = new Uint8Array(wasmInstance.exports.memory.buffer);
    writeFile("coredump." + Date.now(), image);
}

If you're curious about the actual details of the core dump implementation, you can find the source code here. It was written in AssemblyScript, a TypeScript-like language for WebAssembly.

This is how we use the polyfilling technique to implement Wasm core dumps when the runtime doesn’t support them yet. Interestingly, some Wasm runtimes, being optimizing compilers, are likely to make debugging more difficult because function arguments, locals, or functions themselves can be optimized away. Polyfilling or rewriting the binary could actually preserve more source-level information for debugging.

You might be asking what about performance? We did some testing and found that the impact is negligible; the cost-benefit of being able to debug our crashes is positive. Also, you can easily turn wasm core dumps on or off for specific builds or environments; deciding when you need them is up to you.

Debugging from a core dump

We now know how to generate a core dump, but how do we use it to diagnose and debug a software crash?

Similarly to gdb (GNU Project Debugger) on Linux, wasmgdb is the tool you can use to parse and make sense of core dumps in WebAssembly; it understands the file structure, uses DWARF to provide naming and contextual information, and offers interactive commands to navigate the data. To exemplify how it works, wasmgdb has a demo of a Rust application that deliberately crashes; we will use it.

Let's imagine that our Wasm program crashed, wrote a core dump file, and we want to debug it.

$ wasmgdb source-program.wasm /path/to/coredump
wasmgdb>

When you fire wasmgdb, you enter a REPL (Read-Eval-Print Loop) interface, and you can start typing commands. The tool tries to mimic the gdb command syntax; you can find the list here.

Let's examine the backtrace using the bt command:

wasmgdb> bt
#18     000137 as __rust_start_panic () at library/panic_abort/src/lib.rs
#17     000129 as rust_panic () at library/std/src/panicking.rs
#16     000128 as rust_panic_with_hook () at library/std/src/panicking.rs
#15     000117 as {closure#0} () at library/std/src/panicking.rs
#14     000116 as __rust_end_short_backtrace<std::panicking::begin_panic_handler::{closure_env#0}, !> () at library/std/src/sys_common/backtrace.rs
#13     000123 as begin_panic_handler () at library/std/src/panicking.rs
#12     000194 as panic_fmt () at library/core/src/panicking.rs
#11     000198 as panic () at library/core/src/panicking.rs
#10     000012 as calculate (value=0x03000000) at src/main.rs
#9      000011 as process_thing (thing=0x2cff0f00) at src/main.rs
#8      000010 as main () at src/main.rs
#7      000008 as call_once<fn(), ()> (???=0x01000000, ???=0x00000000) at /rustc/b833ad56f46a0bbe0e8729512812a161e7dae28a/library/core/src/ops/function.rs
#6      000020 as __rust_begin_short_backtrace<fn(), ()> (f=0x01000000) at /rustc/b833ad56f46a0bbe0e8729512812a161e7dae28a/library/std/src/sys_common/backtrace.rs
#5      000016 as {closure#0}<()> () at /rustc/b833ad56f46a0bbe0e8729512812a161e7dae28a/library/std/src/rt.rs
#4      000077 as lang_start_internal () at library/std/src/rt.rs
#3      000015 as lang_start<()> (main=0x01000000, argc=0x00000000, argv=0x00000000, sigpipe=0x00620000) at /rustc/b833ad56f46a0bbe0e8729512812a161e7dae28a/library/std/src/rt.rs
#2      000013 as __original_main () at <directory not found>/<file not found>
#1      000005 as _start () at <directory not found>/<file not found>
#0      000264 as _start.command_export at <no location>

Each line represents a frame from the program's call stack; see frame #3:

#3      000015 as lang_start<()> (main=0x01000000, argc=0x00000000, argv=0x00000000, sigpipe=0x00620000) at /rustc/b833ad56f46a0bbe0e8729512812a161e7dae28a/library/std/src/rt.rs

You can read the funcidx, function name, arguments names and values and source location are all present. Let's select frame #9 now and inspect the locals, which include the function arguments:

wasmgdb> f 9
000011 as process_thing (thing=0x2cff0f00) at src/main.rs
wasmgdb> info locals
thing: *MyThing = 0xfff1c

Let’s use the p command to inspect the content of the thing argument:

wasmgdb> p (*thing)
thing (0xfff2c): MyThing = {
    value (0xfff2c): usize = 0x00000003
}

You can also use the p command to inspect the value of the variable, which can be useful for nested structures:

wasmgdb> p (*thing)->value
value (0xfff2c): usize = 0x00000003

And you can use p to inspect memory addresses. Let’s point at 0xfff2c, the start of the MyThing structure, and inspect:

wasmgdb> p (MyThing) 0xfff2c
0xfff2c (0xfff2c): MyThing = {
    value (0xfff2c): usize = 0x00000003
}

All this information in every step of the stack is very helpful to determine the cause of a crash. In our test case, if you look at frame #10, we triggered an integer overflow. Once you get comfortable walking through wasmgdb and using its commands to inspect the data, debugging core dumps will be another powerful skill under your belt.

Tidying up everything in Cloudflare Workers

We learned about core dumps and how they work, and we know how to make Cloudflare Workers generate them using the wasm-coredump-rewriter polyfill, but how does all this work in practice end to end?

We've been dogfooding the technique described in this blog at Cloudflare for a while now. Wasm core dumps have been invaluable in helping us debug Rust-based services running on top of Cloudflare Workers like D1, Privacy Edge, AMP, or Constellation.

Today we're open-sourcing the Wasm Coredump Service and enabling anyone to deploy it. This service collects the Wasm core dumps originating from your projects and applications when they crash, parses them, prints an exception with the stack information in the logs, and can optionally store the full core dump in a file in an R2 bucket (which you can then use with wasmgdb) or send the exception to Sentry.

We use a service binding to facilitate the communication between your application Worker and the Coredump service Worker. A Service binding allows you to send HTTP requests to another Worker without those requests going over the Internet, thus avoiding network latency or having to deal with authentication. Here’s a diagram of how it works:

Wasm core dumps and debugging Rust in Cloudflare Workers

Using it is as simple as npm/yarn installing @cloudflare/wasm-coredump, configuring a few options, and then adding a few lines of code to your other applications running in Cloudflare Workers, in the exception handling logic:

import shim, { getMemory, wasmModule } from "../build/worker/shim.mjs"

const timeoutSecs = 20;

async function fetch(request, env, ctx) {
    try {
        // see https://github.com/rustwasm/wasm-bindgen/issues/2724.
        return await Promise.race([
            shim.fetch(request, env, ctx),
            new Promise((r, e) => setTimeout(() => e("timeout"), timeoutSecs * 1000))
        ]);
    } catch (err) {
      const memory = getMemory();
      const coredumpService = env.COREDUMP_SERVICE;
      await recordCoredump({ memory, wasmModule, request, coredumpService });
      throw err;
    }
}

The ../build/worker/shim.mjs import comes from the worker-build tool, from the workers-rs packages and is automatically generated when wrangler builds your Rust-based Cloudflare Workers project. If the Wasm throws an exception, we catch it, extract the core dump from memory, and send it to our Core dump service.

You might have noticed that we race the workers-rs shim.fetch() entry point with another Promise to generate a timeout exception if the Rust code doesn't respond earlier. This is because currently, wasm-bindgen, which generates the glue between the JavaScript and Rust land, used by workers-rs, has an issue where a Promise might not be rejected if Rust panics asynchronously (leading to the Worker runtime killing the worker with “Error: The script will never generate a response”.). This can block the wasm-coredump code and make the core dump generation flaky.

We are working to improve this, but in the meantime, make sure to adjust timeoutSecs to something slightly bigger than the typical response time of your application.

Here’s an example of a Wasm core dump exception in Sentry:

Wasm core dumps and debugging Rust in Cloudflare Workers

You can find a working example, the Sentry and R2 configuration options, and more details in the @cloudflare/wasm-coredump GitHub repository.

Too big to fail

It's worth mentioning one corner case of this debugging technique and the solution: sometimes your codebase is so big that adding core dump and DWARF debugging information might result in a Wasm binary that is too big to fit in a Cloudflare Worker. Well, worry not; we have a solution for that too.

Fortunately the DWARF for WebAssembly specification also supports external DWARF files. To make this work, we have a tool called debuginfo-split that you can add to the build command in the wrangler.toml configuration:

command = "... && debuginfo-split ./build/worker/index.wasm"

What this does is it strips the debugging information from the Wasm binary, and writes it to a new separate file called debug-{UUID}.wasm. You then need to upload this file to the same R2 bucket used by the Wasm Coredump Service (you can automate this as part of your CI or build scripts). The same UUID is also injected into the main Wasm binary; this allows us to correlate the Wasm binary with its corresponding DWARF debugging information. Problem solved.

Binaries without DWARF information can be significantly smaller. Here’s our example:

4.5 MiB debug-63372dbe-41e6-447d-9c2e-e37b98e4c656.wasm
313 KiB build/worker/index.wasm

Final words

We hope you enjoyed reading this blog as much as we did writing it and that it can help you take your Wasm debugging journeys, using Cloudflare Workers or not, to another level.

Note that while the examples used here were around using Rust and WebAssembly because that's a common pattern, you can use the same techniques if you're compiling WebAssembly from other languages like C or C++.

Also, note that the WebAssembly core dump standard is a hot topic, and its implementations and adoption are evolving quickly. We will continue improving the wasm-coredump-rewriter, debuginfo-split, and wasmgdb tools and the wasm-coredump service. More and more runtimes, including V8, will eventually support core dumps natively, thus eliminating the need to use polyfills, and the tooling, in general, will get better; that's a certainty. For now, we present you with a solution that works today, and we have strong incentives to keep supporting it.

As usual, you can talk to us on our Developers Discord or the Community forum or open issues or PRs in our GitHub repositories; the team will be listening.

Debug Queues from the dash: send, list, and ack messages

Post Syndicated from Emilie Ma original http://blog.cloudflare.com/debug-queues-from-dash/

Debug Queues from the dash: send, list, and ack messages

Debug Queues from the dash: send, list, and ack messages

Today, August 11, 2023, we are excited to announce a new debugging workflow for Cloudflare Queues. Customers using Cloudflare Queues can now send, list, and acknowledge messages directly from the Cloudflare dashboard, enabling a more user-friendly way to interact with Queues. Though it can be difficult to debug asynchronous systems, it’s now easy to examine a queue’s state and test the full flow of information through a queue.

With guaranteed delivery, message batching, consumer concurrency, and more, Cloudflare Queues is a powerful tool to connect services reliably and efficiently. Queues integrate deeply with the existing Cloudflare Workers ecosystem, so developers can also leverage our many other products and services. Queues can be bound to producer Workers, which allow Workers to send messages to a queue, and to consumer Workers, which pull messages from the queue.

We’ve received feedback that while Queues are effective and performant, customers find it hard to debug them. After a message is sent to a queue from a producer worker, there’s no way to inspect the queue’s contents without a consumer worker. The limited transparency was frustrating, and the need to write a skeleton worker just to debug a queue was high-friction.

Debug Queues from the dash: send, list, and ack messages

Now, with the addition of new features to send, list, and acknowledge messages in the Cloudflare dashboard, we’ve unlocked a much simpler debugging workflow. You can send messages from the Cloudflare dashboard to check if their consumer worker is processing messages as expected, and verify their producer worker’s output by previewing messages from the Cloudflare dashboard.

The pipeline of messages through a queue is now more open and easily examined. Users just getting started with Cloudflare Queues also no longer have to write code to send their first message: it’s as easy as clicking a button in the Cloudflare dashboard.

Debug Queues from the dash: send, list, and ack messages

Sending messages

Both features are located in a new Messages tab on any queue’s page. Scroll to Send message to open the message editor.

Debug Queues from the dash: send, list, and ack messages

From here, you can write a message and click Send message to send it to your queue. You can also choose to send JSON, which opens a JSON editor with syntax highlighting and formatting. If you’ve saved your message as a file locally, you can drag-and-drop the file over the textbox or click Upload a file to send it as well.

This feature makes testing changes in a queue’s consumer worker much easier. Instead of modifying an existing producer worker or creating a new one, you can send one-off messages. You can also easily verify if your queue consumer settings are behaving as expected: send a few messages from the Cloudflare dashboard to check that messages are batched as desired.

Behind the scenes, this feature leverages the same pipeline that Cloudflare Workers uses to send messages, so you can be confident that your message will be processed as if sent via a Worker.

Listing messages

On the same page, you can also inspect the messages you just sent from the Cloudflare dashboard. On any queue’s page, open the Messages tab and scroll to Queued messages.

If you have a consumer attached to your queue, you’ll fetch a batch of messages of the same size as configured in your queue consumer settings by default, to provide a realistic view of what would be sent to your consumer worker. You can change this value to preview messages one-at-a-time or even in much larger batches than would be normally sent to your consumer.

After fetching a batch of messages, you can preview the message’s body, even if you’ve sent raw bytes or a JavaScript object supported by the structured clone algorithm. You can also check the message’s timestamp; number of retries; producer source, such as a Worker or the Cloudflare dashboard; and type, such as text or JSON. This information can help you debug the queue’s current state and inspect where and when messages originated from.

Debug Queues from the dash: send, list, and ack messages

The batch of messages that’s returned is the same batch that would be sent to your consumer Worker on its next run. Messages are even guaranteed to be in the same order on the UI as sent to your consumer. This feature grants you a looking glass view into your queue, matching the exact behavior of a consumer worker. This works especially well for debugging messages sent by producer workers and verifying queue consumer settings.

Listing messages from the Cloudflare dashboard also doesn’t interfere with an existing connected consumer. Messages that are previewed from the Cloudflare dashboard stay in the queue and do not have their number of retries affected.

This ‘peek’ functionality is unique to Cloudflare Queues: Amazon SQS bumps the number of retries when a message is viewed, and RabbitMQ retries the message, forcing it to the back of the queue. Cloudflare Queues’ approach means that previewing messages does not have any unintended side effects on your queue and your consumer. If you ever need to debug queues used in production, don’t worry – listing messages is entirely safe.

As well, you can now remove messages from your queue from the Cloudflare dashboard. If you’d like to remove a message or clear the full batch from the queue, you can select messages to acknowledge. This is useful for preventing buggy messages from being repeatedly retried without having to write a dummy consumer.

Debug Queues from the dash: send, list, and ack messages

You might have noticed that this message preview feature operates similarly to another popular feature request for an HTTP API to pull batches of messages from a queue. Customers will be able to make a request to the API endpoint to receive a batch of messages, then acknowledge the batch to remove the messages from the queue. Under the hood, both listing messages from the Cloudflare dashboard and HTTP Pull/Ack use a common infrastructure, and HTTP Pull/Ack is coming very soon!

These debugging features have already been invaluable for testing example applications we’ve built on Cloudflare Queues. At an internal hack week event, we built a web crawler with Queues as an example use-case (check out the tutorial here!). During development, we took advantage of this user-friendly way to send messages to quickly iterate on a consumer worker before we built a producer worker. As well, when we encountered bugs in our consumer worker, the message previews were handy to realize we were sending malformed messages, and the message acknowledgement feature gave us an easy way to remove them from the queue.

New Queues debugging features — available today!

The Cloudflare dashboard features announced today provide more transparency into your application and enable more user-friendly debugging.

All Cloudflare Queues customers now have access to these new debugging tools. And if you’re not already using Queues, you can join the Queues Open Beta by enabling Cloudflare Queues here.
Get started on Cloudflare Queues with our guide and create your next app with us today! Your first message is a single click away.

Hardening Workers KV

Post Syndicated from Matt Silverlock original http://blog.cloudflare.com/workers-kv-restoring-reliability/

Hardening Workers KV

Hardening Workers KV

Over the last couple of months, Workers KV has suffered from a series of incidents, culminating in three back-to-back incidents during the week of July 17th, 2023. These incidents have directly impacted customers that rely on KV — and this isn’t good enough.

We’re going to share the work we have done to understand why KV has had such a spate of incidents and, more importantly, share in depth what we’re doing to dramatically improve how we deploy changes to KV going forward.

Workers KV?

Workers KV — or just “KV” — is a key-value service for storing data: specifically, data with high read throughput requirements. It’s especially useful for user configuration, service routing, small assets and/or authentication data.

We use KV extensively inside Cloudflare too, with Cloudflare Access (part of our Zero Trust suite) and Cloudflare Pages being some of our highest profile internal customers. Both teams benefit from KV’s ability to keep regularly accessed key-value pairs close to where they’re accessed, as well its ability to scale out horizontally without any need to become an expert in operating KV.

Given Cloudflare’s extensive use of KV, it wasn’t just external customers impacted. Our own internal teams felt the pain of these incidents, too.

The summary of the post-mortem

Back in June 2023, we announced the move to a new architecture for KV, which is designed to address two major points of customer feedback we’ve had around KV: high latency for infrequently accessed keys (or a key accessed in different regions), and working to ensure the upper bound on KV’s eventual consistency model for writes is 60 seconds — not “mostly 60 seconds”.

At the time of the blog, we’d already been testing this internally, including early access with our community champions and running a small % of production traffic to validate stability and performance expectations beyond what we could emulate within a staging environment.

However, in the weeks between mid-June and culminating in the series of incidents during the week of July 17th, we would continue to increase the volume of new traffic onto the new architecture. When we did this, we would encounter previously unseen problems (many of these customer-impacting) — then immediately roll back, fix bugs, and repeat. Internally, we’d begun to identify that this pattern was becoming unsustainable — each attempt to cut traffic onto the new architecture would surface errors or behaviors we hadn’t seen before and couldn’t immediately explain, and thus we would roll back and assess.

The issues at the root of this series of incidents proved to be significantly challenging to track and observe. Once identified, the two causes themselves proved to be quick to fix, but an (1) observability gap in our error reporting and (2) a mutation to local state that resulted in an unexpected mutation of global state were both hard to observe and reproduce over the days following the customer-facing impact ending.

The detail

One important piece of context to understand before we go into detail on the post-mortem: Workers KV is composed of two separate Workers scripts – internally referred to as the Storage Gateway Worker and SuperCache. SuperCache is an optional path in the Storage Gateway Worker workflow, and is the basis for KV's new (faster) backend (refer to the blog).

Here is a timeline of events:

Time Description
2023-07-17 21:52 UTC Cloudflare observes alerts showing 500 HTTP status codes in the MEL01 data-center (Melbourne, AU) and begins investigating.
We also begin to see a small set of customers reporting HTTP 500s being returned via multiple channels. It is not immediately clear if this is a data-center-wide issue or KV specific, as there had not been a recent KV deployment, and the issue directly correlated with three data-centers being brought back online.
2023-07-18 00:09 UTC We disable the new backend for KV in MEL01 in an attempt to mitigate the issue (noting that there had not been a recent deployment or change to the % of users on the new backend).
2023-07-18 05:42 UTC Investigating alerts showing 500 HTTP status codes in VIE02 (Vienna, AT) and JNB01 (Johannesburg, SA).
2023-07-18 13:51 UTC The new backend is disabled globally after seeing issues in VIE02 (Vienna, AT) and JNB01 (Johannesburg, SA) data-centers, similar to MEL01. In both cases, they had also recently come back online after maintenance, but it remained unclear as to why KV was failing.
2023-07-20 19:12 UTC The new backend is inadvertently re-enabled while deploying the update due to a misconfiguration in a deployment script.
2023-07-20 19:33 UTC The new backend is (re-) disabled globally as HTTP 500 errors return.
2023-07-20 23:46 UTC Broken Workers script pipeline deployed as part of gradual rollout due to incorrectly defined pipeline configuration in the deployment script.
Metrics begin to report that a subset of traffic is being black-holed.
2023-07-20 23:56 UTC Broken pipeline rolled back; errors rates return to pre-incident (normal) levels.

All timestamps referenced are in Coordinated Universal Time (UTC).

We initially observed alerts showing 500 HTTP status codes in the MEL01 data-center (Melbourne, AU) at 21:52 UTC on July 17th, and began investigating. We also received reports from a small set of customers reporting HTTP 500s being returned via multiple channels. This correlated with three data centers being brought back online, and it was not immediately clear if it related to the data centers or was KV-specific — especially given there had not been a recent KV deployment. On 05:42, we began investigating alerts showing 500 HTTP status codes in VIE02 (Vienna) and JNB02 (Johannesburg) data-centers; while both had recently come back online after maintenance, it was still unclear why KV was failing. At 13:51 UTC, we made the decision to disable the new backend globally.

Following the incident on July 18th, we attempted to deploy an allow-list configuration to reduce the scope of impacted accounts. However, while attempting to roll out a change for the Storage Gateway Worker at 19:12 UTC on July 20th, an older configuration was progressed causing the new backend to be enabled again, leading to the third event. As the team worked to fix this and deploy this configuration, they attempted to manually progress the deployment at 23:46 UTC, which resulted in the passing of a malformed configuration value that caused traffic to be sent to an invalid Workers script configuration.

After all deployments and the broken Workers configuration (pipeline) had been rolled back at 23:56 on the 20th July, we spent the following three days working to identify the root cause of the issue. We lacked observability as KV's Worker script (responsible for much of KV's logic) was throwing an unhandled exception very early on in the request handling process. This was further exacerbated by prior work to disable error reporting in a disabled data-center due to the noise generated, which had previously resulted in logs being rate-limited upstream from our service.

This previous mitigation prevented us from capturing meaningful logs from the Worker, including identifying the exception itself, as an uncaught exception terminates request processing. This has raised the priority of improving how unhandled exceptions are reported and surfaced in a Worker (see Recommendations, below, for further details). This issue was exacerbated by the fact that KV's Worker script would fail to re-enter its "healthy" state when a Cloudflare data center was brought back online, as the Worker was mutating an environment variable perceived to be in request scope, but that was in global scope and persisted across requests. This effectively left the Worker “frozen” with the previous, invalid configuration for the affected locations.

Further, the introduction of a new progressive release process for Workers KV, designed to de-risk rollouts (as an action from a prior incident), prolonged the incident. We found a bug in the deployment logic that led to a broader outage due to an incorrectly defined configuration.

This configuration effectively caused us to drop a single-digit % of traffic until it was rolled back 10 minutes later. This code is untested at scale, and we need to spend more time hardening it before using it as the default path in production.

Additionally: although the root cause of the incidents was limited to three Cloudflare data-centers (Melbourne, Vienna, and Johannesburg), traffic across these regions still uses these data centers to route reads and writes to our system of record. Because these three data centers participate in KV’s new backend as regional tiers, a portion of traffic across the Oceania, Europe, and African regions was affected. Only a portion of keys from enrolled namespaces use any given data center as a regional tier in order to limit a single (regional) point of failure, so while traffic across all data centers in the region was impacted, nowhere was all traffic in a given data center affected.

We estimated the affected traffic to be 0.2-0.5% of KV's global traffic (based on our error reporting), however we observed some customers with error rates approaching 20% of their total KV operations. The impact was spread across KV namespaces and keys for customers within the scope of this incident.

Both KV’s high total traffic volume and its role as a critical dependency for many customers amplify the impact of even small error rates. In all cases, once the changes were rolled back, errors returned to normal levels and did not persist.

Thinking about risks in building software

Before we dive into what we’re doing to significantly improve how we build, test, deploy and observe Workers KV going forward, we think there are lessons from the real world that can equally apply to how we improve the safety factor of the software we ship.

In traditional engineering and construction, there is an extremely common procedure known as a   “JSEA”, or Job Safety and Environmental Analysis (sometimes just “JSA”). A JSEA is designed to help you iterate through a list of tasks, the potential hazards, and most importantly, the controls that will be applied to prevent those hazards from damaging equipment, injuring people, or worse.

One of the most critical concepts is the “hierarchy of controls” — that is, what controls should be applied to mitigate these hazards. In most practices, these are elimination, substitution, engineering, administration and personal protective equipment. Elimination and substitution are fairly self-explanatory: is there a different way to achieve this goal? Can we eliminate that task completely? Engineering and administration ask us whether there is additional engineering work, such as changing the placement of a panel, or using a horizontal boring machine to lay an underground pipe vs. opening up a trench that people can fall into.

The last and lowest on the hierarchy, is personal protective equipment (PPE). A hard hat can protect you from severe injury from something falling from above, but it’s a last resort, and it certainly isn’t guaranteed. In engineering practice, any hazard that only lists PPE as a mitigating factor is unsatisfactory: there must be additional controls in place. For example, instead of only wearing a hard hat, we should engineer the floor of scaffolding so that large objects (such as a wrench) cannot fall through in the first place. Further, if we require that all tools are attached to the wearer, then it significantly reduces the chance the tool can be dropped in the first place. These controls ensure that there are multiple degrees of mitigation — defense in depth — before your hard hat has to come into play.

Coming back to software, we can draw parallels between these controls: engineering can be likened to improving automation, gradual rollouts, and detailed metrics. Similarly, personal protective equipment can be likened to code review: useful, but code review cannot be the only thing protecting you from shipping bugs or untested code. Automation with linters, more robust testing, and new metrics are all vastly safer ways of shipping software.

As we spent time assessing where to improve our existing controls and how to put new controls in place to mitigate risks and improve the reliability (safety) of Workers KV, we took a similar approach: eliminating unnecessary changes, engineering more resilience into our codebase, automation, deployment tooling, and only then looking at human processes.

How we plan to get better

Cloudflare is undertaking a larger, more structured review of KV's observability tooling, release infrastructure and processes to mitigate not only the contributing factors to the incidents within this report, but recent incidents related to KV. Critically, we see tooling and automation as the most powerful mechanisms for preventing incidents, with process improvements designed to provide an additional layer of protection. Process improvements alone cannot be the only mitigation.

Specifically, we have identified and prioritized the below efforts as the most important next steps towards meeting our own availability SLOs, and (above all) make KV a service that customers building on Workers can rely on for storing configuration and service data in the hot path of their traffic:

  • Substantially improve the existing observability tooling for unhandled exceptions, both for internal teams and customers building on Workers. This is especially critical for high-volume services, where traditional logging alone can be too noisy (and not specific enough) to aid in tracking down these cases. The existing ongoing work to land this will be prioritized further. In the meantime, we have directly addressed the specific uncaught exception with KV's primary Worker script.
  • Improve the safety around the mutation of environmental variables in a Worker, which currently operate at "global" (per-isolate) scope, but can appear to be per-request. Mutating an environmental variable in request scope mutates the value for all requests transiting that same isolate (in a given location), which can be unexpected. Changes here will need to take backwards compatibility in mind.
  • Continue to expand KV’s test coverage to better address the above issues, in parallel with the aforementioned observability and tooling improvements, as an additional layer of defense. This includes allowing our test infrastructure to simulate traffic from any source data-center, which would have allowed us to more quickly reproduce the issue and identify a root cause.
  • Improvements to our release process, including how KV changes and releases are reviewed and approved, going forward. We will enforce a higher level of scrutiny for future changes, and where possible, reduce the number of changes deployed at once. This includes taking on new infrastructure dependencies, which will have a higher bar for both design and testing.
  • Additional logging improvements, including sampling, throughout our request handling process to improve troubleshooting & debugging. A significant amount of the challenge related to these incidents was due to the lack of logging around specific requests (especially non-2xx requests)
  • Review and, where applicable, improve alerting thresholds surrounding error rates. As mentioned previously in this report, sub-% error rates at a global scale can have severe negative impact on specific users and/or locations: ensuring that errors are caught and not lost in the noise is an ongoing effort.
  • Address maturity issues with our progressive deployment tooling for Workers, which is net-new (and will eventually be exposed to customers directly).

This is not an exhaustive list: we're continuing to expand on preventative measures associated with these and other incidents. These changes will not only improve KVs reliability, but other services across Cloudflare that KV relies on, or that rely on KV.

We recognize that KV hasn’t lived up to our customers’ expectations recently. Because we rely on KV so heavily internally, we’ve felt that pain first hand as well. The work to fix the issues that led to this cycle of incidents is already underway. That work will not only improve KV’s reliability but also improve the reliability of any software written on the Cloudflare Workers developer platform, whether by our customers or by ourselves.

Cloudflare Workers database integration with Upstash

Post Syndicated from Joaquin Gimenez original http://blog.cloudflare.com/cloudflare-workers-database-integration-with-upstash/

Cloudflare Workers database integration with Upstash

Cloudflare Workers database integration with Upstash

During Developer Week we announced Database Integrations on Workers  a new and seamless way to connect with some of the most popular databases. You select the provider, authorize through an OAuth2 flow and automatically get the right configuration stored as encrypted environment variables to your Worker.

Today we are thrilled to announce that we have been working with Upstash to expand our integrations catalog. We are now offering three new integrations: Upstash Redis, Upstash Kafka and Upstash QStash. These integrations allow our customers to unlock new capabilities on Workers. Providing them with a broader range of options to meet their specific requirements.

Add the integration

We are going to show the setup process using the Upstash Redis integration.

Select your Worker, go to the Settings tab, select the Integrations tab to see all the available integrations.

Cloudflare Workers database integration with Upstash

After selecting the Upstash Redis integration we will get the following page.

Cloudflare Workers database integration with Upstash

First, you need to review and grant permissions, so the Integration can add secrets to your Worker. Second, we need to connect to Upstash using the OAuth2 flow. Third, select the Redis database we want to use. Then, the Integration will fetch the right information to generate the credentials. Finally, click “Add Integration” and it's done! We can now use the credentials as environment variables on our Worker.

Implementation example

On this occasion we are going to use the CF-IPCountry  header to conditionally return a custom greeting message to visitors from Paraguay, United States, Great Britain and Netherlands. While returning a generic message to visitors from other countries.

To begin we are going to load the custom greeting messages using Upstash’s online CLI tool.

➜ set PY "Mba'ẽichapa 🇵🇾"
OK
➜ set US "How are you? 🇺🇸"
OK
➜ set GB "How do you do? 🇬🇧"
OK
➜ set NL "Hoe gaat het met u? 🇳🇱"
OK

We also need to install @upstash/redis package on our Worker before we upload the following code.

import { Redis } from '@upstash/redis/cloudflare'
 
export default {
  async fetch(request, env, ctx) {
    const country = request.headers.get("cf-ipcountry");
    const redis = Redis.fromEnv(env);
    if (country) {
      const localizedMessage = await redis.get(country);
      if (localizedMessage) {
        return new Response(localizedMessage);
      }
    }
    return new Response("👋👋 Hello there! 👋👋");
  },
};

Just like that we are returning a localized message from the Redis instance depending on the country which the request originated from. Furthermore, we have a couple ways to improve performance, for write heavy use cases we can use Smart Placement with no replicas, so the Worker code will be executed near the Redis instance provided by Upstash. Otherwise, creating a Global Database on Upstash to have multiple read replicas across regions will help.

Try it now

Upstash Redis, Kafka and QStash are now available for all users! Stay tuned for more updates as we continue to expand our Database Integrations catalog.

Cloudflare Zaraz steps up: general availability and new pricing

Post Syndicated from Yair Dovrat original http://blog.cloudflare.com/cloudflare-zaraz-steps-up-general-availability-and-new-pricing/

Cloudflare Zaraz steps up: general availability and new pricing

This post is also available in Deutsch, Français.

Cloudflare Zaraz has transitioned out of beta and is now generally available to all customers. It is included under the free, paid, and enterprise plans of the Cloudflare Developer Platform. Visit our docs to learn more on our different plans.

Cloudflare Zaraz steps up: general availability and new pricing

Zaraz Is part of Cloudflare Developer Platform

Cloudflare Zaraz is a solution that developers and marketers use to load third-party tools like Google Analytics 4, Facebook CAPI, TikTok, and others. With Zaraz, Cloudflare customers can easily transition to server-side data collection with just a few clicks, without the need to set up and maintain their own cloud environment or make additional changes to their website for installation. Server-side data collection, as facilitated by Zaraz, simplifies analytics reporting from the server rather than loading numerous JavaScript files on the user's browser. It's a rapidly growing trend due to browser limitations on using third-party solutions and cookies. The result is significantly faster websites, plus enhanced security and privacy on the web.

We've had Zaraz in beta mode for a year and a half now. Throughout this time, we've dedicated our efforts to meeting as many customers as we could, gathering feedback, and getting a deep understanding of our users' needs before addressing them. We've been shipping features at a high rate and have now reached a stage where our product is robust, flexible, and competitive. It also offers unique features not found elsewhere, thanks to being built on Cloudflare’s global network, such as Zaraz’s Worker Variables. We have cultivated a strong and vibrant discord community, and we have certified Zaraz developers ready to help anyone with implementation and configuration.

With more than 25,000 websites running Zaraz today – from personal sites to those of some of the world's biggest companies – we feel confident it's time to go out of beta, and introduce our new pricing system. We believe this pricing is not only generous to our customers, but also competitive and sustainable. We view this as the next logical step in our ongoing commitment to our customers, for whom we're building the future.

If you're building a web application, there's a good chance you've spent at least some time implementing third-party tools for analytics, marketing performance, conversion optimization, A/B testing, customer experience and more. Indeed, according to the Web Almanac report, 94% percent of mobile pages used at least one third-party solution in 2022, and third-party requests accounted for 45% of all requests made by websites. It's clear that third-party solutions are everywhere. They have become an integral part of how the web has evolved. Third-party tools are here to stay, and they require effective developer solutions. We are building Zaraz to help developers manage the third-party layer of their website properly.

Starting today, Cloudflare Zaraz is available to everyone for free under their Cloudflare dashboard, and the paid version of Zaraz is included in the Workers Paid plan. The Free plan is designed to meet the needs of most developers who want to use Zaraz for personal use cases. For a price starting at $5/month, customers of the Workers Paid plan can enjoy the extensive list of features that makes Zaraz powerful, deploy Zaraz on their professional projects, and utilize the pay-as-you-go system. This is in addition to everything else included in the Workers Paid plan. The Enterprise plan, on the other hand, addresses the needs of larger businesses looking to leverage our platform to its fullest potential.

How is Zaraz priced

Zaraz pricing is based on two components: Zaraz Loads and the set of features. A Zaraz Load is counted each time a web page loads the Zaraz script within it, and/or the Pageview trigger is being activated. For Single Page Applications, each URL navigation is counted as a new Zaraz Load. Under the Zaraz Monitoring dashboard, you can find a report showing how many Zaraz Loads your website has generated during a specific time period. Zaraz Loads and features are factored into our billing as follows:

Cloudflare Zaraz steps up: general availability and new pricing

Free plan

The Free Plan has a limit of 100,000 Zaraz Loads per month per account. This should allow almost everyone wanting to use Zaraz for personal use cases, like personal websites or side projects, to do so for free. After 100,000 Zaraz Loads, Zaraz will simply stop functioning.

Following the same logic, the free plan includes everything you need in order to use Zaraz for personal use cases. That includes Auto-injection, Zaraz Debugger, Zaraz Track and Zaraz Set from our Web API, Consent Management Platform (CMP), Data Layer compatibility mode, and many more.

If your websites generate more than 100,000 Zaraz loads combined, you will need to upgrade to the Workers Paid plan to avoid service interruption. If you desire some of the more advanced features, you can upgrade to Workers Paid and get access for only $5/month.

The Workers Paid Plan includes the first 200,000 Zaraz Loads per month per account, free of charge.

If you exceed the free Zaraz Loads allocations, you'll be charged $0.50 for every additional 1,000 Zaraz Loads, but the service will continue to function. (You can set notifications to get notified when you exceed a certain threshold of Zaraz Loads, to keep track of your usage.)

Workers Paid customers can enjoy most of Zaraz robust and existing features, amongst other things, this includes: Zaraz E-commerce from our Web API, Custom Endpoints, Workers Variables, Preview/Publish Workflow, Privacy Features, and more.

If your websites generate Zaraz Loads in the millions, you might want to consider the Workers Enterprise plan. Beyond the free 200,000 Zaraz Loads per month for your account, it offers additional volume discounts based on your Zaraz Loads usage as well as Cloudflare’s professional services.

Enterprise plan

The Workers Enterprise Plan includes the first 200,000 Zaraz Loads per month per account free of charge. Based on your usage volume, Cloudflare’s sales representatives can offer compelling discounts. Get in touch with us here. Workers Enterprise customers enjoy all paid enterprise features.

I already use Zaraz, what should I do?

If you were using Zaraz under the free beta, you have a period of two months to adjust and decide how you want to go about this change. Nothing will change until September 20, 2023. In the meantime we advise you to:

  1. Get more clarity of your Zaraz Loads usage. Visit Monitoring to check how many Zaraz Loads you had in the previous couple of months. If you are worried about generating more than 100,000 Zaraz Loads per month, you might want to consider upgrading to Workers Paid via the plans page, to avoid service interruption. If you generate a big amount of Zaraz Loads, you’d probably want to reach out to your sales representative and get volume discounts. You can leave your details here, and we’ll get back to you.
  2. Check if you are using one of the paid features as listed in the plans page. If you are, then you would need to purchase a Workers Paid subscription, starting at $5/month via the plans page. On September 20, these features will cease to work unless you upgrade.

* Please note, as of now, free plan users won't have access to any paid features. However, if you're already using a paid feature without a Workers Paid subscription, you can continue to use it risk-free until September 20. After this date, you'll need to upgrade to keep using any paid features.

We are here for you

As we make this important transition, we want to extend our sincere gratitude to all our beta users who have provided invaluable feedback and have helped us shape Zaraz into what it is today. We are excited to see Zaraz move beyond its beta stage and look forward to continuing to serve your needs and helping you build better, faster, and more secure web experiences. We know this change comes with adjustments, and we are committed to making the transition as smooth as possible. In the next couple of days, you can expect an email from us, with clear next steps and a way to get advice in case of need. You can always get in touch directly with the Cloudflare Zaraz team on Discord, or the community forum.

Thank you for joining us on this journey and for your ongoing support and trust in Cloudflare Zaraz. Let's continue to build the future of the web together!

Workers KV is faster than ever with a new architecture

Post Syndicated from Charles Burnett original http://blog.cloudflare.com/faster-workers-kv-architecture/

Workers KV is faster than ever with a new architecture

Workers KV is faster than ever with a new architecture

We’re excited to announce a significant performance improvement coming to Workers KV, focused on dramatically improving cold read performance and reducing latency, even for long tail access patterns.

Developers using KV have seen great performance on hot reads, but ask why their 95th percentile latency — often on a key (or set of keys) that hadn’t been accessed recently or in that region — was higher than expected. We took this feedback to heart: we’ve been working feverishly on a new caching layer for KV behind the scenes, which enables customers to achieve much more frequent hot reads, reduced worst case latency times, better flexibility and control over cache TTLs, and much faster consistency over our previous iterations, and it’s now live for all KV users.

The best part? Developers using KV don’t need to change anything to benefit from this increased performance.

What is Workers KV?

Workers KV is a key value store designed for read heavy use-cases and applications powered by Cloudflare’s network. KV’s focus on read-heavy use-cases allows it to serve hot (cached) reads in milliseconds, which makes it ideal for storing per-application or customer configuration data, routing configuration, multivariate (A/B testing) configurations, and even small asset data that you need to serve quickly.  Anything that you can serialize and need quickly you can store in KV, all the way up to 25 MiB worth of data per each individual key, with no cap on total data stored.

The problem

KV might be optimized for read-heavy workloads, but it’s critical that writes are globally available quickly enough that they’re useful for your application. Under typical conditions, the convergence delay for an eventually consistent system like KV is approximately one minute, globally: a write from one location should be able to be observed by all readers. Typical conditions are great, but typical unfortunately didn’t mean “always”. It could take significant time to restore global consistency where regions like North America and Europe are reading the same value. We needed to improve not just the average convergence, but the worst case as well.

Speaking of consistency, setting a long cache Time to Live (cacheTTL) for reads would result in a situation where you won’t notice a write for the entire cacheTTL duration, as the existing cached data had not timed out yet. This means you have to trade off read latency for infrequently accessed keys against noticing writes. Developers using KV have been consistent in their feedback: a higher cache TTL should improve performance, but not multiply the time it takes for KV to converge on a write to that key.

Lastly, our cold read times also left room for improvement. While cache hits are fast in KV, a cache miss would result in a request being routed all the way to our storage backends. While this is slow for everyone, it was particularly slow for folks in regions not immediately in the US or EU.This is poor performance that doesn’t represent what we can achieve with our global presence.

Our solution

A new horizontally scaled tiered cache

We’ve revamped Workers KV to be powered by a new tiered cache implementation. This implementation is written as a Worker service. We reuse the Dynamic Dispatch infrastructure developed for Workers for Platforms which lets us jump from our old KV worker into our new caching service within hundreds of microseconds. Importantly, this means we don’t impact cache hit performance to implement this new transparent caching layer. We leverage the same infrastructure powering Smart Placement to implement the tiering.

Before we re-designed KV, our topology looked like this:

Workers KV is faster than ever with a new architecture
All data centers in Cloudflare’s network can reach out to the origin in the event of a cache miss or to do a background refresh.

Cache TTL and efficiency

Our design goal was clear and ambitious: “can we relax honoring the cacheTTL constraint without violating it”? While this seems contradictory, the motivation is clear: we want to minimize the need to communicate with our storage backends while honoring the user-facing semantics of the cacheTTL setting, as it can have security implications if violated (e.g. if you use it to store and validate security tokens). Answering this design question also manages to simultaneously solve many of the problems outlined earlier.

Comparing existing solutions

First, let’s look at the design constraints for two eventually consistent storage systems at Cloudflare: Quicksilver and Tiered CDN.

Quicksilver gives us global consistency within seconds using a push architecture to replicate the data across all machines at Cloudflare. That architecture however doesn’t scale for Workers KV’s needs, which can have terabytes of data just within one namespace. This would be too much to replicate to every single data center.

By comparison, the tiered CDN cache is a pull mechanism where each hop pulls a more recent version of the asset into the local cache on access. That scales better because we only use storage for assets that are accessed, which works well with most use-cases where the vast majority of data is never retrieved. However, a pull based architecture is insufficient because it can only let us aggregate traffic across broader regions but we still can’t decouple how long we serve from the cache from the cacheTTL.

Push based architectures let us know when an asset is updated and enable scalable storage. By blending the properties of both systems, we can decouple how long we store the assets in cache from the cacheTTL. And that’s exactly what we did: KV now uses a hybrid push/pull caching layer where data centers closest to customers will pull from the regional data centers that are a little bit farther away. Writes will broadcast to all regional data centers that a key has been updated, so that the regional data center will remove that key from the local cache.

Workers KV is faster than ever with a new architecture
Traditional regional tiered cache topology

We can solve this problem by taking advantage of the fact that we semantically understand the write operations that are happening within Workers KV:

  1. Workers KV doesn’t have one data center per region as might be typical for your zone in a Cloudflare CDN regional tiered cache topology. Instead, each key in a KV namespace is deterministically assigned a data center by performing a weighted rendezvous hash. The rendezvous hash ensures that load is distributed equally across the region and outages result in optimal shifts of traffic.
  2. When the data center closest to a customer has a miss, it computes the regional data center affinity and provides that information to our Smart Placement infrastructure. When a regional tier misses, we repeat this process except using data centers in the KV origin region.
  3. Finally, a miss at the upper tier exits to our storage nodes located in that origin region.

When we do a write, we only purge (invalidate) the key from the regional and upper tier data centers. This is a fixed number of data centers in our network regardless of how many data centers we add, which ensures that we aren’t reducing cache hit rates as our network continues to grow Compared with a global purge that delivers the event to every data center in our network, because we only need to deliver this purge to a random fixed set of data centers in our network, our aggregate write capacity for Workers KV automatically scales horizontally as we add more data centers.

Workers KV is faster than ever with a new architecture
All lower-tier data centers will reach out to a regional tier responsible for a given key in the event of a cache miss. If the regional tier doesn’t have the content, the regional tier will then ask an upper-tier out of region for the content. On a write for a given key, the responsible regional and upper tiers have that key deleted from cache.

Why do we call this a hybrid topology? The data centers closest to customers pull from the regional data centers as normal, but we automatically push invalidation events to the regional tier data centers on every write. That way, those customer data center pulls know to get an updated value when there is one. This means that while the cacheTTL parameter controls the caching behavior closest to the customer, it’s treated as a suggestion at best at the regional and upper tiers.

This way we’ve combined the push design principles behind Quicksilver, which delivers global consistency within seconds, with the pull-based design of our CDN tiered caching which can scale to handle “infinite” size workloads and prioritizes the assets that are most frequently accessed.

Visualizing it

It can be a bit hard to follow what’s happening in the new caching layer since there’s so many moving parts.

Here’s a video of a simplified version of how it works:

Small yellow balls represent KV read requests, larger green balls represent read responses. A larger purple ball represents a KV write request, while a read response ball represents a KV write response. Teal balls represent purge requests being broadcast. The “E” is a data center that doesn’t participate as a regional tier. The R represents the regional tier for key N while O is the upper tier for key N.

Decoupled cache TTL and consistency parameters

As a refresher, the objects written to KV can specify a cacheTTL: by default this is set to 1 minute, which is also the minimum acceptable value. This means that if an asset has been in the cache for longer than a minute, we bypass the cache and read instead from our durable storage nodes. In order to prevent eyeballs noticing origin fetches every minute, we implement stale while revalidate logic in our caching layer that automatically refreshes from the storage nodes in the background as requests come in.

Workers KV is faster than ever with a new architecture
Here’s an example from a Worker that’s constantly reading the same key

Notice the absence of any spikes indicating a cache miss? You’d expect to see them regularly every minute or so in the tens or even hundreds of milliseconds when the cacheTTL should expire. The reason this doesn’t happen is because as the expiry time is approaching, a background request to the storage nodes occurs and the cache is updated with an expiry time one more minute into the future; thus the asset in cache is never too stale and eyeball requests are always served from cache. Let’s take a look at requests to our storage layer before and after adding tiering:

Workers KV is faster than ever with a new architecture
Yellow is the estimated number of requests that would have occurred to origin without the new caching layer. Blue is the number of requests we’re making now.

The above chart is for a system with conservative parameters set. The upper tier doesn’t store the data for much longer than the cacheTTL currently and the upper tier will itself still do a background refresh probabilistically even though it doesn’t actually need to since we see all writes.

The new caching layer we’ve built inherits the old background refresh mechanism and expands on it. The first thing we did is decouple the background refresh period from the cacheTTL as a separate parameter (also defaulting to 1 minute). This means that even if you set a cacheTTL for 1 hour, KV will still check every minute from the regional tier to see if the value has been updated. If the data you’re storing within KV doesn’t have strict requirements on stale reads (think a key that’s accessed once every 10 minutes but needs to honor a write within 1 minute like security tokens), then you can increase the cacheTTL so that infrequently accessed keys stick around in the cache without changing the observed consistency.

Consistency improvements

Speaking of consistency, we’ve improved the worst case performance of that as well. Historically, we’ve had a background system that crawls all data in the storage nodes to figure out which region has the most up to date value and update accordingly. This gives us complete consistency coverage, but could take a significant amount of time to confirm. We would also periodically check both backends to see if network conditions had changed to pick the primary storage region to use for a given customer-close data center. Of course inconsistencies would be resolved then, but in practice this happens randomly, and at a low probability that won’t typically catch any meaningful values served inconsistently.

With the new caching layer all this changes. Since we’re now only reading keys on first access or after a write, we have enough storage capacity that we can check both backends on every read. When a customer requests data, we make a call to each origin data center, with the fastest response being returned immediately to reduce read latency. If the other data center has a newer value than what was returned first, we synchronize both data centers and notify our caching layer to purge that key from all regional data centers. If the other data center instead has an older value, we just synchronize the data centers without purging since we served the latest value. This means that even if our data centers are inconsistent, readers will notice new values much more quickly.

Latency improvements

Here’s the latency improvement at 10% rollout on a logarithmic x-axis:

Workers KV is faster than ever with a new architecture

Architecture that just gets better

This is just the start of what we can do. We now have a solid foundation for making further improvements, including making our best case reads even faster. We’ll be working on cutting out parts of our traditional stack that add unnecessary latency, and adding new high performance features that were too difficult to integrate otherwise. We can also explore features like setting the consistency TTL parameter for sub one minute consistency for additional cost. Similarly, we could create a best effort global purge feature if you want to choose to signal writes that way. Finally, we’re looking at exposing this new caching layer as a general Worker binding anyone can use within a Worker in front of their own service or to put in front of their Worker. If these sound like the killer features you need, please reach out to us if you’re interested in trying them out.

What next?

Developers don’t have to do anything to benefit from KV’s new performance improvements. We are currently in the process of rolling out our new architecture, and you don’t have to redeploy your Worker or change the way you use KV to benefit.

Workers KV is a natural fit for any application built on top of our Workers platform. We provide a native API that enables any Worker script to read, write, list, and manageyour Workers KV storage. You can also interact with Workers KV directly via our REST API from any client that can make a HTTP request, and the Cloudflare Dashboard provides an easy way to create, list, and delete keys to be used with the rest of your Workers setup.

Regardless of how you use Workers KV, it will be faster than ever before. We’re excited to see what you build with us, and you can dive into our documentation to start building with it.

Dynamic data collection with Zaraz Worker Variables

Post Syndicated from Tom Klein original http://blog.cloudflare.com/dynamic-data-collection-with-zaraz-worker-variables/

Dynamic data collection with Zaraz Worker Variables

Bringing dynamic data to the server

Dynamic data collection with Zaraz Worker Variables

Since its inception, Cloudflare Zaraz, the server-side third-party manager built for speed, privacy and security, has strived to offer a way for marketers and developers alike to get the data they need to understand their user journeys, without compromising on page performance. Cloudflare Zaraz makes it easy to transition from traditional client-side data collection based on marketing pixels in users’ browsers, to a server-side paradigm that shares events with vendors from the edge.

When implementing data collection on websites or mobile applications, analysts and digital marketers usually first define the set of interactions and attributes they want to measure, formalizing those requirements along technical specifications in a central document (“tagging plan”). Developers will later implement the required code to make those attributes available for the third party manager to pick it up. For instance, an analyst may want to analyze page views based on an internal name instead of the page title or page pathname. They would therefore define an example “page name” attribute that would need to be made available in the context of the page, by the developer. From there, the analyst would configure the tag management system to pick the attribute’s value before dispatching it to the analytics tool.

Yet, while the above flow works fine in theory, the reality is that analytics data comes from multiple sources, in multiple formats, that do not always fit the initially formulated requirements.

The industry accepted solution, such as Google Tag Manager’s “Custom JavaScript variables” or Adobe’s “Custom Code Data Elements”, was to offer a way for users to dynamically invoke custom JavaScript functions on the client, allowing them to perform cleaning (like removing PII data from the payload before sending it to Google Analytics), transformations (extracting specific product attributes out of a product array) or enrichment (making an API call to grab the current user’s CRM id to stitch user sessions in your analytics tool) to the data before dispatch by the third-party manager.

Dynamic data collection with Zaraz Worker Variables
Example of Google Tag Manager custom javascript variable that aggregates individual items prices from a javascript array of product information. 

Having the ability to run custom JavaScript is a powerful feature that offers a lot of flexibility and yet, was a missing part of Cloudflare Zaraz. While some workarounds existed, it did not really fit with Cloudflare Zaraz’s objective of high-performance. We needed a way for our users to provide custom code to be executed fast, server-side. Quite fast, it was clear that Cloudflare Workers, the globally distributed serverless V8-based JavaScript runtime was the solution.

Worker Variables to the rescue

Cloudflare Zaraz Worker Variables is powered by Cloudflare Workers, our platform for running custom code on the edge, but let’s take a step back and work through how Cloudflare Zaraz is implemented.

When making a request to a website proxied by Cloudflare, a few things will run before making it to your origin. This includes the firewall, DDoS mitigation, caching, and also something called First-Party Workers.

These First-Party Workers are Cloudflare Workers with special permissions. Cloudflare Zaraz is one of them. Our Worker is built in a way that allows variables to be replaced by their contents. Those variables can be used in places where you would be reusing hardcoded text, to make it easier to make changes to all places where it would be used. For example, the name of your site, a secret key, etc:

Dynamic data collection with Zaraz Worker Variables

These variables can then be used in any of Cloudflare Zaraz’s components, by selecting them right from the dashboard as a property, or as part of a component’s settings:

Dynamic data collection with Zaraz Worker Variables

When using a Worker Variable, instead of replacing your variable with a hardcoded string, we instead execute the custom code hosted in your own Cloudflare Worker that you have associated with the variable. The response of which is then being used as the variable’s value. Calling one worker from within the Cloudflare Zaraz Worker is done using Dynamic Dispatch.

In our Cloudflare Zaraz Worker, calling Dynamic Dispatch is very similar to how your regular, everyday worker might do it. From having a binding in our wrangler.toml:

...
unsafe.bindings = [
  { name = "DISPATCHER", type = "dynamic_dispatch", id_prefix = "", first_party = true },
]

To having our code responsible for variables actually call your worker:

if (variable.type === 'worker') {
  // Get the persistent ID of the Worker
  const mutableId = variable.value.mutableId
  // Get the binding for the specific Worker
  const workerBinding = context.env.DISPATCHER.get(mutableId)
  ...
  // Execute the Worker and return the response
  const workerResponse = await workerBinding.fetch(
    new Request(String(url || context.url || 'http://unknown')),
    {
      method: 'POST',
      headers: {
        'Content-type': 'application/json',
      },
      body: JSON.stringify(payload),
    }
  )
  ...
  return workerResponse
}

Benefits of Cloudflare Zaraz Worker Variables

Cloudflare Workers is a world-class solution to build complex applications. Together with Cloudflare Zaraz, we feel that makes it the ideal platform to orchestrate your data workflows:

Build with context: Cloudflare Zaraz automatically shares the context as part of the call to the Cloudflare Zaraz Worker, allowing you to use that data as input to your functions. Cloudflare Zaraz offers a Web API which customers can use to track important events in their users' journeys. Along with the Web API, Zaraz offers ways for users to define custom attributes, called “Track properties” and “Variables”, that allow our customers to provide additional context to the event getting sent to a vendor. The Cloudflare Zaraz context holds every attribute that was tracked by Cloudflare Zaraz as part of the current visitor session along with other generic attributes like the visitors’ device cookies for instance.

Speed: In comparison to manually calling a worker from client-side JavaScript, this saves the roundtrip to the Worker’s HTTP endpoint and gives you access to Cloudflare Zaraz properties, allowing you to work with client-side data right from the edge.

Isolated environment: As the function is executed inside the worker, which lives outside of your visitor browser, it cannot access the DOM or JavaScript runtime from the browser, preventing potential bugs in your Worker’s code from affecting the experience of your user.

When combining Worker Variables with the Custom HTML tool, you also get the benefits of offloading client-side JavaScript to a worker. This improves performance for both AJAX network requests, which can then be executed directly from Cloudflare’s global network, as well as the offloading of resource intensive tasks to a Worker, such as data manipulation or computations. All whilst keeping your API secrets and other sensitive data hidden from the clients, allowing you to only send the results that are actually needed by the client.

Examples walkthrough

Now that you are more familiar with the concept, let’s get to some practical use cases!

We will cover two examples: translating a GTM custom JavaScript variable to a Cloudflare Zaraz Worker variable, and enriching user information with data from an external API.

Translate a GTM Custom JavaScript variable into Cloudflare Zaraz Worker Variable: Let’s take our previous example, Google Tag Manager custom javascript variable that aggregates individual items prices from a JavaScript array of product information.

Dynamic data collection with Zaraz Worker Variables

The function makes use of a “GTM Data Layer Variable” (represented with double curly braces, line 2, “{{DLV – Ecommerce – Purchase – Products }}”). That kind of variable is equivalent to Track Properties in Cloudflare Zaraz land: they are a way to access the value of a custom attribute that you shared with the third party manager. When translating from GTM to Cloudflare Zaraz, one should take care of making sure that such variables have also been translated to their Cloudflare Zaraz counterpart.

Back to our example, let’s say that the GTM variable “DLV – Ecommerce – Purchase – Products” is equal to a track property “products” in Cloudflare Zaraz. Your first step is to parse the Cloudflare Zaraz context ($1), that gives you two objects: client, holding all track properties set in the current visitor context and system that gives you access to some generic properties of the visitor’s device.

You can then reference a specific track property by accessing it from the client object. ($2)

The variable code was aggregating price from product information into a comma-separated string. For this, we can keep the same code. ($3)

A major difference between javascript functions executed in the client and Workers is that the worker should “return” the value as part of a Response object. ($4)

export default {
  async fetch(request, env) {
    // $1 Parse the Zaraz Context object
    const { system, client } = await request.json();

    // $2 Get a reference to the products track property
    const products = client.products;

    // $3 Calculate the sum
    const prices = products.map(p => p.price).join();

    return new Response(prices);
  },
};

Enriching user information with data coming from an API: For this second example, let’s imagine that we want to synchronize user activity online and offline. To do so, we need a common key to reconcile the user journeys. A CRM id looks like an appropriate candidate for that use case. We will obtain this id through the CRM solution API (the fictitious “https://example.com/api/getUserIdFromCookie”) Our primary key, that will be used to lookup the user CRM id, will be taken from a cookie that holds the current user session id.

export default {
  async fetch(request, env) {
    // Parse the Zaraz Context object
    const { system, client } = await request.json();

    // Get the value of the cookie "login-cookie"
    const cookieValue = system.cookies["login-cookie"];

    const userId = await fetch("https://example.com/api/getUserIdFromCookie", {
      method: POST,
      body: cookieValue,
    });

    return new Response(userId);
  },
};

Start using Worker Variables today

Worker Variables are available for all accounts with a paid Workers subscription (starting at $5 / month).

Create a worker

To use a Worker Variable, you first need to create a new Cloudflare Worker. You can do this through the Cloudflare dashboard or by using Wrangler.

To create a new worker in the Cloudflare dashboard:

  1. Log in to the Cloudflare dashboard.
  2. Go to Workers and select Create a Service.
  3. Give a name to your service and choose the HTTP Handler as your starter template.
  4. Click Create Service, and then Quick Edit.

To create a new worker through Wrangler:

1. Start a new Cloudflare Worker project

$ npx wrangler init my-project
$ cd my-project

2. Run your development server

$ npx wrangler dev

3. Start coding

// my-project/index.js || my-project/index.ts
export default {
 async fetch(request) {
   // Parse the Zaraz Context object
   const { system, client } = await request.json();

   return new Response("Hello World!");
 },
};

Configure a Worker Variable

With your Cloudflare Worker freshly configured and published, it is straightforward to configure a Worker Variable:

1. Log in to the Cloudflare dashboard

2. Go to Zaraz > Tools configuration > Variables.

3. Click Create variable.

4. Give your variable a name, choose Worker as the Variable type, and select your newly created Worker.

Dynamic data collection with Zaraz Worker Variables

5. Save your variable.

Use your Worker Variable

It is now time to use your Worker Variable! You can reference your variable as part of a trigger or an action. To set it up for a specific action for instance:

  1. Go to Zaraz > Tools configuration > Tools.
  2. Click Edit next to a tool that you have already configured.
  3. Select an action or add a new one.
  4. Click on the plus sign at the right of the text fields.
  5. Select your Worker Variable from the list.
Dynamic data collection with Zaraz Worker Variables

Announcing Cohort #2 of the Workers Launchpad

Post Syndicated from Mia Wang original http://blog.cloudflare.com/launchpad-cohort2/

Announcing Cohort #2 of the Workers Launchpad

Announcing Cohort #2 of the Workers Launchpad

We launched the $2B Workers Launchpad Funding Program in late 2022 to help support the over one million developers building on Cloudflare’s Developer Platform, many of which are startups leveraging Cloudflare to ship faster, scale more efficiently, and accelerate their growth.

Cohort #1 wrap-up

Since announcing the program just a few months ago, we have welcomed 25 startups from all around the world into our inaugural cohort and recently wrapped up the program with the Demo Day. Cohort #1 gathered weekly for Office Hours with our Solutions Architects for technical advice and the Founders Bootcamp, where they spent time with Cloudflare leadership, preview upcoming products with our Developer Platform Product Managers, and receive advice on a wide range of topics such as how to build Sales teams and think about the right pricing model for your product.

Learn more about what these companies are building and what they’ve been up to below:

Authdog

Identity and Access Management streamlined.

Demo Day pitch

Why they chose Cloudflare
“Cloudflare is the de facto Infrastructure for building resilient serverless products, it was a no-brainer to migrate to Cloudflare Workers to build the most frictionless experience for our customers.”

Recent updates
Learn more about how Authdog is using Cloudflare’s Developer Platform in their Built With Workers case study.

Drivly

Automotive Commerce APIs to Buy & Sell Cars Online.

Demo Day pitch

Why they chose Cloudflare
“We believe that Cloudflare is the next-generation of cloud computing platforms, and Drivly is completely built on Cloudflare, from Workers, Queues, PubSub, and especially Durable Objects.”

Recent updates
Drivly made their public launch at Demo Day!

Flethy

Integrate APIs, the easy way.

Demo Day pitch

Why they chose Cloudflare
“Simplicity and Performance. Using Pages and KV is extremely easy, but what really impresses are Workers with a nearly instant cold start!”

Recent updates
Check out how Cloudflare is helping Flethy improve and accelerate API service integrations for developers here.

GPUX

Serverless GPU.

Demo Day pitch

Why they chose Cloudflare
“Cloudflare is core to the internet; R2, Transit, Workers with no egress charge.”

Recent updates
GPUX launched v2 of their platform on Demo Day!

Grafbase

The easiest way to build and deploy GraphQL backends.

Demo Day pitch

Why they chose Cloudflare
“The Grafbase platform is built from the ground up to be highly performant and deployed to the edge using Rust and WebAssembly. Services like Cloudflare Workers, KV, Durable Objects, Edge Caching were a natural choice as it fits perfectly into our vision architecturally.”

Recent updates
Grafbase, which is building on Workers for Platforms among other Cloudflare products, celebrated their public launch and 7 new features in their April 2023 Launch Week.

JEMPass

Simple, seamless, and secure way to eliminate passwords.

Demo Day pitch

Why they chose Cloudflare
“We found it to be the best fit for our needs: performant, and easy to develop on, easy to scale.”

Recent updates
Learn more about how JEMPass works here.

Karambit.ai

The last line of defense for the software supply chain.

Demo Day pitch

Why they chose Cloudflare
“Cloudflare's developer products offer effortlessly powerful building blocks essential to scaling up product to meet strenuous customer demand while enabling our developers to deliver faster than ever.”

Recent updates
Karambit recently received a grant from the Virginia Innovation Partnership Corporation to help scale their commercial growth.

Narrative BI

A no-code analytics platform for growth teams that automatically turns raw data into actionable narratives.

Demo Day pitch

Why they chose Cloudflare
“Our customers benefit as we improve the quality of insights for them by running advanced algorithms for finding unqualified data points and quickly solving them with the unlimited power of Cloudflare Workers.”

Recent updates
Learn more about how Cloudflare is helping Narrative BI improve the quality of insights they generate for customers here.

Ninetailed

API-first personalization and experimentation solution to give your customers blazing-fast experiences.

Demo Day pitch

Why they chose Cloudflare
“Cloudflare’s developers platform allows us to fully deploy our everything-on-the-edge approach to both data and delivery means personalized experience cause zero loading lag and zero interruptions for the customer.”

Recent updates
Ninetailed recently launched integrations with Contentstack, Zapier, and other tools to improve and personalize digital customer experiences. Learn more on the Ninetailed blog and their Built with Workers case study.

Patr

Scalable, secure and cost-effective digital infrastructure, without the complexities of it.

Demo Day pitch

Why they chose Cloudflare
“Workers provides us with a global network of edge compute that we can use to route data internally to our user's deployments, providing our users with infinite scale.”

Recent updates
Patr was recently highlighted as a Product of the Day on Product Hunt!

QRYN

Polyglot monitoring and edge observability.

Demo Day pitch

Why they chose Cloudflare
“Polyglot, Secure, Cost-Effective Edge Observability – all powered by Cloudflare Workers and R2 Storage.”

Recent updates
QRYN recently launched integrations with Cloudflare Log Push, Grafana, and others.

Quest.ai

Quest is a code-generation tool that automatically generates frontend code for business applications.

Demo Day pitch

Why they chose Cloudflare
“We chose Cloudflare's Workers and Pages product to augment our frontend code-gen to include backend and hosting capabilities.”

Recent updates
Quest has been hard at work expanding their platform and recently added animations, CSS grid, MUI & Chakra UI support, NextJS support, breakpoints, nested components, and more.

Rollup ID

Simple & Secure ‍User Access. Rollup is all your authentication and authorization needs bundled into one great package.

Demo Day pitch

Why they chose Cloudflare
“We chose Cloudflare’s developer platform because it provides us all the tools to build a logical user graph at the edge. We can utilize everything from Durable Objects, D1, R2, and more to build a fast and distributed auth platform.”

Recent updates
Rollup ID recently made their public debut and has rolled out lots of new features since. Learn more here.

Targum

Translating videos at the speed of social media using AI.

Demo Day pitch

Why they chose Cloudflare
“Cloudflare Stream allows us to compete with YouTube's scale while being a 1-person startup, and Cloudflare Workers handles millions of unique views on Targum without waking us up at night.”

Recent updates
Targum launched its platform to customers and hit $100K MRR in just a few days! Check out their Built With Workers case study to learn more.

Touchless

Fixing website platforms without code.

Demo Day pitch

Why they chose Cloudflare
“Workers and the Cloudflare developer platform have been pivotal in enabling us to modernize and enhance existing website platforms and grow their conversions by 5X with little to no code.”

Recent updates
Touchless has been growing their ecosystem and recently joined the RudderStack Solutions Partner Program.

Introducing Cohort #2 of the Workers Launchpad!

We have received hundreds of applications from startups from nearly 50 different countries. There were many AI or AI-related companies helping everyone from developers, to security teams and sales organizations. We also heard from many startups looking to improve developer tooling and collaboration, new social and gaming platforms, and companies solving a wide range of problems that ecommerce, consumer, real estate, and other businesses face today.

While these applicants are tackling a diverse set of real-world problems, the common thread is that they chose to leverage Cloudflare’s developer platform to build more secure, scalable, and feature-rich products faster than they otherwise could.

Without further ado, we are thrilled to announce the 25 incredible startups selected for Cohort #2 of the Workers Launchpad:

Announcing Cohort #2 of the Workers Launchpad

Here’s what they’re building, in their own words:

42able.ai Making AI available and accessible to all.
ai.moda Automate delegating tasks to both your bots and human workers with an MTurk compatible API.
Arrive GG Real-time CDN for gamers.
Astro All-in-one web framework designed for speed. Pull your content from anywhere and deploy everywhere, all powered by your favorite UI components and libraries.
Azule Azule delivers AI agents that interact with your customers.
Brevity Build better software, visually.
Buildless Buildless is a global build cache, like Cloudflare for compiled code; we cache artifacts and make them available over the internet to exponentially accelerate developer velocity.
ChainFuse no-code platform to build multi-model AI for your business.
ChatORG Collaborative ChatGPT for your team.
Clerk Clerk, the drop-in authentication and user management solution for React.
contribute.design OpenSource Software & Design collaboration made easy.
Drifting in Space Drifting in Space builds software that enables developers to use WebSockets to create real-time applications.
Eclipse AI Prevent churn with generative AI.
Embley Marketplace automation platform enabling businesses to scale better and faster.
Fudge Fudge makes websites faster.
Mixer Real world social on a generative AI stack.
Monosnap Monosnap is a secure productivity SaaS with B2B PLG strategy, complementing existing workflows.
Nefeli Networks Unified and declarative cloud network management.
Smplrspace The digital floor plan platform.
Speech Labs AI assistant helping with everyday tasks.
TestApp.io Mobile app testing made easy.
Tigris Data Serverless NoSQL database and search platform to help developers quickly and easily build any application.
tldraw tldraw is building an infinite canvas for developers.
Vantyr The programmatic authorization layer for SaaS.
WunderGraph WunderGraph: The Backend for Frontend framework.

We are looking forward to working with each of these companies over the next few months and sharing what they’re building with you.

If you’re building on Cloudflare’s Developer Platform, head over to @CloudflareDev or join the Cloudflare Developer Discord community to stay in the loop on Launchpad updates. In the early fall, we’ll be selecting Cohort #3 — apply early here!

Cloudflare is not providing any funding or making any funding decisions, and there is no guarantee that any particular company will receive funding through the program. All funding decisions will be made by the venture capital firms that participate in the program. Cloudflare is not a registered broker-dealer, investment adviser, or other similar intermediary.

More Node.js APIs in Cloudflare Workers — Streams, Path, StringDecoder

Post Syndicated from James M Snell original http://blog.cloudflare.com/workers-node-js-apis-stream-path/

More Node.js APIs in Cloudflare Workers — Streams, Path, StringDecoder

More Node.js APIs in Cloudflare Workers — Streams, Path, StringDecoder

Today we are announcing support for three additional APIs from Node.js in Cloudflare Workers. This increases compatibility with the existing ecosystem of open source npm packages, allowing you to use your preferred libraries in Workers, even if they depend on APIs from Node.js.

We recently added support for AsyncLocalStorage, EventEmitter, Buffer, assert and parts of util. Today, we are adding support for:

We are also sharing a preview of a new module type, available in the open-source Workers runtime, that mirrors a Node.js environment more closely by making some APIs available as globals, and allowing imports without the node: specifier prefix.

You can start using these APIs today, in the open-source runtime that powers Cloudflare Workers, in local development, and when you deploy your Worker. Get started by enabling the nodejs_compat compatibility flag for your Worker.

Stream

The Node.js streams API is the original API for working with streaming data in JavaScript that predates the WHATWG ReadableStream standard. Now, a full implementation of Node.js streams (based directly on the official implementation provided by the Node.js project) is available within the Workers runtime.

Let's start with a quick example:

import {
  Readable,
  Transform,
} from 'node:stream';

import {
  text,
} from 'node:stream/consumers';

import {
  pipeline,
} from 'node:stream/promises';

// A Node.js-style Transform that converts data to uppercase
// and appends a newline to the end of the output.
class MyTransform extends Transform {
  constructor() {
    super({ encoding: 'utf8' });
  }
  _transform(chunk, _, cb) {
    this.push(chunk.toString().toUpperCase());
    cb();
  }
  _flush(cb) {
    this.push('\n');
    cb();
  }
}

export default {
  async fetch() {
    const chunks = [
      "hello ",
      "from ",
      "the ",
      "wonderful ",
      "world ",
      "of ",
      "node.js ",
      "streams!"
    ];

    function nextChunk(readable) {
      readable.push(chunks.shift());
      if (chunks.length === 0) readable.push(null);
      else queueMicrotask(() => nextChunk(readable));
    }

    // A Node.js-style Readable that emits chunks from the
    // array...
    const readable = new Readable({
      encoding: 'utf8',
      read() { nextChunk(readable); }
    });

    const transform = new MyTransform();
    await pipeline(readable, transform);
    return new Response(await text(transform));
  }
};

In this example we create two Node.js stream objects: one stream.Readable and one stream.Transform. The stream.Readable simply emits a sequence of individual strings, piped through the stream.Transform which converts those to uppercase and appends a new-line as a final chunk.

The example is straightforward and illustrates the basic operation of the Node.js API. For anyone already familiar with using standard WHATWG streams in Workers the pattern here should be recognizable.

The Node.js streams API is used by countless numbers of modules published on npm. Now that the Node.js streams API is available in Workers, many packages that depend on it can be used in your Workers. For example, the split2 module is a simple utility that can break a stream of data up and reassemble it so that every line is a distinct chunk. While simple, the module is downloaded over 13 million times each week and has over a thousand direct dependents on npm (and many more indirect dependents). Previously it was not possible to use split2 within Workers without also pulling in a large and complicated polyfill implementation of streams along with it. Now split2 can be used directly within Workers with no modifications and no additional polyfills. This reduces the size and complexity of your Worker by thousands of lines.

import {
  PassThrough,
} from 'node:stream';

import { default as split2 } from 'split2';

const enc = new TextEncoder();

export default {
  async fetch() {
    const pt = new PassThrough();
    const readable = pt.pipe(split2());

    pt.end('hello\nfrom\nthe\nwonderful\nworld\nof\nnode.js\nstreams!');
    for await (const chunk of readable) {
      console.log(chunk);
    }

    return new Response("ok");
  }
};

Path

The Node.js Path API provides utilities for working with file and directory paths. For example:

import path from "node:path"
path.join('/foo', 'bar', 'baz/asdf', 'quux', '..');

// Returns: '/foo/bar/baz/asdf'

Note that in the Workers implementation of path, the path.win32 variants of the path API are not implemented, and will throw an exception.

StringDecoder

The Node.js StringDecoder API is a simple legacy utility that predates the WHATWG standard TextEncoder/TextDecoder API and serves roughly the same purpose. It is used by Node.js' stream API implementation as well as a number of popular npm modules for the purpose of decoding UTF-8, UTF-16, Latin1, Base64, and Hex encoded data.

import { StringDecoder } from 'node:string_decoder';
const decoder = new StringDecoder('utf8');

const cent = Buffer.from([0xC2, 0xA2]);
console.log(decoder.write(cent));

const euro = Buffer.from([0xE2, 0x82, 0xAC]);
console.log(decoder.write(euro)); 

In the vast majority of cases, your Worker should just keep on using the standard TextEncoder/TextDecoder APIs, but the StringDecoder is available directly for workers to use now without relying on polyfills.

Node.js Compat Modules

One Worker can already be a bundle of multiple assets. This allows a single Worker to be made up of multiple individual ESM modules, CommonJS modules, JSON, text, and binary data files.

Soon there will be a new type of module that can be included in a Worker bundles: the NodeJsCompatModule.

A NodeJsCompatModule is designed to emulate the Node.js environment as much as possible. Within these modules, common Node.js global variables such as process, Buffer, and even __filename will be available. More importantly, it is possible to require() our Node.js core API implementations without using the node: specifier prefix. This maximizes compatibility with existing NPM packages that depend on globals from Node.js being present, or don’t import Node.js APIs using the node: specifier prefix.

Support for this new module type has landed in the open source workerd runtime, with deeper integration with Wrangler coming soon.

What’s next

We’re adding support for more Node.js APIs each month, and as we introduce new APIs, they will be added under the nodejs_compat compatibility flag — no need to take any action or update your compatibility date.

Have an NPM package that you wish worked on Workers, or an API you’d like to be able to use? Join the Cloudflare Developers Discord and tell us what you’re building, and what you’d like to see next.

Cloudflare Queues: messages at your speed with consumer concurrency and explicit acknowledgement

Post Syndicated from Charles Burnett original http://blog.cloudflare.com/messages-at-your-speed-with-concurrency-and-explicit-acknowledgement/

Cloudflare Queues: messages at your speed with consumer concurrency and explicit acknowledgement

Cloudflare Queues: messages at your speed with consumer concurrency and explicit acknowledgement

Communicating between systems can be a balancing act that has a major impact on your business. APIs have limits, billing frequently depends on usage, and end-users are always looking for more speed in the services they use. With so many conflicting considerations, it can feel like a challenge to get it just right. Cloudflare Queues is a tool to make this balancing act simple. With our latest features like consumer concurrency and explicit acknowledgment, it’s easier than ever for developers to focus on writing great code, rather than worrying about the fees and rate limits of the systems they work with.

Queues is a messaging service, enabling developers to send and receive messages across systems asynchronously with guaranteed delivery. It integrates directly with Cloudflare Workers, making for easy message production and consumption working with the many products and services we offer.

What’s new in Queues?

Consumer concurrency

Oftentimes, the systems we pull data from can produce information faster than other systems can consume them. This can occur when consumption involves processing information, storing it, or sending and receiving information to a third party system. The result of which is that sometimes, a queue can fall behind where it should be. At Cloudflare, a queue shouldn't be a quagmire. That’s why we’ve introduced Consumer Concurrency.

With Concurrency, we automatically scale up the amount of consumers needed to match the speed of information coming into any given queue. In this way, customers no longer have to worry about an ever-growing backlog of information bogging down their system.

How it works

When setting up a queue, developers can set a Cloudflare Workers script as a target to send messages to. With concurrency enabled, Cloudflare will invoke multiple instances of the selected Worker script to keep the messages in the queue moving effectively. This feature is enabled by default for every queue and set to automatically scale.

Autoscaling considers the following factors when spinning up consumers:  the number of messages in a queue, the rate of new messages, and successful vs. unsuccessful consumption attempts.

If a queue has enough messages in it, concurrency will increase each time a message batch is successfully processed. Concurrency is decreased when message batches encounter errors. Customers can set a max_concurrency value in the Dashboard or via Wrangler, which caps out how many consumers can be automatically created to perform processing for a given queue.

Setting the max_concurrency value manually can be helpful in the following situations where producer data is provided in bursts, the datasource API is rate limited, and datasource API has higher costs with more usage.

Setting a max concurrency value manually allows customers to optimize their workflows for other factors beyond speed.

// in your wrangler.toml file


[[queues.consumers]]
  queue = "my-queue"

//max concurrency can be set to a number between 1 and 10
//this defines the total amount of consumers running simultaneously

max_concurrency = 7

To learn more about concurrency you can check out our developer documentation here.

Concurrency in practice

It’s baseball season in the US, and for many of us that means fantasy baseball is back! This year is the year we finally write a program that uses data and statistics to pick a winning team, as opposed to picking players based on “feelings” and “vibes”. We’re engineers after all, and baseball is a game of rules. If the Oakland A’s can do it, so can we!

So how do we put this together? We’ll need a few things:

  1. A list of potential players
  2. An API to pull historical game statistics from
  3. A queue to send this data to its consumer
  4. A Worker script to crunch the numbers and generate a score

A developer can pull from a baseball reference API into a Workers script, and from that worker pass this information to a queue. Historical data is… historical, so we can pull data into our queue as fast as the baseball API will allow us. For our list of potential players, we pull statistics for each game they’ve played. This includes everything from batting averages, to balls caught, to game day weather. Score!

//get data from a third party API and pass it along to a queue


const response = await fetch("http://example.com/baseball-stats.json");
const gamesPlayedJSON = await response.json();

for (game in gamesPlayedJSON){
//send JSON to your queue defined in your workers environment
env.baseballqueue.send(jsonData)
}

Our producer Workers script then passes these statistics onto the queue. As each game contains quite a bit of data, this results in hundreds of thousands of “game data” messages waiting to be processed in our queue. Without concurrency, we would have to wait for each batch of messages to be processed one at a time, taking minutes if not longer. But, with Consumer Concurrency enabled, we watch as multiple instances of our worker script invoked to process this information in no time!

Our Worker script would then take these statistics, apply a heuristic, and store the player name and a corresponding quality score into a database like a Workers KV store for easy access by your application presenting the data.

Explicit Acknowledgment

In Queues previously, a failure of a single message in a batch would result in the whole batch being resent to the consumer to be reprocessed. This resulted in extra cycles being spent on messages that were processed successfully, in addition to the failed message attempt. This hurts both customers and developers, slowing processing time, increasing complexity, and increasing costs.

With Explicit Acknowledgment, we give developers the precision and flexibility to handle each message individually in their consumer, negating the need to reprocess entire batches of messages. Developers can now tell their queue whether their consumer has properly processed each message, or alternatively if a specific message has failed and needs to be retried.

An acknowledgment of a message means that that message will not be retried if the batch fails. Only messages that were not acknowledged will be retried. Inversely, a message that is explicitly retried, will be sent again from the queue to be reprocessed without impacting the processing of the rest of the messages currently being processed.

How it works

In your consumer, there are 4 new methods you can call to explicitly acknowledge a given message: .ack(), .retry(), .ackAll(), .retryAll().

Both ack() and retry() can be called on individual messages. ack() tells a queue that the message has been processed successfully and that it can be deleted from the queue, whereas retry() tells the queue that this message should be put back on the queue and delivered in another batch.

async queue(batch, env, ctx) {
    for (const msg of batch.messages) {
	try {
//send our data to a 3rd party for processing
await fetch('https://thirdpartyAPI.example.com/stats', {
	method: 'POST',
	body: msg, 
	headers: {
		'Content-type': 'application/json'
}
});
//acknowledge if successful
msg.ack();
// We don't have to re-process this if subsequent messages fail!
}
catch (error) {
	//send message back to queue for a retry if there's an error
      msg.retry();
		console.log("Error processing", msg, error);
}
    }
  }

ackAll() and retryAll() work similarly, but act on the entire batch of messages instead of individual messages.

For more details check out our developer documentation here.

Explicit Acknowledgment in practice

In the course of making our Fantasy Baseball team picker, we notice that data isn’t always sent correctly from the baseball reference API. This results in data not being correctly parsed and rejected from our player heuristics.

Without Explicit Acknowledgment, the entire batch of baseball statistics would need to be retried. Thankfully, we can use Explicit Acknowledgment to avoid that, and tell our queue which messages were parsed successfully and which were not.

import heuristic from "baseball-heuristic";
export default {
  async queue(batch: MessageBatch, env: Env, ctx: ExecutionContext) {
    for (const msg of batch.messages) {
      try {
        // Calculate the score based on the game stats
        heuristic.generateScore(msg)
        // Explicitly acknowledge results 
        msg.ack()
      } catch (err) {
        console.log(err)
        // Retry just this message
        msg.retry()
      } 
    }
  },
};

Higher throughput

Under the hood, we’ve been working on improvements to further increase the amount of messages per second each queue can handle. In the last few months, that number has quadrupled, improving from 100 to over 400 messages per second.

Scalability can be an essential factor when deciding which services to use to power your application. You want a service that can grow with your business. We are always aiming to improve our message throughput and hope to see this number quadruple again over the next year. We want to grow with you.

What’s next?

As our service grows, we want to provide our customers with more ways to interact with our service beyond the traditional Cloudflare Workers workflow. We know our customers’ infrastructure is often complex, spanning across multiple services. With that in mind, our focus will be on enabling easy connection to services both within the Cloudflare ecosystem and beyond.

R2 as a consumer

Today, the only type of consumer you can configure for a queue is a Workers script. While Workers are incredibly powerful, we want to take it a step further and give customers a chance to write directly to other services, starting with R2. Coming soon, customers will be able to select an R2 bucket in the Cloudflare Dashboard for a Queue to write to directly, no code required. This will save valuable developer time by avoiding the initial setup in a Workers script, and any maintenance that is required as services evolve. With R2 as a first party consumer in Queues, customers can simply select their bucket, and let Cloudflare handle the rest.

HTTP pull

We're also working to allow you to consume messages from existing infrastructure you might have outside of Cloudflare. Cloudflare Queues will provide an HTTP API for each queue from which any consumer can pull batches of messages for processing. Customers simply make a request to the API endpoint for their queue, receive data they requested, then send an acknowledgment that they have received the data, so the queue can continue working on the next batch.

Always working to be faster

For the Queues team, speed is always our focus, as we understand our customers don't want bottlenecks in the performance of their applications. With this in mind the team will be continuing to look for ways to increase the velocity through which developers can build best in class applications on our developer platform. Whether it's reducing message processing time, the amount of code you need to manage, or giving developers control over their application pipeline, we will continue to implement solutions to allow you to focus on just the important things, while we handle the rest.

Cloudflare Queues is currently in Open Beta and ready to power your most complex applications.

Check out our getting started guide and build your service with us today!

Announcing Cloudflare Secrets Store

Post Syndicated from Dina Kozlov original http://blog.cloudflare.com/secrets-store/

Announcing Cloudflare Secrets Store

Announcing Cloudflare Secrets Store

We’re excited to announce Secrets Store – Cloudflare’s new secrets management offering!

A secrets store does exactly what the name implies – it stores secrets. Secrets are variables that are used by developers that contain sensitive information – information that only authorized users and systems should have access to.

If you’re building an application, there are various types of secrets that you need to manage. Every system should be designed to have identity & authentication data that verifies some form of identity in order to grant access to a system or application. One example of this is API tokens for making read and write requests to a database. Failure to store these tokens securely could lead to unauthorized access of information – intentional or accidental.

The stakes with secret’s management are high. Every gap in the storage of these values has potential to lead to a data leak or compromise. A security administrator’s worst nightmare.

Developers are primarily focused on creating applications, they want to build quickly, they want their system to be performant, and they want it to scale. For them, secrets management is about ease of use, performance, and reliability. On the other hand, security administrators are tasked with ensuring that these secrets remain secure. It’s their responsibility to safeguard sensitive information, ensure that security best practices are met, and to manage any fallout of an incident such as a data leak or breach. It’s their job to verify that developers at their company are building in a secure and foolproof manner.

In order for developers to build at high velocity and for security administrators to feel at ease, companies need to adopt a highly reliable and secure secrets manager. This should be a system that ensures that sensitive information is stored with the highest security measures, while maintaining ease of use that will allow engineering teams to efficiently build.

Why Cloudflare is building a secrets store

Cloudflare’s mission is to help build a better Internet – that means a more secure Internet. We recognize our customers’ need for a secure, centralized repository for storing sensitive data. Within the Cloudflare ecosystem, are various places where customers need to store and access API and authorization tokens, shared secrets, and sensitive information. It’s our job to make it easy for customers to manage these values securely.

The need for secrets management goes beyond Cloudflare. Customers have sensitive data that they manage everywhere – at their cloud provider, on their own infrastructure, across machines. Our plan is to make our Secrets Store a one-stop shop for all of our customer’s secrets.

The evolution of secrets at Cloudflare

In 2020, we launched environment variables and secrets for Cloudflare Workers, allowing customers to create and encrypt variables across their Worker scripts. By doing this, developers can obfuscate the value of a variable so that it’s no longer available in plaintext and can only be accessed by the Worker.

Announcing Cloudflare Secrets Store

Adoption and use of these secrets is quickly growing. We now have more than three million Workers scripts that reference variables and secrets managed through Cloudflare. One piece of feedback that we continue to hear from customers is that these secrets are scoped too narrowly.

Today, customers can only use a variable or secret within the Worker that it’s associated with. Instead, customers have secrets that they share across Workers. They don’t want to re-create those secrets and focus their time on keeping them in sync. They want account level secrets that are managed in one place but are referenced across multiple Workers scripts and functions.

Outside of Workers, there are many use cases for secrets across Cloudflare services.

Inside our Web Application Firewall (WAF), customers can make rules that look for authorization headers in order to grant or deny access to requests. Today, when customers create these rules, they put the authorization header value in plaintext, so that anyone with WAF access in the Cloudflare account can see its value. What we’ve heard from our customers is that even internally, engineers should not have access to this type of information. Instead, what our customers want is one place to manage the value of this header or token, so that only authorized users can see, create, and rotate this value. Then when creating a WAF rule, engineers can just reference the associated secret e.g.“account.mysecretauth”. By doing this, we help our customers secure their system by reducing the access scope and enhance management of this value by keeping it updated in one place.

Announcing Cloudflare Secrets Store

With new Cloudflare products and features quickly developing, we’re hearing more and more use cases for a centralized secrets manager. One that can be used to store Access Service tokens or shared secrets for Webhooks.

With the new account level Secrets Store, we’re excited to give customers the tools they need to manage secrets across Cloudflare services.

Securing the Secret Store

To have a secrets store, there are a number of measures that need to be in place, and we’re committing to providing these for our customers.

First, we’re going to give the tools that our customers need to restrict access to secrets. We will have scope permissions that will allow admins to choose which users can view, create, edit, or remove secrets. We also plan to add the same level of granularity to our services – giving customers the ability to say “only allow this Worker to access this secret and only allow this set of Firewall rules to access that secret”.

Announcing Cloudflare Secrets Store

Next, we’re going to give our customers extensive audits that will allow them to track the access and use of their secrets. Audit logs are crucial for security administrators. They can be used to alert team members that a secret was used by an unauthorized service or that a compromised secret is being accessed when it shouldn’t be. We will give customers audit logs for every secret-related event, so that customers can see exactly who is making changes to secrets and which services are accessing and when.

In addition to the built-in security of the Secrets Store, we’re going to give customers the tools to rotate their encryption keys on-demand or at a cadence that fits the right security posture for them.

Sign up for the beta

We’re excited to get the Secrets Store in our customer’s hands. If you’re interested in using this, please fill out this form, and we’ll reach out to you when it’s ready to use.

How Cloudflare is powering the next generation of platforms with Workers

Post Syndicated from Nathan Disidore original http://blog.cloudflare.com/powering-platforms-on-workers/

How Cloudflare is powering the next generation of platforms with Workers

How Cloudflare is powering the next generation of platforms with Workers

We launched Workers for Platforms, our Workers offering for SaaS businesses, almost exactly one year ago to the date! We’ve seen a wide array of customers using Workers for Platforms – from e-commerce to CMS, low-code/no-code platforms and also a new wave of AI businesses running tailored inference models for their end customers!

Let’s take a look back and recap why we built Workers for Platforms, show you some of the most interesting problems our customers have been solving and share new features that are now available!

What is Workers for Platforms?

SaaS businesses are all too familiar with the never ending need to keep up with their users' feature requests. Thinking back, the introduction of Workers at Cloudflare was to solve this very pain point. Workers gave our customers the power to program our network to meet their specific requirements!

Need to implement complex load balancing across many origins? Write a Worker. Want a custom set of WAF rules for each region your business operates in? Go crazy, write a Worker.

We heard the same themes coming up with our customers – which is why we partnered with early customers to build Workers for Platforms. We worked with the Shopify Oxygen team early on in their journey to create a built-in hosting platform for Hydrogen, their Remix-based eCommerce framework. Shopify’s Hydrogen/Oxygen combination gives their merchants the flexibility to build out personalized shopping for buyers. It’s an experience that storefront developers can make their own, and it’s powered by Cloudflare Workers behind the scenes. For more details, check out Shopify’s “How we Built Oxygen” blog post.

Oxygen is Shopify's built-in hosting platform for Hydrogen storefronts, designed to provide users with a seamless experience in deploying and managing their ecommerce sites. Our integration with Workers for Platforms has been instrumental to our success in providing fast, globally-available, and secure storefronts for our merchants. The flexibility of Cloudflare's platform has allowed us to build delightful merchant experiences that integrate effortlessly with the best that the Shopify ecosystem has to offer.
Lance Lafontaine, Senior Developer Shopify Oxygen

Another customer that we’ve been working very closely with is Grafbase. Grafbase started out on the Cloudflare for Startups program, building their company from the ground up on Workers. Grafbase gives their customers the ability to deploy serverless GraphQL backends instantly. On top of that, their developers can build custom GraphQL resolvers to program their own business logic right at the edge. Using Workers and Workers for Platforms means that Grafbase can focus their team on building Grafbase, rather than having to focus on building and architecting at the infrastructure layer.

Our mission at Grafbase is to enable developers to deploy globally fast GraphQL APIs without worrying about complex infrastructure. We provide a unified data layer at the edge that accelerates development by providing a single endpoint for all your data sources. We needed a way to deploy serverless GraphQL gateways for our customers with fast performance globally without cold starts. We experimented with container-based workloads and FaaS solutions, but turned our attention to WebAssembly (Wasm) in order to achieve our performance targets. We chose Rust to build the Grafbase platform for its performance, type system, and its Wasm tooling. Cloudflare Workers was a natural fit for us given our decision to go with Wasm. On top of using Workers to build our platform, we also wanted to give customers the control and flexibility to deploy their own logic. Workers for Platforms gave us the ability to deploy customer code written in JavaScript/TypeScript or Wasm straight to the edge.
Fredrik Björk, Founder & CEO at Grafbase

Over the past year, it’s been incredible seeing the velocity that building on Workers allows companies both big and small to move at.

New building blocks

Workers for Platforms uses Dynamic Dispatch to give our customers, like Shopify and Grafbase, the ability to run their own Worker before user code that’s written by Shopify and Grafbase’s developers is executed. With Dynamic Dispatch, Workers for Platforms customers (referred to as platform customers) can authenticate requests, add context to a request or run any custom code before their developer’s Workers (referred to as user Workers) are called.

This is a key building block for Workers for Platforms, but we’ve also heard requests for even more levels of visibility and control from our platform customers. Delivering on this theme, we’re releasing three new highly requested features:

Outbound Workers

Dynamic Dispatch gives platforms visibility into all incoming requests to their user’s Workers, but customers have also asked for visibility into all outgoing requests from their user’s Workers in order to do things like:

  • Log all subrequests in order to identify malicious hosts or usage patterns
  • Create allow or block lists for hostnames requested by user Workers
  • Configure authentication to your APIs behind the scenes (without end developers needing to set credentials)

Outbound Workers sit between user Workers and fetch() requests out to the Internet. User Workers will trigger a FetchEvent on the Outbound Worker and from there platform customers have full visibility over the request before it’s sent out.

How Cloudflare is powering the next generation of platforms with Workers

It’s also important to have context in the Outbound Worker to answer questions like “which user Worker is this request coming from?”. You can declare variables to pass through to the Outbound Worker in the dispatch namespaces binding:

[[dispatch_namespaces]]
binding = "dispatcher"
namespace = "<NAMESPACE_NAME>"
outbound = {service = "<SERVICE_NAME>", parameters = [customer_name,url]}

From there, the variables declared in the binding can be accessed in the Outbound Worker through env. <VAR_NAME>.

Custom Limits

Workers are really powerful, but, as a platform, you may want guardrails around their capabilities to shape your pricing and packaging model. For example, if you run a freemium model on your platform, you may want to set a lower CPU time limit for customers on your free tier.

Custom Limits let you set usage caps for CPU time and number of subrequests on your customer’s Workers. Custom limits are set from within your dynamic dispatch Worker allowing them to be dynamically scripted. They can also be combined to set limits based on script tags.

Here’s an example of a Dynamic Dispatch Worker that puts both Outbound Workers and Custom Limits together:

export default {
async fetch(request, env) {
  try {
    let workerName = new URL(request.url).host.split('.')[0];
    let userWorker = env.dispatcher.get(
      workerName,
      {},
      {// outbound arguments
       outbound: {
           customer_name: workerName,
           url: request.url},
        // set limits
       limits: {cpuMs: 10, subRequests: 5}
      }
    );
    return await userWorker.fetch(request);
  } catch (e) {
    if (e.message.startsWith('Worker not found')) {
      return new Response('', { status: 404 });
    }
    return new Response(e.message, { status: 500 });
  }
}
};

They’re both incredibly simple to configure, and the best part – the configuration is completely programmatic. You have the flexibility to build on both of these features with your own custom logic!

Tail Workers

Live logging is an essential piece of the developer experience. It allows developers to monitor for errors and troubleshoot in real time. On Workers, giving users real time logs though wrangler tail is a feature that developers love! Now with Tail Workers, platform customers can give their users the same level of visibility to provide a faster debugging experience.

Tail Worker logs contain metadata about the original trigger event (like the incoming URL and status code for fetches), console.log() messages and capture any unhandled exceptions. Tail Workers can be added to the Dynamic Dispatch Worker in order to capture logs from both the Dynamic Dispatch Worker and any User Workers that are called.

A Tail Worker can be configured by adding the following to the wrangler.toml file of the producing script

tail_consumers = [{service = "<TAIL_WORKER_NAME>", environment = "<ENVIRONMENT_NAME>"}]

From there, events are captured in the Tail Worker using a new tail handler:

export default {
  async tail(events) => {
    fetch("https://example.com/endpoint", {
      method: "POST",
      body: JSON.stringify(events),
    })
  }
}

Tail Workers are full-fledged Workers empowered by the usual Worker ecosystem. You can send events to any HTTP endpoint, like for example a logging service that parses the events and passes on real-time logs to customers.

Try it out!

All three of these features are now in open beta for users with access to Workers for Platforms. For more details and try them out for yourself, check out our developer documentation:

Workers for Platforms is an enterprise only product (for now) but we’ve heard a lot of interest from developers. In the later half of the year, we’ll be bringing Workers for Platforms down to our pay as you go plan! In the meantime, if you’re itching to get started, reach out to us through the Cloudflare Developer Discord (channel name: workers-for-platforms).

A whole new Quick Edit in Cloudflare Workers

Post Syndicated from Samuel Macleod original http://blog.cloudflare.com/improved-quick-edit/

A whole new Quick Edit in Cloudflare Workers

A whole new Quick Edit in Cloudflare Workers

Quick Edit is a development experience for Cloudflare Workers, embedded right within the Cloudflare dashboard. It’s the fastest way to get up and running with a new worker, and lets you quickly preview and deploy changes to your code.

We’ve spent a lot of recent time working on upgrading the local development experience to be as useful as possible, but the Quick Edit experience for editing Workers has stagnated since the release of workers.dev. It’s time to give Quick Edit some love and bring it up to scratch with the expectations of today's developers.

Before diving into what’s changed—a quick overview of the current Quick Edit experience:

A whole new Quick Edit in Cloudflare Workers

We used the robust Monaco editor, which took us pretty far—it’s even what VSCode uses under the hood! However, Monaco is fairly limited in what it can do. Developers are used to the full power of their local development environment, with advanced IntelliSense support and all the power of a full-fledged IDE. Compared to that, a single file text editor is a step-down in expressiveness and functionality.

VSCode for Web

Today, we’re rolling out a new Quick Edit experience for Workers, powered by VSCode for Web. This is a huge upgrade, allowing developers to work in a familiar environment. This isn’t just about familiarity though—using VSCode for Web to power Quick Edit unlocks significant new functionality that was previously only possible with a local development setup using Wrangler.

A whole new Quick Edit in Cloudflare Workers

Support for multiple modules!

Cloudflare Workers released support for the Modules syntax in 2021, which is the recommended way to write Workers. It leans into modern JavaScript by leveraging the ES Module syntax, and lets you define Workers by exporting a default object containing event handlers.

export default {
 async fetch(request, env) {
   return new Response("Hello, World!")
 }
}

There are two sides of the coin when it comes to ES Modules though: exports and imports. Until now, if you wanted to organise your worker in multiple modules you had to use Wrangler and a local development setup. Now, you’ll be able to write multiple modules in the dashboard editor, and import them, just as you can locally. We haven’t enabled support for importing modules from npm yet, but that’s something we’re actively exploring—stay tuned!

A whole new Quick Edit in Cloudflare Workers

Edge Preview

A whole new Quick Edit in Cloudflare Workers

When editing a worker in the dashboard, Cloudflare spins up a preview of your worker, deployed from the code you’re currently working on. This helps speed up the feedback loop when developing a worker, and makes it easy to test changes without impacting production traffic (see also, wrangler dev).

However, the in-dashboard preview hasn’t historically been a high-fidelity match for the deployed Workers runtime. There were various differences in behaviour between the dashboard preview environment and a deployed worker, and it was difficult to have full confidence that a worker that worked in the preview would work in the deployed environment.

That changes today! We’ve changed the dashboard preview environment to use the same system that powers wrangler dev. This means that your preview worker will be run on Cloudflare's global network, the same environment as your deployed workers.

Helpful error messages

In the previous dashboard editor, the experience when your code throws an error wasn’t great. Unless you wrap your worker code in a try-catch handler, the preview will show a blank page when your worker throws an error. This can make it really tricky to debug your worker, and is pretty frustrating. With the release of the new Quick Editor, we now wrap your worker with error handling code that shows helpful error pages, complete with error stack traces and detailed descriptions.

A whole new Quick Edit in Cloudflare Workers

Typechecking

TypeScript is incredibly popular, and developers are more and more used to writing their workers in TypeScript. While the dashboard editor still only allows JavaScript files (and you’re unable to write TypeScript directly) we wanted to support modern typed JavaScript development as much as we could. To that end, the new dashboard editor has full support for JSDoc TypeScript syntax, with the TypeScript environment for workers (link) preloaded. This means that writing code with type errors will show a familiar squiggly red line, and Cloudflare APIs like HTMLRewriter will be autocompleted.

A whole new Quick Edit in Cloudflare Workers

How we built it

It wouldn’t be a Cloudflare blog post without a deep dive into the nuts and bolts of what we’ve built!

First, an overview—how does this work at a high level? We embed VSCode for Web in the Cloudflare dashboard as an iframe, and communicate with it over a MessageChannel. When the iframe is loaded, the Cloudflare dashboard sends over the contents of your worker to a VSCode for Web extension. This extension seeds an in-memory filesystem from which VSCode for Web reads. When you edit files in VSCode for Web, the updated files are sent back over the same MessageChannel to the Cloudflare dashboard, where they’re uploaded as a previewed worker to Cloudflare's global network.

As with any project of this size, the devil is in the details. Let’s focus on a specific area —how we communicate with VSCode for Web’s iframe from the Cloudflare dashboard.

The MessageChannel browser API enables relatively easy cross-frame communication—in this case, from an iframe embedder to the iframe itself. To use it, you construct an instance and access the port1 and port2 properties:

const channel = new MessageChannel()

// The MessagePort you keep a hold of
channel.port1

// The MessagePort you send to the iframe
channel.port2

We store a reference to the MessageChannel to use across component renders with useRef(), since React would otherwise create a new MessageChannel instance with every render.

With that out of the way, all that remains is to send channel.port2 to VSCode for Web’s iframe, via a call to postMessage().

// A reference to the iframe embedding VSCode for Web
const editor = document.getElementById("vscode")

// Wait for the iframe to load 
editor.addEventListener('load', () => {
	// Send over the MessagePort
editor.contentWindow.postMessage('PORT', '*', [
channel.port2
]);
});

An interesting detail here is how the MessagePort is sent over to the iframe. The third argument to postMessage() indicates a sequence of Transferable objects. This transfers ownership of port2 to the iframe, which means that any attempts to access it in the original context will throw an exception.

At this stage the dashboard has loaded an iframe containing VSCode for Web, initialised a MessageChannel, and sent over a MessagePort to the iframe. Let’s switch context—the iframe now needs to catch the MessagePort and start using it to communicate with the embedder (Cloudflare’s dashboard).

window.onmessage = (e) => {
if (e.data === "PORT") {
	// An instance of a MessagePort
const port = e.ports[0]
}
};

Relatively straightforward! With not that much code, we’ve set up communication and can start sending more complex messages across. Here’s an example of how we send over the initial worker content from the dashboard to the VSCode for Web iframe:

// In the Cloudflare dashboard

// The modules that make up your worker
const files = [
  {
    path: 'index.js',
    contents: `
		import { hello } from "./world.js"
export default {
			fetch(request) {
				return new Response(hello)
			}
		}`
  },
  {
    path: 'world.js',
    contents: `export const hello = "Hello World"`
  }
];

channel.port1.postMessage({
  type: 'WorkerLoaded',
  // The worker name
  name: 'your-worker-name',
  // The worker's main module
  entrypoint: 'index.js',
  // The worker's modules
  files: files
});

If you’d like to learn more about our approach, you can explore the code we’ve open sourced as part of this project, including the VSCode extension we’ve written to load data from the Cloudflare dashboard, our patches to VSCode, and our VSCode theme.

We’re not done!

This is a huge overhaul of the dashboard editing experience for Workers, but we’re not resting on our laurels! We know there’s a long way to go before developing a worker in the browser will offer the same experience as developing a worker locally with Wrangler, and we’re working on ways to close that gap. In particular, we’re working on adding Typescript support to the editor, and supporting syncing to external Git providers like GitHub and GitLab.

We’d love to hear any feedback from you on the new editing experience—come say hi and ask us any questions you have on the Cloudflare Discord!

Modernizing the toolbox for Cloudflare Pages builds

Post Syndicated from Greg Brimble original http://blog.cloudflare.com/moderizing-cloudflare-pages-builds-toolbox/

Modernizing the toolbox for Cloudflare Pages builds

Modernizing the toolbox for Cloudflare Pages builds

Cloudflare Pages launched over two years ago in December 2020, and since then, we have grown Pages to build millions of deployments for developers. In May 2022, to support developers with more complex requirements, we opened up Pages to empower developers to create deployments using their own build environments — but that wasn't the end of our journey. Ultimately, we want to be able to allow anyone to use our build platform and take advantage of the git integration we offer. You should be able to connect your repository and have it just work on Cloudflare Pages.

Today, we're introducing a new beta version of our build system (a.k.a. "build image") which brings the default set of tools and languages up-to-date, and sets the stage for future improvements to builds on Cloudflare Pages. We now support the latest versions of Node.js, Python, Hugo and many more, putting you on the best path for any new projects that you undertake. Existing projects will continue to use the current build system, but this upgrade will be available to opt-in for everyone.

New defaults, new possibilities

The Cloudflare Pages build system has been updated to not only support new versions of your favorite languages and tools, but to also include new versions by default. The versions of 2020 are no longer relevant for the majority of today's projects, and as such, we're bumping these to their more modern equivalents:

  • Node.js' default is being increased from 12.18.0 to 18.16.0,
  • Python 2.7.18 and 3.10.5 are both now available by default,
  • Ruby's default is being increased from 2.7.1 to 3.2.2,
  • Yarn's default is being increased from 1.22.4 to 3.5.1,
  • And we're adding pnpm with a default version of 8.2.0.

These are just some of the headlines — check out our documentation for the full list of changes.

We're aware that these new defaults constitute a breaking change for anyone using a project without pinning their versions with an environment variable or version file. That's why we're making this new build system opt-in for existing projects. You'll be able to stay on the existing system without breaking your builds. If you do decide to adventure with us, we make it easy to test out the new system in your preview environments before rolling out to production.

Modernizing the toolbox for Cloudflare Pages builds

Additionally, we're now making your builds more reproducible by taking advantage of lockfiles with many package managers. npm ci and yarn --pure-lockfile are now used ahead of your build command in this new version of the build system.

For new projects, these updated defaults and added support for pnpm and Yarn 3 mean that more projects will just work immediately without any undue setup, tweaking, or configuration. Today, we're launching this update as a beta, but we will be quickly promoting it to general availability once we're satisfied with its stability. Once it does graduate, new projects will use this updated build system by default.

We know that this update has been a long-standing request from our users (we thank you for your patience!) but part of this rollout is ensuring that we are now in a better position to make regular updates to Cloudflare Pages' build system. You can expect these default languages and tools to now keep pace with the rapid rate of change seen in the world of web development.

We very much welcome your continued feedback as we know that new tools can quickly appear on the scene, and old ones can just as quickly drop off. As ever, our Discord server is the best place to engage with the community and Pages team. We’re excited to hear your thoughts and suggestions.

Our modular and scalable architecture

Powering this updated build system is a new architecture that we've been working on behind-the-scenes. We're no strangers to sweeping changes of our build infrastructure: we've done a lot of work to grow and scale our infrastructure. Moving beyond purely static site hosting with Pages Functions brought a new wave of users, and as we explore convergence with Workers, we expect even more developers to rely on our git integrations and CI builds. Our new architecture is being rolled out without any changes affecting users, so unless you're interested in the technical nitty-gritty, feel free to stop reading!

The biggest change we're making with our architecture is its modularity. Previously, we were using Kubernetes to run a monolithic container which was responsible for everything for the build. Within the same image, we'd stream our build logs, clone the git repository, install any custom versions of languages and tools, install a project's dependencies, run the user's build command, and upload all the assets of the build. This was a lot of work for one container! It meant that our system tooling had to be compatible with versions in the user's space and therefore new default versions were a massive change to make. This is a big part of why it took us so long to be able to update the build system for our users.

In the new architecture, we've broken these steps down into multiple separate containers. We make use of Kubernetes' init containers feature and instead of one monolithic container, we have three that execute sequentially:

  1. clone a user's git repository,
  2. install any custom versions of languages and tools, install a project's dependencies, run the user's build command, and
  3. upload all the assets of a build.

We use a shared volume to give the build a persistent workspace to use between containers, but now there is clear isolation between system stages (cloning a repository and uploading assets) and user stages (running code that the user is responsible for). We no longer need to worry about conflicting versions, and we've created an additional layer of security by isolating a user's control to a separate environment.

Modernizing the toolbox for Cloudflare Pages builds

We're also aligning the final stage, the one responsible for uploading static assets, with the same APIs that Wrangler uses for Direct Upload projects. This reduces our maintenance burden going forward since we'll only need to consider one way of uploading assets and creating deployments. As we consolidate, we're exploring ways to make these APIs even faster and more reliable.

Logging out

You might have noticed that we haven't yet talked about how we're continuing to stream build logs. Arguably, this was one of the most challenging pieces to work out. When everything ran in a single container, we were able to simply latch directly into the stdout of our various stages and pipe them through to a Durable Object which could communicate with the Cloudflare dashboard.

By introducing this new isolation between containers, we had to get a bit more inventive. After prototyping a number of approaches, we've found one that we like. We run a separate, global log collector container inside Kubernetes which is responsible for collating logs from a build, and passing them through to that same Durable Object infrastructure. The one caveat is that the logs now need to be annotated with which build they are coming from, since one global log collector container accepts logs from multiple builds. A Worker in front of the Durable Object is responsible for reading the annotation and delegating to the relevant build's Durable Object instance.

Modernizing the toolbox for Cloudflare Pages builds

Caching in

With this new modular architecture, we plan to integrate a feature we've been teasing for a while: build caching. Today, when you run a build in Cloudflare Pages, we start fresh every time. This works, but it's inefficient.

Very often, only small changes are actually made to your website between deployments: you might tweak some text on your homepage, or add a new blog post; but rarely does the core foundation of your site actually change between deployments. With build caching, we can reuse some of the work from earlier builds to speed up subsequent builds. We'll offer a best-effort storage mechanism that allows you to persist and restore files between builds. You'll soon be able to cache dependencies, as well as the build output itself if your framework supports it, resulting in considerably faster builds and a tighter feedback loop from push to deploy.

This is possible because our new modular design has clear divides between the stages where we'd want to restore and cache files.

Modernizing the toolbox for Cloudflare Pages builds

Start building

We're excited about the improvements that this new modular architecture will afford the Pages team, but we're even more excited for how this will result in faster and more scalable builds for our users. This architecture transition is rolling out behind-the-scenes, but the updated beta build system with new languages and tools is available to try today. Navigate to your Pages project settings in the Cloudflare Dashboard to opt-in.

Let us know if you have any feedback on the Discord server, and stay tuned for more information about build caching in upcoming posts on this blog. Later today (Wednesday 17th, 2023), the Pages team will be hosting a Q&A session to talk about this announcement on Discord at 17:30 UTC.

Making Cloudflare the best place for your web applications

Post Syndicated from Igor Minar original http://blog.cloudflare.com/making-cloudflare-for-web/

Making Cloudflare the best place for your web applications

Making Cloudflare the best place for your web applications

Hey web developers! We are about to shake things up a bit here at Cloudflare and wanted to give you a heads-up, so that you know what we are doing and where we are going. You might know Cloudflare as one of the best places to come to when you need to protect, speed up, or scale your web application, but increasingly Cloudflare is also becoming the best place to deploy and run your application!

Why deploy your application to Cloudflare? Two simple reasons. First, it removes lots of hassle of managing many separate systems and allows you to develop, deploy, monitor, and tune your application all in one place. Second, by deploying to Cloudflare directly, there is so much more we can do to optimize your application and get it to the hands, ears, or eyes of your users more quickly and smoothly.

So what’s changing? Quite a bit, actually. I’m not going to bore you with rehashing all the details as my most-awesome colleagues have written separate blog posts with all the details, but here is a high level rundown.

Cloudflare Workers + Pages = awesome development platform

Cloudflare Pages and Workers are merging into a single unified development and application hosting platform that offers:

  • Super low latency globally: your static assets and compute are less than 50ms away from 95% of the world’s Internet-connected population.
  • Free egress including free static asset hosting.
  • Standards-based JavaScript and WASM runtime that already serves over 10 million requests per second at peak globally.
  • Access to powerful features like R2 (object storage with an S3-compatible API), low-latency globally replicated KV storage, Queues, D1 database, and many more.
  • Support for GitOps and CI/CD workflows and preview environments to boost development velocity.
  • … and so much more.

While mathematically proven to be wrong, we stubbornly believe that 1+1=3, and in this case this translates to Cloudflare Pages + Workers = way more than the sum of the parts. In fact, it’s an awesome foundation for one of a kind development platform that we are thrilled to be building for you.

We started this product convergence journey a few quarters ago, and early on agreed upon not leaving any of the existing applications behind. Instead, we’ll be bringing them over to this new world. Today we are ready to start sharing the incremental results, with so much more to come over the upcoming quarters. Want to know more? My colleague Nevi posted lots of spicy details in her blog post.

Smart Placement for Workers takes us beyond the edge!

Smart placement is, to put it simply, revolutionary for Cloudflare. It enables a new compute paradigm on our platform, unmatched by any other application hosting providers today. Do you have a typical full-stack application built with one of the many popular web frameworks? This feature is for you! And it works with both Workers and Pages!

While previously we always executed all applications at the “edge” of our global network — meaning, as close to the user as possible. With smart placement, we intelligently determine the best location within our network where the compute (your application) should run. We do this by observing your application’s behavior and what other network resources or endpoints the application interacts with. We then transparently spawn your application at an optimal location, usually close to where your data is stored, and route the incoming requests via our network to this location.

Smart placement enables applications to run near to the data these applications need to get stuff done. This is especially powerful for applications that interact with databases, object stores, or other backend endpoints, especially if these are centralized and not globally distributed.

Your user or clients requests still enter our lightning fast network in one of our 285+ datacenters in the world, close to their current location, but instead of spawning the application right there, we route the request to the most optimal datacenter, the one that is near the data or backend system the application talks to.

This doesn’t mean that compute at the edge is not cool anymore! It is! There are still many use-cases where running your application at the edge makes sense, and smart placement will determine this scenario and keep the application at the edge if that’s the right place for it to be. A/B testing, localization, asset serving, and others are use-cases that should almost always happen at the edge.

Sounds interesting? Check out this visual demo and read up on Smart Placement in a blog post from my colleague Tanushree to get started.

Develop locally or in the browser!

We continue to deliver on our goal to build the best development environment integrated directly into our lightning fast and globally distributed application platform. We’re launching Wrangler v3, with complete support for local-by-default development workflow. Powered by the open-source Cloudflare Workers JavaScript runtime — workerd, this change reduces development server startup time by 10x and script reload times by 60x — boosting your productivity and keeping you in the flow longer.

In the dashboard, we're introducing an upgraded and far more powerful online editor powered by VSCode – you can now finally edit multiple JavaScript modules in your browser, get an accurate edge preview of your code, friendly error pages, and type checking!

Finally, in both our dashboard editor and Wrangler, we've updated our workerd-customized Chrome DevTools to the latest version, providing even greater debugging and profiling capabilities, wherever you choose to work.

This is just the first wave of improvements to our development tooling space, you’ll see us iterating in this space over the next few quarters, but in the meantime, check out in-depth posts from Adam, Brendan, and Samuel with all the Wrangler v3 details and VSCode and dash editor improvements.

Increased memory, CPU, and application size limits and simplified pricing!

In the age of AI, WASM, and powerful full-stack applications, we’ve noticed that developers are hitting our current resource limits with increased frequency. We want to be a place where these applications thrive and developers are empowered to build bigger and more sophisticated applications. Therefore, within the next week we’ll be increasing application size limits (JavaScript/WASM bundle size) to 10MB (after gzip) and startup latency limit (script compile time) is being increased from 200ms to 400ms.

To further empower developers, we’re thinking about how to unify and simplify our billing model to make our pricing more straightforward, and increase limits such as memory limits by introducing tiers. Stay tuned for more information on these!

With these changes developers can build cooler apps and operate them for less! Cool, right?!?

Pages CI now with a modern build image!

The wait is finally over! Pages now use a modern build image to power the CI and integrated build system. With this improvement you can finally use recent versions of Node.js, pnpm, and many other tools used by developers today.

While delivering this improvement, we made it much easier for us to keep things up to date in the future, but also unlocked new features like build caching!

The updates are available to all new projects by default, while existing projects can opt in to newer defaults. Sounds like your cup of coffee? Read on in this blog post by Greg.

Enough already, let’s get started! …with your framework of choice and C3!

In addition to being a CDN, and place to deploy your Worker applications, Cloudflare is now also becoming the best place to run your full-stack web applications. This includes all full-stack web frameworks like Angular, Astro, Next, Nuxt, Qwik, Remix, Solid, Svelte, Vue, and others.

Our overall mission is to help build a better Internet, and my team’s contribution to this mission is to enable developers, but really just about anyone, to go from an idea to a deployed application in no time.

To enable developers to turn their ideas into deployed applications quickly and without any hassle we’ve built two things.

First, we partnered with many web framework authors to build new or improve existing adapters for all the popular JavaScript web frameworks. These adapters ensure that your application runs on our platform in the most efficient way, while having access to all the capabilities and features of our platform.

These adapters include the highly requested Next.js adapter, that we’ve just overhauled to be production ready and are launching 1.0.0 today! In partnership with the respective teams, we’ve built brand-new adapters for Angular, and Qwik, while improving Astro, Nuxt, Solid, and a few others.

Second, we developed a brand new sassy CLI we call C3 — short for create-cloudflare CLI, a sibling to our existing Wrangler CLI. If you are a developer who lives your life in terminal or local editors like VSCode, then this CLI is your single entry-point to the Cloudflare universe.

Run the C3 command, and we’ll get you started. You pick your framework of choice, we hand the control over to the CLI of the chosen framework as we don’t want to stand in between you and the hard-working framework authors that craft the experience for their framework. A minute or so later once all npm dependencies are installed, you get a URL from us with your application deployed. That’s it. From an idea to a URL that you can share with friends almost instantly! Boom.

The best place for your web applications

So to recap, our first class support for full-stack web frameworks, combined with the low latency and cost-effectiveness of our platform, as well as smart placement that allows the backend of the full-stack web application to run in the optimal location automagically, and all the remaining significant improvements in our developer tooling, makes Cloudflare THE best place to build and host web applications. This is our contribution to our mission to build a better Internet and push the Web forward.

We aspire to be the place people turn to when they want to get business done, or when they just want to be creative, explore ideas and have fun. It’s a long journey, and we’ve got a lot of interesting challenges ahead of us. Your input will be critical in guiding us. We are all thrilled to have the opportunity to be part of it and give it our best shot. You can join this journey too, and get started today:

npm create cloudflare my-first-app

Improved local development with wrangler and workerd, Developer Week

Post Syndicated from Brendan Coll original http://blog.cloudflare.com/wrangler3/

Improved local development with wrangler and workerd, Developer Week

Improved local development with wrangler and workerd, Developer Week

For over a year now, we’ve been working to improve the Workers local development experience. Our goal has been to improve parity between users' local and production environments. This is important because it provides developers with a fully-controllable and easy-to-debug local testing environment, which leads to increased developer efficiency and confidence.

To start, we integrated Miniflare, a fully-local simulator for Workers, directly into Wrangler, the Workers CLI. This allowed users to develop locally with Wrangler by running wrangler dev --local. Compared to the wrangler dev default, which relied on remote resources, this represented a significant step forward in local development. As good as it was, it couldn’t leverage the actual Workers runtime, which led to some inconsistencies and behavior mismatches.

Last November, we announced the experimental version of Miniflare v3, powered by the newly open-sourced workerd runtime, the same runtime used by Cloudflare Workers. Since then, we’ve continued to improve upon that experience both in terms of accuracy with the real runtime and in cross-platform compatibility.

As a result of all this work, we are proud to announce the release of Wrangler v3 – the first version of Wrangler with local-by-default development.

A new default for Wrangler

Starting with Wrangler v3, users running wrangler dev will be leveraging Miniflare v3 to run your Worker locally. This local development environment is effectively as accurate as a production Workers environment, providing an ability for you to test every aspect of your application before deploying. It provides the same runtime and bindings, but has its own simulators for KV, R2, D1, Cache and Queues. Because you’re running everything on your machine, you won’t be billed for operations on KV namespaces or R2 buckets during development, and you can try out paid-features like Durable Objects for free.

In addition to a more accurate developer experience, you should notice performance differences. Compared to remote mode, we’re seeing a 10x reduction to startup times and 60x reduction to script reload times with the new local-first implementation. This massive reduction in reload times drastically improves developer velocity!

Improved local development with wrangler and workerd, Developer Week

Remote development isn’t going anywhere. We recognise many developers still prefer to test against real data, or want to test Cloudflare services like image resizing that aren’t implemented locally yet. To run wrangler dev on Cloudflare’s network, just like previous versions, use the new --remote flag.

Deprecating Miniflare v2

For users of Miniflare, there are two important pieces of information for those updating from v2 to v3. First, if you’ve been using Miniflare’s CLI directly, you’ll need to switch to wrangler dev. Miniflare v3 no longer includes a CLI. Secondly, if you’re using Miniflare’s API directly, upgrade to miniflare@3 and follow the migration guide.

How we built Miniflare v3

Miniflare v3 is now built using workerd, the open-source Cloudflare Workers runtime. As workerd is a server-first runtime, every configuration defines at least one socket to listen on. Each socket is configured with a service, which can be an external server, disk directory or most importantly for us, a Worker! To start a workerd server running a Worker, create a worker.capnp file as shown below, run npx workerd serve worker.capnp and visit http://localhost:8080 in your browser:

using Workerd = import "/workerd/workerd.capnp";


const helloConfig :Workerd.Config = (
 services = [
   ( name = "hello-worker", worker = .helloWorker )
 ],
 sockets = [
   ( name = "hello-socket", address = "*:8080", http = (), service = "hello-worker" )
 ]
);


const helloWorker :Workerd.Worker = (
 modules = [
   ( name = "worker.mjs",
     esModule =
       `export default {
       `  async fetch(request, env, ctx) {
       `    return new Response("Hello from workerd! 👋");
       `  }
       `}
   )
 ],
 compatibilityDate = "2023-04-04",
);

If you’re interested in what else workerd can do, check out the other samples. Whilst workerd provides the runtime and bindings, it doesn’t provide the underlying implementations for the other products in the Developer Platform. This is where Miniflare comes in! It provides simulators for KV, R2, D1, Queues and the Cache API.

Improved local development with wrangler and workerd, Developer Week

Building a flexible storage system

As you can see from the diagram above, most of Miniflare’s job is now providing different interfaces for data storage. In Miniflare v2, we used a custom key-value store to back these, but this had a few limitations. For Miniflare v3, we’re now using the industry-standard SQLite, with a separate blob store for KV values, R2 objects, and cached responses. Using SQLite gives us much more flexibility in the queries we can run, allowing us to support future unreleased storage solutions. 👀

A separate blob store allows us to provide efficient, ranged, streamed access to data. Blobs have unguessable identifiers, can be deleted, but are otherwise immutable. These properties make it possible to perform atomic updates with the SQLite database. No other operations can interact with the blob until it's committed to SQLite, because the ID is not guessable, and we don't allow listing blobs. For more details on the rationale behind this, check out the original GitHub discussion.

Running unit tests inside Workers

One of Miniflare’s primary goals is to provide a great local testing experience. Miniflare v2 provided custom environments for popular Node.js testing frameworks that allowed you to run your tests inside the Miniflare sandbox. This meant you could import and call any function using Workers runtime APIs in your tests. You weren’t restricted to integration tests that just send and receive HTTP requests. In addition, these environments provide per-test isolated storage, automatically undoing any changes made at the end of each test.

In Miniflare v2, these environments were relatively simple to implement. We’d already reimplemented Workers Runtime APIs in a Node.js environment, and could inject them using Jest and Vitest’s APIs into the global scope.

Improved local development with wrangler and workerd, Developer Week

For Miniflare v3, this is much trickier. The runtime APIs are implemented in a separate workerd process, and you can’t reference JavaScript classes across a process boundary. So we needed a new approach…

Improved local development with wrangler and workerd, Developer Week

Many test frameworks like Vitest use Node’s built-in worker_threads module for running tests in parallel. This module spawns new operating system threads running Node.js and provides a MessageChannel interface for communicating between them. What if instead of spawning a new OS thread, we spawned a new workerd process, and used WebSockets for communication between the Node.js host process and the workerd “thread”?

Improved local development with wrangler and workerd, Developer Week

We have a proof of concept using Vitest showing this approach can work in practice. Existing Vitest IDE integrations and the Vitest UI continue to work without any additional work. We aren’t quite ready to release this yet, but will be working on improving it over the next few months. Importantly, the workerd “thread” needs access to Node.js built-in modules, which we recently started rolling out support for.

Improved local development with wrangler and workerd, Developer Week

Running on every platform

We want developers to have this great local testing experience, regardless of which operating system they’re using. Before open-sourcing, the Cloudflare Workers runtime was originally only designed to run on Linux. For Miniflare v3, we needed to add support for macOS and Windows too. macOS and Linux are both Unix-based, making porting between them relatively straightforward. Windows on the other hand is an entirely different beast… 😬

The workerd runtime uses KJ, an alternative C++ base library, which is already cross-platform. We’d also migrated to the Bazel build system in preparation for open-sourcing the runtime, which has good Windows support. When compiling our C++ code for Windows, we use LLVM's MSVC-compatible compiler driver clang-cl, as opposed to using Microsoft’s Visual C++ compiler directly. This enables us to use the "same" compiler frontend on Linux, macOS, and Windows, massively reducing the effort required to compile workerd on Windows. Notably, this provides proper support for #pragma once when using symlinked virtual includes produced by Bazel, __atomic_* functions, a standards-compliant preprocessor, GNU statement expressions used by some KJ macros, and understanding of the .c++ extension by default. After switching out unix API calls for their Windows equivalents using #if _WIN32 preprocessor directives, and fixing a bunch of segmentation faults caused by execution order differences, we were finally able to get workerd running on Windows! No WSL or Docker required! 🎉

Let us know what you think!

Wrangler v3 is now generally available! Upgrade by running npm install --save-dev wrangler@3 in your project. Then run npx wrangler dev to try out the new local development experience powered by Miniflare v3 and the open-source Workers runtime. Let us know what you think in the #wrangler channel on the Cloudflare Developers Discord, and please open a GitHub issue if you hit any unexpected behavior.