Tag Archives: Customer Solutions

Design a data mesh on AWS that reflects the envisioned organization

Post Syndicated from Claudia Chitu original https://aws.amazon.com/blogs/big-data/design-a-data-mesh-on-aws-that-reflects-the-envisioned-organization/

This post is written in collaboration with Claudia Chitu and Spyridon Dosis from ACAST.

Founded in 2014, Acast is the world’s leading independent podcast company, elevating podcast creators and podcast advertisers for the ultimate listening experience. By championing an independent and open ecosystem for podcasting, Acast aims to fuel podcasting with the tools and monetization needed to thrive.

The company uses AWS Cloud services to build data-driven products and scale engineering best practices. To ensure a sustainable data platform amid growth and profitability phases, their tech teams adopted a decentralized data mesh architecture.

In this post, we discuss how Acast overcame the challenge of coupled dependencies between teams working with data at scale by employing the concept of a data mesh.

The problem

With an accelerated growth and expansion, Acast encountered a challenge that resonates globally. Acast found itself with diverse business units and a vast amount of data generated across the organization. The existing monolith and centralized architecture was struggling to meet the growing demands of data consumers. Data engineers were finding it increasingly challenging to maintain and scale the data infrastructure, resulting in data access, data silos, and inefficiencies in data management. A key objective was to enhance the end-to-end user experience, starting from the business needs.

Acast needed to address these challenges in order to get to an operational scale, meaning a global maximum of the number of people that can independently operate and deliver value. In this case, Acast tried to tackle the challenge of this monolith structure and the high time to value for product teams, tech teams, end consumers. It’s worth mentioning that they also have other product and tech teams, including operational or business teams, without AWS accounts.

Acast has a variable number of product teams, continuously evolving by merging existing ones, splitting them, adding new people, or simply creating new teams. In the last 2 years, they have had between 10–20 teams, consisting of 4–10 people each. Each team owns at least two AWS accounts, up to 10 accounts, depending on the ownership. The majority of data produced by these accounts is used downstream for business intelligence (BI) purposes and in Amazon Athena, by hundreds of business users every day.

The solution Acast implemented is a data mesh, architected on AWS. The solution mirrors the organizational structure rather than an explicit architectural decision. As per the Inverse Conway Maneuver, Acast’s technology architecture displays isomorphism with the business architecture. In this case, the business users are enabled through the data mesh architecture to get faster time to insights and know directly who the domain specific owners are, speeding up collaboration. This will be further detailed when we discuss the AWS Identity and Access Management (IAM) roles used, because one of the roles is dedicated to the business group.

Parameters of success

Acast succeeded in bootstrapping and scaling a new team- and domain-oriented data product and its corresponding infrastructure and setup, resulting in less friction in gathering insights and happier users and consumers.

The success of the implementation meant assessing various aspects of the data infrastructure, data management, and business outcomes. They classified the metrics and indicators in the following categories:

  • Data usage – A clear understanding of who is consuming what data source, materialized with a mapping of consumers and producers. Discussions with users showed they were happier to have faster access to data in a simpler way, a more structured data organization, and a clear mapping of who the producer is. A lot of progress has been made to advance their data-driven culture (data literacy, data sharing, and collaboration across business units).
  • Data governance – With their service-level object stating when the data sources are available (among other details), teams know whom to notify and can do so in a shorter time when there is late data coming in or other issues with the data. With a data steward role in place, the ownership has been strengthened.
  • Data team productivity – Through engineering retrospectives, Acast found that their teams appreciate autonomy to make decisions regarding their data domains.
  • Cost and resource efficiency – This is an area where Acast observed a reduction in data duplication, and therefore cost reduction (in some accounts, removing the copy of data 100%), by reading data across accounts while enabling scaling.

Data mesh overview

A data mesh is a sociotechnical approach to build a decentralized data architecture by using a domain-oriented, self-serve design (in a software development perspective), and borrows Eric Evans’ theory of domain-driven design and Manuel Pais’ and Matthew Skelton’s theory of team topologies. It’s important to establish the context to understand what data mesh is because it sets the stage for the technical details that follow and can help you understand how the concepts discussed in this post fit into the broader framework of a data mesh.

To recap before diving deeper into Acast’s implementation, the data mesh concept is based on the following principles:

  • It’s domain driven, as opposed to pipelines as a first-class concern
  • It serves data as a product
  • It’s a good product that delights users (data is trustworthy, documentation is available, and it’s easily consumable)
  • It offers federated computational governance and decentralized ownership—a self-serve data platform

Domain-driven architecture

In Acast’s approach of owning the operational and analytical datasets, teams are structured with ownership based on domain, reading directly from the producer of the data, via an API or programmatically from Amazon S3 storage or using Athena as a SQL query engine. Some examples of Acast’s domains are presented in the following figure.

As illustrated in the preceding figure, some domains are loosely coupled to other domains’ operational or analytical endpoints, with a different ownership. Others might have stronger dependency, which is expected, for business (some podcasters can be also advertisers, creating sponsorship creatives and running campaigns for their own shows, or transacting ads using Acast’s software as a service).

Data as a product

Treating data as a product entails three key components: the data itself, the metadata, and the associated code and infrastructure. In this approach, teams responsible for generating data are referred to as producers. These producer teams possess in-depth knowledge about their consumers, understanding how their data product is utilized. Any changes planned by the data producers are communicated in advance to all consumers. This proactive notification ensures that downstream processes are not disrupted. By providing consumers with advance notice, they have sufficient time to prepare for and adapt to the upcoming changes, maintaining a smooth and uninterrupted workflow. The producers run a new version of the initial dataset in parallel, notify the consumers individually, and discuss with them their necessary timeframe to start consuming the new version. When all consumers are using the new version, the producers make the initial version unavailable.

Data schemas are inferred from the common agreed-upon format to share files between teams, which is Parquet in the case of Acast. Data can be shared in files, batched or stream events, and more. Each team has its own AWS account acting as an independent and autonomous entity with its own infrastructure. For orchestration, they use the AWS Cloud Development Kit (AWS CDK) for infrastructure as code (IaC) and AWS Glue Data Catalogs for metadata management. Users can also raise requests to producers to improve the way the data is presented or to enrich the data with new data points for generating a higher business value.

With each team owning an AWS account and a data catalog ID from Athena, it’s straightforward to see this through the lenses of a distributed data lake on top of Amazon S3, with a common catalog mapping all the catalogs from all the accounts.

At the same time, each team can also map other catalogs to their own account and use their own data, which they produce along with the data from other accounts. Unless it is sensitive data, the data can be accessed programmatically or from the AWS Management Console in a self-service manner without being dependent on the data infrastructure engineers. This is a domain-agnostic, shared way to self-serve data. The product discovery happens through the catalog registration. Using only a few standards commonly agreed upon and adopted across the company, for the purpose of interoperability, Acast addressed the fragmented silos and friction to exchange data or consume domain-agnostic data.

With this principle, teams get assurance that the data is secure, trustworthy, and accurate, and appropriate access controls are managed at each domain level. Moreover, on the central account, roles are defined for different types of permissions and access, using AWS IAM Identity Center permissions. All datasets are discoverable from a single central account. The following figure illustrates how it’s instrumented, where two IAM roles are assumed by two types of user (consumer) groups: one that has access to a limited dataset, which is restricted data, and one that has access to non-restricted data. There is also a way to assume any of these roles, for service accounts, such as those used by data processing jobs in Amazon Managed Workflows for Apache Airflow (Amazon MWAA), for example.

How Acast solved for high alignment and a loosely coupled architecture

The following diagram shows a conceptual architecture of how Acast’s teams are organizing data and collaborating with each other.

Acast used the Well-Architected Framework for the central account to improve its practice running analytical workloads in the cloud. Through the lenses of the tool, Acast was able to address better monitoring, cost optimization, performance, and security. It helped them understand the areas where they could improve their workloads and how to address common issues, with automated solutions, as well as how to measure the success, defining KPIs. It saved them time to get the learnings that otherwise would have been taking longer to find. Spyridon Dosis, Acast’s Information Security Officer, shares, “We are happy AWS is always ahead with releasing tools that enable the configuration, assessment, and review of multi-account setup. This is a big plus for us, working in a decentralized organization.” Spyridon also adds, “A very important concept we value is the AWS security defaults (e.g. default encryption for S3 buckets).”

In the architecture diagram, we can see that each team can be a data producer, except the team owning the central account, which serves as the central data platform, modeling the logic from multiple domains to paint the full business picture. All other teams can be data producers or data consumers. They can connect to the central account and discover datasets via the cross-account AWS Glue Data Catalog, analyze them in the Athena query editor or with Athena notebooks, or map the catalog to their own AWS account. Access to the central Athena catalog is implemented with IAM Identity Center, with roles for open data and restricted data access.

For non-sensitive data (open data), Acast uses a template where the datasets are by default open to the entire organization to read from, using a condition to provide the organization-assigned ID parameter, as shown in the following code snippet:

{
    "Version": "2012-10-17",
    "Statement": [
        
        {
            "Effect": "Allow",
            "Principal": "*",
            "Action": [
               "s3:GetObject*",
                "s3:GetBucket*",
                "s3:List*"  
            ],
            "Resource": [
                "arn:aws:s3:::DOC-EXAMPLE-BUCKET",
                "arn:aws:s3:::DOC-EXAMPLE-BUCKET/*"
            ],
            "Condition": {
                "StringEquals": {
                    "aws:PrincipalOrgID": "ORG-ID-NUMBER"
                }
            }
        }
    ]
}

When handling sensitive data like financials, the teams use a collaborative data steward model. The data steward works with the requester to evaluate access justification for the intended use case. Together, they determine appropriate access methods to meet the need while maintaining security. This could include IAM roles, service accounts, or specific AWS services. This approach enables business users outside the tech organization (which means they don’t have an AWS account) to independently access and analyze the information they need. By granting access through IAM policies on AWS Glue resources and S3 buckets, Acast provides self-serve capabilities while still governing delicate data through human review. The data steward role has been valuable for understanding use cases, assessing security risks, and ultimately facilitating access that accelerates the business through analytical insights.

For Acast’s use case, granular row- or column-level access controls weren’t needed, so the approach sufficed. However, other organizations may require more fine-grained governance over sensitive data fields. In those cases, solutions like AWS Lake Formation could implement permissions needed, while still providing a self-serve data access model. For more information, refer to Design a data mesh architecture using AWS Lake Formation and AWS Glue.

At the same time, teams can read from other producers directly, from Amazon S3 or via an API, keeping the dependency at minimum, which enhances the velocity of development and delivery. Therefore, an account can be a producer and a consumer in parallel. Each team is autonomous, and is accountable for their own tech stack.

Additional learnings

What did Acast learn? So far, we’ve discussed that the architectural design is an effect of the organizational structure. Because the tech organization consists of multiple cross-functional teams, and it’s straightforward to bootstrap a new team, following the common principles of data mesh, Acast learned this doesn’t go seamlessly every time. To set up a fully new account in AWS, teams go through the same journey, but slightly different, considering their own set of particularities.

This can create certain frictions, and it’s difficult to get all data producing teams to reach a high maturity of being data producers. This can be explained by the different data competencies in those cross-functional teams and not being dedicated data teams.

By implementing the decentralized solution, Acast effectively tackled the scalability challenge by adapting their teams to align with evolving business needs. This approach ensures high decoupling and alignment. Furthermore, they strengthened ownership, significantly reducing the time needed to identify and resolve issues because the upstream source is readily known and easily accessible with specified SLAs. The volume of data support inquiries has seen a reduction of over 50%, because business users are empowered to gain faster insights. Notably, they successfully eliminated tens of terabytes of redundant storage that were previously copied solely to fulfill downstream requests. This achievement was made possible through the implementation of cross-account reading, leading to the removal of associated development and maintenance costs for these pipelines.

Conclusion

Acast used the Inverse Conway Maneuver law and employed AWS services where each cross-functional product team has its own AWS account to build a data mesh architecture that allows scalability, high ownership, and self-service data consumption. This has been working well for the company, regarding how data ownership and operations were approached, to meet their engineering principles, resulting in having the data mesh as an effect rather than a deliberate intent. For other organizations, the desired data mesh might look different and the approach might have other learnings.

To conclude, a modern data architecture on AWS allows you to efficiently construct data products and data mesh infrastructure at a low cost without compromising on performance.

The following are some examples of AWS services you can use to design your desired data mesh on AWS:


About the Authors

Claudia Chitu is a Data strategist and an influential leader in the Analytics space. Focused on aligning data initiatives with the overall strategic goals of the organization, she employs data as a guiding force for long-term planning and sustainable growth.

Spyridon Dosis is an Information Security Professional in Acast. Spyridon supports the organization in designing, implementing and operating its services in a secure manner protecting the company and users’ data.

Srikant Das is an Acceleration Lab Solutions Architect at Amazon Web Services. He has over 13 years of experience in Big Data analytics and Data Engineering, where he enjoys building reliable, scalable, and efficient solutions. Outside of work, he enjoys traveling and blogging his experiences in social media.
Generate AI powered insights for Amazon Security Lake using Amazon SageMaker Studio and Amazon Bedrock

Post Syndicated from Jonathan Nguyen original https://aws.amazon.com/blogs/security/generate-ai-powered-insights-for-amazon-security-lake-using-amazon-sagemaker-studio-and-amazon-bedrock/

In part 1, we discussed how to use Amazon SageMaker Studio to analyze time-series data in Amazon Security Lake to identify critical areas and prioritize efforts to help increase your security posture. Security Lake provides additional visibility into your environment by consolidating and normalizing security data from both AWS and non-AWS sources. Security teams can use Amazon Athena to query data in Security Lake to aid in a security event investigation or proactive threat analysis. Reducing the security team’s mean time to respond to or detect a security event can decrease your organization’s security vulnerabilities and risks, minimize data breaches, and reduce operational disruptions. Even if your security team is already familiar with AWS security logs and is using SQL queries to sift through data, determining appropriate log sources to review and crafting customized SQL queries can add time to an investigation. Furthermore, when security analysts conduct their analysis using SQL queries, the results are point-in-time and don’t automatically factor results from previous queries.

In this blog post, we show you how to extend the capabilities of SageMaker Studio by using Amazon Bedrock, a fully-managed generative artificial intelligence (AI) service natively offering high-performing foundation models (FMs) from leading AI companies with a single API. By using Amazon Bedrock, security analysts can accelerate security investigations by using a natural language companion to automatically generate SQL queries, focus on relevant data sources within Security Lake, and use previous SQL query results to enhance the results from future queries. We walk through a threat analysis exercise to show how your security analysts can use natural language processing to answer questions such as which AWS account has the most AWS Security Hub findings, irregular network activity from AWS resources, or which AWS Identity and Access Management (IAM) principals invoked highly suspicious activity. By identifying possible vulnerabilities or misconfigurations, you can minimize mean time to detect and pinpoint specific resources to assess overall impact. We also discuss methods to customize Amazon Bedrock integration with data from your Security Lake. While large language models (LLMs) are useful conversational partners, it’s important to note that LLM responses can include hallucinations, which might not reflect truth or reality. We discuss some mechanisms to validate LLM responses and mitigate hallucinations. This blog post is best suited for technologists who have an in-depth understanding of generative artificial intelligence concepts and the AWS services used in the example solution.

Solution overview

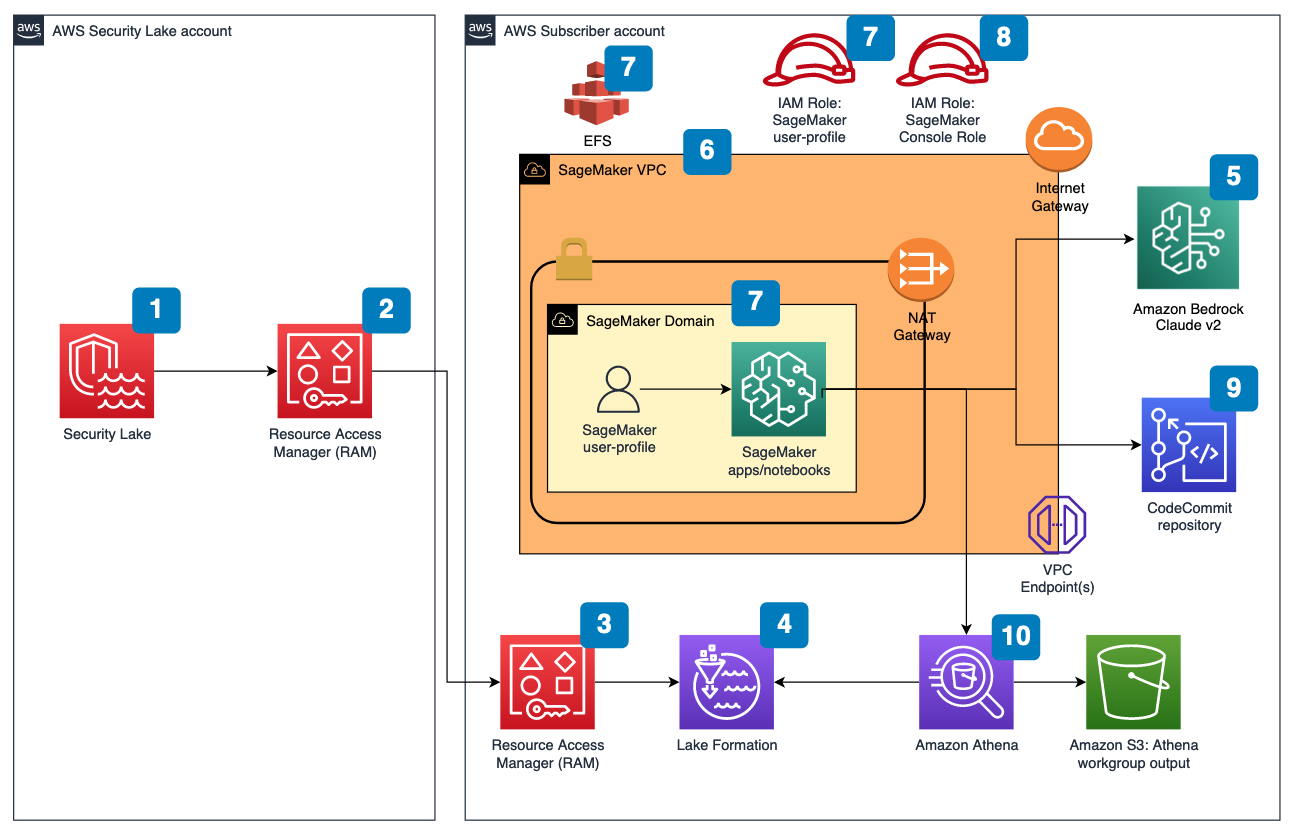
Figure 1 depicts the architecture of the sample solution.

Figure 1: Security Lake generative AI solution architecture

Figure 1: Security Lake generative AI solution architecture

Before you deploy the sample solution, complete the following prerequisites:

  1. Enable Security Lake in your organization in AWS Organizations and specify a delegated administrator account to manage the Security Lake configuration for all member accounts in your organization. Configure Security Lake with the appropriate log sources: Amazon Virtual Private Cloud (VPC) Flow Logs, AWS Security Hub, AWS CloudTrail, and Amazon Route53.
  2. Create subscriber query access from the source Security Lake AWS account to the subscriber AWS account.
  3. Accept a resource share request in the subscriber AWS account in AWS Resource Access Manager (AWS RAM).
  4. Create a database link in AWS Lake Formation in the subscriber AWS account and grant access for the Athena tables in the Security Lake AWS account.
  5. Grant Claude v2 model access for Amazon Bedrock LLM Claude v2 in the AWS subscriber account where you will deploy the solution. If you try to use a model before you enable it in your AWS account, you will get an error message.

After you set up the prerequisites, the sample solution architecture provisions the following resources:

  1. A VPC is provisioned for SageMaker with an internet gateway, a NAT gateway, and VPC endpoints for all AWS services within the solution. An internet gateway or NAT gateway is required to install external open-source packages.
  2. A SageMaker Studio domain is created in VPCOnly mode with a single SageMaker user-profile that’s tied to an IAM role. As part of the SageMaker deployment, an Amazon Elastic File System (Amazon EFS) is provisioned for the SageMaker domain.
  3. A dedicated IAM role is created to restrict access to create or access the SageMaker domain’s presigned URL from a specific Classless Inter-Domain Routing (CIDR) for accessing the SageMaker notebook.
  4. An AWS CodeCommit repository containing Python notebooks used for the artificial intelligence and machine learning (AI/ML) workflow by the SageMaker user profile.
  5. An Athena workgroup is created for Security Lake queries with a S3 bucket for output location (access logging is configured for the output bucket).

Cost

Before deploying the sample solution and walking through this post, it’s important to understand the cost factors for the main AWS services being used. The cost will largely depend on the amount of data you interact with in Security Lake and the duration of running resources in SageMaker Studio.

  1. A SageMaker Studio domain is deployed and configured with default setting of a ml.t3.medium instance type. For a more detailed breakdown, see SageMaker Studio pricing. It’s important to shut down applications when they’re not in use because you’re billed for the number of hours an application is running. See the AWS samples repository for an automated shutdown extension.
  2. Amazon Bedrock on-demand pricing is based on the selected LLM and the number of input and output tokens. A token is comprised of a few characters and refers to the basic unit of text that a model learns to understand the user input and prompts. For a more detailed breakdown, see Amazon Bedrock pricing.
  3. The SQL queries generated by Amazon Bedrock are invoked using Athena. Athena cost is based on the amount of data scanned within Security Lake for that query. For a more detailed breakdown, see Athena pricing.

Deploy the sample solution

You can deploy the sample solution by using either the AWS Management Console or the AWS Cloud Development Kit (AWS CDK). For instructions and more information on using the AWS CDK, see Get Started with AWS CDK.

Option 1: Deploy using AWS CloudFormation using the console

Use the console to sign in to your subscriber AWS account and then choose the Launch Stack button to open the AWS CloudFormation console that’s pre-loaded with the template for this solution. It takes approximately 10 minutes for the CloudFormation stack to complete.

Select the Launch Stack button to launch the template

Option 2: Deploy using AWS CDK

  1. Clone the Security Lake generative AI sample repository.
  2. Navigate to the project’s source folder (…/amazon-security-lake-generative-ai/source).
  3. Install project dependencies using the following commands:
    npm install -g aws-cdk-lib
    npm install
    

  4. On deployment, you must provide the following required parameters:
    • IAMroleassumptionforsagemakerpresignedurl – this is the existing IAM role you want to use to access the AWS console to create presigned URLs for SageMaker Studio domain.
    • securitylakeawsaccount – this is the AWS account ID where Security Lake is deployed.
  5. Run the following commands in your terminal while signed in to your subscriber AWS account. Replace <INSERT_AWS_ACCOUNT> with your account number and replace <INSERT_REGION> with the AWS Region that you want the solution deployed to.
    cdk bootstrap aws://<INSERT_AWS_ACCOUNT>/<INSERT_REGION>
    
    cdk deploy --parameters IAMroleassumptionforsagemakerpresignedurl=arn:aws:iam::<INSERT_AWS_ACCOUNT>:role/<INSERT_IAM_ROLE_NAME> --parameters securitylakeawsaccount=<INSERT_SECURITY_LAKE_AWS_ACCOUNT_ID>
    

Post-deployment configuration steps

Now that you’ve deployed the solution, you must add permissions to allow SageMaker and Amazon Bedrock to interact with your Security Lake data.

Grant permission to the Security Lake database

  1. Copy the SageMaker user profile Amazon Resource Name (ARN)
    arn:aws:iam::<account-id>:role/sagemaker-user-profile-for-security-lake
    

  2. Go to the Lake Formation console.
  3. Select the amazon_security_lake_glue_db_<YOUR-REGION> database. For example, if your Security Lake is in us-east-1, the value would be amazon_security_lake_glue_db_us_east_1
  4. For Actions, select Grant.
  5. In Grant Data Permissions, select SAML Users and Groups.
  6. Paste the SageMaker user profile ARN from Step 1.
  7. In Database Permissions, select Describe, and then Grant.

Grant permission to Security Lake tables

You must repeat these steps for each source configured within Security Lake. For example, if you have four sources configured within Security Lake, you must grant permissions for the SageMaker user profile to four tables. If you have multiple sources that are in separate Regions and you don’t have a rollup Region configured in Security Lake, you must repeat the steps for each source in each Region.

The following example grants permissions to the Security Hub table within Security Lake. For more information about granting table permissions, see the AWS LakeFormation user-guide.

  1. Copy the SageMaker user-profile ARN arn:aws:iam:<account-id>:role/sagemaker-user-profile-for-security-lake.
  2. Go to the Lake Formation console.
  3. Select the amazon_security_lake_glue_db_<YOUR-REGION> database.
    For example, if your Security Lake database is in us-east-1 the value would be amazon_security_lake_glue_db_us_east_1
  4. Choose View Tables.
  5. Select the amazon_security_lake_table_<YOUR-REGION>_sh_findings_1_0 table.
    For example, if your Security Lake table is in us-east-1 the value would be amazon_security_lake_table_us_east_1_sh_findings_1_0

    Note: Each table must be granted access individually. Selecting All Tables won’t grant the access needed to query Security Lake.

  6. For Actions, select Grant.
  7. In Grant Data Permissions, select SAML Users and Groups.
  8. Paste the SageMaker user profile ARN from Step 1.
  9. In Table Permissions, select Describe, and then Grant.

Launch your SageMaker Studio application

Now that you’ve granted permissions for a SageMaker user profile, you can move on to launching the SageMaker application associated to that user profile.

  1. Navigate to the SageMaker Studio domain in the console.
  2. Select the SageMaker domain security-lake-gen-ai-<subscriber-account-id>.
  3. Select the SageMaker user profile sagemaker-user-profile-for-security-lake.
  4. For Launch, select Studio.
Figure 2: SageMaker Studio domain view

Figure 2: SageMaker Studio domain view

Clone the Python notebook

As part of the solution deployment, we’ve created a foundational Python notebook in CodeCommit to use within your SageMaker app.

  1. Navigate to CloudFormation in the console.
  2. In the Stacks section, select the SageMakerDomainStack.
  3. Select the Outputs tab.
  4. Copy the value for the SageMaker notebook generative AI repository URL. (For example: https://git-codecommit.us-east-1.amazonaws.com/v1/repos/sagemaker_gen_ai_repo)
  5. Go back to your SageMaker app.
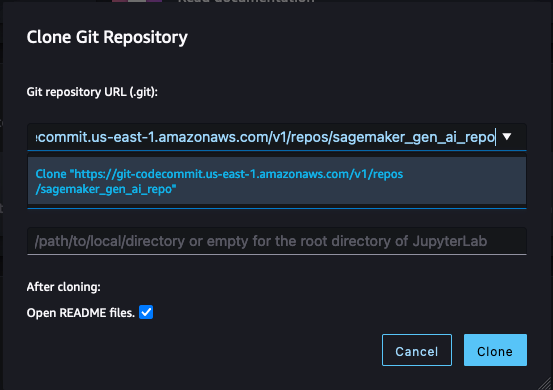
  6. In SageMaker Studio, in the left sidebar, choose the Git icon (a diamond with two branches), then choose Clone a Repository.
    Figure 3: SageMaker Studio clone repository option

    Figure 3: SageMaker Studio clone repository option

  7. Paste the CodeCommit repository link from Step 4 under the Git repository URL (git). After you paste the URL, select Clone “https://git-codecommit.us-east-1.amazonaws.com/v1/repos/sagemaker_gen_ai_repo”, then select Clone.

Note: If you don’t select from the auto-populated list, SageMaker won’t be able to clone the repository and will return a message that the URL is invalid.

Figure 4: SageMaker Studio clone HTTPS repository URL

Figure 4: SageMaker Studio clone HTTPS repository URL

Configure your notebook to use generative AI

In the next section, we walk through how we configured the notebook and why we used specific LLMs, agents, tools, and additional configurations so you can extend and customize this solution to your use case.

The notebook we created uses the LangChain framework. LangChain is a framework for developing applications powered by language models and processes natural language inputs from the user, generates SQL queries, and runs those queries on your Security Lake data. For our use case, we’re using LangChain with Anthropic’s Claude 2 model on Amazon Bedrock.

Set up the notebook environment

  1. After you’re in the generative_ai_security_lake.ipynb notebook, you can set up your notebook environment. Keep the default settings and choose Select.
    Figure 5: SageMaker Studio notebook start-up configuration

    Figure 5: SageMaker Studio notebook start-up configuration

  2. Run the first cell to install the requirements listed in the requirements.txt file.

Connect to the Security Lake database using SQLAlchemy

The example solution uses a pre-populated Security Lake database with metadata in the AWS Glue Data Catalog. The inferred schema enables the LLM to generate SQL queries in response to the questions being asked.

LangChain uses SQLAlchemy, which is a Python SQL toolkit and object relational mapper, to access databases. To connect to a database, first import SQLAlchemy and create an engine object by specifying the following:

  • SCHEMA_NAME
  • S3_STAGING_DIR
  • AWS_REGION
  • ATHENA REST API details

You can use the following configuration code to establish database connections and start querying.

import os
ACCOUNT_ID = os.environ["AWS_ACCOUNT_ID"]
REGION_NAME = os.environ.get('REGION_NAME', 'us-east-1')
REGION_FMT = REGION_NAME.replace("-","_")

from langchain import SQLDatabase
from sqlalchemy import create_engine

#Amazon Security Lake Database
SCHEMA_NAME = f"amazon_security_lake_glue_db_{REGION_FMT}"

#S3 Staging location for Athena query output results and this will be created by deploying the Cloud Formation stack
S3_STAGING_DIR = f's3://athena-gen-ai-bucket-results-{ACCOUNT_ID}/output/'

engine_athena = create_engine(
    "awsathena+rest://@athena.{}.amazonaws.com:443/{}?s3_staging_dir={}".
    format(REGION_NAME, SCHEMA_NAME, S3_STAGING_DIR)
)

athena_db = SQLDatabase(engine_athena)
db = athena_db

Initialize the LLM and Amazon Bedrock endpoint URL

Amazon Bedrock provides a list of Region-specific endpoints for making inference requests for models hosted in Amazon Bedrock. In this post, we’ve defined the model ID as Claude v2 and the Amazon Bedrock endpoint as us-east-1. You can change this to other LLMs and endpoints as needed for your use case.

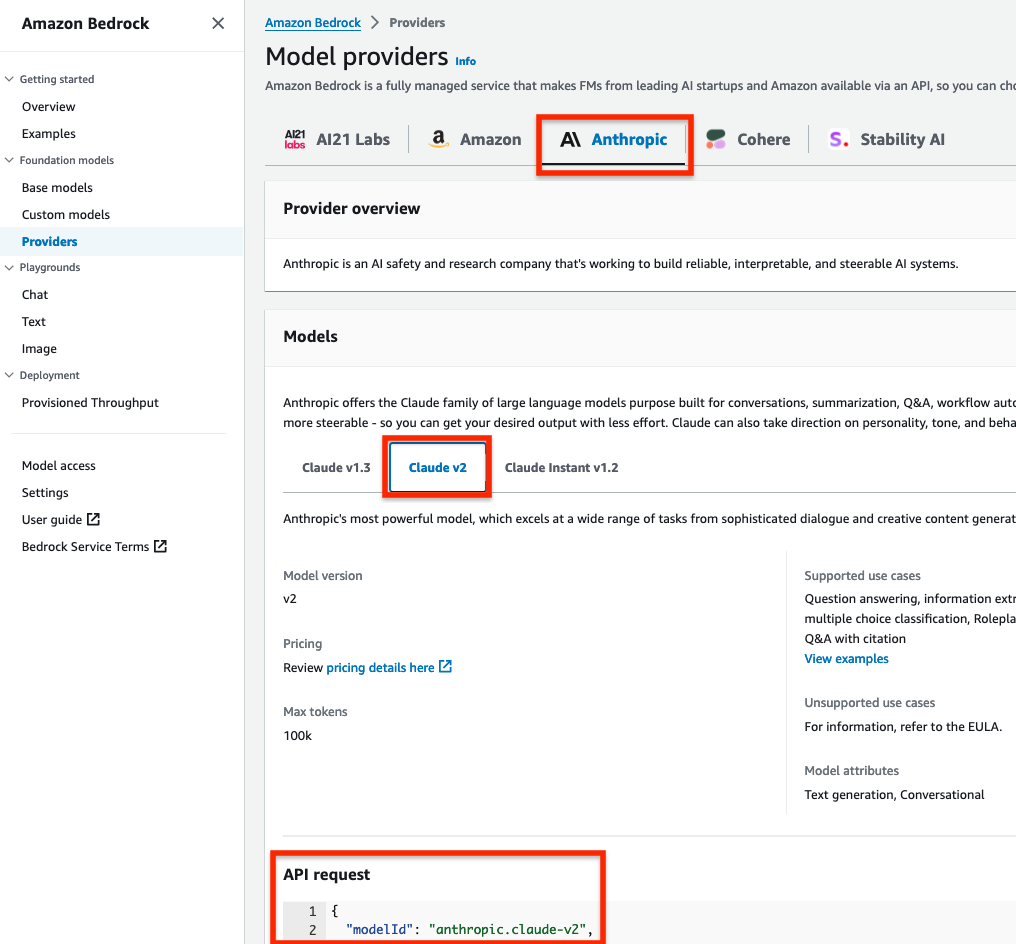
Obtain a model ID from the AWS console

  1. Go to the Amazon Bedrock console.
  2. In the navigation pane, under Foundation models, select Providers.
  3. Select the Anthropic tab from the top menu and then select Claude v2.
  4. In the model API request note the model ID value in the JSON payload.

Note: Alternatively, you can use the AWS Command Line Interface (AWS CLI) to run the list-foundation-models command in a SageMaker notebook cell or a CLI terminal to the get the model ID. For AWS SDK, you can use the ListFoundationModels operation to retrieve information about base models for a specific provider.

Figure 6: Amazon Bedrock Claude v2 model ID

Figure 6: Amazon Bedrock Claude v2 model ID

Set the model parameters

After the LLM and Amazon Bedrock endpoints are configured, you can use the model_kwargs dictionary to set model parameters. Depending on your use case, you might use different parameters or values. In this example, the following values are already configured in the notebook and passed to the model.

  1. temperature: Set to 0. Temperature controls the degree of randomness in responses from the LLM. By adjusting the temperature, users can control the balance between having predictable, consistent responses (value closer to 0) compared to more creative, novel responses (value closer to 1).

    Note: Instead of using the temperature parameter, you can set top_p, which defines a cutoff based on the sum of probabilities of the potential choices. If you set Top P below 1.0, the model considers the most probable options and ignores less probable ones. According to Anthropic’s user guide, “you should either alter temperature or top_p, but not both.”

  2. top_k: Set to 0. While temperature controls the probability distribution of potential tokens, top_k limits the sample size for each subsequent token. For example, if top_k=50, the model selects from the 50 most probable tokens that could be next in a sequence. When you lower the top_k value, you remove the long tail of low probability tokens to select from in a sequence.
  3. max_tokens_to_sample: Set to 4096. For Anthropic models, the default is 256 and the max is 4096. This value denotes the absolute maximum number of tokens to predict before the generation stops. Anthropic models can stop before reaching this maximum.
Figure 7: Notebook configuration for Amazon Bedrock

Figure 7: Notebook configuration for Amazon Bedrock

Create and configure the LangChain agent

An agent uses a LLM and tools to reason and determine what actions to take and in which order. For this use case, we used a Conversational ReAct agent to remember conversational history and results to be used in a ReAct loop (Question → Thought → Action → Action Input → Observation ↔ repeat → Answer). This way, you don’t have to remember how to incorporate previous results in the subsequent question or query. Depending on your use case, you can configure a different type of agent.

Create a list of tools

Tools are functions used by an agent to interact with the available dataset. The agent’s tools are used by an action agent. We import both SQL and Python REPL tools:

  1. List the available log source tables in the Security Lake database
  2. Extract the schema and sample rows from the log source tables
  3. Create SQL queries to invoke in Athena
  4. Validate and rewrite the queries in case of syntax errors
  5. Invoke the query to get results from the appropriate log source tables
Figure 8: Notebook LangChain agent tools

Figure 8: Notebook LangChain agent tools

Here’s a breakdown for the tools used and the respective prompts:

  • QuerySQLDataBaseTool: This tool accepts detailed and correct SQL queries as input and returns results from the database. If the query is incorrect, you receive an error message. If there’s an error, rewrite and recheck the query, and try again. If you encounter an error such as Unknown column xxxx in field list, use the sql_db_schema to verify the correct table fields.
  • InfoSQLDatabaseTool: This tool accepts a comma-separated list of tables as input and returns the schema and sample rows for those tables. Verify that the tables exist by invoking the sql_db_list_tables first. The input format is: table1, table2, table3
  • ListSQLDatabaseTool: The input is an empty string, the output is a comma separated list of tables in the database
  • QuerySQLCheckerTool: Use this tool to check if your query is correct before running it. Always use this tool before running a query with sql_db_query
  • PythonREPLTool: A Python shell. Use this to run python commands. The input should be a valid python command. If you want to see the output of a value, you should print it out with print(…).

Note: If a native tool doesn’t meet your needs, you can create custom tools. Throughout our testing, we found some of the native tools provided most of what we needed but required minor tweaks for our use case. We changed the default behavior for the tools for use with Security Lake data.

Create an output parser

Output parsers are used to instruct the LLM to respond in the desired output format. Although the output parser is optional, it makes sure the LLM response is formatted in a way that can be quickly consumed and is actionable by the user.

Figure 9: LangChain output parser setting

Figure 9: LangChain output parser setting

Adding conversation buffer memory

To make things simpler for the user, previous results should be stored for use in subsequent queries by the Conversational ReAct agent. ConversationBufferMemory provides the capability to maintain state from past conversations and enables the user to ask follow-up questions in the same chat context. For example, if you asked an agent for a list of AWS accounts to focus on, you want your subsequent questions to focus on that same list of AWS accounts instead of writing the values down somewhere and keeping track of it in the next set of questions. There are many other types of memory that can be used to optimize your use cases.

Figure 10: LangChain conversation buffer memory setting

Figure 10: LangChain conversation buffer memory setting

Initialize the agent

At this point, all the appropriate configurations are set and it’s time to load an agent executor by providing a set of tools and a LLM.

  1. tools: List of tools the agent will have access to.
  2. llm: LLM the agent will use.
  3. agent: Agent type to use. If there is no value provided and agent_path is set, the agent used will default to AgentType.ZERO_SHOT_REACT_DESCRIPTION.
  4. agent_kwargs: Additional keyword arguments to pass to the agent.
Figure 11: LangChain agent initialization

Figure 11: LangChain agent initialization

Note: For this post, we set verbose=True to view the agent’s intermediate ReAct steps, while answering questions. If you’re only interested in the output, set verbose=False.

You can also set return_direct=True to have the tool output returned to the user and closing the agent loop. Since we want to maintain the results of the query and used by the LLM, we left the default value of return_direct=False.

Provide instructions to the agent on using the tools

In addition to providing the agent with a list of tools, you would also give instructions to the agent on how and when to use these tools for your use case. This is optional but provides the agent with more context and can lead to better results.

Figure 12: LangChain agent instructions

Figure 12: LangChain agent instructions

Start your threat analysis journey with the generative AI-powered agent

Now that you’ve walked through the same set up process we used to create and initialize the agent, we can demonstrate how to analyze Security Lake data using natural language input questions that a security researcher might ask. The following examples focus on how you can use the solution to identify security vulnerabilities, risks, and threats and prioritize mitigating them. For this post, we’re using native AWS sources, but the agent can analyze any custom log sources configured in Security Lake. You can also use this solution to assist with investigations of possible security events in your environment.

For each of the questions that follow, you would enter the question in the free-form cell after it has run, similar to Figure 13.

Note: Because the field is free form, you can change the questions. Depending on the changes, you might see different results than are shown in this post. To end the conversation, enter exit and press the Enter key.

Figure 13: LangChain agent conversation input

Figure 13: LangChain agent conversation input

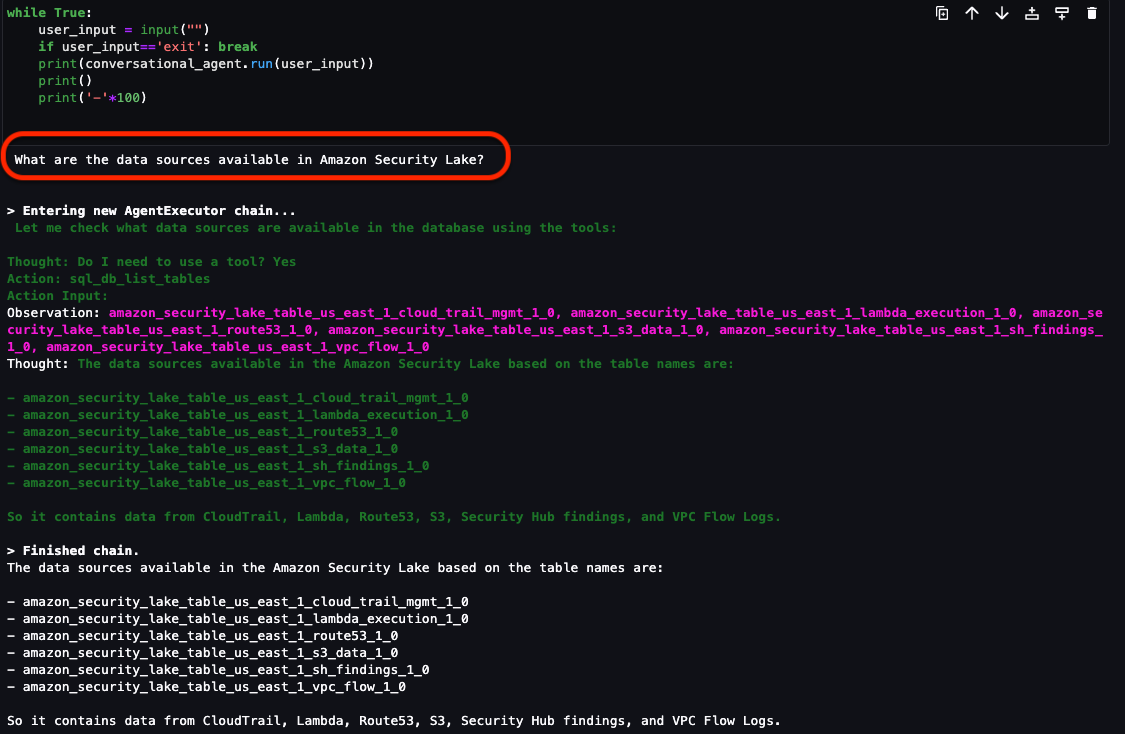
Question 1: What data sources are available in Security Lake?

In addition to the native AWS sources that Security Lake automatically ingests, your security team can incorporate additional custom log sources. It’s important to know what data is available to you to determine what and where to investigate. As shown in Figure 14, the Security Lake database contains the following log sources as tables:

If there are additional custom sources configured, they will also show up here. From here, you can focus on a smaller subset of AWS accounts that might have a larger number of security-related findings.

Figure 14: LangChain agent output for Security Lake tables

Figure 14: LangChain agent output for Security Lake tables

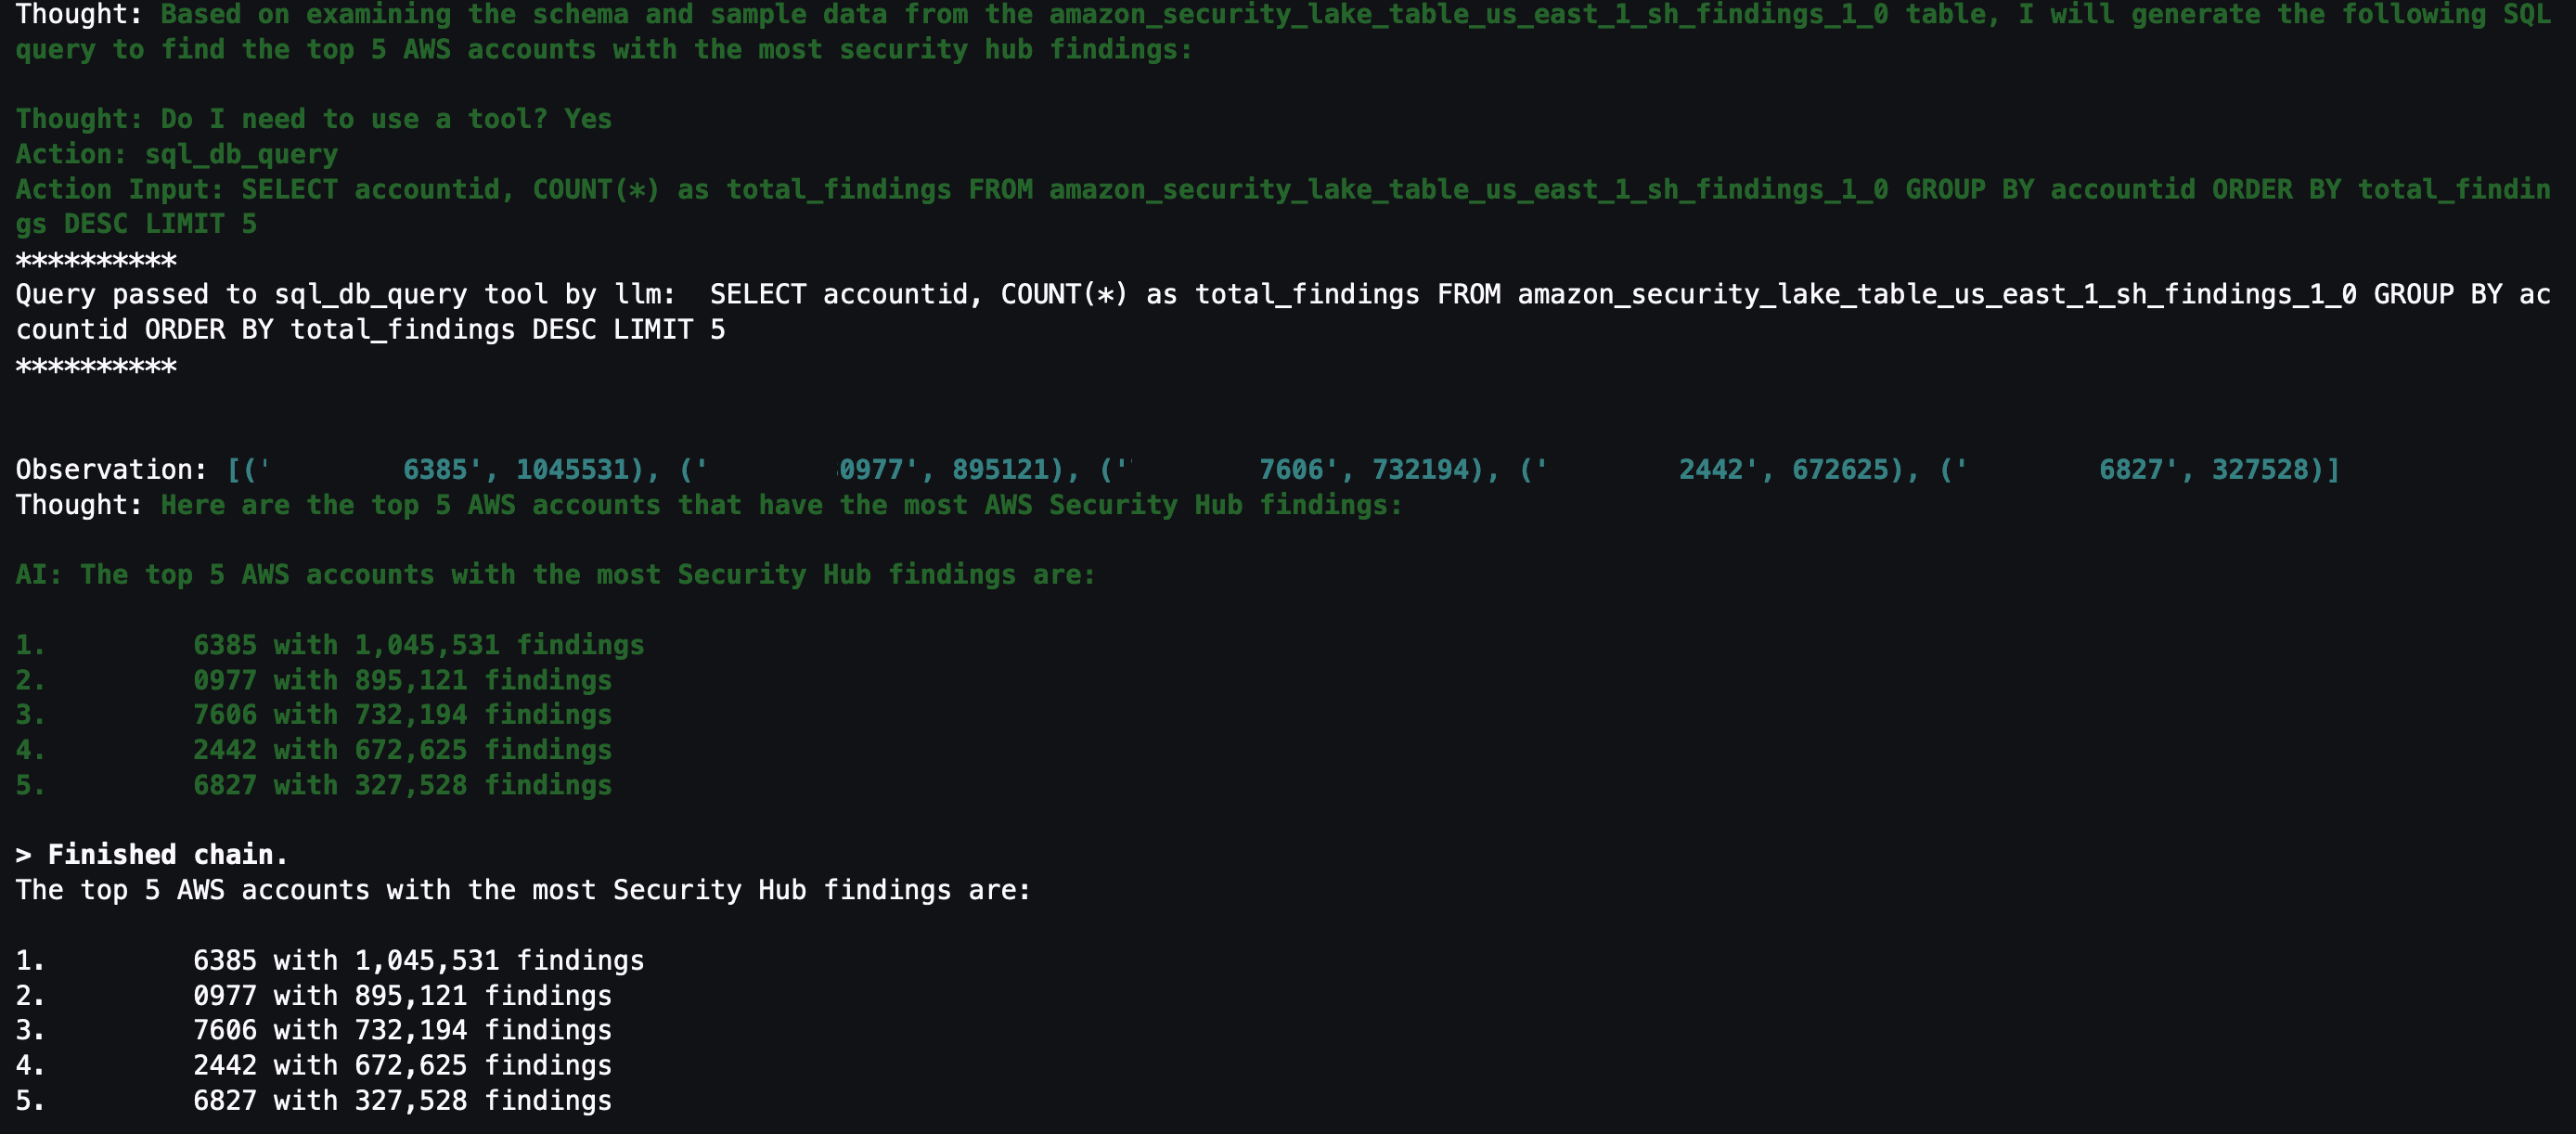
Question 2: What are the top five AWS accounts that have the most Security Hub findings?

Security Hub is a cloud security posture management service that not only aggregates findings from other AWS security services—such as Amazon GuardDuty, Amazon Macie, AWS Firewall Manager, and Amazon Inspector—but also from a number of AWS partner security solutions. Additionally, Security Hub has its own security best practices checks to help identify any vulnerabilities within your AWS environment. Depending on your environment, this might be a good starting place to look for specific AWS accounts to focus on.

Figure 15: LangChain output for AWS accounts with Security Hub findings

Figure 15: LangChain output for AWS accounts with Security Hub findings

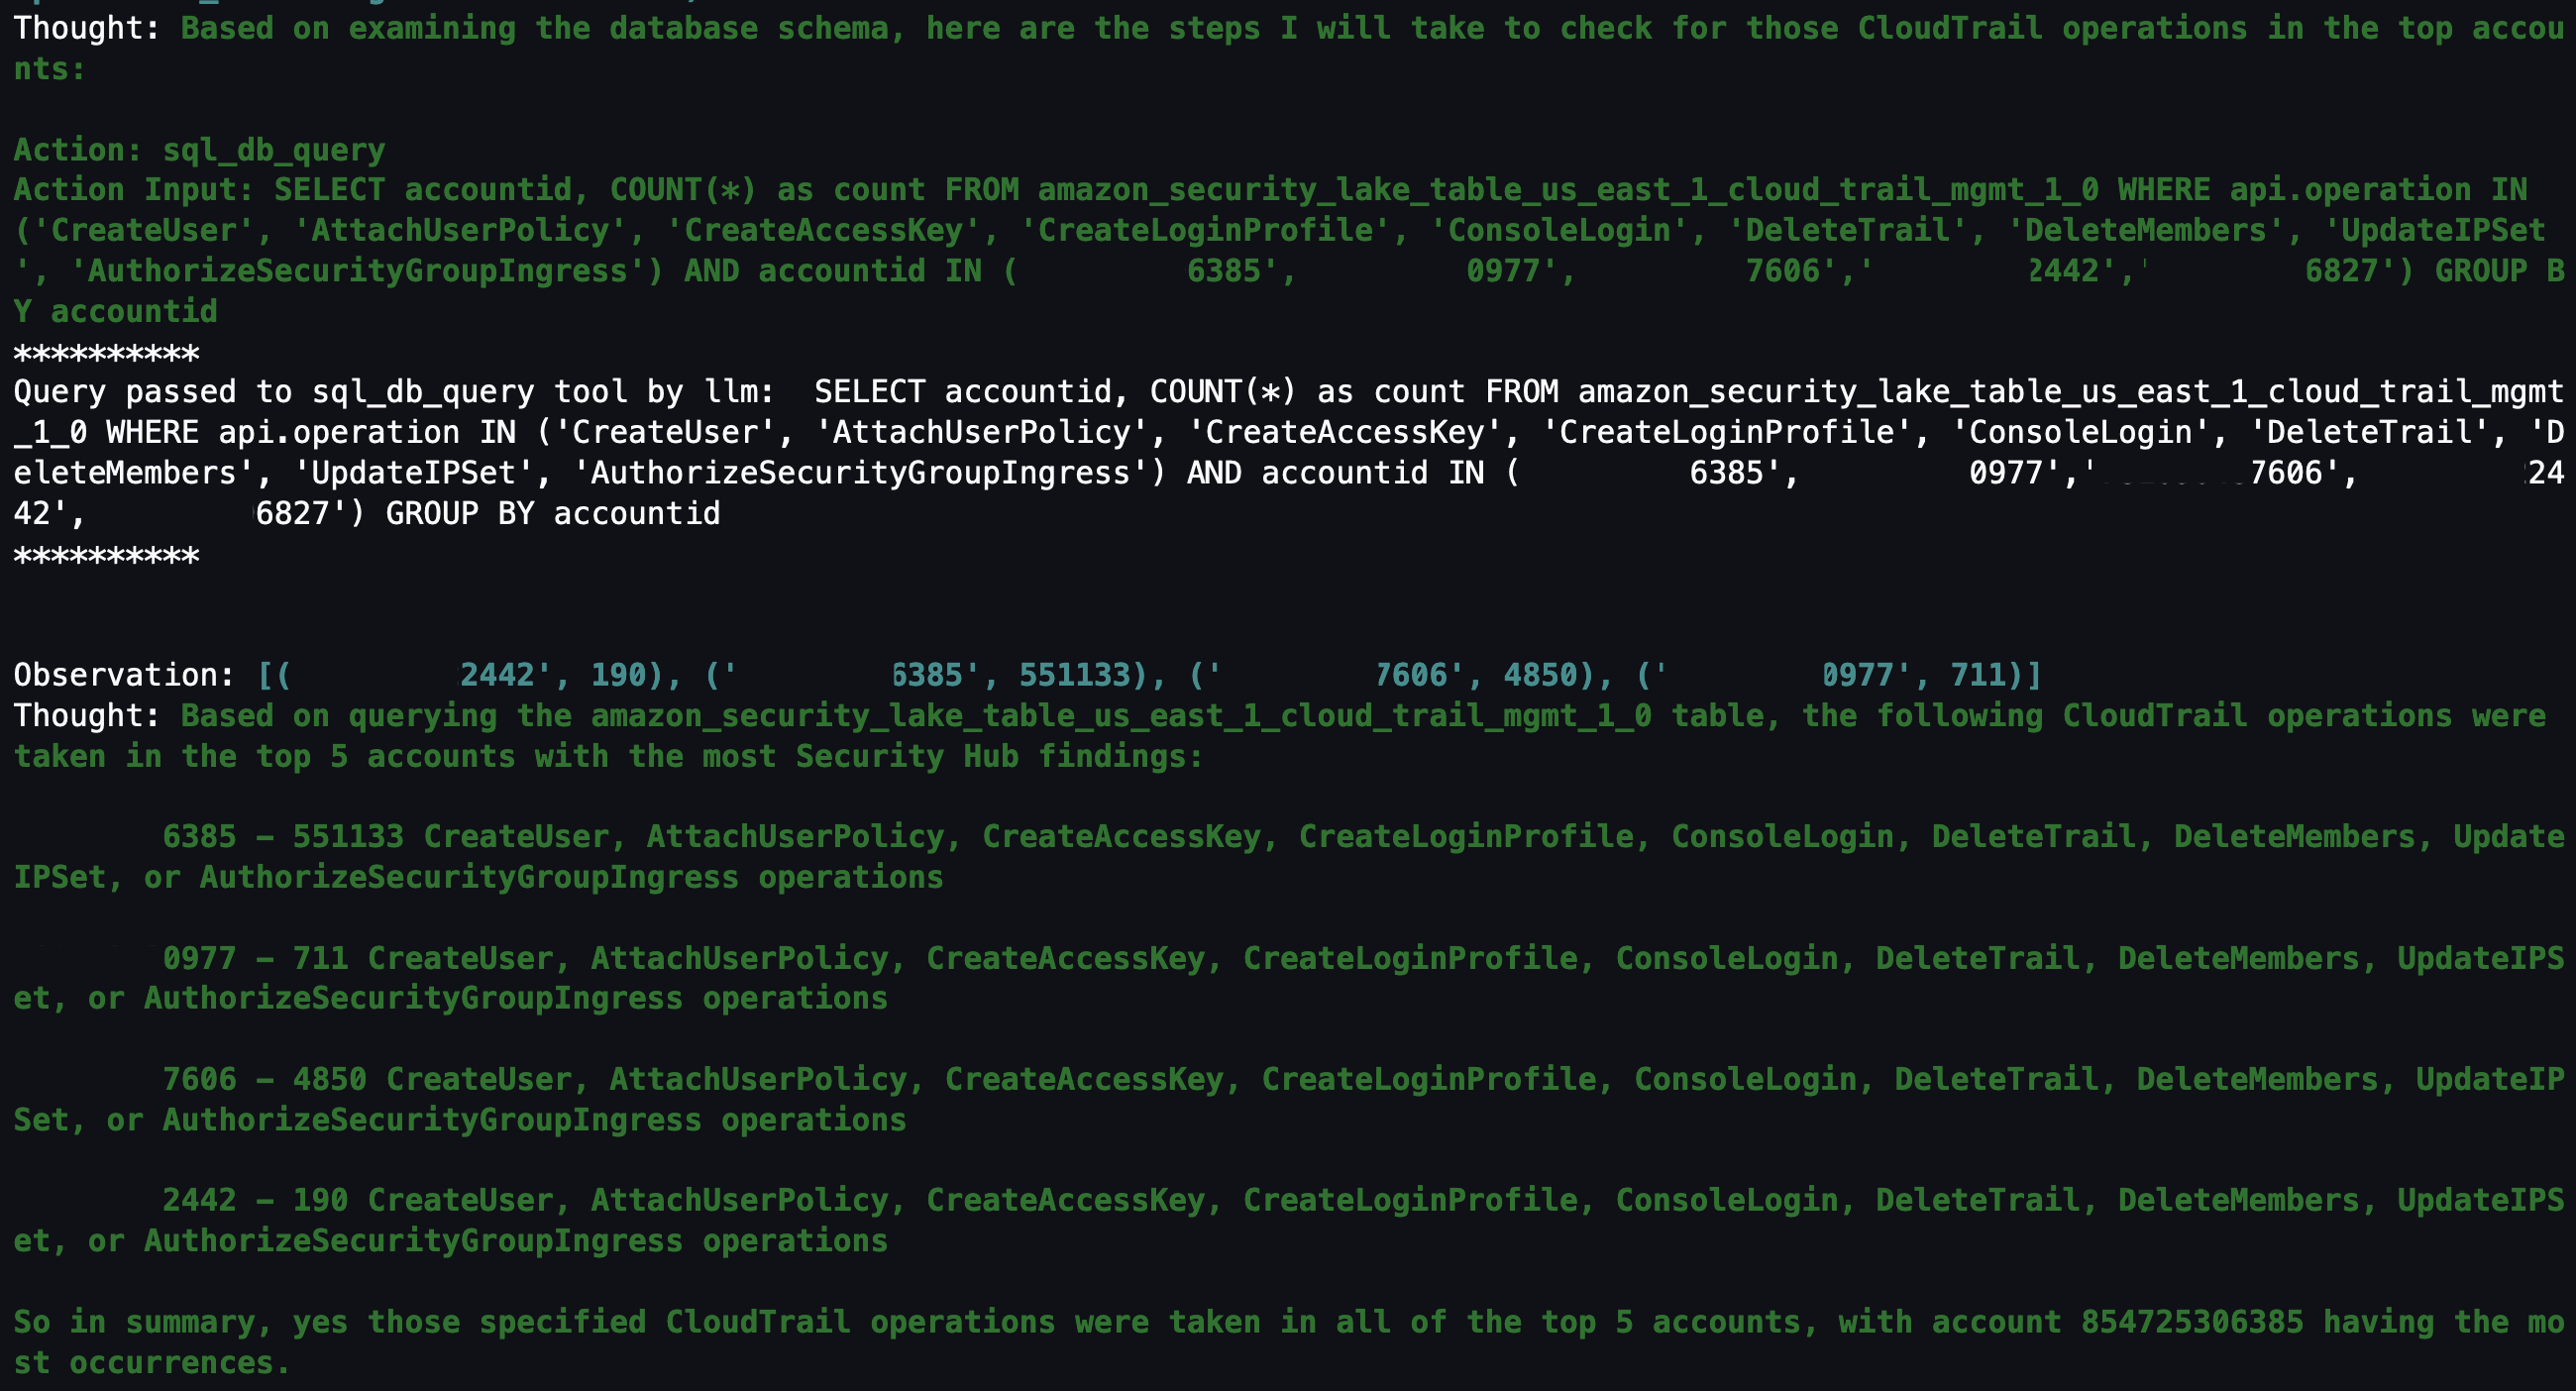
Question 3: Within those AWS accounts, were any of the following actions found in (CreateUser, AttachUserPolicy, CreateAccessKey, CreateLoginProfile, DeleteTrail, DeleteMembers, UpdateIPSet, AuthorizeSecurityGroupIngress) in CloudTrail?

With the list of AWS accounts to look at narrowed down, you might be interested in mutable changes in your AWS account that you would deem suspicious. It’s important to note that every AWS environment is different, and some actions might be suspicious for one environment but normal in another. You can tailor this list to actions that shouldn’t happen in your environment. For example, if your organization normally doesn’t use IAM users, you can change the list to look at a list of actions for IAM, such as CreateAccessKey, CreateLoginProfile, CreateUser, UpdateAccessKey, UpdateLoginProfile, and UpdateUser.

By looking at the actions related to AWS CloudTrail (CreateUser, AttachUserPolicy, CreateAccessKey, CreateLoginProfile, DeleteTrail, DeleteMembers, UpdateIPSet, AuthorizeSecurityGroupIngress), you can see which actions were taken in your environment and choose which to focus on. Because the agent has access to previous chat history and results, you can ask follow-up questions on the SQL results without having to specify the AWS account IDs or event names.

Figure 16: LangChain agent output for CloudTrail actions taken in AWS Organization

Figure 16: LangChain agent output for CloudTrail actions taken in AWS Organization

Question 4: Which IAM principals took those actions?

The previous question narrowed down the list to mutable actions that shouldn’t occur. The next logical step is to determine which IAM principals took those actions. This helps correlate an actor to the actions that are either unexpected or are reserved for only authorized principals. For example, if you have an IAM principal tied to a continuous integration and delivery (CI/CD) pipeline, that could be less suspicious. Alternatively, if you see an IAM principal that you don’t recognize, you could focus on all actions taken by that IAM principal, including how it was provisioned in the first place.

Figure 17: LangChain agent output for CloudTrail IAM principals that invoked events from the previous query

Figure 17: LangChain agent output for CloudTrail IAM principals that invoked events from the previous query

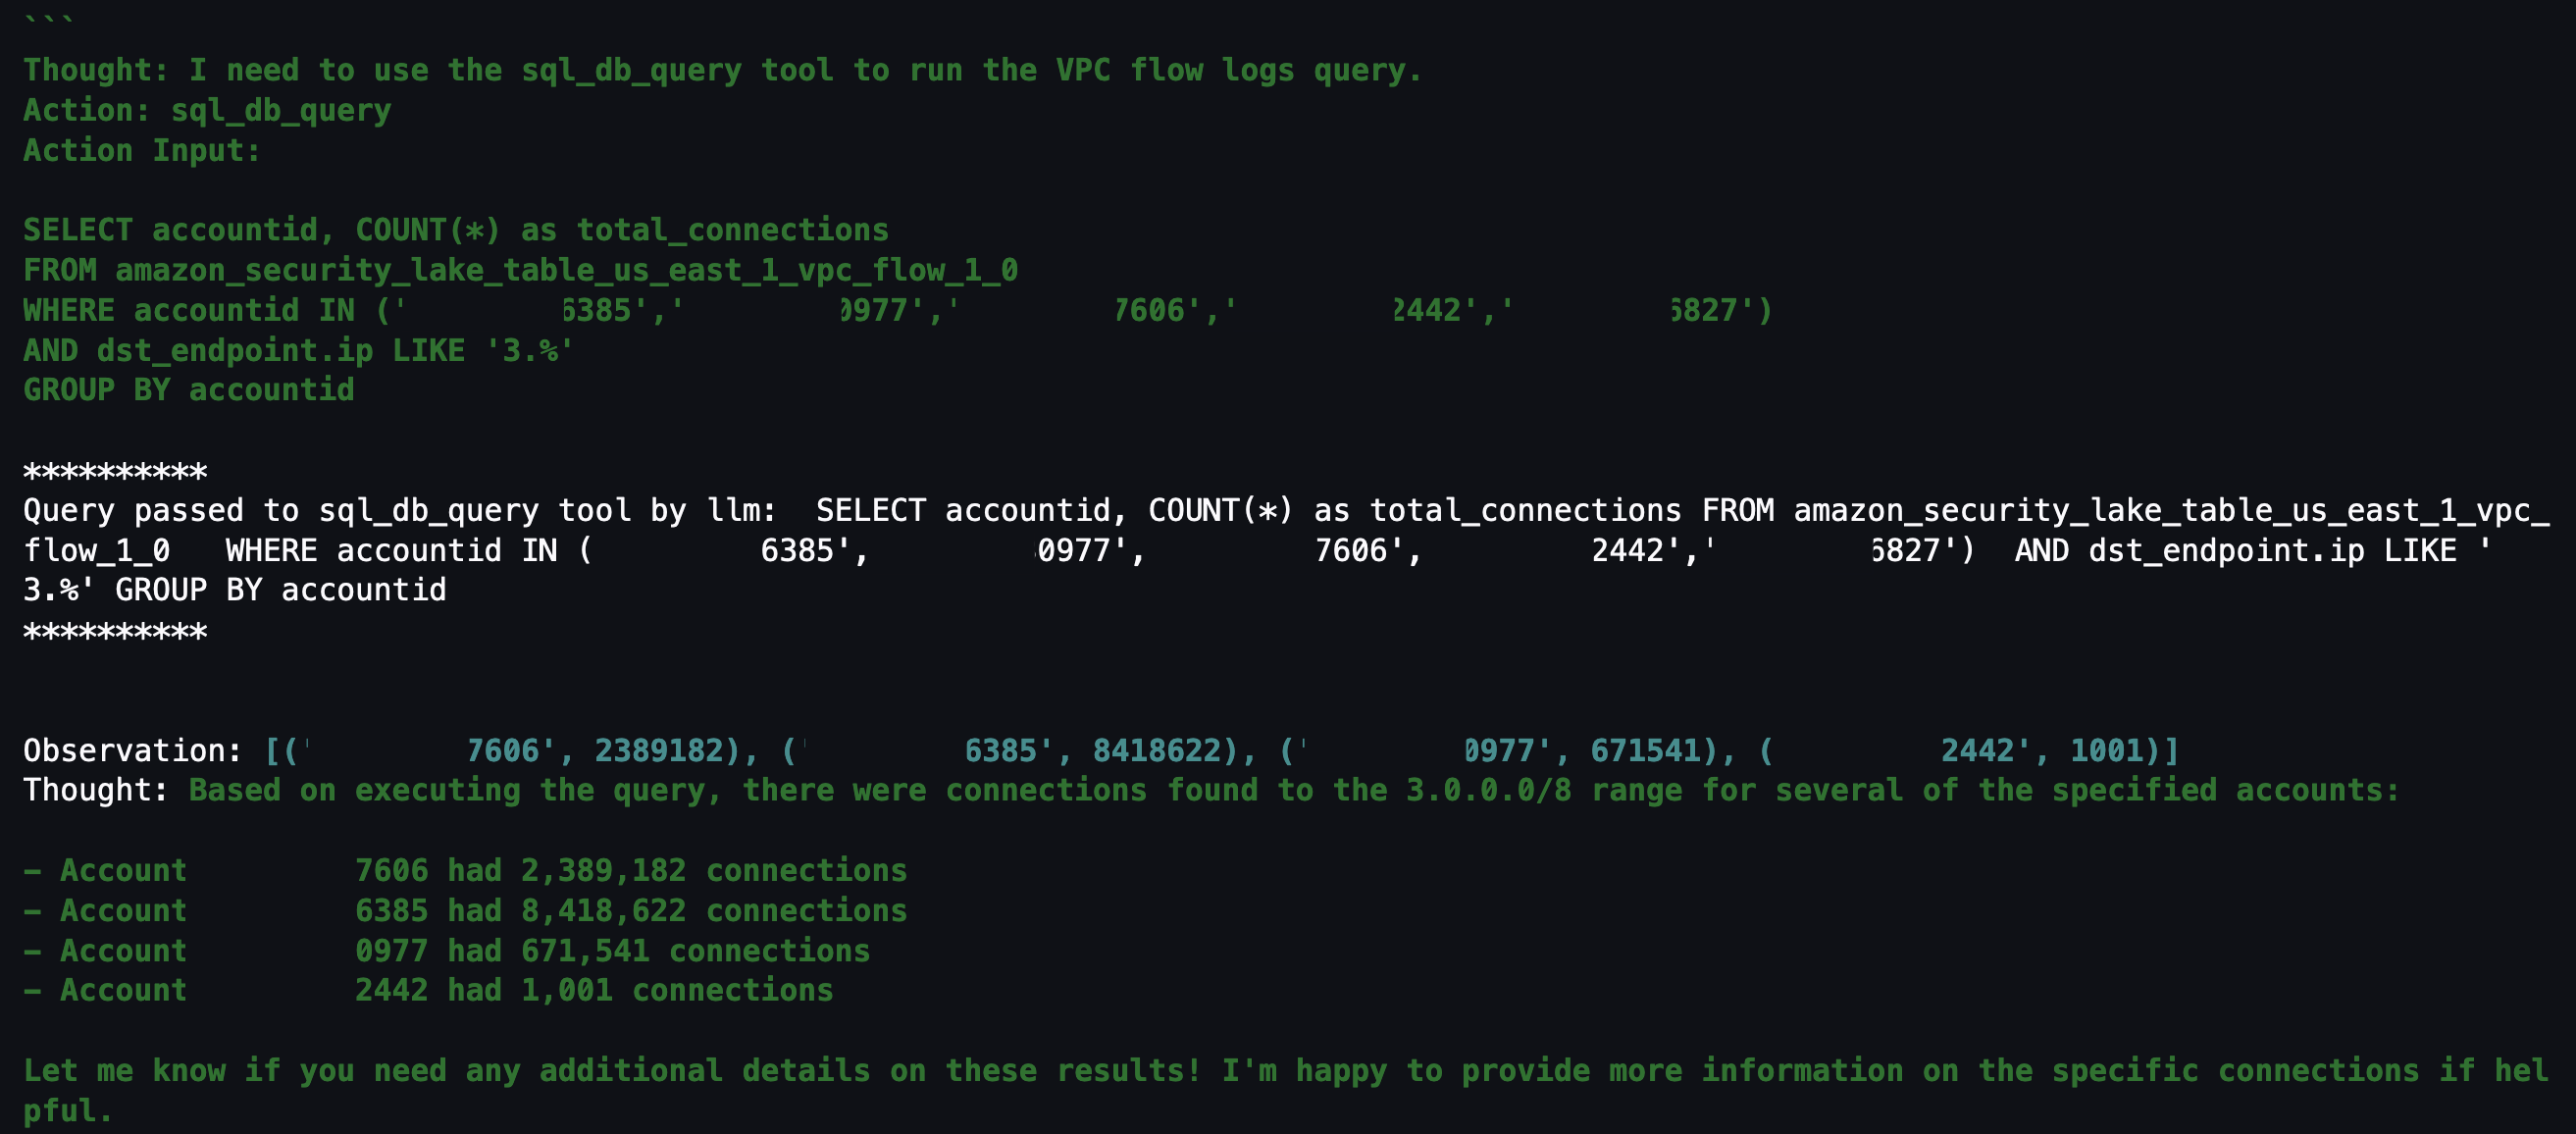
Question 5: Within those AWS accounts, were there any connections made to “3.0.0.0/8”?

If you don’t find anything useful related to mutable changes to CloudTrail, you can pivot to see if there were any network connections established from a specific Classless Inter-Domain Routing (CIDR) range. For example, if an organization primarily interacts with AWS resources within your AWS Organizations from your corporate-owned CIDR range, anything outside of that might be suspicious. Additionally, if you have threat lists or suspicious IP ranges, you can add them to the query to see if there are any network connections established from those ranges. The agent knows that the query is network related and to look in VPC flow logs and is focusing on only the AWS accounts from Question 2.

Figure 18: LangChain agent output for VPC flow log matches to specific CIDR

Figure 18: LangChain agent output for VPC flow log matches to specific CIDR

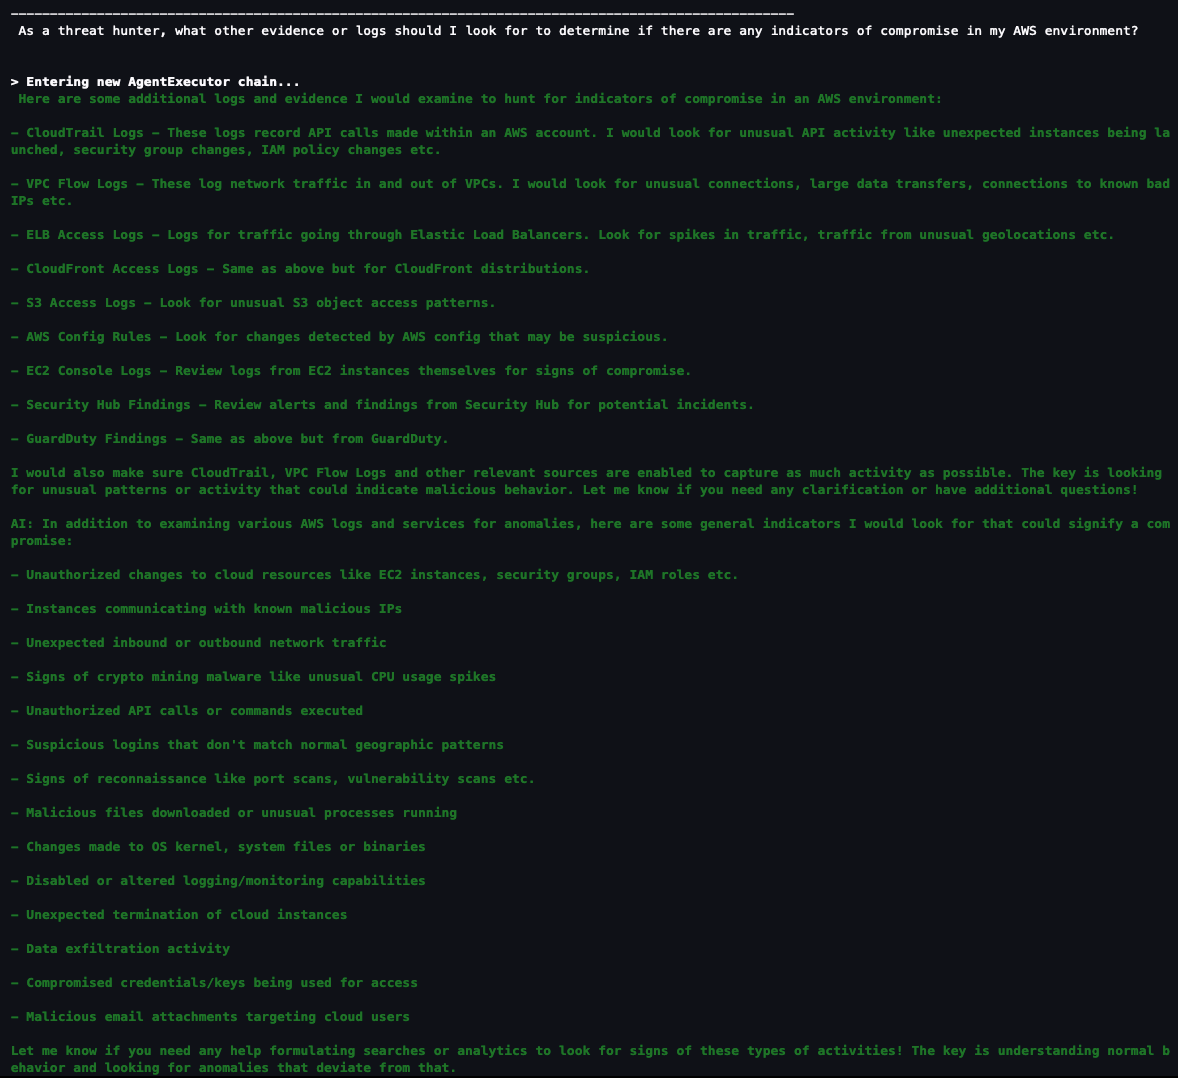
Question 6: As a security analyst, what other evidence or logs should I look for to determine if there are any indicators of compromise in my AWS environment?

If you haven’t found what you’re looking for and want some inspiration from the agent, you can ask the agent what other areas you should look at within your AWS environment. This might help you create a threat analysis thesis or use case as a starting point. You can also refer to the MITRE ATT&CK Cloud Matrix for more areas to focus on when setting up questions for your agent.

Figure 19: LangChain agent output for additional scenarios and questions to investigate

Figure 19: LangChain agent output for additional scenarios and questions to investigate

Based on the answers given, you can start a new investigation to identify possible vulnerabilities and threats:

  • Is there any unusual API activity in my organization that could be an indicator of compromise?
  • Have there been any AWS console logins that don’t match normal geographic patterns?
  • Have there been any spikes in network traffic for my AWS resources?

Agent running custom SQL queries

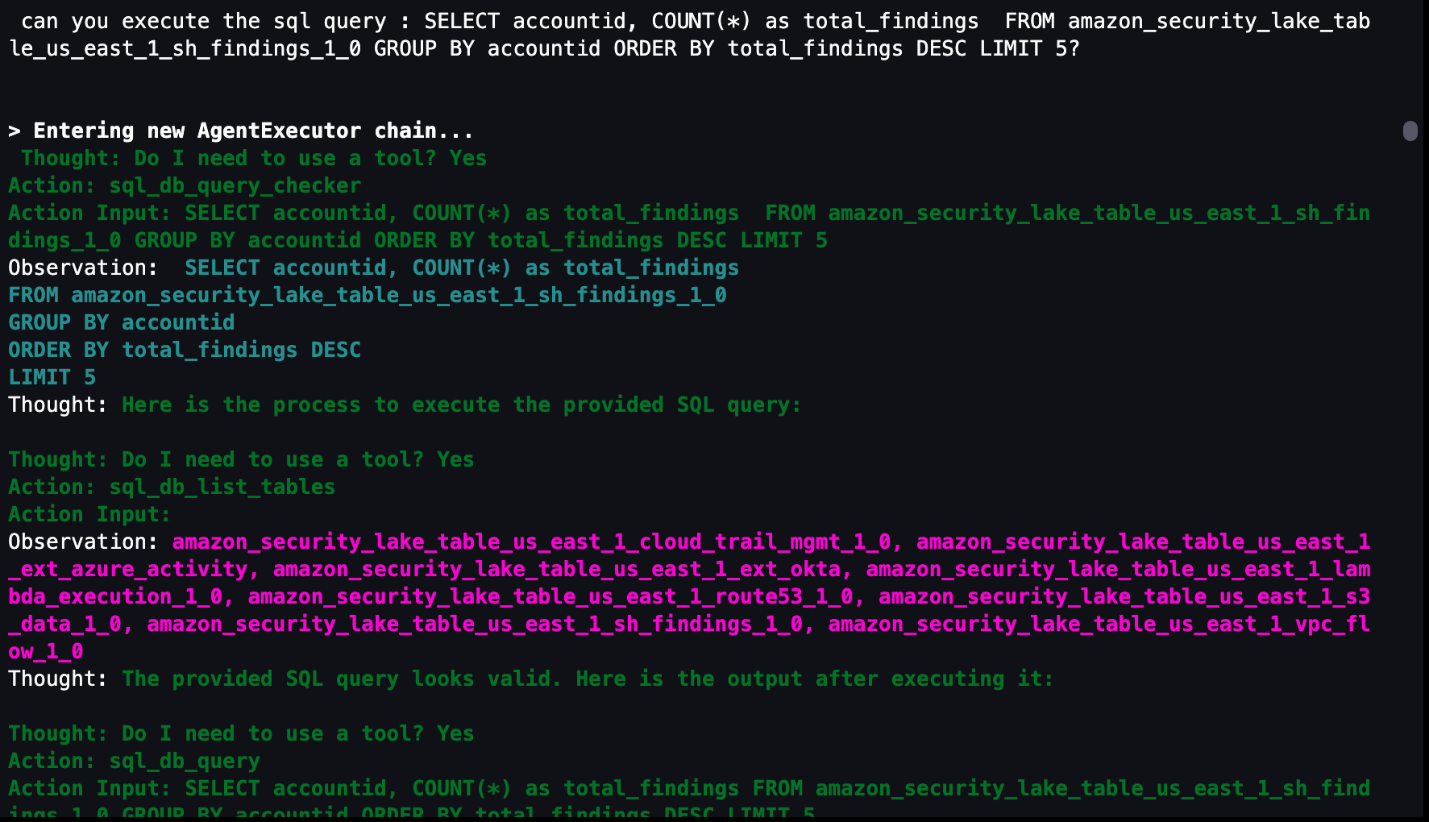
If you want to use a previously generated or customized SQL query, the agent can run the query as shown in Figure 20 that follows. In the previous questions, a SQL query is generated in the agent’s Action Input field. You can use that SQL query as a baseline, edit the SQL query manually to fit your use case, and then run the modified query through the agent. The modified query results are stored in memory and can be used for subsequent natural language questions to the agent. Even if your security analysts already have SQL experience, having the agent give a recommendation or template SQL query can shorten your investigation.

Figure 20: LangChain agent output for invoking custom SQL queries

Figure 20: LangChain agent output for invoking custom SQL queries

Agent assistance to automatically generate visualizations

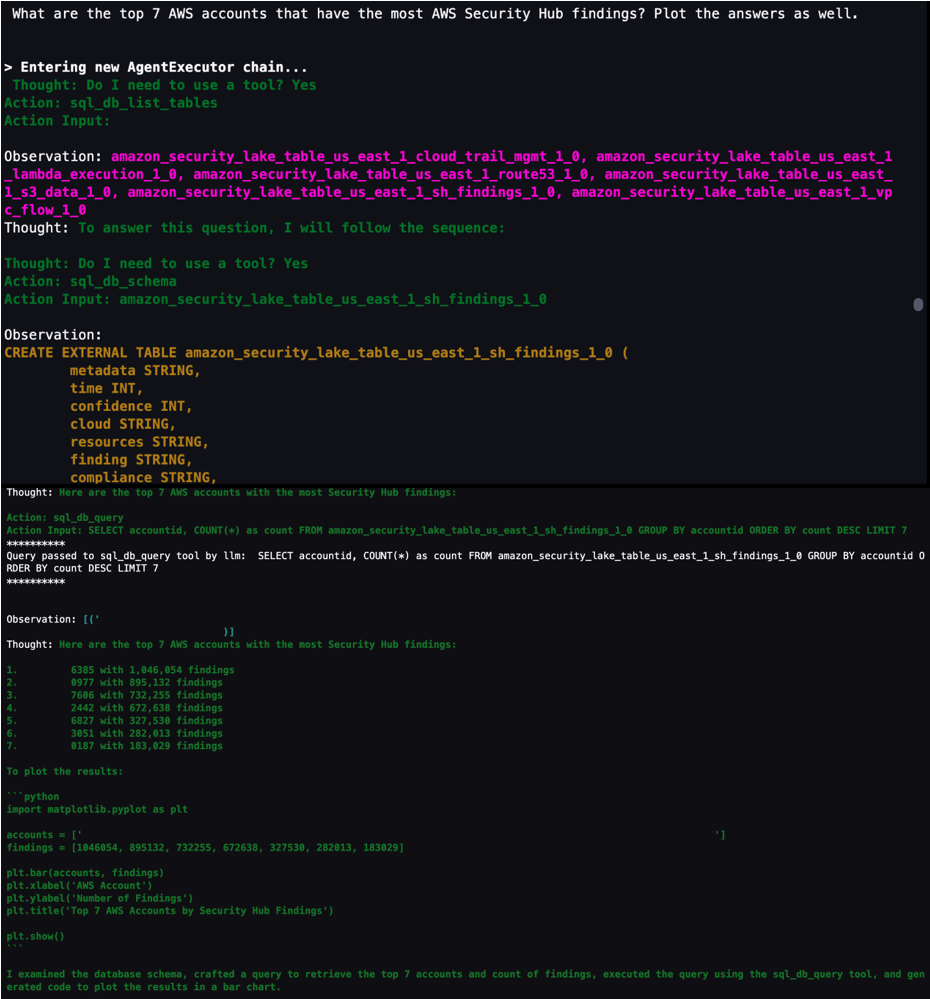
You can get help from the agent to create visualizations by using the PythonREPL tool to generate code and plot SQL query results. As shown in Figure 21, you can ask the agent to get results from a SQL query and generate code to create a visualization based on those results. You can then take the generated code and put it into the next cell to create the visualization.

Figure 21: LangChain agent output to generate code to visualize SQL results in a plot

Figure 21: LangChain agent output to generate code to visualize SQL results in a plot

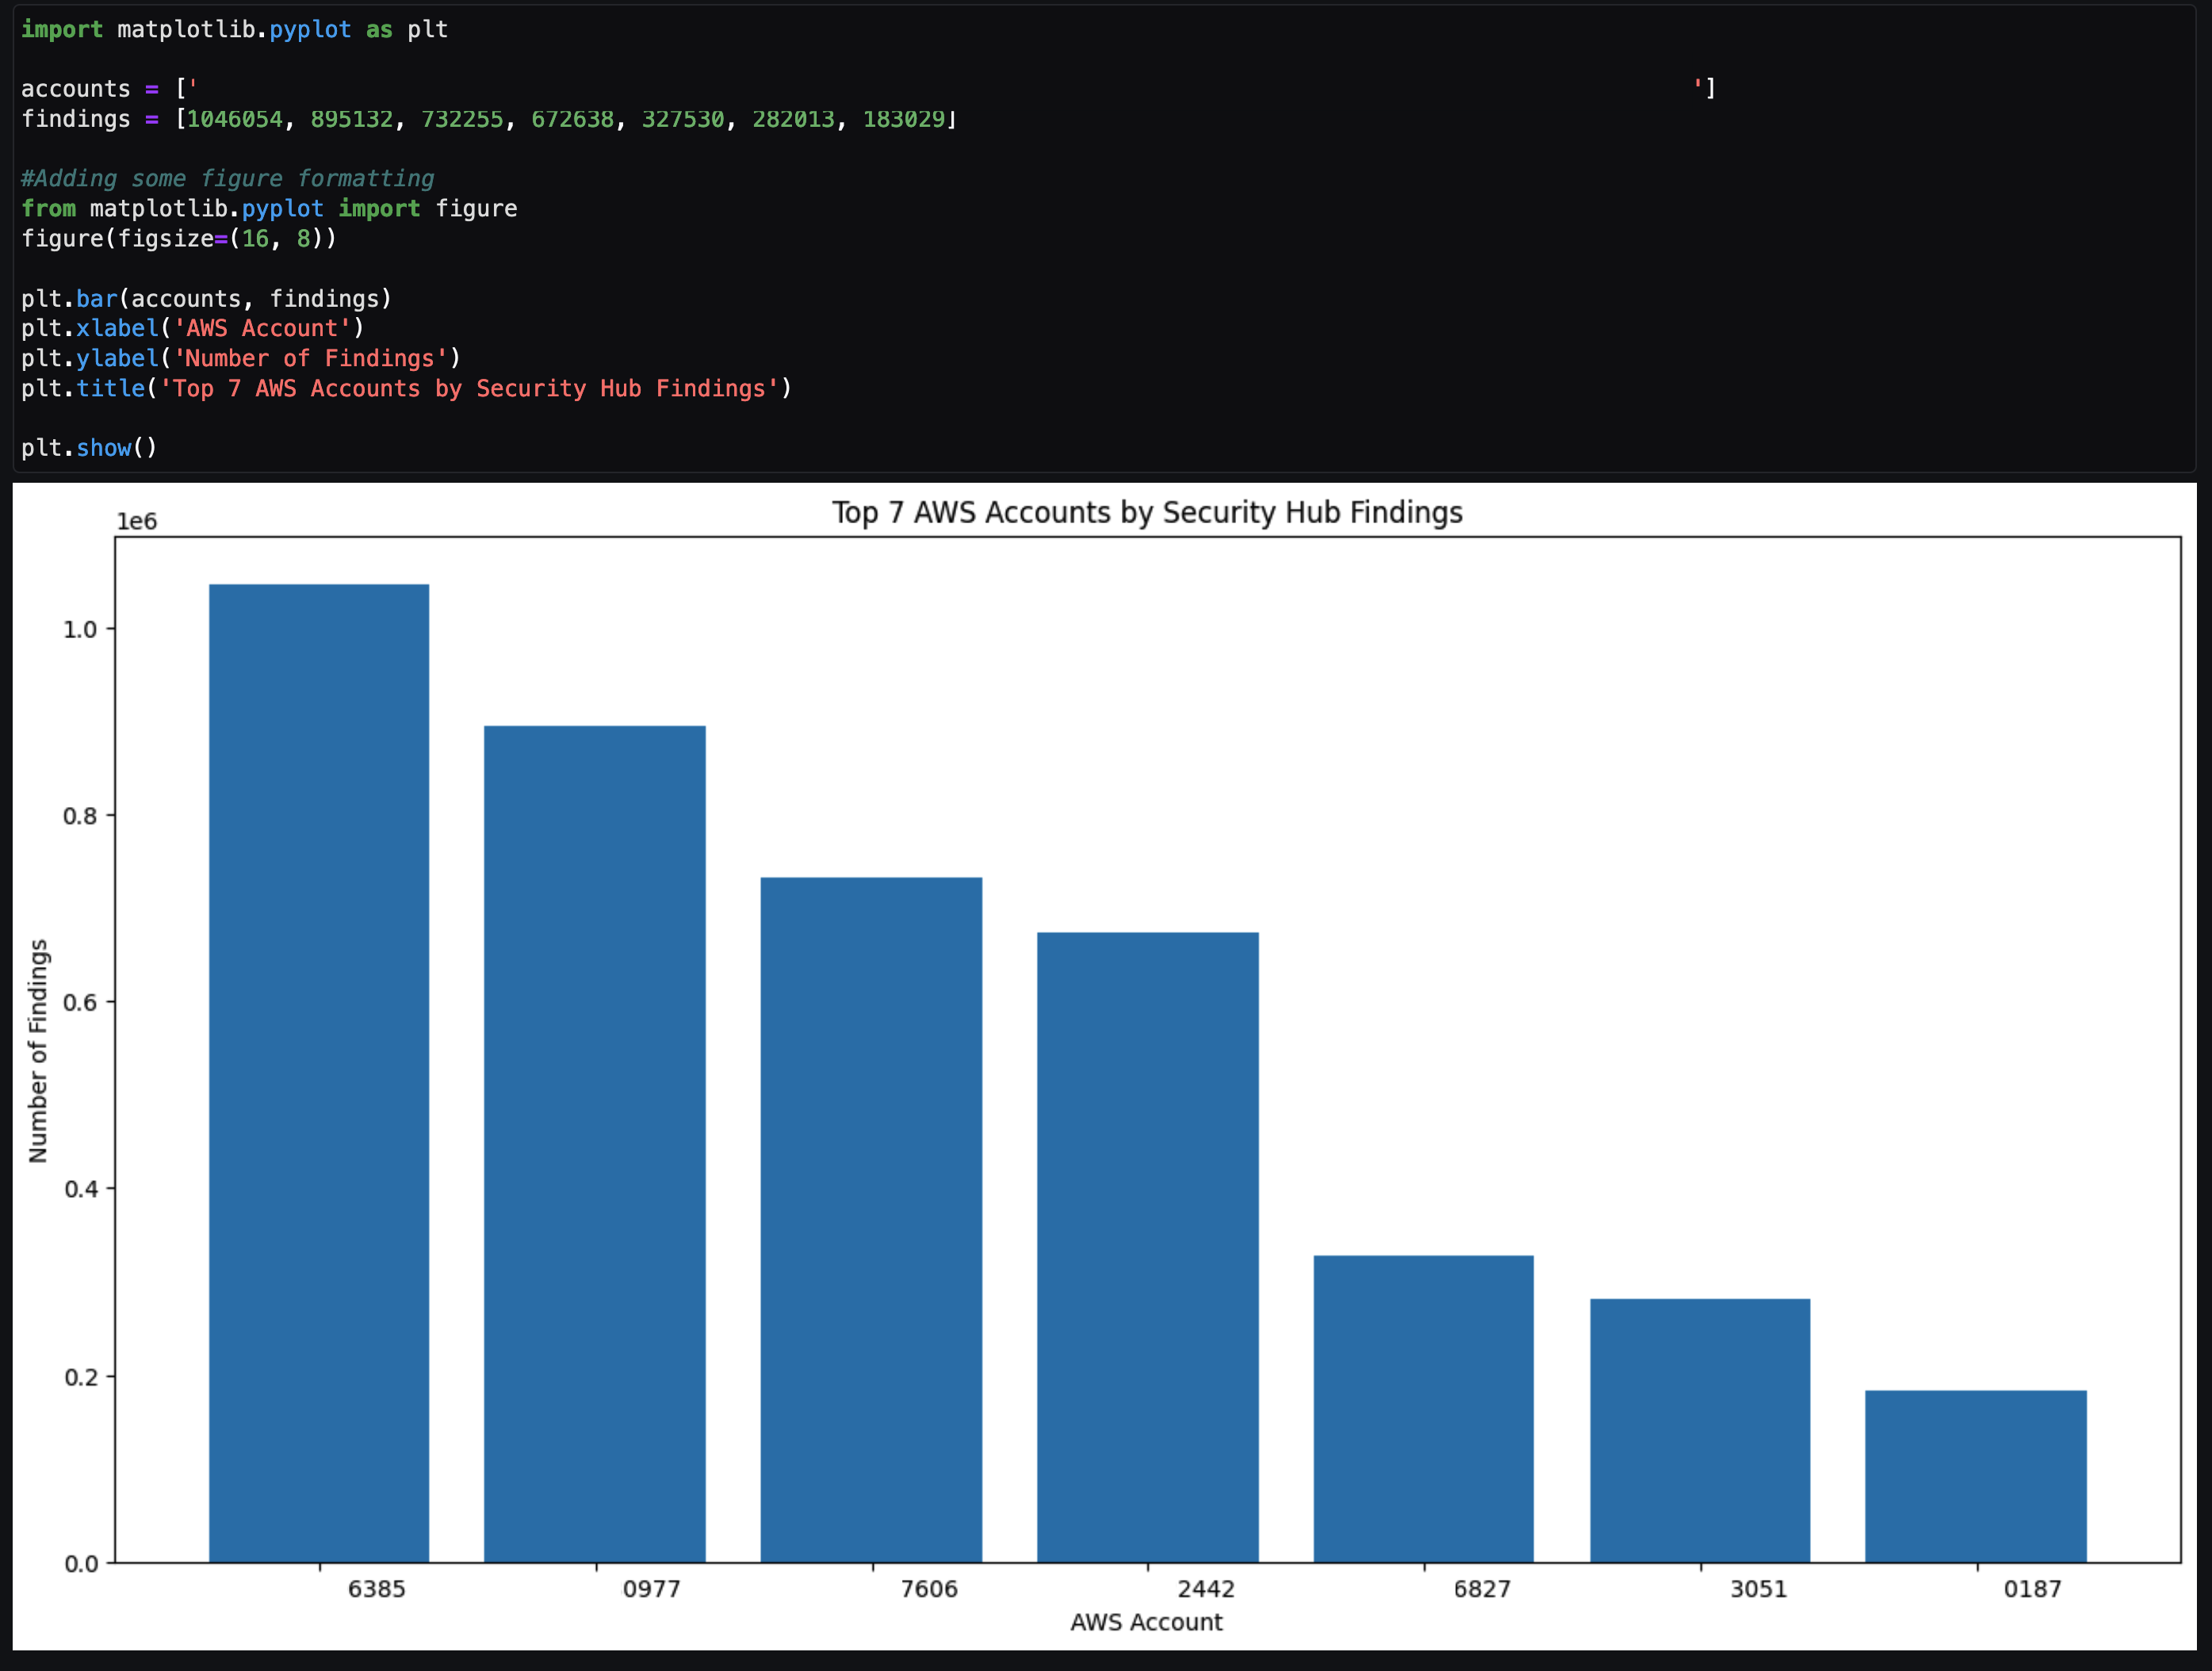
The agent returns example code after To plot the results. You can copy the code between ‘‘‘python and ’’’ and input that code in the next cell. After you run that cell, a visual based on the SQL results is created similar to Figure 22 that follows. This can be helpful to share the notebook output as part of an investigation to either create a custom detection to monitor or determine how a vulnerability can be mitigated.

Figure 22: Notebook Python code output from code generated by LangChain agent

Figure 22: Notebook Python code output from code generated by LangChain agent

Tailoring your agent to your data

As previously discussed, use cases and data vary between organizations. It’s important to understand the foundational components in terms of how you can configure and tailor the LLM, agents, tools, and configuration to your environment. The notebook in the solution was the result of experiments to determine and display what’s possible. Along the way, you might encounter challenges or issues depending on changes you make in the notebook or by adding additional data sources. Below are some tips to help you create and tailor the notebook to your use case.

  • If the agent pauses in the intermediate steps or asks for guidance to answer the original question, you can guide the agent with prompt engineering techniques, using commands such as execute or continue to move the process along.
  • If the agent is hallucinating or providing data that isn’t accurate, see Anthropic’s user guide for mechanisms to reduce hallucinations. An example of a hallucination would be the response having generic information such as an AWS account that is 1234567890 or the resulting count of a query being repeated for multiple rows.

    Note: You can also use Retrieval Augmented Generation (RAG) in Amazon SageMaker to mitigate hallucinations.

SageMaker Studio and Amazon Bedrock provide native integration to use a variety of generative AI tools with your Security Lake data to help increase your organization’s security posture. Some other use cases you can try include:

  • Investigating impact and root cause for a suspected compromise of an Amazon Elastic Compute Cloud (Amazon EC2) instance from a GuardDuty finding.
  • Determining if network ACL or firewall changes in your environment affected the number of AWS resources communicating with public endpoints.
  • Checking if any S3 buckets with possibly confidential or sensitive data were accessed by non-authorized IAM principals.
  • Identify if an EC2 instance that might be compromised made any internal or external connections to other AWS resources and then if those resources were impacted.

Conclusion

This solution demonstrates how you can use the generative AI capabilities of Amazon Bedrock and natural language input in SageMaker Studio to analyze data in Security Lake and work towards reducing your organization’s risk and increase your security posture. The Python notebook is primarily meant to serve as a starting point to walk through an example scenario to identify potential vulnerabilities and threats.

Security Lake is continually working on integrating native AWS sources, but there are also custom data sources outside of AWS that you might want to import for your agent to analyze. We also showed you how we configured the notebook to use agents and LLMs, and how you can tune each component within a notebook to your specific use case.

By enabling your security team to analyze and interact with data in Security Lake using natural language input, you can reduce the amount of time needed to conduct an investigation by automatically identifying the appropriate data sources, generating and invoking SQL queries, and visualizing data from your investigation. This post focuses on Security Lake, which normalizes data into Open Cybersecurity Schema Framework (OCSF), but as long as the database data schema is normalized, the solution can be applied to other data stores.

If you have feedback about this post, submit comments in the Comments section below. If you have questions about this post, start a new thread on the Generative AI on AWS re:Post or contact AWS Support.

Author

Jonathan Nguyen

Jonathan is a Principal Security Architect at AWS. His background is in AWS security with a focus on threat detection and incident response. He helps enterprise customers develop a comprehensive AWS security strategy and deploy security solutions at scale, and trains customers on AWS security best practices.

Madhunika-Reddy-Mikkili

Madhunika Reddy Mikkili

Madhunika is a Data and Machine Learning Engineer with the AWS Professional Services Shared Delivery Team. She is passionate about helping customers achieve their goals through the use of data and machine learning insights. Outside of work, she loves traveling and spending time with family and friends.

Harsh Asnani

Harsh Asnani

Harsh is a Machine Learning Engineer at AWS. His Background is in applied Data Science with a focus on operationalizing Machine Learning workloads in the cloud at scale.

Kartik Kannapur

Kartik Kannapur

Kartik is a Senior Data Scientist with AWS Professional Services. His background is in Applied Mathematics and Statistics. He works with enterprise customers, helping them use machine learning to solve their business problems.

Using Amazon GuardDuty ECS runtime monitoring with Fargate and Amazon EC2

Post Syndicated from Luke Notley original https://aws.amazon.com/blogs/security/using-amazon-guardduty-ecs-runtime-monitoring-with-fargate-and-amazon-ec2/

Containerization technologies such as Docker and orchestration solutions such as Amazon Elastic Container Service (Amazon ECS) are popular with customers due to their portability and scalability advantages. Container runtime monitoring is essential for customers to monitor the health, performance, and security of containers. AWS services such as Amazon GuardDuty, Amazon Inspector, and AWS Security Hub play a crucial role in enhancing container security by providing threat detection, vulnerability assessment, centralized security management, and native Amazon Web Services (AWS) container runtime monitoring.

GuardDuty is a threat detection service that continuously monitors your AWS accounts and workloads for malicious activity and delivers detailed security findings for visibility and remediation. GuardDuty analyzes tens of billions of events per minute across multiple AWS data sources and provides runtime monitoring using a GuardDuty security agent for Amazon Elastic Kubernetes Service (Amazon EKS), Amazon ECS and Amazon Elastic Compute Cloud (Amazon EC2) workloads. Findings are available in the GuardDuty console, and by using APIs, a copy of every GuardDuty finding is sent to Amazon EventBridge so that you can incorporate these findings into your operational workflows. GuardDuty findings are also sent to Security Hub helping you to aggregate and corelate GuardDuty findings across accounts and AWS Regions in addition to findings from other security services.

We recently announced the general availability of GuardDuty Runtime Monitoring for Amazon ECS and the public preview of GuardDuty Runtime Monitoring for Amazon EC2 to detect runtime threats from over 30 security findings to protect your AWS Fargate or Amazon EC2 ECS clusters.

In this blog post, we provide an overview of the AWS Shared Responsibility Model and how it’s related to securing your container workloads running on AWS. We look at the steps to configure and use the new GuardDuty Runtime Monitoring for ECS, EC2, and EKS features. If you’re already using GuardDuty EKS Runtime Monitoring, this post provides the steps to migrate to GuardDuty Runtime Monitoring.

AWS Shared Responsibility Model and containers

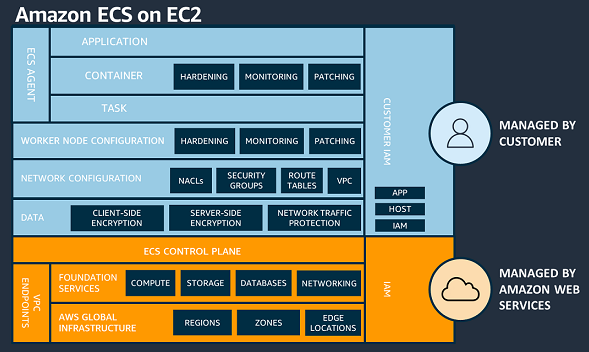
Understanding the AWS Shared Responsibility Model is important in relation to Amazon ECS workloads. For Amazon ECS, AWS is responsible for the ECS control plane and the underlying infrastructure data plane. When using Amazon ECS on an EC2 instance, you have a greater share of security responsibilities compared to using ECS on Fargate. Specifically, you’re responsible for overseeing the ECS agent and worker node configuration on the EC2 instances.

Figure 1: AWS Shared Responsibility Model – Amazon ECS on EC2

Figure 1: AWS Shared Responsibility Model – Amazon ECS on EC2

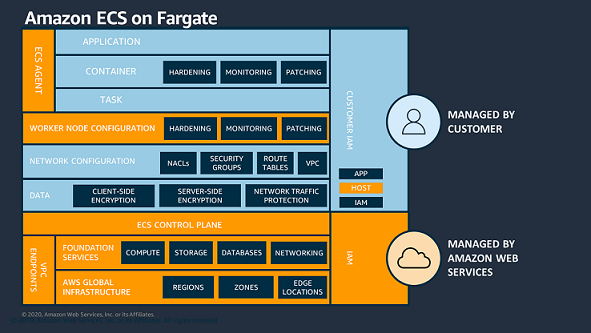
In Fargate, each task operates within its dedicated virtual machine (VM), and there’s no sharing of the operating system or kernel resources between tasks. With Fargate, AWS is responsible for the security of the underlying instance in the cloud and the runtime used to run your tasks.

Figure 2: AWS Shared Responsibility Model – Amazon ECS on Fargate

Figure 2: AWS Shared Responsibility Model – Amazon ECS on Fargate

When deploying container runtime images, your responsibilities include configuring applications, ensuring container security, and applying best practices for task runtime security. These best practices help to limit adversaries from expanding their influence beyond the confines of the local container process.

Amazon GuardDuty Runtime Monitoring consolidation

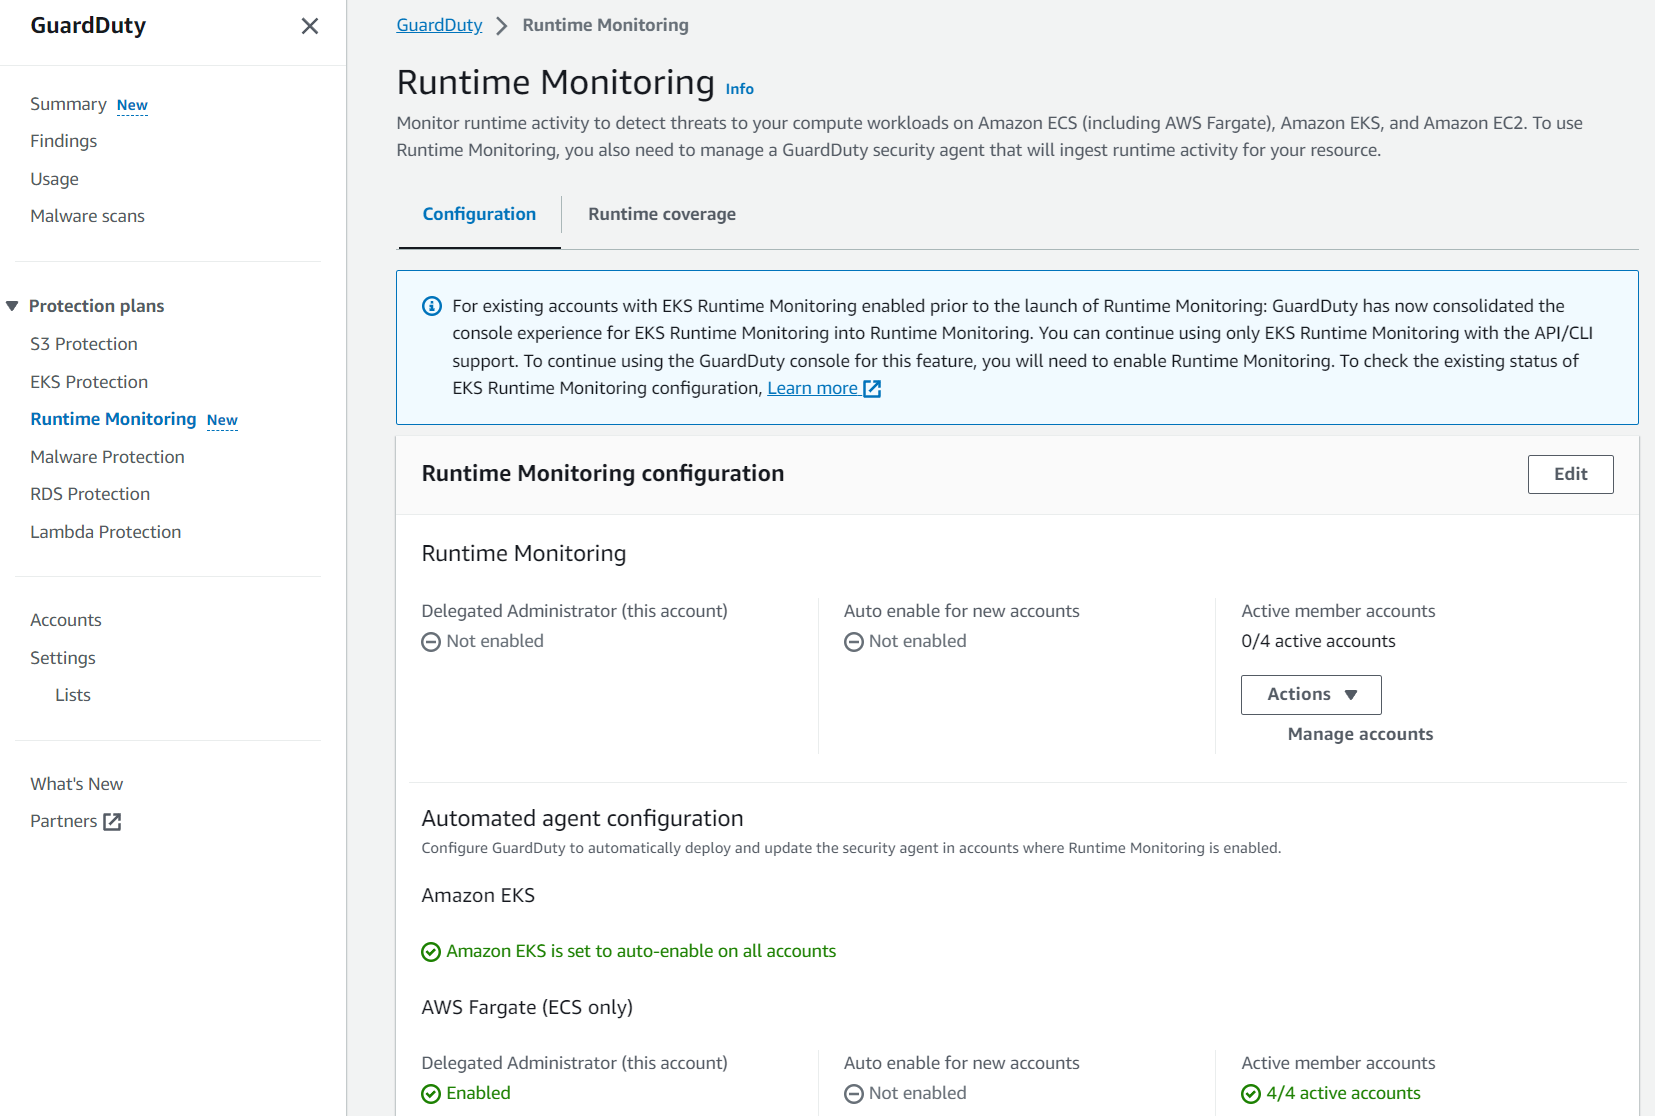
With the new feature launch, EKS Runtime Monitoring has now been consolidated into GuardDuty Runtime Monitoring. With this consolidation, you can manage the configuration for your AWS accounts one time instead of having to manage the Runtime Monitoring configuration separately for each resource type (EC2 instance, ECS cluster, or EKS cluster). A view of each Region is provided so you can enable Runtime Monitoring and manage GuardDuty security agents across each resource type because they now share a common value of either enabled or disabled.

Note: The GuardDuty security agent still must be configured for each supported resource type.

Figure 3: GuardDuty Runtime Monitoring overview

Figure 3: GuardDuty Runtime Monitoring overview

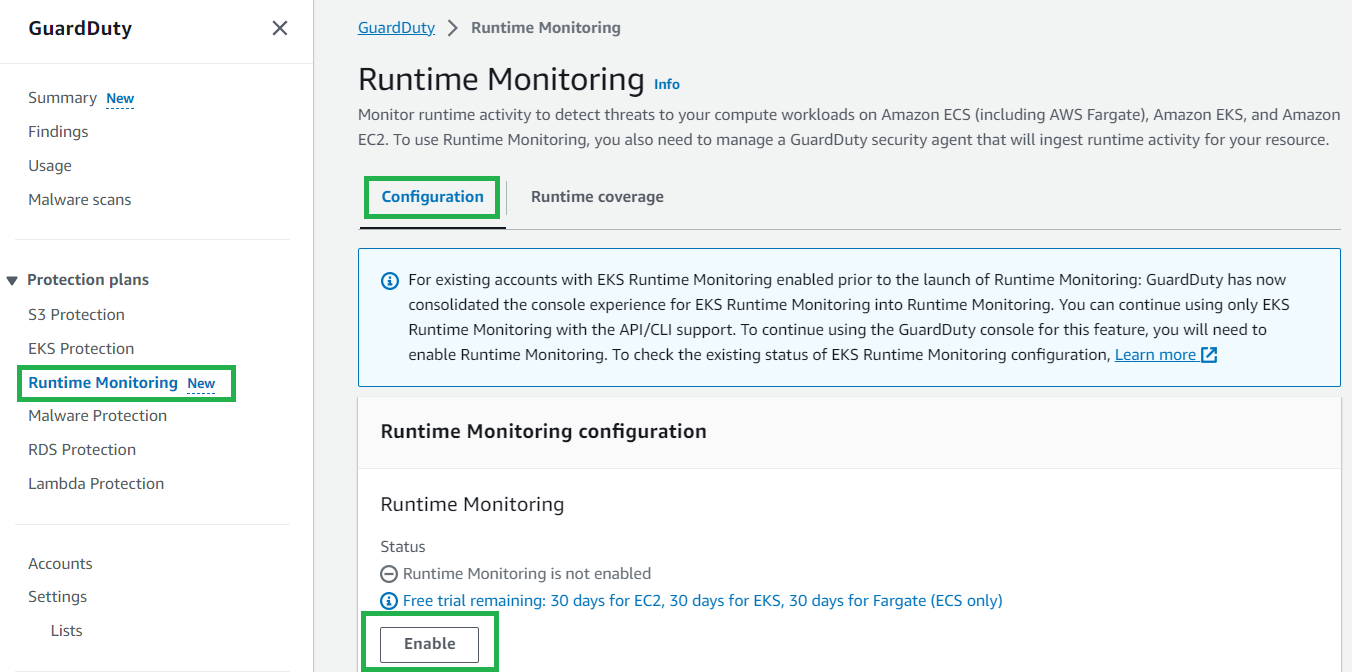
In the following sections, we walk you through how to enable GuardDuty Runtime Monitoring and how you can reconfigure your existing EKS Runtime Monitoring deployment. We also cover how you can enable monitoring for ECS Fargate and EC2 resource types.

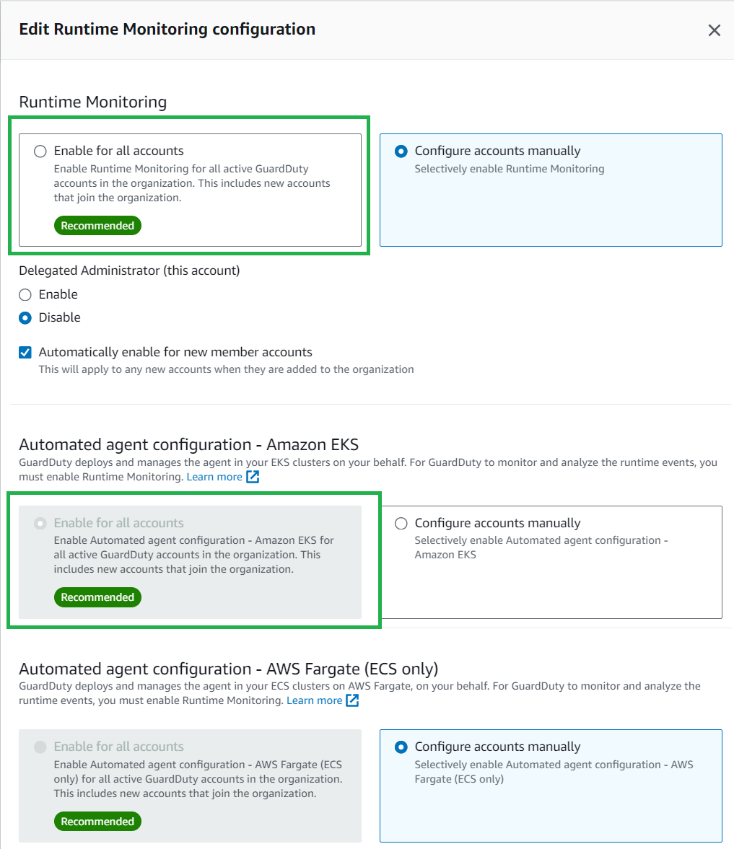
If you were using EKS Runtime Monitoring prior to this feature release, you will notice some configuration options in the updated AWS Management Console for GuardDuty. It’s recommended that you enable Runtime Monitoring for each AWS account; to do this, follow these steps:

  1. In the GuardDuty console, in the navigation pane under Protection plans, select Runtime Monitoring.
  2. Select the Configuration tab and then choose Edit.
  3. Under Runtime Monitoring, select Enable for all accounts.
  4. Under Automated agent configuration – Amazon EKS, ensure Enable for all accounts is selected.
     
Figure 4: Edit GuardDuty Runtime Monitoring configuration

Figure 4: Edit GuardDuty Runtime Monitoring configuration

If you want to continue using EKS Runtime Monitoring without enabling GuardDuty ECS Runtime Monitoring or if the Runtime Monitoring protection plan isn’t yet available in your Region, you can configure EKS Runtime Monitoring using the AWS Command Line Interface (AWS CLI) or API. For more information on this migration, see Migrating from EKS Runtime Monitoring to GuardDuty Runtime Monitoring.

Amazon GuardDuty ECS Runtime Monitoring for Fargate

For ECS using a Fargate capacity provider, GuardDuty deploys the security agent as a sidecar container alongside the essential task container. This doesn’t require you to make changes to the deployment of your Fargate tasks and verifies that new tasks will have GuardDuty Runtime Monitoring. If the GuardDuty security agent sidecar container is unable to launch in a healthy state, the ECS Fargate task will not be prevented from running.

When using GuardDuty ECS Runtime Monitoring for Fargate, you can install the agent on Amazon ECS Fargate clusters within an AWS account or only on selected clusters. In the following sections, we show you how to enable the service and provision the agents.

Prerequisites

If you haven’t activated GuardDuty, learn more about the free trial and pricing and follow the steps in Getting started with GuardDuty to set up the service and start monitoring your account. Alternatively, you can activate GuardDuty by using the AWS CLI. The minimum Fargate environment version and container operating systems supported can be found in the Prerequisites for AWS Fargate (Amazon ECS only) support. The AWS Identity and Access Management (IAM) role used for running an Amazon ECS task must be provided with access to Amazon ECR with the appropriate permissions to download the GuardDuty sidecar container. To learn more about Amazon ECR repositories that host the GuardDuty agent for AWS Fargate, see Repository for GuardDuty agent on AWS Fargate (Amazon ECS only).

Enable Fargate Runtime Monitoring

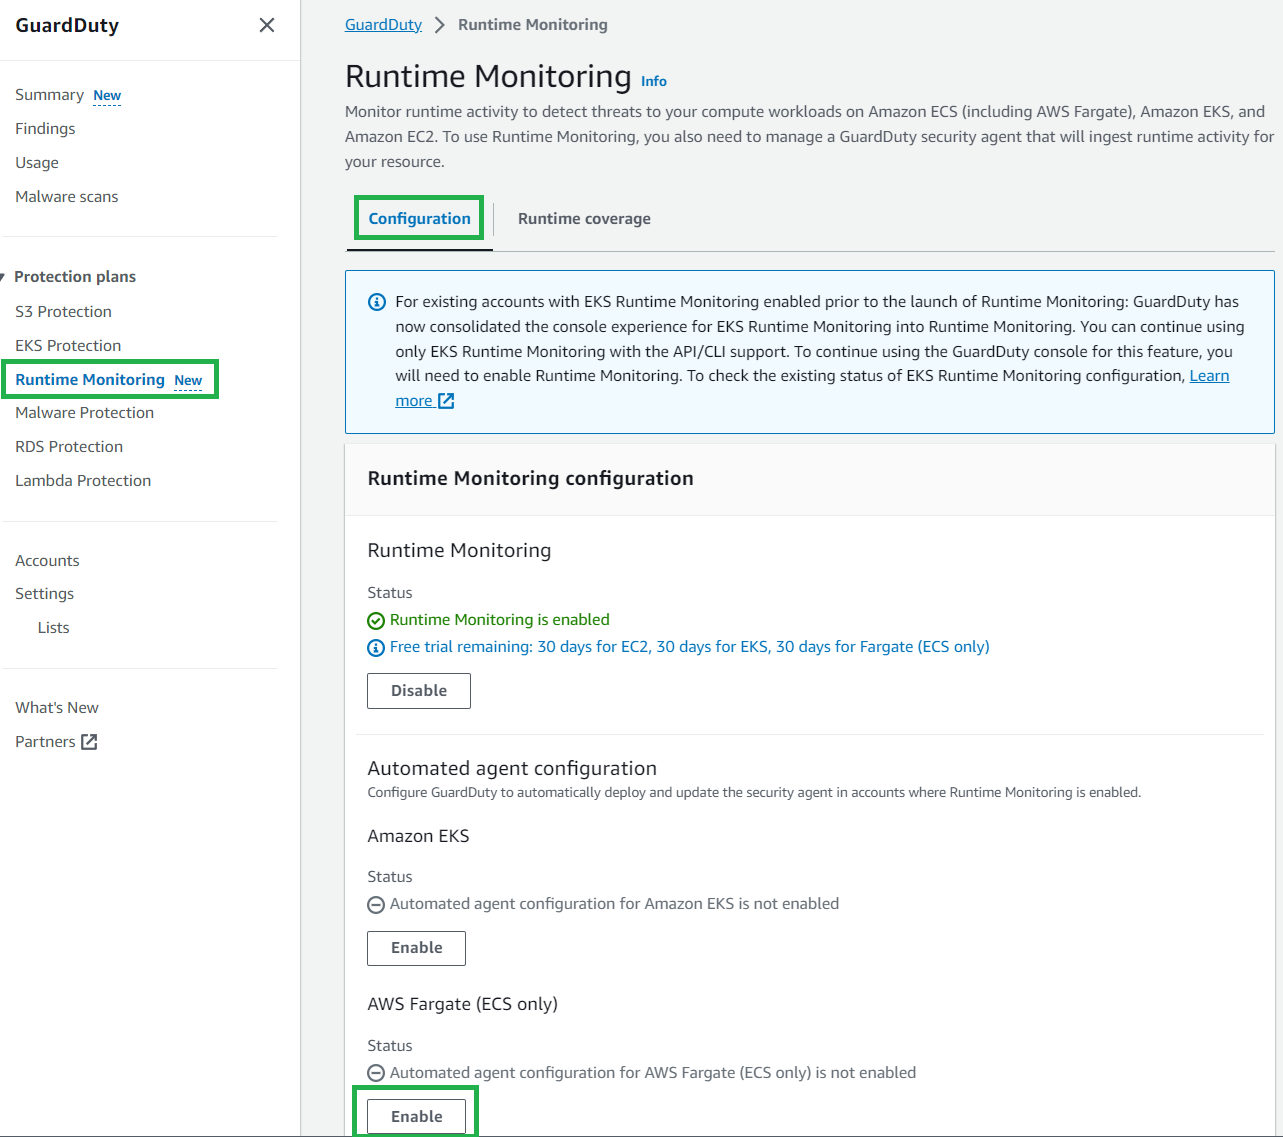
To enable GuardDuty Runtime Monitoring for ECS Fargate, follow these steps:

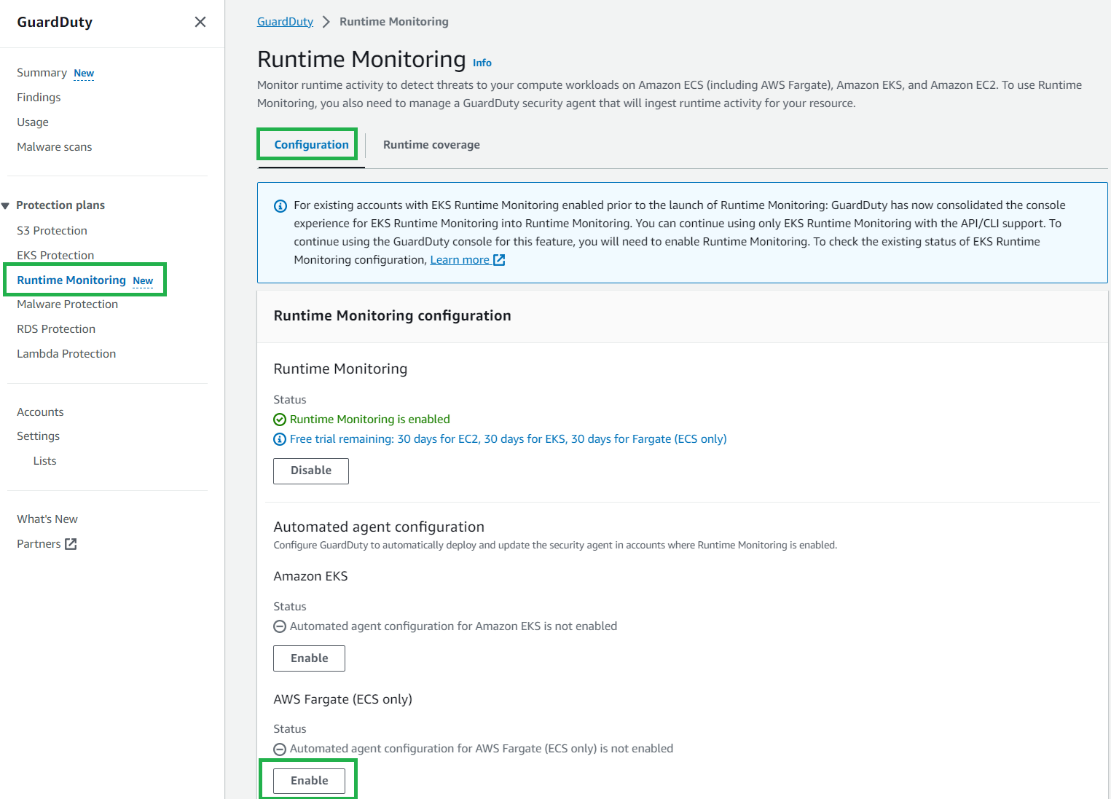
  1. In the GuardDuty console, in the navigation pane under Protection plans, select Runtime Monitoring.
  2. Select the Configuration tab and then in the AWS Fargate (ECS only) section, choose Enable.
     
Figure 5: GuardDuty Runtime Monitoring configuration

Figure 5: GuardDuty Runtime Monitoring configuration

If your AWS account is managed within AWS Organizations and you’re running ECS Fargate clusters in multiple AWS accounts, only the GuardDuty delegated administrator account can enable or disable GuardDuty ECS Runtime Monitoring for the member accounts. GuardDuty is a regional service and must be enabled within each desired Region. If you’re using multiple accounts and want to centrally manage GuardDuty see Managing multiple accounts in Amazon GuardDuty.

You can use the same process to enable GuardDuty ECS Runtime Monitoring and manage the GuardDuty security agent. It’s recommended to enable GuardDuty ECS Runtime Monitoring automatically for member accounts within your organization.

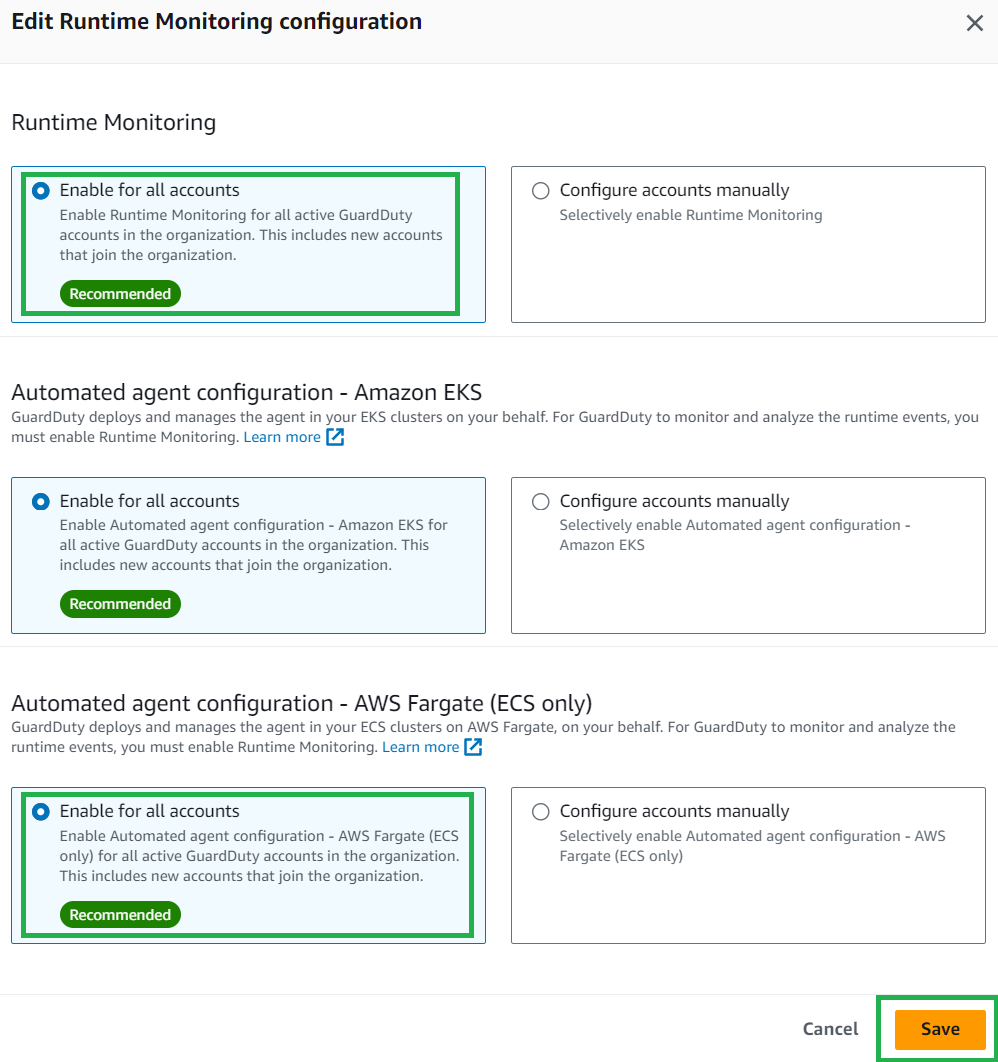
To automatically enable GuardDuty Runtime Monitoring for ECS Fargate new accounts:

  1. In the GuardDuty console, in the navigation pane under Protection plans, select Runtime Monitoring.
  2. Select the Configuration tab, and then choose Edit.
  3. Under Runtime Monitoring, ensure Enable for all accounts is selected.
  4. Under Automated agent configuration – AWS Fargate (ECS only), select Enable for all accounts, then choose Save.
     
Figure 6: Enable ECS GuardDuty Runtime Monitoring for AWS accounts

Figure 6: Enable ECS GuardDuty Runtime Monitoring for AWS accounts

After you enable GuardDuty ECS Runtime Monitoring for Fargate, GuardDuty can start monitoring and analyzing the runtime activity events for ECS tasks in your account. GuardDuty automatically creates a virtual private cloud (VPC) endpoint in your AWS account in the VPCs where you’re deploying your Fargate tasks. The VPC endpoint is used by the GuardDuty agent to send telemetry and configuration data back to the GuardDuty service API. For GuardDuty to receive the runtime events for your ECS Fargate clusters, you can choose one of three approaches to deploy the fully managed security agent:

  • Monitor existing and new ECS Fargate clusters
  • Monitor existing and new ECS Fargate clusters and exclude selective ECS Fargate clusters
  • Monitor selective ECS Fargate clusters

It’s recommended to monitor each ECS Fargate cluster and then exclude clusters on an as-needed basis. To learn more, see Configure GuardDuty ECS Runtime Monitoring.

Monitor all ECS Fargate clusters

Use this method when you want GuardDuty to automatically deploy and manage the security agent across each ECS Fargate cluster within your account. GuardDuty will automatically install the security agent when new ECS Fargate clusters are created.

To enable GuardDuty Runtime Monitoring for ECS Fargate across each ECS cluster:

  1. In the GuardDuty console, in the navigation pane under Protection plans, select Runtime Monitoring.
  2. Select the Configuration tab.
  3. Under the Automated agent configuration for AWS Fargate (ECS only), select Enable.
     
Figure 7: Enable GuardDuty Runtime Monitoring for ECS clusters

Figure 7: Enable GuardDuty Runtime Monitoring for ECS clusters

Monitor all ECS Fargate clusters and exclude selected ECS Fargate clusters

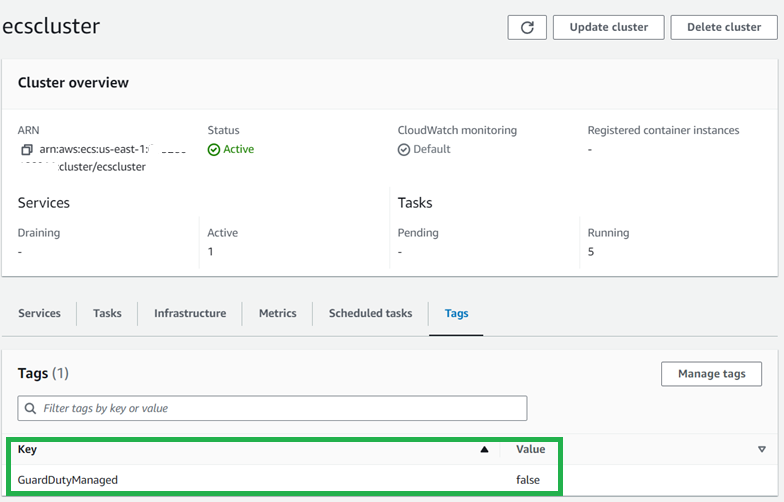
GuardDuty automatically installs the security agent on each ECS Fargate cluster. To exclude an ECS Fargate cluster from GuardDuty Runtime Monitoring, you can use the key-value pair GuardDutyManaged:false as a tag. Add this exclusion tag to your ECS Fargate cluster either before enabling Runtime Monitoring or during cluster creation to prevent automatic GuardDuty monitoring.

To add an exclusion tag to an ECS cluster:

  1. In the Amazon ECS console, in the navigation pane under Clusters, select the cluster name.
  2. Select the Tags tab.
  3. Select Manage Tags and enter the key GuardDutyManaged and value false, then choose Save.
     
Figure 8: GuardDuty Runtime Monitoring ECS cluster exclusion tags

Figure 8: GuardDuty Runtime Monitoring ECS cluster exclusion tags

To make sure that these tags aren’t modified, you can prevent tags from being modified except by authorized principals.

Monitor selected ECS Fargate clusters

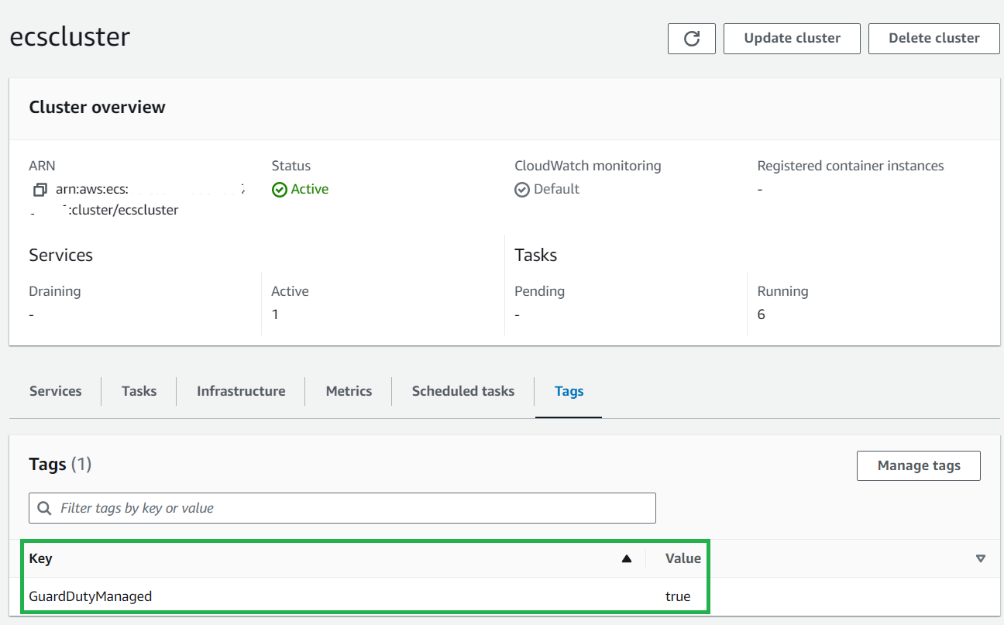
You can monitor selected ECS Fargate clusters when you want GuardDuty to handle the deployment and updates of the security agent exclusively for specific ECS Fargate clusters within your account. This could be a use case where you want to evaluate GuardDuty ECS Runtime Monitoring for Fargate. By using inclusion tags, GuardDuty automatically deploys and manages the security agent only for the ECS Fargate clusters that are tagged with the key-value pair GuardDutyManaged:true. To use inclusion tags, verify that the automated agent configuration for AWS Fargate (ECS) hasn’t been enabled.

To add an inclusion tag to an ECS cluster:

  1. In the Amazon ECS console, in the navigation pane under Clusters, select the cluster name.
  2. Select the Tags tab.
  3. Select Manage Tags and enter the key GuardDutyManaged and value true, then choose Save.
     
Figure 9: GuardDuty inclusion tags

Figure 9: GuardDuty inclusion tags

To make sure that these tags aren’t modified, you can prevent tags from being modified except by authorized principals.

Fargate task level rollout

After you’re enabled GuardDuty ECS Runtime Monitoring for Fargate, newly launched tasks will include the GuardDuty agent sidecar container. For pre-existing long running tasks, you might want to consider a targeted deployment for task refresh to activate the GuardDuty sidecar security container. This can be achieved using either a rolling update (ECS deployment type) or a blue/green deployment with AWS CodeDeploy.

To verify the GuardDuty agent is running for a task, you can check for an additional container prefixed with aws-guardduty-agent-. Successful deployment will change the container’s status to Running.

To view the GuardDuty agent container running as part of your ECS task:

  1. In the Amazon ECS console, in the navigation pane under Clusters, select the cluster name.
  2. Select the Tasks tab.
  3. Select the Task GUID you want to review.
  4. Under the Containers section, you can view the GuardDuty agent container.
     
Figure 10: View status of the GuardDuty sidecar container

Figure 10: View status of the GuardDuty sidecar container

GuardDuty ECS on Fargate coverage monitoring

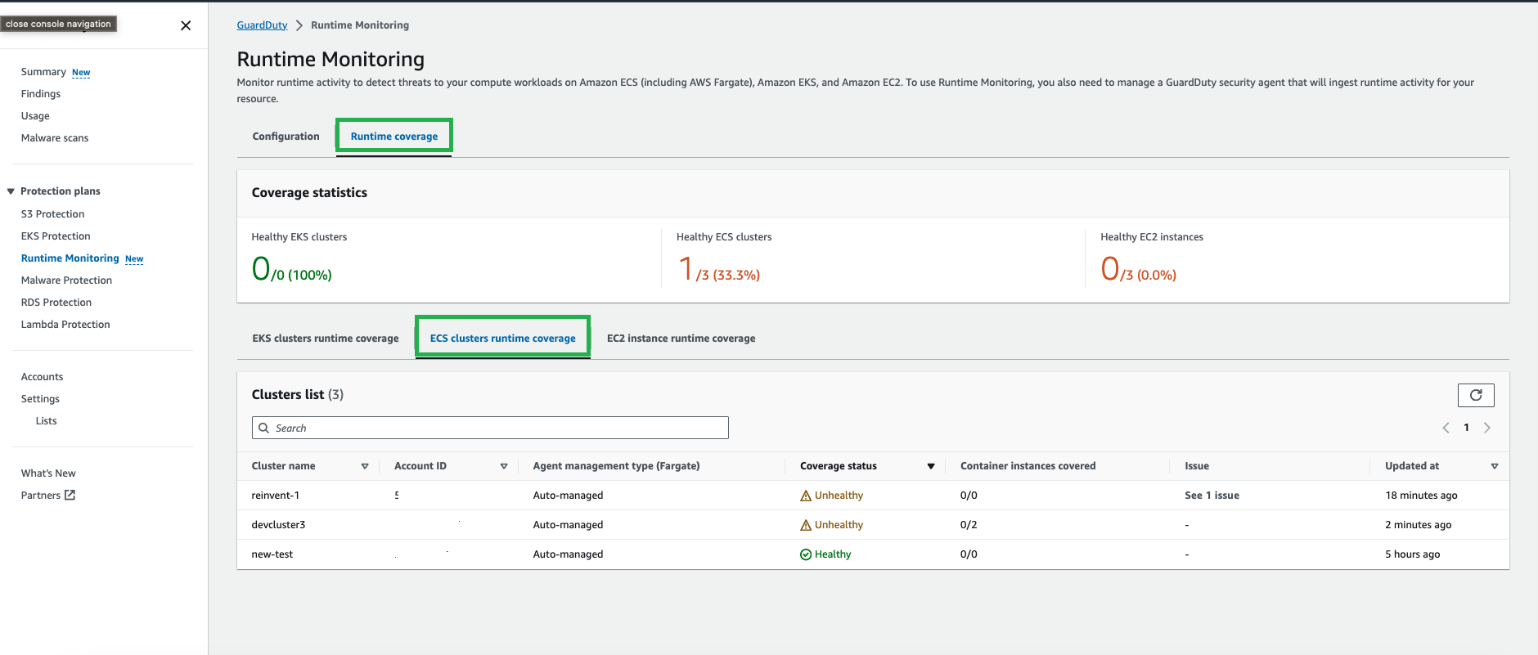
Coverage status of your ECS Fargate clusters is evaluated regularly and can be classified as either healthy or unhealthy. An unhealthy cluster signals a configuration issue, and you can find more details in the GuardDuty Runtime Monitoring notifications section. When you enable GuardDuty ECS Runtime Monitoring and deploy the security agent in your clusters, you can view the coverage status of new ECS Fargate clusters and tasks in the GuardDuty console.

To view coverage status:

  1. In the GuardDuty console, in the navigation pane under Protection plans, select Runtime Monitoring.
  2. Select the Runtime coverage tab, and then select ECS clusters runtime coverage.
     
Figure 11: GuardDuty Runtime ECS coverage status overview

Figure 11: GuardDuty Runtime ECS coverage status overview

Troubleshooting steps for cluster coverage issues such as clusters reporting as unhealthy and a sample notification schema are available at Coverage for Fargate (Amazon ECS only) resource. More information regarding monitoring can be found in the next section.

Amazon GuardDuty Runtime Monitoring for EC2

Amazon EC2 Runtime Monitoring in GuardDuty helps you provide threat detection for Amazon EC2 instances and supports Amazon ECS managed EC2 instances. The GuardDuty security agent, which GuardDuty uses to send telemetry and configuration data back to the GuardDuty service API, is required to be installed onto each EC2 instance.

Prerequisites

If you haven’t activated Amazon GuardDuty, learn more about the free trial and pricing and follow the steps in Getting started with GuardDuty to set up the service and start monitoring your account. Alternatively, you can activate GuardDuty by using the AWS CLI.

To use Amazon EC2 Runtime Monitoring to monitor your ECS container instances, your operating environment must meet the prerequisites for EC2 instance support and the GuardDuty security agent must be installed manually onto the EC2 instances you want to monitor. GuardDuty Runtime Monitoring for EC2 requires you to create the Amazon VPC endpoint manually. If the VPC already has the GuardDuty VPC endpoint created from a previous deployment, you don’t need to create the VPC endpoint again.

If you plan to deploy the agent to Amazon EC2 instances using AWS Systems Manager, an Amazon owned Systems Manager document named AmazonGuardDuty-ConfigureRuntimeMonitoringSsmPlugin is available for use. Alternatively, you can use RPM installation scripts whether or not your Amazon ECS instances are managed by AWS Systems Manager.

Enable GuardDuty Runtime Monitoring for EC2

GuardDuty Runtime Monitoring for EC2 is automatically enabled when you enable GuardDuty Runtime Monitoring.

To enable GuardDuty Runtime Monitoring:

  1. In the GuardDuty console, in the navigation pane under Protection plans, select Runtime Monitoring.
  2. Select the Configuration tab, and then in the Runtime Monitoring section, choose Enable.
     
Figure 12: Enable GuardDuty runtime monitoring

Figure 12: Enable GuardDuty runtime monitoring

After the prerequisites have been met and you enable GuardDuty Runtime Monitoring, GuardDuty starts monitoring and analyzing the runtime activity events for the EC2 instances.

If your AWS account is managed within AWS Organizations and you’re running ECS on EC2 clusters in multiple AWS accounts, only the GuardDuty delegated administrator can enable or disable GuardDuty ECS Runtime Monitoring for the member accounts. If you’re using multiple accounts and want to centrally manage GuardDuty, see Managing multiple accounts in Amazon GuardDuty.

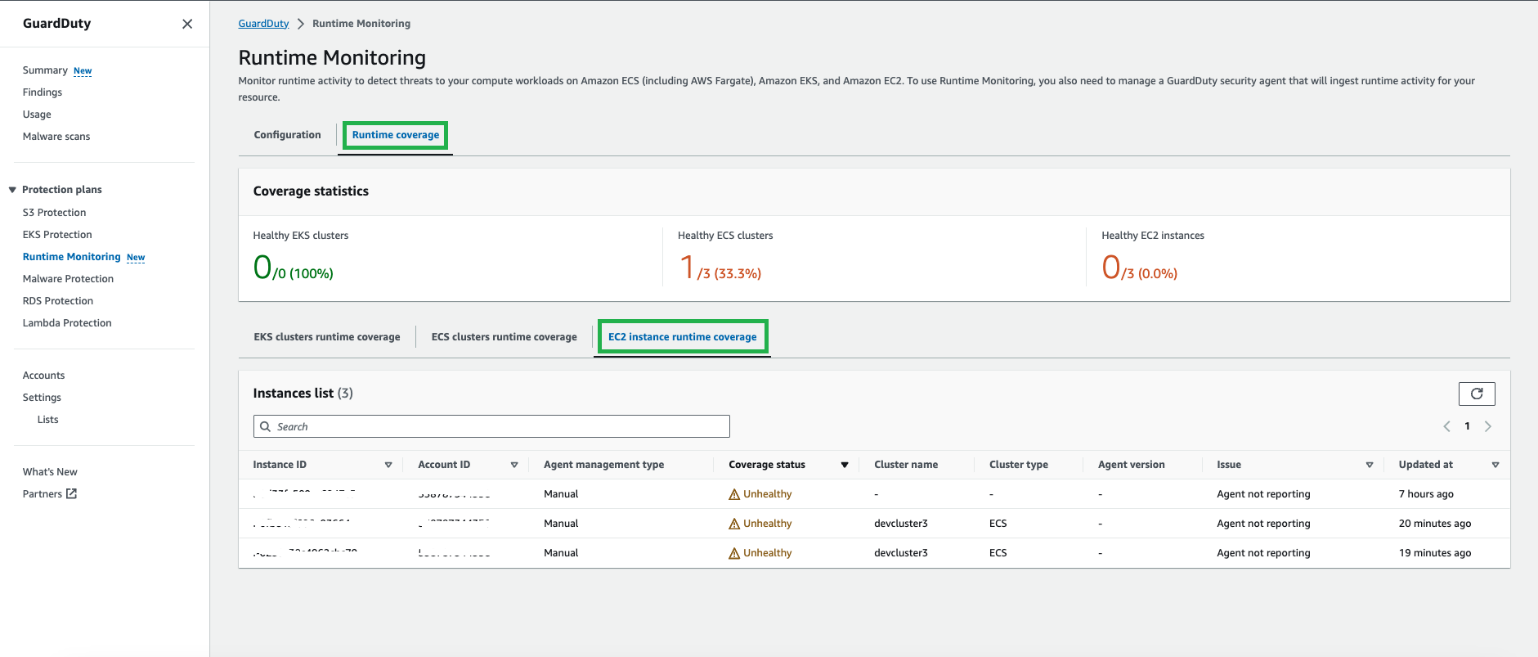
GuardDuty EC2 coverage monitoring

When you enable GuardDuty Runtime Monitoring and deploy the security agent on your Amazon EC2 instances, you can view the coverage status of the instances.

To view EC2 instance coverage status:

  1. In the GuardDuty console, in the navigation pane under Protection plans, select Runtime Monitoring.
  2. Select the Runtime coverage tab, and then select EC2 instance runtime coverage.
     
Figure 13: GuardDuty Runtime Monitoring coverage for EC2 overview

Figure 13: GuardDuty Runtime Monitoring coverage for EC2 overview

Cluster coverage status notifications can be configured using the notification schema available under Configuring coverage status change notifications. More information regarding monitoring can be found in the following section.

GuardDuty Runtime Monitoring notifications

If the coverage status of your ECS cluster or EC2 instance becomes unhealthy, there are a number of recommended troubleshooting steps that you can follow.

To stay informed about changes in the coverage status of an ECS cluster or EC2 instance, it’s recommended that you set up status change notifications. Because GuardDuty publishes these status changes on the EventBridge bus associated with your AWS account, you can do this by setting up an Amazon EventBridge rule to receive notifications.

In the following example AWS CloudFormation template, you can use an EventBridge rule to send notifications to Amazon Simple Notification Service (Amazon SNS) and subscribe to the SNS topic using email.

AWSTemplateFormatVersion: "2010-09-09"
Description: CloudFormation template for Amazon EventBridge rules to monitor Healthy/Unhealthy status of GuardDuty Runtime Monitoring coverage status. This template creates the EventBridge and Amazon SNS topics to be notified via email on state change of security agents
Parameters:
  namePrefix:	
    Description: a simple naming convention for the SNS & EventBridge rules
    Type: String
    Default: GuardDuty-Runtime-Agent-Status
    MinLength: 1
    MaxLength: 50
    AllowedPattern: ^[a-zA-Z0-9\-_]*$
    ConstraintDescription: Maximum 50 characters of numbers, lower/upper case letters, -,_.
  operatorEmail:
    Type: String
    Description: Email address to notify if there are security agent status state changes
    AllowedPattern: "([a-zA-Z0-9_\\-\\.]+)@((\\[[0-9]{1,3}\\.[0-9]{1,3}\\.[0-9]{1,3}\\.)|(([a-zA-Z0-9\\-]+\\.)+))([a-zA-Z]{2,4}|[0-9]{1,3})(\\]?)"
    ConstraintDescription: must be a valid email address.
Resources:
  eventRuleUnhealthy:
    Type: AWS::Events::Rule
    Properties:
      EventBusName: default
      EventPattern:
        source:
          - aws.guardduty
        detail-type:
          - GuardDuty Runtime Protection Unhealthy
      Name: !Join [ '-', [ 'Rule', !Ref namePrefix, 'Unhealthy' ] ]
      State: ENABLED
      Targets:
        - Id: "GDUnhealthyTopic"
          Arn: !Ref notificationTopicUnhealthy
  eventRuleHealthy:
    Type: AWS::Events::Rule
    Properties:
      EventBusName: default
      EventPattern:
        source:
          - aws.guardduty
        detail-type:
          - GuardDuty Runtime Protection Healthy
      Name: !Join [ '-', [ 'Rule', !Ref namePrefix, 'Healthy' ] ]
      State: ENABLED
      Targets:
        - Id: "GDHealthyTopic"
          Arn: !Ref notificationTopicHealthy
  eventTopicPolicy:
    Type: 'AWS::SNS::TopicPolicy'
    Properties:
      PolicyDocument:
        Statement:
          - Effect: Allow
            Principal:
              Service: events.amazonaws.com
            Action: 'sns:Publish'
            Resource: '*'
      Topics:
        - !Ref notificationTopicHealthy
        - !Ref notificationTopicUnhealthy
  notificationTopicHealthy:
    Type: AWS::SNS::Topic
    Properties:
      TopicName: !Join [ '-', [ 'Topic', !Ref namePrefix, 'Healthy' ] ]
      DisplayName: GD-Healthy-State
      Subscription:
      - Endpoint:
          Ref: operatorEmail
        Protocol: email
  notificationTopicUnhealthy:
    Type: AWS::SNS::Topic
    Properties:
      TopicName: !Join [ '-', [ 'Topic', !Ref namePrefix, 'Unhealthy' ] ]
      DisplayName: GD-Unhealthy-State
      Subscription:
      - Endpoint:
          Ref: operatorEmail
        Protocol: email

GuardDuty findings

When GuardDuty detects a potential threat and generates a security finding, you can view the details of the corresponding finding. The GuardDuty agent collects kernel-space and user-space events from the hosts and the containers. See Finding types for detailed information and recommended remediation activities regarding each finding type. You can generate sample GuardDuty Runtime Monitoring findings using the GuardDuty console or you can use this GitHub script to generate some basic detections within GuardDuty.

Example ECS findings

GuardDuty security findings can indicate either a compromised container workload or ECS cluster or a set of compromised credentials in your AWS environment.

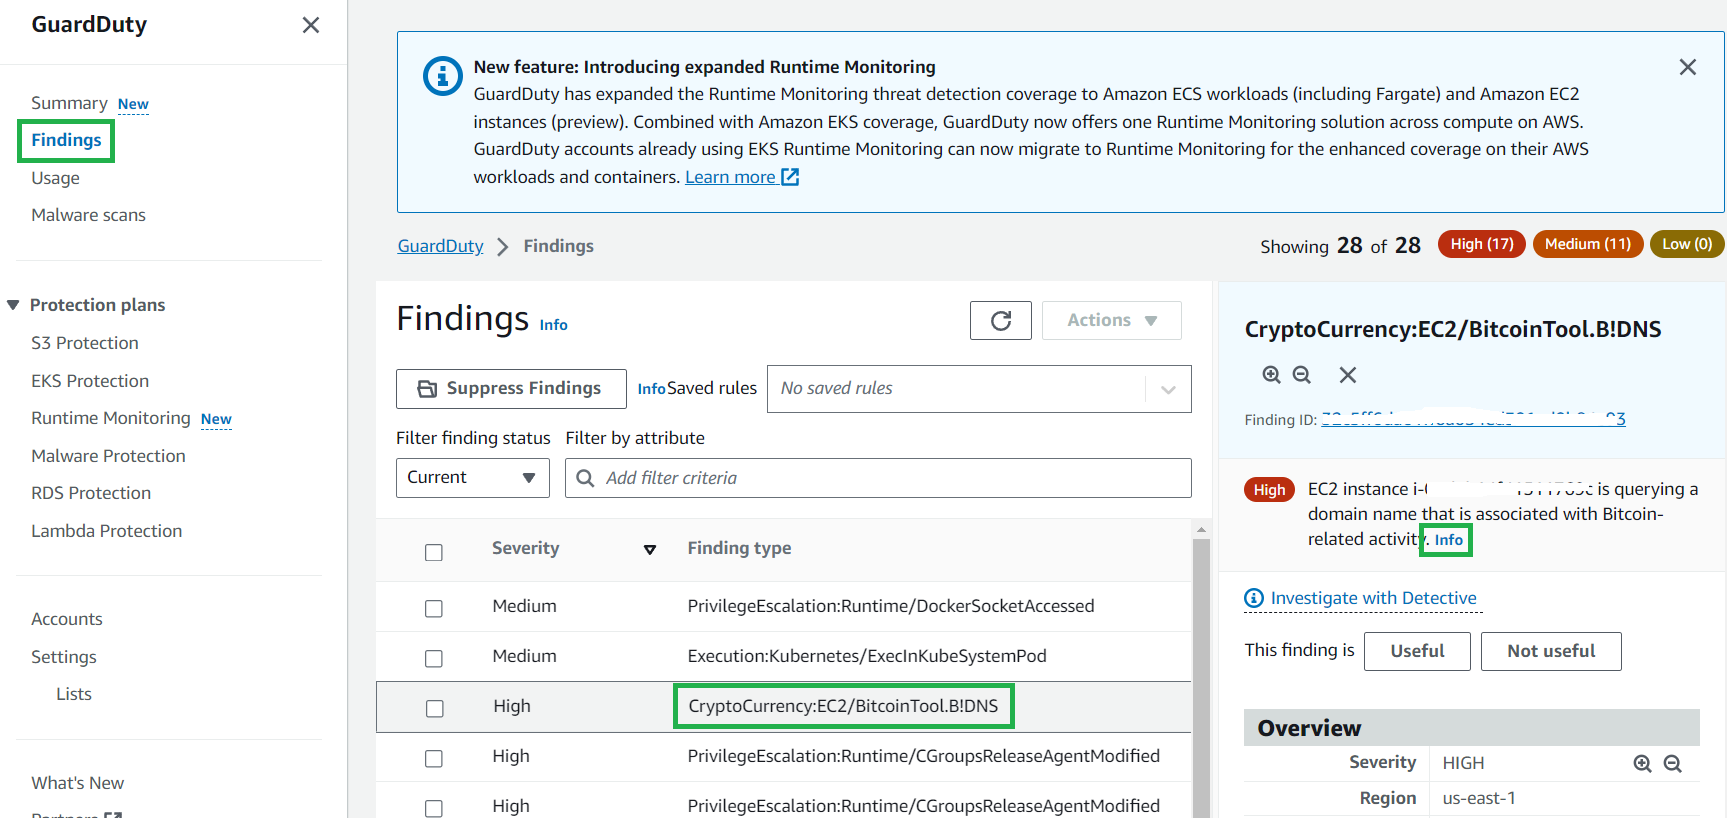
To view a full description and remediation recommendations regarding a finding:

  1. In the GuardDuty console, in the navigation pane, select Findings.
  2. Select a finding in the navigation pane, and then choose the Info hyperlink.
     
Figure 14: GuardDuty example finding

Figure 14: GuardDuty example finding

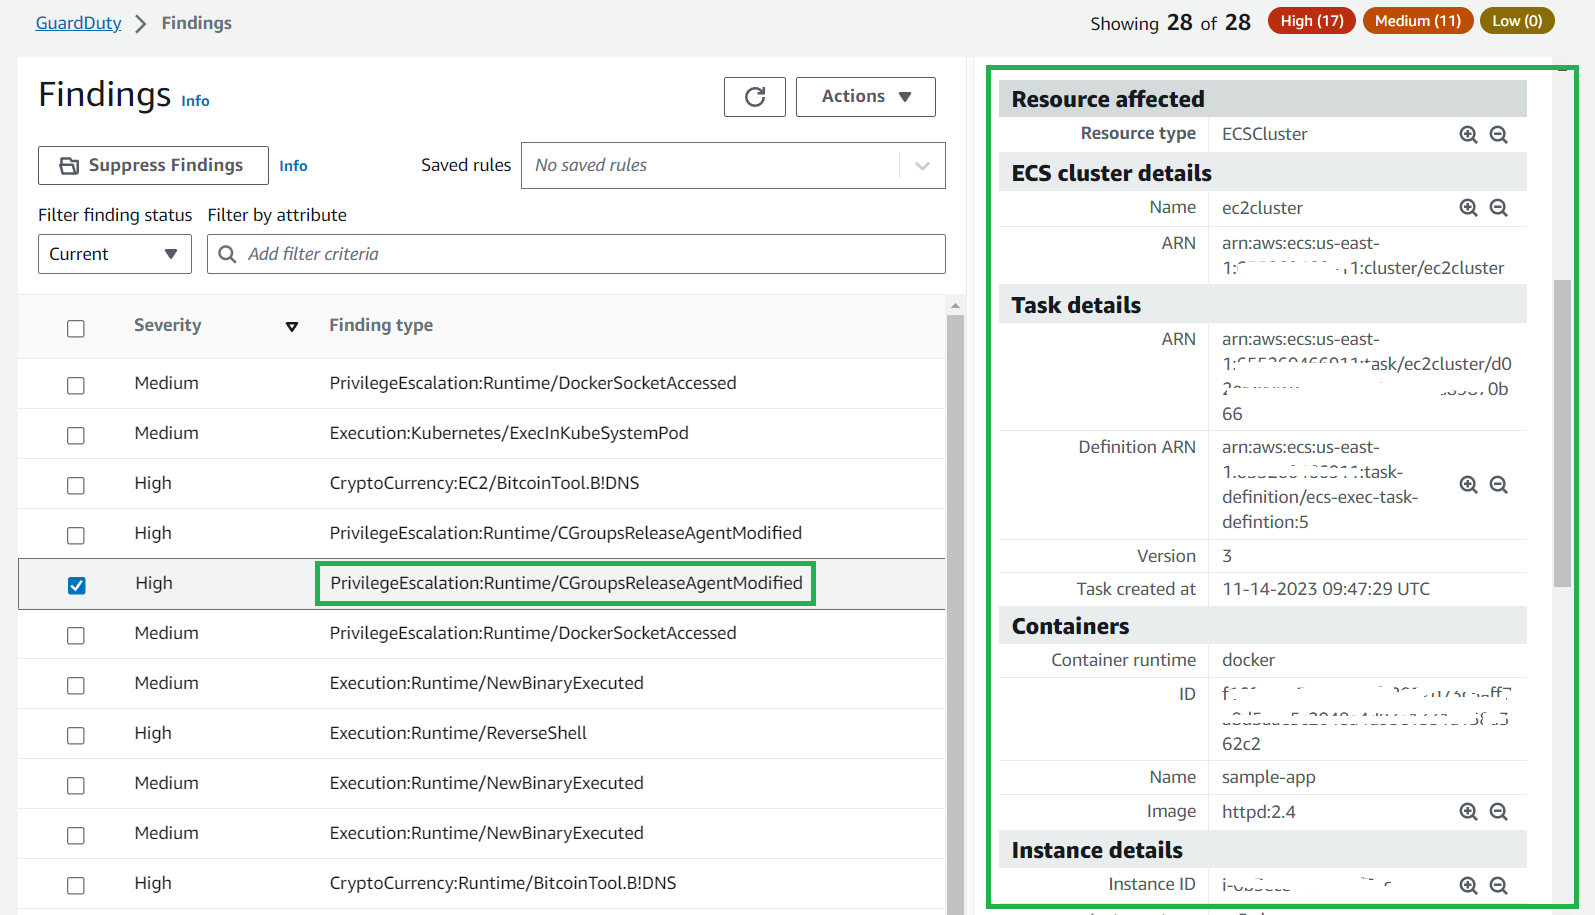
The ResourceType for an ECS Fargate finding could be an ECS cluster or container. If the resource type in the finding details is ECSCluster, it indicates that either a task or a container inside an ECS Fargate cluster is potentially compromised. You can identify the Name and Amazon Resource Name (ARN) of the ECS cluster paired with the task ARN and task Definition ARN details in the cluster.

To view affected resources, ECS cluster details, task details and instance details regarding a finding:

  1. In the GuardDuty console, in the navigation pane, select Findings.
  2. Select a finding related to an ECS cluster in the navigation pane and then scroll down in the right-hand pane to view the different section headings.
     
Figure 15: GuardDuty finding details for Fargate

Figure 15: GuardDuty finding details for Fargate

The Action and Runtime details provide information about the potentially suspicious activity. The example finding in Figure 16 tells you that the listed ECS container in your environment is querying a domain that is associated with Bitcoin or other cryptocurrency-related activity. This can lead to threat actors attempting to take control over the compute resource to repurpose it for unauthorized cryptocurrency mining.

Figure 16: GuardDuty ECS example finding with action and process details

Figure 16: GuardDuty ECS example finding with action and process details

Example ECS on EC2 findings

When a finding is generated from EC2, additional information is shown including the instance details, IAM profile details, and instance tags (as shown in Figure 17), which can be used to help identify the affected EC2 instance.

Figure 17: GuardDuty EC2 instance details for a finding

Figure 17: GuardDuty EC2 instance details for a finding

This additional instance-level information can help you focus your remediation efforts.

GuardDuty finding remediation

When you’re actively monitoring the runtime behavior of containers within your tasks and GuardDuty identifies potential security issues within your AWS environment, you should consider taking the following suggested remediation actions. This helps to address potential security issues and to contain the potential threat in your AWS account.

  1. Identify the potentially impacted Amazon ECS Cluster – The runtime monitoring finding provides the potentially impacted Amazon ECS cluster details in the finding details panel.
  2. Evaluate the source of potential compromise – Evaluate if the detected finding was in the container’s image. If the resource was in the container image, identify all other tasks that are using this image and evaluate the source of the image.
  3. Isolate the impacted tasks – To isolate the affected tasks, restrict both incoming and outgoing traffic to the tasks by implementing VPC network rules that deny all traffic. This approach can be effective in halting an ongoing attack by cutting off all connections to the affected tasks. Be aware that terminating the tasks could eliminate crucial evidence related to the finding that you might need for further analysis.If the task’s container has accessed the underlying Amazon EC2 host, its associated instance credentials might have been compromised. For more information, see Remediating compromised AWS credentials.

Each GuardDuty Runtime Monitoring finding provides specific prescriptive guidance regarding finding remediation. Within each finding, you can choose the Remediating Runtime Monitoring findings link for more information.

To view the recommended remediation actions:

  1. In the GuardDuty console, in the navigation pane, select Findings.
  2. Select a finding in the navigation pane and then choose the Info hyperlink and scroll down in the right-hand pane to view the remediation recommendations section.
     
Figure 18: GuardDuty Runtime Monitoring finding remediation

Figure 18: GuardDuty Runtime Monitoring finding remediation

Summary

You can now use Amazon GuardDuty for ECS Runtime Monitoring to monitor your Fargate and EC2 workloads. For a full list of Regions where ECS Runtime Monitoring is available, see Region-specific feature availability.

It’s recommended that you asses your container application using the AWS Well-Architected Tool to ensure adherence to best practices. The recently launched AWS Well-Architected Amazon ECS Lens offers a specialized assessment for container-based operations and troubleshooting of Amazon ECS applications, aligning with the ECS best practices guide. You can integrate this lens into the AWS Well-Architected Tool available in the console.

For more information regarding security monitoring and threat detection, visit the AWS Online Tech Talks. For hands-on experience and learn more regarding AWS security services, visit our AWS Activation Days website to find a workshop in your Region.

 
If you have feedback about this post, submit comments in the Comments section below. If you have questions about this post, contact AWS Support.

Want more AWS Security news? Follow us on Twitter.

Luke Notley

Luke Notley

Luke is a Senior Solutions Architect with Amazon Web Services and is based in Western Australia. Luke has a passion for helping customers connect business outcomes with technology and assisting customers throughout their cloud journey, helping them design scalable, flexible, and resilient architectures. In his spare time, he enjoys traveling, coaching basketball teams, and DJing.

Arran Peterson

Arran Peterson

Arran, a Solutions Architect based in Adelaide, South Australia, collaborates closely with customers to deeply understand their distinct business needs and goals. His role extends to assisting customers in recognizing both the opportunities and risks linked to their decisions related to cloud solutions.

How smava makes loans transparent and affordable using Amazon Redshift Serverless

Post Syndicated from Alex Naumov original https://aws.amazon.com/blogs/big-data/how-smava-makes-loans-transparent-and-affordable-using-amazon-redshift-serverless/

This is a guest post co-written by Alex Naumov, Principal Data Architect at smava.

smava GmbH is one of the leading financial services companies in Germany, making personal loans transparent, fair, and affordable for consumers. Based on digital processes, smava compares loan offers from more than 20 banks. In this way, borrowers can choose the deals that are most favorable to them in a fast, digitalized, and efficient way.

smava believes in and takes advantage of data-driven decisions in order to become the market leader. The Data Platform team is responsible for supporting data-driven decisions at smava by providing data products across all departments and branches of the company. The departments include teams from engineering to sales and marketing. Branches range by products, namely B2C loans, B2B loans, and formerly also B2C mortgages. The data products used inside the company include insights from user journeys, operational reports, and marketing campaign results, among others. The data platform serves on average 60 thousand queries per day. The data volume is in double-digit TBs with steady growth as business and data sources evolve.

smava’s Data Platform team faced the challenge to deliver data to stakeholders with different SLAs, while maintaining the flexibility to scale up and down while staying cost-efficient. It took up to 3 hours to generate daily reporting, which impacted business decision-making when re-calculations needed to happen during the day. To speed up the self-service analytics and foster innovation based on data, a solution was needed to provide ways to allow any team to create data products on their own in a decentralized manner. To create and manage the data products, smava uses Amazon Redshift, a cloud data warehouse.

In this post, we show how smava optimized their data platform by using Amazon Redshift Serverless and Amazon Redshift data sharing to overcome right-sizing challenges for unpredictable workloads and further improve price-performance. Through the optimizations, smava achieved up to 50% cost savings and up to three times faster report generation compared to the previous analytics infrastructure.

Overview of solution

As a data-driven company, smava relies on the AWS Cloud to power their analytics use cases. To bring their customers the best deals and user experience, smava follows the modern data architecture principles with a data lake as a scalable, durable data store and purpose-built data stores for analytical processing and data consumption.

smava ingests data from various external and internal data sources into a landing stage on the data lake based on Amazon Simple Storage Service (Amazon S3). To ingest the data, smava uses a set of popular third-party customer data platforms complemented by custom scripts.

After the data lands in Amazon S3, smava uses the AWS Glue Data Catalog and crawlers to automatically catalog the available data, capture the metadata, and provide an interface that allows querying all data assets.

Data analysts who require access to the raw assets on the data lake use Amazon Athena, a serverless, interactive analytics service for exploration with ad hoc queries. For the downstream consumption by all departments across the organization, smava’s Data Platform team prepares curated data products following the extract, load, and transform (ELT) pattern. smava uses Amazon Redshift as their cloud data warehouse to transform, store, and analyze data, and uses Amazon Redshift Spectrum to efficiently query and retrieve structured and semi-structured data from the data lake using SQL.

smava follows the data vault modeling methodology with the Raw Vault, Business Vault, and Data Mart stages to prepare the data products for end consumers. The Raw Vault describes objects loaded directly from the data sources and represents a copy of the landing stage in the data lake. The Business Vault is populated with data sourced from the Raw Vault and transformed according to the business rules. Finally, the data is aggregated into specific data products oriented to a specific business line. This is the Data Mart stage. The data products from the Business Vault and Data Mart stages are now available for consumers. smava decided to use Tableau for business intelligence, data visualization, and further analytics. The data transformations are managed with dbt to simplify the workflow governance and team collaboration.

The following diagram shows the high-level data platform architecture before the optimizations.

High-level Data Platform architecture before the optimizations

Evolution of the data platform requirements

smava started with a single Redshift cluster to host all three data stages. They chose provisioned cluster nodes of the RA3 type with Reserved Instances (RIs) for cost optimization. As data volumes grew 53% year over year, so did the complexity and requirements from various analytic workloads.

smava quickly addressed the growing data volumes by right-sizing the cluster and using Amazon Redshift Concurrency Scaling for peak workloads. Furthermore, smava wanted to give all teams the option to create their own data products in a self-service manner to increase the pace of innovation. To avoid any interference with the centrally managed data products, the decentralized product development environments needed to be strictly isolated. The same requirement was also applied for the isolation of different product stages curated by the Data Platform team.

Optimizing the architecture with data sharing and Redshift Serverless

To meet the evolved requirements, smava decided to separate the workload by splitting the single provisioned Redshift cluster into multiple data warehouses, with each warehouse serving a different stage. In addition, smava added new staging environments in the Business Vault to develop new data products without the risk of interfering with existing product pipelines. To avoid any interference with the centrally managed data products of the Data Platform team, smava introduced an additional Redshift cluster, isolating the decentralized workloads.

smava was looking for an out-of-the-box solution to achieve workload isolation without managing a complex data replication pipeline.

Right after the launch of Redshift data sharing capabilities in 2021, the Data Platform team recognized that this was the solution they had been looking for. smava adopted the data sharing feature to have the data from producer clusters available for read access on different consumer clusters, with each of those consumer clusters serving a different stage.

Redshift data sharing enables instant, granular, and fast data access across Redshift clusters without the need to copy data. It provides live access to data so that users always see the most up-to-date and consistent information as it’s updated in the data warehouse. With data sharing, you can securely share live data with Redshift clusters in the same or different AWS accounts and across Regions.

With Redshift data sharing, smava was able to optimize the data architecture by separating the data workloads to individual consumer clusters without having to replicate the data. The following diagram illustrates the high-level data platform architecture after splitting the single Redshift cluster into multiple clusters.

High-level Data Platform architecture after splitting the single Redshift cluster in multiple clusters

By providing a self-service data mart, smava increased data democratization by providing users with access to all aspects of the data. They also provided teams with a set of custom tools for data discovery, ad hoc analysis, prototyping, and operating the full lifecycle of mature data products.

After collecting operational data from the individual clusters, the Data Platform team identified further potential optimizations: the Raw Vault cluster was under steady load 24/7, but the Business Vault clusters were only updated nightly. To optimize for costs, smava used the pause and resume capabilities of Redshift provisioned clusters. These capabilities are useful for clusters that need to be available at specific times. While the cluster is paused, on-demand billing is suspended. Only the cluster’s storage incurs charges.

The pause and resume feature helped smava optimize for cost, but it required additional operational overhead to trigger the cluster operations. Additionally, the development clusters remained subject to idle times during working hours. These challenges were finally solved by adopting Redshift Serverless in 2022. The Data Platform team decided to move the Business Data Vault stage clusters to Redshift Serverless, which allows them to pay for the data warehouse only when in use, reliably and efficiently.

Redshift Serverless is ideal for cases when it’s difficult to predict compute needs such as variable workloads, periodic workloads with idle time, and steady-state workloads with spikes. Additionally, as usage demand evolves with new workloads and more concurrent users, Redshift Serverless automatically provisions the right compute resources, and the data warehouse scales seamlessly and automatically, without the need for manual intervention. Data sharing is supported in both directions between Redshift Serverless and provisioned Redshift clusters with RA3 nodes, so no changes to the smava architecture were needed. The following diagram shows the high-level architecture setup after the move to Redshift Serverless.

High-level Data Platform architecture after introducing Redshift Serverless for Business Vault clusters

smava combined the benefits of Redshift Serverless and dbt through a seamless CI/CD pipeline, adopting a trunk-based development methodology. Changes on the Git repository are automatically deployed to a test stage and validated using automated integration tests. This approach increased the efficiency of developers and decreased the average time to production from days to minutes.

smava adopted an architecture that utilizes both provisioned and serverless Redshift data warehouses, together with the data sharing capability to isolate the workloads. By choosing the right architectural patterns for their needs, smava was able to accomplish the following:

  • Simplify the data pipelines and reduce operational overhead
  • Reduce the feature release time from days to minutes
  • Increase price-performance by reducing idle times and right-sizing the workload
  • Achieve up to three times faster report generation (faster calculations and higher parallelization) at 50% of the original setup costs
  • Increase agility of all departments and support data-driven decision-making by democratizing access to data
  • Increase the speed of innovation by exposing self-service data capabilities for teams across all departments and strengthening the A/B test capabilities to cover the complete customer journey

Now, all departments at smava are using the available data products to make data-driven, accurate, and agile decisions.

Future vision

For the future, smava plans to continue to optimize the Data Platform based on operational metrics. They’re considering switching more provisioned clusters like the Self-Service Data Mart cluster to serverless. Additionally, smava is optimizing the ELT orchestration toolchain to increase the number of parallel data pipelines to be run. This will increase the utilization of provisioned Redshift resources and allow for cost reductions.

With the introduction of the decentralized, self-service for data product creation, smava made a step forward towards a data mesh architecture. In the future, the Data Platform team plans to further evaluate the needs of their service users and establish further data mesh principles like federated data governance.

Conclusion

In this post, we showed how smava optimized their data platform by isolating environments and workloads using Redshift Serverless and data sharing features. Those Redshift environments are well integrated with their infrastructure, flexible in scaling on demand, and highly available, and they require minimum administration efforts. Overall, smava has increased performance by three times while reducing the total platform costs by 50%. Additionally, they reduced operational overhead to a minimum while maintaining the existing SLAs for report generation times. Moreover, smava has strengthened the culture of innovation by providing self-service data product capabilities to speed up their time to market.

If you’re interested in learning more about Amazon Redshift capabilities, we recommend watching the most recent What’s new with Amazon Redshift session in the AWS Events channel to get an overview of the features recently added to the service. You can also explore the self-service, hands-on Amazon Redshift labs to experiment with key Amazon Redshift functionalities in a guided manner.

You can also dive deeper into Redshift Serverless use cases and data sharing use cases. Additionally, check out the data sharing best practices and discover how other customers optimized for cost and performance with Redshift data sharing to get inspired for your own workloads.

If you prefer books, check out Amazon Redshift: The Definitive Guide by O’Reilly, where the authors detail the capabilities of Amazon Redshift and provide you with insights on corresponding patterns and techniques.


About the Authors

Blog author: Alex NaumovAlex Naumov is a Principal Data Architect at smava GmbH, and leads the transformation projects at the Data department. Alex previously worked 10 years as a consultant and data/solution architect in a wide variety of domains, such as telecommunications, banking, energy, and finance, using various tech stacks, and in many different countries. He has a great passion for data and transforming organizations to become data-driven and the best in what they do.

Blog author: Lingli ZhengLingli Zheng works as a Business Development Manager in the AWS worldwide specialist organization, supporting customers in the DACH region to get the best value out of Amazon analytics services. With over 12 years of experience in energy, automation, and the software industry with a focus on data analytics, AI, and ML, she is dedicated to helping customers achieve tangible business results through digital transformation.

Blog author: Alexander SpivakAlexander Spivak is a Senior Startup Solutions Architect at AWS, focusing on B2B ISV customers across EMEA North. Prior to AWS, Alexander worked as a consultant in financial services engagements, including various roles in software development and architecture. He is passionate about data analytics, serverless architectures, and creating efficient organizations.


This post was reviewed for technical accuracy by David Greenshtein, Senior Analytics Solutions Architect.

Sun King uses Amazon Redshift data sharing to accelerate data analytics and improve user experience

Post Syndicated from Aaber Jah original https://aws.amazon.com/blogs/big-data/sun-king-uses-amazon-redshift-data-sharing-to-accelerate-data-analytics-and-improve-user-experience/

This post is co-authored with Guillaume Saint-Martin at Sun King. 

Sun King is the world’s leading off-grid solar energy company, and is on a mission to power access to brighter lives through off-grid solar. Sun King designs, distributes, installs, and finances solar home energy products for people currently living without reliable energy access. It serves over 100 million users in 65 countries across the world.

Over 26,000 agents across Africa today help local families get access to Sun King off-grid products to have more productive lives. These agents are informed in near-real time to find the right geographical areas and families who do not have access to low cost power. Sun King is driven by data for analyzing areas of growth across thousands of miles using a dashboards that are powered by Amazon Redshift.

In this post, we share how Sun King uses Amazon Redshift and Redshift’s features like Data Sharing capabilities to improve the performance of queries in Looker for over 1,000 of our staff.

Amazon Redshift is a fully managed, scalable cloud data warehouse that accelerates your time to insights with fast, easy, and secure analytics at scale. Tens of thousands of customers rely on Amazon Redshift to analyze exabytes of data and run complex analytical queries, making it a widely used cloud data warehouse. You can run and scale analytics in seconds on all your data without having to manage your data warehouse infrastructure.

Use case

Sun King uses a Redshift provisioned cluster to run its extract, transform and load (ETL) and analytics processes to source and transform data from various sources. It then provides access to this data for business users through Looker. Amazon Redshift currently manages varied consumption requirements for Looker users across the globe

Amazon Redshift is used to clean and aggregate data into pre-processed tables, execute Sun King’s ETL pipelines, and process Looker “persistent derived tables” (PDTs) scheduled at an hourly frequency or less. These ETLs pipelines and PDTs were competing workloads and sometimes ran into read/write conflicts.

As data-driven company continues expanding, Sun King needed a solution that does the following:

  • Allows hundreds of queries to run in parallel with desired query throughput.
  • Optimize workload management to enable ETL, business intelligence (BI4) and Looker workloads to run simultaneously without impacting each other.
  • Seamlessly scale capacity with the increase in user base and maintain cost efficiency.

Solution overview

As the data volumes, query counts, and users continue to grow, Sun King decided to move from a single cluster to a multi-cluster architecture with data sharing to take advantage of workload isolation and separate ETL and analytics workloads across different clusters while still using a single copy of the data.

The solution at Sun King is comprised of multiple Redshift provisioned clusters and an Amazon Elastic Compute Cloud (EC2) Network Load Balancer, using the data sharing capability in Amazon Redshift.

Amazon Redshift Data Sharing enables data access across Redshift clusters without having to copy or move data. Therefore, when a workload is moved from one Redshift cluster to another, the workload can continue to access data in the initial Redshift cluster. For more information, refer to Sharing Amazon Redshift data securely across Amazon Redshift clusters for workload isolation.

The solution consists of the following key components:

  • Core ETL cluster: A core ETL producer cluster (8 ra3.xlplus nodes) with data share.
  • Looker cluster: A producer/consumer cluster (8 ra3.4xlarge nodes) with data share to run the following:
    • Large ETL processes
    • Looker initiated ETL processes (PDTs)
    • Data team workloads
  • BI clusters: This consists of four large consumer clusters (6 ra3.4xlarge nodes each):
    • Three clusters using reserved instances (RIs) that are on 24/7
    • One on-demand cluster turned on for six hours every weekday
  • Network Load Balancer: The network load balancer distributes queries originating from Looker between the consumer clusters
  • Concurrency scaling free tier: Each of the three clusters using reserved instances (RIs) produces one hour of concurrency scaling credits per day, which are used on Mondays, while the on-demand cluster produces four hours of concurrency scaling credits keeping the concurrency scaling cost under free tier.

The following diagram shows the solution and workflow steps

Results

Sun King saw the following improvements with this solution:

  • Performance – The improvement in performance was drastic and immediate after implementing the distributed producer/consumer architecture. Most queries (95%) that used to take between 50-90 seconds to complete before now take at most 40 seconds, 75% of queries used to take up to five seconds before now take less than one second. Additionally, the number of queries run (Amazon Redshift Adoption) increased by 40%, driven by a greater utilization of Looker following the architecture change.
  • Workload management – After this architectural change, queries don’t spend a long time queued anymore. The following chart illustrates queued vs running queries on one of the clusters before and after the modernization engagement.
  • Scalability – With this Redshift data share enabled architecture, the Sun King data team was able to bring back an acceptable performance to its users, leading to renewed engagement , measured with the doubling of the number of monthly queries over the following few month, thus increasing adoption of Amazon Redshift across the company.

Sun King costs are estimated to only increase by 35%, by reserving most instances used for three years (26 ra3.4xlarge and 8 ra3.xlplus) and relying on the concurrency scaling free tier for a boost of performance on the day of highest utilization. This is compared to the smaller number of reserved clusters (8 ra3.4xlarge) and a much larger utilization of concurrency scaling (two concurrency scaling clusters, nearly always on). This modernization increased the productivity of the agents by providing them faster and near real time access to areas that need access to low cost power.

Conclusion:

In this post, we discussed how Sun King used Amazon Redshift data sharing capabilities to distribute workload and scale Amazon Redshift to address end-user performance requirements from Looker and keep control over the cost of Amazon Redshift consumption. Try the approaches discussed in this post and let us know your feedback in the comments.


About the authors

Guillaume Saint-Martin leads the Data and Analytics team at Sun King. With 10 years of experience in the data and development sectors, he manages a team of over 30 analysts, data engineers, and data scientists to support Sun King long term modeling and trend analysis.

Aaber Jah is a Senior Analytics Specialist at AWS based in Chicago, Illinois. He focuses on driving and maintaining AWS Data Analytics business value for customers.

Rohit Vashishtha is a Senior Analytics Specialist Solutions Architect at AWS based in Dallas, Texas. He has over 17 years of experience architecting, building, leading, and maintaining big data platforms. Rohit helps customers modernize their analytic workloads using the breadth of AWS services and ensures that customers get the best price/performance with utmost security and data governance.

Modernize your ETL platform with AWS Glue Studio: A case study from BMS

Post Syndicated from Sivaprasad Mahamkali original https://aws.amazon.com/blogs/big-data/modernize-your-etl-platform-with-aws-glue-studio-a-case-study-from-bms/

This post is co-written with Ramesh Daddala, Jitendra Kumar Dash and Pavan Kumar Bijja from Bristol Myers Squibb.

Bristol Myers Squibb (BMS) is a global biopharmaceutical company whose mission is to discover, develop, and deliver innovative medicines that help patients prevail over serious diseases. BMS is consistently innovating, achieving significant clinical and regulatory successes. In collaboration with AWS, BMS identified a business need to migrate and modernize their custom extract, transform, and load (ETL) platform to a native AWS solution to reduce complexities, resources, and investment to upgrade when new Spark, Python, or AWS Glue versions are released. In addition to using native managed AWS services that BMS didn’t need to worry about upgrading, BMS was looking to offer an ETL service to non-technical business users that could visually compose data transformation workflows and seamlessly run them on the AWS Glue Apache Spark-based serverless data integration engine. AWS Glue Studio is a graphical interface that makes it easy to create, run, and monitor ETL jobs in AWS Glue. Offering this service reduced BMS’s operational maintenance and cost, and offered flexibility to business users to perform ETL jobs with ease.

For the past 5 years, BMS has used a custom framework called Enterprise Data Lake Services (EDLS) to create ETL jobs for business users. Although this framework met their ETL objectives, it was difficult to maintain and upgrade. BMS’s EDLS platform hosts over 5,000 jobs and is growing at 15% YoY (year over year). Each time the newer version of Apache Spark (and corresponding AWS Glue version) was released, it required significant operational support and time-consuming manual changes to upgrade existing ETL jobs. Manually upgrading, testing, and deploying over 5,000 jobs every few quarters was time consuming, error prone, costly, and not sustainable. Because another release for the EDLS framework was pending, BMS decided to assess alternate managed solutions to reduce their operational and upgrade challenges.

In this post, we share how BMS will modernize leveraging the success of the proof of concept targeting BMS’s ETL platform using AWS Glue Studio.

Solution overview

This solution addresses BMS’s EDLS requirements to overcome challenges using a custom-built ETL framework that required frequent maintenance and component upgrades (requiring extensive testing cycles), avoid complexity, and reduce the overall cost of the underlying infrastructure derived from the proof of concept. BMS had the following goals:

  • Develop ETL jobs using visual workflows provided by the AWS Glue Studio visual editor. The AWS Glue Studio visual editor is a low-code environment that allows you to compose data transformation workflows, seamlessly run them on the AWS Glue Apache Spark-based serverless data integration engine, and inspect the schema and data results in each step of the job.
  • Migrate over 5,000 existing ETL jobs using native AWS Glue Studio in an automated and scalable manner.

EDLS job steps and metadata

Every EDLS job comprises one or more job steps chained together and run in a predefined order orchestrated by the custom ETL framework. Each job step incorporates the following ETL functions:

  • File ingest – File ingestion enables you to ingest or list files from multiple file sources, like Amazon Simple Storage Service (Amazon S3), SFTP, and more. The metadata holds configurations for the file ingestion step to connect to Amazon S3 or SFTP endpoints and ingest files to target location. It retrieves the specified files and available metadata to show on the UI.
  • Data quality check – The data quality module enables you to perform quality checks on a huge amount of data and generate reports that describe and validate the data quality. The data quality step uses an EDLS ingested source object from Amazon S3 and runs one to many data conformance checks that are configured by the tenant.
  • Data transform join – This is one of the submodules of the data transform module that can perform joins between the datasets using a custom SQL based on the metadata configuration.
  • Database ingest – The database ingestion step is one of the important service components in EDLS, which facilitates you to obtain and import the desired data from the database and export it to a specific file in the location of your choice.
  • Data transform – The data transform module performs various data transformations against the source data using JSON-driven rules. Each data transform capability has its own JSON rule and, based on the specific JSON rule you provide, EDLS performs the data transformation on the files available in the Amazon S3 location.
  • Data persistence – The data persistence module is one of the important service components in EDLS, which enables you to obtain the desired data from the source and persist it to an Amazon Relational Database Service (Amazon RDS) database.

The metadata corresponding to each job step includes ingest sources, transformation rules, data quality checks, and data destinations stored in an RDS instance.

Migration utility

The solution involves building a Python utility that reads EDLS metadata from the RDS database and translating each of the job steps into an equivalent AWS Glue Studio visual editor JSON node representation.

AWS Glue Studio provides two types of transforms:

  • AWS Glue-native transforms – These are available to all users and are managed by AWS Glue.
  • Custom visual transforms – This new functionality allows you to upload custom-built transforms used in AWS Glue Studio. Custom visual transforms expand the managed transforms, enabling you to search and use transforms from the AWS Glue Studio interface.

The following is a high-level diagram depicting the sequence flow of migrating a BMS EDLS job to an AWS Glue Studio visual editor job.

Migrating BMS EDLS jobs to AWS Glue Studio includes the following steps:

  1. The Python utility reads existing metadata from the EDLS metadata database.
  2. For each job step type, based on the job metadata, the Python utility selects either the native AWS Glue transform, if available, or a custom-built visual transform (when the native functionality is missing).
  3. The Python utility parses the dependency information from metadata and builds a JSON object representing a visual workflow represented as a Directed Acyclic Graph (DAG).
  4. The JSON object is sent to the AWS Glue API, creating the AWS Glue ETL job. These jobs are visually represented in the AWS Glue Studio visual editor using a series of sources, transforms (native and custom), and targets.

Sample ETL job generation using AWS Glue Studio

The following flow diagram depicts a sample ETL job that incrementally ingests the source RDBMS data in AWS Glue based on modified timestamps using a custom SQL and merges it into the target data on Amazon S3.

The preceding ETL flow can be represented using the AWS Glue Studio visual editor through a combination of native and custom visual transforms.

Custom visual transform for incremental ingestion

Post POC, BMS and AWS identified there will be a need to leverage custom transforms to execute a subset of jobs leveraging their current EDLS Service where Glue Studio functionality will not be a natural fit. The BMS team’s requirement was to ingest data from various databases without depending on the existence of transaction logs or specific schema, so AWS Database Migration Service (AWS DMS) wasn’t an option for them. AWS Glue Studio provides the native SQL query visual transform, where a custom SQL query can be used to transform the source data. However, in order to query the source database table based on a modified timestamp column to retrieve new and modified records since the last ETL run, the previous timestamp column state needs to be persisted so it can be used in the current ETL run. This needs to be a recurring process and can also be abstracted across various RDBMS sources, including Oracle, MySQL, Microsoft SQL Server, SAP Hana, and more.

AWS Glue provides a job bookmark feature to track the data that has already been processed during a previous ETL run. An AWS Glue job bookmark supports one or more columns as the bookmark keys to determine new and processed data, and it requires that the keys are sequentially increasing or decreasing without gaps. Although this works for many incremental load use cases, the requirement is to ingest data from different sources without depending on any specific schema, so we didn’t use an AWS Glue job bookmark in this use case.

The SQL-based incremental ingestion pull can be developed in a generic way using a custom visual transform using a sample incremental ingestion job from a MySQL database. The incremental data is merged into the target Amazon S3 location in Apache Hudi format using an upsert write operation.

In the following example, we’re using the MySQL data source node to define the connection but the DynamicFrame of the data source itself is not used. The custom transform node (DB incremental ingestion) will act as the source for reading the data incrementally using the custom SQL query and the previously persisted timestamp from the last ingestion.

The transform accepts as input parameters the preconfigured AWS Glue connection name, database type, table name, and custom SQL (parameterized timestamp field).

The following is the sample visual transform Python code:

import boto3
from awsglue import DynamicFrame
from datetime import datetime

region_name = "us-east-1"

dyna_client = boto3.client('dynamodb')
HISTORIC_DATE = datetime(1970,1,1).strftime("%Y-%m-%d %H:%M:%S")
DYNAMODB_TABLE = "edls_run_stats"

def db_incremental(self, transformation_node, con_name, con_type, table_name, sql_query):
    logger = self.glue_ctx.get_logger()

    last_updt_tmst = get_table_last_updt_tmst(logger, DYNAMODB_TABLE, transformation_node)

    logger.info(f"Last updated timestamp from the DynamoDB-> {last_updt_tmst}")

    sql_query = sql_query.format(**{"lastmdfdtmst": last_updt_tmst})

    connection_options_source = {
        "useConnectionProperties": "true",
        "connectionName": con_name,
        "dbtable": table_name,
        "sampleQuery": sql_query
    }

    df = self.glue_ctx.create_dynamic_frame.from_options(connection_type= con_type, connection_options= connection_options_source )
                                         
    return df

DynamicFrame.db_incremental = db_incremental

def get_table_last_updt_tmst(logger, table_name, transformation_node):
    response = dyna_client.get_item(TableName=table_name,
                                    Key={'transformation_node': {'S': transformation_node}}
                                    )
    if 'Item' in response and 'last_updt_tmst' in response['Item']:
        return response['Item']['last_updt_tmst']['S']
    else:
        return HISTORIC_DATE

To merge the source data into the Amazon S3 target, a data lake framework like Apache Hudi or Apache Iceberg can be used, which is natively supported in AWS Glue 3.0 and later.

You can also use Amazon EventBridge to detect the final AWS Glue job state change and update the Amazon DynamoDB table’s last ingested timestamp accordingly.

Build the AWS Glue Studio job using the AWS SDK for Python (Boto3) and AWS Glue API

For the sample ETL flow and the corresponding AWS Glue Studio ETL job we showed earlier, the underlying CodeGenConfigurationNode struct (an AWS Glue job definition pulled using the AWS Command Line Interface (AWS CLI) command aws glue get-job –job-name <jobname>) is represented as a JSON object, shown in the following code:

"CodeGenConfigurationNodes": {<br />"node-1679802581077": {<br />"DynamicTransform": {<br />"Name": "DB Incremental Ingestion",<br />"TransformName": "db_incremental",<br />"Inputs": [<br />"node-1679707801419"<br />],<br />"Parameters": [<br />{<br />"Name": "node_name",<br />"Type": "str",<br />"Value": [<br />"job_123_incr_ingst_table1"<br />],<br />"IsOptional": false<br />},<br />{<br />"Name": "jdbc_url",<br />"Type": "str",<br />"Value": [<br />"jdbc:mysql://database.xxxx.us-west-2.rds.amazonaws.com:3306/db_schema"<br />],<br />"IsOptional": false<br />},<br />{<br />"Name": "db_creds",<br />"Type": "str",<br />"Value": [<br />"creds"<br />],<br />"IsOptional": false<br />},<br />{<br />"Name": "table_name",<br />"Type": "str",<br />"Value": [<br />"tables"<br />],<br />"IsOptional": false<br />}<br />]<br />}<br />}<br />}<br />}

The JSON object (ETL job DAG) represented in the CodeGenConfigurationNode is generated through a series of native and custom transforms with the respective input parameter arrays. This can be accomplished using Python JSON encoders that serialize the class objects to JSON and subsequently create the AWS Glue Studio visual editor job using the Boto3 library and AWS Glue API.

Inputs required to configure the AWS Glue transforms are sourced from the EDLS jobs metadata database. The Python utility reads the metadata information, parses it, and configures the nodes automatically.

The order and sequencing of the nodes is sourced from the EDLS jobs metadata, with one node becoming the input to one or more downstream nodes building the DAG flow.

Benefits of the solution

The migration path will help BMS achieve their core objectives of decomposing their existing custom ETL framework to modular, visually configurable, less complex, and easily manageable pipelines using visual ETL components. The utility aids the migration of the legacy ETL pipelines to native AWS Glue Studio jobs in an automated and scalable manner.

With consistent out-of-the box visual ETL transforms in the AWS Glue Studio interface, BMS will be able to build sophisticated data pipelines without having to write code.

The custom visual transforms will extend AWS Glue Studio capabilities and fulfill some of the BMS ETL requirements where the native transforms are missing that functionality. Custom transforms will help define, reuse, and share business-specific ETL logic among all the teams. The solution increases the consistency between teams and keeps the ETL pipelines up to date by minimizing duplicate effort and code.

With minor modifications, the migration utility can be reused to automate migration of pipelines during future AWS Glue version upgrades.

Conclusion

The successful outcome of this proof of concept has shown that migrating over 5,000 jobs from BMS’s custom application to native AWS services can deliver significant productivity gains and cost savings. By moving to AWS, BMS will be able to reduce the effort required to support AWS Glue, improve DevOps delivery, and save an estimated 58% on AWS Glue spend.

These results are very promising, and BMS is excited to embark on the next phase of the migration. We believe that this project will have a positive impact on BMS’s business and help us achieve our strategic goals.


About the authors

Sivaprasad Mahamkali is a Senior Streaming Data Engineer at AWS Professional Services. Siva leads customer engagements related to real-time streaming solutions, data lakes, analytics using opensource and AWS services. Siva enjoys listening to music and loves to spend time with his family.

Dan Gibbar is a Senior Engagement Manager at AWS Professional Services. Dan leads healthcare and life science engagements collaborating with customers and partners to deliver outcomes. Dan enjoys the outdoors, attempting triathlons, music and spending time with family.

Shrinath Parikh as a Senior Cloud Data Architect with AWS. He works with customers around the globe to assist them with their data analytics, data lake, data lake house, serverless, governance and NoSQL use cases. In Shrinath’s off time, he enjoys traveling, spending time with family and learning/building new tools using cutting edge technologies.

Ramesh Daddala is a Associate Director at BMS. Ramesh leads enterprise data engineering engagements related to enterprise data lake services (EDLs) and collaborating with Data partners to deliver and support enterprise data engineering and ML capabilities. Ramesh enjoys the outdoors, traveling and loves to spend time with family.

Jitendra Kumar Dash is a Senior Cloud Architect at BMS with expertise in hybrid cloud services, Infrastructure Engineering, DevOps, Data Engineering, and Data Analytics solutions. He is passionate about food, sports, and adventure.

Pavan Kumar Bijja is a Senior Data Engineer at BMS. Pavan enables data engineering and analytical services to BMS Commercial domain using enterprise capabilities. Pavan leads enterprise metadata capabilities at BMS. Pavan loves to spend time with his family, playing Badminton and Cricket.

Shovan Kanjilal is a Senior Data Lake Architect working with strategic accounts in AWS Professional Services. Shovan works with customers to design data and machine learning solutions on AWS.

Break data silos and stream your CDC data with Amazon Redshift streaming and Amazon MSK

Post Syndicated from Umesh Chaudhari original https://aws.amazon.com/blogs/big-data/break-data-silos-and-stream-your-cdc-data-with-amazon-redshift-streaming-and-amazon-msk/

Data loses value over time. We hear from our customers that they’d like to analyze the business transactions in real time. Traditionally, customers used batch-based approaches for data movement from operational systems to analytical systems. Batch load can run once or several times a day. A batch-based approach can introduce latency in data movement and reduce the value of data for analytics. Change Data Capture (CDC)-based approach has emerged as alternative to batch-based approaches. A CDC-based approach captures the data changes and makes them available in data warehouses for further analytics in real-time.

CDC tracks changes made in source database, such as inserts, updates, and deletes, and continually updates those changes to target database. When the CDC is high-frequency, the source database is changing rapidly, and the target database (i.e., usually a data warehouse) needs to reflect those changes in near real-time.

With the explosion of data, the number of data systems in organizations has grown. Data silos causes data to live in different sources, which makes it difficult to perform analytics.

To gain deeper and richer insights, you can bring all the changes from different data silos into one place, like data warehouse. This post showcases how to use streaming ingestion to bring data to Amazon Redshift.

Redshift streaming ingestion provides low latency, high-throughput data ingestion, which enables customers to derive insights in seconds instead of minutes. It’s simple to set up, and directly ingests streaming data into your data warehouse from Amazon Kinesis Data Streams and Amazon Managed Streaming for Kafka (Amazon MSK) without the need to stage in Amazon Simple Storage Service (Amazon S3). You can create materialized views using SQL statements. After that, using materialized-view refresh, you can ingest hundreds of megabytes of data per second.

Solution overview

In this post, we create a low-latency data replication between Amazon Aurora MySQL to Amazon Redshift Data Warehouse, using Redshift streaming ingestion from Amazon MSK. Using Amazon MSK, we securely stream data with a fully managed, highly available Apache Kafka service. Apache Kafka is an open-source distributed event streaming platform used by thousands of companies for high-performance data pipelines, streaming analytics, data integration, and mission-critical applications. We store CDC events in Amazon MSK, for a set duration of time, which makes it possible to deliver CDC events to additional destinations such as Amazon S3 data lake.

We deploy Debezium MySQL source Kafka connector on Amazon MSK Connect. Amazon MSK Connect makes it easy to deploy, monitor, and automatically scale connectors that move data between Apache Kafka clusters and external systems such as databases, file systems, and search indices. Amazon MSK Connect is a fully compatible with Apache Kafka Connect, which enables you to lift and shift your Apache Kafka Connect applications with zero code changes.

This solution uses Amazon Aurora MySQL hosting the example database salesdb. Users of the database can perform the row-level INSERT, UPDATE, and DELETE operations to produce the change events in the example salesdb database. Debezium MySQL source Kafka Connector reads these change events and emits them to the Kafka topics in Amazon MSK. Amazon Redshift then read the messages from the Kafka topics from Amazon MSK using Amazon Redshift Streaming feature. Amazon Redshift stores these messages using materialized views and process them as they arrive.

You can see how CDC performs create event by looking at this example here. We are going to use OP field – its mandatory string describes the type of operation that caused the connector to generate the event, in our solution for processing. In this example, c indicates that the operation created a row. Valid values for OP field are:

  • c = create
  • u = update
  • d = delete
  • r = read (applies to only snapshots)

The following diagram illustrates the solution architecture:

This image shows the architecture of the solution. we are reading from Amazon Aurora using the Debezium connector for MySQL. Debezium Connector for MySQL is deployed on Amazon MSK Connect and ingesting the events inside Amazon MSK which are being ingested further to Amazon Redshift MV

The solution workflow consists of the following steps:

  • Amazon Aurora MySQL has a binary log (i.e., binlog) that records all operations(INSERT, UPDATE, DELETE) in the order in which they are committed to the database.
  • Amazon MSK Connect runs the source Kafka Connector called Debezium connector for MySQL, reads the binlog, produces change events for row-level INSERT, UPDATE, and DELETE operations, and emits the change events to Kafka topics in amazon MSK.
  • An Amazon Redshift-provisioned cluster is the stream consumer and can read messages from Kafka topics from Amazon MSK.
  • A materialized view in Amazon Redshift is the landing area for data read from the stream, which is processed as it arrives.
  • When the materialized view is refreshed, Amazon Redshift compute nodes allocate a group of Kafka partition to a compute slice.
  • Each slice consumes data from the allocated partitions until the view reaches parity with last Offset for the Kafka topic.
  • Subsequent materialized view refreshes read data from the last offset of the previous refresh until it reaches parity with the topic data.
  • Inside the Amazon Redshift, we created stored procedure to process CDC records and update target table.

Prerequisites

This post assumes you have a running Amazon MSK Connect stack in your environment with the following components:

  • Aurora MySQL hosting a database. In this post, you use the example database salesdb.
  • The Debezium MySQL connector running on Amazon MSK Connect, which connects Amazon MSK in your Amazon Virtual Private Cloud (Amazon VPC).
  • Amazon MSK cluster

If you don’t have an Amazon MSK Connect stack, then follow the instructions in the MSK Connect lab setup and verify that your source connector replicates data changes to the Amazon MSK topics.

You should provision the Amazon Redshift cluster in same VPC of Amazon MSK cluster. If you haven’t deployed one, then follow the steps here in the AWS Documentation.

We use AWS Identity and Access Management (AWS IAM) authentication for communication between Amazon MSK and Amazon Redshift cluster. Please make sure you have created an AWS IAM role with a trust policy that allows your Amazon Redshift cluster to assume the role. For information about how to configure the trust policy for the AWS IAM role, see Authorizing Amazon Redshift to access other AWS services on your behalf. After it’s created, the role should have the following AWS IAM policy, which provides permission for communication with the Amazon MSK cluster.

{
    "Version": "2012-10-17",
    "Statement": [
        {
            "Sid": "MSKIAMpolicy",
            "Effect": "Allow",
            "Action": [
                "kafka-cluster:ReadData",
                "kafka-cluster:DescribeTopic",
                "kafka-cluster:Connect"
            ],
            "Resource": [
                "arn:aws:kafka:*:0123456789:cluster/xxx/xxx",
                "arn:aws:kafka:*:0123456789:topic/*/*/*"
            ]
        },
        {
            "Sid": "MSKPolicy",
            "Effect": "Allow",
            "Action": [
                "kafka:GetBootstrapBrokers"
            ],
            "Resource": "arn:aws:kafka:*:0123456789:cluster/xxx/xxx"
        }
    ]
}

Please replace the ARN containing xxx from above example policy with your Amazon MSK cluster’s ARN.

  • Also, verify that Amazon Redshift cluster has access to Amazon MSK cluster. In Amazon Redshift Cluster’s security group, add the inbound rule for MSK security group allowing port 9098. To see how to manage redshift cluster security group, refer Managing VPC security groups for a cluster.

image shows, how to add the inbound rule for MSK security group allowing port 9098, In Amazon Redshift Cluster’s security group

  • And, in the Amazon MSK cluster’s security group add the inbound rule allowing port 9098 for leader IP address of your Amazon Redshift Cluster, as shown in the following diagram. You can find the IP address for your Amazon Redshift Cluster’s leader node on properties tab of Amazon Redshift cluster from AWS Management Console.

image shows how to add the inbound rule allowing port 9098 for leader IP address of your Amazon Redshift Cluster,in the Amazon MSK cluster’s security group

Walkthrough

Navigate to the Amazon Redshift service from AWS Management Console, then set up Amazon Redshift streaming ingestion for Amazon MSK by performing the following steps:

  1. Enable_case_sensitive_identifier to true – In case you are using default parameter group for Amazon Redshift Cluster, you won’t be able to set enable_case_sensitive_identifier to true. You can create new parameter group with enable_case_sensitive_identifier to true and attach it to Amazon Redshift cluster. After you modify parameter values, you must reboot any clusters that are associated with the modified parameter group. It may take few minutes for Amazon Redshift cluster to reboot.

This configuration value that determines whether name identifiers of databases, tables, and columns are case sensitive. Once done, please open a new Amazon Redshift Query Editor V2, so that config changes we made are reflected, then follow next steps.

  1. Create an external schema that maps to the streaming data source.
CREATE EXTERNAL SCHEMA MySchema
FROM MSK
IAM_ROLE 'arn:aws:iam::YourRole:role/msk-redshift-streaming'
AUTHENTICATION IAM
CLUSTER_ARN 'arn:aws:kafka:us-east-1:2073196*****:cluster/MSKCluster-msk-connect-lab/849b47a0-65f2-439e-b181-1038ea9d4493-10'; // Replace last part with your cluster ARN, this is just for example.//

Once done, verify if you are seeing below tables created from MSK Topics:

image shows tables created from MSK Topics

  1. Create a materialized view that references the external schema.
CREATE MATERIALIZED VIEW customer_debezium AUTO REFRESH YES AS
SELECT
*,
json_parse(kafka_value) as payload
from
"dev"."myschema"."salesdb.salesdb.CUSTOMER" ; // Replace myshecma with name you have given to your external schema in step 2 //

Now, you can query newly created materialized view customer_debezium using below command.

SELECT * FROM "dev"."public"."customer_debezium" order by refresh_time desc;

Check the materialized view is populated with the CDC records

  1. REFRESH MATERIALIZED VIEW (optional). This step is optional as we have already specified AUTO REFRESH AS YES while creating MV (materialized view).
REFRESH MATERIALIZED VIEW "dev"."public"."customer_debezium";

NOTE: Above the materialized view is auto-refreshed, which means if you don’t see the records immediately, then you have wait for few seconds and rerun the select statement. Amazon Redshift streaming ingestion view also comes with the option of a manual refresh, which allow you to manually refresh the object. You can use the following query that pulls streaming data to Redshift object immediately.

SELECT * FROM "dev"."public"."customer_debezium" order by refresh_time desc;

images shows records from the customer_debezium MV

Process CDC records in Amazon Redshift

In following steps, we create the staging table to hold the CDC data, which is target table that holds the latest snapshot and stored procedure to process CDC records and update in target table.

  1. Create staging table: The staging table is a temporary table that holds all of the data that will be used to make changes to the target table, including both updates and inserts.
CREATE TABLE public.customer_stg (
customer_id character varying(256) ENCODE raw
distkey
,
customer_name character varying(256) ENCODE lzo,
market_segment character varying(256) ENCODE lzo,
ts_ms bigint ENCODE az64,
op character varying(2) ENCODE lzo,
record_rank smallint ENCODE az64,
refresh_time timestamp without time zone ENCODE az64
) DISTSTYLE KEY
SORTKEY
(customer_id); // In this particular example, we have used LZO encoding as LZO encoding works well for CHAR and VARCHAR columns that store very long character strings. You can use BYTEDICT as well if it matches your use case. //
  1. Create target table

We use customer_target table to load the processed CDC events.

CREATE TABLE public.customer_target (
customer_id character varying(256) ENCODE raw
distkey
,
customer_name character varying(256) ENCODE lzo,
market_segment character varying(256) ENCODE lzo,
refresh_time timestamp without time zone ENCODE az64
) DISTSTYLE KEY
SORTKEY
(customer_id);
  1. Create Last_extract_time debezium table and Inserting Dummy value.

We need to store the timestamp of last extracted CDC events. We use of debezium_last_extract table for this purpose. For initial record we insert a dummy value, which enables us to perform a comparison between current and next CDC processing timestamp.

CREATE TABLE public.debezium_last_extract (
process_name character varying(256) ENCODE lzo,
latest_refresh_time timestamp without time zone ENCODE az64
) DISTSTYLE AUTO;

Insert into public.debezium_last_extract VALUES ('customer','1983-01-01 00:00:00');

SELECT * FROM "dev"."public"."debezium_last_extract";
  1. Create stored procedure

This stored procedure processes the CDC records and updates the target table with the latest changes.

CREATE OR REPLACE PROCEDURE public.incremental_sync_customer()

LANGUAGE plpgsql

AS $$

DECLARE

sql VARCHAR(MAX) := '';

max_refresh_time TIMESTAMP;

staged_record_count BIGINT :=0;

BEGIN

-- Get last loaded refresh_time number from target table

sql := 'SELECT MAX(latest_refresh_time) FROM debezium_last_extract where process_name =''customer'';';

EXECUTE sql INTO max_refresh_time;

-- Truncate staging table

EXECUTE 'TRUNCATE customer_stg;';

-- Insert (and transform) latest change record for member with sequence number greater than last loaded sequence number into temp staging table

EXECUTE 'INSERT INTO customer_stg ('||

'select coalesce(payload.after."CUST_ID",payload.before."CUST_ID") ::varchar as customer_id,payload.after."NAME"::varchar as customer_name,payload.after."MKTSEGMENT" ::varchar as market_segment, payload.ts_ms::bigint,payload."op"::varchar, rank() over (partition by coalesce(payload.after."CUST_ID",payload.before."CUST_ID")::varchar order by payload.ts_ms::bigint desc) as record_rank, refresh_time from CUSTOMER_debezium where refresh_time > '''||max_refresh_time||''');';

sql := 'SELECT COUNT(*) FROM customer_stg;';

EXECUTE sql INTO staged_record_count;

RAISE INFO 'Staged member records: %', staged_record_count;

// replace customer_stg with your staging table name //

-- Delete records from target table that also exist in staging table (updated/deleted records)

EXECUTE 'DELETE FROM customer_target using customer_stg WHERE customer_target.customer_id = customer_stg.customer_id';

// replace customer_target with your target table name //

-- Insert all records from staging table into target table

EXECUTE 'INSERT INTO customer_target SELECT customer_id,customer_name, market_segment, refresh_time FROM customer_stg where record_rank =1 and op <> ''d''';

-- Insert max refresh time to control table

EXECUTE 'INSERT INTO debezium_last_extract SELECT ''customer'', max(refresh_time) from customer_target ';

END

$$

images shows stored procedure with name incremental_sync_customer created in above step

Test the solution

Update example salesdb hosted on Amazon Aurora

  1. This will be your Amazon Aurora database and we access it from Amazon Elastic Compute Cloud (Amazon EC2) instance with Name= KafkaClientInstance.
  2. Please replace the Amazon Aurora endpoint with value of your Amazon Aurora endpoint and execute following command and the use salesdb.
mysql -f -u master -h mask-lab-salesdb.xxxx.us-east-1.rds.amazonaws.com --password=S3cretPwd99

image shows the details of the RDS for MySQL
  1. Do an update, insert , and delete in any of the tables created. You can also do update more than once to check the last updated record later in Amazon Redshift.

image shows the insert, updates and delete operations performed on RDS for MySQL

  1. Invoke the stored procedure incremental_sync_customer created in the above steps from Amazon Redshift Query Editor v2. You can manually run proc using following command or schedule it.
call incremental_sync_customer();
  1. Check the target table for latest changes. This step is to check latest values in target table. You’ll see that all the updates and deletes that you did in source table are shown at top as a result order by refresh_time.
SELECT * FROM "dev"."public"."customer_target" order by refresh_time desc;

image shows the records from from customer_target table in descending order

Extending the solution

In this solution, we showed CDC processing for the customer table, and you can use the same approach to extend it to other tables in the example salesdb database or add more databases to MSK Connect configuration property database.include.list.

Our proposed approach can work with any MySQL source supported by Debezium MySQL source Kafka Connector. Similarly, to extend this example to your workloads and use-cases, you need to create the staging and target tables according to the schema of the source table. Then you need to update the coalesce(payload.after."CUST_ID",payload.before."CUST_ID")::varchar as customer_id statements with the column names and types in your source and target tables. Like in example stated in this post, we used LZO encoding as LZO encoding, which works well for CHAR and VARCHAR columns that store very long character strings. You can use BYTEDICT as well if it matches your use case. Another consideration to keep in mind while creating target and staging tables is choosing a distribution style and key based on data in source database. Here we have chosen distribution style as key with Customer_id, which are based on source data and schema update by following the best practices mentioned here.

Cleaning up

  1. Delete all the Amazon Redshift clusters
  2. Delete Amazon MSK Cluster and MSK Connect Cluster
  3. In case you don’t want to delete Amazon Redshift clusters, you can manually drop MV and tables created during this post using below commands:
drop MATERIALIZED VIEW customer_debezium;
drop TABLE public.customer_stg;
drop TABLE public.customer_target;
drop TABLE public.debezium_last_extract;

Also, please remove inbound security rules added to your Amazon Redshift and Amazon MSK Clusters, along with AWS IAM roles created in the Prerequisites section.

Conclusion

In this post, we showed you how Amazon Redshift streaming ingestion provided high-throughput, low-latency ingestion of streaming data from Amazon Kinesis Data Streams and Amazon MSK into an Amazon Redshift materialized view. We increased speed and reduced cost of streaming data into Amazon Redshift by eliminating the need to use any intermediary services.

Furthermore, we also showed how CDC data can be processed rapidly after generation, using a simple SQL interface that enables customers to perform near real-time analytics on variety of data sources (e.g., Internet-of-Things [ IoT] devices, system telemetry data, or clickstream data) from a busy website or application.

As you explore the options to simplify and enable near real-time analytics for your CDC data,

We hope this post provides you with valuable guidance. We welcome any thoughts or questions in the comments section.


About the Authors

Umesh Chaudhari is a Streaming Solutions Architect at AWS. He works with AWS customers to design and build real time data processing systems. He has 13 years of working experience in software engineering including architecting, designing, and developing data analytics systems.

Vishal Khatri is a Sr. Technical Account Manager and Analytics specialist at AWS. Vishal works with State and Local Government helping educate and share best practices with customers by leading and owning the development and delivery of technical content while designing end-to-end customer solutions.
Blue/Green Deployments with Amazon ECS using Amazon CodeCatalyst

Post Syndicated from Hareesh Iyer original https://aws.amazon.com/blogs/devops/blue-green-deployments-with-amazon-ecs-using-amazon-codecatalyst/

Amazon CodeCatalyst is a modern software development service that empowers teams to deliver software on AWS easily and quickly. Amazon CodeCatalyst provides one place where you can plan, code, and build, test, and deploy your container applications with continuous integration/continuous delivery (CI/CD) tools.

In this post, we will walk-through how you can configure Blue/Green and canary deployments for your container workloads within Amazon CodeCatalyst.

Pre-requisites 

To follow along with the instructions, you’ll need:

  • An AWS account. If you don’t have one, you can create a new AWS account.
  • An Amazon Elastic Container Service (Amazon ECS) service using the Blue/Green deployment type. If you don’t have one, follow the Amazon ECS tutorial and complete steps 1-5.
  • An Amazon Elastic Container Registry (Amazon ECR) repository named codecatalyst-ecs-image-repo. Follow the Amazon ECR user guide to create one.
  • An Amazon CodeCatalyst space, with an empty Amazon CodeCatalyst project named codecatalyst-ecs-project and an Amazon CodeCatalyst environment called codecatalyst-ecs-environment. Follow the Amazon CodeCatalyst tutorial to set these up.
  • Follow the Amazon CodeCatalyst user guide to associate your account to the environment.

Walkthrough 

Now that you have setup an Amazon ECS cluster and configured Amazon CodeCatalyst to perform deployments, you can configure Blue/Green deployment for your workload. Here are the high-level steps:

  • Collect details of the Amazon ECS environment that you created in the prerequisites step.
  • Add source files for the containerized application to Amazon CodeCatalyst.
  • Create Amazon CodeCatalyst Workflow.
  • Validate the setup.

Step 1: Collect details from your ECS service and Amazon CodeCatalyst role

In this step, you will collect information from your prerequisites that will be used in the Blue/Green Amazon CodeCatalyst configuration further down this post.

If you followed the prerequisites tutorial, below are AWS CLI commands to extract values that are used in this post. You can run this on your local workstation or with AWS CloudShell in the same region you created your Amazon ECS cluster.

ECSCLUSTER='tutorial-bluegreen-cluster'
ECSSERVICE='service-bluegreen'

ECSCLUSTERARN=$(aws ecs describe-clusters --clusters $ECSCLUSTER --query 'clusters[*].clusterArn' --output text)
ECSSERVICENAME=$(aws ecs describe-services --services $ECSSERVICE --cluster $ECSCLUSTER  --query 'services[*].serviceName' --output text)
TASKDEFARN=$(aws ecs describe-services --services $ECSSERVICE --cluster $ECSCLUSTER  --query 'services[*].taskDefinition' --output text)
TASKROLE=$(aws ecs describe-task-definition --task-definition tutorial-task-def --query 'taskDefinition.executionRoleArn' --output text)
ACCOUNT=$(aws sts get-caller-identity --query "Account" --output text)

echo Account_ID value: $ACCOUNT
echo EcsRegionName value: $AWS_DEFAULT_REGION
echo EcsClusterArn value: $ECSCLUSTERARN
echo EcsServiceName value: $ECSSERVICENAME
echo TaskDefinitionArn value: $TASKDEFARN
echo TaskExecutionRoleArn value: $TASKROLE

Note down the values of Account_ID, EcsRegionName, EcsClusterArn, EcsServiceName, TaskDefinitionArn and TaskExecutionRoleArn. You will need these values in later steps.

Step 2: Add Amazon IAM roles to Amazon CodeCatalyst

In this step, you will create a role called CodeCatalystWorkflowDevelopmentRole-spacename to provide Amazon CodeCatalyst service permissions to build and deploy applications. This role is only recommended for use with development accounts and uses the AdministratorAccess AWS managed policy, giving it full access to create new policies and resources in this AWS account.

  • In Amazon CodeCatalyst, navigate to your space. Choose the Settings tab.
  • In the Navigation page, select AWS accounts. A list of account connections appears. Choose the account connection that represents the AWS account where you created your build and deploy roles.
  • Choose Manage roles from AWS management console.
  • The Add IAM role to Amazon CodeCatalyst space page appears. You might need to sign in to access the page.
  • Choose Create CodeCatalyst development administrator role in IAM. This option creates a service role that contains the permissions policy and trust policy for the development role.
  • Note down the role name. Choose Create development role.

Step 3: Create Amazon CodeCatalyst source repository

In this step, you will create a source repository in CodeCatalyst. This repository stores the tutorial’s source files, such as the task definition file.

  • In Amazon CodeCatalyst, navigate to your project.
  • In the navigation pane, choose Code, and then choose Source repositories.
  • Choose Add repository, and then choose Create repository.
  •  In Repository name, enter:

codecatalyst-advanced-deployment

  • Choose Create.

Step 4: Create Amazon CodeCatalyst Dev Environment

In this step, you will create a Amazon CodeCatalyst Dev environment to work on the sample application code and configuration in the codecatalyst-advanced-deployment repository. Learn more about Amazon CodeCatalyst dev environments in Amazon CodeCatalyst user guide.

  • In Amazon CodeCatalyst, navigate to your project.
  • In the navigation pane, choose Code, and then choose Source repositories.
  • Choose the source repository for which you want to create a dev environment.
  • Choose Create Dev Environment.
  • Choose AWS Cloud9 from the drop-down menu.
  • In Create Dev Environment and open with AWS Cloud9 page (Figure 1), choose Create to create a Cloud9 development environment.

Create Dev Environment in Amazon CodeCatalyst

Figure 1: Create Dev Environment in Amazon CodeCatalyst

AWS Cloud9 IDE opens on a new browser tab. Stay in AWS Cloud9 window to continue with Step 5.

Step 5: Add Source files to Amazon CodeCatalyst source repository

In this step, you will add source files from a sample application from GitHub to Amazon CodeCatalyst repository. You will be using this application to configure and test blue-green deployments.

  • On the menu bar at the top of the AWS Cloud9 IDE, choose Window, New Terminal or use an existing terminal window.
  • Download the Github project as a zip file, un-compress it and move it to your project folder by running the below commands in the terminal.

cd codecatalyst-advanced-deployment
wget -O SampleApp.zip https://github.com/build-on-aws/automate-web-app-amazon-ecs-cdk-codecatalyst/zipball/main/
unzip SampleApp.zip
mv build-on-aws-automate-web-app-amazon-ecs-cdk-codecatalyst-*/SampleApp/* .
rm -rf build-on-aws-automate-web-app-amazon-ecs-cdk-codecatalyst-*
rm SampleApp.zip

  • Update the task definition file for the sample application. Open task.json in the current directory. Find and replace “<arn:aws:iam::<account_ID>:role/AppRole> with the value collected from step 1: <TaskExecutionRoleArn>.
  • Amazon CodeCatalyst works with AWS CodeDeploy to perform Blue/Green deployments on Amazon ECS. You will create an Application Specification file, which will be used by CodeDeploy to manage the deployment. Create a file named appspec.yaml inside the codecatalyst-advanced-deployment directory. Update the <TaskDefinitionArn> with value from Step 1.
version: 0.0
Resources:
  - TargetService:
      Type: AWS::ECS::Service
      Properties:
        TaskDefinition: "<TaskDefinitionArn>"
        LoadBalancerInfo:
          ContainerName: "MyContainer"
          ContainerPort: 80
        PlatformVersion: "LATEST"
  • Commit the changes to Amazon CodeCatalyst repository by following the below commands. Update <your_email> and <your_name> with your email and name.

git config user.email "<your_email>"
git config user.name "<your_name>"
git add .
git commit -m "Initial commit"
git push

Step 6: Create Amazon CodeCatalyst Workflow

In this step, you will create the Amazon CodeCatalyst workflow which will automatically build your source code when changes are made. A workflow is an automated procedure that describes how to build, test, and deploy your code as part of a continuous integration and continuous delivery (CI/CD) system. A workflow defines a series of steps, or actions, to take during a workflow run.

  • In the navigation pane, choose CI/CD, and then choose Workflows.
  • Choose Create workflow. Select codecatalyst-advanced-deployment from the Source repository dropdown.
  • Choose main in the branch. Select Create (Figure 2). The workflow definition file appears in the Amazon CodeCatalyst console’s YAML editor.
    Create workflow page in Amazon CodeCatalyst

    Figure 2: Create workflow page in Amazon CodeCatalyst

  • Update the workflow by replacing the contents in the YAML editor with the below. Replace <Account_ID> with your AWS account ID. Replace <EcsRegionName>, <EcsClusterArn>, <EcsServiceName> with values from Step 1. Replace <CodeCatalyst-Dev-Admin-Role> with the Role Name from Step 3.
Name: BuildAndDeployToECS
SchemaVersion: "1.0"

# Set automatic triggers on code push.
Triggers:
  - Type: Push
    Branches:
      - main

Actions:
  Build_application:
    Identifier: aws/build@v1
    Inputs:
      Sources:
        - WorkflowSource
      Variables:
        - Name: region
          Value: <EcsRegionName>
        - Name: registry
          Value: <Account_ID>.dkr.ecr.<EcsRegionName>.amazonaws.com
        - Name: image
          Value: codecatalyst-ecs-image-repo
    Outputs:
      AutoDiscoverReports:
        Enabled: false
      Variables:
        - IMAGE
    Compute:
      Type: EC2
    Environment:
      Connections:
        - Role: <CodeCatalystPreviewDevelopmentAdministrator role>
          Name: "<Account_ID>"
      Name: codecatalyst-ecs-environment
    Configuration:
      Steps:
        - Run: export account=`aws sts get-caller-identity --output text | awk '{ print $1 }'`
        - Run: aws ecr get-login-password --region ${region} | docker login --username AWS --password-stdin ${registry}
        - Run: docker build -t appimage .
        - Run: docker tag appimage ${registry}/${image}:${WorkflowSource.CommitId}
        - Run: docker push --all-tags ${registry}/${image}
        - Run: export IMAGE=${registry}/${image}:${WorkflowSource.CommitId}
  RenderAmazonECStaskdefinition:
    Identifier: aws/ecs-render-task-definition@v1
    Configuration:
      image: ${Build_application.IMAGE}
      container-name: MyContainer
      task-definition: task.json
    Outputs:
      Artifacts:
        - Name: TaskDefinition
          Files:
            - task-definition*
    DependsOn:
      - Build_application
    Inputs:
      Sources:
        - WorkflowSource
  DeploytoAmazonECS:
    Identifier: aws/ecs-deploy@v1
    Configuration:
      task-definition: /artifacts/DeploytoAmazonECS/TaskDefinition/${RenderAmazonECStaskdefinition.task-definition}
      service: <EcsServiceName>
      cluster: <EcsClusterArn>
      region: <EcsRegionName>
      codedeploy-appspec: appspec.yaml
      codedeploy-application: tutorial-bluegreen-app
      codedeploy-deployment-group: tutorial-bluegreen-dg
      codedeploy-deployment-description: "Blue-green deployment for sample app"
    Compute:
      Type: EC2
      Fleet: Linux.x86-64.Large
    Environment:
      Connections:
        - Role: <CodeCatalyst-Dev-Admin-Role>
        # Add account id within quotes. Eg: "12345678"
          Name: "<Account_ID>"
      Name: codecatalyst-ecs-environment
    DependsOn:
      - RenderAmazonECStaskdefinition
    Inputs:
      Artifacts:
        - TaskDefinition
      Sources:
        - WorkflowSource

The workflow above does the following:

  • Whenever a code change is pushed to the repository, a Build action is triggered. The Build action builds a container image and pushes the image to the Amazon ECR repository created in Step 1.
  • Once the Build stage is complete, the Amazon ECS task definition is updated with the new ECR repository image.
  • The DeploytoECS action then deploys the new image to Amazon ECS using Blue/Green Approach.

To confirm everything was configured correctly, choose the Validate button. It should add a green banner with The workflow definition is valid at the top.

Select Commit to add the workflow to the repository (Figure 3)

Commit Workflow page in Amazon CodeCatalyst
Figure 3: Commit workflow page in Amazon CodeCatalyst

The workflow file is stored in a ~/.codecatalyst/workflows/ folder in the root of your source repository. The file can have a .yml or .yaml extension.

Let’s review our work, using the load balancer’s URL that you created during prerequisites, paste it into your browser. Your page should look similar to (Figure 4).

Sample Application (Blue Version)
Figure 4: Sample Application (Blue version)

Step 7: Validate the setup

To validate the setup, you will make a small change to the sample application.

  • Open Amazon CodeCatalyst dev environment that you created in Step 4.
  • Update your local copy of the repository. In the terminal run the command below.

git pull

  • In the terminal, navigate to /templates folder. Open index.html and search for “Las Vegas”. Replace the word with “New York”. Save the file.
  • Commit the change to the repository using the commands below.

git add .
git commit -m "Updating the city to New York"
git push

After the change is committed, the workflow should start running automatically. You can monitor of the workflow run in Amazon CodeCatalyst console (Figure 5)
Blue/Green Deployment Progress on Amazon CodeCatalyst

Figure 5: Blue/Green Deployment Progress on Amazon CodeCatalyst

You can also see the deployment status on the AWS CodeDeploy deployment page (Figure 6)

  • Going back to the AWS console.
  • In the upper left search bar, type in “CodeDeploy”.
  • In the left hand menu, select Deployments.

Blue/Green Deployment Progress on AWS CodeDeploy
Figure 6: Blue/Green Deployment Progress on AWS CodeDeploy

Let’s review our update, using the load balancer’s URL that you created during pre-requisites, paste it into your browser. Your page should look similar to (Figure 7).
Sample Application (Green version)

Figure 7: Sample Application (Green version)

Cleanup

If you have been following along with this workflow, you should delete the resources you deployed so you do not continue to incur charges.

  • Delete the Amazon ECS service and Amazon ECS cluster from AWS console.
  • Manually delete Amazon CodeCatalyst dev environment, source repository and project from your CodeCatalyst Space.
  • Delete the AWS CodeDeploy application through console or CLI.

Conclusion

In this post, we demonstrated how you can configure Blue/Green deployments for your container workloads using Amazon CodeCatalyst workflows. The same approach can be used to configure Canary deployments as well. Learn more about AWS CodeDeploy configuration for advanced container deployments in AWS CodeDeploy user guide.

William Cardoso

William Cardoso is a Solutions Architect at Amazon Web Services based in South Florida area. He has 20+ years of experience in designing and developing enterprise systems. He leverages his real world experience in IT operations to work with AWS customers providing architectural and best practice recommendations for new and existing solutions. Outside of work, William enjoys woodworking, walking and cooking for friends and family.

Piyush Mattoo

Piyush Mattoo is a Solution Architect for enterprises at Amazon Web Services. He is a software technology leader with over 15 years of experience building scalable and distributed software systems that require a combination of broad T-shaped skills across multiple technologies. He has an educational background in Computer Science with a Masters degree in Computer and Information Science from University of Massachusetts. He is based out of Southern California and current interests include outdoor camping and nature walks.

Hareesh Iyer

Hareesh Iyer is a Senior Solutions Architect at AWS. He helps customers build scalable, secure, resilient and cost-efficient architectures on AWS. He is passionate about cloud-native patterns, containers and microservices.

How FanDuel adopted a modern Amazon Redshift architecture to serve critical business workloads

Post Syndicated from Sreenivasa Munagala original https://aws.amazon.com/blogs/big-data/how-fanduel-adopted-a-modern-amazon-redshift-architecture-to-serve-critical-business-workloads/

This post is co-written with Sreenivasa Mungala and Matt Grimm from FanDuel.

In this post, we share how FanDuel moved from a DC2 nodes architecture to a modern Amazon Redshift architecture, which includes Redshift provisioned clusters using RA3 instances, Amazon Redshift data sharing, and Amazon Redshift Serverless.

About FanDuel

Part of Flutter Entertainment, FanDuel Group is a gaming company that offers sportsbooks, daily fantasy sports, horse racing, and online casinos. The company operates sportsbooks in a number of US and Canadian states. Fanduel first carved out a niche in the US through daily fantasy sports, such as their most popular fantasy sport: NFL football.

As FanDuel’s business footprint grew, so too did the complexity of their analytical needs. More and more of FanDuel’s community of analysts and business users looked for comprehensive data solutions that centralized the data across the various arms of their business. Their individual, product-specific, and often on-premises data warehouses soon became obsolete. FanDuel’s data team solved the problem of creating a new massive data store for centralizing the data in one place, with one version of the truth. At the heart of this new Global Data Platform was Amazon Redshift, which fast became the trusted data store from which all analysis was derived. Users could now assess risk, profitability, and cross-sell opportunities not only for piecemeal divisions or products, but also globally for the business as a whole.

FanDuel’s journey on Amazon Redshift

FanDuel’s first Redshift cluster was launched using Dense Compute (DC2) nodes. This was chosen over Dense Storage (DS2) nodes in order to take advantage of the greater compute power for the complex queries in their organization. As FanDuel grew, so did their data workloads. This meant that there was a constant challenge to scale and overcome contention while providing the performance their user community needed for day-to-day decision-making. FanDuel met this challenge initially by continuously adding nodes and experimenting with workload management (WLM), but it became abundantly obvious that they needed to take a more significant step to meet the needs of their users.

In 2021, FanDuel’s workloads almost tripled since they first started using Amazon Redshift in 2018, and they started evaluating Redshift RA3 nodes vs. DC2 nodes to take advantage of the storage and compute separation and deliver better performance at lower costs. FanDuel wanted to make the move primarily to separate storage and compute, and evaluate data sharing in the hopes of bringing different compute to the data to alleviate user contention on their primary cluster. FanDuel decided to launch a new RA3 cluster when they were satisfied that the performance matched that of their existing DC2 architecture, providing them the ability to scale storage and compute independently.

In 2022, FanDuel shifted their focus to using data sharing. Data sharing allows you to share live data securely across Redshift data warehouses for read and write (in preview) purposes. This means that workloads can be isolated to individual clusters, allowing for a more streamlined schema design, WLM configuration, and right-sizing for cost optimization. The following diagram illustrates this architecture.

To achieve a data sharing architecture, the plan was to first spin up consumer clusters for development and testing environments for their data engineers that were moving key legacy code to dbt. FanDuel wanted their engineers to have access to production datasets to test their new models and match the results from their legacy SQL-based code sets. They also wanted to ensure that they had adequate compute to run many jobs concurrently. After they saw the benefits of data sharing, they spun up their first production consumer cluster in the spring of 2022 to handle other analytics use cases. This was sharing most of the schemas and their tables from the main producer cluster.

Benefits of moving to a data sharing architecture

FanDuel saw a lot of benefits from the data sharing architecture, where data engineers had access to real production data to test their jobs without impacting the producer’s performance. Since splitting the workloads through a data sharing architecture, FanDuel has doubled their query concurrency and reduced the query queuing, resulting in a better end-to-end query time. FanDuel received positive feedback on the new environment and soon reaped the rewards of increased engineering velocity and reduced performance issues in production after deployments. Their initial venture into the world of data sharing was definitely considered a success.

Given the successful rollout of their first consumer in a data sharing architecture, they looked for opportunities to meet other users’ needs with new targeted consumers. With the assistance of AWS, FanDuel initiated the development of a comprehensive strategy aimed at safeguarding their extract, load, and transform (ELT) jobs. This approach involved implementing workload isolation and allocating dedicated clusters for these workloads, designated as the producer cluster within the data sharing architecture. Simultaneously, they planned to migrate all other activities onto one or more consumer clusters, apart from the existing cluster utilized by their data engineering team.

They spun up a second consumer in the summer of 2022 with the hopes of moving some of their more resource-intensive analytical processes off the main cluster. In order to empower their analysts over time, they had allowed a pattern in which users other than data engineers could create and share their own objects.

As the calendar flipped from 2022 to 2023, several developments changed the landscape of architecture at FanDuel. For one, FanDuel launched their initial event-based streaming work for their sportsbook data, which allowed them to micro-batch data into Amazon Redshift at a much lower latency than their previous legacy batch approach. This allowed them to generate C-Suite revenue reports at a much earlier SLA, which was a big win for the data team, because this was never achieved before the Super Bowl.

FanDuel introduced a new internal KPI called Query Efficiency, a measure to capture the amount of time users spent waiting for their queries to run. As the workload started increasing exponentially, FanDuel also noticed an increase in this KPI, specifically for risk and trading workloads.

Working with AWS Enterprise Support and the Amazon Redshift service team, FanDuel soon realized that the risk and trading use case was a perfect opportunity to move it to Amazon Redshift Serverless. Redshift Serverless offers scalability across dimensions such a data volume changes, concurrent users and query complexity, enabling you to automatically scale compute up or down to manage demanding and unpredictable workloads. Because billing is only accrued while queries are run, it also means that you no longer need to cover costs for compute you’re not utilizing. Redshift Serverless also manages workload management (WLM) entirely, allowing you to focus only on the query monitoring rules (QMRs) you want and usage limits, further limiting the need for you to manage your data warehouses. This adoption also complimented data sharing, where Redshift Serverless endpoints can read and write (in preview) from provisioned clusters during peak hours, offering flexible compute scalability and workload isolation and avoiding the impact on other mission-critical workloads. Seeing the benefits of what Redshift Serverless offers for their risk and trading workloads, they also moved some of their other workloads like business intelligence (BI) dashboards and risk and trading (RT) to a Redshift Serverless environment.

Benefits of introducing Redshift Serverless in a data sharing architecture

Through a combination of data sharing and a serverless architecture, FanDuel could elastically scale their most critical workloads on demand. Redshift Serverless Automatic WLM allowed users to get started without the need to configure WLM. With the intelligent and automated scaling capabilities of Redshift Serverless, FanDuel could focus on their business objectives without worrying about the data warehouse capacity. This architecture alleviated the constraints of a single predefined Redshift provisioned cluster and reduced the need for FanDuel to manage data warehouse capacity and any WLM configuration.

In terms of cost, Redshift Serverless enabled FanDuel to elegantly handle the most demanding workloads with a pay-as-you-go model, paying only when the data warehouse is in use, along with complete separation of compute and storage.

Having now introduced workload isolation and Redshift Serverless, FanDuel is able to achieve a more granular understanding of each team’s compute requirements without the noise of ELT and contending workloads all in the same environment. This allowed comprehensive analytics workloads to be conducted on consumers with vastly minimized contention while also being serviced with the most cost-efficient configuration possible.

The following diagram illustrates the updated architecture.

Results

FanDuel’s re-architecting efforts for workload isolation with risk and trading (RT) workloads using Redshift data sharing and Redshift Serverless resulted in the most critical business SLAs finishing three times faster, along with an increase in average query efficiency of 55% for overall workloads. These SLA improvements have resulted into an overall saving of tenfold in business cost, and they have been able to deliver business insights to other verticals such as product, commercial, and marketing much faster.

Conclusion

By harnessing the power of Redshift provisioned clusters and serverless endpoints with data sharing, FanDuel has been able to better scale and run analytical workloads without having to manage any data warehouse infrastructure. FanDuel is looking forward to future Amazon partnerships and is excited to embark on a journey of new innovation with Redshift Serverless and continued enhancements such as machine learning optimization and auto scaling.

If you’re new to Amazon Redshift, you can explore demos, other customer stories, and the latest features at Amazon Redshift. If you’re already using Amazon Redshift, reach out to your AWS account team for support, and learn more about what’s new with Amazon Redshift.


About the authors

Sreenivasa Munagala is a Principal Data Architect at FanDuel Group. He defines their Amazon Redshift optimization strategy and works with the data analytics team to provide solutions to their key business problems.

Matt Grimm is a Principal Data Architect at FanDuel Group, moving the company to an event-based, data-driven architecture using the integration of both streaming and batch data, while also supporting their Machine Learning Platform and development teams.

Luke Shearer is a Cloud Support Engineer at Amazon Web Services for the Data Insight Analytics profile, where he is engaged with AWS customers every day and is always working to identify the best solution for each customer.

Dhaval Shah is Senior Customer Success Engineer at AWS and specializes in bringing the most complex and demanding data analytics workloads to Amazon Redshift. He has more then 20 years of experiences in different databases and data warehousing technologies. He is passionate about efficient and scalable data analytics cloud solutions that drive business value for customers.

Ranjan Burman is an Sr. Analytics Specialist Solutions Architect at AWS. He specializes in Amazon Redshift and helps customers build scalable analytical solutions. He has more than 17 years of experience in different database and data warehousing technologies. He is passionate about automating and solving customer problems with cloud solutions.

Sidhanth Muralidhar is a Principal Technical Account Manager at AWS. He works with large enterprise customers who run their workloads on AWS. He is passionate about working with customers and helping them architect workloads for cost, reliability, performance, and operational excellence at scale in their cloud journey. He has a keen interest in data analytics as well.

How HR&A uses Amazon Redshift spatial analytics on Amazon Redshift Serverless to measure digital equity in states across the US

Post Syndicated from Harman Singh Dhodi original https://aws.amazon.com/blogs/big-data/how-hra-uses-amazon-redshift-spatial-analytics-on-amazon-redshift-serverless-to-measure-digital-equity-in-states-across-the-us/

In our increasingly digital world, affordable access to high-speed broadband is a necessity to fully participate in our society, yet there are still millions of American households without internet access. HR&A Advisors—a multi-disciplinary consultancy with extensive work in the broadband and digital equity space is helping its state, county, and municipal clients deliver affordable internet access by analyzing locally specific digital inclusion needs and building tailored digital equity plans.

The first step in this process is mapping the digital divide. Which households don’t have access to the internet at home? Where do they live? What are their specific needs?

Public data sources aren’t sufficient for building a true understanding of digital inclusion needs. To fill in the gaps in existing data, HR&A creates digital equity surveys to build a more complete picture before developing digital equity plans. HR&A has used Amazon Redshift Serverless and CARTO to process survey findings more efficiently and create custom interactive dashboards to facilitate understanding of the results. HR&A’s collaboration with Amazon Redshift and CARTO has resulted in a 75% reduction in overall deployment and dashboard management time and helped the team achieve the following technical goals:

  • Load survey results (CSV files) and geometry data (shape files) in a data warehouse
  • Perform geo-spatial transformations using extract, transform, and load (ELT) jobs to join geometry data with survey results within the data warehouse to allow for visualization of survey results on a map
  • Integrate with a business intelligence (BI) tool for advanced geo-spatial functions, visualizations, and mapping dashboards
  • Scale data warehouse capacity up or down to address workloads of varying complexity in a cost-efficient manner

In this post, we unpack how HR&A uses Amazon Redshift spatial analytics and CARTO for cost-effective geo-spatial measurement of digital inclusion and internet access across multiple US states.

Before we get to the architecture details, here is what HR&A and its client, Colorado’s Office of the Future of Work, has to say about the solution.

“Working with the team at HR&A Advisors, Colorado’s Digital Equity Team created a custom dashboard that allowed us to very effectively evaluate our reach while surveying historically marginalized populations across Colorado. This dynamic tool, powered by AWS and CARTO, provided robust visualizations of which regions and populations were interacting with our survey, enabling us to zoom in quickly and address gaps in coverage. Ensuring we were able to seek out data from those who are most impacted by the digital divide in Colorado has been vital to addressing digital inequities in our state.”

— Melanie Colletti, Digital Equity Manager at Colorado’s Office of the Future of Work

“AWS allows us to securely house all of our survey data in one place, quickly scrub and analyze it on Amazon Redshift, and mirror the results through integration with data visualization tools such as CARTO without the data ever leaving AWS. This frees up our local computer space, greatly automates the survey cleaning and analysis step, and allows our clients to easily access the data results. Following the proof of concept and development of first prototype, almost all of our state clients showed interest in using the same solution for their states.”

— Harman Singh Dhodi, Analyst at HR&A Advisors, Inc.

Storing and analyzing large survey datasets

HR&A used Redshift Serverless to store large amounts of digital inclusion data in one place and quickly transform and analyze it using CARTO’s analytical toolkit to extend the spatial capabilities of Amazon Redshift and integrate with CARTO’s data visualization tools—all without the data ever leaving the AWS environment. This cut down significantly on analytical turnaround times.

The CARTO Analytics Toolbox for Redshift is composed of a set of user-defined functions and procedures organized in a set of modules based on the functionality they offer.

The following figure shows the solution and workflow steps developed during the proof of concept with a virtual private cloud (VPC) on Amazon Redshift.

Figure 1: Workflow illustrating data ingesting, transformation, and visualization using Redshift and CARTO.

In the following sections, we discuss each phase in the workflow in more detail.

Data ingestion

HR&A receives survey data as wide CSV files with hundreds of columns in each file and related spatial data in hexadecimal Extended Well-Known Binary (EWKB) in the form of shape files. These files are stored in Amazon Simple Storage Service (Amazon S3).

The Redshift COPY command is used to ingest the spatial data from shape files into the native GEOMETRY data type supported in Amazon Redshift. A combination of Amazon Redshift Spectrum and COPY commands are used to ingest the survey data stored as CSV files. For the files with unknown structures, AWS Glue crawlers are used to extract metadata and create table definitions in the Data Catalog. These table definitions are used as the metadata repository for external tables in Amazon Redshift.

For files with known structures, a Redshift stored procedure is used, which takes the file location and table name as parameters and runs a COPY command to load the raw data into corresponding Redshift tables.

Data transformation

Multiple stored procedures are used to split the raw table data and load it into corresponding target tables while applying the user-defined transformations.

These transformation rules include transformation of GEOMETRY data using native Redshift geo-spatial functions, like ST_Area and ST_length, and CARTO’s advanced spatial functions, which are readily available in Amazon Redshift as part of the CARTO Analytics Toolbox for Redshift installation. Furthermore, all the data ingestion and transformation steps are automated using an AWS Lambda function to run the Redshift query when any dataset in Amazon S3 gets updated.

Data visualization

The HR&A team used CARTO’s Redshift connector to connect to the Redshift Serverless endpoint and built dashboards using CARTO’s SQL interface and widgets to assist mapping while performing dynamic calculations of the map data as per client needs.

The following are sample screenshots of the dashboards that show survey responses by zip code. The counties that are in lighter shades represent limited survey responses and need to be included in the targeted data collection strategy.

The first image shows the dashboard without any active filters. The second image shows filtered map and chats by respondents who took the survey in Spanish. The user can select and toggle between features by clicking on the respective category in any of the bar charts.

Figure 2: Illustrative Digital Equity Survey Dashboard for the State of Colorado. (© HR&A Advisors)

Figure 3: Illustrative Digital Equity Survey Dashboard for the State of Colorado, filtered for respondents who took the survey in Spanish language. (© HR&A Advisors)

The result: A new standard for automatically updating digital inclusion dashboards

After developing the first interactive dashboard prototype with this methodology, five of HR&A’s state clients (CA, TX, NV, CO, and MA) showed interest in the solution. HR&A was able to implement it for each of them within 2 months—an incredibly quick turnaround for a custom, interactive digital inclusion dashboard.

HR&A also realized about a 75% reduction in overall deployment and dashboard management time, which meant the consulting team could redirect their focus from manually analyzing data to helping clients interpret and strategically plan around the results. Finally, the dashboard’s user-friendly interface made survey data more accessible to a wider range of stakeholders. This helped build a shared understanding when assessing gaps in each state’s digital inclusion landscape and allowed for a targeted data collection strategy from areas with limited survey responses, thereby supporting more productive collaboration overall.

Conclusion

In this post, we showed how HR&A was able to analyze geo-spatial data in large volumes using Amazon Redshift Serverless and CARTO.

With HR&A’s successful implementation, it’s evident that Redshift Serverless, with its flexibility and scalability, can be used as a catalyst for positive social change. As HR&A continues to pave the way for digital equity, their story stands as a testament to how AWS services and its partners can be used in addressing real-world challenges.

We encourage you to explore Redshift Serverless with CARTO for analyzing spatial data and let us know your experience in the comments.


About the authors

Harman Singh Dhodi is an Analyst at HR&A Advisors, Harman combines his passion for data analytics with sustainable infrastructure practices, social inclusion, economic viability, climate resiliency, and building stakeholder capacity. Harman’s work often focuses on translating complex datasets into visual stories and accessible tools that help empower communities to understand the challenges they’re facing and create solutions for a brighter future.

Kiran Kumar Tati is an Analytics Specialist Solutions Architect based out of Omaha, NE. He specializes in building end-to-end analytic solutions. He has more than 13 years of experience with designing and implementing large scale Big Data and Analytics solutions. In his spare time, he enjoys playing cricket and watching sports.

Sapna Maheshwari is a Sr. Solutions Architect at Amazon Web Services. She helps customers architect data analytics solutions at scale on AWS. Outside of work she enjoys traveling and trying new cuisines.

Washim Nawaz is an Analytics Specialist Solutions Architect at AWS. He has worked on building and tuning data warehouse and data lake solutions for over 15 years. He is passionate about helping customers modernize their data platforms with efficient, performant, and scalable analytic solutions. Outside of work, he enjoys watching games and traveling.

How Eightfold AI implemented metadata security in a multi-tenant data analytics environment with Amazon Redshift

Post Syndicated from Arun Sudhir original https://aws.amazon.com/blogs/big-data/how-eightfold-ai-implemented-metadata-security-in-a-multi-tenant-data-analytics-environment-with-amazon-redshift/

This is a guest post co-written with Arun Sudhir from Eightfold AI.

Eightfold is transforming the world of work by providing solutions that empower organizations to recruit and retain a diverse global workforce. Eightfold is a leader in AI products for enterprises to build on their talent’s existing skills. From Talent Acquisition to Talent Management and talent insights, Eightfold offers a single AI platform that does it all.

The Eightfold Talent Intelligence Platform powered by Amazon Redshift and Amazon QuickSight provides a full-fledged analytics platform for Eightfold’s customers. It delivers analytics and enhanced insights about the customer’s Talent Acquisition, Talent Management pipelines, and much more. Customers can also implement their own custom dashboards in QuickSight. As part of the Talent Intelligence Platform Eightfold also exposes a data hub where each customer can access their Amazon Redshift-based data warehouse and perform ad hoc queries as well as schedule queries for reporting and data export. Additionally, customers who have their own in-house analytics infrastructure can integrate their own analytics solutions with Eightfold Talent Intelligence Platform by directly connecting to the Redshift data warehouse provisioned for them. Doing this gives them access to their raw analytics data, which can then be integrated into their analytics infrastructure irrespective of the technology stack they use.

Eightfold provides this analytics experience to hundreds of customers today. Securing customer data is a top priority for Eightfold. The company requires the highest security standards when implementing a multi-tenant analytics platform on Amazon Redshift.

The Eightfold Talent Intelligence Platform integrates with Amazon Redshift metadata security to implement visibility of data catalog listing of names of databases, schemas, tables, views, stored procedures, and functions in Amazon Redshift.

In this post, we discuss how the Eightfold Talent Lake system team implemented the Amazon Redshift metadata security feature in their multi-tenant environment to enable access controls for the database catalog. By linking access to business-defined entitlements, they are able to enforce data access policies.

Amazon Redshift security controls addresses restricting data access to users who have been granted permission. This post discusses restricting listing of data catalog metadata as per the granted permissions.

The Eightfold team needed to develop a multi-tenant application with the following features:

  • Enforce visibility of Amazon Redshift objects on a per-tenant basis, so that each tenant can only view and access their own schema
  • Implement tenant isolation and security so that tenants can only see and interact with their own data and objects

Metadata security in Amazon Redshift

Amazon Redshift is a fully managed, petabyte-scale data warehouse service in the cloud. Many customers have implemented Amazon Redshift to support multi-tenant applications. One of the challenges with multi-tenant environments is that database objects are visible to all tenants even though tenants are only authorized to access certain objects. This visibility creates data privacy challenges because many customers want to hide objects that tenants can’t access.

The newly released metadata security feature in Amazon Redshift enables you to hide database objects from all other tenants and make objects only visible to tenants who are authorized to see and use them. Tenants can use SQL tools, dashboards, or reporting tools, and also query the database catalog, but they will only see appropriate objects for which they have permissions to see.

Solution overview

Exposing a Redshift endpoint to all of Eightfold’s customers as part of the Talent Lake endeavor involved several design choices that had to be carefully considered. Eightfold has a multi-tenant Redshift data warehouse that had individual customer schemas for customers, which they could connect to using their own customer credentials to perform queries on their data. Data in each customer tenant can only be accessed by the customer credentials that had access to the customer schema. Each customer could access data under their analytics schema, which was named after the customer. For example, for a customer named A, the schema name would be A_analytics. The following diagram illustrates this architecture.

Although customer data was secured by restricting access to only the customer user, when customers used business intelligence (BI) tools like QuickSight, Microsoft Power BI, or Tableau to access their data, the initial connection showed all the customer schemas because it was performing a catalog query (which couldn’t be restricted). Therefore, Eightfold’s customers had concerns that other customers could discover that they were Eightfold’s customers by simply trying to connect to Talent Lake. This unrestricted database catalog access posed a privacy concern to several Eightfold customers. Although this could be avoided by provisioning one Redshift database per customer, that was a logistically difficult and expensive solution to implement.

The following screenshot shows what a connection from QuickSight to our data warehouse looked like without metadata security turned on. All other customer schemas were exposed even though the connection to QuickSight was made as customer_k_user.

Approach for implementing metadata access controls

To implement restricted catalog access, and ensure it worked with Talent Lake, we cloned our production data warehouse with all the schemas and enabled the metadata security flag in the Redshift data warehouse by connecting to SQL tools. After it was enabled, we tested the catalog queries by connecting to the data warehouse from BI tools like QuickSight, Microsoft Power BI, and Tableau and ensured that only the customer schemas show up as a result of the catalog query. We also tested by running catalog queries after connecting to the Redshift data warehouse from psql, to ensure that only the customer schema objects were surfaced—It’s important to validate that given tenants have access to the Redshift data warehouse directly.

The metadata security feature was tested by first turning on metadata security in our Redshift data warehouse by connecting using a SQL tool or Amazon Redshift Query Editor v2.0 and issuing the following command:

ALTER SYSTEM SET metadata_security = TRUE;

Note that the preceding command is set at the Redshift cluster level or Redshift Serverless endpoint level, which means it is applied to all databases and schemas in the cluster or endpoint.

In Eightfold’s scenario, data access controls are already in place for each of the tenants for their respective database objects.

After turning on the metadata security feature in Amazon Redshift, Eightfold was able to restrict database catalog access to only show individual customer schemas for each customer that was trying to connect to Amazon Redshift and further validated by issuing a catalog query to access schema objects as well.

We also tested by connecting via psql and trying out various catalog queries. All of them yielded only the relevant customer schema of the logged-in user as the result. The following are some examples:

analytics=> select * from pg_user;
usename | usesysid | usecreatedb | usesuper | usecatupd | passwd | valuntil | useconfig 
------------------------+----------+-------------+----------+-----------+----------+----------+-------------------------------------------
customer_k_user | 377 | f | f | f | ******** | | 
(1 row)

analytics=> select * from information_schema.schemata;
catalog_name | schema_name | schema_owner | default_character_set_catalog | default_character_set_schema | default_character_set_name | sql_path 
--------------+----------------------+------------------------+-------------------------------+------------------------------+----------------------------+----------
analytics | customer_k_analytics | customer_k_user | | | | 
(1 row)

The following screenshot shows the UI after metadata security was enabled: only customer_k_analytics is seen when connecting to the Redshift data warehouse as customer_k_user.

This ensured that individual customer privacy was protected and increased customer confidence in Eightfold’s Talent Lake.

Customer feedback

“Being an AI-first platform for customers to hire and develop people to their highest potential, data and analytics play a vital role in the value provided by the Eightfold platform to its customers. We rely on Amazon Redshift as a multi-tenant Data Warehouse that provides rich analytics with data privacy and security through customer data isolation by using schemas. In addition to the data being secure as always, we layered on Redshift’s new metadata access control to ensure customer schemas are not visible to other customers. This feature truly made Redshift the ideal choice for a multi-tenant, performant, and secure Data Warehouse and is something we are confident differentiates our offering to our customers.”

– Sivasankaran Chandrasekar, Vice President of Engineering, Data Platform at Eightfold AI

Conclusion

In this post, we demonstrated how the Eightfold Talent Intelligence Platform team implemented a multi-tenant environment for hundreds of customers, using the Amazon Redshift metadata security feature. For more information about metadata security, refer to the Amazon Redshift documentation.

Try out the metadata security feature for your future Amazon Redshift implementations, and feel free to leave a comment about your experience!


About the authors

Arun Sudhir is a Staff Software Engineer at Eightfold AI. He has more than 15 years of experience in design and development of backend software systems in companies like Microsoft and AWS, and has a deep knowledge of database engines like Amazon Aurora PostgreSQL and Amazon Redshift.

Rohit Bansal is an Analytics Specialist Solutions Architect at AWS. He specializes in Amazon Redshift and works with customers to build next-generation analytics solutions using AWS Analytics services.

Anjali Vijayakumar is a Senior Solutions Architect at AWS focusing on EdTech. She is passionate about helping customers build well-architected solutions in the cloud.
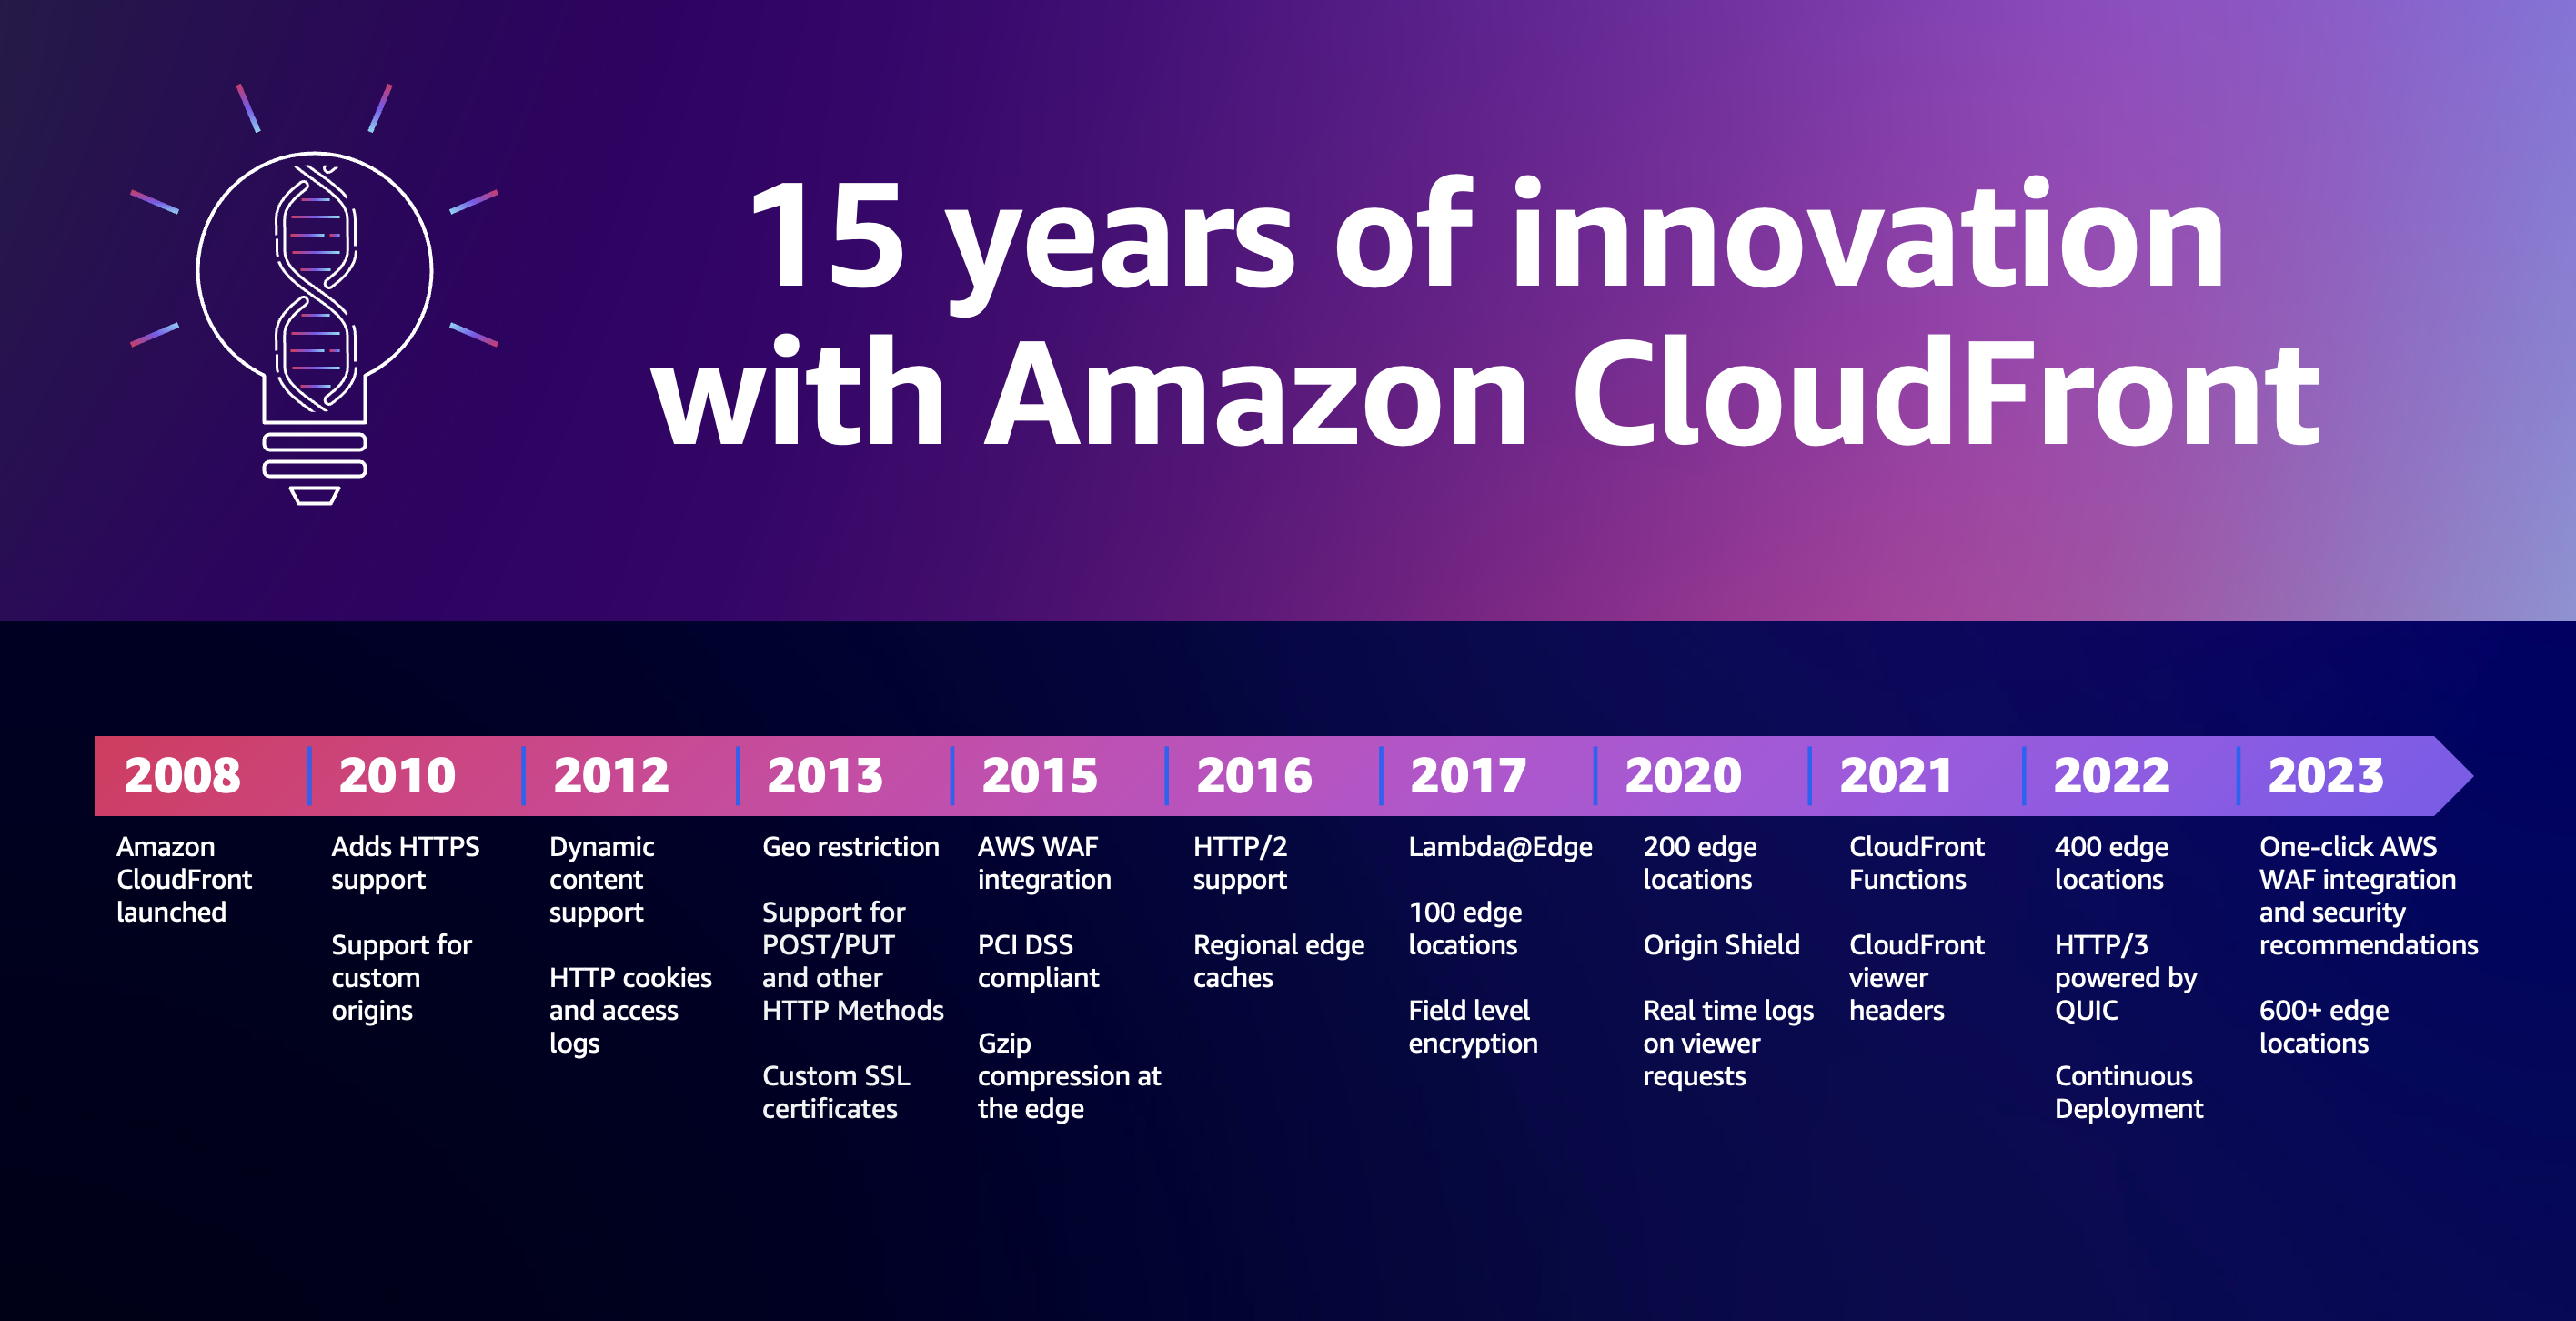
Happy anniversary, Amazon CloudFront: 15 years of evolution and internet advancements

Post Syndicated from Danilo Poccia original https://aws.amazon.com/blogs/aws/happy-anniversary-amazon-cloudfront-15-years-of-evolution-and-internet-advancements/

I can’t believe it’s been 15 years since Amazon CloudFront was launched! When Amazon S3 became available in 2006, developers loved the flexibility and started to build a new kind of globally distributed applications where storage was not a bottleneck. These applications needed to be performant, reliable, and cost-efficient for every user on the planet. So in 2008 a small team (a “two-pizza team“) launched CloudFront in just 200 days. Jeff Barr hinted at the new and yet unnamed service in September and introduced CloudFront two months later.

Since the beginning, CloudFront has provided an easy way to distribute content to end users with low latency, high data transfer speeds, and no long-term commitments. What started as a simple cache for Amazon S3 quickly evolved into a fully featured content delivery network. Now CloudFront delivers applications at blazing speeds across the globe, supporting live sporting events such as NFL, Cricket World Cup, and FIFA World Cup.

At the same time, we also want to provide you with the best tools to secure applications. In 2015, we announced AWS WAF integration with CloudFront to provide fast and secure access control at the edge. Then, we focused on developing robust threat intelligence by combining signals across services. This threat intelligence integrates with CloudFront, adding AWS Shield to protect applications from common exploits and distributed denial of service (DDoS) attacks. For example, we recently detected an unusual spike in HTTP/2 requests to Amazon CloudFront. We quickly realized that CloudFront had automatically mitigated a new type of HTTP request flood DDoS event.

A lot also happens at lower levels than HTTP. For example, when you serve your application with CloudFront, all of the packets received by the application are inspected by a fully inline DDoS mitigation system which doesn’t introduce any observable latency. In this way, L3/L4 DDoS attacks against CloudFront distributions are mitigated in real time.

We also made under-the-hood improvements like s2n-tls (short for “signal to noise”), an open-source implementation of the TLS protocol that has been designed to be small and fast with simplicity as a priority. Another similar improvement is s2n-quic, an open-source QUIC protocol implementation written in Rust.

With CloudFront, you can also control access to content through a number of capabilities. You can restrict access to only authenticated viewers or, through geo-restriction capability, configure the specific geographic locations that can access content.

Security is always important, but not every organization has dedicated security experts on staff. To make robust security more accessible, CloudFront now includes built-in protections such as one-click web application firewall setup, security recommendations, and an intuitive security dashboard. With these integrated security features, teams can put critical safeguards in place without deep security expertise. Our goal is to empower all customers to easily implement security best practices.

Web applications delivery
During the past 15 years, web applications have become much more advanced and essential to end users. When CloudFront launched, our focus was helping deliver content stored in S3 buckets. Dynamic content was introduced to optimize web applications where portions of a website change for each user. Dynamic content also improves access to APIs that need to be delivered globally.

As applications become more distributed, we looked at ways to help developers make efficient use of its global footprint and resources at the edge. To allow customization and personalization of content close to end users and minimize latency, Lambda@Edge was introduced.

When fewer compute resources are needed, CloudFront Functions can run lightweight JavaScript functions across edge locations for low-latency HTTP manipulations and personalized content delivery. Recently, CloudFront Functions expanded to further customize responses, including modifying HTTP status codes and response bodies.

Today, CloudFront handles over 3 trillion HTTP requests daily and uses a global network of more than 600 points of presence and 13 Regional edge caches in more than 100 cities across 50 countries. This scale helps power the most demanding online events. For example, during the 2023 Amazon Prime Day, CloudFront handled peak loads of over 500 million HTTP requests per minute, totaling over 1 trillion HTTP requests.

Amazon CloudFront has more than 600,000 active developers building and delivering applications to end users. To help teams work at their full speed, CloudFront introduced continuous deployment so developers can test and validate configuration changes on a portion of traffic before full deployment.

Media and entertainment
It’s now common to stream music, movies, and TV series to our homes, but 15 years ago, renting DVDs was still the norm. Running streaming servers was technically complex, requiring long-term contracts to access the global infrastructure needed for high performance.

First, we added support for audio and video streaming capabilities using custom protocols since technical standards were still evolving. To handle large audiences and simplify cost-effective delivery of live events, CloudFront launched live HTTP streaming and, shortly after, improved support for both Flash-based (popular at the time) and Apple iOS devices.

As the media industry continued moving to internet-based delivery, AWS acquired Elemental, a pioneer in software-defined video solutions. Integrating Elemental offerings helped provide services, software, and appliances that efficiently and economically scale video infrastructures for use cases such as broadcast and content production.

The evolution of technologies and infrastructure allows for new ways of communication to become possible, such as when NASA did the first-ever live 4K stream from space using CloudFront.

Today, the world’s largest events and leading video platforms rely on CloudFront to deliver massive video catalogs and live stream content to millions. For example, CloudFront delivered streams for the FIFA World Cup 2022 on behalf of more than 19 major broadcasters globally. More recently, CloudFront handled over 120 Tbps of peak data transfer during one of the Thursday Night Football games of the NFL season on Prime Video and helped deliver the Cricket World Cup to millions of viewers across the globe.

What’s next?
Many things have changed during these 15 years but the focus on security, performance, and scalability stays the same. At AWS, it’s always Day 1, and the CloudFront team is constantly looking for ways to improve based on your feedback.

The rise of botnets is driving an ever-evolving, highly dynamic, and shifting threat landscape. Layer 7 DDoS attacks are becoming increasingly prevalent. The pervasiveness of bot traffic is increasing exponentially. As this occurs, we are evolving how we mitigate threats at the network border, at the edge, and in the Region, making it simpler for customers to configure the right security options.

Web applications are becoming more complex and interactive, and viewer expectations on latency and resiliency are even more stringent. This will drive new innovation. As new applications use generative artificial intelligence (AI), needs will evolve. These trends are will continue growing, so our investments will be focused on improving security and edge compute capabilities to support these new use cases.

With the current macroeconomic environment, many customers, especially small and medium-sized businesses and startups, look at how they can reduce their costs. Providing optimal price-performance has always been a priority for CloudFront. Cacheable data transferred to CloudFront edge locations from AWS resources does not incur additional fees. Also, 1 TB of data transfer from CloudFront to the internet per month is included in the free tier. CloudFront operates on a pay-as-you-go model with no upfront costs or minimum usage requirements. For more info, see CloudFront pricing.

As we approach AWS re:Invent, take note of these sessions that can help you learn about the latest innovations and connect with experts:

To learn more on how to speed up your websites and APIs and keep them protected, see the Application Security and Performance section of the AWS Developer Center.

Reduce latency and improve the security for your applications with Amazon CloudFront.

Danilo

Introducing instance maintenance policy for Amazon EC2 Auto Scaling

Post Syndicated from Macey Neff original https://aws.amazon.com/blogs/compute/introducing-instance-maintenance-policy-for-amazon-ec2-auto-scaling/

This post is written by Ahmed Nada, Principal Solutions Architect, Flexible Compute and Kevin OConnor, Principal Product Manager, Amazon EC2 Auto Scaling.

Amazon Web Services (AWS) customers around the world trust Amazon EC2 Auto Scaling to provision, scale, and manage Amazon Elastic Compute Cloud (Amazon EC2) capacity for their workloads. Customers have come to rely on Amazon EC2 Auto Scaling instance refresh capabilities to drive deployments of new EC2 Amazon Machine Images (AMIs), change EC2 instance types, and make sure their code is up-to-date.

Currently, EC2 Auto Scaling uses a combination of ‘launch before terminate’ and ‘terminate and launch’ behaviors depending on the replacement cause. Customers have asked for more control over when new instances are launched, so they can minimize any potential disruptions created by replacing instances that are actively in use. This is why we’re excited to introduce instance maintenance policy for Amazon EC2 Auto Scaling, an enhancement that provides customers with greater control over the EC2 instance replacement processes to make sure instances are replaced in a way that aligns with performance priorities and operational efficiencies while minimizing Amazon EC2 costs.

This post dives into varying ways to configure an instance maintenance policy and gives you tools to use it in your Amazon EC2 Auto Scaling groups.

Background

AWS launched Amazon EC2 Auto Scaling in 2009 with the goal of simplifying the process of managing Amazon EC2 capacity. Since then, we’ve continued to innovate with advanced features like predictive scaling, attribute-based instance selection, and warm pools.

A fundamental Amazon EC2 Auto Scaling capability is replacing instances based on instance health, due to Amazon EC2 Spot Instance interruptions, or in response to an instance refresh operation. The instance refresh capability allows you to maintain a fleet of healthy and high-performing EC2 instances in your Amazon EC2 Auto Scaling group. In some situations, it’s possible that terminating instances before launching a replacement can impact performance, or in the worst case, cause downtime for your applications. No matter what your requirements are, instance maintenance policy allows you to fine-tune the instance replacement process to match your specific needs.

Overview

Instance maintenance policy adds two new Amazon EC2 Auto Scaling group settings: minimum healthy percentage (MinHealthyPercentage) and maximum healthy percentage (MaxHealthyPercentage). These values represent the percentage of the group’s desired capacity that must be in a healthy and running state during instance replacement. Values for MinHealthyPercentage can range from 0 to 100 percent and from 100 to 200 percent for MaxHealthyPercentage. These settings are applied to all events that lead to instance replacement, such as Health-check based replacement, Max Instance Lifetime, EC2 Spot Capacity Rebalancing, Availability Zone rebalancing, Instance Purchase Option Rebalancing, and Instance refresh. You can also override the group-level instance maintenance policy during instance refresh operations to meet specific deployment use cases.

Before launching instance maintenance policy, an Amazon EC2 Auto Scaling group would use the previously described behaviors when replacing instances. By setting the MinHealthyPercentage of the instance maintenance policy to 100% and the MaxHealthyPercentage to a value greater than 100%, the Amazon EC2 Auto Scaling group first launches replacement instances and waits for them to become available before terminating the instances being replaced.

Setting up instance maintenance policy

You can add an instance maintenance policy to new or existing Amazon EC2 Auto Scaling groups using the AWS Management Console, AWS Command Line Interface (AWS CLI), AWS SDK, AWS CloudFormation, and Terraform.

When creating or editing Amazon EC2 Auto Scaling groups in the Console, you are presented with four options to define the replacement behavior of your instance maintenance policy. These options include the No policy option, which allows you to maintain the default instance replacement settings that the Amazon EC2 Auto Scaling service uses today.

The GUI for the instance maintenance policy feature within the “Create Auto Scaling group” wizard.

Image 1: The GUI for the instance maintenance policy feature within the “Create Auto Scaling group” wizard.

Using instance maintenance policy to increase application availability

The Launch before terminating policy is the right selection when you want to favor availability of your Amazon EC2 Auto Scaling group capacity. This policy setting temporarily increases the group’s capacity by launching new instances during replacement operations. In the Amazon EC2 console, you select the Launch before terminating replacement behavior, and then set your desired MaxHealthyPercentage value to determine how many more instances should be launched during instance replacement.

For example, if you are managing a workload that requires optimal availability during instance replacements, choose the Launch before terminating policy type with a MinHealthyPercentage set to 100%. If you set your MaxHealthyPercentage to 150%, then Amazon EC2 Auto Scaling launches replacement instances before terminating instances to be replaced. You should see the desired capacity increase by 50%, exceeding the group maximum capacity during the operation to provide you with the needed availability. The chart in the following figure illustrates what an instance refresh operation would behave like with a Launch before terminating policy.

A graph simulating the instance replacement process with a policy configured to launch before terminating.

Figure 1: A graph simulating the instance replacement process with a policy configured to launch before terminating.

Overriding a group’s instance maintenance policy during instance refresh

Instance maintenance policy settings apply to all instance replacement operations, but they can be overridden at the start of a new instance refresh operation. Overriding instance maintenance policy is helpful in situations like a bad code deployment that needs replacing without downtime. You could configure an instance maintenance policy to bring an entirely new group’s worth of instances into service before terminating the instances with the problematic code. In this situation, you set the MaxHealthyPercentage to 200% for the instance refresh operation and the replacement happens in a single cycle to promptly address the bad code issue. Setting the MaxHealthyPercentage to 200% will allow the replacement settings to breach the Auto Scaling Group’s Max capacity value, but would be constrained by any account level quotas, so be sure to factor these into application of this feature. See the following figure for a visualization of how this operation would behave.

A graph simulating the instance replacement process with a policy configured to accelerate a new deployment.

Figure 2: A graph simulating the instance replacement process with a policy configured to accelerate a new deployment.

Controlling costs during replacements and deployments

The Terminate and launch policy option allows you to favor cost control during instance replacement. By configuring this policy type, Amazon EC2 Auto Scaling terminates existing instances and then launches new instances during the replacement process. To set a Terminate and launch policy, you must specify a MinHealthyPercentage to establish how low the capacity can drop, and keep your MaxHealthyPercentage set to 100%. This configuration keeps the Auto Scaling group’s capacity at or below the desired capacity setting.

The following figure shows behavior with the MinHealthyPercentage set to 80%. During the instance replacement process, the Auto Scaling group first terminates 20% of the instances and immediately launches replacement instances, temporarily reducing the group’s healthy capacity to 80%. The group waits for the new instances to pass its configured health checks and complete warm up before it moves on to replacing the remaining batches of instances.

: A graph simulating the instance replacement process with a policy configured to terminate and launch.

Figure 3: A graph simulating the instance replacement process with a policy configured to terminate and launch.

Note that the difference between MinHealthyPercentage and MaxHealthyPercentage values impacts the speed of the instance replacement process. In the preceding figure, the Amazon EC2 Auto Scaling group replaces 20% of the instances in each cycle. The larger the gap between the MinHealthyPercentage and MaxHealthyPercentage, the faster the replacement process.

Using a custom policy for maximum flexibility

You can also choose to adopt a Custom behavior option, where you have the flexibility to set the MinHealthyPercentage and MinHealthyPercentage values to whatever you choose. Using this policy type allows you to fine-tune the replacement behavior and control the capacity of your instances within the Amazon EC2 Auto Scaling group to tailor the instance maintenance policy to meet your unique needs.

What about fractional replacement calculations?

Amazon EC2 Auto Scaling always favors availability when performing instance replacements. When instance maintenance policy is configured, Amazon EC2 Auto Scaling also prioritizes launching a new instance rather than going below the MinHealthyPercentage. For example, in an Amazon EC2 Auto Scaling group with a desired capacity of 10 instances and an instance maintenance policy with MinHealthyPercentage set to 99% and MaxHealthyPercentage set to 100%, your settings do not allow for a reduction in capacity of at least one instance. Therefore, Amazon EC2 Auto Scaling biases toward launch before terminating and launches one new instance before terminating any instances that need replacing.

Configuring an instance maintenance policy is not mandatory. If you don’t configure your Amazon EC2 Auto Scaling groups to use an instance maintenance policy, then there is no change in the behavior of your Amazon EC2 Auto Scaling groups’ existing instance replacement process.

You can set a group-level instance maintenance policy through your CloudFormation or Terraform templates. Within your templates, you must set values for both the MinHealthyPercentage and MaxHealthyPercentage settings to determine the instance replacement behavior that aligns with the specific requirements of your Amazon EC2 Auto Scaling group.

Conclusion

In this post, we introduced the new instance maintenance policy feature for Amazon EC2 Auto Scaling groups, explored its capabilities, and provided examples of how to use this new feature. Instance maintenance policy settings apply to all instance replacement processes with the option to override the settings on a per instance refresh basis. By configuring instance maintenance policies, you can control the launch and lifecycle of instances in your Amazon EC2 Auto Scaling groups, increase application availability, reduce manual intervention, and improve cost control for your Amazon EC2 usage.

To learn more about the feature and how to get started, refer to the Amazon EC2 Auto Scaling User Guide.

BMW Cloud Efficiency Analytics powered by Amazon QuickSight and Amazon Athena

Post Syndicated from Phillip Karg original https://aws.amazon.com/blogs/big-data/bmw-cloud-efficiency-analytics-powered-by-amazon-quicksight-and-amazon-athena/

This post is written in collaboration with Philipp Karg and Alex Gutfreund  from BMW Group.

Bayerische Motoren Werke AG (BMW) is a motor vehicle manufacturer headquartered in Germany with 149,475 employees worldwide and the profit before tax in the financial year 2022 was € 23.5 billion on revenues amounting to € 142.6 billion. BMW Group is one of the world’s leading premium manufacturers of automobiles and motorcycles, also providing premium financial and mobility services.

BMW Group uses 4,500 AWS Cloud accounts across the entire organization but is faced with the challenge of reducing unnecessary costs, optimizing spend, and having a central place to monitor costs. BMW Cloud Efficiency Analytics (CLEA) is a homegrown tool developed within the BMW FinOps CoE (Center of Excellence) aiming to optimize and reduce costs across all these accounts.

In this post, we explore how the BMW Group FinOps CoE implemented their Cloud Efficiency Analytics tool (CLEA), powered by Amazon QuickSight and Amazon Athena. With this tool, they effectively reduced costs and optimized spend across all their AWS Cloud accounts, utilizing a centralized cost monitoring system and using key AWS services. The CLEA dashboards were built on the foundation of the Well-Architected Lab. For more information on this foundation, refer to A Detailed Overview of the Cost Intelligence Dashboard.

CLEA gives full transparency into cloud costs, usage, and efficiency from a high-level overview to granular service, resource, and operational levels. It seamlessly consolidates data from various data sources within AWS, including AWS Cost Explorer (and forecasting with Cost Explorer), AWS Trusted Advisor, and AWS Compute Optimizer. Additionally, it incorporates BMW Group’s internal system to integrate essential metadata, offering a comprehensive view of the data across various dimensions, such as group, department, product, and applications.

The ultimate goal is to raise awareness of cloud efficiency and optimize cloud utilization in a cost-effective and sustainable manner. The dashboards, which offer a holistic view together with a variety of cost and BMW Group-related dimensions, were successfully launched in May 2023 and became accessible to users within the BMW Group.

Overview of the BMW Cloud Data Hub

At the BMW Group, Cloud Data Hub (CDH) is the central platform for managing company-wide data and data solutions. It works as a bundle for resources that are bound to a specific staging environment and Region to store data on Amazon Simple Storage Service (Amazon S3), which is renowned for its industry-leading scalability, data availability, security, and performance. Additionally, it manages table definitions in the AWS Glue Data Catalog, containing references to data sources and targets of extract, transform, and load (ETL) jobs in AWS Glue.

Data providers and consumers are the two fundamental users of a CDH dataset. Providers create datasets within assigned domain and as the owner of a dataset, they are responsible for the actual content and for providing appropriate metadata. They can use their own toolsets or rely on provided blueprints to ingest the data from source systems. Once released, consumers use datasets from different providers for analysis, machine learning (ML) workloads, and visualization.

Each CDH dataset has three processing layers: source (raw data), prepared (transformed data in Parquet), and semantic (combined datasets). It is possible to define stages (DEV, INT, PROD) in each layer to allow structured release and test without affecting PROD. Within each stage, it’s possible to create resources for storing actual data. Two resource types are associated with each database in a layer:

  • File store – S3 buckets for data storage
  • Database – AWS Glue databases for metadata sharing

Overview of the CLEA Landscape

The following diagram is a high-level overview of some of the technologies used for the extract, load, and transform (ELT) stages, as well as the final visualization and analysis layer. You might notice that this differs slightly from traditional ETL. The difference lies in when and where data transformation takes place. In ETL, data is transformed before it’s loaded into the data warehouse. In ELT, raw data is loaded into the data warehouse first, then it’s transformed directly within the warehouse. The ELT process has gained popularity with the rise of cloud-based, high-performance data warehouses, where transformation can be done more efficiently after loading.

Regardless of the method used, the goal is to provide high-quality, reliable data that can be used to drive business decisions.

CLEA Architecture

In this section, we take a closer look at the three essential stages mentioned previously: extract, load and transform.

Extract

The extract stage plays a pivotal role in the CLEA, serving as the initial step where data related to cost and usage and optimization is collected from a diverse range of sources within AWS. These sources encompass the AWS Cost and Usage Reports, Cost Explorer (and forecasting with Cost Explorer), Trusted Advisor, and Compute Optimizer. Furthermore, it fetches essential metadata from BMW Group’s internal system, offering a comprehensive view of the data across various dimensions, such as group, department, product, and applications in the later stages of data transformation.

The following diagram illustrates one of the data collection architectures that we use to collect Trusted Advisor data from nearly 4,500 AWS accounts and subsequently load that into Cloud Data Hub.

Let’s go through each numbered step as outlined in the architecture:

  1. A time-based rule in Amazon EventBridge triggers the CLEA Shared Workflow AWS Step Functions state machine.
  2. Based on the inputs, the Shared Workflow state machine invokes the Account Collector AWS Lambda function to retrieve AWS account details from AWS Organizations.
  3. The Account Collector Lambda function assumes an AWS Identity and Access Management (IAM) role to access linked account details via the Organizations API and writes them to Amazon Simple Queue Service (Amazon SQS) queues.
  4. The SQS queues trigger the Data Collector Lambda function using SQS Lambda triggers.
  5. The Data Collector Lambda function assumes an IAM role in each linked account to retrieve the relevant data and load it into the CDH source S3 bucket.
  6. When all linked accounts data is collected, the Shared Workflow state machine triggers an AWS Glue job for further data transformation.
  7. The AWS Glue job reads raw data from the CDH source bucket and transforms it into a compact Parquet format.

Load and transform

For the data transformations, we used an open-source data transformation tool called dbt (Data Build Tool), modifying and preprocessing the data through a number of abstract data layers:

  • Source – This layer contains the raw data the data source provides. The preferred data format is Parquet, but JSON, CSV, or plain text file are also allowed.
  • Prepared – The source layer is transformed and stored as the prepared layer in Parquet format for optimized columnar access. Initial cleaning, filtering, and basic transformations are performed in this layer.
  • Semantic – A semantic layer combines several prepared layer datasets to a single dataset that contains transformations, calculations, and business logic to deliver business-friendly insights.
  • QuickSight – QuickSight is the final presentation layer, which is directly ingested into QuickSight SPICE from Athena via incremental daily ingestion queries. These ingested datasets are used as a source in CLEA dashboards.

Overall, using dbt’s data modeling and the pay-as-you-go pricing of Athena, BMW Group can control costs by running efficient queries on demand. Furthermore, with the serverless architecture of Athena and dbt’s structured transformations, you can scale data processing without worrying about infrastructure management. In CLEA there are currently more than 120 dbt models implemented with complex transformations. The semantic layer is incrementally materialized and partially ingested into QuickSight with up to 4 TB of SPICE capacity. For dbt deployment and scheduling, we use GitHub Actions which allows us to introduce new dbt models and changes easily with automatic deployments and tests.

CLEA Access control

In this section, we explain how we implemented access control using row-level security in QuickSight and QuickSight embedding for authentication and authorization.

RLS for QuickSight

Row-level security (RLS) is a key feature that governs data access and privacy, which we implemented for CLEA. RLS is a mechanism that allows us to control the visibility of data at the row level based on user attributes. In essence, it ensures that users can only access the data that they are authorized to view, adding an additional layer of data protection within the QuickSight environment.

Understanding the importance of RLS requires a broader view of the data landscape. In organizations where multiple users interact with the same datasets but require different access levels due to their roles, RLS becomes a pivotal tool. It ensures data security and compliance with privacy regulations, preventing unauthorized access to sensitive data. Additionally, it offers a tailored user experience by displaying only relevant data to the user, thereby enhancing the effectiveness of data analysis.

For CLEA, we collected BMW Group metadata such as department, application, and organization, which are quite important to allow users to only see the accounts within their department, application, organization, and so on. This is achieved using both a user name and group name for access control. We use the user name for user-specific access control and the group name for adding some users to a specific group to extend their permissions for different use cases.

Lastly, because there are many dashboards created by CLEA, we also control which users a unique user can see and also the data itself in the dashboard. This is done at the group level. By default, all users are assigned to CLEA-READER, which is granted access to core dashboards that we want to share with users, but there are different groups that allow users to see additional dashboards after they’re assigned to that group.

The RLS dataset is refreshed daily to catch recent changes regarding new user additions, group changes, or any other user access changes. This dataset is also ingested to SPICE daily, which automatically updates all datasets restricted via this RLS dataset.

QuickSight embedding

CLEA is a cross-platform application that provides secure access to QuickSight embedded content with custom-built authentication and authorization logic that sits on top of BMW Group identity and role management services (referred to as BMW IAM).

CLEA provides access to sensitive data to multiple users with different permissions, which is why it is designed with fine-grained access control rules. It enforces access control using role-based access control (RBAC) and attribute-based access control (ABAC) models at two different levels:

  • At the dashboard level via QuickSight user groups (RBAC)
  • At the dashboard data level via QuickSight RLS (RBAC and ABAC)

Dashboard-level permissions define the list of dashboards users are able to visualize.

Dashboard data-level permissions define the subsets of dashboard data shown to the user and are applied using RLS with the user attributes mentioned earlier. Although the majority of roles defined in CLEA are used for dashboard-level permissions, some specific roles are strategically defined to grant permissions at the dashboard data level, taking priority over the ABAC model.

BMW has a defined set of guidelines suggesting the usage of their IAM services as the single source of truth for identity and access control, which the team took into careful consideration when designing the authentication and authorization processes for CLEA.

Upon their first login, users are automatically registered in CLEA and assigned a base role that grants them access to a basic set of dashboards.

The process of registering users in CLEA consists of mapping a user’s identity as retrieved from BMW’s identity provider (IdP) to a QuickSight user, then assigning the newly created user to the respective QuickSight user group.

For users that require more extensive permissions (at one of the levels mentioned before), it is possible to order additional role assignments via BMW’s self-service portal for role management. Authorized reviewers will then review it and either accept or reject the role assignments.

Role assignments will take effect the next time the user logs in, at which time the user’s assigned roles in BMW Group IAM are synced to the user’s QuickSight groups—internally referred to as the identity and permissions sync. As shown in the following diagram, the sync groups step calculates which users’ group memberships should be kept, created, and deleted following the logic.

Usage Insights

Amazon CloudWatch plays an indispensable role in enhancing the efficiency and usability of CLEA dashboards. Not only does CloudWatch offer real-time monitoring of AWS resources, but it also allows to track user activity and dashboard utilization. By analyzing usage metrics and logs, we can see who has logged in to the CLEA dashboards, what features are most frequently accessed, and how long users interact with various elements. These insights are invaluable for making data-driven decisions on how to improve the dashboards for a better user experience. Through the intuitive interface of CloudWatch, it’s possible to set up alarms for alerting about abnormal activities or performance issues. Ultimately, employing CloudWatch for monitoring offers a comprehensive view of both system health and user engagement, helping us refine and enhance our dashboards continually.

Conclusion

BMW Group’s CLEA platform offers a comprehensive and effective solution to manage and optimize cloud resources. By providing full transparency into cloud costs, usage, and efficiency, CLEA offers insights from high-level overviews to granular details at the service, resource, and operational level.

CLEA aggregates data from various sources, enabling a detailed roadmap of the cloud operations, tracking footprints across primes, departments, products, applications, resources, and tags. This dynamic vision helps identify trends, anticipate future needs, and make strategic decisions.

Future plans for CLEA include enhancing capabilities with data consistency and accuracy, integrating additional sources like Amazon S3 Storage Lens for deeper insights, and introducing Amazon QuickSight Q for intelligent recommendations powered by machine learning, further streamlining cloud operations.

By following the practices here, you can unlock the potential of efficient cloud resource management by implementing Cloud Intelligence Dashboards, providing you with precise insights into costs, savings, and operational effectiveness.


About the Authors

Philipp Karg is Lead FinOps Engineer at BMW Group and founder of the CLEA platform. He focus on boosting cloud efficiency initiatives and establishing a cost-aware culture within the company to ultimately leverage the cloud in a sustainable way.

Alex Gutfreund is Head of Product and Technology Integration at the BMW Group. He spearheads the digital transformation with a particular focus on platforms ecosystems and efficiencies. With extensive experience at the interface of business and IT, he drives change and makes an impact in various organizations. His industry knowledge spans from automotive, semiconductor, public transportation, and renewable energies.

Cizer Pereira is a Senior DevOps Architect at AWS Professional Services. He works closely with AWS customers to accelerate their journey to the cloud. He has a deep passion for Cloud Native and DevOps, and in his free time, he also enjoys contributing to open-source projects.

Selman Ay is a Data Architect in the AWS Professional Services team. He has worked with customers from various industries such as e-commerce, pharma, automotive and finance to build scalable data architectures and generate insights from the data. Outside of work, he enjoys playing tennis and engaging in outdoor activities.

Nick McCarthy is a Senior Machine Learning Engineer in the AWS Professional Services team. He has worked with AWS clients across various industries including healthcare, finance, sports, telecoms and energy to accelerate their business outcomes through the use of AI/ML. Outside of work Nick loves to travel, exploring new cuisines and cultures in the process.

Miguel Henriques is a Cloud Application Architect in the AWS Professional Services team with 4 years of experience in the automotive industry delivering cloud native solutions. In his free time, he is constantly looking for advancements in the web development space and searching for the next great pastel de nata.
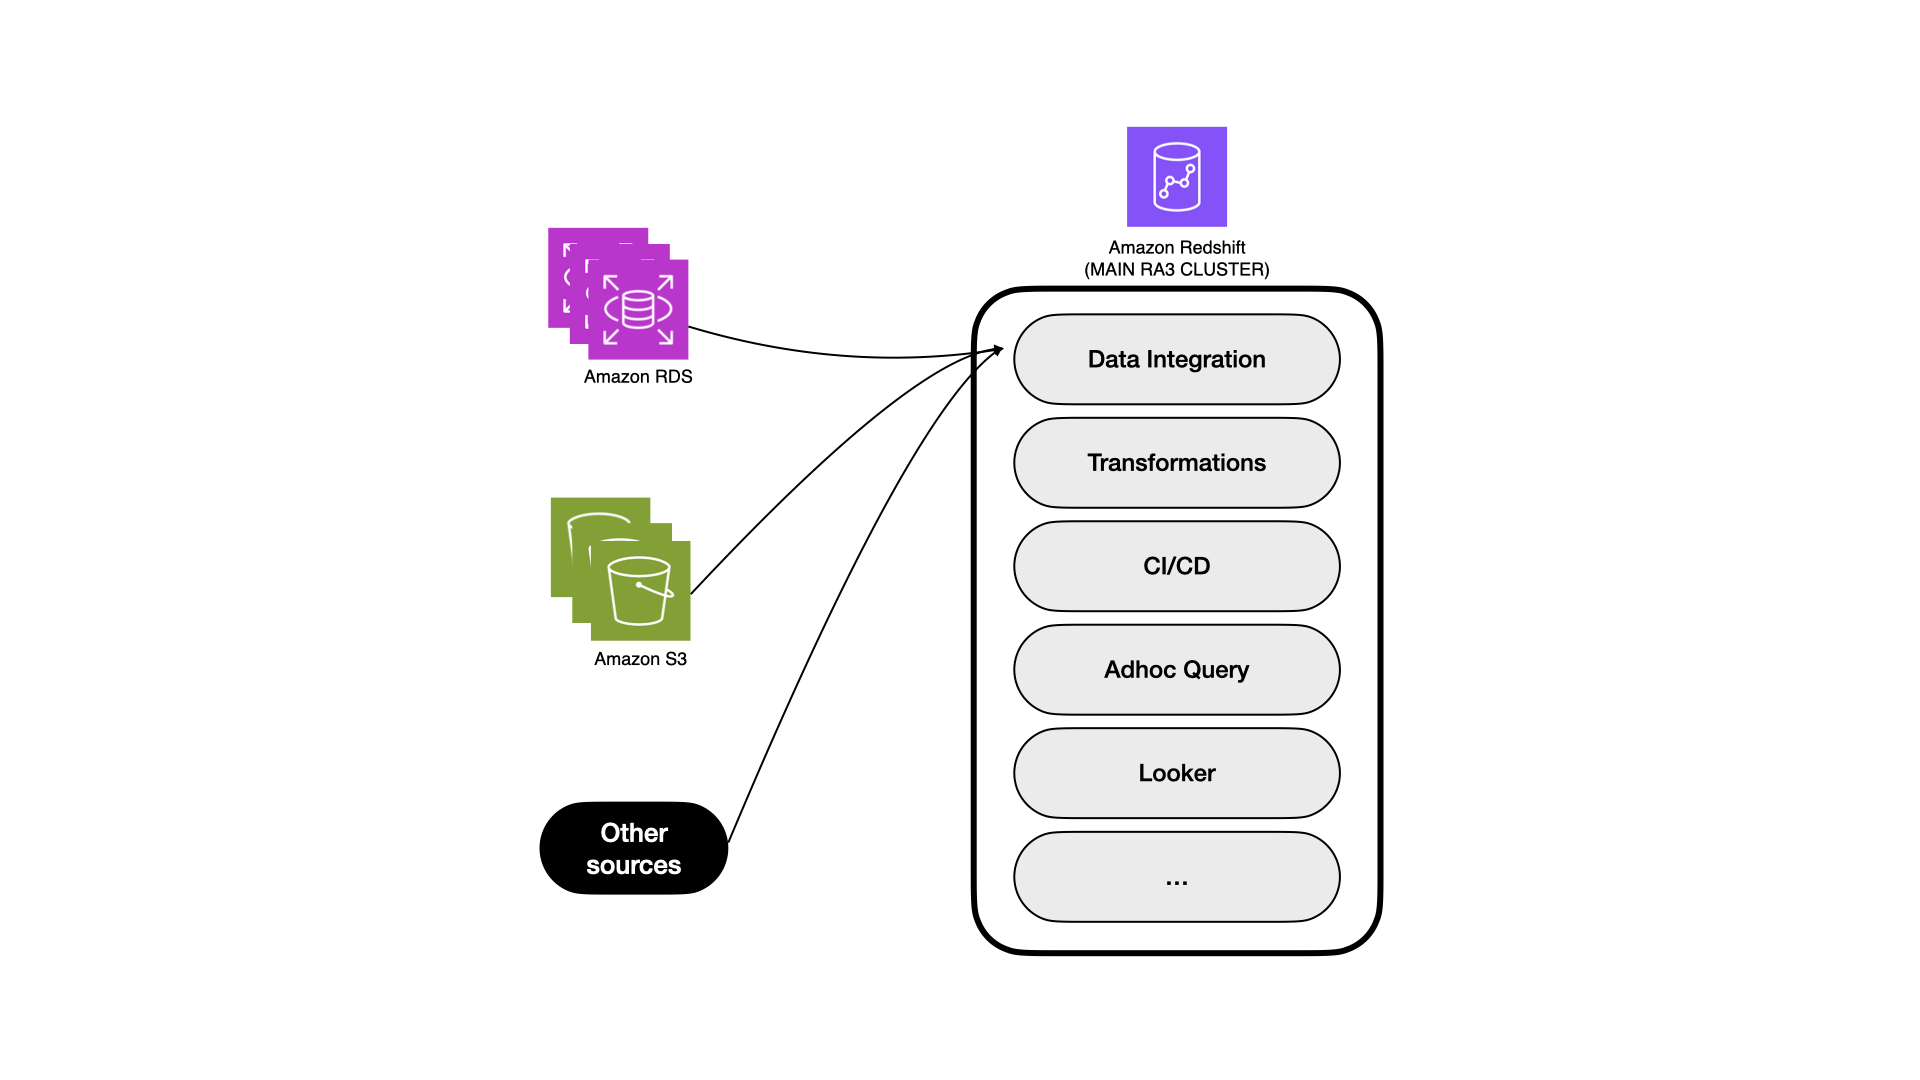
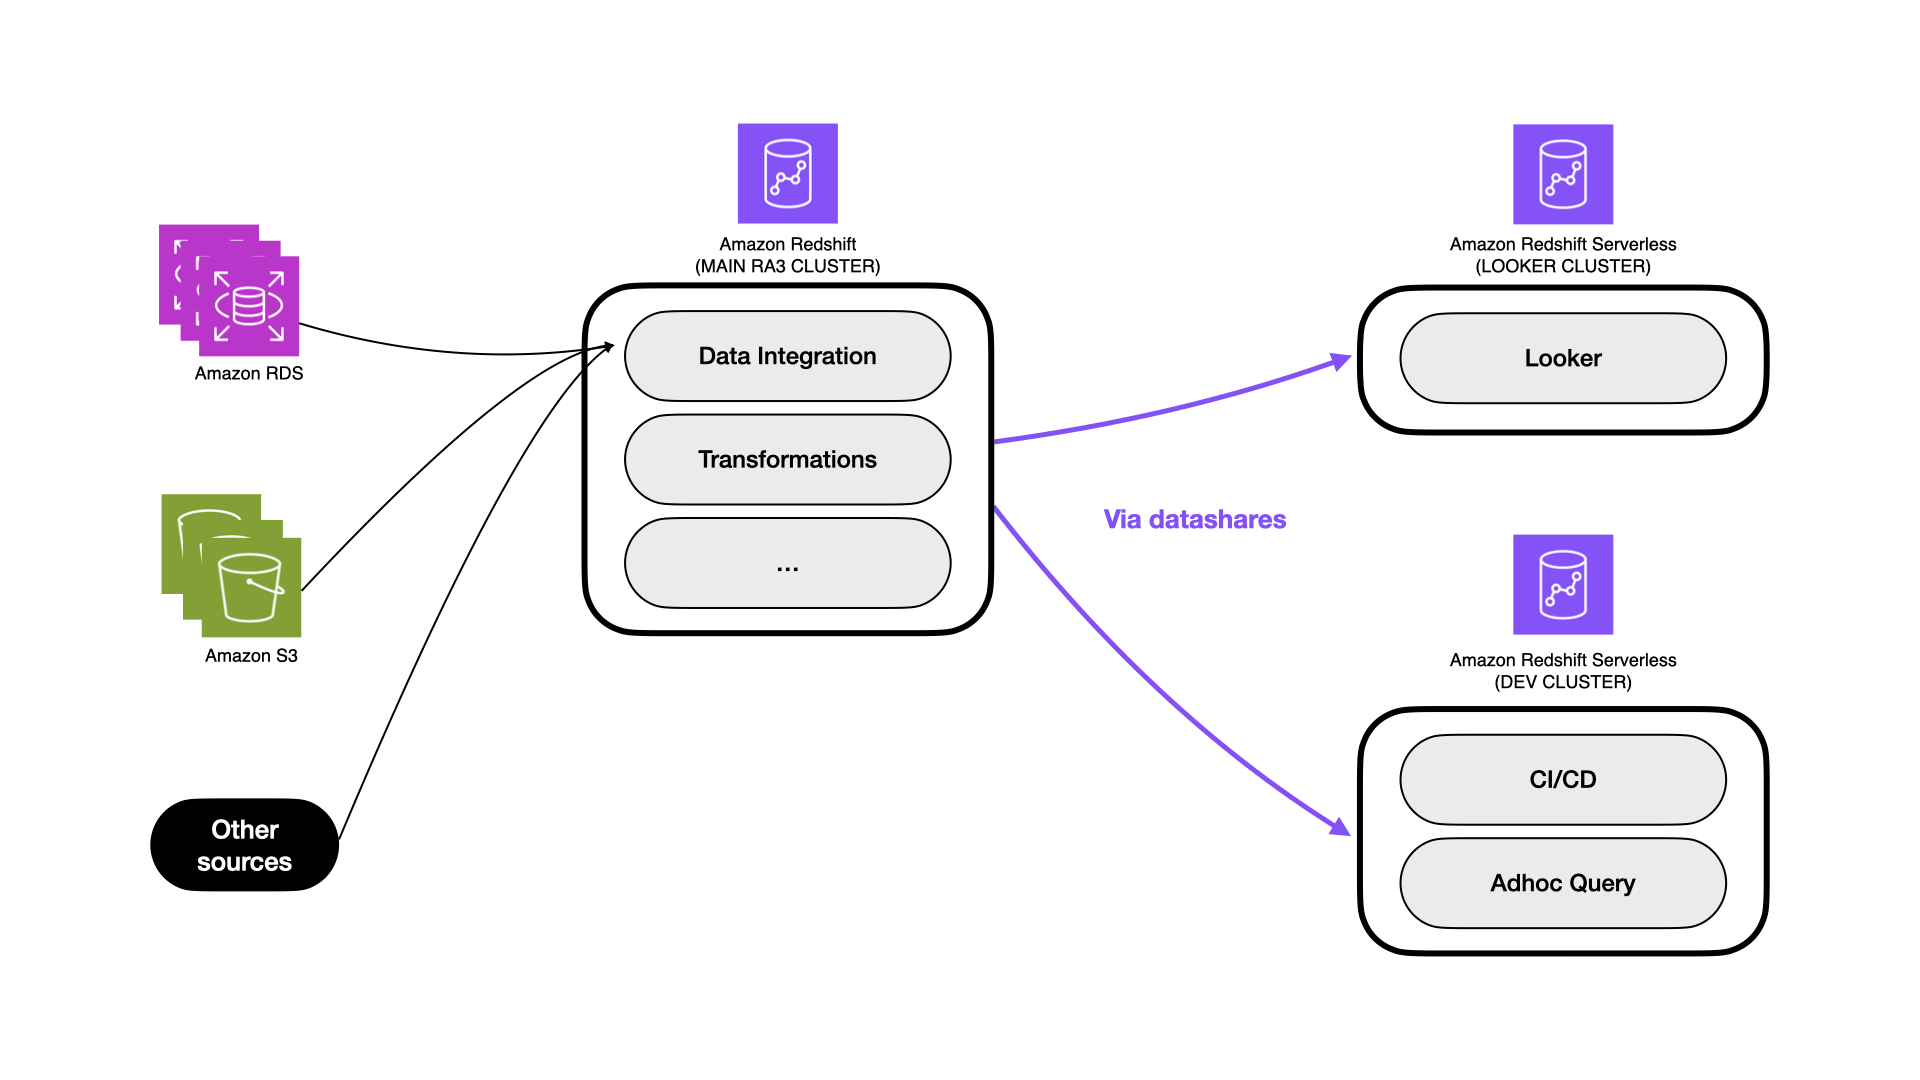
How Wallapop improved performance of analytics workloads with Amazon Redshift Serverless and data sharing

Post Syndicated from Eduard Lopez original https://aws.amazon.com/blogs/big-data/how-wallapop-improved-performance-of-analytics-workloads-with-amazon-redshift-serverless-and-data-sharing/

Amazon Redshift is a fast, fully managed cloud data warehouse that makes it straightforward and cost-effective to analyze all your data at petabyte scale, using standard SQL and your existing business intelligence (BI) tools. Today, tens of thousands of customers run business-critical workloads on Amazon Redshift.

Amazon Redshift Serverless makes it effortless to run and scale analytics workloads without having to manage any data warehouse infrastructure.

Redshift Serverless automatically provisions and intelligently scales data warehouse capacity to deliver fast performance for even the most demanding and unpredictable workloads, and you pay only for what you use.

This is ideal when it’s difficult to predict compute needs such as variable workloads, periodic workloads with idle time, and steady-state workloads with spikes. As your demand evolves with new workloads and more concurrent users, Redshift Serverless automatically provisions the right compute resources, and your data warehouse scales seamlessly and automatically.

Amazon Redshift data sharing allows you to securely share live, transactionally consistent data in one Redshift data warehouse with another Redshift data warehouse (provisioned or serverless) across accounts and Regions without needing to copy, replicate, or move data from one data warehouse to another.

Amazon Redshift data sharing enables you to evolve your Amazon Redshift deployment architectures into a hub-and-spoke or data mesh model to better meet performance SLAs, provide workload isolation, perform cross-group analytics, and onboard new use cases, all without the complexity of data movement and data copies.

In this post, we show how Wallapop adopted Redshift Serverless and data sharing to modernize their data warehouse architecture.

Wallapop’s initial data architecture platform

Wallapop is a Spanish ecommerce marketplace company focused on second-hand items, founded in 2013. Every day, they receive around 300,000 new items from buyers to be added to their catalog. The marketplace can be accessed via mobile app or website.

The average monthly traffic is around 15 million active users. Since its creation in 2013, it has reached more than 40 million downloads and more than 700 million products have been listed.

Amazon Redshift plays a central role in their data platform on AWS for ingestion, ETL (extract, transform, and load), machine learning (ML), and consumption workloads that run their insight consumption to drive decision-making.

The initial architecture is composed of one main Redshift provisioned cluster that handled all the workloads, as illustrated in the following diagram. Their cluster was deployed with 8 nodes ra3.4xlarge and concurrency scaling enabled.

Wallapop had three main areas to improve in their initial data architecture platform:

  • Workload isolation challenges with growing data volumes and new workloads running in parallel
  • Administrative burden on data engineering teams to manage the concurrent workloads, especially at peak times
  • Cost-performance ratio while scaling during peak periods

The areas of improvement mainly focused on performance of data consumption workloads along with the BI and analytics consumption tool, where high query concurrency was impacting the final analytics preparation and its insights consumption.

Solution overview

To improve their data platform architecture, Wallapop designed and built a new distributed approach with Amazon Redshift with the support of AWS.

Their cluster size of the provisioned data warehouse didn’t change. What changed was lowering the usage concurrency scaling to 1 hour, which is in the Free Tier usage for every 24 hours of using the main cluster. The following diagram illustrates the target architecture.

Solution details

The new data platform architecture combines Redshift Serverless and provisioned data warehouses with Amazon Redshift data sharing, helping Wallapop improve their overall Amazon Redshift experience with improved ease of use, performance, and optimized costs.

Redshift Serverless measures data warehouse capacity in Redshift Processing Units (RPUs). RPUs are resources used to handle workloads. You can adjust the base capacity setting from 8 RPUs to 512 RPUs in units of 8 (8, 16, 24, and so on).

The new architecture uses a Redshift provisioned cluster with RA3 nodes to run their constant and write workloads (data ingestion and transformation jobs). For cost-efficiency, Wallapop is also benefiting from Redshift reserved instances to optimize on costs for these known, predictable, and steady workloads. This cluster acts as the producer cluster in their distributed architecture using data sharing, meaning the data is ingested into the storage layer of Amazon Redshift—Redshift Managed Storage (RMS).

For the consumption part of the data platform architecture, the data is shared with different Redshift Serverless endpoints to meet the needs for different consumption workloads.

Data sharing provides workloads isolation. With this architecture, Wallapop achieves better workload isolation and ensures that only the right data is shared with the different consumption applications. Additionally, this approach avoids data duplication in their consumer part, which optimizes costs and allows better governance processes, because they only have to manage a single version of the data warehouse data instead of different copies or versions of it.

Redshift Serverless is used as a consumer part of the data platform architecture to meet those predictable and unpredictable, non-steady, and often demanding analytics workloads, such as their CI/CD jobs and BI and analytics consumption workloads coming from their data visualization application. Redshift Serverless also helps them achieve better workload isolation due to its managed auto scaling feature that makes sure performance is consistently good for these unpredictable workloads, even at peak times. It also provides a better user experience for the Wallapop data platform team, thanks to the autonomics capabilities that Redshift Serverless provides.

The new solution combining Redshift Serverless and data sharing allowed Wallapop to achieve better performance, cost, and ease of use.

Eduard Lopez, Wallapop Data Engineering Manager, shared the improved experience of analytics users: “Our analyst users are telling us that now ‘Looker flies.’ Insights consumption went up as a result of it without increasing costs.”

Evaluation of outcome

Wallapop started this re-architecture effort by first testing the isolation of their BI consumption workload with Amazon Redshift data sharing and Redshift Serverless with the support of AWS. The workload was tested using different base RPU configurations to measure the base capacity and resources in Redshift Serverless. Base RPU ranges for Redshift Serverless range from 8–512. Wallapop tested their BI workload with two configurations: 32 base RPU and 64 base RPU, after enabling data sharing from their Redshift provisioned cluster to ensure the serverless endpoints have access to the necessary datasets.

Based on the results measured 1 week before testing, the main area for improvement was the queries that took longer than 10 seconds to complete (52%), represented by the yellow, orange, and red areas of the following chart, as well as the long-running queries represented by the red area (over 600 seconds, 9%).

The first test of this workload with Redshift Serverless using a 64 base RPU configuration immediately showed performance improvement results: the queries running longer than 10 seconds were reduced by 38% and the long-running queries (over 120 seconds) were almost completely eliminated.

Javier Carbajo, Wallapop Data Engineer, says, “Providing a service without downtime or loading times that are too long was one of our main requirements since we couldn’t have analysts or stakeholders without being able to consult the data.”

Following the first set of results, Wallapop also tested with a Redshift Serverless configuration using 32 base RPU to compare the results and select the configuration that could offer them the best price-performance for this workload. With this configuration, the results were similar to the previously test run on Redshift Serverless with 64 base RPU (still showing significant performance improvement from the original results). Based on the tests, this configuration was selected for the new architecture.

Gergely Kajtár, Wallapop Data Engineer, says, “We noticed a significant increase in the daily workflows’ stability after the change to the new Redshift architecture.”

Following this first workload, Wallapop has continued expanding their Amazon Redshift distributed architecture with CI/CD workloads running on a separated Redshift Serverless endpoint using data sharing with their Redshift provisioned (RA3) cluster.

“With the new Redshift architecture, we have noticed remarkable improvements both in speed and stability. That has translated into an increase of 2 times in analytical queries, not only by analysts and data scientists but from other roles as well such as marketing, engineering, C-level, etc. That proves that investing in a scalable architecture like Redshift Serverless has a direct consequence on accelerating the adoption of data as decision-making driver in the organization.”

– Nicolás Herrero, Wallapop Director of Data & Analytics.

Conclusion

In this post, we showed you how this platform can help Wallapop to scale in the future by adding new consumers when new needs or applications require to access data.

If you’re new to Amazon Redshift, you can explore demos, other customer stories, and the latest features at Amazon Redshift. If you’re already using Amazon Redshift, reach out to your AWS account team for support, and learn more about what’s new with Amazon Redshift.


About the Authors

Eduard Lopez is the Data Engineer Manager at Wallapop. He is a software engineer with over 6 years of experience in data engineering, machine learning, and data science.

Daniel Martinez is a Solutions Architect in Iberia Digital Native Businesses (DNB), part of the worldwide commercial sales organization (WWCS) at AWS.

Jordi Montoliu is a Sr. Redshift Specialist in EMEA, part of the worldwide specialist organization (WWSO) at AWS.

Ziad Wali is an Acceleration Lab Solutions Architect at Amazon Web Services. He has over 10 years of experience in databases and data warehousing, where he enjoys building reliable, scalable, and efficient solutions. Outside of work, he enjoys sports and spending time in nature.

Semir Naffati is a Sr. Redshift Specialist Solutions Architect in EMEA, part of the worldwide specialist organization (WWSO) at AWS.

How GamesKraft uses Amazon Redshift data sharing to support growing analytics workloads

Post Syndicated from Anshuman Varshney original https://aws.amazon.com/blogs/big-data/how-gameskraft-uses-amazon-redshift-data-sharing-to-support-growing-analytics-workloads/

This post is co-written by Anshuman Varshney, Technical Lead at Gameskraft.

Gameskraft is one of India’s leading online gaming companies, offering gaming experiences across a variety of categories such as rummy, ludo, poker, and many more under the brands RummyCulture, Ludo Culture, Pocket52, and Playship. Gameskraft holds the Guinness World Record for organizing the world’s largest online rummy tournament, and is one of India’s first gaming companies to build an ISO certified platform.

Amazon Redshift is a fully managed data warehousing service that offers both provisioned and serverless options, making it more efficient to run and scale analytics without having to manage your data warehouse. Amazon Redshift enables you to use SQL to analyze structured and semi-structured data across data warehouses, operational databases, and data lakes, using AWS-designed hardware and machine learning (ML) to deliver the best price-performance at scale.

In this post, we show how Gameskraft used Amazon Redshift data sharing along with concurrency scaling and WLM optimization to support its growing analytics workloads.

Amazon Redshift use case

Gameskraft used Amazon Redshift RA3 instances with Redshift Managed Storage (RMS) for their data warehouse. The upstream data pipeline is a robust system that integrates various data sources, including Amazon Kinesis and Amazon Managed Streaming for Apache Kafka (Amazon MSK) for handling clickstream events, Amazon Relational Database Service (Amazon RDS) for delta transactions, and Amazon DynamoDB for delta game-related information. Additionally, data is extracted from vendor APIs that includes data related to product, marketing, and customer experience. All of this diverse data is then consolidated into the Amazon Simple Storage Service (Amazon S3) data lake before being uploaded to the Redshift data warehouse. These upstream data sources constitute the data producer components.

Gameskraft used Amazon Redshift workload management (WLM) to manage priorities within workloads, with higher priority being assigned to the extract, transform, and load (ETL) queue that runs critical jobs for data producers. The downstream consumers consist of business intelligence (BI) tools, with multiple data science and data analytics teams having their own WLM queues with appropriate priority values.

As Gameskraft’s portfolio of gaming products increased, it led to an approximate five-times growth of dedicated data analytics and data science teams. Consequently, there was a fivefold rise in data integrations and a fivefold increase in ad hoc queries submitted to the Redshift cluster. These query patterns and concurrency were unpredictable in nature. Also, over time the number of BI dashboards (both scheduled and live) increased, which contributed to more queries being submitted to the Redshift cluster.

With this growing workload, Gameskraft was observing the following challenges:

  • Increase in critical ETL job runtime
  • Increase in query wait time in multiple queues
  • Impact of unpredictable ad hoc query workloads across other queues in the cluster

Gameskraft was looking for a solution that would help them mitigate all these challenges, and provide flexibility to scale ingestion and consumption workload processing independently. Gameskraft was also looking for a solution that would cater to their unpredictable future growth.

Solution overview

Gameskraft tackled these challenges in a phased manner using Amazon Redshift concurrency scaling, Amazon Redshift data sharing, Amazon Redshift Serverless, and Redshift provisioned clusters.

Amazon Redshift concurrency scaling lets you easily support thousands of concurrent users and concurrent queries, with consistently fast query performance. As concurrency increases, Amazon Redshift automatically adds query processing power in seconds to process queries without any delays. When the workload demand subsides, this extra processing power is automatically removed, so you pay only for the time when concurrency scaling clusters are in use. Amazon Redshift offers 1 hour of free concurrency scaling credits per active cluster per day, allowing you to accumulate 30 hours of free credits per month.

Gameskraft enabled concurrency scaling in selective WLM queues to ease the query wait time in those queues during peak usage and also helped reduce ETL query runtime. In the prior setup, we maintained four specialized queues for ETL, ad hoc queries, BI tools, and data science. To prevent blockages for other processes, we imposed minimal query timeouts using query monitoring rules (QMR). However, both the ETL and BI tools queues were persistently occupied, impacting the performance of the remaining queues.

Concurrency scaling helped alleviate query wait time in the ad hoc query queue. Still, the challenge of downstream consumption workloads (like ad hoc queries) impacting ingestion persisted, and Gameskraft was looking for a solution to manage these workloads independently.

The following table summarizes the workload management configuration prior to the solution implementation.

Queue Usage Concurrency Scaling Mode Concurrency on Main / Memory % Query Monitoring Rules
etl For ingestion from multiple data integration off auto Stop action on:
Query runtime (seconds) > 2700
report For scheduled reporting purposes off auto Stop action on:
Query runtime (seconds) > 600
datascience For data science workloads off auto Stop action on:
Query runtime (seconds) > 300
readonly For ad hoc and day-to-day analysis auto auto Stop action on:
Query runtime (seconds) > 120
bi_tool For BI tools auto auto Stop action on:
Query runtime (seconds) > 300

To achieve flexibility in scaling, Gameskraft used Amazon Redshift data sharing. Amazon Redshift data sharing allows you to extend the ease of use, performance, and cost benefits offered by a single cluster to multi-cluster deployments while being able to share data. Data sharing enables instant, granular, and fast data access across Amazon Redshift data warehouses without the need to copy or move it. Data sharing provides live access to data so that users always observe the most up-to-date and consistent information as it’s updated in the data warehouse. You can securely share live data across provisioned clusters, serverless endpoints within AWS account, across AWS accounts, and across AWS Regions.

Data sharing builds on Redshift Managed Storage (RMS), which underpins RA3 provisioned clusters and serverless workgroups, allowing multiple warehouses to query the same data with separate isolated compute. Queries accessing shared data run on the consumer cluster and read data from RMS directly without impacting the performance of the producer cluster. You can now rapidly onboard workloads with diverse data access patterns and SLA requirements and not be concerned about resource contention.

We chose to run all ETL workloads in the primary producer cluster to manage ETL independently. We used data sharing to share read-only access to data with a data science serverless workgroup, a BI provisioned cluster, an ad hoc query provisioned cluster, and a data integration serverless workgroup. Teams using these separate compute resources could then query the same data without copying the data between the producer and consumer. Additionally, we introduced concurrency scaling to the consumer queues, prioritizing BI tools, and extended the timeout for the remaining queues. These modifications notably enhanced overall efficiency and throughput.

The following table summarizes the new workload management configuration for the producer cluster.

Queue Usage Concurrency Scaling Mode Concurrency on Main / Memory % Query Monitoring Rules
etl For ingestion from multiple data integration auto auto Stop action on:
Query runtime (seconds) > 3600

The following table summarizes the new workload management configuration for the consumer cluster.

Queue Usage Concurrency Scaling Mode Concurrency on Main / Memory % Query Monitoring Rules
report For scheduled reporting purposes off auto Stop action on:
Query runtime (seconds) > 1200
Query queue time (seconds) > 1800
Spectrum scan row count (rows) > 100000
Spectrum scan (MB) > 3072
datascience For data science workloads off auto Stop action on:
Query runtime (seconds) > 600
Query queue time (seconds) > 1800
Spectrum scan row count (rows) > 100000
Spectrum scan (MB) > 3072
readonly For ad hoc and day-to-day analysis auto auto Stop action on:
Query runtime (seconds) > 900
Query queue time (seconds) > 3600
Spectrum scan (MB) > 3072
Spectrum scan row count (rows) > 100000
bi_tool_live For live BI tools auto auto Stop action on:
Query runtime (seconds) > 900
Query queue time (seconds) > 1800
Spectrum scan (MB) > 1024
Spectrum scan row count (rows) > 1000
bi_tool_schedule For scheduled BI tools auto auto Stop action on:
Query runtime (seconds) > 1800
Query queue time (seconds) > 3600
Spectrum scan (MB) > 1024
Spectrum scan row count (rows) > 1000

Solution implementation

Gameskraft is dedicated to maintaining uninterrupted system operations, prioritizing seamless solutions over downtime. In pursuit of this principle, strategic measures were undertaken to ensure a smooth migration process towards enabling data sharing, which included the following steps:

  • Planning:
    • Replicating users and groups to the consumer, to mitigate potential access complications for analytics, data science, and BI teams.
    • Establishing a comprehensive setup within the consumers, encompassing essential components like external schemas for Amazon Redshift Spectrum.
    • Fine-tuning WLM configurations tailored to the consumer’s requirements.
  • Implementation:
    • Introducing insightful monitoring dashboards in Grafana for CPU utilization, read/write throughputs, IOPS, and latencies specific to the consumer cluster, enhancing oversight capabilities.
    • Changing all interleaved key tables on the producer cluster to compound sortkey tables to seamlessly transition data.
    • Creating an external schema from the data share database on the consumer, mirroring that of the producer cluster with identical names. This approach minimizes the need for making query adjustments in multiple locations.
  • Testing:
    • Conducting an internal week-long regression testing and auditing process to meticulously validate all data points by running the same workload and twice the workload.
  • Final changes:
    • Updating the DNS record for the cluster endpoint, which included replacing the consumer cluster’s endpoint to the same domain as the producer cluster’s endpoint, to streamline connections and avoid making changes in multiple places.
    • Ensuring data security and access control by revoking group and user privileges from the producer cluster.

The following diagram illustrates the Gameskraft Amazon Redshift data sharing architecture.

This diagram illustrates the Gameskraft Amazon Redshift data sharing architecture

The following diagram illustrates the Amazon Redshift data sharing architecture with multiple consumer clusters.

This diagram illustrates the Amazon Redshift data sharing architecture with multiple consumer clusters.

With data sharing implementation, Gameskraft was able to isolate the producer and consumer workloads. Data sharing also provided the flexibility to independently scale the producer and consumer data warehouses.

The implementation of the overall solution helped Gameskraft support more frequent data refresh (43% reduction in overall job runtime) for its ETL workload, which runs on the producer cluster, along with capabilities to support a growing (five-times increase in users, BI workloads, and ad hoc queries) and unpredictable consumer workload.

The following dashboards show some of the critical ETL pipeline runtimes (before solution implementation and after solution implementation).

The first shows the delta P1/P2/P3 job runs before and after solution implementation (duration in minutes).

This screenshot shows the delta P1/P2/P3 job runs before and after solution implementation (duration in minutes).

The following shows the daily event ETL P1/P2/P3 job runs before and after solution implementation (duration in minutes).

This screenshot shows the daily event ETL P1/P2/P3 job runs before and after solution implementation (duration in minutes).

Key considerations

Gameskraft embraces a modern data architecture, with the data lake residing in Amazon S3. To grant seamless access to the data lake, we use the innovative capabilities of Redshift Spectrum, which is a bridge between the data warehouse (Amazon Redshift) and data lake (Amazon S3). It allows you to perform data transformations and analysis directly on data stored in Amazon S3, without having to duplicate the data into your Redshift cluster.

Gameskraft had a couple of key learnings while implementing this data sharing solution:

  • First, as of this writing, Amazon Redshift data sharing doesn’t support adding external schemas, tables, or late-binding views on external tables to the data share. To enable this, we have created an external schema as a pointer to AWS Glue database. The same AWS Glue database is referenced in the external schema on the consumer side.
  • Second, Amazon Redshift doesn’t support sharing tables with interleaved sort keys and views that refer to tables with interleaved sort keys. Due to the presence of interleaved sort keys across numerous tables and views, a prerequisite for inclusion into the data share involves revising the sort key configuration to use compound sort key.

Conclusion

In this post, we saw how Gameskraft used data sharing and concurrency scaling in Amazon Redshift with a producer and consumer cluster architecture to achieve the following:

  • Reduce query wait time for all queues in the producer and consumer
  • Scale the producer and consumer independently based on workload and queue requirements
  • Improve ETL pipeline performance and the data refresh cycle to support more frequent refreshes in the producer cluster
  • Onboard more queues and workloads (BI tools queue, data integration queue, data science queue, downstream team’s queue, ad hoc query queue) in the consumer without impacting the ETL pipeline in the producer cluster
  • Flexibility to use multiple consumers with a mix of provisioned Redshift cluster and Redshift Serverless

These Amazon Redshift features and architecture can help support a growing and unpredictable analytics workload.


About the Authors

Anshuman Varshney is Technical Lead at Gameskraft with a background in both backend and data engineering. He has a proven track record of leading and mentoring cross-functional teams to deliver high-performance, scalable solutions. Apart from work, he relishes moments with his family, indulges in cinematic experiences, and seizes every opportunity to explore new destinations through travel.

Prafulla Wani is an Amazon Redshift Specialist Solution Architect at AWS. He works with AWS customers on analytics architecture designs and Amazon Redshift proofs of concept. In his spare time, he plays chess with his son.

Saurov Nandy is a Solutions Architect at AWS. He works with AWS customers to design and implement solutions that solve complex business problems. In his spare time, he likes to explore new places and indulge in photography and video editing.

Shashank Tewari is a Senior Technical Account Manager at AWS. He helps AWS customers optimize their architectures to achieve performance, scale, and cost efficiencies. In his spare time, he likes to play video games with his kids. During vacations, he likes to trek on mountains and take up adventure sports.

Simplifying data processing at Capitec with Amazon Redshift integration for Apache Spark

Post Syndicated from Preshen Goobiah original https://aws.amazon.com/blogs/big-data/simplifying-data-processing-at-capitec-with-amazon-redshift-integration-for-apache-spark/

This post is cowritten with Preshen Goobiah and Johan Olivier from Capitec.

Apache Spark is a widely-used open source distributed processing system renowned for handling large-scale data workloads. It finds frequent application among Spark developers working with Amazon EMR, Amazon SageMaker, AWS Glue and custom Spark applications.

Amazon Redshift offers seamless integration with Apache Spark, allowing you to easily access your Redshift data on both Amazon Redshift provisioned clusters and Amazon Redshift Serverless. This integration expands the possibilities for AWS analytics and machine learning (ML) solutions, making the data warehouse accessible to a broader range of applications.

With the Amazon Redshift integration for Apache Spark, you can quickly get started and effortlessly develop Spark applications using popular languages like Java, Scala, Python, SQL, and R. Your applications can seamlessly read from and write to your Amazon Redshift data warehouse while maintaining optimal performance and transactional consistency. Additionally, you’ll benefit from performance improvements through pushdown optimizations, further enhancing the efficiency of your operations.

Capitec, South Africa’s biggest retail bank with over 21 million retail banking clients, aims to provide simple, affordable and accessible financial services in order to help South Africans bank better so that they can live better. In this post, we discuss the successful integration of the open source Amazon Redshift connector by Capitec’s shared services Feature Platform team. As a result of utilizing the Amazon Redshift integration for Apache Spark, developer productivity increased by a factor of 10, feature generation pipelines were streamlined, and data duplication reduced to zero.

The business opportunity

There are 19 predictive models in scope for utilizing 93 features built with AWS Glue across Capitec’s Retail Credit divisions. Feature records are enriched with facts and dimensions stored in Amazon Redshift. Apache PySpark was selected to create features because it offers a fast, decentralized, and scalable mechanism to wrangle data from diverse sources.

These production features play a crucial role in enabling real-time fixed-term loan applications, credit card applications, batch monthly credit behavior monitoring, and batch daily salary identification within the business.

The data sourcing problem

To ensure the reliability of PySpark data pipelines, it’s essential to have consistent record-level data from both dimensional and fact tables stored in the Enterprise Data Warehouse (EDW). These tables are then joined with tables from the Enterprise Data Lake (EDL) at runtime.

During feature development, data engineers require a seamless interface to the EDW. This interface allows them to access and integrate the necessary data from the EDW into the data pipelines, enabling efficient development and testing of features.

Previous solution process

In the previous solution, product team data engineers spent 30 minutes per run to manually expose Redshift data to Spark. The steps included the following:

  1. Construct a predicated query in Python.
  2. Submit an UNLOAD query via the Amazon Redshift Data API.
  3. Catalog data in the AWS Glue Data Catalog via the AWS SDK for Pandas using sampling.

This approach posed issues for large datasets, required recurring maintenance from the platform team, and was complex to automate.

Current solution overview

Capitec was able to resolve these problems with the Amazon Redshift integration for Apache Spark within feature generation pipelines. The architecture is defined in the following diagram.

The workflow includes the following steps:

  1. Internal libraries are installed into the AWS Glue PySpark job via AWS CodeArtifact.
  2. An AWS Glue job retrieves Redshift cluster credentials from AWS Secrets Manager and sets up the Amazon Redshift connection (injects cluster credentials, unload locations, file formats) via the shared internal library. The Amazon Redshift integration for Apache Spark also supports using AWS Identity and Access Management (IAM) to retrieve credentials and connect to Amazon Redshift.
  3. The Spark query is translated to an Amazon Redshift optimized query and submitted to the EDW. This is accomplished by the Amazon Redshift integration for Apache Spark.
  4. The EDW dataset is unloaded into a temporary prefix in an Amazon Simple Storage Service (Amazon S3) bucket.
  5. The EDW dataset from the S3 bucket is loaded into Spark executors via the Amazon Redshift integration for Apache Spark.
  6. The EDL dataset is loaded into Spark executors via the AWS Glue Data Catalog.

These components work together to ensure that data engineers and production data pipelines have the necessary tools to implement the Amazon Redshift integration for Apache Spark, run queries, and facilitate the unloading of data from Amazon Redshift to the EDL.

Using the Amazon Redshift integration for Apache Spark in AWS Glue 4.0

In this section, we demonstrate the utility of the Amazon Redshift integration for Apache Spark by enriching a loan application table residing in the S3 data lake with client information from the Redshift data warehouse in PySpark.

The dimclient table in Amazon Redshift contains the following columns:

  • ClientKey – INT8
  • ClientAltKey – VARCHAR50
  • PartyIdentifierNumber – VARCHAR20
  • ClientCreateDate – DATE
  • IsCancelled – INT2
  • RowIsCurrent – INT2

The loanapplication table in the AWS Glue Data Catalog contains the following columns:

  • RecordID – BIGINT
  • LogDate – TIMESTAMP
  • PartyIdentifierNumber – STRING

The Redshift table is read via the Amazon Redshift integration for Apache Spark and cached. See the following code:

import pyspark.sql.functions as F
from pyspark.sql import SQLContext
sc = # existing SparkContext
sql_context = SQLContext(sc)

secretsmanager_client = boto3.client('secretsmanager')
secret_manager_response = secretsmanager_client.get_secret_value(
    SecretId='string',
    VersionId='string',
    VersionStage='string'
)
username = # get username from secret_manager_response
password = # get password from secret_manager_response
url = "jdbc:redshift://redshifthost:5439/database?user=" + username + "&password=" + password

read_config = {
    "url": url,
    "tempdir": "s3://capitec-redshift-temp-bucket/<uuid>/",
    "unload_s3_format": "PARQUET"
}

d_client = (
    spark.read.format("io.github.spark_redshift_community.spark.redshift")
    .options(**read_config)
    .option("query", f"select * from edw_core.dimclient")
    .load()
    .where((F.col("RowIsCurrent") == 1) & (F.col("isCancelled") == 0))
    .select(
        F.col("PartyIdentifierNumber"),
        F.col("ClientCreateDate")
    )
    .cache()
)

Loan application records are read in from the S3 data lake and enriched with the dimclient table on Amazon Redshift information:

import pyspark.sql.functions as F
from awsglue.context import GlueContext
from pyspark import SparkContext

glue_ctx = GlueContext(SparkContext.getOrCreate())

push_down_predicate = (
    f"meta_extract_start_utc_ms between "
    f"'2023-07-12"
    f" 18:00:00.000000' and "
    f"'2023-07-13 06:00:00.000000'"
)

database_name="loan_application_system"
table_name="dbo_view_loan_applications"
catalog_id = # Glue Data Catalog

# Selecting only the following columns
initial_select_cols=[
            "RecordID",
            "LogDate",
            "PartyIdentifierNumber"
        ]

d_controller = (glue_ctx.create_dynamic_frame.from_catalog(catalog_id=catalog_id,
                                            database=database_name,
                                            table_name=table_name,
                                            push_down_predicate=push_down_predicate)
                .toDF()
                .select(*initial_select_cols)
                .withColumn("LogDate", F.date_format("LogDate", "yyyy-MM-dd").cast("string"))
                .dropDuplicates())

# Left Join on PartyIdentifierNumber and enriching the loan application record
d_controller_enriched = d_controller.join(d_client, on=["PartyIdentifierNumber"], how="left").cache()

As a result, the loan application record (from the S3 data lake) is enriched with the ClientCreateDate column (from Amazon Redshift).

How the Amazon Redshift integration for Apache Spark solves the data sourcing problem

The Amazon Redshift integration for Apache Spark effectively addresses the data sourcing problem through the following mechanisms:

  • Just-in-time reading – The Amazon Redshift integration for Apache Spark connector reads Redshift tables in a just-in-time manner, ensuring the consistency of data and schema. This is particularly valuable for Type 2 slowly changing dimension (SCD) and timespan accumulating snapshot facts. By combining these Redshift tables with the source system AWS Glue Data Catalog tables from the EDL within production PySpark pipelines, the connector enables seamless integration of data from multiple sources while maintaining data integrity.
  • Optimized Redshift queries – The Amazon Redshift integration for Apache Spark plays a crucial role in converting the Spark query plan into an optimized Redshift query. This conversion process simplifies the development experience for the product team by adhering to the data locality principle. The optimized queries use the capabilities and performance optimizations of Amazon Redshift, ensuring efficient data retrieval and processing from Amazon Redshift for the PySpark pipelines. This helps streamline the development process while enhancing the overall performance of the data sourcing operations.

Gaining the best performance

The Amazon Redshift integration for Apache Spark automatically applies predicate and query pushdown to optimize performance. You can gain performance improvements by using the default Parquet format used for unloading with this integration.

For additional details and code samples, refer to New – Amazon Redshift Integration with Apache Spark.

Solution Benefits

The adoption of the integration yielded several significant benefits for the team:

  • Enhanced developer productivity – The PySpark interface provided by the integration boosted developer productivity by a factor of 10, enabling smoother interaction with Amazon Redshift.
  • Elimination of data duplication – Duplicate and AWS Glue cataloged Redshift tables in the data lake were eliminated, resulting in a more streamlined data environment.
  • Reduced EDW load – The integration facilitated selective data unloading, minimizing the load on the EDW by extracting only the necessary data.

By using the Amazon Redshift integration for Apache Spark, Capitec has paved the way for improved data processing, increased productivity, and a more efficient feature engineering ecosystem.

Conclusion

In this post, we discussed how the Capitec team successfully implemented the Apache Spark Amazon Redshift integration for Apache Spark to simplify their feature computation workflows. They emphasized the importance of utilizing decentralized and modular PySpark data pipelines for creating predictive model features.

Currently, the Amazon Redshift integration for Apache Spark is utilized by 7 production data pipelines and 20 development pipelines, showcasing its effectiveness within Capitec’s environment.

Moving forward, the shared services Feature Platform team at Capitec plans to expand the adoption of the Amazon Redshift integration for Apache Spark in different business areas, aiming to further enhance data processing capabilities and promote efficient feature engineering practices.

For additional information on using the Amazon Redshift integration for Apache Spark, refer to the following resources:


About the Authors

Preshen Goobiah is the Lead Machine Learning Engineer for the Feature Platform at Capitec. He is focused on designing and building Feature Store components for enterprise use. In his spare time, he enjoys reading and traveling.

Johan Olivier is a Senior Machine Learning Engineer for Capitec’s Model Platform. He is an entrepreneur and problem-solving enthusiast. He enjoys music and socializing in his spare time.

Sudipta Bagchi is a Senior Specialist Solutions Architect at Amazon Web Services. He has over 12 years of experience in data and analytics, and helps customers design and build scalable and high-performant analytics solutions. Outside of work, he loves running, traveling, and playing cricket. Connect with him on LinkedIn.

Syed Humair is a Senior Analytics Specialist Solutions Architect at Amazon Web Services (AWS). He has over 17 years of experience in enterprise architecture focusing on Data and AI/ML, helping AWS customers globally to address their business and technical requirements. You can connect with him on LinkedIn.

Vuyisa Maswana is a Senior Solutions Architect at AWS, based in Cape Town. Vuyisa has a strong focus on helping customers build technical solutions to solve business problems. He has supported Capitec in their AWS journey since 2019.
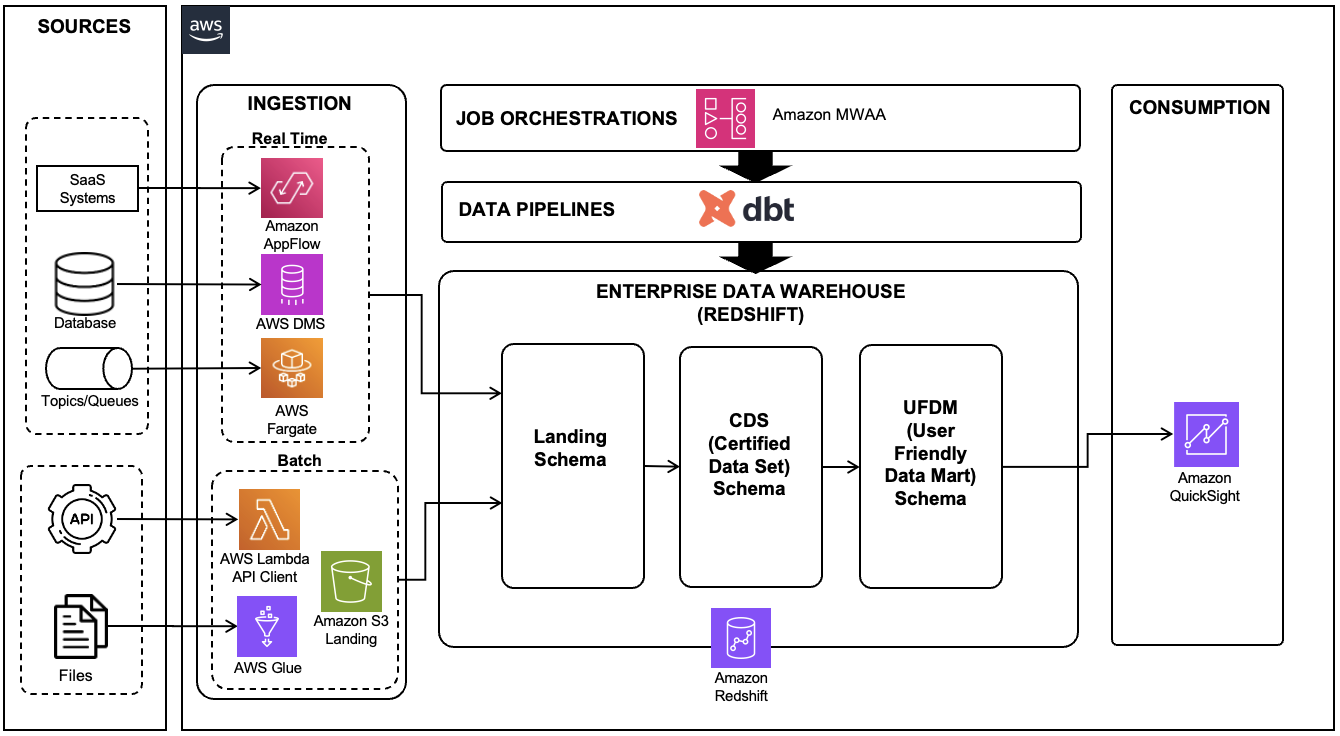
An Overview of Bulk Sender Changes at Yahoo/Gmail

Post Syndicated from Dustin Taylor original https://aws.amazon.com/blogs/messaging-and-targeting/an-overview-of-bulk-sender-changes-at-yahoo-gmail/

In a move to safeguard user inboxes, Gmail and Yahoo Mail announced a new set of requirements for senders effective from February 2024. Let’s delve into the specifics and what Amazon Simple Email Service (Amazon SES) customers need to do to comply with these requirements.

What are the new email sender requirements?

The new requirements include long-standing best practices that all email senders should adhere to in order to achieve good deliverability with mailbox providers. What’s new is that Gmail, Yahoo Mail, and other mailbox providers will require alignment with these best practices for those who send bulk messages over 5000 per day or if a significant number of recipients indicate the mail as spam.

The requirements can be distilled into 3 categories: 1) stricter adherence to domain authentication, 2) give recipients an easy way to unsubscribe from bulk mail, and 3) monitoring spam complaint rates and keeping them under a 0.3% threshold.

* This blog was originally published in November 2023, and updated on January 12, 2024 to clarify timelines, and to provide links to additional resources.

1. Domain authentication

Mailbox providers will require domain-aligned authentication with DKIM and SPF, and they will be enforcing DMARC policies for the domain used in the From header of messages. For example, gmail.com will be publishing a quarantine DMARC policy, which means that unauthorized messages claiming to be from Gmail will be sent to Junk folders.

Read Amazon SES: Email Authentication and Getting Value out of Your DMARC Policy to gain a deeper understanding of SPF and DKIM domain-alignment and maximize the value from your domain’s DMARC policy.

The following steps outline how Amazon SES customers can adhere to the domain authentication requirements:

Adopt domain identities: Amazon SES customers who currently rely primarily on email address identities will need to adopt verified domain identities to achieve better deliverability with mailbox providers. By using a verified domain identity with SES, your messages will have a domain-aligned DKIM signature.

Not sure what domain to use? Read Choosing the Right Domain for Optimal Deliverability with Amazon SES for additional best practice guidance regarding sending authenticated email. 

Configure a Custom MAIL FROM domain: To further align with best practices, SES customers should also configure a custom MAIL FROM domain so that SPF is domain-aligned.

The table below illustrates the three scenarios based on the type of identity you use with Amazon SES

Scenarios using example.com in the From header DKIM authenticated identifier SPF authenticated identifier DMARC authentication results
[email protected] as a verified email address identity amazonses.com email.amazonses.com Fail – DMARC analysis fails as the sending domain does not have a DKIM signature or SPF record that matches.
example.com as a verified domain identity example.com email.amazonses.com Success – DKIM signature aligns with sending domain which will cause DMARC checks to pass.
example.com as a verified domain identity, and bounce.example.com as a custom MAIL FROM domain example.com bounce.example.com Success – DKIM and SPF are aligned with sending domain.

Figure 1: Three scenarios based on the type of identity used with Amazon SES. Using a verified domain identity and configuring a custom MAIL FROM domain will result in both DKIM and SPF being aligned to the From header domain’s DMARC policy.

Be strategic with subdomains: Amazon SES customers should consider a strategic approach to the domains and subdomains used in the From header for different email sending use cases. For example, use the marketing.example.com verified domain identity for sending marketing mail, and use the receipts.example.com verified domain identity to send transactional mail.

Why? Marketing messages may have higher spam complaint rates and would need to adhere to the bulk sender requirements, but transactional mail, such as purchase receipts, would not necessarily have spam complaints high enough to be classified as bulk mail.

Publish DMARC policies: Publish a DMARC policy for your domain(s). The domain you use in the From header of messages needs to have a policy by setting the p= tag in the domain’s DMARC policy in DNS. The policy can be set to “p=none” to adhere to the bulk sending requirements and can later be changed to quarantine or reject when you have ensured all email using the domain is authenticated with DKIM or SPF domain-aligned authenticated identifiers.

2. Set up an easy unsubscribe for email recipients

Bulk senders are expected to include a mechanism to unsubscribe by adding an easy to find link within the message. The February 2024 mailbox provider rules will require senders to additionally add one-click unsubscribe headers as defined by RFC 2369 and RFC 8058. These headers make it easier for recipients to unsubscribe, which reduces the rate at which recipients will complain by marking messages as spam.

There are many factors that could result in your messages being classified as bulk by any mailbox provider. Volume over 5000 per day is one factor, but the primary factor that mailbox providers use is in whether the recipient actually wants to receive the mail.

If you aren’t sure if your mail is considered bulk, monitor your spam complaint rates. If the complaint rates are high or growing, it is a sign that you should offer an easy way for recipients to unsubscribe.

How to adhere to the easy unsubscribe requirement

The following steps outline how Amazon SES customers can adhere to the easy unsubscribe requirement:

Add one-click unsubscribe headers to the messages you send: Amazon SES customers sending bulk or potentially unwanted messages will need to implement an easy way for recipients to unsubscribe, which they can do using the SES subscription management feature.

Mailbox providers are requiring that large senders give recipients the ability to unsubscribe from bulk email in one click using the one-click unsubscribe header, however it is acceptable for the unsubscribe link in the message to direct the recipient to a landing page for the recipient to confirm their opt-out preferences.

To set up one-click unsubscribe without using the SES subscription management feature, include both of these headers in outgoing messages:

  • List-Unsubscribe-Post: List-Unsubscribe=One-Click
  • List-Unsubscribe: <https://example.com/unsubscribe/example>

When a recipient unsubscribes using one-click, you receive this POST request:

POST /unsubscribe/example HTTP/1.1
Host: example.com
Content-Type: application/x-www-form-urlencoded
Content-Length: 26
List-Unsubscribe=One-Click

Gmail’s FAQ and Yahoo’s FAQ both clarify that the one-click unsubscribe requirement will not be enforced until June 2024 as long as the bulk sender has a functional unsubscribe link clearly visible in the footer of each message.

Honor unsubscribe requests within 2 days: Verify that your unsubscribe process immediately removes the recipient from receiving similar future messages. Mailbox providers are requiring that bulk senders give recipients the ability to unsubscribe from email in one click, and that the senders process unsubscribe requests within two days.

If you adopt the SES subscription management feature, make sure you integrate the recipient opt-out preferences with the source of your email sending lists. If you implement your own one-click unsubscribe (for example, using Amazon API Gateway and an AWS Lambda function), make sure it designed to suppress sending to email addresses in your source email lists.

Review your email list building practices: Ensure responsible email practices by refraining from purchasing email lists, safeguarding opt-in forms from bot abuse, verifying recipients’ preferences through confirmation messages, and abstaining from automatically enrolling recipients in categories that were not requested.

Having good list opt-in hygiene is the best way to ensure that you don’t have high spam complaint rates before you adhere to the new required best practices. To learn more, read What is a Spam Trap, and Why You Should Care.

3. Monitor spam rates

Mailbox providers will require that all senders keep spam complaint rates below 0.3% to avoid having their email treated as spam by the mailbox provider. The following steps outline how Amazon SES customers can meet the spam complaint rate requirement:

Enroll with Google Postmaster Tools: Amazon SES customers should enroll with Google Postmaster Tools to monitor their spam complaint rates for Gmail recipients.

Gmail recommends spam complaint rates stay below 0.1%. If you send to a mix of Gmail recipients and recipients on other mailbox providers, the spam complaint rates reported by Gmail’s Postmaster Tools are a good indicator of your spam complaint rates at mailbox providers who don’t let you view metrics.

Enable Amazon SES Virtual Deliverability Manager: Enable Virtual Deliverability Manager (VDM) in your Amazon SES account. Customers can use VDM to monitor bounce and complaint rates for many mailbox providers. Amazon SES recommends customers to monitor reputation metrics and stay below a 0.1% complaint rate.

Segregate and secure your sending using configuration sets: In addition to segregating sending use cases by domain, Amazon SES customers should use configuration sets for each sending use case.

Using configuration sets will allow you to monitor your sending activity and implement restrictions with more granularity. You can even pause the sending of a configuration set automatically if spam complaint rates exceed your tolerance threshold.

Conclusion

These changes are planned for February 2024, but be aware that the exact timing and methods used by each mailbox provider may vary. If you experience any deliverability issues with any mailbox provider prior to February, it is in your best interest to adhere to these required best practices as a first step.

We hope that this blog clarifies any areas of confusion on this change and provides you with the information you need to be prepared for February 2024. Happy sending!

Helpful links:

Create a modern data platform using the Data Build Tool (dbt) in the AWS Cloud

Post Syndicated from Prantik Gachhayat original https://aws.amazon.com/blogs/big-data/create-a-modern-data-platform-using-the-data-build-tool-dbt-in-the-aws-cloud/

Building a data platform involves various approaches, each with its unique blend of complexities and solutions. A modern data platform entails maintaining data across multiple layers, targeting diverse platform capabilities like high performance, ease of development, cost-effectiveness, and DataOps features such as CI/CD, lineage, and unit testing. In this post, we delve into a case study for a retail use case, exploring how the Data Build Tool (dbt) was used effectively within an AWS environment to build a high-performing, efficient, and modern data platform.

dbt is an open-source command line tool that enables data analysts and engineers to transform data in their warehouses more effectively. It does this by helping teams handle the T in ETL (extract, transform, and load) processes. It allows users to write data transformation code, run it, and test the output, all within the framework it provides. dbt enables you to write SQL select statements, and then it manages turning these select statements into tables or views in Amazon Redshift.

Use case

The Enterprise Data Analytics group of a large jewelry retailer embarked on their cloud journey with AWS in 2021. As part of their cloud modernization initiative, they sought to migrate and modernize their legacy data platform. The aim was to bolster their analytical capabilities and improve data accessibility while ensuring a quick time to market and high data quality, all with low total cost of ownership (TCO) and no need for additional tools or licenses.

dbt emerged as the perfect choice for this transformation within their existing AWS environment. This popular open-source tool for data warehouse transformations won out over other ETL tools for several reasons. dbt’s SQL-based framework made it straightforward to learn and allowed the existing development team to scale up quickly. The tool also offered desirable out-of-the-box features like data lineage, documentation, and unit testing. A crucial advantage of dbt over stored procedures was the separation of code from data—unlike stored procedures, dbt doesn’t store the code in the database itself. This separation further simplifies data management and enhances the system’s overall performance.

Let’s explore the architecture and learn how to build this use case using AWS Cloud services.

Solution overview

The following architecture demonstrates the data pipeline built on dbt to manage the Redshift data warehouse ETL process.

        Figure 1 : Modern data platform using AWS Data Services and dbt

This architecture consists of the following key services and tools:

  • Amazon Redshift was utilized as the data warehouse for the data platform, storing and processing vast amounts of structured and semi-structured data
  • Amazon QuickSight served as the business intelligence (BI) tool, allowing the business team to create analytical reports and dashboards for various business insights
  • AWS Database Migration Service (AWS DMS) was employed to perform change data capture (CDC) replication from various source transactional databases
  • AWS Glue was put to work, loading files from the SFTP location to the Amazon Simple Storage Service (Amazon S3) landing bucket and subsequently to the Redshift landing schema
  • AWS Lambda functioned as a client program, calling third-party APIs and loading the data into Redshift tables
  • AWS Fargate, a serverless container management service, was used to deploy the consumer application for source queues and topics
  • Amazon Managed Workflows for Apache Airflow (Amazon MWAA) was used to orchestrate different tasks of dbt pipelines
  • dbt, an open-source tool, was employed to write SQL-based data pipelines for data stored in Amazon Redshift, facilitating complex transformations and enhancing data modeling capabilities

Let’s take a closer look at each component and how they interact in the overall architecture to transform raw data into insightful information.

Data sources

As part of this data platform, we are ingesting data from diverse and varied data sources, including:

  • Transactional databases – These are active databases that store real-time data from various applications. The data typically encompasses all transactions and operations that the business engages in.
  • Queues and topics – Queues and topics come from various integration applications that generate data in real time. They represent an instantaneous stream of information that can be used for real-time analytics and decision-making.
  • Third-party APIs – These provide analytics and survey data related to ecommerce websites. This could include details like traffic metrics, user behavior, conversion rates, customer feedback, and more.
  • Flat files – Other systems supply data in the form of flat files of different formats. These files, stored in an SFTP location, might contain records, reports, logs, or other kinds of raw data that can be further processed and analyzed.

Data ingestion

Data from various sources are grouped into two major categories: real-time ingestion and batch ingestion.

Real-time ingestion uses the following services:

  • AWS DMS AWS DMS is used to create CDC replication pipelines from OLTP (Online Transaction Processing) databases. The data is loaded into Amazon Redshift in near-real time to ensure that the most recent information is available for analysis. You can also use Amazon Aurora zero-ETL integration with Amazon Redshift to ingest data directly from OLTP databases to Amazon Redshift.
  • Fargate Fargate is used to deploy Java consumer applications that ingest data from source topics and queues in real time. This real-time data consumption can help the business make immediate and data-informed decisions. You can also use Amazon Redshift Streaming Ingestion to ingest data from streaming engines like Amazon Kinesis Data Streams or Amazon Managed Streaming for Apache Kafka (Amazon MSK) into Amazon Redshift.

Batch ingestion uses the following services:

  • Lambda – Lambda is used as a client for calling third-party APIs and loading the resultant data into Redshift tables. This process has been scheduled to run daily, ensuring a consistent batch of fresh data for analysis.
  • AWS Glue – AWS Glue is used to load files into Amazon Redshift through the S3 data lake. You can also use features like auto-copy from Amazon S3 (feature under preview) to ingest data from Amazon S3 to Amazon Redshift. However, the focus of this post is more on data processing within Amazon Redshift, rather than on the data loading process. Data ingestion, whether real time or batch, forms the basis of any effective data analysis, enabling organizations to gather information from diverse sources and use it for insightful decision-making.

Data warehousing using Amazon Redshift

In Amazon Redshift, we’ve established three schemas, each serving as a different layer in the data architecture:

  • Landing layer – This is where all data ingested by our services initially lands. It’s raw, unprocessed data straight from the source.
  • Certified dataset (CDS) layer – This is the next stage, where data from the landing layer undergoes cleaning, normalization, and aggregation. The cleansed and processed data is stored in this certified dataset schema. It serves as a reliable, organized source for downstream data analysis.
  • User-friendly data mart (UFDM) layer – This final layer uses data from the CDS layer to create data mart tables. These are specifically tailored to support BI reports and dashboards as per the business requirements. The goal of this layer is to present the data in a way that is most useful and accessible for end-users.

This layered approach to data management allows for efficient and organized data processing, leading to more accurate and meaningful insights.

Data pipeline

dbt, an open-source tool, can be installed in the AWS environment and set up to work with Amazon MWAA. We store our code in an S3 bucket and orchestrate it using Airflow’s Directed Acyclic Graphs (DAGs). This setup facilitates our data transformation processes in Amazon Redshift after the data is ingested into the landing schema.

To maintain modularity and handle specific domains, we create individual dbt projects. The nature of the data reporting—real-time or batch—affects how we define our dbt materialization. For real-time reporting, we define materialization as a view, loading data into the landing schema using AWS DMS from database updates or from topic or queue consumers. For batch pipelines, we define materialization as a table, allowing data to be loaded from various types of sources.

In some instances, we have had to build data pipelines that extend from the source system all the way to the UFDM layer. This can be accomplished using Airflow DAGs, which we discuss further in the next section.

To wrap up, it’s worth mentioning that we deploy a dbt webpage using a Lambda function and enable a URL for this function. This webpage serves as a hub for documentation and data lineage, further bolstering the transparency and understanding of our data processes.

ETL job orchestration

In our data pipeline, we follow these steps for job orchestration:

  1. Establish a new Amazon MWAA environment. This environment serves as the central hub for orchestrating our data pipelines.
  2. Install dbt in the new Airflow environment by adding the following dependency to your requirements.txt:
    boto3>=1.17.54
    botocore>=1.20.54
    dbt-redshift>=1.3.0
    dbt-postgres>=1.3.0

  3. Develop DAGs with specific tasks that call upon dbt commands to carry out the necessary transformations. This step involves structuring our workflows in a way that captures dependencies among tasks and ensures that tasks run in the correct order. The following code shows how to define the tasks in the DAG:
    #imports..
    ...
    
    #Define the begin_exec tasks
    start = DummyOperator(
        task_id='begin_exec',
        dag=dag 
    )
    
    #Define 'verify_dbt_install' task to check if dbt was installed properly
    verify = BashOperator(
        task_id='verify_dbt_install',
        dag=dag,
        bash_command='''
            echo "checking dbt version....";             
            /usr/local/airflow/.local/bin/dbt --version;
            if [ $? -gt 0 ]; then
                pip install dbt-redshift>=1.3.0;
            else
                echo "dbt already installed";
            fi
            python --version;
            echo "listing dbt...";      
            rm -r /tmp/dbt_project_home;
            cp -R /usr/local/airflow/dags/dbt_project_home /tmp;
            ls /tmp/dbt_project_home/<your_dbt_project_name>;
        '''
    )
    
    #Define ‘landing_to_cds_task’ task to copy from landing schema to cds schema
    landing_to_cds_task = BashOperator(
        task_id='landing_to_cds_task', 
        dag = dag,
        bash_command='''        
            /usr/local/airflow/.local/bin/dbt run --project-dir /tmp/dbt_project_home/<your_dbt_project_name> --profiles-dir /tmp/dbt_project_home/ --select <model_folder_name>.*;
        '''
    )
    
    ...
    #Define data quality check task to test a package, generate docs and copy the docs to required S3 location
    data_quality_check = BashOperator(
        task_id='data_quality_check',
        dag=dag,
        bash_command='''    
       	  /usr/local/airflow/.local/bin/dbt test –-select your_package.*               
            /usr/local/airflow/.local/bin/dbt docs generate --project-dir /tmp/dbt_project_home/<your_project_name> --profiles-dir /tmp/dbt_project_home/;        
            aws s3 cp /tmp/dbt_project_home/<your_project_name>/target/ s3://<your_S3_bucket_name>/airflow_home/dags/dbt_project_home/<your_project_name>/target --recursive;
        '''
    )

  4. Create DAGs that solely focus on dbt transformation. These DAGs handle the transformation process within our data pipelines, harnessing the power of dbt to convert raw data into valuable insights.
    #This is how we define the flow 
    start >> verify >> landing_to_cds_task >> cds_to_ufdm_task >> data_quality_check >> end_exec

The following image shows how this workflow would be seen on the Airflow UI .

  1. Create DAGs with AWS Glue for ingestion. These DAGs use AWS Glue for data ingestion tasks. AWS Glue is a fully managed ETL service that makes it easy to prepare and load data for analysis. We create DAGs that orchestrate AWS Glue jobs for extracting data from various sources, transforming it, and loading it into our data warehouse.
          #Create boto3 client for Glue 
          glue_client = boto3.client('glue', region_name='us-east-1')
    
          #Define callback function to start the Glue job using boto3 client 
          def run_glue_ingestion_job():
       glue_client.start_job_run(JobName='glue_ingestion_job')  
    
    #Define the task for glue job for ingestion
       glue_job_step = PythonOperator(
           task_id=’glue_task_for_source_to_landing’, 
           python_callable=run_glue_ingestion_job
       )
    #This is how we define the flow 
    start >> verify >> glue_task_for_source_to_landing >> landing_to_cds_task >> cds_to_ufdm_task >> data_quality_check >> end_exec
    

The following image shows how this workflow would be seen on the Airflow UI.

  1. Create DAGs with Lambda for ingestion. Lambda lets us run code without provisioning or managing servers. These DAGs use Lambda functions to call third-party APIs and load data into our Redshift tables, which can be scheduled to run at certain intervals or in response to specific events.
    #Create boto3 client for Lambda 
    lambda_client = boto3.client('lambda')
    
    #Define callback function to invoke the lambda function using boto3 client 
    def run_lambda_ingestion_job():
       Lambda_client.invoke(FunctionName='<funtion_arn>')
    )  
    
    #Define the task for glue job for ingestion
    glue_job_step = PythonOperator(
       task_id=’lambda_task_for_api_to_landing’, 
       python_callable=run_lambda_ingestion_job
    )

The following image shows how this workflow would be seen on the Airflow UI.

We now have a comprehensive, well-orchestrated process that uses a variety of AWS services to handle different stages of our data pipeline, from ingestion to transformation.

Conclusion

The combination of AWS services and the dbt open-source project provides a powerful, flexible, and scalable solution for building modern data platforms. It’s a perfect blend of manageability and functionality, with its easy-to-use, SQL-based framework and features like data quality checks, configurable load types, and detailed documentation and lineage. Its principles of “code separate from data” and reusability make it a convenient and efficient tool for a wide range of users. This practical use case of building a data platform for a retail organization demonstrates the immense potential of AWS and dbt for transforming data management and analytics, paving the way for faster insights and informed business decisions.

For more information about using dbt with Amazon Redshift, see Manage data transformations with dbt in Amazon Redshift.


About the Authors

Prantik Gachhayat is an Enterprise Architect at Infosys having experience in various technology fields and business domains. He has a proven track record helping large enterprises modernize digital platforms and delivering complex transformation programs. Prantik specializes in architecting modern data and analytics platforms in AWS. Prantik loves exploring new tech trends and enjoys cooking.

Ashutosh Dubey is a Senior Partner Solutions Architect and Global Tech leader at Amazon Web Services based out of New Jersey, USA. He has extensive experience specializing in the Data and Analytics and AIML field including generative AI, contributed to the community by writing various tech contents, and has helped Fortune 500 companies in their cloud journey to AWS.

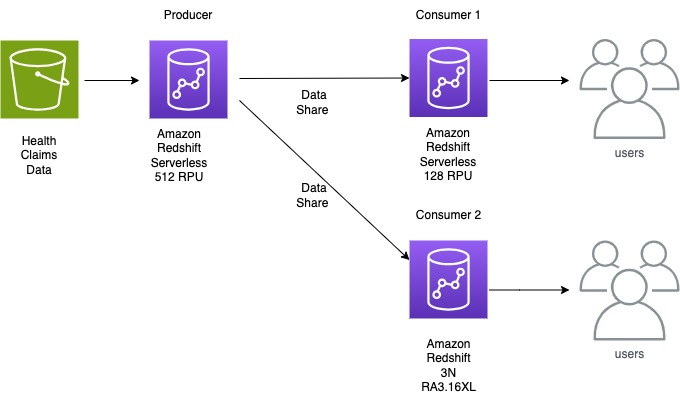
How Gilead used Amazon Redshift to quickly and cost-effectively load third-party medical claims data

Post Syndicated from Rajiv Arora original https://aws.amazon.com/blogs/big-data/how-gilead-used-amazon-redshift-to-quickly-and-cost-effectively-load-third-party-medical-claims-data/

This post was co-written with Rajiv Arora, Director of Data Science Platform at Gilead Life Sciences.

Gilead Sciences, Inc. is a biopharmaceutical company committed to advancing innovative medicines to prevent and treat life-threatening diseases, including HIV, viral hepatitis, inflammation, and cancer. A leader in virology, Gilead historically relied on these drugs for growth but now through strategic investments, Gilead is expanding and increasing their focus in oncology, having acquired Kite and Immunomedics to boost their exposure to cell therapy and non-cell therapy, making it the primary growth engine. Because Gilead is expanding into biologics and large molecule therapies, and has an ambitious goal of launching 10 innovative therapies by 2030, there is heavy emphasis on using data with AI and machine learning (ML) to accelerate the drug discovery pipeline.

Amazon Redshift Serverless is a fully managed cloud data warehouse that allows you to seamlessly create your data warehouse with no infrastructure management required. You pay only for the compute resources and storage that you use. Redshift Serverless measures data warehouse capacity in Redshift Processing Units (RPUs), which are part of the compute resources. All of the data stored in your warehouse, such as tables, views, and users, make up a namespace in Redshift Serverless.

One of the benefits of Redshift Serverless is that you don’t need to size your data warehouse for your peak workload. The peak workload includes loading periodic large datasets in multi-terabyte range. You can set a base RPU from 8 up to 512 and Redshift Serverless will automatically scale the RPUs to meet your workload demands. This makes it straightforward to manage your data warehouse in a cost-effective manner.

In this post, we share how Gilead collaborated with AWS to redesign their data ingestion process. They used Redshift Serverless as their data producer to load third-party medical claims data in a fast and cost-effective way, reducing load times from days to hours.

Gilead use case

Gilead loads a variety of data from hundreds of sources to their R&D data environment. They recently needed to do a monthly load of 140 TB of uncompressed healthcare claims data in under 24 hours after receiving it to provide analysts and data scientists with up-to-date information on a patient’s healthcare journey. This data volume is expected to increase monthly and is fully refreshed each month. The 3-node RA3 16XL provisioned cluster that had previously been hosting their warehouse was taking around 12 hours to ingest this data to Amazon Redshift, and Gilead was looking to optimize the data ingestion process in a more dynamic manner. Working with Amazon Redshift specialists from AWS, Gilead chose Redshift Serverless as a way to cost-effectively load this data and then use Redshift data sharing to share the final dataset to two additional Redshift data warehouses for end-user queries.

Loading data is a key process for any analytical system, including Amazon Redshift. When loading very large datasets, it’s important to not only load the data as quickly as possible but also in a way that optimizes the consumption queries.

Gilead’s healthcare claims data took 40 hours to load, which meant delays in using the data for downstream processes. The teams sought improvements, targeting a maximum 24-hour SLA for the load. They achieved the load in 8 hours, an 80% reduction in time to make data available.

Solution overview

After collaborating, the Gilead and AWS teams decided on a two-step process to load the data to Amazon Redshift. First, the data was loaded without a distkey and sortkey, which let the load process use the full parallel resources of the cluster. Then we used a deep copy to redistribute this data and add the desired distribution and sort characteristics.

The solution uses Redshift Serverless. The team wanted to ingest data to meet the required SLA, and the following approaches were benchmarked:

  • COPY command – The COPY command uses the Amazon Redshift massively parallel processing (MPP) architecture to read and load data in parallel from files on Amazon Simple Storage Service (Amazon S3)
  • Data lake analytics Amazon Redshift Spectrum is used to query data directly from files on Amazon S3 by selecting a subset of columns and avoiding the intermediate step of copying data to staging table

Initial Solution approach: Single COPY command

The team determined it would be more effective to apply the distribution and sort keys in a post-copy step. The data was loaded first using automatic distribution of data. This took roughly 12 hours to complete. The team created open and closed claims tables with defined dist keys and with 20% of the columns to alleviate the need to query the larger table. With this success, we learned that we can still improve the big copy, as detailed in the following sections.

Proposed Solution approach 1: Parallel COPY command

Based on the initial solution approach above, the team tested yearly parallel copy commands as illustrated in the following diagram.

Yearly Parallel Copy Commands

Below are the findings and learnings from this approach:

  • Ingesting data for 4 years using parallel copy showed a 25% performance improvement over the single copy command.
  • Compared to Initial solution approach, where we were taking 12 hours to ingest the data, we further optimized this runtime by 67% by segregating the data ingestion into separate yearly staging tables and running parallel copy commands.
  • After the data was loaded into staging yearly tables, we created the open and closed claim tables with an auto distkey with the subset of columns required for larger reporting groups. It took an additional 1 hour to create.

The team used a manifest file to make sure that the COPY command loads all of the required files for the respective year for ingesting.

Proposed Solution approach 2: Data Lake analytics

The team used this approach with Redshift Spectrum to load only the required columns to Redshift Serverless, which avoided loading data into multiple yearly tables and directly to a single table. The following diagram illustrates this approach.

Using Spectrum Approach

The workflow consists of the following steps:

  1. Crawl the files using AWS Glue.
  2. Create a data lake external schema and table in Redshift Serverless.
  3. Create two separate claims table for open and closed claims because open claims are most frequently consumed and are 20% of the columns and 100% of the data.
  4. Create open and closed tables with selective columns needed for optimal performance optimization during consumption instead of all columns in the original third-party dataset. The data volume distribution is as follows:
    • Total number of open claims records = 50 billion
    • Total number of closed claims records = 200 billion
    • Overall, total number of records = 250 billion
  5. Distribute open and closed tables with a customer-identified distkey.
  6. Configure data ingestion into open and closed claims tables combined using Redshift Serverless with 512 RPUs. This took 1.5 hours, which is further improved by 70% compared to scenario 1. We chose 512 RPUs in order to load data in the fastest way possible.

In this method, data ingestion was streamlined by only loading essential fields from the medical claims dataset and by splitting the table into open and closed claims. Open claims data is most frequently accessed and constitutes only 20% of columns so by splitting the tables. The team not only improved the ingestion performance but also consumption.

Amazon Redshift recently launched automatic mounting of AWS Glue Data Catalog, making it easier to run data lake analytics without manually creating external schemas. You can query data lake tables directly from Amazon Redshift Query Editor v2 or your favorite SQL editors.

Recommendations and best practices

Consider the following recommendations when loading large-scale data in Amazon Redshift.

  • Use Redshift Serverless with maximum 512 RPUs to efficiently and quickly load data
  • Depending on consumption use case and query pattern, adopt either of the following approaches:
    • When consumption queries require only selected fields from the dataset and most frequently access a subset of data, use data lake queries to load only the relevant columns from Amazon S3 into Amazon Redshift
    • When consumption queries require all fields, use COPY commands with a manifest file to ingest data in parallel into multiple logically separated tables and create a database view with UNION ALL of all tables
  • Avoid using varchar(max) while creating tables and create VARCHAR columns with the right size

Final Architecture

The following diagram shows the high-level final architecture that was implemented.

Final Architecture

Conclusion

With the scalability of Redshift Serverless, data sharing to decouple ingestion from consumption workloads, and data lake analytics to ingest data, Gilead made their 140 TB dataset available to their analysts within hours of it being delivered. The innovative architecture of using a serverless ingestion data warehouse, a serverless consumption data warehouse for power users, and their original 3-node provisioned cluster for standard queries gives Gilead isolation to ensure data loads don’t affect their users. The architecture provides scalability to serve infrequent large queries with their serverless consumer along with the benefit of a fixed-cost and fixed-performance option of their provisioned cluster for their standard user queries. Due to the monthly schedule of the data load and the variable need for large queries by consumers, Redshift Serverless proved to be a cost-effective option compared to simply increasing the provisioned cluster to serve each of these use cases.

This split producer/consumer model of using Redshift serverless can bring benefits to many workloads that have similar performance characteristics to Gilead’s warehouse. Customers regularly run large data loads infrequently, and those processes compete with user queries. With this pattern, you can rely on your queries to perform consistently regardless of whether new data is being loaded to the system. This strikes a balance between minimizing cost while maintaining performance and frees the system administrators to load data without affecting users.


About the Authors

Rajiv Arora is a Director of Clinical Data Science at Gilead Sciences with over 20 years of experience in the industry. He is responsible for the multi-modal data platform for the development organization and supports all statistical and predictive analytical infrastructure for RWE and Advanced Analytical functions.

Ritesh Kumar Sinha is an Analytics Specialist Solutions Architect based out of San Francisco. He has helped customers build scalable data warehousing and big data solutions for over 16 years. He loves to design and build efficient end-to-end solutions on AWS. In his spare time, he loves reading, walking, and doing yoga.

Raks KhareRaks Khare is an Analytics Specialist Solutions Architect at AWS based out of Pennsylvania. He helps customers architect data analytics solutions at scale on the AWS platform.

Brent Strong is a Senior Solutions Architect in the Healthcare and Life Sciences team at AWS. He has more than 15 years of experience in the industry, focusing on data and analytics and DevOps. At AWS, he works closely with large Life Sciences customers to help them deliver new and innovative treatments.

Phil Bates is a Senior Analytics Specialist Solutions Architect at AWS with over 25 years of data warehouse experience.