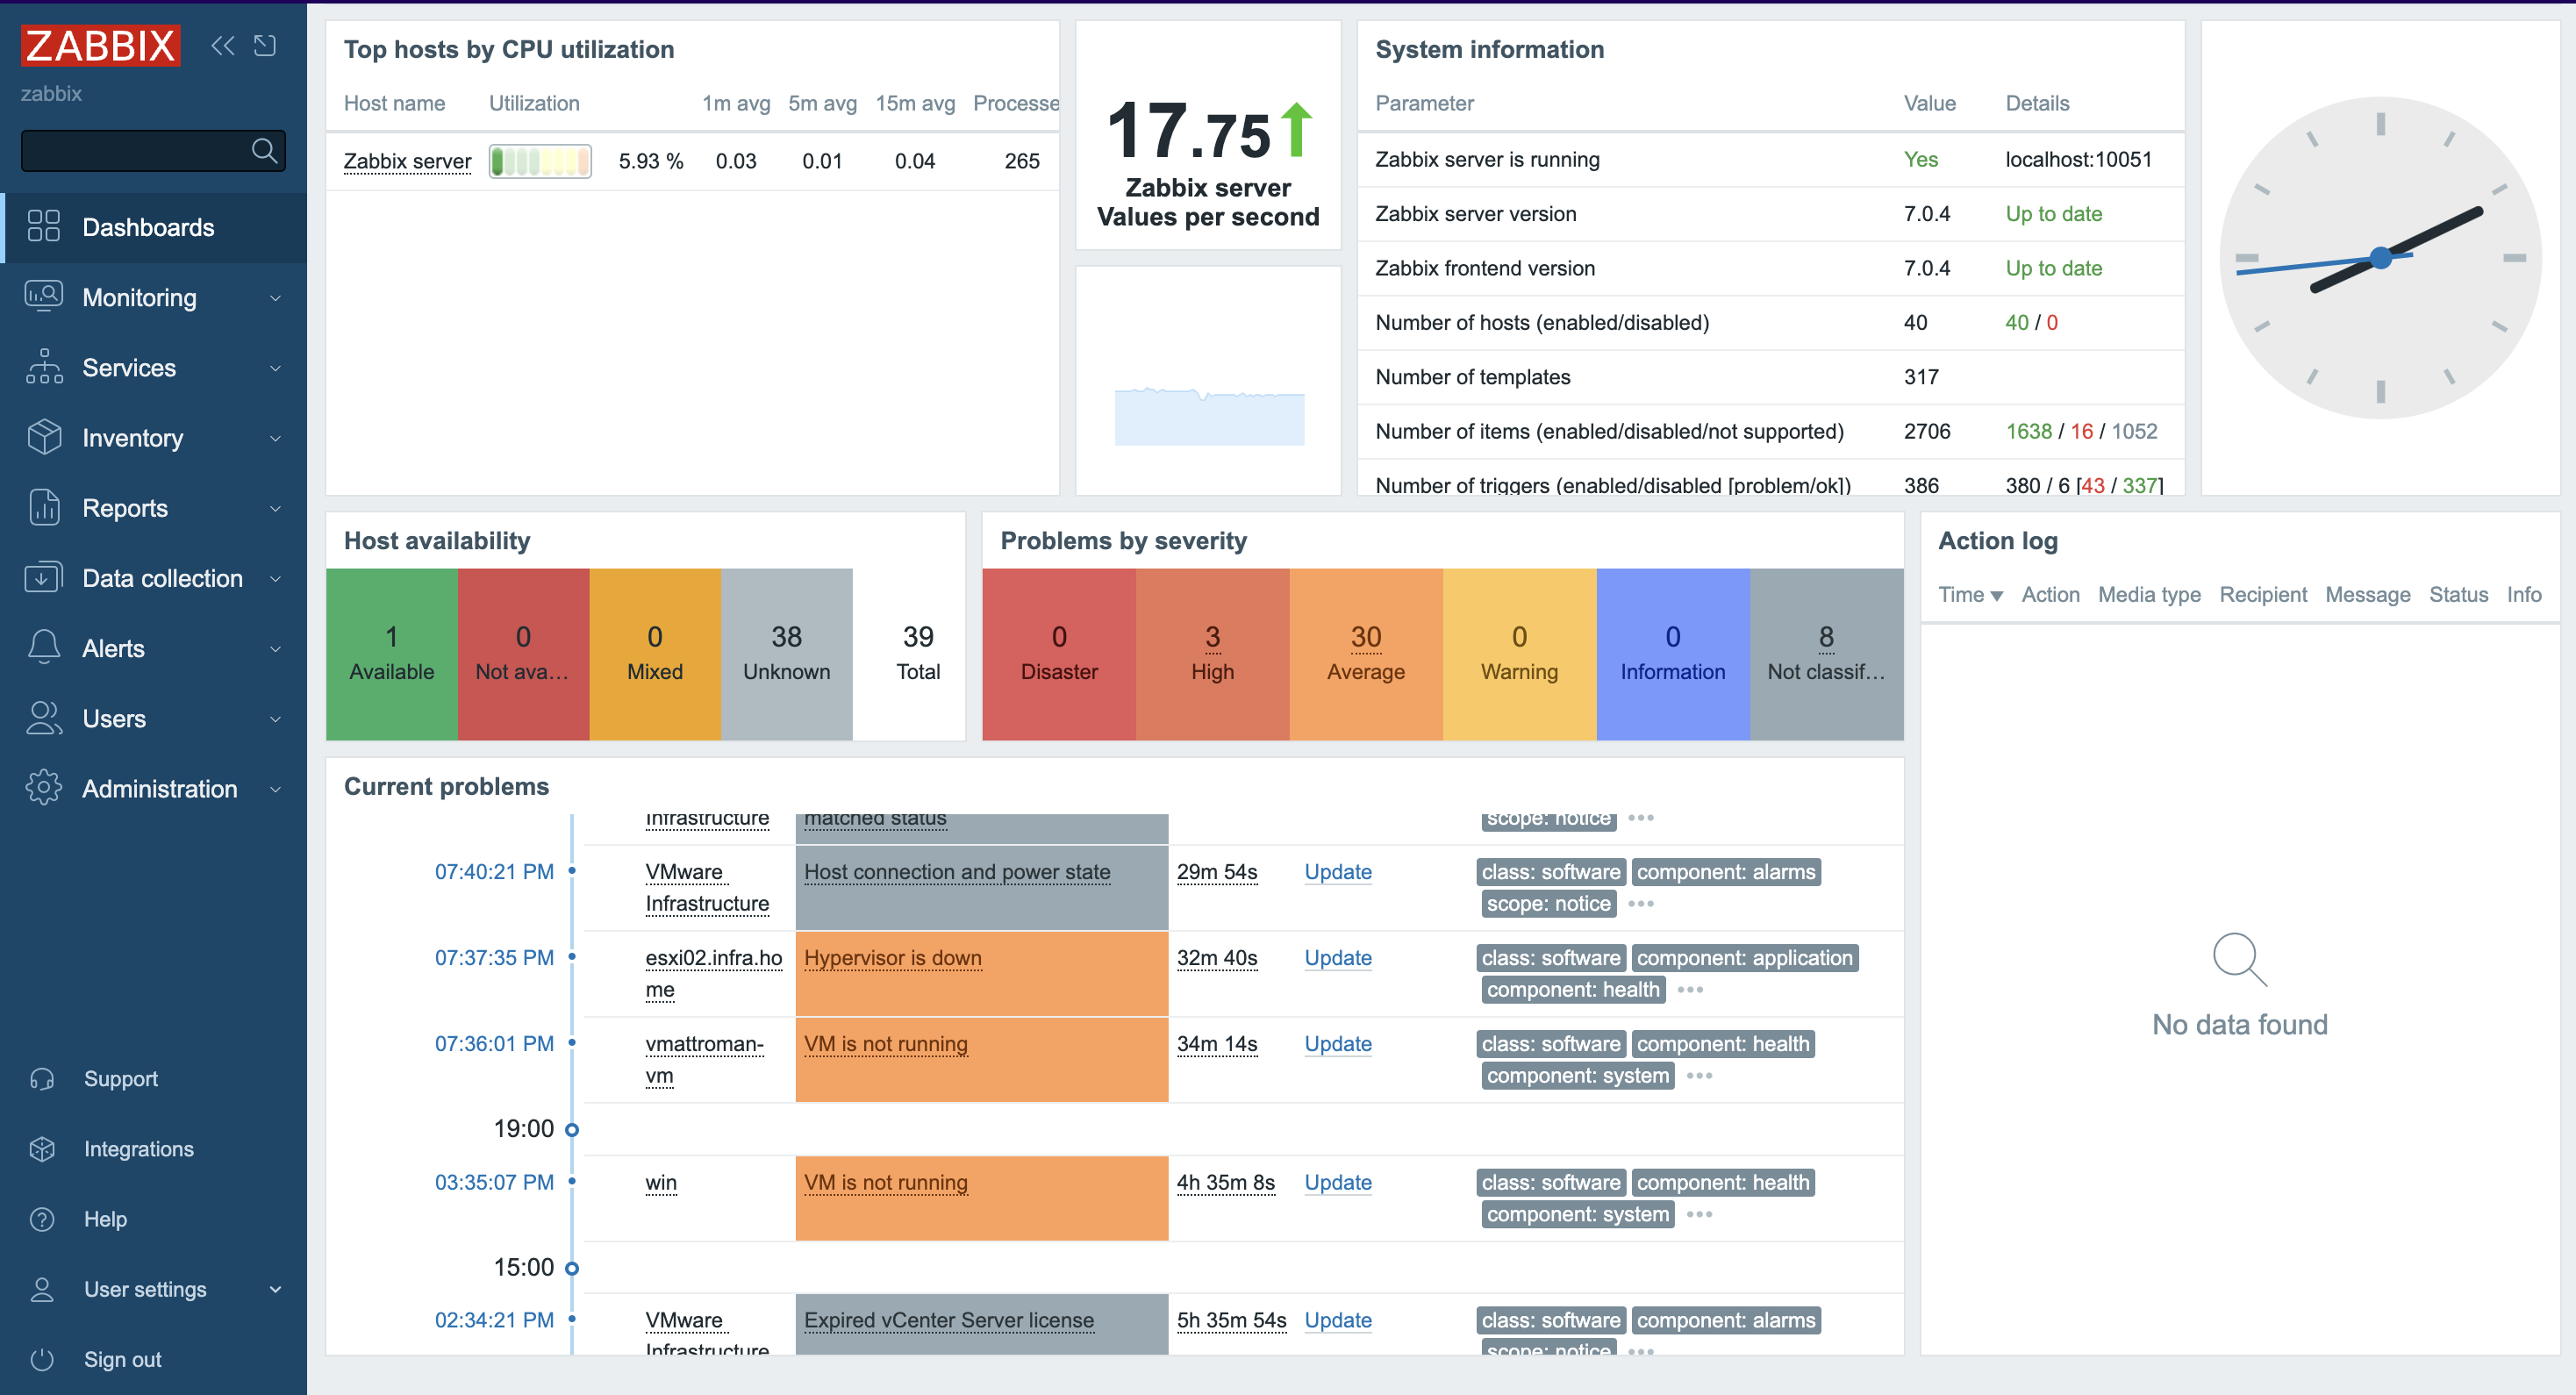
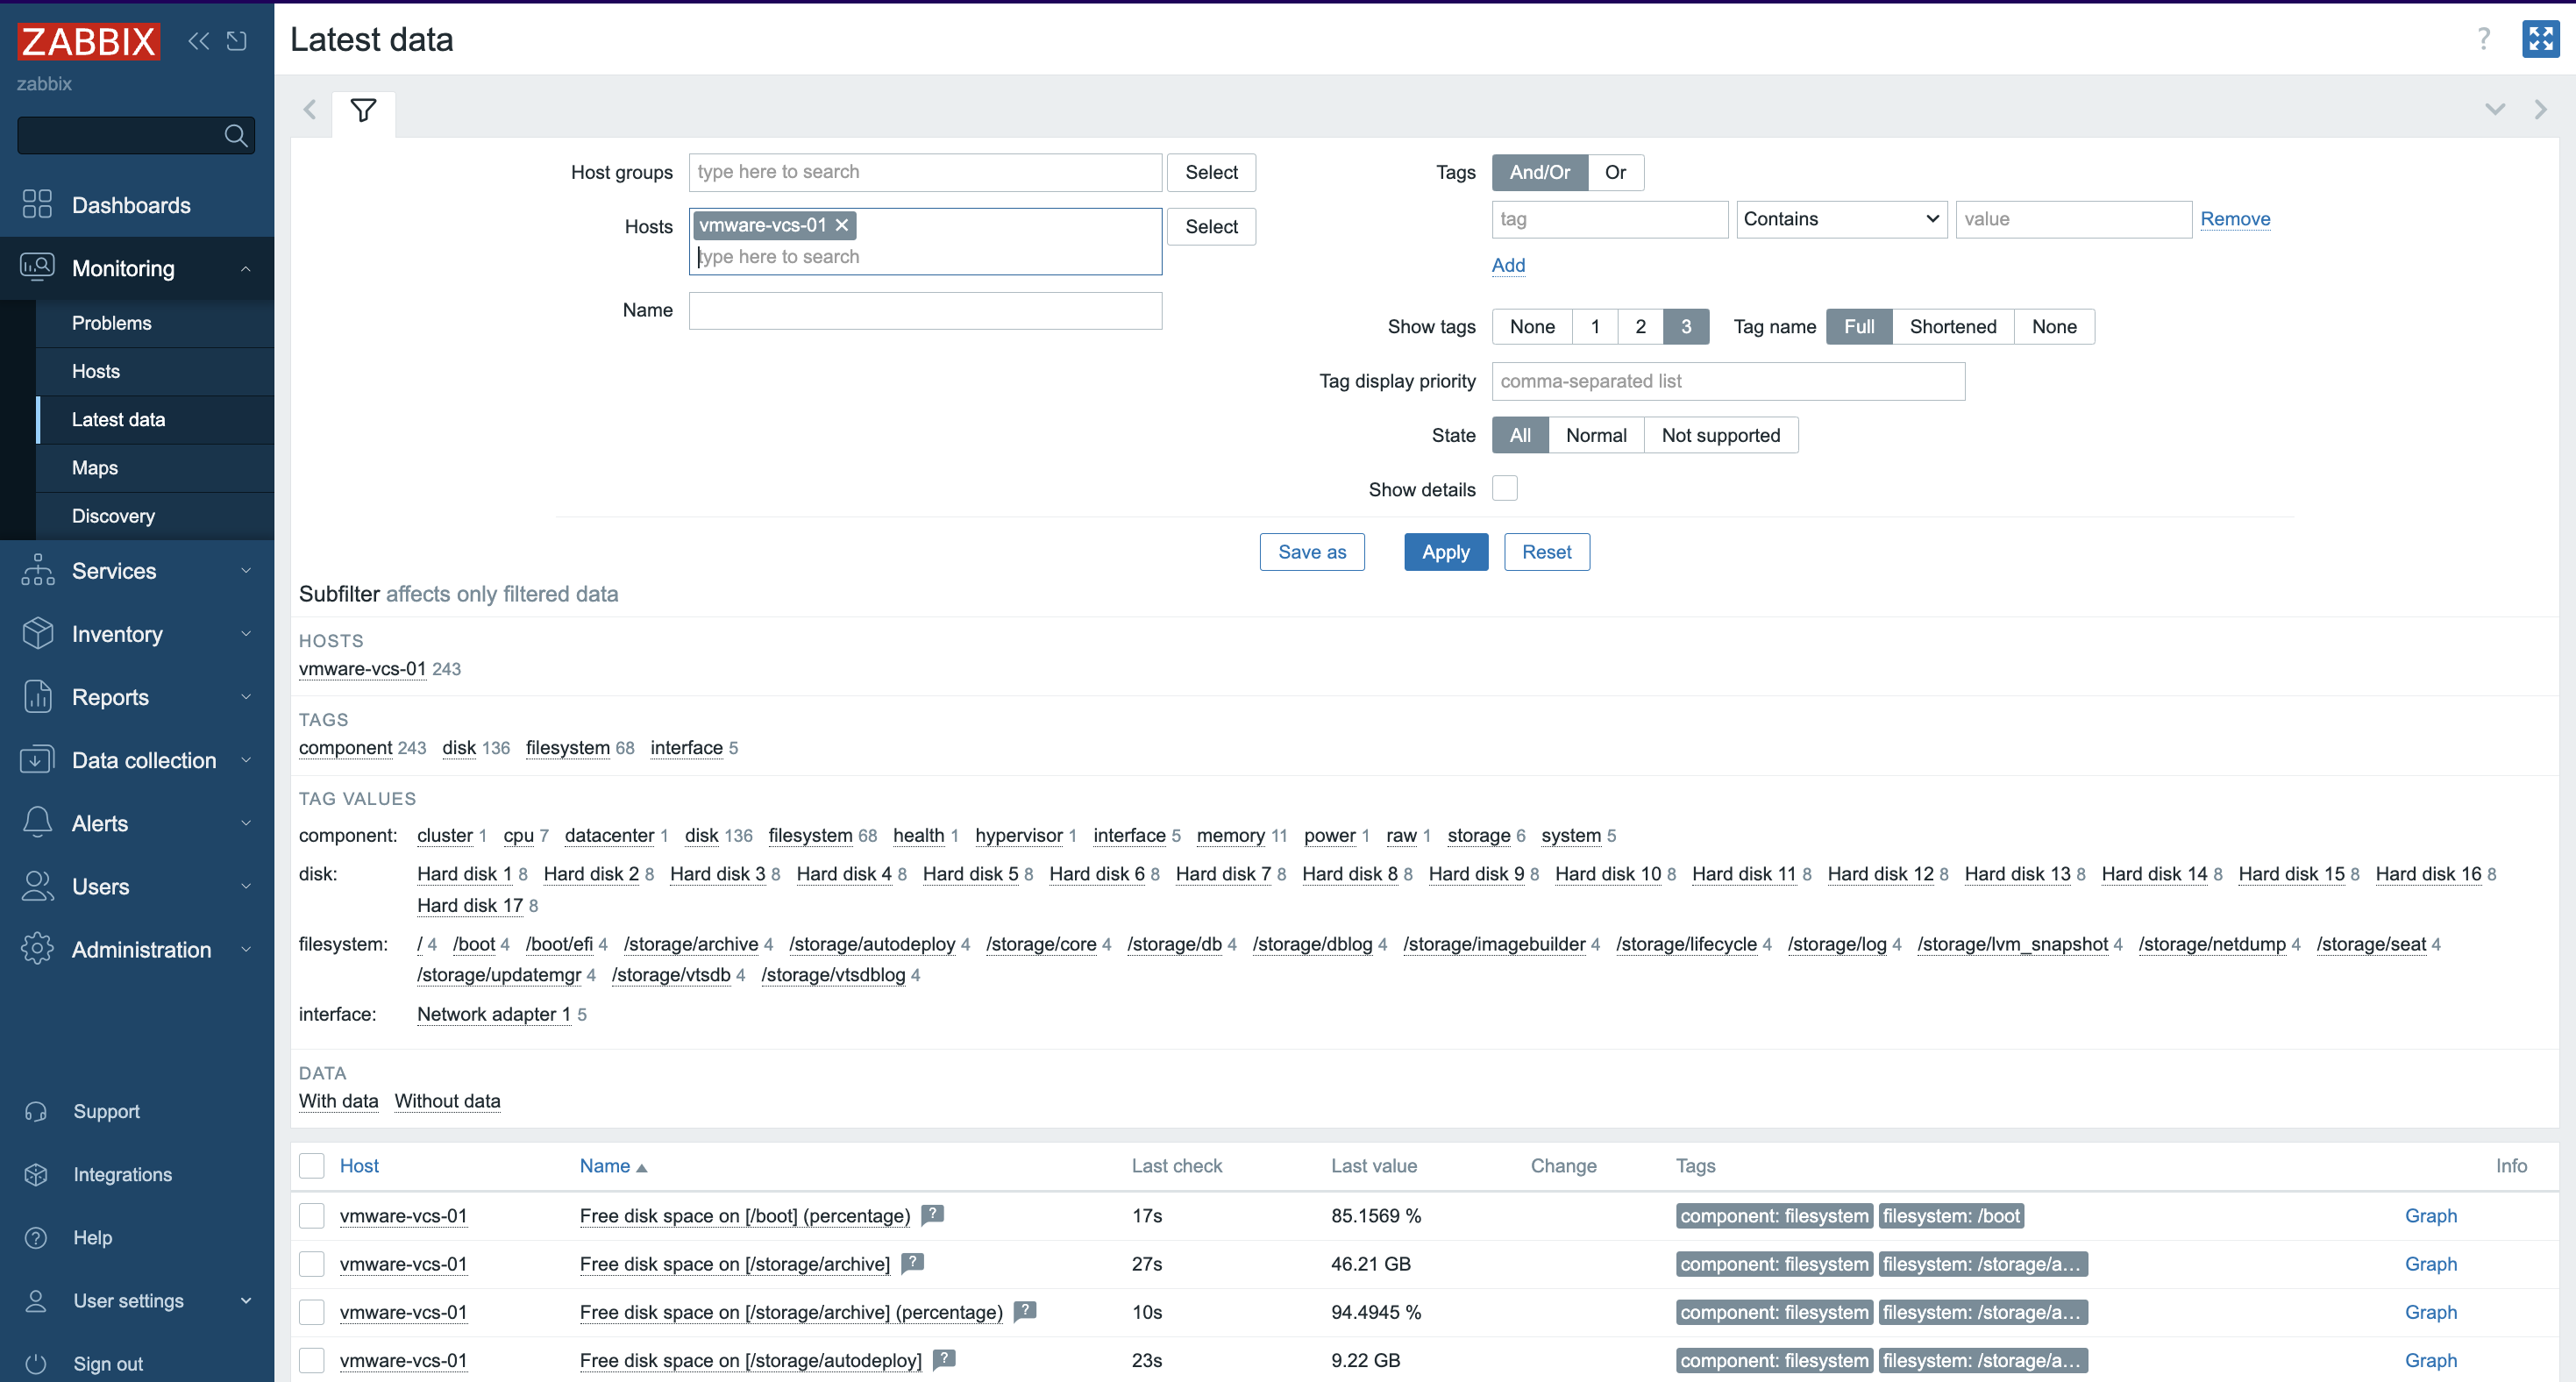
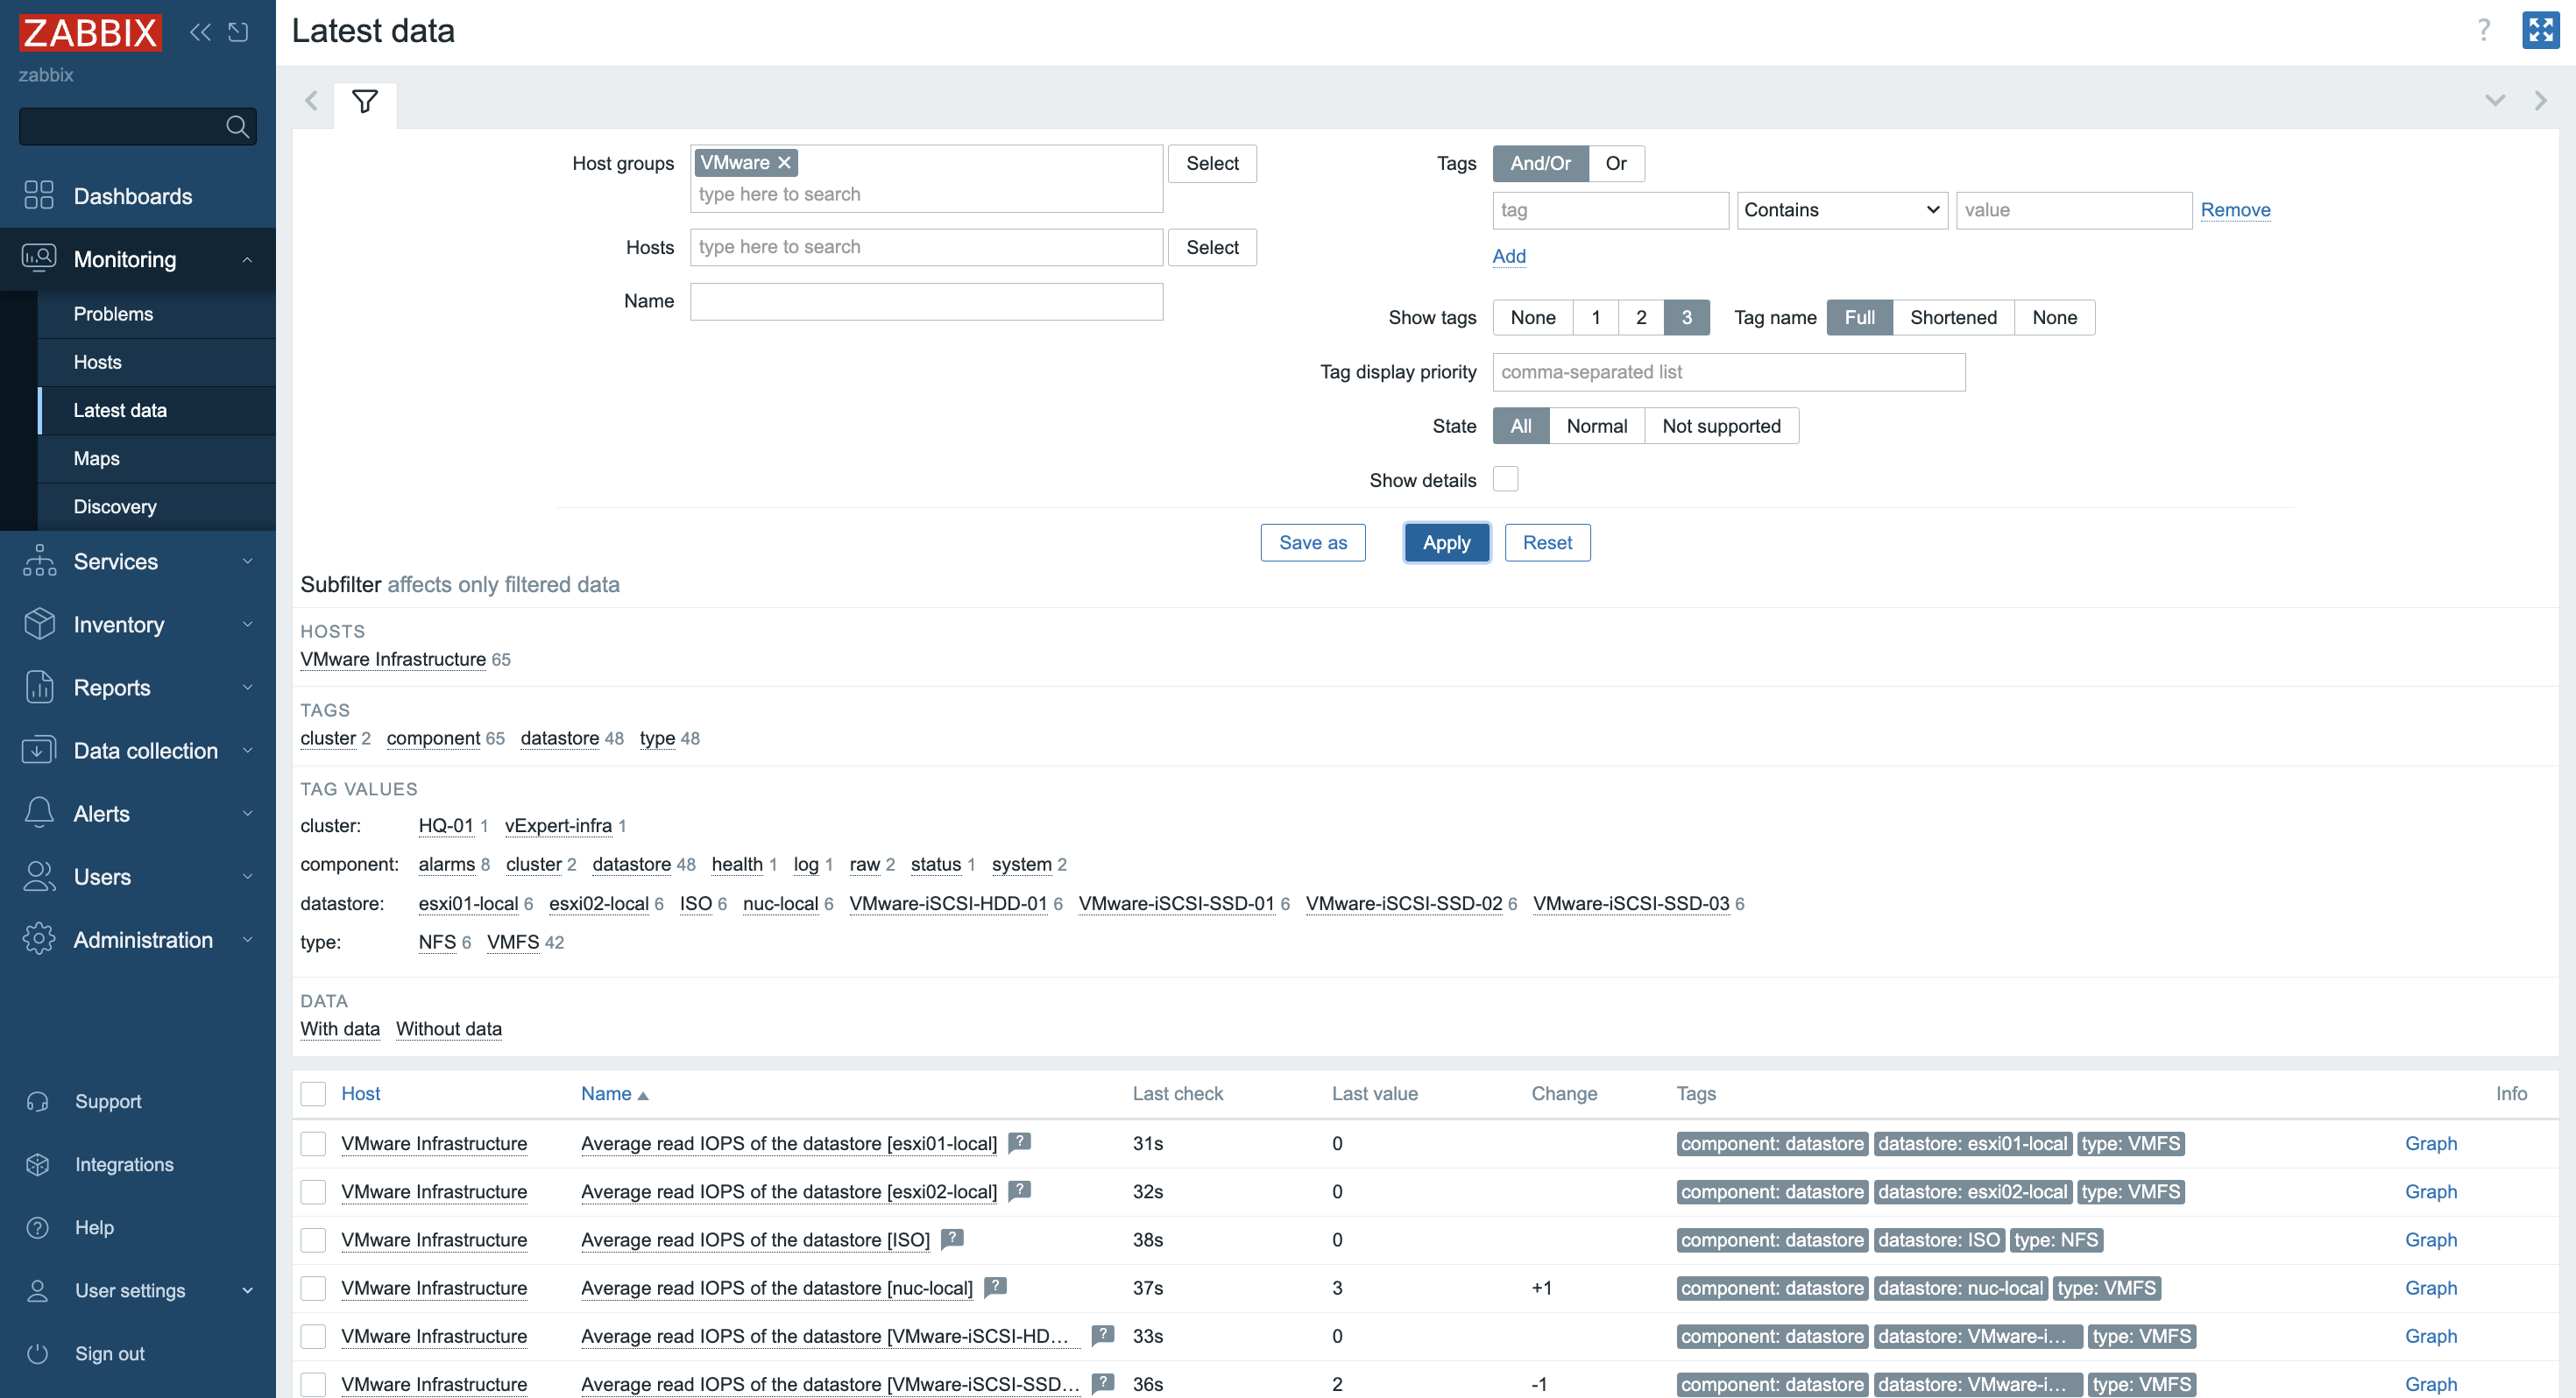
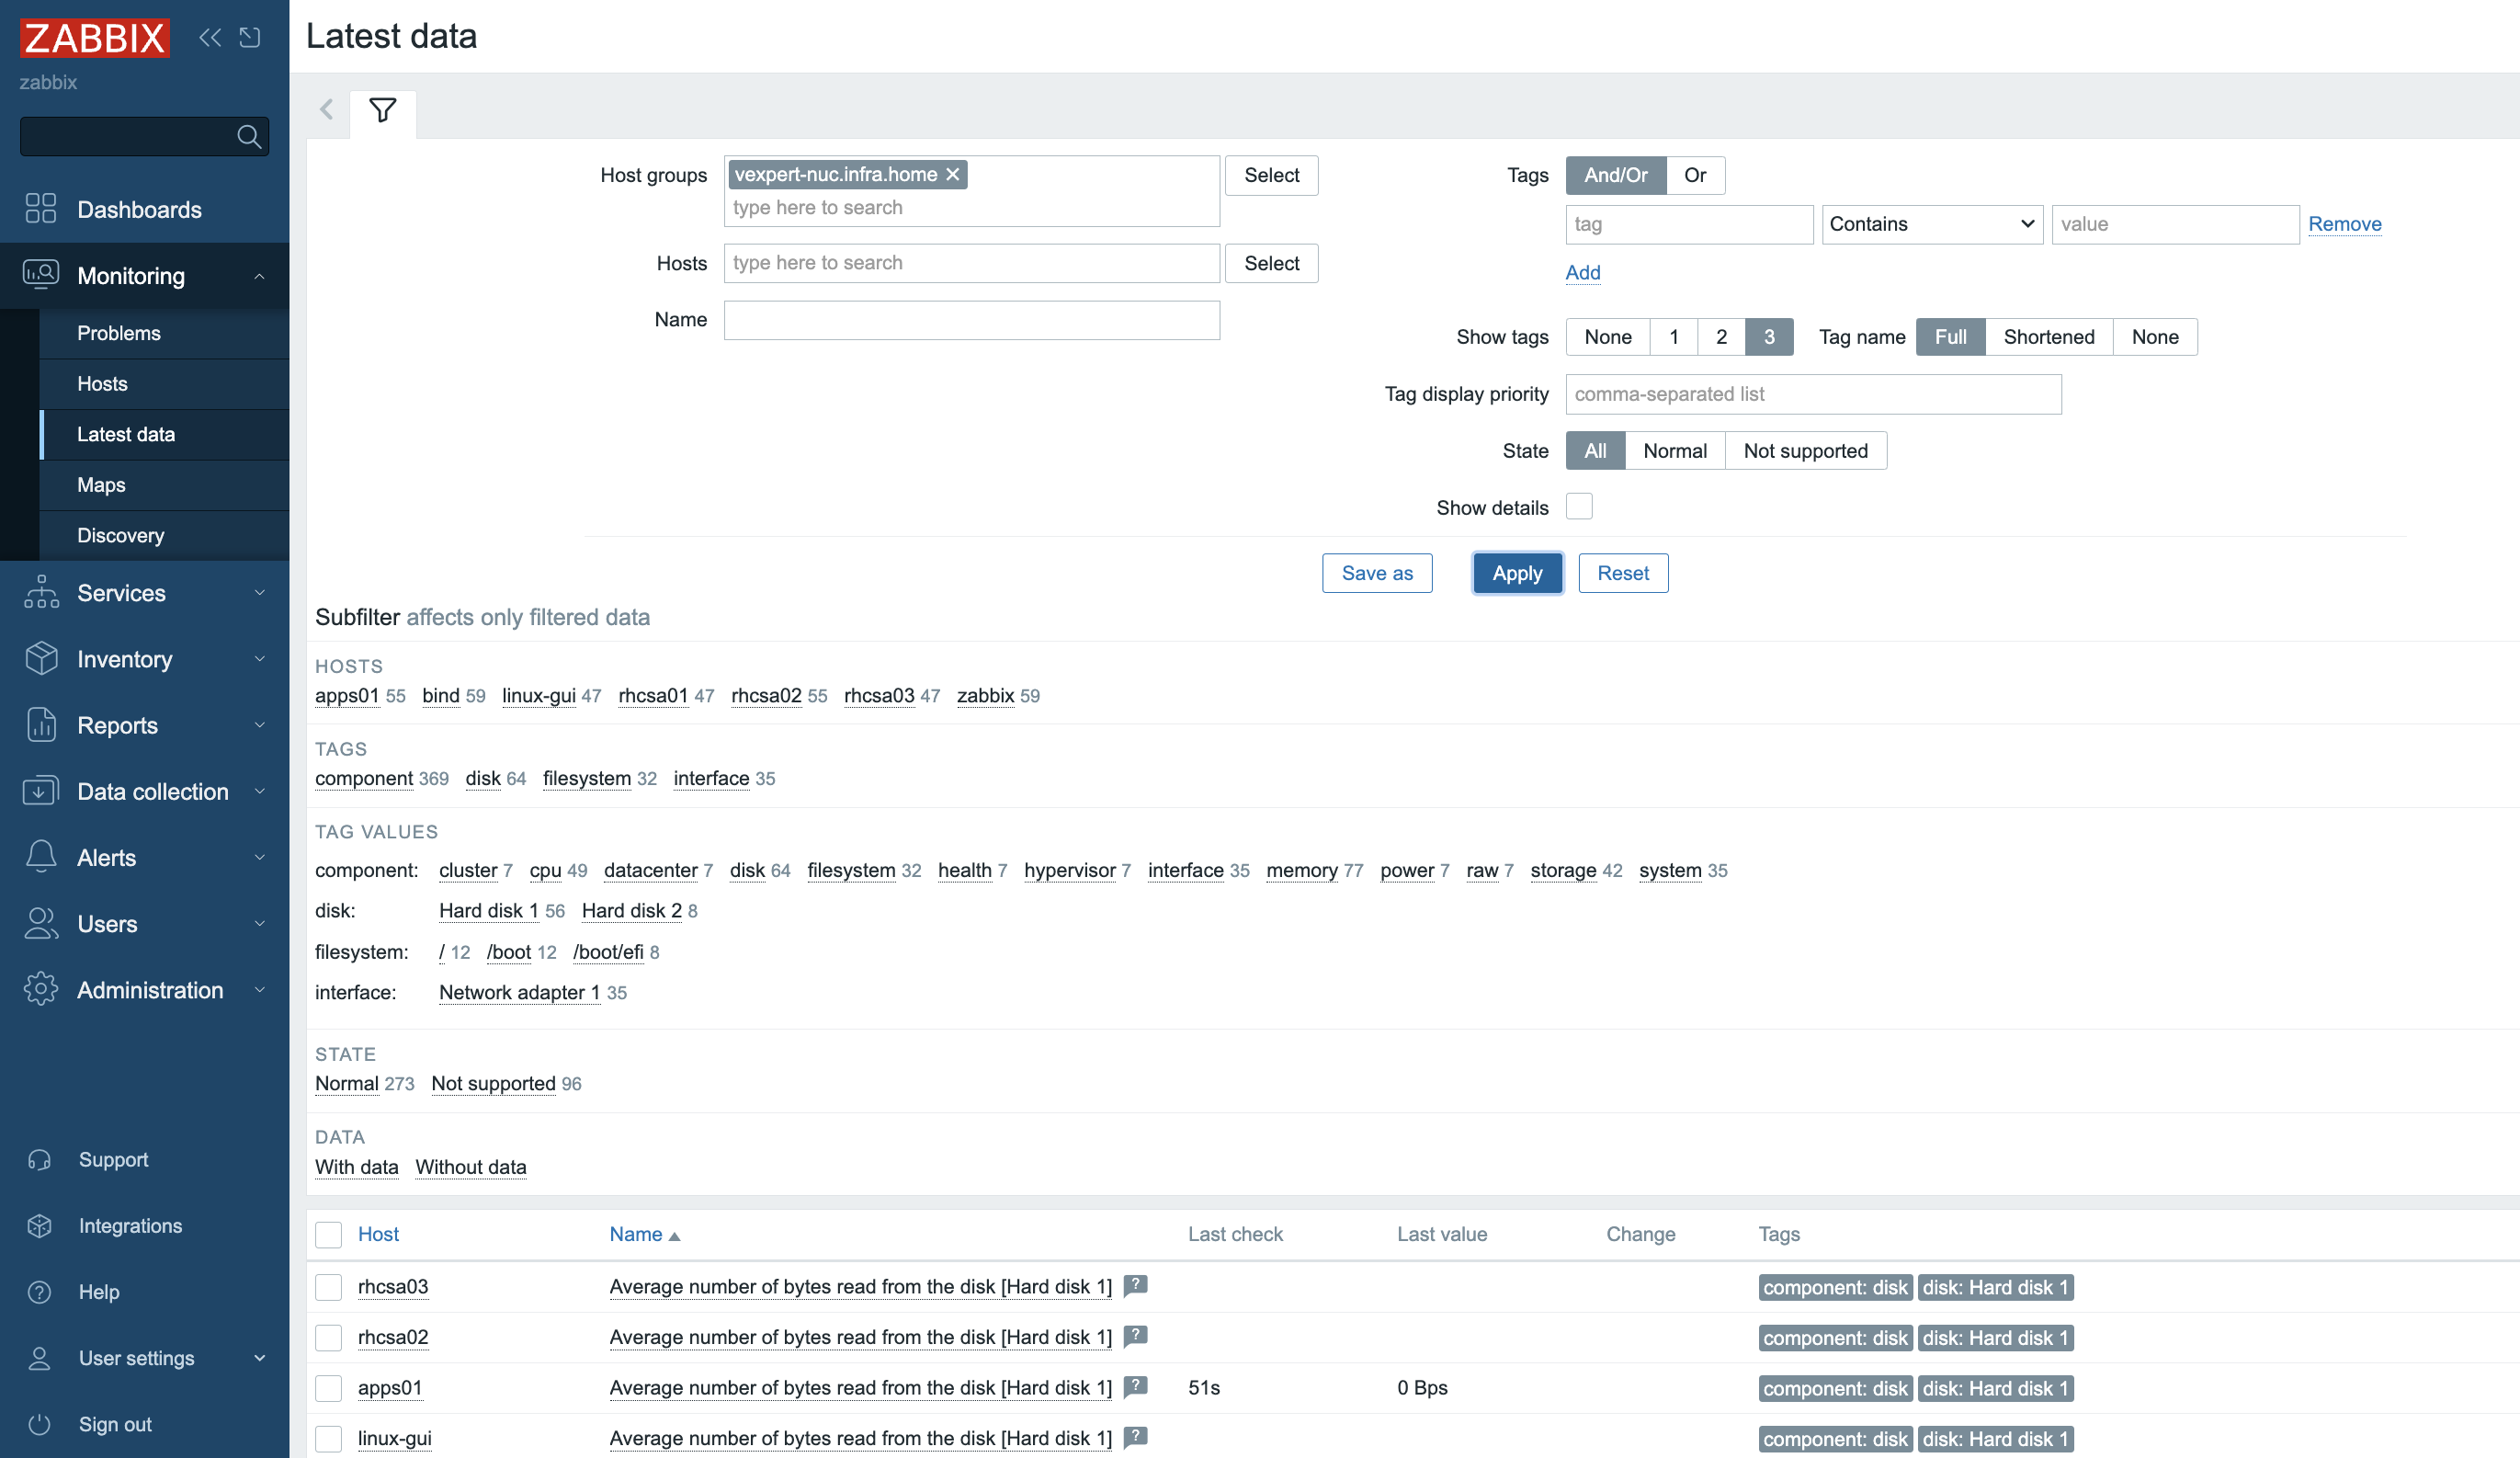
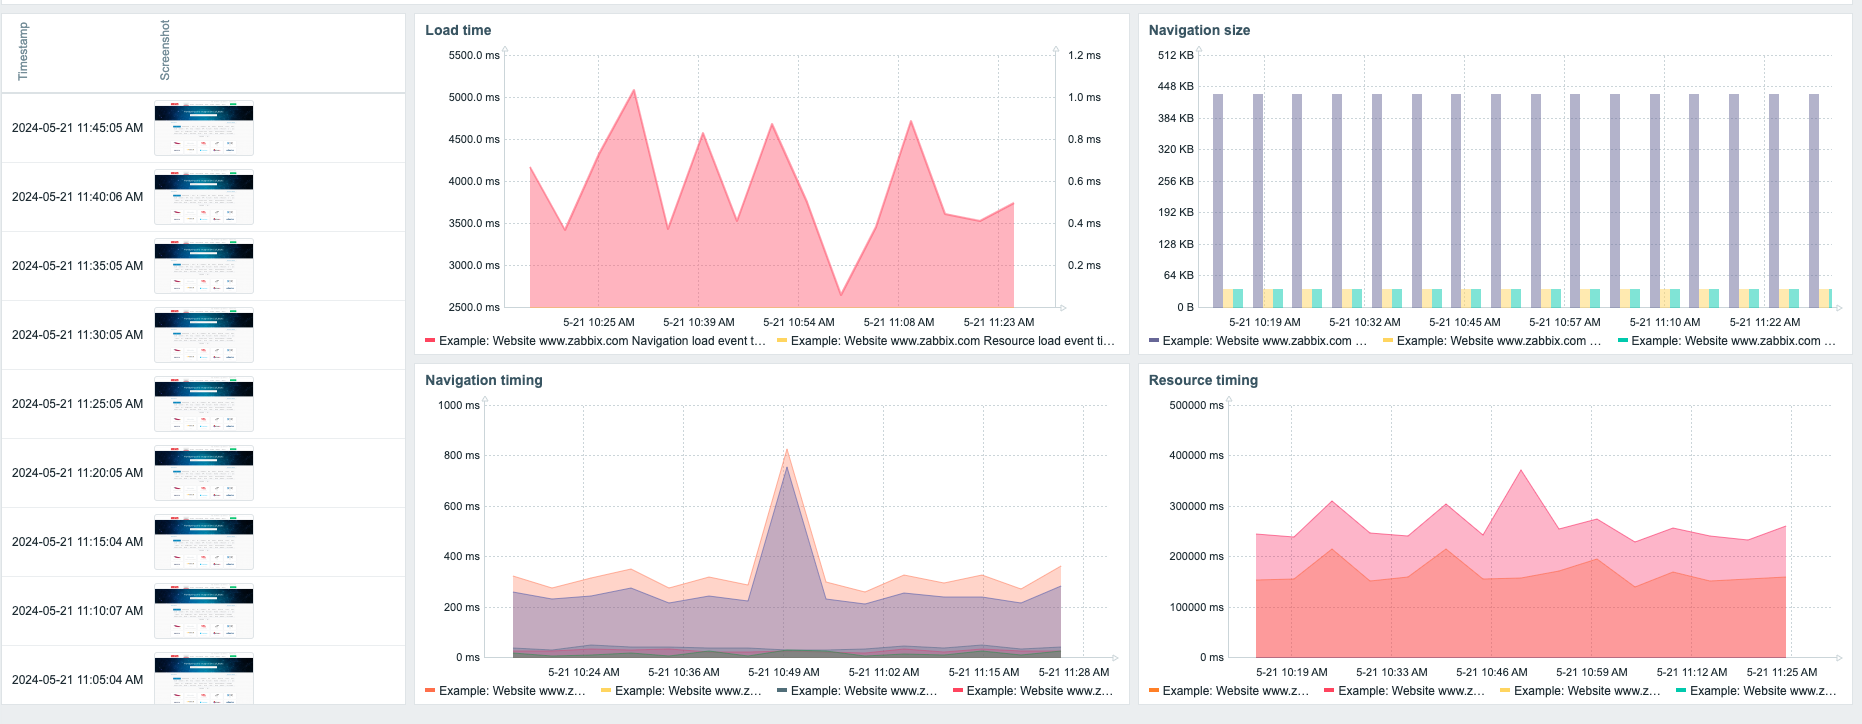
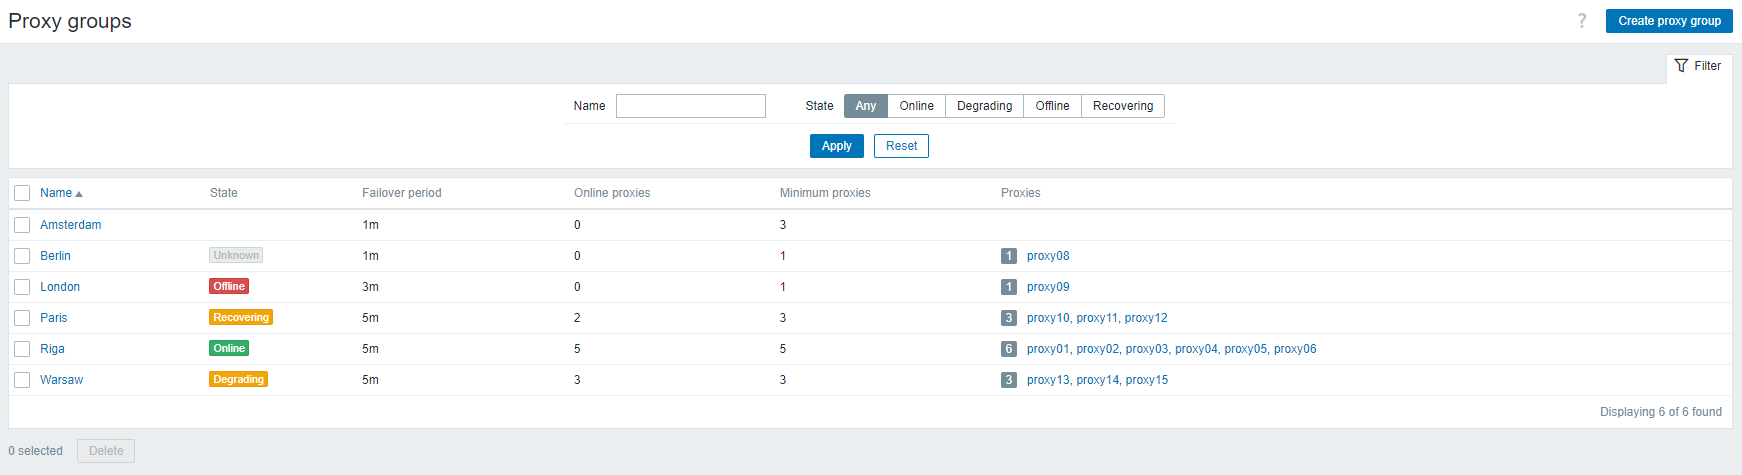
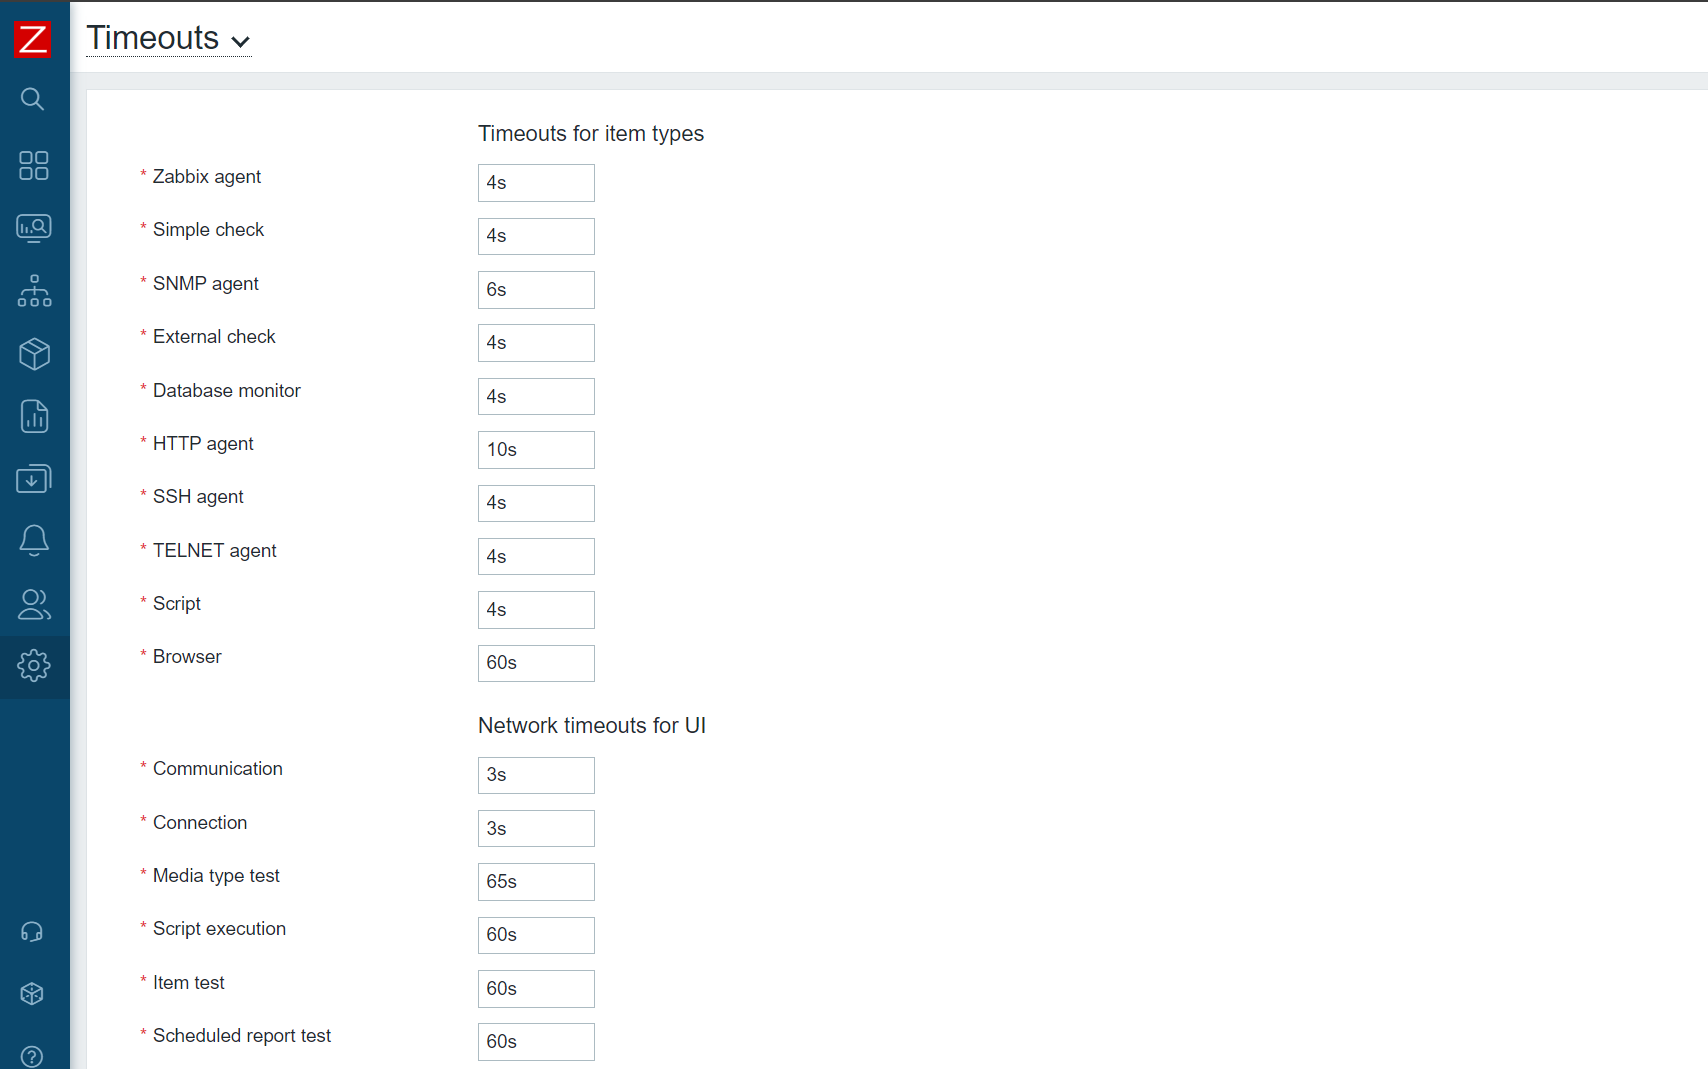
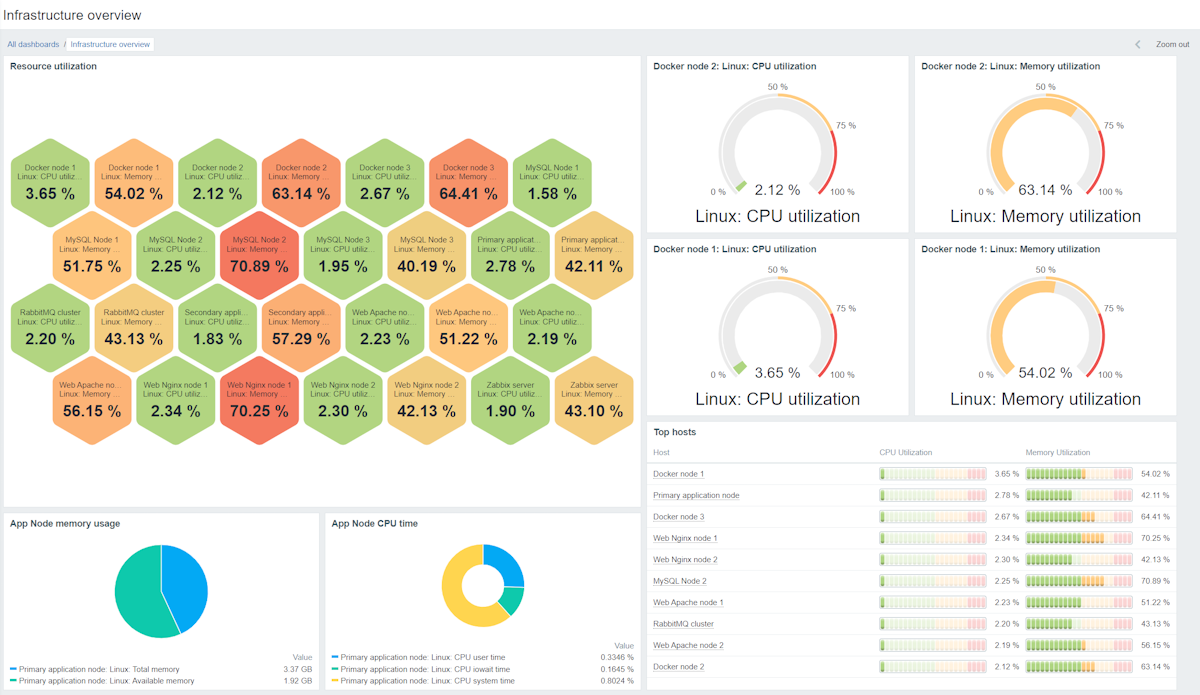
SEB Bank is a major financial services group based in Stockholm, Sweden. It serves northern Europe, particularly the Nordic and Baltic regions. Known for its digital innovation and commitment to sustainability, SEB offers banking, investment, and financial advisory services to individuals, businesses, and institutions, focusing on long-term relationships and financial stability. This case study, which shows how Zabbix helped SEB solve its log monitoring challenges, discusses aspects specific to SEB’s operations in the Baltics, where distinct systems and structures are in place but are aligned with the group’s overall approach.
The challenge
Between 2016 and 2020, SEB launched a unified IT platform for all three Baltic countries. They encountered a wide variety of challenges, including a distinct need to unify the monitoring area. Different countries had different tools and different attitudes regarding the way monitoring should operate. After numerous discussions and weighing the pros and cons of different monitoring tools, SEB concluded that the most effective way to achieve unification would be to (re)implement everything necessary with Zabbix.
It turned out that a great deal of valuable data for monitoring resides in logs. The logs varied in update frequency and structure, as did the requirements for data extraction. Some monitoring items were simple regex patterns to count matching entities or catch errors, while others had more complex logic, such as joining multiple lines for evaluation or dynamically detecting specific patterns to observe.
At the start of SEB’s journey with Zabbix, they were using version 3.0, which came with some now long-forgotten limitations:
No log.count[*] item yet
No PCRE regular expressions – only ERE was available
Very limited dashboard and visualization capabilities
The solution
To address all the log-related challenges, SEB chose to leverage Zabbix’s “UserParameter” capabilities. This feature is invaluable for extending Zabbix functionality.
log.discovery
This custom approach relies on the ability to effectively convert regex capturing groups into LLD (Low-Level Discovery) objects. When new elements that need monitoring appear in the logs, corresponding monitoring objects can be automatically created in Zabbix. This process was covered in more detail at Zabbix Summit 2023.
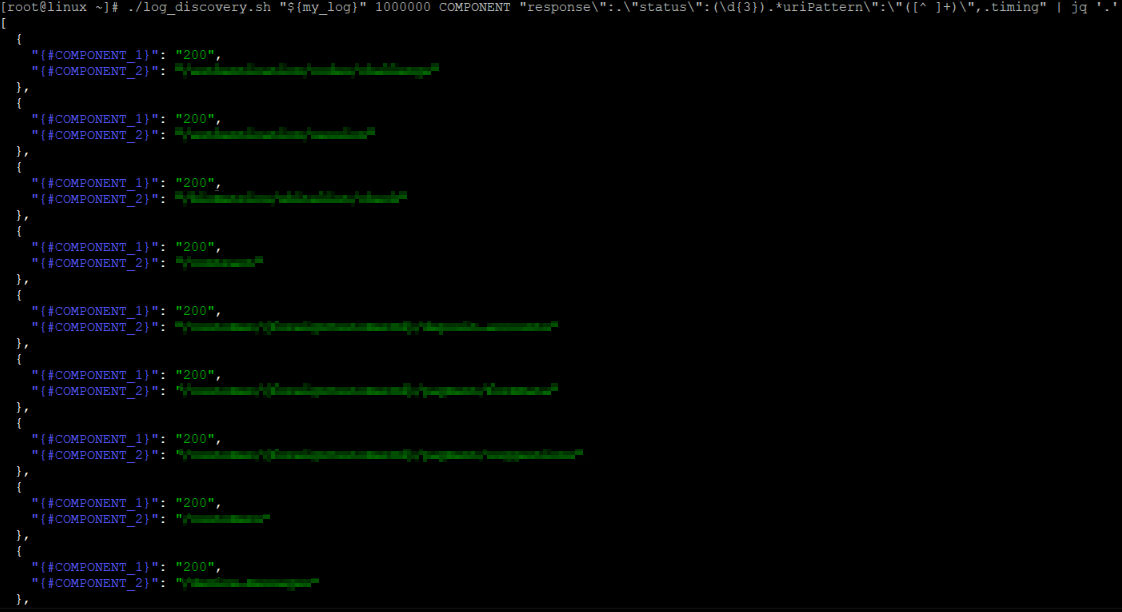
For instance, an effective set of metrics is extracted from logs to monitor the SEB mobile app. Request processing durations are logged alongside other parameters, enabling efficient grouping, such as by endpoint name and HTTP status code. This approach accommodates a wide range of potential combinations for “endpoint + HTTP status code”:
For each discovered couple, monitoring of request processing durations is added, both for individual durations and 1 minute averages:
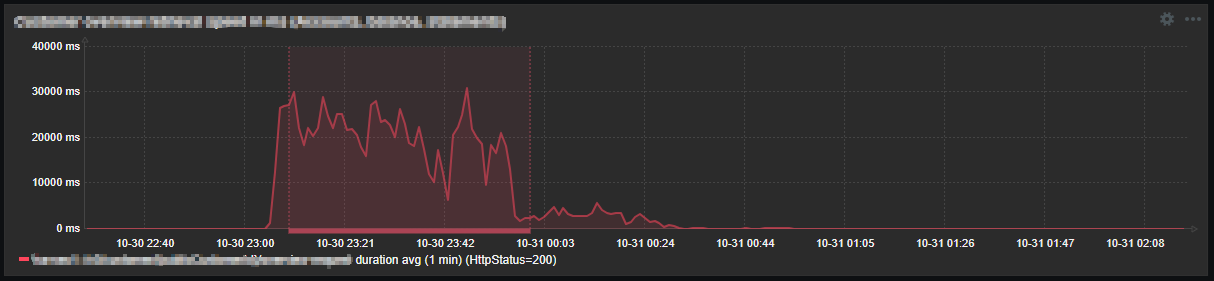
Certain significant combinations are enhanced with triggers, efficiently managed using the “Override” section in the LLD configuration to ensure they are created only for specific cases. So with this approach, some unexpected slowness can be nicely caught:
log.reader
For complex data collection scenarios, there was a need to implement a solution that allows data to be extracted from logs with minimal limitations. The approach was to create a log reading mechanism that could support any required data extraction logic on top of it. This was covered in more detail at Zabbix Summit 2024.
Zabbix agent 2
In addition to the mentioned custom log processing techniques, SEB had a good reason to use “Zabbix agent 2”. Both log[*] and log.count[*] are of the “Active” item type. These items are not processed in parallel by the Zabbix agent. In places with a large number of log-based items, “Zabbix Agent 2” was used, because it supports the concurrent processing of active checks.
The results
The ability to use LLD on logs was a game-changer and a lifesaver for SEB. Imagine hundreds of different items discovered from a single rule, along with the requirement to monitor any new entity matching a specific pattern as soon as it appears. Without LLD, meeting such a requirement would have been simply impossible. This approach covers many different areas, including mission-critical metrics such as counts of various requests and processing durations.
The ability to slice logs themselves and create any needed logic on top makes almost any custom log monitoring requirement possible. It gives the ability to analyze data in ways that wouldn’t be possible otherwise (e.g. average duration monitoring for large set of data).
In conclusion
SEB Bank in the Baltics relies heavily on data collection from logs. Zabbix is flexible enough to meet most of their needs when it comes to log monitoring, and – most importantly – it allows for custom implementations where required. This flexibility is highly appreciated, as it removes many barriers when monitoring the various components of SEB’s IT ecosystem and business functions.
Amazon CloudWatch dashboards are customizable pages in the CloudWatch console that you can use to monitor your resources in a single view. This post focuses on deploying a CloudWatch dashboard that you can use to create a customizable monitoring solution for your AWS Network Firewall firewall. It’s designed to provide deeper insights into your firewall’s performance and security events simplifying security monitoring.
Network Firewall is a managed service that you can use to deploy essential network protections to Amazon Virtual Private Clouds (Amazon VPCs). Network Firewall provides comprehensive logs and metrics through CloudWatch, and we’re expanding its capabilities with this CloudWatch dashboard. This enhancement makes it easier to visualize, analyze, and act on the wealth of data generated by your firewall.
This open source solution streamlines network security monitoring with a user-friendly AWS CloudFormation template that quickly deploys a dedicated monitoring dashboard. This solution incorporates a suite of CloudWatch features—basic monitoring metrics, vended logs, Logs Insights queries, Contributor Insights rules, and the dashboard itself—into a centralized view. Preconfigured widgets provide instant insights into critical areas such as top talkers, protocol distributions, and alert log trends, in addition to HTTP and TLS flow analysis. A consolidated view of key metrics and logs enables faster identification of potential security threats or performance issues. With all of this relevant network firewall data in one place, your team can respond more quickly to emerging security events.
In this blog post, we provide an overview of the dashboard and a step-by-step guide to deploy it in your environment.
Solution overview
The CloudWatch dashboard can be deployed in all AWS Regions where Network Firewall is available today, including the AWS GovCloud (US) Regions and China Regions. While the dashboard comes pre-configured, you can quickly adjust queries, time ranges, and refresh intervals to help meet your specific needs. By default, the dashboard queries firewall flow and alert log events over a 3-hour period, impacting the number of log events scanned. Logs Insights and Contributor Insights widgets showcase the top 10 data points by default, but you can enhance results by modifying queries or adjusting the Top Contributors value, though this might lead to increased costs. You can configure the auto-refresh interval of the widgets to get real-time visibility and optimize costs. See the Amazon CloudWatch Pricing guide for up-to-date free and paid tier pricing considerations.
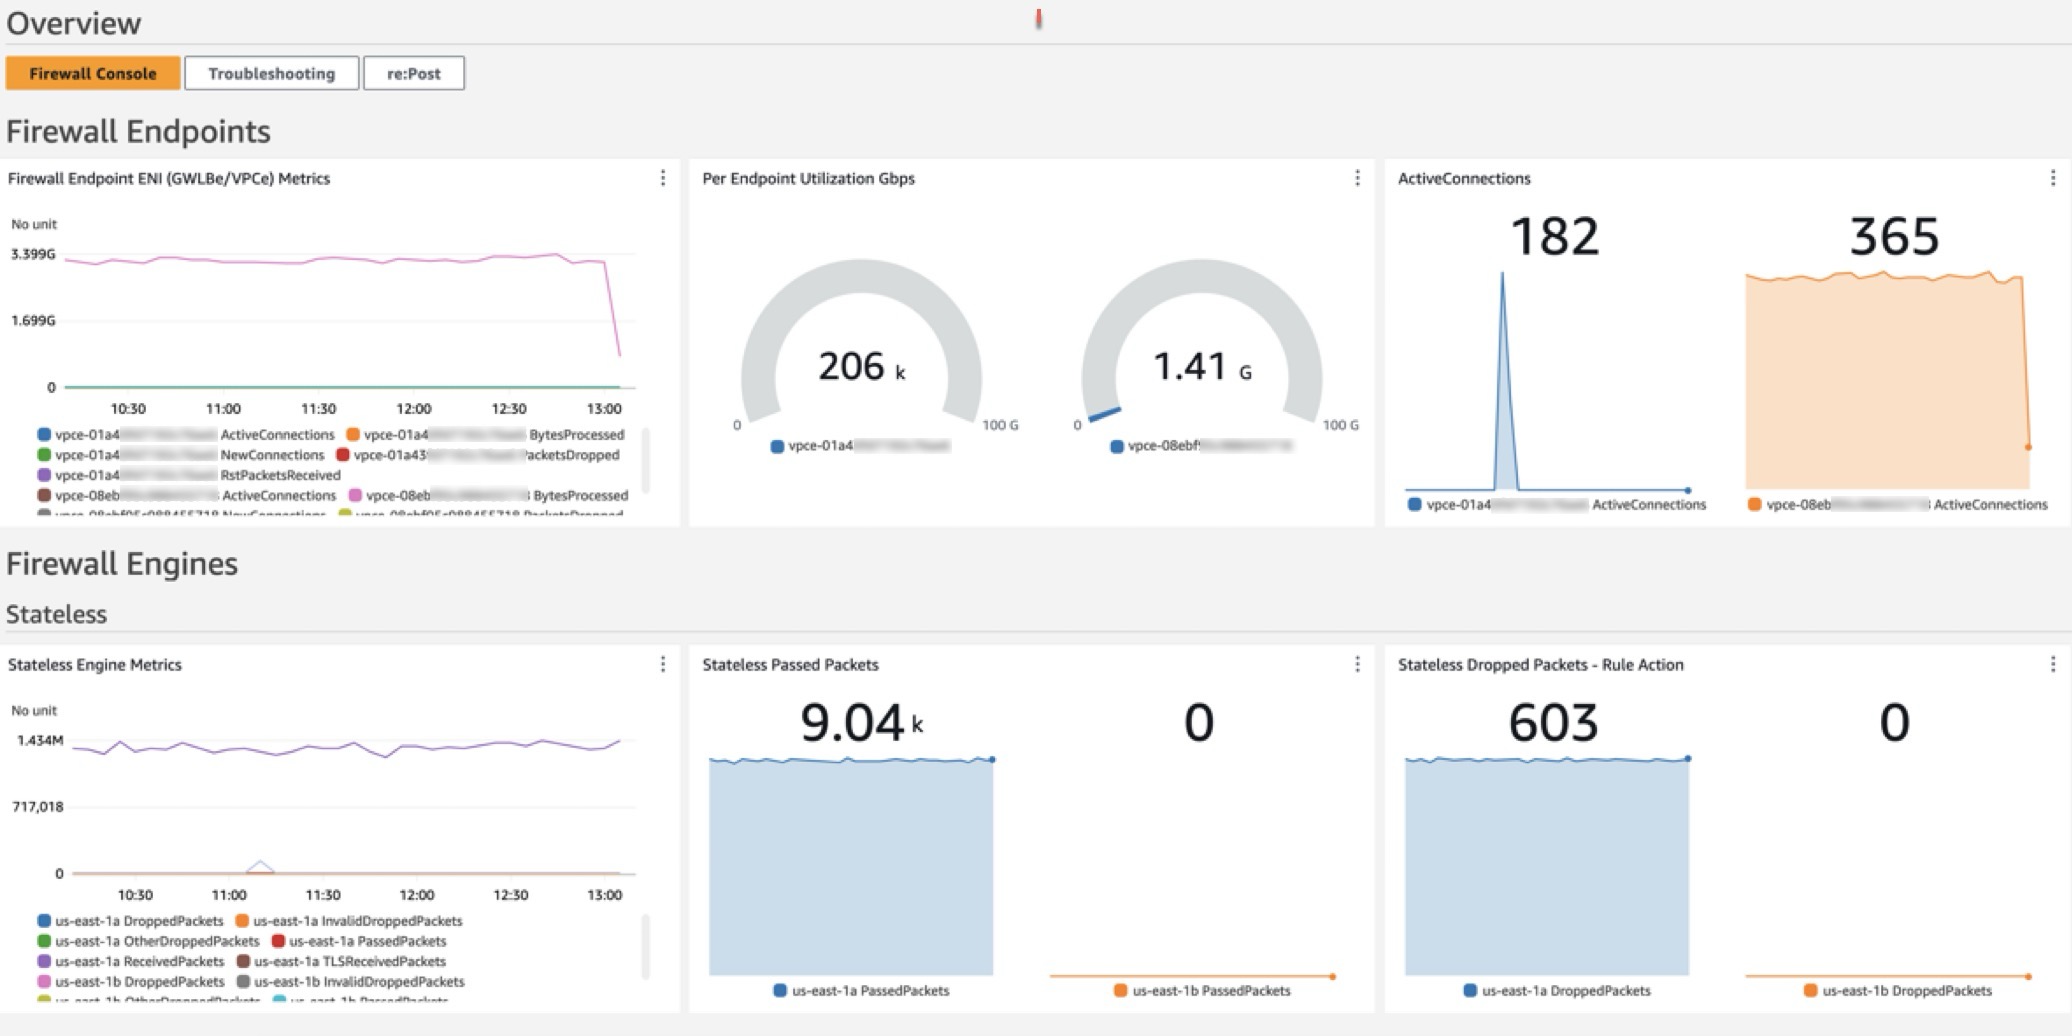
The dashboard, shown in Figure 1, can be deployed using CloudFormation and includes data and analytics from the following sources:
Native CloudWatch metrics from the AWS/NetworkFirewall and AWS/PrivateLinkEndpoints namespaces
CloudWatch Logs Insights queries that analyze Network Firewall flow and alert logs
CloudWatch Contributor Insights rules that aggregate data from Network Firewall flow and alert logs.
Figure 1: CloudWatch dashboard
Walkthrough
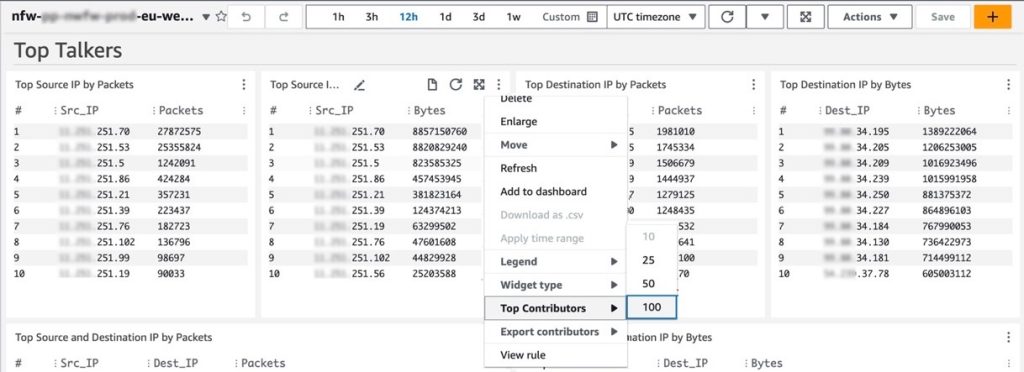
In the dashboard, the Logs Insights and Contributor Insights widgets display the top 10 data points by default. You can edit the Insights queries or change the Top Contributors to a larger value to display more results, as shown in Figure 2.
Figure 2: Top Talkers dashboard showing a change to the Top Contributors value
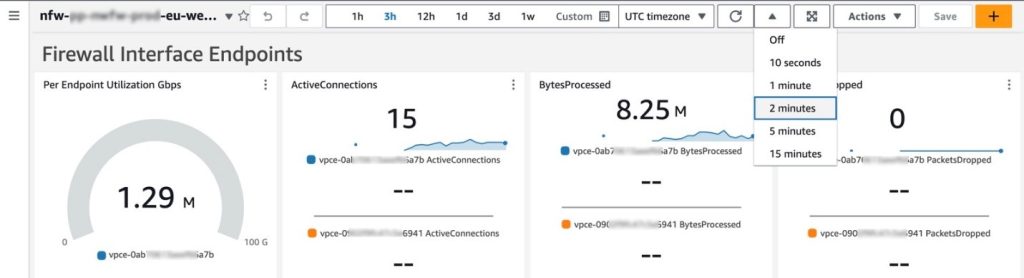
You can also manually refresh the data within a single or multiple widgets, or you can configure the entire dashboard to automatically refresh at a configured time interval as shown in Figure 3. The dashboard won’t automatically refresh the widget data by default.
Figure 3: Configuring the dashboard to automatically refresh
Prerequisites
Deploying the Network Firewall CloudWatch Dashboard is straightforward. You will need the following:
A Network Firewall in your VPC.
Your Network Firewall must be configured to publish firewall flow and alert logs to two different CloudWatch log groups. For example, firewall flow logs are published to /my-firewall-flow-logs and alert logs are published to /my-firewall-alert-logs.
If you haven’t deployed Network Firewall in your VPC, you can use one of the available AWS Network Firewall Deployment Architecture templates to create a firewall. After creating a firewall, configure CloudWatch log groups for the firewall flow and alert logs and configure stateful logging as described previously. Fine-tune your firewall policy and rule configuration and make sure that you’re routing traffic symmetrically through the firewall. With the firewall now in the routed path and publishing metrics and log events, you can proceed with this Network Firewall CloudWatch dashboard template.
Deployment
The Network Firewall dashboard CloudFormation template creates a monitoring dashboard for a single Network Firewall firewall. Make sure that you launch this CloudFormation stack in the same AWS Region and account as the firewall, regardless of whether the firewall is set up centrally or in a distributed manner.
To deploy the dashboard:
Choose Launch Stack for the relevant AWS Region. Make sure that you’re signed in to the appropriate AWS account and Region.
Region: China
Region: Gov Cloud
Region: All other regions supported by AWS Network Firewall
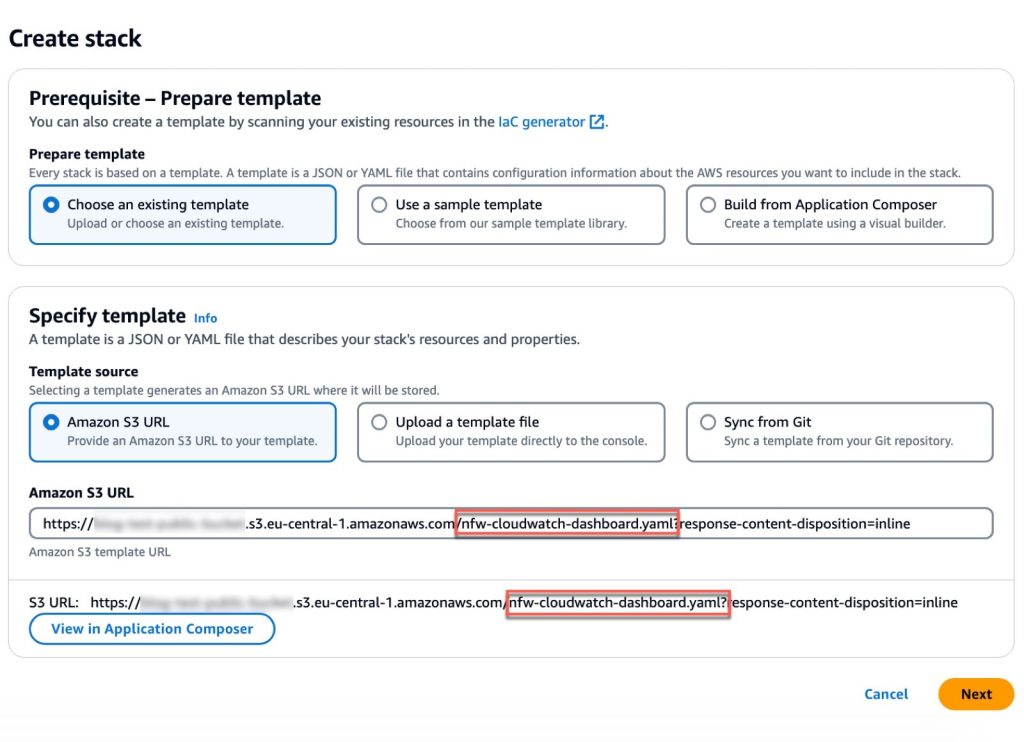
You will be redirected to the Create stack page in the AWS Management Console for CloudFormation. Make sure that you’re in the correct Region and using the correct template. Choose Next. The following are the Regions and their template names:
Figure 4: Make sure that you’re using the correct template
When launching the stack, you will need to enter the following parameters:
Stack name: A descriptive name for this CloudFormation stack. For example, my-firewall-dashboard.
Firewall name: The firewall name as seen in the Amazon VPC console. In the Amazon VPC console, choose Network Firewall in the navigation pane, then choose Firewalls.
Firewall subnets: The firewall subnet IDs to which your firewall endpoints are attached. The firewall subnets can be found on the Firewall details tab of your firewall in the Amazon VPC
Flow log group name: The name of the CloudWatch log group where your firewall flow logs are stored.
Alert log group name: The name of the CloudWatch log group where your firewall alert logs are stored.
Contributor Insights rule state: Enable or disable the Contributor Insights rules (the template defaults to enabled). Disabling will stop the rules from scanning log data and displaying results in the Contributor Insights widgets. After the rules are created, you can change the state of one or more Contributor Insights rules from CloudWatch console by choosing Insights from the navigation pane, and then choosing Contributor Insights.
After the stack reaches CREATE_COMPLETE status, go to the Outputs tab and choose the FirewallDashboardURI link to open the new dashboard in the CloudWatch Dashboards console. It might take a few minutes for the Logs Insights and Contributor Insights widgets to start displaying data. For more details about each widget, see the README. If you don’t have log events matching the query parameters in the widgets, some widgets might not show data points.
Troubleshooting
If you encounter issues during or after deployment, review the following:
Both firewall flow and alert logging are enabled, not just one.
Log group names are entered correctly; incorrect names will cause widgets to point to invalid data.
Correct subnets are selected. Incorrect choices can impact the PrivateLink metrics widgets.
Firewall name is entered correctly. An incorrect name can disrupt metrics widgets, dashboard, and Contributor Insights widget names and break the firewall link.
Cleaning up
You can delete the Network Firewall CloudWatch dashboard and all of the associated resources with a few clicks. Deleting the dashboard will not impact the routing and network traffic inspection performed by the firewall.
Sign in to the CloudFormation console in the Region where you launched the stack and choose Stacks from the navigation pane.
Select the Stack name you chose when launching the stack. For example, my-firewall-dashboard.
Choose Delete.
Conclusion
We encourage you to see for yourself how this new dashboard can enhance your network security management. To get started with the AWS Network Firewall CloudWatch Dashboard, visit our GitHub repository for detailed instructions and the CloudFormation template. For a visual overview of the dashboard and its capabilities, check out our YouTube video.
If you have feedback about this post, submit comments in the Comments section below. If you have questions about this post, contact AWS Support.
We have often seen Zabbix used as a simple tool for monitoring network assets as well as Information and Communication Technology (ICT) infrastructure. While this concept is not incorrect, it is equally important to understand that with the advancement of Zabbix versions, more and more functionalities have been made available for other types of monitoring, enabling advanced data analysis and stunning visualizations through new and modern widgets in the frontend layer.
In this short blog post, we will explore some of the existing yet under-discussed features of Zabbix that contribute to the maturity of the cybersecurity discipline within organizations — a topic that is becoming increasingly critical in the corporate environment.
Table of Contents
FIM – File Integrity Monitoring
FIM is a very common concept among information security tools, specifically in tools like SIEM/XDR (Security Information Event Management/Extended Detection and Response). The name is quite suggestive of its usability, but while some tools highlight this feature as one of their main functionalities, it is also available for those who use Zabbix – just not explicitly labeled under this name.
Here, we will approach FIM as a concept rather than just a functionality. This is because we aim to achieve a result, not merely have a menu with a name to claim compliance while using our tool. In fact, the outcome needs to be more important than mere “marketing.”
What should we expect from FIM?
Imagine that your servers have certain directories and/or files so critical that you cannot afford to neglect monitoring them for changes, insertions, or deletions. Additionally, these files may have owners and properties that must not be altered – otherwise, the systems that depend on them might lose the ability to read or execute their functions. This, at a minimum, is what we expect from FIM as a functionality.
To illustrate this a bit further, consider a database service like MariaDB:
# ls -lR /etc/mysql/
/etc/mysql/:
total 24
drwxr-xr-x 2 root root 4096 Jun 25 18:40 conf.d
-rwxr-xr-x 1 root root 1740 Nov 30 2023 debian-start
-rw------- 1 root root 544 Jun 25 18:43 debian.cnf
-rw-r--r-- 1 root root 1126 Nov 30 2023 mariadb.cnf
drwxr-xr-x 2 root root 4096 Sep 30 16:36 mariadb.conf.d
lrwxrwxrwx 1 root root 24 Oct 20 2020 my.cnf -> /etc/alternatives/my.cnf
-rw-r--r-- 1 root root 839 Oct 20 2020 my.cnf.fallback

/etc/mysql/conf.d:
total 8
-rw-r--r-- 1 root root 8 Oct 20 2020 mysql.cnf
-rw-r--r-- 1 root root 55 Oct 20 2020 mysqldump.cnf

/etc/mysql/mariadb.conf.d:
total 40
-rw-r--r-- 1 root root 575 Nov 30 2023 50-client.cnf
-rw-r--r-- 1 root root 231 Nov 30 2023 50-mysql-clients.cnf
-rw-r--r-- 1 root root 927 Nov 30 2023 50-mysqld_safe.cnf
-rw-r--r-- 1 root root 3795 Sep 30 16:36 50-server.cnf
-rw-r--r-- 1 root root 570 Nov 30 2023 60-galera.cnf
-rw-r--r-- 1 root root 76 Nov 8 2023 provider_bzip2.cnf
-rw-r--r-- 1 root root 72 Nov 8 2023 provider_lz4.cnf
-rw-r--r-- 1 root root 74 Nov 8 2023 provider_lzma.cnf
-rw-r--r-- 1 root root 72 Nov 8 2023 provider_lzo.cnf
-rw-r--r-- 1 root root 78 Nov 8 2023 provider_snappy.cnf
All the files, directories, and subdirectories listed above have already been configured, and the system (whatever it may be) is functioning perfectly. However, if someone suddenly decides to alter a configuration in the file /etc/mysql/mariadb.conf.d/50-server.cnf, this could be disastrous for the service. Regardless, the important thing to do is to monitor this scope and notify the relevant stakeholders so that an appropriate analysis can be conducted.
Zabbix can help with that. Let’s see how.
Zabbix and File Integrity Monitoring functions
Consider that the Zabbix agent is installed on the server to be monitored:
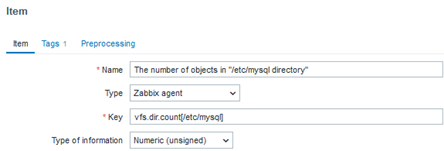
vfs.dir.count[/etc/mysql]
With this key, we can count the objects present within the /etc/mysql directory. Subsequently, we can create a trigger to be activated if there is any change related to the initial collection count, such as someone deleting or adding a file or directory in this location.
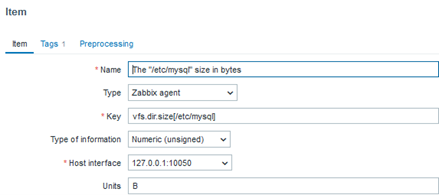
vfs.dir.size[/etc/mysql]
With this key, we can determine the total size in bytes used by the directories and configuration files. In the future, we can create a trigger that activates when this size changes, indicating the deletion or addition of a file.
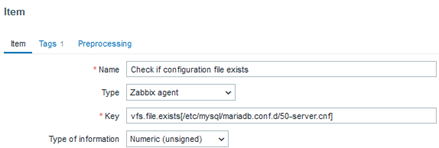
Among several important files, we may have a greater interest in some configuration files, and we can validate their existence by creating a trigger that activates when such a file ceases to exist. This will clearly indicate that something important has disappeared.
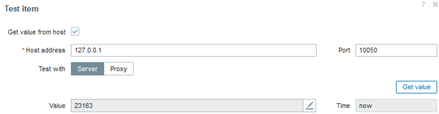
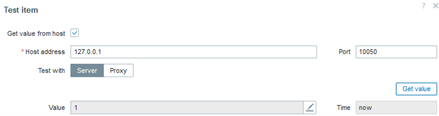
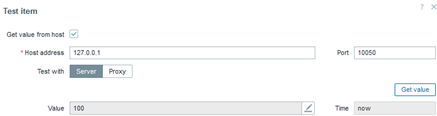
In this case, the value “1” represents “OK” for the existence of the file.
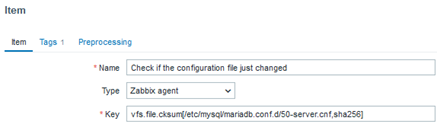
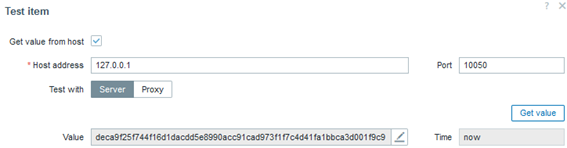
In addition to verifying the existence of the configuration file we consider important, we need to be informed if anything in it changes. This key handles that by generating a hash in a variety of possible formats, allowing a trigger to be activated in case of a hash change, which would reflect a file modification (unfortunately, we won’t know what exactly was altered).
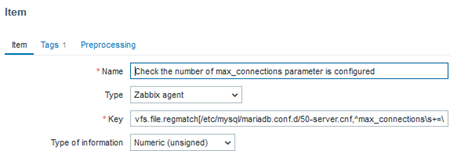
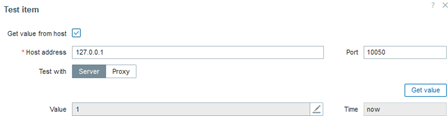
We might have a specific parameter of interest – for example, the maximum number of connections allowed to the database. Monitoring this is important because if the configuration is set to the default value, it means that no “tuning” has been applied to the database. Alternatively, it could mean that someone simply deleted or commented out this line, causing it to be ignored by the system. Therefore, verifying whether the parameter exists and is properly configured is crucial.
In this case, the value “1” indicates that the regular expression was successfully found, meaning that the configuration or parameter we need to exist is indeed present.
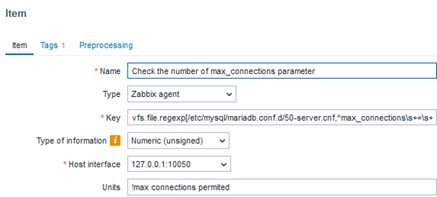
Beyond verifying the existence and integrity of the file, it is also possible to determine what was changed within it. However, we would need to specify the configuration of interest using a regular expression. For example, considering that the maximum number of connections allowed by the database system is “x,” we can be alerted by a trigger if it changes to “y,” “z,” or any other value different from “x.” This setup allows us to monitor the parameter of interest with precision. This logic can be applied to any other parameter you consider important. Of course, there is another way to automate this process, but we will not cover that automation here.
In this case, the parameter defining the maximum number of connections is not only present, but we also know the exact number of connections. This way, we will have a history of the applied parameterization in case it is changed at any point.
The two keys above allow us to determine the owner of a file and (in the case of a Linux system) the owning group. We can also choose to monitor the user’s name or their UID in the system. Naturally, a trigger can be activated to alert us in case of an ownership change, indicating that someone might be “taking over” an important file in the system.
The key above allows us to determine a file’s permissions—read, write, read and write, execution, or a special permission bit. Naturally, a trigger can be activated to alert us if there is any permission change in the file.
The key above does not exist by default. It was created with a UserParameter, which is a customization for verifying a command that, in this case, checks the attributes of a specific file. Consider the following command executed directly in your system’s terminal:
…it could mean that someone does not want the system to log when this file was accessed (refer to the chattr command manual). Additionally, any other attribute can be added or removed, which poses a risk to the system because these attributes can alter how files are accessed, stored on disk, and later read. Therefore, we can create a UserParameter as follows:
When creating the item, don’t forget to create the trigger that should be activated in case there is a change in the attribute of a file, whatever it may be.
Paying attention to file access and modification times
To delve a bit deeper into the concept of FIM, we should ask ourselves if we are monitoring file access and modifications concerning their timestamps. In a way, if we have implemented everything proposed above, the answer is yes.
That said, there is an easier way to keep track of all the things we’ve discussed. It involves using this key:
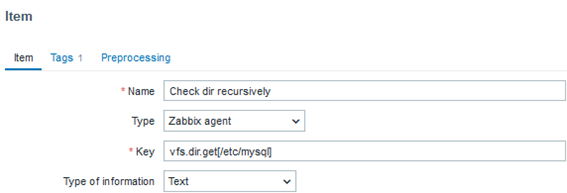
vfs.dir.get[/etc/mysql]
When creating an item with this key, we will recursively obtain all its objects, such as subdirectories and files. The output format will be a JSON, which allows us to create LLD (Low-level Discovery) rules to automate FIM. Below is a small snippet of the monitoring output:
Considering that the output includes all objects from the main directory, this would be the most sensible approach to configure our FIM. However, it is necessary to create the LLD and prototypes. We will not cover this in detail in this article, but this is the path I recommend you follow.
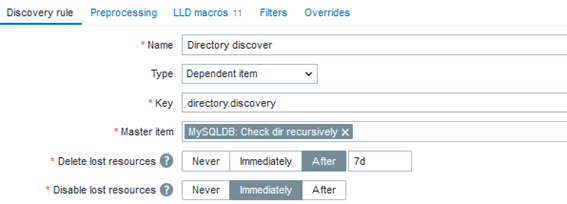
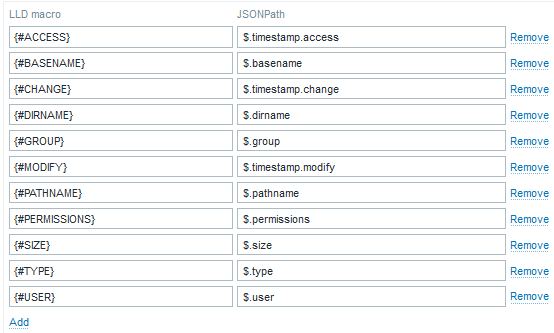
Below is a “blueprint” for an LLD to create automated File Integrity Monitoring:
The “Master item”:
The “Dependent rule”:
The LLD Macro:
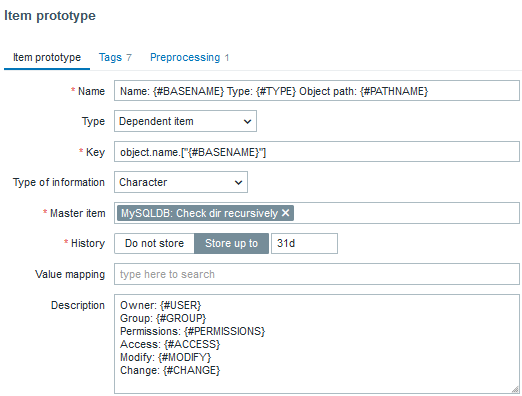
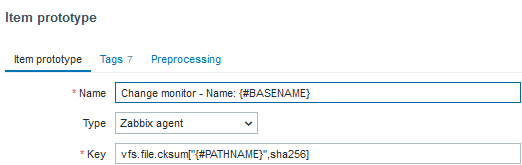
The item prototypes:
Below are the components of a trigger prototype (I created just one to symbolize a type of alert for file modification):
Name: Object: {#BASENAME} just changed

Event name: Object: {#BASENAME} just changed. Last hash: {ITEM.VALUE} The previous one: {?last(/MySQLDB/vfs.file.cksum["{#PATHNAME}",sha256],#2)} Object: {#BASENAME} just changed. Last hash: {ITEM.VALUE} The previous one: {?last(/MySQLDB/vfs.file.cksum["{#PATHNAME}",sha256],#2)}

Severity: Warning

Expression: last(/MySQLDB/vfs.file.cksum["{#PATHNAME}",sha256],#1)<>last(/MySQLDB/vfs.file.cksum["{#PATHNAME}",sha256],#2)
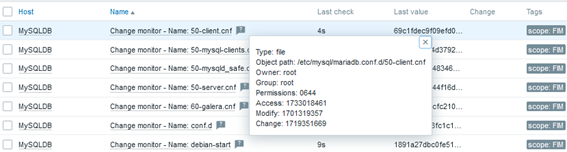
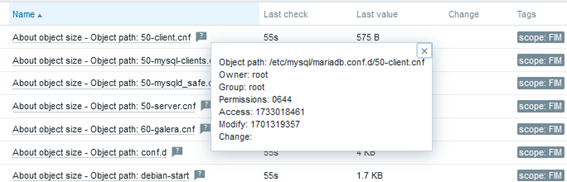
And then, some results:
Conclusion
The implementation of a robust File Integrity Monitoring system helps to ensure the security of IT infrastructure. Detecting unauthorized changes in critical files helps prevent attacks, identify security breaches, and ensure the integrity and availability of systems. With Zabbix, we have an effective solution to implement FIM, enabling process automation and the real-time visualization of changes. This monitoring not only reinforces protection against intrusions but also facilitates auditing and compliance with regulatory standards.
The main benefits of integrating File Integrity Monitoring with Zabbix include:
1. Early detection of changes in critical files, enabling quick responses.
2. Enhanced compliance with security regulations and internal policies.
3. Protection against malware and ransomware by identifying changes in essential files.
4. Ease of auditing with automated reports and modification histories.
5. Greater visibility and control over the integrity of data and systems in real time.
6. Operational efficiency through the automation of alerts and reports.
7. Improved proactive security, helping prevent attacks before they become critical.
By using Zabbix, organizations can strengthen their security posture and optimize risk management, ensuring that any unauthorized changes are detected and promptly corrected.
Zabbix is an open-source monitoring tool designed to oversee multiple IT infrastructure components, including networks, servers, virtual machines, and cloud services. It operates using both agent-based and agentless monitoring methods. Agents can be installed on monitored devices to collect performance data and report back to a centralized Zabbix server.
Zabbix provides comprehensive integration capabilities for monitoring VMware environments, including ESXi hypervisors, vCenter servers, and virtual machines (VMs). This integration allows administrators to effectively track performance metrics and resource usage across their VMware infrastructure.
In this post, I will show you how to set up Zabbix monitoring with a VMware vSphere infrastructure.
Table of Contents
Requirements:
Zabbix server
Access to the VMware vCenter Server
Step one: Create a Zabbix service user in the vCenter
First things first, let’s create a service user on the vCenter that will be used by the Zabbix server to collect data. To make life easier, in my lab setup the user [email protected] will have full Administrator privileges. Read-only permissions should be enough, however.
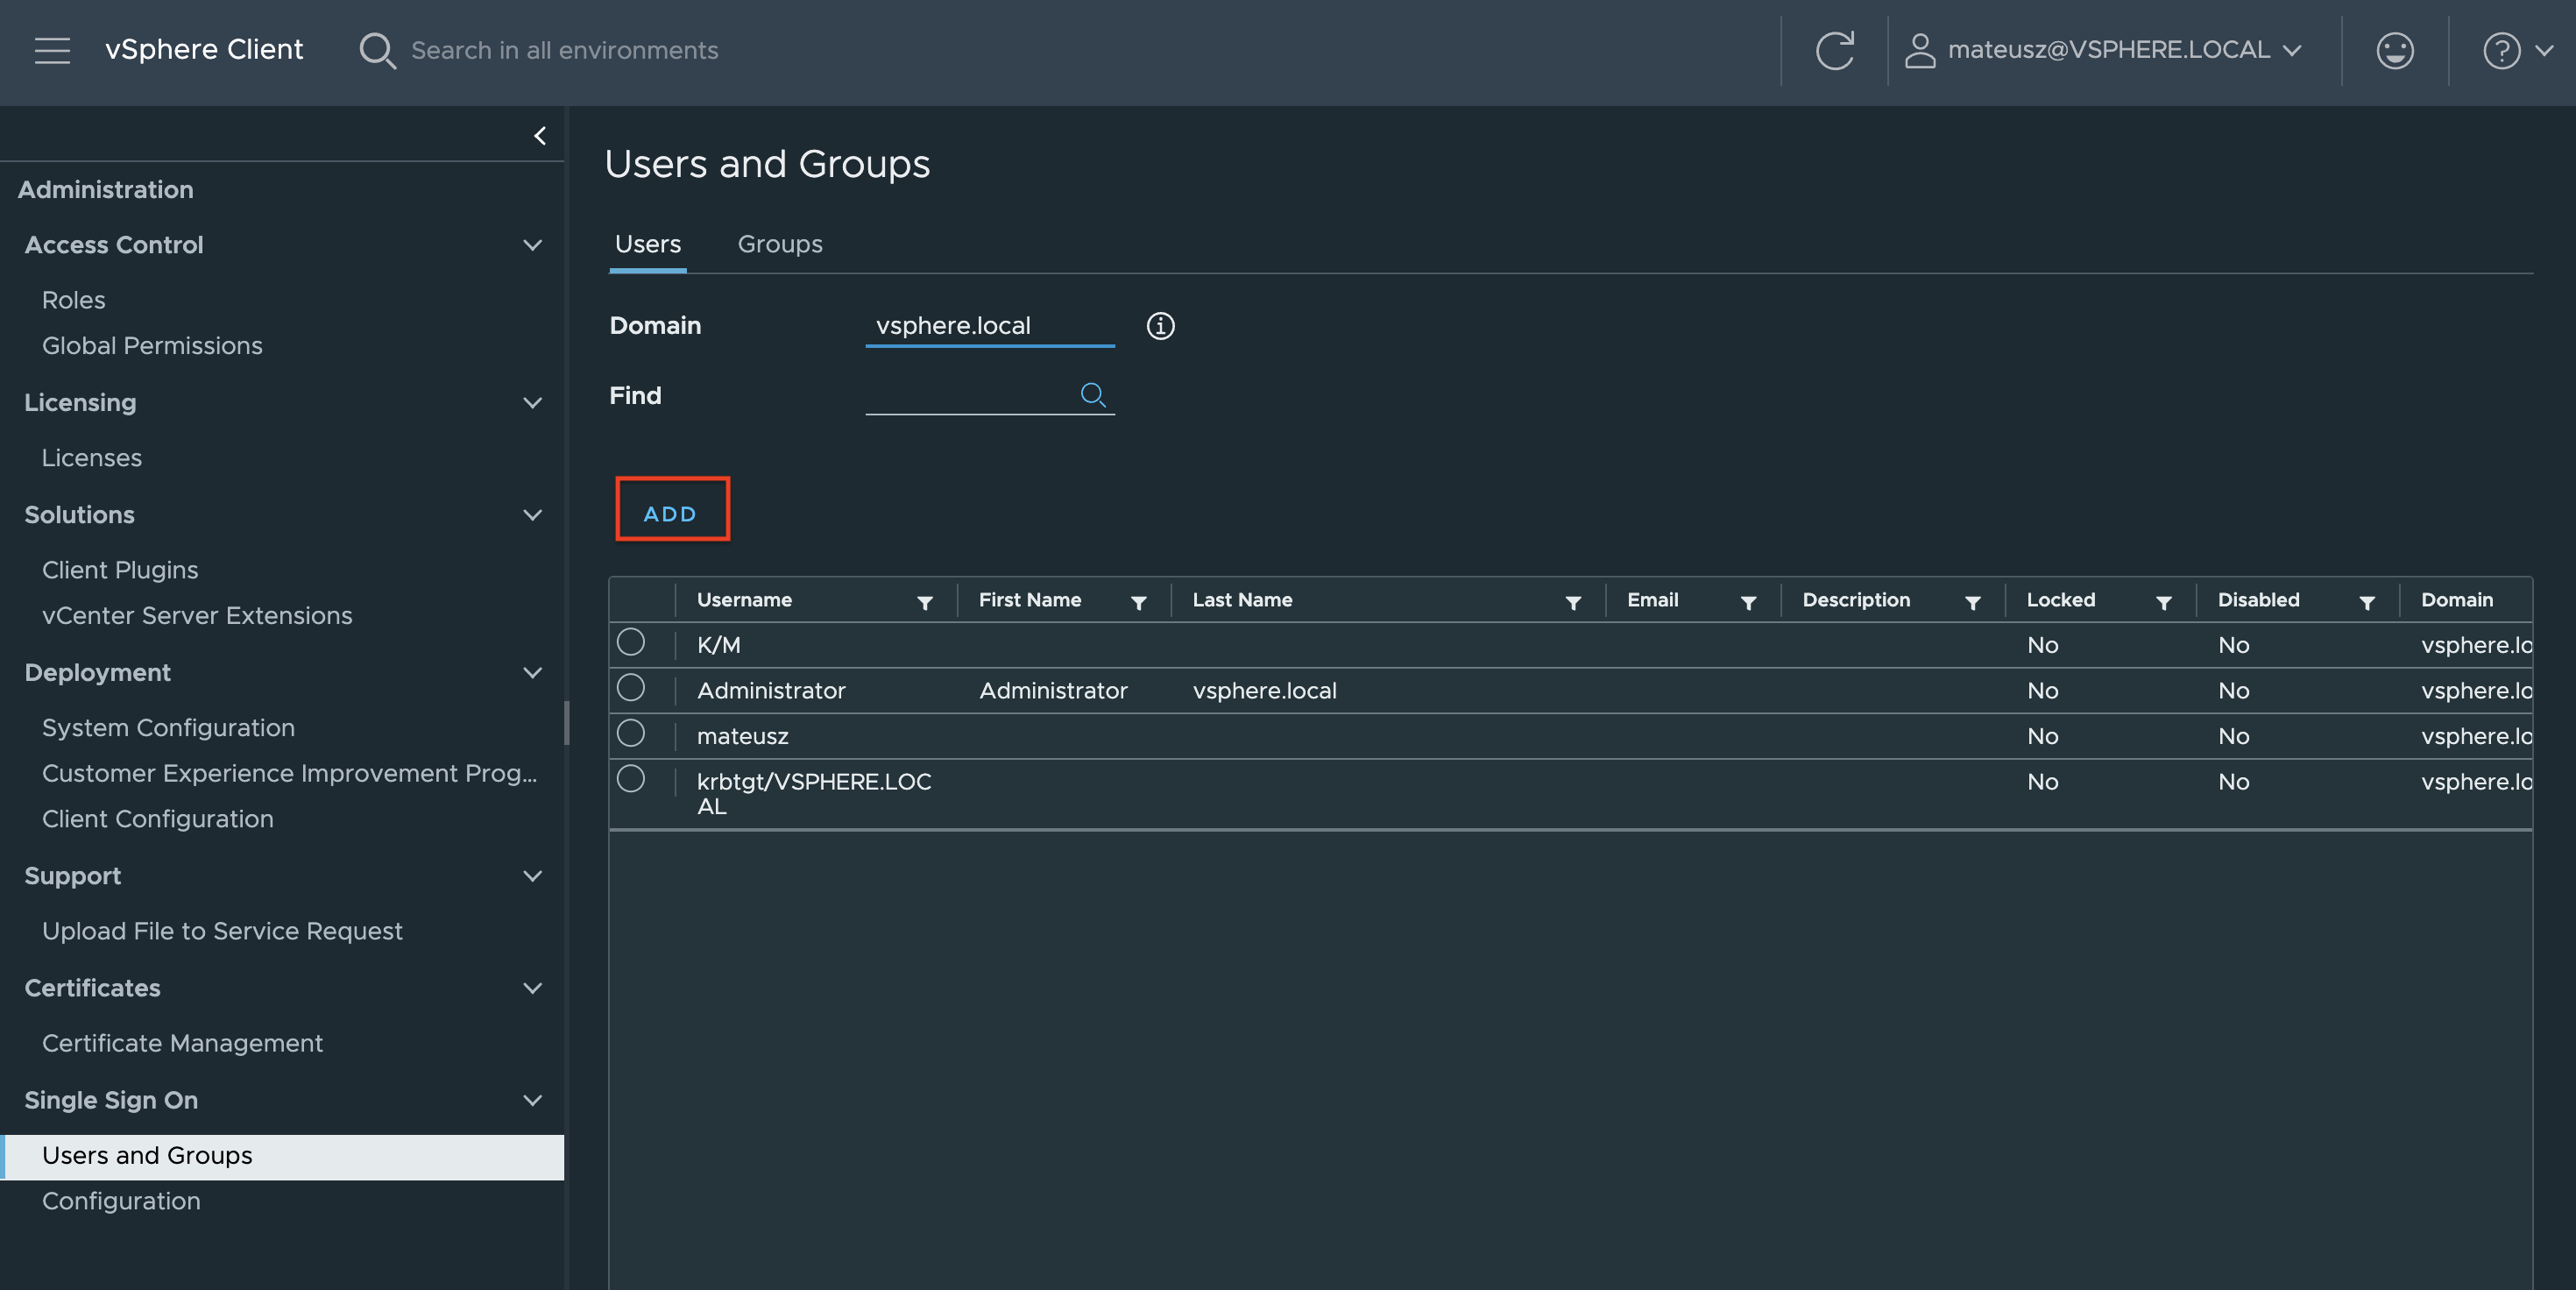
1. In the vSphere Client, choose Menu -> Administration -> Users and Groups. From the Users tab, select Domain vsphere.local, and click the ADD button to add a new user.
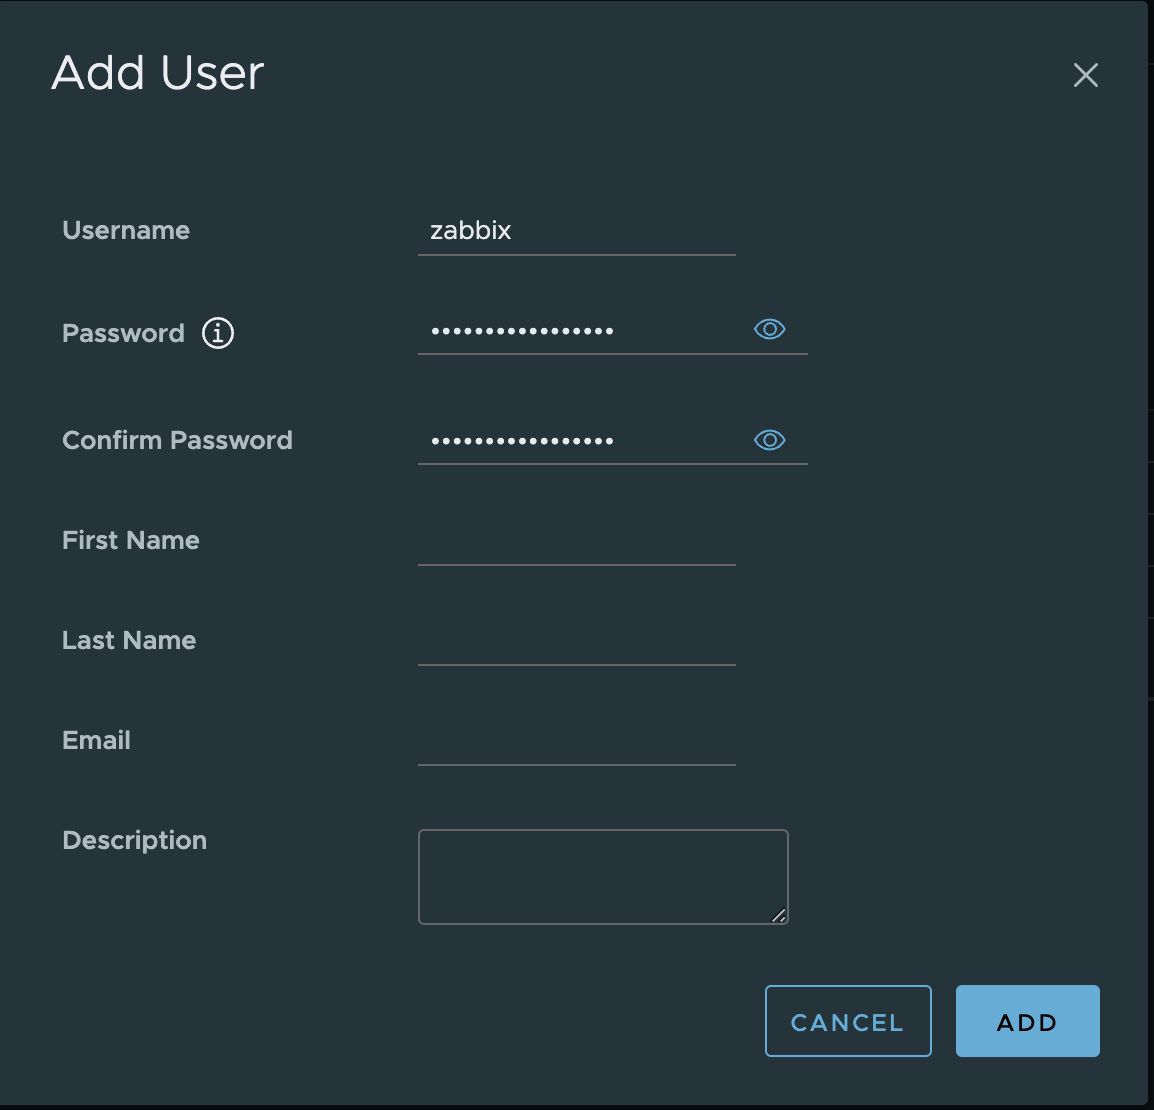
2. Type a username and password. Click ADD to create a new user.
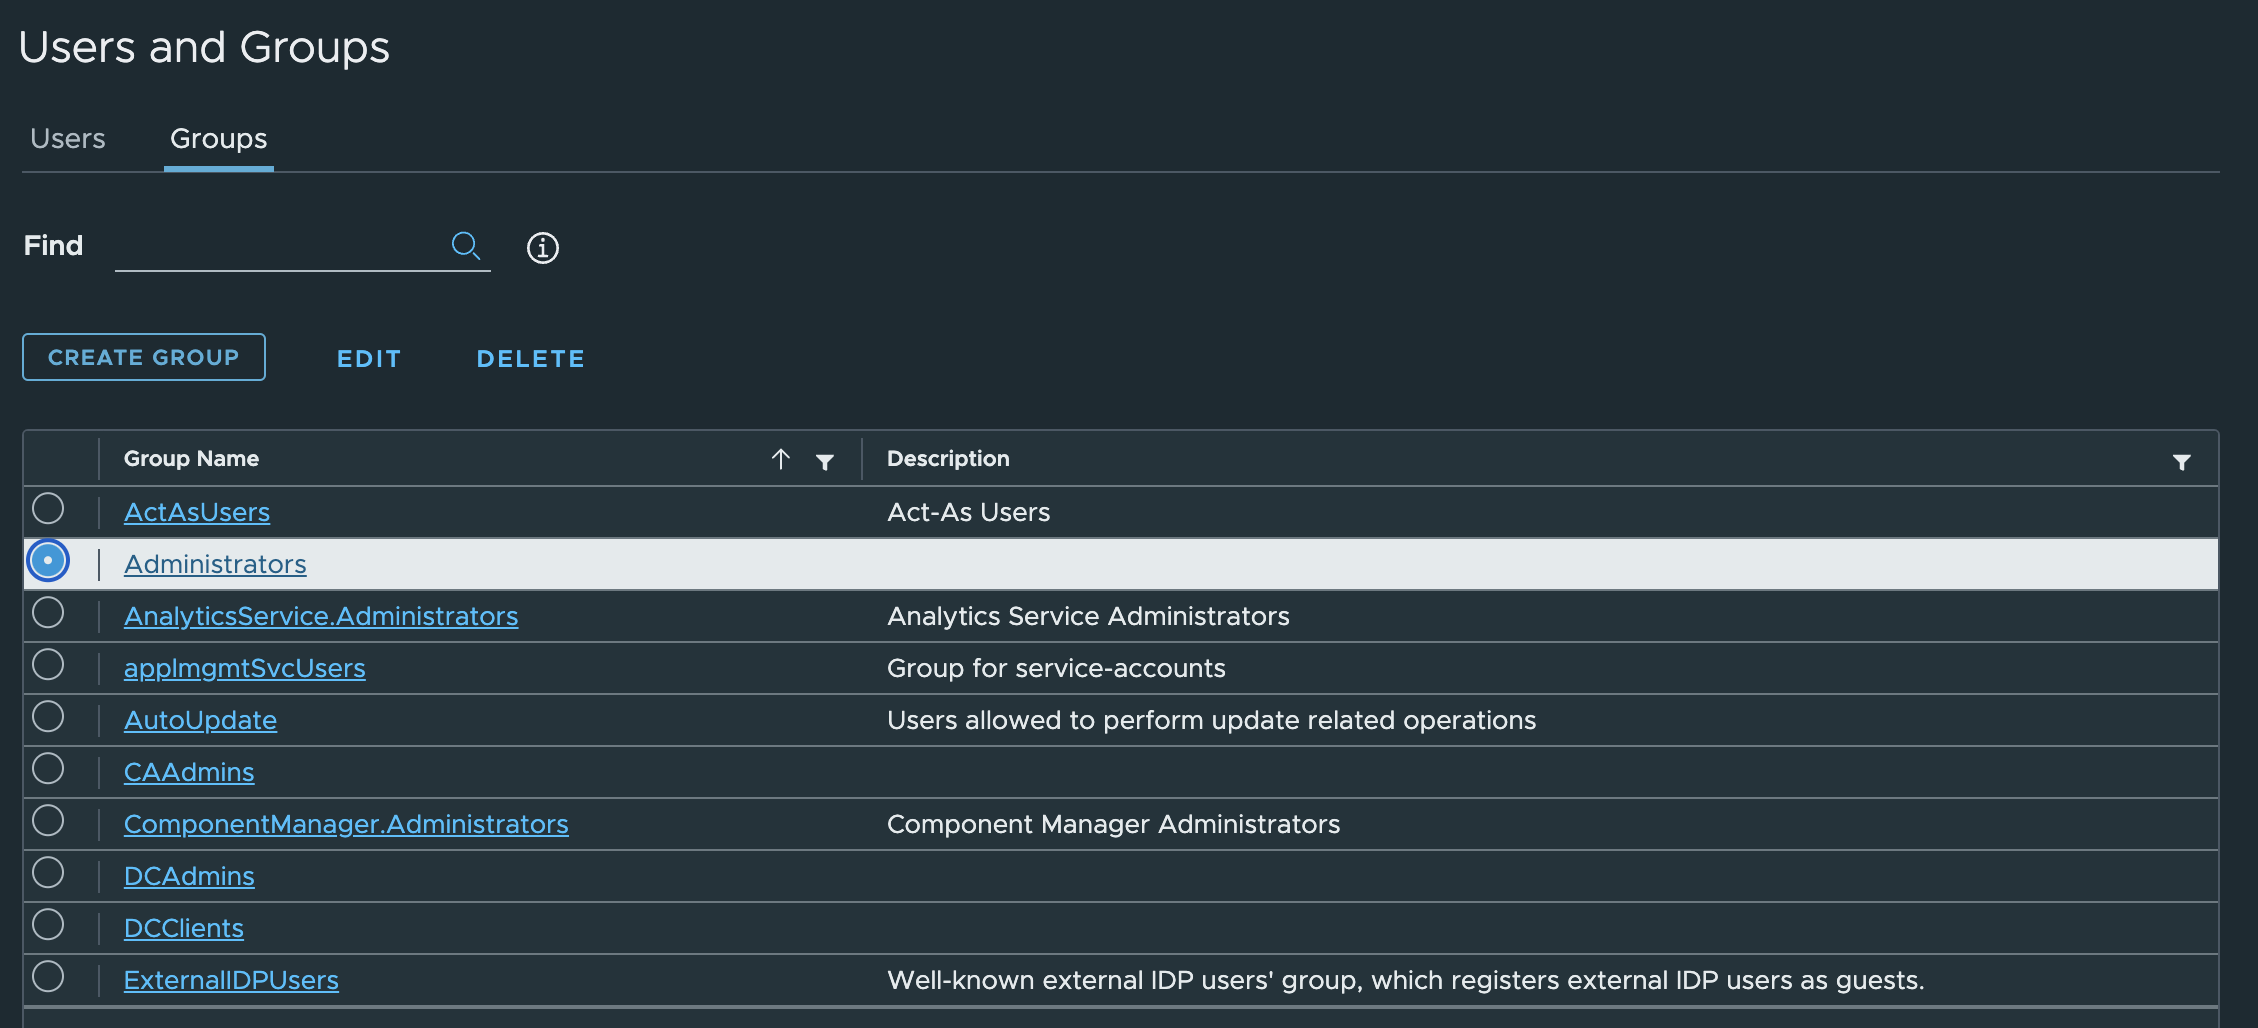
3. Change the tab to Groups and select the Administrators group.
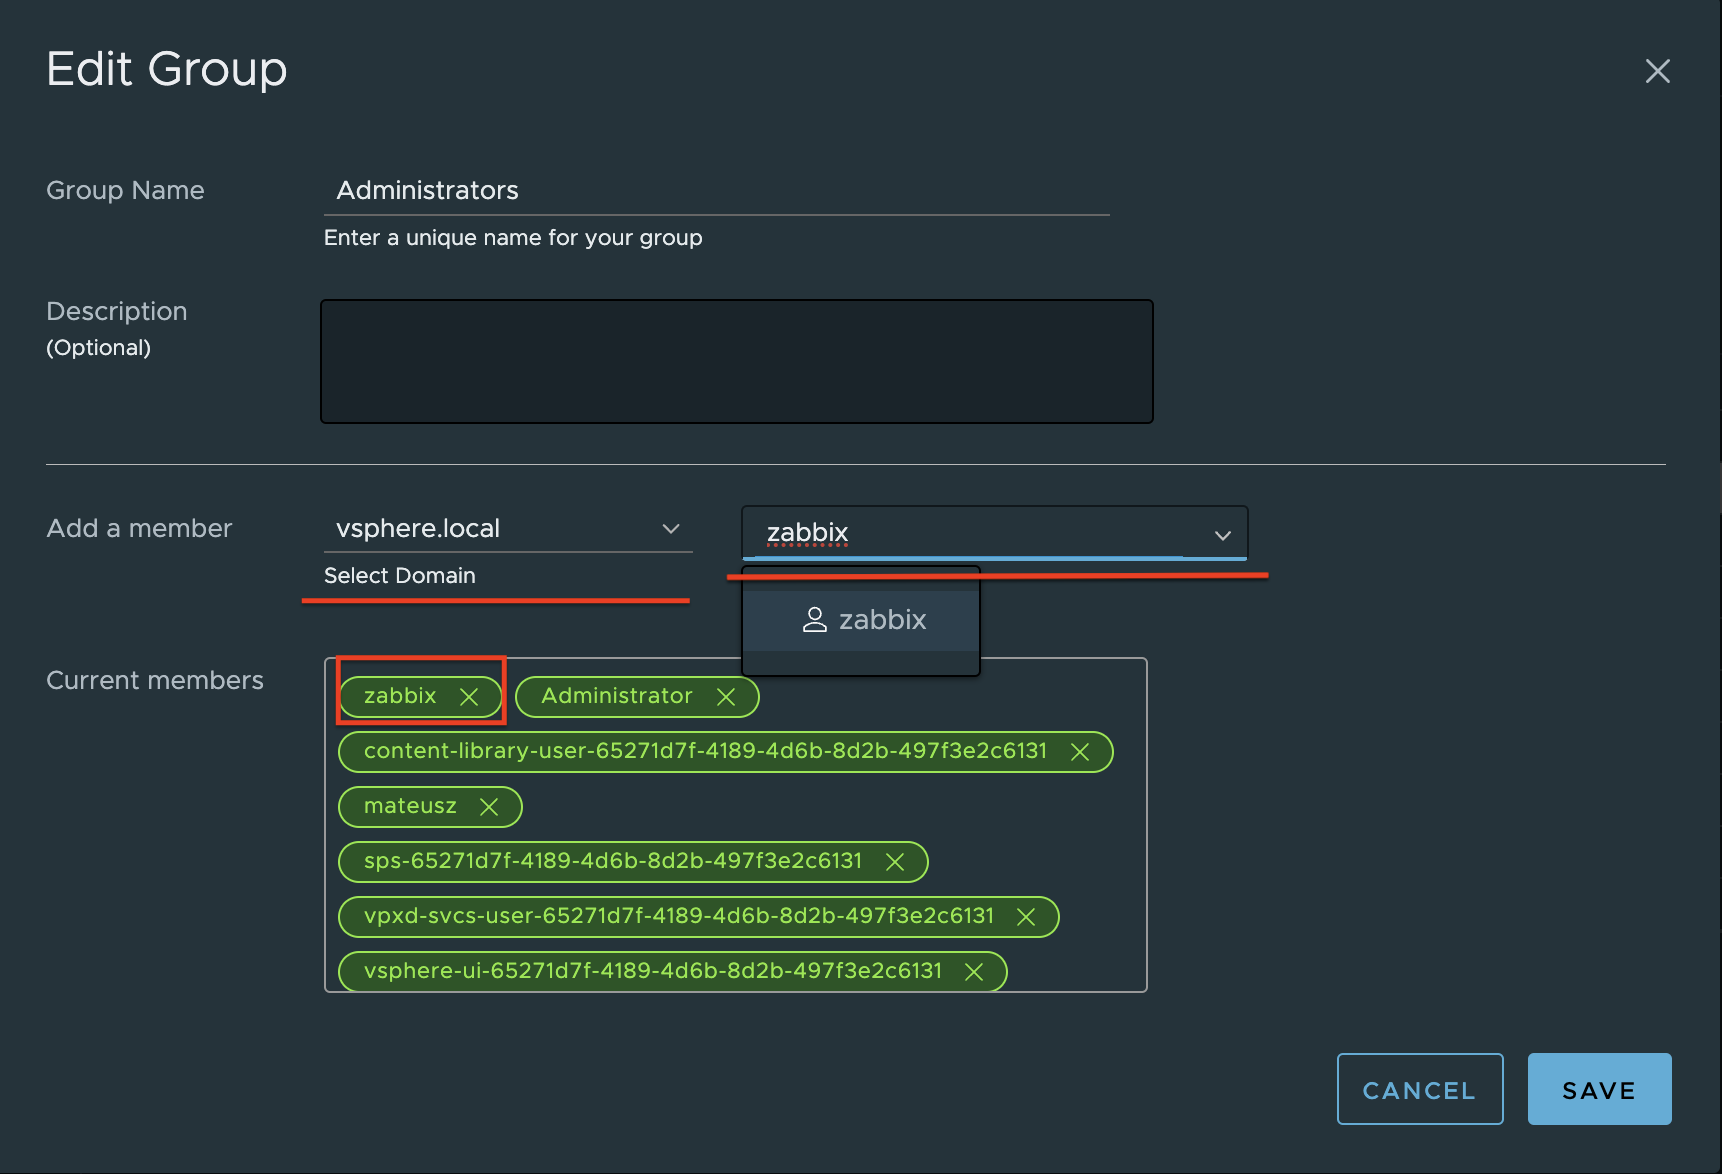
4. Find a new user zabbix, click on it and save. The user is added to the Administrators group.
5. From the Host and Clusters view, choose vCenter name and go to the Permissions tab. Click the Add button.
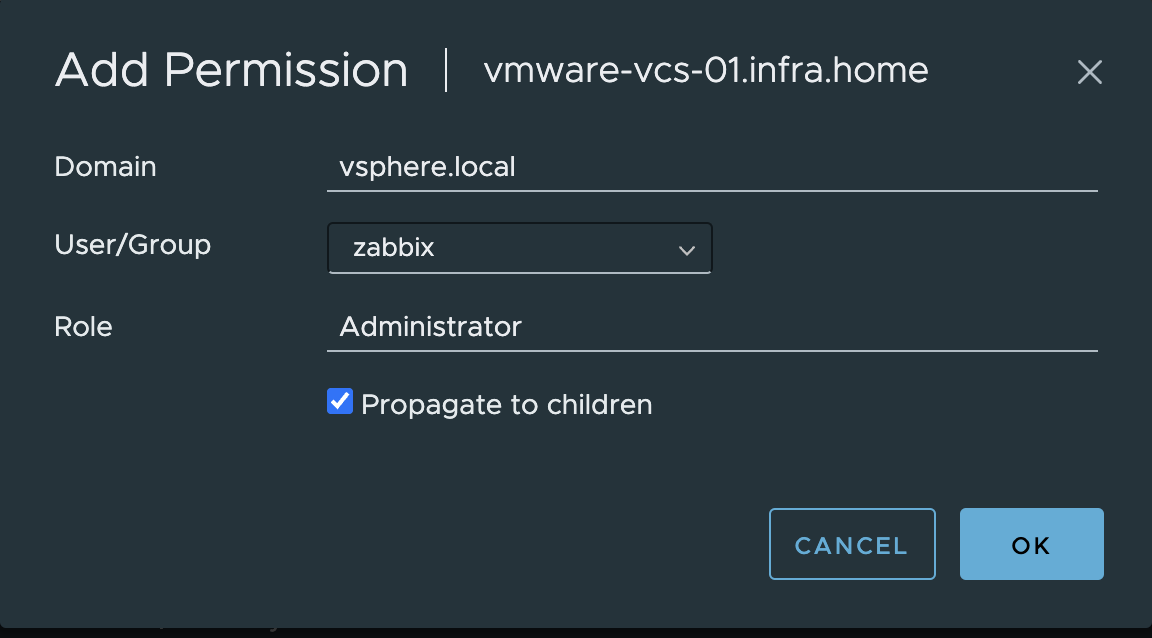
6. Choose a proper domain (vsphere.local), find the user zabbix, set the role to Administrator, and check Propagate to children. Click OK to give those permissions.
Step two: Make changes on the Zabbix server
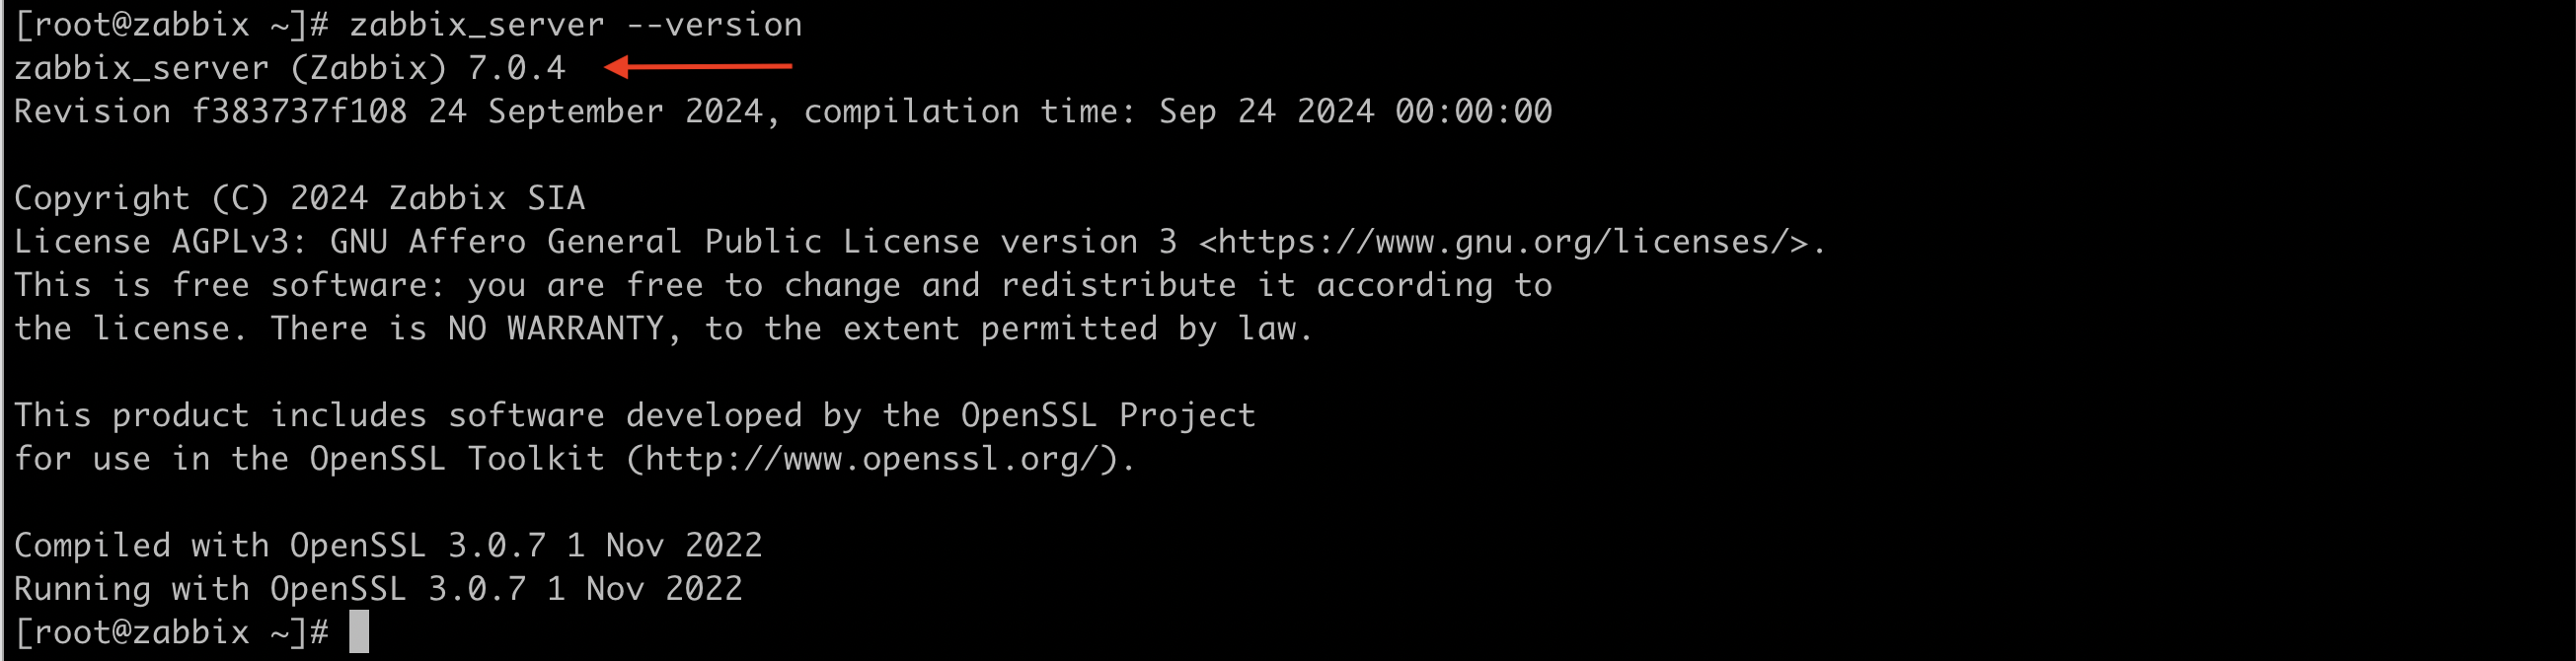
Next, we need to edit zabbix_server.conf. In this file we need to enable the vmware collector process. It’s necessary to start VMware monitoring. FYI, I have installed Zabbix server in version 7.0.4.
1. Edit a configuration file zabbix_server.conf
vim /etc/zabbix/zabbix_server.conf
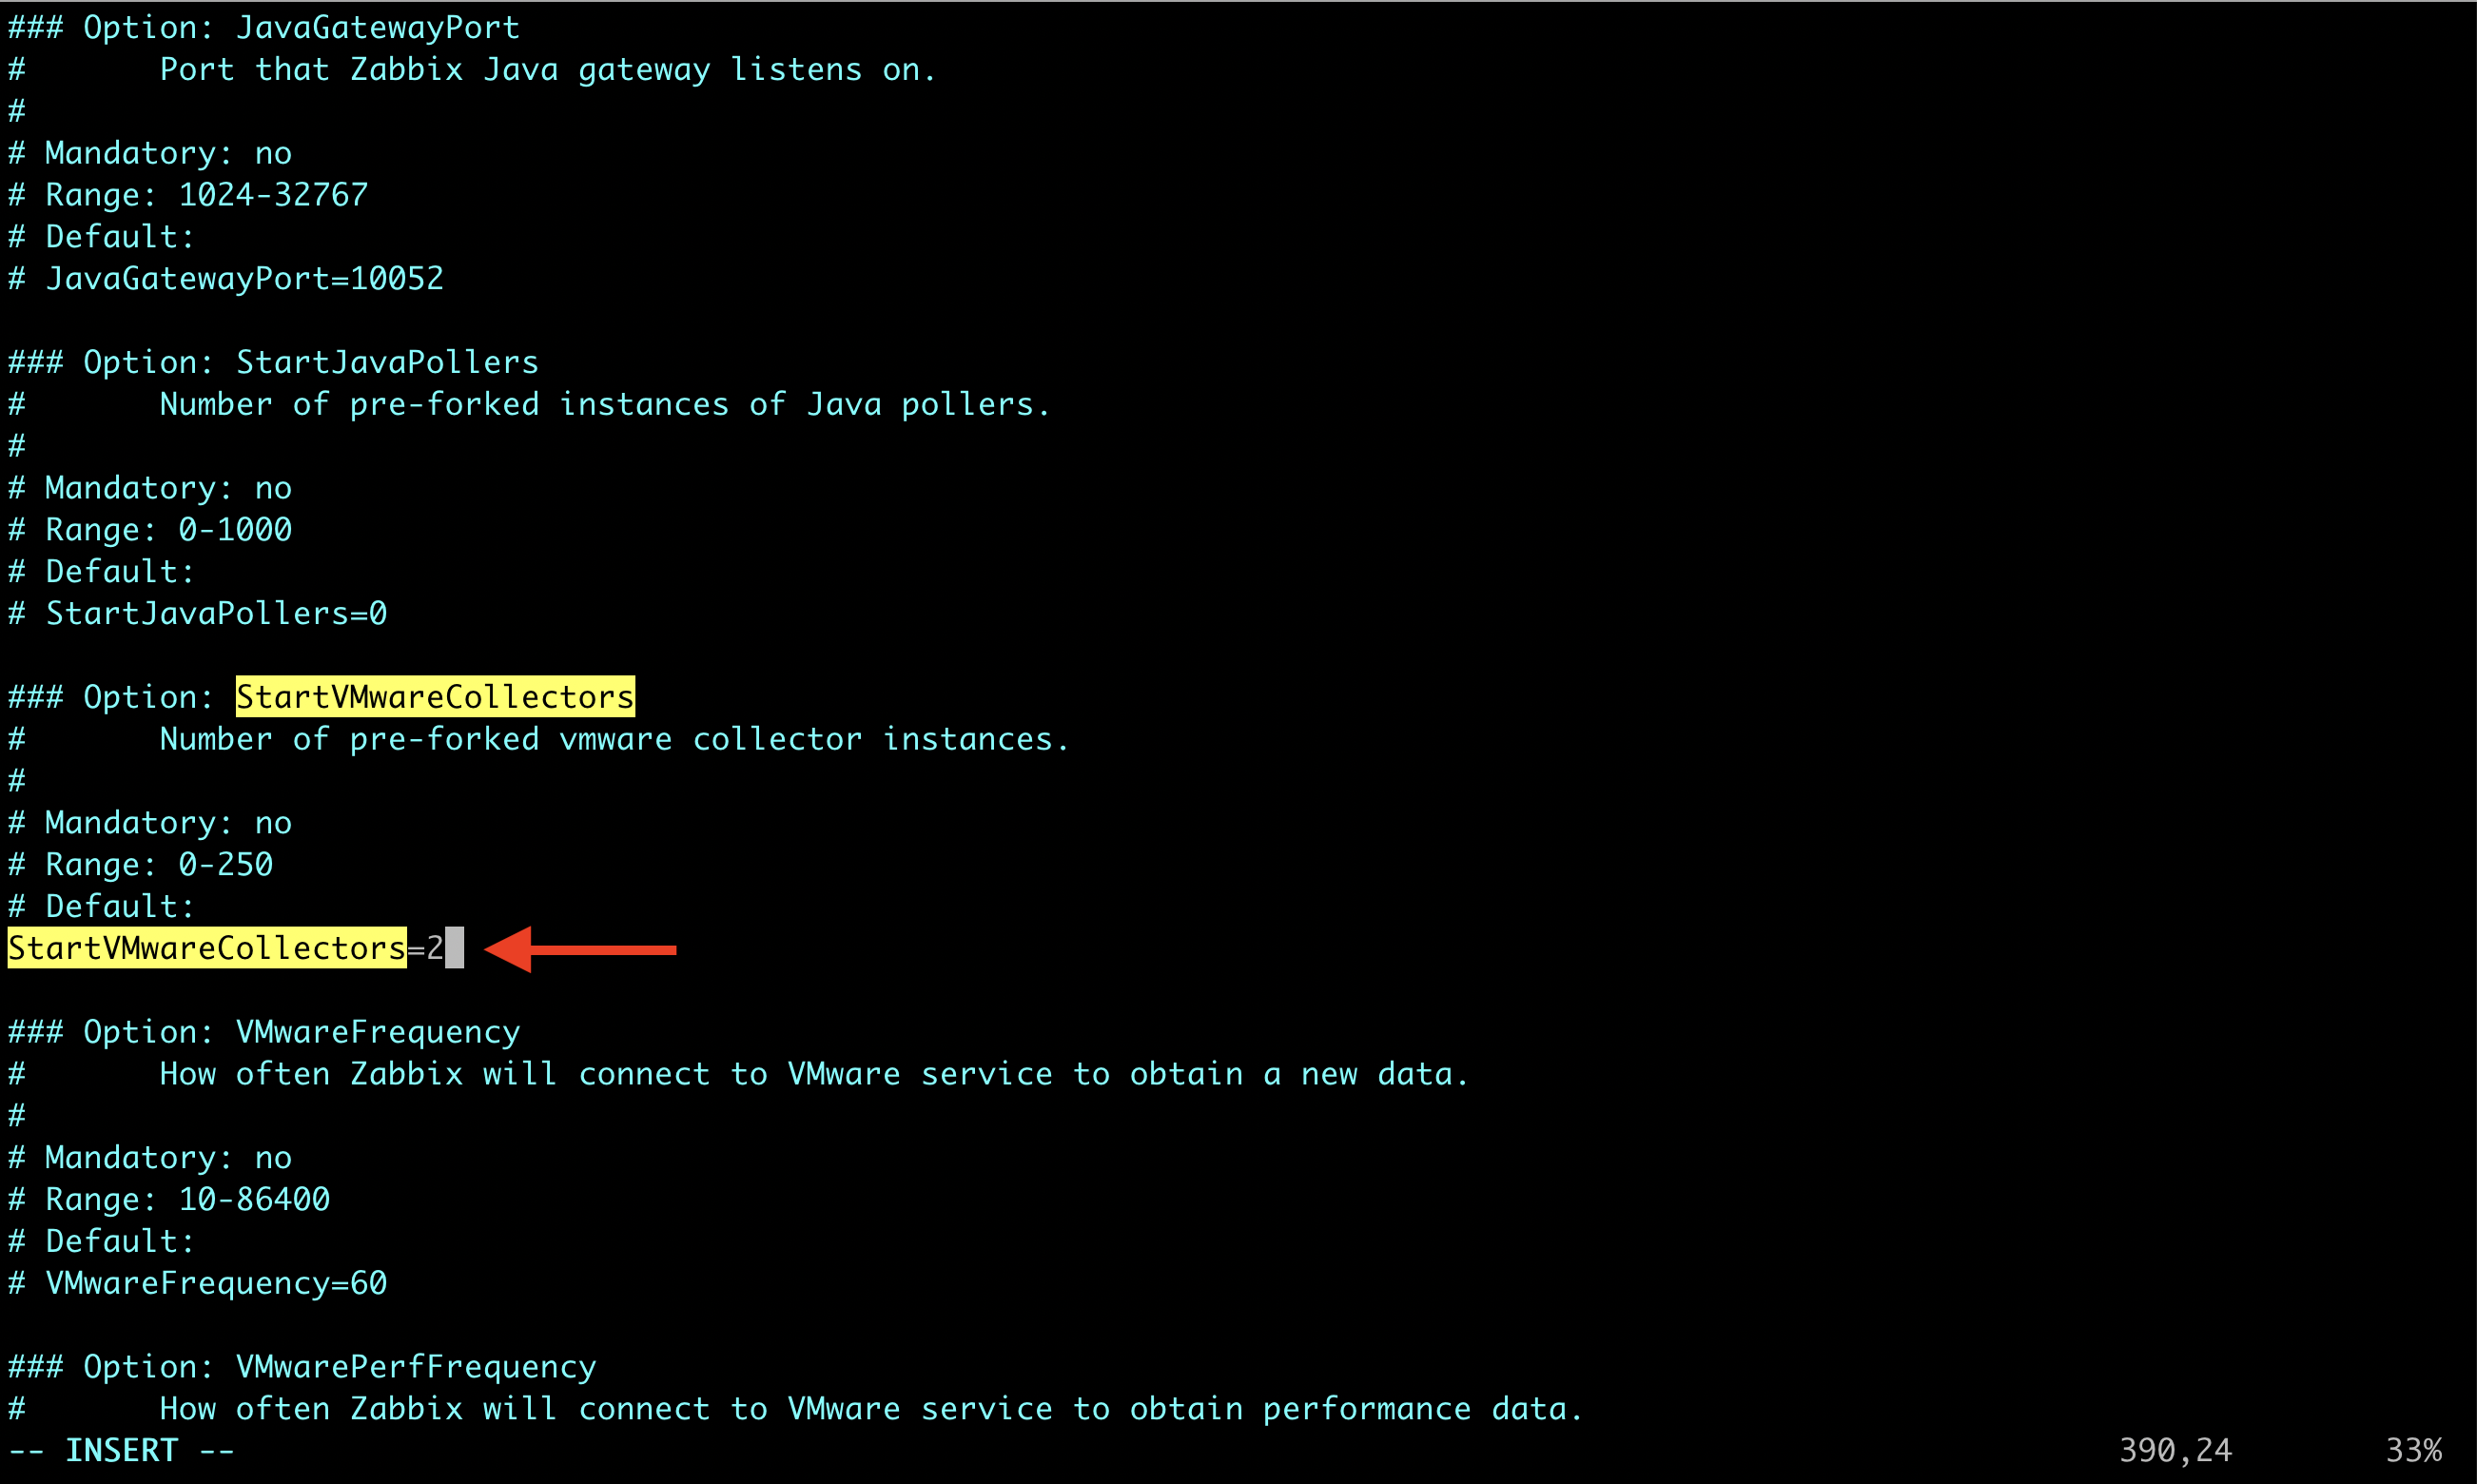
2. Find the StartVMwareCollectors parameter, delete “#” before it and change the value from 0 to at least 2. Save the file and exit.
Except for StartVMwareCollectors which is mandatory, it’s possible to enable and modify additional VMware parameters. You can find more details about them HERE. VMwareCacheSize VMwareFrequency VMwarePerfFrequency VMwareTimeout
3. Restart the zabbix-server service.
systemctl restart zabbix-server
Step three: Configure the VMware template on Zabbix
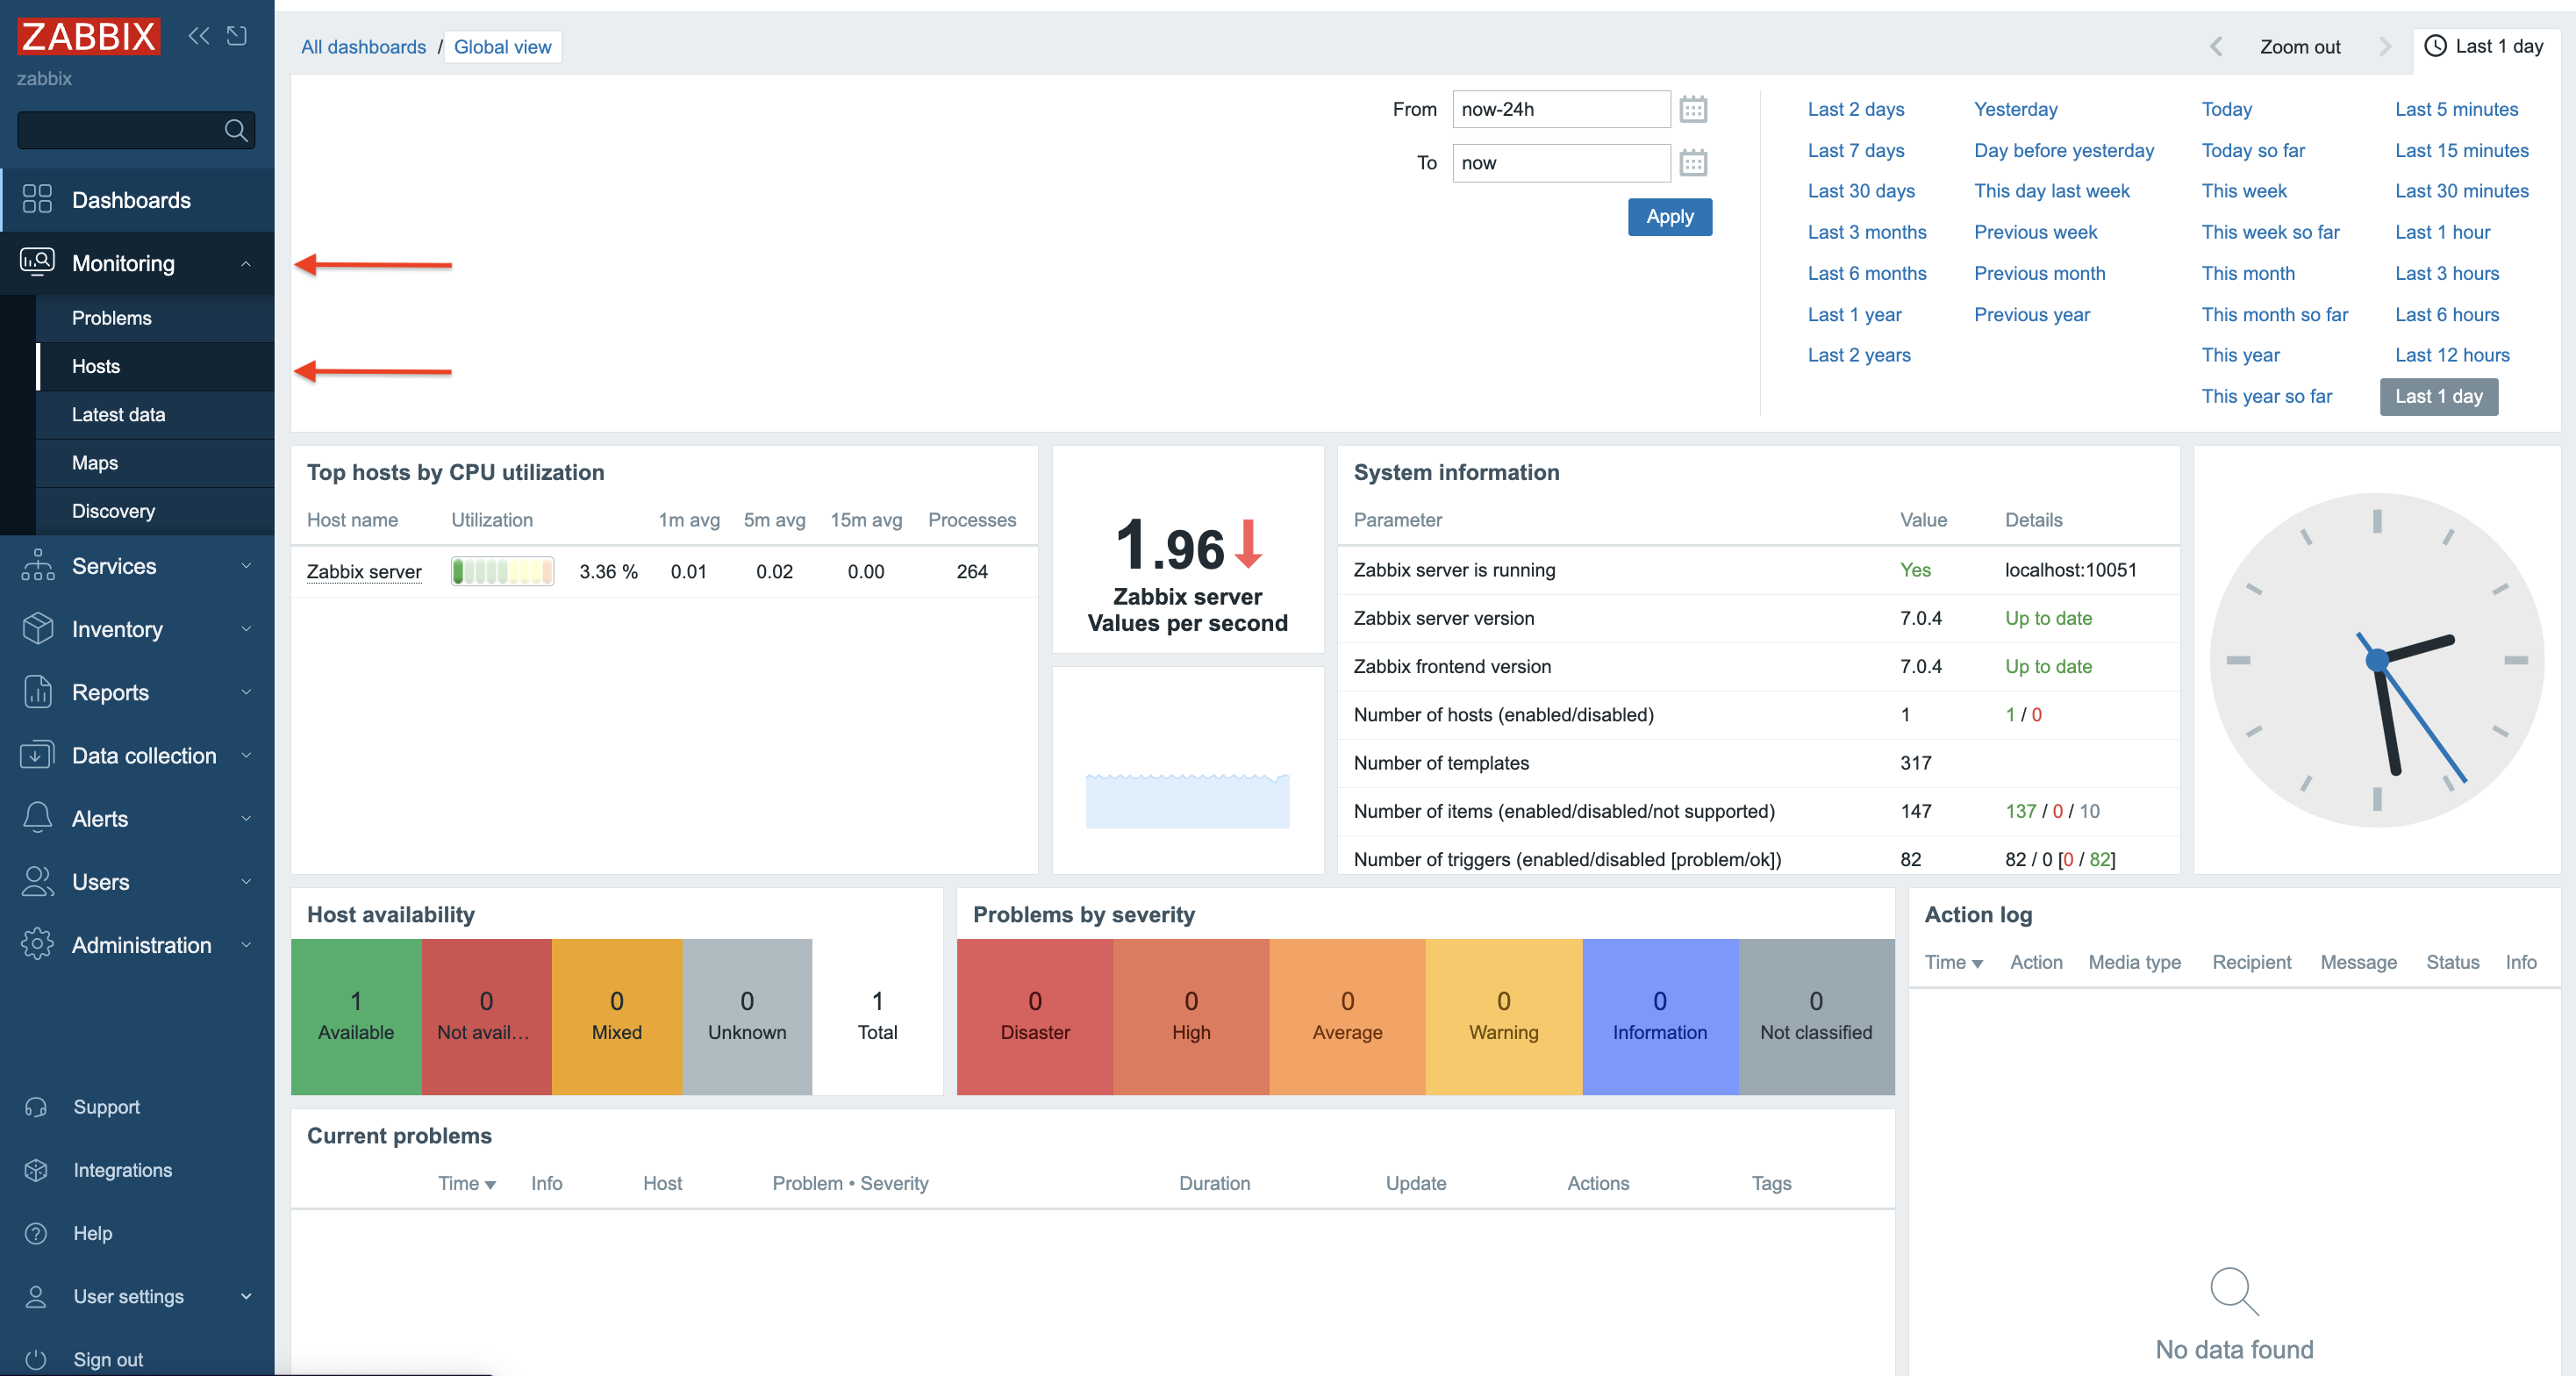
1.Log in to the Zabbix server via GUI – http://zabbix_server/zabbix. Go to the Hosts section under the Monitoring tab.
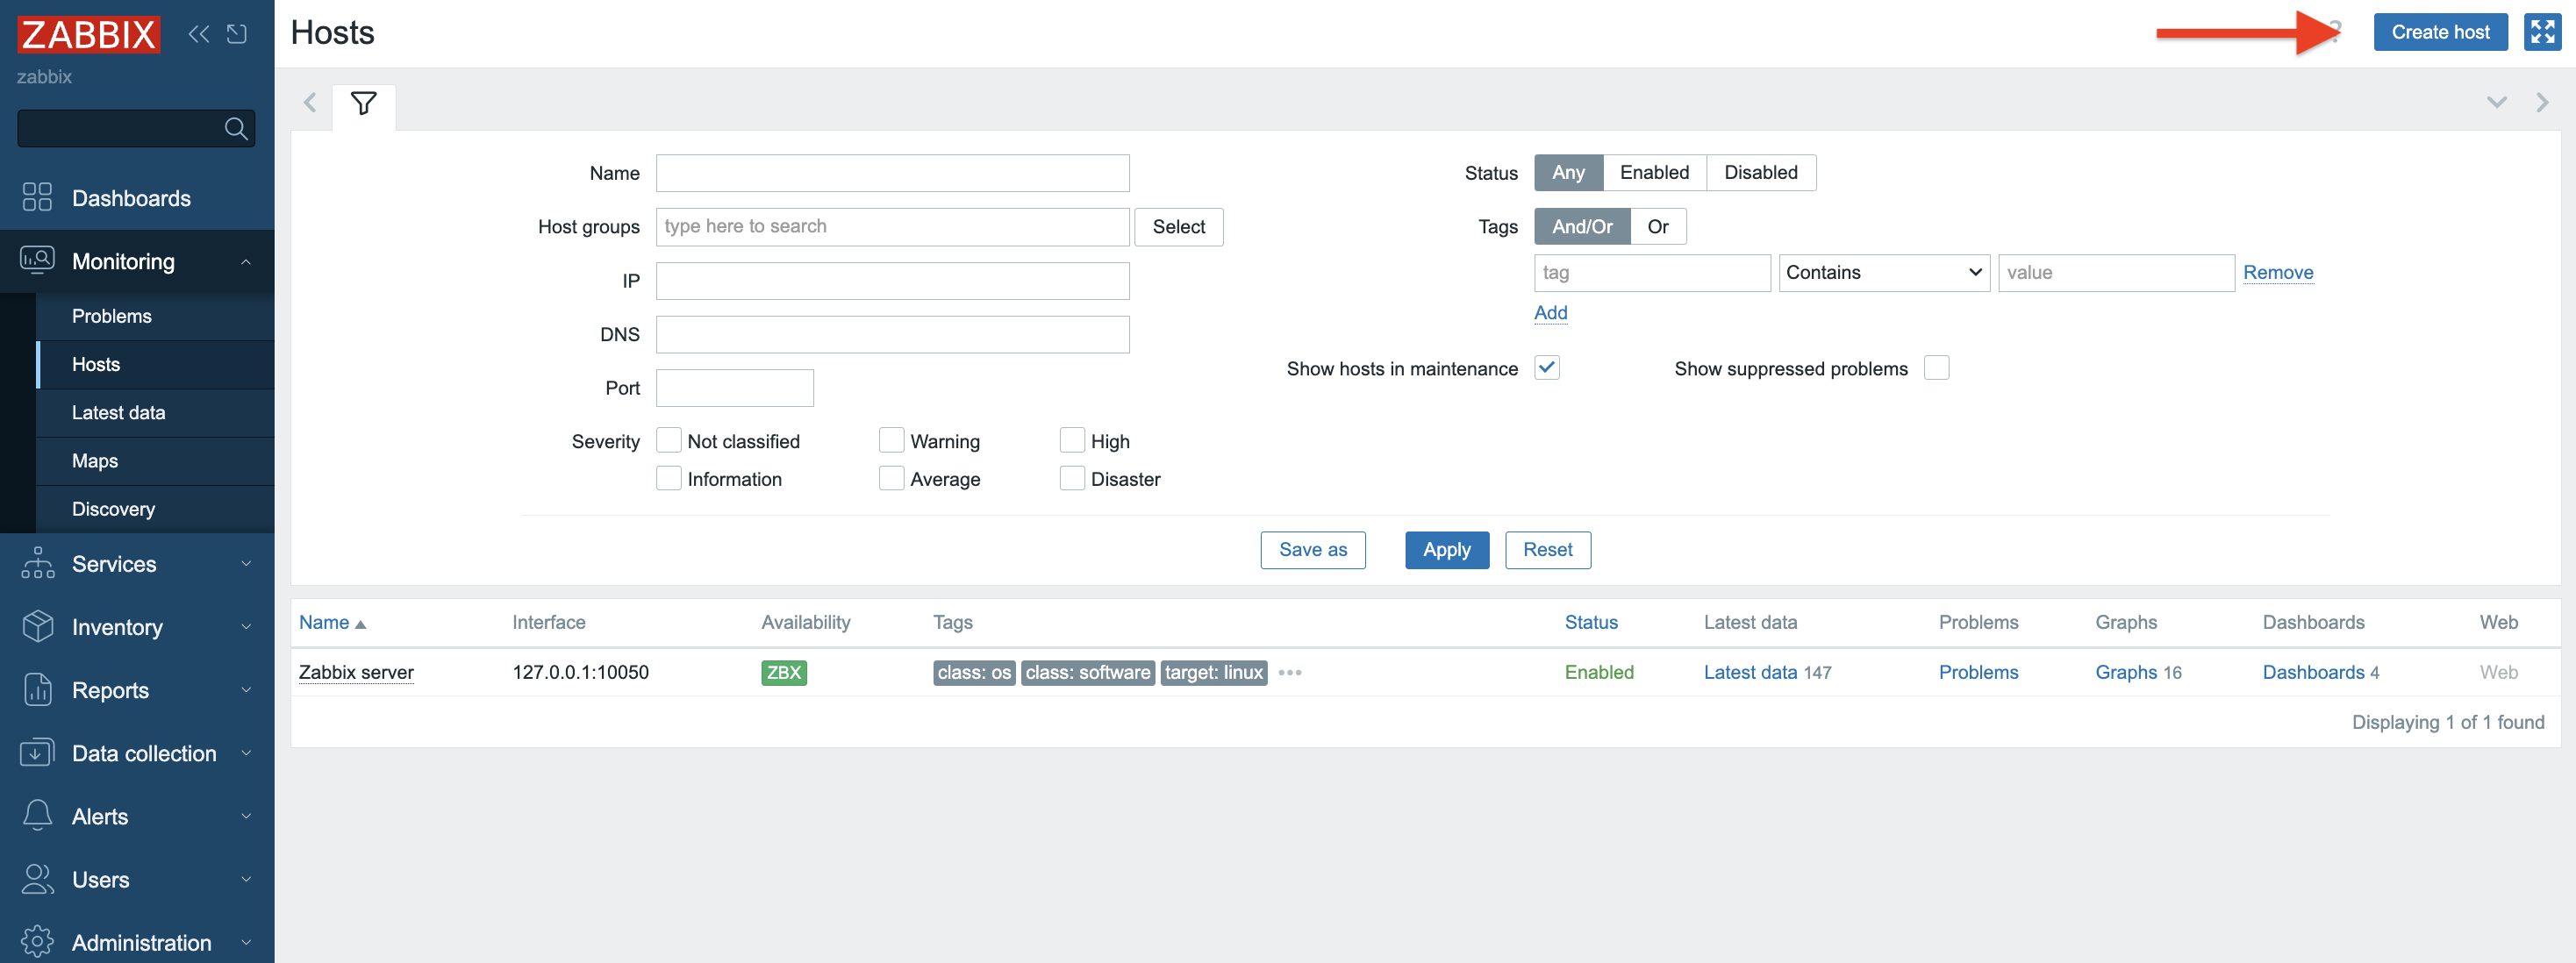
2. Create a new “Host.” Click Create Host in the right upper corner.
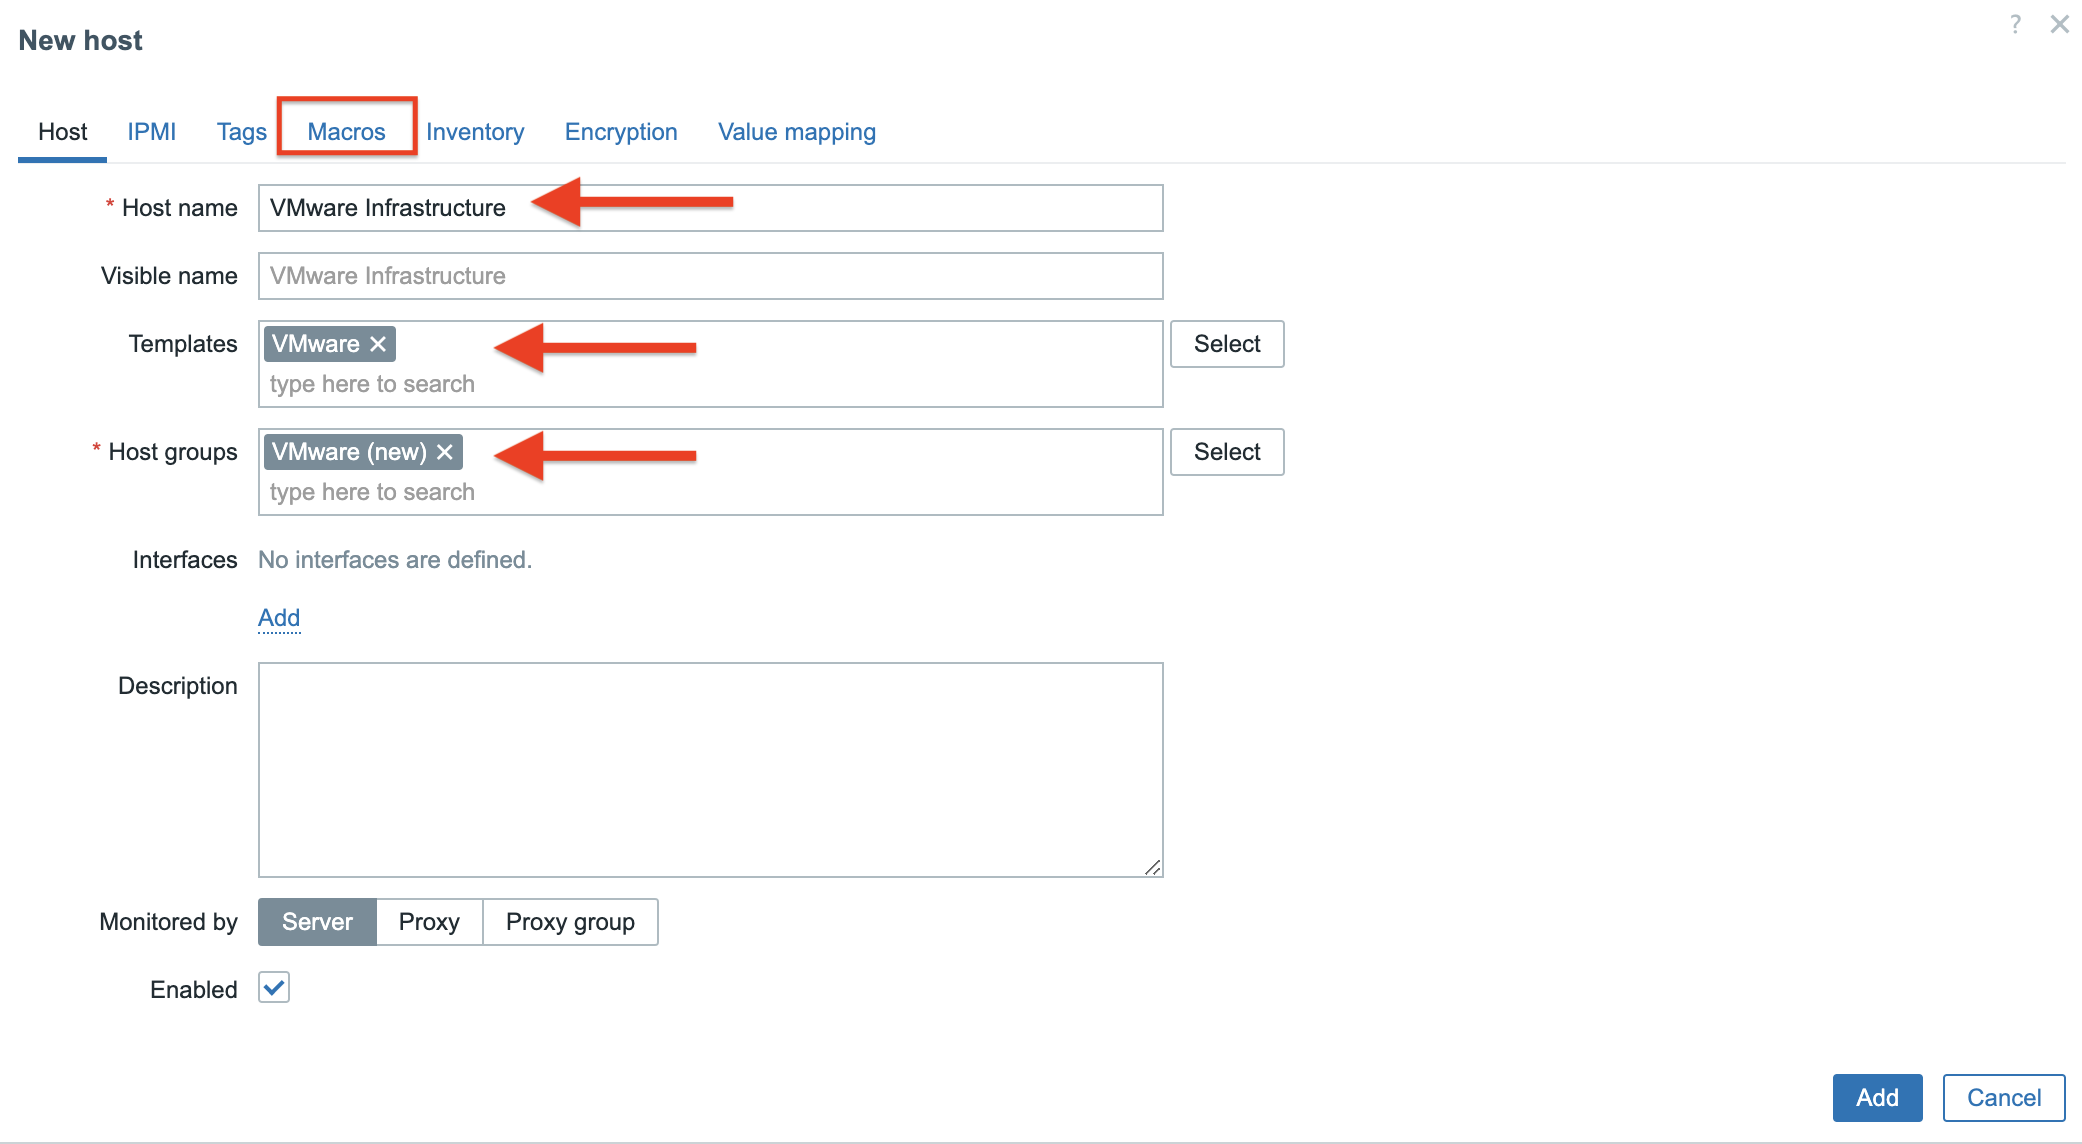
3. In the Host tab provide the following details:
Host name – type the name of the system that we want to monitor – here it is VMware Infrastructure. Templates – type/find template name “VMware”, more info about VMware template you can find HERE. Host groups – find/type “VMware(new)” host group.
At this point, go to the Macros tab.
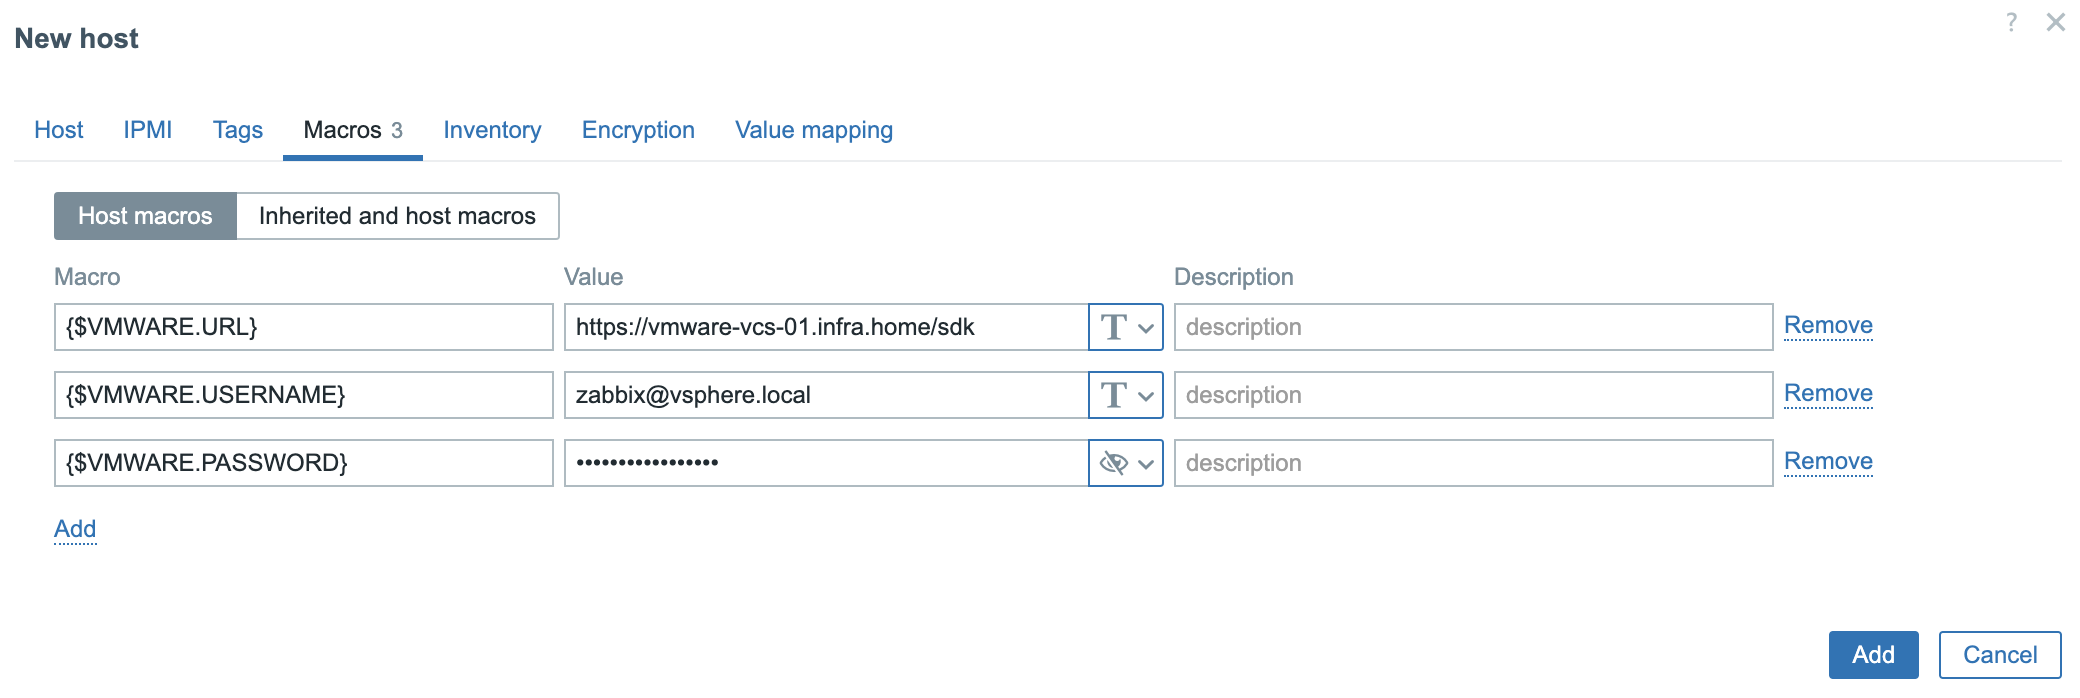
4. In the Macros tab you need to provide 3 values/macros. These macros describes data that is needed to connect Zabbix to the VMware vCenter:
{$VMWARE.URL} – VMware service (vCenter or ESXi hypervisor) SDK URL (https://servername/sdk) that we want to connect. {$VMWARE.USERNAME} – VMware service username created in the 1 section. {$VMWARE.PASSWORD} – VMware service user password created in the 1 section.
Click the Add button.
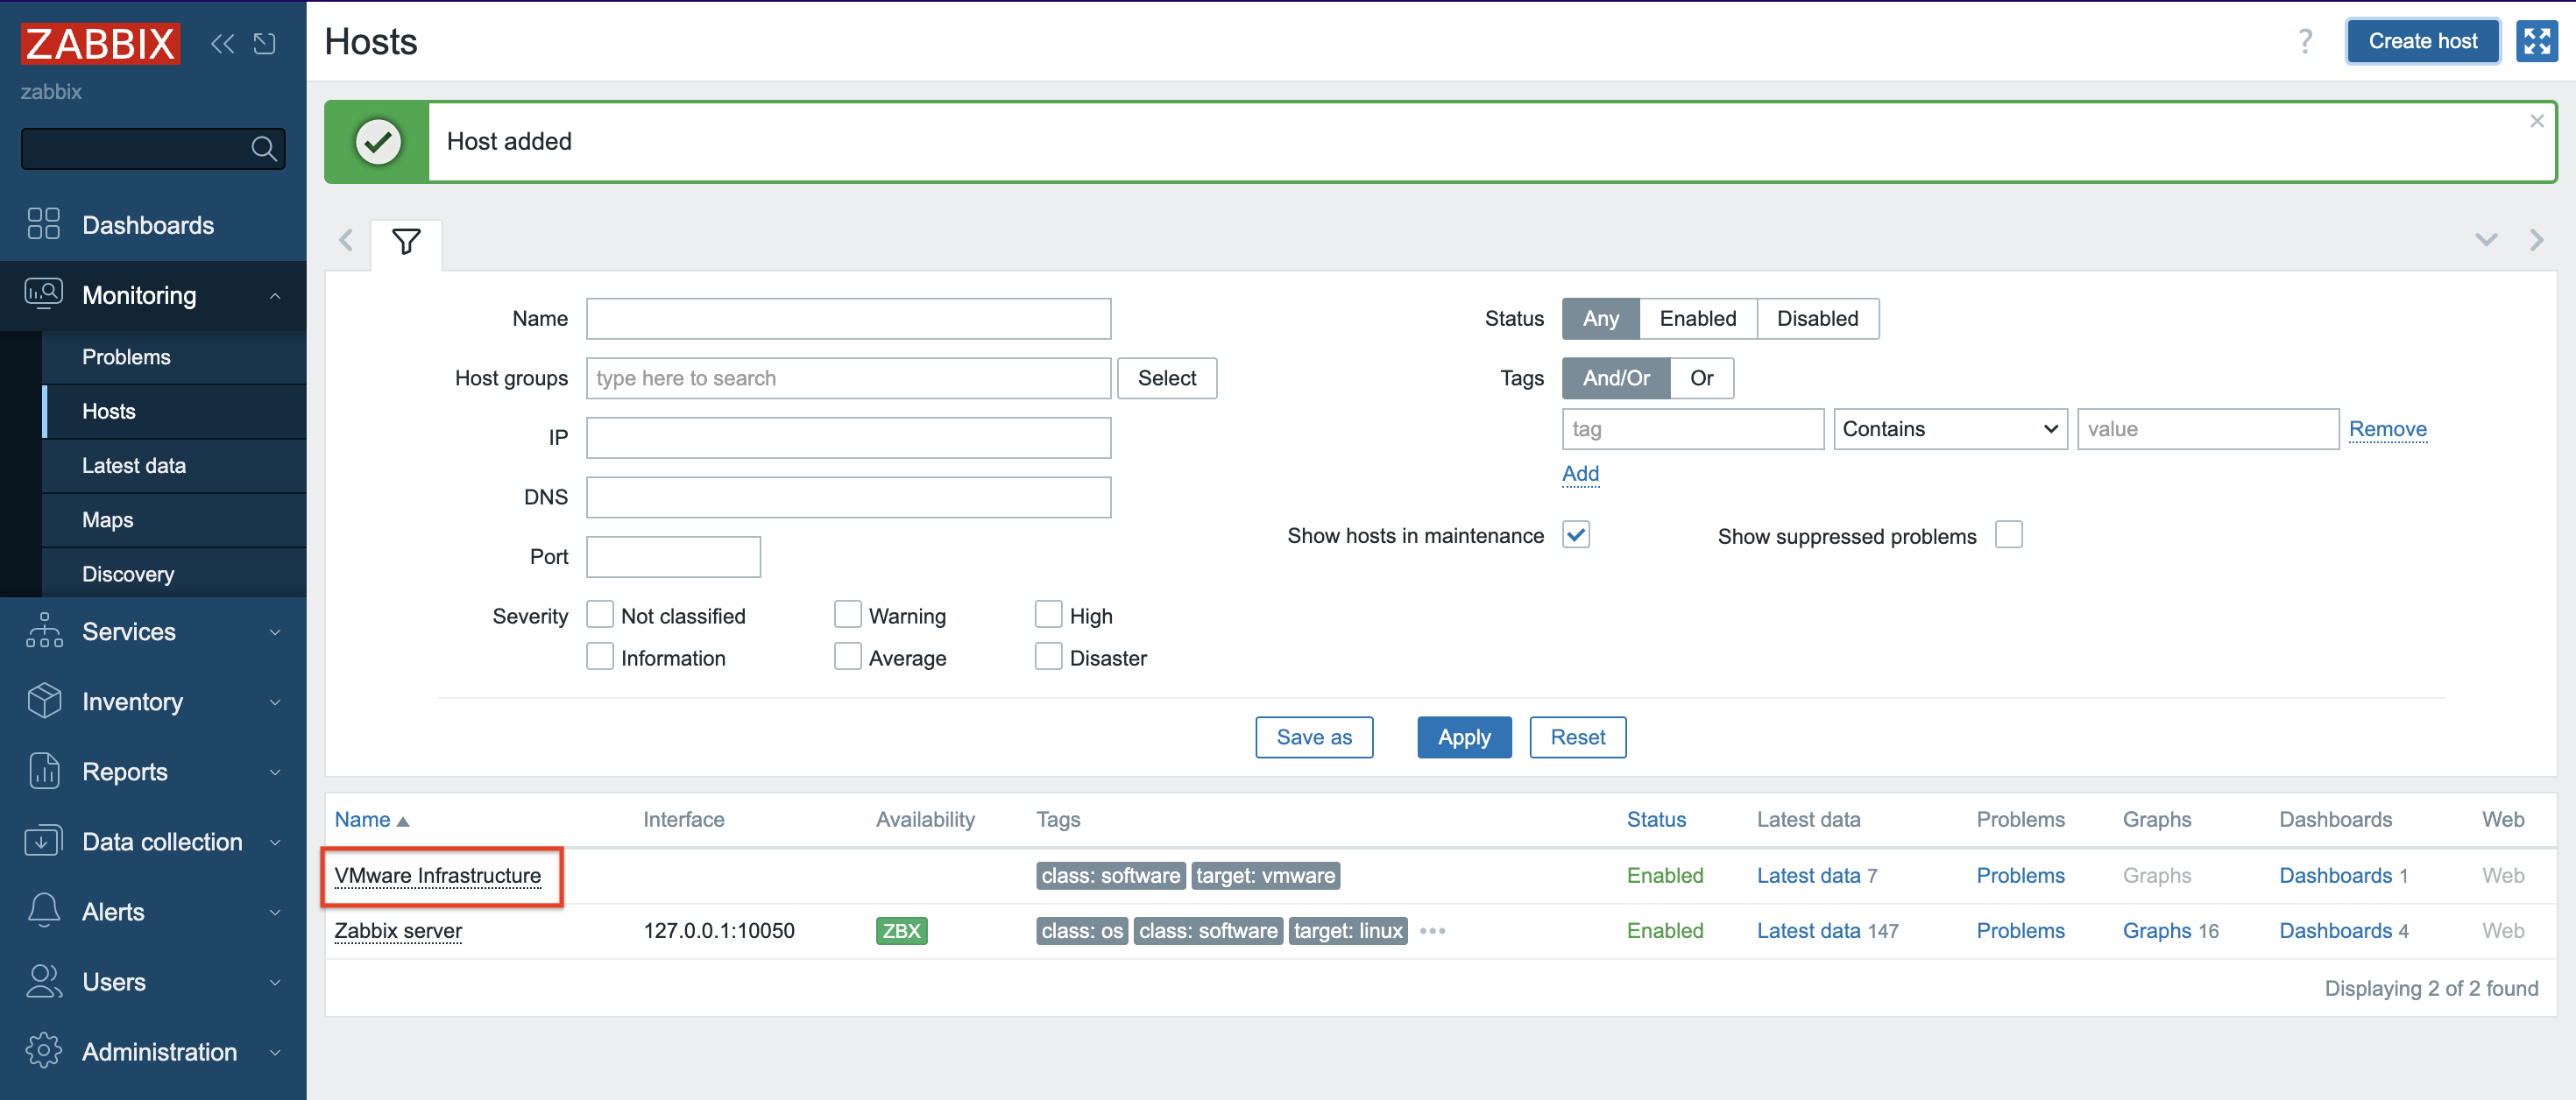
5. A new Host was created and data collection is in progress.
6. Depending on the size of the infrastructure, data collection takes different amounts of time. Once configured, Zabbix will automatically discover VMs and begin collecting performance data. You can find an overview of the latest data in the Dashboard screen.
7. More specific and detailed data can be found in Latest data under the Monitoring tab.
In Host groups or Hosts choose the name of the item you are looking for (you can also click the “Select” button). Select the name of the ESXi host, the virtual machine, the vCenter name, the datastore, or all VMware information.
Zabbix can collect multiple metrics from VMware using its built-in templates. These metrics include:
– CPU usage
– Memory consumption
– Disk I/O statistics
– Network traffic
– Datastore capacity
In conclusion
Integrating Zabbix with VMware provides a robust solution for monitoring virtualized environments and enhancing visibility into system performance and resource utilization, while enabling timely alerts and responses to operational issues.
In this article, we will explore a practical example of using the zabbix_utils library to solve a non-trivial task – obtaining a list of alert recipients for triggers associated with a specific Zabbix host. You will learn how to easily automate the process of collecting this information, and see examples of real code that can be adapted to your needs.
Table of Contents
Over the last year, the zabbix_utils library has become one of the most popular tools for working with the Zabbix API. It is a convenient tool that simplifies interacting with the Zabbix server, proxy, or agent, especially for those who automate monitoring and management tasks.
Due to its ease of use and extensive functionality, zabbix_utils has found a following among system administrators, monitoring, and DevOps engineers. According to data from PyPI, the library has already been downloaded over 140,000 times since its release, confirming its demand within the community. It’s all thanks to you and your attention to zabbix_utils!
Task Description
Administrators often need to check which Zabbix users receive alerts for specific triggers in the Zabbix monitoring system. This can be useful for auditing, configuring new notifications, or simply for a quick diagnosis of issues. The task becomes especially relevant when you have plenty of hosts containing numerous triggers, and manually checking the recipients for each trigger through the Zabbix interface becomes very time-consuming.
In such cases, it is advisable to use a custom solution based on the Zabbix API. You can directly access all the required data using the API, and then use additional logic to determine the final alert recipients. The zabbix_utils library makes working with the Zabbix API more convenient and allows you to automate this process. In this project, we use the zabbix_utils library to write a Python script that collects a list of alert recipients for the triggers of the selected Zabbix host. This will allow you to obtain the necessary information faster and with minimal effort.
Environment Setup and Installation
To get started with zabbix_utils, you need to install the library and configure the connection to the Zabbix API. This article provides more details and examples on getting started with the library. However, it would be better if I describe the basic steps to prepare the environment here.
The library supports several installation methods described in the official README, making it convenient for use in different environments.
1. Installation via pip
The simplest and most common installation method is using the pip package manager. To do this, execute the command:
~$ pip install zabbix_utils
To install all necessary dependencies for asynchronous work, you can use the command:
~$ pip install zabbix_utils[async]
This method is suitable for most users, as pip automatically installs all required dependencies.
2. Installation from Zabbix Repository
Since writing the previous articles, we have added one more installation method – from the official Zabbix repository. First and foremost, you need to add the repository to your system if it has not been installed yet. Official Zabbix packages for Red Hat Enterprise Linux and Debian-based distributions are available on the Zabbix website.
For Red Hat Enterprise Linux and derivatives:
~# dnf install python3-zabbix-utils
For Debian / Ubuntu and derivatives:
~# apt install python3-zabbix-utils
3. Installation from Source Code
If you require the latest version of the library that has not yet been published on PyPI, or you want to customize the code, you can install the library directly from GitHub:
After installing zabbix_utils, it is a good idea to check the connection to your Zabbix server via the API. To do this, use the URL to the Zabbix server, the token, or the username and password of the user who has permission to access the Zabbix API.
Now that the environment is set up, let’s look at the main steps for solving the task of retrieving the list of alert recipients for triggers associated with a specific Zabbix host in Zabbix.
In zabbix_utils, asynchronous API interaction support is built in through the AsyncZabbixAPI class. This allows multiple requests to be sent simultaneously and their results to be handled as they become ready, significantly reducing latencies when making multiple API calls. Therefore, we will use the AsyncZabbixAPI class and the asynchronous approach in this project.
Below are the main steps for solving the task, and code examples for each step. Please note that the code in this project is for demonstration purposes, may not be optimal, or could contain errors. Use it as an example or a base for your project, but not as a complete tool.
Step 1. Obtain Host ID
The first step is to identify the host for which we will retrieve information about triggers and alerts. We need to find the hostid using its name/host to do this. The Zabbix API provides a method to obtain this information, and using zabbix_utils makes this process much simpler.
This method returns a unique identifier for the host, which can be used further. However, for our test project, we will use a manually specified host identifier.
Step 2. Retrieve Host Triggers
With the hostid in hand, the next step is to retrieve all triggers associated with this host. Triggers contain the conditions that trigger the alerts. We need to collect information about all triggers so that we can then use it to select actions that match all the conditions.
This request returns complete information about the triggers for the host. We get not only the triggers but also their tags, associated host and host groups, and discovery rule information. All this information will be necessary to check the conditions of the actions.
Step 3. Initialize Trigger Metadata
At this stage, objects for each trigger are created to store their metadata. This is done using the Trigger class, which includes information about the trigger such as its name, ID, associated host groups, hosts, tags, templates, and operations.
Here’s the code defining the Trigger class:
classTrigger:def__init__(self, trigger):self.name=trigger["description"]self.triggerid=trigger["triggerid"]self.hostgroups= [g["groupid"] forgintrigger["hostgroups"]]self.hosts= [h["hostid"] forhintrigger["hosts"]]self.tags= {t["tag"]: t["value"] fortintrigger["tags"]}self.tmpl_triggerid=self.triggeridself.lld_rule=trigger["discoveryRule"] or {}iftrigger["templateid"] !="0":self.tmpl_triggerid=trigger["templateid"]self.templates= []self.messages= []self._conditions= {"0": self.hostgroups,"1": self.hosts,"2": [self.triggerid],"3": trigger["event_name"] ortrigger["description"],"4": trigger["priority"],"13": self.templates,"25": self.tags.keys(),"26": self.tags, }defeval_condition(self, operator, value, trigger_data):# equals or does not equalifoperatorin ["0", "1"]:equals=operator=="0"ifisinstance(value, dict) andisinstance(trigger_data, dict):ifvalue["tag"] intrigger_data:ifvalue["value"] ==trigger_data[value["tag"]]:returnequalselifvalueintrigger_dataandisinstance(trigger_data, list):returnequalselifvalue==trigger_data:returnequalsreturnnotequals# contains or does not containifoperatorin ["2", "3"]:contains=operator=="2"ifisinstance(value, dict) andisinstance(trigger_data, dict):ifvalue["tag"] intrigger_data:ifvalue["value"] intrigger_data[value["tag"]]:returncontainselifvalueintrigger_data:returncontainsreturnnotcontains# is greater/less than or equalsifoperatorin ["5", "6"]:greater=operator!="5"try:ifint(value) <int(trigger_data):returnnotgreaterifint(value) ==int(trigger_data):returnTrueifint(value) >int(trigger_data):returngreaterexcept:raiseValueError("Values must be numbers to compare them" )defselect_templates(self, templates):fortemplateintemplates:ifself.tmpl_triggeridin [t["triggerid"] fortintemplate["triggers"]]:self.templates.append(template["templateid"])ifself.lld_rule.get("templateid") in [d["itemid"] fordintemplate["discoveries"] ]:self.templates.append(template["templateid"])defselect_actions(self, actions):selected_actions= []foractioninactions:conditions= []if"filter"inaction:conditions=action["filter"]["conditions"]eval_formula=action["filter"]["eval_formula"]# Add actions without conditions directlyifnotconditions:selected_actions.append(action)continuecondition_check= {}forconditioninconditions:if (condition["conditiontype"] !="6"andcondition["conditiontype"] !="16" ):if (condition["conditiontype"] =="26"andisinstance(condition["value"], str) ):condition["value"] = {"tag": condition["value2"],"value": condition["value"], }ifcondition["conditiontype"] inself._conditions:condition_check[condition["formulaid"] ] =self.eval_condition(condition["operator"],condition["value"],self._conditions[condition["conditiontype"] ], )else:condition_check[condition["formulaid"] ] =Trueforformulaid, bool_resultincondition_check.items():eval_formula=eval_formula.replace(formulaid, str(bool_result))
# Evaluate the final condition formulaifeval(eval_formula):selected_actions.append(action)returnselected_actionsdefselect_operations(self, actions, mediatypes):messages_metadata= []foractioninself.select_actions(actions):messages_metadata+=self.check_operations("operations", action, mediatypes )messages_metadata+=self.check_operations("update_operations", action, mediatypes )messages_metadata+=self.check_operations("recovery_operations", action, mediatypes )returnmessages_metadata
defcheck_operations(self, optype, action, mediatypes):messages_metadata= []optype_mapping= {"operations": "0", # Problem event"recovery_operations": "1", # Recovery event"update_operations": "2", # Update event }operations=copy.deepcopy(action[optype])# Processing "notify all involved" scenariosforidx, _inenumerate(operations):ifoperations[idx]["operationtype"] notin ["11", "12"]:continue# Copy operation as a template for reuseop_template=copy.deepcopy(operations[idx])deloperations[idx]# Checking for message sending operationsforkeyin [kforkin ["operations", "update_operations"] ifk!=optype ]:ifnotaction[key]:continue# Checking for message sending type operationsforopin [oforoinaction[key] ifo["operationtype"] =="0" ]:# Copy template for the current operationoperation=copy.deepcopy(op_template)operation.update( {"operationtype": "0","opmessage_usr": op["opmessage_usr"],"opmessage_grp": op["opmessage_grp"], } )operation["opmessage"]["mediatypeid"] =op["opmessage" ]["mediatypeid"]operations.append(operation)foroperationinoperations:ifoperation["operationtype"] !="0":continue# Processing "all mediatypes" scenarioifoperation["opmessage"]["mediatypeid"] =="0":formediatypeinmediatypes:operation["opmessage"]["mediatypeid"] =mediatype["mediatypeid" ]messages_metadata.append(self.create_messages(optype_mapping[optype], action, operation, [mediatype ] ) )else:messages_metadata.append(self.create_messages(optype_mapping[optype],action,operation,mediatypes ) )returnmessages_metadatadefcreate_messages(self, optype, action, operation, mediatypes):message=Message(optype, action, operation)message.select_mediatypes(mediatypes)self.messages.append(message)returnmessage
The code for creating Trigger class objects for each of the retrieved triggers:
This loop iterates through all triggers and saves them in a dictionary called triggers_metadata, where the key is the triggerid and the value is the trigger object.
Step 4. Retrieve Template Information
The next step is to obtain data about the templates associated with all the triggers:
This request returns information about all templates linked to the host’s triggers being examined. Executing a single query for all triggers is a more optimal solution than making individual requests for each trigger. This information will be needed for evaluating the “Template” condition in actions.
Step 5. Get Actions and Media Types
Next, we obtain the list of actions and media types configured in the system:
Here we retrieve actions that define how and to whom alerts are sent, and mediatypes through which users can receive notifications (for example, email or SMS).
Step 6. Match Triggers with Templates and Actions
At this stage, each trigger is associated with the corresponding templates and actions:
Here, for each trigger, we update information about its templates and configured actions for sending notifications. The list of associated actions is determined by checking the conditions specified in them against the accumulated data for each trigger.
For each operation of the corresponding trigger action, a Message class object is created:
classMessage:def__init__(self, optype, action, operation):self.optype=optypeself.mediatypename=""self.actionid=action["actionid"]self.actionname=action["name"]self.operationid=operation["operationid"]self.mediatypeid=operation["opmessage"]["mediatypeid"]self.subject=operation["opmessage"]["subject"]self.message=operation["opmessage"]["message"]self.default_msg=operation["opmessage"]["default_msg"]self.users= [u["userid"] foruinoperation["opmessage_usr"]]self.groups= [g["usrgrpid"] forginoperation["opmessage_grp"]]self.recipients= []# Escalation period set to action's period if not specifiedself.esc_period=operation.get("esc_period", "0")ifself.esc_period=="0":self.esc_period=action["esc_period"]# Use action's escalation period if unsetself.esc_step_from=self.multiply_time(self.esc_period, int(operation.get("esc_step_from", "1")) -1 )ifoperation.get("esc_step_to", "0") !="0":self.repeat_count=str(int(operation["esc_step_to"]) -int(operation["esc_step_from"]) +1 )# If not a problem event, set repeat count to 1elifself.optype!="0":self.repeat_count="1"# Infinite repeat count if esc_step_to is 0else:self.repeat_count=“∞”defmultiply_time(self, time_str, multiplier):# Multiply numbers within the time stringresult=re.sub(r"(\d+)",lambdam: str(int(m.group(1)) *multiplier),time_str )ifresult[0] =="0":return"0"returnresultdefselect_mediatypes(self, mediatypes):formediatypeinmediatypes:ifmediatype["mediatypeid"] ==self.mediatypeid:self.mediatypename=mediatype["name"]# Select message templates related to operation typemsg_template= [mforminmediatype["message_templates"]if (m["recovery"] ==self.optypeandm["eventsource"] =="0" ) ]# Use default message if applicableifmsg_templateandself.default_msg=="1":self.subject=msg_template[0]["subject"]self.message=msg_template[0]["message"]defselect_recipients(self, user_groups, recipients):forgroupidinself.groups:ifgroupidinuser_groups:self.users+=user_groups[groupid]foruseridinself.users:ifuseridinrecipients:recipient=copy.deepcopy(recipients[userid])ifself.mediatypeidinrecipient.sendto:recipient.mediatype =Trueself.recipients.append(recipient)
Each such object represents a separate message sent to users (recipients) and will contain all message information – its subject, text, recipients, and escalation parameters.
Step 7. Collect User and Group Identifiers
After matching the triggers with actions, the process of collecting unique identifiers for users and groups starts:
This code snippet collects the IDs of all users and groups involved in the operations for each trigger. This is necessary to perform only one request to the Zabbix API for all involved users and their groups, rather than making separate requests for each trigger.
Step 8. Obtain User and Group Information
The next step is to collect detailed information about users and user groups:
Here we gather data about users, including their role and media types through which they receive notifications, as well as data about user groups, including access rights to host groups and the list of users in each group. All this information will be needed to check access to the host with the triggers we are working with.
Step 9. Match Users and Groups with Triggers
After obtaining user information, we match users and groups with their respective rights to receive notifications. Here we also link users with groups, updating the information regarding rights and groups for each user.
foruseridin userids:ifuseridin users:user= users[userid] recipients[userid] =Recipient(user)forgroupinuser["usrgrps"]:ifgroup["usrgrpid"] in usergroups: recipients[userid].permissions.update([h["id"]forhin usergroups[group["usrgrpid"]]["hostgroup_rights"]ifint(h["permission"]) >1 ])forgroupidin groupids:ifgroupidin usergroups:group= usergroups[groupid] user_groups[group["usrgrpid"]] = []foruseringroup["users"]: user_groups[group["usrgrpid"]].append(user["userid"])ifuser["userid"] in recipients: recipients[user["userid"]].groups.update(group["usrgrpid"])elifuser["userid"] in users: recipients[user["userid"]] =Recipient(users[user["userid"]]) recipients[user["userid"]].permissions.update([h["id"]forhingroup["hostgroup_rights"]ifint(h["permission"]) >1 ])
This code fragment connects each user with their groups and vice versa, creating a complete list of users with their access rights to the host, and thus their eligibility to receive notifications about events for this host.
For each recipient, a Recipient class object is created containing data about the recipient, such as the notification address, access rights to hosts, configured mediatypes, etc.
Here’s the code that describes the Recipient class:
classRecipient:def__init__(self, user):self.userid=user["userid"]self.username=user["username"]self.fullname="{name}{surname}".format(**user).strip()self.type=user["role"]["type"]self.groups=set([g["usrgrpid"] forginuser["usrgrps"]])self.has_right=Falseself.permissions=set()self.sendto= {m["mediatypeid"]: m["sendto"] forminuser["medias"] ifm["active"] =="0" }# Check if the user is a super admin (type 3)ifself.type=="3":self.has_right=True
Step 10. Match Messages with Recipients
Finally, we match recipients with specific messages from Step 6:
This step completes the main process – each message is assigned to the relevant recipients.
Step 11. Check Recipient Access Rights and Output the Result
Before the actual output of the result with the list of recipients, we can perform a check of the recipients’ message rights and filter only those who have the corresponding rights to receive notifications for the events related to the trigger, or those who have all configured media types specified and active. After these actions, the information can be output in any convenient way – whether it be exporting to a file or displaying it on the screen:
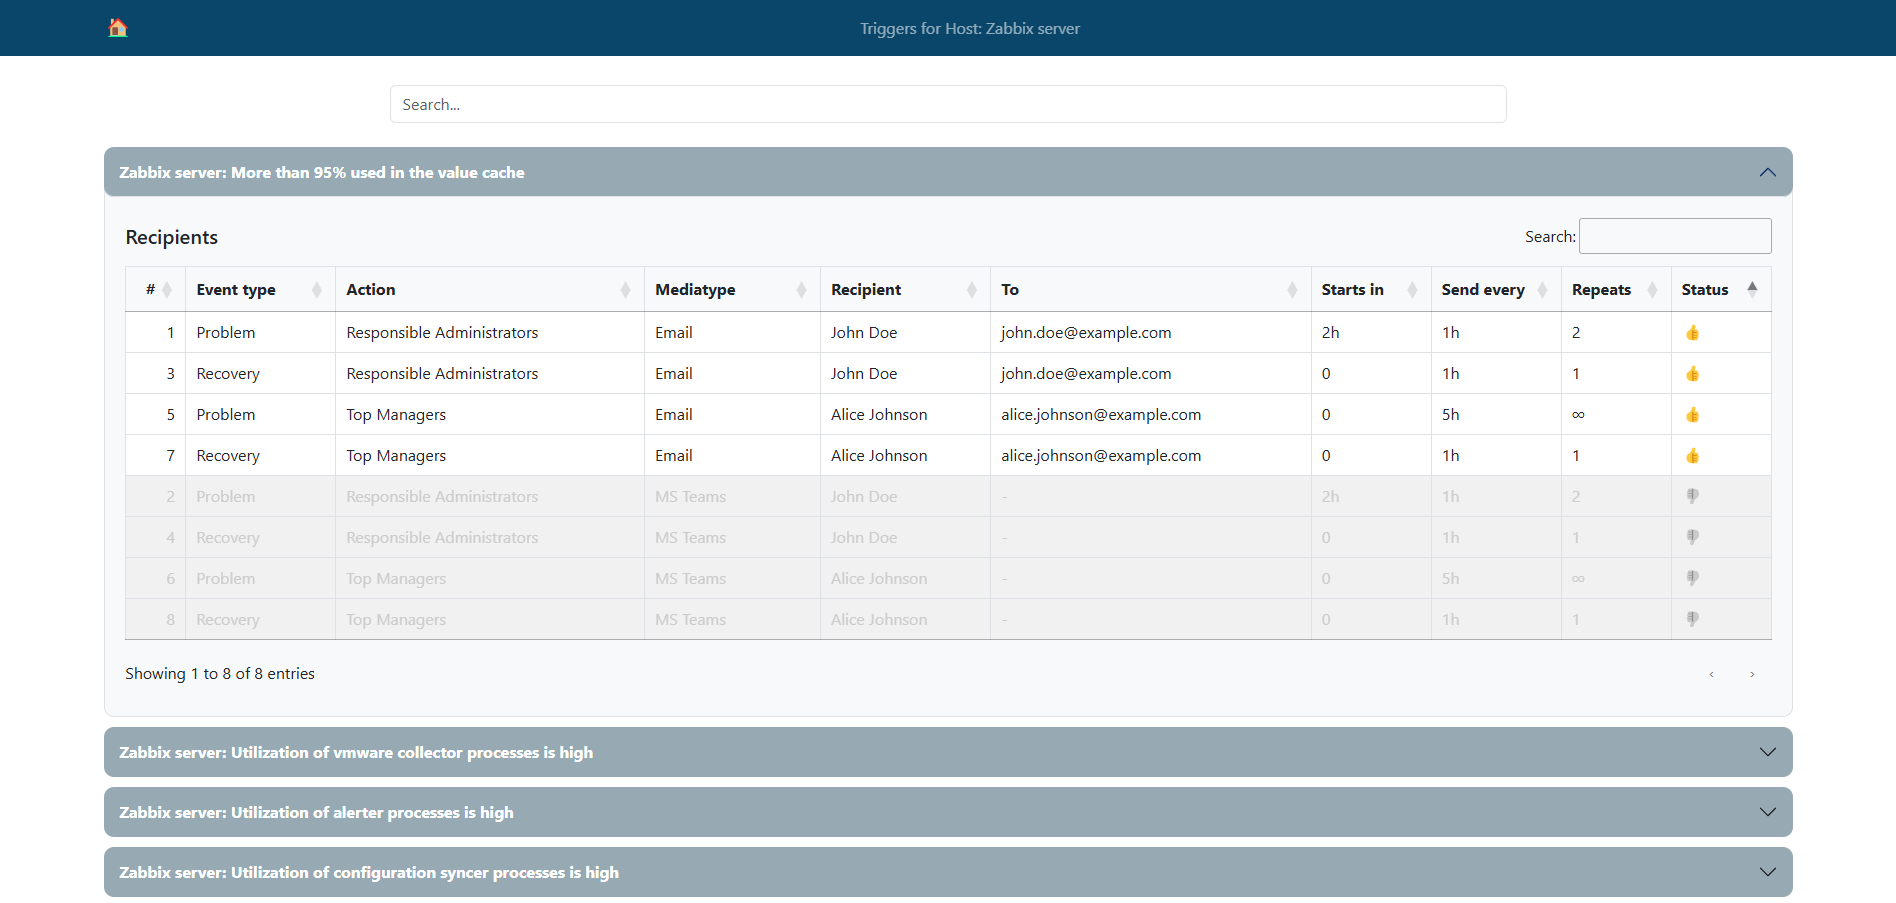
All the examples and code snippets described above have been compiled to create a solution demonstrating the algorithm for obtaining notification recipients for triggers associated with the selected host. We have implemented this algorithm as a simple web interface to make the result more illustrative and convenient for familiarization.
This interface allows users to enter the host’s ID. The script then processes the data and provides a list of notification recipients associated with the triggers on that host. The web interface uses asynchronous requests to the Zabbix API and the zabbix_utils library to ensure fast data processing and ease of use with many triggers and users.
This lets you familiarize yourself with the theoretical steps and code examples and also try to put this solution into action.
Please note once again that the code in this project is for demonstration purposes, may not be optimal, or could contain errors. Use it as an example or a base for your project, but not as a complete tool.
The web interface’s complete source code and installation instructions can be found on GitHub.
Conclusion
In this article, we explored a practical example of using the zabbix_utils library to solve the task of obtaining alert recipients for triggers associated with a selected Zabbix host using the Zabbix API. We detailed the key steps, from setting up the environment and initializing trigger metadata to working with notification recipients and optimizing performance with asynchronous requests.
Using zabbix_utils allowed us to optimize and accelerate interaction with the Zabbix API, expanding the capabilities of the Zabbix web interface and increasing efficiency when working with large volumes of data. Thanks to support for asynchronous processing and selective API requests, it is possible to significantly reduce the load on the server and improve system performance when working with Zabbix, which is especially important in large infrastructures.
We hope this example will assist you in implementing your own solutions based on the Zabbix API and zabbix_utils, and demonstrate the possibilities for optimizing your interaction with the Zabbix API.
Inviting the members of our global community to share their Zabbix dashboards with us prompted a flood of fascinating responses, and we’re highlighting a few of the most interesting submissions here on our blog. This week’s entry comes to us from Nyein Chan Zaw, who is based in Bangkok, Thailand and works as an Infrastructure Specialist for Green Will Solution. Read on to see how he uses his Zabbix dashboard to monitor a highly intricate infrastructure in real time.
I appreciate the chance to share my dashboard, and I would also like to share a use case that demonstrates the practical implementation of Zabbix for real-time infrastructure monitoring.
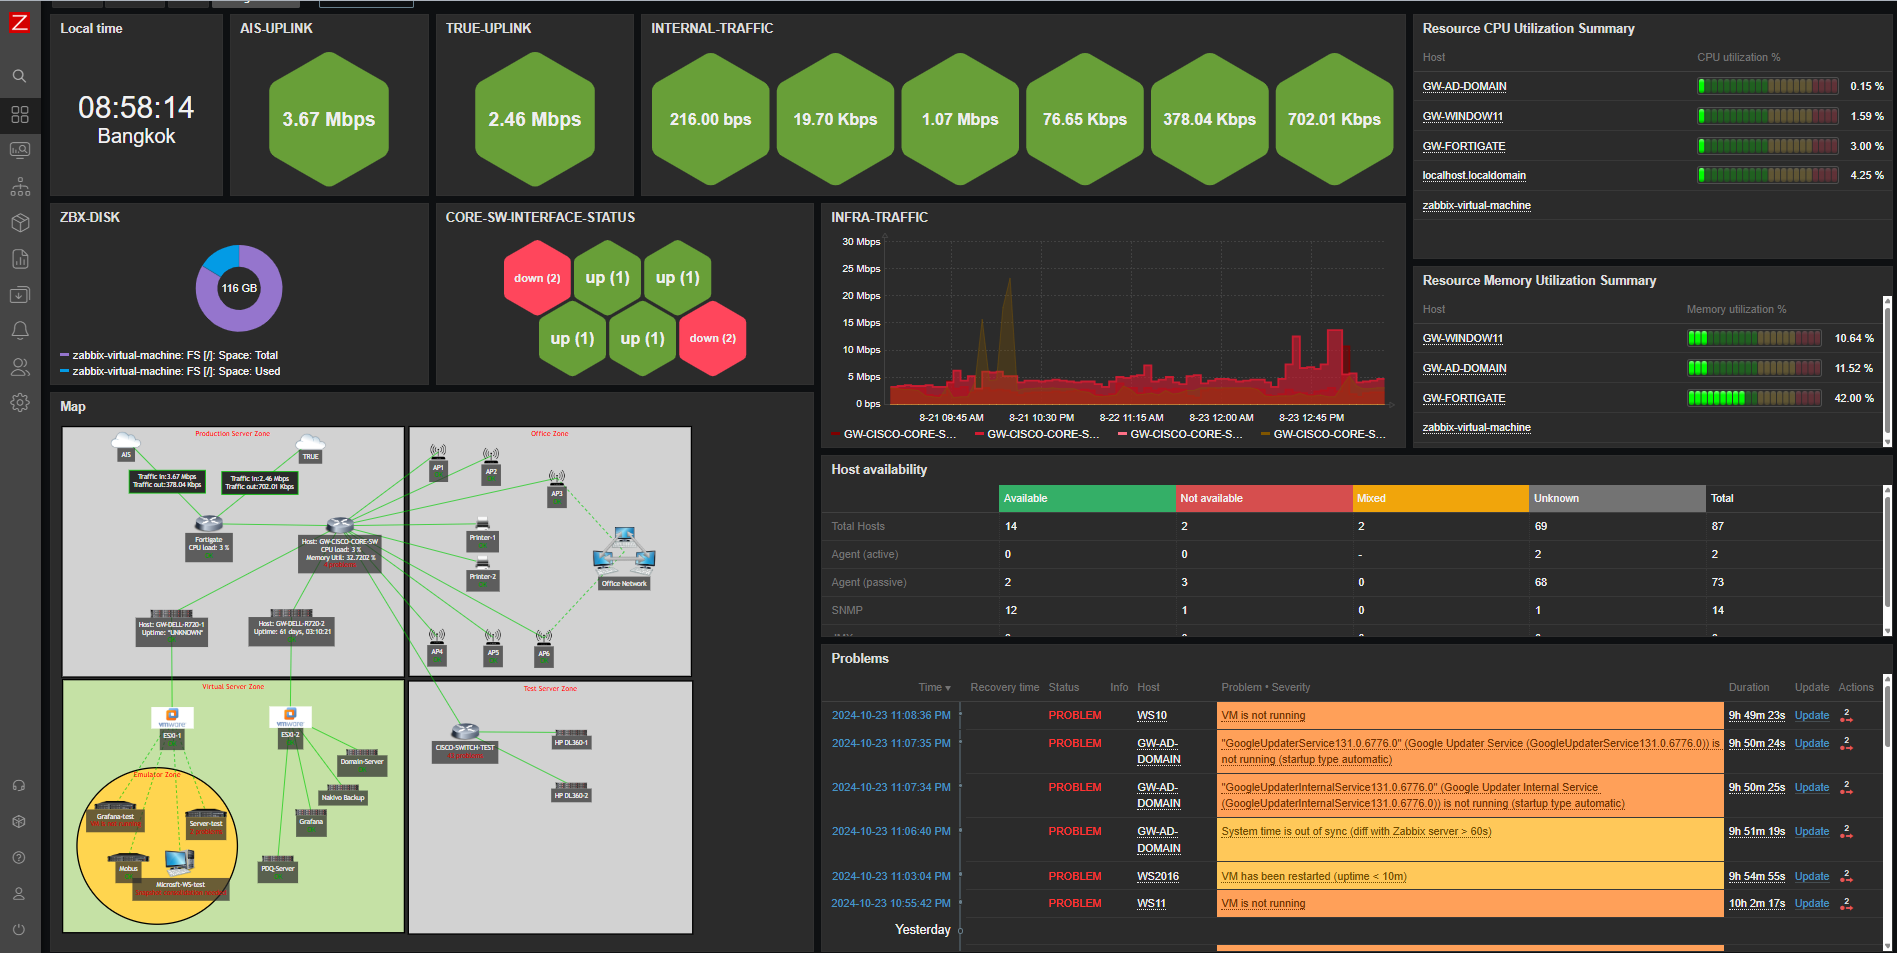
This Zabbix dashboard provides a comprehensive view of the network’s real-time health, server availability, traffic patterns, and key performance metrics of essential infrastructure components. It is designed for monitoring production, office, and virtual server zones, including network devices, physical servers, and virtual machines. The current view is the first page of a two-page dashboard, which focuses on general network monitoring:
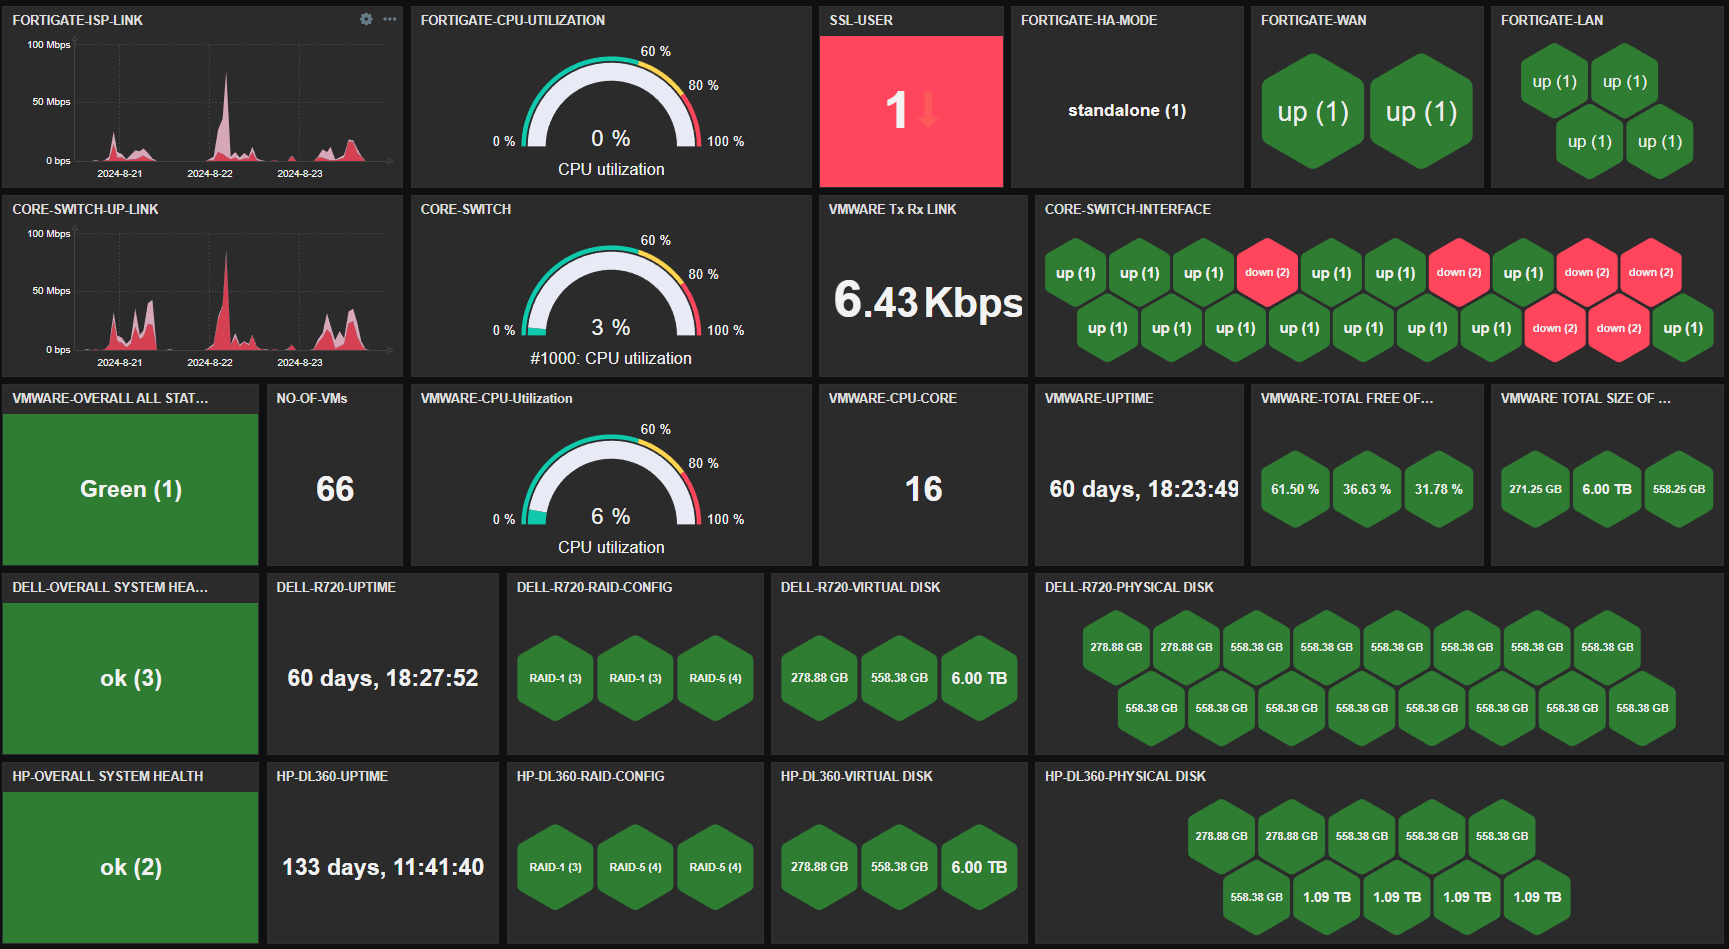
The second page is dedicated solely to monitoring infrastructure nodes:
Key features monitored
Traffic Monitoring: The dashboard tracks real-time traffic from critical network uplinks, including AIS and TRUE, offering visibility into bandwidth usage (e.g., 64.50 Kbps and 13.05 Kbps). It also monitors internal traffic and key devices like the FortiGate firewall, helping ensure optimal network performance and security.
Host Health Monitoring: CPU and memory utilization for top hosts (e.g., GW-WINDOW11, GW-AD-DOMAIN) are displayed, enabling efficient resource management. Alerts are triggered for high resource usage, allowing for a proactive response to performance issues.
Disk Usage: Disk space on key hosts, such as the Zabbix virtual machine and other core servers, is monitored to avoid file system over-utilization, which can lead to potential service interruptions.
Availability Overview: The dashboard provides a summary of host availability, including how many are available, unavailable, or have unknown statuses. Monitoring methods like active agent and SNMP are also shown, giving an overall view of network health.
Visual Topology Map: A detailed network map shows the production, office, virtual, and test zones, along with devices and connections. This visualization aids in quickly identifying problem areas and understanding how systems are interlinked.
Severity and Problem Monitoring: The dashboard classifies issues by severity, from critical problems to warnings. Real-time issues (such as VM downtime or system failures) are highlighted, enabling the team to resolve issues quickly.
Performance Metrics: Graphs display performance metrics, such as bandwidth usage and CPU load, offering insights into system bottlenecks or overuse, particularly in critical devices like firewalls.
Impact
This Zabbix dashboard enables an infrastructure team to efficiently monitor network performance, manage resource usage, and ensure device availability. The clear visual interface helps quickly identify issues, reducing downtime and ensuring higher reliability of critical services.
Conclusion
The first page of the dashboard demonstrates Zabbix’s capabilities for centralized monitoring across large infrastructures. By integrating data from network devices, servers, and virtual machines, it empowers IT teams to make informed decisions and address issues before they escalate. The second page provides a detailed focus on the infrastructure nodes, ensuring that all critical systems are effectively monitored for optimal operation across the IT environment.
Zabbix Summit 2024 is only a few days away, which means that it’s time for the last of our interviews with Summit speakers. Our final chat this year is with Tomáš Heřmánek, the CEO and Founder of initMAX s.r.o. We asked him about his beginnings in the tech industry, how he got started with Zabbix, and how AI will change the game for monitoring in general and Zabbix in particular.
Please tell us a bit about yourself and the journey that led you to initMAX.
My journey in the IT field started with small ISPs and later took a significant leap into the world of Linux and application management, where the need for effective monitoring became evident. I worked for a company that prioritized high-quality open-source solutions, and it was during this time that we adopted Zabbix version 1.8 as a replacement for Nagios, which we found to be inflexible. Shortly after our deployment, Zabbix 2.0 was released. It introduced JMX monitoring, which was crucial for us. Since then, Zabbix has been our go-to solution for monitoring.
I set a personal goal to master this outstanding monitoring system and participated in the first official Zabbix training in the Czech Republic, where I earned my initial certifications as a Zabbix Specialist and Professional on version 3.0. The training experience drew me deeper into the world of Zabbix, especially after meeting a burgeoning group of enthusiasts in the country. I felt compelled to give back to the community that had supported me.
How long have you been using Zabbix? What kind of Zabbix-related tasks does your team tackle on a daily basis?
When I started my own company, becoming a Zabbix partner was a natural choice. To further contribute to the community, I pursued the Expert and Trainer certifications. It was the most challenging 14 days of my life, but it was worth it. For anyone serious about Zabbix, I highly recommend participating in official training sessions and actively engaging with the community through forums, local groups, Telegram, WhatsApp, blogs, and forums. This commitment to support and strengthen the community further.is also why we created our own wiki, which is accessible to everyone without restrictions.
Can you give us a few clues about what we can expect to hear during your Zabbix Summit presentation?
This year, I have prepared a demonstration for the Zabbix Summit showcasing how we integrate AI into our operations, including various modifications to the web interface that allow us to automate and streamline routine tasks. Besides showcasing these innovations, we will also be making some parts of our work available to the public. The main focus of my presentation will be on problem identification, automating the creation of preprocessing steps, and using a chatbot for creating hosts, reading configurations, and making modifications. Essentially, it’s a smart assistant and guide all in one.
The final section, which we find the most challenging, deals with automated event correlation and the creation of a topology, from which correlations partially derive and evaluate. We are using the new Zabbix 7.0 feature – root cause and symptoms – for visualization in Zabbix. Our goal is to showcase not only the capabilities of Zabbix in combination with AI, but also to contribute back to the community by sharing some of these developments freely.
In your experience, does Zabbix lend itself easily to enhancement via AI?
AI is something that truly fascinates us and is currently shaping the world. From our experience, we believe that the possibilities are limited only by our imagination. In the future, I can envision AI autonomously discovering elements that need to be monitored, integrating them into Zabbix, and configuring everything necessary for effective monitoring.
What changes do you think AI will bring to the world of monitoring in general over the next decade or so?
I foresee a shift in our roles, moving away from traditional IT tasks towards a focus on idea generation, control, and the customization of artificial intelligence. As AI continues to evolve, it will not only enhance automation but also empower us to explore and implement innovative solutions more effectively.
As organizations increasingly adopt Amazon Q Developer, understanding how developers use it is essential. Diving into specific telemetry events and user-level data clarifies how users interact with Amazon Q Developer, offering insights into feature usage and developer behaviors. This granular view, accessible through logs, is vital for identifying trends, optimizing performance, and enhancing the overall developer experience. This blog is intended to give visibility to key telemetry events logged by Amazon Q Developer and how to explore this data to gain insights.
To help you get started, the following sections will walk through several practical examples that showcase how to extract meaningful insights from AWS CloudTrail. By reviewing the logs, organizations can track usage patterns, identify top users, and empower them to train and mentor other developers, ultimately fostering broader adoption and engagement across teams.
Although the examples here focus on Amazon Athena for querying logs, the methods can be adapted to integrate with other tools like Splunk or Datadog for further analysis. Through this exploration, readers will learn how to query the log data to understand better how Amazon Q Developer is used within your organization.
Solution Overview
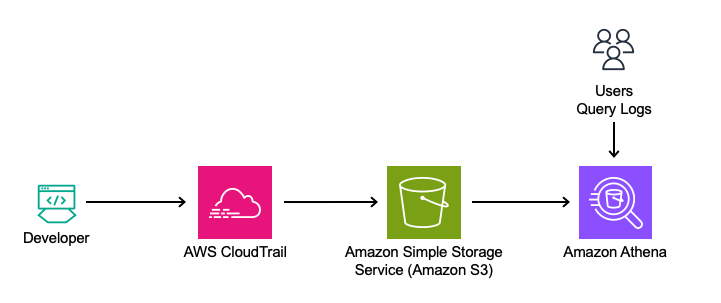
This solution leverages Amazon Q Developer’s logs from the Integrated Development Environment (IDE) and terminal, captured in AWS CloudTrail. The logs will be queried directly using Amazon Athena from Amazon Simple Storage Service (Amazon S3) to analyze feature usage, such as in-line code suggestions, chat interactions, and security scanning events.
Analyzing Telemetry Events in Amazon Q Developer
Amazon Athena is used to query the CloudTrail logs directly to analyze this data. By utilizing Athena, queries can be run on existing CloudTrail records, making it simple to extract insights from the data in its current format.
Ensuring CloudTrail is set up to log the data events.
Navigate to the AWS CloudTrail Console.
Edit an Existing Trail:
If you have a trail, verify it is configured to log data events for Amazon CodeWhisperer.
Note: As of 4/30/24, CodeWhisperer has been renamed to Amazon Q Developer. All the functionality previously provided by CodeWhisperer is now part of Amazon Q Developer. However, for consistency, the original API names have been retained.
Click on your existing trail in CloudTrail. Find the Data Events section and click edit.
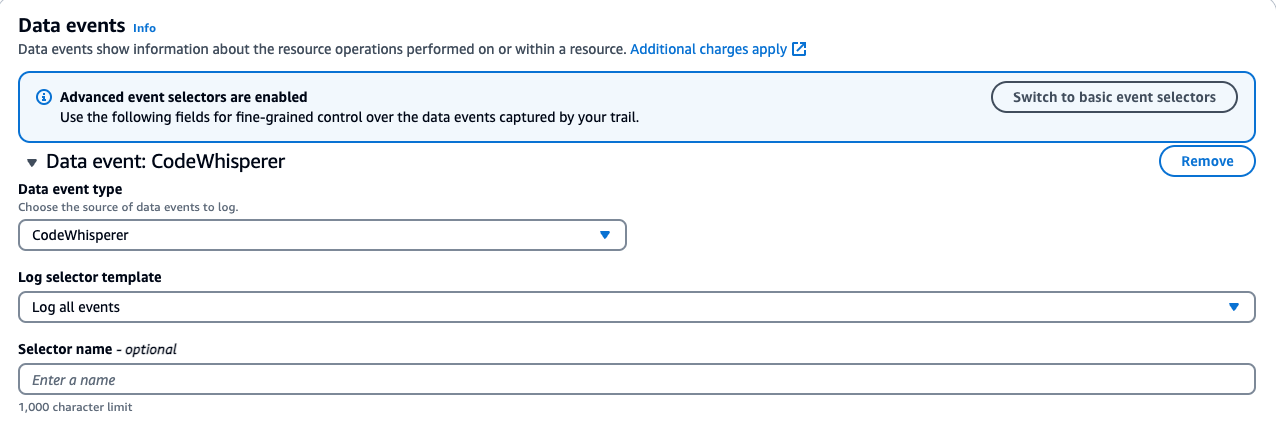
For CodeWhisperer:
Data event type: CodeWhisperer
Log selector template: Log all events
Save your changes.
Note your “Trail log location.” This S3 bucket will be used in our Athena setup.
If you don’t have an existing trail, follow the instructions in the AWS CloudTrail User Guide to set up a new trail.
Below is a screenshot of the data events addition:
Steps to Create an Athena Table from CloudTrail Logs: This step aims to turn CloudTrail events into a queryable Athena table.
1. Navigate to the AWS Management Console > Athena > Editor.
2. Click on the plus to create a query tab.
3. Run the following query to create a database and table. Note to update the location to your S3 bucket.
-- Step 1: Create a new database (if it doesn't exist)
CREATE DATABASE IF NOT EXISTS amazon_q_metrics;

-- Step 2: Create the external table explicitly within the new database
CREATE EXTERNAL TABLE amazon_q_metrics.cloudtrail_logs (

    userIdentity STRUCT<
        accountId: STRING,
        onBehalfOf: STRUCT<
            userId: STRING,
            identityStoreArn: STRING
        >
    >,
    eventTime STRING,
    eventSource STRING,
    eventName STRING,
    requestParameters STRING,
    requestId STRING,
    eventId STRING,
    resources ARRAY<STRUCT<
        arn: STRING,
        accountId: STRING,
        type: STRING
    >>,
    recipientAccountId STRING

)
ROW FORMAT SERDE 'org.apache.hive.hcatalog.data.JsonSerDe'
STORED AS INPUTFORMAT 'com.amazon.emr.cloudtrail.CloudTrailInputFormat'
OUTPUTFORMAT 'org.apache.hadoop.hive.ql.io.HiveIgnoreKeyTextOutputFormat'
LOCATION 's3://{Insert Bucket Name from CloudTrail}/'
TBLPROPERTIES ('classification'='cloudtrail');
4. Click Run
5. Run a quick query to view the data.
SELECT
    eventTime,
    userIdentity.onBehalfOf.userId AS user_id,
    eventName,
    requestParameters
FROM
    amazon_q_metrics.cloudtrail_logs AS logs
WHERE
    eventName = 'SendTelemetryEvent'
LIMIT 10;
In this section, the significance of the telemetry events captured in the requestParameters field will be explained. The query begins by displaying key fields and their data, offering insights into how users interact with various features of Amazon Q Developer.
Query Breakdown:
eventTime: This field captures the time the event was recorded, providing insights into when specific user interactions took place.
userIdentity.onBehalfOf.userId: This extracts the userId of the user. This is critical for attributing interactions to the correct user, which will be covered in more detail later in the blog.
eventName: The query is filtered on SendTelemetryEvent. Telemetry events are triggered when the user interacts with particular features or when a developer uses the service.
requestParameters: The requestParameters field is crucial because it holds the details of the telemetry events. This field contains a rich set of information depending on the type of interaction and feature the developer uses, which programming languages are used, completion types, or code modifications.
In the context of the SendTelemetryEvent, various telemetry events are captured in the requestParameters field of CloudTrail logs. These events provide insights into user interactions, overall usage, and the effectiveness of Amazon Q Developer’s suggestions. Here are the key telemetry events along with their descriptions:
UserTriggerDecisionEvent
Description: This event is triggered when a user interacts with a suggestion made by Amazon Q Developer. It captures whether the suggestion was accepted or rejected, along with relevant metadata.
Key Fields:
completionType: Whether the completion was a block or a line.
suggestionState: Whether the user accepted, rejected, or discarded the suggestion.
programmingLanguage: The programming language associated with the suggestion.
generatedLine: The number of lines generated by the suggestion.
CodeScanEvent
Description: This event is logged when a code scan is performed. It helps track the scope and result of the scan, providing insights into security and code quality checks.
Key Fields:
codeAnalysisScope: Whether the scan was performed at the file level or the project level.
programmingLanguage: The language being scanned.
CodeScanRemediationsEvent
Description: This event captures user interactions with Amazon Q Developer’s remediation suggestions, such as applying fixes or viewing issue details.
Key Fields:
CodeScanRemediationsEventType: The type of remediation action taken (e.g., viewing details or applying a fix).
includesFix: A boolean indicating whether the user applied a fix.
ChatAddMessageEvent
Description: This event is triggered when a new message is added to an ongoing chat conversation. It captures the user’s intent which refers to the purpose or goal the user is trying to achieve with the chat message. The intent can include various actions, such as suggesting alternate implementations of the code, applying common best practices, improving the quality or performance of the code.
Key Fields:
conversationId: The unique identifier for the conversation.
messageId: The unique identifier for the chat message.
userIntent: The user’s intent, such as improving code or explaining code.
programmingLanguage: The language related to the chat message.
ChatInteractWithMessageEvent
Description: This event captures when users interact with chat messages, such as copying code snippets, clicking links, or hovering over references.
Key Fields:
interactionType: The type of interaction (e.g., copy, hover, click).
interactionTarget: The target of the interaction (e.g., a code snippet or a link).
acceptedCharacterCount: The number of characters from the message that were accepted.
acceptedSnippetHasReference: A boolean indicating if the accepted snippet included a reference.
TerminalUserInteractionEvent
Description: This event logs user interactions with terminal commands or completions in the terminal environment.
Key Fields:
terminalUserInteractionEventType: The type of interaction (e.g., terminal translation or code completion).
isCompletionAccepted: A boolean indicating whether the completion was accepted by the user.
terminal: The terminal environment in which the interaction occurred.
shell: The shell used for the interaction (e.g., Bash, Zsh).
Telemetry events are key to understanding how users engage with Amazon Q Developer. They track interactions such as code completion, security scans, and chat-based suggestions. Analyzing the data in the requestParameters field helps reveal usage patterns and behaviors that offer valuable insights.
By exploring events such as UserTriggerDecisionEvent, ChatAddMessageEvent, TerminalUserInteractionEvent, and others in the schema, organizations can assess the effectiveness of Amazon Q Developer and identify areas for improvement.
Example Queries for Analyzing Developer Engagement
To gain deeper insights into how developers interact with Amazon Q Developer, the following queries can help analyze key telemetry data from CloudTrail logs. These queries track in-line code suggestions, chat interactions, and code-scanning activities. By running these queries, you can uncover valuable metrics such as the frequency of accepted suggestions, the types of chat interactions, and the programming languages most frequently scanned. This analysis helps paint a clear picture of developer engagement and usage patterns, guiding efforts to enhance productivity.
These four examples only cover a sample set of the available telemetry events, but they serve as a starting point for further exploration of Amazon Q Developer’s capabilities.
SELECT
    eventTime,
    userIdentity.onBehalfOf.userId AS user_id,
    eventName,
    json_extract_scalar(requestParameters, '$.telemetryEvent.userTriggerDecisionEvent.suggestionState') AS suggestionState,
    json_extract_scalar(requestParameters, '$.telemetryEvent.userTriggerDecisionEvent.completionType') AS completionType
FROM
    amazon_q_metrics.cloudtrail_logs
WHERE
    eventName = 'SendTelemetryEvent'
    AND json_extract(requestParameters, '$.telemetryEvent.userTriggerDecisionEvent') IS NOT NULL
    AND json_extract_scalar(requestParameters, '$.telemetryEvent.userTriggerDecisionEvent.suggestionState') = 'ACCEPT';
Use Case:This use case focuses on how developers interact with in-line code suggestions by analyzing accepted snippets. It helps identify which users are accepting suggestions, the type of snippets being accepted (blocks or lines), and the programming languages involved. Understanding these patterns can reveal how well Amazon Q Developer aligns with the developers’ expectations.
Query Explanation: The query retrieves the event time, user ID, event name, suggestion state (filtered to show only ACCEPT), and completion type. TotalGeneratedLinesBlockAccept and totalGeneratedLinesLineAccept or discarded suggestions are not included, but this gives an idea of the developers using the service for in-line code suggestions and the lines or blocks they have accepted. Additionally, the programming language field can be extracted to see which languages are used during these interactions.
Query 2: Analyzing Chat Interactions
SELECT
    userIdentity.onBehalfOf.userId AS userId,
    json_extract_scalar(requestParameters, '$.telemetryEvent.chatInteractWithMessageEvent.interactionType') AS interactionType,
    COUNT(*) AS eventCount
FROM
    amazon_q_metrics.cloudtrail_logs
WHERE
    eventName = 'SendTelemetryEvent'
    AND json_extract(requestParameters, '$.telemetryEvent.chatInteractWithMessageEvent') IS NOT NULL
GROUP BY
    userIdentity.onBehalfOf.userId,
    json_extract_scalar(requestParameters, '$.telemetryEvent.chatInteractWithMessageEvent.interactionType')
ORDER BY
    eventCount DESC;
Use Case: This use case looks at how developers use chat options like upvoting, downvoting, and copying code snippets. Understanding the chat usage patterns shows which interactions are most used and how developers engage with Amazon Q Developer chat. As an organization, this insight can help support other developers in successfully leveraging this feature.
Query Explanation: The query provides insights into chat interactions within Amazon Q Developer by retrieving user IDs, interaction types, and event counts. This query aggregates data based on the interactionType field within chatInteractWithMessageEvent, showcasing various user actions such as UPVOTE, DOWNVOTE, INSERT_AT_CURSOR, COPY_SNIPPET, COPY, CLICK_LINK, CLICK_BODY_LINK, CLICK_FOLLOW_UP, and HOVER_REFERENCE.
This analysis highlights how users engage with the chat feature and the interactions, offering a view of interaction patterns. By focusing on the interactionType field, you can better understand how developers interact with the chat feature of Amazon Q Developer.
Query 3: Analyzing Code Scanning Jobs Across Programming Languages
SELECT
    userIdentity.onBehalfOf.userId AS userId,
    json_extract_scalar(requestParameters, '$.telemetryEvent.codeScanEvent.programmingLanguage.languageName') AS programmingLanguage,
    COUNT(json_extract_scalar(requestParameters, '$.telemetryEvent.codeScanEvent.codeScanJobId')) AS jobCount
FROM
    amazon_q_metrics.cloudtrail_logs
WHERE
    eventName = 'SendTelemetryEvent'
    AND json_extract(requestParameters, '$.telemetryEvent.codeScanEvent') IS NOT NULL
GROUP BY
    userIdentity.onBehalfOf.userId,
    json_extract_scalar(requestParameters, '$.telemetryEvent.codeScanEvent.programmingLanguage.languageName')
ORDER BY
    jobCount DESC;
Use Case: Amazon Q Developer includes security scanning, and this section helps determine how the security scanning feature is being used across different users and programming languages within the organization. Understanding these trends provides valuable insights into which users actively perform security scans and the specific languages targeted for these scans.
Query Explanation: The query provides insights into the distribution of code scanning jobs across different programming languages in Amazon Q Developer. It retrieves user IDs and the count of code-scanning jobs by programming language. This analysis focuses on the CodeScanEvent, aggregating data to show the total number of jobs executed per language.
By summing up the number of code scanning jobs per programming language, this query helps to understand which languages are most frequently analyzed. It provides a view of how users are leveraging the code-scanning feature. This can be useful for identifying trends in language usage and optimizing code-scanning practices.
Query 4: Analyzing User Activity across features.
SELECT
    userIdentity.onBehalfOf.userId AS user_id,
    COUNT(DISTINCT CASE
        WHEN json_extract(requestParameters, '$.telemetryEvent.userTriggerDecisionEvent') IS NOT NULL
        THEN eventId END) AS inline_suggestions_count,
    COUNT(DISTINCT CASE
        WHEN json_extract(requestParameters, '$.telemetryEvent.chatInteractWithMessageEvent') IS NOT NULL
        THEN eventId END) AS chat_interactions_count,
    COUNT(DISTINCT CASE
        WHEN json_extract(requestParameters, '$.telemetryEvent.codeScanEvent') IS NOT NULL
        THEN eventId END) AS security_scans_count,
    COUNT(DISTINCT CASE
        WHEN json_extract(requestParameters, '$.telemetryEvent.terminalUserInteractionEvent') IS NOT NULL
        THEN eventId END) AS terminal_interactions_count
FROM
    amazon_q_metrics.cloudtrail_logs
WHERE
    eventName = 'SendTelemetryEvent'
GROUP BY
    userIdentity.onBehalfOf.userId
Use Case:This use case looks at how developers use Amazon Q Developer across different features: in-line code suggestions, chat interactions, security scans, and terminal interactions. By tracking usage, organizations can see overall engagement and identify areas where developers may need more support or training. This helps optimize the use of Amazon Q Developer and helps teams get the most out of the tool.
Query Explanation: Let’s take the other events from the prior queries and additional events to get more detail overall and tie it all together. This expanded query provides a comprehensive view of user activity within Amazon Q Developer by tracking the number of in-line code suggestions, chat interactions, security scans, and terminal interactions performed by each user. By analyzing these events, organizations can gain a better understanding of how developers are using these key features.
By summing up the interactions for each feature, this query helps identify which users are most active in each category, offering insights into usage patterns and areas where additional training or support may be needed.
Enhancing Metrics with Display Names and Usernames
The previous queries had userid as a field; however, many customers would prefer to see a user alias (such as username or display name). The following section illustrates enhancing these metrics by augmenting user IDs with display names and usernames from the AWS IAM Identity Center. This will provide more human-readable user names.
In this example, the export is run locally to enhance user metrics with IAM Identity Center for simplicity. This method works well for demonstrating how to access and work with the data, but it provides a static snapshot of the users at the time of export. In a production environment, an automated solution would be preferable to capture newly added users continuously. For the purposes of this blog, this straightforward approach is used to focus on data access.
To proceed, install Python 3.8+ and Boto3, and configure AWS credentials via the CLI. Then, run the following Python script locally to export the data:
import boto3, csv
# replace this with the region of your IDC instance
RegionName='us-east-1'
# client creation
idstoreclient = boto3.client('identitystore', RegionName)
ssoadminclient = boto3.client('sso-admin', RegionName)

Instances= (ssoadminclient.list_instances()).get('Instances')
InstanceARN=Instances[0].get('InstanceArn')
IdentityStoreId=Instances[0].get('IdentityStoreId')

# query
UserDigestList = []
ListUserResponse = idstoreclient.list_users(IdentityStoreId=IdentityStoreId)
UserDigestList.extend([[user['DisplayName'], user['UserName'], user['UserId']] for user in ListUserResponse['Users']])
NextToken = None
if 'NextToken' in ListUserResponse.keys(): NextToken = ListUserResponse['NextToken']
while NextToken is not None:
    ListUserResponse = idstoreclient.list_users(IdentityStoreId=IdentityStoreId, NextToken=NextToken)
    UserDigestList.extend([[user['DisplayName'], user['UserName'], user['UserId']] for user in ListUserResponse['Users']])
    if 'NextToken' in ListUserResponse.keys(): NextToken = ListUserResponse['NextToken']
    else: NextToken = None

# write the query results to IDCUserInfo.csv
with open('IDCUserInfo.csv', 'w') as CSVFile:
    CSVWriter = csv.writer(CSVFile, quoting=csv.QUOTE_ALL)
    HeaderRow = ['DisplayName', 'UserName', 'UserId']
    CSVWriter.writerow(HeaderRow)
    for UserRow in UserDigestList:
        CSVWriter.writerow(UserRow)
This script will query the IAM Identity Center for all users and write the results to a CSV file, including DisplayName, UserName, and UserId. After generating the CSV file, upload it to an S3 bucket. Please make note of this S3 location.
Steps to Create an Athena Table from the above CSV output: Create a table in Athena to join the existing table with the user details.
1. Navigate to the AWS Management Console > Athena > Editor.
2. Click on the plus to create a query tab.
3. Run the following query to create our table. Note to update the location to your S3 bucket.
CREATE EXTERNAL TABLE amazon_q_metrics.user_data (
    DisplayName STRING,
    UserName STRING,
    UserId STRING
)
ROW FORMAT SERDE 'org.apache.hadoop.hive.serde2.OpenCSVSerde'
WITH SERDEPROPERTIES (
   'separatorChar' = ',',
   'quoteChar'     = '"'
)
STORED AS TEXTFILE
LOCATION 's3://{Update to your S3 object location}/'  -- Path containing CSV file
TBLPROPERTIES ('skip.header.line.count'='1');
4. Click Run
5. Now, let’s run a quick query to verify the data in the new table.
SELECT * FROM amazon_q_metrics.user_data limit 10;
The first query creates an external table in Athena from user data stored in a CSV file in S3. The user_data table has three fields: DisplayName, UserName, and UserId. To specify the correct parsing of the CSV, separatorChar is specified as a comma and quoteChar as a double quote. Additionally, the TBLPROPERTIES (‘skip.header.line.count’=’1’) flag skips the header row in the CSV file, ensuring that column names aren’t treated as data.
The user_data table holds key details: DisplayName (full name), UserName (username), and UserId (unique identifier). This table will be joined with the cloudtrail_q_metrics table using the userId field from the onBehalfOf struct, enriching the interaction logs with human-readable user names and display names instead of user IDs.
In the previous analysis of in-line code suggestions, the focus was on retrieving key metrics related to user interactions with Amazon Q Developer. The query below follows a similar structure but now includes a join with the user_data table to enrich insights with additional user details such as DisplayName and Username.
To include a join with the user_data table in the query, it is necessary to define a shared key between the cloudtrail_logs_amazon_q and user_data tables. For this example, user_id will be used.
SELECT
    logs.eventTime,
    user_data.displayname,  -- Additional field from user_data table
    user_data.username,     -- Additional field from user_data table
    json_extract_scalar(logs.requestParameters, '$.telemetryEvent.userTriggerDecisionEvent.suggestionState') AS suggestionState,
    json_extract_scalar(logs.requestParameters, '$.telemetryEvent.userTriggerDecisionEvent.completionType') AS completionType
FROM
    amazon_q_metrics.cloudtrail_logs AS logs  -- Specified database for cloudtrail_logs
JOIN
    amazon_q_metrics.user_data  -- Specified database for user_data
ON
    logs.userIdentity.onBehalfOf.userId = user_data.userid
WHERE
    logs.eventName = 'SendTelemetryEvent'
    AND json_extract_scalar(logs.requestParameters, '$.telemetryEvent.userTriggerDecisionEvent.suggestionState') = 'ACCEPT';
This approach allows for a deeper analysis by integrating user-specific information with the telemetry data, helping you better understand how different user roles interact with the in-line suggestions and other features of Amazon Q Developer.
Cleanup
If you have been following along with this workflow, it is important to clean up the resources to avoid unnecessary charges. You can perform the cleanup by running the following query in the Amazon Athena console:
-- Step 1: Drop the tables
DROP TABLE IF EXISTS amazon_q_metrics.cloudtrail_logs;
DROP TABLE IF EXISTS amazon_q_metrics.user_data;

-- Step 2: Drop the database after the tables are removed
DROP DATABASE IF EXISTS amazon_q_metrics CASCADE;
This query removes both the cloudtrail_logs and user_data tables, followed by the amazon_q_metrics database.
Remove the S3 objects used to store the CloudTrail logs and user data by navigating to the S3 console, selecting the relevant buckets or objects, and choosing “Delete.”
If a new CloudTrail trail was created, consider deleting it to stop further logging. For instructions, see Deleting a Trail. If an existing trail was used, remove the CodeWhisperer data events to prevent continued logging of those events.
Conclusion
By tapping into Amazon Q Developer’s logging capabilities, organizations can unlock detailed insights that drive better decision-making and boost developer productivity. The ability to analyze user-level interactions provides a deeper understanding of how the service is used.
Now that you have these insights, the next step is leveraging them to drive improvements. For example, organizations can use this data to identify opportunities for Proof of Concepts (PoCs) and pilot programs that further demonstrate the value of Amazon Q Developer. By focusing on areas where engagement is high, you can support the most engaged developers as champions to advocate for the tool across the organization, driving broader adoption.
The true potential of these insights lies in the “art of the possible.” With the data provided, it is up to you to explore how to query or visualize it further. Whether you’re examining metrics for in-line code suggestions, interactions, or security scanning, this foundational analysis is just the beginning.
As Amazon Q Developer continues to evolve, staying updated with emerging telemetry events is crucial for maintaining visibility into the available metrics. You can do this by regularly visiting the official Amazon Q Developer documentation and the Amazon Q Developer’s Changelog to stay up-to-date latest information and insights.
We’ve all been in a situation in which Zabbix was somehow unavailable. It can happen for a variety of reasons, and our goal is always to help you get everything back up and running as quickly as possible. In this blog post, we’ll show you what to do in the event of a Zabbix failure, and we’ll also go into detail about how to work with the Zabbix technical support team to resolve more complex issues.
Step by step: Understanding why Zabbix is unavailable
When Zabbix becomes unavailable, it’s important to follow a few key steps to try to resolve the problem as quickly as possible.
Check the service status. First, verify if your Zabbix service is truly inactive. You can do this by accessing the machine where Zabbix is installed and checking the service status using a command like systemctl status zabbix-serveron Linux.
Analyze the Zabbix logs. Check the Zabbix logs for any error messages or clues about what may have caused the failure.
Restart the service. If the Zabbix service has stopped, try restarting it using the appropriate command for your operating system. For example, on Linux, you can use sudo systemctl restart zabbix-server.
Check the database connectivity. Zabbix uses a database to store data and Zabbix server configurations. Make sure that the database is accessible and functioning properly. You can test database connectivity using tools like ping or telnet.
Check your available disk space. Verify that there is available disk space on the machine where Zabbix is installed. A lack of disk space is a common cause of system failures.
Evaluate dependencies. Make sure all Zabbix dependencies are installed and working correctly. This includes libraries, services, and any other software required for Zabbix to function.
If the problem persists after carrying out these steps, it may be necessary to refer to the official Zabbix documentation, seek help from the official Zabbix forum, or contact the Zabbix technical support team, depending on the severity and urgency of the situation.
Making the most of a Zabbix technical support contract
If you or your company have a Zabbix technical support contract, access to our global team of technical experts is guaranteed. This is an ideal option for resolving more complex or urgent issues. Here are a few steps you can follow when contacting the Zabbix technical support team:
Gather all important information. Before contacting the Zabbix technical support team, gather all relevant information about the issue you’re facing. This can include error messages, logs, screenshots, and any steps you’ve already taken to try to resolve the issue.
Open a ticket with the Zabbix technical support team. Contact Zabbix technical support by opening a ticket on the Zabbix Support System. Provide all the information gathered in the previous step to help the technicians understand the problem and find a solution as quickly as possible.
Explain exactly how Zabbix crashed. When describing the problem, be as precise and detailed as possible. Include information such as the Zabbix version you are using, your operating system, your network configuration, and any other relevant details that might help our team diagnose the issue.
Be available to follow up on the ticket. Once you’ve opened a ticket, be available to provide additional information or clarify any questions the support technicians may have. This will help speed up the problem resolution process.
Follow the Zabbix technical support team’s recommendations. After receiving recommendations, follow them carefully and test to see whether they resolve the issue. If the problem persists or if new issues arise, inform the Zabbix technical support team immediately so they can continue assisting you.
A Zabbix technical support subscription gives you access to a team of Zabbix experts who can help you configure and troubleshoot your Zabbix environment. Check out the benefits of each type of subscription on the Zabbix website and make sure you have all the support you need to keep your monitoring fully operational.
The heart and soul of a Zabbix Summit is the wide range of expert speakers who show up each year to share their experience, knowledge, and discoveries. Accordingly, we’re continuing our series of interviews with Summit 2024 speakers by having a chat with MariaDB Sales Engineer Anders Karlsson. He’ll grace our stage at Summit 2024 to talk about his 4 decades of work experience and share how he uses a variety of Zabbix features to monitor MariaDB clusters and MariaDB MaxScale.
Please tell us a bit about yourself and the journey that led you to MariaDB.
I have been working with databases nearly all of my professional life, which is more than 40 years by now. My first IT job was as a system administrator on a development system for Telco equipment running UNIX on a PDP/11 70. This was fun, and I got to use Unix very early (the early 1980’s) and I was also there at the start of the Internet (by emailing through UUCP to the US and then through what was then the Internet).
Following that, I joined another Telco company, which used a rather unknown database technology called Oracle (version 4.1.4). When this company moved their operations from Stockholm (where I lived) to Luxembourg, I decided to leave and look for other opportunities. I heard that Oracle was looking for people and I got a job there as a support engineer. At Oracle I soon got involved with lots of things beyond Tech Support – I was a trainer, a consultant, and eventually a sales engineer.
I left Oracle in the early 1990’s to join a small application development company as a developer, but this really wasn’t for me, so I soon left and joined Informix instead. I was at Informix until 1996 or so and then I worked for some other small companies around the end of the millennium. Next, I joined forces with a couple of old friends to develop a database solution. This wasn’t very successful, and I still needed a job.
I first ended up with TimesTen before they ran out of luck. After a year or so of freelancing, I was approached by an old friend from the Informix days who was now the sales manager for MySQL in Scandinavia. I joined MySQL in 2004 as a sales engineer and was there until Oracle took over. I then worked for a small Swedish startup for a couple of years, but I missed sales engineering, so when I got an offer to join MariaDB in 2012 I said yes.
How long have you been using Zabbix? What kind of Zabbix tasks do you get up to on a daily basis?
I have known about Zabbix and used it occasionally for a while, but while preparing for Zabbix Summit 2024 I have gotten to use it “in anger” a bit more. There are pros and cons to it, but in general I like it. It does have a lot of “Open Source” feel to it, but that is not really an issue for me.
Can you give us a few clues about what we can expect to hear during your Zabbix Summit presentation?
I will focus on monitoring MariaDB Clusters running Galera Cluster and the MariaDB MaxScale database proxy. Monitoring individual MariaDB servers is easy out of the box with Zabbix, but when you have a cluster you have to monitor certain cluster-wide attributes. MariaDB MaxScale keeps track of the state of the server in the cluster in detail and the cluster as whole, and I will show how to pull cluster-wide data from MaxScale using the MaxScale REST/JSON API and how to use that to build triggers and graphs in Zabbix. I will finish up by doing a demo of this with MariaDB MaxScale and a Galera Cluster.
What led you to the topic of Monitoring MariaDB Clusters and MariaDB MaxScale with Zabbix?
The main thing was that although there are community provided Zabbix templates for MariaDB MaxScale, and Galera can be monitored largely by the Zabbix agent, using these typically does not provide as much in terms of cluster-wide monitoring as I would like. It’s important to know how the reads and writes are distributed, what the state of the database cluster is, etc.
How do you see the role of Zabbix in MariaDB in the near future? Are you planning to use it for any other new tasks?
My next goal is to see if I can write a blog for MariaDB on Zabbix monitoring with some emphasis on MariaDB MaxScale.
As the Vice President of Compliance and Policy at fTLD Registry Services, Heather Diaz is a security expert with over a decade of experience in ensuring the legal, compliance, and strategic alignment of the top-level domains .Bank and .Insurance. She is a compliance and ethics professional and leads the policy and security compliance functions at fTLD.
We sat down with her to learn more about how Zabbix makes her job easier, why she appreciates the inherent flexibility of our solutions, and how she works with our team to help make sure fTLD’s domains are as secure as they can possibly be.
Can you give us a bit of background on fTLD and what it does? What makes your business proposition stand out?
fTLD Registry is the domain authority for .Bank and .Insurance – the most trusted and exclusive domain extensions for banks, insurers, and producers. Our mission is to offer these industry-created and governed domains a shield against cyberattacks and fraud, delivering peace of mind with website and email security.
Since 2011, fTLD Registry has collaborated with experts in cybersecurity, domain security, and the banking and insurance sectors to develop Security Requirements that mitigate cyber threats such as phishing, spoofing, cybersquatting, and man-in-the-middle attacks.
Why is monitoring especially important for fTLD?
Security monitoring is a key value for .Bankers (banks who have switched to .Bank) and our .Insurance customers as well. They receive reporting from our customized Zabbix monitoring system whenever security vulnerabilities are detected. This ensures we provide proactive compliance security monitoring, which allows them to address any findings and keep their .Bank and .Insurance websites and email channels secure.
Are there any specific points you were looking to address with a new monitoring approach?
fTLD has continued to enhance our security requirements for .Bank and .Insurance to address new and evolving cybersecurity threats and provide more secure and trusted online interactions for the financial services sector and their customers. We do this by partnering with Zabbix’s security experts and engineers to make sure our security requirements and monitoring continue to provide best-in-class domain security for .Bank and .Insurance.
Can you please share any business or operational areas that have seen improvements since implementing Zabbix?
Our compliance area has enjoyed having time to engage with .Bank and .Insurance customers to educate them about how to address any security vulnerabilities, as the Zabbix system takes care of sending notifications and warnings to our customers. Not only that, the Zabbix system gives us a dashboard with easy-to-interpret metrics, the ability to generate ad-hoc reporting, and with a number of important data elements integrated, such as customer contact information and their domain status (e.g., live), so our team can always have secure employee access to security monitoring data no matter where in the world we are working. Here are just some of the external interfaces, Agent2 plugins, and custom notifications we developed together with the Zabbix team.
External interfaces:
ICANN CZDS (to get a list of zones)
Whois (to get zone and registrar details)
CRM (to get a list of verification contacts)
Marketing system (to get a list of additional zone details)
Certificate plugin (to validate TLS ciphers and certificates)
Port check plugin (to check what ports are open and verify the security of opened ports)
DMARC/SPF plugin (to check presence and validity of DMARC and SPF records)
Web redirect plugin (to check validity of HTTP headers and redirects)
Notifications
Media types to send compliance reports
Is there anything else you’d like to share about Zabbix and our capabilities?
Zabbix is a great partner for security monitoring, as they’re willing to develop new features to provide a service that meets our exacting business requirements and their support is highly responsive. Most solutions come as they are. With Zabbix, we were able to customize and adapt their solution when new needs came up. My favorite feature is how we provide automated reporting to our customers and key stakeholders – it’s all automated and handled by the Zabbix platform.
Zabbix Summit 2024 is almost here, and we’re giving you a sneak peek into what you can expect to see on our main stage this year via a series of short interviews with a few of the eminent speakers who will grace us with their presence. First up is Birol Yildiz, the CEO and Co-founder of ilert GmbH and a man who is deeply passionate about keeping alert noise and fatigue to a minimum.
Please tell us a bit about yourself and the journey that led you to ilert GmbH.
My journey in the tech industry began with a deep passion for creating solutions that simplify and improve the lives of IT professionals. Before co-founding ilert GmbH, I spent over a decade working in various IT roles, ranging from software development to operations. I noticed that while monitoring systems were becoming increasingly sophisticated, the process of alert management and incident response was lagging behind.
This gap inspired me to create ilert, a platform focused on bridging that divide by optimizing alerting processes and reducing response times. Our goal at ilert has always been to empower teams with the tools they need to stay ahead of incidents, ensuring that their systems run smoothly and efficiently.
How long have you been using Zabbix? What kind of Zabbix-related tasks are you involved in on a daily basis?
Zabbix has been an integral part of ilert since 2018, when we first developed one of our early integrations with the platform. Recognizing its popularity among our customer base, we enhanced this integration in 2020, transforming it into a native integration and solidifying our partnership with Zabbix as a technology partner. Since then, Zabbix has become one of the most popular integrations within ilert.
On a daily basis, my involvement with Zabbix includes overseeing the continued optimization of our integration, ensuring that it meets the evolving needs of our users. I work closely with our development and support teams to identify and implement improvements based on user feedback and the latest developments from Zabbix.
Can you give us a few clues about what we can expect to hear during your Zabbix Summit presentation?
Alert fatigue has long been a significant challenge for the DevOps community, often leading to decreased efficiency and increased stress among professionals. In my presentation, we will explore innovative strategies that leverage AI to mitigate alert noise.
I’ll be discussing how to maximize the efficiency of your incident response process by leveraging Zabbix with advanced alerting and on-call management tools like ilert. I’ll share insights on reducing alert fatigue, improving incident response times, and ensuring that critical alerts reach the right people at the right time.
This talk will be particularly valuable for DevOps engineers looking to optimize their alert management systems and reduce the cognitive load caused by alert fatigue. Zabbix administrators will find it insightful, especially if they are interested in integrating advanced AI techniques into their monitoring workflows to achieve better performance and reliability.
Moreover, AI and machine learning enthusiasts will gain practical knowledge about applying AI in IT monitoring and alerting, making this session a comprehensive resource for anyone looking to advance their alert management strategies.
Reducing alert noise is something that’s on almost everyone’s wish list, but was there any particular incident or aspect of your professional life that made you want to focus on this topic?
Absolutely. There was a specific incident early in my career that left a lasting impact on me. We were using a monitoring system that generated a significant number of alerts, most of which were non-critical. One weekend, a critical issue was buried in a flood of low-priority alerts, leading to a delayed response and significant downtime for the business.
This incident underscored the importance of not just having a monitoring system in place but ensuring that it was configured to minimize noise and prioritize what truly matters. That experience drove me to focus on creating solutions that help teams filter out the noise and respond quickly to what’s really important, which is a core principle behind ilert’s offerings.
Are there any other similar issues that you can envision tackling with Zabbix?
Yes, beyond reducing alert noise, there’s a lot of potential in enhancing the collaboration between teams during incidents. For example, automating incident communication and resolution processes is an area where I see great value. By integrating Zabbix with incident management platforms like ilert, teams can not only reduce noise but also streamline communication, ensuring that the right people are involved at the right time and that resolution steps are clear and actionable.
Another area is optimizing the way multiple on-call teams work together using Zabbix and incident response platforms like ilert. In many organizations, different teams are responsible for specific sets of host groups in Zabbix, and it’s crucial that each team only receives alerts for the services they are directly responsible for. These are just a few examples of how we can continue to evolve our approach to incident management in conjunction with Zabbix.
QU!CK Scan & Go, a startup specializing in self-service markets, required a monitoring system that could allow a comprehensive view of operations. Read on to see how Zabbix provided them with a solution that positively impacted their operations as well as their finances.
The convenience of having access to an establishment supplying staple foods around the clock is the motivating factor behind the rise of QU!CK Scan & Go. Since 2021, QU!CK Scan & Go has been developing self-service mini market systems, available in residential complexes and corporate buildings.
Available 24 hours a day, 7 days a week, the technology developed by QU!CK Scan & Go allows markets to be open at all times, with 100% self-service. Customers select the products they want, confirm the price by scanning a barcode, and complete the purchase in their own app with a credit card or virtual wallet.
QU!CK Scan & Go was the first company in the self-service market segment to operate in Argentina. As of this writing, they have 25 self-service stores located in Argentina and 2 in the United States.
The challenge
With the rapid growth in their business, QU!CK Scan & Go needed to be able to easily visualize operations in order to handle environmental issues and avoid product loss due to external factors. In the event of a power outage, for instance, refrigerators and freezers will fail to function, a problem that may take considerable time and effort to fix.
This scenario isn’t an abstract hypothetical – power outages are a recurring issue in Argentina. In 2021 and 2022, the average length of a power outage was 5 hours. For freezers storing products such as ice cream, frozen processed foods, and other perishable items, that’s more than enough time for the products to thaw and become unusable, resulting in severe financial losses.
The solution
QU!CK Scan & Go’s search for a solution led them to Zabbix by way of CTL Information Technology, a Zabbix Certified Partner in Argentina. Juan Guido Camaño, CEO of CTL, immediately grasped the fact that Zabbix provided the perfect solution for what QU!CK Scan & Go needed to monitor.
“Zabbix was our first, second and third choice, due to our extensive experience with the tool. We did not believe that there would be any better alternative.”
– Juan Guido Camaño, CEO of CTL
At the beginning of the implementation project, CTL identified all possible variables necessary for monitoring that should generate alarms in the case of an extraordinary event. These included:
Power outages
Internet connection status
Opened doors
Ambient and air conditioning temperatures
Refrigerator and freezer temperatures
In 2021 and 2022, the team at CTL carried out the proof of concept and the implementation of the tool in the first self-service markets, following a stage-by-stage plan.
First, they had to configure the Zabbix Agent on the monitoring device. After that, we created a standard monitoring model to be used in all establishments, according to data collection and alarm triggering needs. The alarms were subsequently adjusted, with possible responses implemented according to each variable identified. At that point, data visualization was organized in an external system just for reviewing the integrated dashboards.
Thanks to the implementation of IoT devices to control the temperature and the opening and closing of doors, alerts are sent to Zabbix in the event of unusual activity, such as very high or low temperatures, doors opened without supervision, and refrigerator doors open longer than the stipulated time, among other issues.
The results
Since the implementation of Zabbix project in QU!CK Scan & Go’s self-service markets, a variety of benefits have been apparent, including:
Increased control of self-service establishments
Faster resolution of incidents
Improved visualization of operations
Increased availability of services
However, the biggest returns on investment were observed at the financial level. With power outage monitoring and quick corrective actions, losses of perishable products have decreased by 75%.
“Losses of refrigerated products ceased to be an issue due to constant monitoring and immediate alerts in case of incidents during power outages.” – Juan Guido Camaño, CEO of CTL
Additionally, with real-time visualization of operations and business monitoring, the profitability of refrigerated products during power outage incidents has increased by 100%. Currently, QU!CK Scan & Go is the leading company in the self-service market segment in Argentina in terms of turnover, with a rapidly increased brand value.
“In a 100% self-service business model, investments made in incident identification technologies have a direct impact on the company’s results.” – Marcos Acuña, QU!CK Scan & Go
What’s next
While successful, the Zabbix project carried out by CTL and QU!CK Scan & Go is far from finished. The implementation of Zabbix in the company is accelerating at the same rate that new establishments are opened, and the proposal is to continue expanding this monitoring project by completely migrating data visualization to Zabbix.
“Having already managed to ensure the availability of the services associated with QU!CK operations, we are now focusing on the continuous infrastructure optimization.” – Juan Guido Camaño, CEO of CTL
For QU!CK Scan & Go, Zabbix has become much more than an IT infrastructure monitoring provider. Our solutions have improved their business and brought added value to their brand.
“With Zabbix, the return on investment after opening a new location is achieved 50% faster than it used to be.” – Marcos Acuña, Founder of QU!CK Scan & Go
Our goal of promoting seamless services to the technology market together with our partners is most visible in situations like this one, when we’re able to go beyond basic monitoring and position Zabbix as a vital support service for strategic decision making. To find out more about what Zabbix can do for customers in the retail sector, visit us here.
A top-level domain (TLD) is the part of a URL that comes after the last dot in a domain name. While most are familiar with the first TLDs of .com, .net, and .org, there are more than 1,400 TLDs. fTLD Registry (fTLD) is a global coalition of banks, insurance companies, and financial services trade associations who ensure the .Bank and .Insurance TLDs are governed in the best interests of the financial sector and their customers.
The challenge
In 2011, fTLD was formed to secure and manage .Bank and .Insurance. Due to the high risk of fraud in the financial sector, keeping domains (websites and email) secure and out of the hands of malicious actors was paramount – and that can’t be done without close, careful security monitoring. Unfortunately, fTLD was initially dependent on a monitoring solution that required manual compliance work, which made it difficult to get actionable information to its customers and partners. When they began to seek out a replacement solution, fTLD realized that Zabbix promised exactly the features they required, which prompted them to make the switch.
The solution
For every domain in .Bank and .Insurance that meets minimum technical requirements, Zabbix’s system performs multiple security compliance checks. These checks cover a range of domain security features to ensure .Bank and .Insurance websites and email services have implemented a multi-layered domain defense by way of the Security Requirements required by fTLD. Specifically, Zabbix checks and monitors for:
Authoritative name servers, which guarantee that the name servers for .Bank and .Insurance websites have the required security features.
Enhanced DNS security, which involves the proper validation of DNS Security Extensions (DNSSEC) with strong cryptographic algorithms to prevent unauthorized changes to domain data and cyberattacks, including domain spoofing and domain hijacking.
Digital identity and robust encryption, which confirm TLS certificates and TLS version requirements for secure web connections and encrypts all communications for the safe and secure transmission of personal information and financial transactions.
Email security, which increases the deliverability of email and checks for the deployment of DMARC and SPF to protect against phishing and spoofing.
When Zabbix detects an issue, it automatically notifies involved parties, including the registrar and the customer using the domain. As a client, fTLD has access to all the security monitoring data via a custom dashboard. Zabbix puts critical compliance security monitoring information at fTLD’s fingertips, helping them make good on their promise of airtight security for banks, insurers, and producers and their customers through .Bank and .Insurance domains.
The results
Heather Diaz, Vice President, Compliance and Policy, leads the security function for fTLD and attests that:
“With Zabbix as a partner, we have peace of mind knowing that domain security is closely monitored. We can then focus on engaging with customers to help them get the full cyber benefits of using .Bank and .Insurance to protect their brand and their customer data.”
By entrusting Zabbix with security monitoring, fTLD has seen a variety of benefits, including:
Considerable growth in overall security compliance, as Zabbix monitoring has provided better, more accessible, and more reliable security information.
A tangible boost in productivity, thanks to automated customer and partner notifications.
A bird’s-eye view of stats across all domains as well as detailed information for individual domains.
Adaptive compliance security monitoring through daily checks, which help maintain a proactive defense against cyberattacks.
Security expertise from Zabbix to ensure that fTLD’s Security Requirements represent best practices and security measures to ensure the security of .Bank and .Insurance domains and their customers’ well-placed trust.
In conclusion
fTLD is changing the way banks, insurers, and producers around the world interact with their customers by offering trusted, verified, more secure domains. They trust Zabbix to guarantee a multi-layered domain defense strategy by alerting fTLD and its customers to detected anomalies or security issues.
To learn more about what Zabbix can do for customers in banking and finance, visit us here.
As a Zabbix partner, we help customers worldwide with all their Zabbix needs, ranging from building a simple template all the way to (massive) turn-key implementations, trainings, and support contracts. Quite often during projects, we get the question, “How about making configuration backups of our network equipment? We need this, as another tool was also capable of doing this!”
The answer is always the same – yes, but no. Yes, technically it is possible to get your configuration backups in Zabbix. It’s not even that hard to set up initially. However, you really should not want configuration backups. Zabbix is not made for them, and you will run into limitations within minutes. As you can imagine, the customer is never happy with this limitation, and some actively start to question where we think the limitation is to see if it is a limitation for them as well. So we simply set up an SSH agent item and get that config out:
Voila! Once per hour Zabbix will log in to that device, execute the command ‘show full-configuration,’ and get back the result. Frankly, it just works. You check the Monitoring -> Latest data section of the host and see that there is data for this item. Problem solved, right?
No. As a matter of fact, this is where the problems start. Zabbix allows us to store up to 64KB of data in a item value. The above screenshot is of a (small) fortigate firewall and the config if stored in a text file is just over 1.1MB. So, Zabbix truncates the data, which renders the backup useless – restore will never work. At the same time, Zabbix is not sanitizing the output, so all secrets are left in it.
To make it even worse, it’s challenging to make a diff of different config versions/revisions – that feature is just not there. Most of the time, the customer is at this point convinced that Zabbix is not the right tool and the next question pops up – “Now what? How can we fix this?” This is where our added value is presented, as we do have a solution here which is rather affordable (free) as well.
The solution is Oxidized, which is basically Rancid on steroids. This project started years ago and is released under the Apache 2.0 license. We found it by accident, started playing around with it, and never left it. The project is available on Github (https://github.com/ytti/oxidized) and written in Ruby. Incidentally, if you (or your company) have Ruby devs and want to give something back to the community, the Oxidized project is looking for extra maintainers!
At this point, we show our customers the GUI of Oxidized, which in our case involves just making backups of a few firewalls:
So we have the name, the model, and (in this case) just one group. The status shows whether the backup was successful or not, the last update and when the last change was detected. At the same time, under actions, we can get the full config file, look at previous revisions(and diff them) combined with a ‘execute now’ option.
Looking at the versions, it’s simply showing this:
This is already giving us a nice idea of what is going on. We see the versions and dates at a glance, but the moment we check the diff option, we can easily see what was actually changed:
The perfect solution, except that it is not integrated with Zabbix. That means double administration and a lot of extra work, combined with the inevitable errors – devices not added, credential mismatches, connection errors, etc. Luckily, we can easily change the format of the above information from GUI to json by just adding ‘.json’ at the end of the url:
As you might know, Zabbix is perfectly capable of parsing json formats and creating items and triggers out of them. A master item, dependent lld (https://blog.zabbix.com/low-level-discovery-with-dependent-items/13634/), and within minutes you’ve got Oxidized making configuration backups while Zabbix is monitoring and alerting on the status:
At this point we’re getting close to a nice integration, but we haven’t overcome the double configuration management yet.
Oxidized can read its configuration from multiple sources, including a CSV file, SQL, SQLite, MySQL or HTTP. The easiest is a CSV file – just make sure you’ve got all information in the correct column and it works. An example:
Great, now we have to configure 2 places (Zabbix and Oxidized) and get a username/password cleartext in a CSV file. What about SQL as a source, and letting it connect to Zabbix? From there we should be able to get information regarding the hostname, but somehow we need the credentials as well. That’s not a default piece of information in Zabbix, but UserMacros can save us here.
So on our host we add 2 extra macros:
At the same time, we need to tell Oxidized what kind of device it is. There are multiple ways of doing this, obviously. A tag, a usermacro, hostgroups, you name it. In order to do this, we place a tag on the host:
Now we make sure that Oxidized is only taking hosts with the tag ‘oxidized’ and extract from them the host name, IP address, model, username, and password:
This way, we simply add our host in Zabbix, add the SSH credentials, and Oxidized will pick it up the next time a backup is scheduled. Zabbix will immediately start monitoring the status of those jobs and alert you if something fails.
This blog post is not meant as a complete integration write down, but rather as a way to give some insight into how we as a partner operate in the field, taking advantage of the flexibility of the products we work with. This post should give you enough information to build it yourself, but of course we’re always available to help you or just build it as part of our consultancy offering.
After plenty of breathless anticipation, we’re proud to announce the release of the latest major Zabbix version – the new and improved Zabbix 7.0 LTS. This release is the direct result of user feedback and delivers a variety of improvements, including cloud-native Zabbix proxy scalability, website transaction monitoring, improved data collection speed and scalability, new dashboard widgets, major network discovery speed improvements, new templates and integrations, and more!
Without further ado, let’s take a whistle-stop tour of what you need to know:
Table of Contents
Synthetic end-user web monitoring
Busy enterprises can now monitor multiple websites and applications by defining flexible multi-step browser-based scenarios. 7.0 LTS also makes it easy to capture screenshots of the current website state, collect and visualize website performance and availability metrics, extract, monitor, and analyze web application data, and get alerts when issues are discovered.
Zabbix proxy high availability and load balancing
When it’s time to expand, Zabbix 7.0 LTS makes it easy to scale a Zabbix environment, guaranteeing 100% availability with automatic proxy load balancing and high availability features, including the ability to assign hosts to load-balanced proxy groups and seamlessly scale a Zabbix environment by deploying additional proxies.
Faster, more efficient Zabbix proxies
Zabbix proxy now fully supports in-memory data storage for collected metrics. Users can choose from Disk, Memory, and Hybrid proxy buffer modes, all of which are ideal for embedded hardware. In addition, memory mode enables the support of edge computing use cases. Users can expect 10-100x better proxy performance by switching to memory or hybrid modes, depending on allocated hardware.
Centralized control of data collection timeouts
Centralizing control of data collection timeouts enables better support for metrics and custom checks, taking longer data collection time intervals. Data collection timeouts can be defined per item-type and overridden per proxy or on an individual item level. In addition, timeouts are now fully configurable in the Zabbix GUI or via Zabbix API.
Faster and more scalable data collection
Synchronous poller processes have been replaced with asynchronous pollers, which improves the speed and scalability of metric polling, particularly for agent, SNMP, and HTTP checks. The next metric can now be polled before waiting for a response from a previously requested metric, and up to 1,000 concurrent checks can now be supported per poller process.
New ways to visualize data
A variety of new dashboard widgets have been introduced, with the goal of giving users detailed information about their monitored metrics and infrastructure at a glance.
Dynamic dashboard widget navigation
Speaking of dashboard widgets, a new communication framework has also been introduced for dashboard widgets, enabling communication between widgets, allowing a widget to serve as a data source for other widgets, and dynamically updating information displayed in a dashboard widget based on the data source.
Faster network discovery
Discovering services and hosts has never been easier, thanks to support of parallelization while performing network discovery. Concurrency support allows for massive improvements in network discovery speed and simplifies host and service discovery while scanning large network segments.
Better security via enterprise-grade multi-factor authentication
Out-of-the box support of multi-factor authentication enables enterprise-grade security and added flexibility for configuring user authentication methods. Support MFA providers include time-based one-time Password (TOTP) and Duo Universal Prompt authentication.
More flexible resource discovery and management
Low-level discovery has received a variety of improvements, which enable enhanced host configuration and management flexibility when discovering hosts in complex environments, such as VMware or Kubernetes.
New templates and integrations
In response to user demand, Zabbix 7.0 LTS comes pre-packaged with a range of new templates for the most popular vendors and cloud providers.
Zabbix 7.0 training updates
All Zabbix training materials have been updated based on the new functionalities that have been added to the product since Zabbix 6.0.
Everyone is welcome to sharpen their skills, but if you’re a Zabbix 6.0 Certified Specialist or Certified Professional you can master Zabbix 7.0 LTS in just one day with our Upgrade Courses. As a 7.0 Specialist, you’ll be able to automate user provisioning with the Just-in-time (JIT) feature, monitor websites with new synthetic end-user monitoring, leverage new visualization features, and enhance the speed and performance of your data collection.
The 7.0 Certified Professional course covers proxy group configuration with high availability and load balancing, improved proxy data collection, new SNMP bulk monitoring, and enhanced host discovery for VMware, Kubernetes, and Cloud infrastructures.
We’re also happy to organize private trainings for organizations of any size, so don’t hesitate to get in touch!
Upcoming 7.0 events
If you’re looking for more information regarding Zabbix 7.0, you’re in luck! You can tune in to the “What’s new in Zabbix 7.0” webinar on June 11 at 12 PM CST or June 12 at 10 AM EEST. If you’d prefer a more hands-on approach, the following workshops are also available:
• “Zabbix Proxy High-availability and Load Balancing” (June 18, 6 PM EEST)
• “New Web Monitoring Features in Zabbix 7.0” (June 20, 6 PM EEST)
While you’re at it, feel free to explore Zabbix 7.0 LTS webinars and workshops in other languages. You can also check out worldwide events related to Zabbix 7.0 LTS, including our free in-person meetup in Riga on June 19 and Zabbix Summit 2024 this fall.
Ready to upgrade or migrate?
With a brand-new version out, there’s never been a better time to take advantage of our upgrade or migration services. Let our team take the risk out of migrating or upgrading to 7.0, giving you the latest version at a lower cost and with minimal disruption to your organization.
Need a consultation about the latest version?
Not sure about how to get the most out of Zabbix 7.0? Our expert consultants can answer any questions related to the architecture of your infrastructure, the implementation of a back-up strategy, and your capacity planning, while providing strategic advice on which 7.0 services are right for you.
Make your contribution as a translator
The Documentation 7.0 translation project is now live, which means that you can help localize Zabbix 7.0 documentation in multiple languages. Your efforts will help make Zabbix accessible to users around the globe, and you’ll also receive a reward for your contributions. The guidelines, which contain essential information about the project, are available here.
Useful links
To see what else is in store for the future, have a look at the Zabbix roadmap.
You can find the instructions and download the new version on the Download page.
Detailed, step-by-step upgrade instructions are available on our Upgrade procedure page.
Learn about new features and changes introduced in Zabbix 7.0 LTS by visiting the What’s new in Zabbix 7.0 page.
The What’s new documentation section provides a detailed description of the new features.
Take a look at the release notes to see the full list of new features and improvements.
A key component of effective corporate network security is establishing end to end visibility across all traffic that flows through the network. Every network engineer needs a complete overview of their network traffic to confirm their security policies work, to identify new vulnerabilities, and to analyze any shifts in traffic behavior. Often, it’s difficult to build out effective network monitoring as teams struggle with problems like configuring and tuning data collection, managing storage costs, and analyzing traffic across multiple visibility tools.
Today, we’re excited to announce that a free version of Cloudflare’s network flow monitoring product, Magic Network Monitoring, is available to all Enterprise Customers. Every Enterprise Customer can configure Magic Network Monitoring and immediately improve their network visibility in as little as 30 minutes via our self-serve onboarding process.
Enterprise Customers can visit the Magic Network Monitoring product page, click “Talk to an expert”, and fill out the form. You’ll receive access within 24 hours of submitting the request. Over the next month, the free version of Magic Network Monitoring will be rolled out to all Enterprise Customers. The product will automatically be available by default without the need to submit a form.
How it works
Cloudflare customers can send their network flow data (either NetFlow or sFlow) from their routers to Cloudflare’s network edge.
Magic Network Monitoring will pick up this data, parse it, and instantly provide insights and analytics on your network traffic. These analytics include traffic volume overtime in bytes and packets, top protocols, sources, destinations, ports, and TCP flags.
Dogfooding Magic Network Monitoring during the remediation of the Thanksgiving 2023 security incident
Let’s review a recent example of how Magic Network Monitoring improved Cloudflare’s own network security and traffic visibility during the Thanksgiving 2023 security incident. Our security team needed a lightweight method to identify malicious packet characteristics in our core data center traffic. We monitored for any network traffic sourced from or destined to a list of ASNs associated with the bad actor. Our security team setup Magic Network Monitoring and established visibility into our first core data center within 24 hours of the project kick-off. Today, Cloudflare continues to use Magic Network Monitoring to monitor for traffic related to bad actors and to provide real time traffic analytics on more than 1 Tbps of core data center traffic.
Magic Network Monitoring – Traffic Analytics
Monitoring local network traffic from IoT devices
Magic Network Monitoring also improves visibility on any network traffic that doesn’t go through Cloudflare. Imagine that you’re a network engineer at ACME Corporation, and it’s your job to manage and troubleshoot IoT devices in a factory that are connected to the factory’s internal network. The traffic generated by these IoT devices doesn’t go through Cloudflare because it is destined to other devices and endpoints on the internal network. Nonetheless, you still need to establish network visibility into device traffic over time to monitor and troubleshoot the system.
To solve the problem, you configure a router or other network device to securely send encrypted traffic flow summaries to Cloudflare via an IPSec tunnel. Magic Network Monitoring parses the data, and instantly provides you with insights and analytics on your network traffic. Now, when an IoT device goes down, or a connection between IoT devices is unexpectedly blocked, you can analyze historical network traffic data in Magic Network Monitoring to speed up the troubleshooting process.
Monitoring cloud network traffic
As cloud networking becomes increasingly prevalent, it is essential for enterprises to invest in visibility across their cloud environments. Let’s say you’re responsible for monitoring and troubleshooting your corporation’s cloud network operations which are spread across multiple public cloud providers. You need to improve visibility into your cloud network traffic to analyze and troubleshoot any unexpected traffic patterns like configuration drift that leads to an exposed network port.
To improve traffic visibility across different cloud environments, you can export cloud traffic flow logs from any virtual device that supports NetFlow or sFlow to Cloudflare. In the future, we are building support for native cloud VPC flow logs in conjunction with Magic Cloud Networking. Cloudflare will parse this traffic flow data and provide alerts plus analytics across all your cloud environments in a single pane of glass on the Cloudflare dashboard.
Improve your security posture today in less than 30 minutes
If you’re an existing Enterprise customer, and you want to improve your corporate network security, you can get started right away. Visit the Magic Network Monitoring product page, click “Talk to an expert”, and fill out the form. You’ll receive access within 24 hours of submitting the request. You can begin the self-serve onboarding tutorial, and start monitoring your first batch of network traffic in less than 30 minutes.
Over the next month, the free version of Magic Network Monitoring will be rolled out to all Enterprise Customers. The product will be automatically available by default without the need to submit a form.
If you’re interested in becoming an Enterprise Customer, and have more questions about Magic Network Monitoring, you can talk with an expert. If you’re a free customer, and you’re interested in testing a limited beta of Magic Network Monitoring, you can fill out this form to request access.
Maximizing the value from Enterprise Software tools requires an understanding of who and how users interact with those tools. As we have worked with builders rolling out Amazon CodeWhisperer to their enterprises, identifying usage patterns has been critical.
This blog post is a result of that work, builds on Introducing Amazon CodeWhisperer Dashboard blog and Amazon CloudWatch metrics and enables customers to build dashboards to support their rollouts. Note that these features are only available in CodeWhisperer Professional plan.
Organizations have leveraged the existing Amazon CodeWhisperer Dashboard to gain insights into developer usage. This blog explores how we can supplement the existing dashboard with detailed user analytics. Identifying leading contributors has accelerated tool usage and adoption within organizations. Acknowledging and incentivizing adopters can accelerate a broader adoption.
The architecture diagram outlines a streamlined process for tracking and analyzing Amazon CodeWhisperer usage events. It begins with logging these events in CodeWhisperer and AWS CloudTrail and then forwarding them to Amazon CloudWatch Logs. Configuring AWS CloudTrail involves using Amazon S3 for storage and AWS Key Management Service (KMS) for log encryption. An AWS Lambda function analyzes the logs, extracting information about user activity. This blog also introduces a AWS CloudFormation template that simplifies the setup process, including creating the CloudTrail with an S3 bucket KMS key and the Lambda function. The template also configures AWS IAM permissions, ensuring the Lambda function has access rights to interact with other AWS services.
Configuring CloudTrail for CodeWhisperer User Tracking
This section details the process for monitoring user interactions while using Amazon CodeWhisperer. The aim is to utilize AWS CloudTrail to record instances where users receive code suggestions from CodeWhisperer. This involves setting up a new CloudTrail trail tailored to log events related to these interactions. By accomplishing this, you lay a foundational framework for capturing detailed user activity data, which is crucial for the subsequent steps of analyzing and visualizing this data through a custom AWS Lambda function and an Amazon CloudWatch dashboard.
Setup CloudTrail for CodeWhisperer
1. Navigate to AWS CloudTrail Service.
2. Create Trail
3. Choose Trail Attributes
a. Click on Create Trail
b. Provide a Trail Name, for example, “cwspr-preprod-cloudtrail”
c. Choose Enable for all accounts in my organization
d. Choose Create a new Amazon S3 bucket to configure the Storage Location
e. For Trail log bucket and folder, note down the given unique trail bucket name in order to view the logs at a future point.
f. Check Enabled to encrypt log files with SSE-KMS encryption
j. Enter an AWS Key Management Service alias for log file SSE-KMS encryption, for example, “cwspr-preprod-cloudtrail”
h. Select Enabled for CloudWatch Logs
i. Select New
j. Copy the given CloudWatch Log group name, you will need this for the testing the Lambda function in a future step.
k. Provide a Role Name, for example, “CloudTrailRole-cwspr-preprod-cloudtrail”
l. Click Next.
4. Choose Log Events
a. Check “Management events“ and ”Data events“
b. Under Management events, keep the default options under API activity, Read and Write
c. Under Data event, choose CodeWhisperer for Data event type
d. Keep the default Log all events under Log selector template
e. Click Next
f. Review and click Create Trail
Please Note: The logs will need to be included on the account which the management account or member accounts are enabled.
Gathering Application ARN for CodeWhisperer application
Step 1: Access AWS IAM Identity Center
1. Locate and click on the Services dropdown menu at the top of the console.
Step 2: Find the Application ARN for CodeWhisperer application
1. In the IAM Identity Center dashboard, click on Application Assignments. -> Applications in the left-side navigation pane.
2. Locate the application with Service as CodeWhisperer and click on it
3. Copy the Application ARN and store it in a secure place. You will need this ID to configure your Lambda function’s JSON event.
User Activity Analysis in CodeWhisperer with AWS Lambda
This section focuses on creating and testing our custom AWS Lambda function, which was explicitly designed to analyze user activity within an Amazon CodeWhisperer environment. This function is critical in extracting, processing, and organizing user activity data. It starts by retrieving detailed logs from CloudWatch containing CodeWhisperer user activity, then cross-references this data with the membership details obtained from the AWS Identity Center. This allows the function to categorize users into active and inactive groups based on their engagement within a specified time frame.
The Lambda function’s capability extends to fetching and structuring detailed user information, including names, display names, and email addresses. It then sorts and compiles these details into a comprehensive HTML output. This output highlights the CodeWhisperer usage in an organization.
Creating and Configuring Your AWS Lambda Function
1. Navigate to the Lambda service.
2. Click on Create function.
3. Choose Author from scratch.
4. Enter a Function name, for example, “AmazonCodeWhispererUserActivity”.
5. Choose Python 3.11 as the Runtime.
6. Click on ‘Create function’ to create your new Lambda function.
7. Access the Function: After creating your Lambda function, you will be directed to the function’s dashboard. If not, navigate to the Lambda service, find your function “AmazonCodeWhispererUserActivity”, and click on it.
8. Copy and paste your Python code into the inline code editor on the function’s dashboard. The lambda function code can be found here.
9. Click ‘Deploy’ to save and deploy your code to the Lambda function.
10. You have now successfully created and configured an AWS Lambda function with our Python code.
Updating the Execution Role for Your AWS Lambda Function
After you’ve created your Lambda function, you need to ensure it has the appropriate permissions to interact with other AWS services like CloudWatch Logs and AWS Identity Store. Here’s how you can update the IAM role permissions:
Locate the Execution Role:
1. Open Your Lambda Function’s Dashboard in the AWS Management Console.
2. Click on the ‘Configuration’ tab located near the top of the dashboard.
3. Set the Time Out setting to 15 minutes from the default 3 seconds
4. Select the ‘Permissions’ menu on the left side of the Configuration page.
5. Find the ‘Execution role’ section on the Permissions page.
6. Click on the Role Name to open the IAM (Identity and Access Management) role associated with your Lambda function.
7. In the IAM role dashboard, click on the Policy Name under the Permissions policies.
8. Edit the existing policy: Replace the policy with the following JSON.
9. Save the changes to the policy.
{
   "Version":"2012-10-17",
   "Statement":[
      {
         "Action":[
            "logs:CreateLogGroup",
            "logs:CreateLogStream",
            "logs:PutLogEvents",
            "logs:StartQuery",
            "logs:GetQueryResults",
            "sso:ListInstances",
            "sso:ListApplicationAssignments"
            "identitystore:DescribeUser",
            "identitystore:ListUsers",
            "identitystore:ListGroupMemberships"
         ],
         "Resource":"*",
         "Effect":"Allow"
      },
      {
         "Action":[
            "cloudtrail:DescribeTrails",
            "cloudtrail:GetTrailStatus"
         ],
         "Resource":"*",
         "Effect":"Allow"
      }
   ]
} Your AWS Lambda function now has the necessary permissions to execute and interact with CloudWatch Logs and AWS Identity Store.
Testing Lambda Function with custom input
1. On your Lambda function’s dashboard.
2. On the function’s dashboard, locate the Test button near the top right corner.
3. Click on Test. This opens a dialog for configuring a new test event.
4. In the dialog, you’ll see an option to create a new test event. If it’s your first test, you’ll be prompted automatically to create a new event.
5. For Event name, enter a descriptive name for your test, such as “TestEvent”.
6. In the event code area, replace the existing JSON with your specific input:
a. log_group_name: The name of the log group in CloudWatch Logs.
b. start_date: The start date and time for the query, formatted as “YYYY-MM-DD HH:MM:SS”.
c. end_date: The end date and time for the query, formatted as “YYYY-MM-DD HH:MM:SS”.
e. codewhisperer_application_arn: The ARN of the Code Whisperer Application in the AWS Identity Store.
f. identity_store_region: The region of the AWS Identity Store.
f. codewhisperer_region: The region of where Amazon CodeWhisperer is configured.
8. Click on Save to store this test configuration.
9. With the test event selected, click on the Test button again to execute the function with this event.
10. The function will run, and you’ll see the execution result at the top of the page. This includes execution status, logs, and output.
11. Check the Execution result section to see if the function executed successfully.
Visualizing CodeWhisperer User Activity with Amazon CloudWatch Dashboard
This section focuses on effectively visualizing the data processed by our AWS Lambda function using a CloudWatch dashboard. This part of the guide provides a step-by-step approach to creating a “CodeWhispererUserActivity” dashboard within CloudWatch. It details how to add a custom widget to display the results from the Lambda Function. The process includes configuring the widget with the Lambda function’s ARN and the necessary JSON parameters.
1.Navigate to the Amazon CloudWatch service from within the AWS Management Console
2. Choose the ‘Dashboards’ option from the left-hand navigation panel.
3. Click on ‘Create dashboard’ and provide a name for your dashboard, for example: “CodeWhispererUserActivity”.
4. Click the ‘Create Dashboard’ button.
5. Select “Other Content Types” as your ‘Data sources types’ option before choosing “Custom Widget” for your ‘Widget Configuration’ and then click ‘Next’.
6. On the “Create a custom widget” page click the ‘Next’ button without making a selection from the dropdown.
7. On the ‘Create a custom widget’ page:
a. Enter your Lambda function’s ARN (Amazon Resource Name) or use the dropdown menu to find and select your “CodeWhispererUserActivity” function.
b. Add the JSON parameters that you provided in the test event, without including the start and end dates.
{ "log_group_name": "{Insert Log Group Name}", “codewhisperer_application_arn”:”{Insert Codewhisperer Application ARN}”, "identity_store_region": "{Insert identity Store Region}", "codewhisperer_region": "{Insert Codewhisperer Region}" }
8. Click the ‘Add widget’ button. The dashboard will update to include your new widget and will run the Lambda function to retrieve initial data. You’ll need to click the “Execute them all” button in the upper banner to let CloudWatch run the initial Lambda retrieval.
9. Customize Your Dashboard: Arrange the dashboard by dragging and resizing widgets for optimal organization and visibility. Adjust the time range and refresh settings as needed to suit your monitoring requirements.
10. Save the Dashboard Configuration: After setting up and customizing your dashboard, click ‘Save dashboard’ to preserve your layout and settings.
CloudFormation Deployment for the CodeWhisperer Dashboard
The blog post concludes with a detailed AWS CloudFormation template designed to automate the setup of the necessary infrastructure for the Amazon CodeWhisperer User Activity Dashboard. This template provisions AWS resources, streamlining the deployment process. It includes the configuration of AWS CloudTrail for tracking user interactions, setting up CloudWatch Logs for logging and monitoring, and creating an AWS Lambda function for analyzing user activity data. Additionally, the template defines the required IAM roles and permissions, ensuring the Lambda function has access to the needed AWS services and resources.
The blog post also provides a JSON configuration for the CloudWatch dashboard. This is because, at the time of writing, AWS CloudFormation does not natively support the creation and configuration of CloudWatch dashboards. Therefore, the JSON configuration is necessary to manually set up the dashboard in CloudWatch, allowing users to visualize the processed data from the Lambda function. The CloudFormation template can be found here.
Create a CloudWatch Dashboard and import the JSON below.
In this blog, we detail a comprehensive process for establishing a user activity dashboard for Amazon CodeWhisperer to deliver data to support an enterprise rollout. The journey begins with setting up AWS CloudTrail to log user interactions with CodeWhisperer. This foundational step ensures the capture of detailed activity events, which is vital for our subsequent analysis. We then construct a tailored AWS Lambda function to sift through CloudTrail logs. Then, create a dashboard in AWS CloudWatch. This dashboard serves as a central platform for displaying the user data from our Lambda function in an accessible, user-friendly format.
You can reference the existing CodeWhisperer dashboard for additional insights. The Amazon CodeWhisperer Dashboard offers a view summarizing data about how your developers use the service.
Overall, this dashboard empowers you to track, understand, and influence the adoption and effective use of Amazon CodeWhisperer in your organizations, optimizing the tool’s deployment and fostering a culture of informed data-driven usage.
You can use Amazon Security Lake to simplify log data collection and retention for Amazon Web Services (AWS) and non-AWS data sources. To make sure that you get the most out of your implementation requires proper planning.
In this post, we will show you how to plan and implement a proof of concept (POC) for Security Lake to help you determine the functionality and value of Security Lake in your environment, so that your team can confidently design and implement in production. We will walk you through the following steps:
Understand the functionality and value of Security Lake
Determine success criteria for the POC
Define your Security Lake configuration
Prepare for deployment
Enable Security Lake
Validate deployment
Understand the functionality of Security Lake
Figure 1 summarizes the main features of Security Lake and the context of how to use it:
Figure 1: Overview of Security Lake functionality
As shown in the figure, Security Lake ingests and normalizes logs from data sources such as AWS services, AWS Partner sources, and custom sources. Security Lake also manages the lifecycle, orchestration, and subscribers. Subscribers can be AWS services, such as Amazon Athena, or AWS Partner subscribers.
There are four primary functions that Security Lake provides:
Centralize visibility to your data from AWS environments, SaaS providers, on-premises, and other cloud data sources — You can collect log sources from AWS services such as AWS CloudTrail management events, Amazon Simple Storage Service (Amazon S3) data events, AWS Lambda data events, Amazon Route 53 Resolver logs, VPC Flow Logs, and AWS Security Hub findings, in addition to log sources from on-premises, other cloud services, SaaS applications, and custom sources. Security Lake automatically aggregates the security data across AWS Regions and accounts.
Normalize your security data to an open standard — Security Lake normalizes log sources in a common schema, the Open Security Schema Framework (OCSF), and stores them in compressed parquet files.
Use your preferred analytics tools to analyze your security data — You can use AWS tools, such as Athena and Amazon OpenSearch Service, or you can utilize external security tools to analyze the data in Security Lake.
Optimize and manage your security data for more efficient storage and query — Security Lake manages the lifecycle of your data with customizable retention settings with automated storage tiering to help provide more cost-effective storage.
Determine success criteria
By establishing success criteria, you can assess whether Security Lake has helped address the challenges that you are facing. Some example success criteria include:
I need to centrally set up and store AWS logs across my organization in AWS Organizations for multiple log sources.
I need to more efficiently collect VPC Flow Logs in my organization and analyze them in my security information and event management (SIEM) solution.
I want to use OpenSearch Service to replace my on-premises SIEM.
I want to collect AWS log sources and custom sources for machine learning with Amazon Sagemaker.
I need to establish a dashboard in Amazon QuickSight to visualize my Security Hub findings and a custom log source data.
Review your success criteria to make sure that your goals are realistic given your timeframe and potential constraints that are specific to your organization. For example, do you have full control over the creation of AWS services that are deployed in an organization? Do you have resources that can dedicate time to implement and test? Is this time convenient for relevant stakeholders to evaluate the service?
The timeframe of your POC will depend on your answers to these questions.
Important: Security Lake has a 15-day free trial per account that you use from the time that you enable Security Lake. This is the best way to estimate the costs for each Region throughout the trial, which is an important consideration when you configure your POC.
Define your Security Lake configuration
After you establish your success criteria, you should define your desired Security Lake configuration. Some important decisions include the following:
Determine AWS log sources — Decide which AWS log sources to collect. For information about the available options, see Collecting data from AWS services.
Determine third-party log sources — Decide if you want to include non-AWS service logs as sources in your POC. For more information about your options, see Third-party integrations with Security Lake; the integrations listed as “Source” can send logs to Security Lake.
Note: You can add third-party integrations after the POC or in a second phase of the POC. Pre-planning will be required to make sure that you can get these set up during the 15-day free trial. Third-party integrations usually take more time to set up than AWS service logs.
Select a delegated administrator – Identify which account will serve as the delegated administrator. Make sure that you have the appropriate permissions from the organization admin account to identify and enable the account that will be your Security Lake delegated administrator. This account will be the location for the S3 buckets with your security data and where you centrally configure Security Lake. The AWS Security Reference Architecture (AWS SRA) recommends that you use the AWS logging account for this purpose. In addition, make sure to review Important considerations for delegated Security Lake administrators.
Select accounts in scope — Define which accounts to collect data from. To get the most realistic estimate of the cost of Security Lake, enable all accounts across your organization during the free trial.
Determine analytics tool — Determine if you want to use native AWS analytics tools, such as Athena and OpenSearch Service, or an existing SIEM, where the SIEM is a subscriber to Security Lake.
Define log retention and Regions — Define your log retention requirements and Regional restrictions or considerations.
Prepare for deployment
After you determine your success criteria and your Security Lake configuration, you should have an idea of your stakeholders, desired state, and timeframe. Now you need to prepare for deployment. In this step, you should complete as much as possible before you deploy Security Lake. The following are some steps to take:
Create a project plan and timeline so that everyone involved understands what success look like and what the scope and timeline is.
Define the relevant stakeholders and consumers of the Security Lake data. Some common stakeholders include security operations center (SOC) analysts, incident responders, security engineers, cloud engineers, finance, and others.
Define who is responsible, accountable, consulted, and informed during the deployment. Make sure that team members understand their roles.
Consider other technical prerequisites that you need to accomplish. For example, if you need roles in addition to what Security Lake creates for custom extract, transform, and load (ETL) pipelines for custom sources, can you work with the team in charge of that process before the POC?
Enable Security Lake
The next step is to enable Security Lake in your environment and configure your sources and subscribers.
Deploy Security Lake across the Regions, accounts, and AWS log sources that you previously defined.
Configure custom sources that are in scope for your POC.
Configure analytics tools in scope for your POC.
Validate deployment
The final step is to confirm that you have configured Security Lake and additional components, validate that everything is working as intended, and evaluate the solution against your success criteria.
Validate log collection — Verify that you are collecting the log sources that you configured. To do this, check the S3 buckets in the delegated administrator account for the logs.
Validate analytics tool — Verify that you can analyze the log sources in your analytics tool of choice. If you don’t want to configure additional analytics tooling, you can use Athena, which is configured when you set up Security Lake. For sample Athena queries, see Amazon Security Lake Example Queries on GitHub and Security Lake queries in the documentation.
Obtain a cost estimate — In the Security Lake console, you can review a usage page to verify that the cost of Security Lake in your environment aligns with your expectations and budgets.
Assess success criteria — Determine if you achieved the success criteria that you defined at the beginning of the project.
Next steps
Next steps will largely depend on whether you decide to move forward with Security Lake.
Determine if you have the approval and budget to use Security Lake.
Expand to other data sources that can help you provide more security outcomes for your business.
Configure S3 lifecycle policies to efficiently store logs long term based on your requirements.
Let other teams know that they can subscribe to Security Lake to use the log data for their own purposes. For example, a development team that gets access to CloudTrail through Security Lake can analyze the logs to understand the permissions needed for an application.
Conclusion
In this blog post, we showed you how to plan and implement a Security Lake POC. You learned how to do so through phases, including defining success criteria, configuring Security Lake, and validating that Security Lake meets your business needs.
As a customer, this guide will help you run a successful proof of value (POV) with Security Lake. It guides you in assessing the value and factors to consider when deciding to implement the current features.
The popularity of remote teams may have exploded in popularity during the COVID-19 pandemic, but it’s not a phenomenon that’s likely to trend downward anytime soon. High-profile organizations like 3M, Dropbox, Shopify, and LinkedIn are continuing to enthusiastically embrace remote working, essentially making it the “default setting” for their employees.
The shift toward remote working is not without its challenges, however. Organizations of all sizes often have little time to set up the kind of networking infrastructure and efficient processes that make sure remote workers are just as connected and productive as their on-site counterparts. In this article, we’ll take a quick look at some of the most important network monitoring challenges that remote teams face and show how Zabbix can help you tackle them as efficiently as possible.
Table of Contents
Infrastructure and connectivity issues
A remote network is essentially a grouping of multiple smaller network setups, each with their own set of variables that can affect performance. The differences between network system and infrastructure quality at different remote destinations can often lead to low overall network performance, which in turn makes it a challenge to provide the kind of high-speed communication needed to run the remote automation tools and software applications used by remote employees and teams.
By providing straightforward and easy-to-understand visibility into a network’s connected devices and how data moves between them, Zabbix makes it easy to automatically compare data and identify any drop in network performance.
With Zabbix, you can easily keep an eye on network routers and switches, especially internet provider and uplink ports up/down. You can also monitor network latency, the error rate on ports, the packet loss to important devices, and network utilization on important ports with net.if.in/net.if.out. Here are some example triggers:
High Network Utilization: avg(/Router ABC/net.if.in[eth0],5m)>80MB
High Packet Loss: avg(/Router ABC/icmppingloss,5m)>5
High Latency: avg(/Router ABC/icmppingsec,5m)>0.1
What’s more, Zabbix allows you to create network maps with important network devices and real-time data, as well as dashboards with maps and single item/gauge widgets, all of which makes it far easier to achieve the uninterrupted connectivity that remote teams depend on.
Staying safe
Remote locations aren’t islands that can be completely isolated from external traffic. Staying vigilant and doing everything possible to eliminate data breaches is important, and taking advantage of strong encryption methods, network scanning tools, and firewalls to protect your systems is a good start. However, using a whole suite of tools to protect security can add more difficulty when it comes to integrating and monitoring them.
With Zabbix, you can count on enterprise-grade security, including encrypted communication between components, a flexible user permission schema that can be easily applied to a distributed environment, and custom user roles with a granular set of permissions for different types of users.
Zabbix also provides native support for HTTP, LDAP, and SAML authentication (which gives you an additional layer of security and improves your user experience while working with Zabbix), the ability to restrict access to sensitive information by limiting which metrics can be collected in your environment, and the ability to track changes in your environment by utilizing the Audit log. It’s all designed to make sure that there are no compromises on the security of your data when you decide to go remote.
Scalability
As a remote organization grows and its distributed systems expand, a good monitoring solution needs to be able to grow along with it in order to prevent gaps in coverage while maintaining performance and reliability. Zabbix gives you limitless scalability in the form of Zabbix proxies, which act as independent intermediaries that collect performance and availability data on behalf of a Zabbix server. You can roll out new proxies as fast as you need them, and because Zabbix is free and open source, you don’t have to worry about additional licensing costs.
Zabbix proxies allow you to see at a glance what resources are being used on your network at any given moment, which is especially handy if, like most remote teams, you have tens or even hundreds of servers and network appliances to monitor. You can also execute remote commands in remote locations – either on the proxies themselves or on the agents monitored by the proxy, and multiple frontends can be deployed for load balancing as well as for improved security and connectivity. Proxy docker containers and cloud options are available as well, enhancing flexibility and making Zabbix ideal for any organization that spans the globe (or aspires to).
Managing multiple solutions
The legacy software and systems you use were most likely designed to work in a traditional networking model. Remote working, as we’ve seen, presents a whole new range of challenges when it comes to compatibility and support.
We’ve created Zabbix to be as easy as possible to integrate with existing systems. You can easily monitor any operating system, cloud service, IP telephony service, docker container, or web server/database backend. We provide out-of-the-box monitoring for the world’s leading hardware and software vendors, and our extensively documented API makes it easy to create workflows and integrate with other systems. In addition, you can also integrate Zabbix with the most popular helpdesk, messaging, and ITSM systems, such as Slack, Jira, MS Teams, and many others.
Not only that, Zabbix is designed to serve as the ideal monitoring solution for multi-tenant environments. It serves as a single pane of glass for your entire infrastructure, and it’s easy to visualize everything that’s happening with your network with unique maps, dashboards, and templates.
Conclusion
The days of large teams all working together under the same roof are a thing of the past – the remote working trend will only accelerate as technology improves and employees get more accustomed to working with colleagues across multiple locations. That’s why it’s of paramount importance to make sure your monitoring solution has the built-in flexibility and scalability to grow with your team and your business.
If you want to see for yourself how Zabbix can help you effectively monitor a globally distributed network, contact us.
To provide the best experiences, we use technologies like cookies to store and/or access device information. Consenting to these technologies will allow us to process data such as browsing behavior or unique IDs on this site. Not consenting or withdrawing consent, may adversely affect certain features and functions.
Functional
Always active
The technical storage or access is strictly necessary for the legitimate purpose of enabling the use of a specific service explicitly requested by the subscriber or user, or for the sole purpose of carrying out the transmission of a communication over an electronic communications network.
Preferences
The technical storage or access is necessary for the legitimate purpose of storing preferences that are not requested by the subscriber or user.
Statistics
The technical storage or access that is used exclusively for statistical purposes.The technical storage or access that is used exclusively for anonymous statistical purposes. Without a subpoena, voluntary compliance on the part of your Internet Service Provider, or additional records from a third party, information stored or retrieved for this purpose alone cannot usually be used to identify you.
Marketing
The technical storage or access is required to create user profiles to send advertising, or to track the user on a website or across several websites for similar marketing purposes.