In our recent blog post announcing GitHub Copilot X, we mentioned that generative AI represents the future of software development. This amazing technology will enable developers to stay in the flow while helping enterprises meet their business goals.
But as we have also mentioned in our blog series on compliance, generative AI may soon act as an enabler for developer-focused compliance programs that will drive optimization and keep your development, compliance and audit teams productive and happy.
Today, we’ll explore the potential for generative AI to help enable teams to optimize and automate some of the foundational compliance components of separation of duties that many enterprises still often manage and review manually.
Generative AI has been dominating the news lately—but what exactly is it? Here’s what you need to know, and what it means for developers.
Separation of duties
The concept of “separation of duties,” long used in the accounting world as a check and balance approach, is also adopted in other scenarios, including technology architecture and workflows. While helpful to address compliance, it can lead to additional manual steps that can slow down delivery and innovation.
Fortunately, the PCI-DSS requirements guide provides a more DevOps, cloud native, and AI-enabled approach to separation of duties by focusing on functions and accounts, as opposed to people:
“The purpose of this requirement is to separate the development and test functions from the production functions. For example, a developer can use an administrator-level account with elevated privileges in the development environment and have a separate account with user-level access to the production environment.”
There are many parts of a software delivery workflow that need to have separation of duties in place—but one of the core components that is key for any compliance program is the code review. Having a separate set of objective eyes reviewing your code, whether it’s human or AI-powered, helps to ensure risks, tech debt, and security vulnerabilities are found and mitigated as early as possible.
Code reviews also help enable the concept of separation of duties since it prohibits a single person or a single function, account, or process from moving code to the next part of your delivery workflow. Additionally, code reviews help enable separation of duties for Infrastructure as Code (IaC) workflows, Policy-as-Code configurations, and even Kubernetes declarative deployments.
As we mentioned in our previous blog, GitHub makes code review easy, since pull requests are part of the existing workflow that millions of developers use daily. Having a foundational piece of compliance built-in to the platform that developers know and love keeps them in the flow, while keeping compliance and audit teams happy as well.
Generative AI and pull requests
Wouldn’t it be cool if one-day generative AI could be leveraged to enable more developer-friendly compliance programs which have traditionally been very labor and time intensive? Imagine if generative AI could help enable DevOps and cloud native approaches for separation of duties by automating tedious tasks and allowing humans to focus on key value-added tasks.
Bringing this back to compliance and separation of duties, wouldn’t it be great if a generative AI helper was available to provide an objective set of eyes on your pull requests? This is what the GitHub Next team has been working towards with GitHub Copilot for Pull Requests.
Suggestions for your pull request descriptions. AI-powered tags are embedded into a pull request description and automatically filled out by GitHub Copilot based on the code which the developers changed. Going one step further, the GitHub Next team is also looking at the creation of descriptive sentences and paragraphs as developers create pull requests.
Code reviews with AI. Taking pull requests and code reviews one step further, the GitHub Next team is looking at AI to help review the code and provide suggestions for changes. This will help enable human interactions and optimize existing processes. The AI would automate the creation of the descriptions, based on the code changes, as well as suggestions for improvements. The code reviewer will have everything they need to quickly review the change and decide to either move forward or send the change back.
When these capabilities are production ready, development teams and compliance programs will appreciate these features for a few reasons. First, the pull request and code review process would be driven by a conversation based on a neutral and independent description. Second, the description will be based on the actual code that was changed. Third, both development and compliance workflows will be optimized and allow humans to focus on value-added work.
While these capabilities are still a work in progress, there are features available now that may help enable compliance, audit, and security teams with GitHub Copilot for Business. The ability for developers to complete tasks faster and stay in the flow are truly amazing. But the ability for GitHub Copilot to provide AI-based security vulnerability filtering nowis a great place for compliance and audit teams within enterprises to get started on their journey to embracing generative AI into their day-to-day practices.
Next steps
Generative AI will enable developers and enterprises to achieve success by reducing manual tasks and enabling developers to focus their creativity on business value–all while staying in the flow.
I hope this blog will help drive positive discussions regarding this topic and has provided a forward looking view into what will be possible in the future. The future ability of generative AI to help enable teams by automating tedious tasks will help humans focus on more value-added work and could eventually be an important part of a robust and risk-based compliance posture.
AWS Network Firewall is a managed service that provides a convenient way to deploy essential network protections for your virtual private clouds (VPCs). In this blog, we are going to cover how to leverage the TLS inspection configuration with AWS Network Firewall and perform Deep Packet Inspection for encrypted traffic. We shall also discuss key considerations and possible architectures.
Today, the majority of internet traffic is SSL/TLS encrypted to maintain privacy and secure communications between applications. Deep packet inspection (DPI) refers to the method of examining the full content of data packets as they traverse a network perimeter firewall. However, the lack of visibility into encrypted traffic presents a challenge to organizations that do not have the resources to decrypt and inspect network traffic. TLS encryption can hide malware, conceal data theft, or mask data leakage of sensitive information such as credit card numbers or passwords. Additionally, TLS decryption is compute-intensive and cryptographic standards are constantly evolving. Organizations that want to decrypt and inspect network traffic typically use a combination of hardware and software solutions from multiple vendors, which adds operational complexity and implementation challenges around capacity planning, scaling issues, and latency concerns. This forces some organizations to make adverse decisions to reduce the complexity of inspecting their network traffic such as blocking access to popular websites to mitigate performance problems.
There are multiple options you can use to perform DPI for encrypted traffic in your AWS environment, based on the use case. These include using AWS WAF or implementing third-party security appliances (next generation firewalls). The addition of new services like Gateway Load Balancer gives you more flexibility in designing your firewall architectures and the ability to perform DPI on AWS.
With this release, Network Firewall also becomes an option to support Deep Packet Inspection on encrypted payloads.
Considerations for deep packet inspection
The following are some key factors to consider when you enable TLS decryption functionality on Network Firewall.
DPI and performance. DPI is processor-intensive, because it not only looks into individual packets, but it also looks into traffic flows (a flow is a collection of related packets). This is combined with the fact that inspection needs to be done in real time with minimal impact to latency. Also, because many firewalls perform other advanced functions (for example, stateful packet inspection, NAT, virtual private network (VPN), and malware threat prevention), adding DPI increases the complexity of the entire system and impacts performance. However, because Network Firewall is an AWS managed service, the bandwidth performance of 100 gigabits per second (Gbps) per firewall endpoint is not impacted, even after you enable TLS inspection configuration. Single digit millisecond latency is expected at initial connection due to the TCP and TLS handshake before data can flow to the firewall. We recommend that you conduct your own testing for the rule sets to verify that the service meets your performance expectations.
DPI and encryption. Encryption has particularly been a challenge to DPI. Effective decisions can’t be made if the contents of the packets aren’t known. As more applications and websites use encryption, it is important that you implement the right TLS decryption technique. With Network Firewall, you can chose which traffic to decrypt by using your available certificates in AWS Certificate Manager (ACM). You can then apply the TLS configurations across the stateful rule groups, thereby authorizing Network Firewall to act as a go-between. For more information on how AWS Network Firewall handles privacy, please read the Network Firewall documentation.
AWS Network Firewall deployment architectures
There are three main architecture patterns for Network Firewall deployments. You can refer to the Deployment models for AWS Network Firewall blog post, which provides details on these, as well as key considerations. The three main models are as follows:
Distributed deployment model — Network Firewall is deployed into each individual VPC.
Centralized deployment model — Network Firewall is deployed into a centralized VPC for East-West (VPC-to-VPC) or North-South (inbound and outbound from internet, on-premises) traffic. We refer to this VPC as the inspection VPC throughout this blog post.
Combined deployment model — Network Firewall is deployed into a centralized inspection VPC for East-West (VPC-to-VPC) and a subset of North-South (on-premises, egress) traffic. Internet ingress is distributed to VPCs that require dedicated inbound access from the internet, and Network Firewall is deployed accordingly.
Each of these architectures is still valid for TLS inspection functionality. Today, AWS Network Firewall supports TLS inspection only for the ingress (inbound) traffic coming into the VPC.
In this section, we will highlight a deployment architecture with AWS Network Firewall and the process for deep packet inspection.
AWS Network Firewall – prior to TLS inspection configuration
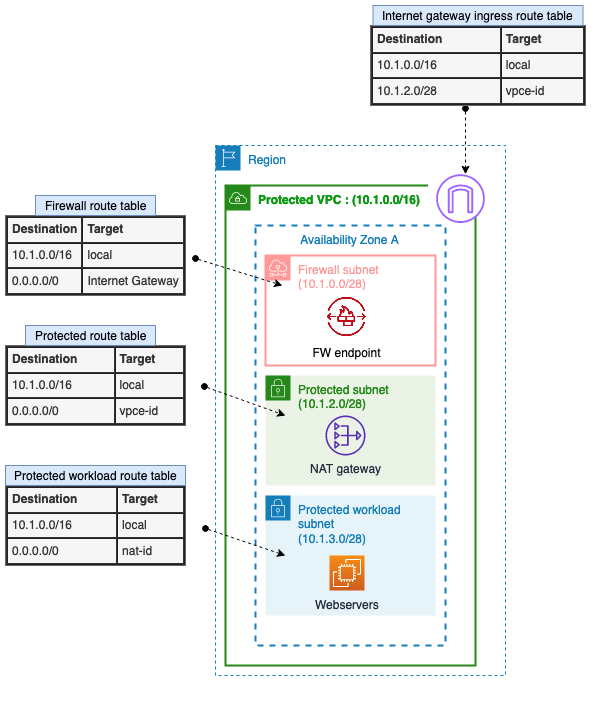
Below figure 1 shows how Network Firewall performs inspection when the TLS inspection feature isn’t enabled. The workflow is as follows:
The ingress traffic enters the VPC. Ingress routing enables the internet traffic to be inspected by AWS Network Firewall.
The traffic from the firewall endpoint to the Network Firewall:
Network Firewall inspects the packet first through a stateless engine. Network Firewall makes a drop/pass decision by applying the rules that are present in the stateless engine.
If there is no match on the set of stateless rules present, the traffic is then forwarded to the stateful engine. Again, a drop/pass decision is made by applying the set of stateful rules.
If the decision is to pass traffic, then the firewall endpoint present in the firewall subnet sends the traffic to the customer subnet through the routes present in the VPC subnet route table.
AWS Network Firewall — after TLS inspection configuration
After you enable the TLS inspection capability in Network Firewall, the traffic flow changes slightly, as shown in Figure 2. Because the ingress data you want to inspect is encrypted, it first needs to be decrypted before it is sent to the firewall stateful engine.
In Figure 2, you can see the ingress traffic flow, which has the following steps:
The ingress traffic enters the VPC. Ingress routing enables the internet traffic to be inspected by AWS Network Firewall.
The traffic from the firewall endpoint to the Network Firewall:
Network Firewall inspects the packet first through a stateless engine. Network Firewall makes a drop/pass decision by applying the rules present in the stateless engine.
If there is no match on the set of stateless rules present, the traffic is then forwarded to the stateful engine. However, before the traffic passes to the stateful engine, if there is no match and the traffic is in the scope of the TLS encryption configuration, the traffic is forwarded for the decrypt operation.
After decryption, the traffic is then forwarded to the firewall stateful engine for inspection. Again, Network Firewall makes a drop/pass decision by applying the set of stateful rules.
If the decision is to pass traffic, then the firewall endpoint present in the firewall subnet sends the traffic to the customer subnet through the routes present in the VPC subnet route table.
Note: Customers must trust this certificate for the TLS inspection configuration to function properly.
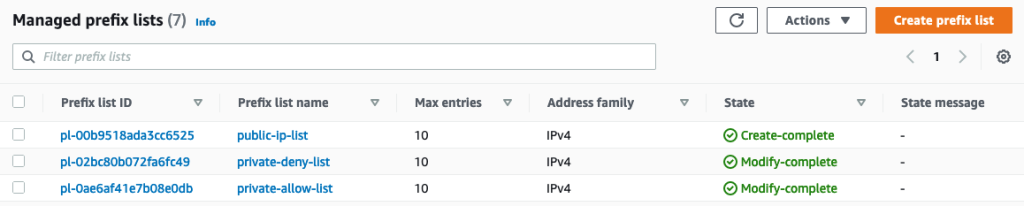
Let’s look at how to implement TLS inspection when you create a new network firewall in AWS Network Firewall. A TLS inspection configuration contains one or more references to a valid AWS Certificate Manager (ACM) SSL/TLS certificate that Network Firewall uses to decrypt ingress (inbound) traffic. Network Firewall supports a variety of certificate types supported in addition to wildcard certificates. You can optionally define a scope (5-tuple based) to decrypt traffic by source and destination IP or port. To follow this procedure, you must have at least one valid certificate type supported by Network Firewall in ACM that’s accessible by your AWS account.
To create a TLS inspection configuration (console)
In the navigation pane, under Network Firewall, choose TLS inspection configurations.
Choose Create TLS inspection configuration.
Figure 3: TLS inspection configuration for AWS Network Firewall
On the Associate SSL/TLS certificates page, in the search box, select the ACM certificate to use in the TLS inspection configuration, and then choose Add certificate. You can use as many as 10 certificates for a single configuration.
Figure 4: SSL/TLS certificate as part of Network Firewall inspection configuration
Choose Next to go to the TLS inspection configuration’s Describe TLS inspection configuration page.
For Name, enter a name to identify this TLS inspection configuration, and optionally enter a description for the TLS inspection configuration.
Choose Next to go to the TLS inspection configuration’s Define scope page.
Figure 5: Description for Network Firewall inspection configuration
Note that you can’t change the name after you create the TLS inspection configuration.
In the Scope configuration pane, you can optionally define one or more 5-tuple scopes for the domains that you want Network Firewall to decrypt. Network Firewall uses the corresponding SSL/TLS certificates in your TLS inspection configuration to decrypt the SSL/TLS traffic that matches the scope criteria.
Figure 6: Define scope for Network Firewall to decrypt
For Protocol, choose the protocol to decrypt and inspect for. Network Firewall currently supports only TCP.
For Source, choose the source IP addresses and ranges to decrypt and inspect for. You can inspect for either Custom IP addresses or Any IPv4 address. (IPv6 is currently not supported.)
For Source port, choose the source ports and source port ranges to decrypt and inspect for. You can inspect for either Custom port ranges or Any port.
For Destination, choose the destination IP addresses and ranges to decrypt and inspect for. You can inspect for either Custom IP addresses or Any IPv4 address.
For Destination port, choose the destination ports and destination port ranges to decrypt and inspect for. You can inspect for either Custom port ranges or Any port.
After you’ve set the scope criteria, choose Add scope configuration, and then choose Next.
On the next page, Select encryption options, determine whether you want to use the AWS managed key or customize encryption settings (advanced). Here we use the default key that AWS owns and manages on your behalf, choose Next.
Figure 7: Select the encryption options
On the Add tags page, choose Next. Tags are optional but are recommended as a best practice. Tags help you organize and manage your AWS resources. For more information about tagging your resources, see Tagging AWS Network Firewall resources.
On the Review and confirm page, check the TLS inspection configuration settings. Choose Create TLS inspection configuration. Your TLS inspection configuration is now ready for use.
Figure 8: Validate the TLS inspection configuration
Update an existing network firewall with TLS inspection configuration
There are two methods that you can use modify an existing firewall configuration for TLS inspection, depending on your scenario.
Scenario 1: Add TLS inspection to an existing network firewall. In this scenario, you only need to consider the scope that TLS inspection applies to. After you have followed steps 1 through 12 outlined in the procedure in this post, and created the TLS inspection configuration, ingress (inbound) traffic will be decrypted and then sent to the stateful engine for inspection that uses your existing firewall policies.
Scenario 2: Modify an existing firewall with TLS inspection configured. In this scenario, where TLS configuration has already been added and you just need to modify the configuration, you can use the following steps. Note that you can’t change the name of a TLS inspection configuration after creation, but you can change other details.
AWS Network Firewall lets you inspect traffic at scale in a variety of use cases. In this blog post, we looked into the recently launched TLS inspection configuration for ingress inspection architectures and discussed considerations for enabling this feature. We showed how you can enable and update the TLS inspection feature on Network Firewall. To learn more about the TLS inspection feature, check out the AWS Network Firewall Developer Guide. We hope this post is helpful and look forward to hearing about how you use the latest feature.
If you have feedback about this post, submit comments in the Comments section below. If you have questions about this post, contact AWS Support.
Want more AWS Security news? Follow us on Twitter.
Effective security incident response depends on adequate logging, as described in the AWS Security Incident Response Guide. If you have the proper logs and the ability to query them, you can respond more rapidly and effectively to security events. If a security event occurs, you can use various log sources to validate what occurred and understand the scope. Then, you can use the results of your analysis to take remediation actions. To learn more about logging best practices, see Configure service and application logging and Analyze logs, findings, and metrics centrally.
In this blog post, we will show you how to achieve an effective strategy for logging for security incident response. We will share logging options across the typical cloud application stack, log analysis options, and sample queries. AWS offers managed services, such as Amazon GuardDuty for threat detection and Amazon Detective for incident analysis. If you want to collect additional logs or perform custom analysis, then you should consider the options described in this blog post.
Selection of logs
To select the appropriate logs for security incident response, you should start with the common cloud application stack, which consists of the components and layers of your application deployed on AWS. For each component, we will describe the logging sources that you have. For each log source, we will describe why you should log it for security incident response, how to enable the logs, and what your log storage options are.
To select the logs for security incident response, first consider the following questions:
What are your compliance and regulatory requirements for logging?
Note: Make sure that you comply with the log retention requirements of compliance standards relevant to your organization, as well as your organization’s incident response strategy.
What AWS services do you commonly use?
What AWS services have access to or contain sensitive data?
What threats are most relevant to you?
Note: Performing a threat model of your cloud architectures can help you answer this question. For more information, see How to approach threat modelling.
Considering these questions can help you develop requirements for logging that will guide your selection of the following log sources.
AWS account logs
An AWS account is the first, fundamental component of an application deployed on AWS. The account is a container for your AWS resources. You create and manage your AWS resources in this account, and the account provides administrative capabilities for access and billing.
AWS CloudTrail
Within an account, each action performed is an API call. From a console sign-in to the deployment of each resource in an AWS CloudFormation stack, events are generated to provide transparency on what has occurred in the account. With AWS CloudTrail, you can log, continuously monitor, and retain account activity related to actions across supported AWS services. CloudTrail provides the event history of your account activity, including actions taken through the AWS Management Console, AWS SDKs, command line tools, and other AWS services. CloudTrail logs API calls as three types of events:
Management events(also known as control plane operations) show management operations that are performed on resources in your account. This includes actions like creating an Amazon Simple Storage Service (Amazon S3) bucket and setting up logging.
Data events(also known as data plane operations) show the resource operations performed on or within resources in your account. These operations are often high-volume activities, such as Amazon S3 object-level API activity (for example, GetObject, DeleteObject, and PutObject API operations) and AWS Lambda function invocation activity.
Insights events capture unusual API call rate or error rate activity in your account. You must enable these events on a trail in order to capture them, and they are logged to a different folder prefix in the destination S3 bucket for your trail. Insights events provide you with information such as the type of event, the incident time period, the associated API, the error code, and statistics to help you understand and respond effectively to unusual activity.
For security investigations, CloudTrail provides context on the creation, modification, and deletion of AWS resources. Therefore, CloudTrail is one of your most important log sources for security incident response in an AWS environment. You have three primary ways to set up CloudTrail:
CloudTrail Event history — CloudTrail is enabled by default with 90-day retention of management events that you can retrieve through the CloudTrail Event history facility using the console, AWS Command line Interface (AWS CLI), or AWS SDK. You don’t need to take any action to get started using the Event history feature.
CloudTrail trail — For longer retention and visibility of data events, you need to create a CloudTrail trail and associate it with an S3 bucket and optionally with an Amazon CloudWatch log group. If you use AWS Organizations, you can create an organization trail that will log events for each account in the organization. By default, trails are multi-Region, so you don’t need to enable CloudTrail logs in each AWS Region.
AWS CloudTrail Lake — You can create a CloudTrail lake, which retains CloudTrail logs for up to seven years and provides a SQL-based querying facility. You don’t need to have a trail configured in your account to use CloudTrail Lake.
Amazon Security Lake — You can use Security Lake to ingest CloudTrail events, which include management and data events. You can further analyze these events with Amazon QuickSight or another other third-party security information and event management (SIEM) tool.
AWS Config
Creating and modifying resources is an integral part of your account use. Tracking resource configuration changes made by calling the AWS API helps you review changes throughout the resource lifecycle. AWS Config provides a detailed view of the configuration of AWS resources in your account, examines the resource configurations periodically, and tracks configuration changes that were not initiated by the API. This includes how the resources are related to one another and how they were configured in the past so that you can see how configurations and relationships change over time.
You should enable AWS Config in each Region where you have resources deployed, and you should configure an S3 bucket to receive configuration history and configuration snapshot files, which contain details on the resources that AWS Config records. You can then review configuration compliance and analyze activities performed before, during, and after an event using the configuration history in S3. You should centralize AWS Config resource tracking across multiple accounts in the same organization by setting up an aggregator. You can use AWS Control Tower to automate the setup.
During a security investigation, you might want to understand how a resource configuration has changed over time. For example, you might want to investigate the changes to an S3 bucket policy before and after a security event that involves an S3 bucket. AWS Config provides a configuration history for resources that can help you track activities performed during a security event.
Operating system and application logs
To record interactions with applications, you must capture operating system (OS) and application logs, especially custom logs generated by the application development framework. OS and local application logs are relevant for security events that involve an Amazon Elastic Compute Cloud (Amazon EC2) instance. These instances could be standalone, in an auto scaling group behind a load balancer, or compute workloads for Amazon Elastic Container Service (Amazon ECS) or an Amazon Elastic Kubernetes Service (Amazon EKS) cluster. OS logs track privileged use, processes, login events, access to directory services, and file system activity on a server. To analyze a potential compromise to an EC2 instance, you will want to review the security event logs for Windows OS and the system logs for Linux-based OS.
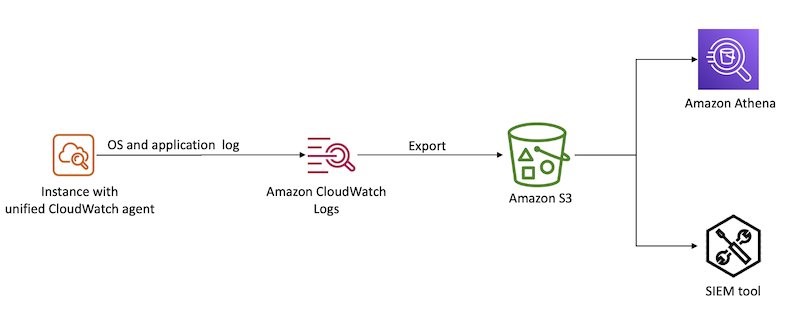
With the unified CloudWatch agent, you can collect metrics and logs from EC2 instances and on-premises servers. The CloudWatch agent aggregates log data into CloudWatch logs, which can then be exported to Amazon S3 for long-term retention and analyzed with a SIEM tool of your choice or Amazon Athena, as shown in Figure 1.
Figure 1: Aggregate OS and application logs using CloudWatch Logs
Database logs
With SQL databases, you can log transactions to help track modifications to the databases, such as additions or deletions. After an engine or system failure, you will need transaction logs to restore a database to a consistent state. Transaction logs are designed to be secure, and they require additional processing to access valuable information. It’s important that you understand data interactions during a security investigation, especially if your databases hold personally identifiable information (PII), financial and payments information, or other information subject to regulatory controls.
The goal of logging network activity is to gain insight into the communications that traverse your network. You might need this data for a variety of reasons, such as network troubleshooting or for use in a forensic investigation of suspected malware activity within your network.
In the AWS Cloud, you can log network activity by creating a proxy that logs network traffic or by using Traffic Mirroring to send a copy of network traffic to a logging server. You can adopt cloud-native approaches to capture this type of data using Amazon Route 53 DNS query logs and Amazon VPC Flow Logs.
There are also a variety of third-party networking solutions available like Palo Alto Networks and Fortinet, so you can continue to use the network logging mechanisms that you might have used in an on-premises environment.
Route 53 DNS query logs
You can configure Amazon Route 53 to log Domain Name System (DNS) queries. These logs are categorized into two groups:
Public DNS query logging
Resolver query logging
Logging public DNS queries against domains that you have hosted in Route 53 provides query information, such as the domain or subdomain requested, date and time stamp of the request, DNS record type, Route 53 edge location that responded, and response code.
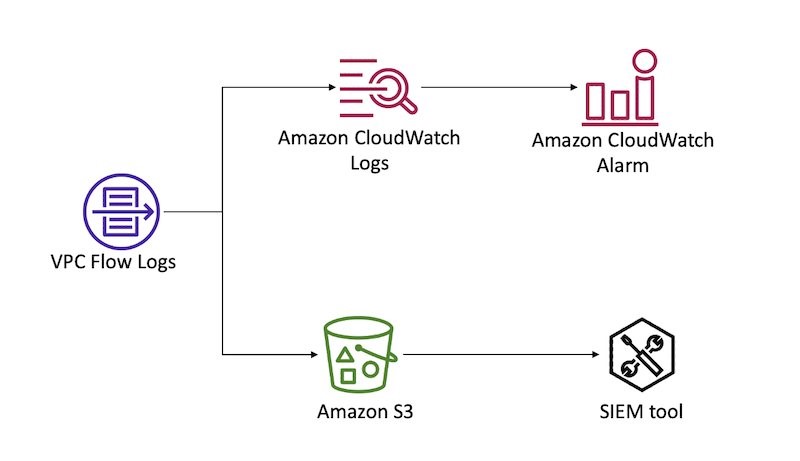
You can configure VPC Flow Logs for a VPC in your account to capture traffic that enters and moves around your VPC network, without the addition of instances or products. From these logs, you can review information, such as source and destination IP, ports, timestamps, protocol, account ID, and whether the traffic was accepted or rejected. For a complete list of the fields available for flow log records, see Available fields. You can create a flow log for a VPC, a subnet, or a network interface. If you create a flow log for a subnet or VPC, IP traffic going to and from each network interface in that subnet or VPC will be logged. For more details on VPC Flow Logs, see Logging IP traffic using VPC Flow Logs.
You can forward flow logs to Amazon CloudWatch Logs to create CloudWatch alarms based on metric filters. You can also forward flow logs to an S3 bucket for long-term retention and further analysis. Figure 2 demonstrates these configurations.
Figure 2: Sending VPC Flow logs to CloudWatch Logs and S3
Access logs
To identify access patterns for accessible endpoints, especially public endpoints, you should use access logs. Access logs capture detailed information about requests sent to your load balancer. Each log contains information such as the time the request was received, the client’s IP address, latencies, request paths, and server responses. With services built in layers behind a load balancer, unless you track the X-Forwarded-For request header, the requestor’s context is lost. Access logs help bridge that gap during investigations and analysis.
Amazon S3 server access logs
Access logs are critical to track object level access when using S3 buckets to store confidential or sensitive data. You can also turn on CloudTrail to capture S3 data events. You can store access logs in S3 buckets for long-term storage for compliance purposes and to run analyses during and after an event.
Load balancing logs
Elastic Load Balancing provides access logs that capture detailed information about requests sent to load balancers. Each log contains information such as the time the request was received, the client’s IP address, latencies, request paths, and server responses. You can use this log to analyze traffic patterns and to troubleshoot issues.
Access logs is an optional feature of Elastic Load Balancing that is turned off by default. To enable access logs for load balancers, see Access logs for your Application Load Balancer.
If you implement your own reverse proxy for load balancing needs, make sure that you capture the reverse proxy access logs. You can use the unified CloudWatch agent to forward the logs to CloudWatch. As with OS logs, you can export CloudWatch logs to an S3 bucket for long-term retention and analysis.
If you use an Amazon CloudFront distribution as the public endpoint for end users with load balancers as the custom origin, then load balancing access logs will represent the CloudFront distribution as the requestor, rather than the actual end user. If this information doesn’t add value to your incident handling process, then you can use CloudFront access logs as the log source that provides end user request details.
CloudFront access logs
You should enable standard logs, also known as access logs, when using CloudFront. Specify an S3 bucket where you want CloudFront to save the files.
CloudFront access logs are delivered on a best-effort basis. For information about requests made to a distribution in real time, use real-time logs that are delivered within seconds of receiving the requests. You should use real-time logs to monitor, analyze, and take action based on content delivery performance. For more details on the fields available from these logs, see the CloudFront standard log file format.
AWS WAF logs
When associated with a supported resource like a CloudFront distribution, Amazon API Gateway REST API, Application Load Balancer, AWS AppSync GraphQL API, Amazon Cognito user pool, or AWS App Runner, AWS WAF can help you monitor HTTP and HTTPS requests that are forwarded to the resource. You should configure web access control lists (ACLs) to gain fine-grained control over the requests, and enable logging for such ACLs to get detailed information about traffic that is analyzed by AWS WAF. Log information includes time of the request being received by AWS WAF from the AWS resource, details about the request, and the AWS WAF rules that the request matched. You can use this log information to monitor access patterns of public endpoints and configure rules to inspect requests in detail. For more information about AWS WAF logging, see Logging web ACL traffic.
Serverless logs
Serverless computing has become increasingly popular in the cloud-computing space. It provides on-demand compute power in a relatively short burst, meaning that cloud-based instances don’t need to be provisioned and kept around, idle, when there are no tasks to be completed. Although more and more compute tasks are being moved to serverless solutions, the need to log has not changed, but how the logs are generated has. In a serverless environment, security investigations not only benefit from logs that demonstrate the interactions and changes made by the code deployed, but that also document changes to the deployed code itself and access permissions of the Lambda execution role that is granting privileged access.
AWS Lambda
The logging of Lambda functions involves two components: how the function itself is operating, and what is happening inside the function (what your code is actually doing).
The logging of a Lambda function itself occurs through data events captured by CloudTrail. As noted earlier in this post, you must configure data events on a trail created in CloudTrail. During configuration, you will need to specify the function from which logs will be captured by your trail, and the destination S3 bucket where they will be stored. These logs contain details on the invocation of the function and help identify the IAM principals that called the Invoke API for Lambda.
AWS Lambda automatically monitors Lambda functions on your behalf and sends logs to CloudWatch. Your Lambda function comes with a CloudWatch Logs log group and a log stream for each instance of your function. The Lambda runtime environment sends details about each invocation to the log stream, and relays logs and other output from your function’s code. For more details on how to monitor Lambda functions, see Accessing Amazon CloudWatch logs for AWS Lambda.
Log analysis
For incident response, you need to be able to analyze and query your logs to validate what occurred and to understand the scope.
To begin, you can aggregate logs from various sources in S3 buckets for long-term storage, and you can integrate that data with query tools for further investigation. Logs can be exported and either parsed through directly, or ingested by another tool to help with the analysis. The following are some options that you can use to query these logs:
Amazon Athena — You can directly query CloudTrail events stored in S3 with Athena using SQL commands, specifying the LOCATION of the log files. You would generally use this approach if you have advanced queries to run, and you don’t have a SIEM. To set up Athena to query logs, you can use this open-source solution from AWS.
Amazon OpenSearch Service — OpenSearch is a distributed search and log analytics suite. Because it’s open source, it can ingest logs from more than just AWS log sources. To set this up, you can use this open-source SIEM solution from AWS.
CloudTrail Event History — Either from the console, or programmatically, you can query CloudTrail management events from the last 90-day period. This is ideal for when you have simple queries to make within the last 90 days, and you don’t need stored logs or more complex queries.
AWS CloudTrail Lake — Either from the console, or programmatically, you can query stored events in your configured CloudTrail Lake from the time of its configuration, up until the maximum storage duration of 2,557 days (7 years) from the time that you make your query. This approach allows for SQL-based queries, and it is ideal for when you need to make more complex queries against events, but don’t require the additional features of a SIEM solution.
Parse through raw JSON using CLI — This is achieved programmatically and parsed through terminal commands. It’s more a legacy method of parsing through logs. You might choose to use this approach for analysis if another service or solution isn’t feasible (for example, if you can’t use the service due to your corporate security policy).
Third-party SIEM — A third-party SIEM might be ideal if you already have a SIEM solution on AWS or elsewhere, and you don’t need a duplicated solution elsewhere. Typically, SIEM solutions will import logs from an S3 bucket and process and index events for analysis. To learn more about SIEM options, see the SIEM solutions in the AWS Marketplace, or the AWS Security Competency Partners for a partner local to you with threat detection and incident response (TDIR) expertise.
Sample queries
In this section, we provide samples of SQL queries. Both Athena and CloudTrail Lake accept SQL queries, but the following samples have been tested for use in Athena only. This is because some samples are for VPC Flow Logs, which you can’t query from CloudTrail Lake. To query CloudTrail logs in Athena, you must first create a table definition that points to the location of your logs stored in S3. You can do this from the CloudTrail Events console by using a hyperlinked suggestion, or from the Athena console directly. Alternatively, for Athena, you can use the AWS Security Analytics Bootstrap.
For each of these queries, you might need to modify some of the fields, such as the time frame that you are investigating, the IAM entity involved, and the account and Region in scope. For example, you might want to modify the time frame based on the current time and when you believe the security event began. This often involves expanding the time frame after running additional queries and learning more about the scope and timeline.
By using partitions for tables, you can restrict the amount of data scanned by each Athena query, helping to improve performance and reduce cost. For example, you can partition your CloudTrail Athena table manually or by using partition projection. You can include the partition column (for example, the timestamp) in your queries to limit the amount of data scanned.
Unauthorized attempts
When a security event occurs, you might want to review API calls that were attempted but failed due to the IAM principal not having access to perform the action on that resource. To discover this activity, run the following query (be sure to modify the time window first):
SELECT *
FROM cloudtrail
WHERE errorcode IN ('Client.UnauthorizedOperation','Client.InvalidPermission.NotFound','Client.OperationNotPermitted','AccessDenied')
AND useridentity.arn LIKE '%iam%'
AND eventtime >= '2023-01-01T00:00:00Z'
AND eventtime < '2023-03-01T00:00:00Z'
ORDER BY eventtime desc
This sample query can help you identify whether certain IAM principals have a significant amount of unauthorized API calls, which can indicate that an IAM principal is compromised.
Rejected TCP connections
During a security event, the unauthorized user that is interacting with the resources in your account is probably trying to establish persistence through the network layer. To get a list of rejected TCP connections and extract from it the day that these events occurred, run the following query:
SELECT day_of_week(date) AS
day,date,interface_id,srcaddr,action,protocol
FROM vpc_flow_logs
WHERE action = 'REJECT' AND protocol = 6
LIMIT 100;
Connections over older TLS versions
You might want to see how many calls to AWS APIs were made using older versions of the TLS protocol, as part of a forensic follow-up or a discovery job after a risk analysis. You can get this data by querying CloudTrail logs.
SELECT eventSource
COUNT(*) AS numOutdatedTlsCalls FROM cloudtrail WHERE tlsDetails.tlsVersion IN ('TLSv1', 'TLSv1.1') AND eventTime > '2023-01-01 00:00:00' GROUP BY eventSource ORDER BY numOutdatedTlsCalls DESC
Filter connections from an IP
With an IP address that you’d like to investigate, as a part of your forensic analysis, you might want to see the connections made to resources in a VPC. You can obtain this information by querying VPC Flow Logs. As with the server access logs, if you’re using Athena, you will first need to create a new table.
SELECT day_of_week(date) AS
day, date, srcaddr, dstaddr, action, protocol
FROM vpc_flow_logs
WHERE day >= '2023/01/01' AND day < '2023/03/01' AND srcaddr LIKE '172.50.%'
ORDER BY day DESC
LIMIT 100
Investigate user actions
If you have identified a user who has been compromised, or that you suspect has been compromised, you might want to know the API calls that they made over a specific time period. Understanding the activity of a user can help you understand the scope of impact during an incident, as well as the reach of user permissions when you design your access management strategy.
SELECT eventID, eventName, eventSource, eventTime, userIdentity.arn
AS user
FROM cloudtrail
WHERE userIdentity.arn = '%<username>%' AND eventTime > '2022-12-05 00:00:00' AND eventTime < '2022-12-08 00:00:00'
Conclusion
It is essential that you capture logs from various layers within your application architecture, so that you can effectively respond to a security event at various layers of the application stack. If a security event occurs, logs can help provide a clear picture of what happened and the scope of the affected resources. This post helps you build a logging strategy for security incident response by understanding what logs you want to analyze, where you want to store those logs, and how you will analyze them.
I’d like to personally invite you to attend the Amazon Web Services (AWS) security conference, AWS re:Inforce 2023, in Anaheim, CA on June 13–14, 2023. You’ll have access to interactive educational content to address your security, compliance, privacy, and identity management needs. Join security experts, peers, leaders, and partners from around the world who are committed to the highest security standards, and learn how your business can stay ahead in the rapidly evolving security landscape.
As Chief Information Security Officer of AWS, my primary job is to help you navigate your security journey while keeping the AWS environment secure. AWS re:Inforce offers an opportunity for you to dive deep into how to use security to drive adaptability and speed for your business. With headlines currently focused on the macroeconomy and broader technology topics such as the intersection between AI and security, this is your chance to learn the tactical and strategic lessons that will help you develop a security culture that facilitates business innovation.
Here are a few reasons I’m especially looking forward to this year’s program:
Sharing my keynote, including the latest innovations in cloud security and what AWS Security is focused on
AWS re:Inforce 2023 will kick off with my keynote on Tuesday, June 13, 2023 at 9 AM PST. I’ll be joined by Steve Schmidt, Chief Security Officer (CSO) of Amazon, and other industry-leading guest speakers. You’ll hear all about the latest innovations in cloud security from AWS and learn how you can improve the security posture of your business, from the silicon to the top of the stack. Take a look at my most recent re:Invent presentation, What we can learn from customers: Accelerating innovation at AWS Security and the latest re:Inforce keynote for examples of the type of content to expect.
Engaging sessions with real-world examples of how security is embedded into the way businesses operate
AWS re:Inforce offers an opportunity to learn how to prioritize and optimize your security investments, be more efficient, and respond faster to an evolving landscape. Using the Security pillar of the AWS Well-Architected Framework, these sessions will demonstrate how you can build practical and prescriptive measures to protect your data, systems, and assets.
Sessions are offered at all levels and all backgrounds. Depending on your interests and educational needs, AWS re:Inforce is designed to meet you where you are on your cloud security journey. There are learning opportunities in several hundred sessions across six tracks: Data Protection; Governance, Risk & Compliance; Identity & Access Management; Network & Infrastructure Security, Threat Detection & Incident Response; and, this year, Application Security—a brand-new track. In this new track, discover how AWS experts, customers, and partners move fast while maintaining the security of the software they are building. You’ll hear from AWS leaders and get hands-on experience with the tools that can help you ship quickly and securely.
Shifting security into the “department of yes”
Rather than being seen as the proverbial “department of no,” IT teams have the opportunity to make security a business differentiator, especially when they have the confidence and tools to do so. AWS re:Inforce provides unique opportunities to connect with and learn from AWS experts, customers, and partners who share insider insights that can be applied immediately in your everyday work. The conference sessions, led by AWS leaders who share best practices and trends, will include interactive workshops, chalk talks, builders’ sessions, labs, and gamified learning. This means you’ll be able to work with experts and put best practices to use right away.
Our Expo offers opportunities to connect face-to-face with AWS security solution builders who are the tip of the spear for security. You can ask questions and build solutions together. AWS Partners that participate in the Expo have achieved security competencies and are there to help you find ways to innovate and scale your business.
A full conference pass is $1,099. Register today with the code ALUMwrhtqhv to receive a limited time $300 discount, while supplies last.
I’m excited to see everyone at re:Inforce this year. Please join us for this unique event that showcases our commitment to giving you direct access to the latest security research and trends. Our teams at AWS will continue to release additional details about the event on our website, and you can get real-time updates by following @awscloud and @AWSSecurityInfo.
I look forward to seeing you in Anaheim and providing insight into how we prioritize security at AWS to help you navigate your cloud security investments.
If you have feedback about this post, submit comments in the Comments section below. If you have questions about this post, contact AWS Support.
Want more AWS Security news? Follow us on Twitter.
Cloudflare has achieved a new EU Cloud Code of Conduct privacy validation, demonstrating GDPR compliance to strengthen trust in cloud services
Internet privacy laws around the globe differ, and in recent years there’s been much written about cross-border data transfers. Many regulations require adequate protections to be in place before personal information flows around the world, as with the European General Data Protection Regulation (GDPR). The law rightly sets a high bar for how organizations must carefully handle personal information, and in drafting the regulation lawmakers anticipated personal data crossing-borders: Chapter V of the regulation covers those transfers specifically.
Whilst transparency on where personal information is stored is important, it’s also critically important how personal information is handled, and how it is kept safe and secure. At Cloudflare, we believe in protecting the privacy of personal information across the world, and we give our customers the tools and the choice on how and where to process their data. Put simply, we require that data is handled and protected in the same, secure, and careful way, whether our customers choose to transfer data across the world, or for it to remain in one country.
And today we are proud to announce that we have successfully completed our assessment journey and received the EU Cloud Code of Conduct compliance mark as a demonstration of our compliance with the GDPR, protecting personal data in the cloud, all across the world.
It matters how personal information is handled – not just where in the world it is saved
The same GDPR lawmakers also anticipated that organizations would want to handle and protect personal information in a consistent, transparent, and safe way too. Article 40, called ‘Codes of Conduct’ starts:
“The Member States, the supervisory authorities, the Board and the Commission shall encourage the drawing up of codes of conduct intended to contribute to the proper application of this Regulation, taking account of the specific features of the various processing sectors and the specific needs of micro, small and medium-sized enterprises.”
Using codes of conduct to demonstrate compliance with privacy law has a longer history, too. Like the GDPR, the pioneering 1995 EU Data Protection Directive, officially Directive 95/46/EC, also included provision for draft community codes to be submitted to national authorities, and for those codes to be formally approved by an official body of the European Union.
An official GDPR Code of Conduct
It took a full five years after the GDPR was adopted in 2016 for the first code of conduct to be officially approved. Finally in May 2021, the European Data Protection Board, a group composed of representatives of all the national data protection authorities across the union, approved the “EU Data Protection Code of Conduct for Cloud Service Providers” – the EU Cloud Code of Conduct (or ‘EU Cloud CoC’ for short) as the first official GDPR code of conduct. The EU Cloud CoC was brought to the board by the Belgian supervisory authority on behalf of SCOPE Europe, the organization who collaborated to develop the code over a number of years, including with input from the European Commission, members of the cloud computing community, and European data protection authorities.
The code is a framework for buyers and providers of cloud services. Buyers can understand in a straightforward way how a provider of cloud services will handle personal information. Providers of cloud services undergo an independent assessment to demonstrate to the buyers of their cloud services that they will handle personal information in a safe and codified way. In the case of the EU Cloud CoC and only because the code has received formal approval, buyers of cloud services compliant with code will know that the cloud provider handled customer personal information in a way that is compliant with the GDPR.
What the code covers
The code defines clear requirements for providers of cloud services to implement Article 28 of the GDPR (“Processor”) and related articles. The framework covers data protection policies, as well as technical and organizational security measures. There are sections covering providers’ terms and conditions, confidentiality and recordkeeping, the audit rights of the customer, how to handle potential data breaches, and how the provider approaches subprocessing – when a third-party is subcontracted to process personal data alongside the main data processor – and more.
The framework also covers how personal data may be legitimately transferred internationally, although whilst the EU Cloud CoC covers ensuring this is done in a legally-compliant way, the code itself is not a ‘safeguard’ or a tool for third country transfers. A future update to the code may expand into that with an additional module, but as of March 2023 that is still under development.
Let us do a deeper dive into some of the requirements of the EU Cloud CoC and how it can demonstrate compliance with the GDPR
Example one One requirement in the code is to have documented procedures in place to assist customers with their ‘data protection impact assessments’. According to the GDPR, these are:
“…an assessment of the impact of the envisaged processing operations on the protection of personal data.” – Article 35.1, GDPR
So a cloud service provider should have a written process in place to support customers as they undertake their own assessments. In supporting the customer, the service provider is demonstrating their commitment to the rigorous data protection standards of the GDPR too. Cloudflare meets this requirement, and further supports transparency by publishing details of sub-processors used in the processing of personal data, and directing customers to audit reports available in the Cloudflare dashboard.
There’s also another reference in the GDPR to codes of conduct in the context of data protection impact assessments too:
“Compliance with approved codes of conduct… shall be taken into due account in assessing the impact of the processing operations performed… in particular for the purposes of a data protection impact assessment.” – Article 35.8, GDPR
So when preparing an impact assessment, a cloud customer shall take into account that a service provider complies with an approved code of conduct. Another way that both customers and cloud providers benefit from using codes of conduct!
Example two Another example of a requirement of the code is that when cloud service providers provide encryption capabilities, they shall be implemented effectively. The requirement clarifies further that this should be undertaken by following strong and trusted encryption techniques, by taking into account the state-of-the-art, and by adequately preventing abusive access to customer personal data. Encryption is critical to protecting personal data in the cloud; without encryption, or with weakened or outdated encryption, privacy and security are not possible. So in using and reviewing encryption appropriately, cloud services providers help meet the requirements of the GDPR in protecting their customers’ personal data.
At Cloudflare, we are particularly proud of our trackrecord: we makeeffectiveencryptionavailable, for free, to all our customers. We help our customers understandencryption, and most importantly, we use strong and trusted encryption algorithms and techniques ourselves to protect customer personal data. We have a formal Research Team, including academic researchers and cryptographers who design and deploystate-of-the-art encryption protocols designed to provide effective protection against active and passive attacks, including with resources known to be available to public authorities; and we use trustworthy public-key certification authorities and infrastructure. Most recently this month, we announced that post-quantum crypto should be free, and so we are including it for free, forever.
More information The code contains requirements described in 87 statements, called controls. You can find more about the EU Cloud CoC, download a full copy of the code, and keep up to date with news at https://eucoc.cloud/en/home
Why this matters to Cloudflare customers
Cloudflare joined the EU Cloud Code of Conduct’s General Assembly last May. Members of the General Assembly undertake an assessment journey which includes declaring named cloud services compliant with the EU Cloud Code, and after completing an independent assessment process by SCOPE Europe, the accredited monitoring body, receive the EU Cloud Code of Conduct compliance mark.
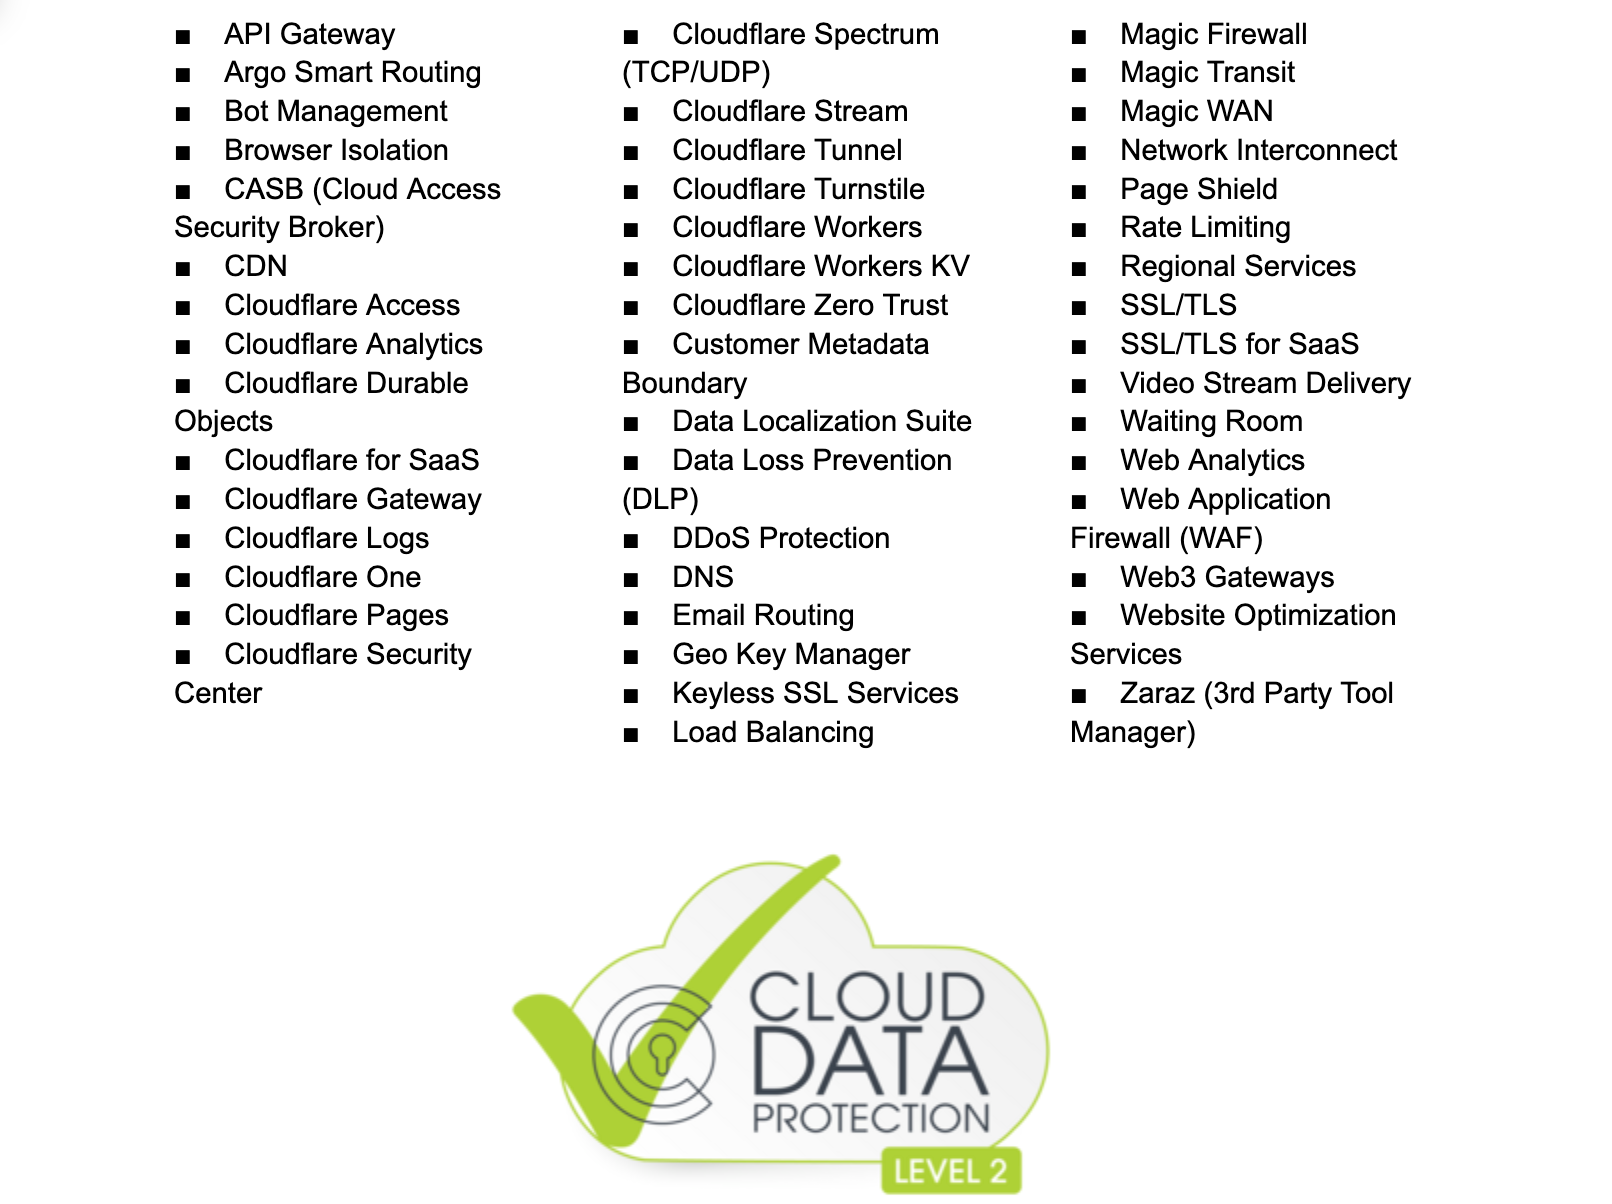
Cloudflare has completed the assessment process and been verified for 47 cloud services.
Cloudflare services that are in scope for EU Cloud Code of Conduct:
EU Cloud CoC Verification-ID: 2023LVL02SCOPE4316.
Services are verified compliant with the EU Cloud Code of Conduct, Verification-ID: 2023LVL02SCOPE4316. For further information please visit https://eucoc.cloud/en/public-register
And we’re not done yet…
The EU Cloud Code of Conduct is the newest privacy validation to add to our growing list of privacy certifications. Two years ago, Cloudflare was one of the first organisations in our industry to have received the new ISO privacy certification, ISO/IEC 27701:2019, and the first Internet performance & security company to be certified to it. Last year, Cloudflare certified to a second international privacy standard related to the processing of personal data, ISO/IEC 27018:2019. Most recently, in January this year Cloudflare completed our annual ISO audit with third-party auditor Schellman; and our new certificate, covering ISO 27001:2013, ISO 27018:2019, and ISO 27701:2019 is now available for customers to download from the Cloudflare dashboard.
And there’s more to come! As we blogged about in January for Data Privacy Day, we’re following the progress of the emerging Global Cross Border Privacy Rules (CBPR) certification with interest. This proposed single global certification could suffice for participating companies to safely transfer personal data between participating countries worldwide, and having already been supported by several governments from North America and Asia, looks very promising in this regard.
Cloudflare certifications
Find out how existing customers may download a copy of Cloudflare’s certifications and reports from the Cloudflare dashboard; new customers may also request these from your sales representative.
For the latest information about our certifications and reports, please visit our Trust Hub.
DevSecOps is the practice of integrating security testing at every stage of the software development process. Amazon CodeCatalyst includes tools that encourage collaboration between developers, security specialists, and operations teams to build software that is both efficient and secure. DevSecOps brings cultural transformation that makes security a shared responsibility for everyone who is building the software.
Introduction
In a prior post in this series, Maintaining Code Quality with Amazon CodeCatalyst Reports, I discussed how developers can quickly configure test cases, run unit tests, set up code coverage, and generate reports using CodeCatalyst’s workflow actions. This was done through the lens of Maxine, the main character of Gene Kim’s The Unicorn Project. In the story, Maxine meets Purna – the QA and Release Manager and Shannon – a Security Engineer. Everyone has the same common goal to integrate security into every stage of the Software Development Lifecycle (SDLC) to ensure secure code deployments. The issue Maxine faces is that security testing is not automated and the separation of responsibilities by role leads to project stagnation.
In this post, I will focus on how DevSecOps teams can use Amazon CodeCatalyst to easily integrate and automate security using CodeCatalyst workflows. I’ll start by checking for vulnerabilities using OWASP dependency checker and Mend SCA. Then, I’ll conduct Static Analysis (SA) of source code using Pylint. I will also outline how DevSecOps teams can influence the outcome of a build by defining success criteria for Software Composition Analysis (SCA) and Static Analysis actions in the workflow. Last, I’ll show you how to gain insights from CodeCatalyst reports and surface potential issues to development teams through CodeCatalyst Issues for faster remediation.
Prerequisites
If you would like to follow along with this walkthrough, you will need to:
Have an AWS account associated with your space and have the IAM role in that account. For more information about the role and role policy, see Creating a CodeCatalyst service role.
Have a Mend Account (required for the optional Mend Section)
Walkthrough
To follow along, you can re-use a project you created previously, or you can refer to a previous post that walks through creating a project using the Modern Three-tier Web Application blueprint. Blueprints provide sample code and CI/CD workflows to help you get started easily across different combinations of programming languages and architectures. The back-end code for this project is written in Python and the front-end code is written in JavaScript.
Figure 1. Modern Three-tier Web Application architecture including a presentation, application and data layer
Once the project is deployed, CodeCatalyst opens the project overview. Select CI/CD → Workflows → ApplicationDeploymentPipeline to view the current workflow.
Figure 2. ApplicationDeploymentPipeline
Modern applications use a wide array of open-source dependencies to speed up feature development, but sometimes these dependencies have unknown exploits within them. As a DevSecOps engineer, I can easily edit this workflow to scan for those vulnerable dependencies to ensure I’m delivering secure code.
Software Composition Analysis (SCA)
Software composition analysis (SCA) is a practice in the fields of Information technology and software engineering for analyzing custom-built software applications to detect embedded open-source software and analyzes whether they are up-to-date, contain security flaws, or have licensing requirements. For this walkthrough, I’ll highlight two SCA methods:
I’ll use CodeCatalyst’s Mend SCA Action to integrate Mend for SCA into my CI/CD workflow.
Note that developers can replace either of these with a tool of their choice so long as that tool outputs an SCA report format supported by CodeCatalyst.
Software Composition Analysis using OWASP Dependency Checker
To get started, I select Edit at the top-right of the workflows tab. By default, CodeCatalyst opens the YAML tab. I change to the Visual tab to visually edit the workflow and add a CodeCatalyst Action by selecting “+Actions” (1) and then “+” (2). Next select the Configuration (3) tab and edit the Action Name (4). Make sure to select the check mark after you’re done.
Figure 3. New Action Initial Configuration
Scroll down in the Configuration tab to Shell commands. Here, copy and paste the following command snippets that runs when action is invoked.
#Set Source Repo Directory to variable
- Run: sourceRepositoryDirectory=$(pwd)
#Install Node Dependencies
- Run: cd web && npm install
#Install known vulnerable dependency (This is for Demonstrative Purposes Only)
- Run: npm install [email protected]
#Go to parent directory and download OWASP dependency-check CLI tool
- Run: cd .. && wget https://github.com/jeremylong/DependencyCheck/releases/download/v8.1.2/dependency-check-8.1.2-release.zip
#Unzip file - Run: unzip dependency-check-8.1.2-release.zip
#Navigate to dependency-check script location
- Run: cd dependency-check/bin
#Execute dependency-check shell script. Outputs in SARIF format
- Run: ./dependency-check.sh --scan $sourceRepositoryDirectory/web -o $sourceRepositoryDirectory/web/vulnerabilities -f SARIF --disableYarnAudit
These commands will install the node dependencies, download the OWASP dependency-check tool, and run it to generate findings in a SARIF file. Note the third command, which installs a module with known vulnerabilities (This is for demonstrative purposes only).
On the Outputs (1) tab, I change the Report prefix (2) to owasp-frontend. Then I set the Success criteria (3) for Vulnerabilities to 0 – Critical (4). This configuration will stop the workflow if any critical vulnerabilities are found.
Figure 4: owasp-dependecy-check-frontend
It is a best practice to scan for vulnerable dependencies before deploying resources so I’ll set my owasp-dependency-check-frontend action as the first step in the workflow. Otherwise, I might accidentally deploy vulnerable code. To do this, I select the Build (1)action group and set the Depends on (2) dropdown to my owasp-dependency-check-frontend action. Now, my action will run before any resources are built and deployed to my AWS environment. To save my changes and run the workflow, I select Commit (3) and provide a commit message.
Figure 5: Setting OWASP as the First Workflow Action
Amazon CodeCatalyst shows me the state of the workflow run in real-time. After the workflow completes, I see that the action has entered a failed state. If I were a QA Manager like Purna from the Unicorn Project, I would want to see why the action failed. On the lefthand navigation bar, I select the Reports → owasp-frontend-web/vulnerabilities/dependency-check-report.sarif for more details.
Figure 6: SCA Report Overview
This report view provides metadata such as the workflow name, run ID, action name, repository, and the commit ID. I can also see the report status, a bar graph of vulnerabilities grouped by severity, the number of libraries scanned, and a Findings panel. I had set the success criteria for this report to 0 – Critical so it failed because 1 Critical vulnerability was found. If I select a specific finding ID, I can learn more about that specific finding and even view it on the National Vulnerability Database website.
Figure 7: Critical Vulnerability CVE Finding
Now I can raise this issue with the development team through the Issues board on the left-hand navigation panel. See this previous post to learn more about how teams can collaborate in CodeCatalyst.
Note: Let’s remove [email protected] install from owasp-dependency-check-frontend action’s list of commands to allow the workflow to proceed and finish successfully.
Software Composition Analysis using Mend
Mend, formerly known as WhiteSource, is an application security company built to secure today’s digital world. Mend secures all aspects of software, providing automated remediation, prevention, and protection from problem to solution versus only detection and suggested fixes. Find more information about Mend here.
Mend Software Composition Analysis (SCA) can be run as an action within Amazon CodeCatalyst CI/CD workflows, making it easy for developers to perform open-source software vulnerability detection when building and deploying their software projects. This makes it easier for development teams to quickly build and deliver secure applications on AWS.
Getting started with CodeCatalyst and Mend is very easy. After logging in to my Mend Account, I need to create a new Mend Product named Amazon-CodeCatalyst and a Project named mythical-misfits.
Next, I navigate back to my existing workflow in CodeCatalyst and add a new action. However, this time I’ll select the Mend SCA action.
Figure 8: Mend Action
All I need to do now is go to the Configuration tab and set the following values:
Mend Project Name: mythical-misfits
Mend Product Name: Amazon-CodeCatalyst
Mend License Key: You can get the License Key from your Mend account in the CI/CD Integration section. You can get more information from here.
Figure 9: Mend Action Configuration
Then I commit the changes and return to Mend.
Figure 10: Mend Console
After successful execution, Mend will automatically update and show a report similar to the screenshot above. It contains useful information about this project like vulnerabilities, licenses, policy violations, etc. To learn more about the various capabilities of Mend SCA, see the documentation here.
Static Analysis (SA)
Static analysis, also called static code analysis, is a method of debugging that is done by examining the code without executing the program. The process provides an understanding of the code structure and can help ensure that the code adheres to industry standards. Static analysis is used in software engineering by software development and quality assurance teams.
Currently, my workflow does not do static analysis. As a DevSecOps engineer, I can add this as a step to the workflow. For this walkthrough, I’ll create an action that uses Pylint to scan my Python source code for Static Analysis. Note that you can also use other static analysis tools or a GitHub Action like SuperLinter, as covered in this previous post.
Static Analysis using Pylint
After navigating back to CI/CD → Workflows → ApplicationDeploymentPipeline and selecting Edit, I create a new test action. I change the action name to pylint and set the Configuration tab to run the following shell commands:
On the Outputs tab, I change the Report prefix to pylint. Then I set the Success criteria for Static analysis as shown in the figure below:
Figure 11: Static Analysis Report Configuration
Being that Static Analysis is typically run before any execution, the pylint or OWASP action should be the very first action in the workflow. For the sake of this blog we will use pylint. I select the OWASP or Mend actions I created before, set the Depends on dropdown to my pylint action, and commit the changes. Once the workflow finishes, I can go to Reports > pylint-pylint-report.json for more details.
Figure 12: Pylint Static Analysis Report
The Report status is Failed because more than 1 high-severity or above bug was detected. On the Results tab I can view each finding in greater detail, including the severity, type of finding, message from the linter, and which specific line the error originates from.
Cleanup
If you have been following along with this workflow, you should delete the resources you deployed so you do not continue to incur charges. First, delete the two stacks that AWS Cloud Development Kit (CDK) deployed using the AWS CloudFormation console in the AWS account you associated when you launched the blueprint. These stacks will have names like mysfitsXXXXXWebStack and mysfitsXXXXXAppStack. Second, delete the project from CodeCatalyst by navigating to Project settings and choosing Delete project.
Conclusion
In this post, I demonstrated how DevSecOps teams can easily integrate security into Amazon CodeCatalyst workflows to automate security testing by checking for vulnerabilities using OWASP dependency checker or Mend through Software Composition Analysis (SCA) of dependencies. I also outlined how DevSecOps teams can configure Static Analysis (SA) reports and use success criteria to influence the outcome of a workflow action.
Many organizations have adopted DevOps practices to streamline and automate software delivery and IT operations. A DevOps model can be adopted without sacrificing security by using automated compliance policies, fine-grained controls, and configuration management techniques. However, one of the key challenges customers face is analyzing code and detecting any vulnerabilities in the code pipeline due to a lack of access to the right tool. Amazon CodeGuru addresses this challenge by using machine learning and automated reasoning to identify critical issues and hard-to-find bugs during application development and deployment, thus improving code quality.
Amazon CodeGuru Reviewer helps you improve code security and provides recommendations based on common vulnerabilities (OWASP Top 10) and AWS security best practices. CodeGuru analyzes Java and Python code and provides recommendations for remediation. CodeGuru Reviewer detects a deviation from best practices when using AWS APIs and SDKs, and also identifies concurrency issues, resource leaks, security vulnerabilities and validates input parameters. For every workflow run, CodeGuru Reviewer’s GitHub Action copies your code and build artifacts into an S3 bucket and calls CodeGuru Reviewer APIs to analyze the artifacts and provide recommendations. Refer to the code detector library here for more information about CodeGuru Reviewer’s security and code quality detectors.
With GitHub Actions, developers can easily integrate CodeGuru Reviewer into their CI workflows, conducting code quality and security analysis. They can view CodeGuru Reviewer recommendations directly within the GitHub user interface to quickly identify and fix code issues and security vulnerabilities. Any pull request or push to the master branch will trigger a scan of the changed lines of code, and scheduled pipeline runs will trigger a full scan of the entire repository, ensuring comprehensive analysis and continuous improvement.
Solution overview
The solution comprises of the following components:
GitHub Actions – Workflow Orchestration tool that will host the Pipeline.
AWS CodeDeploy – AWS service to manage deployment on Amazon EC2 Autoscaling Group.
AWS Auto Scaling – AWS service to help maintain application availability and elasticity by automatically adding or removing Amazon EC2 instances.
Amazon EC2 – Destination Compute server for the application deployment.
Amazon CodeGuru – AWS Service to detect security vulnerabilities and automate code reviews.
AWS CloudFormation – AWS infrastructure as code (IaC) service used to orchestrate the infrastructure creation on AWS.
The following diagram illustrates the architecture:
Figure 1. Architecture Diagram of the proposed solution in the blog
Developer commits code changes from their local repository to the GitHub repository. In this post, the GitHub action is triggered manually, but this can be automated.
GitHub action triggers the build stage.
GitHub’s Open ID Connector (OIDC) uses the tokens to authenticate to AWS and access resources.
GitHub action uploads the deployment artifacts to Amazon S3.
GitHub action invokes Amazon CodeGuru.
The source code gets uploaded into an S3 bucket when the CodeGuru scan starts.
GitHub action invokes CodeDeploy.
CodeDeploy triggers the deployment to Amazon EC2 instances in an Autoscaling group.
CodeDeploy downloads the artifacts from Amazon S3 and deploys to Amazon EC2 instances.
After completing the steps, you should have a local repository with the below directory structure, and one completed Actions run.
Figure 2. Directory structure
To enable automated deployment upon git push, you will need to make a change to your .github/workflow/deploy.yml file. Specifically, you can activate the automation by modifying the following line of code in the deploy.yml file:
From:
workflow_dispatch: {}
To:
  #workflow_dispatch: {}
  push:
    branches: [ main ]
  pull_request:
Solution walkthrough
The following steps provide a high-level overview of the walkthrough:
Create an S3 bucket for the Amazon CodeGuru Reviewer.
Update the IAM role to include permissions for Amazon CodeGuru.
Associate the repository in Amazon CodeGuru.
Add Vulnerable code.
Update GitHub Actions Job to run the Amazon CodeGuru Scan.
Push the code to the repository.
Verify the pipeline.
Check the Amazon CodeGuru recommendations in the GitHub user interface.
1. Create an S3 bucket for the Amazon CodeGuru Reviewer
When you run a CodeGuru scan, your code is first uploaded to an S3 bucket in your AWS account.
Note that CodeGuru Reviewer expects the S3 bucket name to begin with codeguru-reviewer-.
You can create this bucket using the bucket policy outlined in this CloudFormation template (JSON or YAML) or by following these instructions.
2. Update the IAM role to add permissions for Amazon CodeGuru
Locate the role created in the pre-requisite section, named “CodeDeployRoleforGitHub”.
Next, create an inline policy by following these steps. Give it a name, such as “codegurupolicy” and add the following permissions to the policy.
At this point, you will have completed your initial full analysis run. However, since this is a simple “helloWorld” program, you may not receive any recommendations. In the following steps, you will incorporate vulnerable code and trigger the analysis again, allowing CodeGuru to identify and provide recommendations for potential issues.
4. Add Vulnerable code
Create a file application.conf at /aws-codedeploy-github-actions-deployment/spring-boot-hello-world-example
Add the following content in application.conf file.
5. Update GitHub Actions Job to run Amazon CodeGuru Scan
You will need to add a new job definition in the GitHub Actions’ yaml file. This new section should be inserted between the Build and Deploy sections for optimal workflow.
Additionally, you will need to adjust the dependency in the deploy section to reflect the new flow: Build -> CodeScan -> Deploy.
Review sample GitHub actions code for running security scan on Amazon CodeGuru Reviewer.
Refer to the complete file provided below for your reference. It is important to note that you will need to replace the following environment variables with your specific values.
Your code has been pushed to the repository and will trigger the workflow as per the configuration in GitHub Actions.
7. Verify the pipeline
Your pipeline is set up to fail upon the detection of a critical vulnerability. You can also suppress recommendations from CodeGuru Reviewer if you think it is not relevant for setup. In this example, as there are two critical vulnerabilities, the pipeline will not proceed to the next step.
To view the status of the pipeline, navigate to the Actions tab on your GitHub console. You can refer to the following image for guidance.
Figure 4. GitHub Actions pipeline
To view the details of the error, you can expand the “codescan” job in the GitHub Actions console. This will provide you with more information about the specific vulnerabilities that caused the pipeline to fail and help you to address them accordingly.
Figure 5. Codescan actions logs
8. Check the Amazon CodeGuru recommendations in the GitHub user interface
Once you have run the CodeGuru Reviewer Action, any security findings and recommendations will be displayed on the Security tab within the GitHub user interface. This will provide you with a clear and convenient way to view and address any issues that were identified during the analysis.
Figure 6. Security tab with results
Clean up
To avoid incurring future charges, you should clean up the resources that you created.
Empty the Amazon S3 bucket.
Delete the CloudFormation stack (CodeDeployStack) from the AWS console.
Amazon CodeGuru is a valuable tool for software development teams looking to improve the quality and efficiency of their code. With its advanced AI capabilities, CodeGuru automates the manual parts of code review and helps identify performance, cost, security, and maintainability issues. CodeGuru also integrates with popular development tools and provides customizable recommendations, making it easy to use within existing workflows. By using Amazon CodeGuru, teams can improve code quality, increase development speed, lower costs, and enhance security, ultimately leading to better software and a more successful overall development process.
In this post, we explained how to integrate Amazon CodeGuru Reviewer into your code build pipeline using GitHub actions. This integration serves as a quality gate by performing code analysis and identifying challenges in your code. Now you can access the CodeGuru Reviewer recommendations directly within the GitHub user interface for guidance on resolving identified issues.
AWS Network Firewall is a stateful, managed, network firewall and intrusion detection and prevention service for your Amazon VPC. With Network Firewall, you can filter inbound and outbound traffic to or from internet gateways; AWS Direct Connect gateways; AWS PrivateLink, AWS Site-to-Site VPN, and AWS Client VPN gateways; NAT gateways; and even between other attached VPCs and subnets.
You can use Network Firewall to help prevent your VPC from accessing unauthorized domains, to block IP addresses, and to perform deep packet inspection or protocol filtering. However, it can be time consuming to update your firewall’s rule groups to add, remove, or modify the list of IP addresses across multiple Network Firewall instances that can be deployed in distributed, centralized, or combined deployment models.
With prefix lists, you can group one or more CIDR blocks into a single object. Therefore, you can group IP addresses that you frequently use in a prefix list, and reference this list in Network Firewall rule groups. With this approach, you don’t need to update individual firewall rules when scaling the network to add new IP addresses, and the Network Firewall rule groups that reference the prefix list are automatically updated.
In this post, we will show you how to build an example configuration in your test environment that uses customer-managed prefix lists in a Network Firewall rule group.
In this post, we will show you how to create a simple architecture in a VPC to create three different VPC prefix lists for private and public subnets and provide protection by restricting traffic flow to the firewall subnet. Then you will create a stateful Network Firewall rule group to include IP set references that are mapped to VPC prefix lists. Figure 1 illustrates the architecture of a protected VPC.
Figure 1: Simple architecture of a protected VPC
In this example, the following three subnets are in the protected VPC:
Firewall subnet: 10.1.0.0/28 This subnet is dedicated for use by Network Firewall. The Network Firewall endpoint is deployed into a dedicated subnet of the VPC.
Public subnet (protected subnet): 10.1.2.0/28 The resources are designed to be internet-facing, so this subnet needs to communicate with the internet gateway. The NAT gateway and load balancer are also hosted on this subnet.
Private subnet (protected workload subnet): 10.1.3.0/28 This is the subnet where you host your private workload that doesn’t accept incoming traffic from the internet (in our example, this is the webservers). The private workload can send requests to the internet through the NAT gateway.
Deploy the CloudFormation template
The following AWS CloudFormation template deploys a network firewall and related resources in a distributed architecture across two Availability Zones. In production, AWS recommends that you use multiple Availability Zones to help ensure high availability and improve fault tolerance. To simplify the instructions, we will focus on a single Availability Zone for this blog post.
To deploy the CloudFormation template
Choose the following Launch Stack button.
Launch the CloudFormation template in the Region of your choice. Make sure that the Region that you choose supports Network Firewall. Select the Availability Zone or Zones to be used for this deployment, and leave the rest of the options as default.
Create the VPC prefix lists
In this section, we will show you how to define your requirements and implement them within Network Firewall to only enable Secure Shell (SSH) traffic from a trusted IP range (an authorized public subnet on the protected VPC) to the private subnet. We will also show you how to block Internet Control Message Protocol (ICMP) traffic from another IP range (with CIDR 10.0.1.0/24).
You will create the following VPC prefix lists:
Public-ip-list — includes the protected subnet: 10.1.2.0/28
Private-deny-list — includes a CIDR block from the other VPC: 10.0.1.0/24
Private-allow-list — includes the protected workload subnet: 10.1.3.0/28
Choose Create prefix list, and then do the following, as shown in Figure 2:
For Prefix list name, enter a name for the prefix list. In our example, the name is Public-ip-list.
For Max entries, enter the maximum number of entries for the prefix list. In our example, this number is 10.
For Address family, select the prefix list that supports IPv4 entries.
Note: Network Firewall currently supports only references to IPv4 prefix lists.
For Prefix list entries, choose Add new entry, and then enter the CIDR block and a description for the entry. In our example, the CIDR block is 10.1.2.0/28.
Choose Create prefix list.
Figure 2: Example of managed prefix lists
Repeat the preceding steps for the two remaining prefix lists: Private-deny-list and Private-allow-list.
When you’ve finished creating the prefix lists, you can view them under Managed prefix lists, as shown in Figure 3.
Figure 3: Example of VPC prefix lists
Create a Network Firewall rule group
The next step is to create a Network Firewall rule group. A Network Firewall rule group is a reusable set of criteria for inspecting and handling network traffic. As part of this configuration, we will take advantage of customer-managed VPC prefix lists as a variable to simplify the management of the rules.
To create a Network Firewall rule group
In the Amazon VPC console, in the left navigation pane, choose Network Firewall rule groups.
From the Rule groups tab, select Create Network Firewall rule group, and then do the following, as shown in Figure 4:
For Rule group type, select Stateful rule group.
For Name, enter your network firewall rule group.
For Capacity, enter 25 or another appropriate value.
For Stateful rule group options, select 5-tuple.
Under Stateful rule order, select Default.
Figure 4: Network Firewall rule group
In the IP set references section, do the following, as shown in Figure 5:
For IP set preference variable name, enter new variable names for each of your VPC prefix lists.
From the IP set resource ID dropdown, select an IP set.
In this example, you are creating three IP set references that are mapped to the VPC prefix lists that you configured in the previous sections, as shown in the following table.
IP set references variable name
Mapped VPC prefix list name to IP set references
CIDR block
IP_list_Allow_ssh_subnets
public-ip-list
10.1.2.0/28
IP_list_Private_Deny
private-deny-list
10.0.1.0/24
IP_list_private_subnets
private-allow-list
10.1.3.0/28
Figure 5: Example of IP set references
In the Add rule section, do the following, as shown in Figure 6:
Select the protocol.
For Source, select Custom and then enter the IP set reference variable name for the source IP address with the following format: <@Your_ip_set_reference_name>. In our example, the name is @IP_list_Allow_ssh_subnets.
For Source port, select Custom and enter the appropriate port number.
For Destination, choose Custom and then enter the IP set reference variable name for the destination IP address with the following format: <@Your_ip_set_reference_name>. In our example, the name is @IP_list_Private_subnets.
For Destination port, choose Custom and enter the appropriate port number.
For Traffic direction, select Any.
For Action, select Pass.
Choose Add rule.
Figure 6: Example of a Network Firewall rule group with custom IP set references
For the next set of rules, repeat the preceding steps and choose the appropriate protocol, source, destination, traffic direction, and action, as shown in the following table.
Protocol
Source
Destination
Source port
Destination port
Direction
Action
SSH
@IP_list_Allow_ssh_subnets
@IP_list_private_subnets
22
22
Forward
Pass
SSH
Any
@IP_list_private_subnets
Any
22
Forward
Drop
ICMP
@IP_list_Private_Deny
Any
Any
Any
Forward
Drop
After completion, you will have a set of stateful rules, as shown in Figure 7.
Figure 7: Example list of Network Firewall rules
Congratulations! You have configured Network Firewall rule groups by using VPC prefix lists for a simplified management to allow SSH traffic only from authorized subnets and to deny ICMP traffic from unauthorized subnets.
For the next steps, you can test your configuration by trying to use protocols such as SSH or ICMP from unauthorized subnets to your private subnets and reviewing the behavior. You can also test your configuration by doing the same from authorized subnets and comparing the results. Furthermore, you can create logging and monitoring solutions in Network Firewall to review the dropped or allowed packets from your Network Firewall log groups in CloudWatch Logs or use contributor insights to analyze Network Firewall logs.
Clean up the resources
To clean up the resources that you created for this walkthrough, do the following:
In this post, you learned how to use Amazon VPC managed prefix lists to simplify management of IP addresses within Network Firewall rule groups. IP set preferences that are mapped to your VPC prefix lists are a great tool to help simplify your firewall rules and reduce operational overhead and administration as you scale your network.
Security Week 2023 is officially in the books. In our welcome post last Saturday, I talked about Cloudflare’s years-long evolution from protecting websites, to protecting applications, to protecting people. Our goal this week was to help our customers solve a broader range of problems, reduce external points of vulnerability, and make their jobs easier.
We announced 34 new tools and integrations that will do just that. Combined, these announcement will help you do five key things faster and easier:
Making it easier to deploy and manage Zero Trust everywhere
Reducing the number of third parties customers must use
Leverage machine learning to let humans focus on critical thinking
Opening up more proprietary Cloudflare threat intelligence to our customers
Making it harder for humans to make mistakes
And to help you respond to the most current attacks in real time, we reported on how we’re seeing scammers use the Silicon Valley Bank news to phish new victims, and what you can do to protect yourself.
In case you missed any of the announcements, take a look at the summary and navigation guide below.
Today we have released insights from our global network on the top 50 brands used in phishing attacks coupled with the tools customers need to stay safer. Our new phishing and brand protection capabilities, part of Security Center, let customers better preserve brand trust by detecting and even blocking “confusable” and lookalike domains involved in phishing campaigns.
Phishing attacks come in all sorts of ways to fool people. Email is definitely the most common, but there are others. Following up on our Top 50 brands in phishing attacks post, here are some tips to help you catch these scams before you fall for them.
Page Shield now ensures only vetted and secure JavaScript is being executed by browsers to stop unwanted or malicious JavaScript from loading to keep end user data safer.
With Aegis, customers can now get dedicated IPs from Cloudflare we use to send them traffic. This allows customers to lock down services and applications at an IP level and build a protected environment that is application, protocol, and even IP-aware.
mTLS support for Workers allows for communication with resources that enforce an mTLS connection. mTLS provides greater security for those building on Workers so they can identify and authenticate both the client and the server helps protect sensitive data.
We have introduced an innovative new approach to secure hosted applications via Cloudflare Access without the need for any installed software or custom code on application servers.
Cloudflare is excited to launch the Descaler Program, a frictionless path to migrate existing Zscaler customers to Cloudflare One. With this announcement, Cloudflare is making it even easier for enterprise customers to make the switch to a faster, simpler, and more agile foundation for security and network transformation.
Today we’re excited to announce the expansion of support for automated normalization and correlation of Zero Trust logs for Logpush in Sumo Logic’s Cloud SIEM. Joint customers will reduce alert fatigue and accelerate the triage process by converging security and network data into high-fidelity insights.
Cloudflare One now offers Data Loss Prevention (DLP) detections for Microsoft Purview Information Protection labels. This extends the power of Microsoft’s labels to any of your corporate traffic in just a few clicks.
We are unveiling two new integrations for Cloudflare CASB: one for Atlassian Confluence and the other for Atlassian Jira. Security teams can begin scanning for Atlassian- and Confluence-specific security issues that may be leaving sensitive corporate data at risk.
Cloudflare Access and Ping Identity offer a powerful solution for organizations looking to implement Zero Trust security controls to protect their applications and data. Cloudflare is now offering full integration support, so Ping Identity customers can easily integrate their identity management solutions with Cloudflare Access to provide a comprehensive security solution for their applications
We are excited to announce Cloudflare Fraud Detection that will provide precise, easy to use tools that can be deployed in seconds to detect and categorize fraud such as fake account creation or card testing and fraudulent transactions. Fraud Detection will be in early access later this year, those interested can sign up here.
Customers can use these new features to enforce a positive security model on their API endpoints even if they have little-to-no information about their existing APIs today.
With our new Cloudflare Sequence Analytics for APIs, organizations can view the most important sequences of API requests to their endpoints to better understand potential abuse and where to apply protections first.
Read our post on how we keep users and organizations safer with machine learning models that detect attackers attempting to evade detection with DNS tunneling and domain generation algorithms.
We are making the machine learning empowered WAF and Security analytics view available to our Business plan customers, to help detect and stop attacks before they are known.
We have made Cloudflare Radar’s newest free tool available, URL Scanner, providing an under-the-hood look at any webpage to make the Internet more transparent and secure for all.
One of our core beliefs is that privacy is a human right. To achieve that right, we are announcing that our implementations of post-quantum cryptography will be available to everyone, free of charge, forever.
The recent news reports of AI cracking post-quantum cryptography are greatly exaggerated. In this blog, we take a deep dive into the world of side-channel attacks and how AI has been used for more than a decade already to aid it.
IBM and Cloudflare continue to partner together to help customers meet the unique security, performance, resiliency and compliance needs of their customers through the addition of exciting new product and service offerings.
Customers will now be able to use our Cloudflare Tunnels product to send traffic to the key server through a secure channel, without publicly exposing it to the rest of the Internet.
Brand impersonation continues to be a big problem globally. Setting SPF, DKIM and DMARC policies is a great way to reduce that risk, and protect your domains from being used in spoofing emails. But maintaining a correct SPF configuration can be very costly and time consuming, and that’s why we’re launching Cloudflare DMARC Management.
At Cloudflare, we use the Workers platform and our product stack to build new services. Read how we made the new DMARC Management solution entirely on top of our APIs.
Cloudflare’s cloud email security solution now integrates with KnowBe4, allowing mutual customers to offer real-time coaching to employees when a phishing campaign is detected by Cloudflare.
We are excited to announce new options to customize user experience in Access, including customizable pages including login, blocks and the application launcher.
Cloudflare Access is 75% faster than Netskope and 50% faster than Zscaler, and our network is faster than other providers in 48% of last mile networks.
Cloudflare announces one-click ISO certified region, a super easy way for customers to limit where traffic is serviced to ISO 27001 certified data centers inside the European Union.
All WAF customers will benefit fromAccount Security Analytics and Events. This allows organizations to new eyes on your account in Cloudflare dashboard to give holistic visibility. No matter how many zones you manage, they are all there!
We are thrilled to announce the full support of wildcard and multi-hostname application definitions in Cloudflare Access. Until now, Access had limitations that restricted it to a single hostname or a limited set of wildcards
While that’s it for Security Week 2023, you all know by now that Innovation weeks never end for Cloudflare. Stay tuned for a week full of new developer tools coming soon, and a week dedicated to making the Internet faster later in the year.
We are thrilled to announce the full support of wildcard and multi-hostname application definitions in Cloudflare Access. Until now, Access had limitations that restricted it to a single hostname or a limited set of wildcards. Before diving into these new features let’s review Cloudflare Access and its previous limitations around application definition.
Access and hostnames
Cloudflare Access is the gateway to applications, enforcing security policies based on identity, location, network, and device health. Previously, Access applications were defined as a single hostname. A hostname is a unique identifier assigned to a device connected to the internet, commonly used to identify a website, application, or server. For instance, “www.example.com” is a hostname.
Upon successful completion of the security checks, a user is granted access to the protected hostname via a cookie in their browser, in the form of a JSON Web Token (JWT). This cookie’s session lasts for a specific period of time defined by the administrators and any request made to the hostname must have this cookie present.
However, a single hostname application definition was not sufficient in certain situations, particularly for organizations with Single Page Applications and/or hundreds of identical hostnames.
Many Single Page Applications have two separate hostnames – one for the front-end user experience and the other for receiving API requests (e.g., app.example.com and api.example.com). This created a problem for Access customers because the front-end service could no longer communicate with the API as they did not share a session, leading to Access blocking the requests. Developers had to use different custom approaches to issue or share the Access JWT between different hostnames.
In many instances, organizations also deploy applications using a consistent naming convention, such as example.service123.example.com, especially for automatically provisioned applications. These applications often have the same set of security requirements. Previously, an Access administrator had to create a unique Access application per unique hostname, even if the services were functionally identical. This resulted in hundreds or thousands of Access applications needing to be created.
We aimed to make things easier for security teams as easier configuration means a more coherent security architecture and ultimately more secure applications.
We introduced two significant changes to Cloudflare Access: Multi-Hostname Applications and Wildcard Support.
Multi-Hostname Applications
Multi-Hostname Applications allow teams to protect multiple subdomains with a single Access app, simplifying the process and reducing the need for multiple apps.
Access also takes care of JWT cookie issuance across all hostnames associated with a given application. This means that a front-end and API service on two different hostnames can communicate securely without any additional software changes.
Wildcards
A wildcard is a special character, in this case *, defines a specific application pattern to match instead of explicitly having to define each unique application. Access applications can now be defined using a wildcard anywhere in the subdomain or path of a hostname. This allows an administrator to protect hundreds of applications with a single application policy.
In a scenario where an application requires additional security controls, Access is configured such that the most specific hostname definition wins (e.g., test.example.com will take precedence over *.example.com).
Give it a try!
Wildcard Applications are now available in open beta on the Cloudflare One Dashboard. Multi Hostname support will enter an open beta in the coming weeks. For more information, please see our product documentation about Multi-hostname applications and wildcards.
Cloudflare offers many security features like WAF, Bot management, DDoS, Zero Trust, and more! This suite of products are offered in the form of rules to give basic protection against common vulnerability attacks. These rules are usually configured and monitored per domain, which is very simple when we talk about one, two, maybe three domains (or what we call in Cloudflare’s terms, “zones”).
The zone-level overview sometimes is not time efficient
If you’re a Cloudflare customer with tens, hundreds, or even thousands of domains under your control, you’d spend hours going through these domains one by one, monitoring and configuring all security features. We know that’s a pain, especially for our Enterprise customers. That’s why last September we announced the Account WAF, where you can create one security rule and have it applied to the configuration of all your zones at once!
Account WAF makes it easy to deploy security configurations. Following the same philosophy, we want to empower our customers by providing visibility over these configurations, or even better, visibility on all HTTP traffic.
Today, Cloudflare is offering holistic views on the security suite by launching Account Security Analytics and Account Security Events. Now, across all your domains, you can monitor traffic, get insights quicker, and save hours of your time.
How do customers get visibility over security traffic today?
Before today, to view account analytics or events, customers either used to access each zone individually to check the events and analytics dashboards, or used zone GraphQL Analytics API or logs to collect data and send them to their preferred storage provider where they could collect, aggregate, and plot graphs to get insights for all zones under their account — in case ready-made dashboards were not provided.
Introducing Account Security Analytics and Events
The new views are security focused, data-driven dashboards — similar to zone-level views, both have similar data like: sampled logs and the top filters over many source dimensions (for example, IP addresses, Host, Country, ASN, etc.).
The main difference between them is that Account Security Events focuses on the current configurations on every zone you have, which makes reviewing mitigated requests (rule matches) easy. This step is essential in distinguishing between actual threats from false positives, along with maintaining optimal security configuration.
Part of the Security Events power is showing Events “by service” listing the security-related activity per security feature (for example, WAF, Firewall Rules, API Shield) and Events “by Action” (for example, allow, block, challenge).
On the other hand, Account Security Analytics view shows a wider angle with all HTTP traffic on all zones under the account, whether this traffic is mitigated, i.e., the security configurations took an action to prevent the request from reaching your zone, or not mitigated. This is essential in fine-tuning your security configuration, finding possible false negatives, or onboarding new zones.
The view also provides quick filters or insights of what we think are interesting cases worth exploring for ease of use. Many of the view components are similar to zone level Security Analytics that we introduced recently.
To get to know the components and how they interact, let’s have a look at an actual example.
Analytics walk-through when investigating a spike in traffic
Traffic spikes happen to many customers’ accounts; to investigate the reason behind them, and check what’s missing from the configurations, we recommend starting from Analytics as it shows mitigated and non-mitigated traffic, and to revise the mitigated requests to double check any false positives then Security Events is the go to place. That’s what we’ll do in this walk-through starting with the Analytics, finding a spike, and checking if we need further mitigation action.
Step 1: To navigate to the new views, sign into the Cloudflare dashboard and select the account you want to monitor. You will find Security Analytics and Security Events in the sidebar under Security Center.
Step 2: In the Analytics dashboard, if you had a big spike in the traffic compared to the usual, there’s a big chance it’s a layer 7 DDoS attack. Once you spot one, zoom into the time interval in the graph.
Zooming into a traffic spike on the timeseries scale
By Expanding the top-Ns on top of the analytics page we can see here many observations:
We can confirm it’s a DDoS attack as the peak of traffic does not come from one single IP address, It’s distributed over multiple source IPs. The “edge status code” indicates that there’s a rate limiting rule applied on this attack and it’s a GET method over HTTP/2.
Looking at the right hand side of the analytics we can see “Attack Analysis” indicating that these requests were clean from XSS, SQLi, and common RCE attacks. The Bot Analysis indicates it’s an automated traffic in the Bot Scores distribution; these two products add another layer of intelligence to the investigation process. We can easily deduce here that the attacker is sending clean requests through high volumetric attack from multiple IPs to take the web application down.
Step 3: For this attack we can see we have rules in place to mitigate it, with the visibility we get the freedom to fine tune our configurations to have better security posture, if needed. we can filter on this attack fingerprint, for instance: add a filter on the referer `www.example.com` which is receiving big bulk of the attack requests, add filter on path equals `/`, HTTP method, query string, and a filter on the automated traffic with Bot score, we will see the following:
Step 4: Jumping to Security Events to zoom in on our mitigation actions in this case, spike fingerprint is mitigated using two actions: Managed Challenge and Block.
The mitigation happened on: Firewall rules and DDoS configurations, the exact rules are shown in the top events.
Who gets the new views?
Starting this week all our customers on Enterprise plans will have access to Account Security Analytics and Security Events. We recommend having Account Bot Management, WAF Attack Score, and Account WAF to have access to the full visibility and actions.
What’s next?
The new Account Security Analytics and Events encompass metadata generated by the Cloudflare network for all domains in one place. In the upcoming period we will be providing a better experience to save our customers’ time in a simple way. We’re currently in beta, log into the dashboard, check out the views, and let us know your feedback.
We’ve launched a new AWS Security Blog homepage! While we currently have no plans to deprecate our existing list-view homepage, we have recently launched a new, security-centered homepage to provide readers with more blog info and easy access to the rest of AWS Security. Please bookmark the new page, and let us know what you think, by adding a comment, below.
The new AWS Security Blog homepage
If you have feedback about this post, submit comments in the Comments section below.
Want more AWS Security news? Follow us on Twitter.
At the end of 2021 Cloudflare launched Security Center, a unified solution that brings together our suite of security products and unique Internet intelligence. It enables security teams to quickly identify potential security risks and threats to their organizations, map their attack surface and mitigate these risks with just a few clicks. While Security Center initially focused on application security, we are now adding crucial zero trust insights to further enhance its capabilities.
When your brand is loved and trusted, customers and prospects are looking forward to the emails you send them. Now picture them receiving an email from you: it has your brand, the subject is exciting, it has a link to register for something unique — how can they resist that opportunity?
But what if that email didn’t come from you? What if clicking on that link is a scam that takes them down the path of fraud or identity theft? And what if they think you did it? The truth is, even security minded people occasionally fall for well crafted spoof emails.
That poses a risk to your business and reputation. A risk you don’t want to take – no one does. Brand impersonation is a significant problem for organizations globally, and that’s why we’ve built DMARC Management – available in Beta today.
With DMARC Management you have full insight on who is sending emails on your behalf. You can one-click approve each source that is a legitimate sender for your domain, and then set your DMARC policy to reject any emails sent from unapproved clients.
When the survey platform your company uses is sending emails from your domain, there’s nothing to worry about – you configured it that way. But if an unknown mail service from a remote country is sending emails using your domain that can be quite scary, and something you’ll want to address. Let’s see how.
Anti-spoofing mechanisms
Sender Policy Framework (SPF), DomainKeys Identified Mail (DKIM) and Domain-based Message Authentication Reporting and Conformance (DMARC) are three common email authentication methods. Together, they help prevent spammers, phishers, and other unauthorized parties from sending emails on behalf of a domain they do not own.
SPF is a way for a domain to list all the servers the company sends emails from. Think of it like a publicly available employee directory that helps someone to confirm if an employee works for an organization. SPF records list all the IP addresses of all the servers that are allowed to send emails from the domain.
DKIM enables domain owners to automatically “sign” emails from their domain. Specifically, DKIM uses public key cryptography:
A DKIM record stores the domain’s public key, and mail servers receiving emails from the domain can check this record to obtain the public key.
The private key is kept secret by the sender, who signs the email’s header with this key.
Mail servers receiving the email can verify that the sender’s private key was used by applying the public key. This also guarantees that the email was not tampered with while in transit.
DMARC tells a receiving email server what to do after evaluating the SPF and DKIM results. A domain’s DMARC policy can be set in a variety of ways — it can instruct mail servers to quarantine emails that fail SPF or DKIM (or both), to reject such emails, or to deliver them.
It’s not trivial to configure and maintain SPF and DMARC, though. If your configuration is too strict, legitimate emails will be dropped or marked as spam. If it’s too relaxed, your domain might be misused for email spoofing. The proof is that these authentication mechanisms (SPF / DKIM / DMARC) have existed for over 10 years and still, there are still less than 6 million active DMARC records.
DMARC reports can help, and a full solution like DMARC Management reduces the burden of creating and maintaining a proper configuration.
DMARC reports
All DMARC-compliant mailbox providers support sending DMARC aggregated reports to an email address of your choice. Those reports list the services that have sent emails from your domain and the percentage of messages that passed DMARC, SPF and DKIM. They are extremely important because they give administrators the information they need to decide how to adjust their DMARC policies — for instance, that’s how administrators know if their legitimate emails are failing SPF and DKIM, or if a spammer is trying to send illegitimate emails.
But beware, you probably don’t want to send DMARC reports to a human-monitored email address, as these come in fast and furious from virtually every email provider your organization sends messages to, and are delivered in XML format. Typically, administrators set up reports to be sent to a service like our DMARC Management, that boils them down to a more digestible form. Note: These reports do not contain personal identifiable information (PII).
DMARC Management automatically creates an email address for those reports to be sent to, and adds the corresponding RUA record to your Cloudflare DNS to announce to mailbox providers where to send reports to. And yes, if you’re curious, these email addresses are being created using Cloudflare Email Routing.
Note: Today, Cloudflare DNS is a requirement for DMARC Management. Cloudflare Area 1 customers will soon also be able to see DMARC reports even if they’re using third-party DNS services.
As reports are received in this dedicated email address, they are processed by a Worker that extracts the relevant data, parses it and sends it over to our analytics solution. And you guessed again, that’s implemented using Email Workers. You can read more about the technical implementation here.
Taking action
Now that reports are coming in, you can review the data and take action.
Note: It may take up to 24 hours for mailbox providers to start sending reports and for these analytics to be available to you.
At the top of DMARC Management you have an at-a-glance view of the outbound security configuration for your domain, more specifically DMARC, DKIM, and SPF. DMARC Management will soon start reporting on inbound email security as well, which includes STARTTLS, MTA-STS, DANE, and TLS reporting.
The middle section shows the email volume over time, with individual lines showing those that pass DMARC and those that fail.
Below, you have additional details that include the number of email messages sent by each source (per the DMARC reports), and the corresponding DMARC, SPF and DKIM statistics. You can approve (that is, include in SPF) any of these sources by clicking on “…”, and you can easily spot applications that may not have DKIM correctly configured.
Clicking on any source gives you the same DMARC, SPF and DKIM statistics per IP address of that source. This is how you identify if there’s an additional IP address you might need to include in your SPF record, for example.
The ones that fail are the ones you’ll want to take action on, as they will need to either be approved (which technically means including in the SPF record) if legitimate, or stay unapproved and be rejected by the receiving server when the DMARC policy is configured with p=reject.
Getting to a DMARC reject policy is the goal, but you don’t want to apply such a restrictive policy until you have high confidence that all legitimate sending services are accounted for in SPF (and DKIM, if appropriate). That may take a few weeks, depending on the number of services you have sending messages from your domain, but with DMARC Management you will quickly grasp when you’re ready to go.
What else is needed
Once you have approved all your authorized email senders (sources) and configured DMARC to quarantine or reject, you should be confident that your brand and organization are much safer. From then on, keeping an eye on your approved sources list is a very lightweight operation that doesn’t take more than a few minutes per month from your team. Ideally, when new applications that send emails from your domain are deployed in your company, you would proactively include the corresponding IP addresses in your SPF record.
But even if you don’t, you will find new unapproved senders notices on your Security Center, under the Security Insights tab, alongside other important security issues you can review and manage.
Or you can check the unapproved list on DMARC Management every few weeks.
Whenever you see a legitimate sender source show up as unapproved, you know what to do — click “…” and mark them as approved!
What’s coming next
DMARC Management takes email security to the next level, and this is only the beginning.
We’re excited to demonstrate our investments in features that provide customers even more insight into their security. Up next we’ll be connecting security analytics from Cloudflare’s Cloud Access Security Broker (CASB) into the Security Center.
This product integration will provide customers a way to understand the status of their wider SaaS security at a glance. By surfacing the makeup of CASB Findings (or security issues identified in popular SaaS apps) by severity, health of the SaaS integration, and the number of hidden issues, IT and security administrators will have a way to understand the status of their wider security surface area from a single source.
Stay tuned for more news on CASB in Security Center. In the meantime you can join the waitlist for DMARC Management beta for free today and, if you haven’t yet, we recommend you also check out Cloudflare Area 1 and request a Phishing Risk Assessment to block phishing, spoof and spam emails from coming into your environment.
DMARC stands for Domain-based Message Authentication, Reporting, and Conformance. It’s an email authentication protocol that helps protect against email phishing and spoofing.
When an email is sent, DMARC allows the domain owner to set up a DNS record that specifies which authentication methods, such as SPF (Sender Policy Framework) and DKIM (DomainKeys Identified Mail), are used to verify the email’s authenticity. When the email fails these authentication checks DMARC instructs the recipient’s email provider on how to handle the message, either by quarantining it or rejecting it outright.
DMARC has become increasingly important in today’s Internet, where email phishing and spoofing attacks are becoming more sophisticated and prevalent. By implementing DMARC, domain owners can protect their brand and their customers from the negative impacts of these attacks, including loss of trust, reputation damage, and financial loss.
In addition to protecting against phishing and spoofing attacks, DMARC also provides reporting capabilities. Domain owners can receive reports on email authentication activity, including which messages passed and failed DMARC checks, as well as where these messages originated from.
DMARC management involves the configuration and maintenance of DMARC policies for a domain. Effective DMARC management requires ongoing monitoring and analysis of email authentication activity, as well as the ability to make adjustments and updates to DMARC policies as needed.
Some key components of effective DMARC management include:
Setting up DMARC policies: This involves configuring the domain’s DMARC record to specify the appropriate authentication methods and policies for handling messages that fail authentication checks. Here’s what a DMARC DNS record looks like:
This specifies that we are going to use DMARC version 1, our policy is to reject emails if they fail the DMARC checks, and the email address to which providers should send DMARC reports.
Monitoring email authentication activity: DMARC reports are an important tool for domain owners to ensure email security and deliverability, as well as compliance with industry standards and regulations. By regularly monitoring and analyzing DMARC reports, domain owners can identify email threats, optimize email campaigns, and improve overall email authentication.
Making adjustments as needed: Based on analysis of DMARC reports, domain owners may need to make adjustments to DMARC policies or authentication methods to ensure that email messages are properly authenticated and protected from phishing and spoofing attacks.
Working with email providers and third-party vendors: Effective DMARC management may require collaboration with email providers and third-party vendors to ensure that DMARC policies are being properly implemented and enforced.
As a leading provider of cloud-based security and performance solutions, we at Cloudflare take a specific approach to test our products. We “dogfood” our own tools and services, which means we use them to run our business. This helps us identify any issues or bugs before they affect our customers.
We use our own products internally, such as Cloudflare Workers, a serverless platform that allows developers to run their code on our global network. Since its launch in 2017, the Workers ecosystem has grown significantly. Today, there are thousands of developers building and deploying applications on the platform. The power of the Workers ecosystem lies in its ability to enable developers to build sophisticated applications that were previously impossible or impractical to run so close to clients. Workers can be used to build APIs, generate dynamic content, optimize images, perform real-time processing, and much more. The possibilities are virtually endless. We used Workers to power services like Radar 2.0, or software packages like Wildebeest.
Recently our Email Routing product joined forces with Workers, enabling processing incoming emails via Workers scripts. As the documentation states: “With Email Workers you can leverage the power of Cloudflare Workers to implement any logic you need to process your emails and create complex rules. These rules determine what happens when you receive an email.” Rules and verified addresses can all be configured via our API.
With the ability to programmatically process incoming emails in place, it seemed like the perfect way to handle incoming DMARC report emails in a scalable and efficient manner, letting Email Routing and Workers do the heavy lifting of receiving an unbound number of emails from across the globe. A high level description of what we needed is:
Receive email and extract report
Publish relevant details to analytics platform
Store the raw report
Email Workers enable us to do #1 easily. We just need to create a worker with an email() handler. This handler will receive the SMTP envelope elements, a pre-parsed version of the email headers, and a stream to read the entire raw email.
For #2 we can also look into the Workers platform, and we will find the Workers Analytics Engine. We just need to define an appropriate schema, which depends both on what’s present in the reports and the queries we plan to do later. Afterwards we can query the data using either the GraphQL or SQL API.
For #3 we don’t need to look further than our R2 object storage. It is trivial to access R2 from a Worker. After extracting the reports from the email we will store them in R2 for posterity.
We built this as a managed service that you can enable on your zone, and added a dashboard interface for convenience, but in reality all the tools are available for you to deploy your own DMARC reports processor on top of Cloudflare Workers, in your own account, without having to worry about servers, scalability or performance.
Architecture
Email Workers is a feature of our Email Routing product. The Email Routing component runs in all our nodes, so any one of them is able to process incoming mail, which is important because we announce the Email ingress BGP prefix from all our datacenters. Sending emails to an Email Worker is as easy as setting a rule in the Email Routing dashboard.
When the Email Routing component receives an email that matches a rule to be delivered to a Worker, it will contact our internal version of the recently open-sourced workerd runtime, which also runs on all nodes. The RPC schema that governs this interaction is defined in a Capnproto schema, and allows the body of the email to be streamed to Edgeworker as it’s read. If the worker script decides to forward this email, Edgeworker will contact Email Routing using a capability sent in the original request.
jsg::Promise<void> ForwardableEmailMessage::forward(kj::String rcptTo, jsg::Optional<jsg::Ref<Headers>> maybeHeaders) {
  auto req = emailFwdr->forwardEmailRequest();
  req.setRcptTo(rcptTo);

  auto sendP = req.send().then(
      [](capnp::Response<rpc::EmailMetadata::EmailFwdr::ForwardEmailResults> res) mutable {
    auto result = res.getResponse().getResult();
    JSG_REQUIRE(result.isOk(), Error, result.getError());
  });
  auto& context = IoContext::current();
  return context.awaitIo(kj::mv(sendP));
}
In the context of DMARC reports this is how we handle the incoming emails:
Fetch the recipient of the email being processed, this is the RUA that was used. RUA is a DMARC configuration parameter that indicates where aggregate DMARC processing feedback should be reported pertaining to a certain domain. This recipient can be found in the “to” attribute of the message.
const ruaID = message.to
Since we handle DMARC reports for an unbounded number of domains, we use Workers KV to store some information about each one and key this information on the RUA. This also lets us know if we should be receiving these reports.
At this point, we want to read the entire email into an arrayBuffer in order to parse it. Depending on the size of the report we may run into the limits of the free Workers plan. If this happens, we recommend that you switch to the Workers Unbound resource model which does not have this issue.
const rawEmail = new Response(message.raw)
const arrayBuffer = await rawEmail.arrayBuffer()
Parsing the raw email involves, among other things, parsing its MIME parts. There are multiple libraries available that allow one to do this. For example, you could use postal-mime:
const parser = new PostalMime.default()
const email = await parser.parse(arrayBuffer)
Having parsed the email we now have access to its attachments. These attachments are the DMARC reports themselves and they can be compressed. The first thing we want to do is store them in their compressed form in R2 for long-term storage. They can be useful later on for re-processing or investigating interesting reports. Doing this is as simple as calling put() on the R2 binding. In order to facilitate retrieval later we recommend that you spread the report files across directories based on the current time.
We now need to look into the attachment mime type. The raw form of DMARC reports is XML, but they can be compressed. In this case we need to decompress them first. DMARC reporter files can use multiple compression algorithms. We use the MIME type to know which one to use. For Zlib compressed reports pako can be used while for ZIP compressed reports unzipit is a good choice.
Having obtained the raw XML form of the report, fast-xml-parser has worked well for us in parsing them. Here’s how the DMARC report XML looks:
We now have all the data in the report at our fingertips. What we do from here on depends a lot on how we want to present the data. For us, the goal was to display meaningful data extracted from them in our Dashboard. Therefore we needed an Analytics platform where we could push the enriched data. Enter, Workers Analytics Engine. The Analytics engine is perfect for this task since it allows us to send data to it from a worker, and exposes a GraphQL API to interact with the data afterwards. This is how we obtain the data to show in our dashboard.
In the future, we are also considering integrating Queues in the workflow to asynchronously process the report and avoid waiting for the client to complete it.
We managed to implement this project end-to-end relying only on the Workers infrastructure, proving that it’s possible, and advantageous, to build non-trivial apps without having to worry about scalability, performance, storage and security issues.
Open sourcing
As we mentioned before, we built a managed service that you can enable and use, and we will manage it for you. But, everything we did can also be deployed by you, in your account, so that you can manage your own DMARC reports. It’s easy, and free. To help you with that, we are releasing an open-source version of a Worker that processes DMARC reports in the way described above: https://github.com/cloudflare/dmarc-email-worker
If you don’t have a dashboard where to show the data, you can also query the Analytics Engine from a Worker. Or, if you want to store them in a relational database, then there’s D1 to the rescue. The possibilities are endless and we are excited to find out what you’ll build with these tools.
Please contribute, make your own, we’ll be listening.
Final words
We hope that this post has furthered your understanding of the Workers platform. Today Cloudflare takes advantage of this platform to build most of our services, and we think you should too.
Feel free to contribute to our open-source version and show us what you can do with it.
The Email Routing is also working on expanding the Email Workers API more functionally, but that deserves another blog soon.
In this blog post, we wanted to highlight some ways that Cloudflare and IBM Cloud work together to help drive product innovation and deliver services that address the needs of our mutual customers. On our blog, we often discuss exciting new product developments and how we are solving real-world problems in our effort to make the internet better and many of our customers and partners play an important role.
IBM Cloud and Cloudflare have been working together since 2018 to integrate Cloudflare application security and performance products natively into IBM Cloud. IBM Cloud Internet Services (CIS) has customers across a wide range of industry verticals and geographic regions but they also have several specialist groups building unique service offerings.
The IBM Cloud team specializes in serving clients in highly regulated industries, aiming to ensure their resiliency, performance, security and compliance needs are met. One group that we’ve been working with recently is IBM Cloud for Financial Services. This group extends the capabilities of IBM Cloud to help serve the complex security and compliance needs of banks, financial institutions and fintech companies.
Bot Management
As malicious bot attacks get more sophisticated and manual mitigations become more onerous, a dynamic and adaptive solution is required for enterprises running Internet facing workloads. With Cloudflare Bot Management on IBM Cloud Internet Services, we aim to help IBM clients protect their Internet properties from targeted application abuse such as account takeover attacks, inventory hoarding, carding abuse and more. Bot Management will be available in the second quarter of 2023.
Threat actors specifically target financial services entities with Account Takeover Attacks, and this is where Cloudflare can help. As much as 71% of login requests we see come from bots (Source: Cloudflare Data) Cloudflare’s Bot Management is powered by a global machine learning model that analyses an average of 45 million HTTP requests a second to track botnets across our network. Cloudflare’s Bot Management solution has the potential to benefit all IBM CIS customers.
Supporting banks, financial institutions, and fintechs
IBM Cloud has been a leader when it comes to providing solutions for the financial services industry and has developed several key management solutions that are designed so clients only need to store their private keys in custom built devices.
The IBM CIS team wants to incorporate the right mix of security and performance, which necessitates the use of cloud-based DDoS, WAF, and Bot Management. Specifically, they wanted to incorporate the powerful security tools that were offered through IBM’s Enterprise-level Cloud Internet Services offerings. When using a cloud solution, it is necessary to proxy traffic which can create a potential challenge when it comes to managing private keys. While Cloudflare adopts strict controls to protect these keys, organizations in highly regulated industries may have security policies and compliance requirements that prevent them from sharing these private keys.
Cloudflare built Keyless SSL to allow customers to have total control over exactly where private keys are stored. With Keyless SSL and IBM’s key storage solutions, we aim to help enterprises benefit from the robust application protections available through Cloudflare’s WAF, including Cloudflare Bot Management, while still retaining control of their private keys.
“We aim to ensure our clients meet their resiliency, performance, security and compliance needs. The introduction of Keyless SSL and Bot Management security capabilities can further our collaborative accomplishments with Cloudflare and help enterprises, including those in regulated industries, to leverage cloud-native security and adaptive threat mitigation tools.” — Zane Adam, Vice President, IBM Cloud.
“Through our collaboration with IBM Cloud Internet Services, we get to draw on the knowledge and experience of IBM teams, such as the IBM Cloud for Financial Services team, and combine it with our incredible ability to innovate, resulting in exciting new product and service offerings.” — David McClure, Global Alliance Manager, Strategic Partnerships
This is a familiar story in the world of bot attacks. Cloudflare Bot Management helps customers identify the automated tools behind online fraud, but it’s important to note that not all fraud is committed by bots. If the target is valuable enough, bad actors will contract out the exploitation of online applications to real people. Security teams need to look at more than just bots to better secure online applications and tackle modern, online fraud.
Today, we’re excited to announce Cloudflare Fraud Detection. Fraud Detection will give you precise, easy to use tools that can be deployed in seconds to any website on the Cloudflare network to help detect and categorize fraud. For every type of fraud we detect on your website, you will be able to choose the behavior that makes the most sense to you. While some customers will want to block fraudulent traffic at our edge, other customers may want to pass this information in headers to build integrations with their own app, or use our Cloudflare Workers platform to direct high risk users to load an alternate online experience with fewer capabilities.
The online fraud experience today
When we talk to organizations impacted by sophisticated, online fraud, the first thing we hear from frustrated security teams is that they know what they could do to stop fraud in a vacuum: they’ve proposed requiring email verification on signup, enforcing two-factor authentication for all logins, or blocking online purchases from anonymizing VPNs or countries they repeatedly see a disproportionately high number of charge-backs from. While all of these measures would undoubtedly reduce fraud, they would also make the user experience worse. The fear for every company is that a bad UX will mean slower adoption and less revenue, and that’s too steep a price to pay for most run-of-the-mill online fraud.
For those who’ve chosen to preserve that frictionless user experience and bear the cost of fraud, we see two big impacts: higher infrastructure costs and less efficient employees. Bad actors that abuse account creation endpoints or service availability endpoints often do so with floods of highly distributed HTTP requests, quickly moving through residential proxies to pass under IP based rate limiting rules. Without a way to identify fraudulent traffic with certainty, companies are forced to scale up their infrastructure to be able to serve new peaks in request traffic, even when they know the majority of this traffic is illegitimate. Engineering and Trust and Safety Teams suddenly have a whole new set of responsibilities: regularly banning IP addresses that will probably never be used again, routinely purging fraudulent data from over capacity databases, and even sometimes becoming de-facto fraud investigators. As a result, the organization incurs greater costs without any greater value to their customers.
Reduce modern fraud without hurting UX
Organizations have told us loud and clear that an effective fraud management solution needs to reliably stop bad actors before they can create fraudulent accounts, use stolen credit cards, or steal customer data all the while ensuring a frictionless user experience for real users. We are building novel and highly accurate detections, solving for the four common fraud types we hear the most demand for from businesses around the world:
Fake Account Creation: Bad actors signing up for many different accounts to gain access to promotional rewards, or more resources than a single user should have access to.
Account Takeover: Gaining unauthorized access to legitimate accounts, by means such as using stolen username and password combinations from other websites, guessing weak passwords, or abusing account recovery mechanisms.
Card Testing and Fraudulent Transactions: Testing the validity of stolen credit card details or using those same details to purchase goods or services.
Expediting: Obtaining limited availability goods or services by circumventing the normal user flow to complete orders more quickly than should be possible.
In order to trust your fraud management solution, organizations have to understand the decisions or predictions behind the detection of fraud. This is referred to as explainability. For example, it’s not enough to know a signup attempt was flagged as fraud. You need to know, for example, if a signup is fraudulent, exactly what field supplied by the user led us to think this was an issue, why it was an issue, and if it was part of a larger pattern. We will pass along this level of detail when we detect fraud so you can ensure we are only keeping the bad actors out.
Every business that deals with modern, online fraud has a different idea of what risks are acceptable, and a different preference for dealing with fraud once it’s been identified. To give customers maximum flexibility, we’re building Cloudflare’s fraud detection signals to be used individually, or combined with other Cloudflare security products in whichever way best fits each customer’s risk profile and use case, all while using the familiar Cloudflare Firewall Rules interface. Templated rules and suggestions will be available to provide guidance and help customers become familiar with the new features, but each customer will have the option of fully customizing how they want to protect each internet application. Customers can either block, rate-limit, or challenge requests at the edge, or send those signals upstream in request headers, to trigger custom in-application behavior.
Cloudflare provides application performance and security services to millions of sites, and we see 45 million HTTP requests per second on average. The massive diversity and volume of this traffic puts us in a unique position to analyze and defeat online fraud. Cloudflare Bot Management is already built to run our Machine Learning model that detects automated traffic on every request we see. To better tackle more challenging use cases like online fraud, we made our lightning fast Machine Learning even more performant. The typical Machine Learning model now executes in under 0.2 milliseconds, giving us the architecture we need to run multiple specific Machine Learning models in parallel without slowing down content delivery.
Stopping fake account creation and adding to Cloudflare’s defense in depth
The first problem our customers asked us to tackle is detecting fake account creation. Cloudflare is perfectly positioned to solve this because we see more account creation pages than anyone else. Using sampled fake account attack data from our customers, we started looking at signup submission data, and how threat intelligence curated by our Cloudforce One team might be helpful. We found that the data used in our Cloudflare One products was already able to identify 72% of fake accounts based on the signup details supplied by the bad actor, such as the email address or the domain they’re using in the attack. We are continuing to add more sources of threat intelligence data specific to fake accounts to get this number close to 100%. On top of these threat intelligence based rules, we are also training new machine learning models on this data as well, that will spot trends like popular fraud domains based on intelligence from the millions of domains we see across the Cloudflare network.
Making fraud inefficient by expediting detection
The second problem customers asked us to prioritize is expediting. As a reminder, expediting means visiting a succession of web pages faster than would be possible for a normal user, and sometimes skipping ahead in the order of web pages in order to efficiently exploit a resource.
For instance, let’s say that you have an Account Recovery page that is being spammed by a sophisticated group of bad actors, looking for vulnerable users they can steal reset tokens for. In this case, the fraudsters have access to a large number of valid email addresses and they’re testing which of these addresses may be used at your website. To prevent your account recovery process from being abused, we need to ensure that no single person can move through the account recovery process faster, or in a different order than a real person would.
In order to complete a valid password reset action on your site, you may know that a user should have made:
A GET request to render your login page
A POST request to the login page (at least one second after receiving the login page HTML)
A GET request to render the Account Recovery page (at least one second after receiving the POST response)
A POST request to the password reset page (at least one second after receiving the Account Recovery page HTML)
Taken a total time of less than 5 seconds to complete the process
To solve this, we will rely on encrypted data stored by the user in a token to help us determine if the user has visited all the necessary pages needed in a reasonable amount of time to be performing sensitive actions on your site. If your account recovery process is being abused, the encrypted token we supply acts as a VIP pass, allowing only authorized users to successfully complete the password recovery process. Without a pass indicating the user has gone through the normal recovery flow in the correct order and time, they are denied entry to complete a password recovery. By forcing the bad actor to behave the same as a legitimate user, we make their task of checking which of their compromised email addresses might be registered at your site an impossibly slow process, forcing them to move on to other targets.
These are just two of the first techniques we use to identify and block fraud. We are also building Account Takeover and Carding Abuse detections that we will be talking about in the future on this blog. As online fraud continues to evolve, we will continue to build new and unique detections, leveraging Cloudflare’s unique position to help keep the internet safe.
Where do I sign up?
Cloudflare’s mission is to help build a better Internet, and that includes dealing with the evolution of modern online fraud. If you’re spending hours cleaning up after fraud, or are tired of paying to serve web traffic to bad actors, you can join in the Cloudflare Fraud Detection Early Access in the second half of 2023 by submitting your contact information here. Early Access customers can opt in to providing training data sets right away, making our models more effective for their use cases. You’ll also get test access to our newest models, and future fraud protection features as soon as they roll out.
In December 2022 we announced the general availability of the WAF Attack Score. The initial release was for our Enterprise customers, but we always had the belief that this product should be enabled for more users. Today we’re announcing “WAF Attack Score Lite” and “Security Analytics” for our Business plan customers.
Looking back on “What is WAF Attack Score and Security Analytics?”
Vulnerabilities on the Internet appear almost on a daily basis. The CVE (common vulnerabilities and exposures) program has a list with over 197,000 records to track disclosed vulnerabilities.
That makes it really hard for web application owners to harden and update their system regularly, especially when we talk about critical libraries and the exploitation damage that can happen in case of information leak. That’s why web application owners tend to use WAFs (Web Application Firewalls) to protect their online presence.
Most WAFs use signature-based detections, which are rules created based on specific attacks that we know about. The signature-based method is very fast, has a low rate of false positives (these are the requests that are categorized as attack when they are actually legitimate), and is very efficient with most of the attack categories we know. However, they sometimes have a blind spot when a new attack happens, often called zero-day attacks. As soon as a new vulnerability is found, our security analysts take fast action to stop it in a matter of hours and update the WAF Managed Rules, yet we want to protect our customers during this time as well.
This is the main reason Cloudflare created a complementary feature to the WAF managed rules: a smart machine learning layer to help detect unknown attacks, and protect customers even during the time gap until rules are updated.
Early detection + Powerful mitigation = Safer Internet
The performance of any machine learning drastically depends on the data it was trained on. Our machine learning uses a supervised model that was trained over hundreds of millions of requests generated by WAF Managed Rules, data varies between clean and malicious, some were blended with fuzzy techniques to enable catching similar patterns as covered in our blog “Improving the accuracy of our machine learning WAF”. At the moment, there are three types of attacks our machine learning model is optimized to find: SQL Injection (SQLi), Cross Site Scripting (XSS), and a wide range of Remote Code Execution (RCE) attacks such as shell injection, PHP injection, Apache Struts type compromises, Apache log4j, and similar attacks that result in RCE.
And the reason why we started with them is based on Cloudflare’s Application Security Report. These categories represent more than 24% of the mitigated layer 7 attacks over the last year in our WAF, therefore more prone to exploitations.
In the full Enterprise WAF Attack Score version we offer more granularity on the attack categories and we provide scores for each class where they can be configured freely per domain.
WAF Attack Score Lite Features for Business Plan
WAF Attack Score Lite and the Security Analytics view offer three main functions:
1- Attack detection: This happens through inspecting every incoming HTTP request, bucketing or classifying the requests into 4 types: Attacks, Likely Attacks, Likely Clean and Clean. At the moment there are three types of attacks our machine learning model is optimized to find: SQL Injection (SQLi), Cross Site Scripting (XSS), and a wide range of Remote Code Execution (RCE) attacks.
2- Attack mitigation: The ability to create WAF Custom Rules or WAF Rate Limiting Rules to mitigate requests. We’re exposing a new field cf.waf.score.classthat has preset values: attack, likely_attack, likely_clean and clean. customers can use this field in rules expressions and apply needed actions.
3- Visibility over your entire traffic: Security Analytics is a new dashboard currently in beta. It provides a comprehensive view across all your HTTP traffic, which displays all requests whether they match rules or not. Security Analytics is a great tool for investigating false negatives and hardening your security configurations. Security Events is still available in (Security > Events) and Security Analytics is available in a separate tab (Security > Analytics).
Deployment and configuration
In order to enable WAF Attack Score Lite and Security Analytics, you don’t need to take any action. The HTTP machine learning inspection rollout will start today, and Security Analytics will appear automatically to all Business plan customers by the time the rollout is completed in the upcoming weeks.
It’s worth mentioning that having the detection on and viewing the attack analysis in Security Analytics does not mean you’re blocking traffic. It only offers insights and provides the freedom to create rules and mitigate the desired requests. Creating a rule to block or challenge bad traffic is needed to take effect.
A common use case
Consider an attacker executing an attack using automated web requests to manipulate or disrupt web applications. One of the best ways to identify this type of traffic and mitigate these requests is by combining bot score with WAF Attack Score.
1- Go to the Security Analytics dashboard under Security > Analytics. On the right-hand side the Attack Analysis indicates the attack class. In this case, I can select “Attack” to apply a single filter, or use the quick filters under Insights to propagate multiple filters at once. In addition to the attack class, I can also select the Bot “Automated” filter.
2- After filtering, Security Analytics provides the capability of scrolling down to see the logs and validate the results:
3- Once the selected requests are confirmed, I can select the Create WAF Custom Rules option which will direct me to the Security Events with the pre-assigned filters to deploy a rule. In this case, I want to challenge the requests matched by the rule:
And voila! You have a new rule that challenges traffic matching any automated attack variation.
Next steps
We have been working hard to provide maximum security and visibility for all our customers. This is only one step on this road! We will keep adding more product-focused analytics, and providing additional security against unknown attacks. Try it out, create a rule, and don’t hesitate to contact our sales team if you need the full version of WAF Attack Score.
By now, the news about what happened at Silicon Valley Bank (SVB) leading up to its collapse and takeover by the US Federal Government is well known. The rapid speed with which the collapse took place was surprising to many and the impact on organizations, both large and small, is expected to last a while.
Unfortunately, where everyone sees a tragic situation, threat actors see opportunity. We have seen this time and again – in order to breach trust and trick unsuspecting victims, threat actors overwhelmingly use topical events as lures. These follow the news cycle or known high profile events (The Super Bowl, March Madness, Tax Day, Black Friday sales, COVID-19, and on and on), since there is a greater likelihood of users falling for messages referencing what’s top of mind at any given moment.
The SVB news cycle makes for a similarly compelling topical event that threat actors can take advantage of; and it’s crucial that organizations bolster their awareness campaigns and technical controls to help counter the eventual use of these tactics in upcoming attacks. It’s tragic that even as the FDIC is guaranteeing that SVB customers’ money is safe, bad actors are attempting to steal that very money!
Preemptive action
In anticipation of future phishing attacks taking advantage of the SVB brand, Cloudforce One (Cloudflare’s threat operations and research team) significantly increased our brand monitoring focused on SVB’s digital presence starting March 10, 2023 and launched several additional detection modules to spot SVB-themed phishing campaigns. All of our customers taking advantage of our various phishing protection services automatically get the benefit of these new models.
Here’s an actual example of a real campaign involving SVB that’s happening since the bank was taken over by the FDIC.
KYC phish – DocuSign-themed SVB campaign
A frequent tactic used by threat actors is to mimic ongoing KYC (Know Your Customer) efforts that banks routinely perform to validate details about their clients. This is intended to protect financial institutions against fraud, money laundering and financial crime, amongst other things.
On March 14, 2023, Cloudflare detected a large KYC phishing campaign leveraging the SVB brand in a DocuSign themed template. This campaign targeted Cloudflare and almost all industry verticals. Within the first few hours of the campaign, we detected 79 examples targeting different individuals in multiple organizations. Cloudflare is publishing one specific example of this campaign along with the tactics and observables seen to help customers be aware and vigilant of this activity.
Campaign Details
The phishing attack shown below targeted Matthew Prince, Founder & CEO of Cloudflare on March 14, 2023. It included HTML code that contains an initial link and a complex redirect chain that is four-deep. The chain begins when the user clicks the ‘Review Documents’ link. It takes the user to a trackable analytic link run by Sizmek by Amazon Advertising Server bs[.]serving-sys[.]com. The link then further redirects the user to a Google Firebase Application hosted on the domain na2signing[.]web[.]app. The na2signing[.]web[.]app HTML subsequently redirects the user to a WordPress site which is running yet another redirector at eaglelodgealaska[.]com. After this final redirect, the user is sent to an attacker-controlled docusigning[.]kirklandellis[.]net website.
Campaign Timeline
2023-03-14T12:05:28Z		First Observed SVB DoucSign Campaign Launched
2023-03-14T15:25:26Z		Last Observed SVB DoucSign Campaign Launched
A look at the HTML file Google Firebase application (na2signing[.]web[.]app)
The included HTML file in the attack sends the user to a WordPress instance that has recursive redirection capability. As of this writing, we are not sure if this specific WordPress installation has been compromised or a plugin was installed to open this redirect location.
<html dir="ltr" class="" lang="en"><head>
    <title>Sign in to your account</title>

    <script type="text/javascript">
    window.onload = function() {
        function Redirect (url){
            window.location.href = url;
        }
        var urlParams = new URLSearchParams(window.location.href);
        var e = window.location.href;


        Redirect("https://eaglelodgealaska[.]com/wp-header.php?url="+e);
    }
</script>
Indicators of Compromise
na2signing[.]web[.]app	Malicious Google Cloudbase Application.
eaglelodgealaska[.]com	Possibly compromised WordPress website or an open redirect.

*[.]kirklandellis[.]net		Attacker Controlled Application running on at least docusigning[.]kirklandellis[.]net.
Recommendations
Cloudflare Email Security customers can determine if they have received this campaign in their dashboard with the following search terms:
Customers can also track IOCs related to this campaign through our Threat Indicators API. Any updated IOCs will be continually pushed to the relevant API endpoints.
Ensure that you have appropriate DMARC policy enforcement for inbound messages. Cloudflare recommends [p = quarantine] for any DMARC failures on incoming messages at a minimum. SVB’s DMARC records [v=DMARC1; p=reject; pct=100] explicitly state rejecting any messages that impersonate their brand and are not being sent from SVB’s list of designated and verified senders. Cloudflare Email Security customers will automatically get this enforcement based on SVB’s published DMARC records. For other domains, or to apply broader DMARC based policies on all inbound messages, Cloudflare recommends adhering to ‘Enhanced Sender Verification’ policies across all inbound emails within their Cloudflare Area 1 dashboard.
Cloudflare Gateway customers are automatically protected against these malicious URLs and domains. Customers can check their logs for these specific IOCs to determine if their organization had any traffic to these sites.
Work with your phishing awareness and training providers to deploy SVB-themed phishing simulations for your end users, if they haven’t done so already.
Encourage your end users to be vigilant about any ACH (Automated Clearing House) or SWIFT (Society for Worldwide Interbank Financial Telecommunication) related messages. ACH & SWIFT are systems which financial institutions use for electronic funds transfers between entities. Given its large scale prevalence, ACH & SWIFT phish are frequent tactics leveraged by threat actors to redirect payments to themselves. While we haven’t seen any large scale ACH campaigns utilizing the SVB brand over the past few days, it doesn’t mean they are not being planned or are imminent. Here are a few example subject lines to be aware of, that we have seen in similar payment fraud campaigns:
“We’ve changed our bank details”
“Updated Bank Account Information”
“YOUR URGENT ACTION IS NEEDED –
Important – Bank account details change”
“Important – Bank account details change”
“Financial Institution Change Notice”
Stay vigilant against look-alike or cousin domains that could pop up in your email and web traffic associated with SVB. Cloudflare customers have in-built new domain controls within their email & web traffic which would prevent anomalous activity coming from these new domains from getting through.
Ensure any public facing web applications are always patched to the latest versions and run a modern Web Application Firewall service in front of your applications. The campaign mentioned above took advantage of WordPress, which is frequently used by threat actors for their phishing sites. If you’re using the Cloudflare WAF, you can be automatically protected from third party CVEs before you even know about them. Having an effective WAF is critical to preventing threat actors from taking over your public Web presence and using it as part of a phishing campaign, SVB-themed or otherwise.
Staying ahead
Cloudforce One (Cloudflare’s threat operations team) proactively monitors emerging campaigns in their formative stages and publishes advisories and detection model updates to ensure our customers are protected. While this specific campaign is focused on SVB, the tactics seen are no different to other similar campaigns that our global network sees every day and automatically stops them before it impacts our customers.
Having a blend of strong technical controls across multiple communication channels along with a trained and vigilant workforce that is aware of the dangers posed by digital communications is crucial to stopping these attacks from going through.
The crown jewels for an organization are often data, and the first step in protection should be locating where the most critical information lives. Yet, maintaining a thorough inventory of sensitive data is harder than it seems and generally a massive lift for security teams. To help overcome data security troubles, Microsoft offers their customers data classification and protection tools. One popular option are the sensitivity labels available with Microsoft Purview Information Protection. However, customers need the ability to track sensitive data movement even as it migrates beyond the visibility of Microsoft.
Today, we are excited to announce that Cloudflare One now offers Data Loss Prevention (DLP) detections for Microsoft Purview Information Protection labels. Simply integrate with your Microsoft account, retrieve your labels, and build rules to guide the movement of your labeled data. This extends the power of Microsoft’s labels to any of your corporate traffic in just a few clicks.
Data Classification with Microsoft Labels
Every organization has a wealth of data to manage, from publicly accessible data, like documentation, to internal data, like the launch date of a new product. Then, of course, there is the data requiring the highest levels of protection, such as customer PII. Organizations are responsible for confining data to the proper destinations while still supporting accessibility and productivity, which is no small feat.
Microsoft Purview Information Protection offers sensitivity labels to let you classify your organization’s data. With these labels, Microsoft provides the ability to protect sensitive data, while still enabling productivity and collaboration. Sensitivity labels can be used in a number of Microsoft applications, which includes the ability to apply the labels to Microsoft Office documents. The labels correspond to the sensitivity of the data within the file, such as Public, Confidential, or Highly Confidential.
The labels are embedded in a document’s metadata and are preserved even when it leaves the Microsoft environment, such as a download from OneDrive.
Sync Cloudflare One and Microsoft Information Protection
Cloudflare One, our SASE platform that delivers network-as-a-service (NaaS) with Zero Trust security natively built-in, connects users to enterprise resources, and offers a wide variety of opportunities to secure corporate traffic, including the inspection of data moving across the Microsoft productivity suite. We’ve designed Cloudflare One to act as a single pane of glass for your organization. This means that after you’ve deployed any of our Zero Trust services, whether that be Zero Trust Network Access or Secure Web Gateway, you are clicks, not months, away from deploying Data Loss Prevention, Cloud Access Security Broker, Email Security, and Browser Isolation to enhance your Microsoft security and overall data protection.
Specifically, Cloudflare’s API-driven Cloud Access Security Broker (CASB) can scan SaaS applications like Microsoft 365 for misconfigurations, unauthorized user activity, shadow IT, and other data security issues that can occur after a user has successfully logged in.
With this new integration, CASB can now also retrieve Information Protection labels from your Microsoft account. If you have labels configured, upon integration, CASB will automatically populate the labels into a Data Loss Prevention profile.
DLP profiles are the building blocks for applying DLP scanning. They are where you identify the sensitive data you want to protect, such as Microsoft labeled data, credit card numbers, or custom keywords. Your labels are stored as entries within the Microsoft Purview Information Protection Sensitivity Labels profile using the name of your CASB integration. You can also add the labels to custom DLP profiles, of fering more detection flexibility.
Build DLP Rules
You can now extend the power of Microsoft’s labels to protect your data as it moves to other platforms. By building DLP rules, you determine how labeled data can move around and out of your corporate network. Perhaps you don’t want to allow Highly Confidential labels to be downloaded from your OneDrive account, or you don’t want any data more sensitive than Confidential to be uploaded to file sharing sites that you don’t use. All of this can be implemented using DLP and Cloudflare Gateway.
Simply navigate to your Gateway Firewall Policies and start implementing building rules using your DLP profiles:
How to Get Started
To get access to DLP, reach out for a consultation, or contact your account manager.
One year ago we published our first Application Security Report. For Security Week 2023, we are providing updated insights and trends around mitigated traffic, bot and API traffic, and account takeover attacks.
Cloudflare has grown significantly over the last year. In February 2023, Netcraft noted that Cloudflare had become the most commonly used web server vendor within the top million sites at the start of 2023, and continues to grow, reaching a 21.71% market share, up from 19.4% in February 2022.
This continued growth now equates to Cloudflare handling over 45 million HTTP requests/second on average (up from 32 million last year), with more than 61 million HTTP requests/second at peak. DNS queries handled by the network are also growing and stand at approximately 24.6 million queries/second. All of this traffic flow gives us an unprecedented view into Internet trends.
Before we dive in, we need to define our terms.
Definitions
Throughout this report, we will refer to the following terms:
Mitigated traffic: any eyeball HTTP* request that had a “terminating” action applied to it by the Cloudflare platform. These include the following actions: BLOCK, CHALLENGE, JS_CHALLENGE and MANAGED_CHALLENGE. This does not include requests that had the following actions applied: LOG, SKIP, ALLOW. In contrast to last year, we now exclude requests that had CONNECTION_CLOSE and FORCE_CONNECTION_CLOSE actions applied by our DDoS mitigation system, as these technically only slow down connection initiation. They also accounted for a relatively small percentage of requests. Additionally, we improved our calculation regarding the CHALLENGE type actions to ensure that only unsolved challenges are counted as mitigated. A detailed description of actions can be found in our developer documentation.
Bot traffic/automated traffic: any HTTP* request identified by Cloudflare’s Bot Management system as being generated by a bot. This includes requests with a bot score between 1 and 29 inclusive. This has not changed from last year’s report.
API traffic: any HTTP* request with a response content type of XML or JSON. Where the response content type is not available, such as for mitigated requests, the equivalent Accept content type (specified by the user agent) is used instead. In this latter case, API traffic won’t be fully accounted for, but it still provides a good representation for the purposes of gaining insights.
Unless otherwise stated, the time frame evaluated in this post is the 12 month period from March 2022 through February 2023 inclusive.
Finally, please note that the data is calculated based only on traffic observed across the Cloudflare network and does not necessarily represent overall HTTP traffic patterns across the Internet.
*When referring to HTTP traffic we mean both HTTP and HTTPS.
Global traffic insights
6% of daily HTTP requests are mitigated on average
In looking at all HTTP requests proxied by the Cloudflare network, we find that the share of requests that are mitigated has dropped to 6%, down two percentage points compared to last year. Looking at 2023 to date, we see that mitigated request share has fallen even further, to between 4-5%. Large spikes visible in the chart below, such as those seen in June and October, often correlate with large DDoS attacks mitigated by Cloudflare. It is interesting to note that although the percentage of mitigated traffic has decreased over time, the total mitigated request volume has been relatively stable as shown in the second chart below, indicating an increase in overall clean traffic globally rather than an absolute decrease in malicious traffic.
81% of mitigated HTTP requests were outright BLOCKed, with mitigations for the remaining set split across the various CHALLENGE type actions.
DDoS mitigation accounts for more than 50% of all mitigated traffic
Cloudflare provides various security features that customers can configure to keep their applications safe. Unsurprisingly, DDoS mitigation is still the largest contributor to mitigated layer 7 (application layer) HTTP requests. Just last month (February 2023), we reported the largest known mitigated DDoS attack by HTTP requests/second volume (This particular attack is not visible in the graphs above because they are aggregated at a daily level, and the attack only lasted for ~5 minutes).
Compared to last year, however, mitigation by the Cloudflare WAF has grown significantly, and now accounts for nearly 41% of mitigated requests. This can be partially attributed to advances in our WAF technology that enables it to detect and block a larger range of attacks.
Tabular format for reference:
Source
Percentage %
DDoS Mitigation
52%
WAF
41%
IP reputation
4%
Access Rules
2%
Other
1%
Please note that in the table above, in contrast to last year, we are now grouping our products to match our marketing materials and the groupings used in the 2022 Radar Year in Review. This mostly affects our WAF product that comprises the combination of WAF Custom Rules, WAF Rate Limiting Rules, and WAF Managed Rules. In last year’s report, these three features accounted for an aggregate 31% of mitigations.
To understand the growth in WAF mitigated requests over time, we can look one level deeper where it becomes clear that Cloudflare customers are increasingly relying on WAF Custom Rules (historically referred to as Firewall Rules) to mitigate malicious traffic or implement business logic blocks. Observe how the orange line (firewallrules) in the chart below shows a gradual increase over time while the blue line (l7ddos) clearly trends lower.
HTTP Anomaly is the most frequent layer 7 attack vector mitigated by the WAF
Contributing 30% of WAF Managed Rules mitigated traffic overall in March 2023, HTTP Anomaly’s share has decreased by nearly 25 percentage points as compared to the same time last year. Examples of HTTP anomalies include malformed method names, null byte characters in headers, non-standard ports or content length of zero with a POST request. This can be attributed to botnets matching HTTP anomaly signatures slowly changing their traffic patterns.
Removing the HTTP anomaly line from the graph, we can see that in early 2023, the attack vector distribution looks a lot more balanced.
Tabular format for reference (top 10 categories):
Source
Percentage % (last 12 months)
HTTP Anomaly
30%
Directory Traversal
16%
SQLi
14%
File Inclusion
12%
Software Specific
10%
XSS
9%
Broken Authentication
3%
Command Injection
3%
Common Attack
1%
CVE
1%
Of particular note is the orange line spike seen towards the end of February 2023 (CVE category). The spike relates to a sudden increase of two of our WAF Managed Rules:
These two rules are also tagged against CVE-2018-14774, indicating that even relatively old and known vulnerabilities are still often targeted in an effort to exploit potentially unpatched software.
Bot traffic insights
Cloudflare’s Bot Management solution has seen significant investment over the last twelve months. New features such as configurable heuristics, hardened JavaScript detections, automatic machine learning model updates, and Turnstile, Cloudflare’s free CAPTCHA replacement, make our classification of human vs. bot traffic improve daily.
Our confidence in the classification output is very high. If we plot the bot scores across the traffic from the last week of February 2023, we find a very clear distribution, with most requests either being classified as definitely bot (less than 30) or definitely human (greater than 80) with most requests actually scoring less than 2 or greater than 95.
30% of HTTP traffic is automated
Over the last week of February 2023, 30% of Cloudflare HTTP traffic was classified as automated, equivalent to about 13 million HTTP requests/second on the Cloudflare network. This is 8 percentage points less than at the same time last year.
Looking at bot traffic only, we find that only 8% is generated by verified bots, comprising 2% of total traffic. Cloudflare maintains a list of known good (verified) bots to allow customers to easily distinguish between well-behaved bot providers like Google and Facebook and potentially lesser known or unwanted bots. There are currently 171 bots in the list.
16% of non-verified bot HTTP traffic is mitigated
Non-verified bot traffic often includes vulnerability scanners that are constantly looking for exploits on the web, and as a result, nearly one-sixth of this traffic is mitigated because some customers prefer to restrict the insights such tools can potentially gain.
Although verified bots like googlebot and bingbot are generally seen as beneficial and most customers want to allow them, we also see a small percentage (1.5%) of verified bot traffic being mitigated. This is because some site administrators don’t want portions of their site to be crawled, and customers often rely on WAF Custom Rules to enforce this business logic.
The most common action used by customers is to BLOCK these requests (13%), although we do have some customers configuring CHALLENGE actions (3%) to ensure any human false positives can still complete the request if necessary.
On a similar note, it is also interesting that nearly 80% of all mitigated traffic is classified as a bot, as illustrated in the figure below. Some may note that 20% of mitigated traffic being classified as human is still extremely high, but most mitigations of human traffic are generated by WAF Custom Rules, and are frequently due to customers implementing country-level or other related legal blocks on their applications. This is common, for example, in the context of US-based companies blocking access to European users for GDPR compliance reasons.
API traffic insights
55% of dynamic (non cacheable) traffic is API related
Just like our Bot Management solution, we are also investing heavily in tools to protect API endpoints. This is because a lot of HTTP traffic is API related. In fact, if you count only HTTP requests that reach the origin and are not cacheable, up to 55% of traffic is API related, as per the definition stated earlier. This is the same methodology used in last year’s report, and the 55% figure remains unchanged year-over-year.
If we look at cached HTTP requests only (those with a cache status of HIT, UPDATING, REVALIDATED and EXPIRED) we find that, maybe surprisingly, nearly 7% is API related. Modern API endpoint implementations and proxy systems, including our own API Gateway/caching feature set, in fact, allow for very flexible cache logic allowing both caching on custom keys as well as quick cache revalidation (as often as every second) allowing developers to reduce load on back end endpoints.
Including cacheable assets and other requests in the total count, such as redirects, the number goes down, but is still 25% of traffic. In the graph below we provide both perspectives on API traffic:
Yellow line: % of API traffic against all HTTP requests. This will include redirects, cached assets and all other HTTP requests in the total count;
Blue line: % of API traffic against dynamic traffic returning HTTP 200 OK response code only;
65% of global API traffic is generated by browsers
A growing number of web applications nowadays are built “API first”. This means that the initial HTML page load only provides the skeleton layout, and most dynamic components and data are loaded via separate API calls (for example, via AJAX). This is the case for Cloudflare’s own dashboard. This growing implementation paradigm is visible when analyzing the bot scores for API traffic. We can see in the figure below that a large amount of API traffic is generated by user-driven browsers classified as “human” by our system, with nearly two-thirds of it clustered at the high end of the “human” range.
Calculating mitigated API traffic is challenging, as we don’t forward the request to origin servers, and therefore cannot rely on the response content type. Applying the same calculation that was used last year, a little more than 2% of API traffic is mitigated, down from 10.2% last year.
HTTP Anomaly surpasses SQLi as most common attack vector on API endpoints
Compared to last year, HTTP anomalies now surpass SQLi as the most popular attack vector attempted against API endpoints (note the blue line being higher at the start of the graph just when last year’s report was published). Attack vectors on API traffic are not consistent throughout the year and show more variation as compared to global HTTP traffic. For example, note the spike in file inclusion attack attempts in early 2023.
Exploring account takeover attacks
Since March 2021, Cloudflare has provided a leaked credential check feature as part of its WAF. This allows customers to be notified (via an HTTP request header) whenever an authentication request is detected with a username/password pair that is known to be leaked. This tends to be an extremely effective signal at detecting botnets performing account takeover brute force attacks.
Customers also use this signal, on valid username/password pair login attempts, to issue two factor authentication, password reset, or in some cases, increased logging in the event the user is not the legitimate owner of the credentials.
Brute force account takeover attacks are increasing
If we look at the trend of matched requests over the past 12 months, an increase is noticeable starting in the latter half of 2022, indicating growing fraudulent activity against login endpoints. During large brute force attacks we have observed matches against HTTP requests with leaked credentials at a rate higher than 12k per minute.
Our leaked credential check feature has rules matching authentication requests for the following systems:
Drupal
Ghost
Joomla
Magento
Plone
WordPress
Microsoft Exchange
Generic rules matching common authentication endpoint formats
This allows us to compare activity from malicious actors, normally in the form of botnets, attempting to “break into” potentially compromised accounts.
Microsoft Exchange is attacked more than WordPress
Mostly due to its popularity, you might expect WordPress to be the application most at risk and/or observing most brute force account takeover traffic. However, looking at rule matches from the supported systems listed above, we find that after our generic signatures, the Microsoft Exchange signature is the most frequent match.
Most applications experiencing brute force attacks tend to be high value assets, and Exchange accounts being the most likely targeted according to our data reflects this trend.
If we look at leaked credential match traffic by source country, the United States leads by a fair margin. Potentially notable is the absence of China in top contenders given network size. The only exception is Ukraine leading during the first half of 2022 towards the start of the war — the yellow line seen in the figure below.
Looking forward
Given the amount of web traffic carried by Cloudflare, we observe a broad spectrum of attacks. From HTTP anomalies, SQL injection attacks, and cross-site scripting (XSS) to account takeover attempts and malicious bots, the threat landscape is constantly changing. As such, it is critical that any business operating online is investing in visibility, detection, and mitigation technologies so that they can ensure their applications, and more importantly, their end user’s data, remains safe.
We hope that you found the findings in this report interesting, and at the very least, gave you an appreciation on the state of application security on the Internet. There are a lot of bad actors online, and there is no indication that Internet security is getting easier.
We are already planning an update to this report including additional data and insights across our product portfolio. Keep an eye on Cloudflare Radar for more frequent application security reports and insights.
The collective thoughts of the interwebz
Manage Consent
To provide the best experiences, we use technologies like cookies to store and/or access device information. Consenting to these technologies will allow us to process data such as browsing behavior or unique IDs on this site. Not consenting or withdrawing consent, may adversely affect certain features and functions.
Functional
Always active
The technical storage or access is strictly necessary for the legitimate purpose of enabling the use of a specific service explicitly requested by the subscriber or user, or for the sole purpose of carrying out the transmission of a communication over an electronic communications network.
Preferences
The technical storage or access is necessary for the legitimate purpose of storing preferences that are not requested by the subscriber or user.
Statistics
The technical storage or access that is used exclusively for statistical purposes.The technical storage or access that is used exclusively for anonymous statistical purposes. Without a subpoena, voluntary compliance on the part of your Internet Service Provider, or additional records from a third party, information stored or retrieved for this purpose alone cannot usually be used to identify you.
Marketing
The technical storage or access is required to create user profiles to send advertising, or to track the user on a website or across several websites for similar marketing purposes.